Splunk UF Fleet
Follow every forwarding agent of a Splunk deployment and the Deployment Servers that manage them, from what the receivers, the agents and the Deployment Servers already log: the Deployment Server API accounts, the scope and the discovery, enrichment from a CMDB lookup, groups proposed from the server classes and the enrichment, the agents that must stay connected and the notifications; the fleet, the agents, one agent up close and the Deployment Servers’ pace; then four agents of one site stopped on purpose, a mass disconnect per cohort, an expected agent missing, a receiver the agents fail to reach and the Splunk UF Fleet AI Agent.
about 30 minutes · 26 slides. Each slide is followed by a description of what it shows — read top to bottom, this page is the walkthrough.
Overview
This walkthrough covers the Splunk UF Fleet tenant, generally available in TrackMe 2.4.22. Everything was captured live on a fleet of twenty universal forwarders named after their site and service — London, Paris, New York and a development site — on five UF generations from 9.4 to 10.6, managed by a cluster of two Deployment Servers. In four parts: create the tenant, configure it, follow the fleet and its Deployment Servers, and read the findings of agents stopped on purpose.
Why a dedicated Splunk UF Fleet tenant
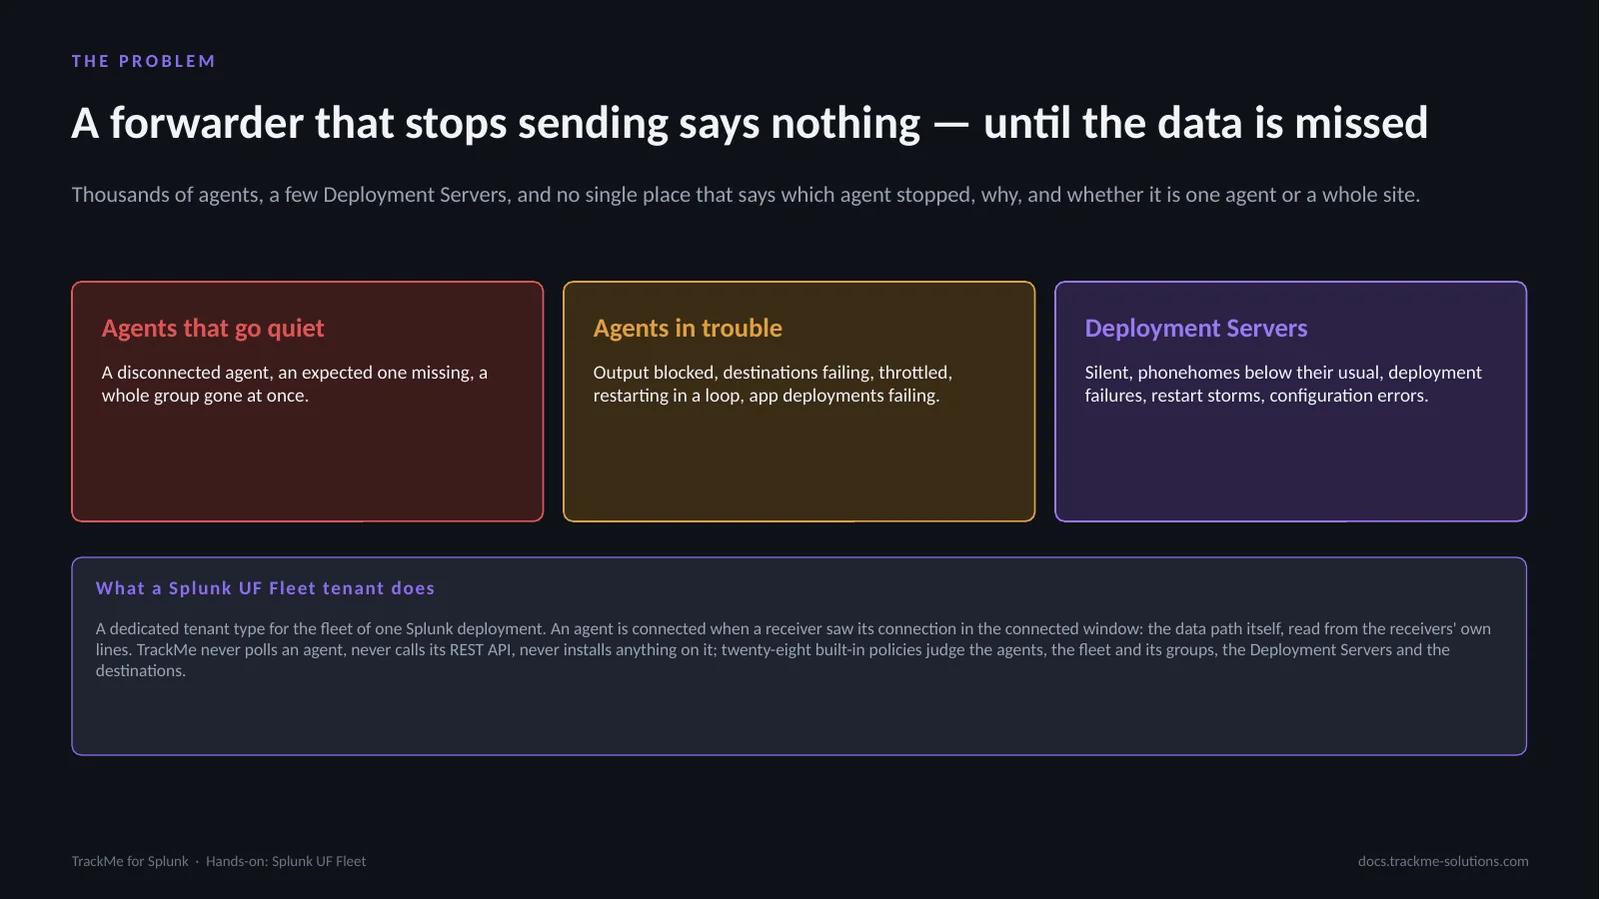
A Splunk administrator asks the same fleet questions every day: how many agents do I have, on which versions and platforms, which are connected, disconnected or dormant, and which of the agents that must stay connected are not. Which agents are blocked, throttled, or failing their destinations or their app deployments? Is each Deployment Server answering its clients at its usual pace? The Splunk UF Fleet tenant answers them with findings raised by twenty-eight built-in policies. It only reads: nothing is installed on an agent, and no agent is ever polled.
How a Splunk UF Fleet tenant works
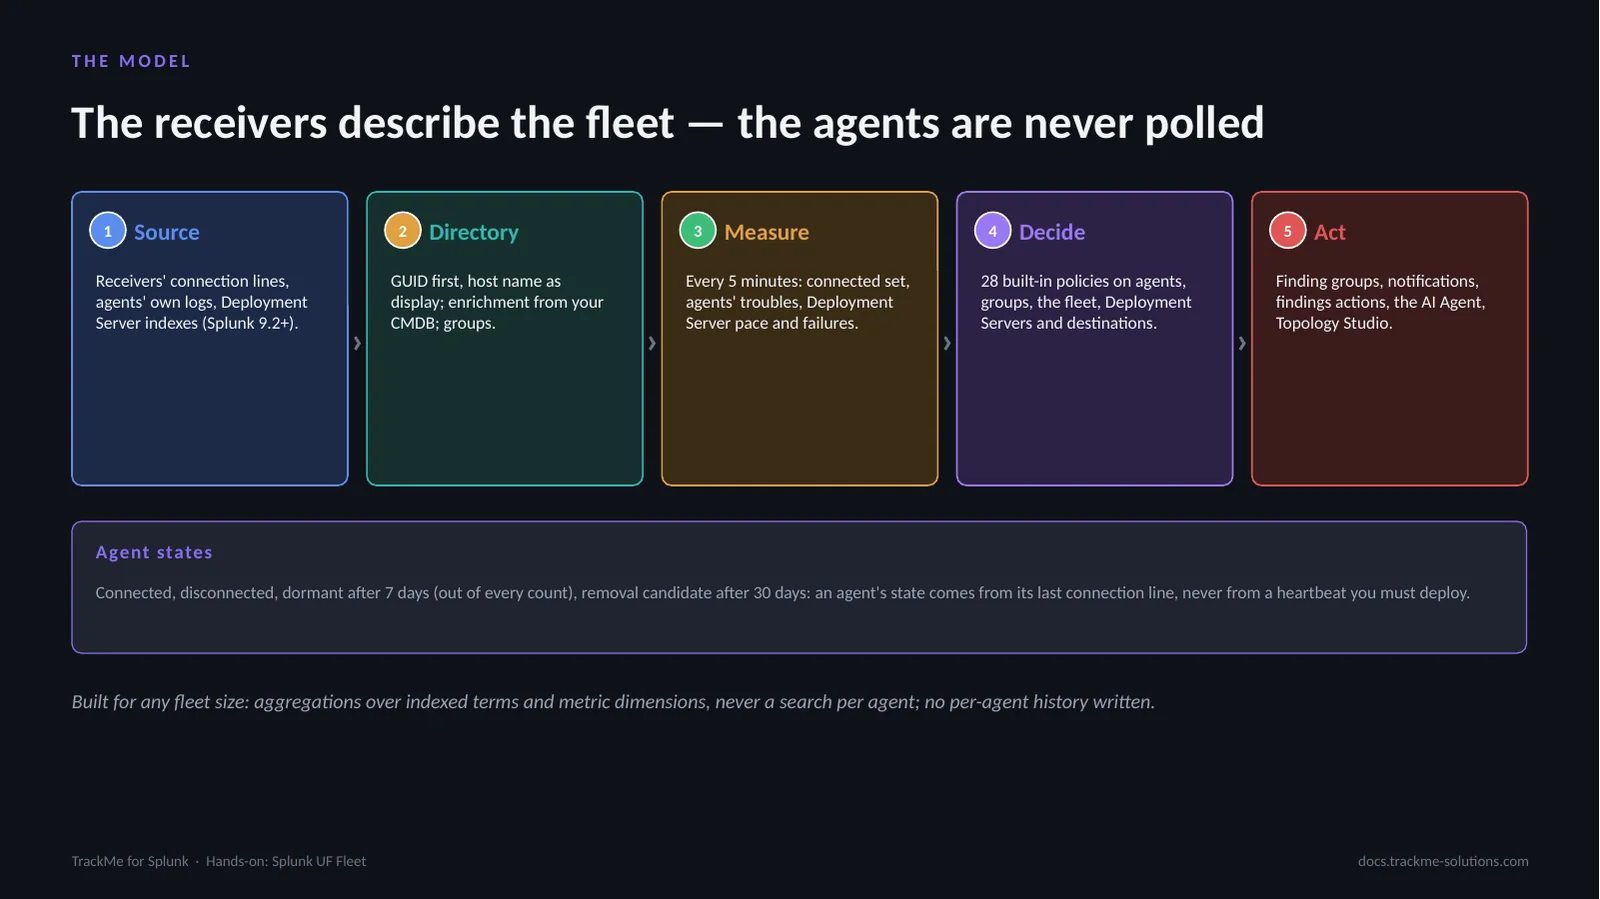
The receivers write a connection line for every sender, the agents forward their own logs, and the Deployment Servers write their phonehomes, their clients and their app events. TrackMe merges the three into one agent directory, reads the connected set every five minutes, and judges the agents, the groups, the fleet and the Deployment Servers. A mass disconnection is one finding on the group, never hundreds of agent findings.
The plan
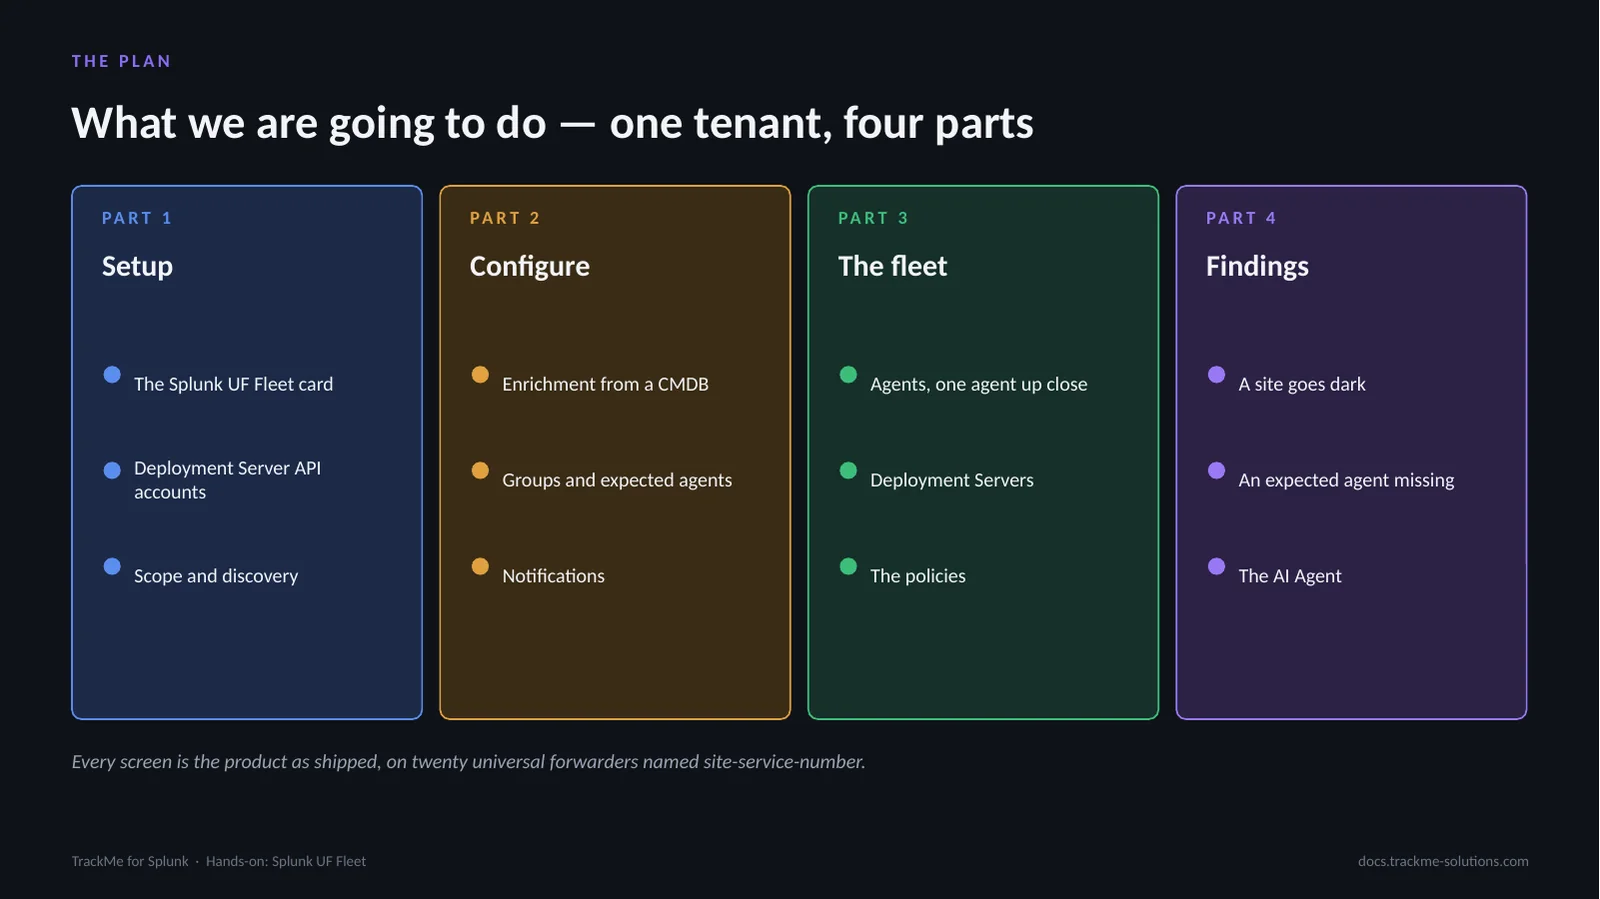
Four parts. Setup: the wizard, the Deployment Server API accounts and the scope. Configure: enrichment from a CMDB, groups proposed from the Deployment Servers and the enrichment, the expected agents and the notifications. The fleet: the Fleet tab, the agents, one agent up close, the Deployment Servers and the policies. Findings: agents stopped on purpose, a site’s mass disconnect, an expected agent missing and the AI Agent.
Part 1 — Setup
Part one: setup. A Splunk UF Fleet tenant reads one deployment: its local search tier, or another deployment through a TrackMe remote account.
A dedicated tenant — pick Splunk UF Fleet
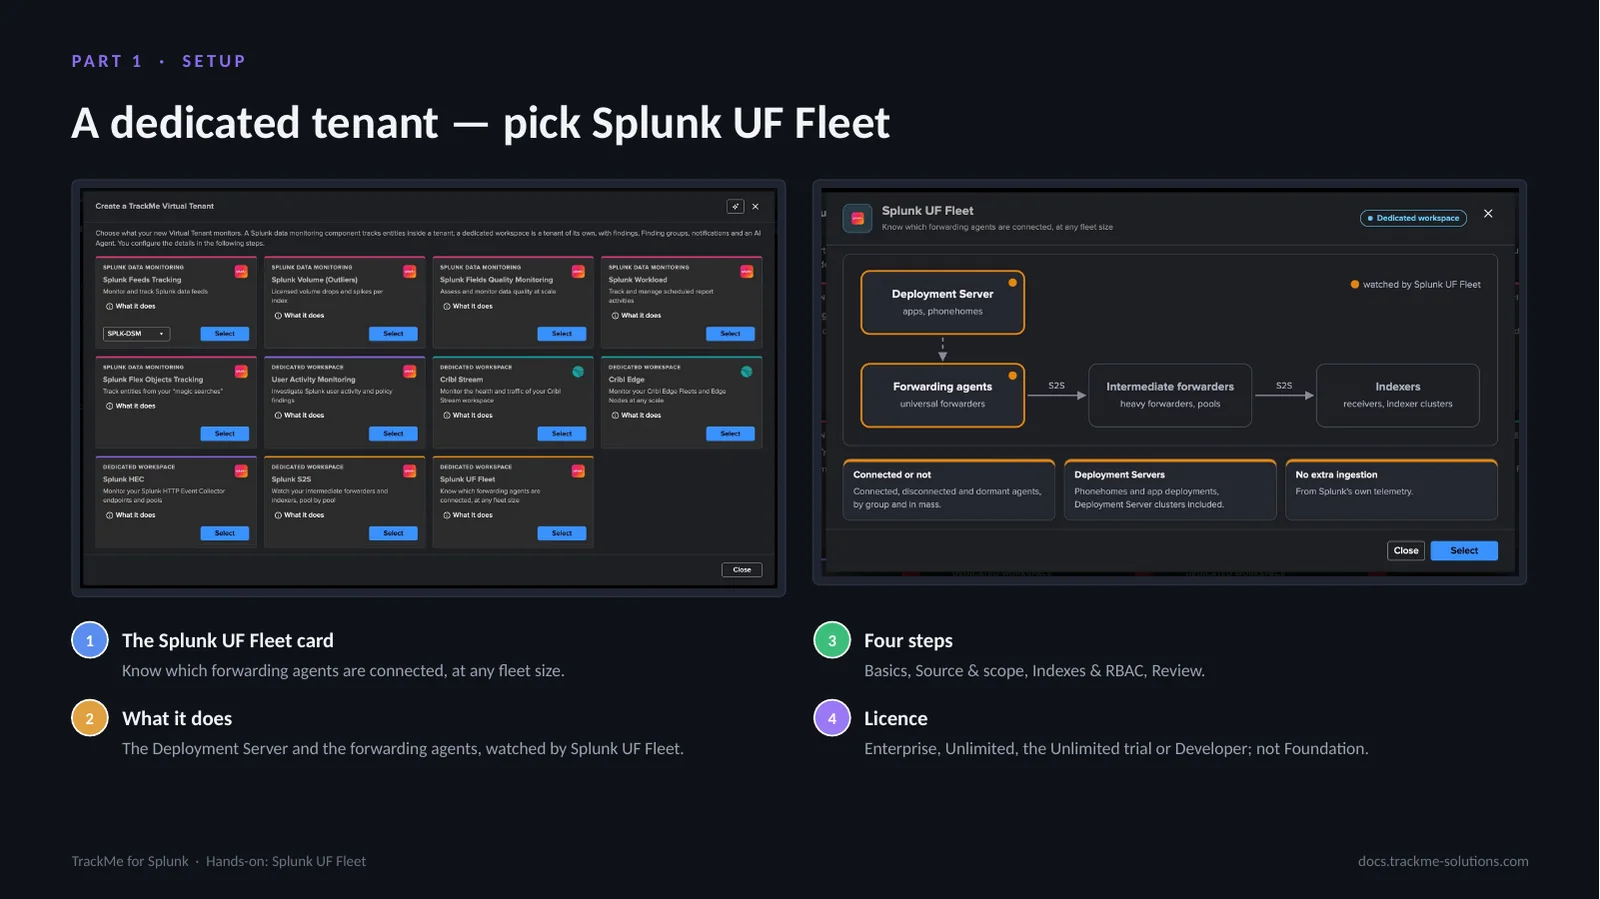
Virtual Tenants, Actions, Create a tracking tenant, then the Splunk UF Fleet card. What it does draws the forwarding path, with the Deployment Server and the forwarding agents watched. The receiving side, the intermediate forwarders and the indexers, has its own tenant type, Splunk S2S; when both read the same source, Topology Studio links them.
Deployment Server API accounts
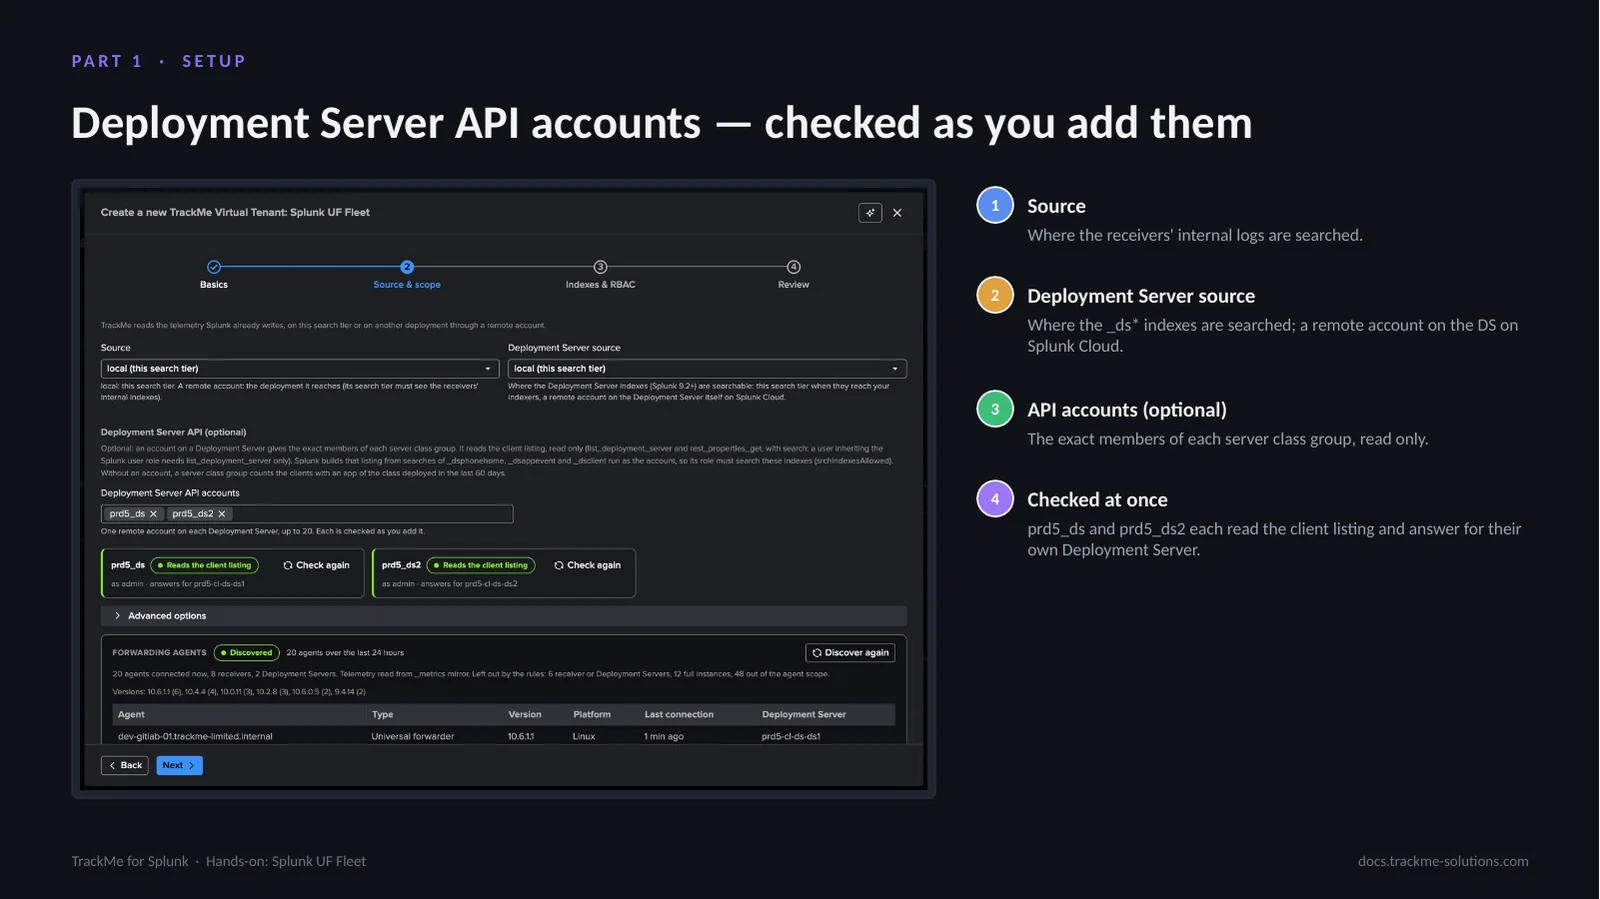
Source and scope. The Deployment Server API accounts are optional: an account on a Deployment Server gives the exact members of each server class group, from its client listing. Its user needs list_deployment_server and rest_properties_get, never an admin role, and its role must be allowed to search the Deployment Server indexes: Splunk builds the client listing from them, as the account. Each account is checked as it is added: here prd5_ds and prd5_ds2 each read the client listing of their own Deployment Server. Without one, a server class group counts the clients with an app of the class deployed in the last 60 days.
Scope the fleet, then see what the tenant would collect
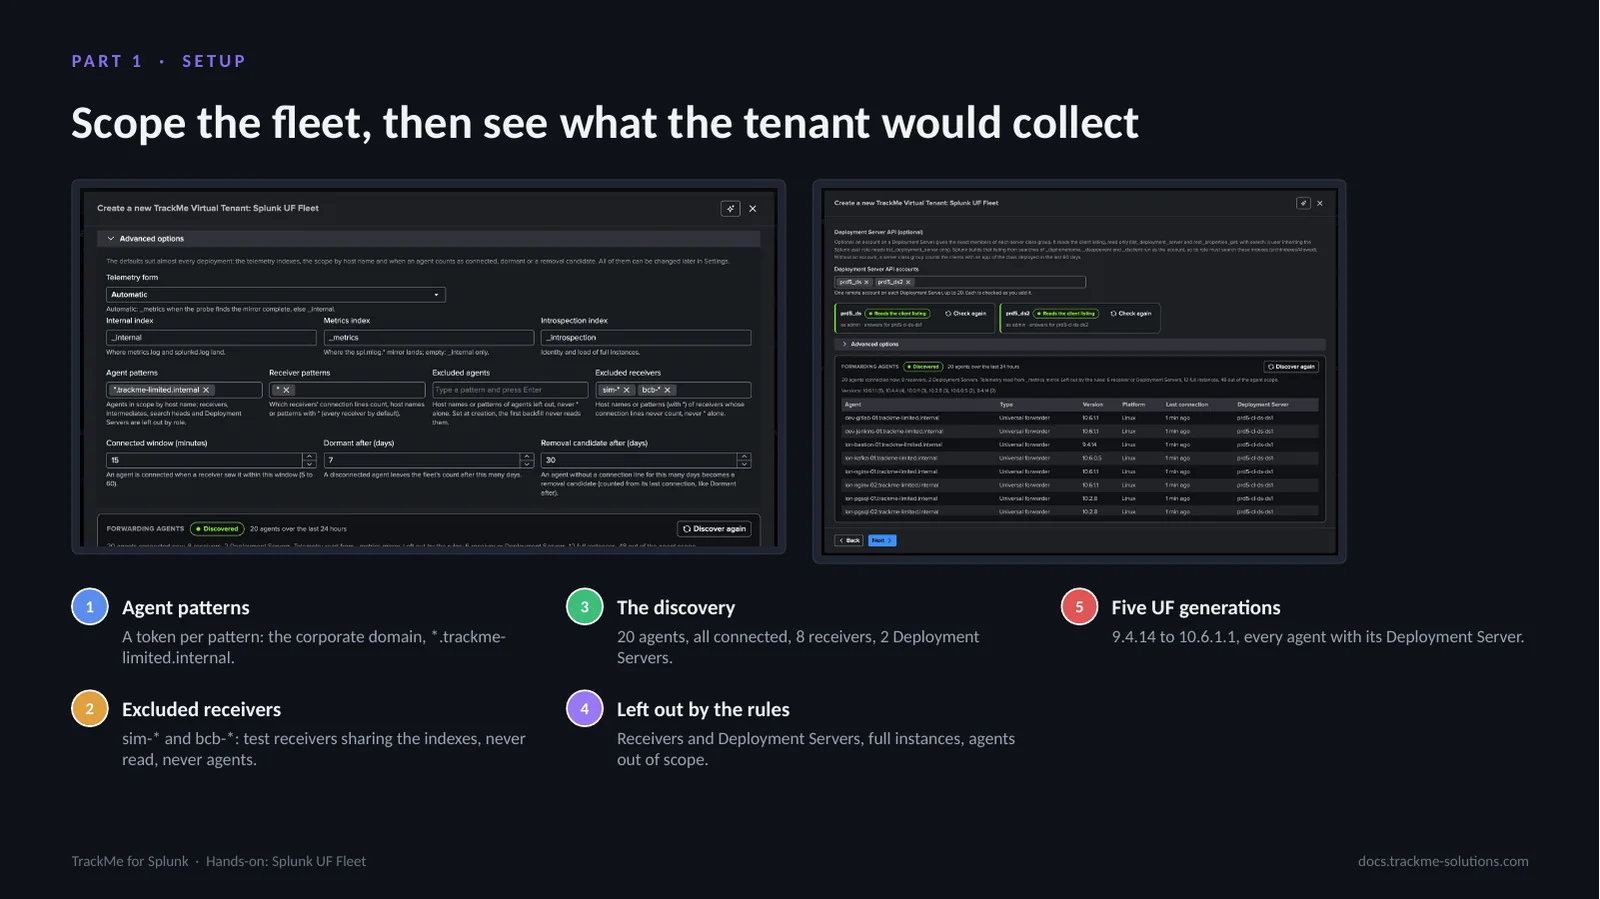
Advanced options: the agent patterns scope the tenant to the corporate domain, here *.trackme-limited.internal, and the excluded receivers leave out two families of test receivers sharing the same indexes; each pattern is a token, typed and added with Enter. Then the connected window and the dormancy and removal delays. The discovery runs the tenant’s own rules with your rights over the last day: here twenty universal forwarders on five UF generations, all connected, and what the rules left out.
A least-privilege owner
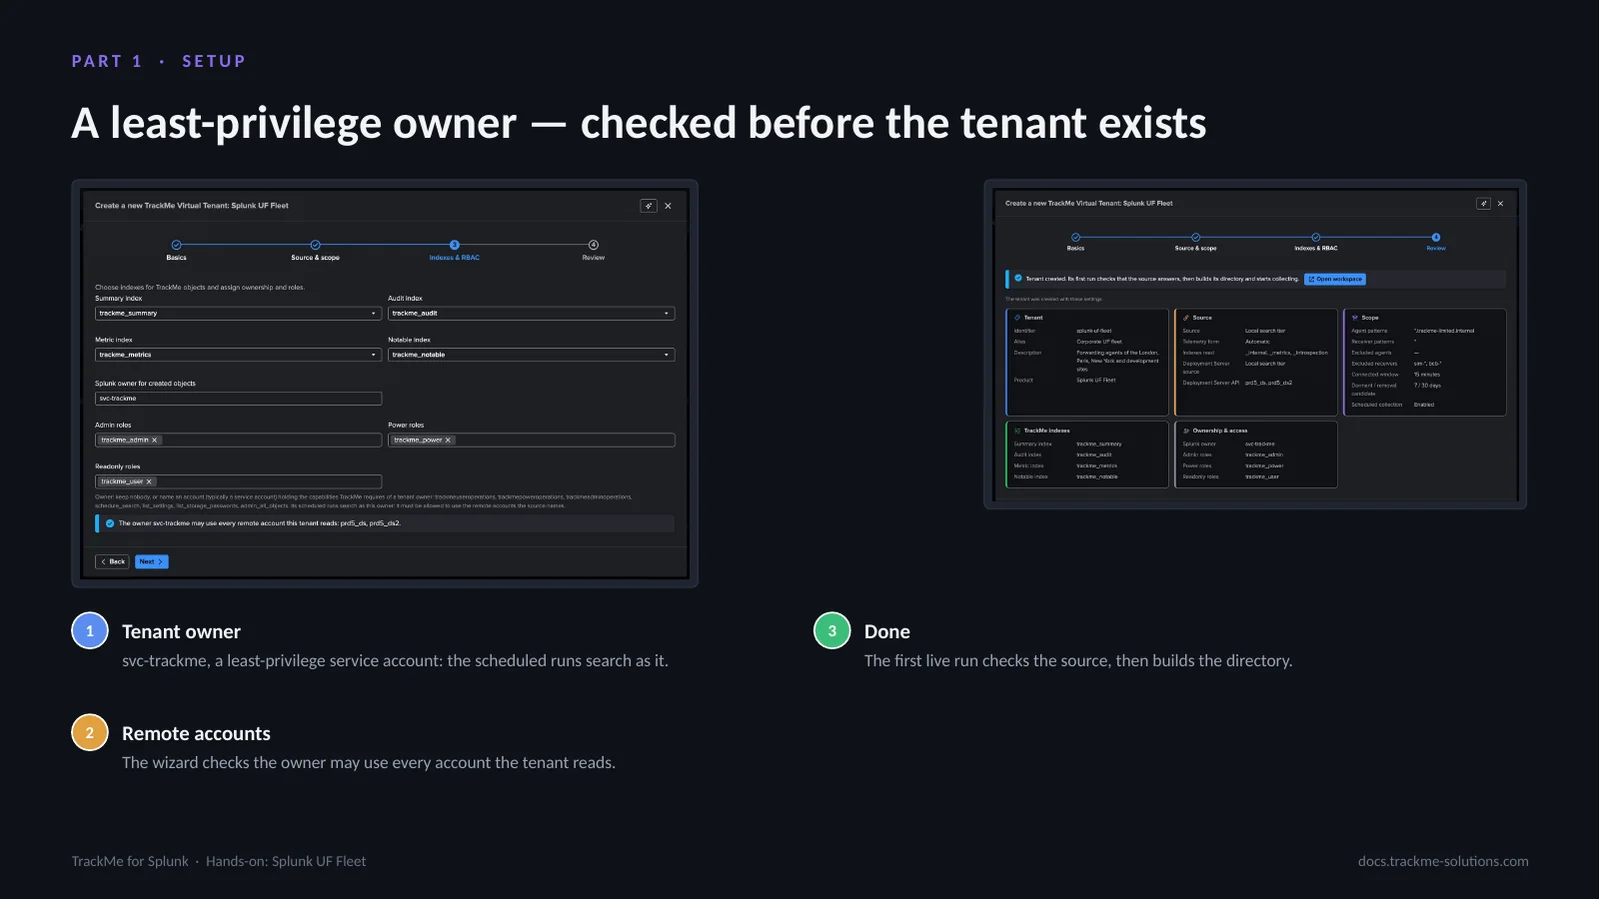
Indexes and RBAC, then Review and Done. The owner must be able to use every remote account the tenant reads, the Deployment Server API accounts included; otherwise the wizard names the fix before the save. The Review lists the source, the scope, the Deployment Server API accounts, the indexes and the ownership. The first live run starts at once.
Part 2 — Configure
Part two: configure the tenant. Three settings turn a list of agents into a fleet: enrichment, groups and expected agents. Notifications then deliver its findings.
Enrichment — your CMDB on every agent
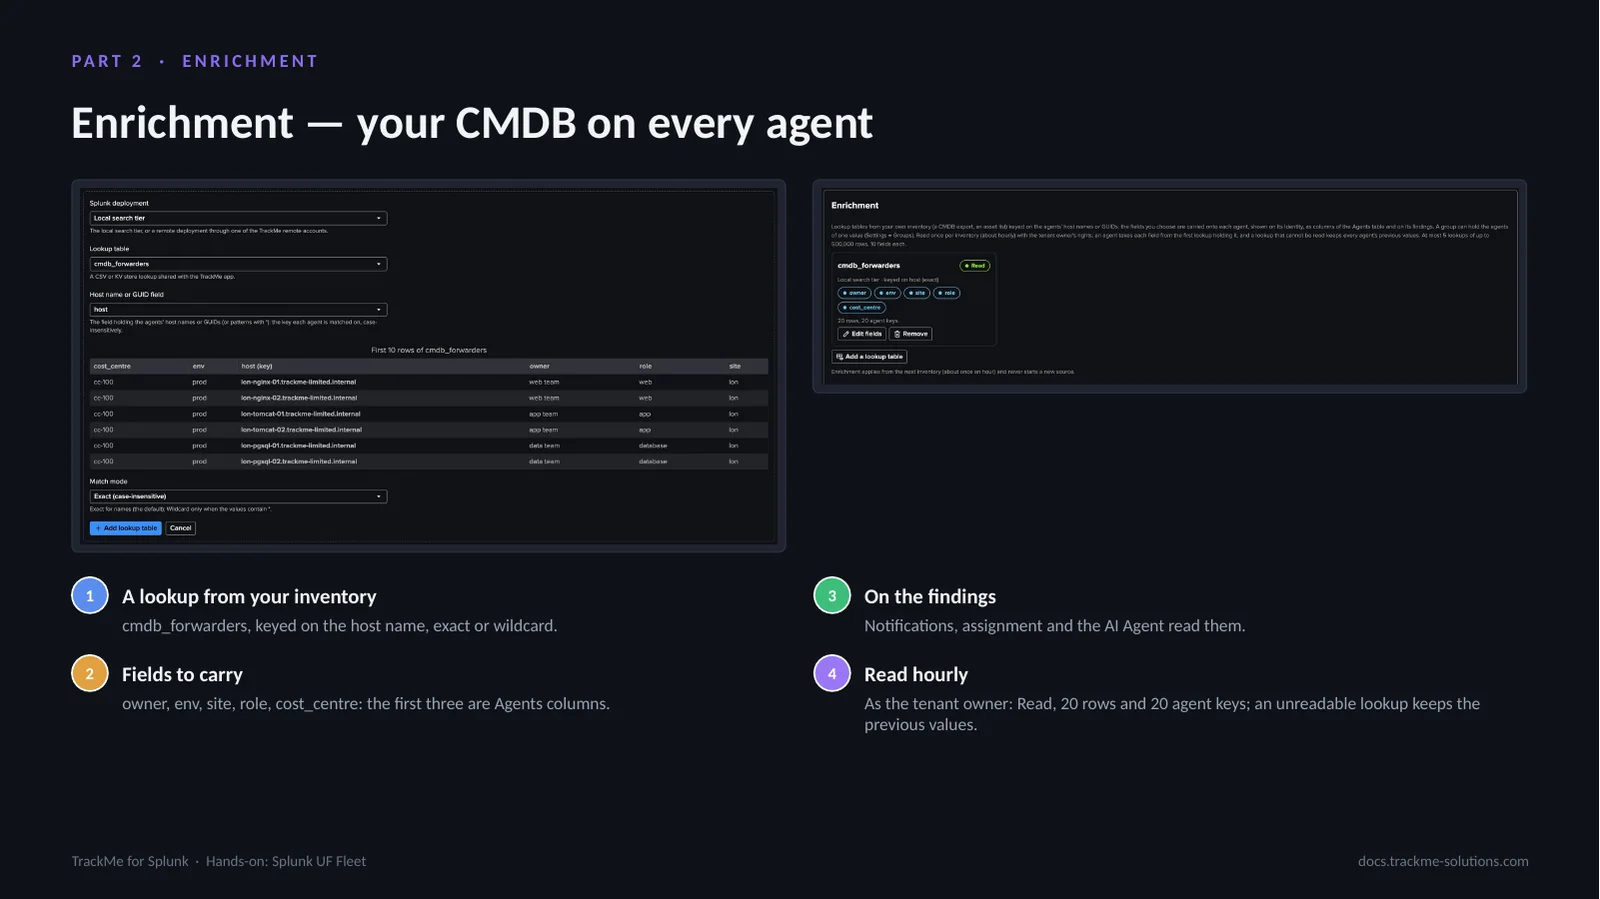
Settings, Enrichment. Up to five lookup tables of up to 500,000 rows, local or through a remote account, carry fields from your own inventory onto each agent: here the owner, the environment, the site, the role and the cost centre from a CMDB lookup, read by the last inventory, 20 rows for 20 agents. Enrichment applies from the next inventory and never starts a new source.
Groups — proposed from your Deployment Servers and your CMDB
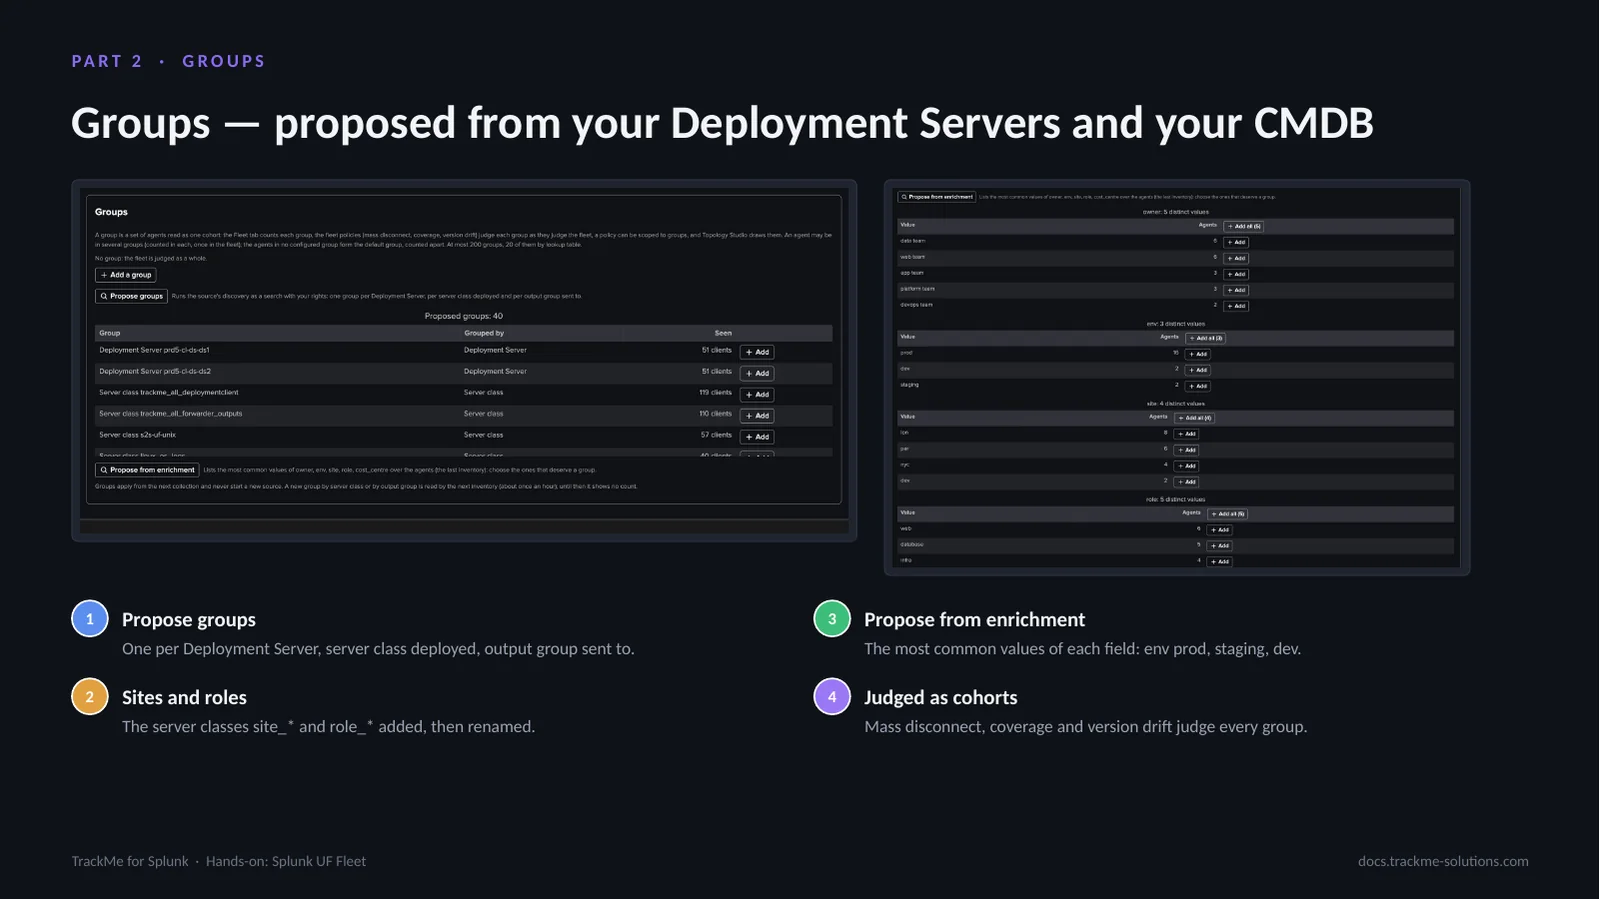
Settings, Groups. A group reads a set of agents as one cohort: the Fleet tab counts it, the fleet policies judge it, a policy can be scoped to it, and Topology Studio draws it. Groups are proposed from the Deployment Server classes and from the enrichment values: here four sites and five roles from the server classes, and three environments from the CMDB. A new group is pending until the next collection; Run now on the inventory shows it at once.
The agents that must always stay connected
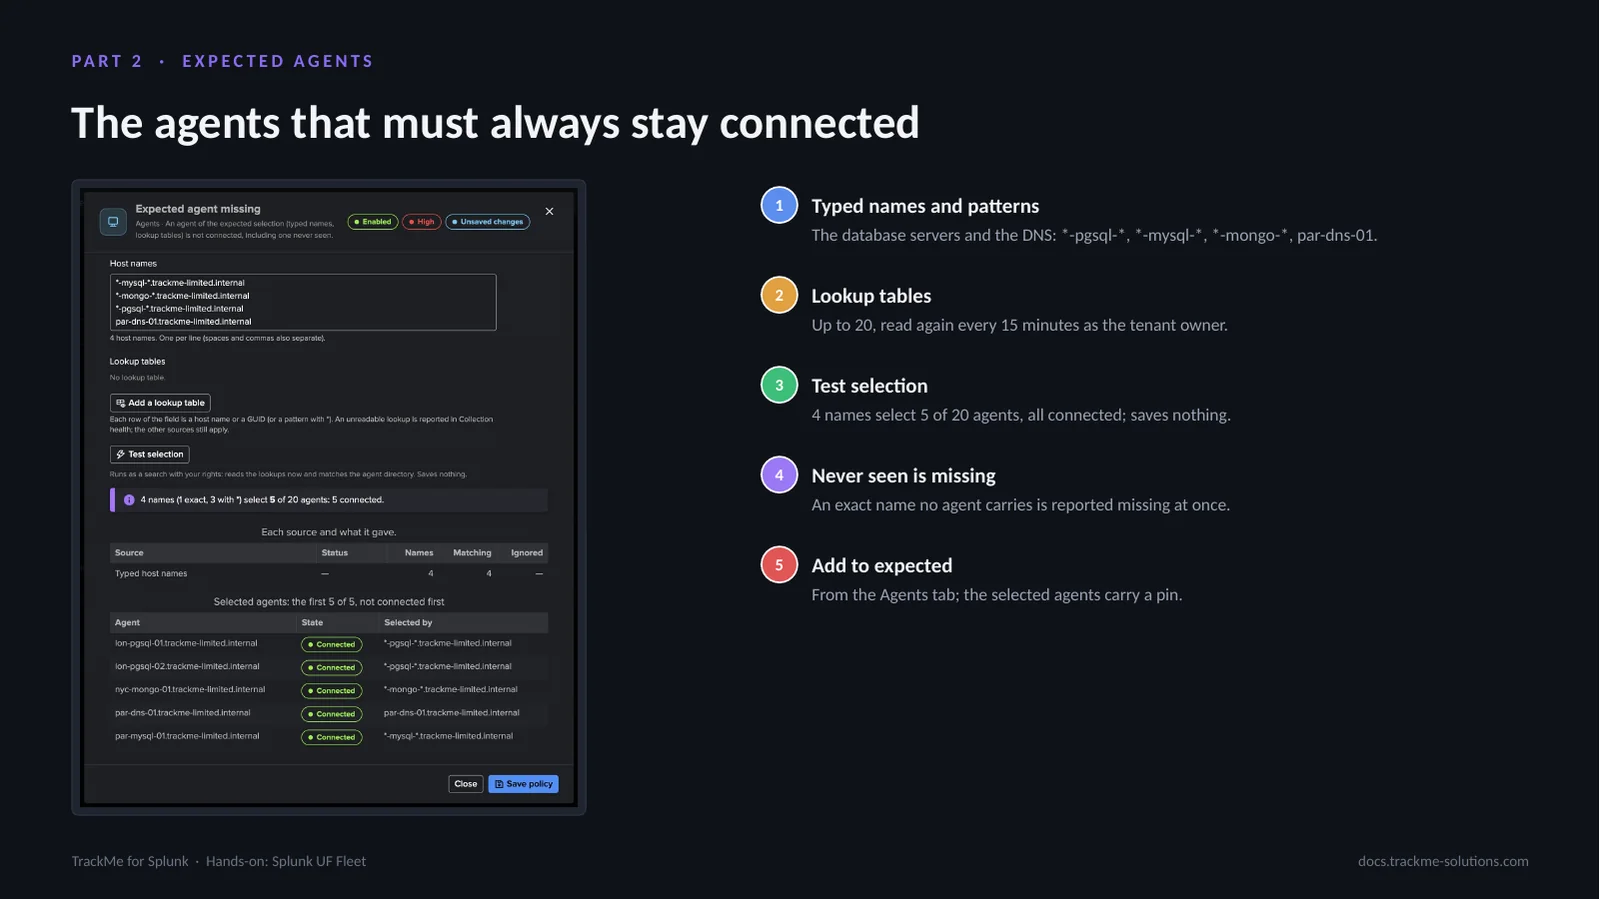
The expected agents are selected in the Expected agent missing policy: typed host names or GUIDs with wildcards, and lookup tables. Here the database servers and the Paris DNS server. Test selection runs as a search with your rights and shows the selected agents by state. Dormancy never closes an expected agent’s finding.
Notifications — one threaded email per Finding group
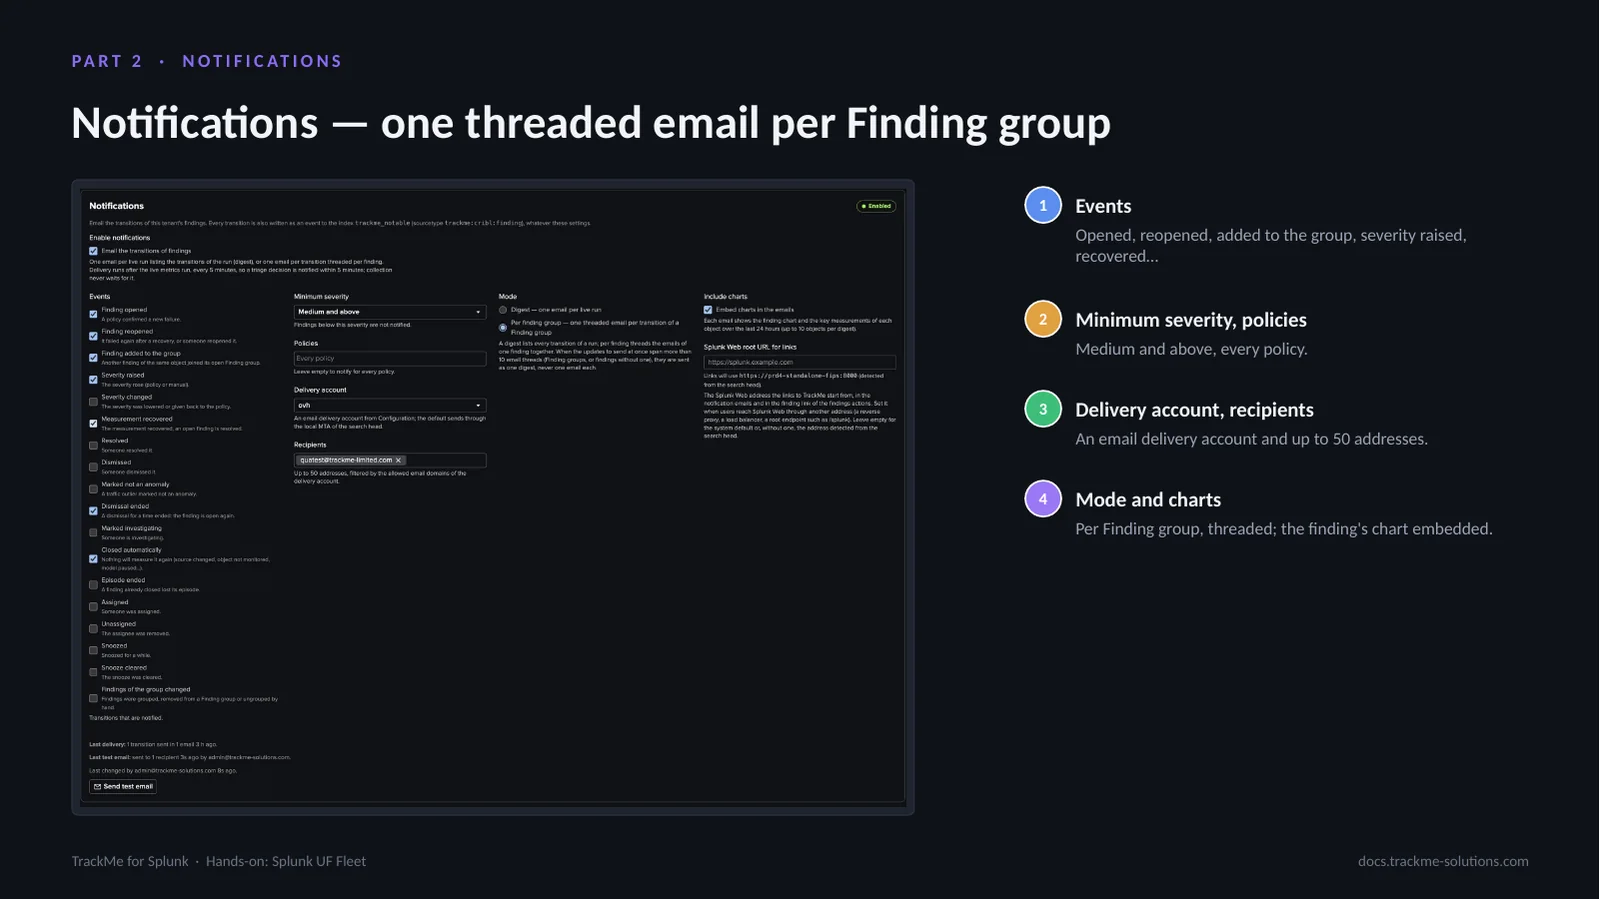
Settings, Notifications: the events notified, the minimum severity, the policies, the email delivery account and the recipients, and the mode — one digest per live run, or one threaded email per transition of a Finding group — with the finding’s chart and key measurements embedded. Every transition is also written as an event to the tenant’s notable index, whatever these settings.
Part 3 — The fleet
Part three: the workspace. The fleet, its agents, its Deployment Servers and its policies.
The fleet — now, the last 24 hours, every group
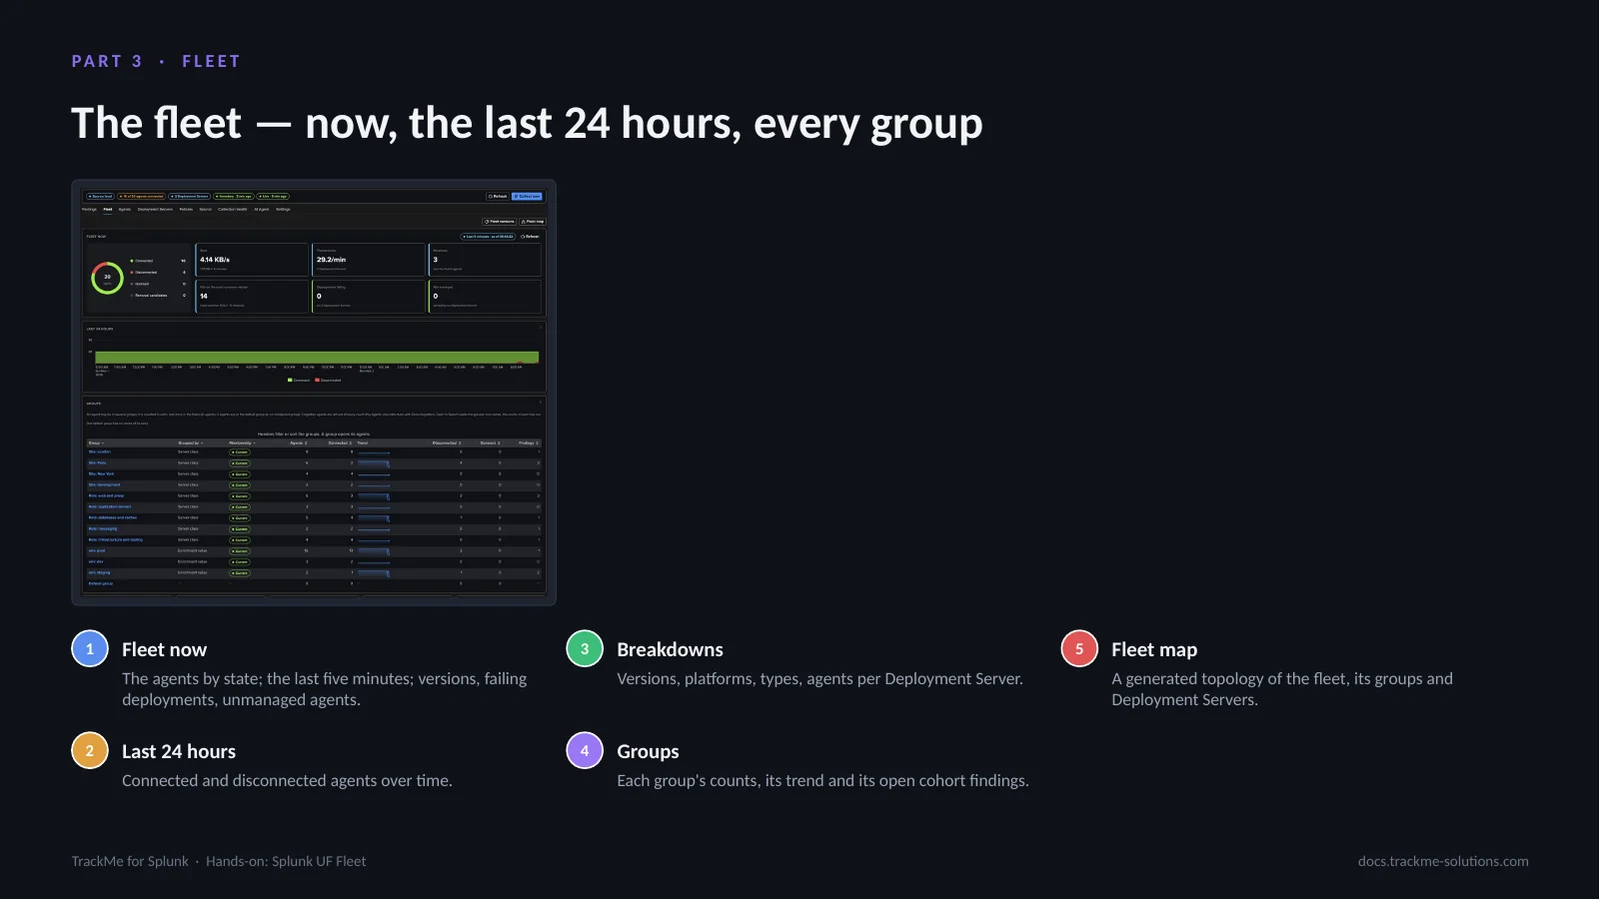
The Fleet tab shows every figure once: the agents by state, the last five minutes (data sent, phonehomes, the receivers that saw the fleet), the fleet’s management (the agents not on the most common version, the deployments failing, the agents served by no Deployment Server), the last 24 hours, the breakdowns by version, platform, agent type and Deployment Server, each opening the Agents tab filtered, the groups with their membership state, counts and open cohort findings, the recently disconnected agents, and the Fleet map, a generated topology of the fleet, its groups and its Deployment Servers. Here the Paris site is down: 16 of 20 agents connected.
The agents — with their groups and your CMDB fields
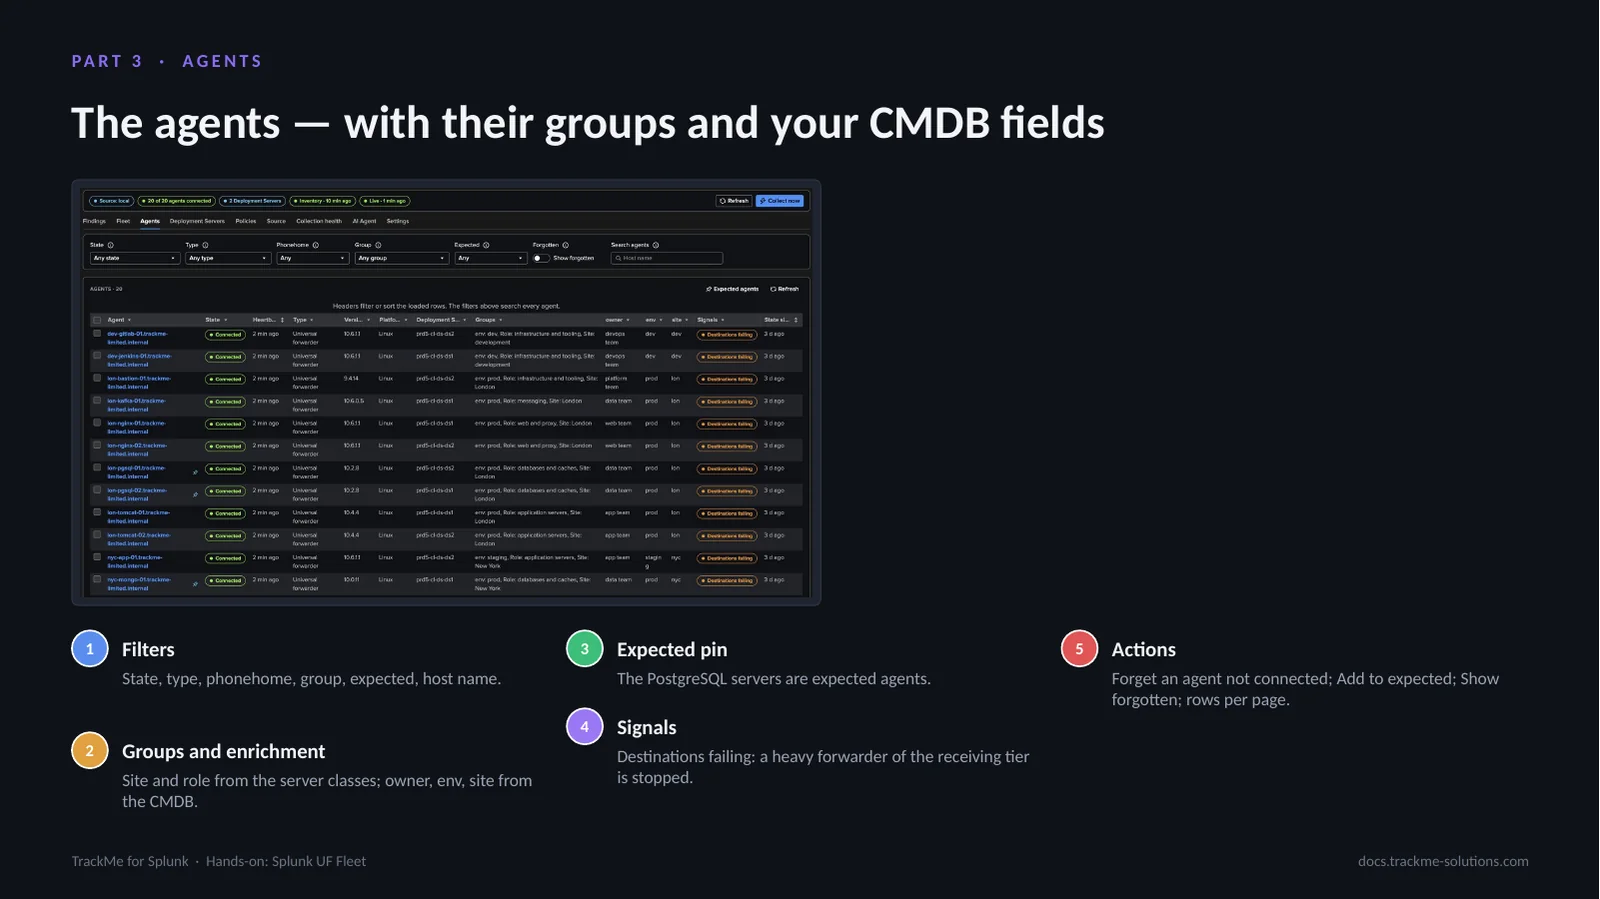
The Agents tab, paged on the server, with filters on state, type, phonehome, group, expected and host name; forgotten agents are listed only with Show forgotten. Each agent with its state, heartbeat, type, version, platform, Deployment Server, groups, the first three enrichment fields and its signals: here Destinations failing on every agent, while a heavy forwarder of the receiving tier is stopped. A signal pill opens its facts and evidence; Forget, for an agent not connected, and Add to expected act on the selection, and the footer sets the rows per page.
One agent up close — state, traffic, identity
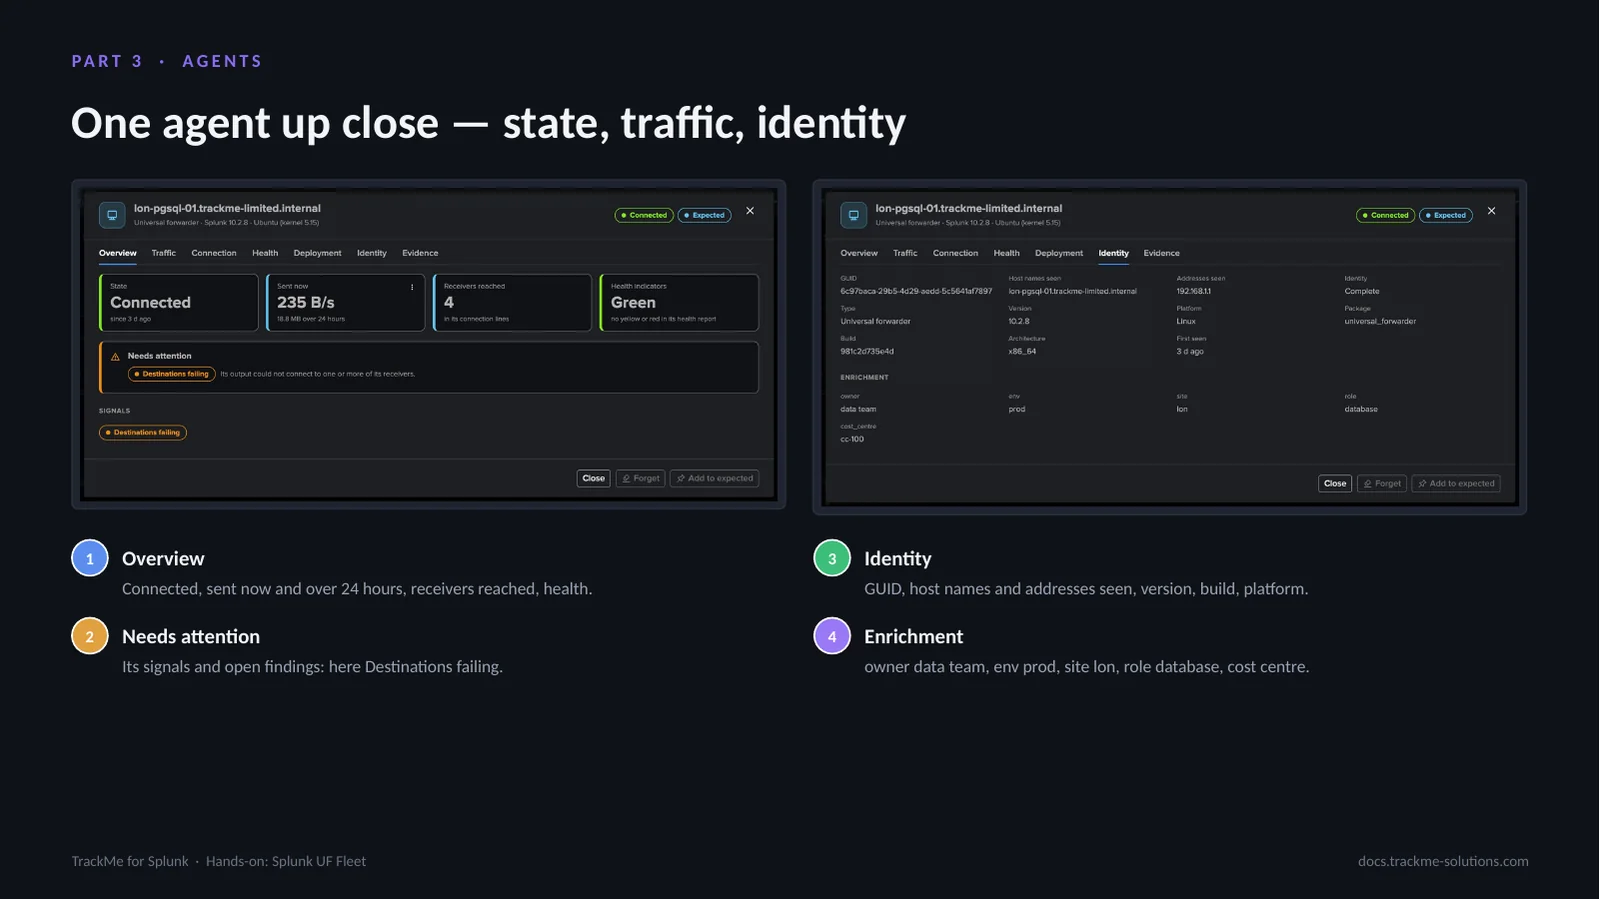
The agent modal: Overview, Traffic, Connection, Health, Deployment, Identity and Evidence. Its Overview shows what needs attention, here Destinations failing; Forget and Add to expected are disabled with their reason for a connected, expected agent. The Identity tab shows the host names and GUIDs the agent was seen with, and the enrichment fields from your CMDB. Its charts read Splunk’s own lines on demand: no per-agent history is written, whatever the fleet size.
Deployment Servers — their pace against their usual
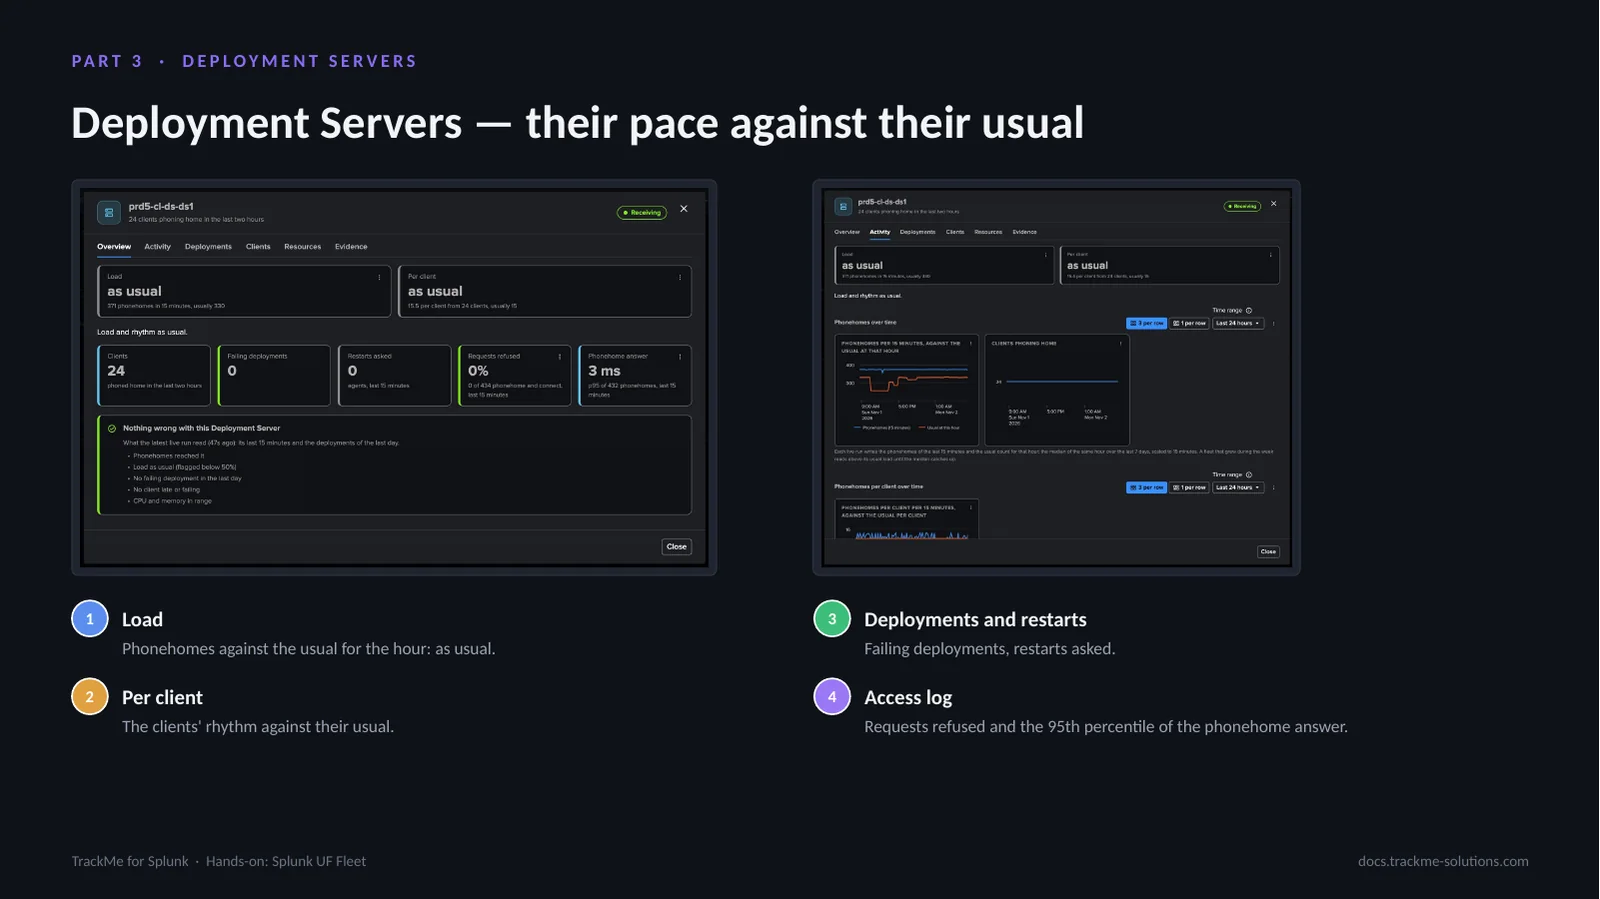
The Deployment Server is a first-class subject: its clients, phonehomes, pace against its usual, failing deployments, restarts asked, CPU and memory. Load and Per client read together: load up with a stable rhythm means more clients; both up, clients phoning home more often; load down with a stable rhythm, clients that left.
Twenty-eight policies — and how each is evaluated
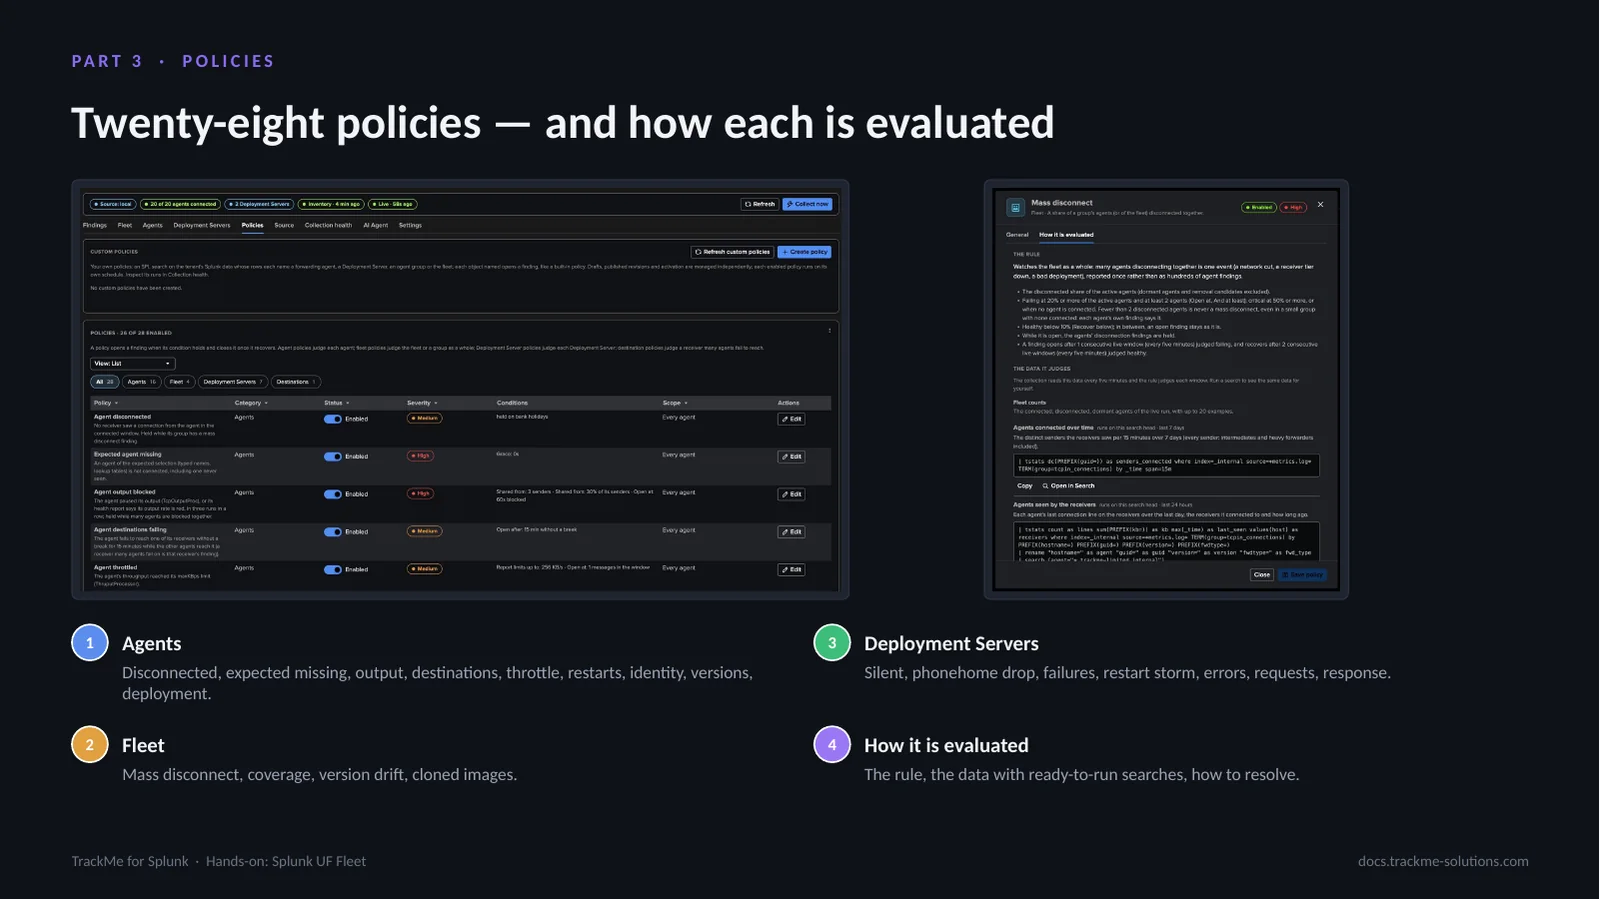
The policy catalogue, by category: agents, the fleet, Deployment Servers and destinations. Every policy has its severity, its checks to open and to recover, a scope by group, a bank holiday hold and How it is evaluated. Mass disconnect opens when twenty per cent of a group, and at least two agents, disconnect together, critical at half; the agents’ own findings are held while it is open. Above the catalogue, TrackMe administrators of the tenant write custom SPL policies.
Part 4 — Findings
Part four: findings. Four agents of the Paris site were stopped on purpose, one of them an expected database server.
A mass disconnect per cohort — not four agent findings
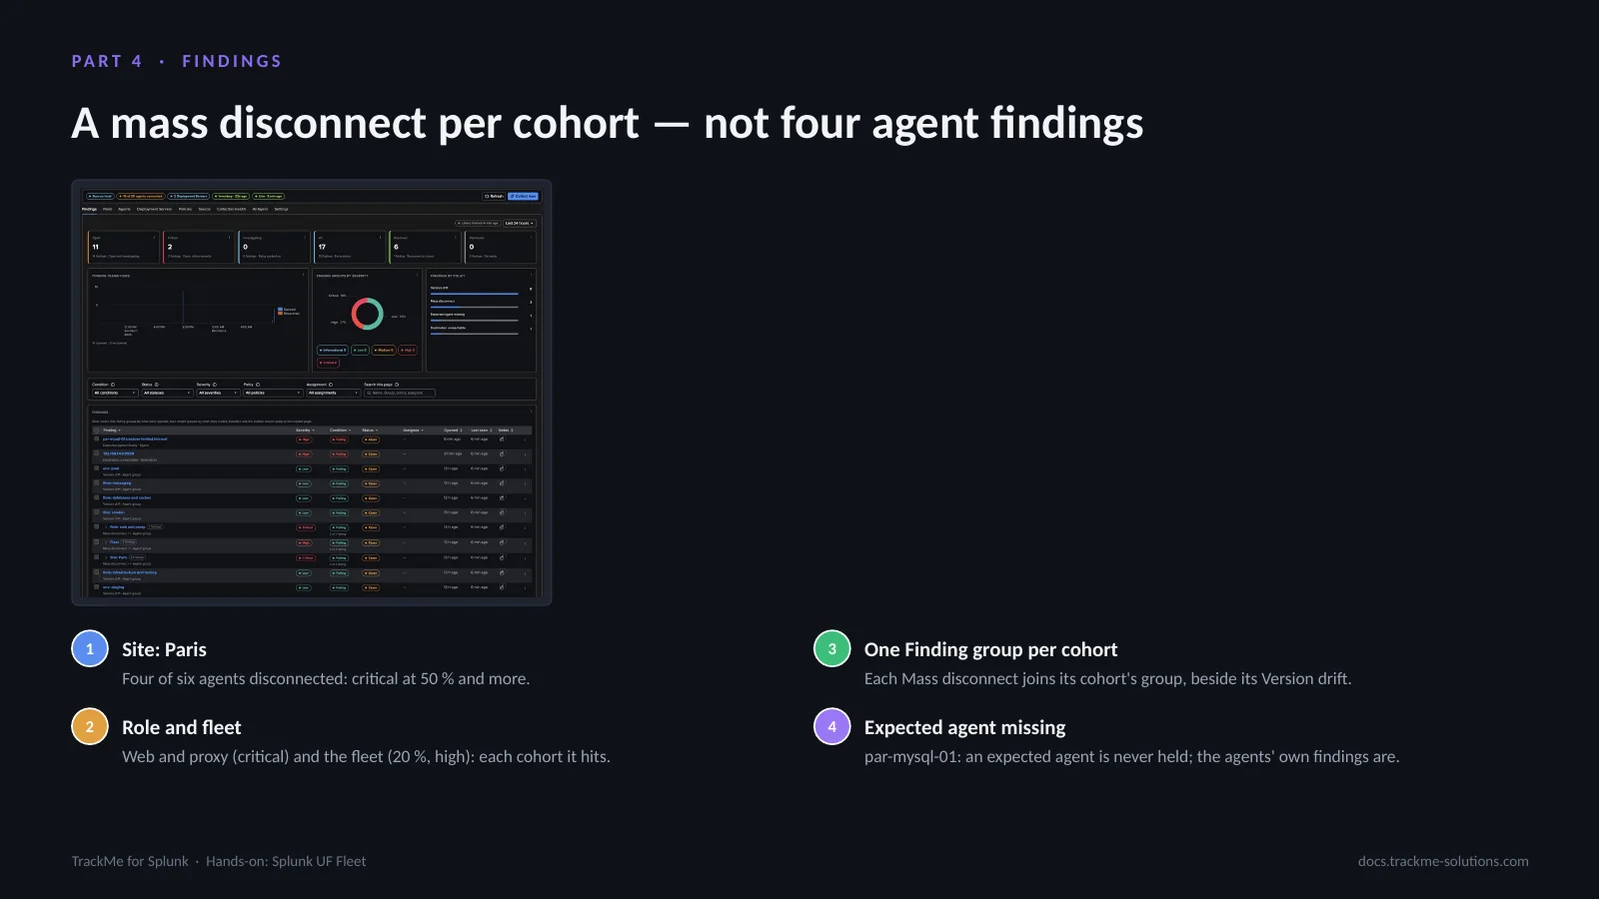
Four agents of the Paris site stopped together. Mass disconnect opens on each cohort they are a large share of: the Paris site group, critical as two thirds of the site is down, the web and proxy role group, critical too, and the fleet at twenty per cent, high; each joins the Finding group of its cohort, beside its Version drift finding. The agents’ own disconnection findings are held, never opened one by one. par-mysql-01 is an expected agent: Expected agent missing opens for it whatever the cohort.
A finding up close
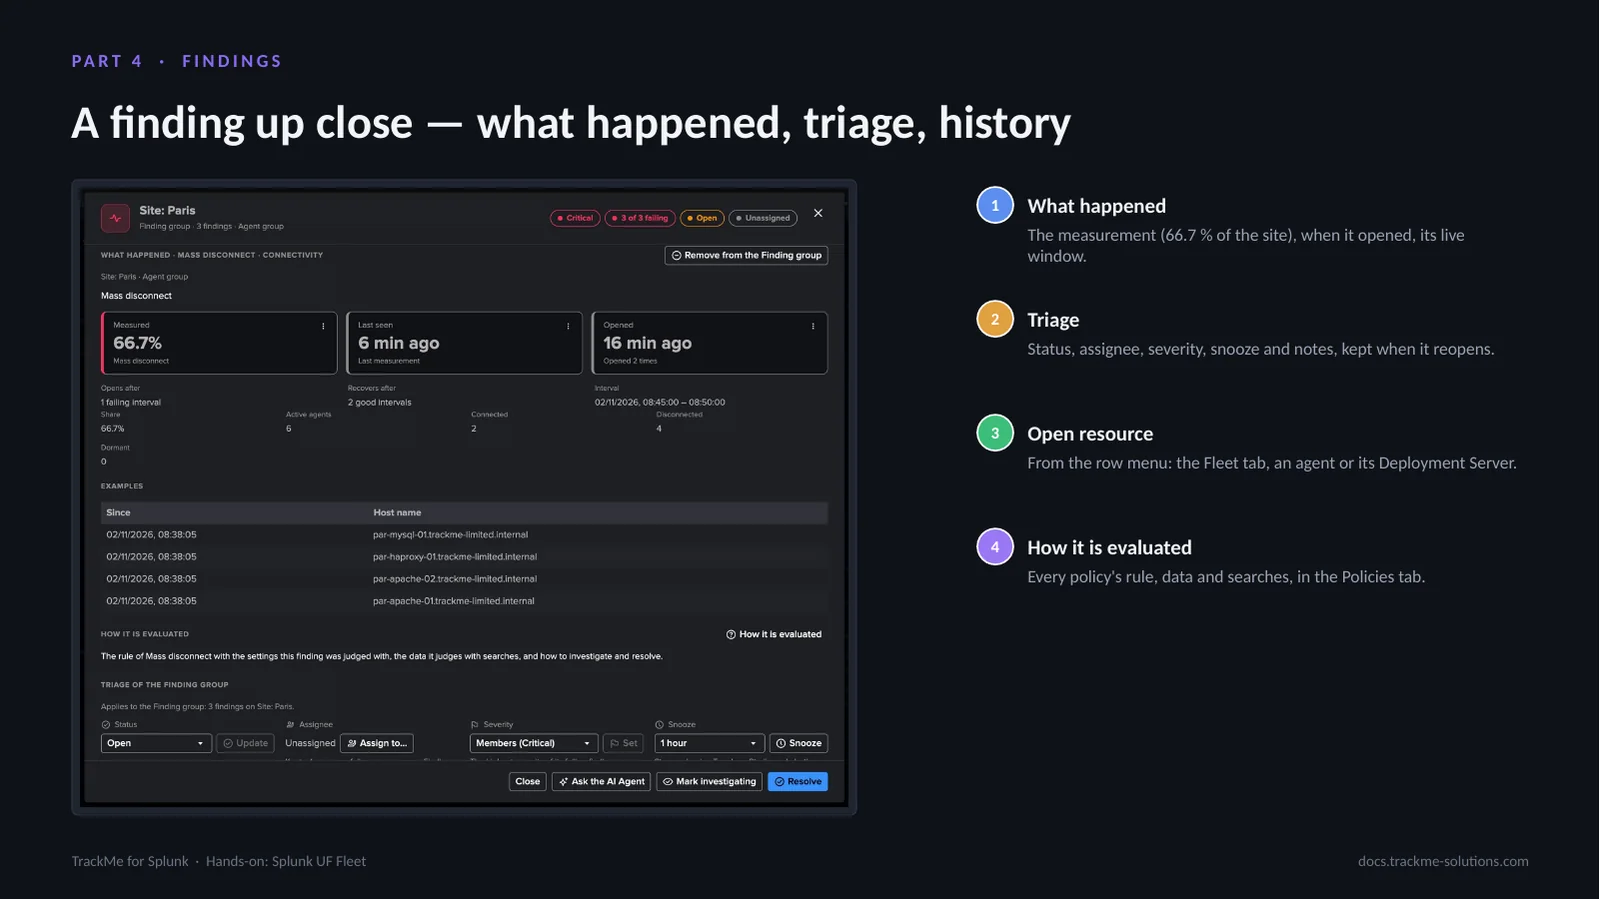
A finding opens with what happened (here 66.7 per cent of the Paris site disconnected), when it opened and its live window, then its triage — status, assignee, severity, snooze — its notes and its history. Open resource, in the row menu, opens the Fleet tab, an agent or its Deployment Server in place. How each policy is evaluated — the rule as configured, the data it reads with ready-to-run searches, and how to investigate and resolve — is in the Policies tab. When the agents reconnect, the mass disconnect recovers below ten per cent for two runs; an agent still disconnected then opens its own finding.
A destination many agents fail to reach
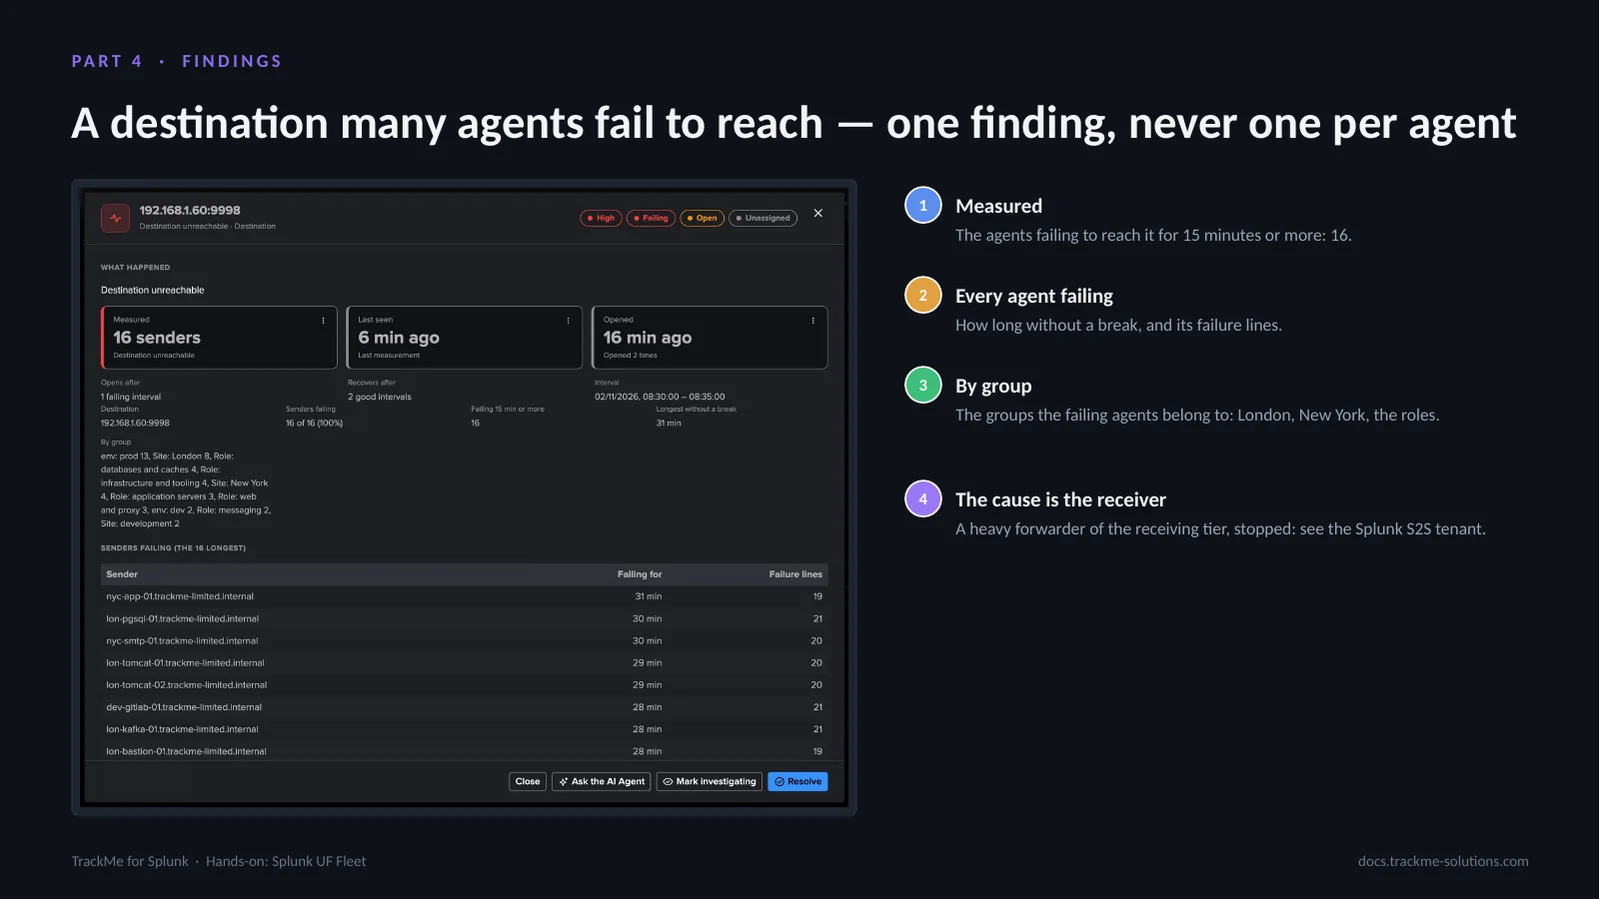
A heavy forwarder of the receiving tier was stopped at the same time. The agents that send to it failed to reach its port: one Destination unreachable finding opened on the receiver, measured on the 16 agents failing for 15 minutes or more, with each agent, how long it failed, its failure lines and the groups the failing agents belong to, never one finding per agent. The receiving side of the same stop is in the Splunk S2S walkthrough.
The Splunk UF Fleet AI Agent
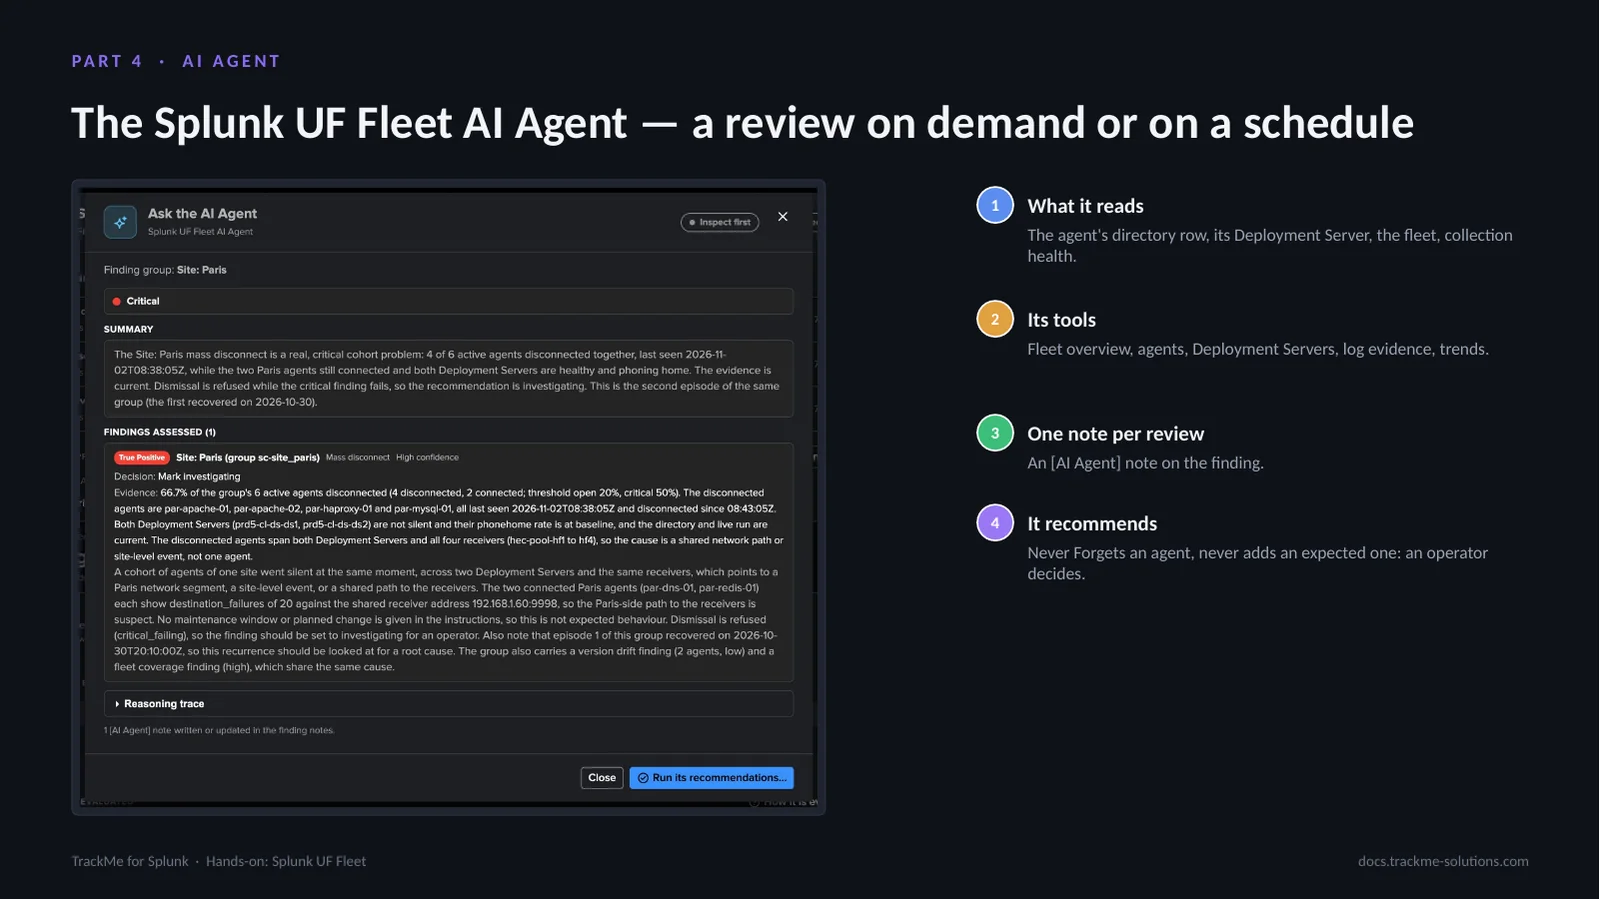
Ask the AI Agent from a finding or a Finding group. The Splunk UF Fleet AI Agent reads the finding, the agent or group, the Deployment Servers and collection health, and may read further through its tools. Each review leaves an [AI Agent] note on the finding. Scheduled triage is off by default: hourly, up to ten findings per run. In act mode it applies only what the tenant allows, and never changes anything on an agent or a Deployment Server.
Where we are
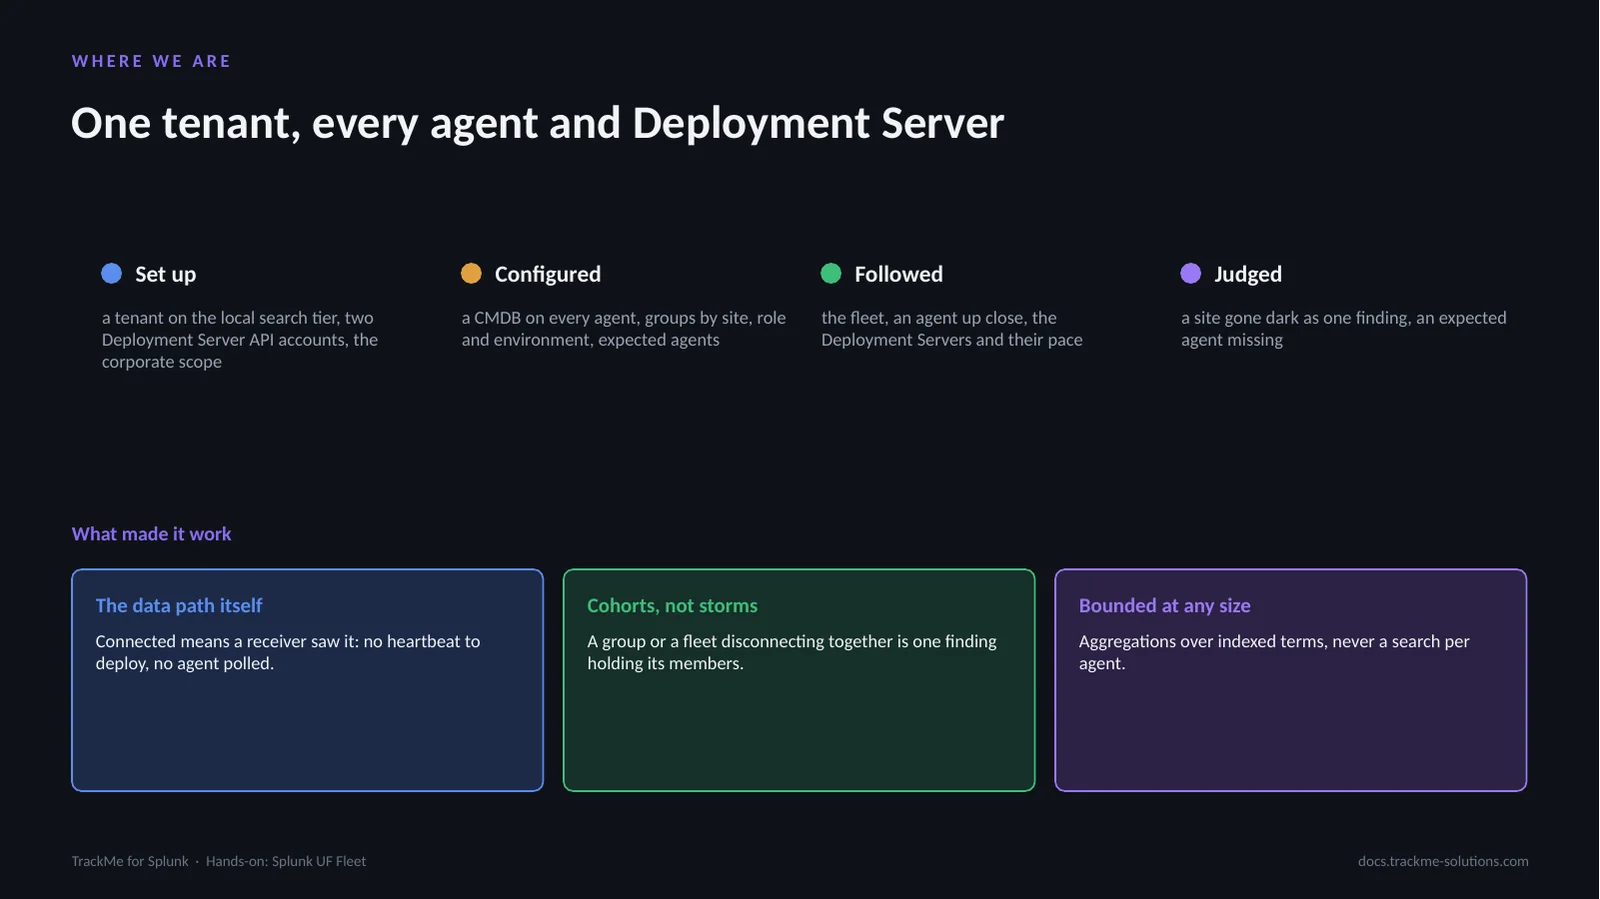
A Splunk UF Fleet tenant set up on twenty universal forwarders and a Deployment Server cluster, enriched from a CMDB, grouped by site, role and environment, its critical agents expected. The fleet, the agents and the Deployment Servers followed. A site gone dark read as a mass disconnect per cohort, an expected agent missing, and the AI Agent’s review.