Who is doing what on your Splunk? User Activity Monitoring (UAM)
About this white paper
This white paper presents User Activity Monitoring (UAM), the dedicated tenant type of TrackMe, generally available in 2.4.19: why it exists, how it is designed, how it turns the audit trail, the search resource records and the knowledge objects of a Splunk platform into findings, and how to adopt it.
It is not a procedure. The tasks — creating the tenant, reading the workspace, triaging a finding — are in the product guide, and the 36-slide hands-on deck walks through the same story screen by screen. This paper links to them where they apply.
The screenshots come from a lab tenant monitoring two search head tiers of one indexing layer. The accounts that appear in them —
alice.moreau,jane.doe,ben.okafor,tom.hendricksand others — are fictitious.UAM requires a licence beyond the Foundation edition: Enterprise, Unlimited, the Unlimited trial or the Developer licence.
Product guide references: User Activity Monitoring (the task guide), User Activity Monitoring — reference, Findings, Finding groups and findings actions and the hands-on deck User Activity Monitoring.
The problem: nobody sees who does what
TrackMe has always watched the data. A Splunk platform is also the people and the automation that use it, and after a few years nobody can say precisely who does what on it:
Personal schedules. An analyst creates a scheduled report to feed a dashboard, then changes team or leaves. The report keeps running under an account nobody owns any more — or stops the day the account is disabled, and a dashboard silently goes dark.
All-time searches. A search with no lower time bound reads every bucket of an index. Scheduled, it is a recurring cost; ad hoc, it is the
index=* earliest=0that pins a search head for an hour. Nobody sees it until the platform slows down.Knowledge objects that grow. A CSV lookup rewritten every hour by a scheduled search reaches hundreds of MiB, is replicated with every knowledge bundle, and nobody knows which account writes it.
Cost without a name. One account, a person or an integration, takes a large share of the search CPU with a handful of searches. The resource records know, per process and per node; they sit in
_introspectionfor a couple of weeks and age out.
Splunk keeps the evidence of all of this — the audit trail, the search resource
records and the knowledge objects exist on every deployment, Enterprise or Cloud — but
reading it is a project: the formats differ between versions, an audit line is not a
search, a search is not a person, and a naive search over _audit is itself a load on the
platform. The requirement behind UAM was simple to state: read those sources once,
cheaply, and turn them into decisions an administrator can take — with the result kept as
evidence in the indexes and as a work queue in TrackMe, not as a dashboard someone has to
remember to open.
Design principles
Six decisions shape the tenant type.
A dedicated tenant, whose object is the finding. UAM is not an eighth entity component. A tenant is either an entity tenant (DSM, DHM, MHM, FLX, FQM, WLK, VOL) or a UAM tenant, never both. There is no decision maker, no impact score and no state colour: a healthy account has no finding at all, and the work queue only contains what needs a look. UAM shares this findings model — policies, findings, Finding groups, triage, assignment, notifications, findings actions, the AI Agent, Collection health — with Cribl Stream and Cribl Edge (Findings, Finding groups and findings actions).
Read what Splunk already keeps. No agent, no forwarder change, no third-party app: the
_audit trail, the _introspection resource records and the search completion records
on the indexing layer, and the Splunk REST API of every search head tier.
Bounded collection, visible coverage. Every read is incremental and bounded: the audit trail from a durable checkpoint, never all time; the catalogs one dataset at a time; the history in fixed buckets. Gaps and partial coverage are recorded in receipts and shown in Collection health, never hidden. A run that could not cover everything may add findings; it never clears one.
Honest claims. An account is the principal reported by Splunk, not a verified person: shared credentials or an integration running as a person’s account look like that person. Distinct search ids are a launch-count proxy. There is no machine learning: the thresholds are explicit, and the daily CPU baseline is a percentile.
Observe, never act on the platform. UAM never edits, disables, dispatches or deletes what it observes. A remediation is a suggestion; a decision on a finding stays in TrackMe.
Talk to the people concerned. A finding about an account is, in the end, a conversation with the person or the team behind it. UAM can email that account directly, next to the operators who triage.
How it works
One indexing layer, one to ten search head tiers
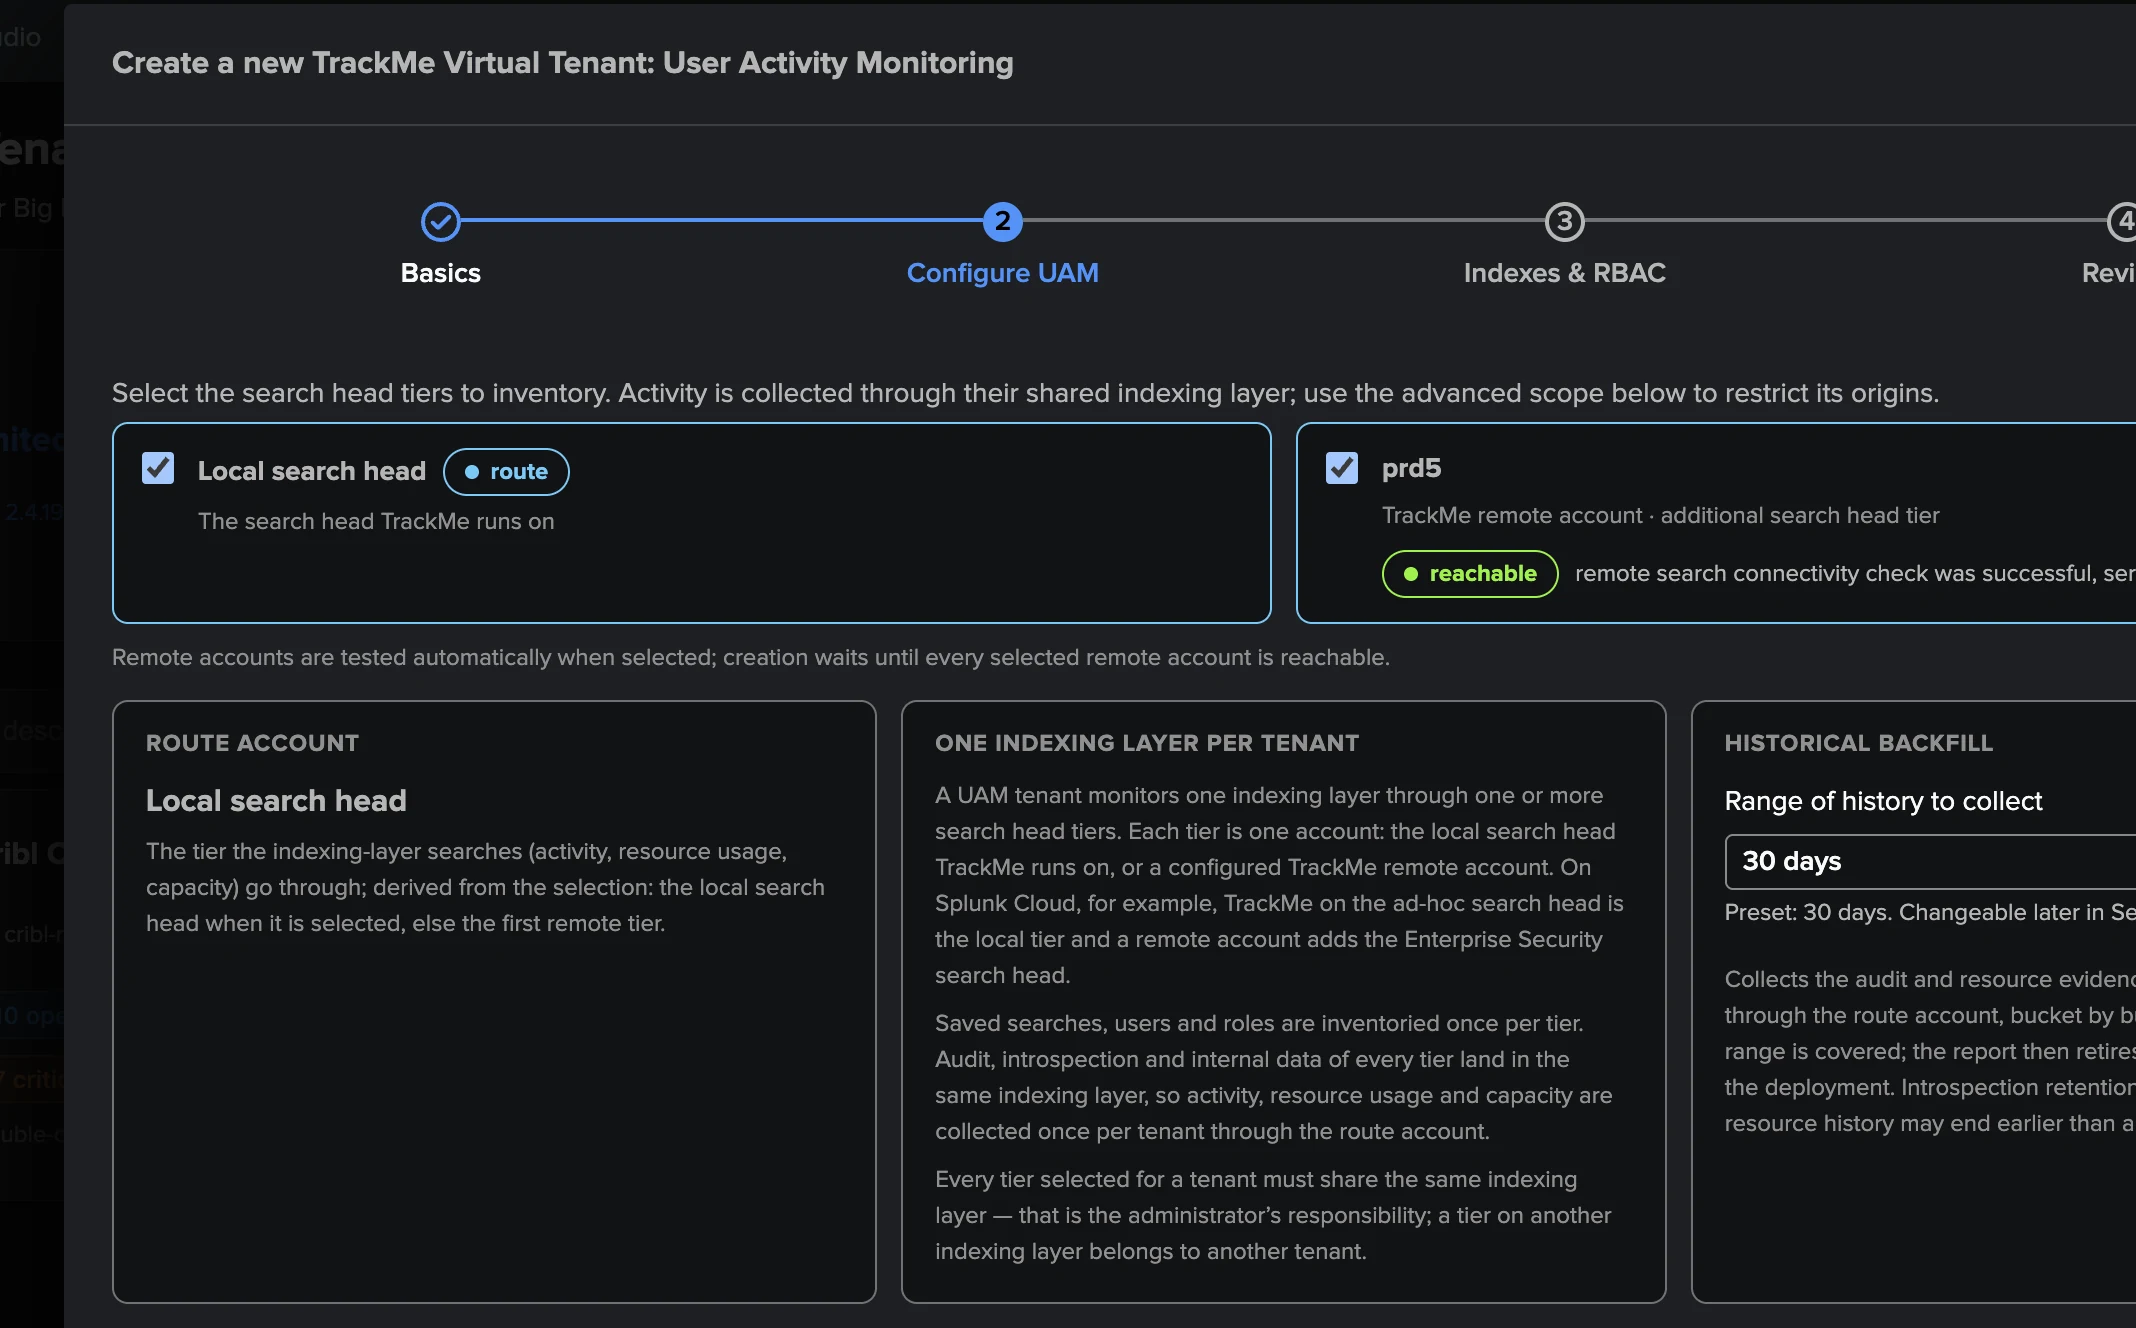
A UAM tenant monitors one indexing layer seen through one to ten search head tiers: the local search head TrackMe runs on and / or remote Splunk deployments reached through TrackMe remote accounts. The two kinds of data live in different places, and UAM reads each where it lives:
Data |
Lives on |
Read |
|---|---|---|
Saved searches, users, roles, CSV lookup files and the other knowledge objects |
each search head tier |
once per tier, from the Splunk REST API |
|
the indexing layer, where every tier forwards its internal indexes |
once per tenant, through one tier called the route account |
A typical Splunk Cloud shape is the ad hoc search head (the local tier, also the route) plus a remote account for a premium-app search head; on Splunk Enterprise, any number of remote accounts over the same indexers. Keeping every tier on the same indexing layer is the administrator’s responsibility: two independent deployments make two tenants. Optional hostname patterns (Activity scope) leave out a search head that shares the indexers, such as a test instance. The details are in Search head tiers and the route account.
Knowledge-object catalogs from the REST API
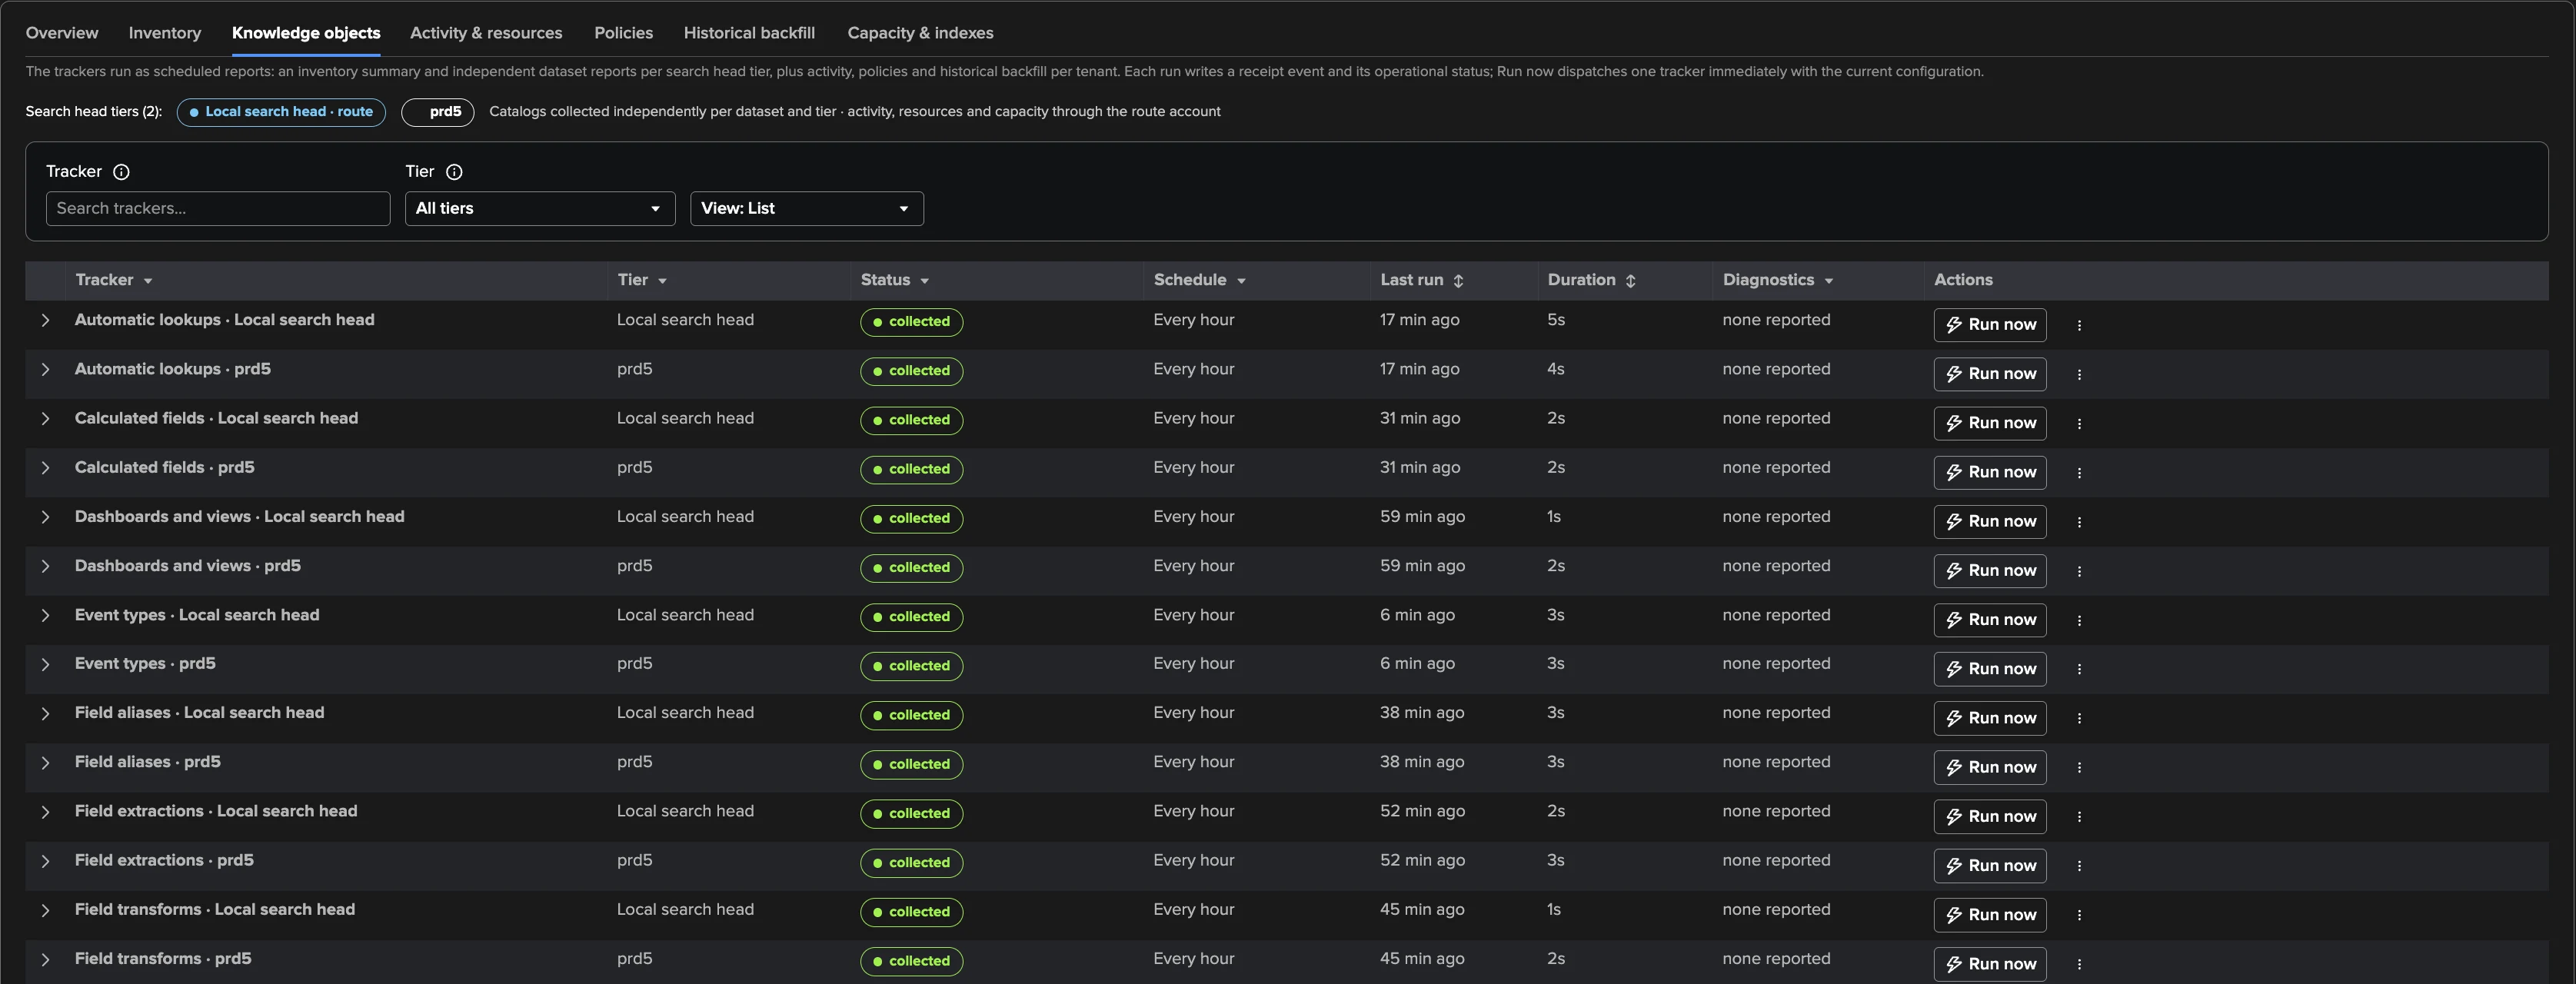
The inventory is read from the Splunk REST API only, one scheduled traversal per dataset and per tier. Ten knowledge-object families sit next to the saved searches, the users and the roles: dashboards and views, macros, event types, field extractions, field transforms, field aliases, calculated fields, lookup definitions, automatic lookups and tags, plus the CSV lookup files — their size, owner and modification time, never their contents.
Saved searches and the other families are collected on the catalog cadence (daily, in an off-peak window by default), users and roles every hour, CSV lookup files every 15 minutes.
A traversal publishes a complete generation or nothing: a failed or partial one keeps the last good catalog, and only a complete one can mark an object removed. Every change of a saved search, user, role or lookup file — added, changed, removed, reappeared — is indexed.
The definitions (saved-search SPL, macro bodies, dashboard source, field expressions…) are kept for administrators, from an explicit attribute list — never a credential, never the contents of a CSV file.
The catalogs reflect what the collection account can see: the coverage of private objects depends on its permissions.
Each family surfaces where it is useful: the owner’s catalogs in the account view, Search knowledge objects across every owner, and Collection health → Knowledge objects.
Activity and resources through the route account
Every five minutes, the activity report reads the _audit trail from its durable
ingestion-time checkpoint and writes one compact record per search and window: the
account Splunk reports, the app, the search id and type, the outcome, the run time, the
events and results, and whether the search covered all time. REST job access is summarised
per account rather than written line by line. In the same run it collects the resource
usage of every search — CPU time, the part spent on the indexers, peak memory, elapsed time
— and refreshes the environment’s search capacity at most hourly.
Two choices make the collection hold on today’s platforms:
The audit format is the contract, not the Splunk version. A line that parses as the classic
key=valueaudit grammar or as the structured JSON record is evidence. Splunk Enterprise 10.4 and Splunk Cloud 10.5 are qualified; any other version is read all the same and only adds a soft diagnostic.CPU follows Splunk’s own accounting where it exists. Splunk Cloud 10.5 accounts a search’s CPU at completion, on the search head and on each indexer, and runs short searches in pooled processes that the introspection samples barely catch. UAM decides per window and per tier from the data: a tier with completion figures counts its CPU once, at completion; a tier without them keeps the CPU integrated from the introspection samples. Every resource record says which source it used, and peak memory reads not measured rather than zero when no sample caught a search.
Every search UAM runs goes through Splunk’s Search API v2, the API Splunk keeps as the v1 Search API is retired.
A historical backfill (30 days by default, up to 90) collects the audit and resource
history that existed before the tenant, newest first, in fixed buckets, and stops at the
retention of the sources — _introspection is often kept for less time than _audit.
It never collects a span twice. Its main value is the classification: the people and
services already active are recognised on the first day instead of a week later.
Evidence in indexes, state in the KV store
The evidence is written as trackme:uam:* events into the tenant’s summary index (audit
records, executions, resource records, inventory changes, receipts) and its notable index
(finding transitions), each family re-targetable to another index. Indexed dimensions let the
per-account and timeline views run through tstats, in proportion to the accounts rather
than the events. The state — configuration, catalogs, findings, Finding groups — lives in
per-tenant KV collections. All collection runs in scheduled searches, never in a REST
handler. The evidence counts against the Splunk licence like any TrackMe summary data; it is
compact by design, and the full shapes are in The evidence.
Accounts: who is a person, who is a service
A finding about an account only makes sense once you know what the account is. UAM keeps three classes, and the class decides which policies apply:
human — detected from interactive activity: a search run from Splunk Web, or a successful browser login. One signal is enough, and the class stays.
service — detected after seven distinct days of automation-only activity (API jobs, the scheduler, acceleration) and nothing a person does; withdrawn as soon as the account does what a person does. This detection needs the classic
key=valueaudit format.system —
nobody,splunk-system-userand the built-inadmin, preset; never evaluated by the account policies and never emailed.
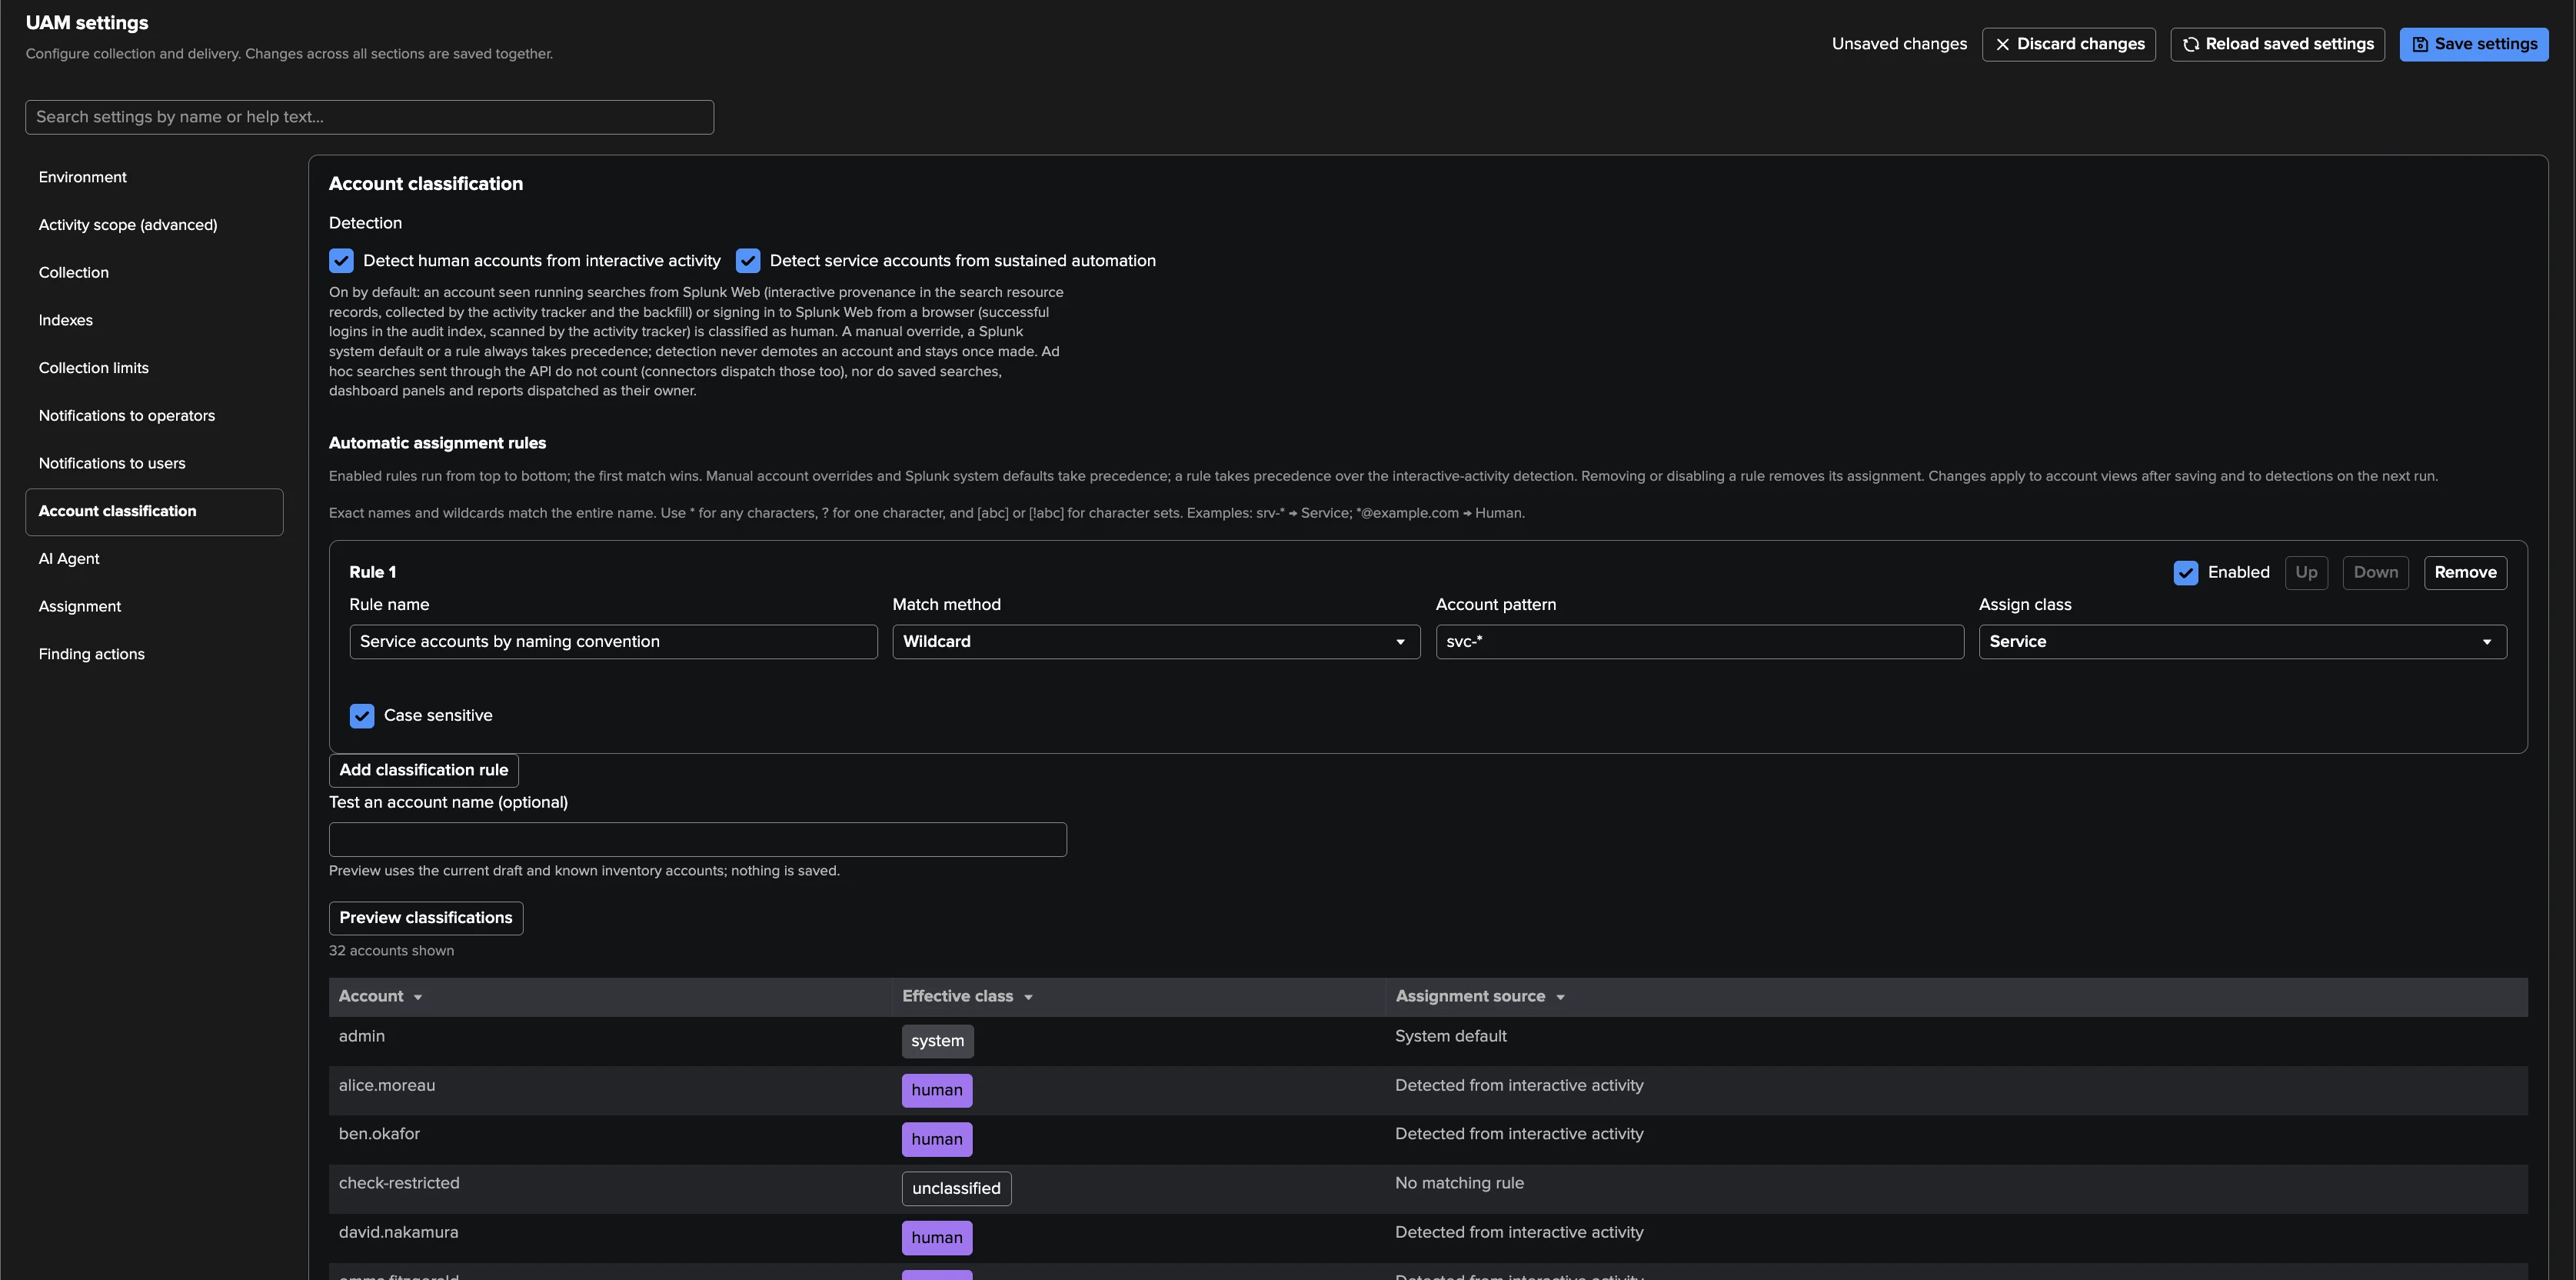
On top of the detection, ordered classification rules (exact names or wildcards such as
svc-*) and manual classes settle the rest. Precedence is always the same: manual
class, system defaults, the first matching rule, human detection, service detection. An
account nothing classifies stays unclassified and is left out of the policies scoped to
human accounts.
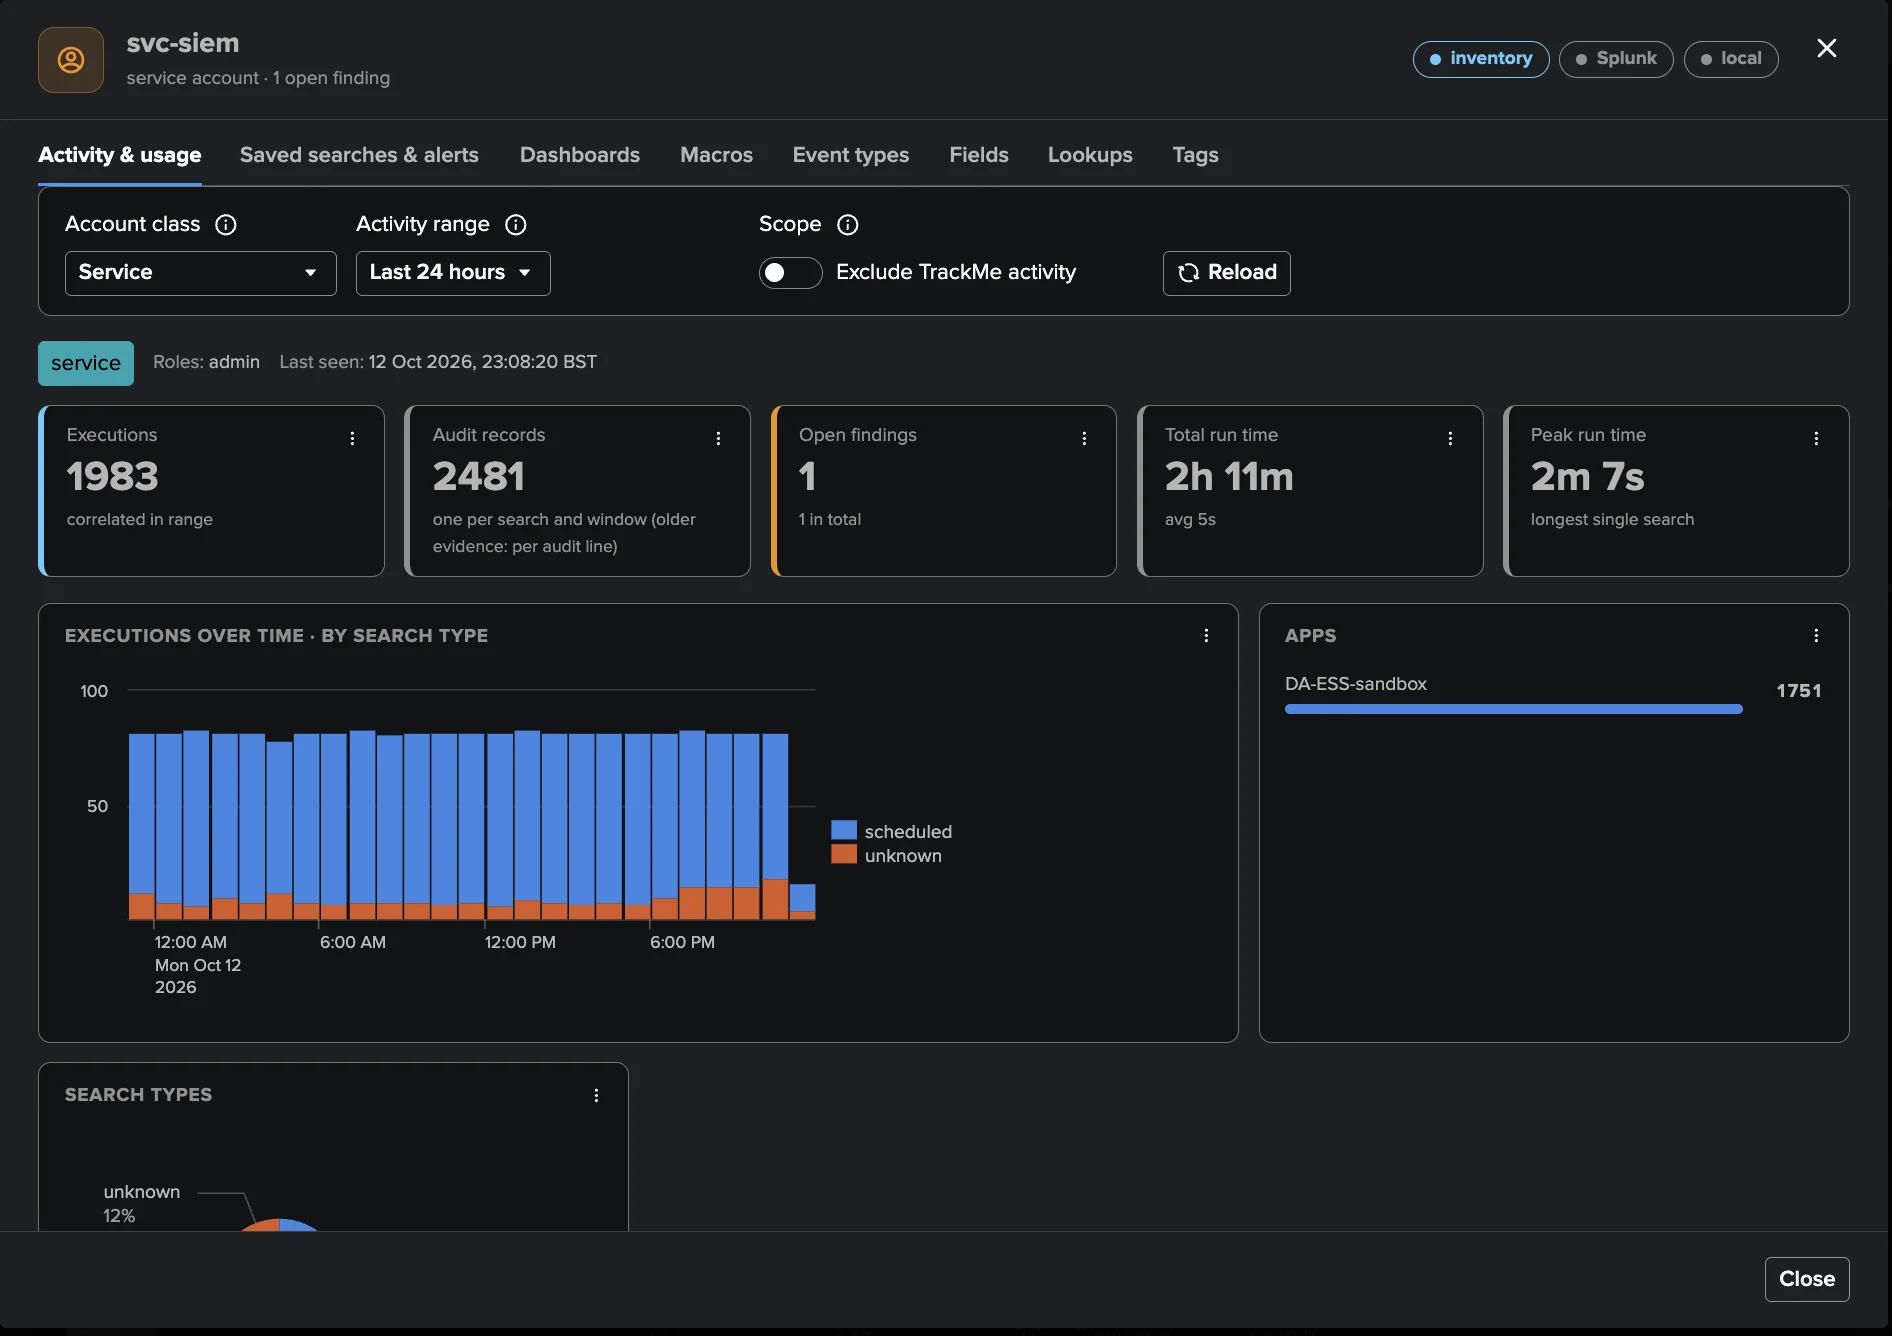
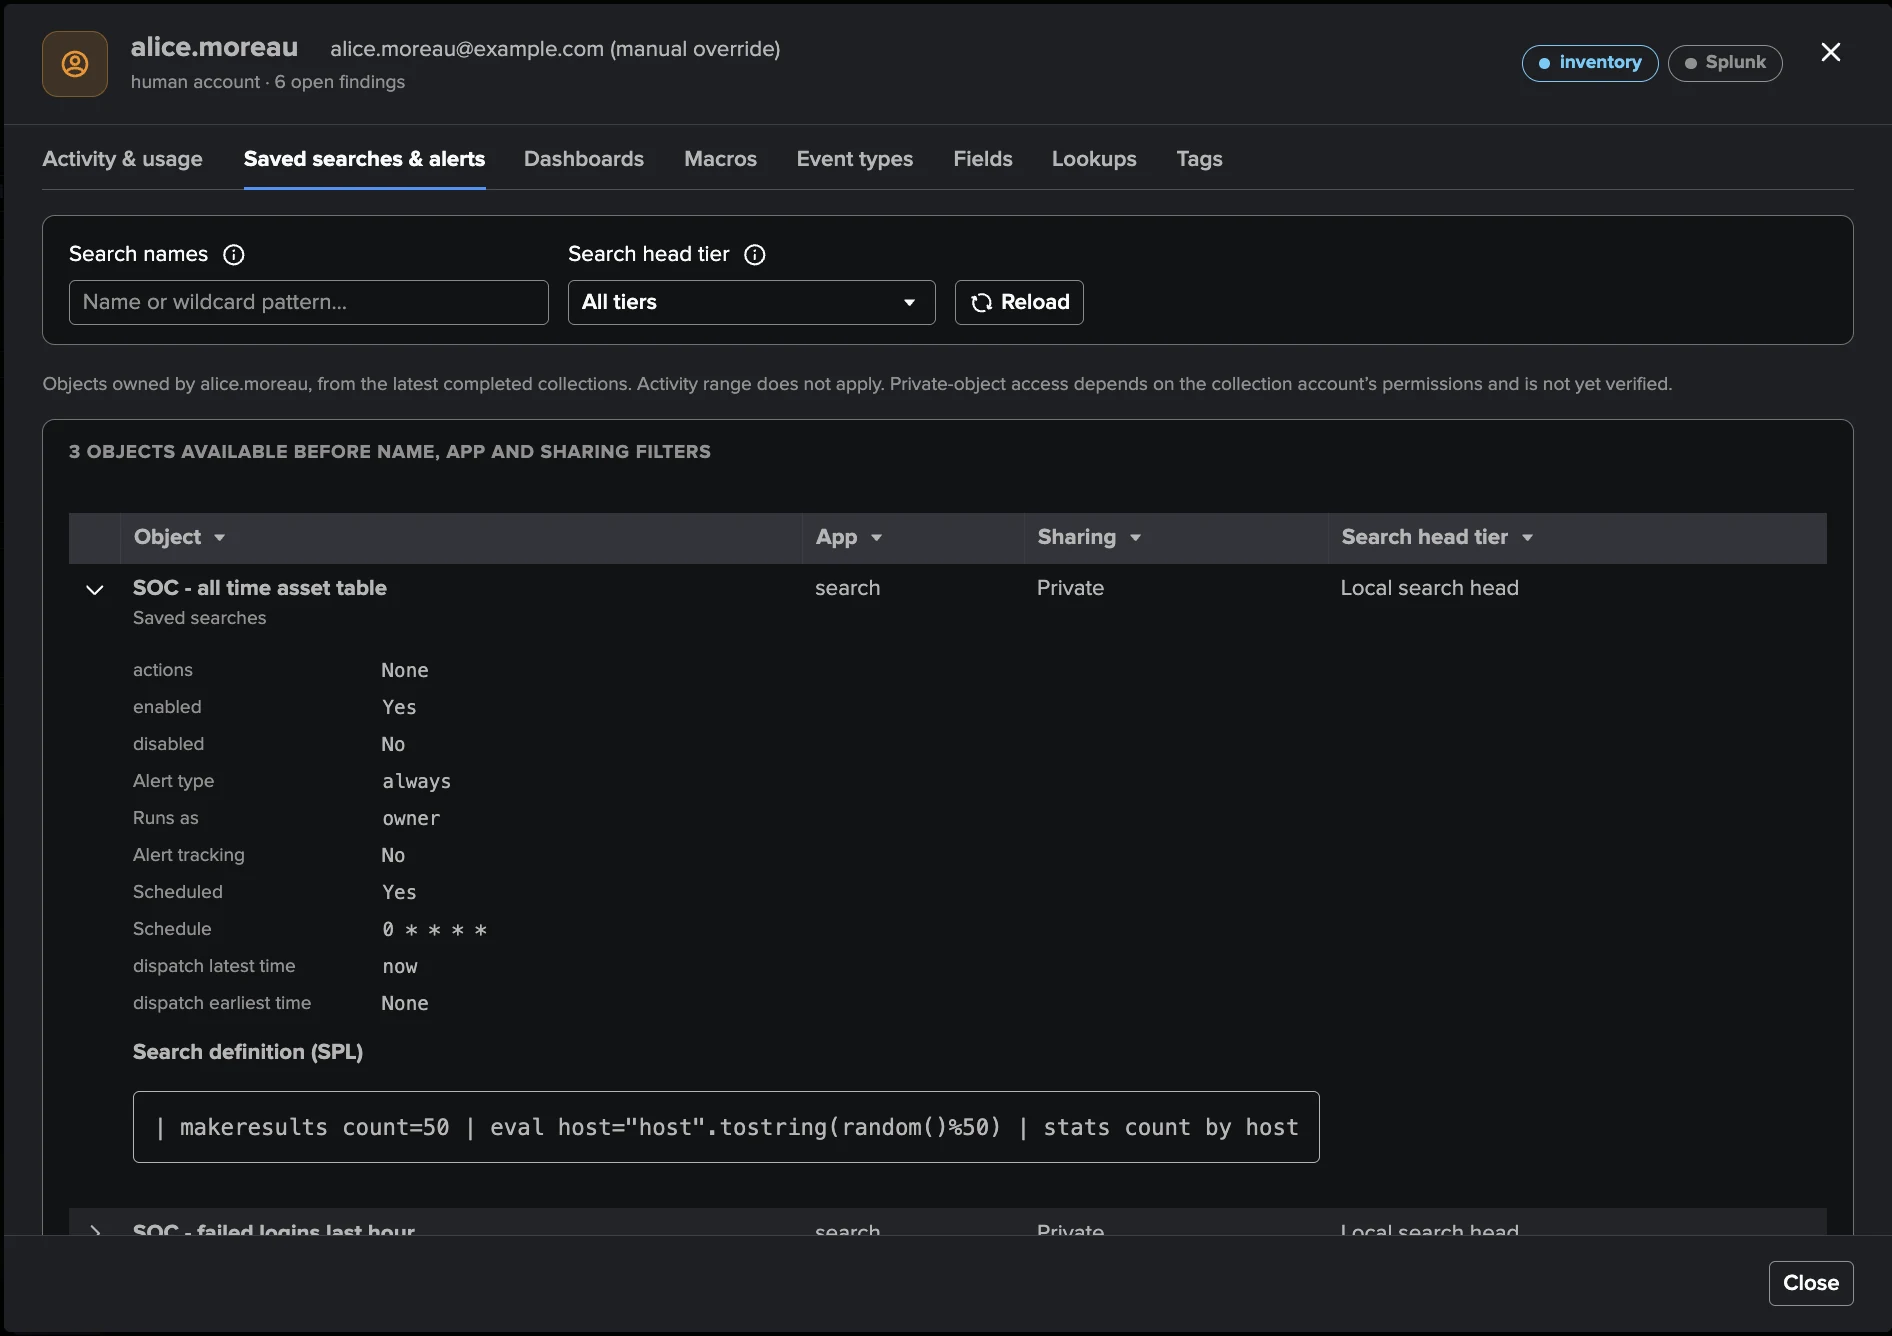
The account view brings everything known about one account together: executions and run
time by search type, CPU over time and the daily CPU baseline, the most expensive and most
recent searches with Fetch SPL, its findings — and, since 2.4.19, the knowledge objects it
owns on each tier, one tab per family. Fetch SPL reads the text of a search live from
_audit, as the person asking, and stores nothing; indexing search text is an opt-in
(Store SPL search, off by default), to be pointed at a restricted index first since search
text can carry literals and secrets.
Policies: what deserves a look
A policy reads the catalogs or the evidence and raises one finding per policy and subject — a saved search or an account — with its evidence, a severity and a suggested remediation.
Twelve built-in policies in three families
Family |
Policies (on by default in bold) |
|---|---|
Inventory — read from the catalogs, judged per tier |
Scheduled search owned by a human account (low); Scheduled search owner is not classified; Scheduled search exceeds the hourly schedule limit; Scheduled search has an all-time dispatch lower bound; Scheduled search uses a real-time dispatch range; CSV lookups attributed to an account exceed its size allowance. |
Activity — read from the audit records of the last 15 minutes |
Account launched an unusual number of searches; Account ran repeated long searches; Account ran all-time searches (high). |
Resource — read from the resource records |
Account’s search resource consumption exceeded its allowance; Account ran repeated resource-intensive searches; Account’s CPU consumption is unusual for its daily baseline (shipped in preview mode). |
Seven are enabled on a new tenant. Every policy takes exact owner and app exclusions — the
trackme and Splunk_SA_CIM apps are excluded by default, so the monitoring and the
data-model accelerations do not flag themselves — and the account policies an account scope
(human accounts, classified accounts or all). The full catalogue with every threshold is in
The built-in policy catalogue.
Three design points deserve attention:
Budgets derived from the capacity. The resource policies carry no absolute figure to maintain: with automatic thresholds on, an account’s allowance is 10 % of the measured search CPU capacity per window, and a heavy search reaches 2 % of it or 10 % of the smallest search host’s memory. An account above 40 % of the environment’s search CPU has its finding raised one severity level — the share is evidence and a boost, never a finding on its own. The resource policies stay learning until the tenant holds 24 hours of resource history and a measured capacity.
The CSV lookup footprint, attributed. On each tier, one CSV lookup over 100 MiB, or the CSV lookups of one account over 500 MiB in total, raise a finding. A file is attributed to its probable writer — the account the audit evidence shows writing it — and otherwise to its recorded owner; the evidence keeps the basis of the attribution and both identities. It is an estimate since monitoring began, not proof of authorship, and only the metadata is read.
Explained evaluations. Each policy’s last evaluation opens a policy insight: what the run saw, what was matched, excluded, not applicable or could not be judged, and why, with a seven-day history. Preview policy shows what a draft would raise before you save.
Custom policies in SPL
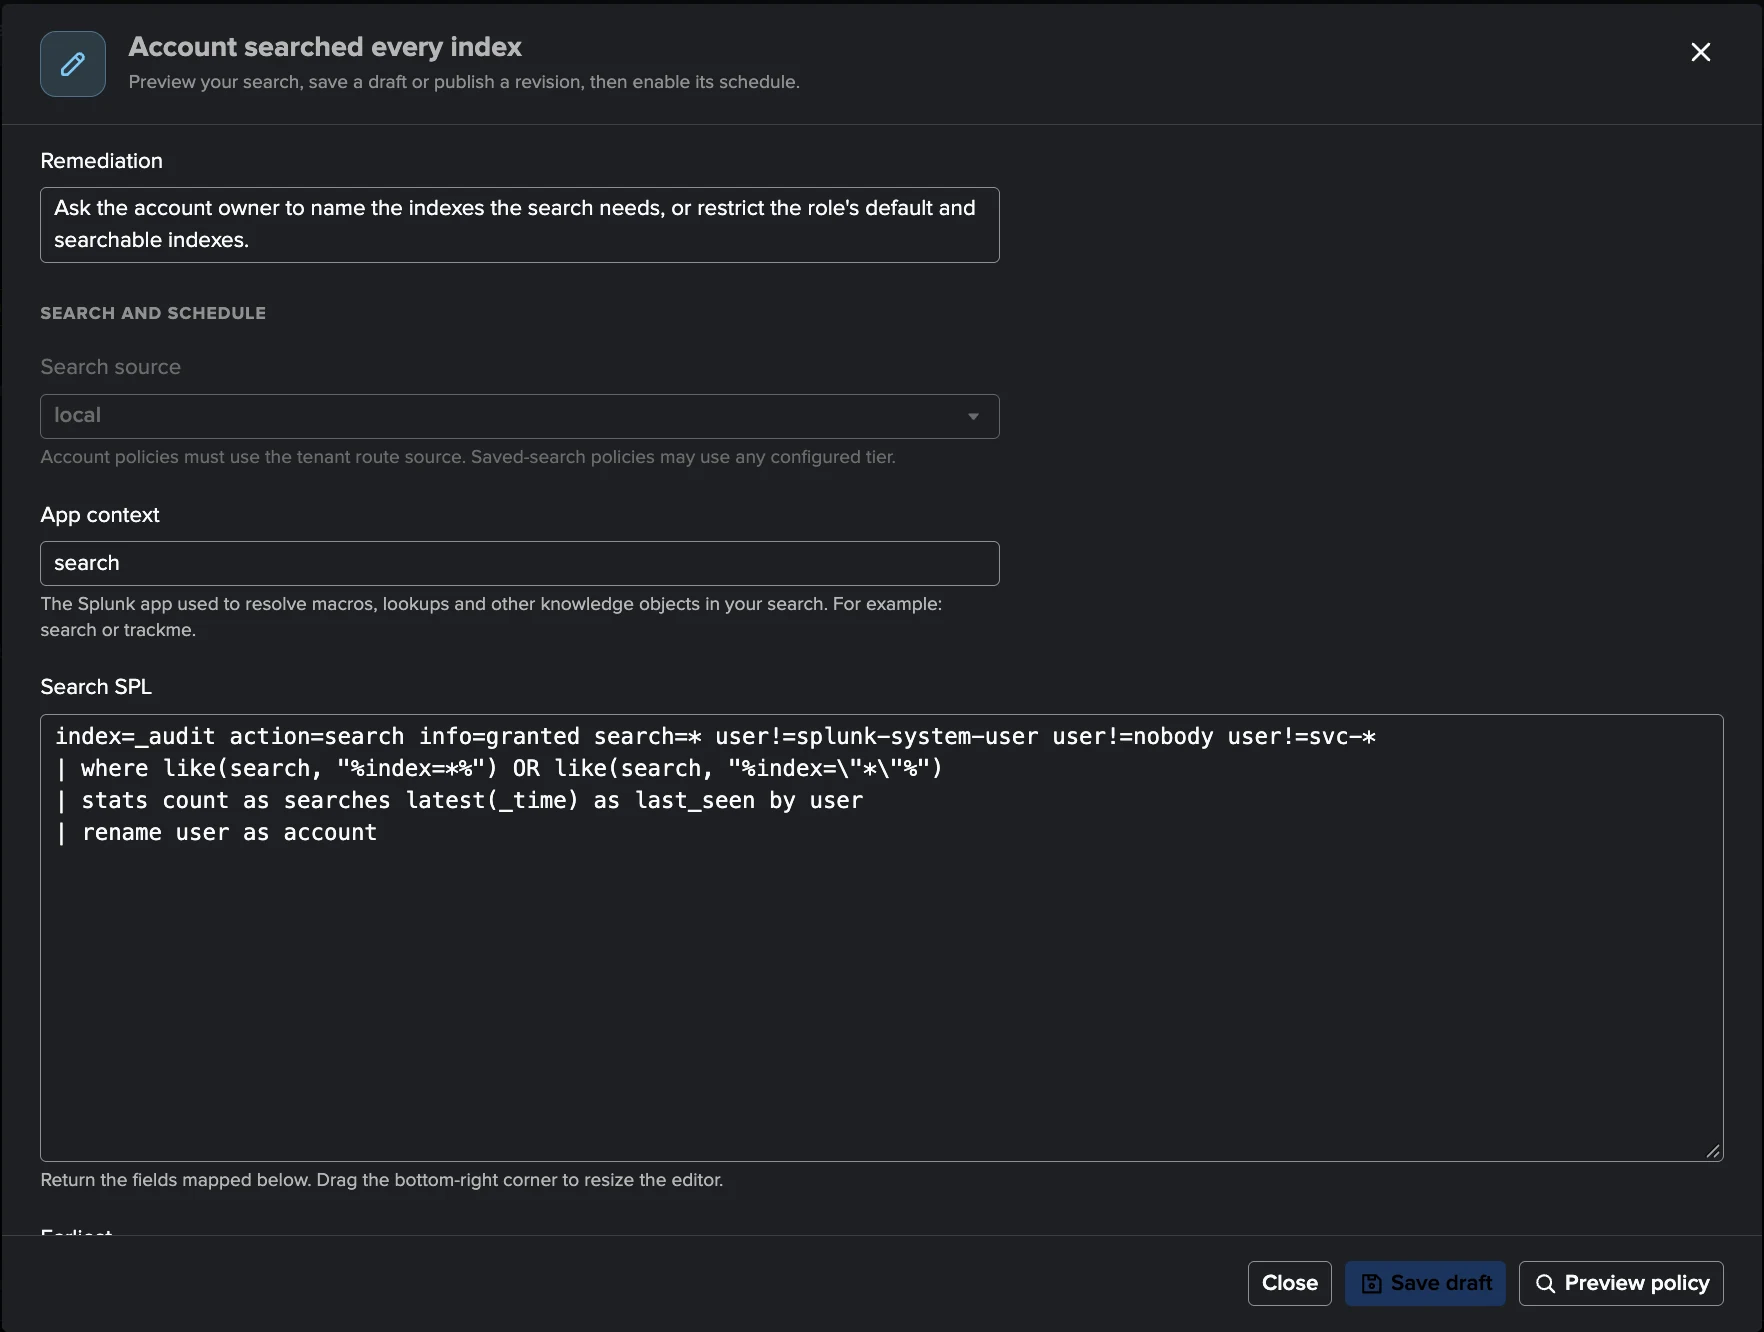
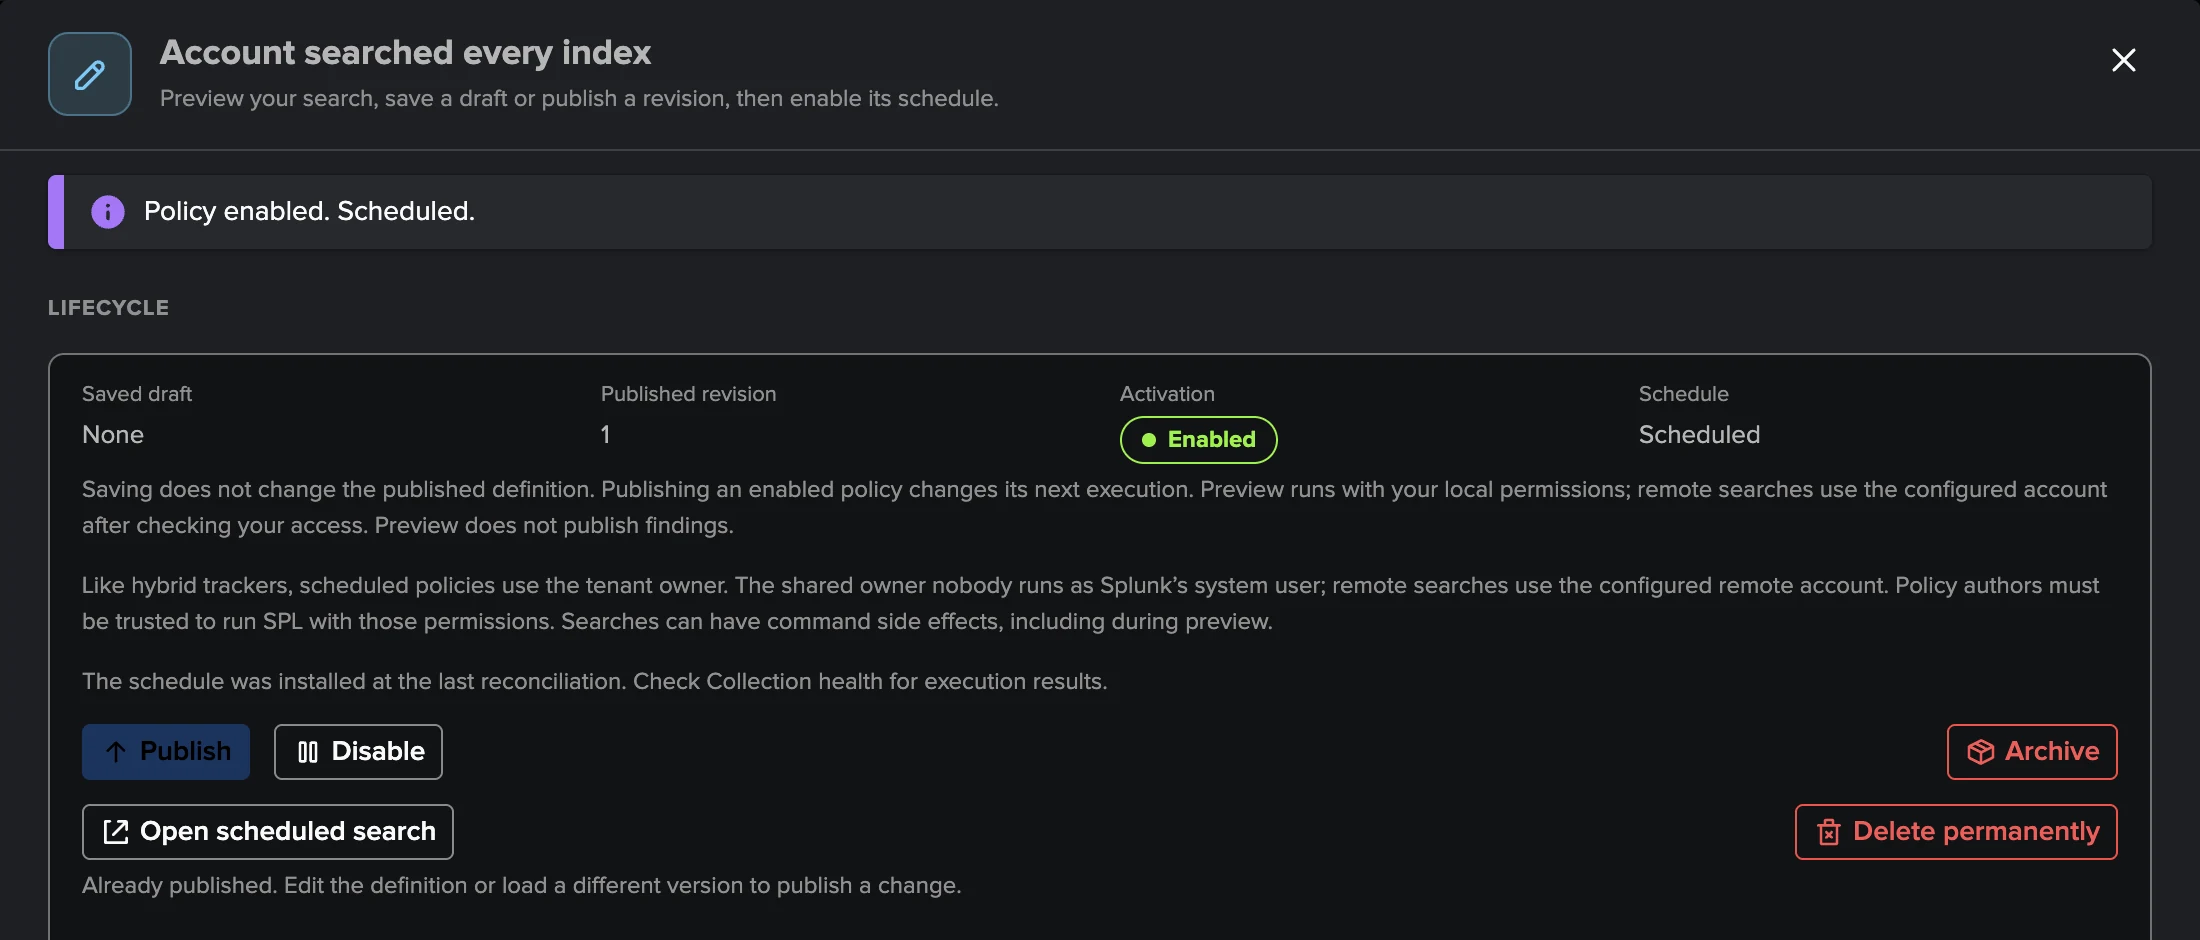
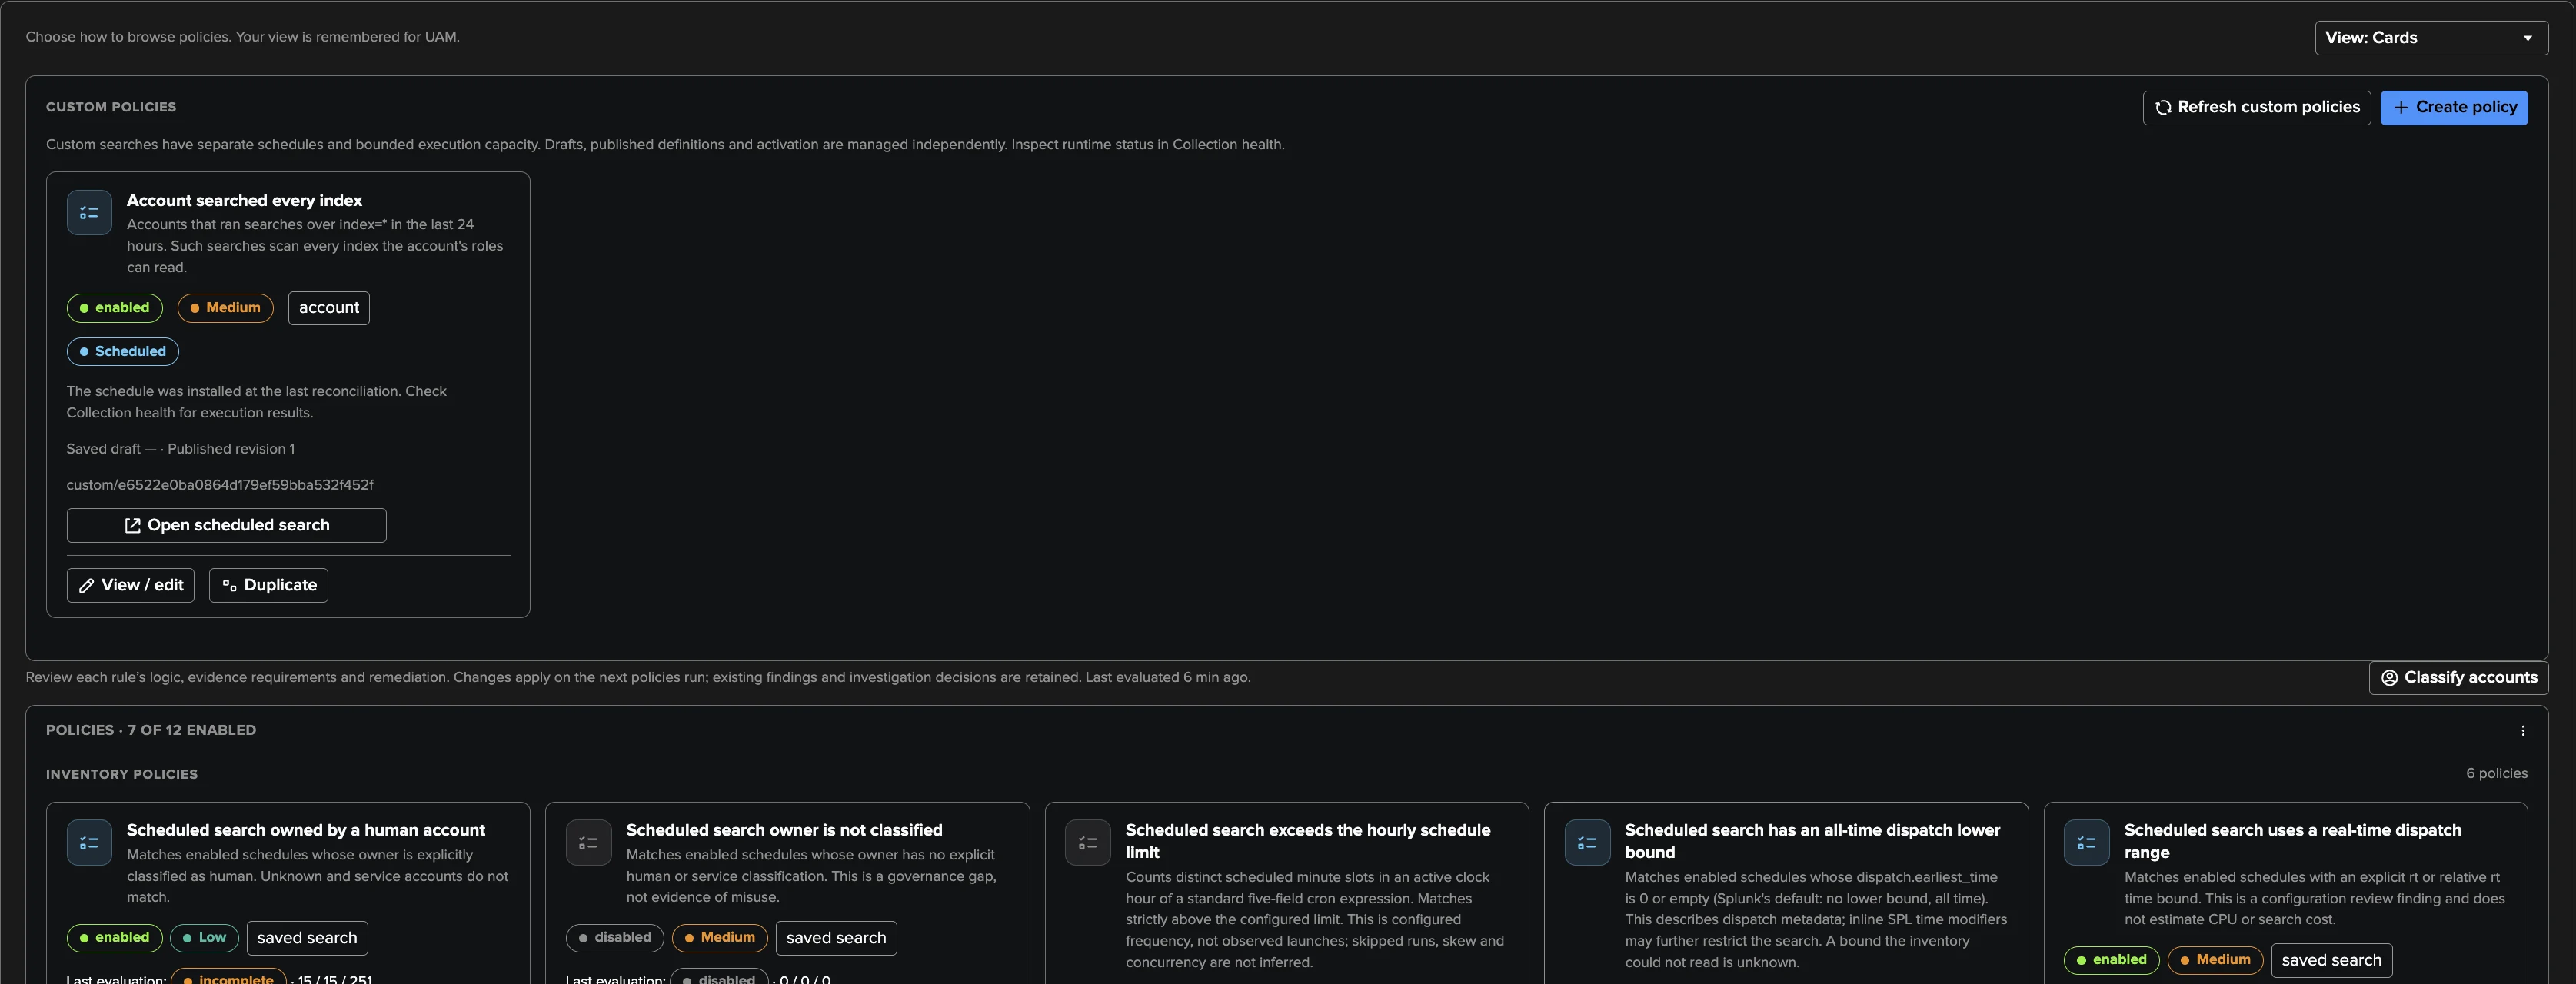
When the catalogue does not cover a rule of your own, tenant administrators write it in SPL. A custom policy is a search, a relative window ending now (at most 31 days), a cron, and a mapping of its results to findings about an account or a saved search — the subject that places them in the right Finding group. Its lifecycle is deliberate:
Preview runs the current draft as its author and shows up to 20 candidate findings.
Publish freezes an immutable revision; later draft edits never change what runs.
Enable schedules a search for the published revision, owned by the tenant owner.
A version history loads, compares and restores versions; Collection health reports the execution health of every enabled policy, and the Configuration Guardian warns when one drifts from its schedule or keeps failing.
A tenant holds up to 100 custom policies, 25 of them enabled. Custom findings appear with the built-in ones, join the same Finding groups and are triaged the same way. Because the SPL runs on a schedule as the tenant owner — and a preview as its author — only trusted tenant administrators author policies. See Custom policies.
Finding groups: triage at the level of the account
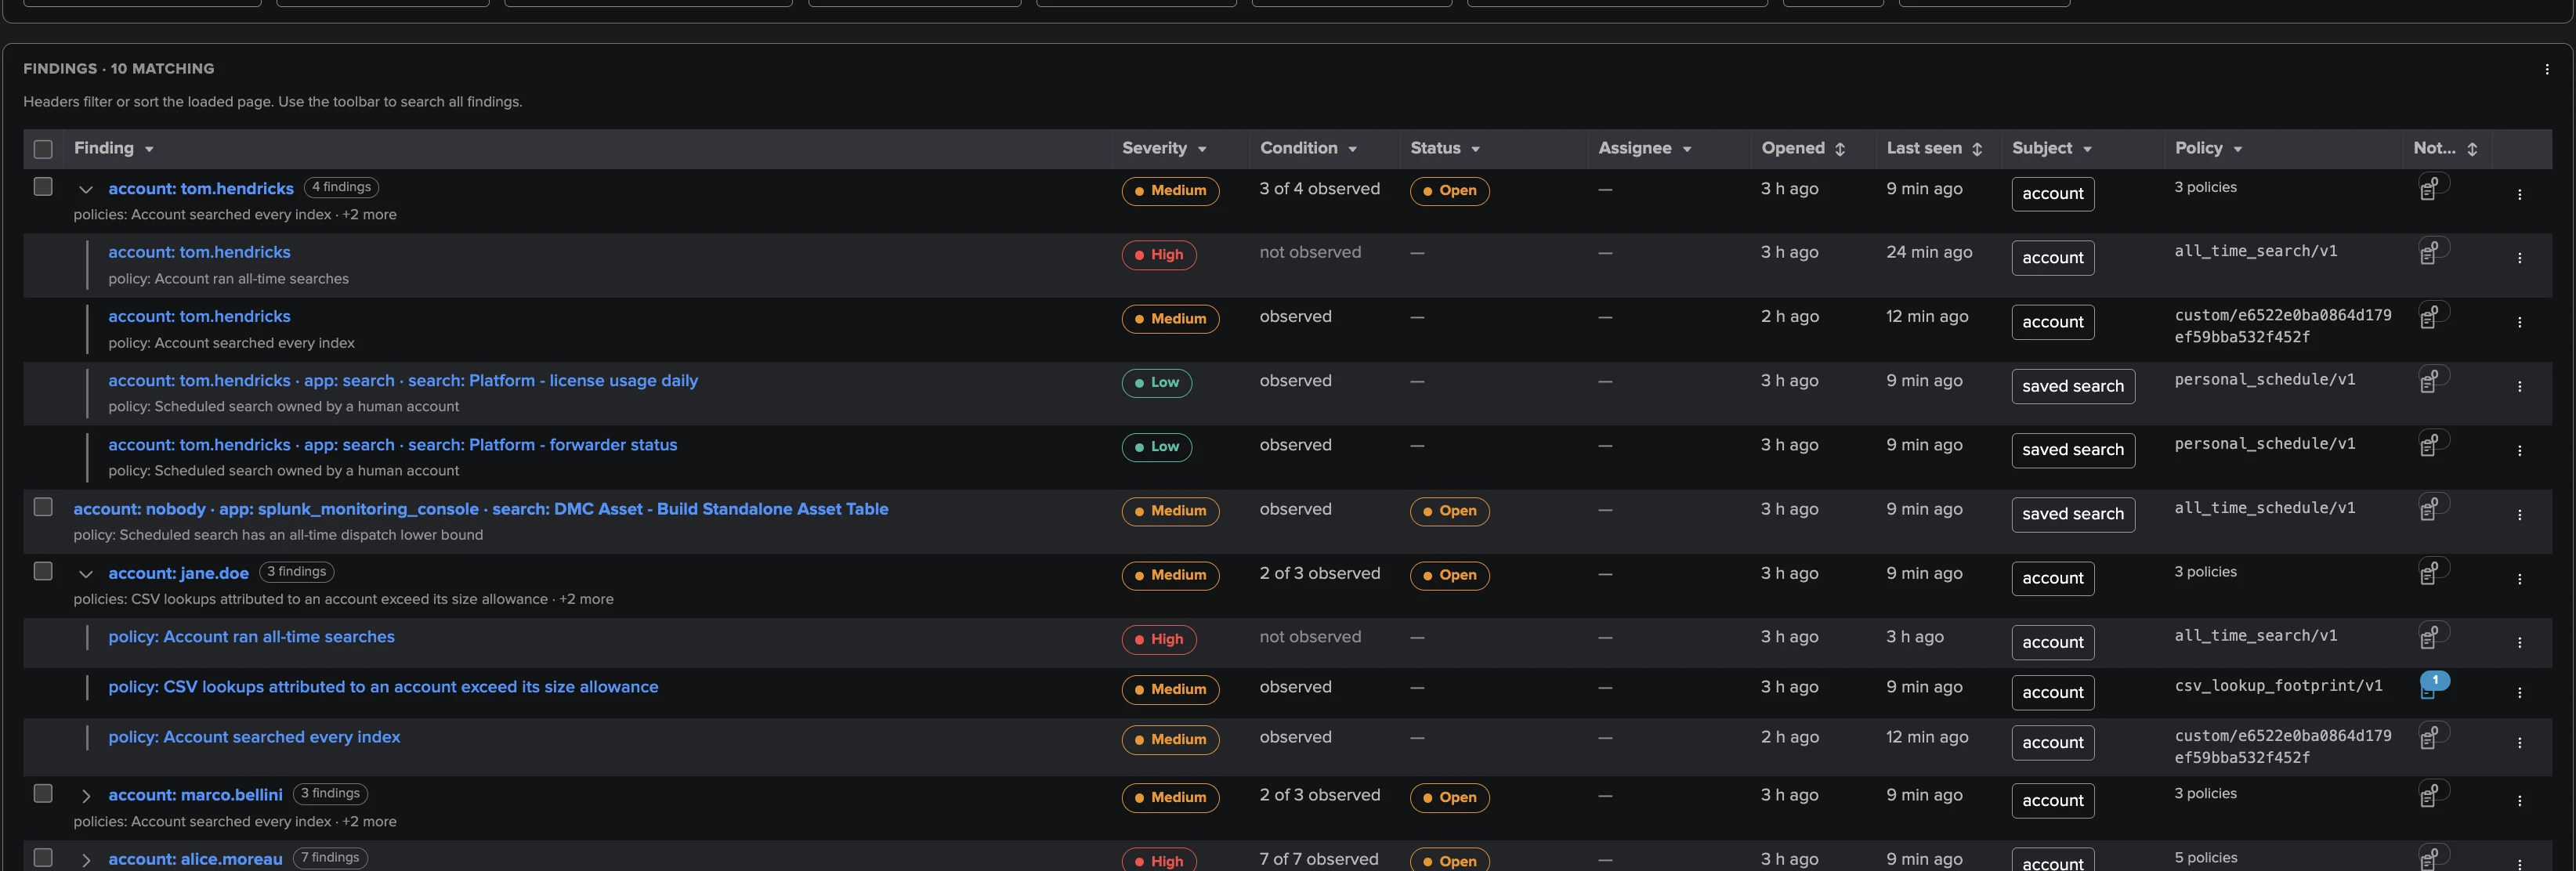
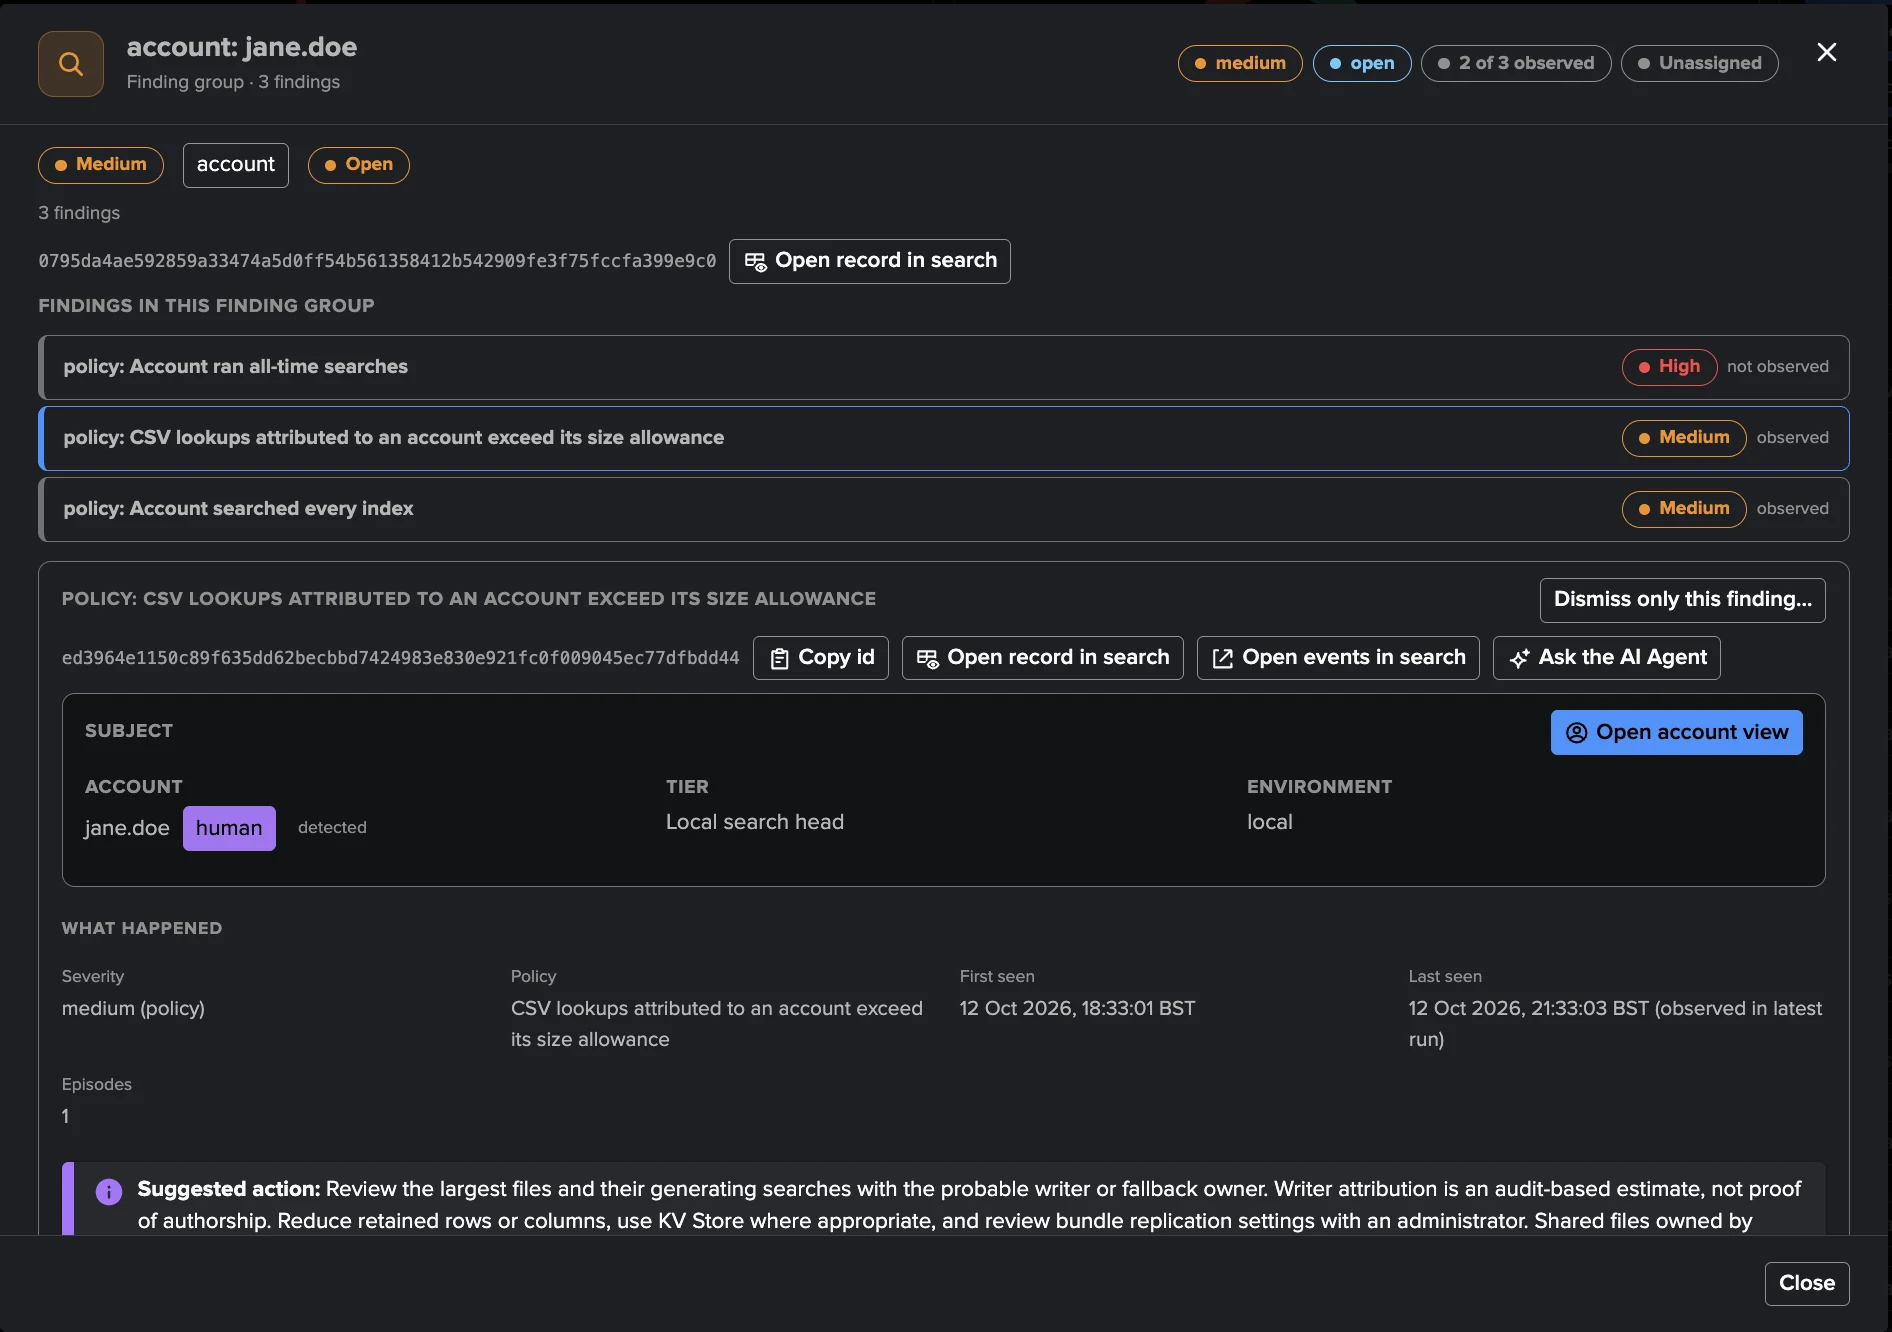
A UAM finding has two independent axes. The first is whether the policy still sees the condition: observed, or not observed after a complete evaluation without it. UAM never resolves a finding for you — a behaviour that disappears from one run still deserves a human decision. The second is your decision: open, investigating, resolved or dismissed (permanently or for 1, 7, 30 or 90 days). A resolved finding observed again reopens; an ended dismissal returns the finding to open.
The decisions are taken on Finding groups. All the findings about one account and the
saved searches it owns form one group: the all-time searches and CSV footprint of
jane.doe together with the custom policy that caught the account’s index=* searches; the
personal schedules of tom.hendricks with that account’s own activity findings. Ownership defines the
group, not classification, and every tier of the indexing layer shares it. The reasoning is
practical: the person you will talk to is the owner, and the conversation covers everything
at once.
A decision on the group applies to every member, except a member dismissed on its own — a personal schedule you accept inside a group that also holds a real problem.
A new kind of finding on a dismissed group reopens the group: a dismissal never silences a new problem.
Operators can also group by hand: merge 2 to 25 groups into one manual group, add to or remove from it, or ungroup — for example to handle the accounts of one project together. The findings of one object always move together.
The Investigate view of a group shows its findings, the subject with its class, What happened in plain words, the evidence of the selected finding, the suggested action and the Triage of the group: status, assignee, severity and notification snooze.
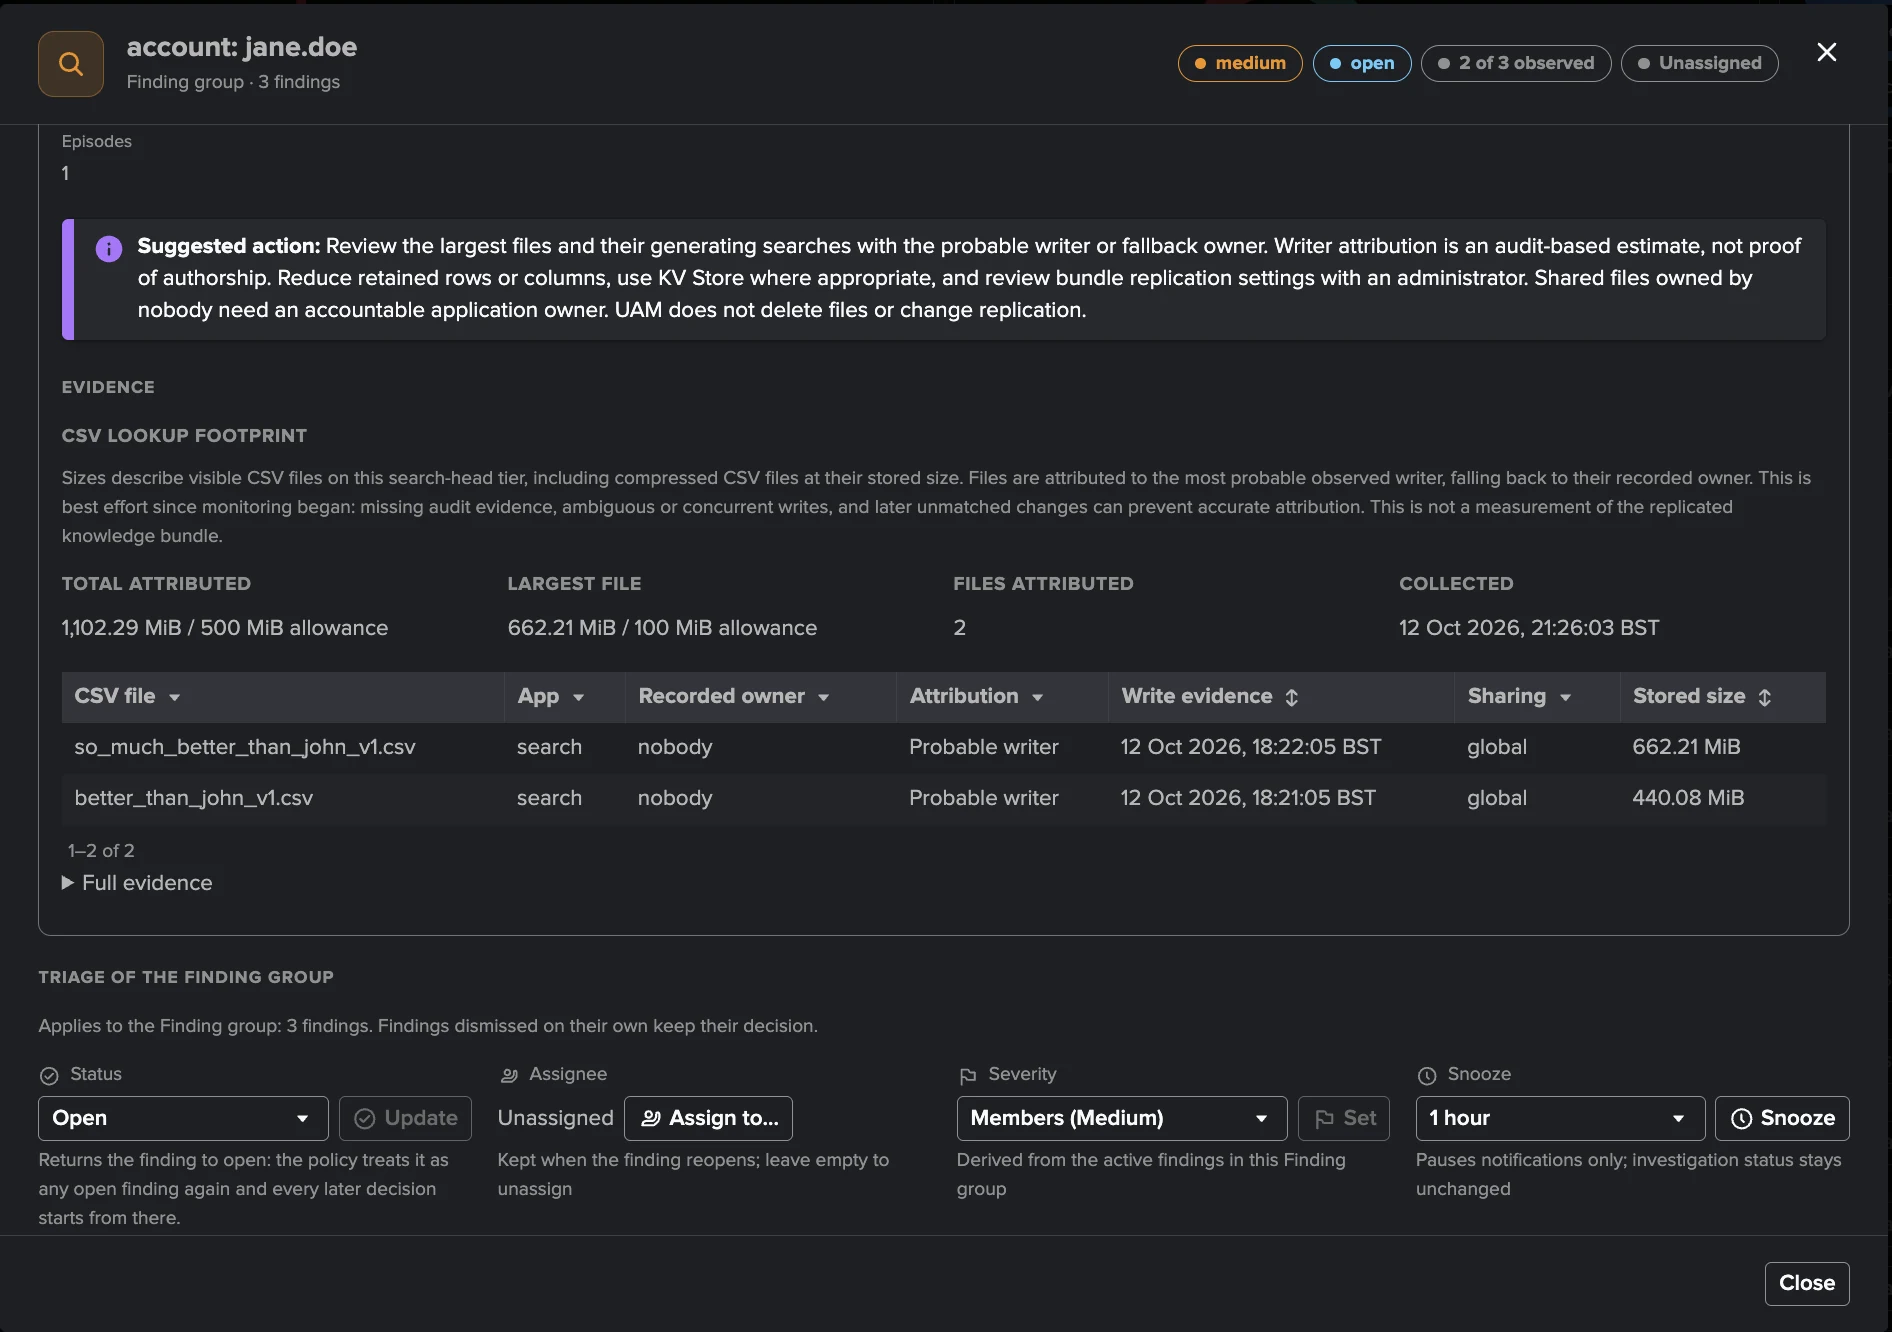
Decisions are recorded in the history of the finding and of its group, with the actor and a
note, and protected against concurrent changes. Assignment groups and ordered routing
rules assign new Finding groups to a team; findings actions add drilldown searches,
links, webhooks through system-wide Webhook accounts and an email action to the finding
menus, by hand or through per-policy automation rules. Every finding transition is also
indexed as trackme:uam:finding, ready for your own Splunk alerts, Enterprise Security
correlations or SOAR playbooks. See Finding groups,
Assignment and automatic routing and Findings actions.
Reaching the people concerned
UAM writes to two audiences, through three independent channels.
Operators — Notifications to operators, off by default: emails on the transitions that matter (new finding, reopened, severity raised, resolved; optionally dismissed and assigned), above a minimum severity, as a digest per policies run or per finding, threaded in the mail client. Every email links to the finding in its Investigate view. Snoozing a Finding group holds these emails without changing its status.
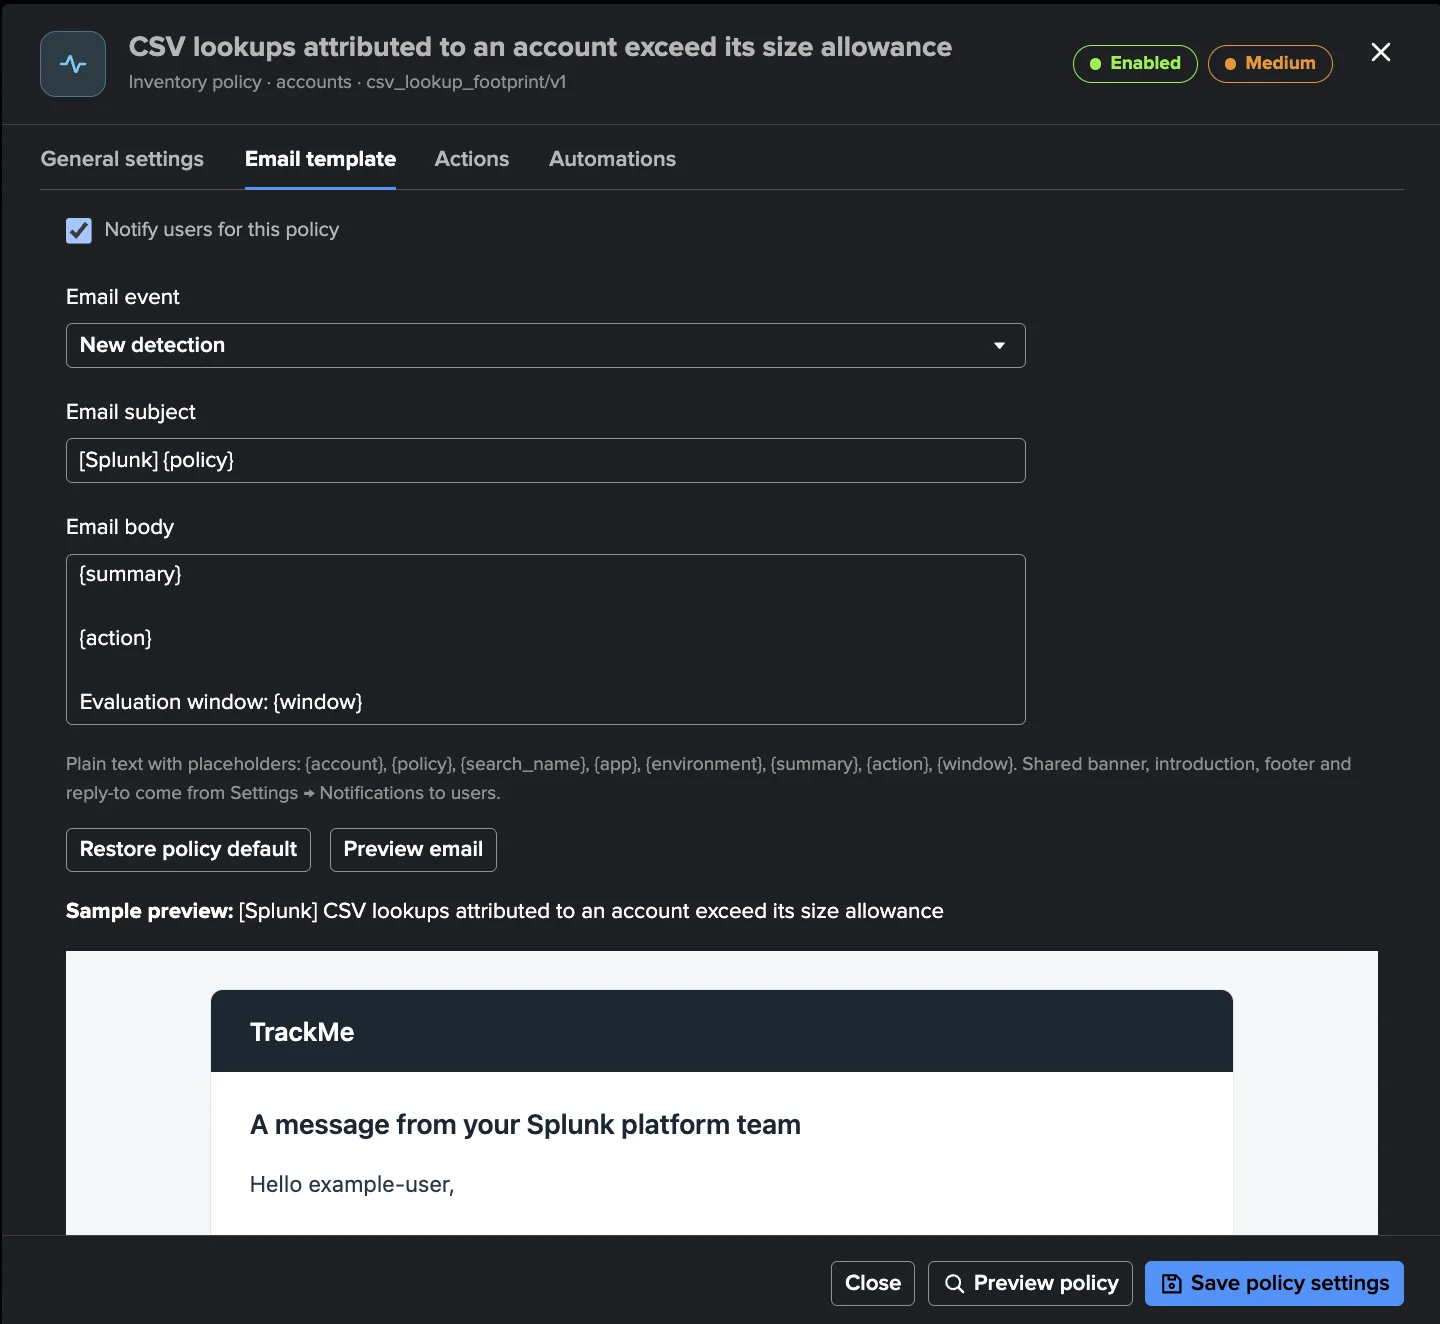
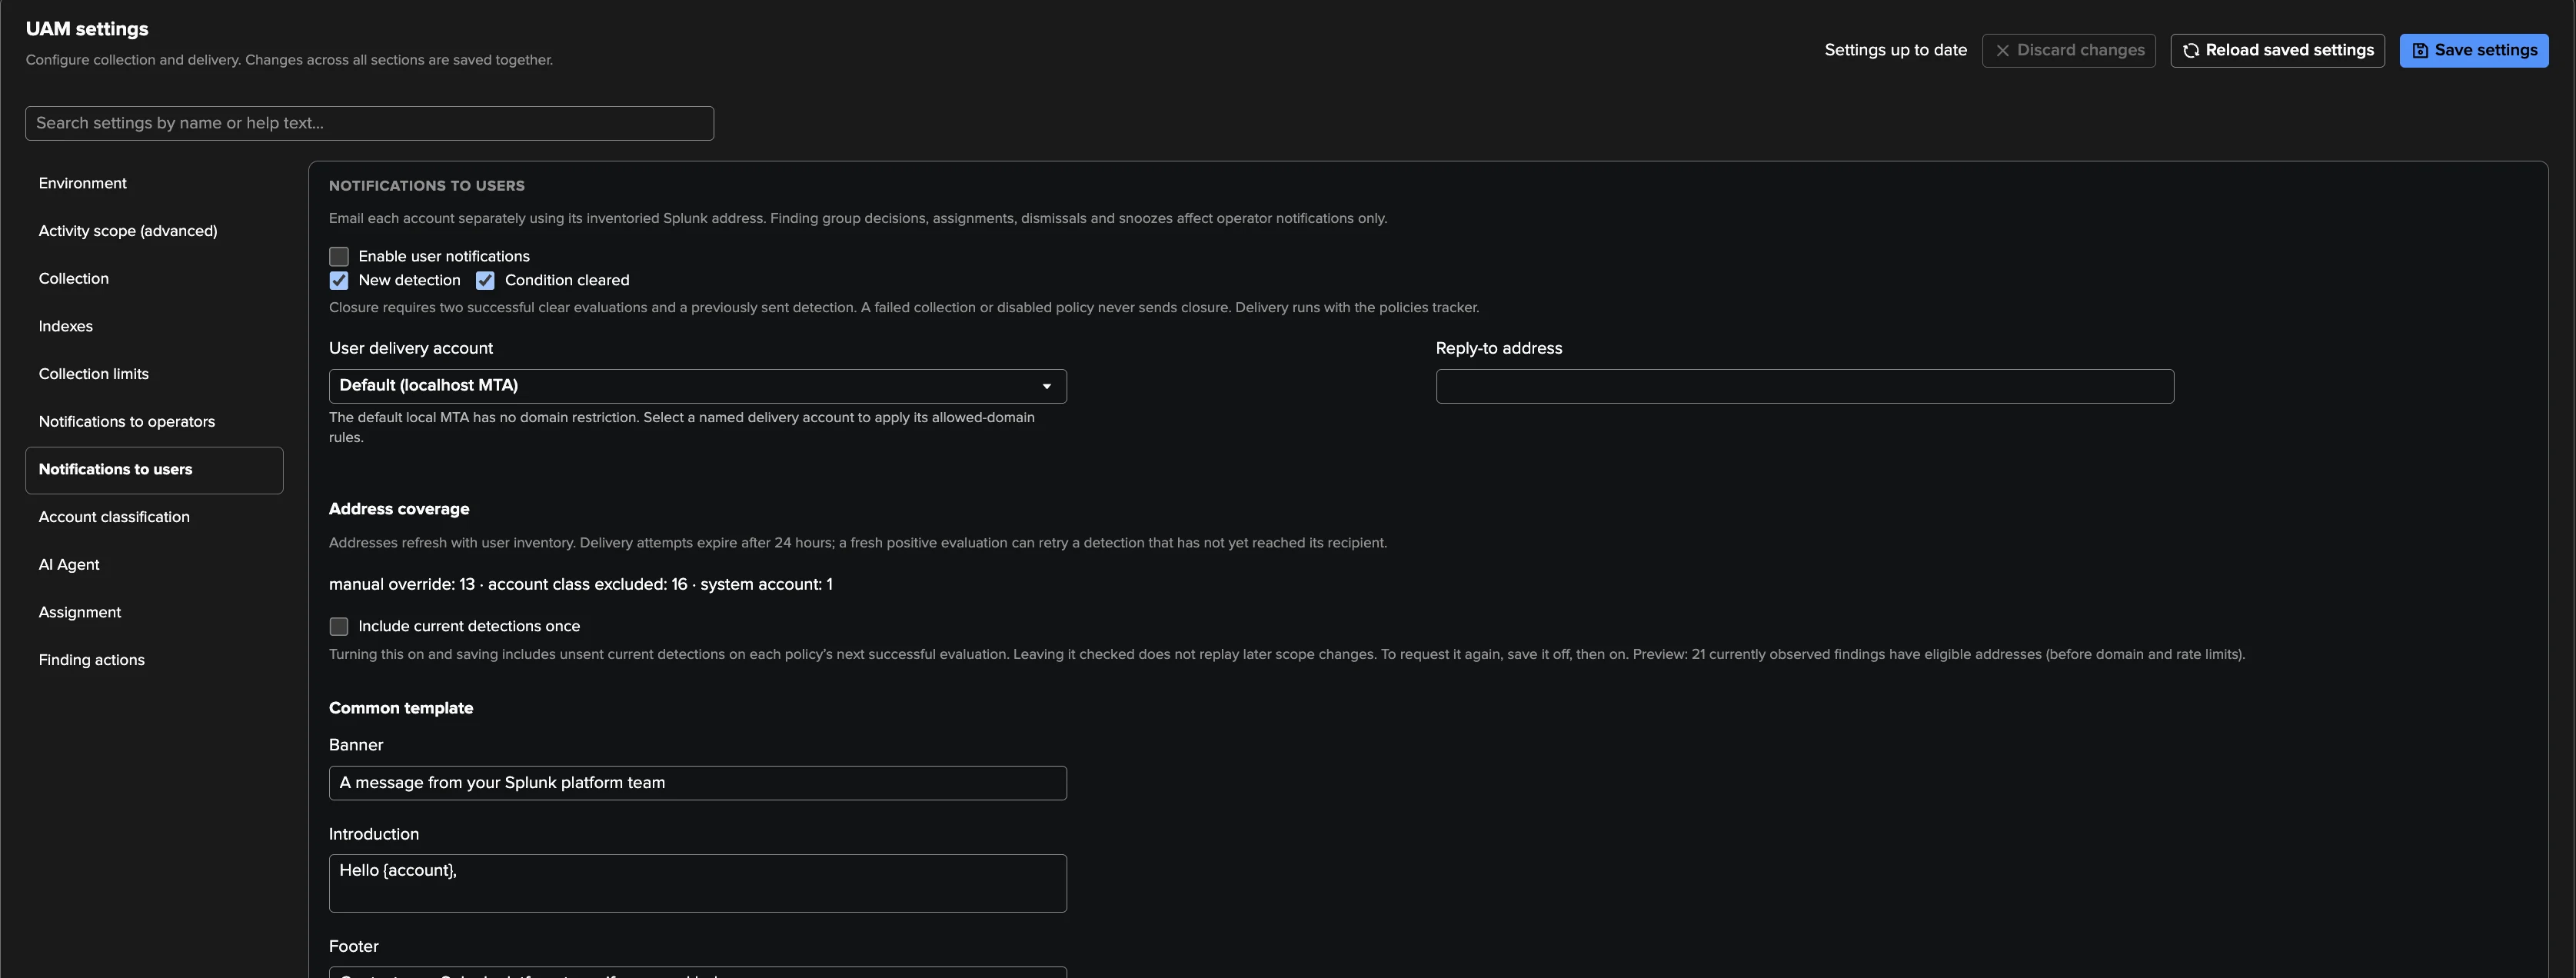
The account concerned — Notifications to users, off by default: one email to the account a finding is about, on a new detection and when the condition is cleared (after two consecutive complete evaluations without it), so that people fix their own searches. The addresses come from Splunk’s user records on each tier, or from an administrator’s override. System accounts never receive mail; human accounts do by default, service and unclassified accounts only on opt-in. A common banner, introduction, footer, reply-to address and support link combine with each policy’s own email template. Turning it on records the current findings as a baseline, so nobody receives a backlog. Rate limits apply (50 emails per run, 3 per address per hour, 24 hours between repeat detections). These emails follow the policy, not the operators’ triage.
A reviewed one-off email — Send email communication, from a finding, a member or a whole Finding group (up to 200 findings in one email): a preview, a recipient you may change for this email only, and an explicit confirmation. It is sent by a TrackMe search job, once, and never resent blindly when the outcome is uncertain.
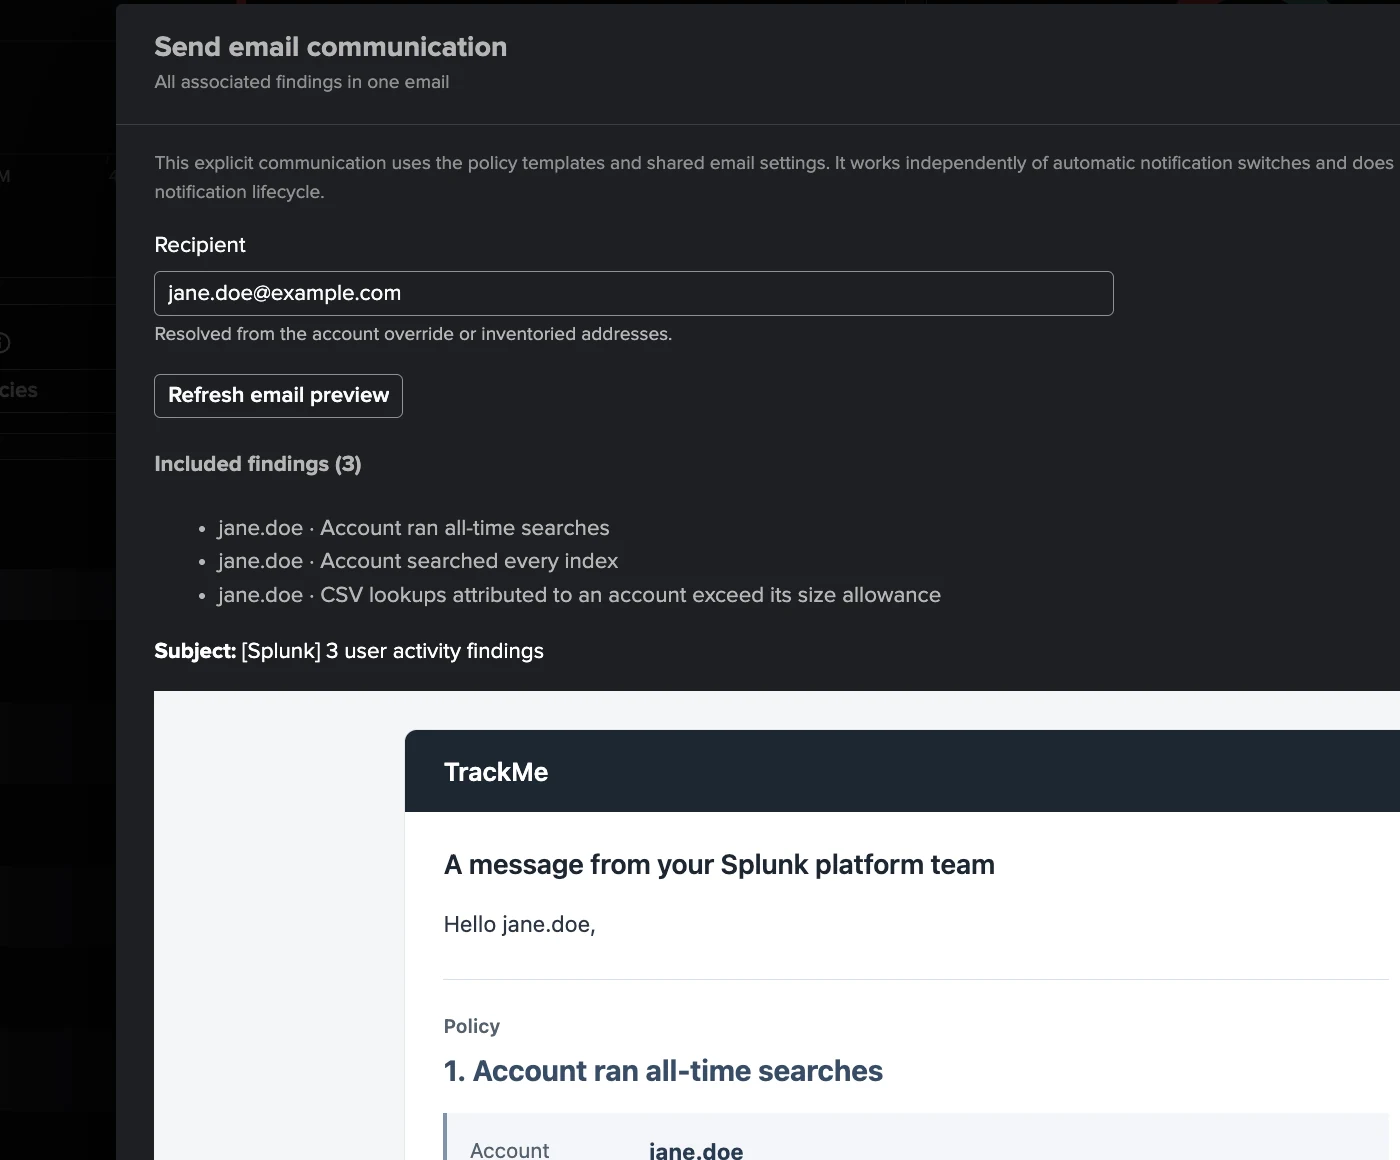
Important
The people who receive the user emails did not ask for them. Before turning the channel on, check the address coverage, point the reply-to address and the support link at your team, and preview the email template of every enabled policy.
The UAM AI Agent
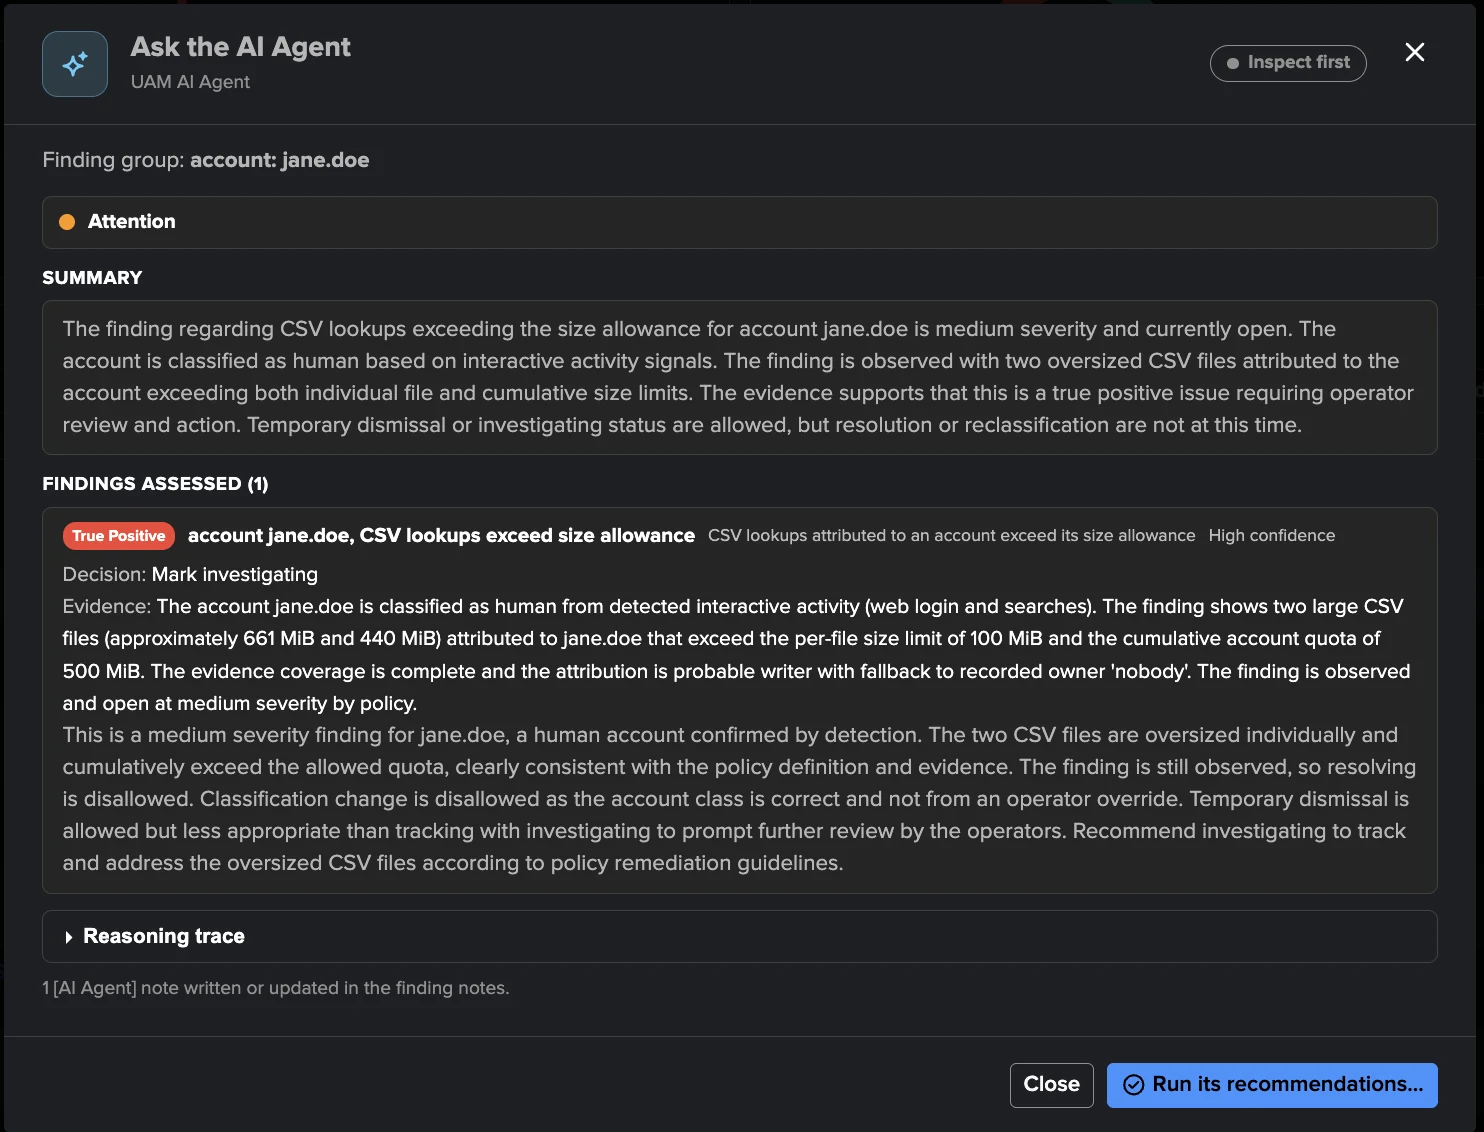
The UAM AI Agent reviews Finding groups the way an operator would, from the evidence UAM
holds, and writes its assessment as one current [AI Agent] note per finding. It runs on
the findings AI Agent framework shared with Cribl Stream, and replaces the UAM Findings
Advisor of 2.4.18.
Inspect changes nothing: an assessment, a confidence and a recommendation.
Act also applies the decisions the tenant allows: mark investigating and dismiss for a time (on by default, never for a critical or high finding still observed), resolve a finding its policy no longer observes and classify an unclassified account (off by default). It never dismisses permanently, assigns, or changes a severity, a policy or a setting.
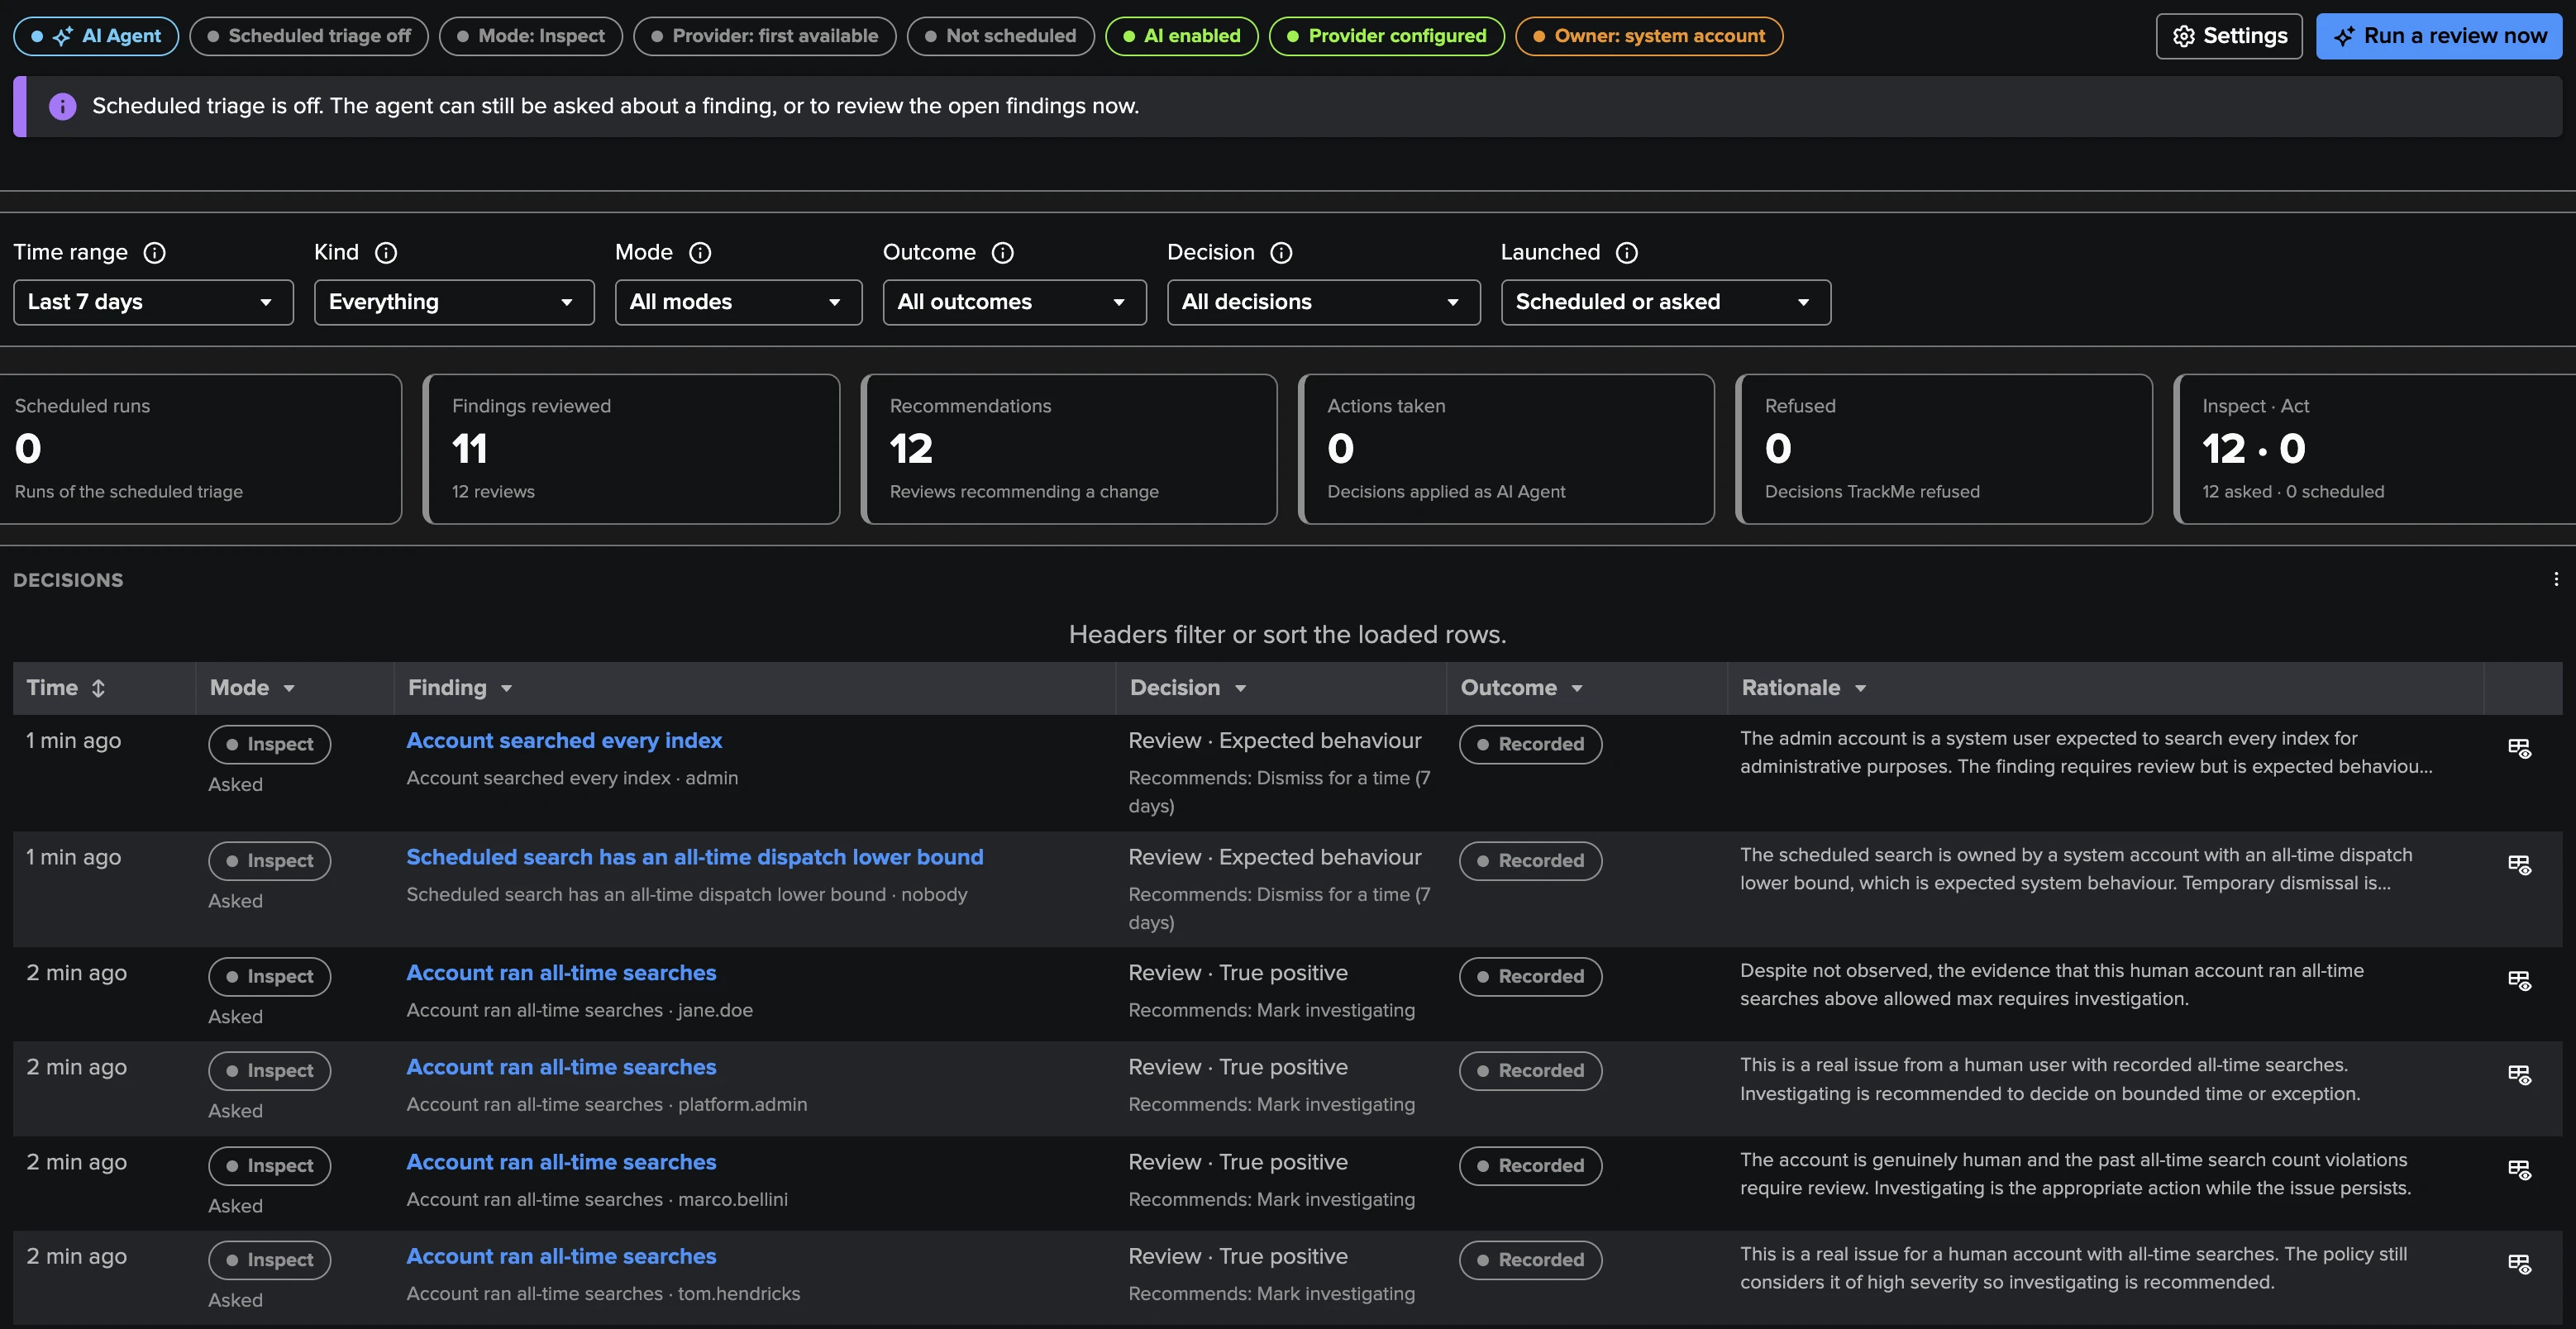
It is used three ways: Ask the AI Agent on one Finding group, Run a review now, and the scheduled triage — hourly, off by default, up to 10 findings per run, one per group, and by default only critical and high findings. A scheduled run never overrides a decision or an assignment made by a person.
Every decision appears under the actor AI Agent in the history and in the decision log of
the AI Agent tab. The agent needs the AI Assistant to be enabled with an AI provider, and
the scheduled triage a tenant owner other than nobody or splunk-system-user. See
Findings AI Agents.
Operating and cost
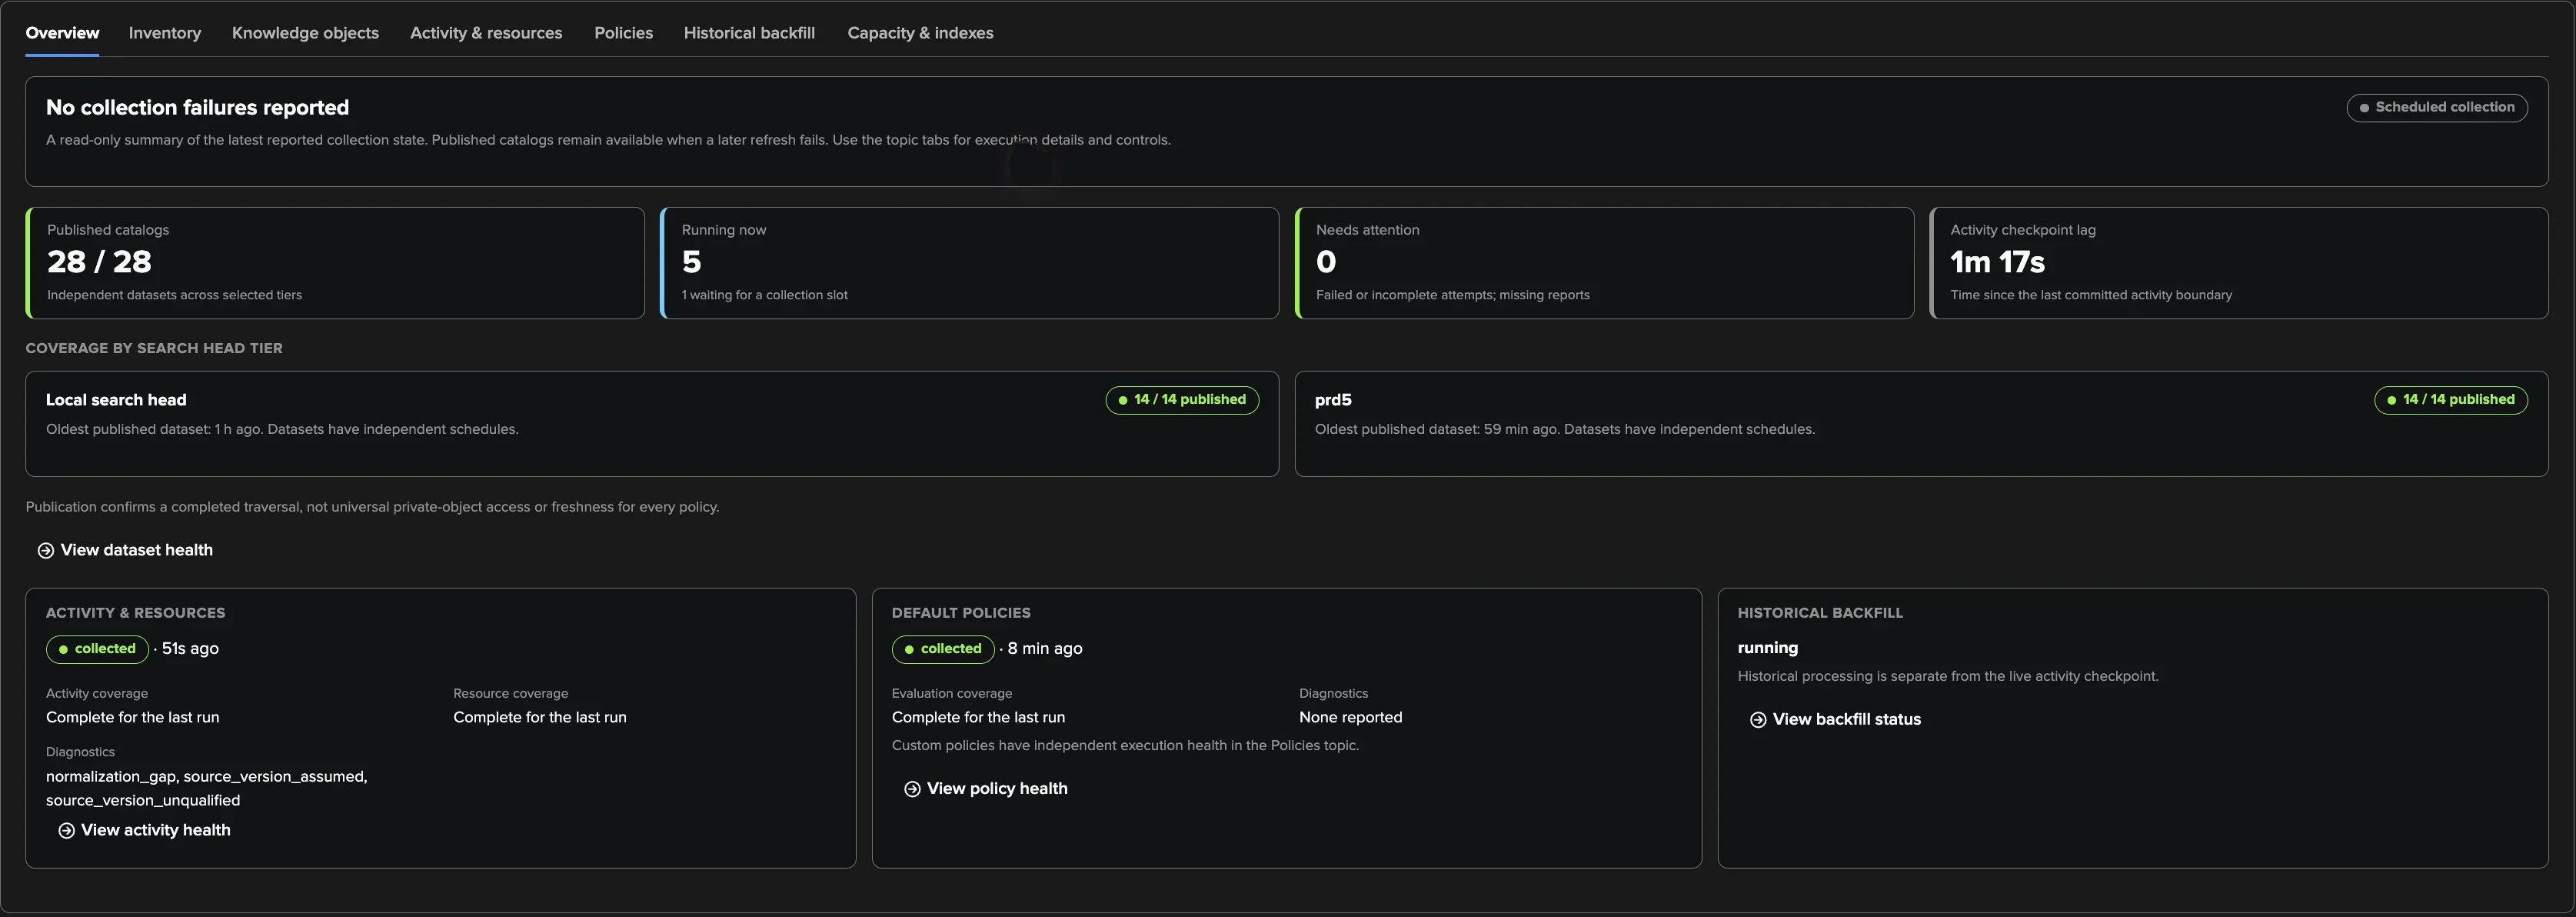
Collection health is the first stop: an overview of what needs attention and the
coverage per search head tier, then each area — inventory, knowledge objects, activity and
resources, policies (built-in and custom), historical backfill, capacity and indexes — with
every report’s last run explained, its diagnostics and Run now. One run per report at a
time; a run whose search provably stopped is recovered automatically after five minutes,
otherwise Recover stopped run releases it. Collect now runs the whole chain on
demand. The Configuration Guardian check uam_collection_health warns when collection is
not running as configured — a missing or unscheduled report, missed schedules, repeated
failures, a stalled checkpoint, an overdue listing, failing email delivery, a custom policy
that drifts — and clears itself once the condition is gone.
What the tenant costs:
Collection — bounded searches with validated budgets: the audit trail five minutes at a time from its checkpoint, a window split when it overflows; one catalog traversal per dataset and tier, mostly daily and off-peak; the backfill under an hour per hourly slot. A window that cannot be read is retried a bounded number of times, then recorded as a gap rather than stalling the cursor. Several tenants watching the same tier each pay their own collection cost.
Evidence — one compact record per search and window, one resource record per search and window, the inventory changes and one receipt per run. To reduce it, switch off resource collection (the resource policies then stay learning), keep Store SPL search off and size the backfill to your retention.
Reads — the account and timeline views run through
tstatson indexed dimensions. These index-time settings take effect after the splunkd restart that follows the app installation or upgrade.
Every budget is a setting with a validated range, not a product cap; the defaults fit a busy cluster. They are listed in Settings reference.
Adopting UAM
Prerequisites
A licence beyond Foundation: Enterprise, Unlimited, the Unlimited trial or the Developer licence.
_auditand_introspectionforwarded to the indexing layer by every search head tier. A search head that keeps its internal indexes local hides its searches, logins and resource usage from the tenant.A TrackMe remote account per additional search head tier (Remote Splunk deployments).
A dedicated tenant owner service account: the scheduled reports run as the owner, and the scheduled AI Agent cannot run as
nobodyorsplunk-system-user.Optionally, a TrackMe email delivery account for the notifications.
UAM evidence is audit data: the workspace is for the TrackMe administrators of the tenant. Power users of the tenant have read access through the REST API and can send user communications and run findings actions.
Creating the tenant
The User Activity Monitoring card of the tenant creation wizard asks for the tenant
identity, the search head tiers (the route account is derived), the historical backfill and
the optional activity scope, then the usual indexes, owner and roles. Everything is
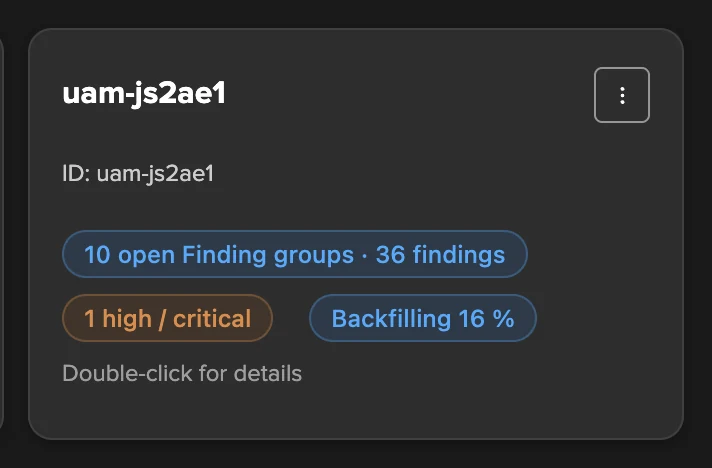
provisioned and scheduled at once; the tenant card shows its open Finding groups and
findings, the high or critical ones, and the collection status. The same creation is one REST
call (POST /trackme/v2/vtenants/admin/add_tenant with tenant_uam_enabled and a
uam_config object). See Creating a splk-uam tenant.
A rollout path
The first hour. Check in Collection health that the first inventory, activity and policies runs succeeded on every tier. Classify the monitoring itself — the tenant owner, the administrator accounts, the platform’s own automation — as system or service so that it never fills the findings, and add a rule for your service-account naming convention.
The first days. Let the backfill and the detection classify the people and the services. Work through the findings of the seven default policies: the all-time searches first (high), then the all-time and real-time schedules, the CSV lookups and the resource findings once the learning period ends. Use the policy insight to understand what each run saw before changing a threshold, and exclusions for the legitimate cases — an acceleration owner, an approved investigation account.
Routine. Turn on the operator notifications at medium severity, set assignment groups and routing rules for your teams, and enable the opt-in policies whose thresholds your baselines now support. When the address coverage is good and the templates are reviewed, turn on the notifications to users — the step that makes the platform’s users part of the remediation. Add custom policies for your own rules, and the scheduled AI Agent triage, in inspect mode first, for the critical and high findings.
The hands-on deck User Activity Monitoring follows this path screen by screen.
Upgrading from 2.4.18
The first policies runs gather the existing findings into Finding groups; triage decisions, notes and history are kept.
The inventory moves to the REST API catalogs: each tier gets its knowledge-object reports and its first full saved-search listing runs within the hour. The users and roles reports move from a 5-minute to a 15-minute schedule.
The UAM Findings Advisor is replaced by the UAM AI Agent; an enabled advisor’s settings are carried over once.
Limits in 2.4.19
Identity. An account is the principal Splunk reports, not a verified person, and UAM does not link the same person’s accounts across deployments.
Custom policies map to accounts and saved searches only, write their exclusions in their SPL, and their findings are not covered by the operator and user notifications, which list the built-in policies.
One indexing layer per tenant, and keeping the tiers on it is the administrator’s responsibility. A saved search with the same name, app and owner on two tiers shares one set of run figures.
Cadence. The activity and resource policies judge the trailing 15 minutes by default; the inventory policies follow the catalog cadence, a daily saved-search listing by default. Catalogs are not atomic snapshots and depend on the collection account’s permissions.
Service detection needs the classic
key=valueaudit format, and its seven days must lie inside the audit retention.No remediation. UAM never changes the platform; every remediation is carried out by people.
See also
User Activity Monitoring — the task guide: setting up, the workspace, triage, communication and tuning.
User Activity Monitoring — reference — the reference: tiers, reports and schedules, evidence, classification, the policy catalogue, every setting, REST and troubleshooting.
Findings, Finding groups and findings actions — findings, Finding groups, assignment, notifications, findings actions and the findings AI Agents, shared with Cribl Stream and Cribl Edge.
User Activity Monitoring — the hands-on deck.
Creating a splk-uam tenant — the creation wizard and the REST flags.
Configuration Guardian — the Configuration Guardian.
The AI Advisors and AI Agents automation — the AI Agents and their automation.