Use Case Demo: Fields Quality (CIM and non-CIM)
Hint
New component: Fields Quality (splk-fqm) - since TrackMe 2.1.22!
TrackMe 2.1.22 introduced a new component called Fields Quality (splk-fqm) which is designed to perform continuous fields quality assessment on Splunk data.
This component implements the concepts described in this white paper, built into TrackMe, with flexibility, scalability and automated wizards.
This white paper was updated to focus on the new component and its capabilities, with associated sections available in the annexes.
TrackMe version 2.1.23 provided several important improvements to the Fields Quality component.
TrackMe version 2.1.24 introduced full support for non-CIM data contexts in the Fields Quality component.
TrackMe version 2.1.26 slightly enhanced the performance of simulation and execution phases, and provided full support for custom break by definitions for both CIM and non CIM contexts.
TrackMe version 2.1.27 provided the capability to create additional monitor only collect jobs through the wizard, allowing to re-use existing quality samples events for different aggregations purposes, such as aggregating per datamodel in a different tenant than the original tenant performing the collect and pre-processing.
Use Case Demo: Fields Quality
This white paper describes a new concept for performing continuous fields quality assessment on Splunk data.
This leverages different scalable Splunk techniques and TrackMe components to perform this task.
Fields quality assessment is a crucial aspect of Splunk monitoring, as it helps ensure that the data is accurate and consistent and ready to serve use cases.
By implementing this, you will be able to build a solid, robust, and scalable solution to monitor the quality of fields parsing for your various sourcetypes in Splunk, as well as receive automated alerts when fields quality issues are detected.
These concepts are applicable to both Splunk Common Information Model (CIM) and non-CIM data.
This work was made possible through the support and deep collaboration of several major fellow TrackMe customers. Thank you!
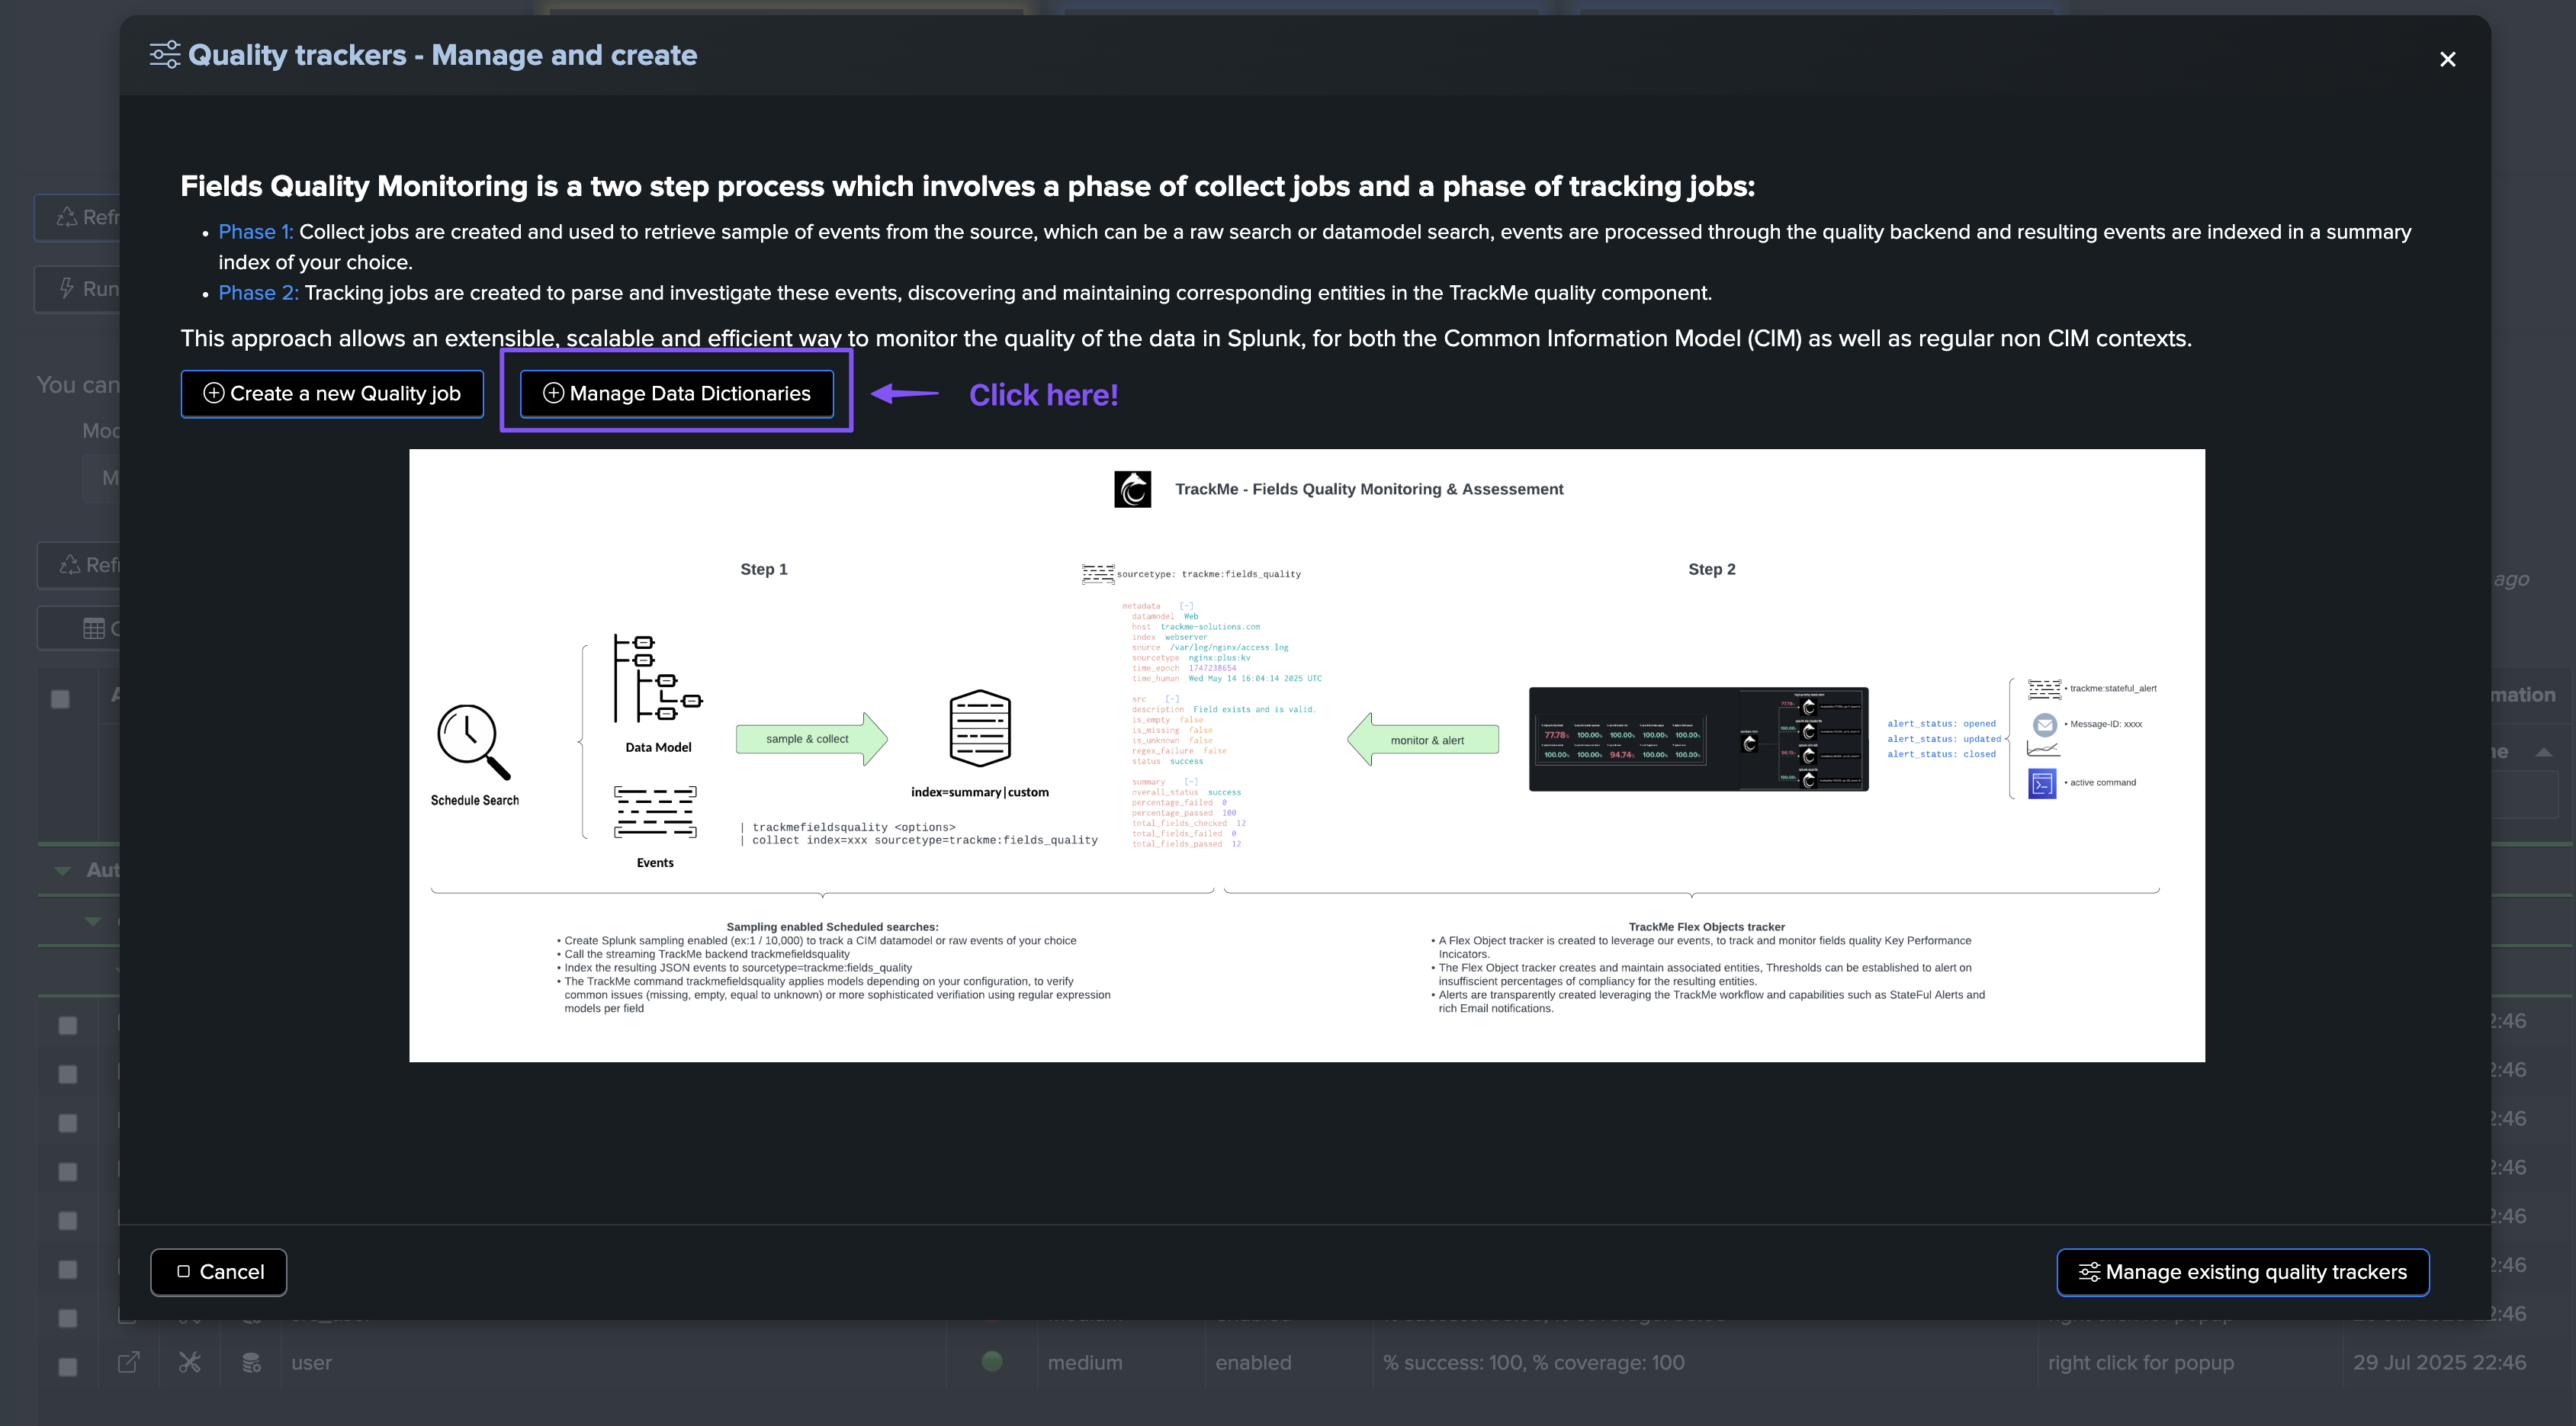
High level workflow and diagram
The following diagram shows the high-level workflow for fields quality assessment:
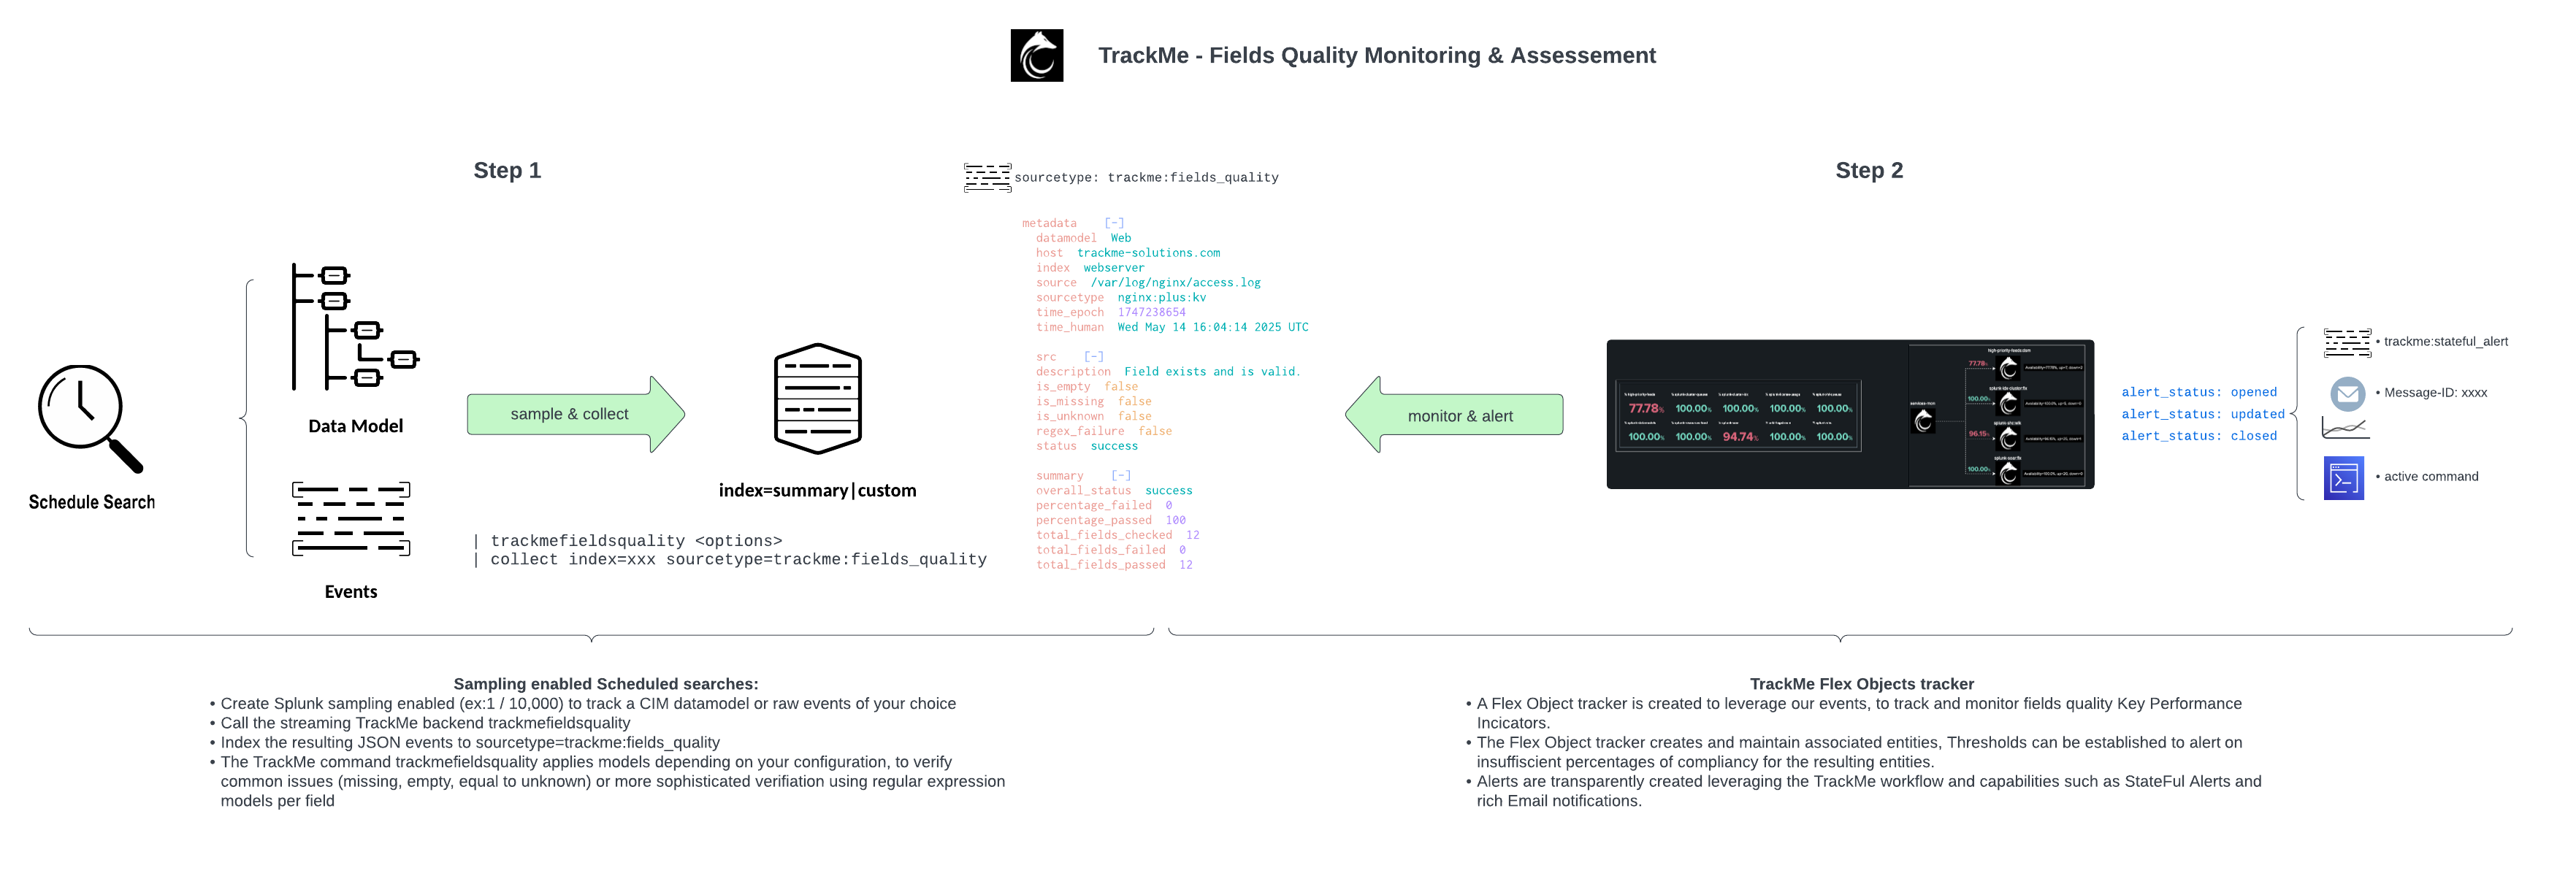
From a high-level perspective, the workflow is as follows:
In the Fields Quality component, you create collect jobs which consist of two phases
Phase 1: collect
Through the Collect job creation wizard, you define a new
collectjob which is tied to a data context (a Splunk search constraint) associated with a data dictionary.The data dictionary can be generated by TrackMe according to the CIM data model, or you can set the collect job to use a previously generated data dictionary. (Dictionaries can be shared between collect jobs)
Once validated and executed, the collect job starts collecting and processing event samples, stored in a summary index and associated with a source value unique per collect job.
Phase 2: monitor
In the collect job, a second set of
monitortrackers are created, which are set to be executed automatically 10 minutes after the collect job is executed.The
monitorjob parses and processes the JSON events generated by the collect job, and discovers and maintains TrackMe entities associated with the collect job.
Hint
Common Information Model (CIM) context versus raw events context
These concepts apply equally to both the Common Information Model and any raw events in Splunk.
CIM parsing quality is generally a critical topic when use cases heavily rely on CIM, but there can be many use cases where you need to ensure the parsing quality outside of a CIM context.
These concepts are applicable to both CIM and non-CIM data, and you can simply use the same approach for both.
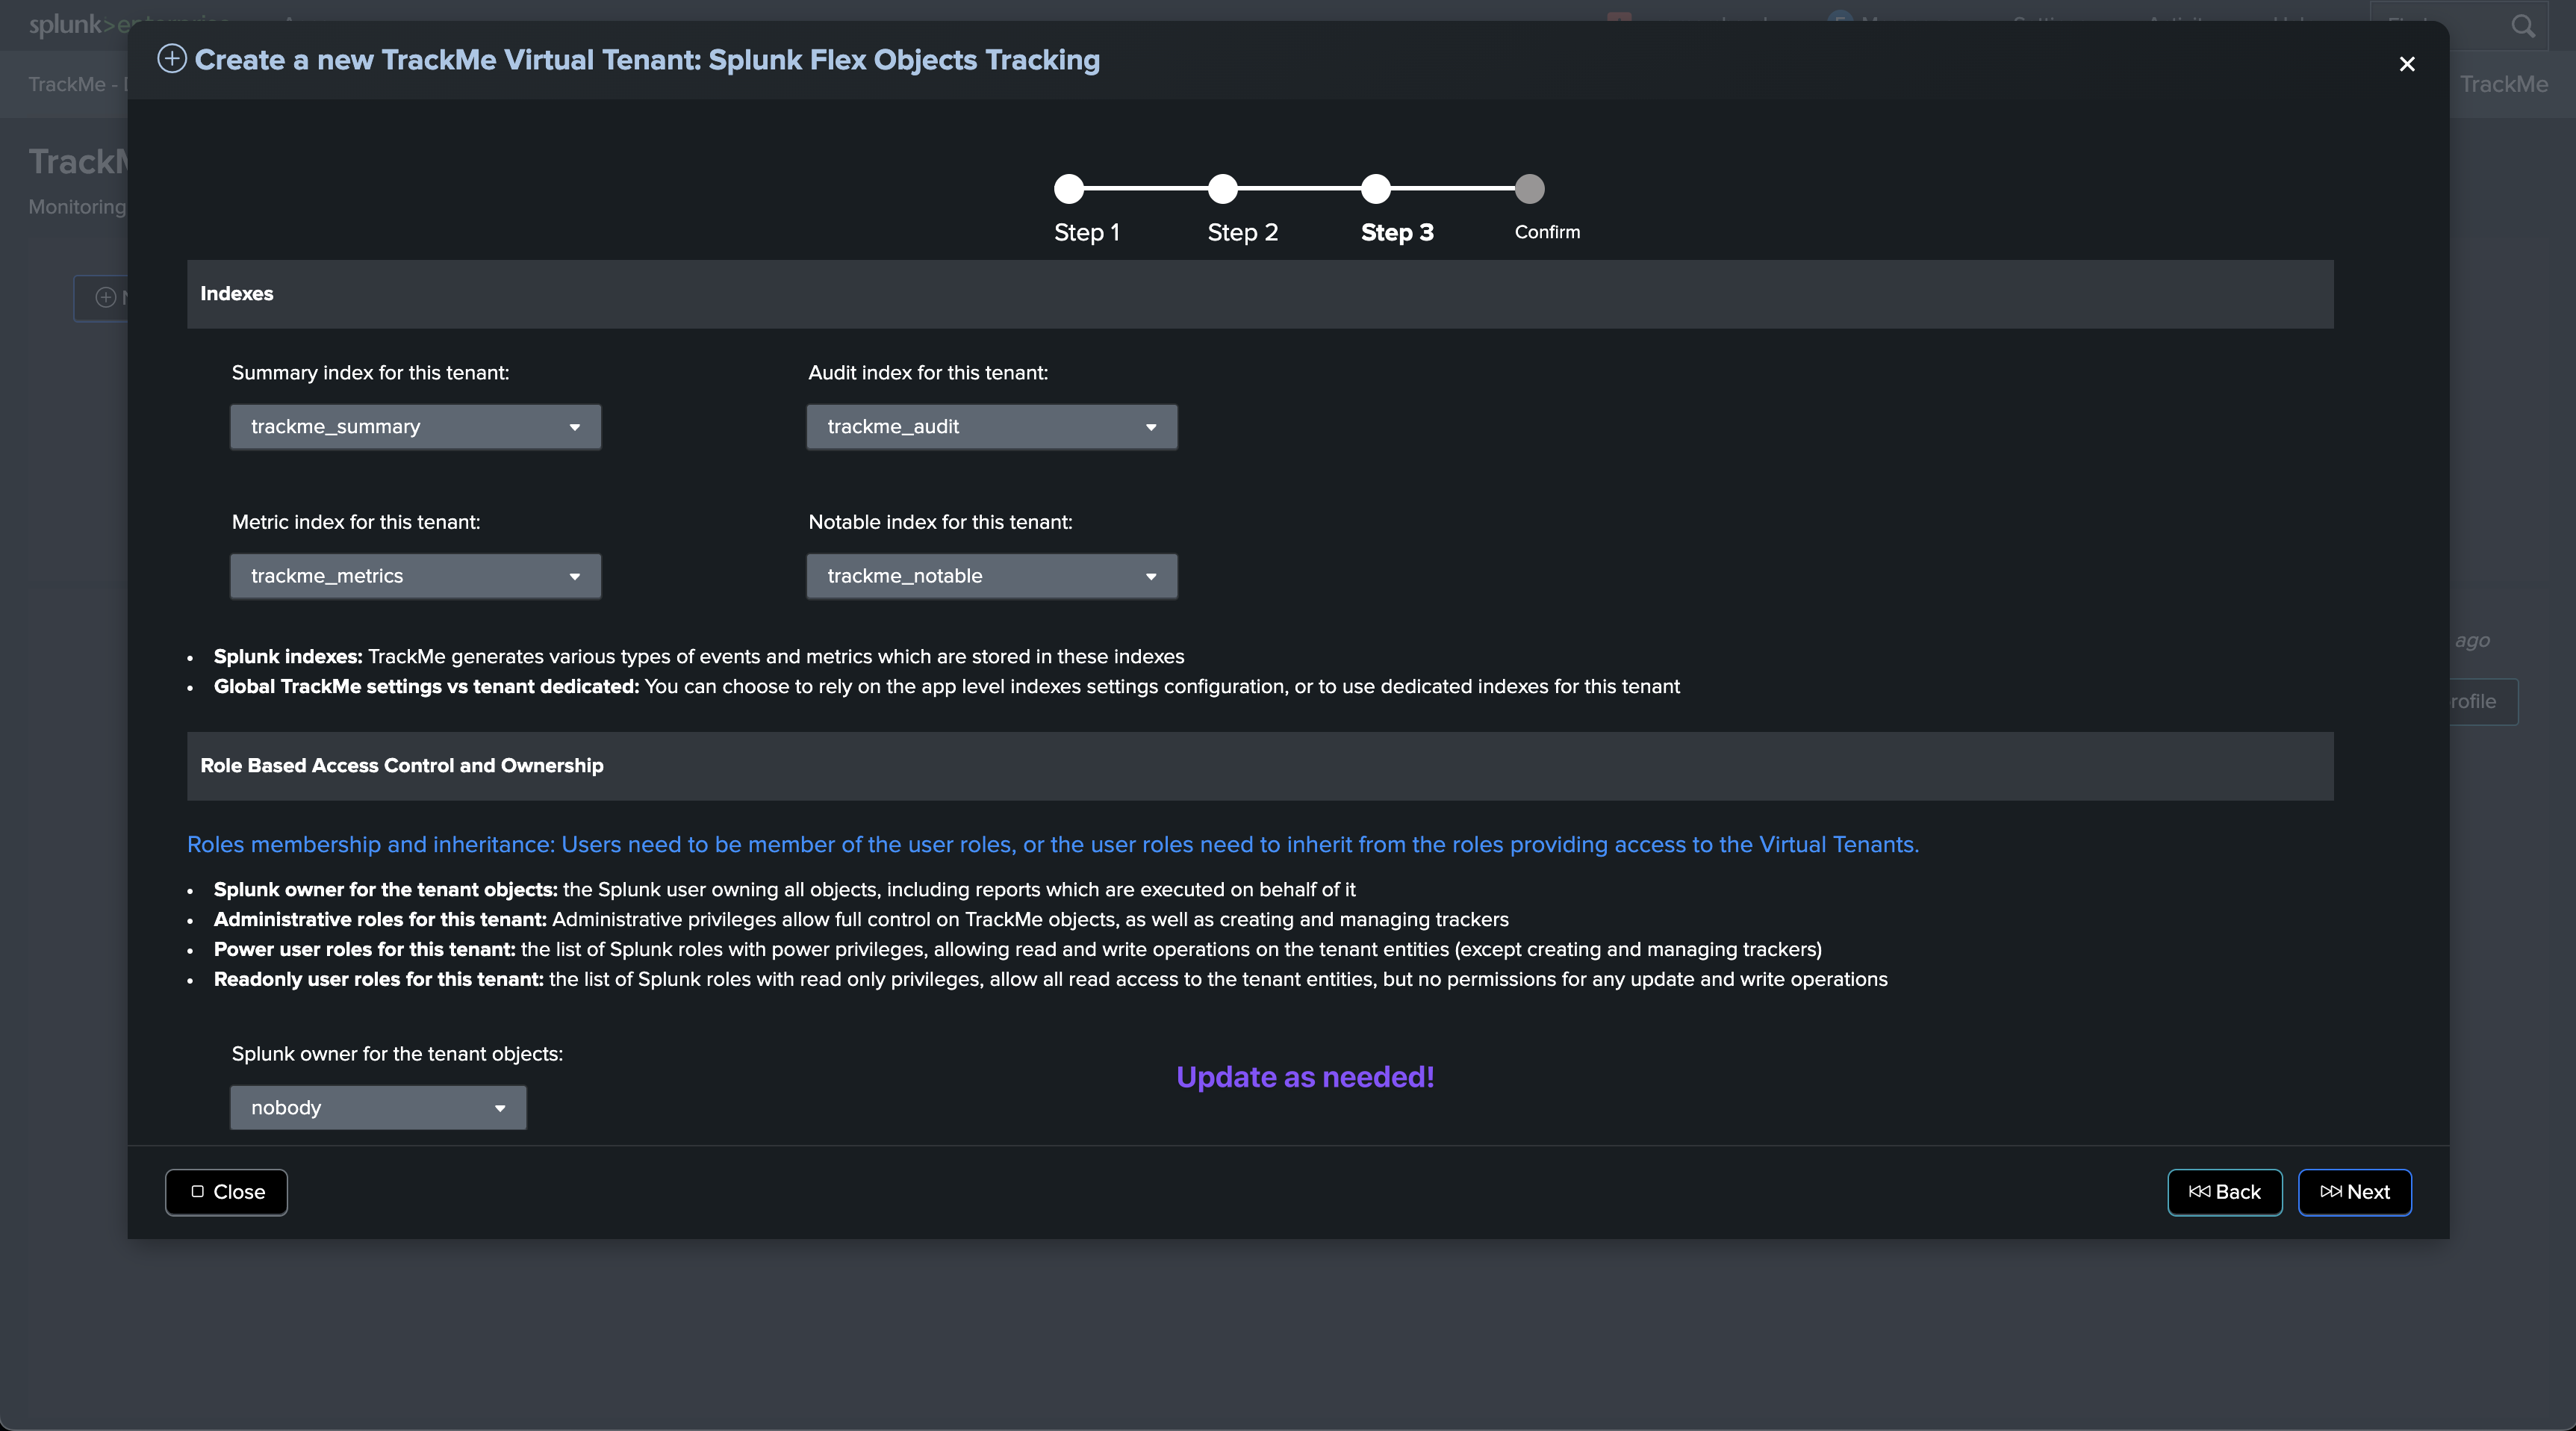
Preparing a Virtual Tenant for the Fields Quality component
You can either create a fresh new Virtual Tenant in a couple of clicks, or add the component to an existing Virtual Tenant.
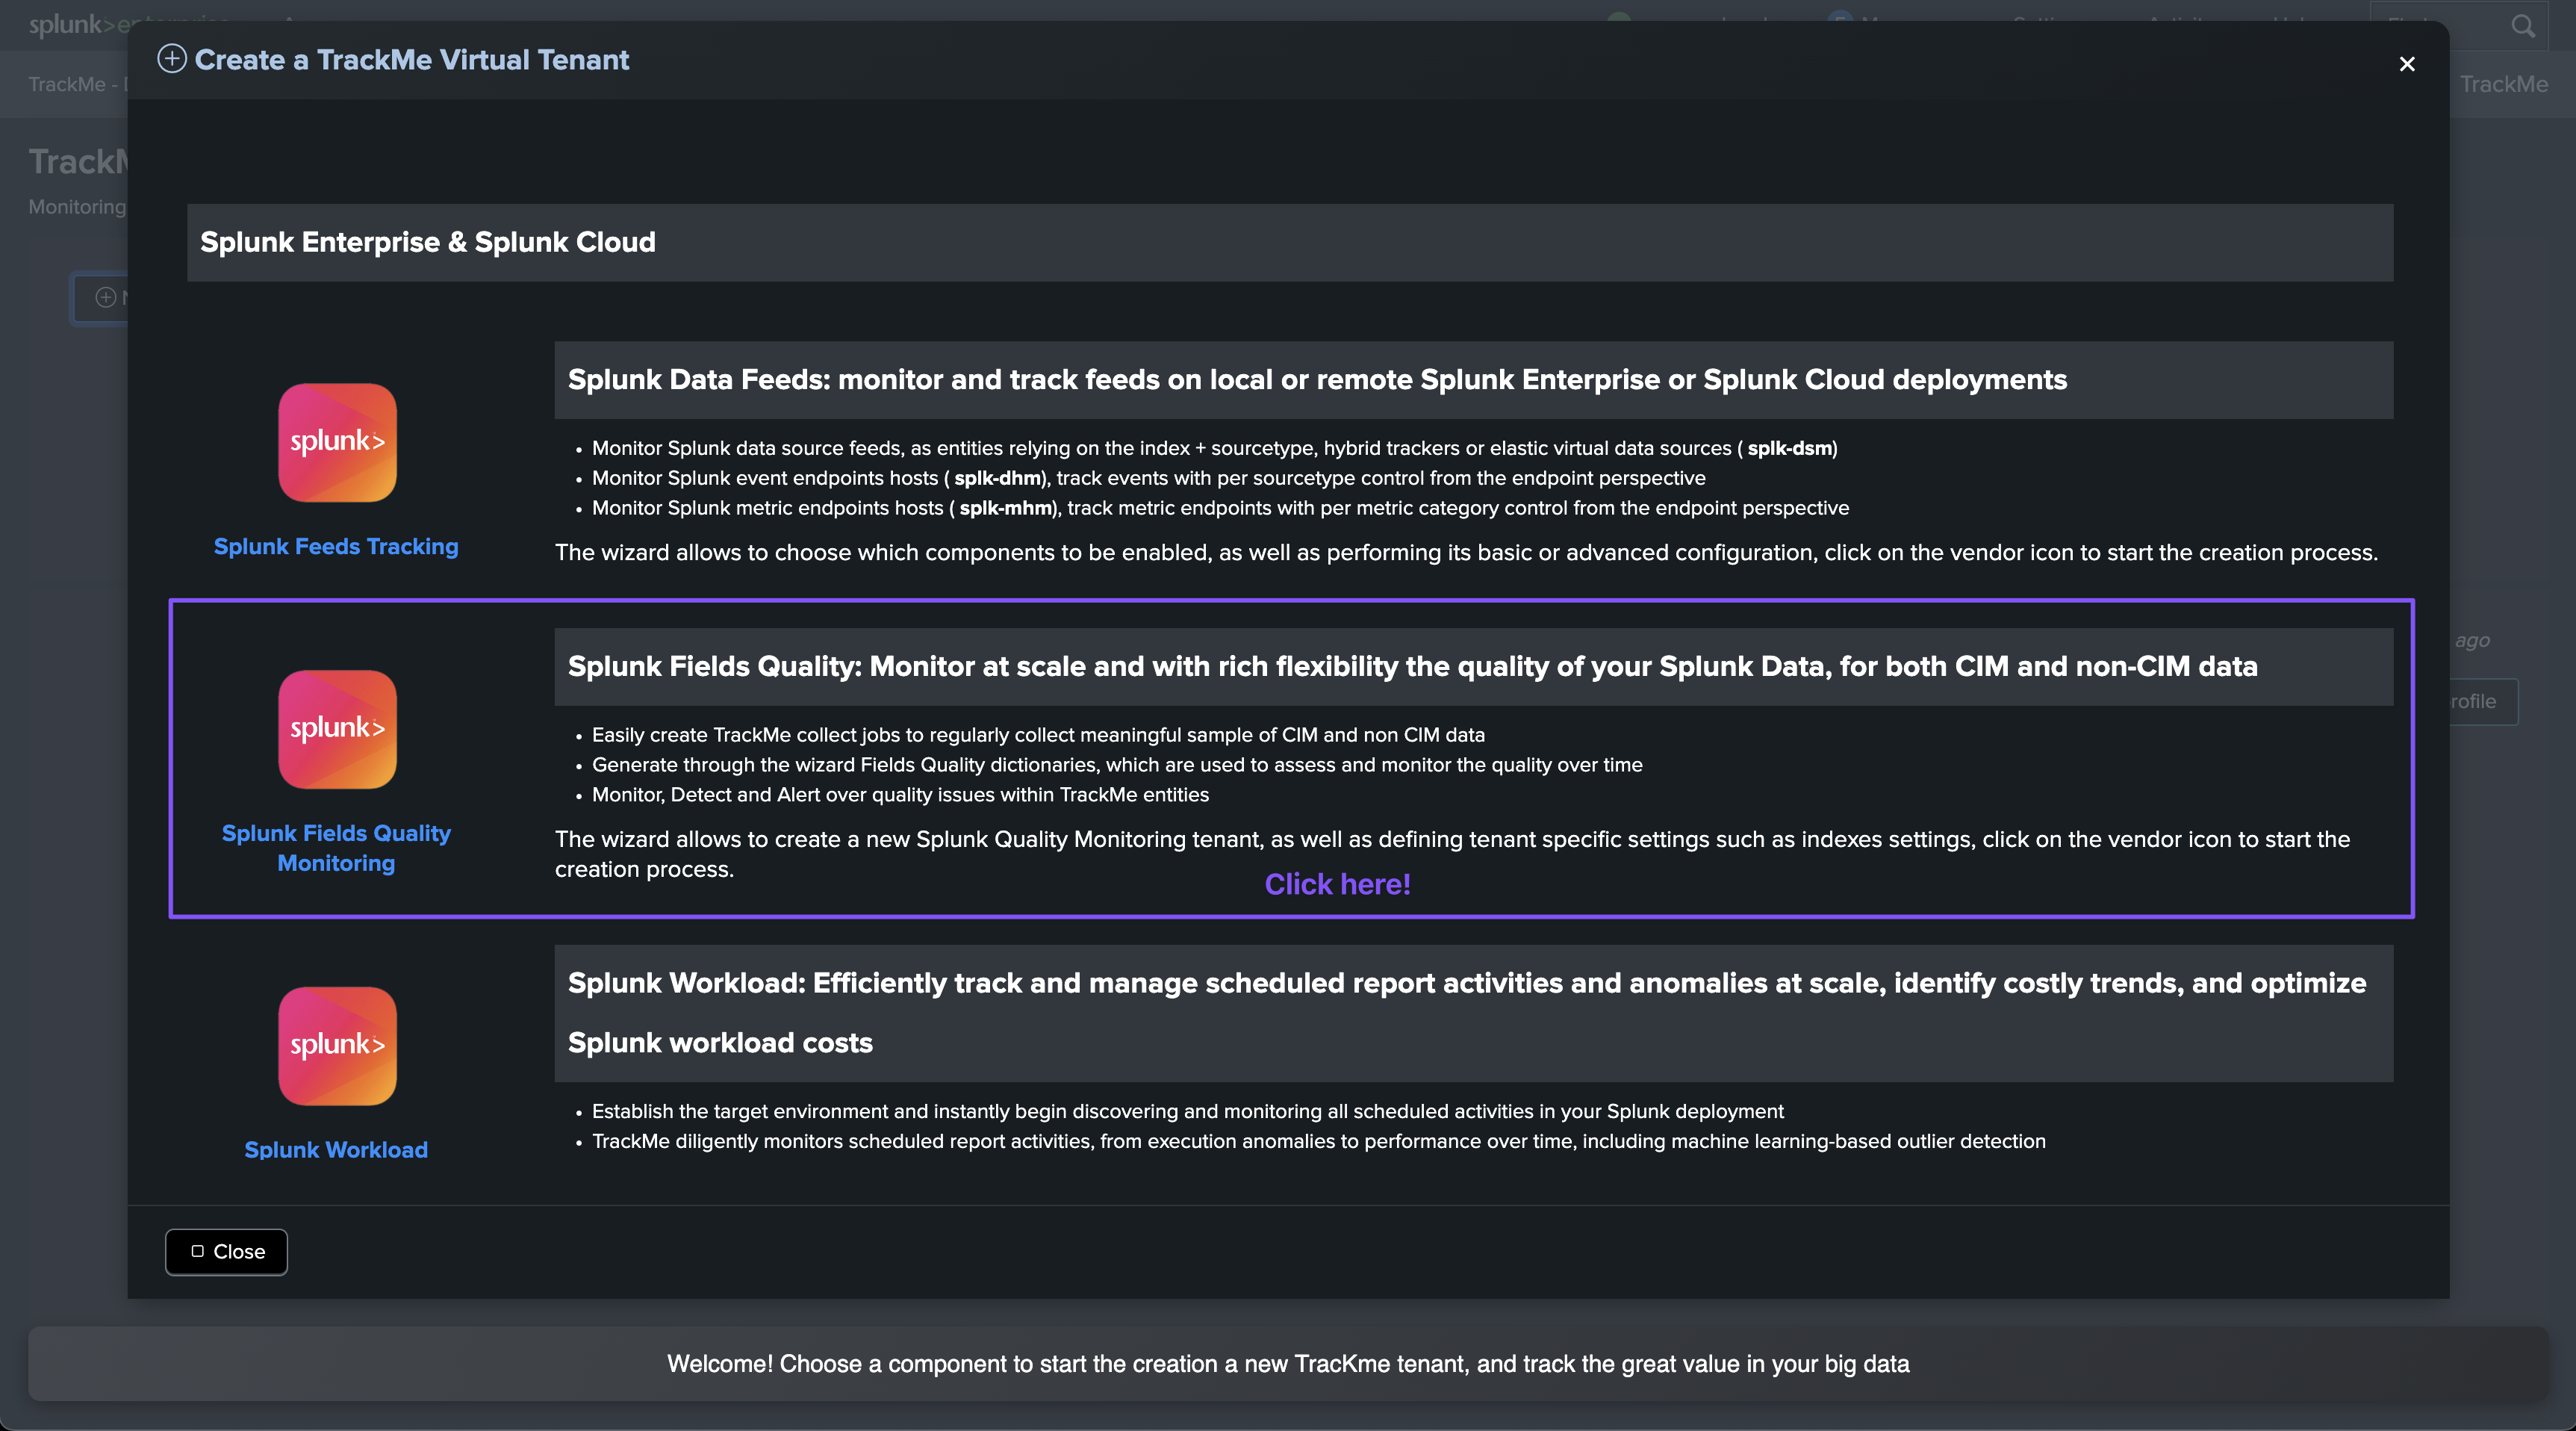
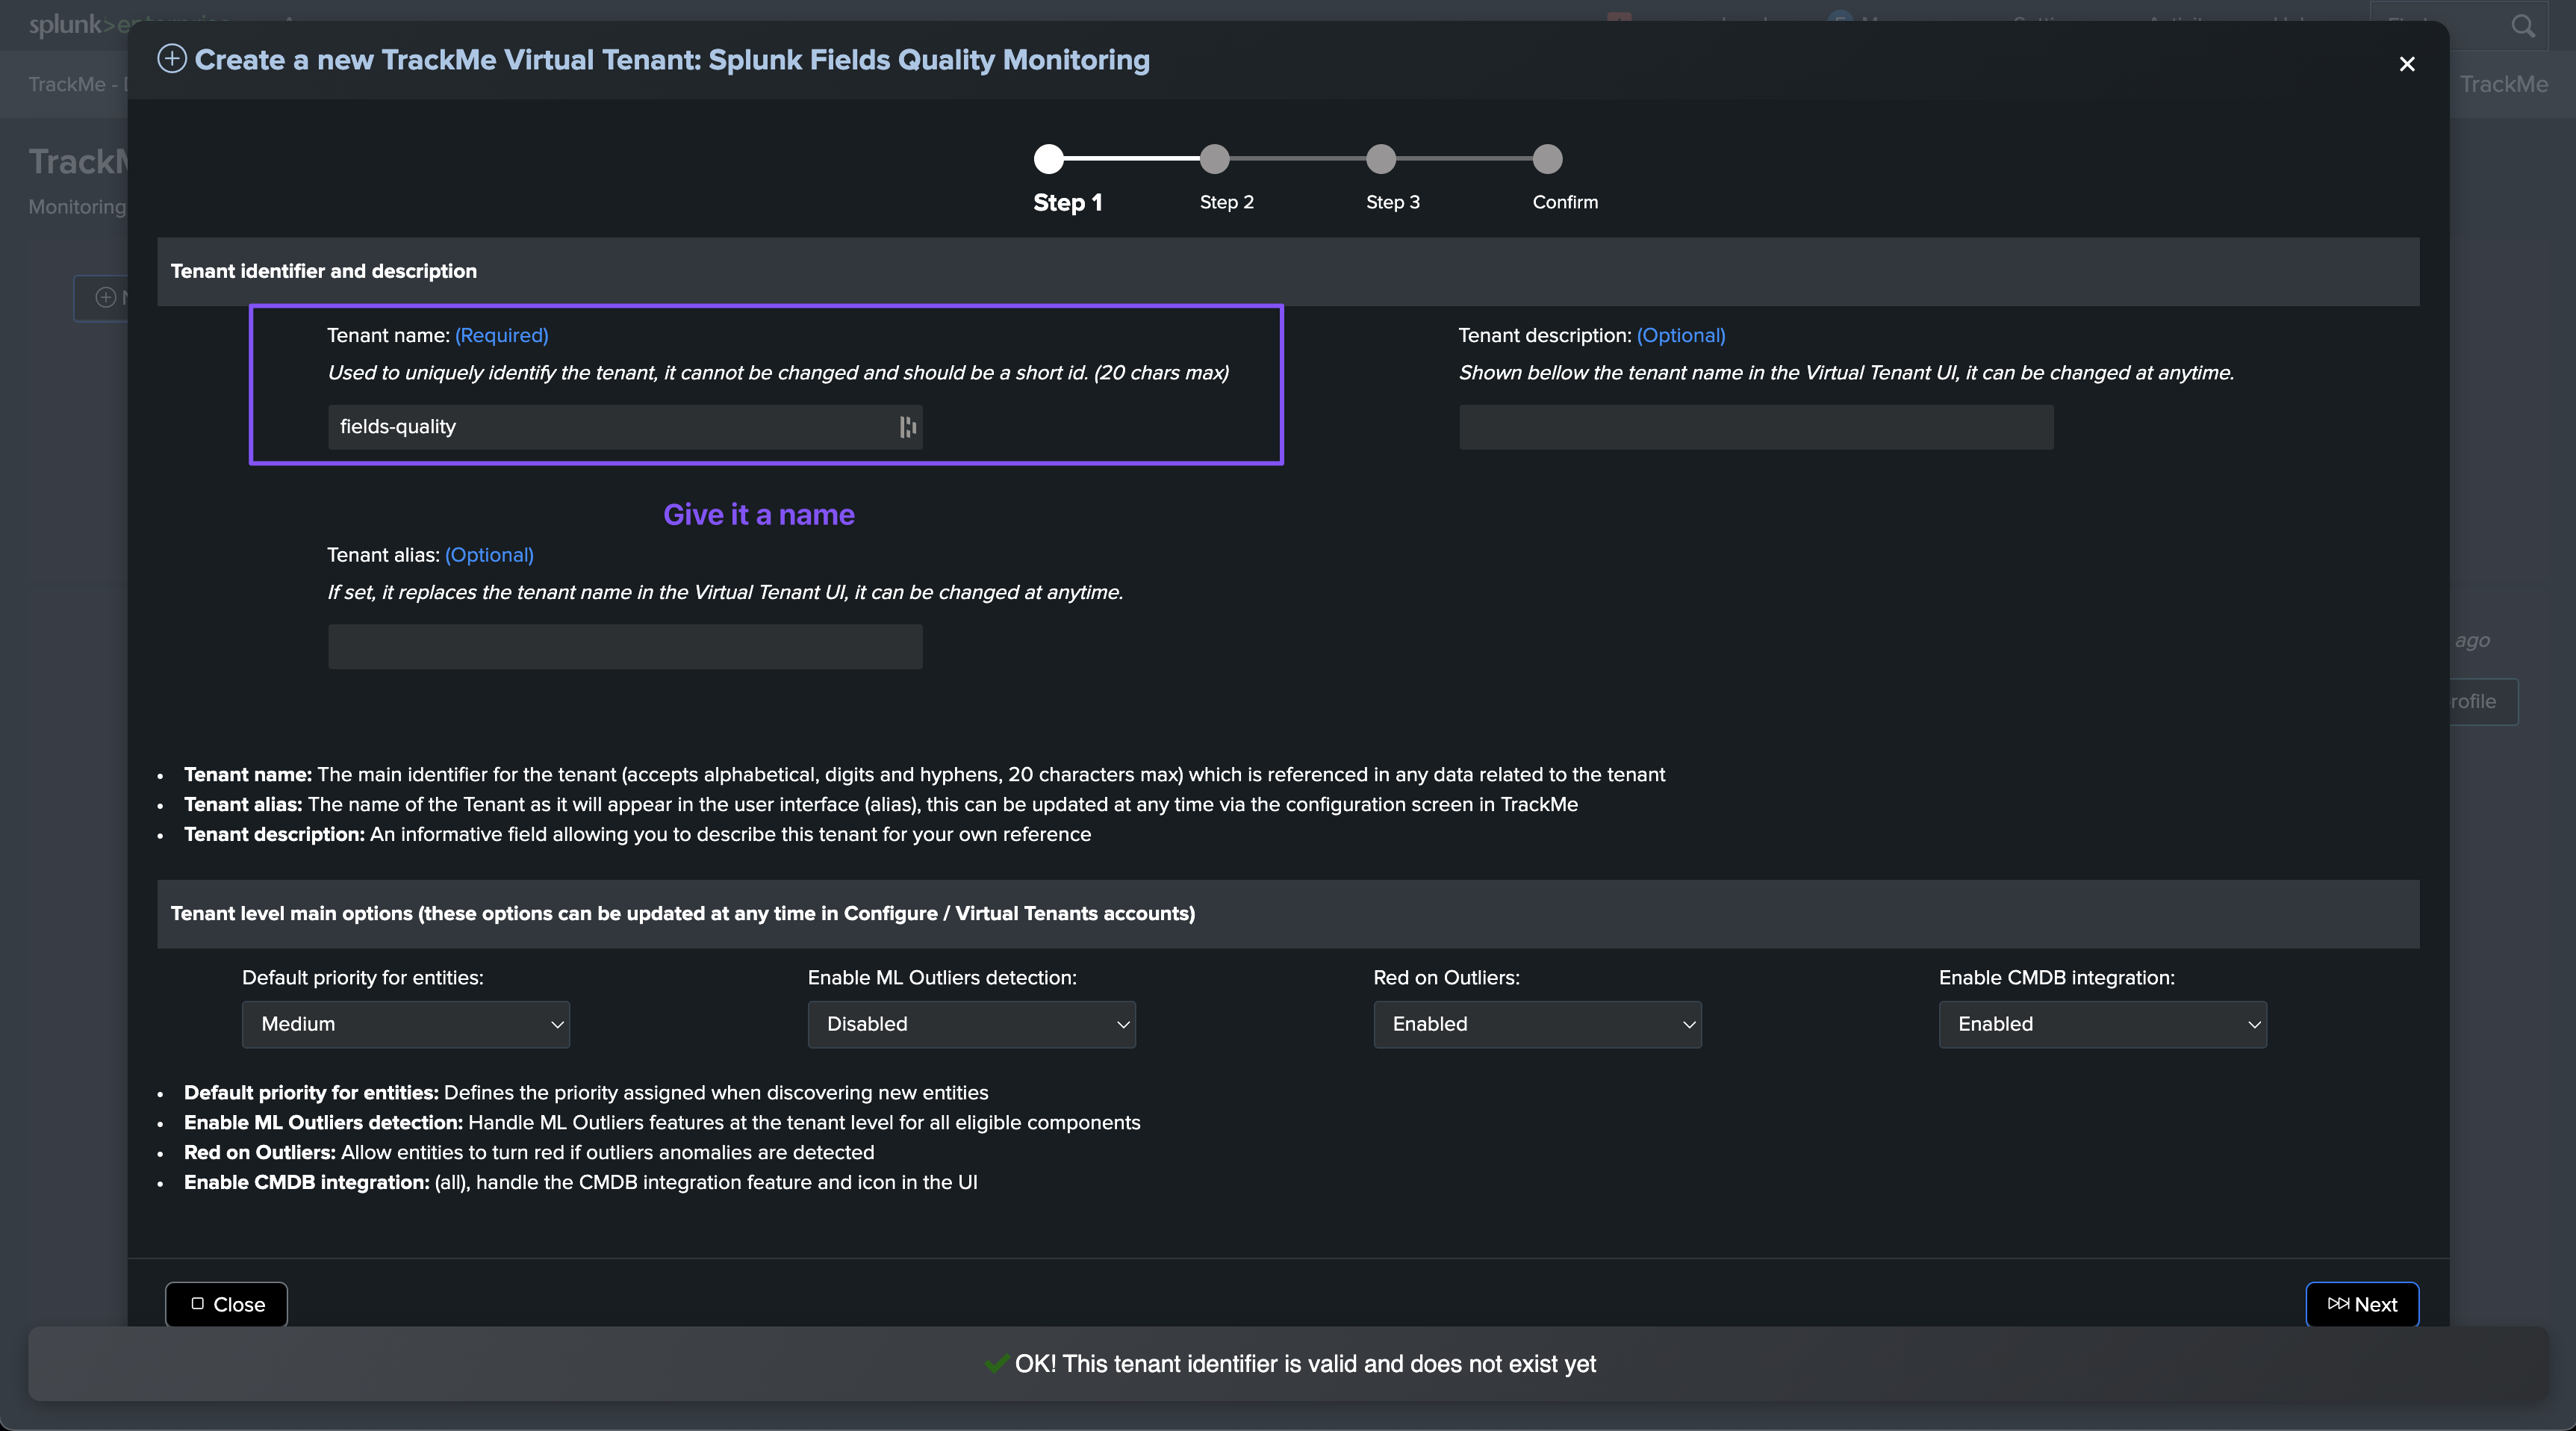
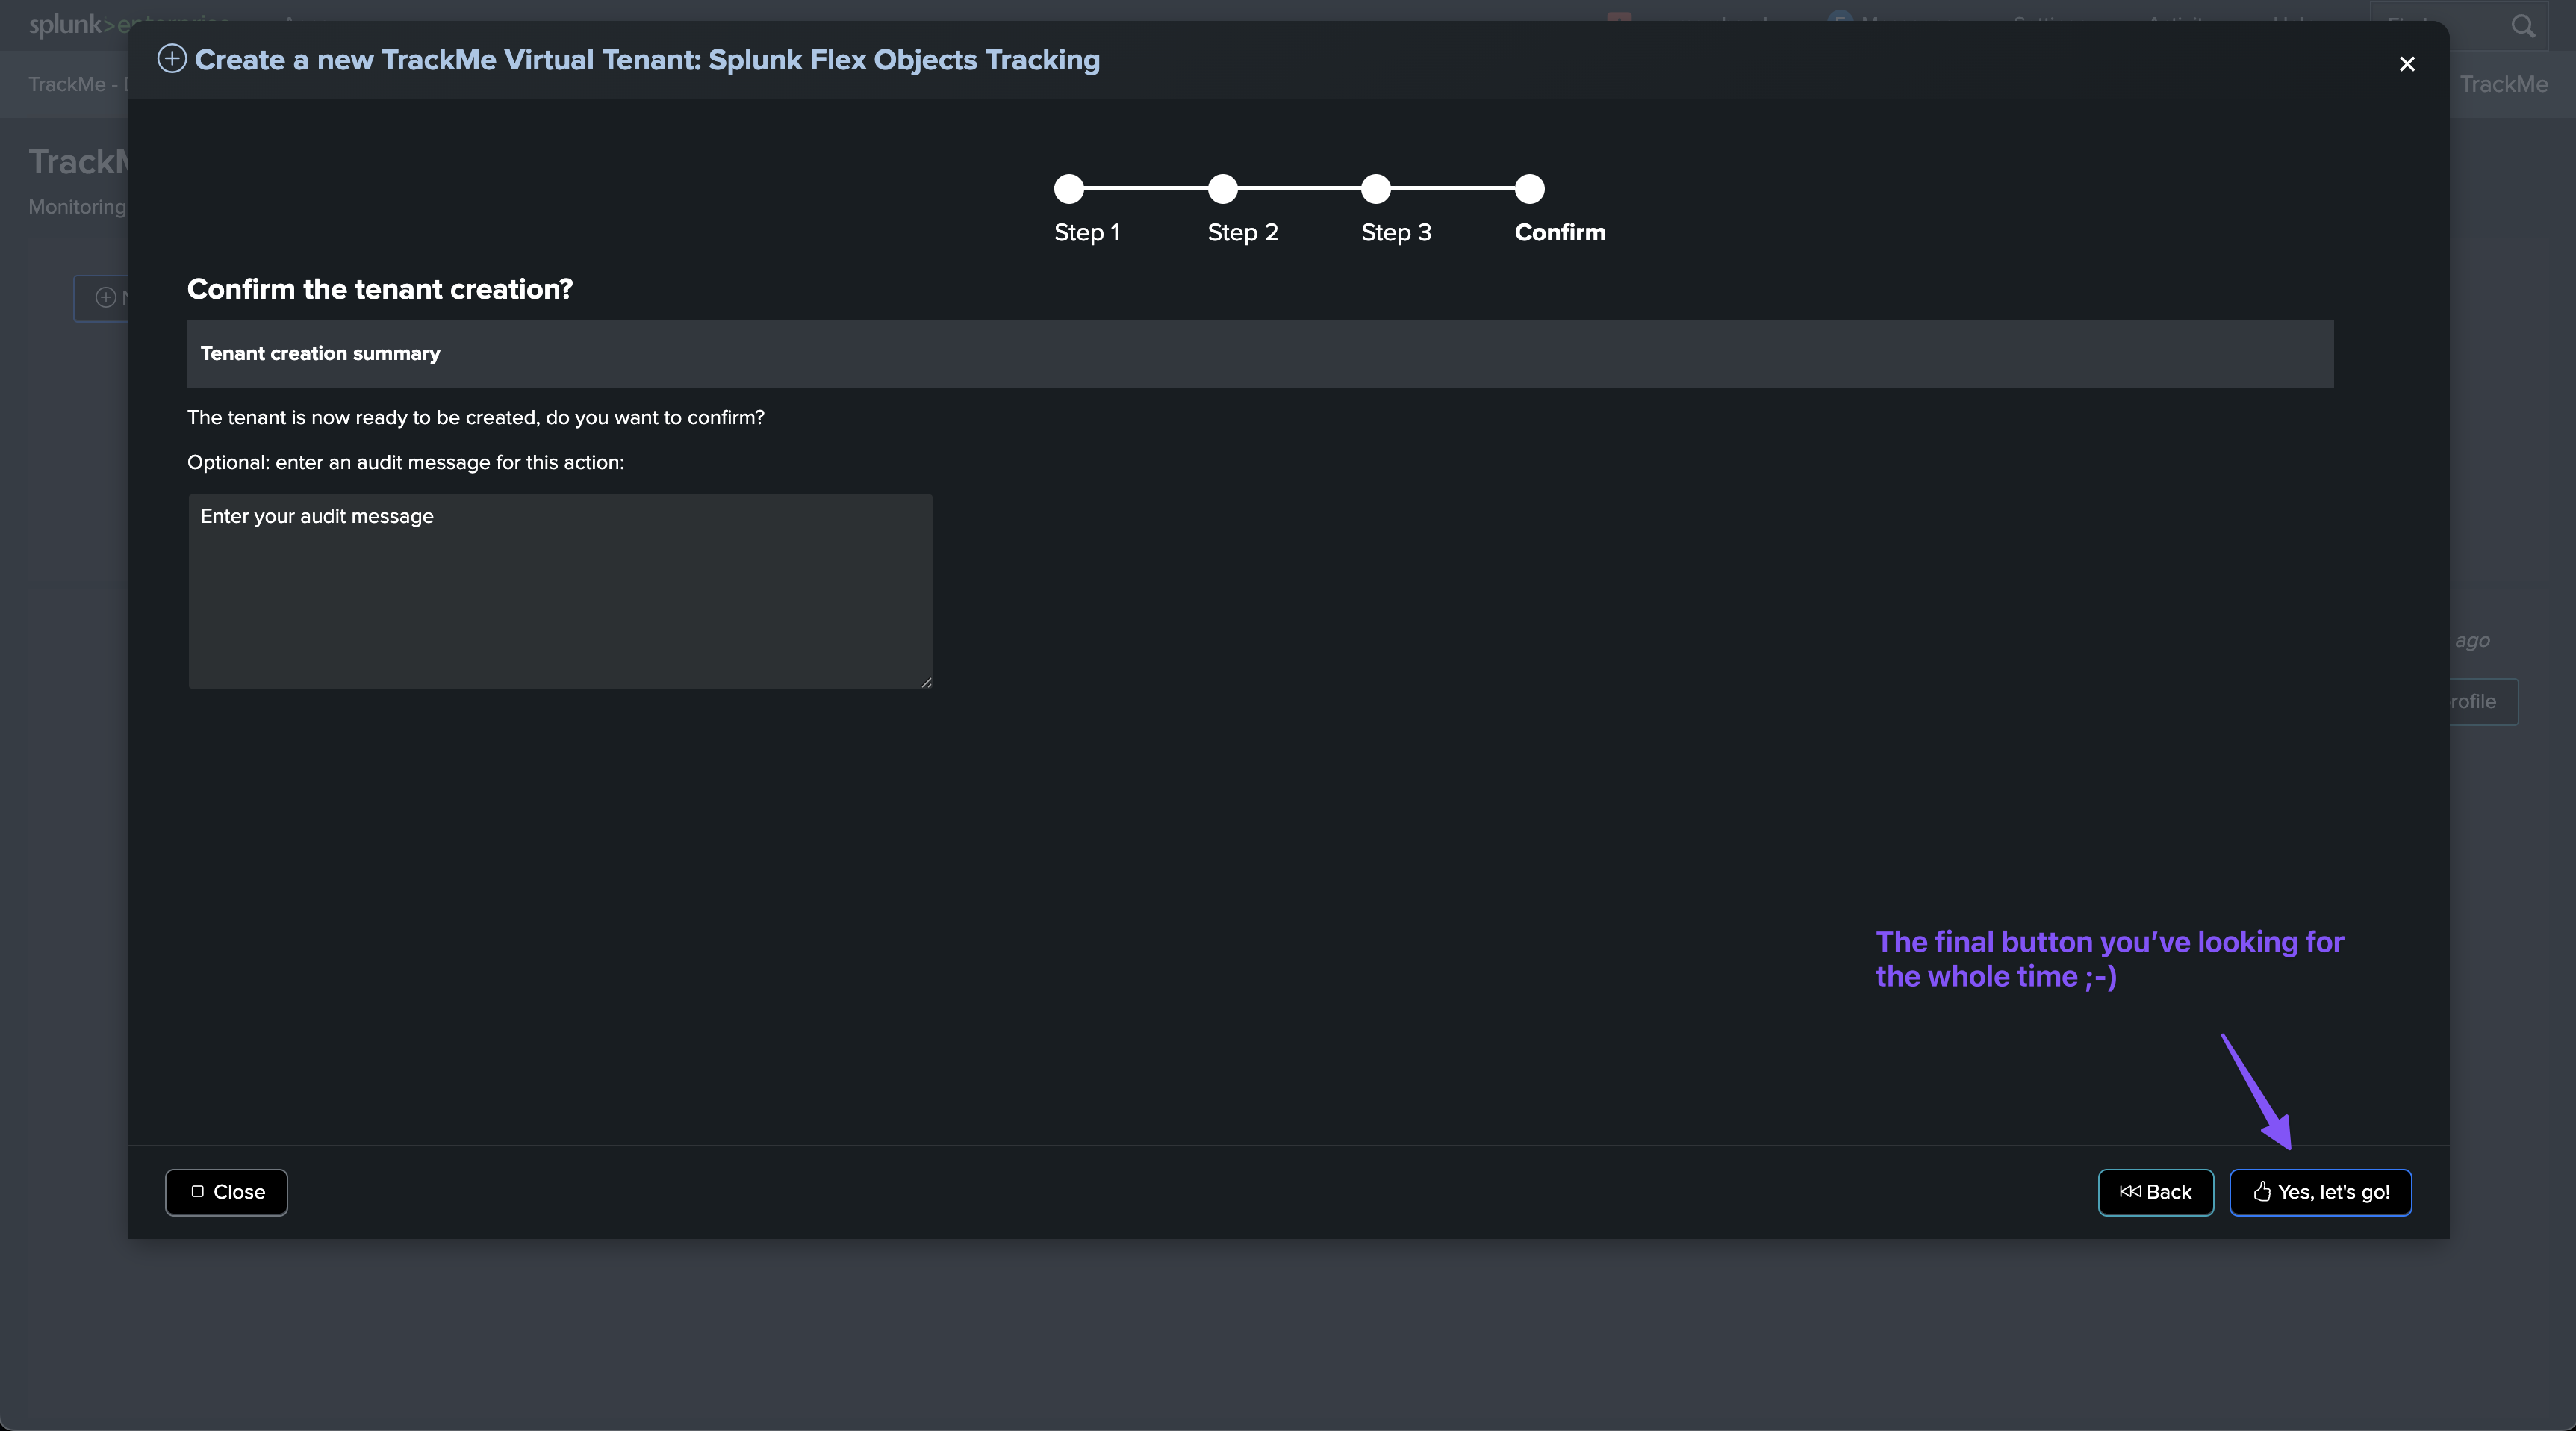
Creating a new Virtual Tenant
To create a new Virtual Tenant, you can follow these steps:
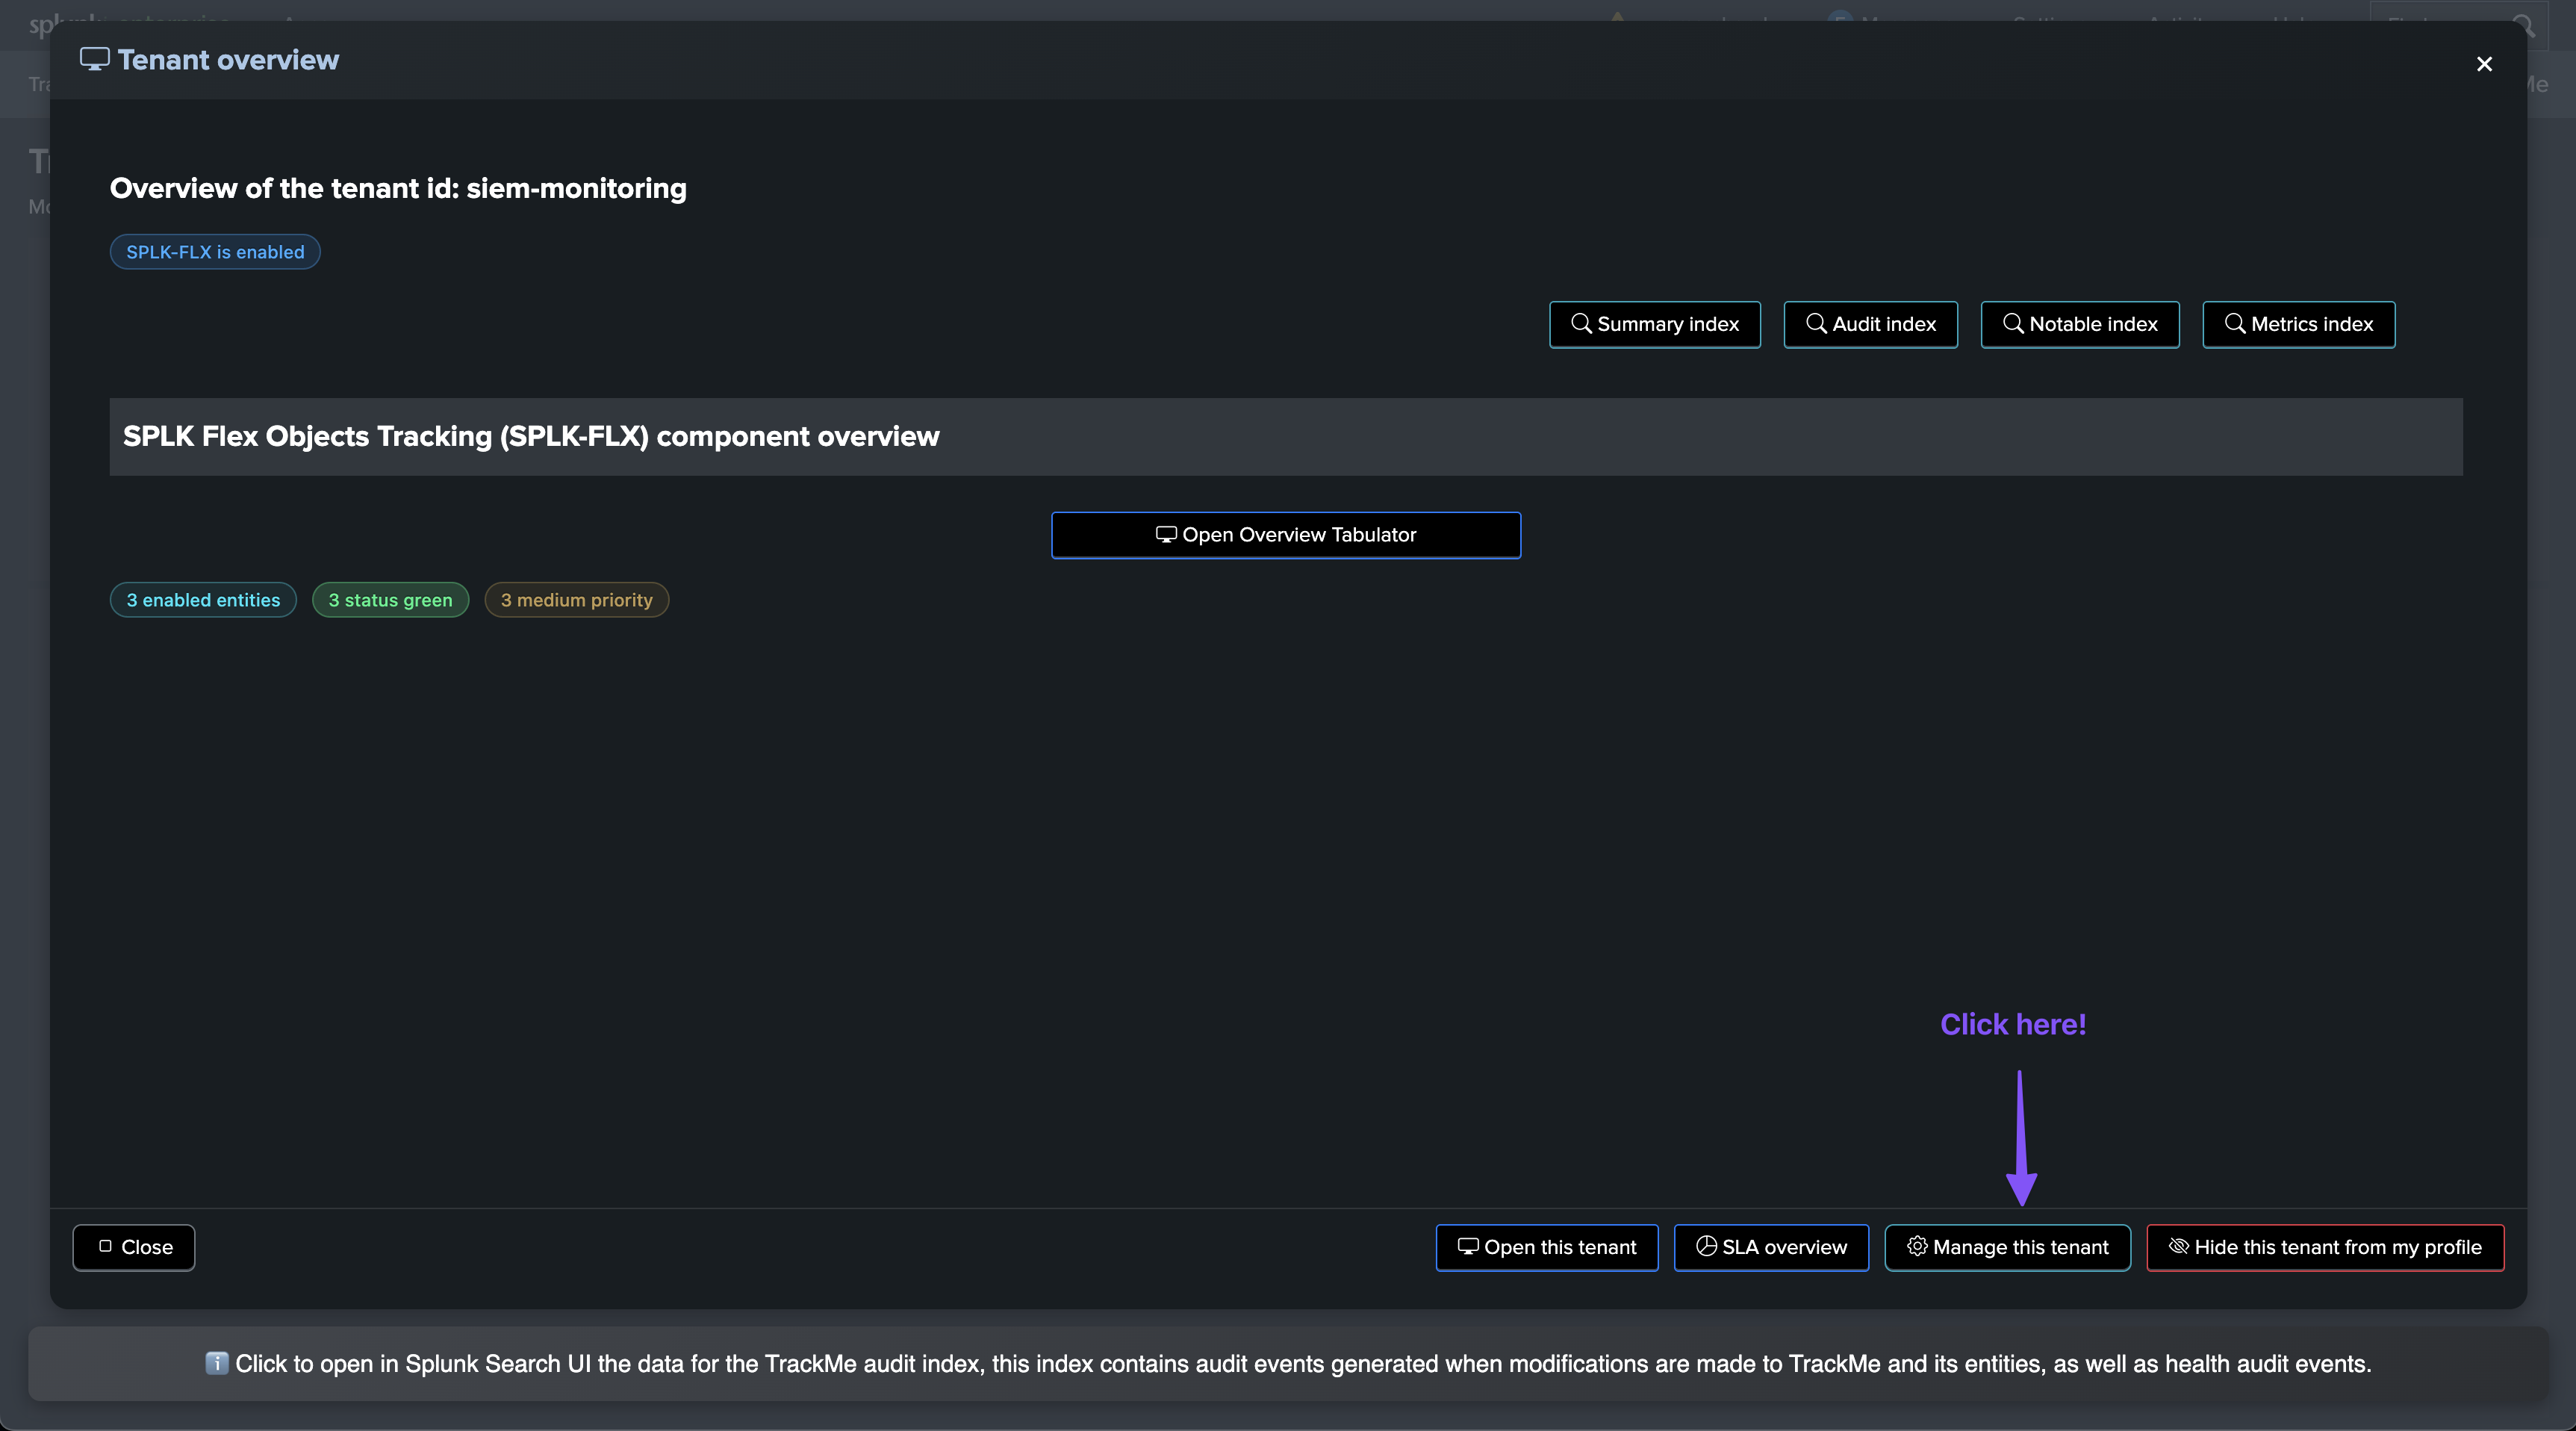
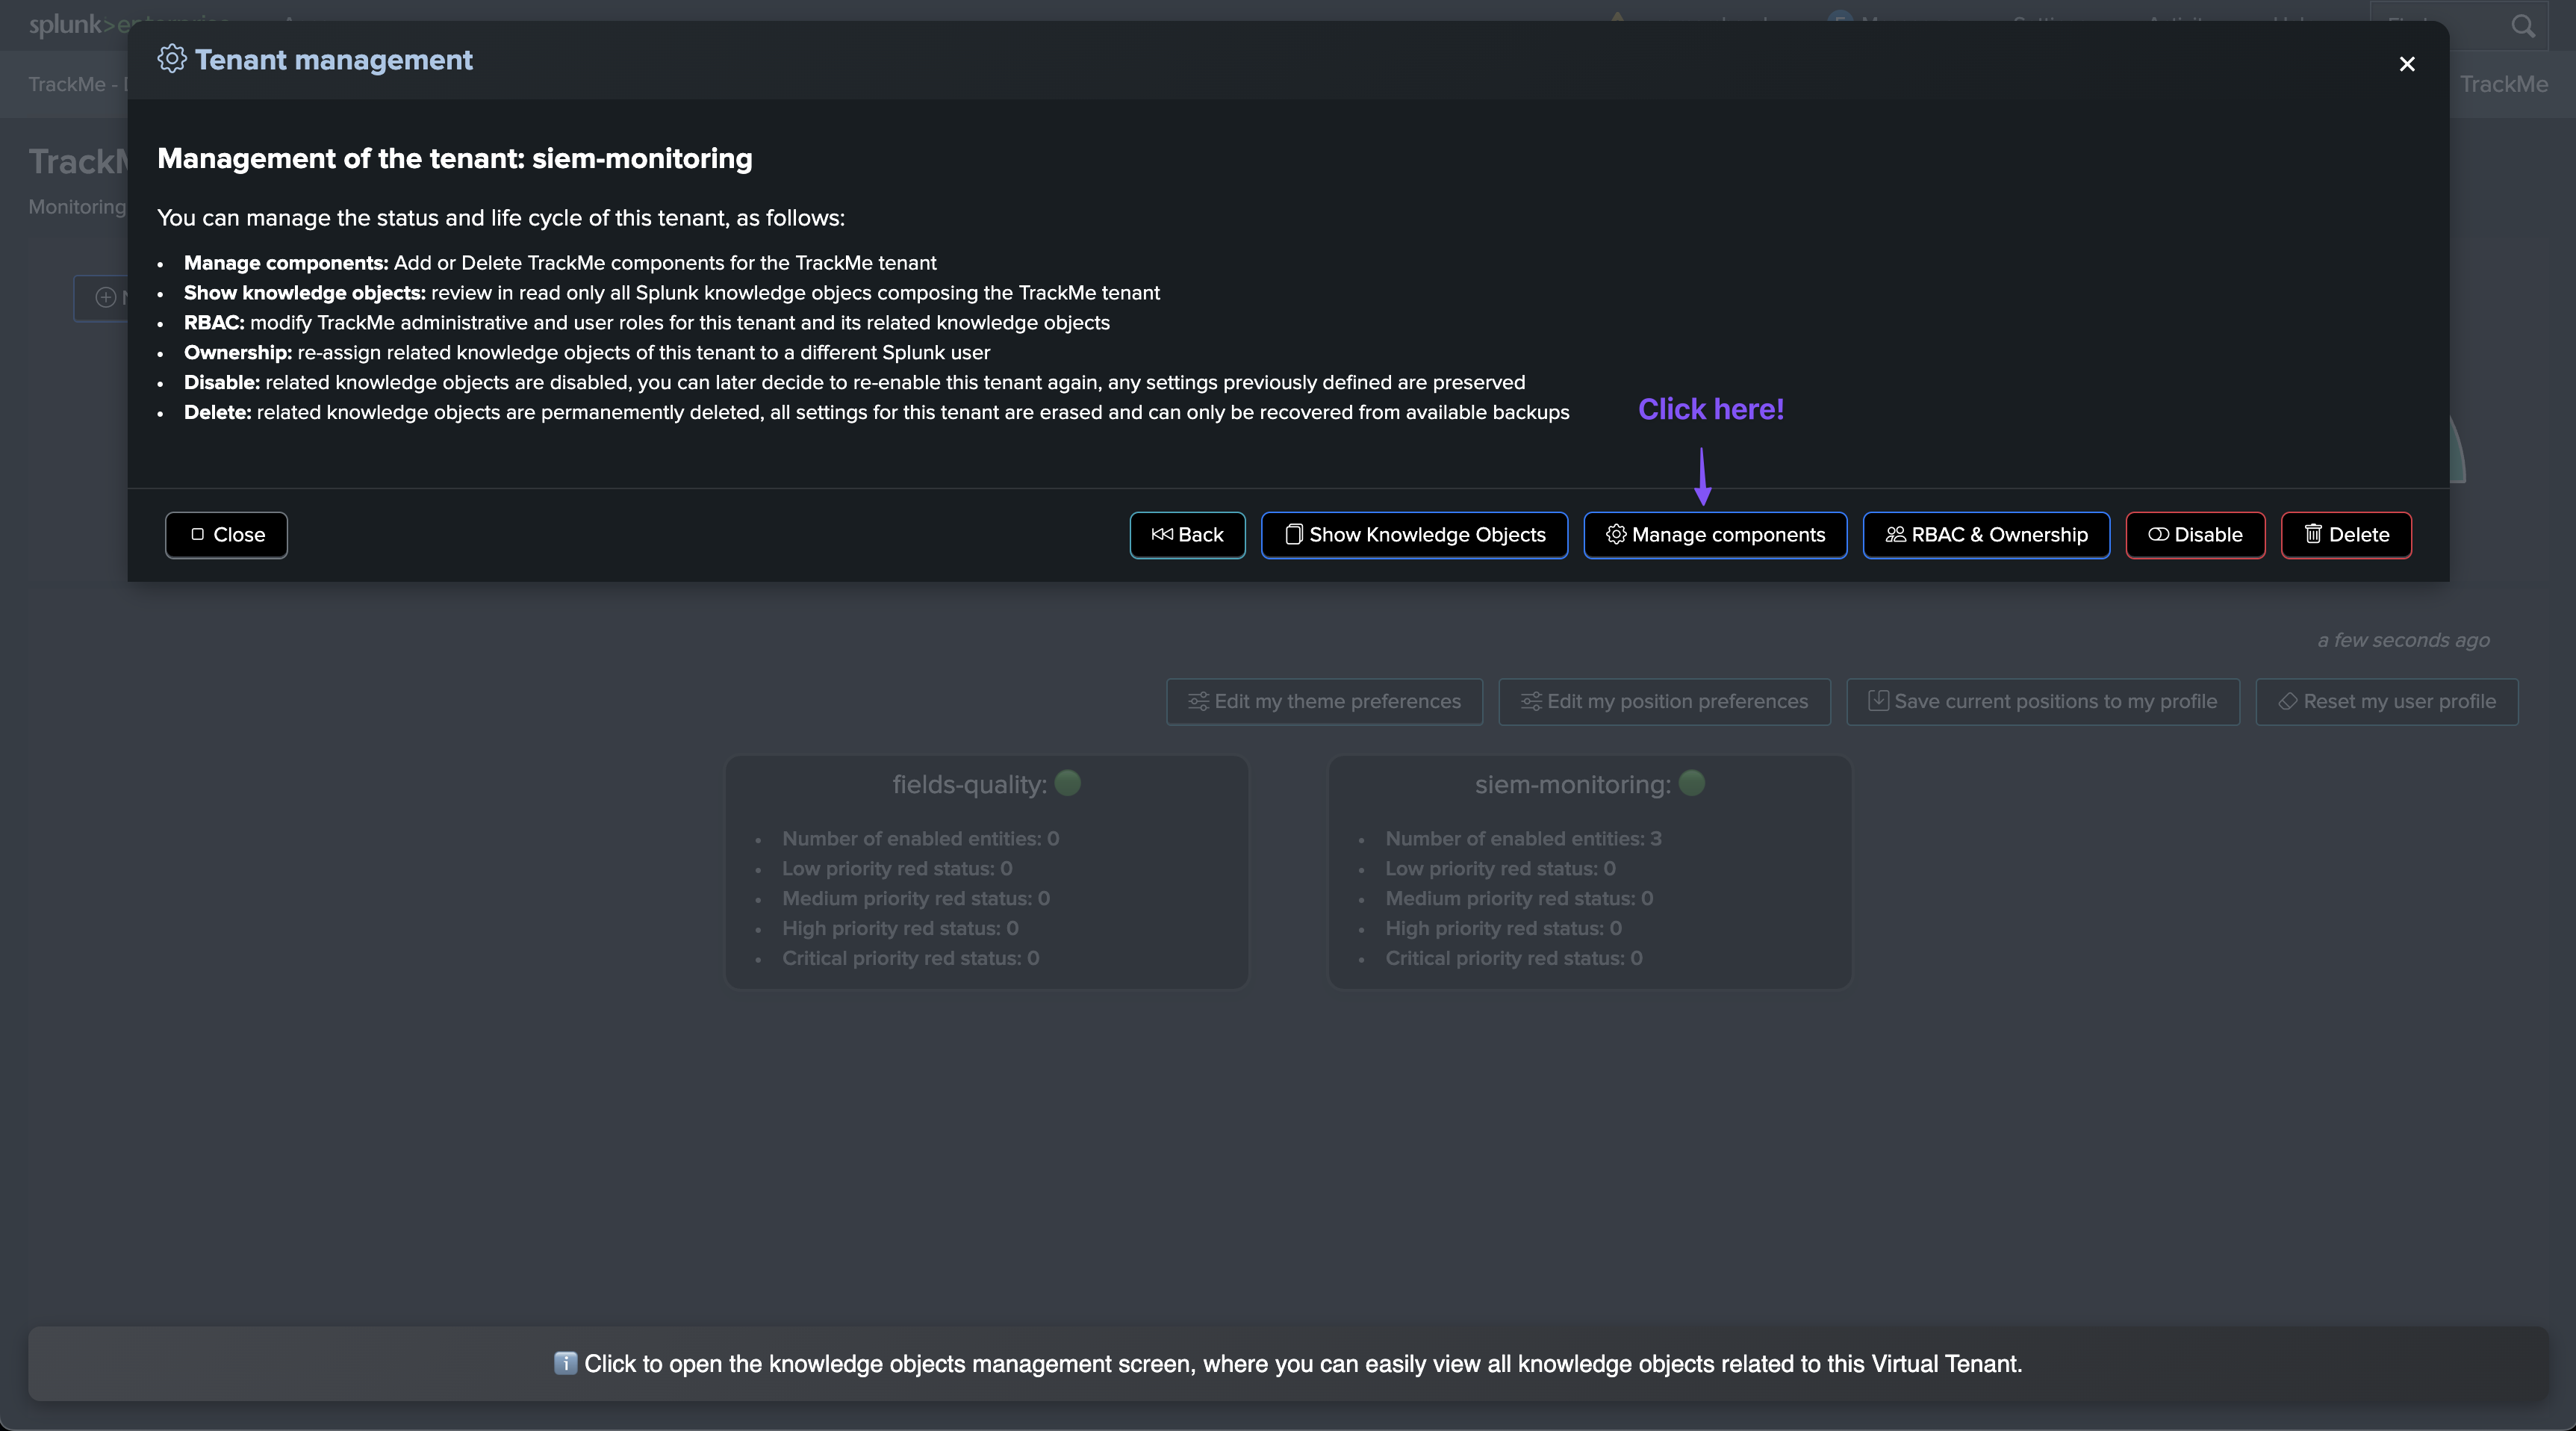
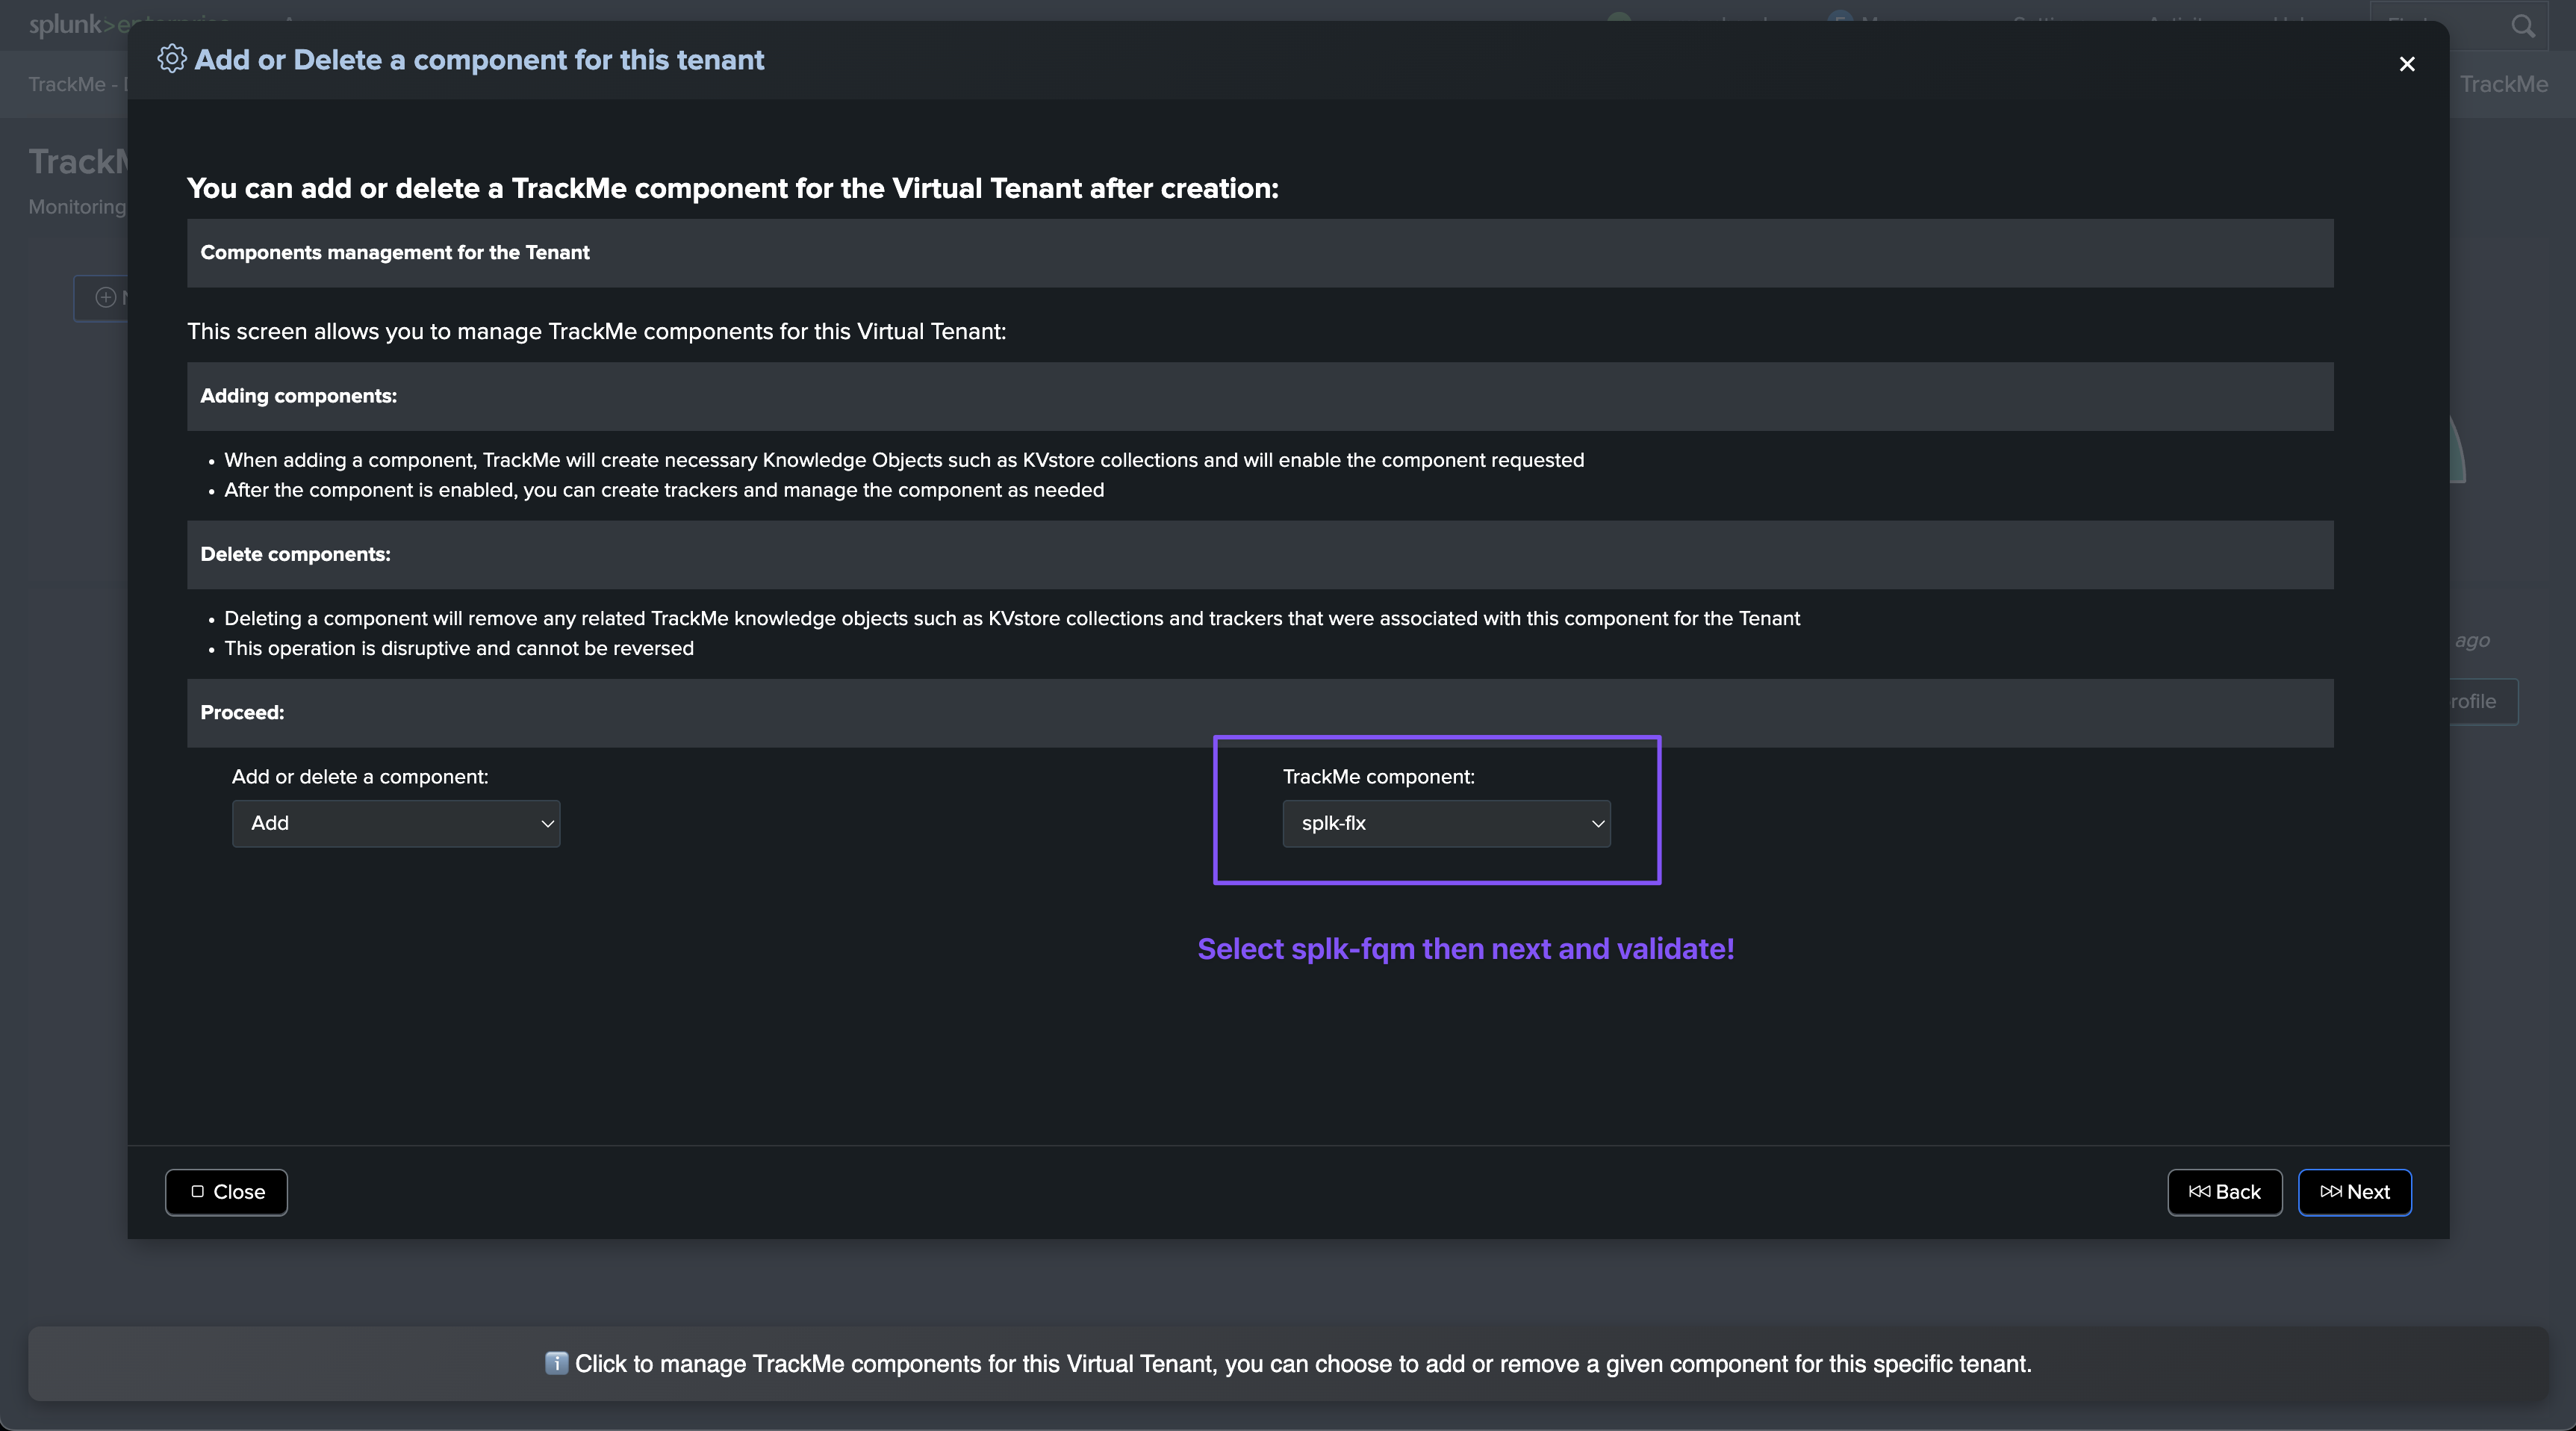
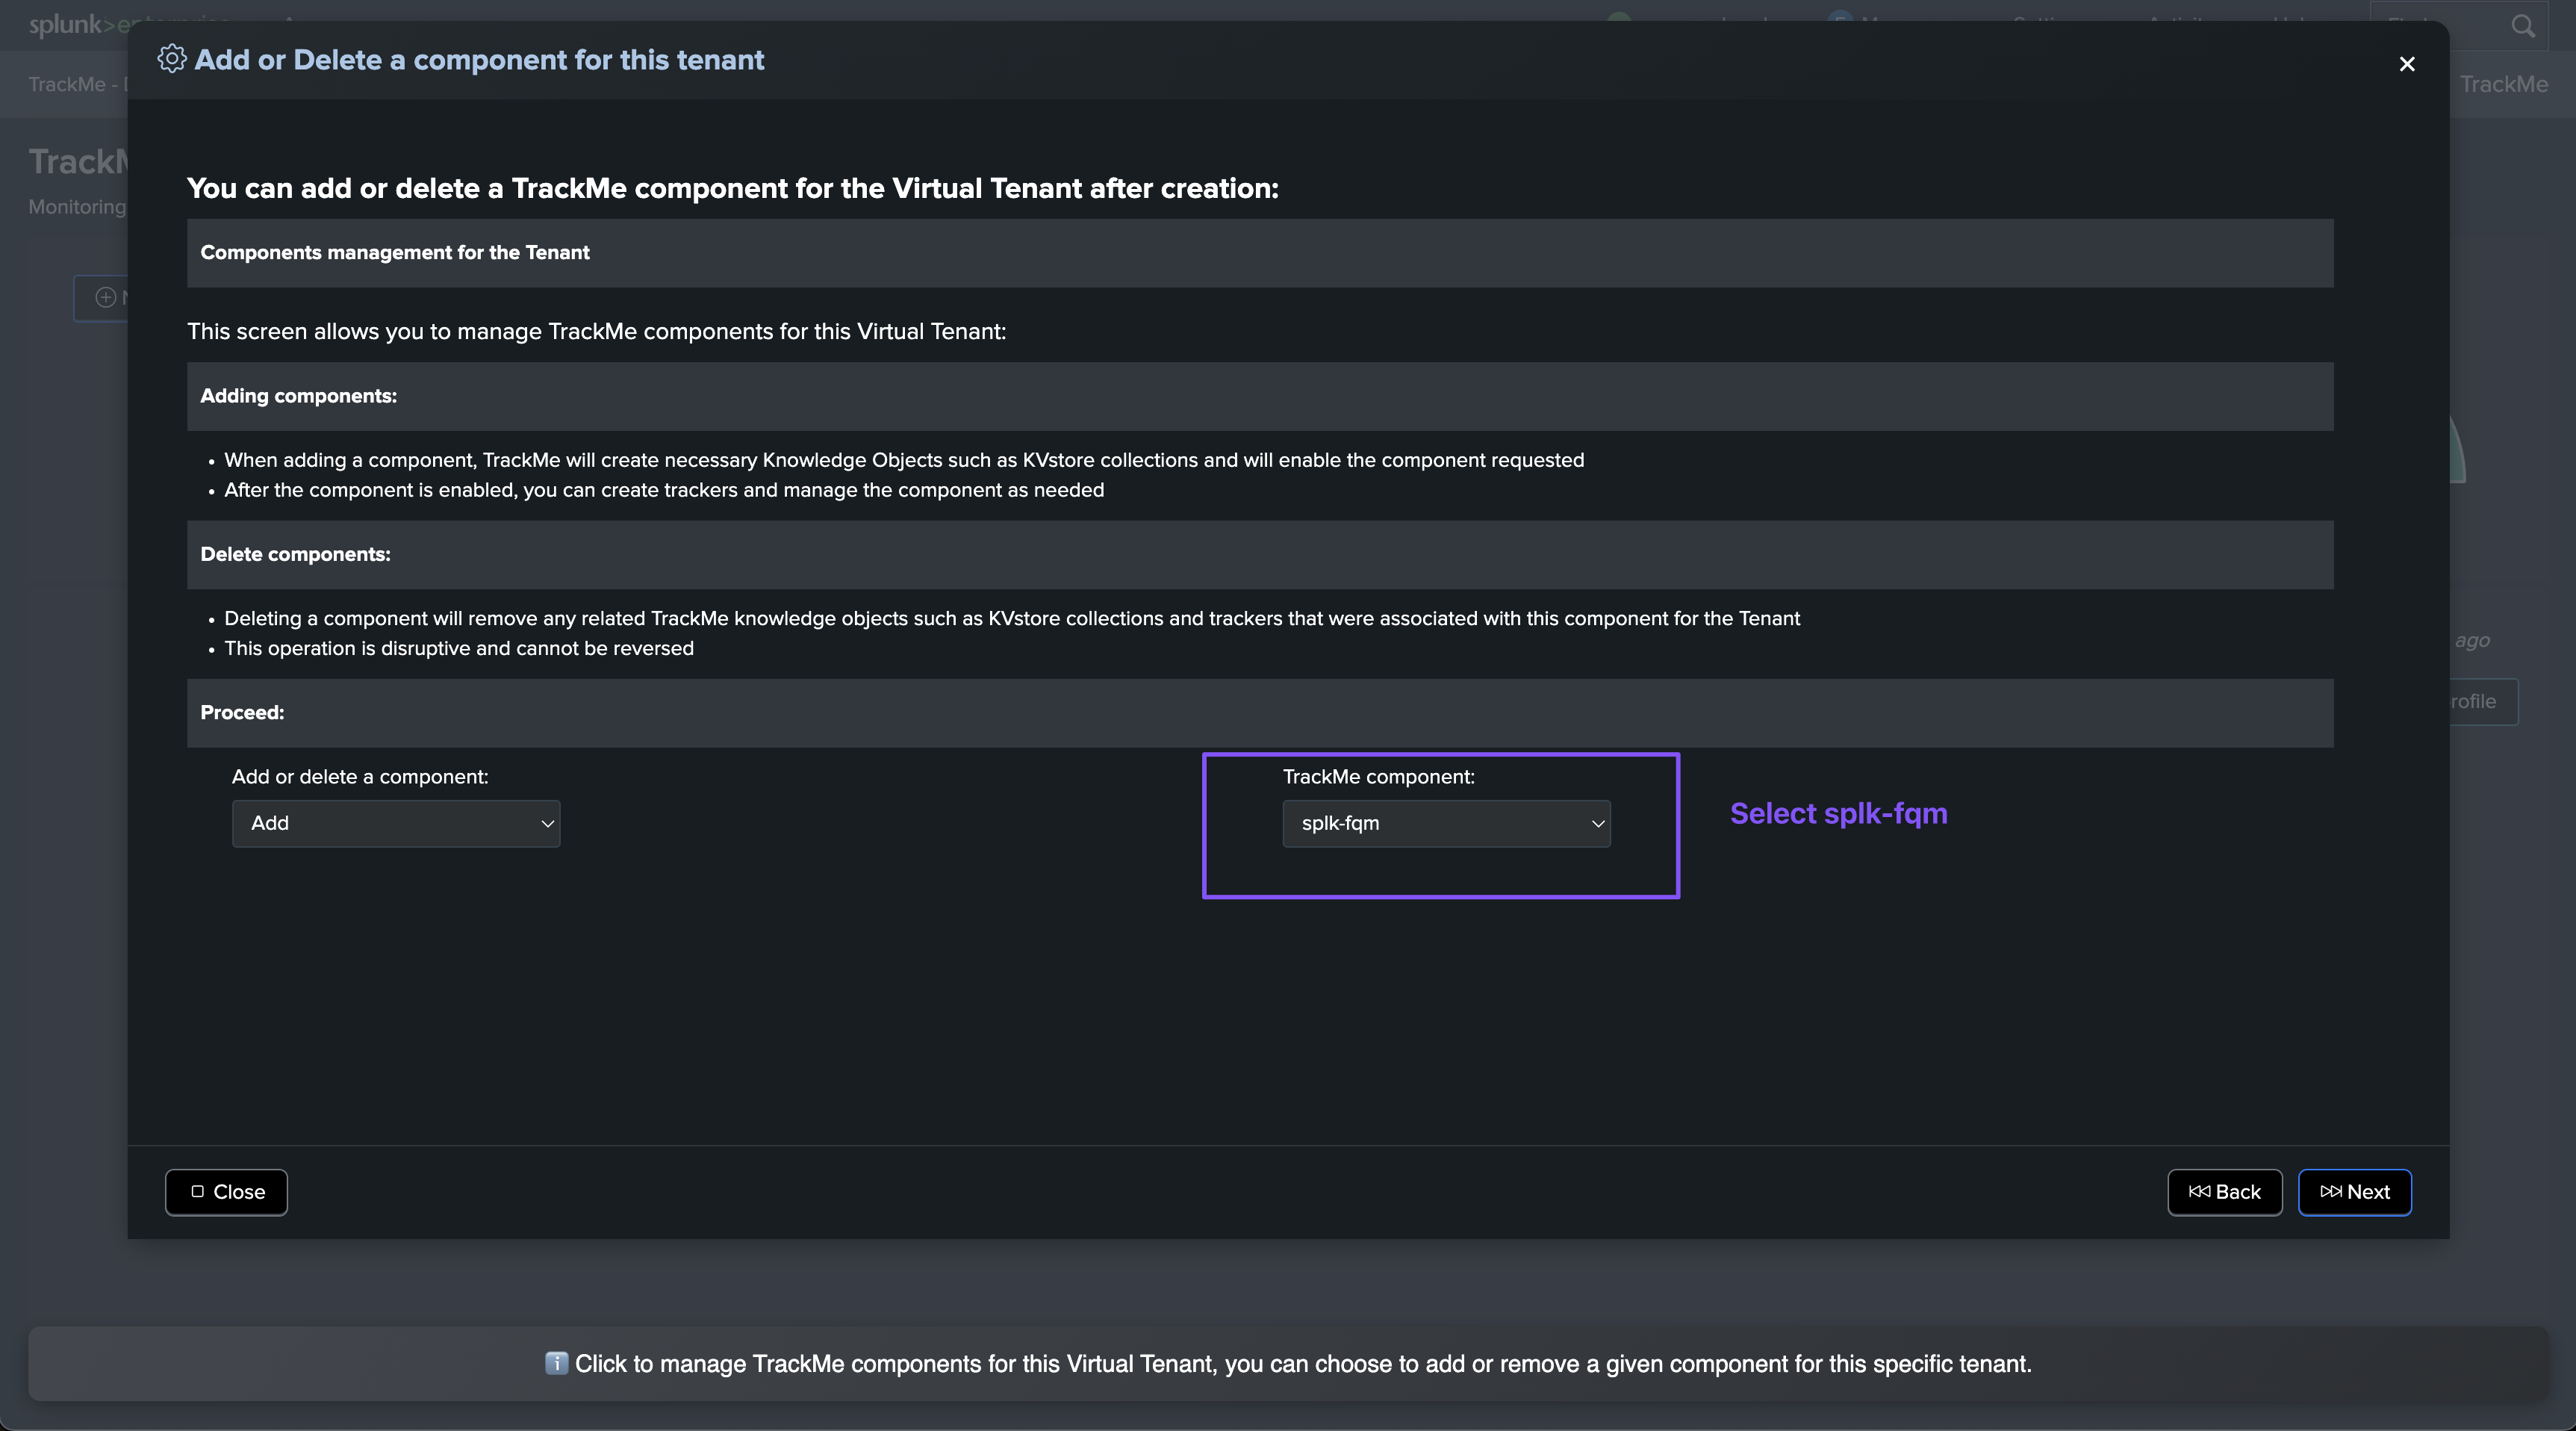
Adding the Fields Quality component to an existing Virtual Tenant
You can also add the Fields Quality component to an existing Virtual Tenant:
Creating your first collect job
Hint
About CIM and non CIM data contexts:
Since TrackMe 2.1.24, the Fields Quality component supports both CIM and non-CIM data contexts.
The main difference between creating a collect job for non CIM contexts relies on the creation of the data dictionary in the wizard and in the same time than the collect job creation.
For non CIM contexts, you need to define the fields to be monitored by declaring the fields of interests in the data dictionary.
On the other hand and for CIM contexts, TrackMe can generate a new data dictionary for you and based on the selected CIM data model.
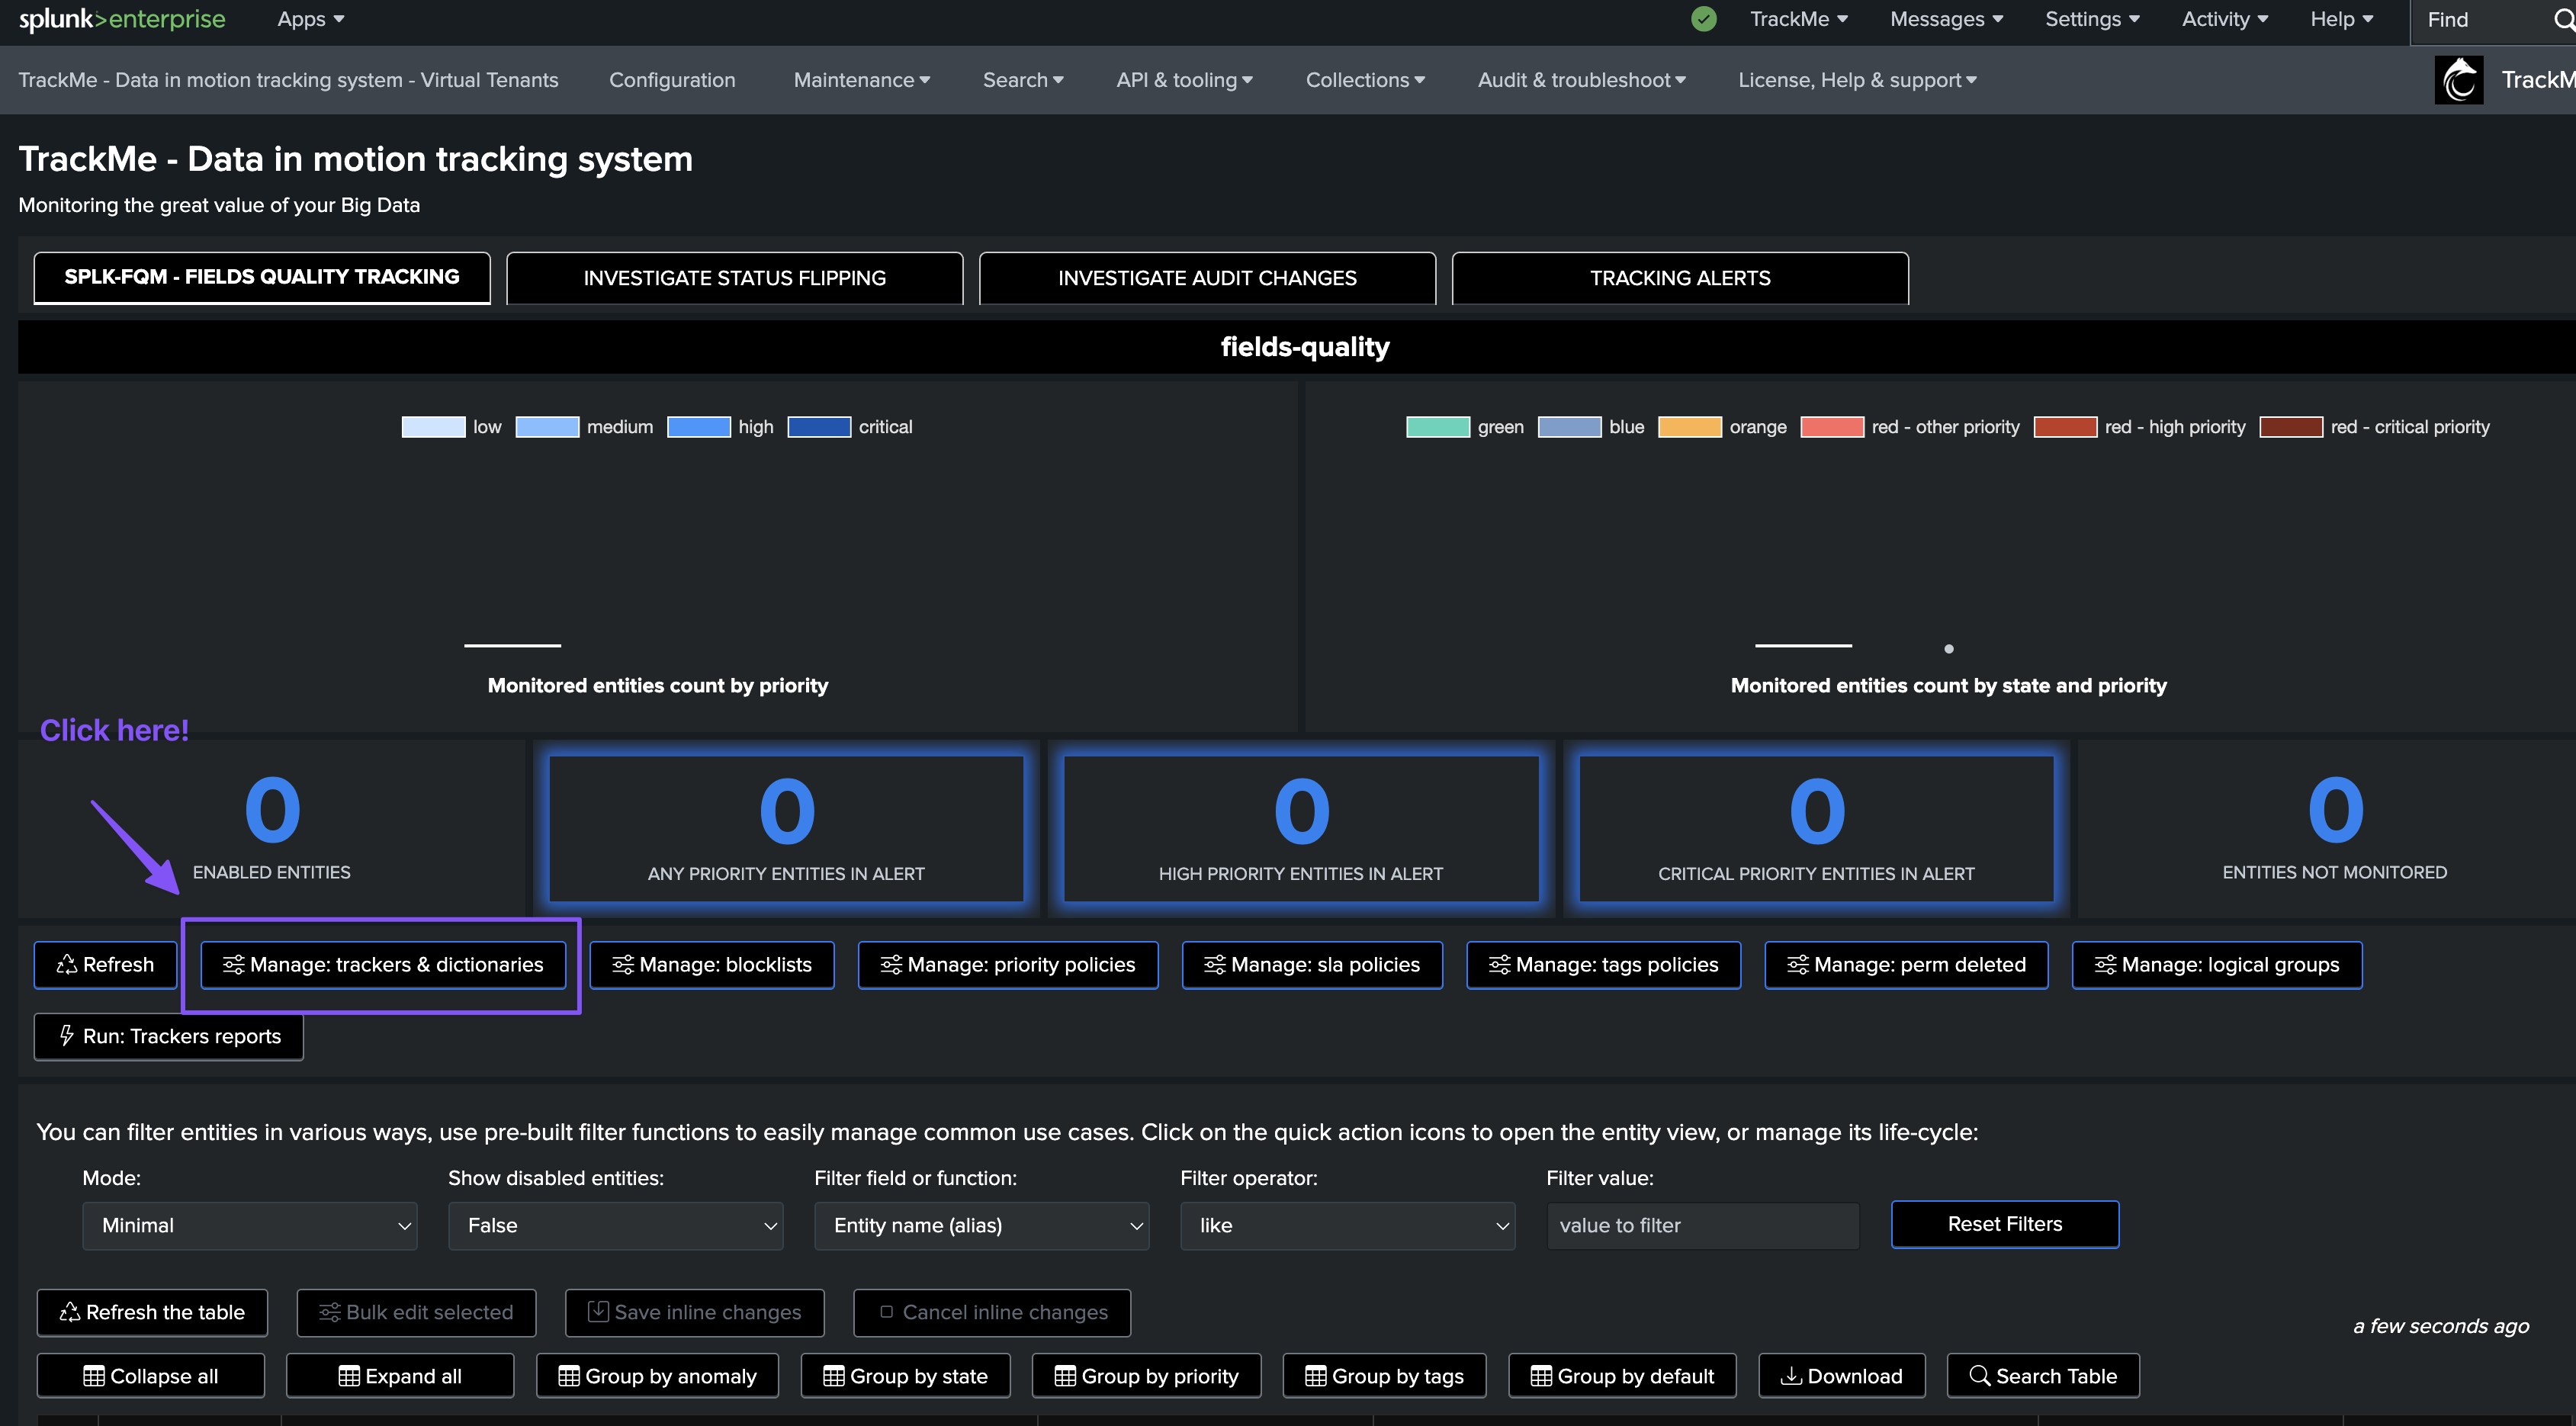
Once we have a Virtual Tenant with the Fields Quality component enabled, we can create our first collect job.
To start the wizard, click on Manage: trackers & dictionaries then choose an action button:
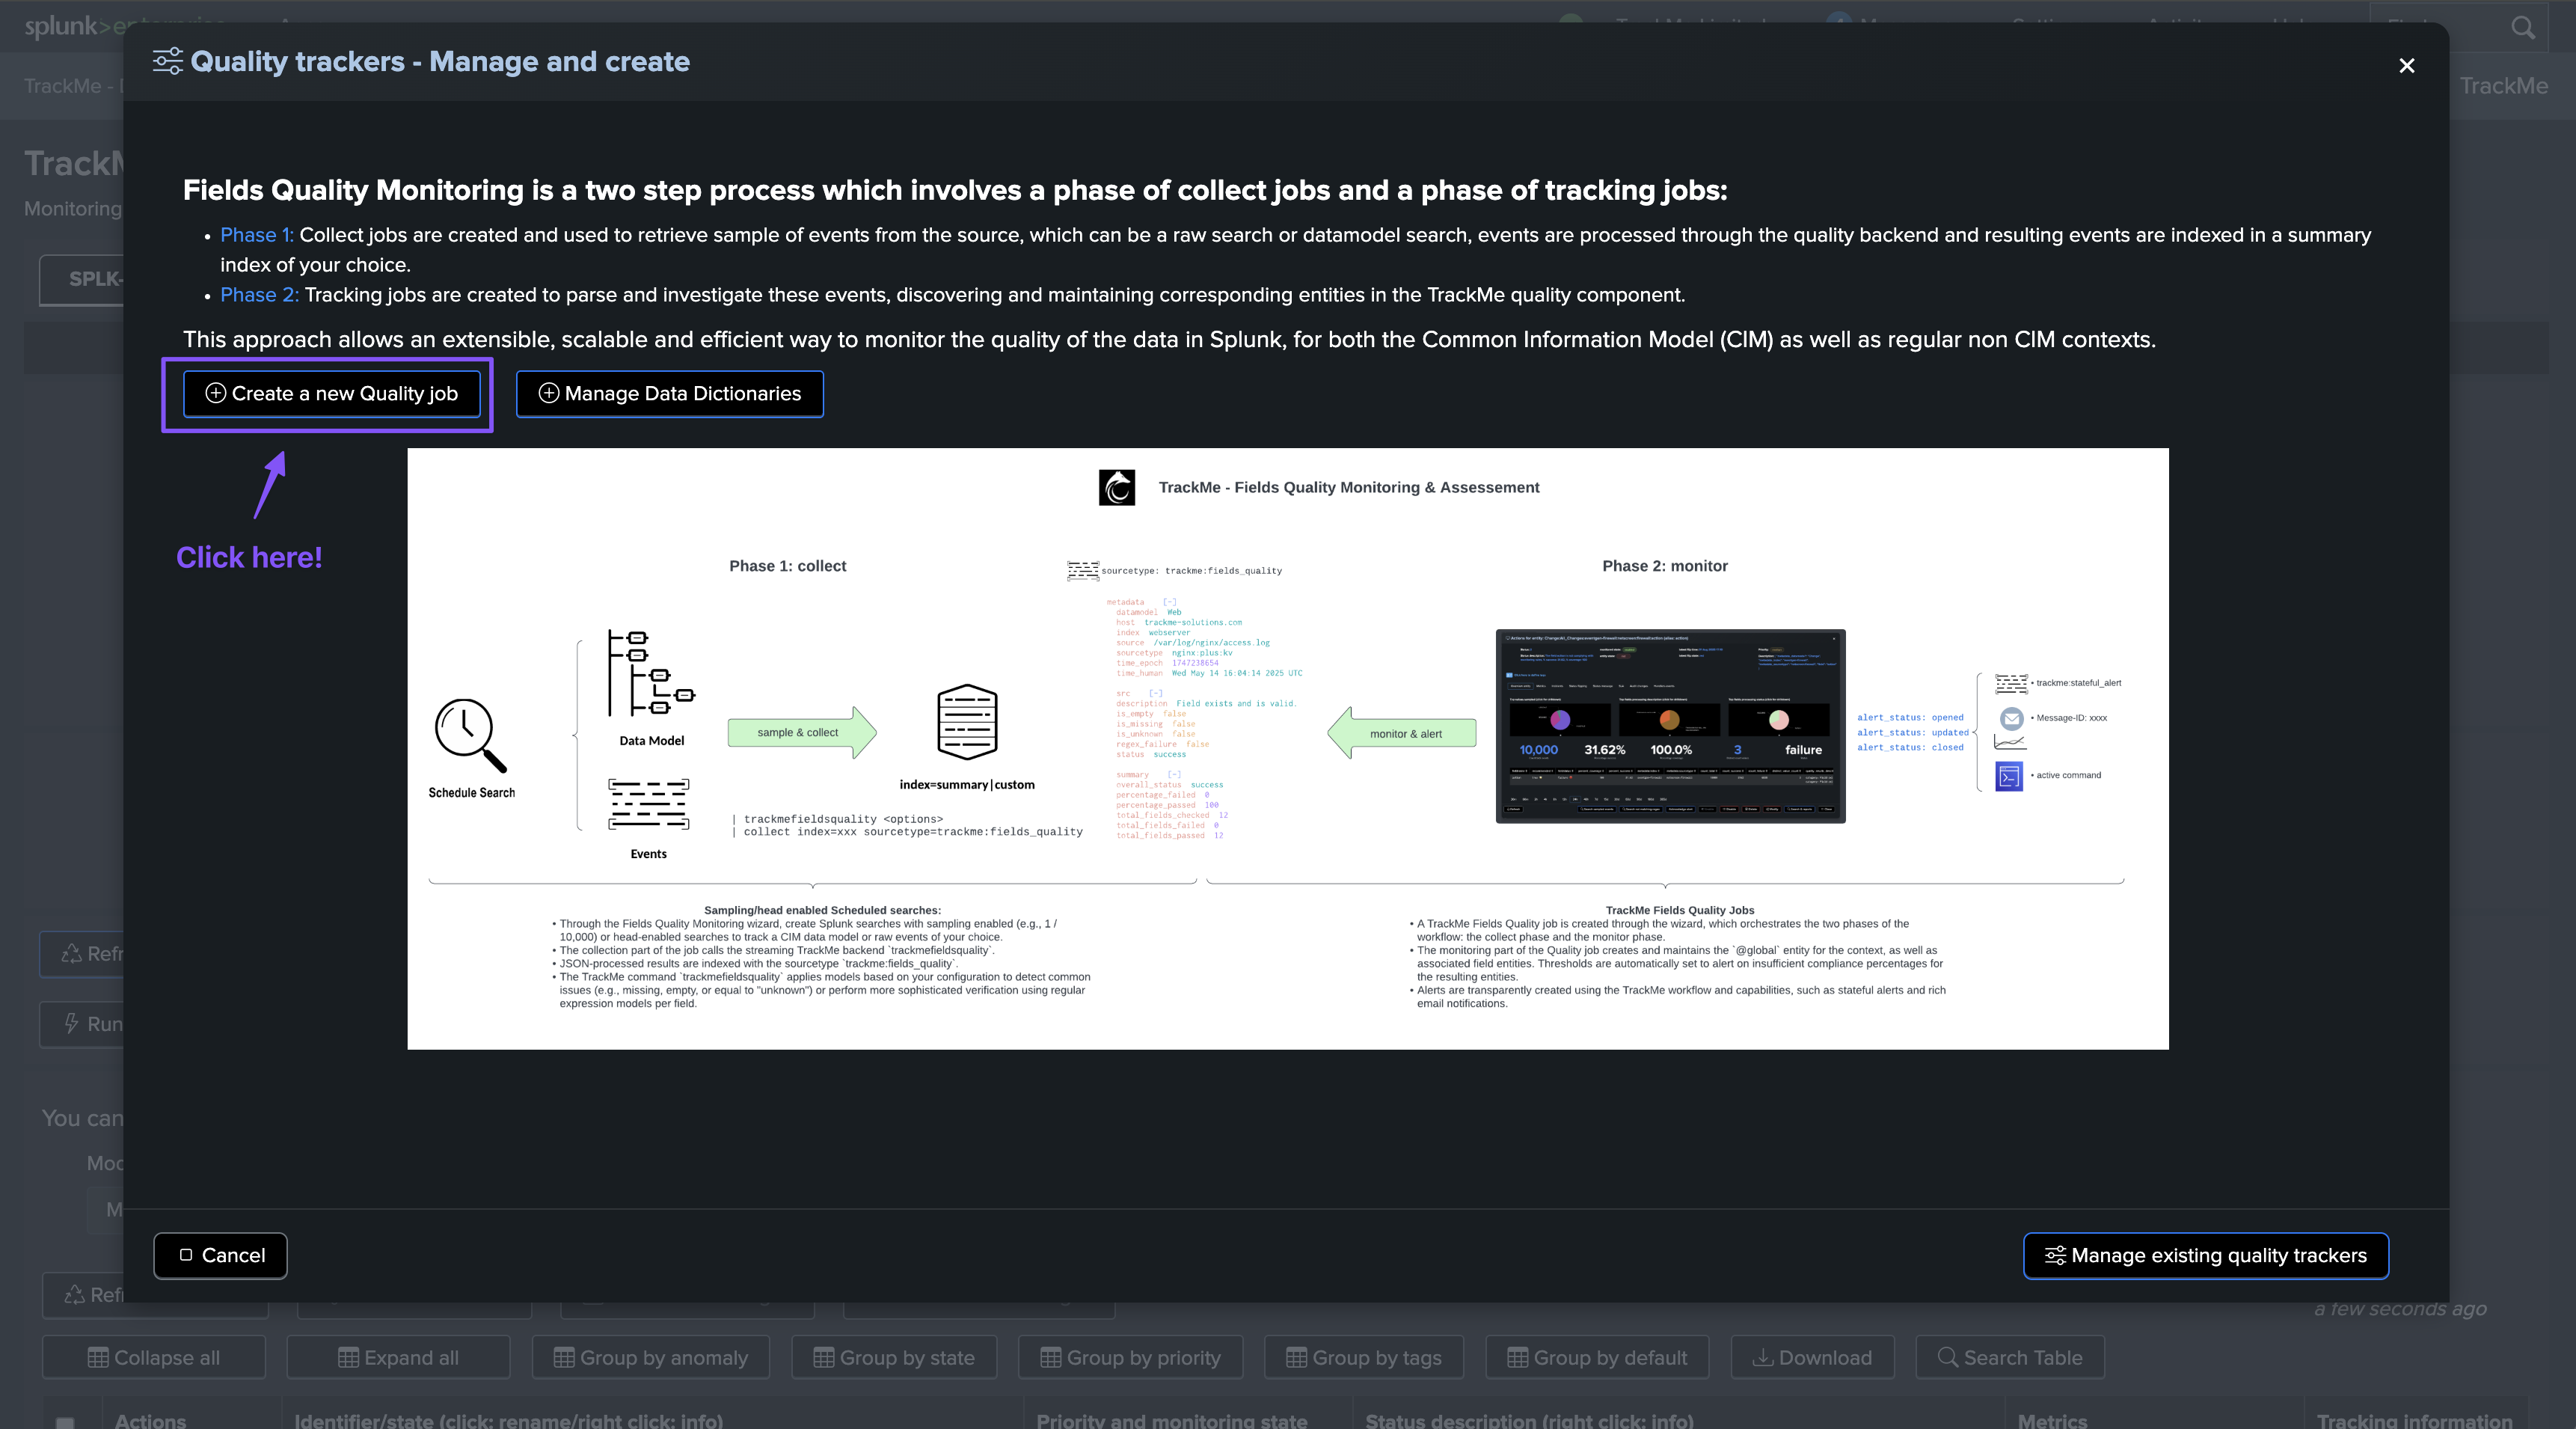
Create a new Quality job (for CIM, generate or use existing dictionary):
This wizard allows creating a new collect job from scratch, and which targets a Common Information Model (CIM) only context.
The wizard can generate the data dictionary for you, based on the selected CIM data model, and some of your preferences.
You can also select an existing data dictionary to be used for the collect job, if any.
Create a new Quality job (for CIM or non CIM, define or use existing dictionary):
This wizard allows creating a new collect job for both CIM and non CIM contexts, the main difference being the way the data dictionary is defined.
You can either choose to create and define the data dictionary within the wizard, or use an existing data dictionary.
It is intended primarly to be used for non CIM contexts, or contexts where you want to have full control over the data dictionary definition at the stage of the collect job creation.
New monitor job only (advanced, re-use events for aggregation):
This is an advanced option, intented to allow creating a monitor only collect job, and re-use the events generated by a previous collect job for different aggregation purposes.
It can be used for instance to track fields quality for existing collectors, but in a different way, such as aggregating at the level of the datamodel rather than datamode/index/sourcetype, without re-collecting and pre-processing the same sources, nor affecting the source tenant way of aggregating and processing the quality entities.
To use this feature, you first need an existing configured collect job and you should have identified your use case, and particularly the aggregation definition. (break by definition)
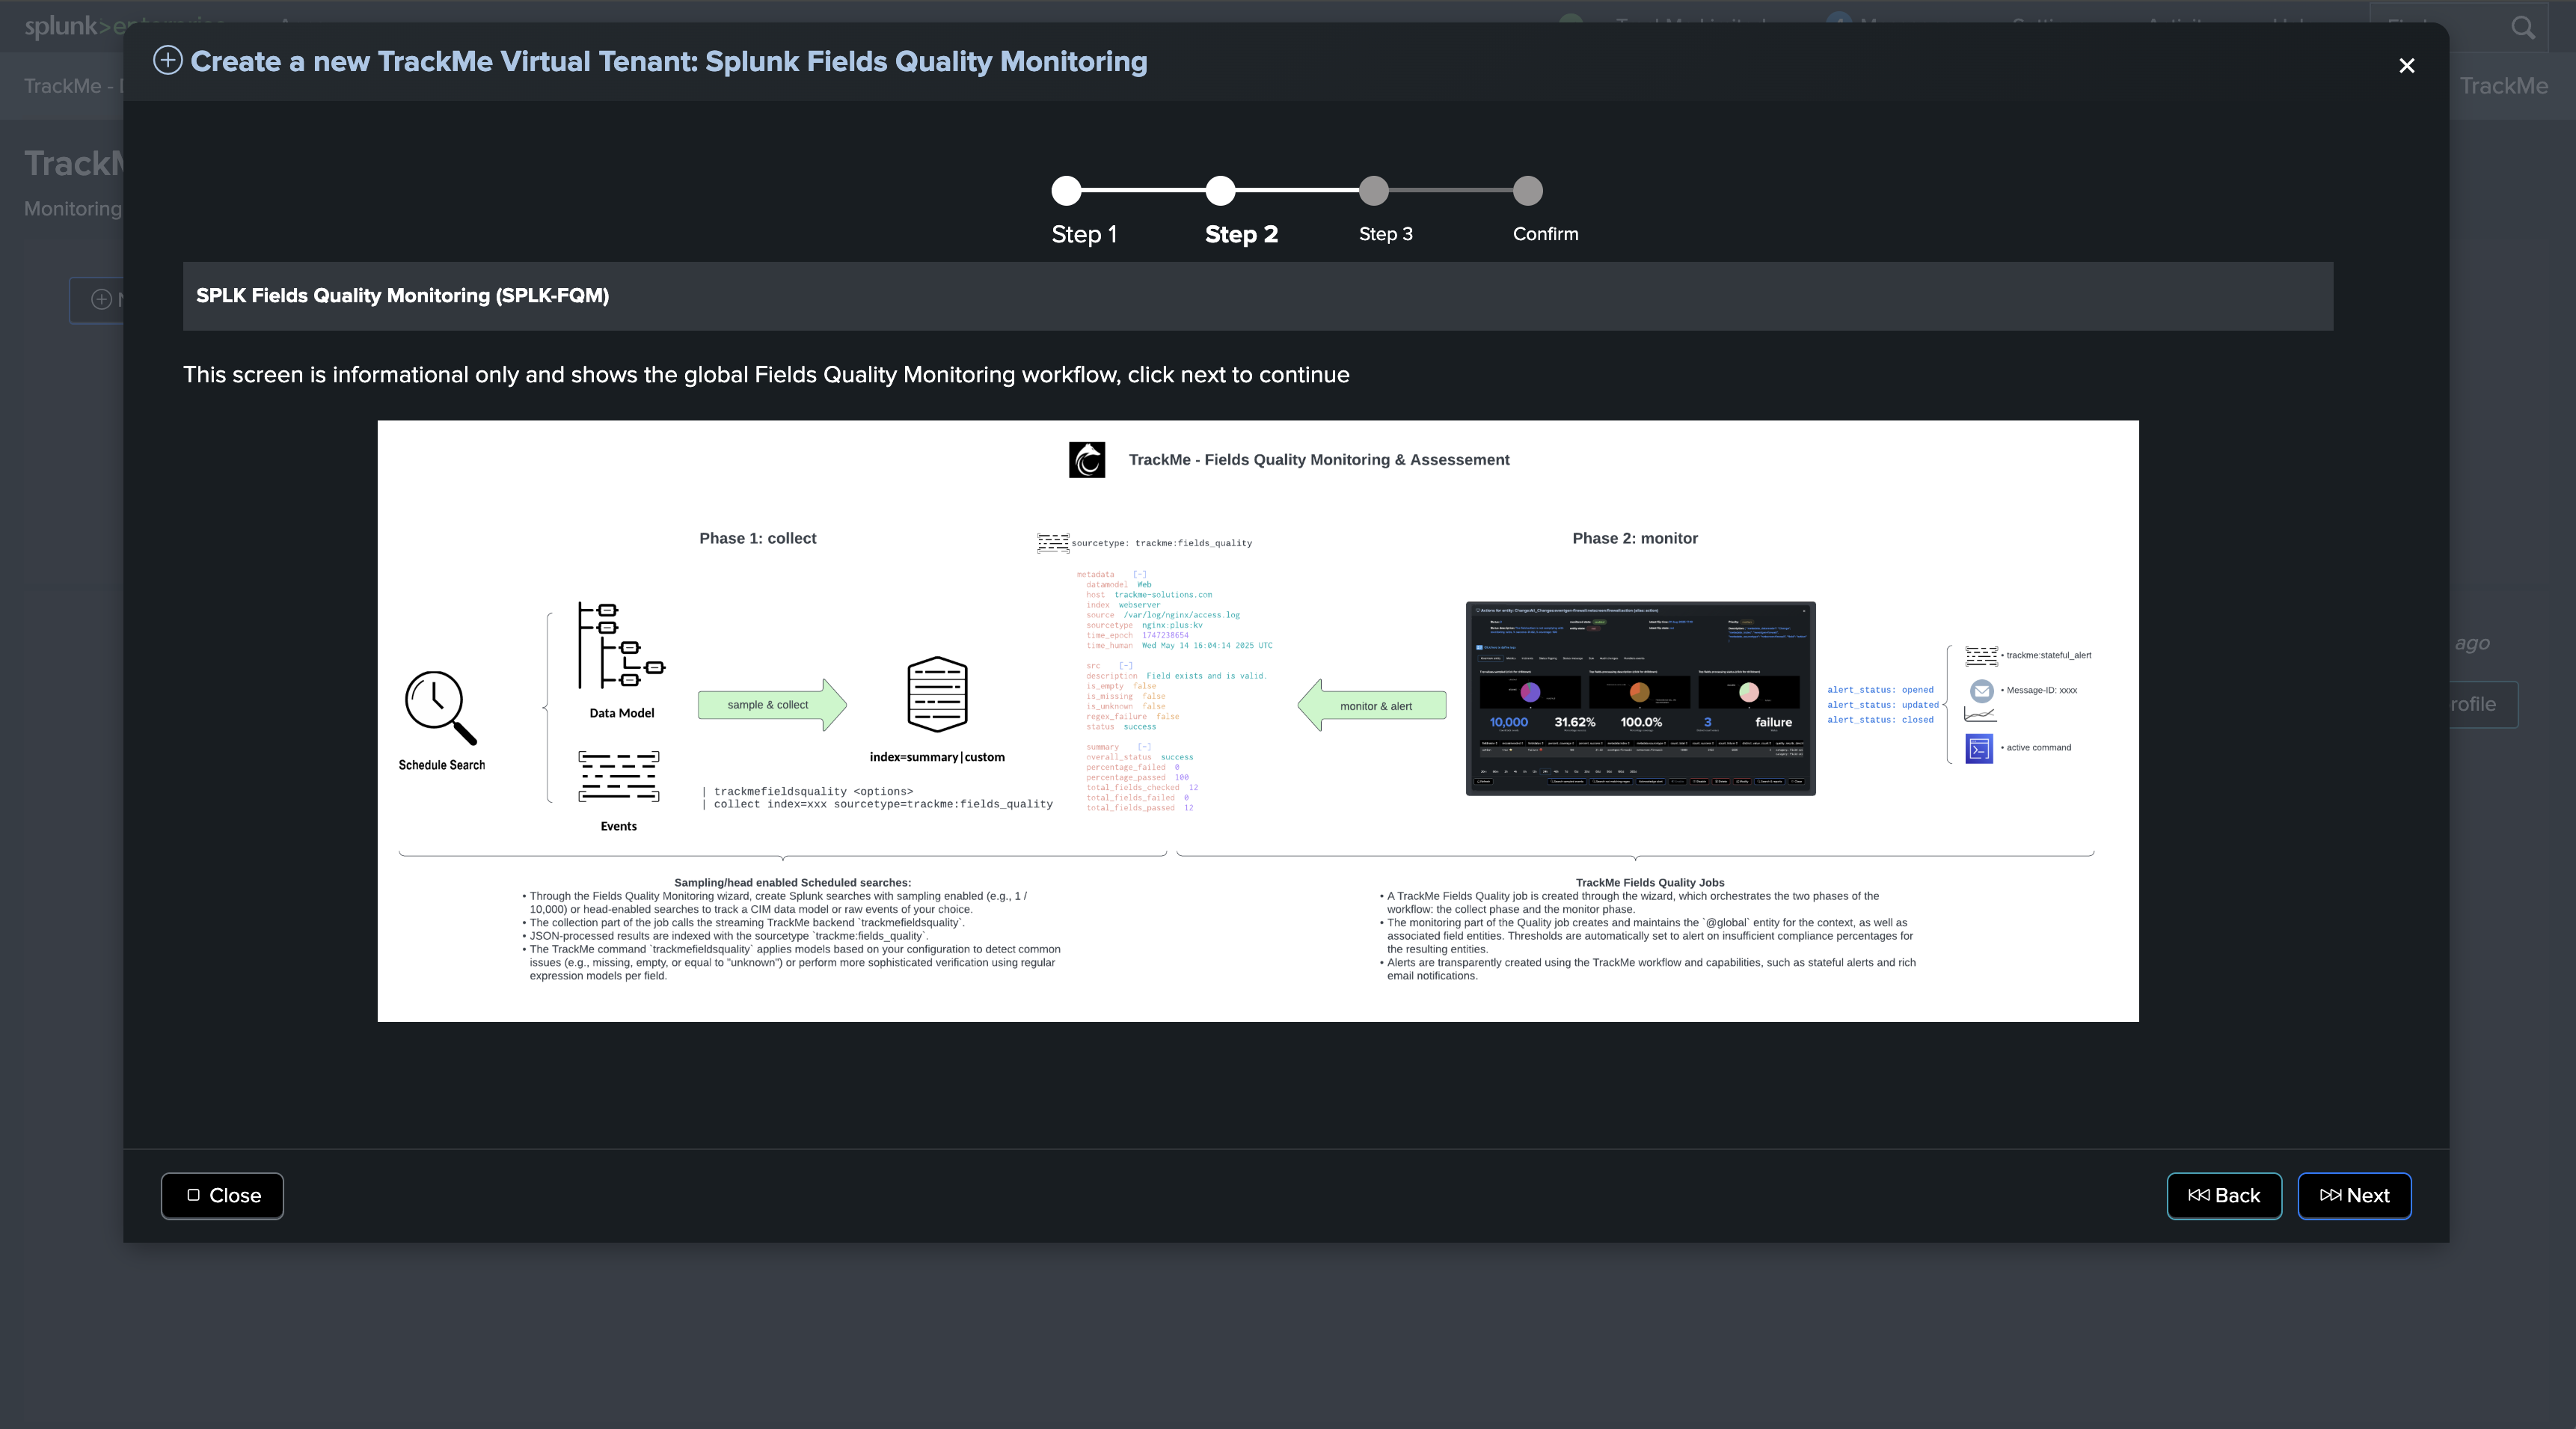
Wizard welcoming screen
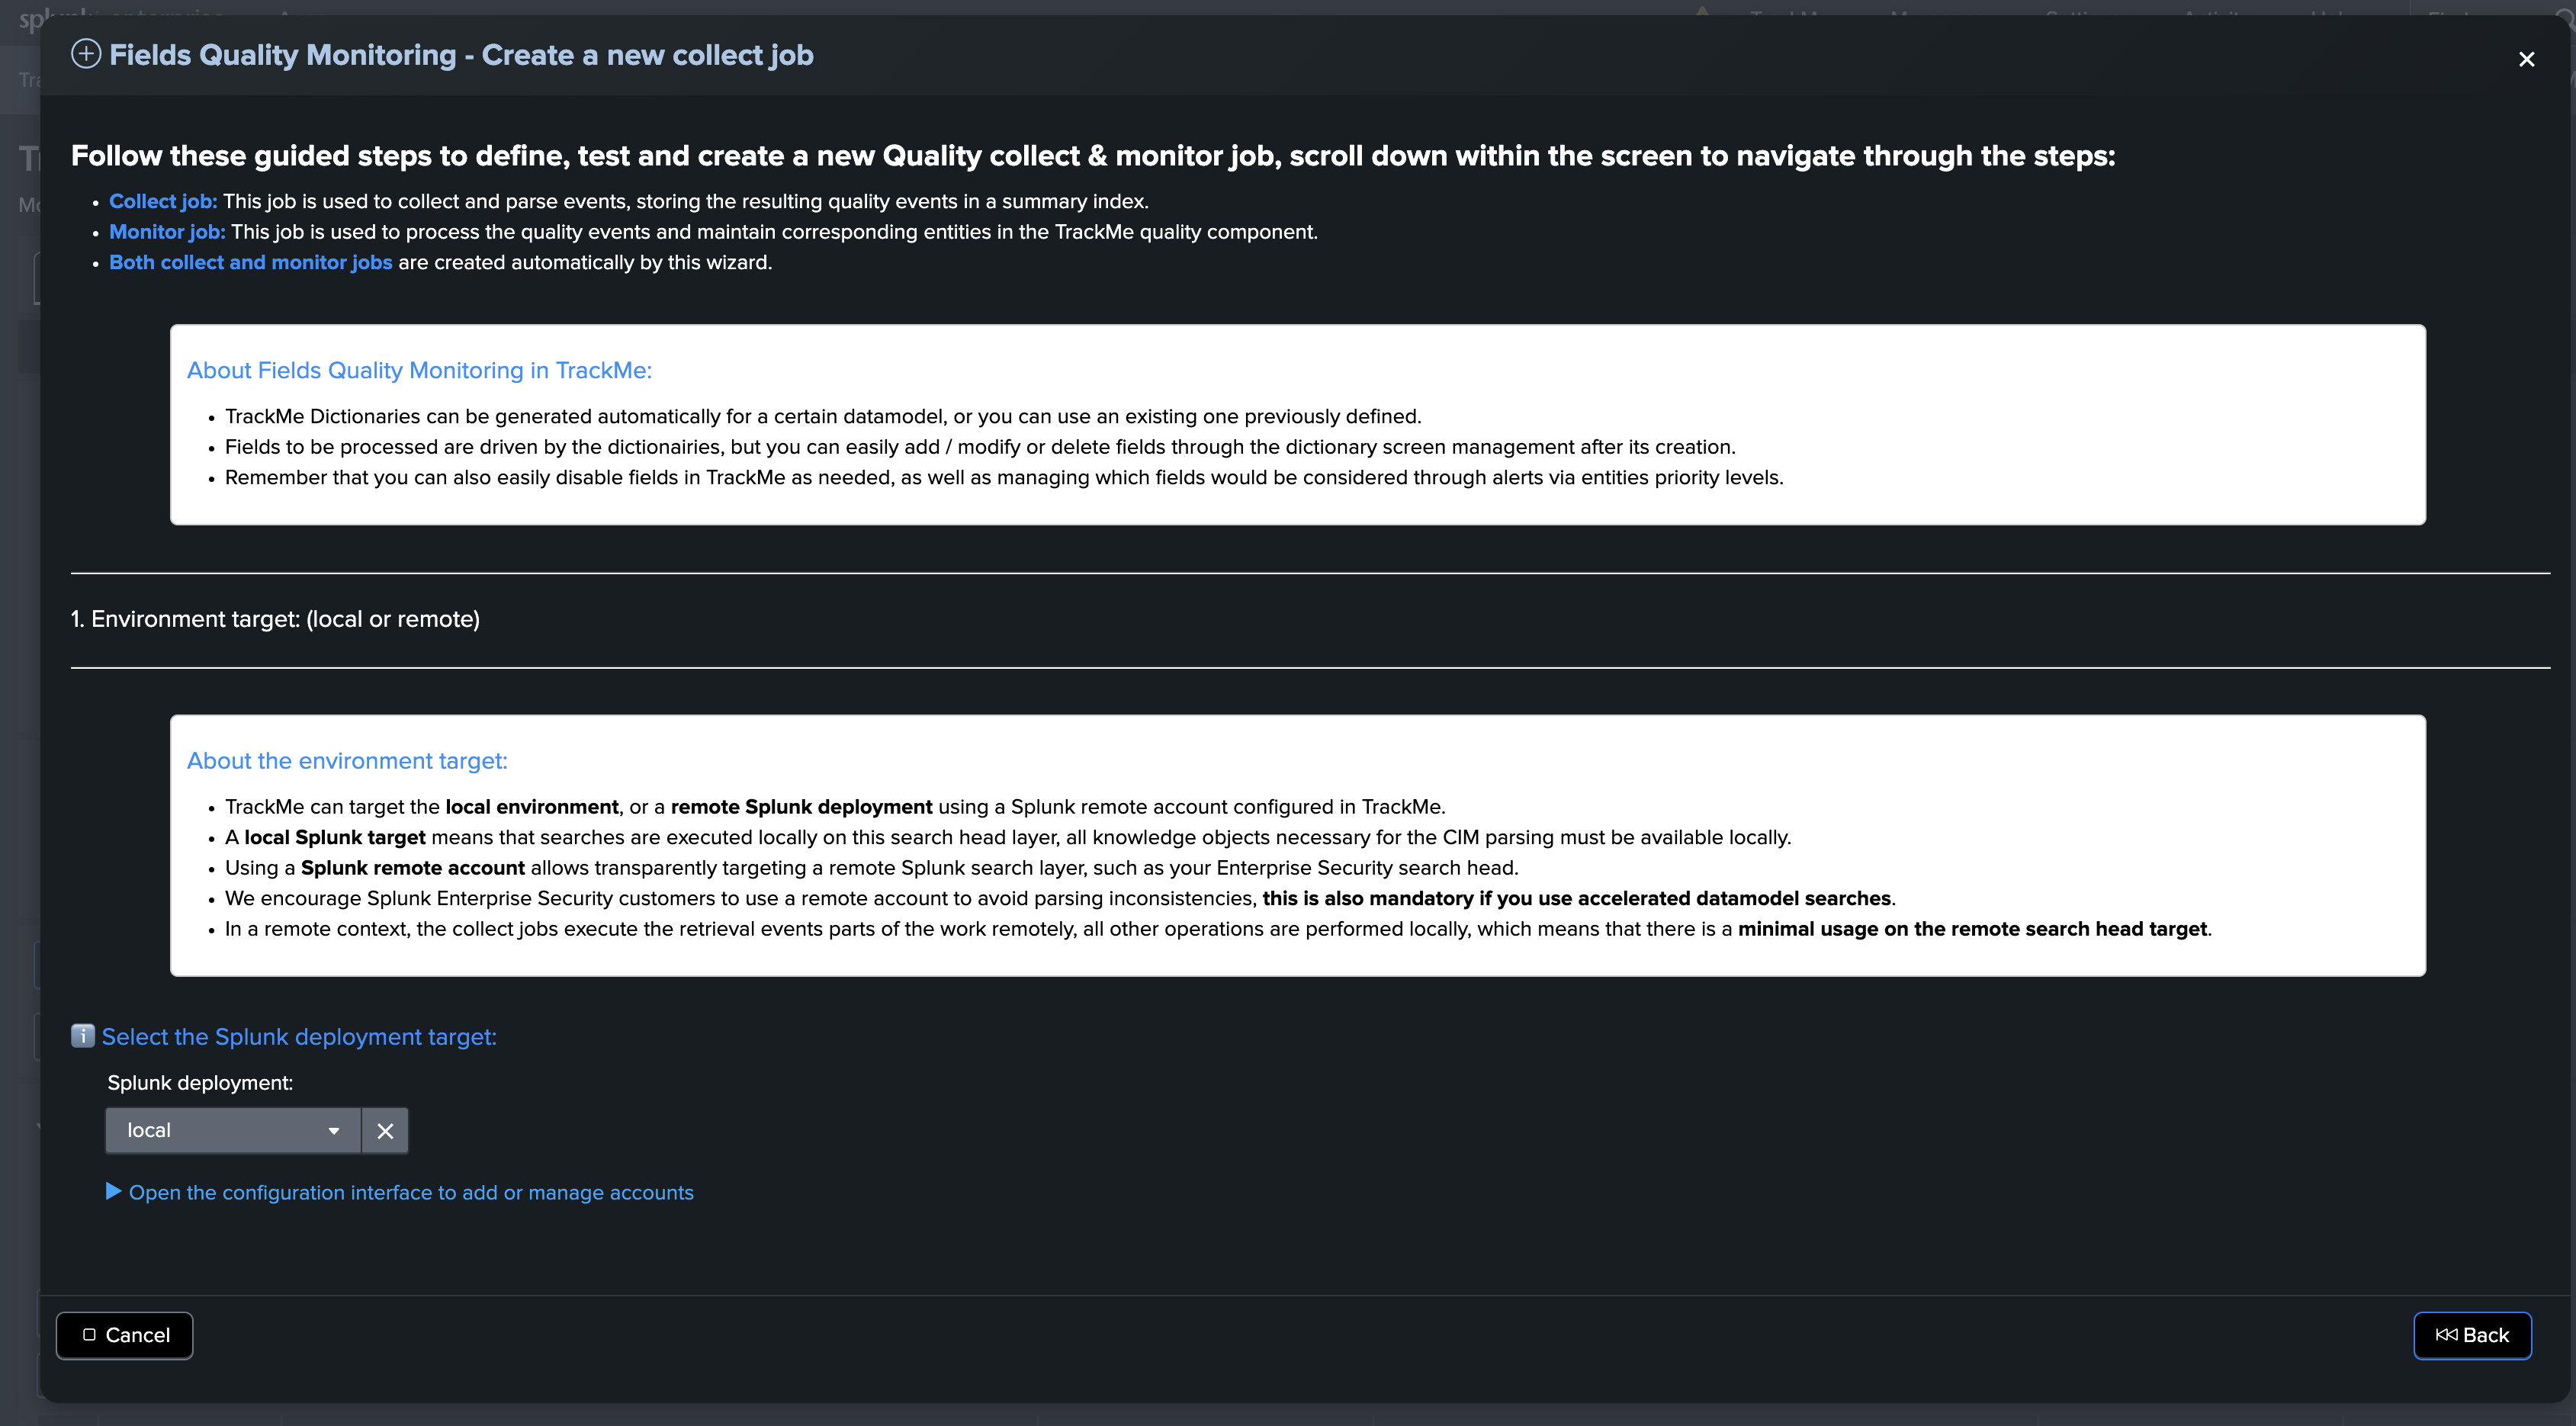
Environment target selection
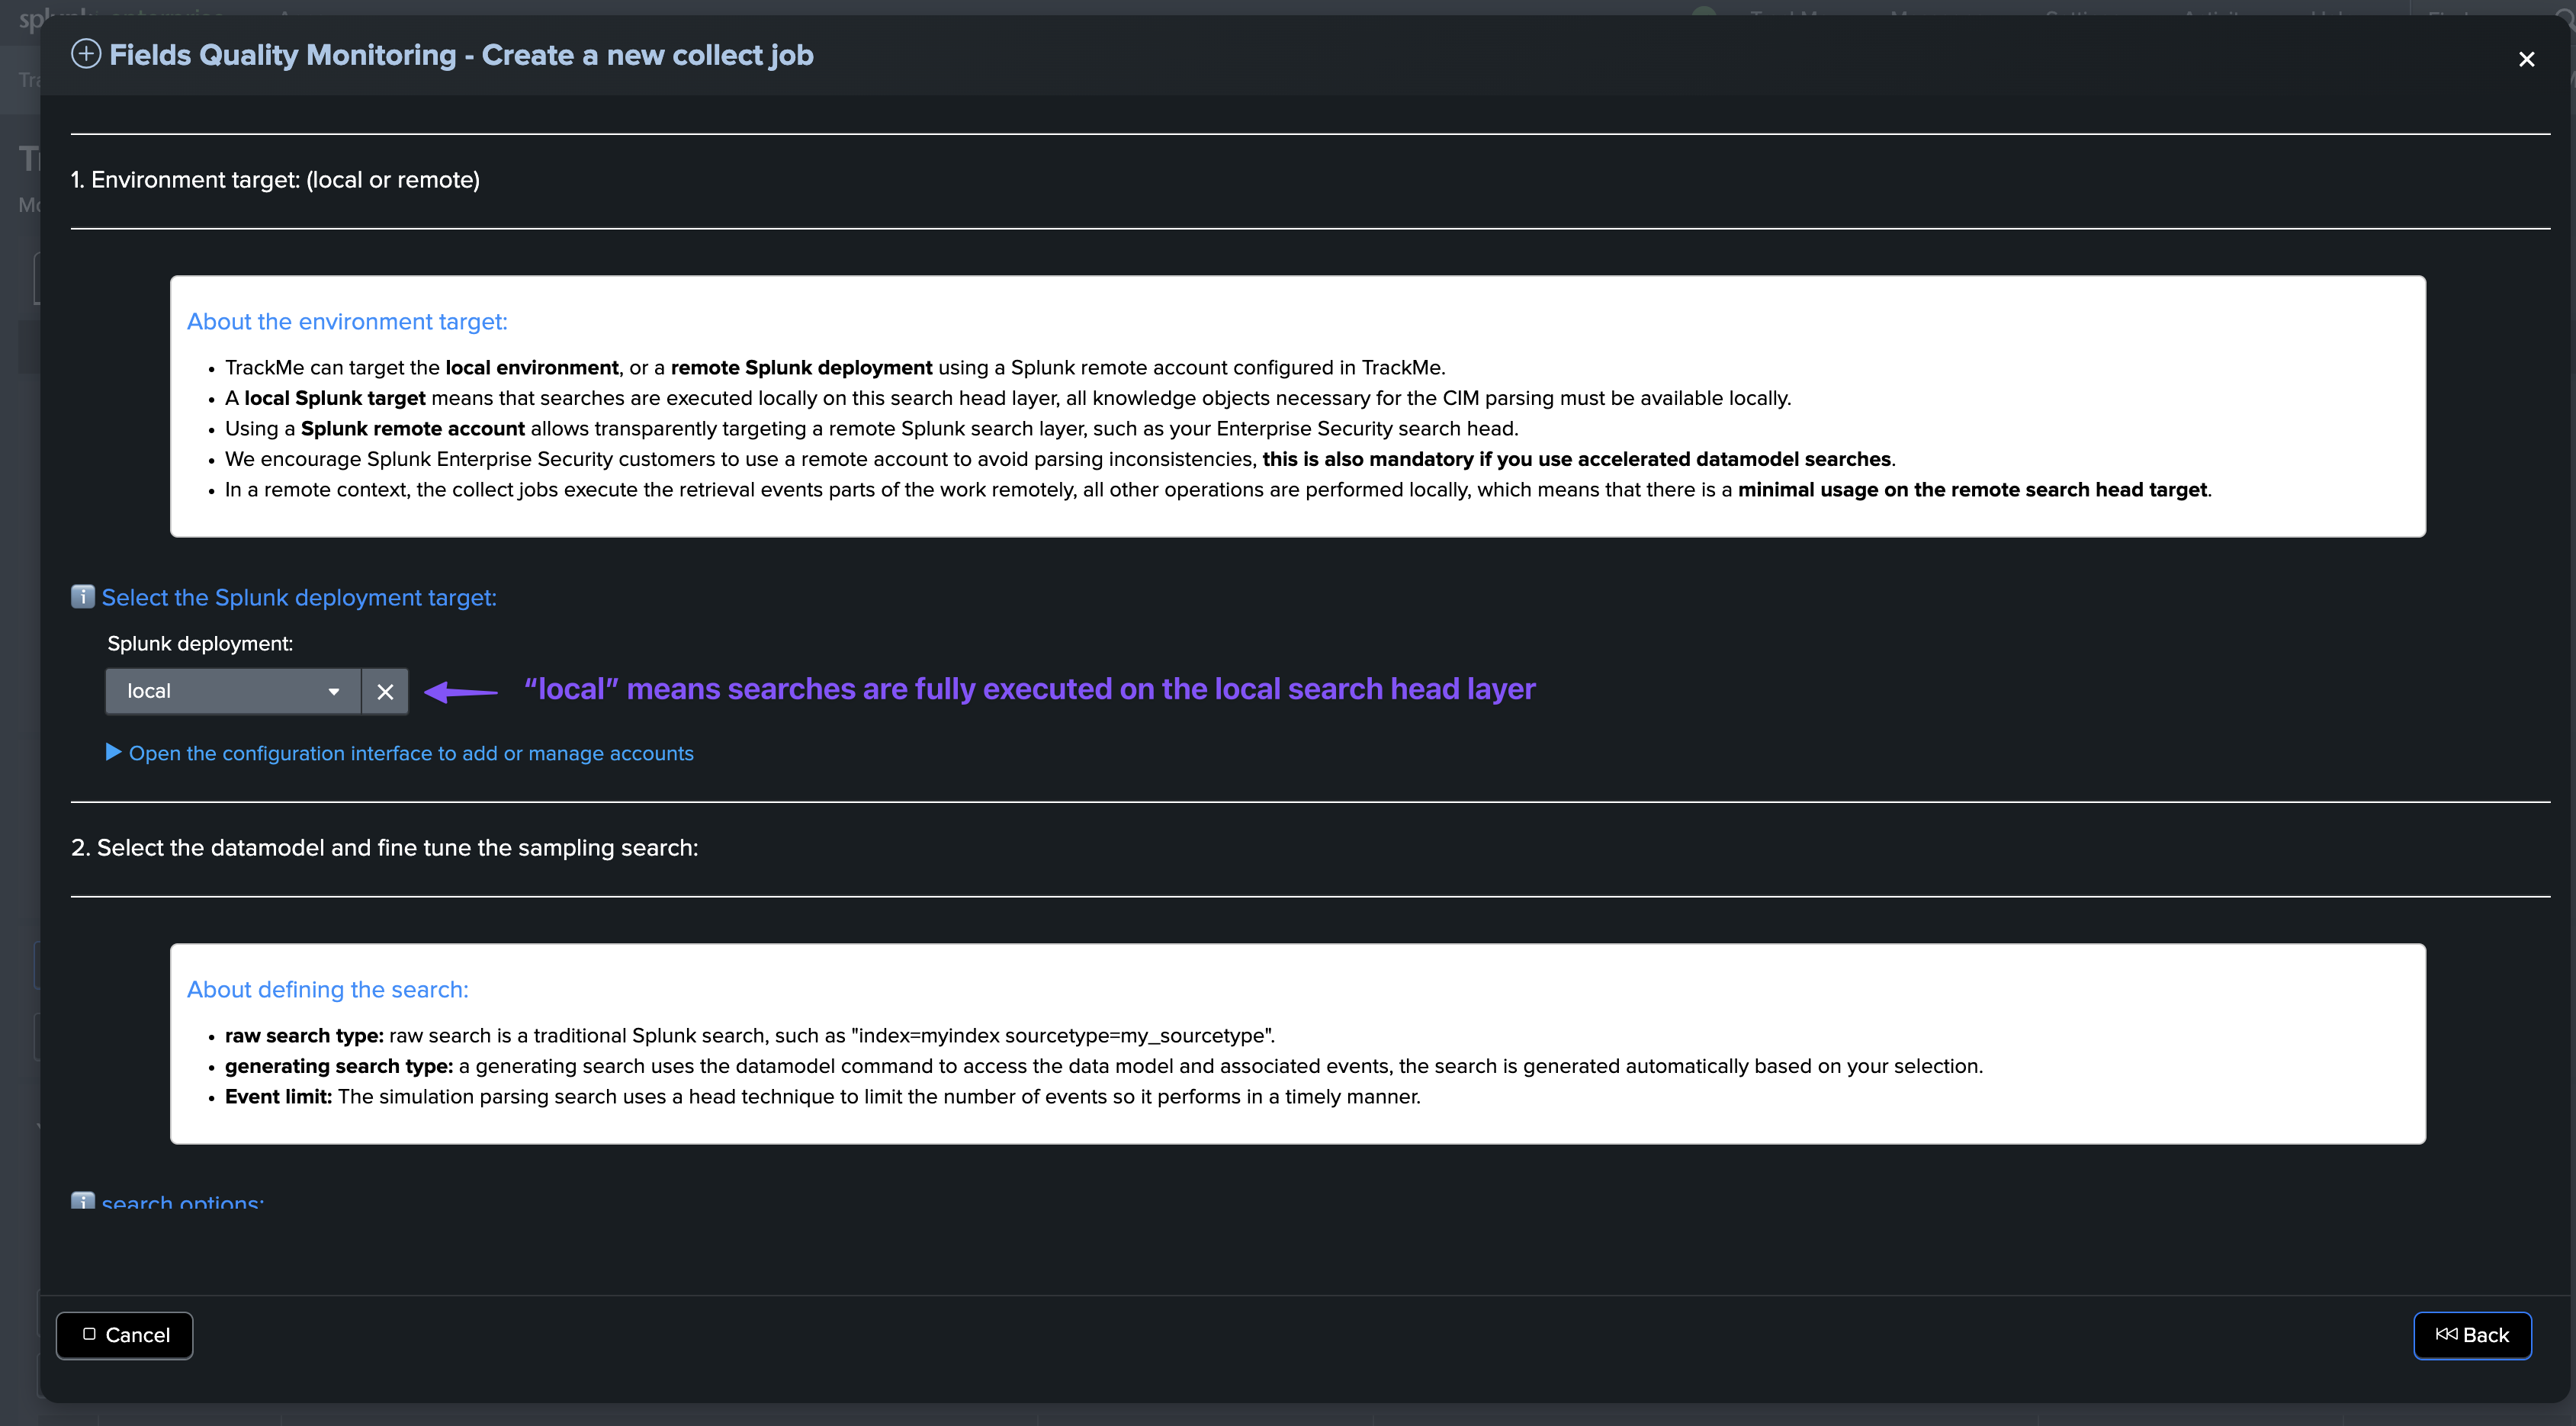
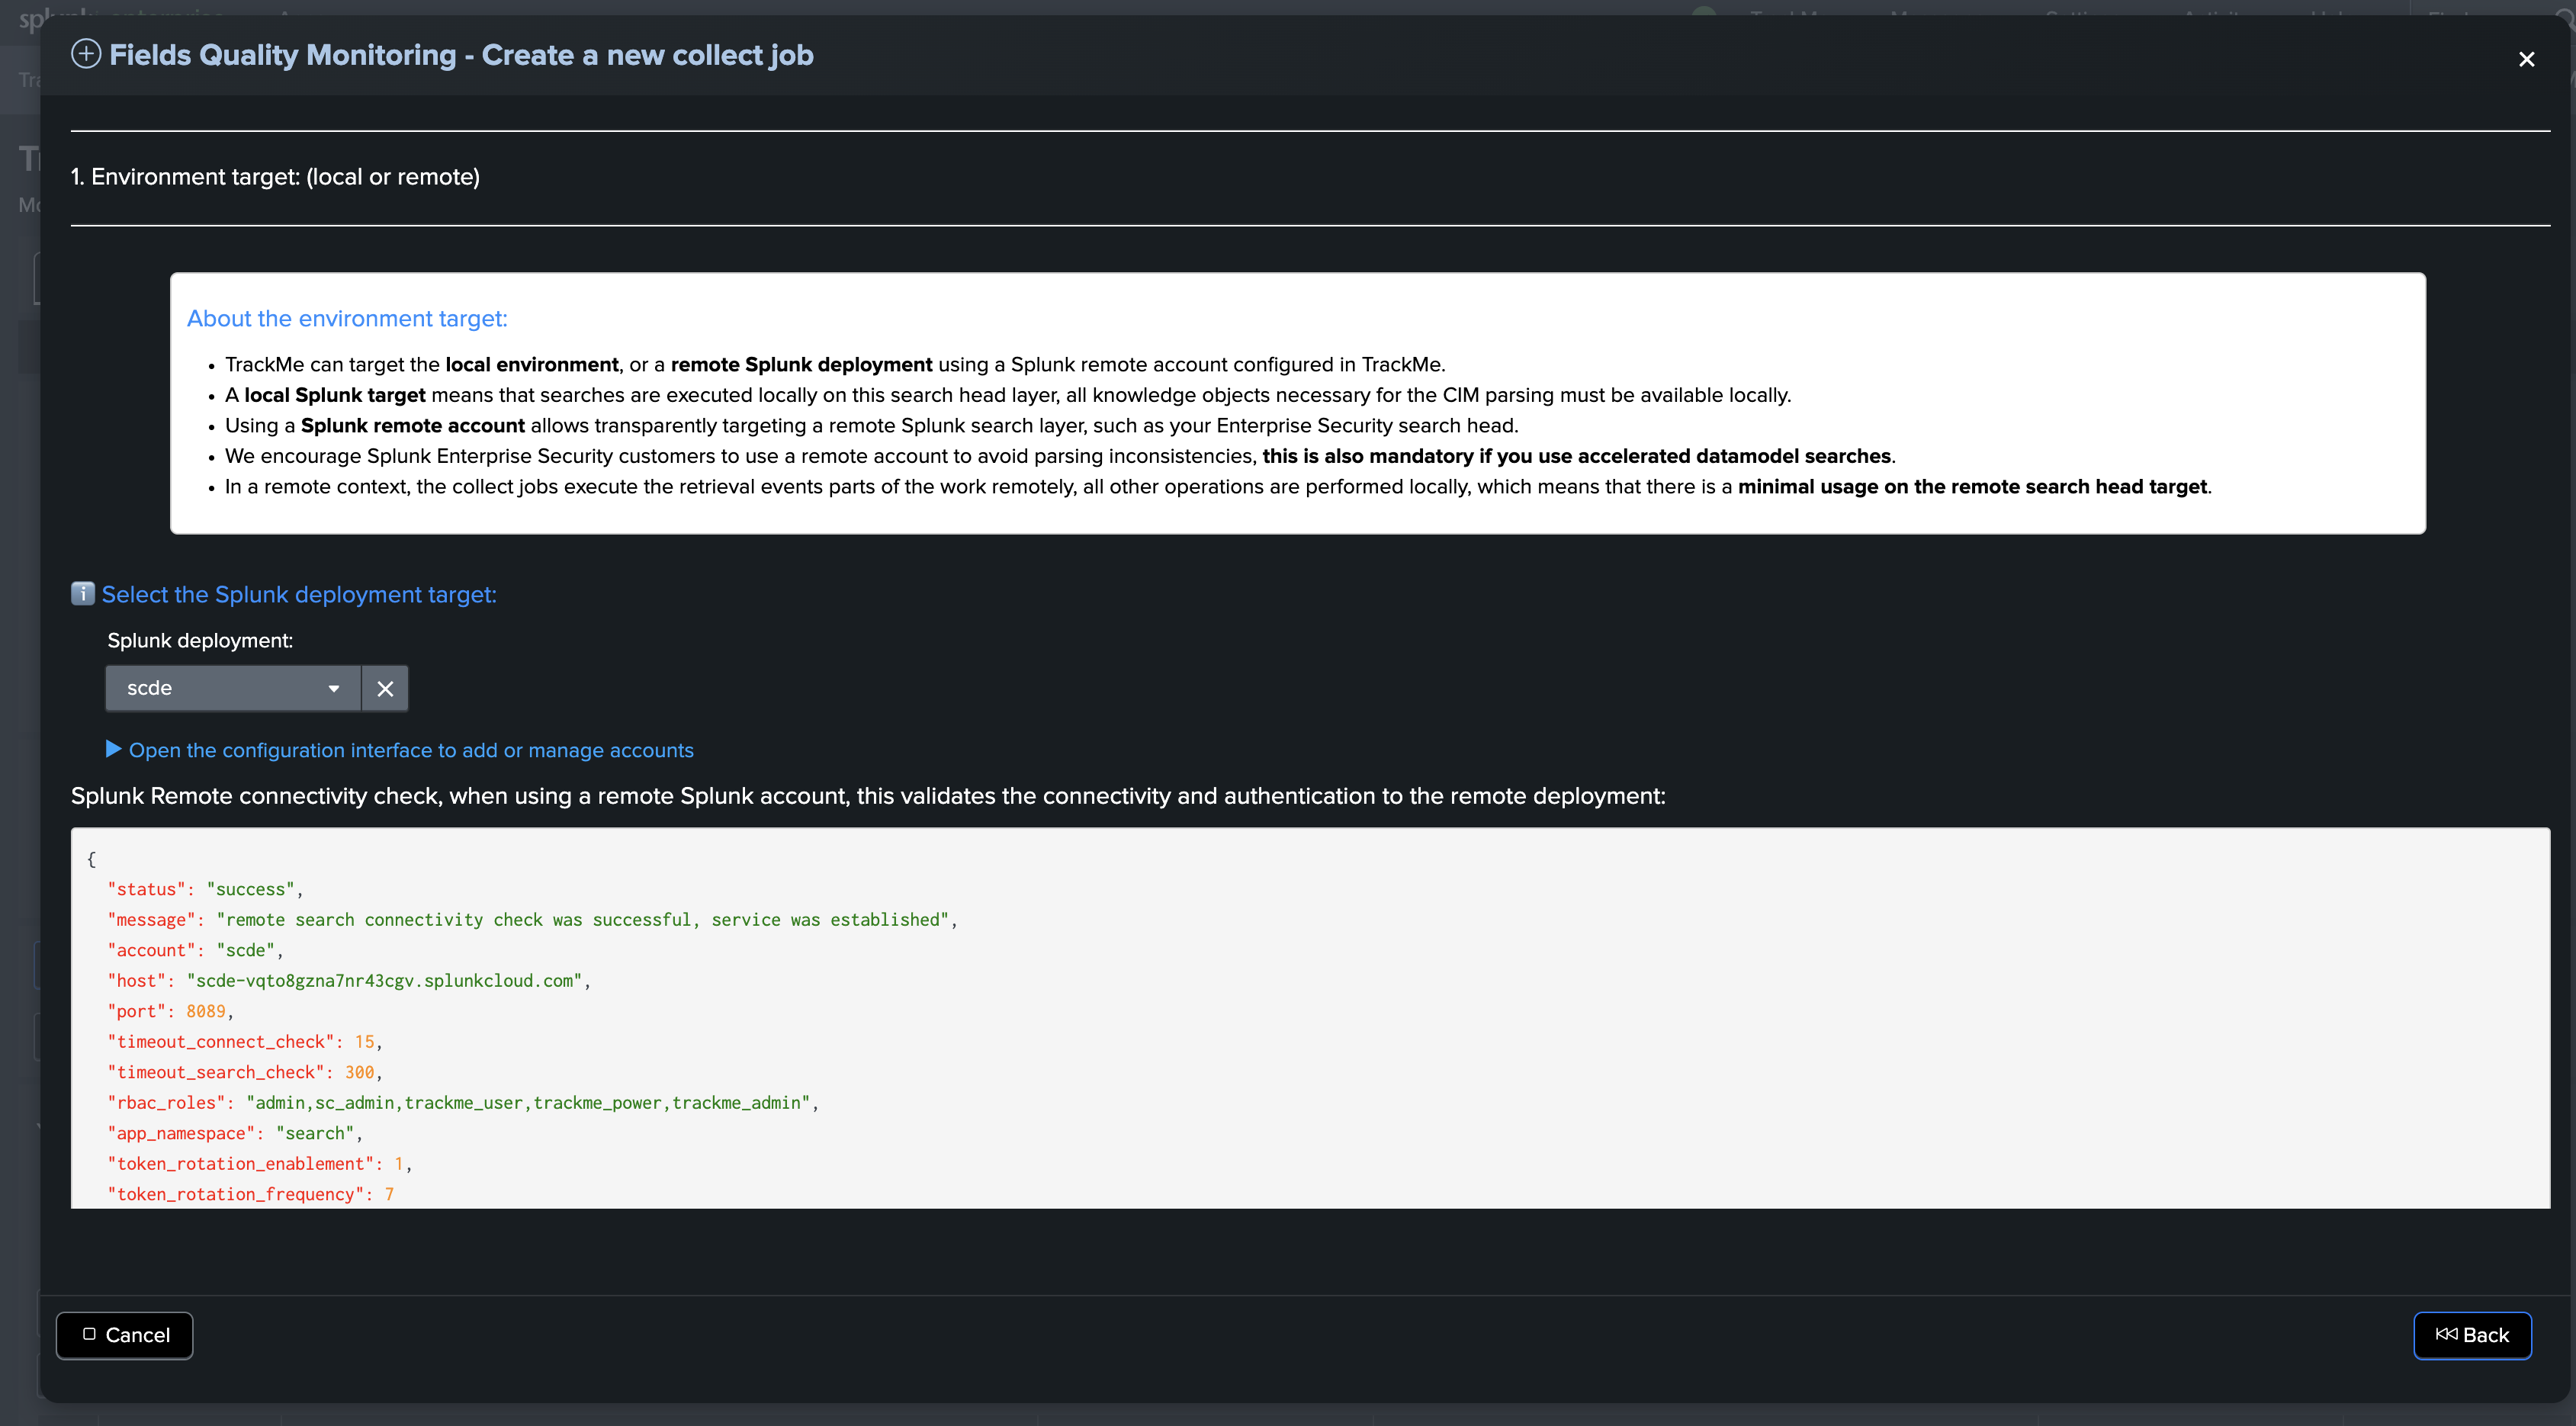
The first step is to select whether the environment target is the local search head or a remote search head:
Hint
About the environment target:
TrackMe can target the local environment, or a remote Splunk deployment using a Splunk remote account configured in TrackMe.
A local Splunk target means that searches are executed locally on this search head layer. All knowledge objects necessary for the CIM parsing must be available locally.
Using a Splunk remote account allows transparently targeting a remote Splunk search layer, such as your Enterprise Security search head.
We encourage Splunk Enterprise Security customers to use a remote account to avoid parsing inconsistencies. This is also mandatory if you use accelerated datamodel searches.
In a remote context, the collect jobs execute the retrieval events parts of the work remotely. All other operations are performed locally, which means there is minimal usage on the remote search head target.
Datamodel and root search definition
Hint
About CIM and non CIM data contexts:
The datamodel selection applies to CIM contexts only.
When creating a collect job for non CIM contexts, you simply need to define the root search constraint.
The next step is to define the type of the search to be executed, the datamodel selection and finally the root search constraints:
About defining the search:
Raw search type: A raw search is a traditional Splunk search, such as “index=myindex sourcetype=my_sourcetype”.
Generating search type: A generating search uses the datamodel command to access the data model and associated events. The search is generated automatically based on your selection.
Event limit: The simulation parsing search uses a head technique to limit the number of events so it performs in a timely manner.
Hint
About your design strategy:
The best strategy is the one that matches your preferences, custom context and objectives.
A single collect job can technically handle multiple indexes, sourcetypes, and so forth, BUT it is tied to a specific datamodel and data dictionary.
Therefore, at minimum you want to segregate your collect jobs per datamodel and sourcetype. (or context feeds, for instance one collect job for WinEvent logs, one for Linux secure logs, etc.)
To ensure a good level of sampling, you can also be as granular as needed, for instance one collect job per datamodel/index/sourcetype. (or context feed)
Hint
About search performance, costs, raw versus generating searches:
Overall, the collect jobs are very efficient and inexpensive.
TrackMe implements two techniques: the
headtechnique and thesamplingtechnique to produce fast and performant collect phase searches.The monitor phase is dependent on the associated collect job events produced and is also very efficient.
Note that when selecting a generating search, TrackMe generates the base root search automatically, according to the selected datamodel.
Finally, generating searches are direct consumers of the datamodel and therefore more restricted in context, while raw searches offer all levels of flexibility in terms of filters.
Examples of both approaches:
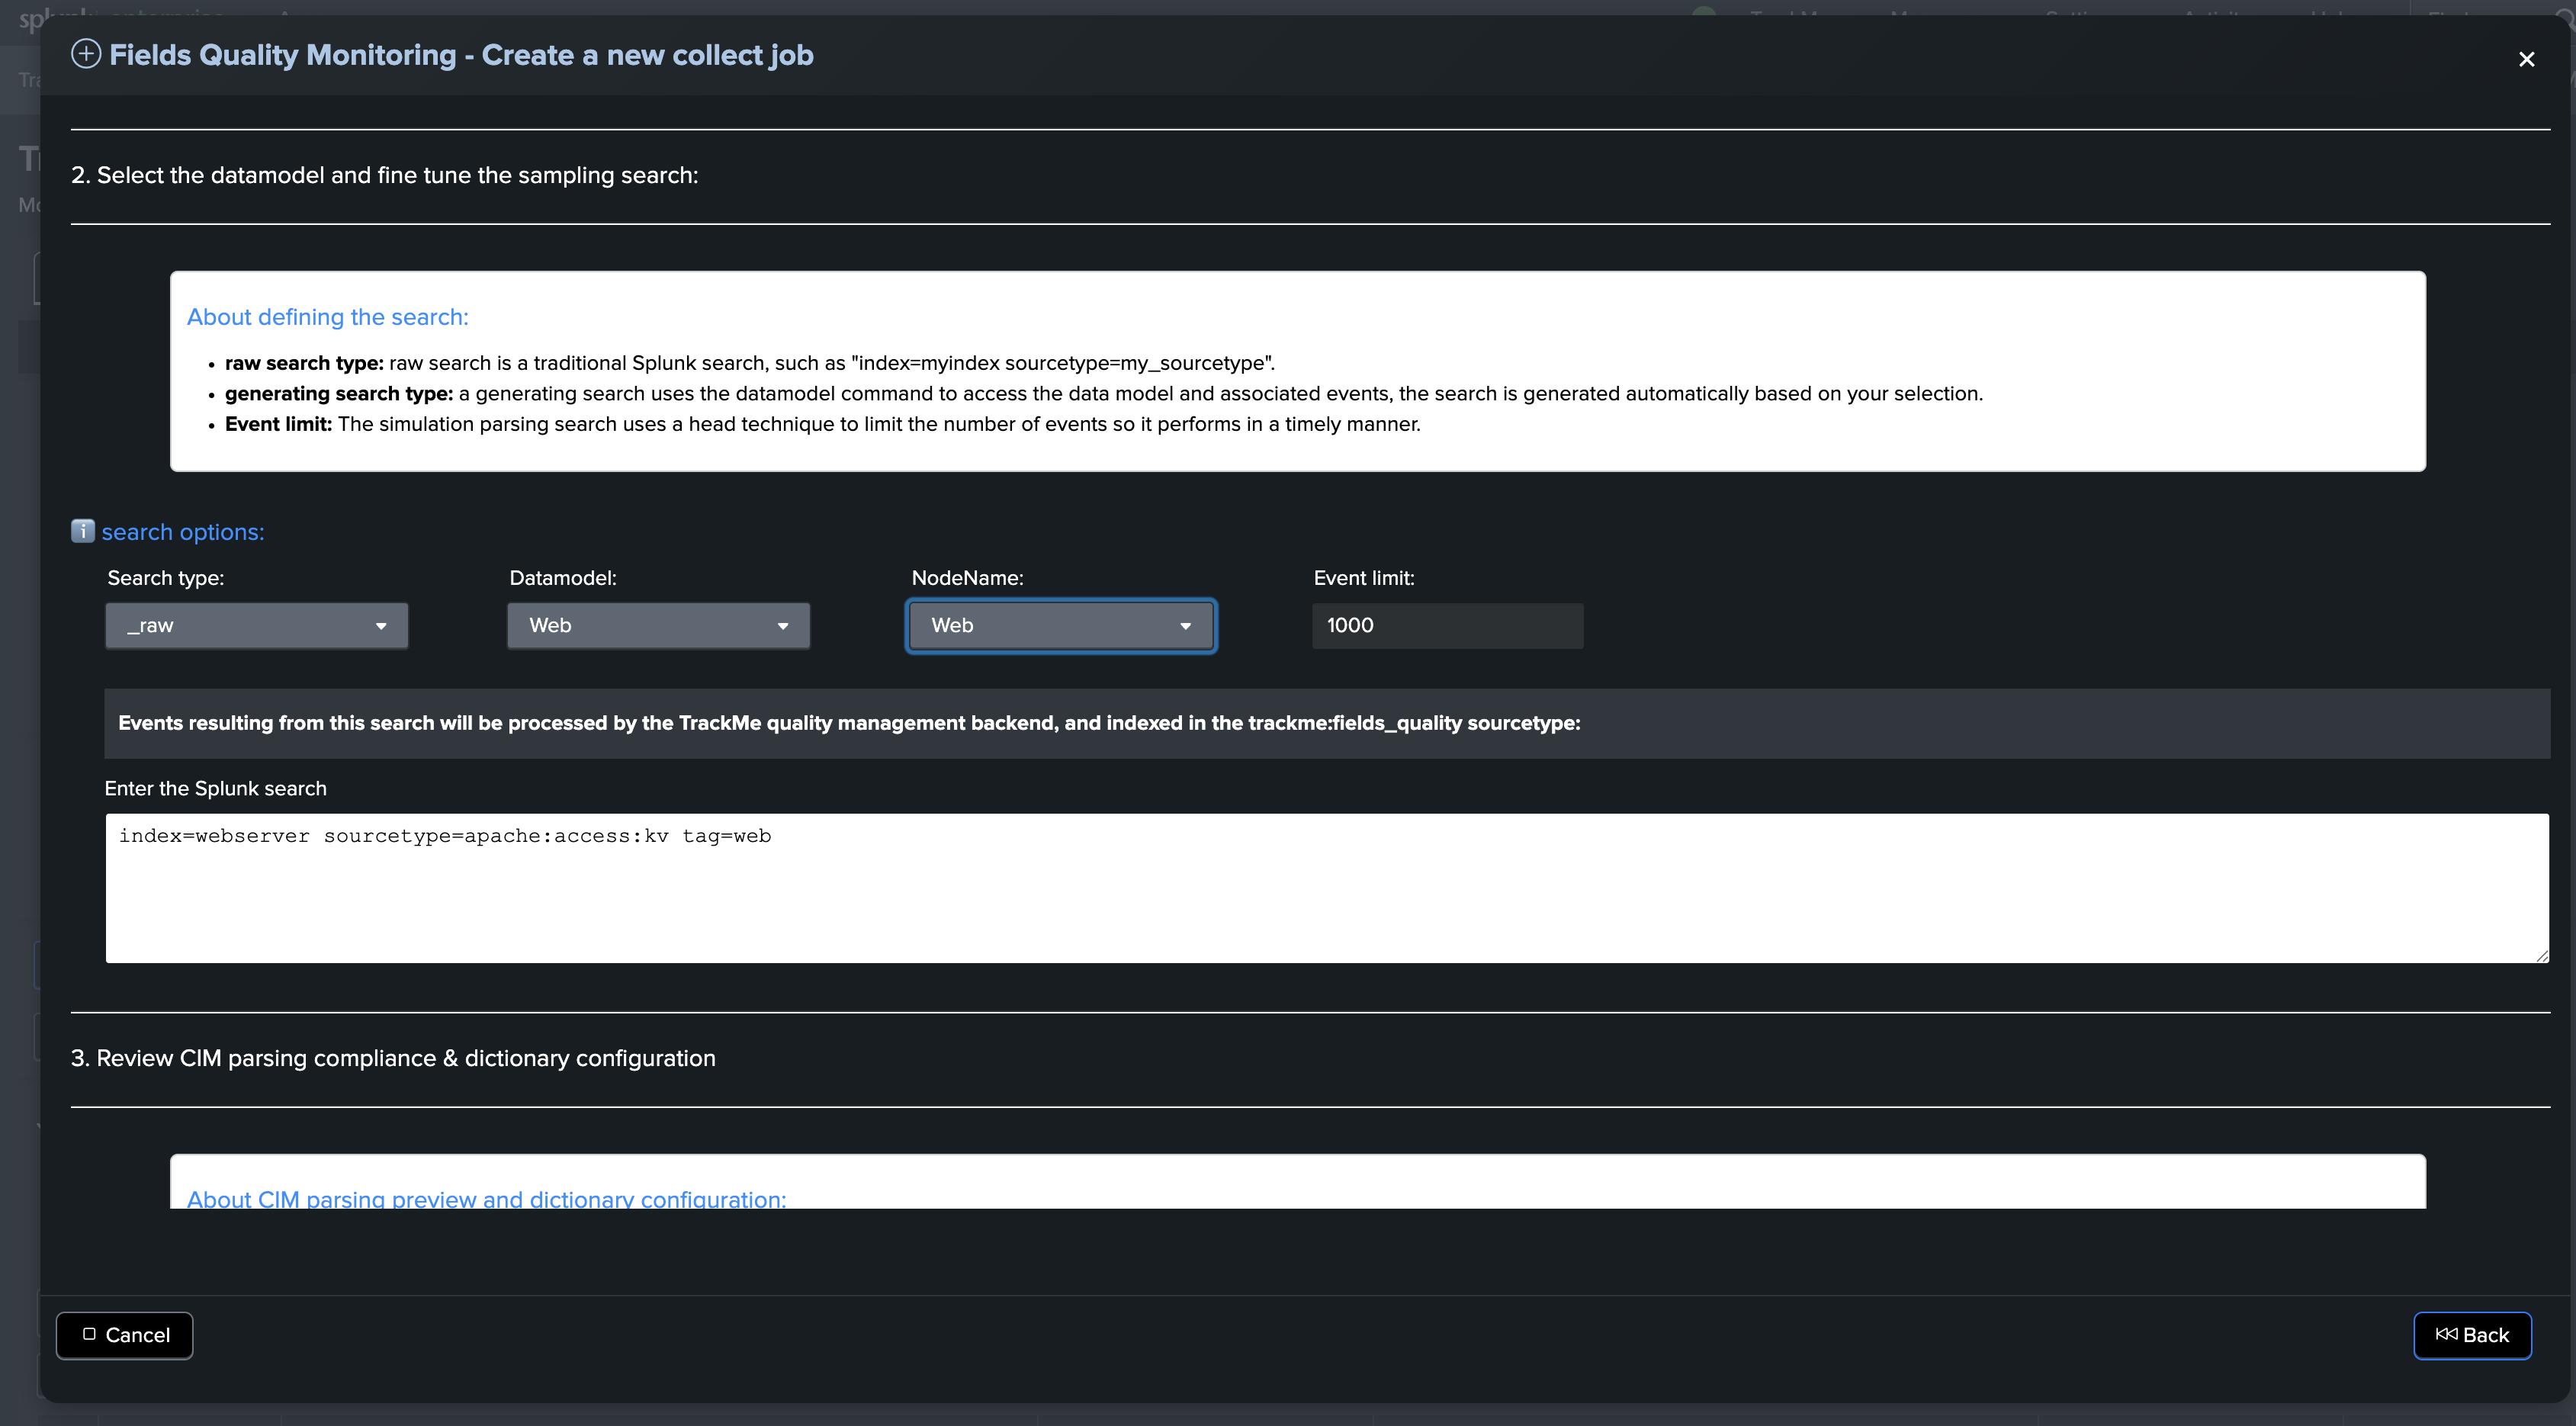
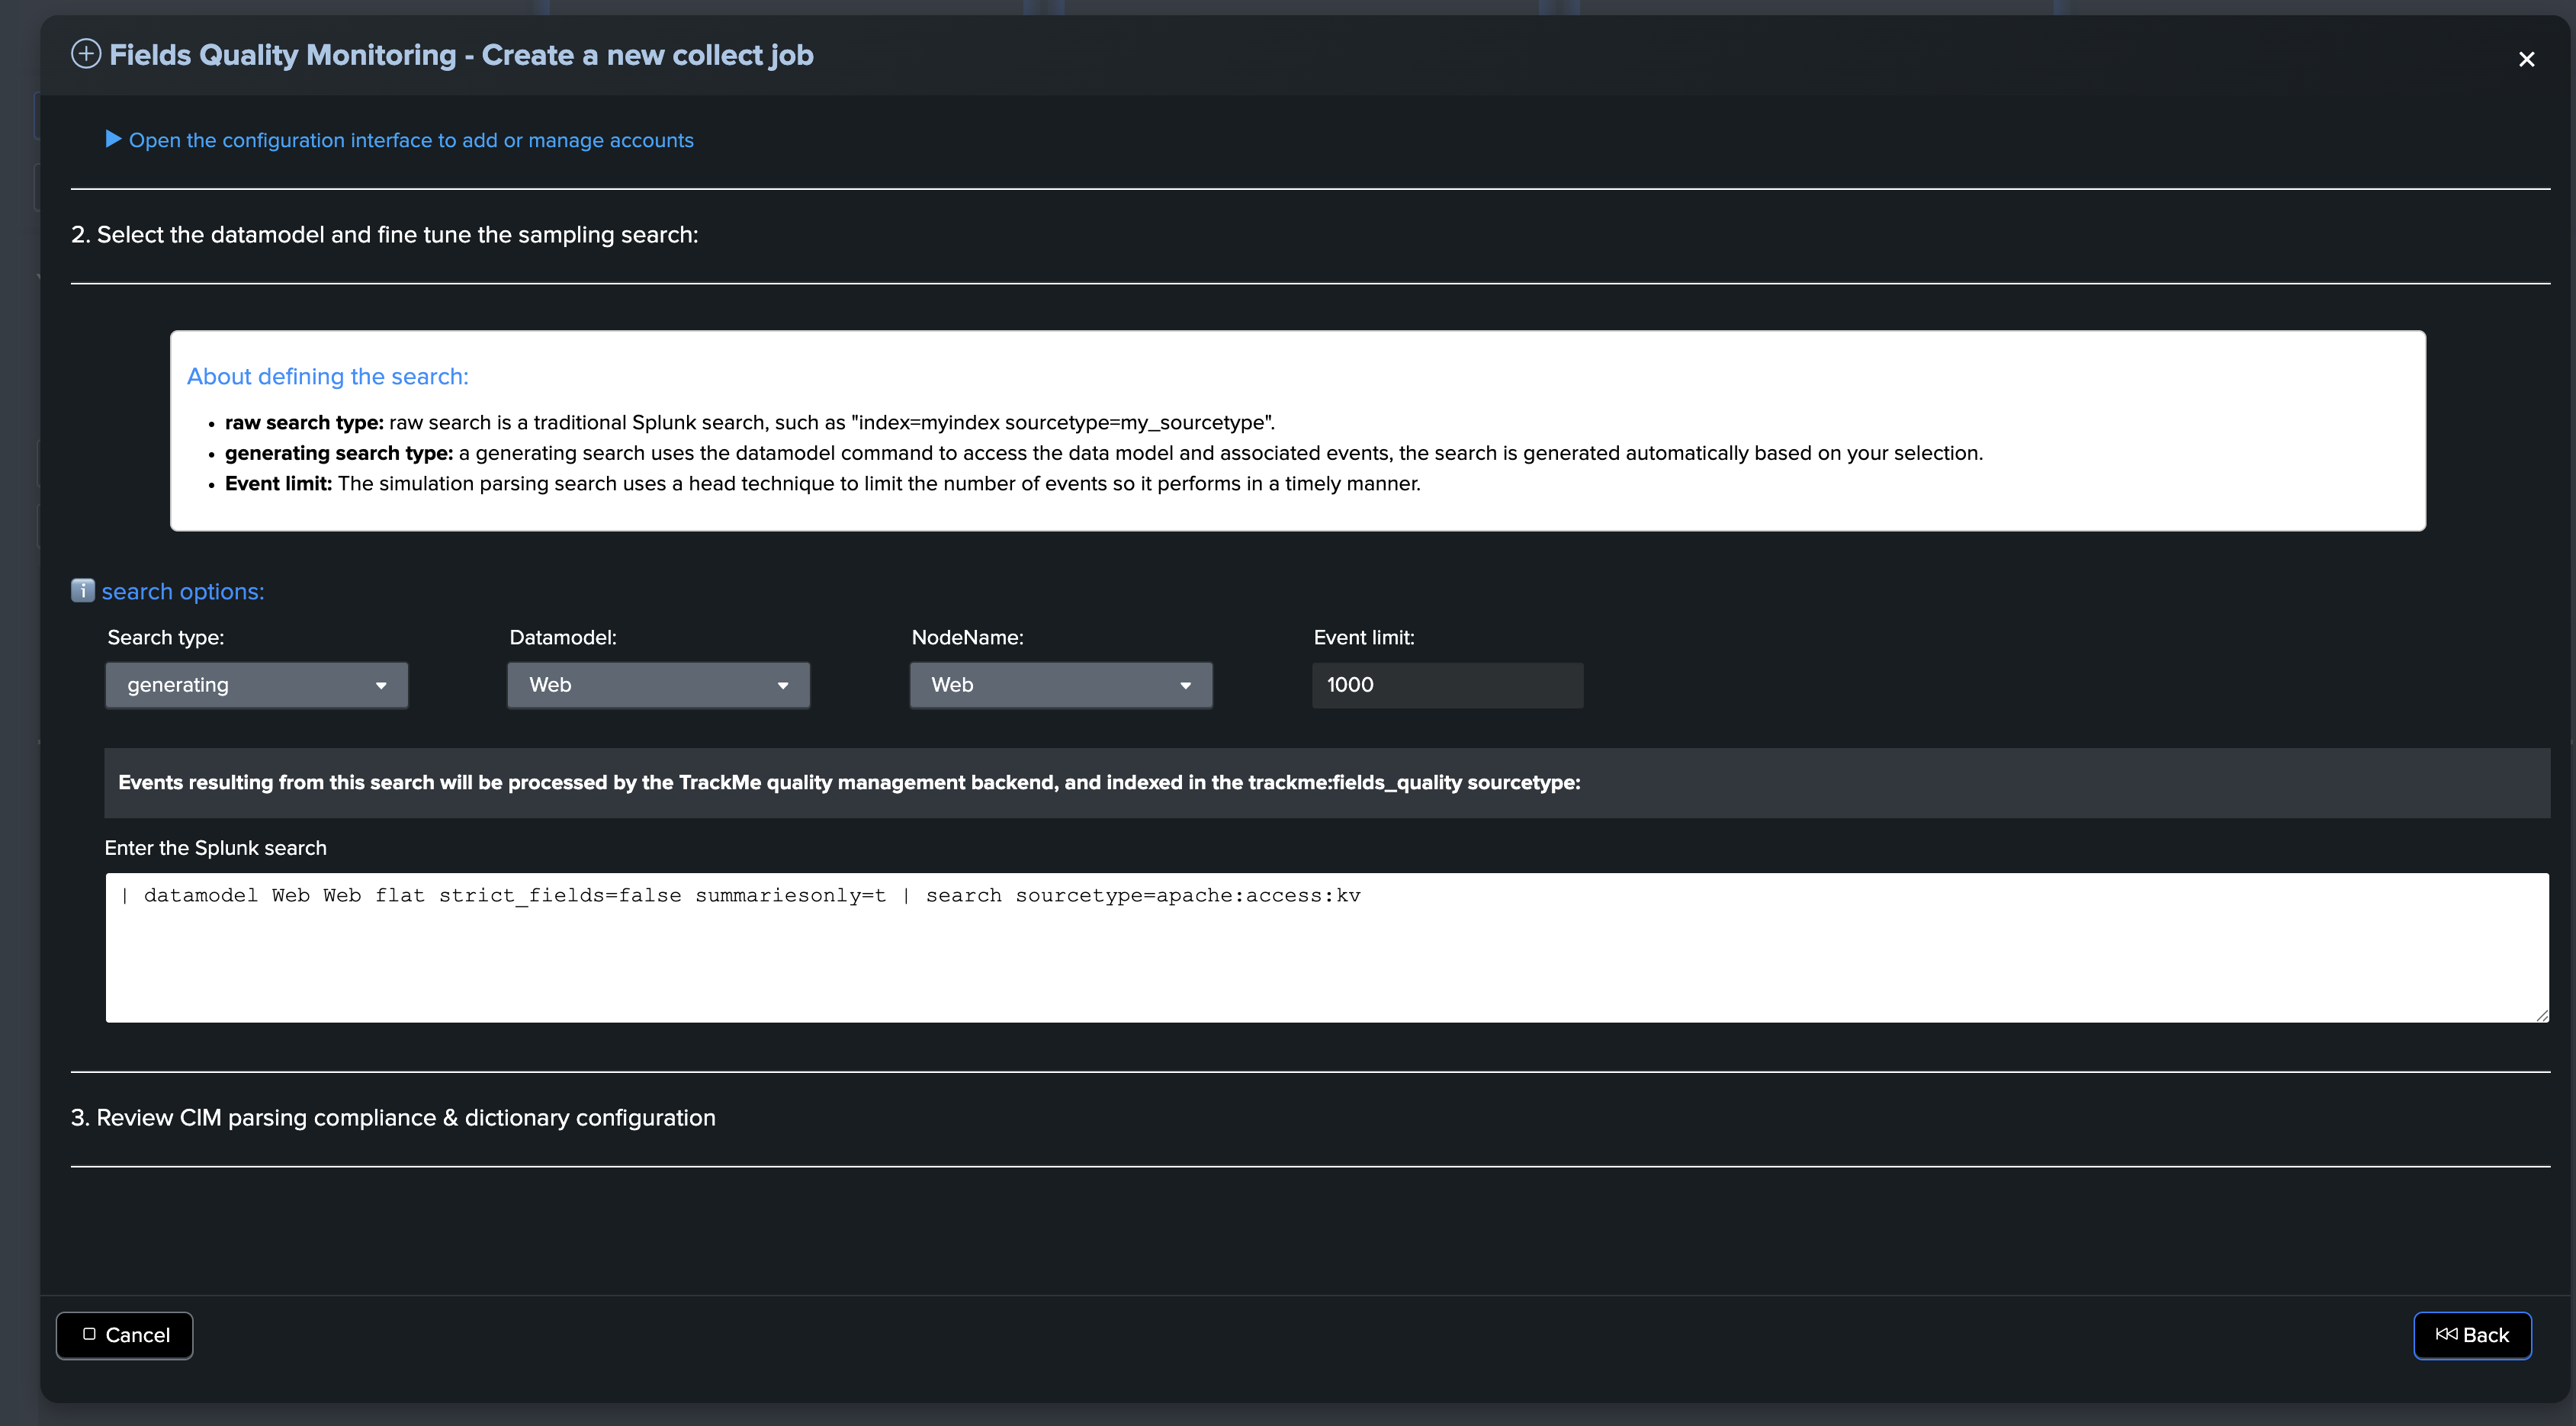
Example of a raw search definition targeting the Web datamodel context:
index=webserver sourcetype=apache:access:kv tag=web
Example of a generating search definition targeting the Web datamodel context:
| datamodel Web Web flat strict_fields=false summariesonly=t | search sourcetype=apache:access:kv
We generally recommend having at minimum one collect job per datamodel/sourcetype.
Data dictionary generation or selection (for CIM context)
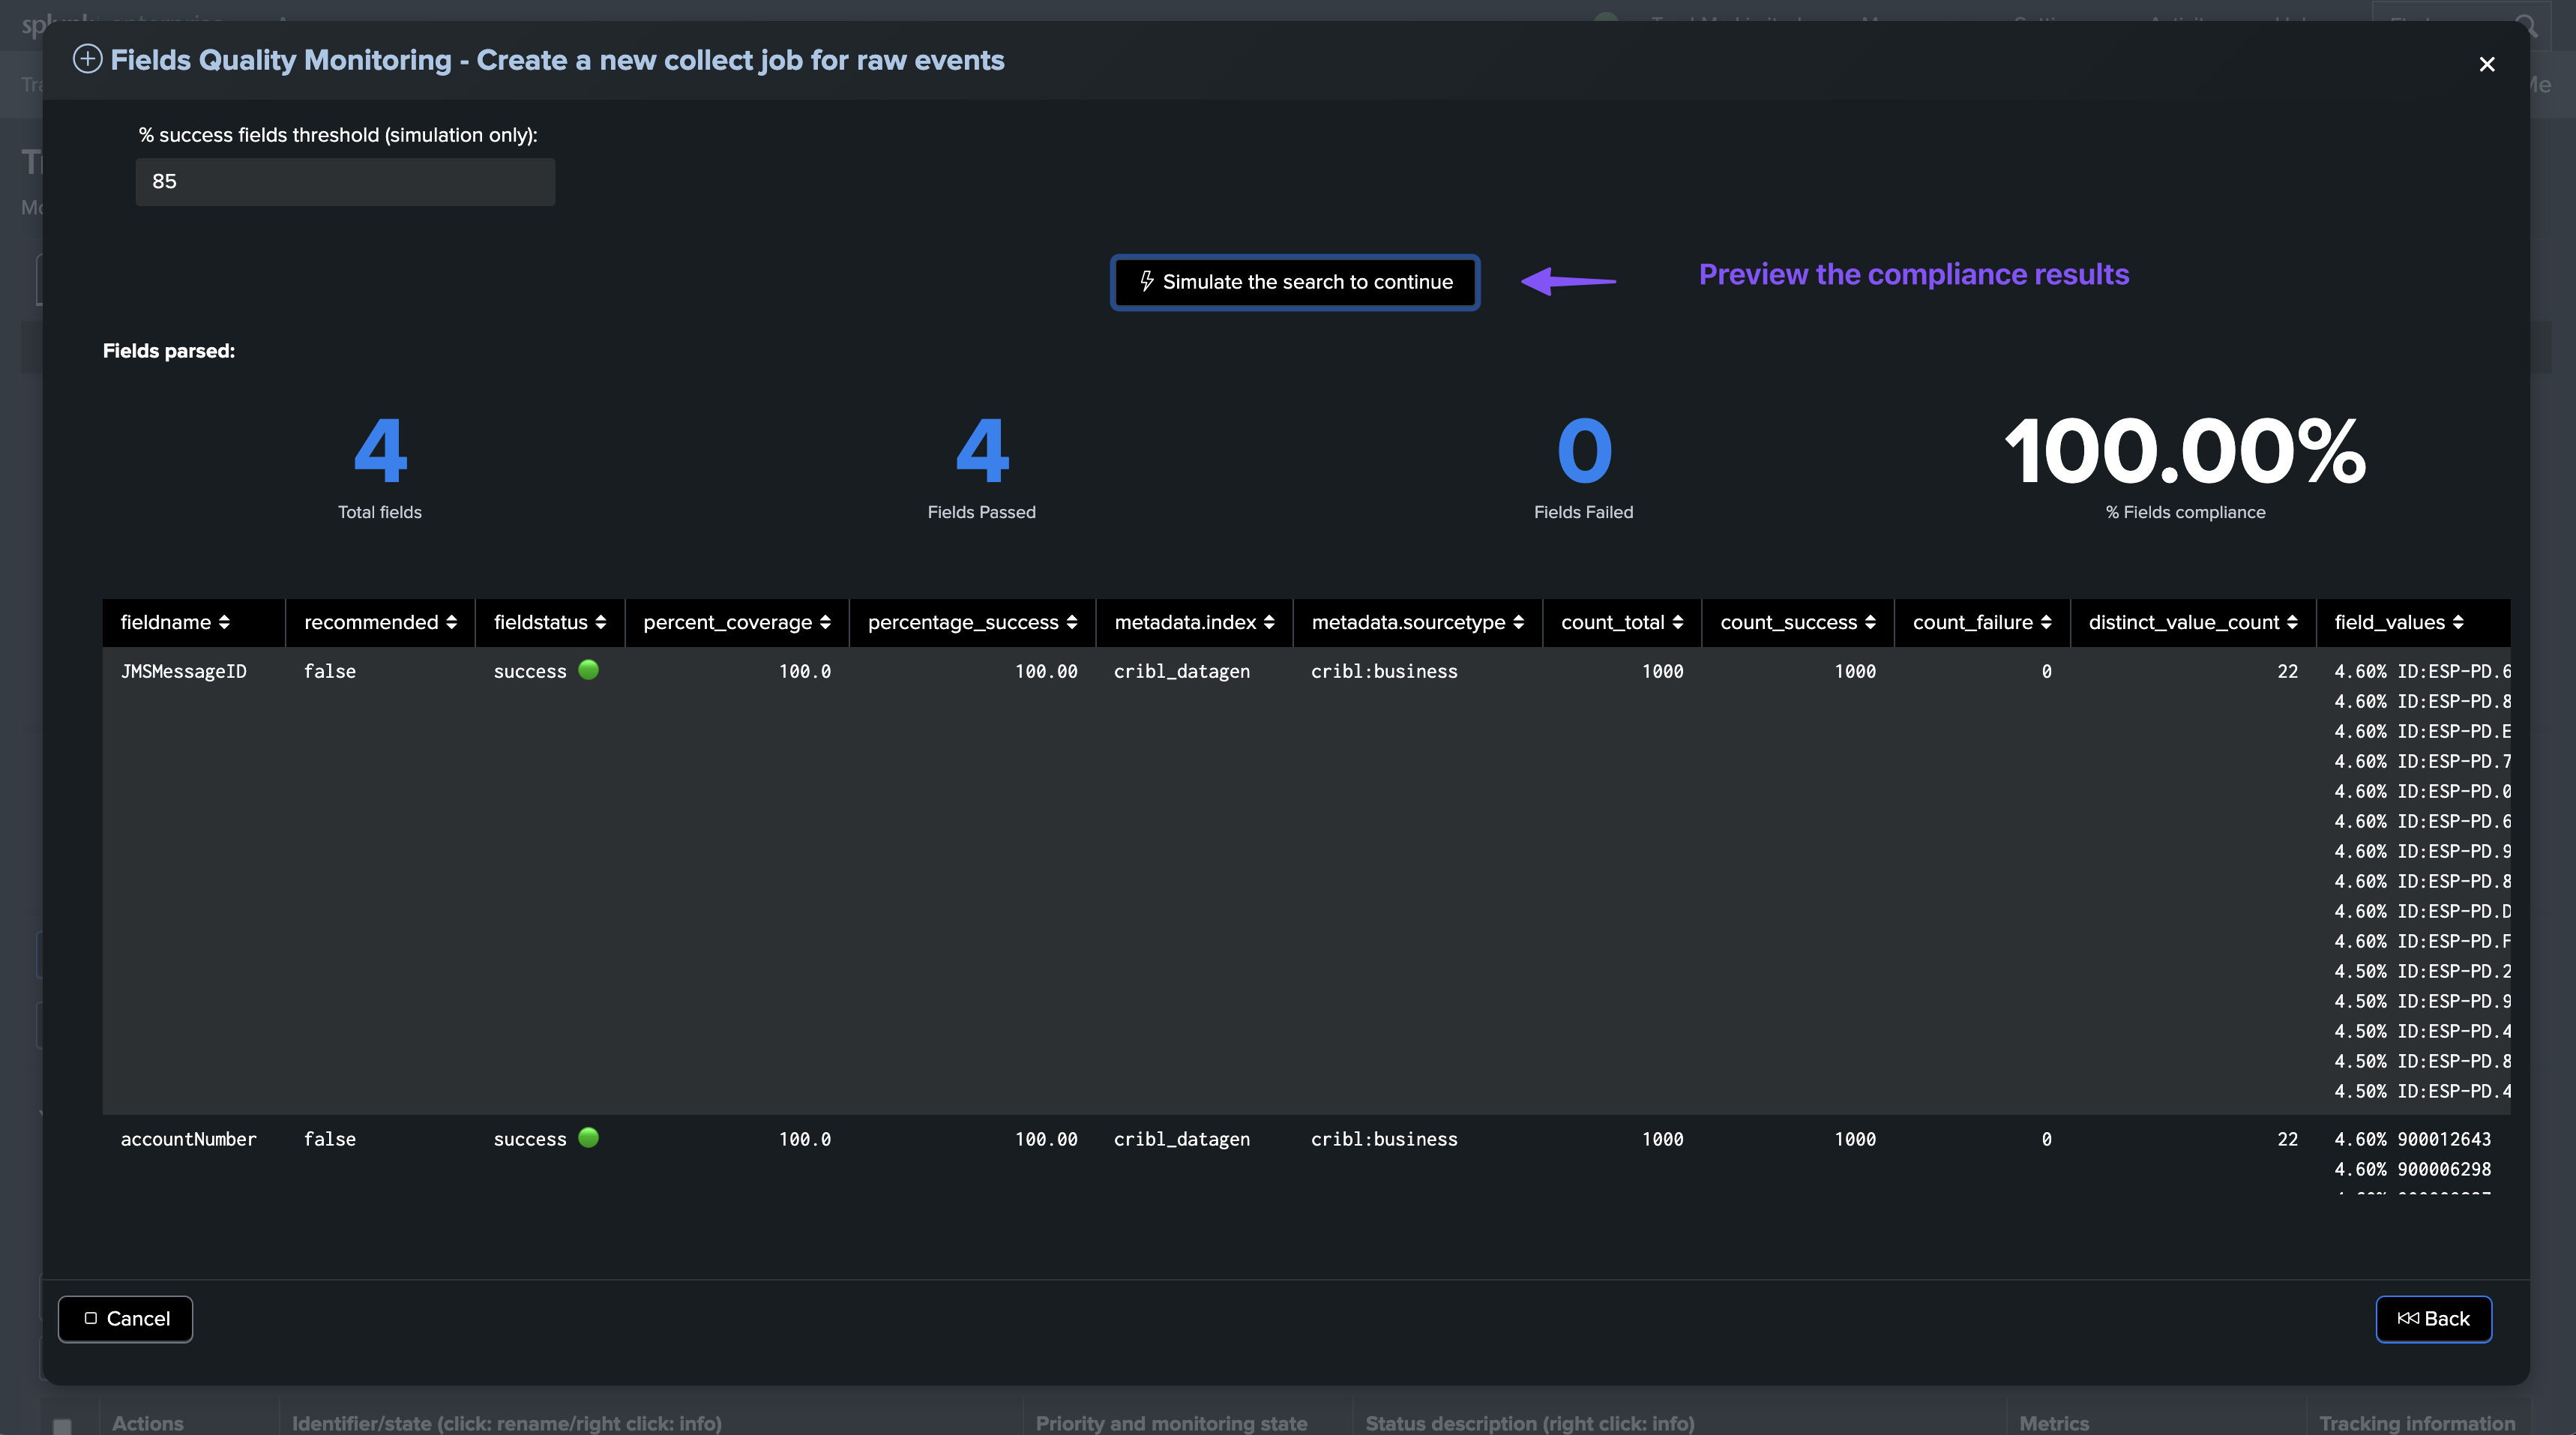
About CIM parsing preview and dictionary configuration:
This step allows you to preview the CIM compliance results, as well as define the dictionary configuration.
TrackMe can generate a new dictionary for you, targeting only recommended fields or all fields.
You can also select a dictionary that was previously created. Dictionaries can be shared between collect jobs.
You can adjust the simulation default fields threshold for the minimal percentage of success for the field to be considered as passed.
The final threshold value is then set automatically per field and can be updated through the entity threshold configuration screen.
Remember that you can easily adjust the dictionary through the dictionaries management screen after its creation.
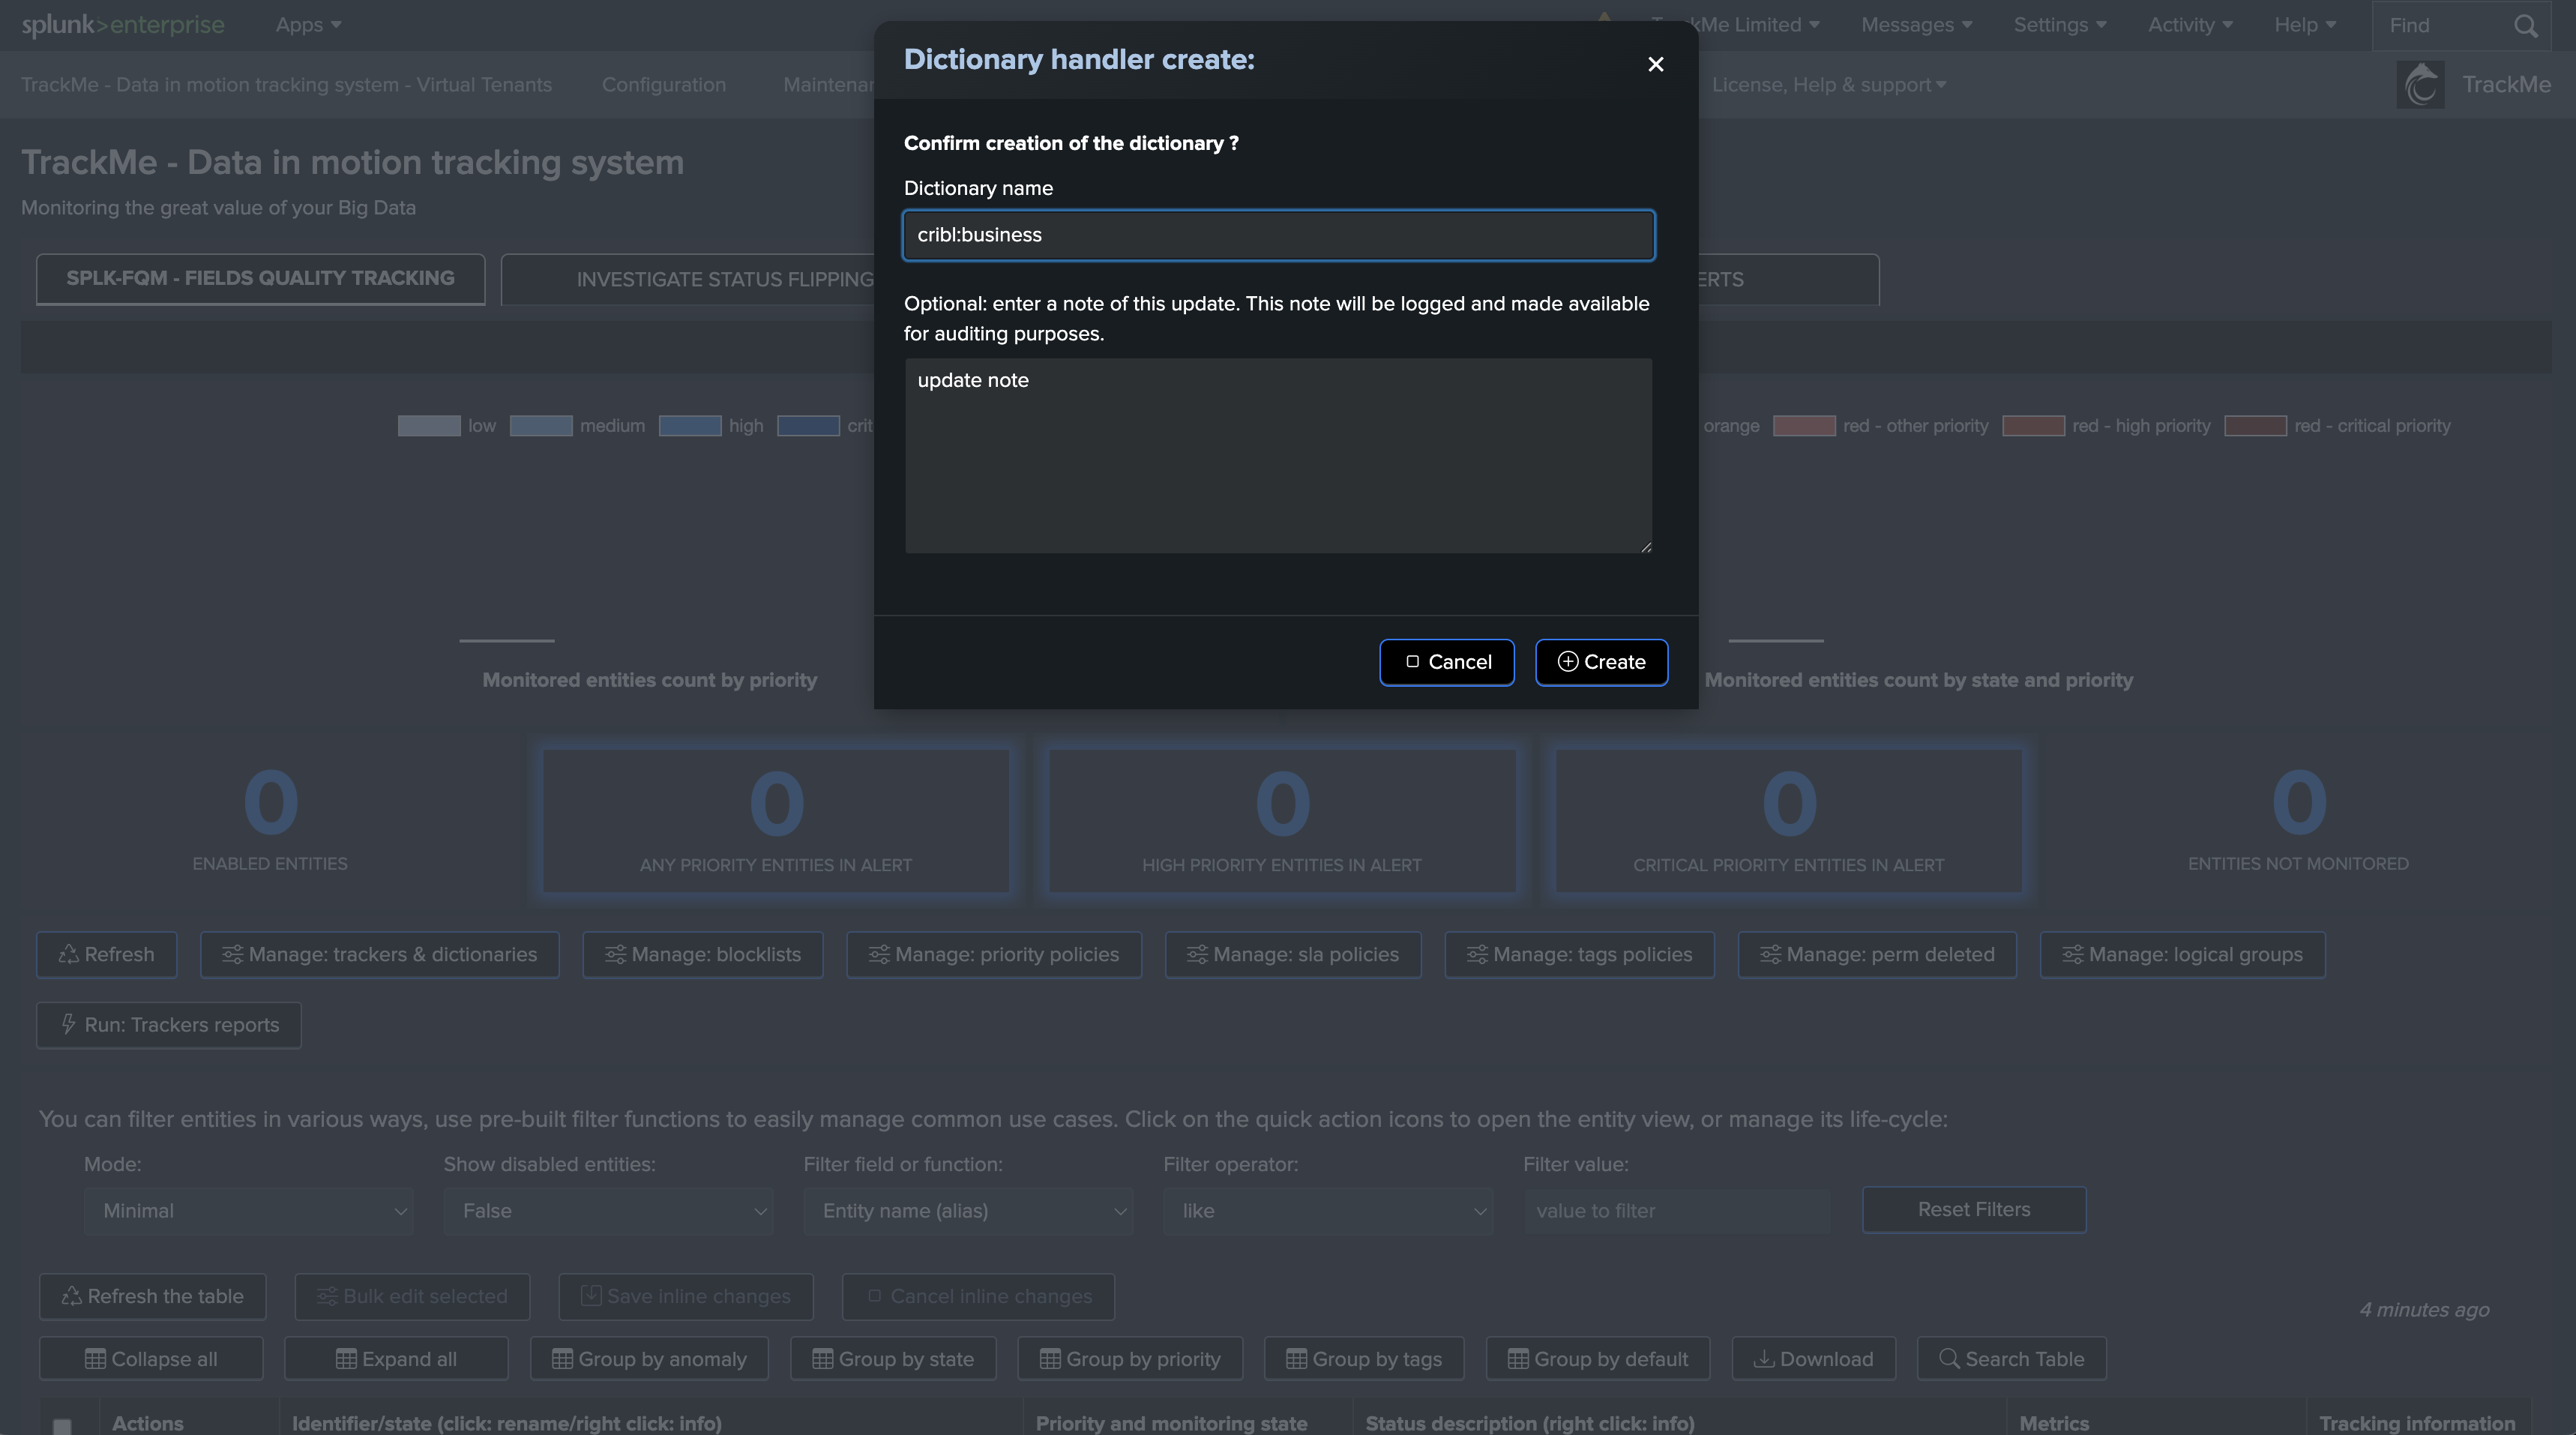
Hint
Naming the data dictionary:
The data dictionary name is defined in this step input field.
We recommend having a meaningful naming convention, such as
<datammodel>:<sourcetype>Remember that dictionaries can be shared between collect jobs.
In our example, we name our new dictionary
Web:apache:access:kv
Generate a new dictionary, or select an existing one, and adjust default behavior and thresholds:
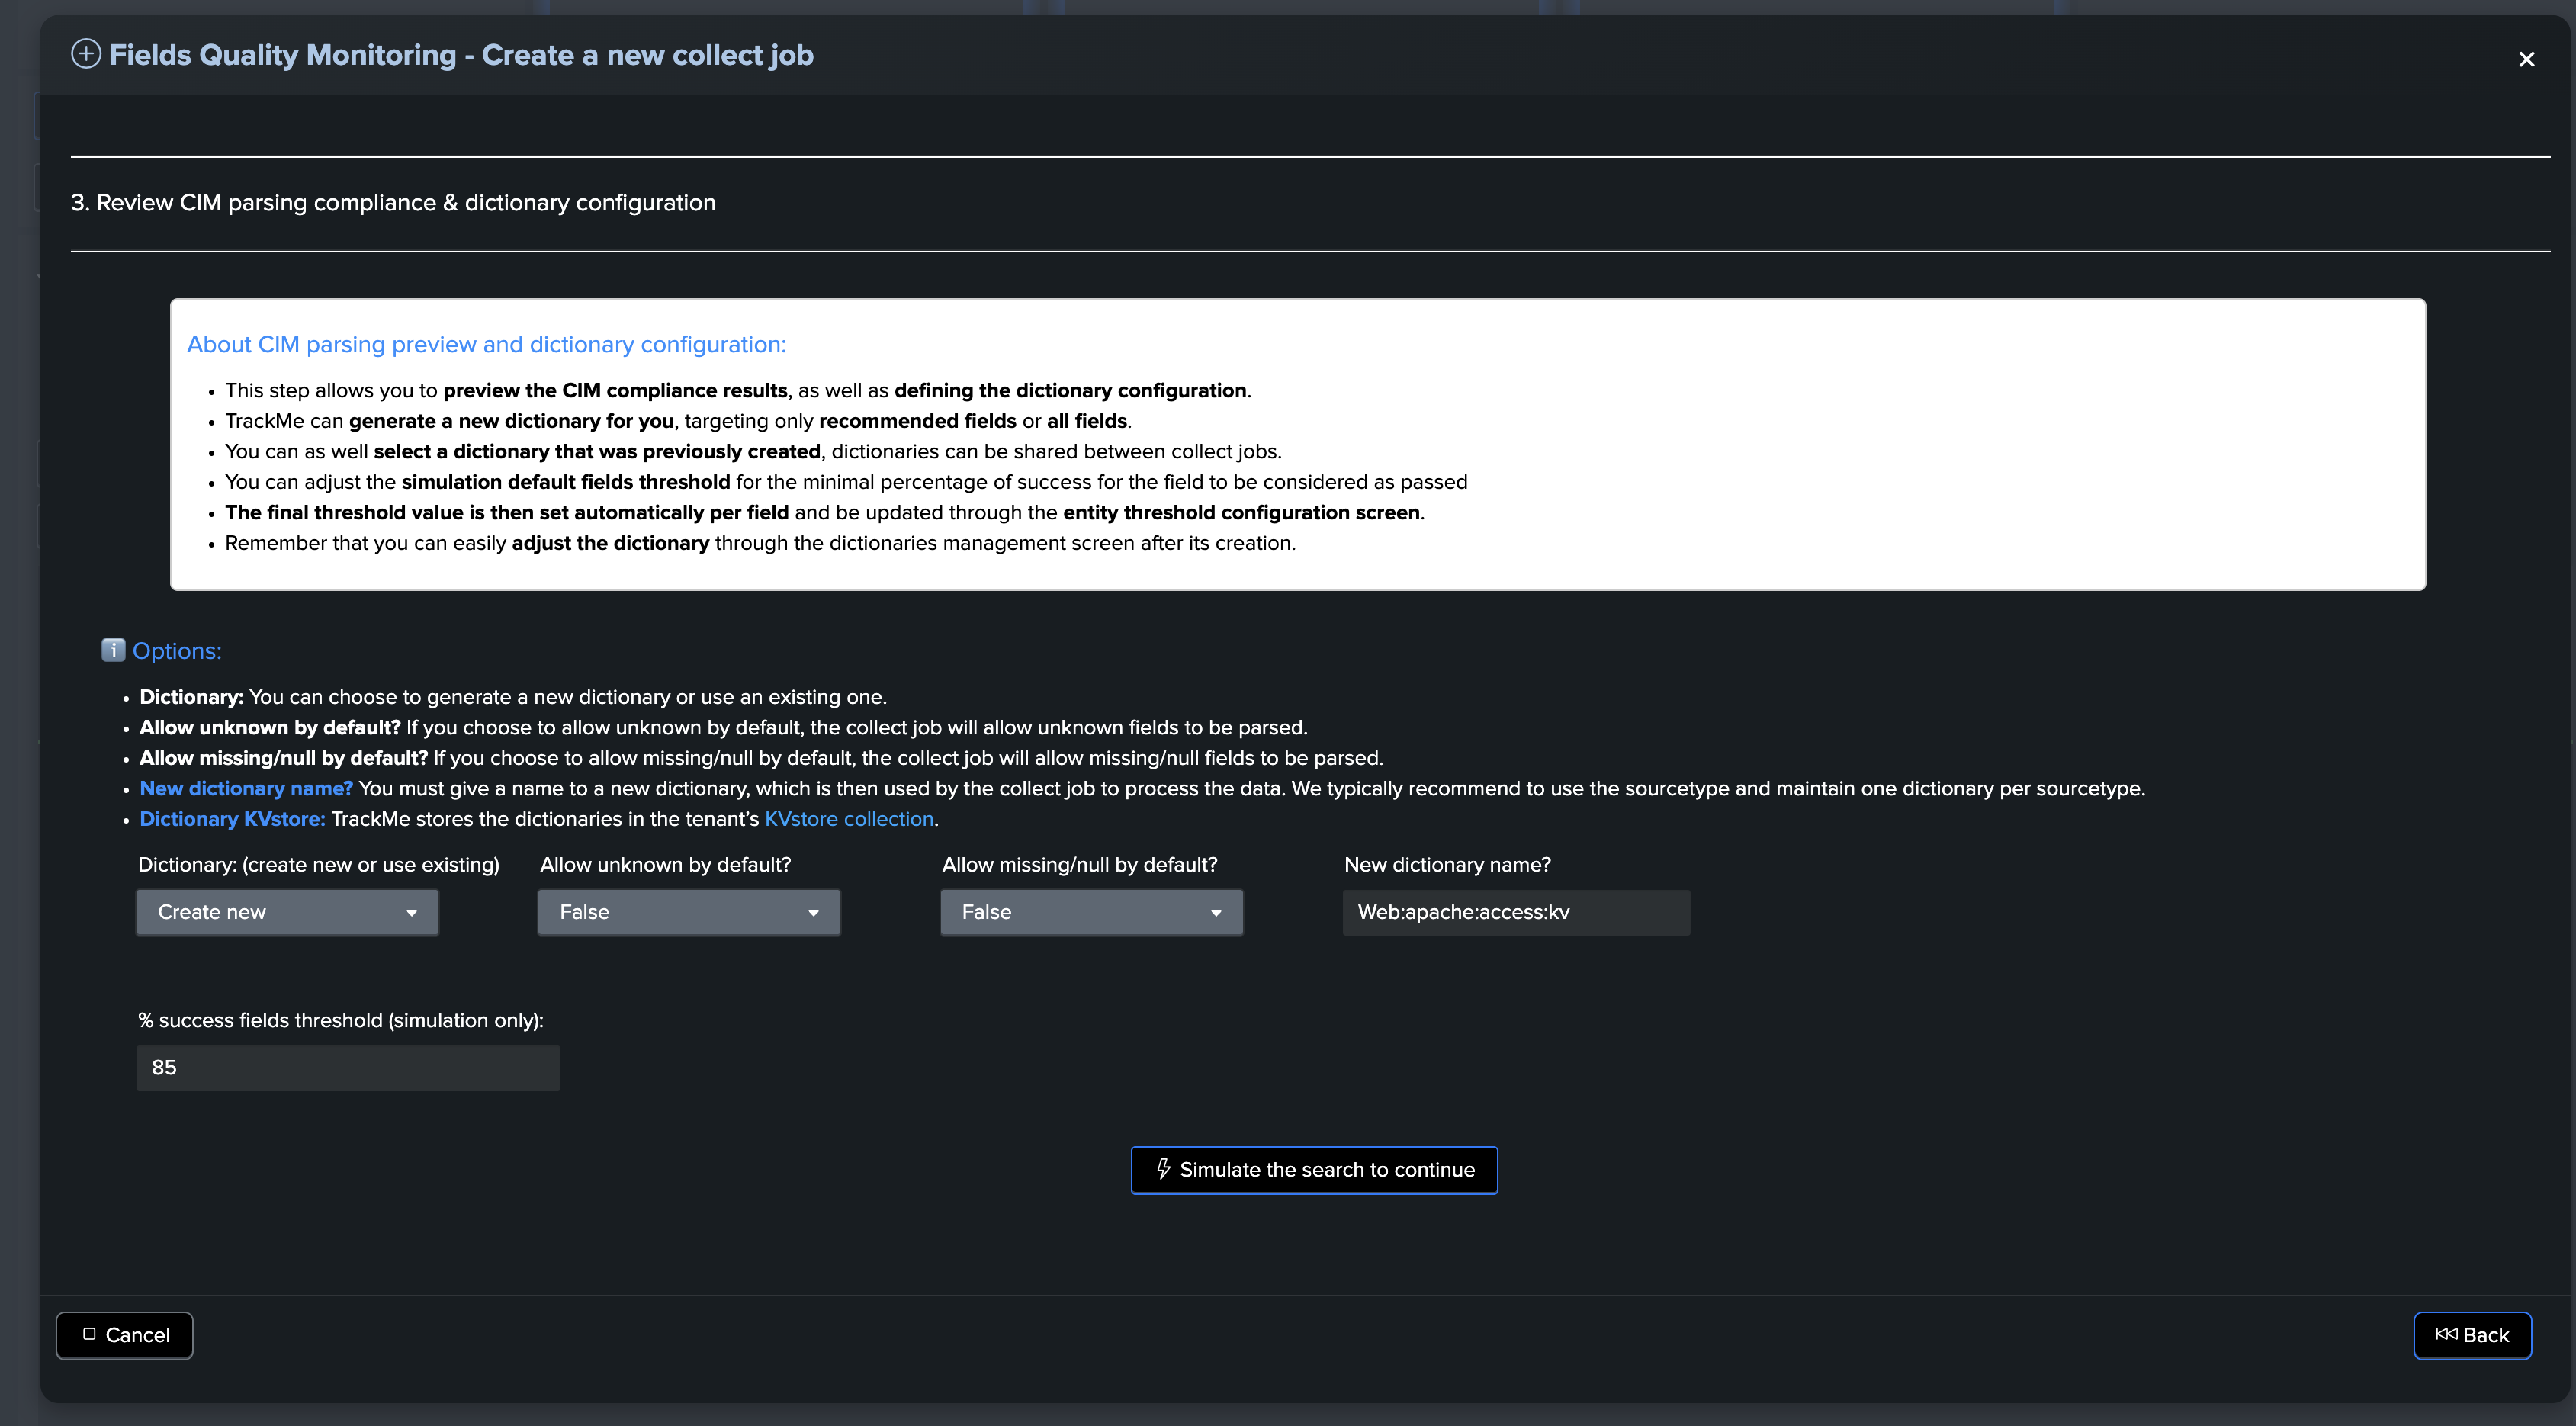
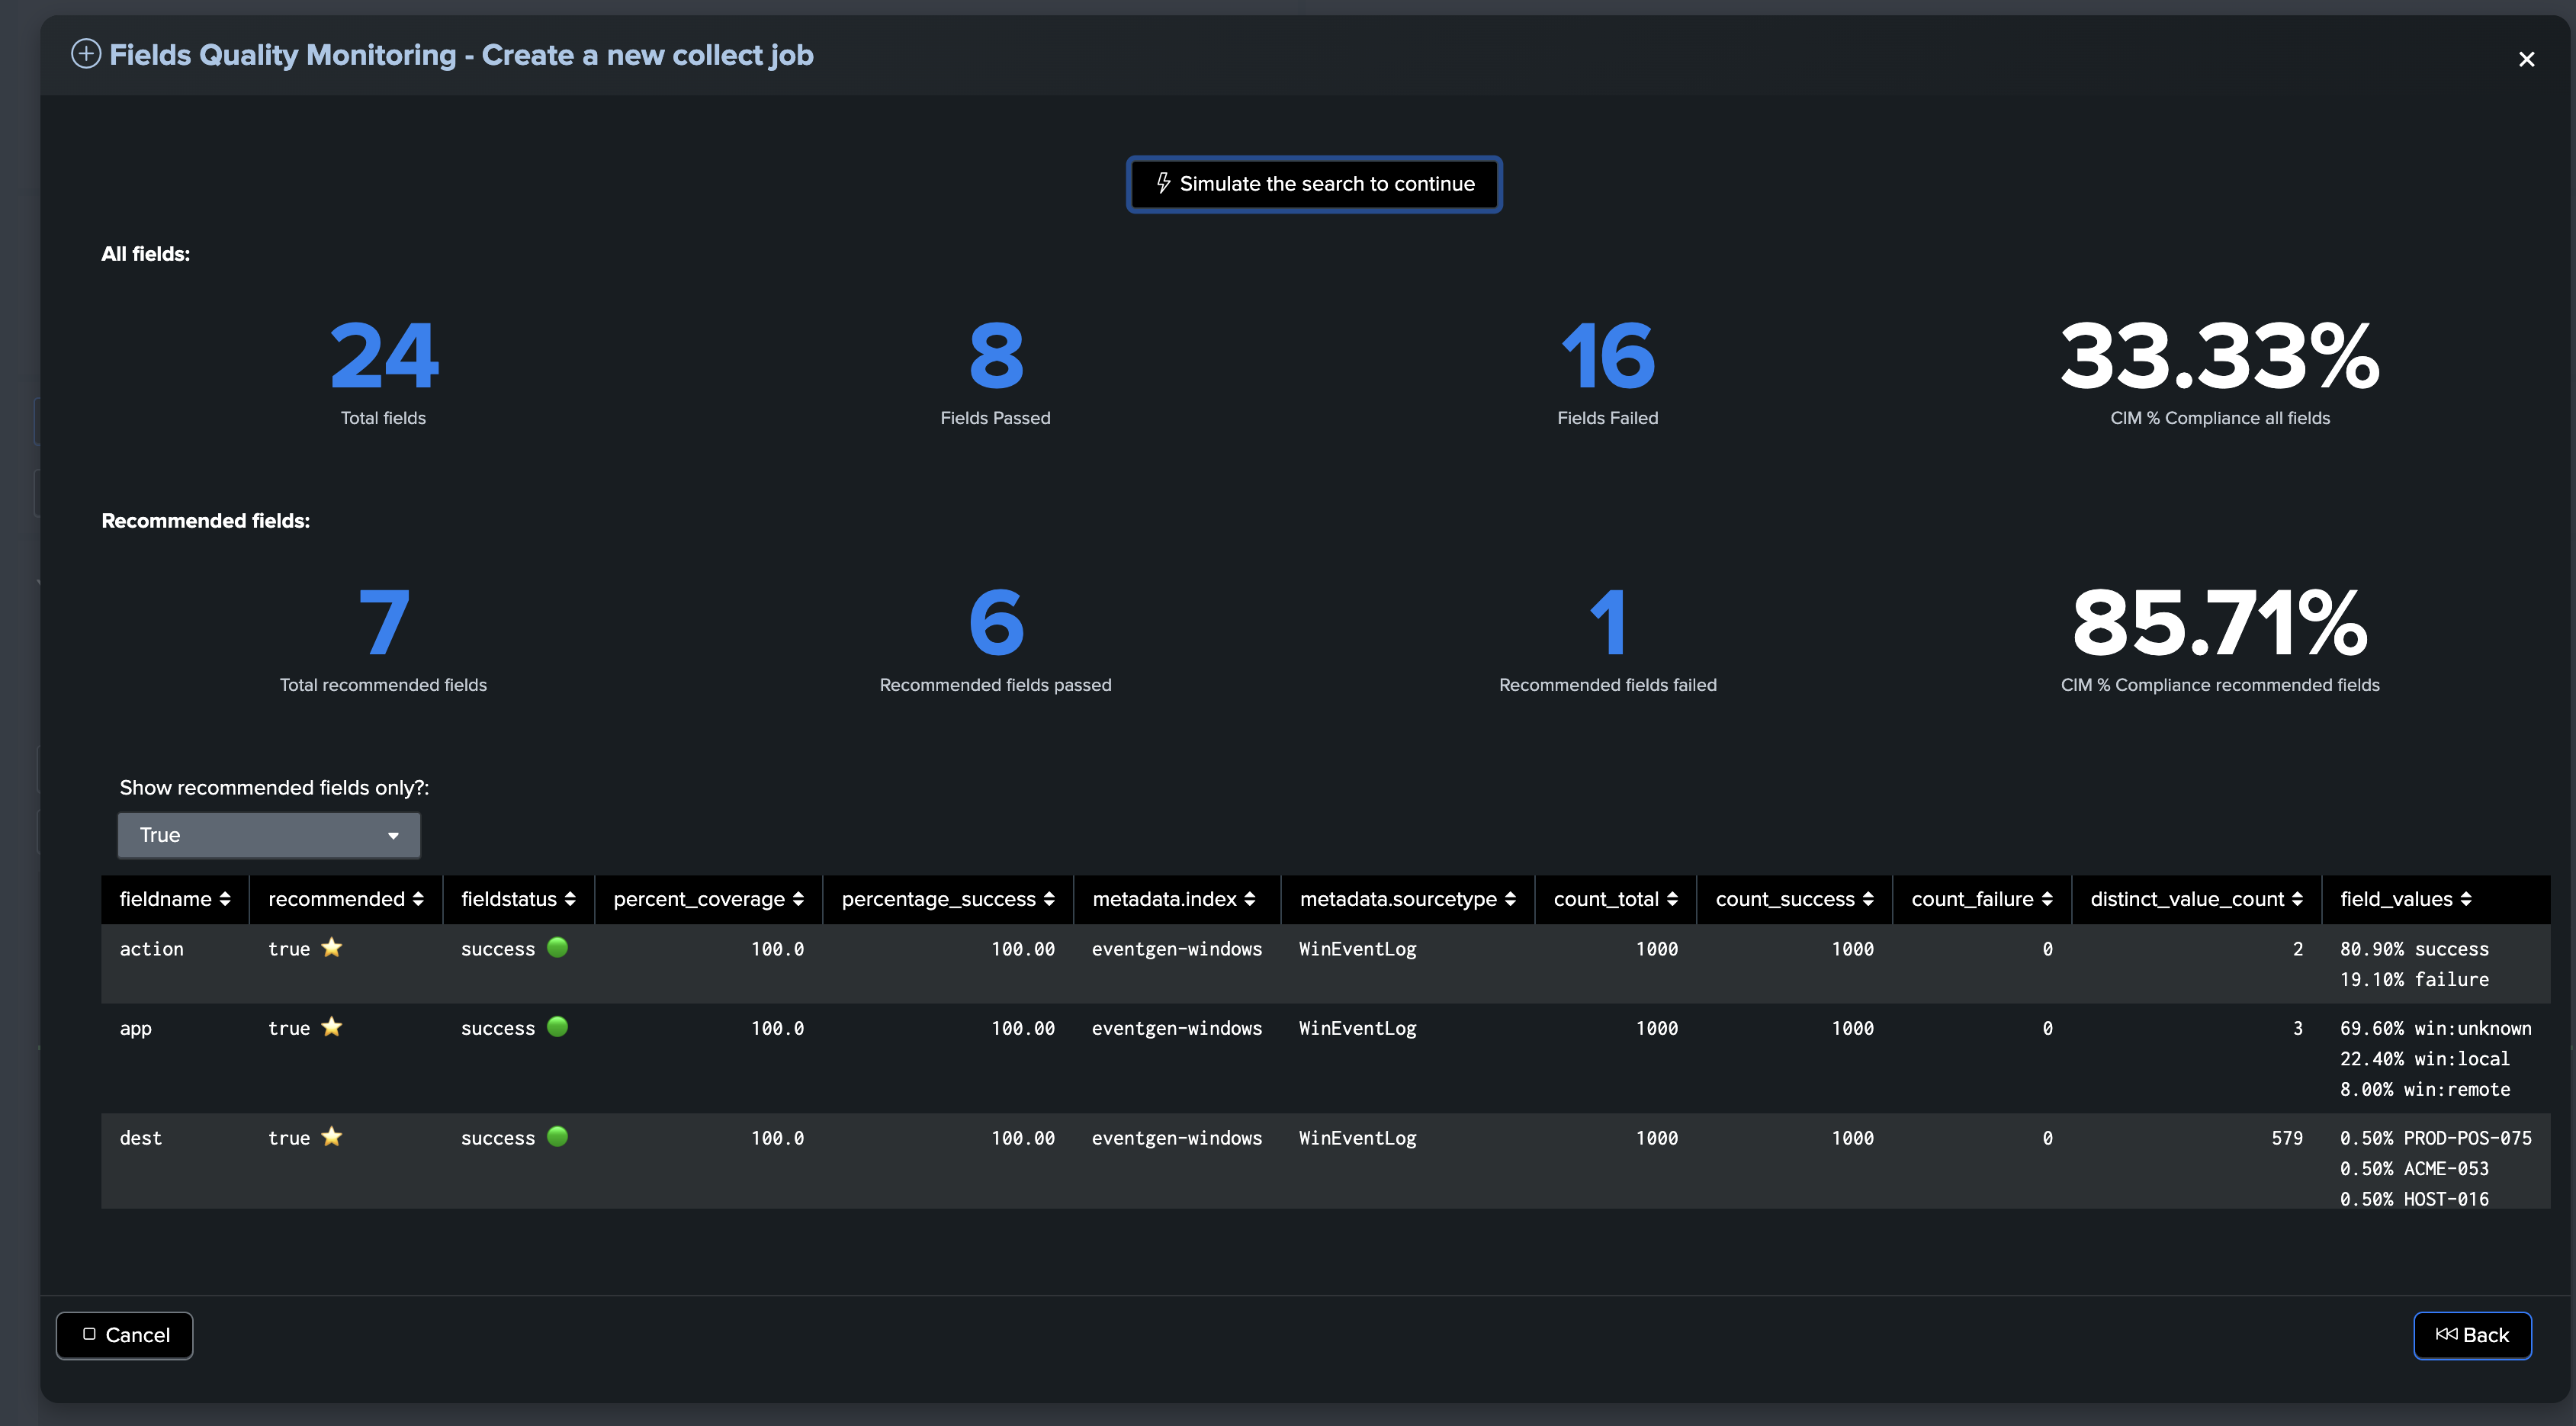
Finally, execute the sampling search to preview the CIM compliance results, which shows key information about the expected results:
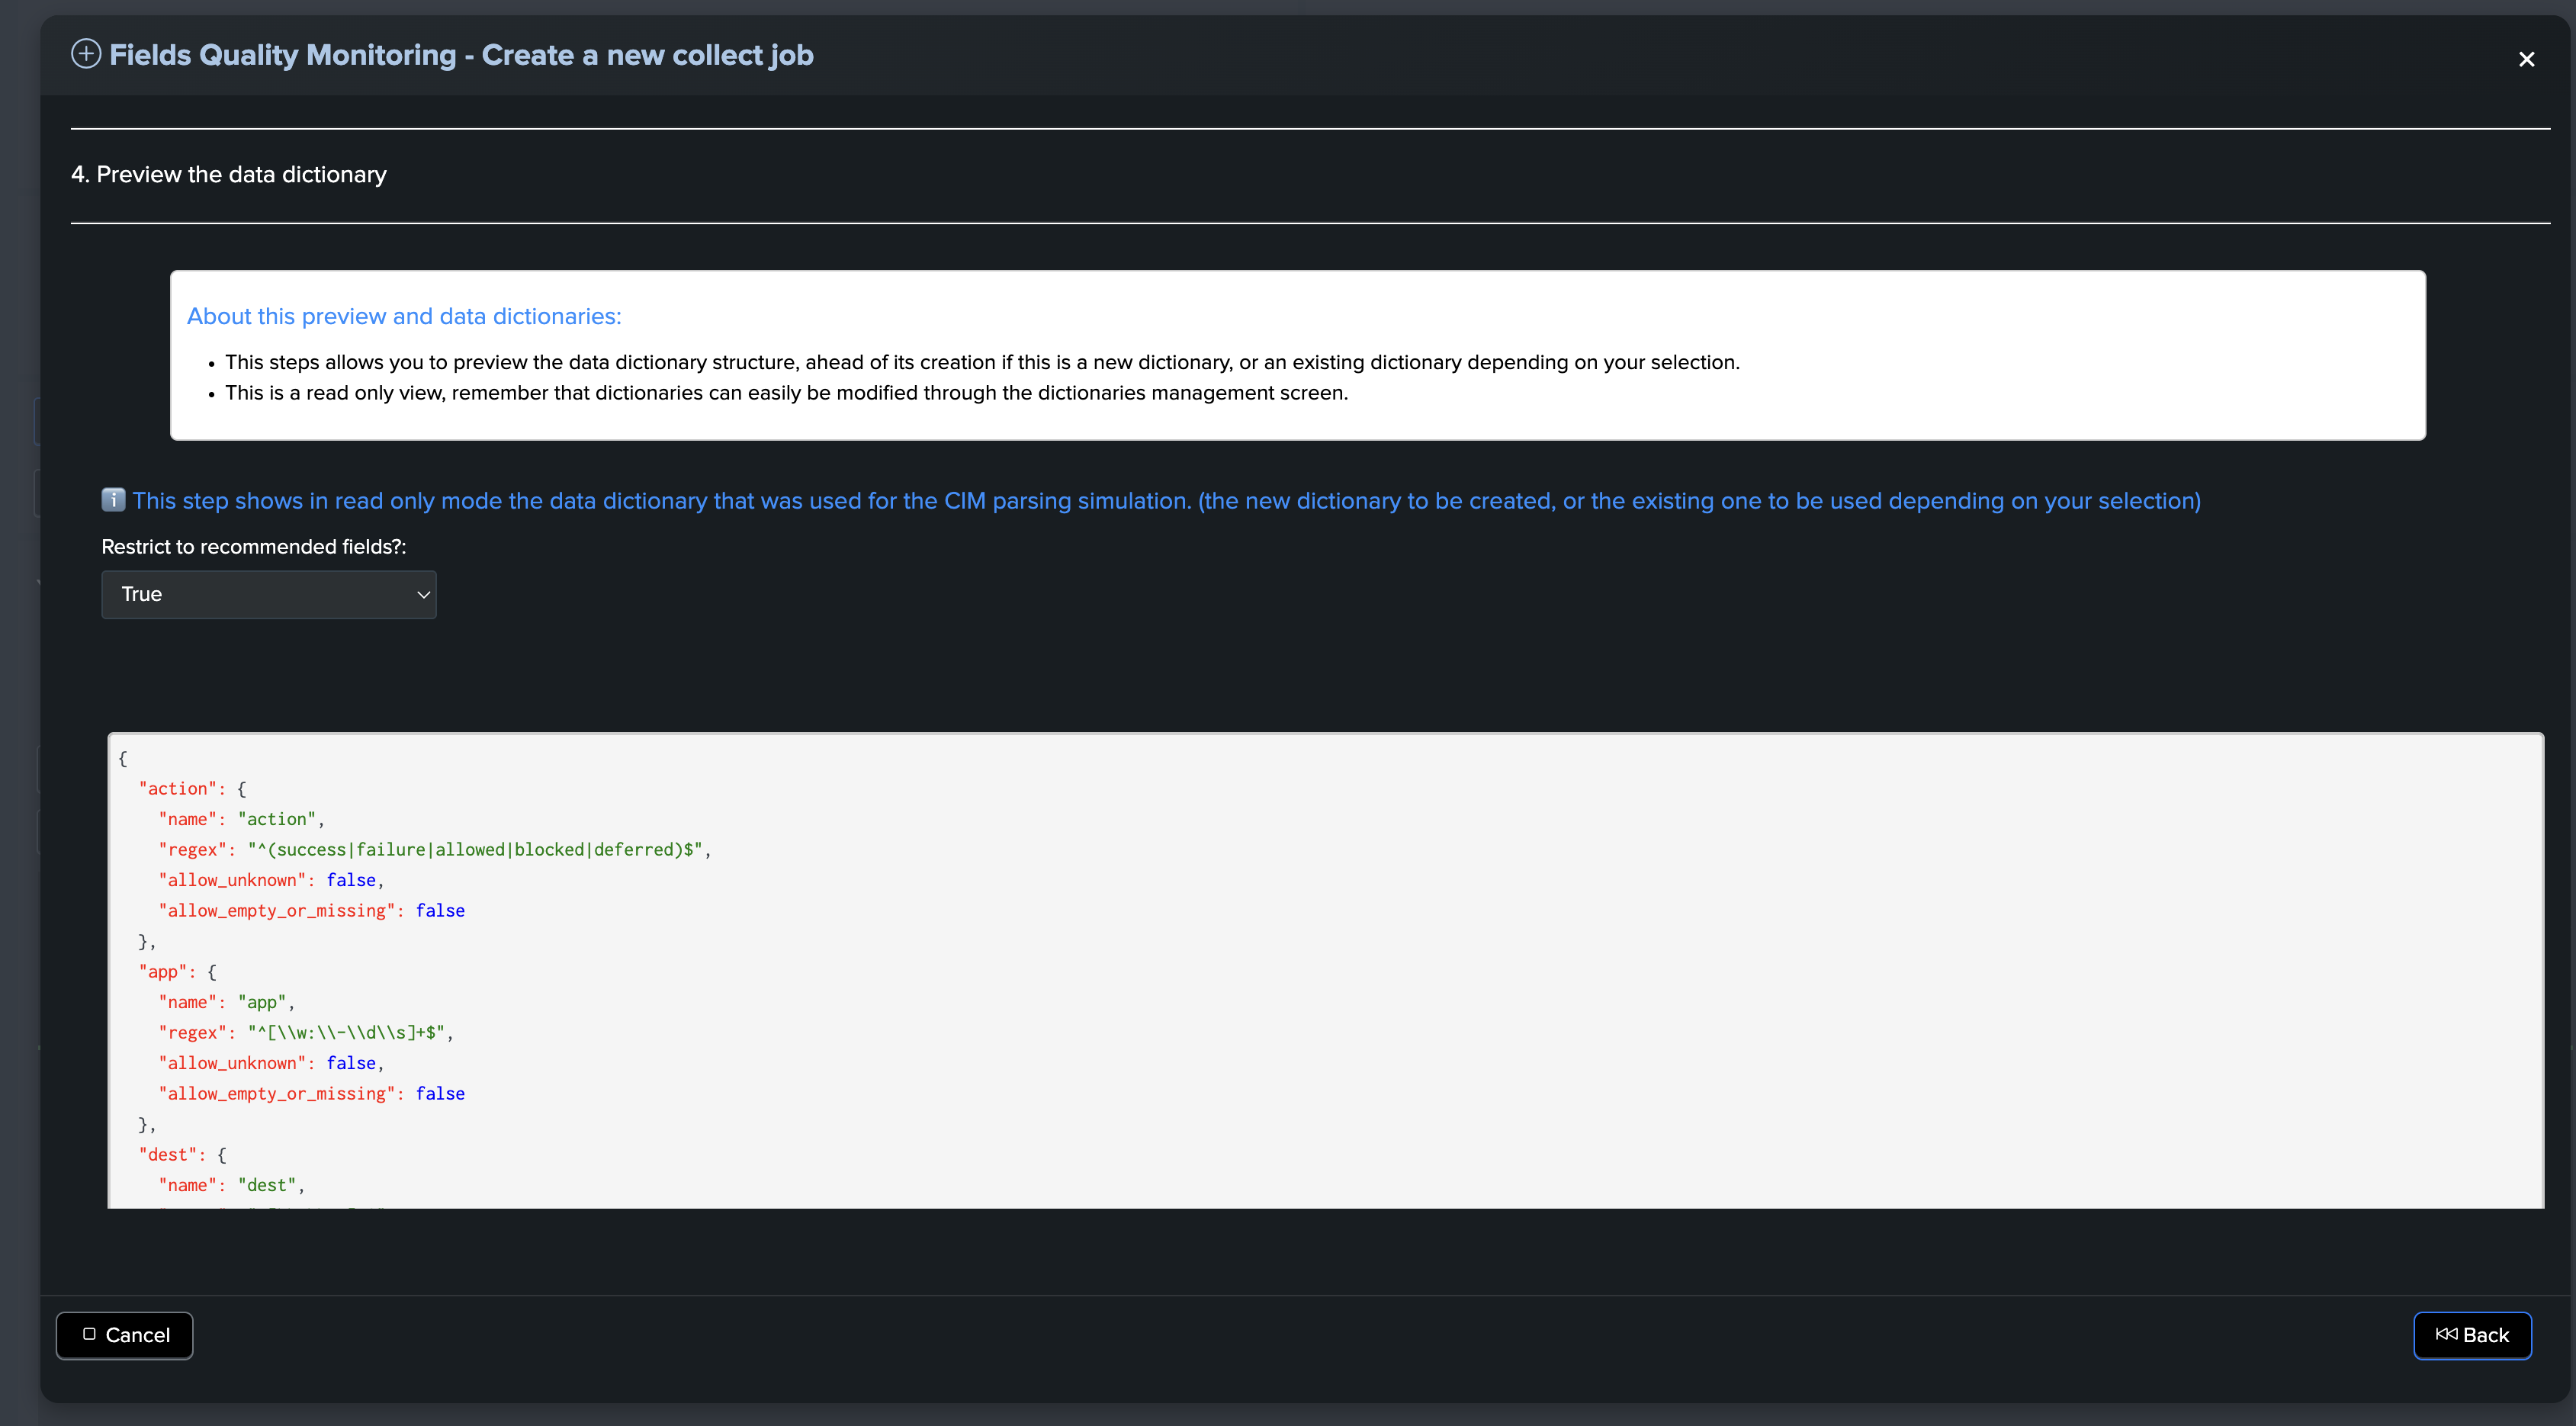
Previewing the data dictionary (CIM context only)
This part of the wizard is informational only and shows a preview of the structure of the data dictionary:
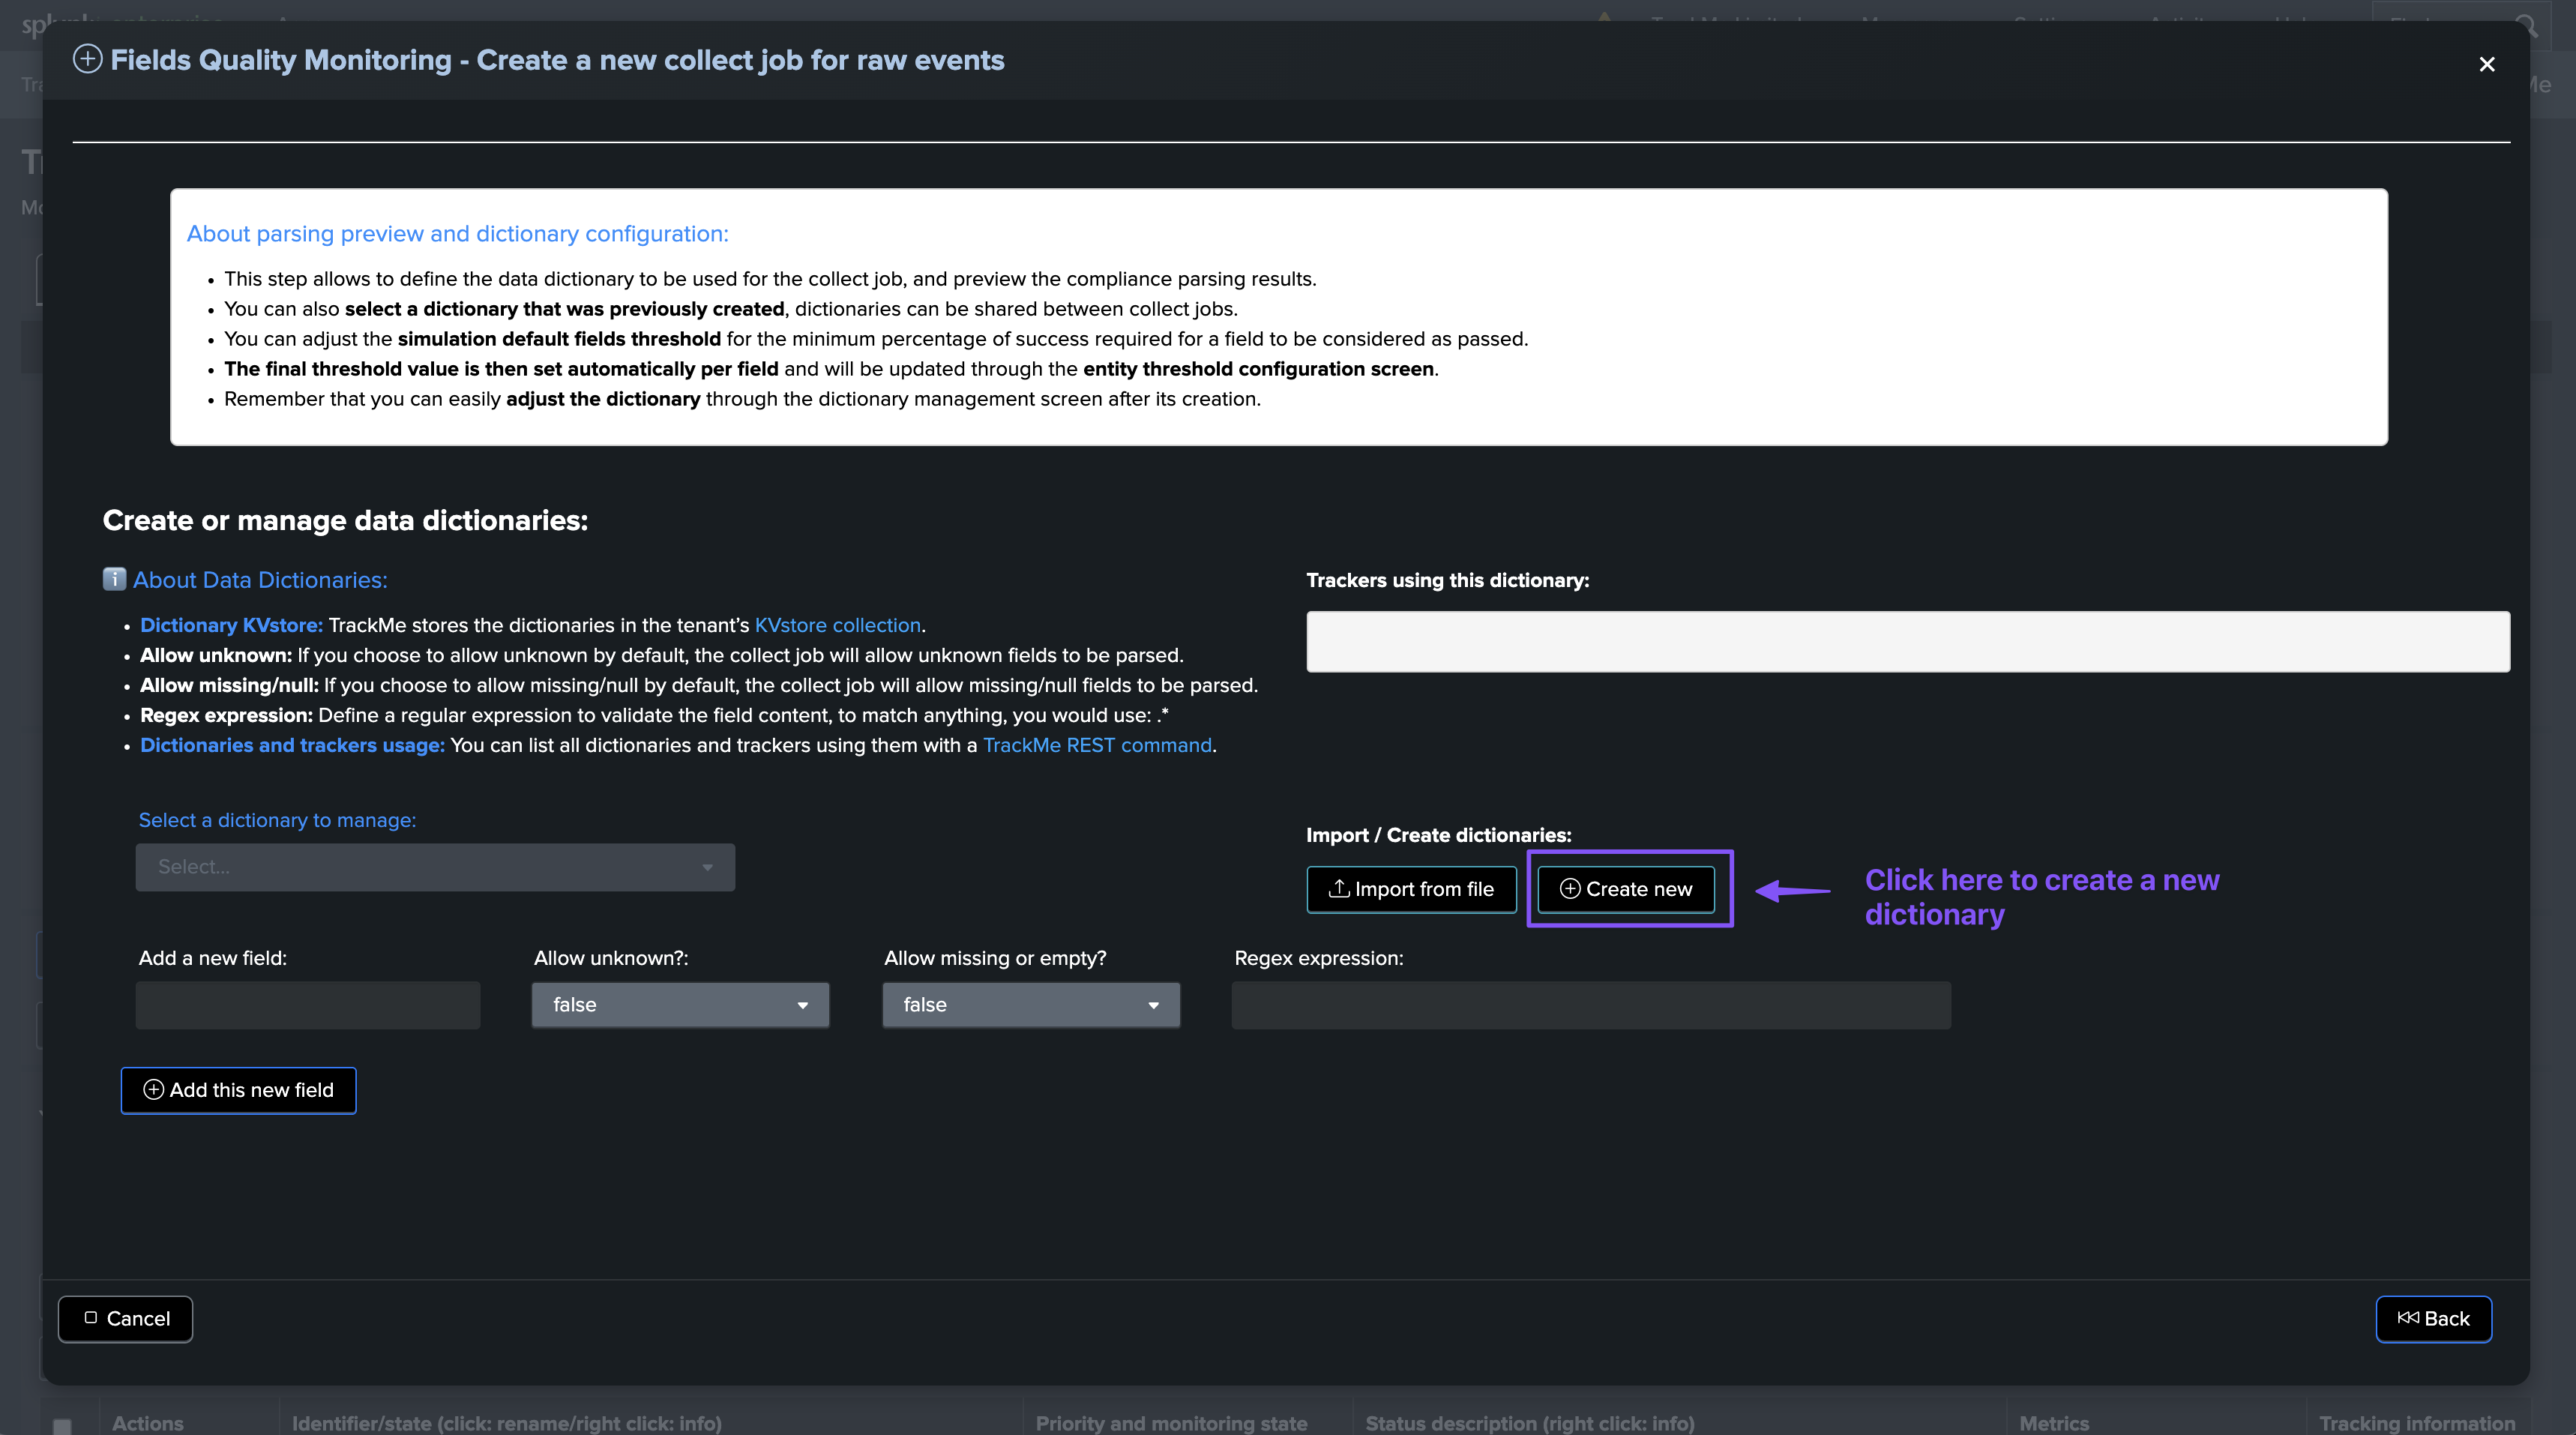
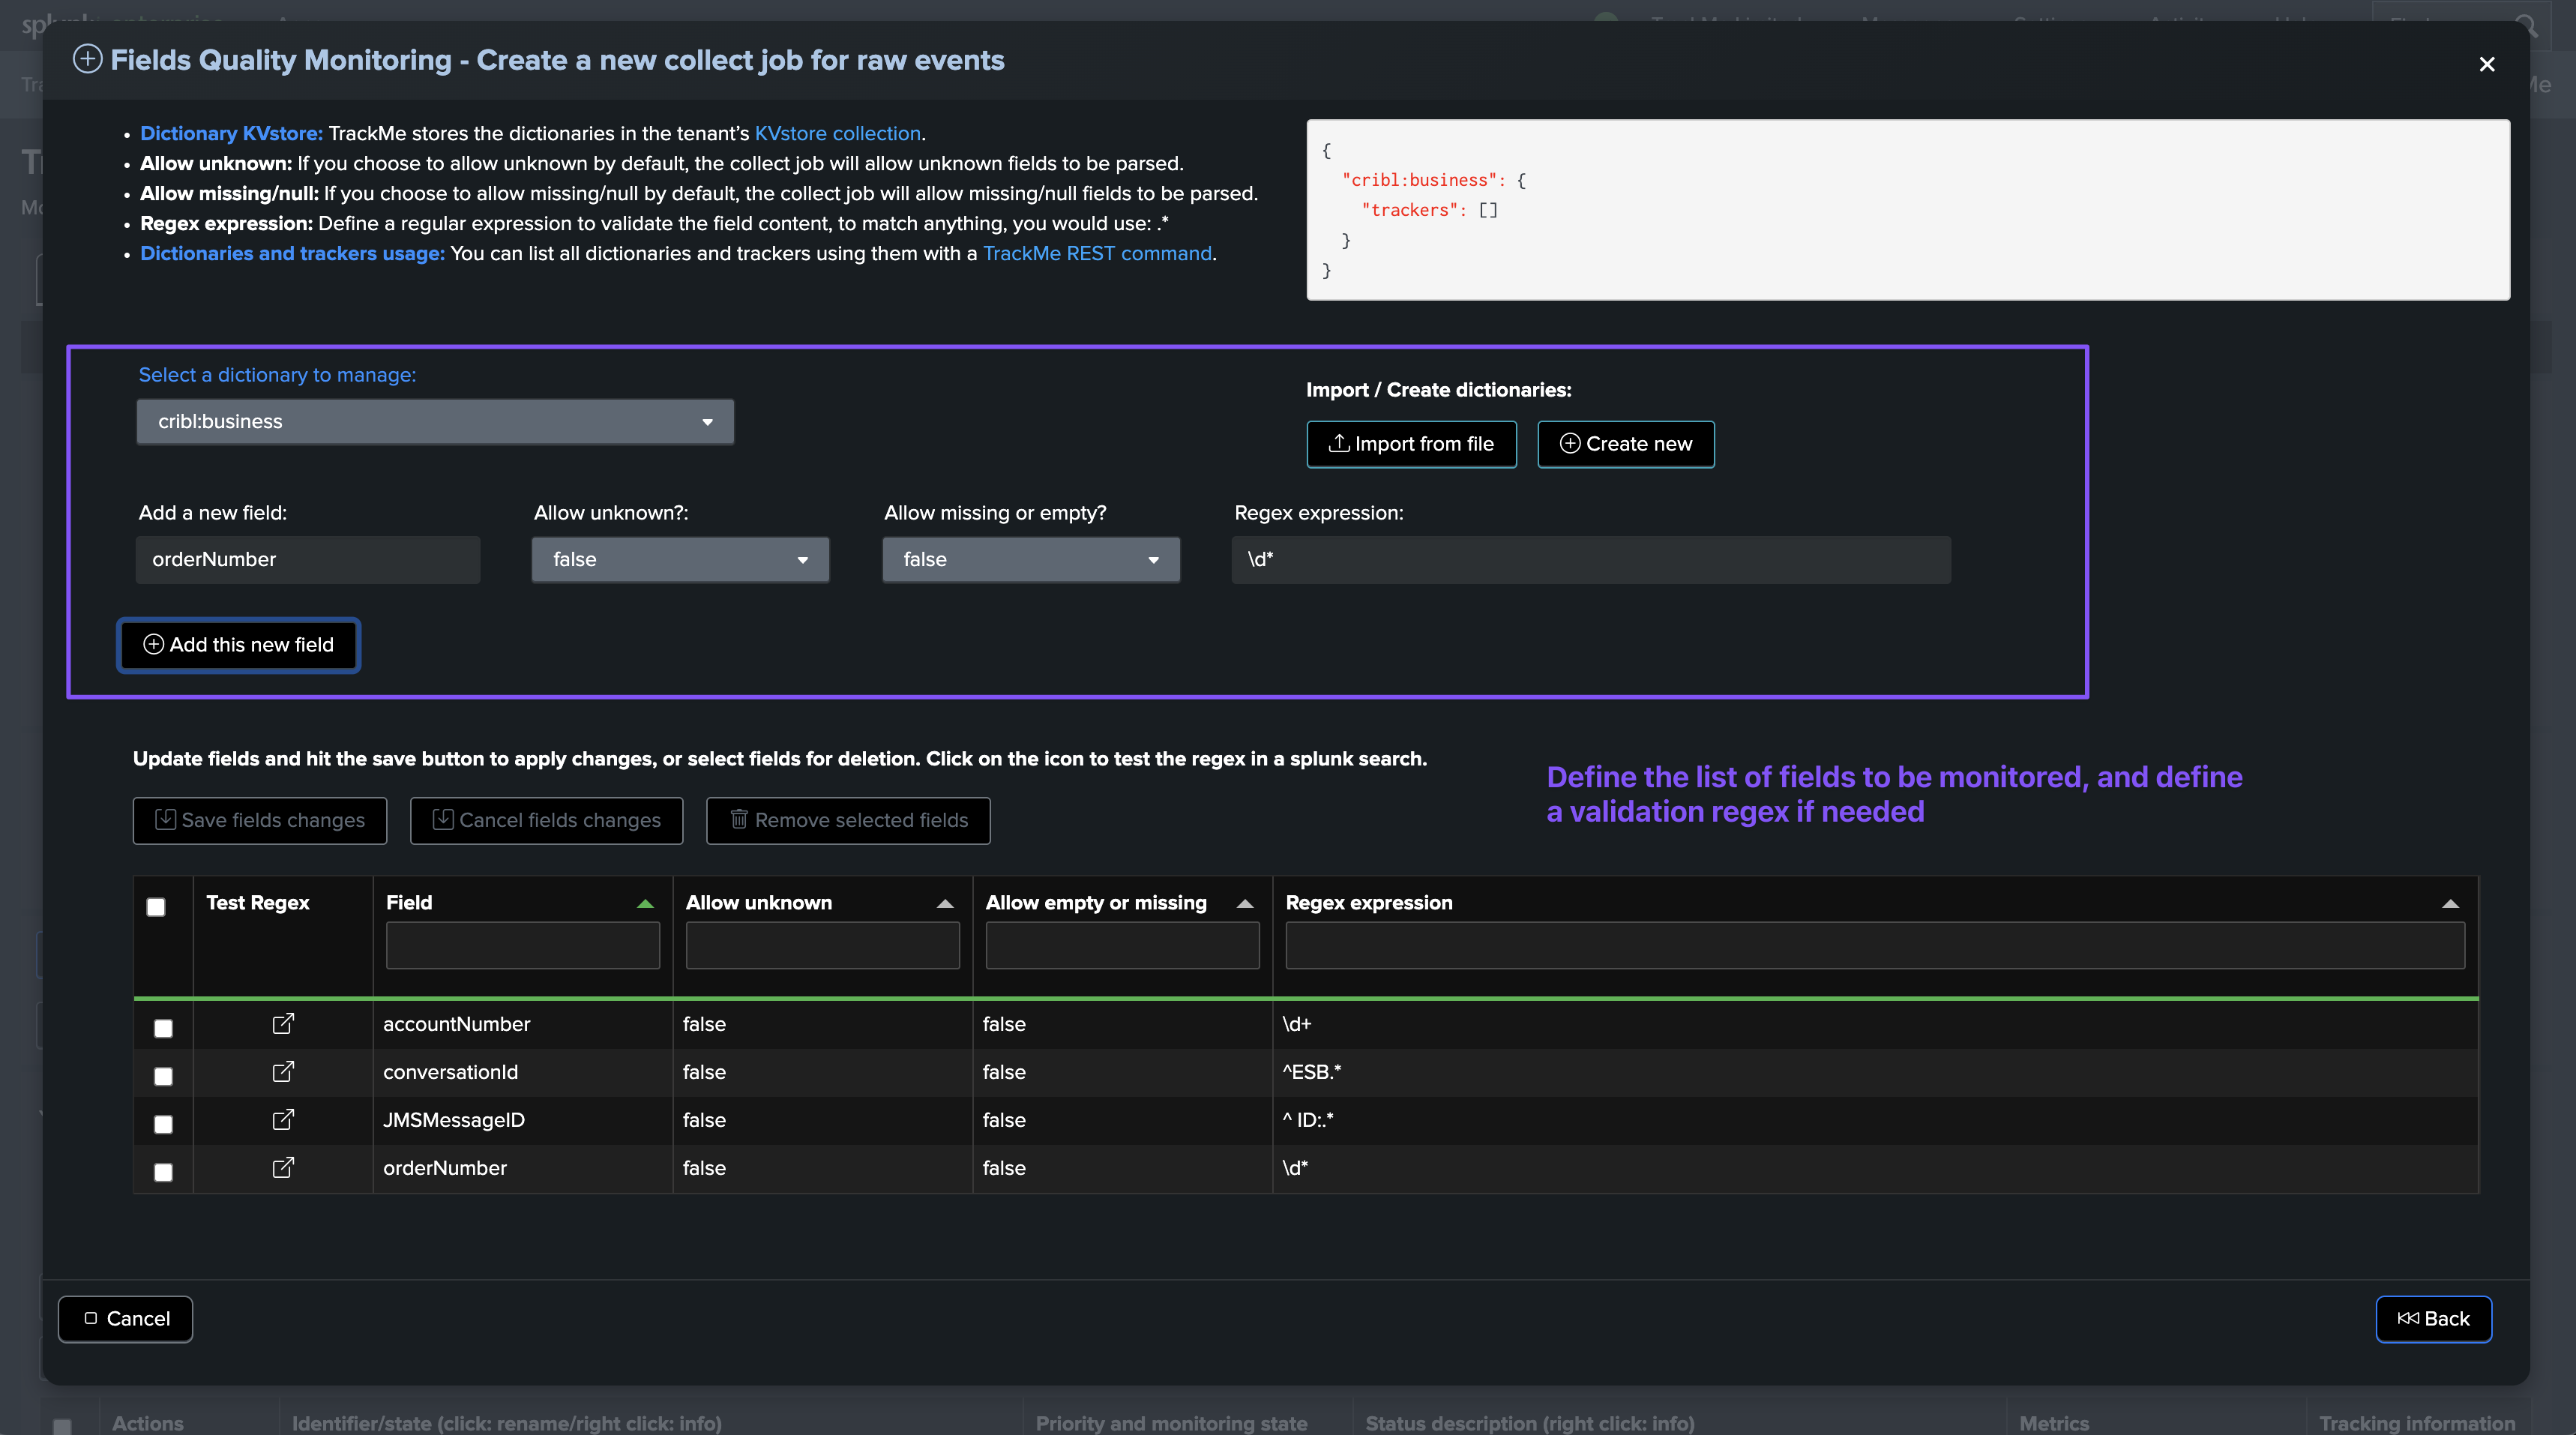
Data dictionary generation or selection (for non CIM context)
For non CIM contexts, you need to define the fields to be monitored by declaring the fields of interests in the data dictionary.
The data dictionary definition step can be performed before the collect job creation via the Manage: dictionaries screen, or during the collect job creation wizard.
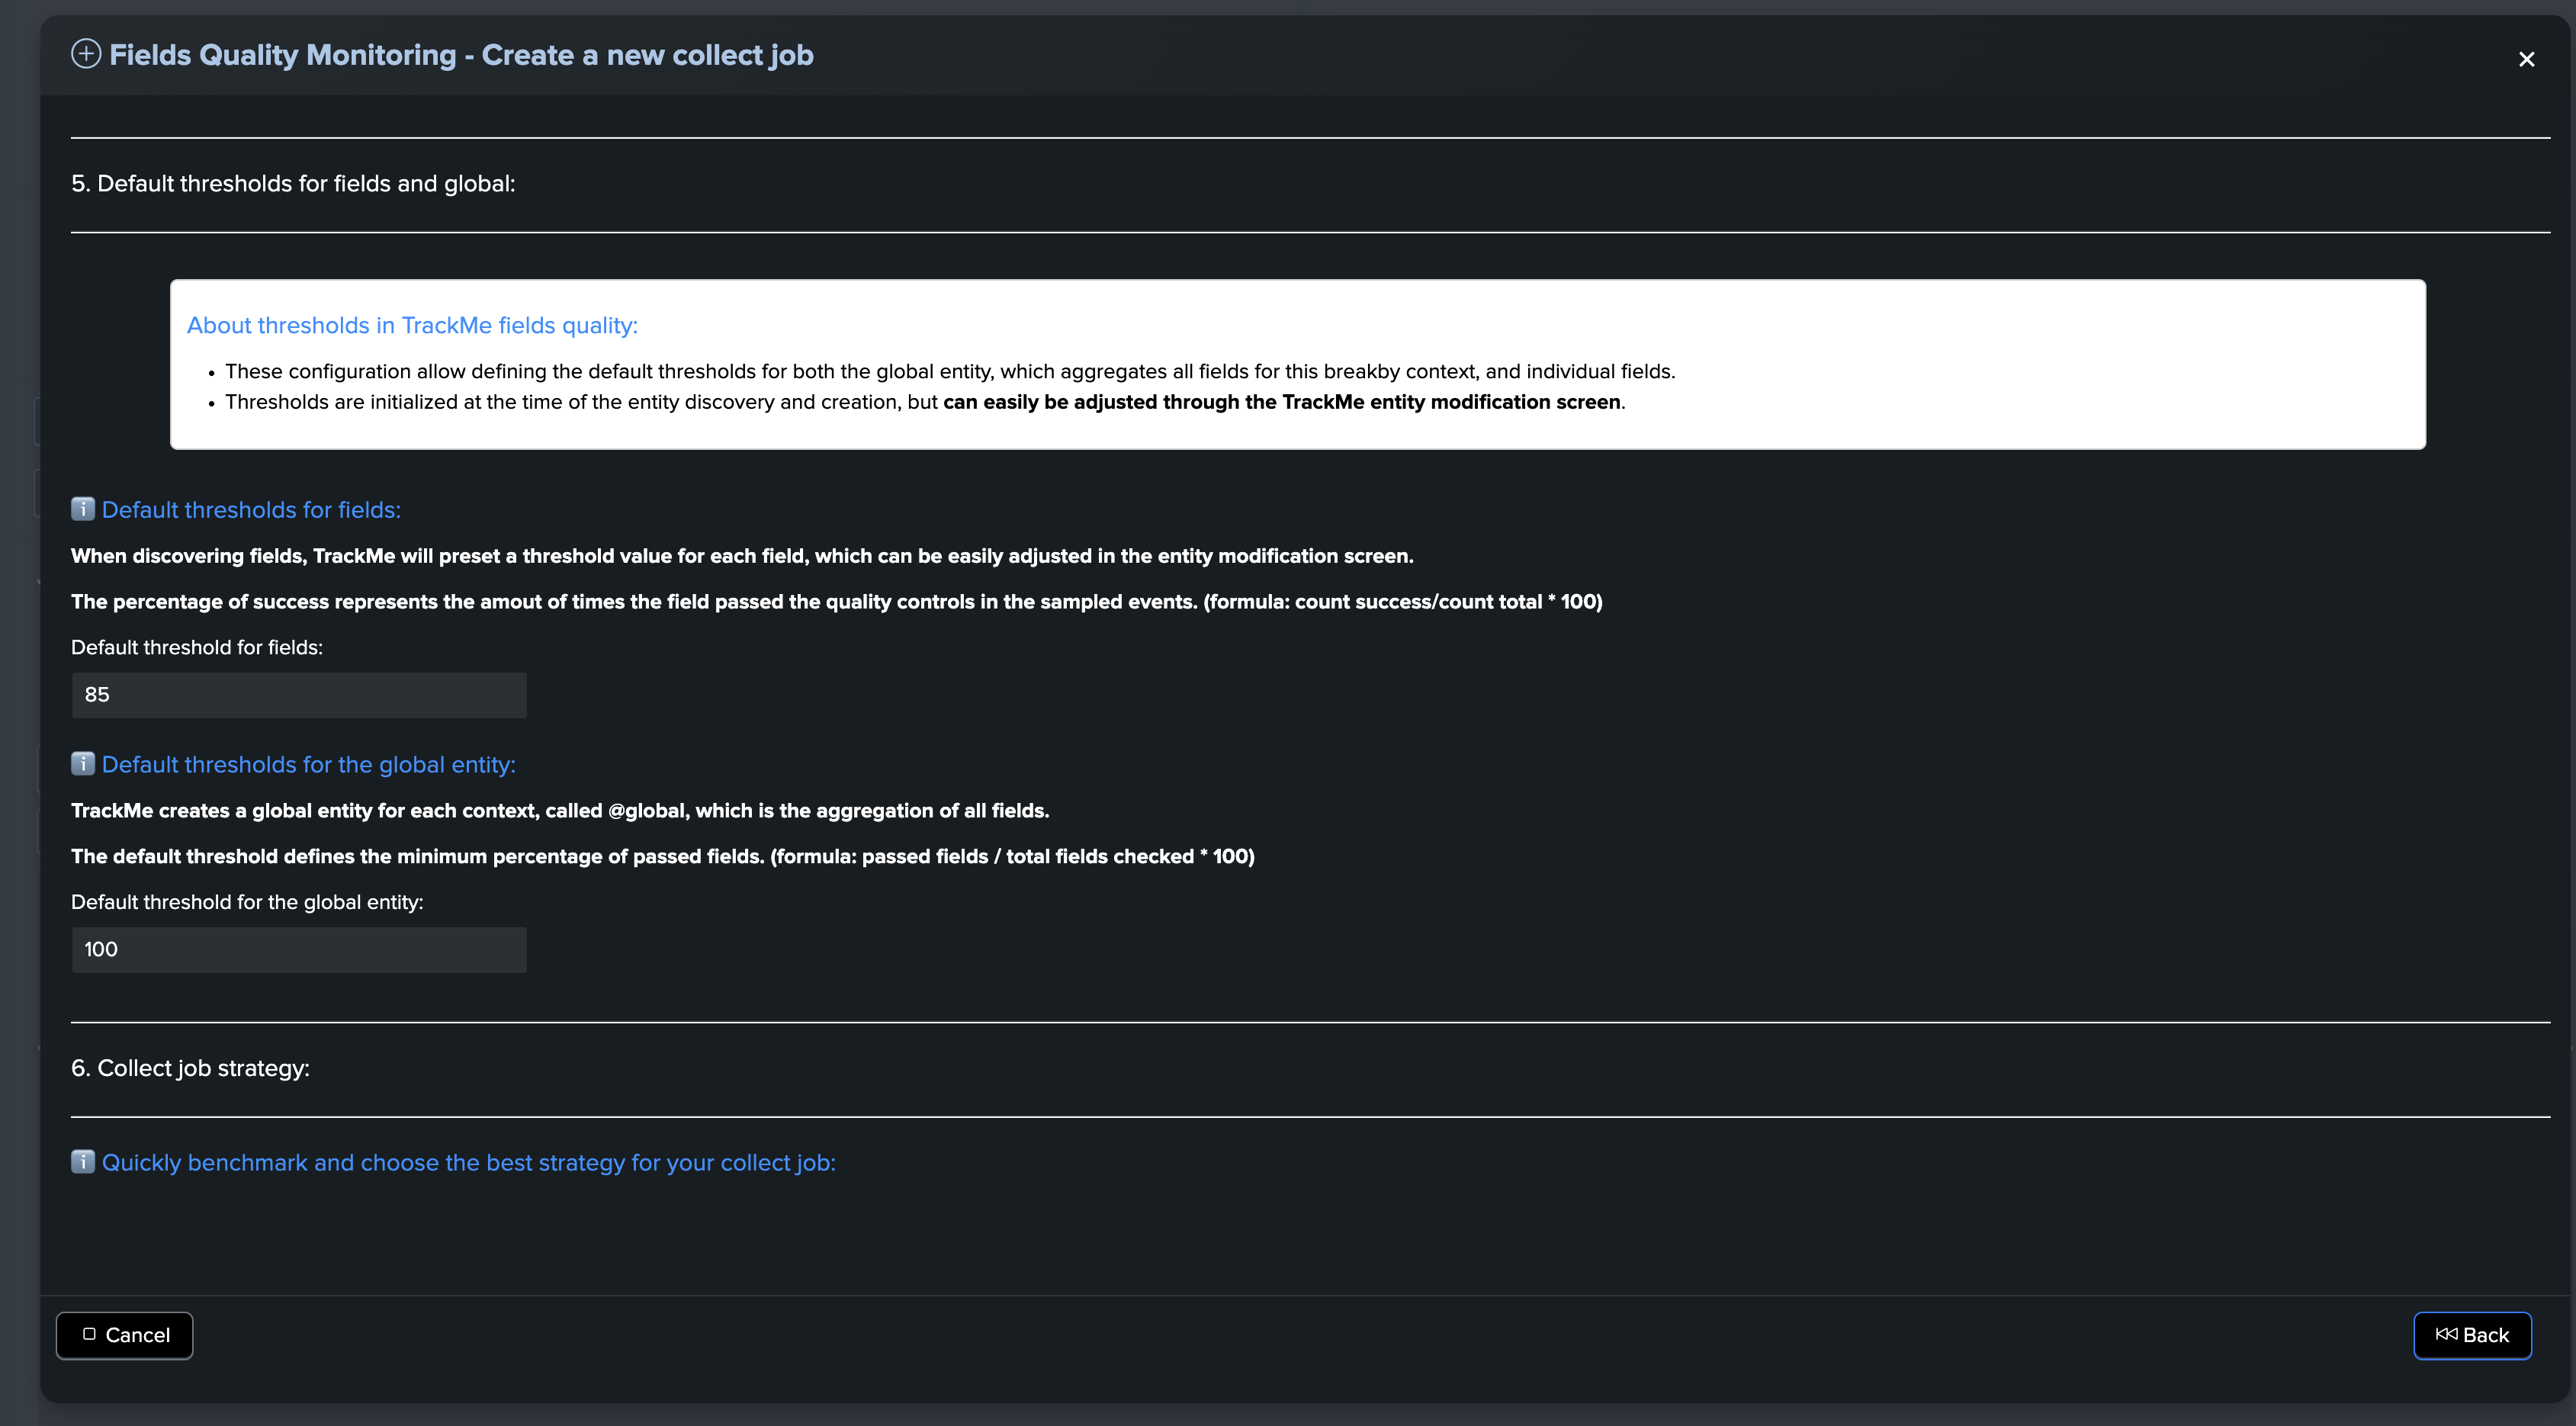
Default thresholds for fields and global
About thresholds in TrackMe fields quality:
These configurations allow you to define the default thresholds for both the global entity, which aggregates all fields for this breakby context, and individual fields.
Thresholds are initialized at the time of entity discovery and creation, but can easily be adjusted through the TrackMe entity modification screen.
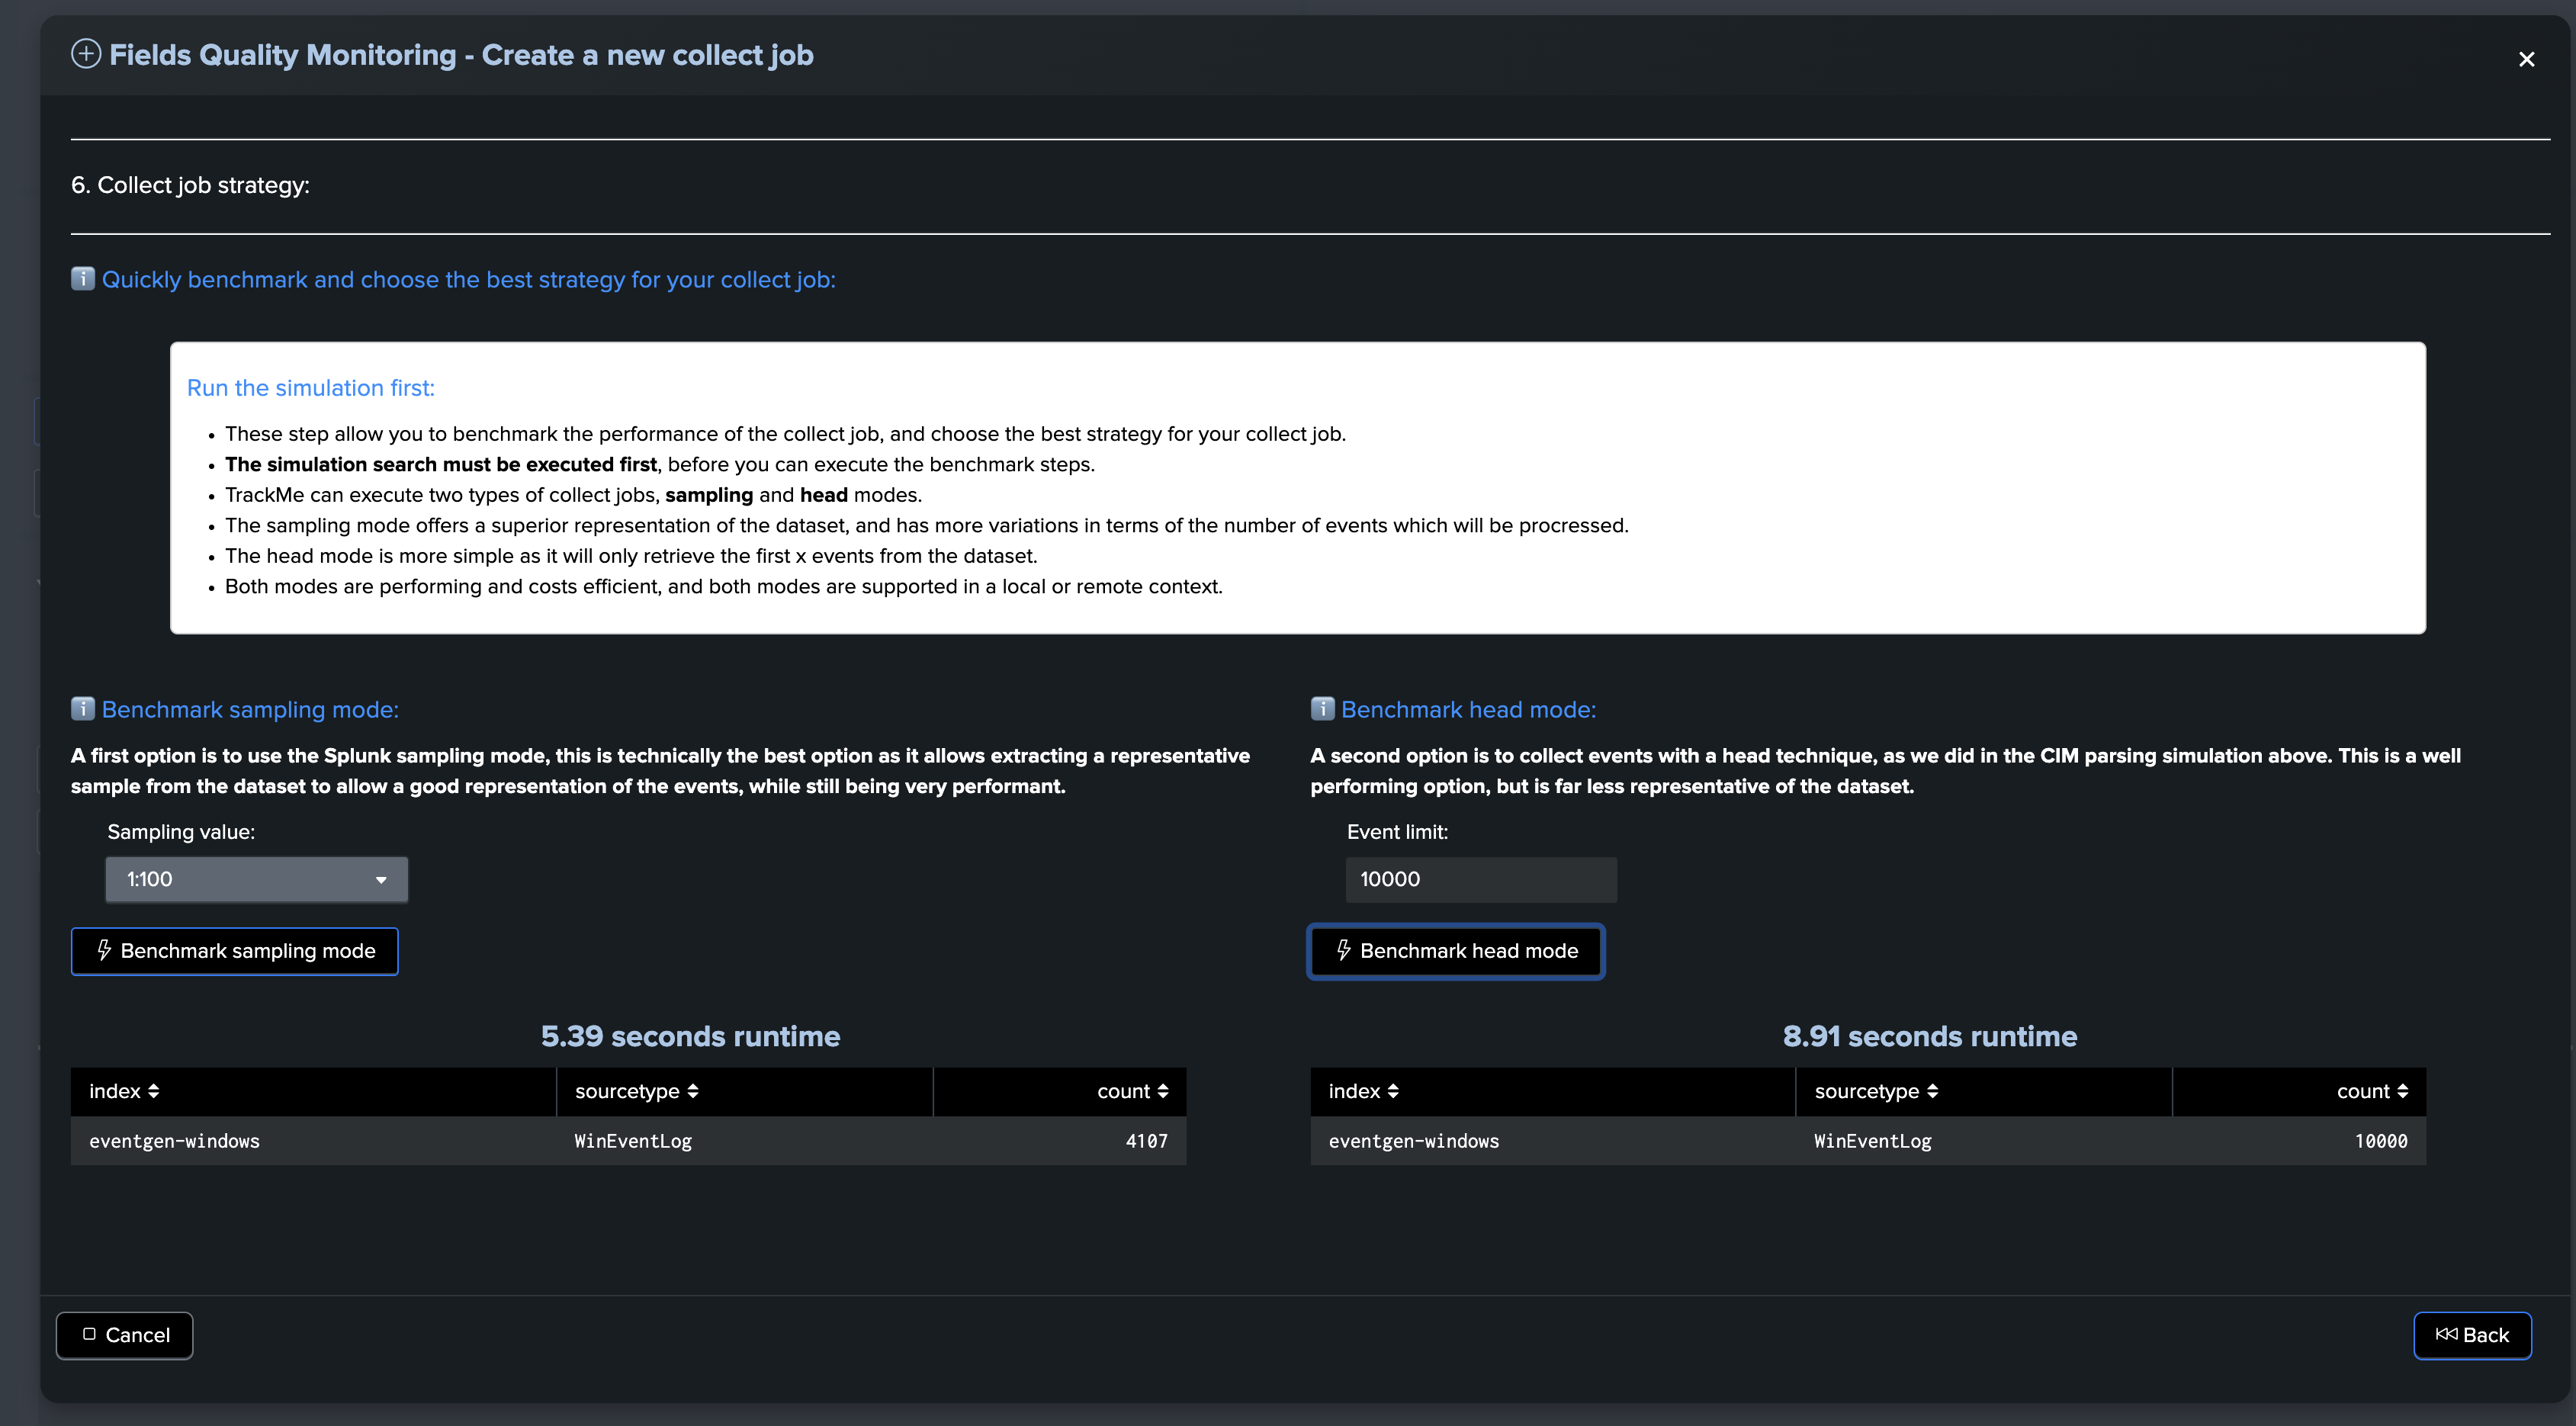
Benchmark the collect job strategy
About the collect job strategy benchmark:
These steps allow you to benchmark the performance of the collect job and choose the best strategy for your collect job.
The simulation search must be executed first, before you can execute the benchmark steps.
TrackMe can execute two types of collect jobs: sampling and head modes.
The sampling mode offers a superior representation of the dataset and has more variations in terms of the number of events that will be processed.
The head mode is simpler as it will only retrieve the first x events from the dataset.
Both modes are performant and cost-efficient, and both modes are supported in a local or remote context.
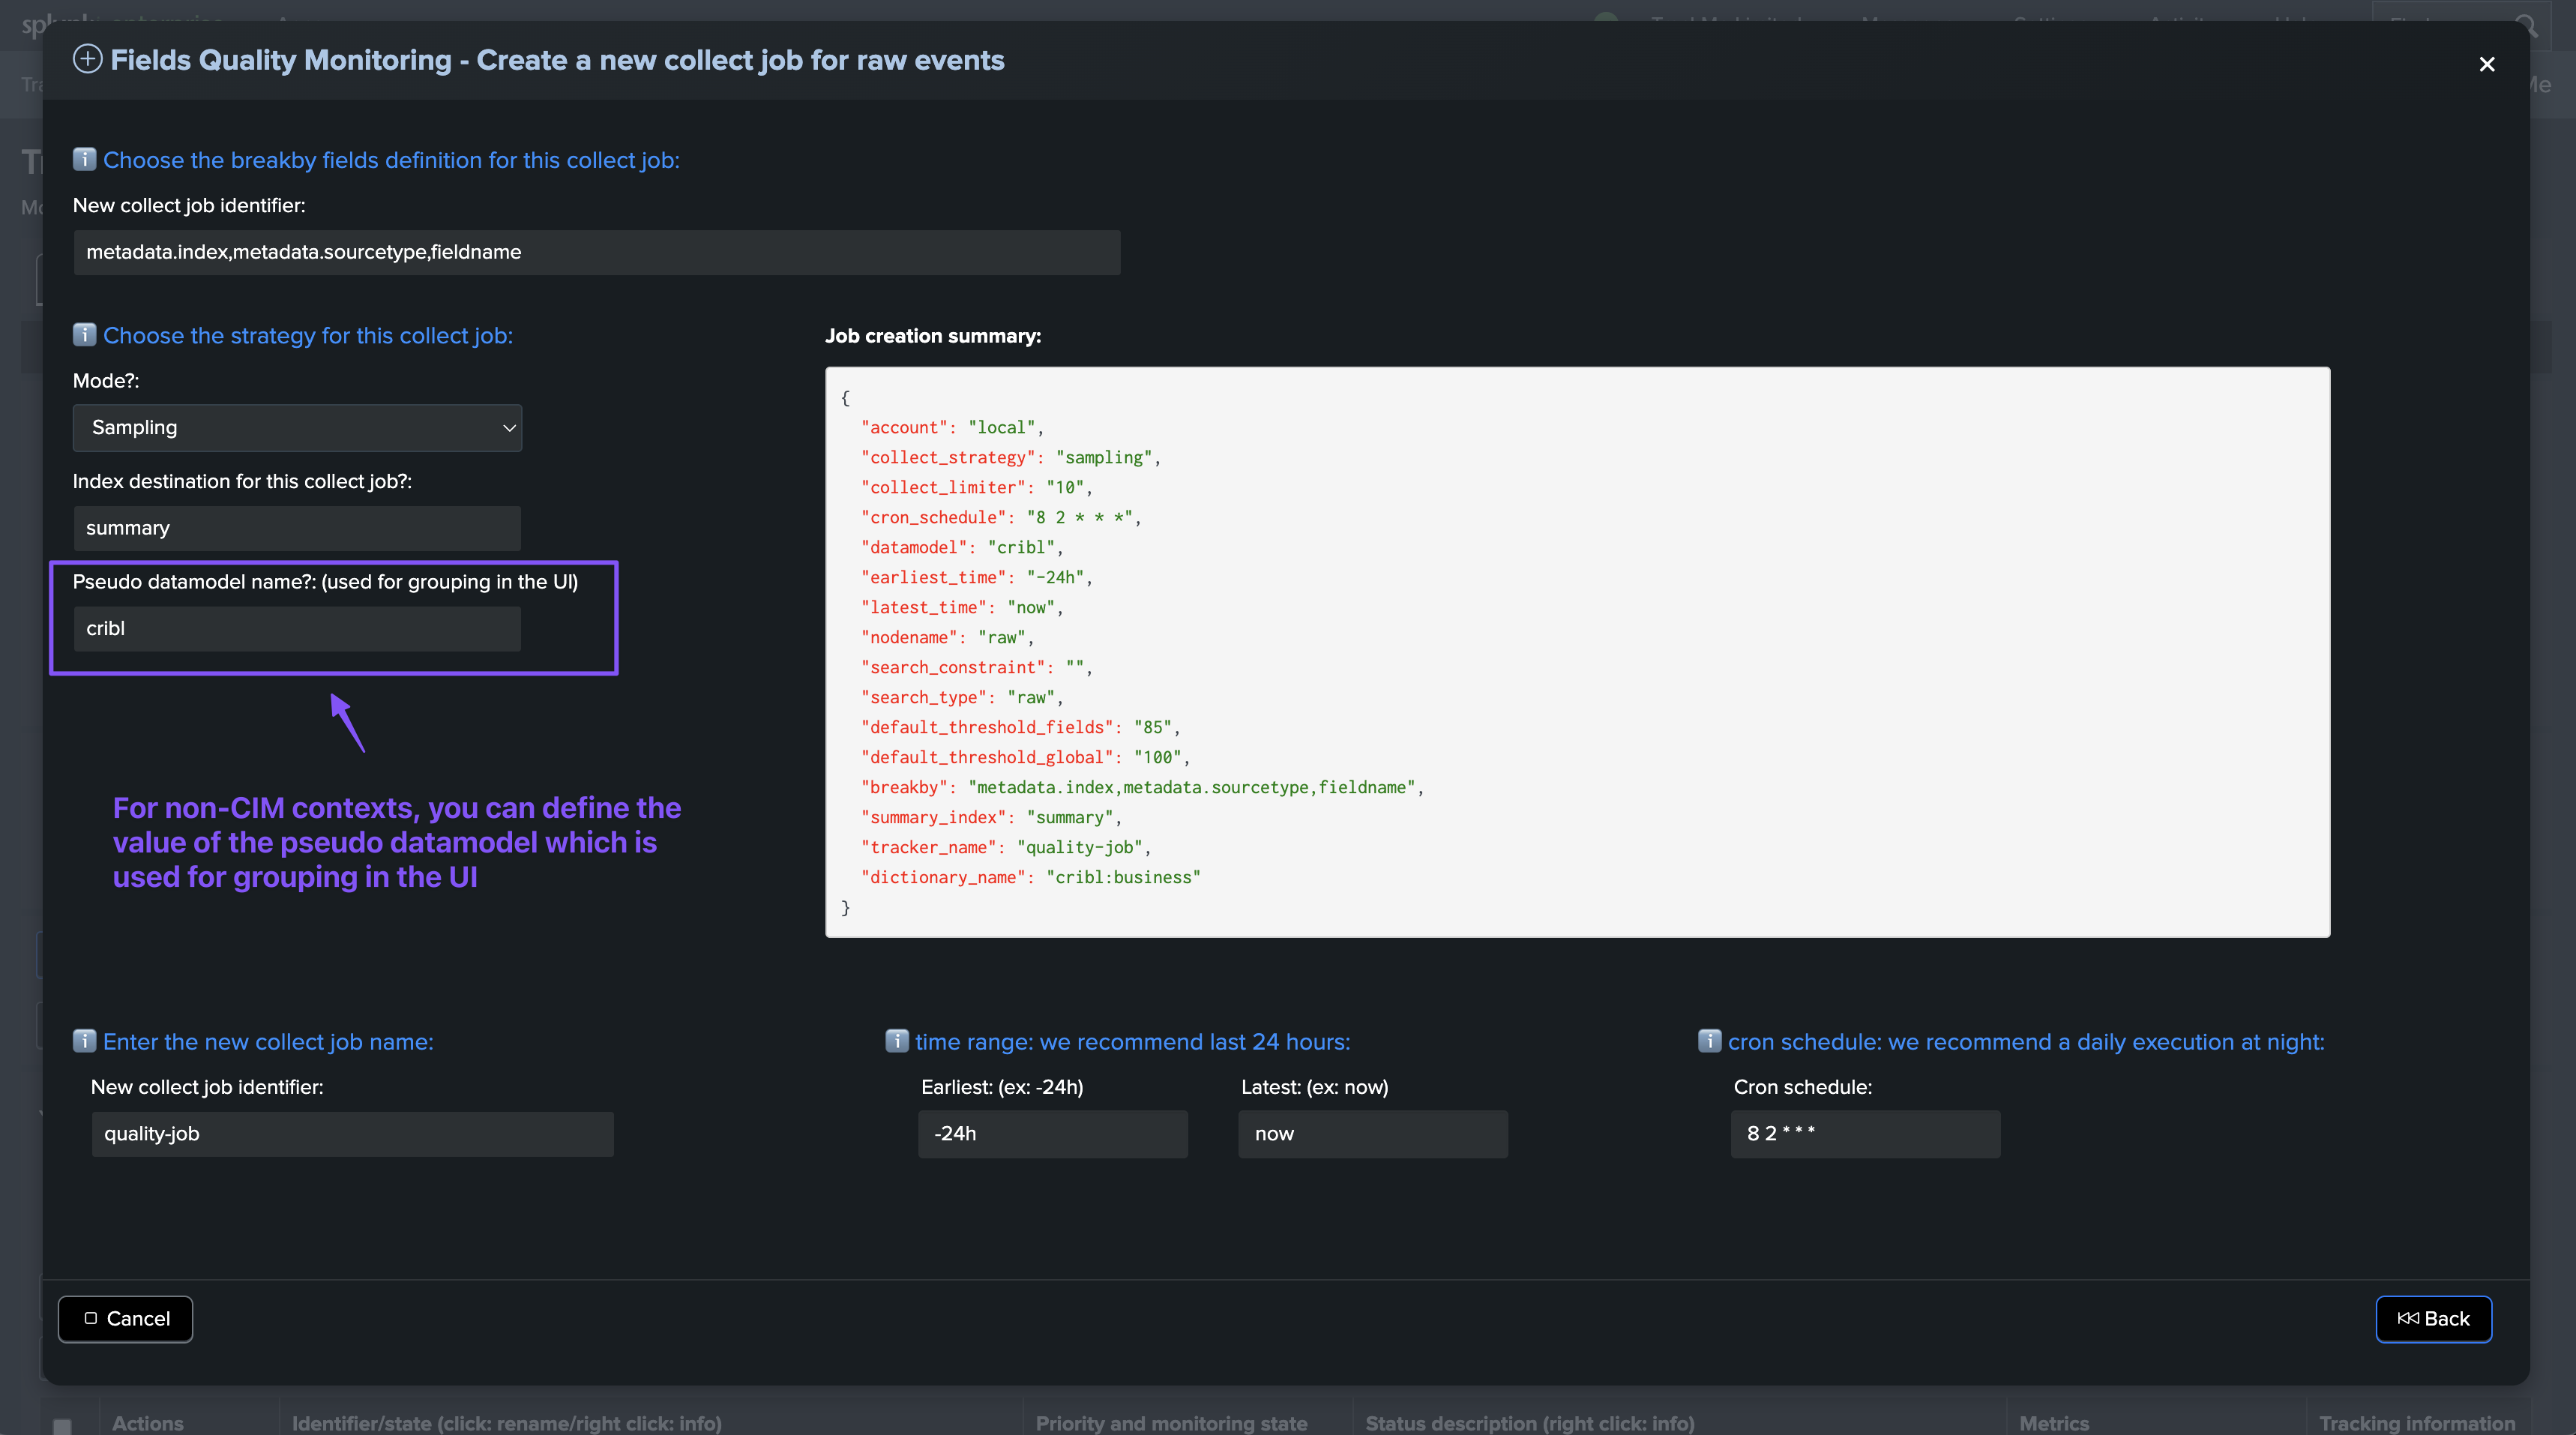
Collect job main settings
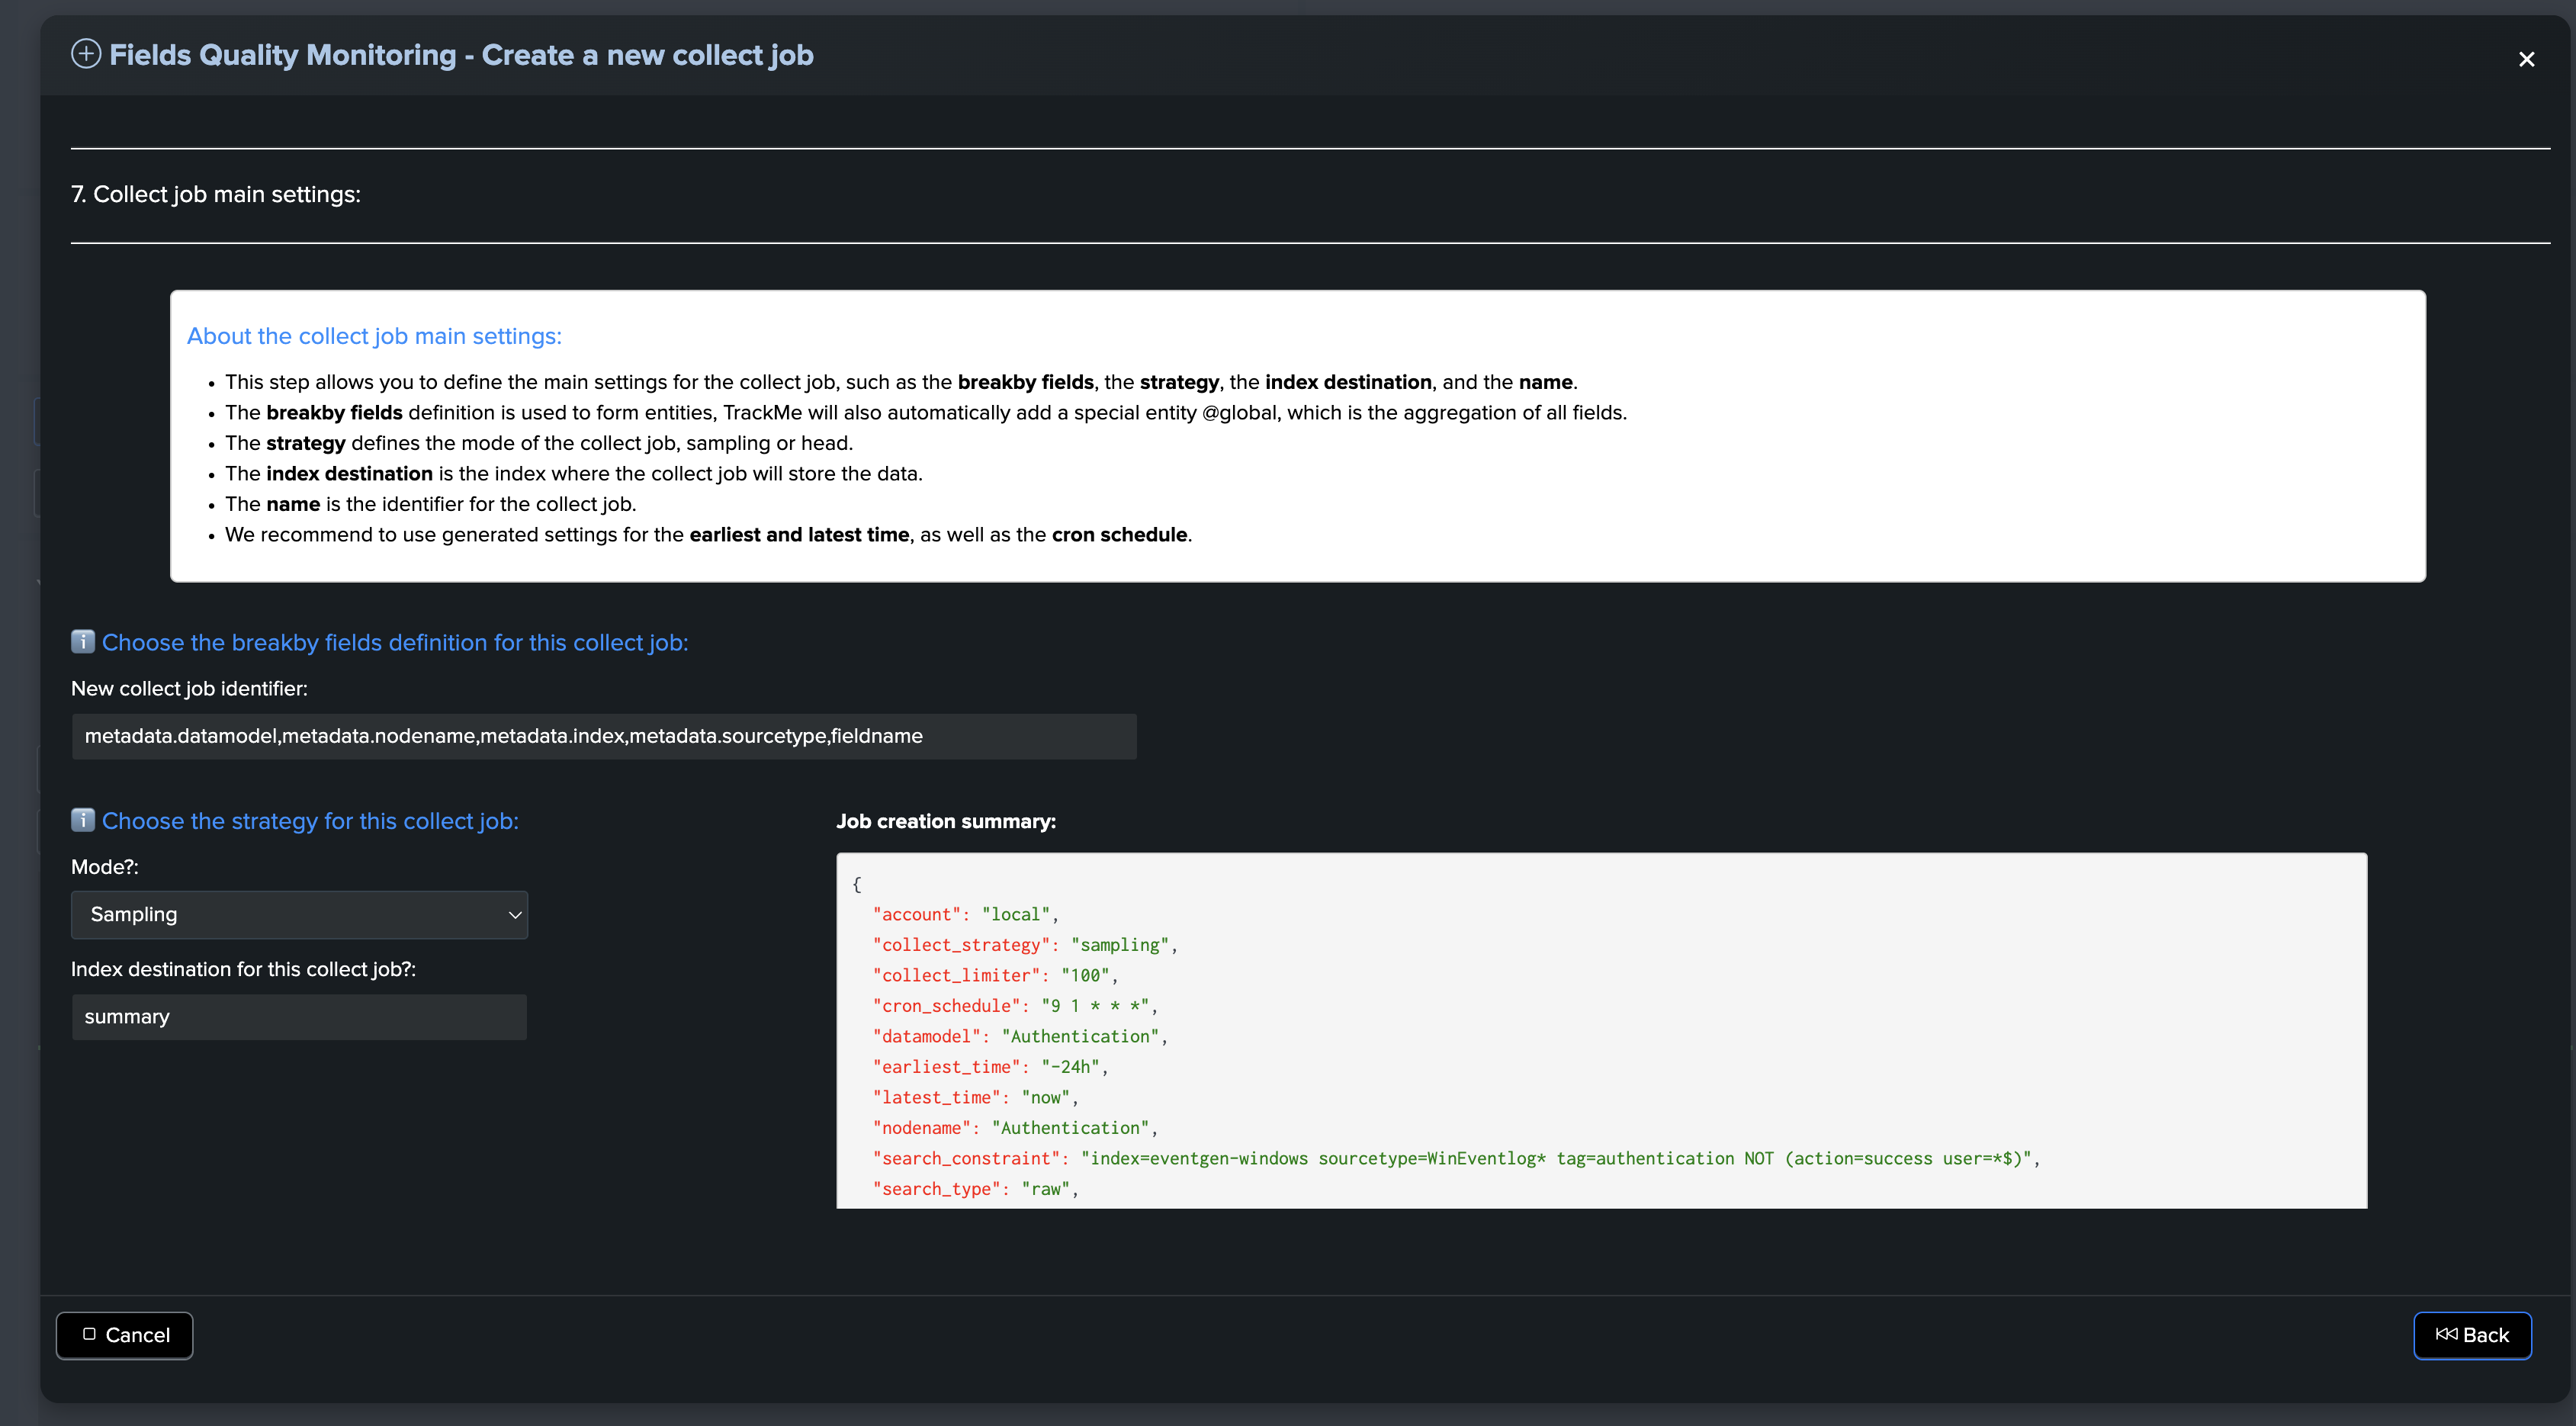
About the collect job main settings:
This step allows you to define the main settings for the collect job, such as the breakby fields, strategy, index destination, and name.
The breakby fields definition is used to form entities. TrackMe will also automatically add a special entity @global, which is the aggregation of all fields.
The strategy defines the mode of the collect job: sampling or head.
The index destination is the index where the collect job will store the data.
The name is the identifier for the collect job.
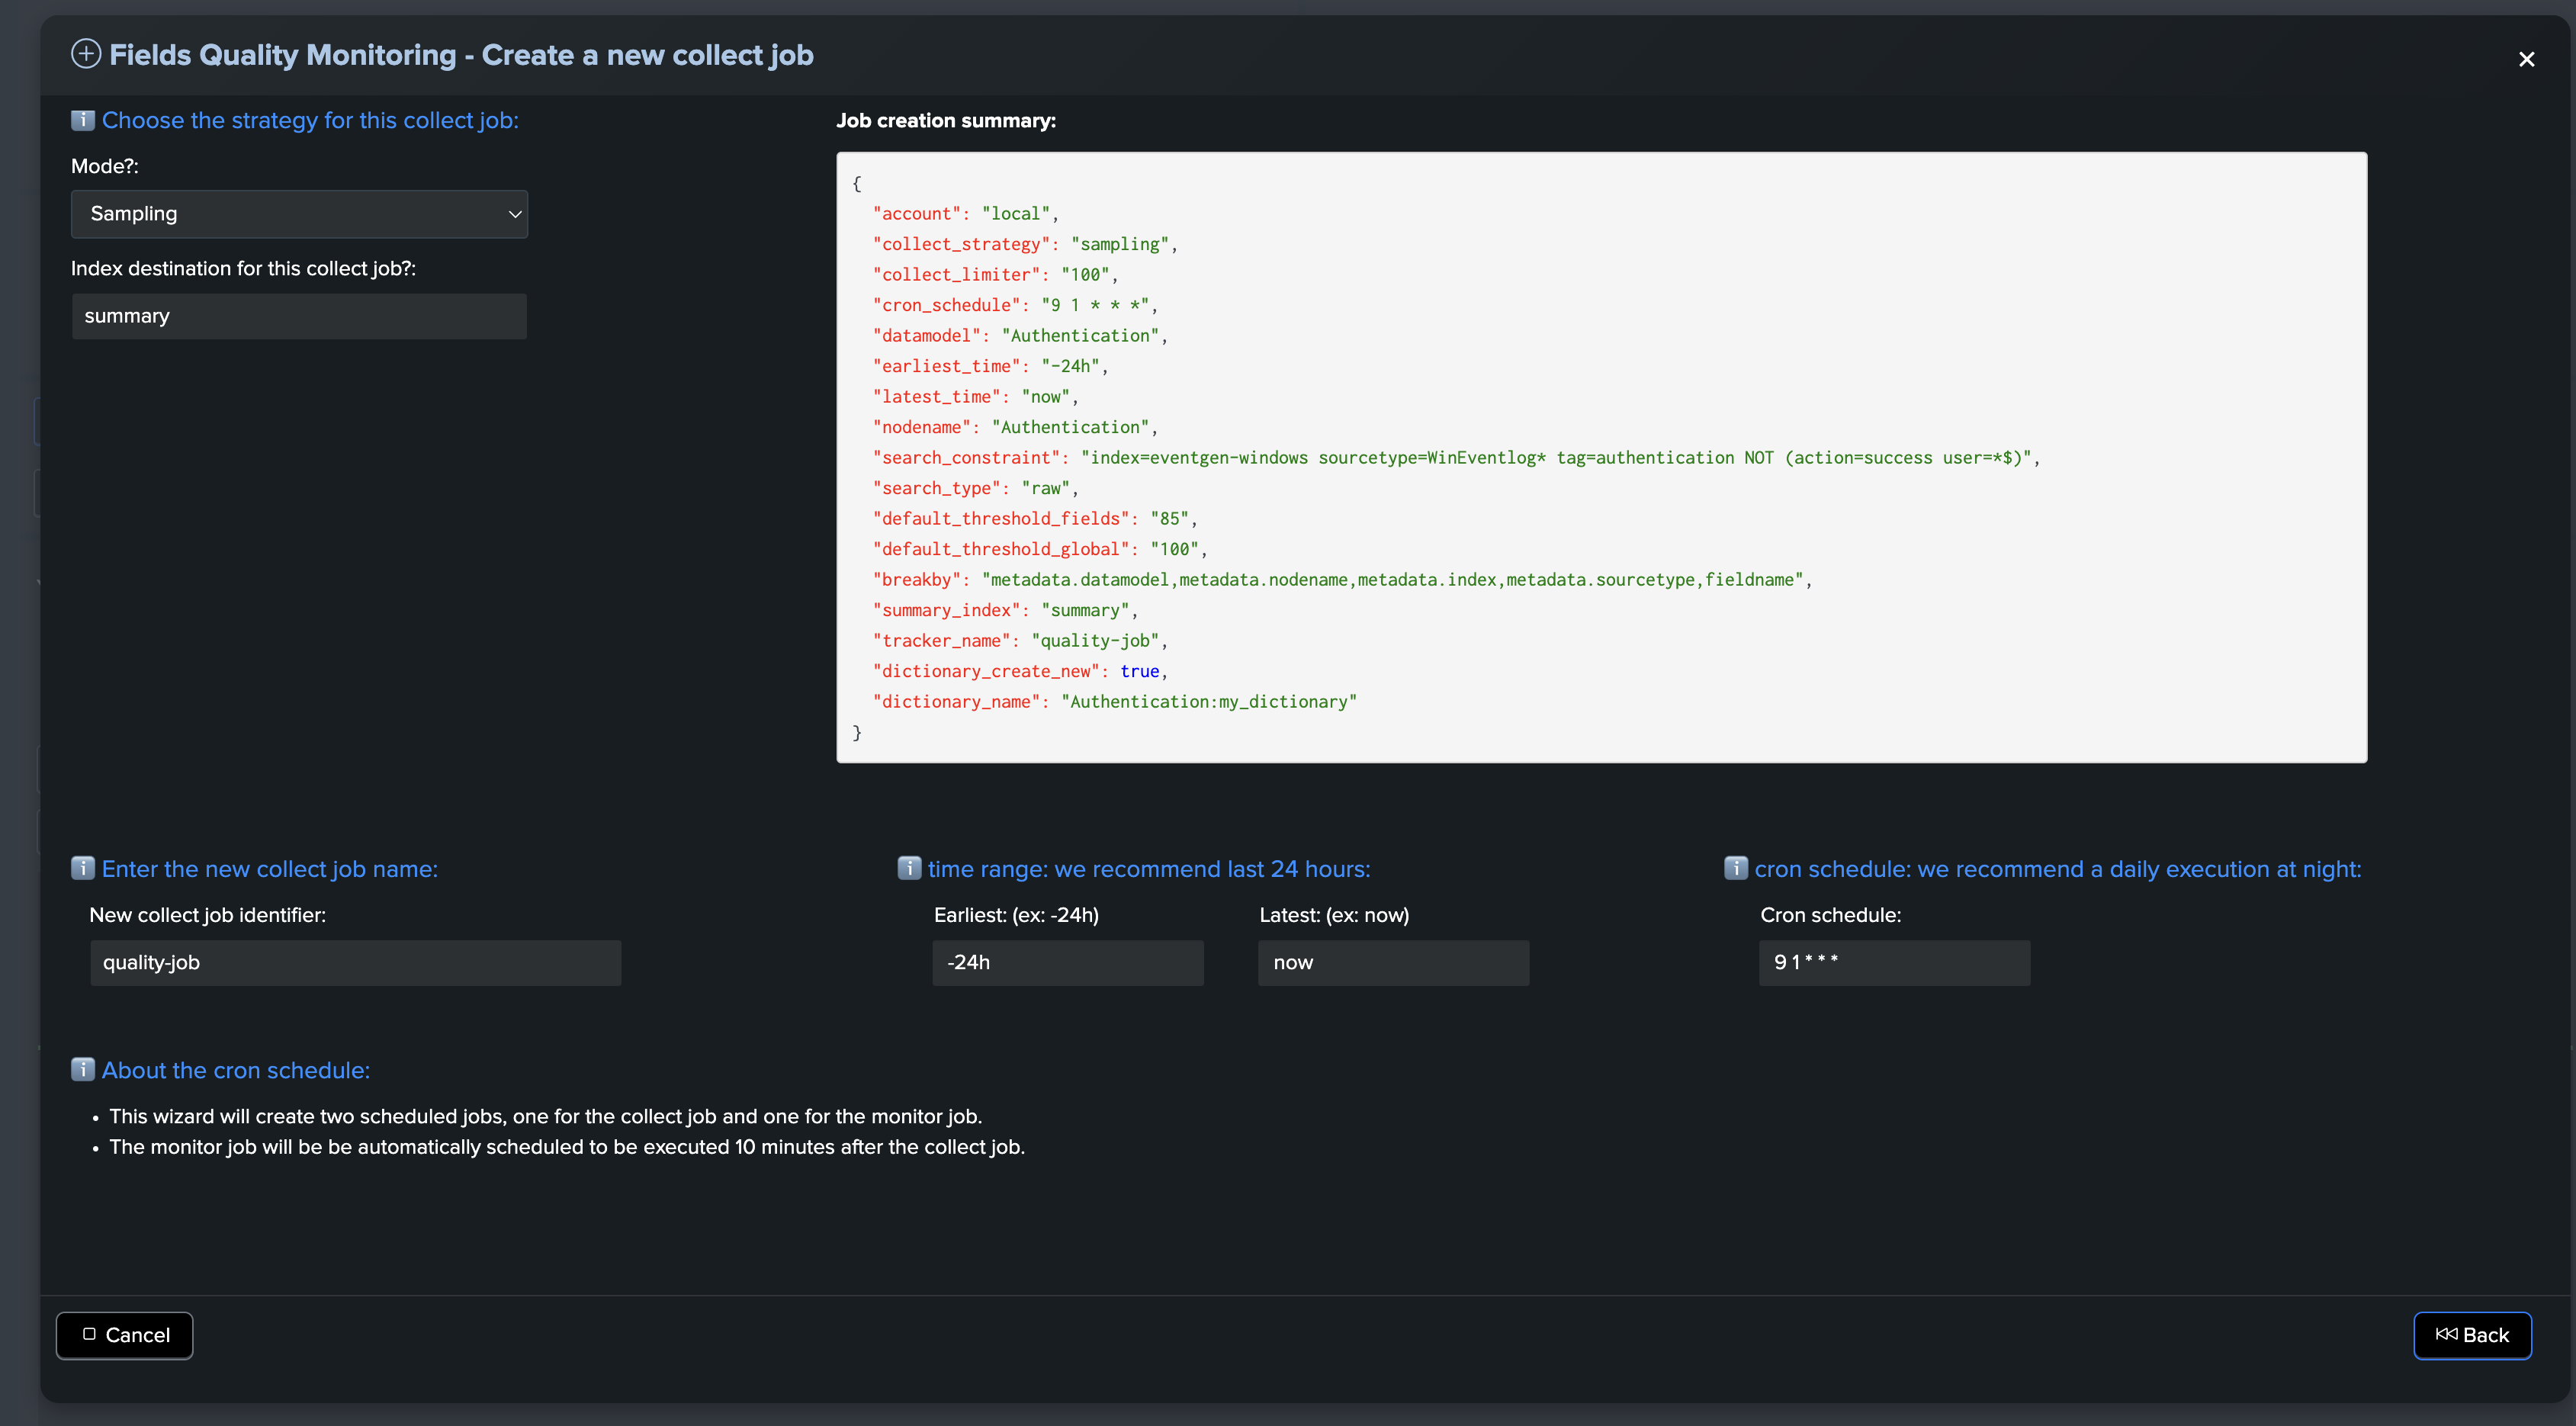
We recommend using generated settings for the earliest and latest time, as well as the cron schedule.
Hint
About the cron schedule:
This wizard will create two scheduled jobs, one for the collect job and one for the monitor job.
The monitor job will be automatically scheduled to be executed 10 minutes after the collect job.
Validate the collect job creation
Finally! Hit the magic button and let TrackMe do the job.
Once created, you can immediately execute the collect phase of the job, then the monitor phase to start seeing entities in TrackMe:
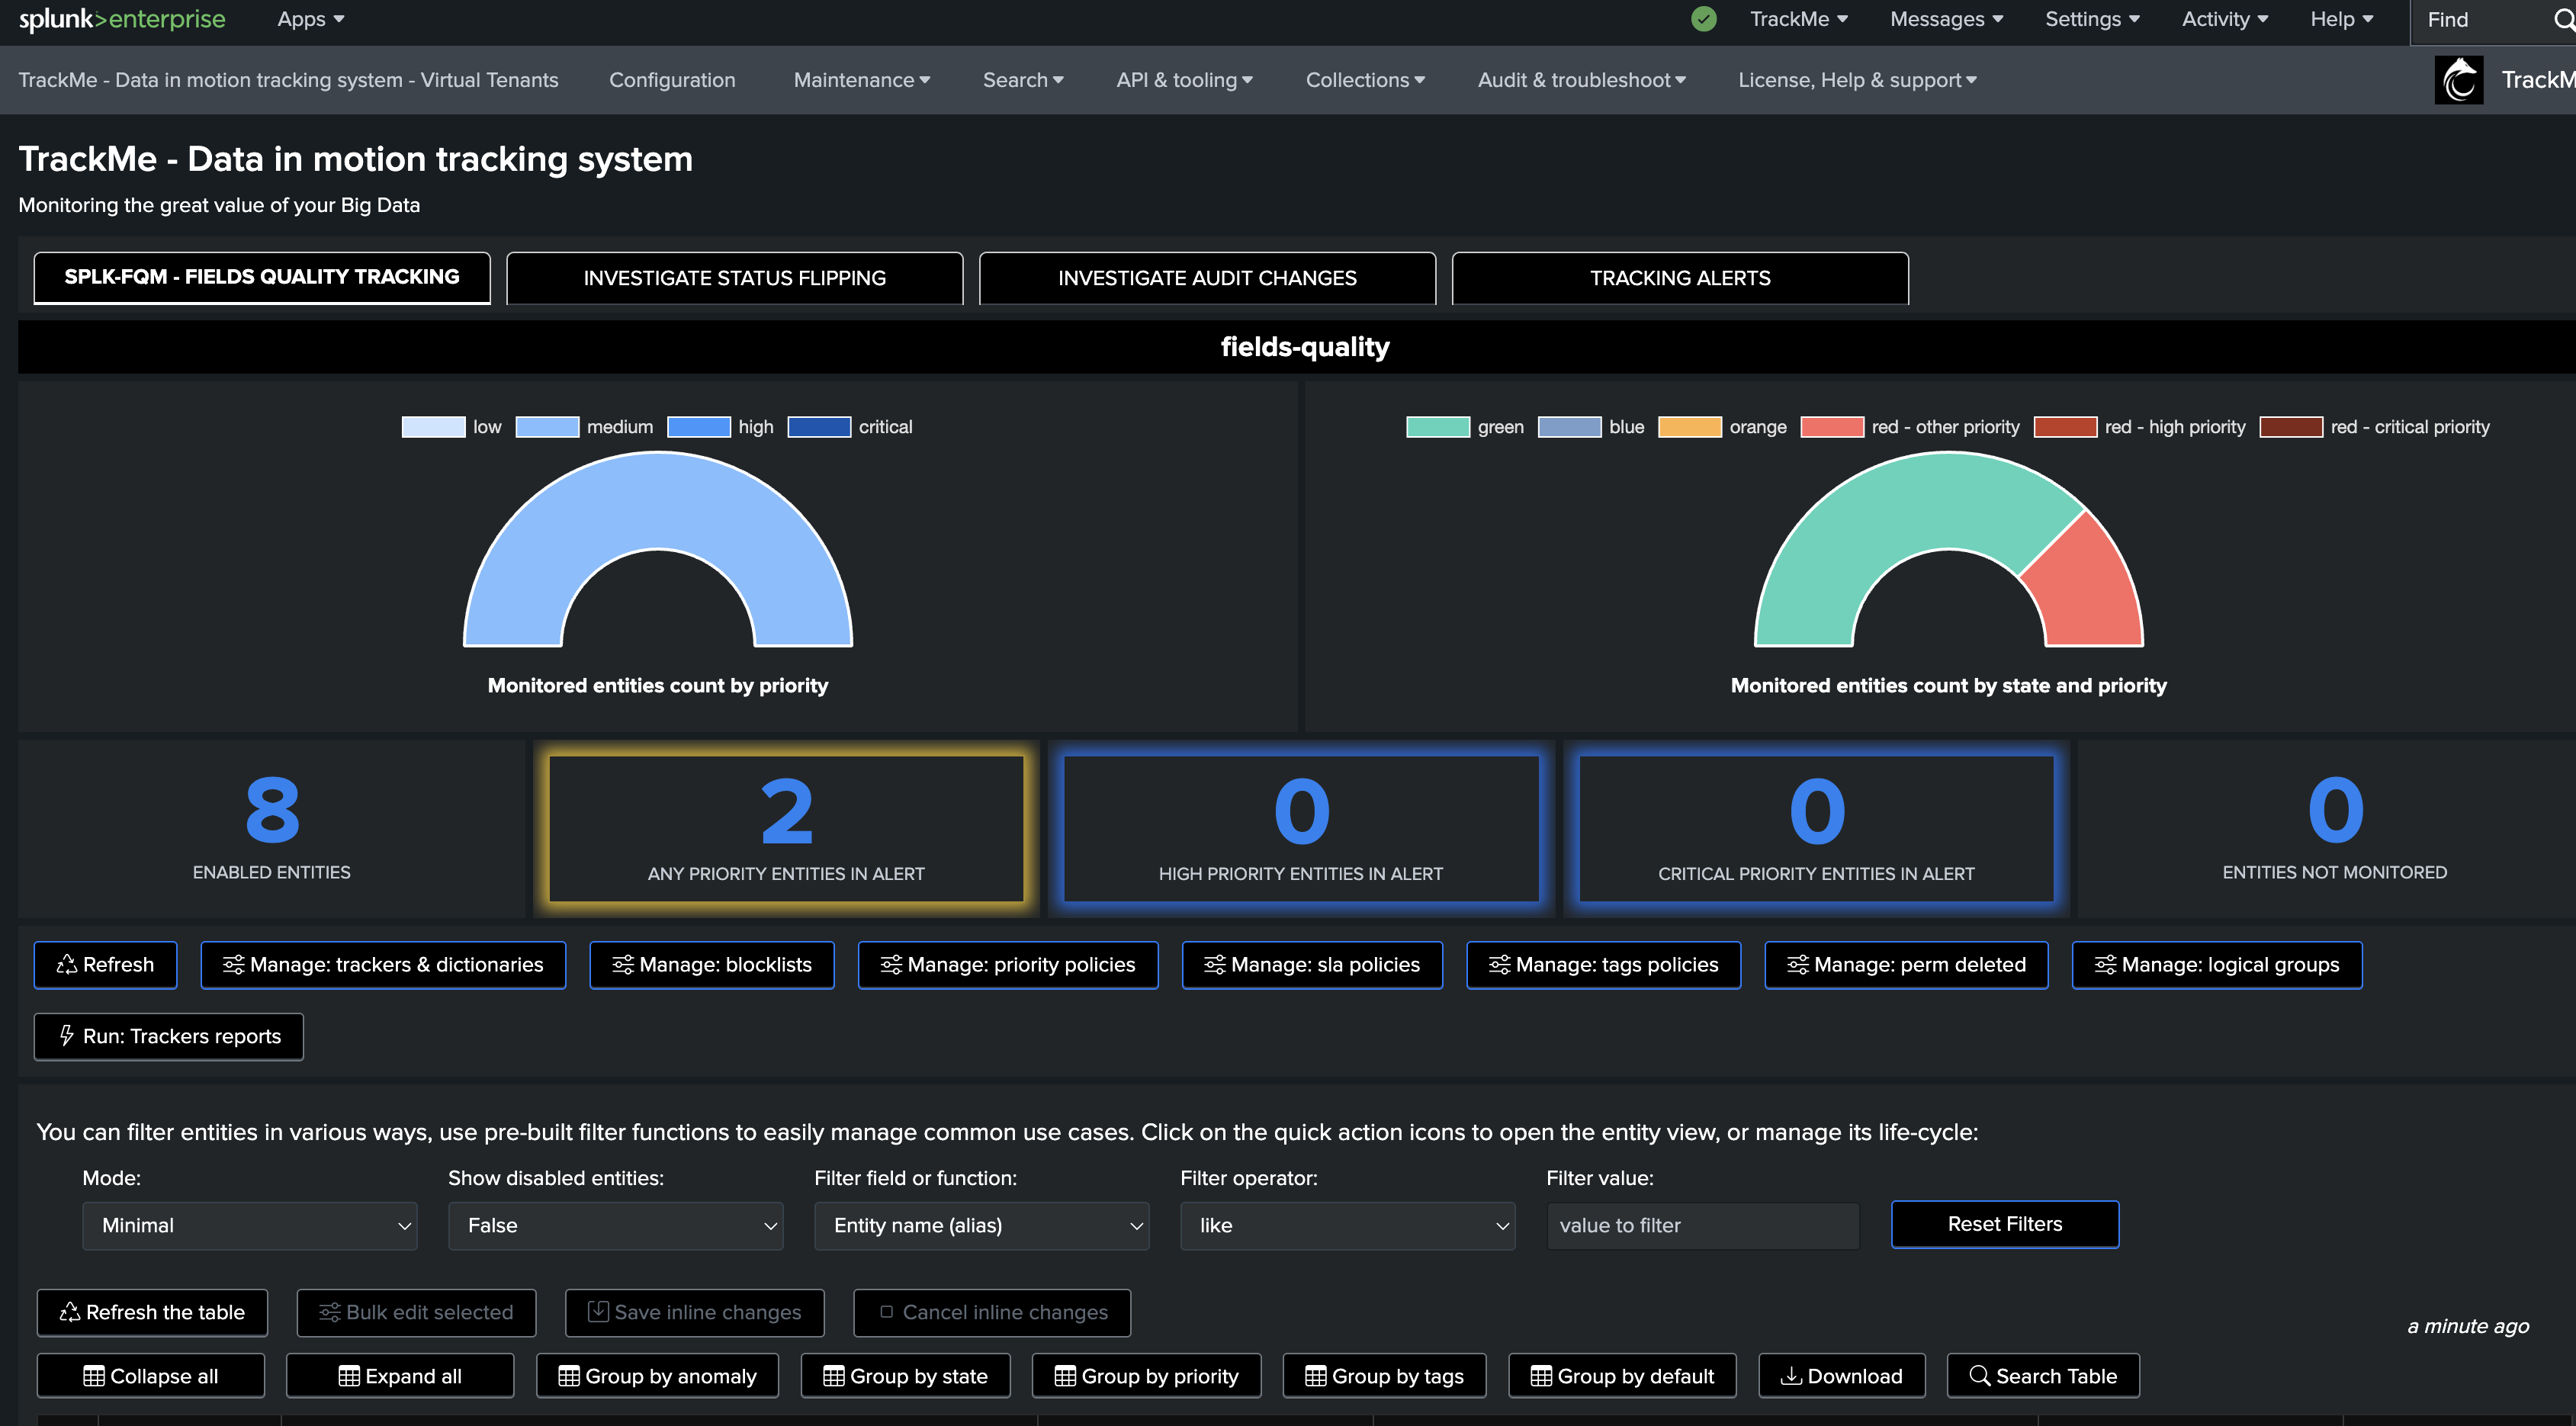
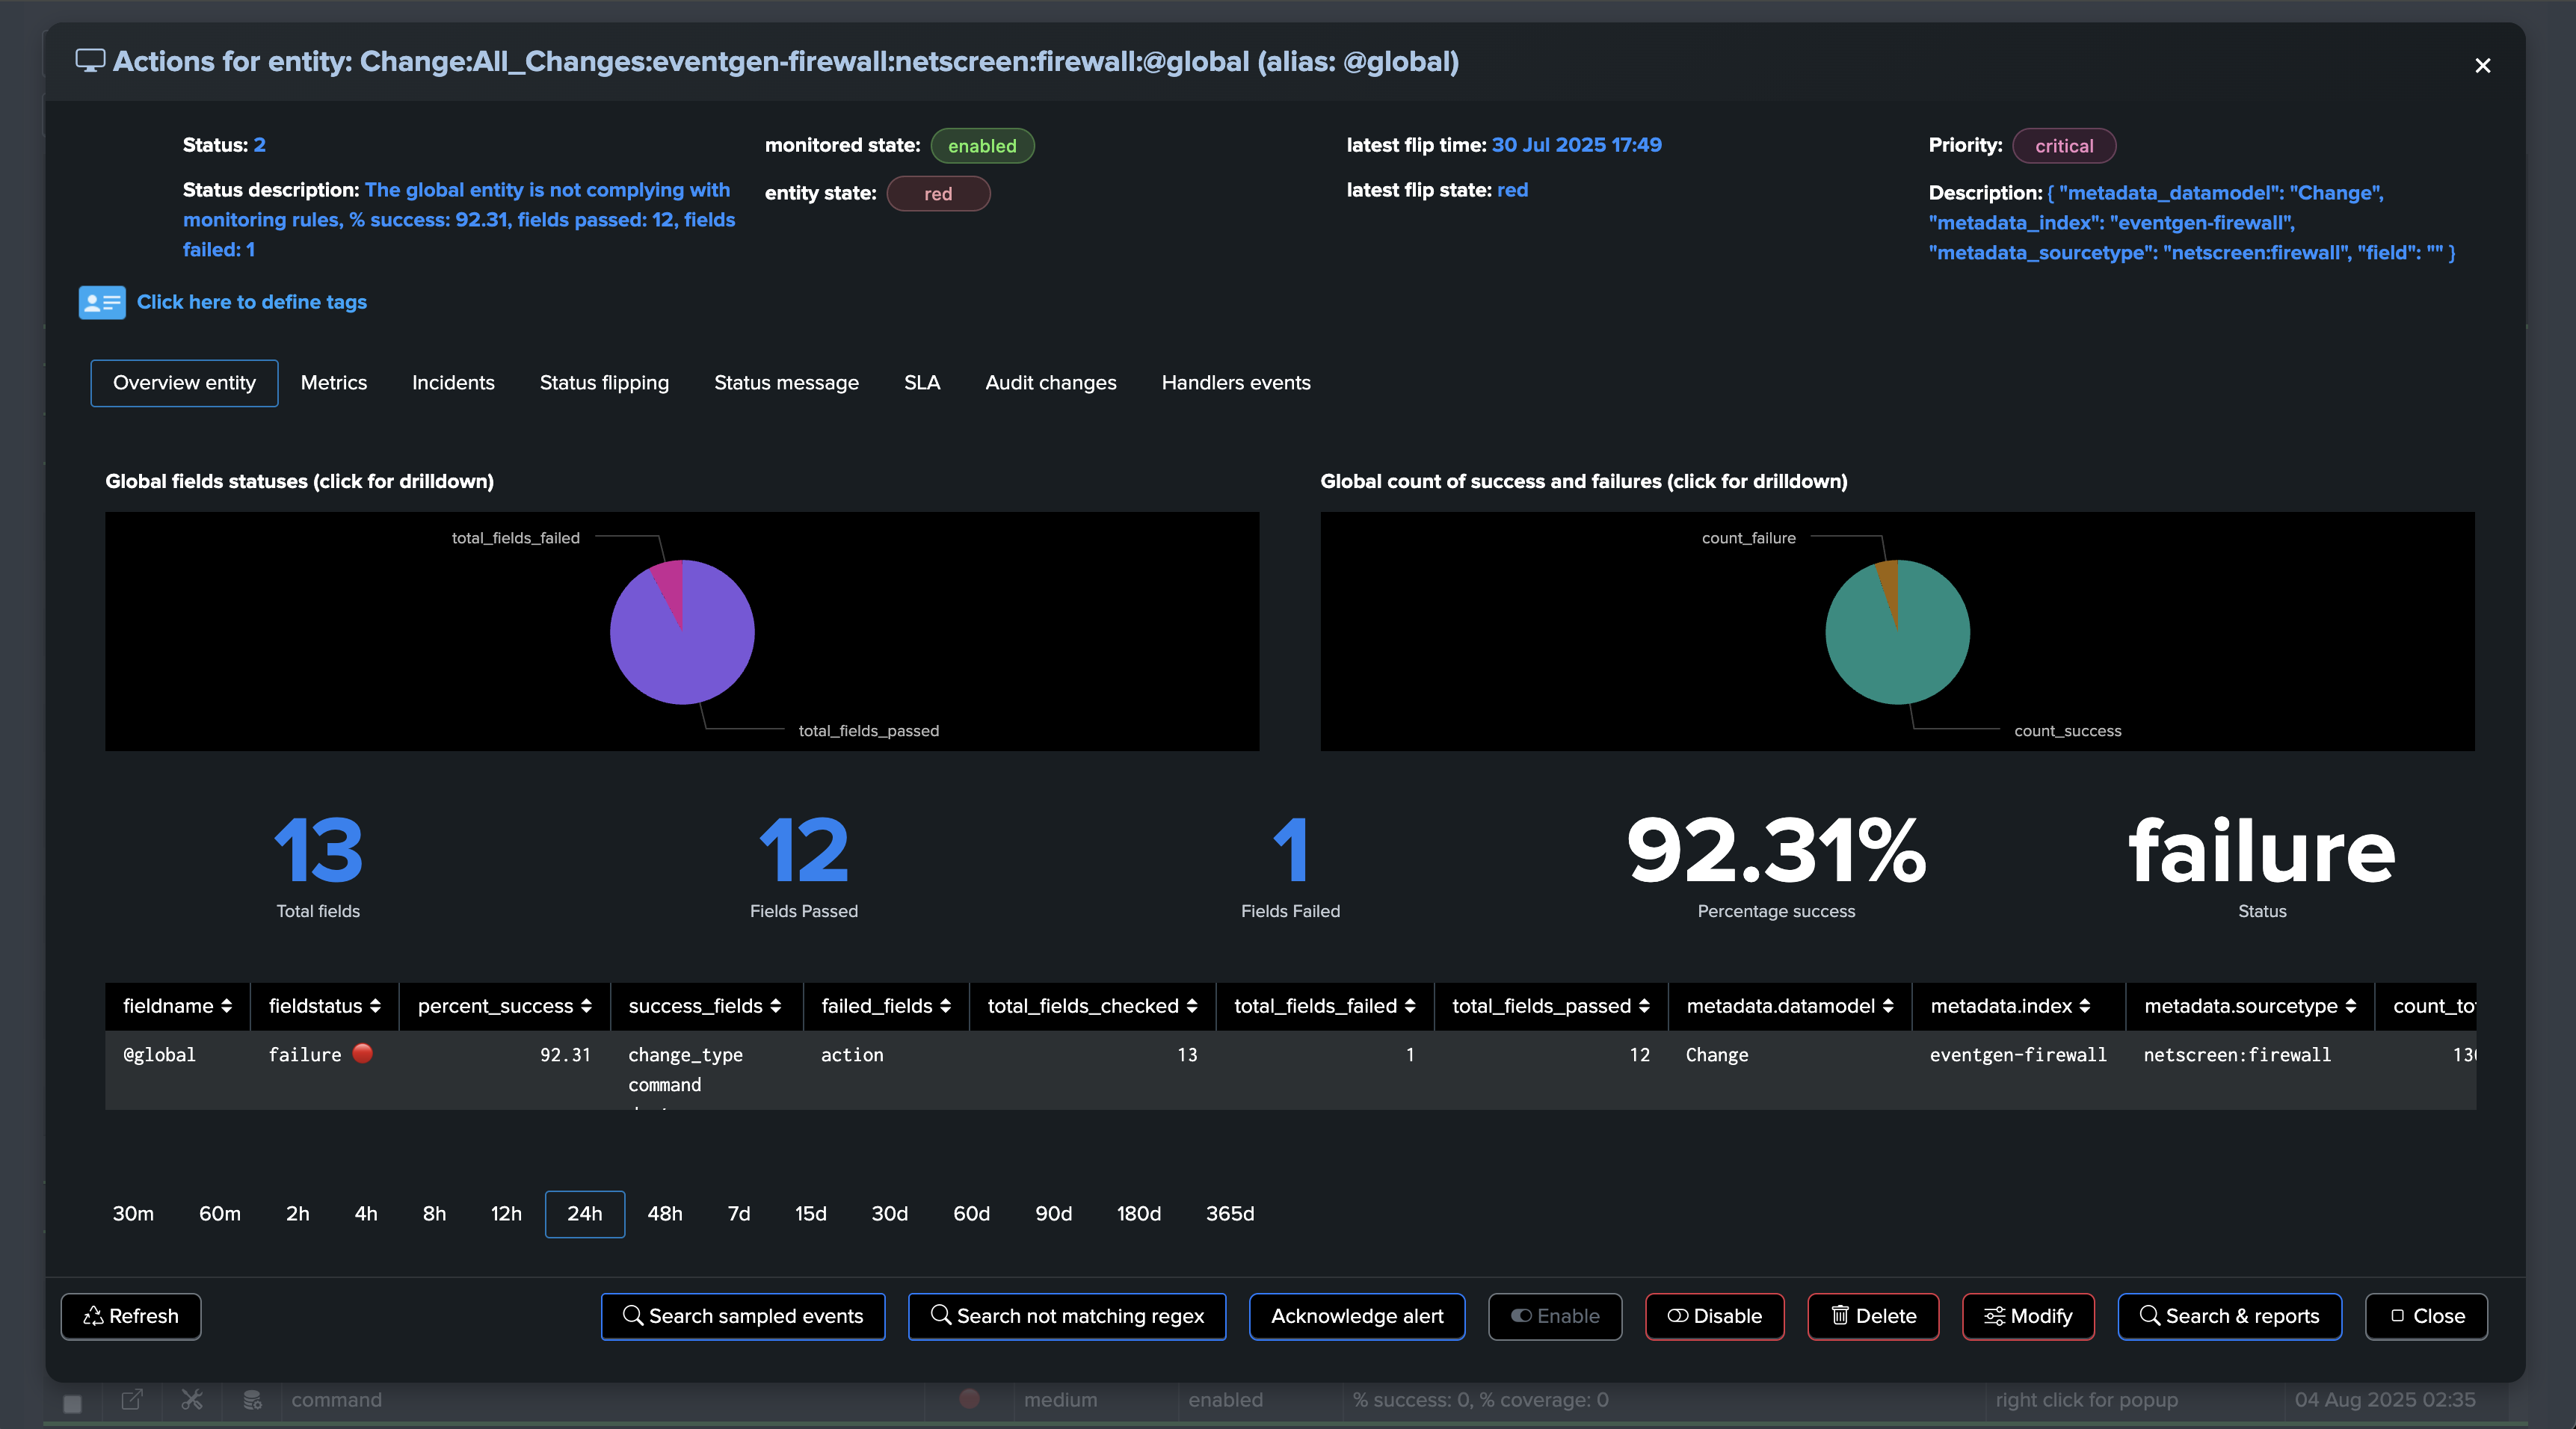
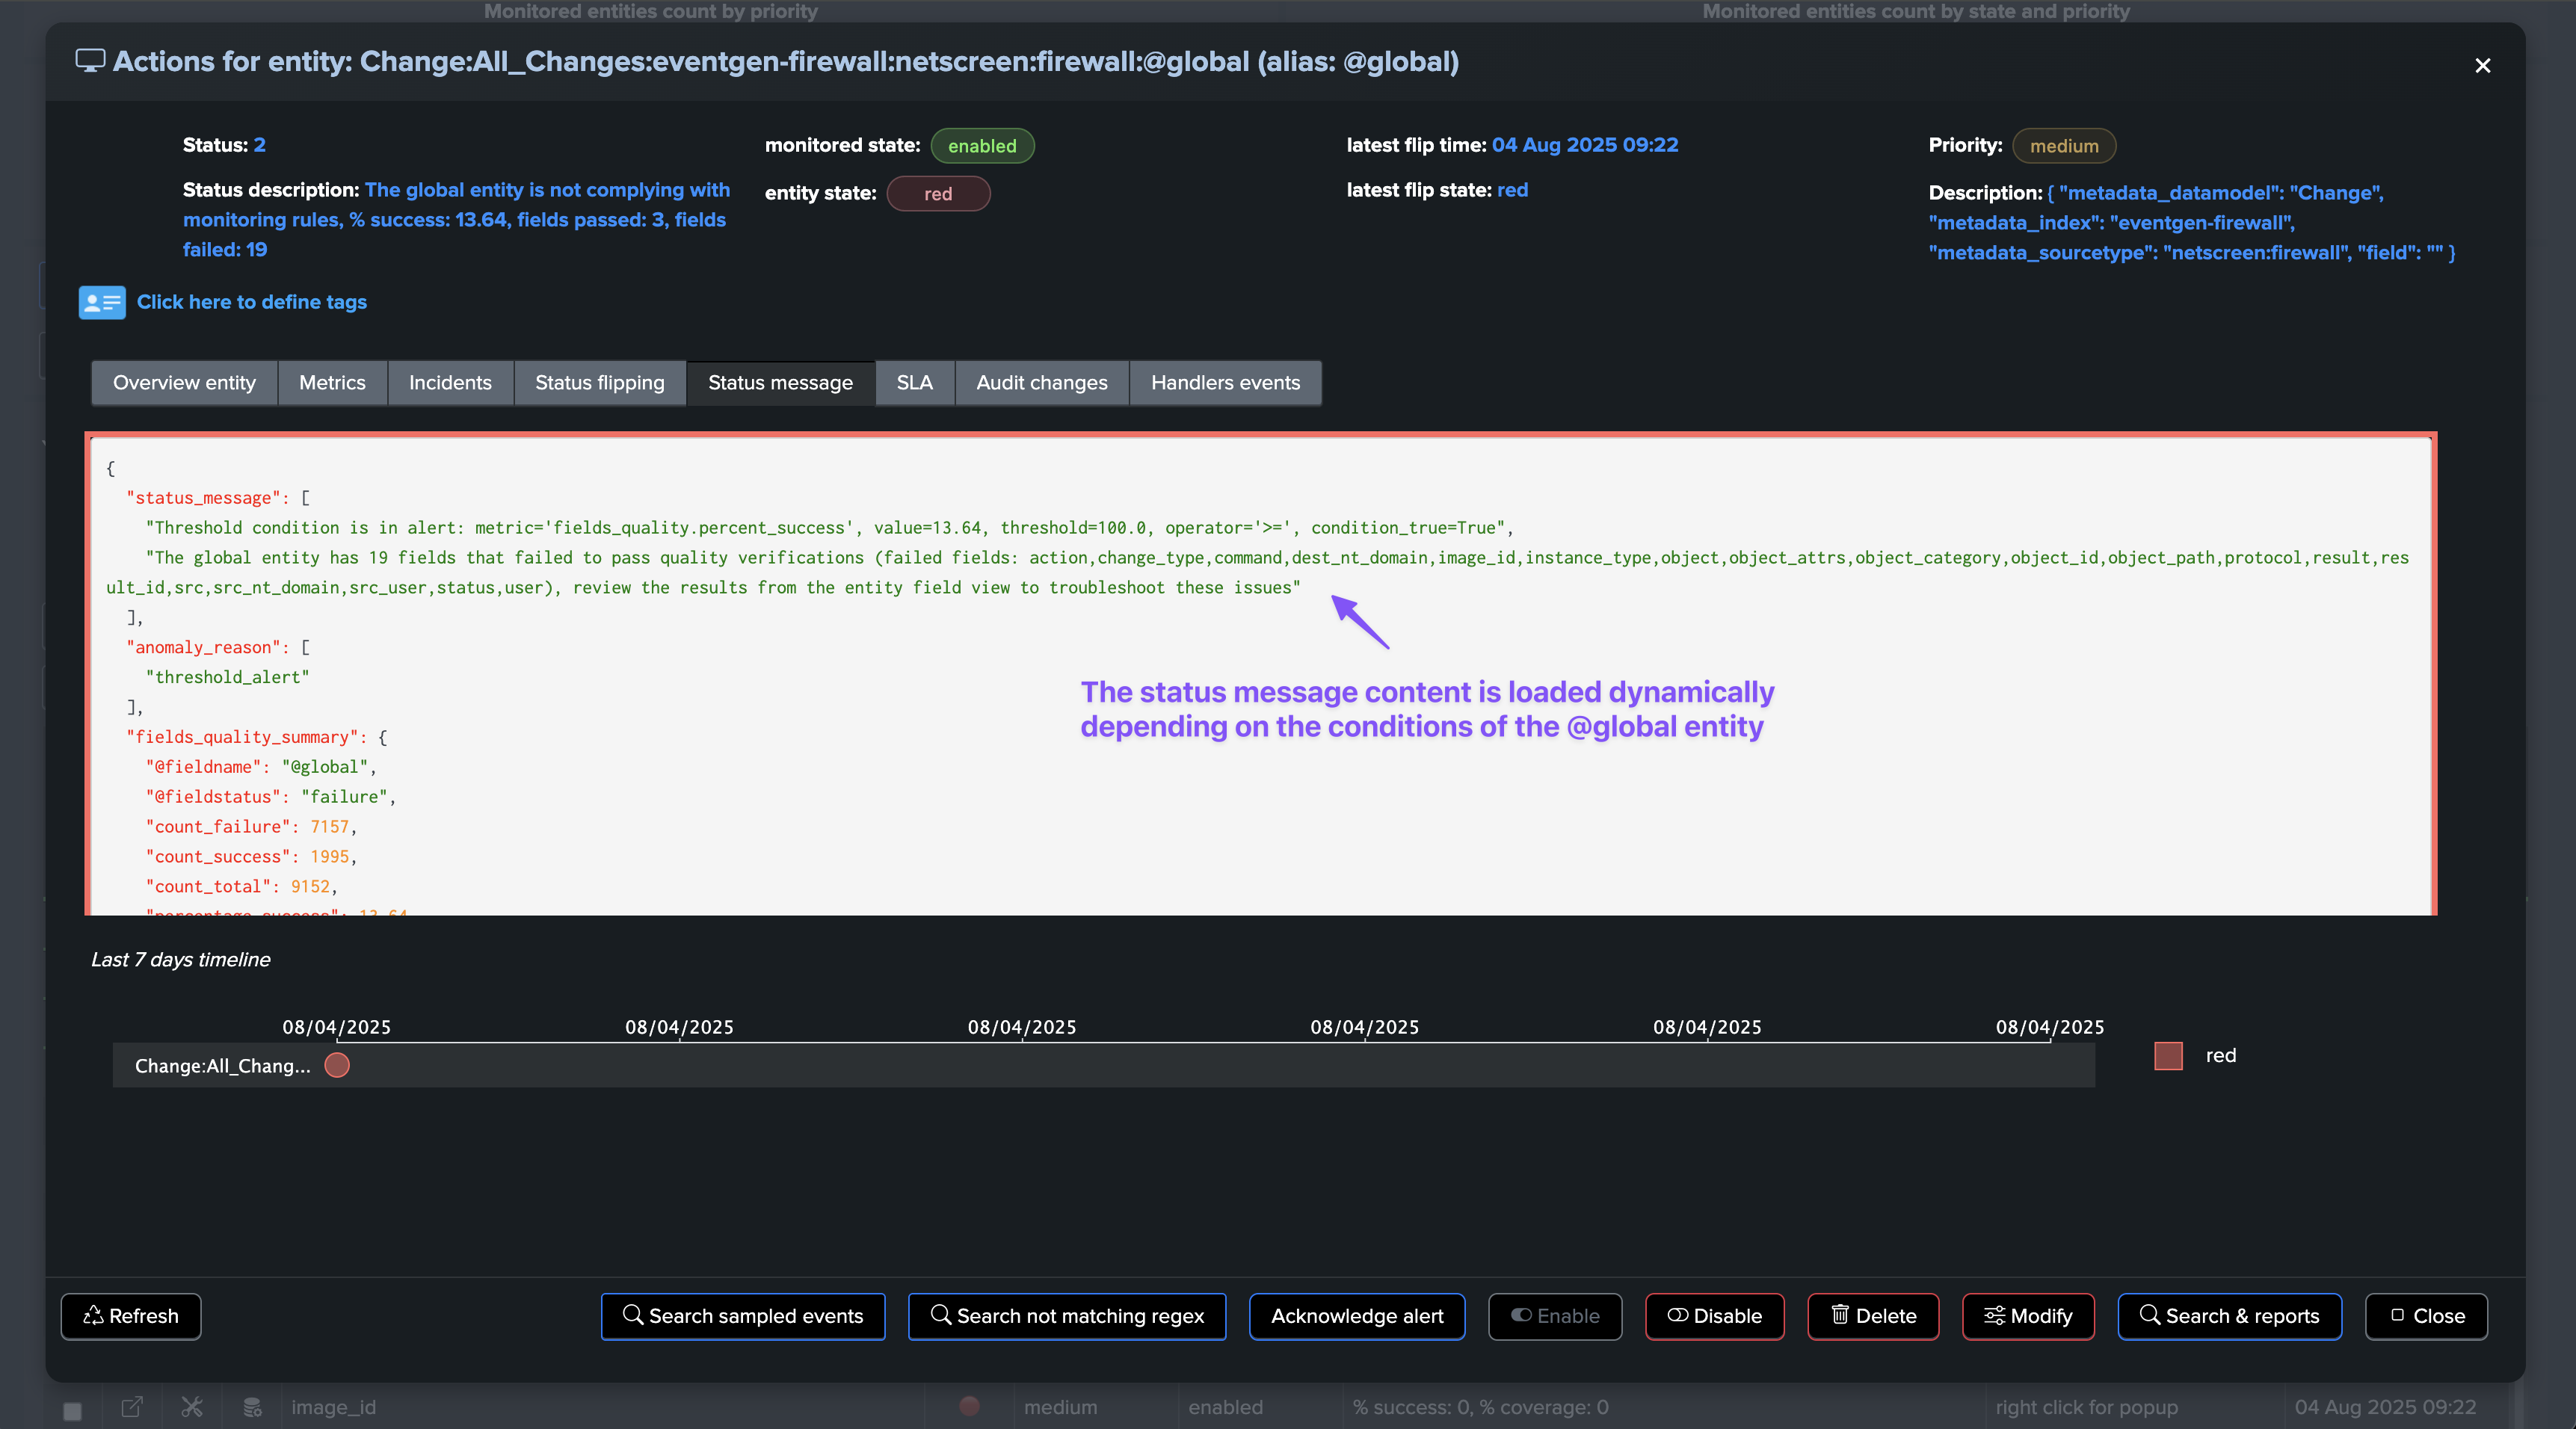
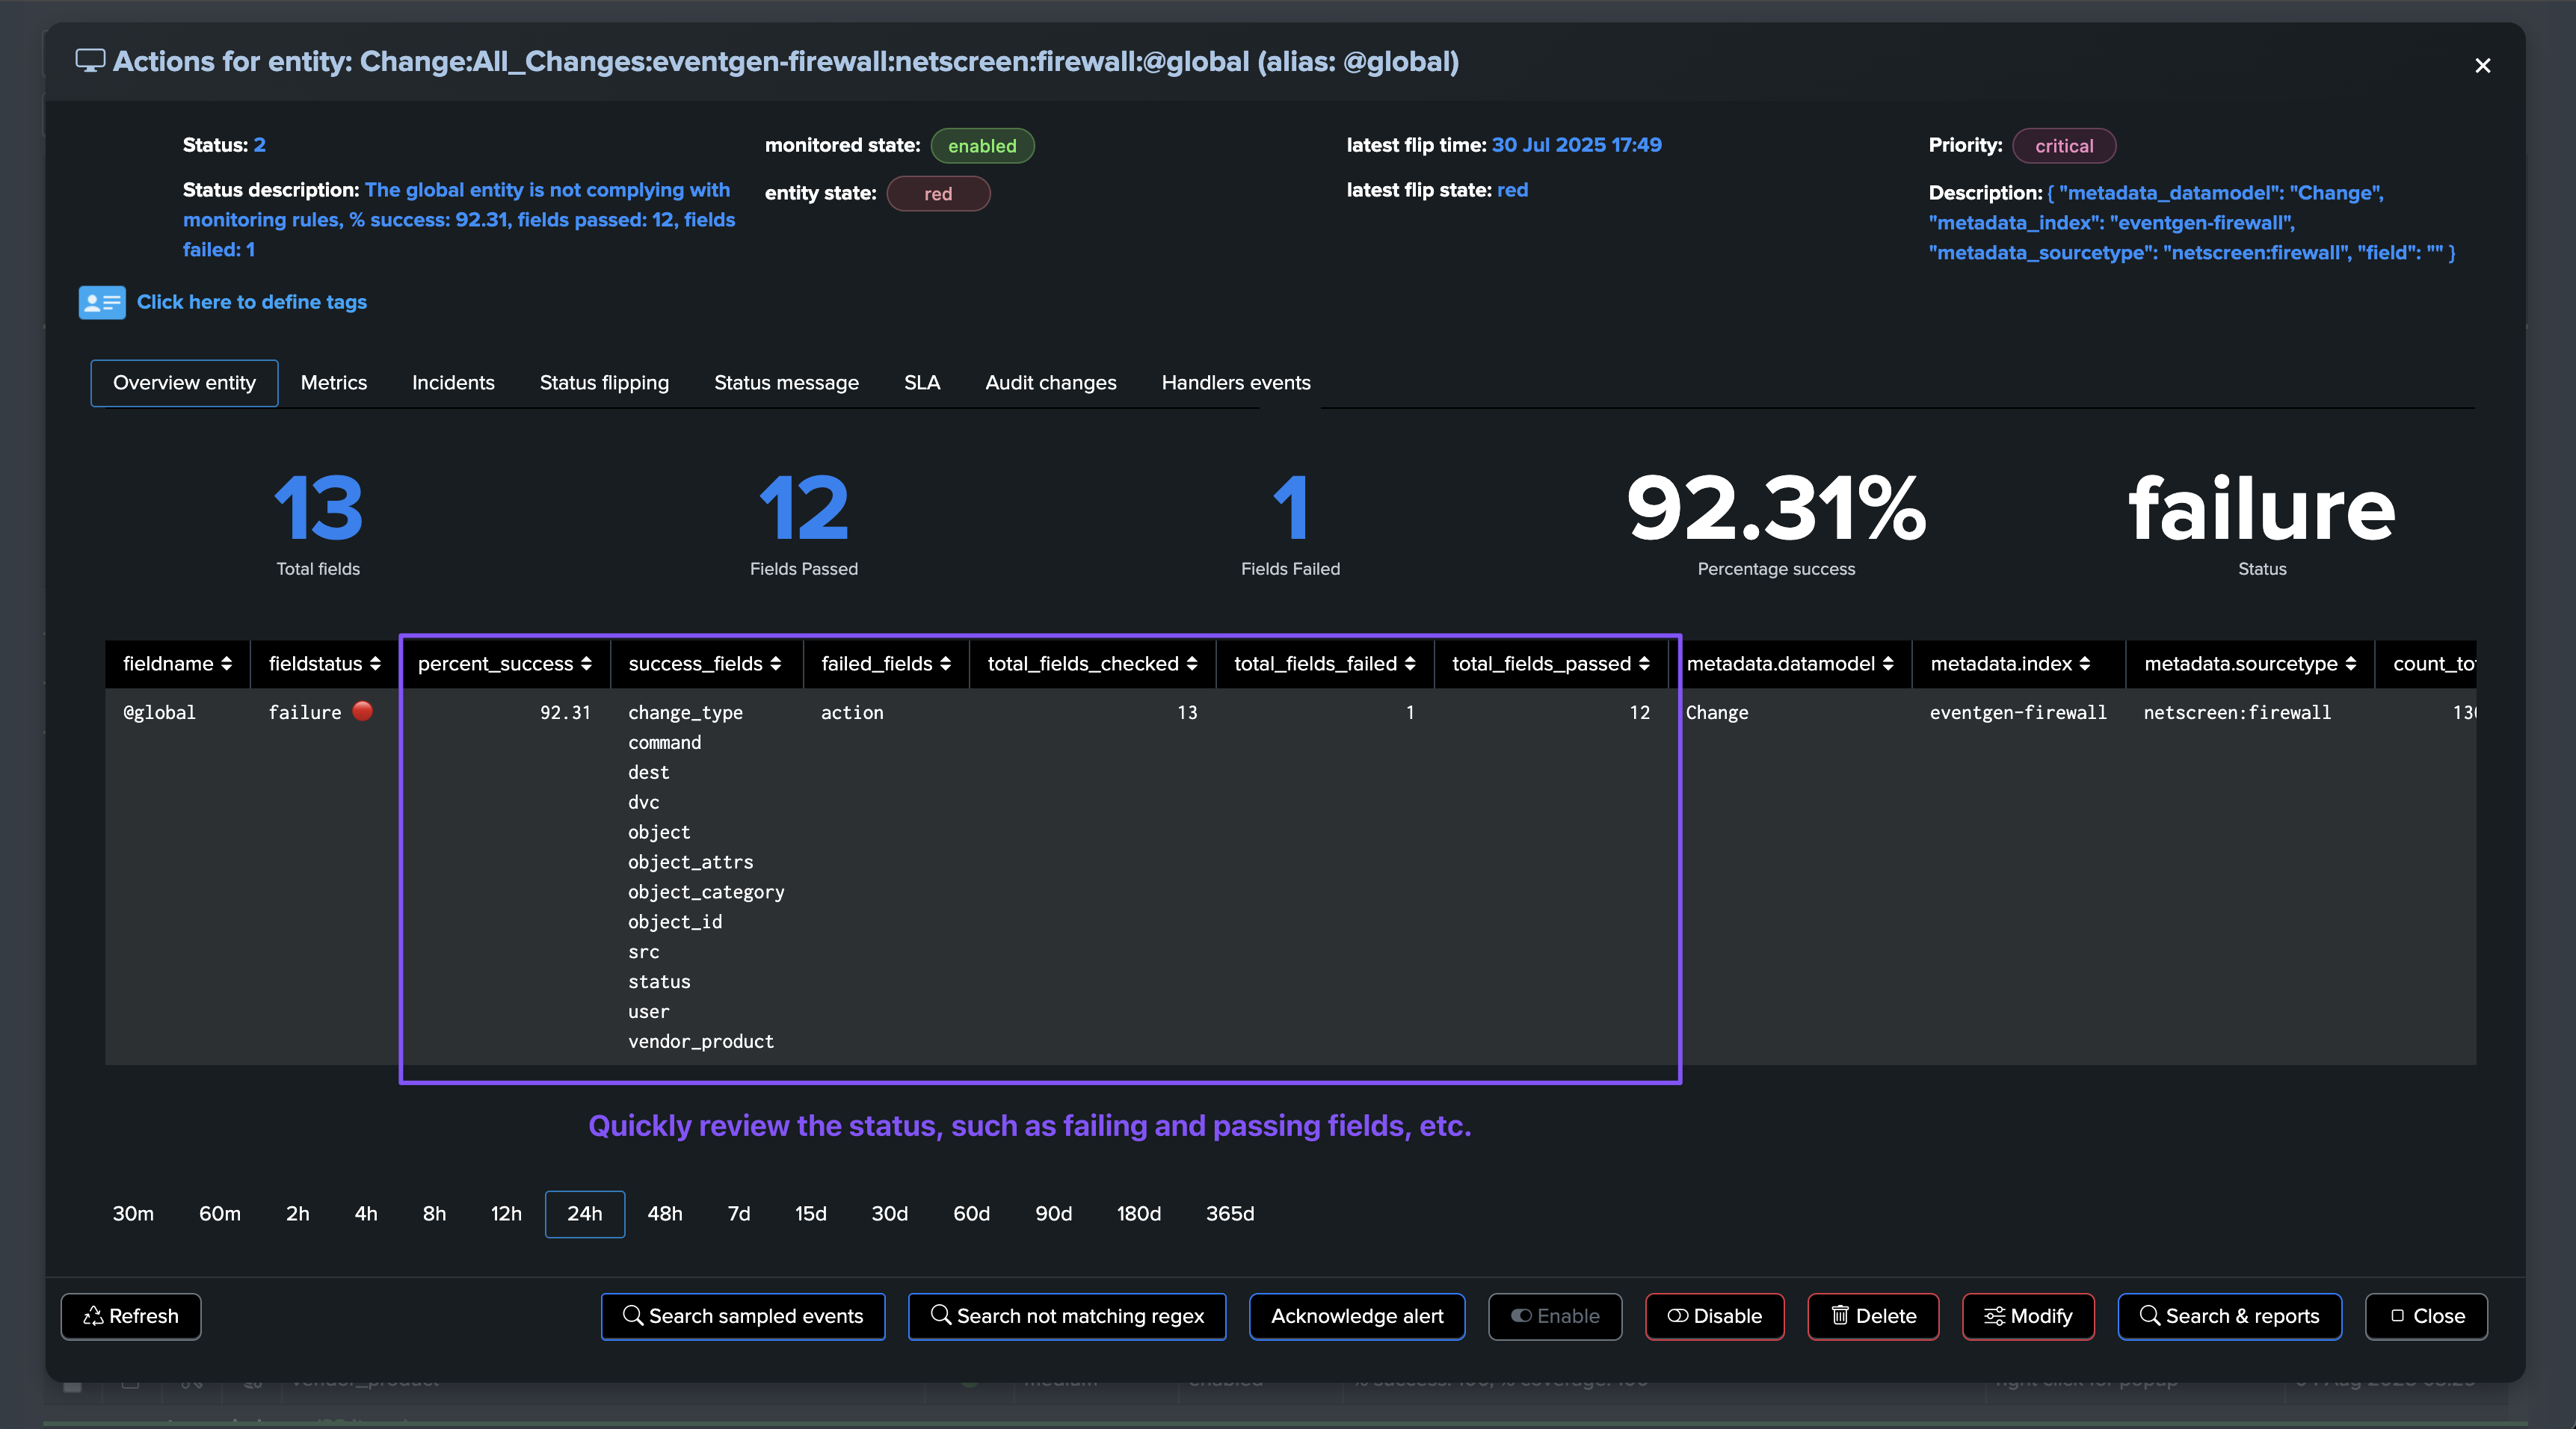
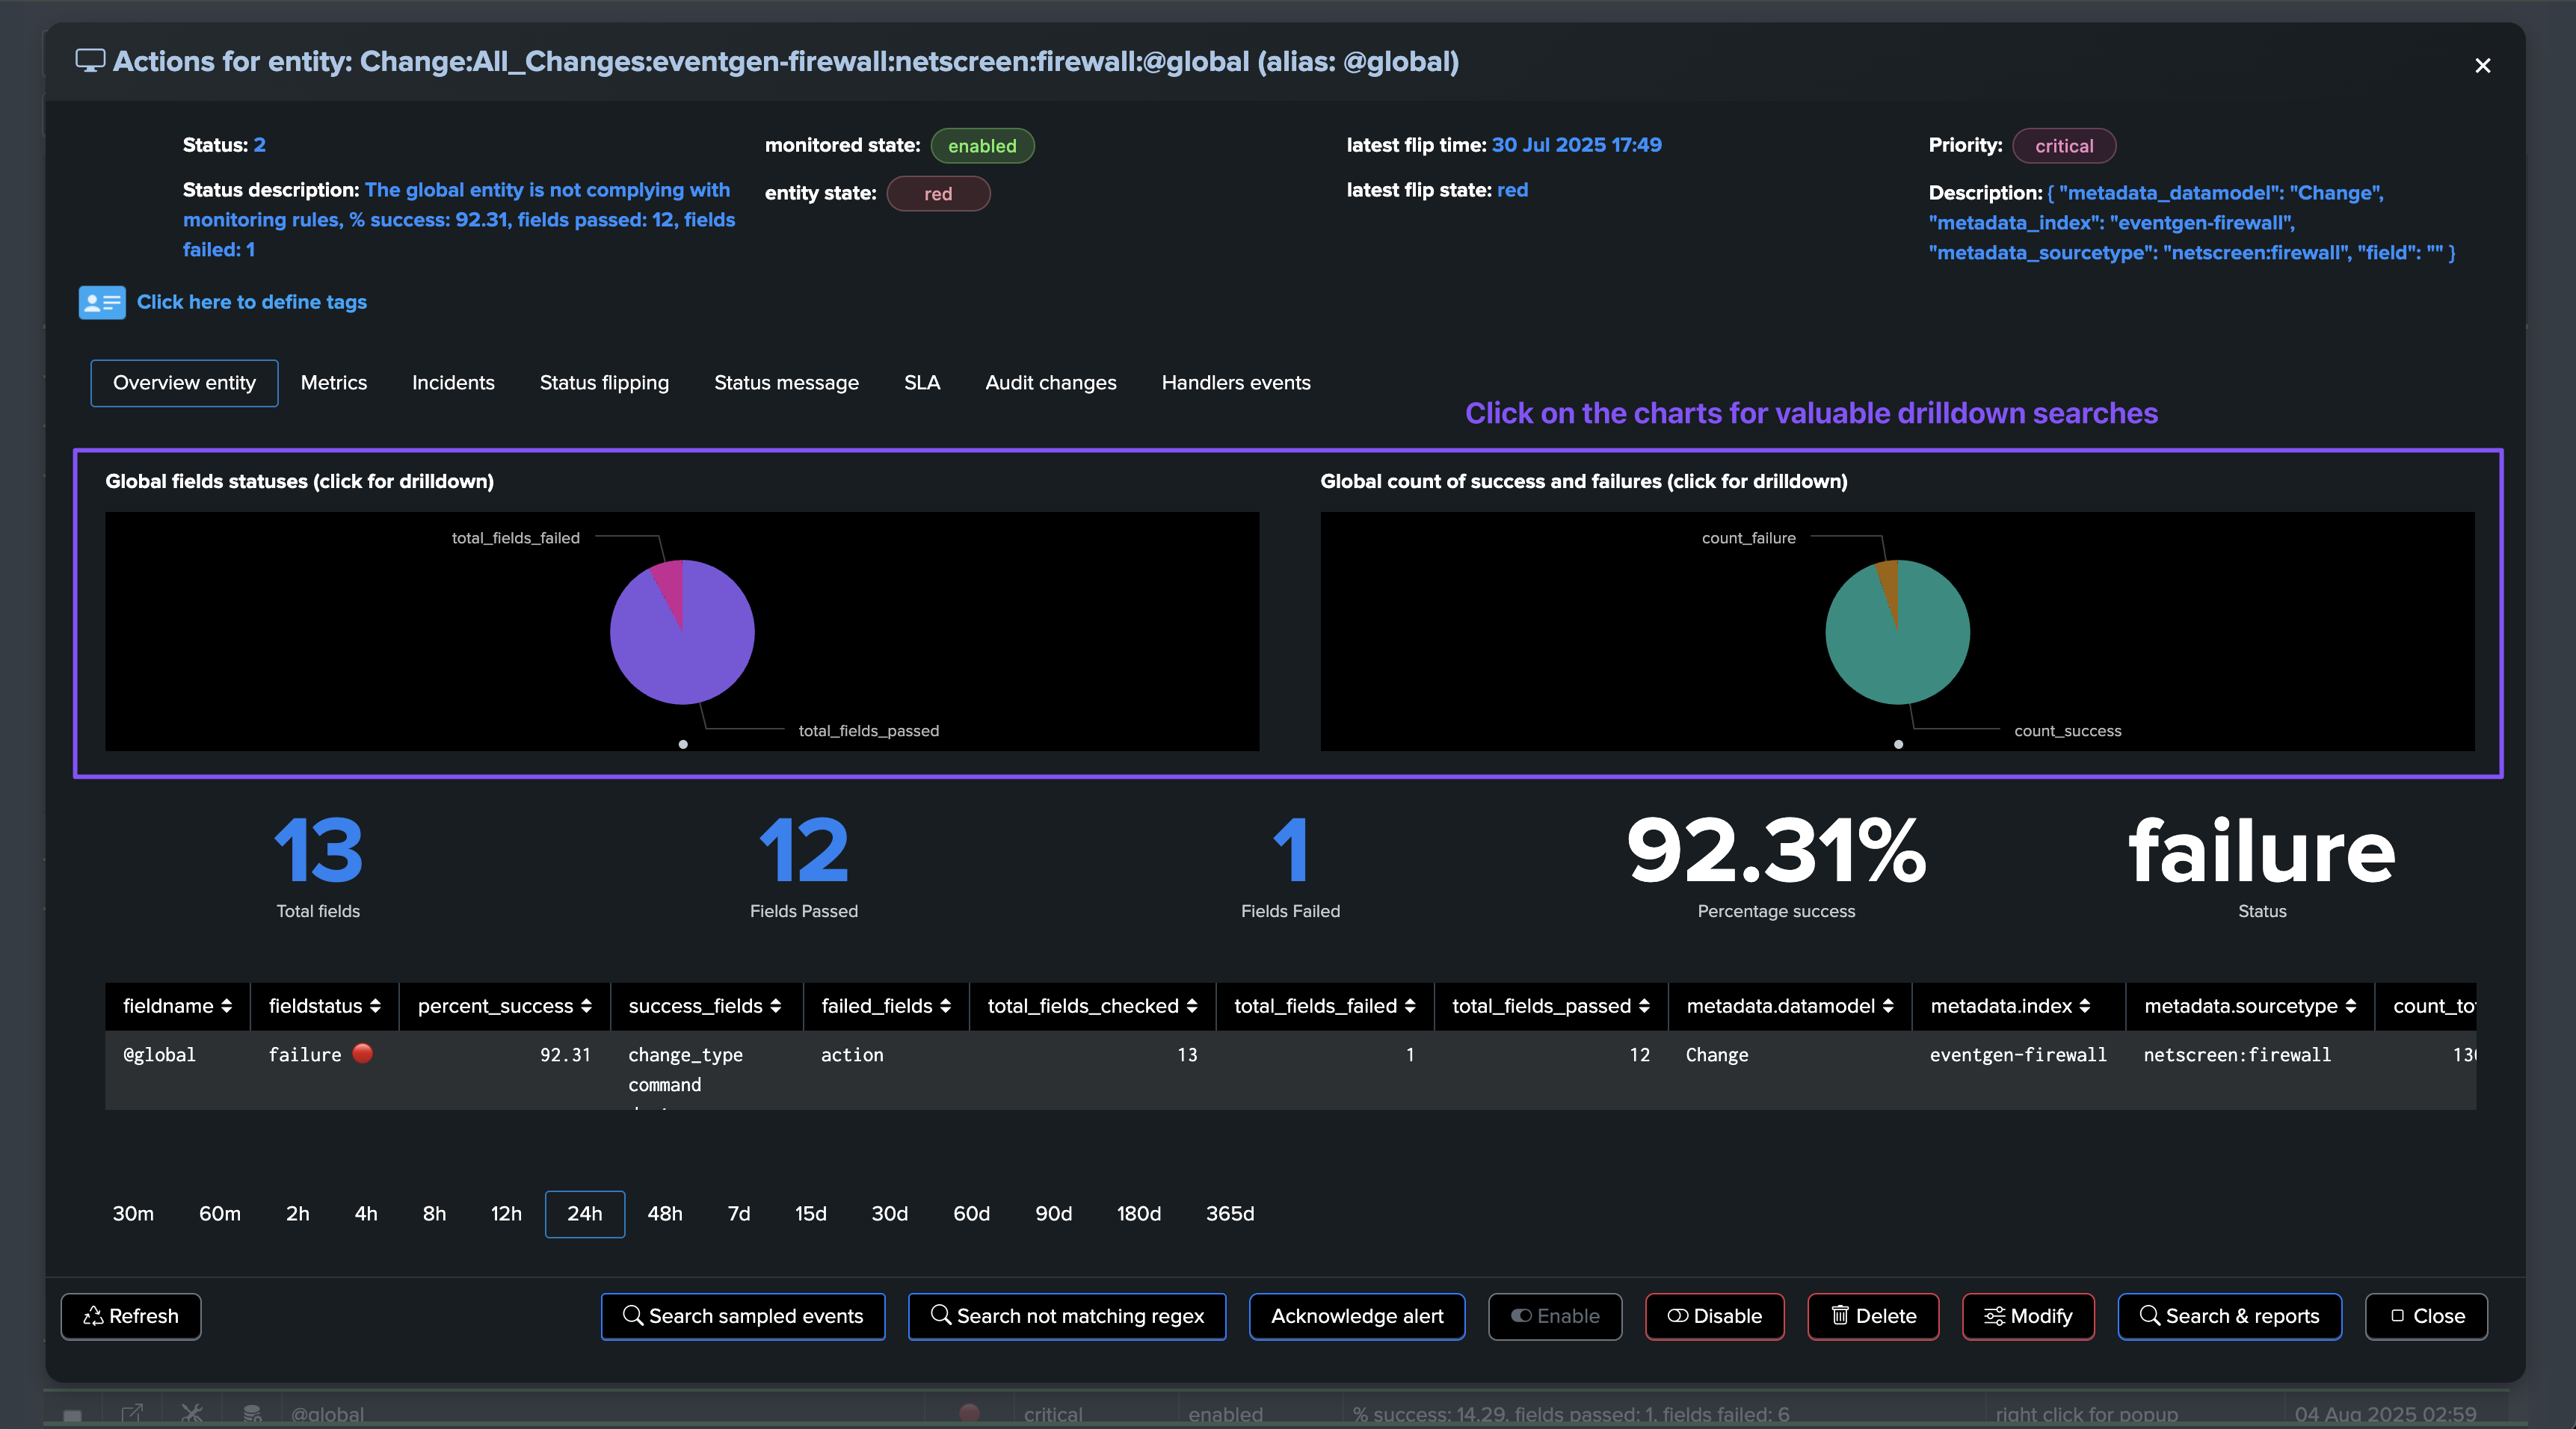
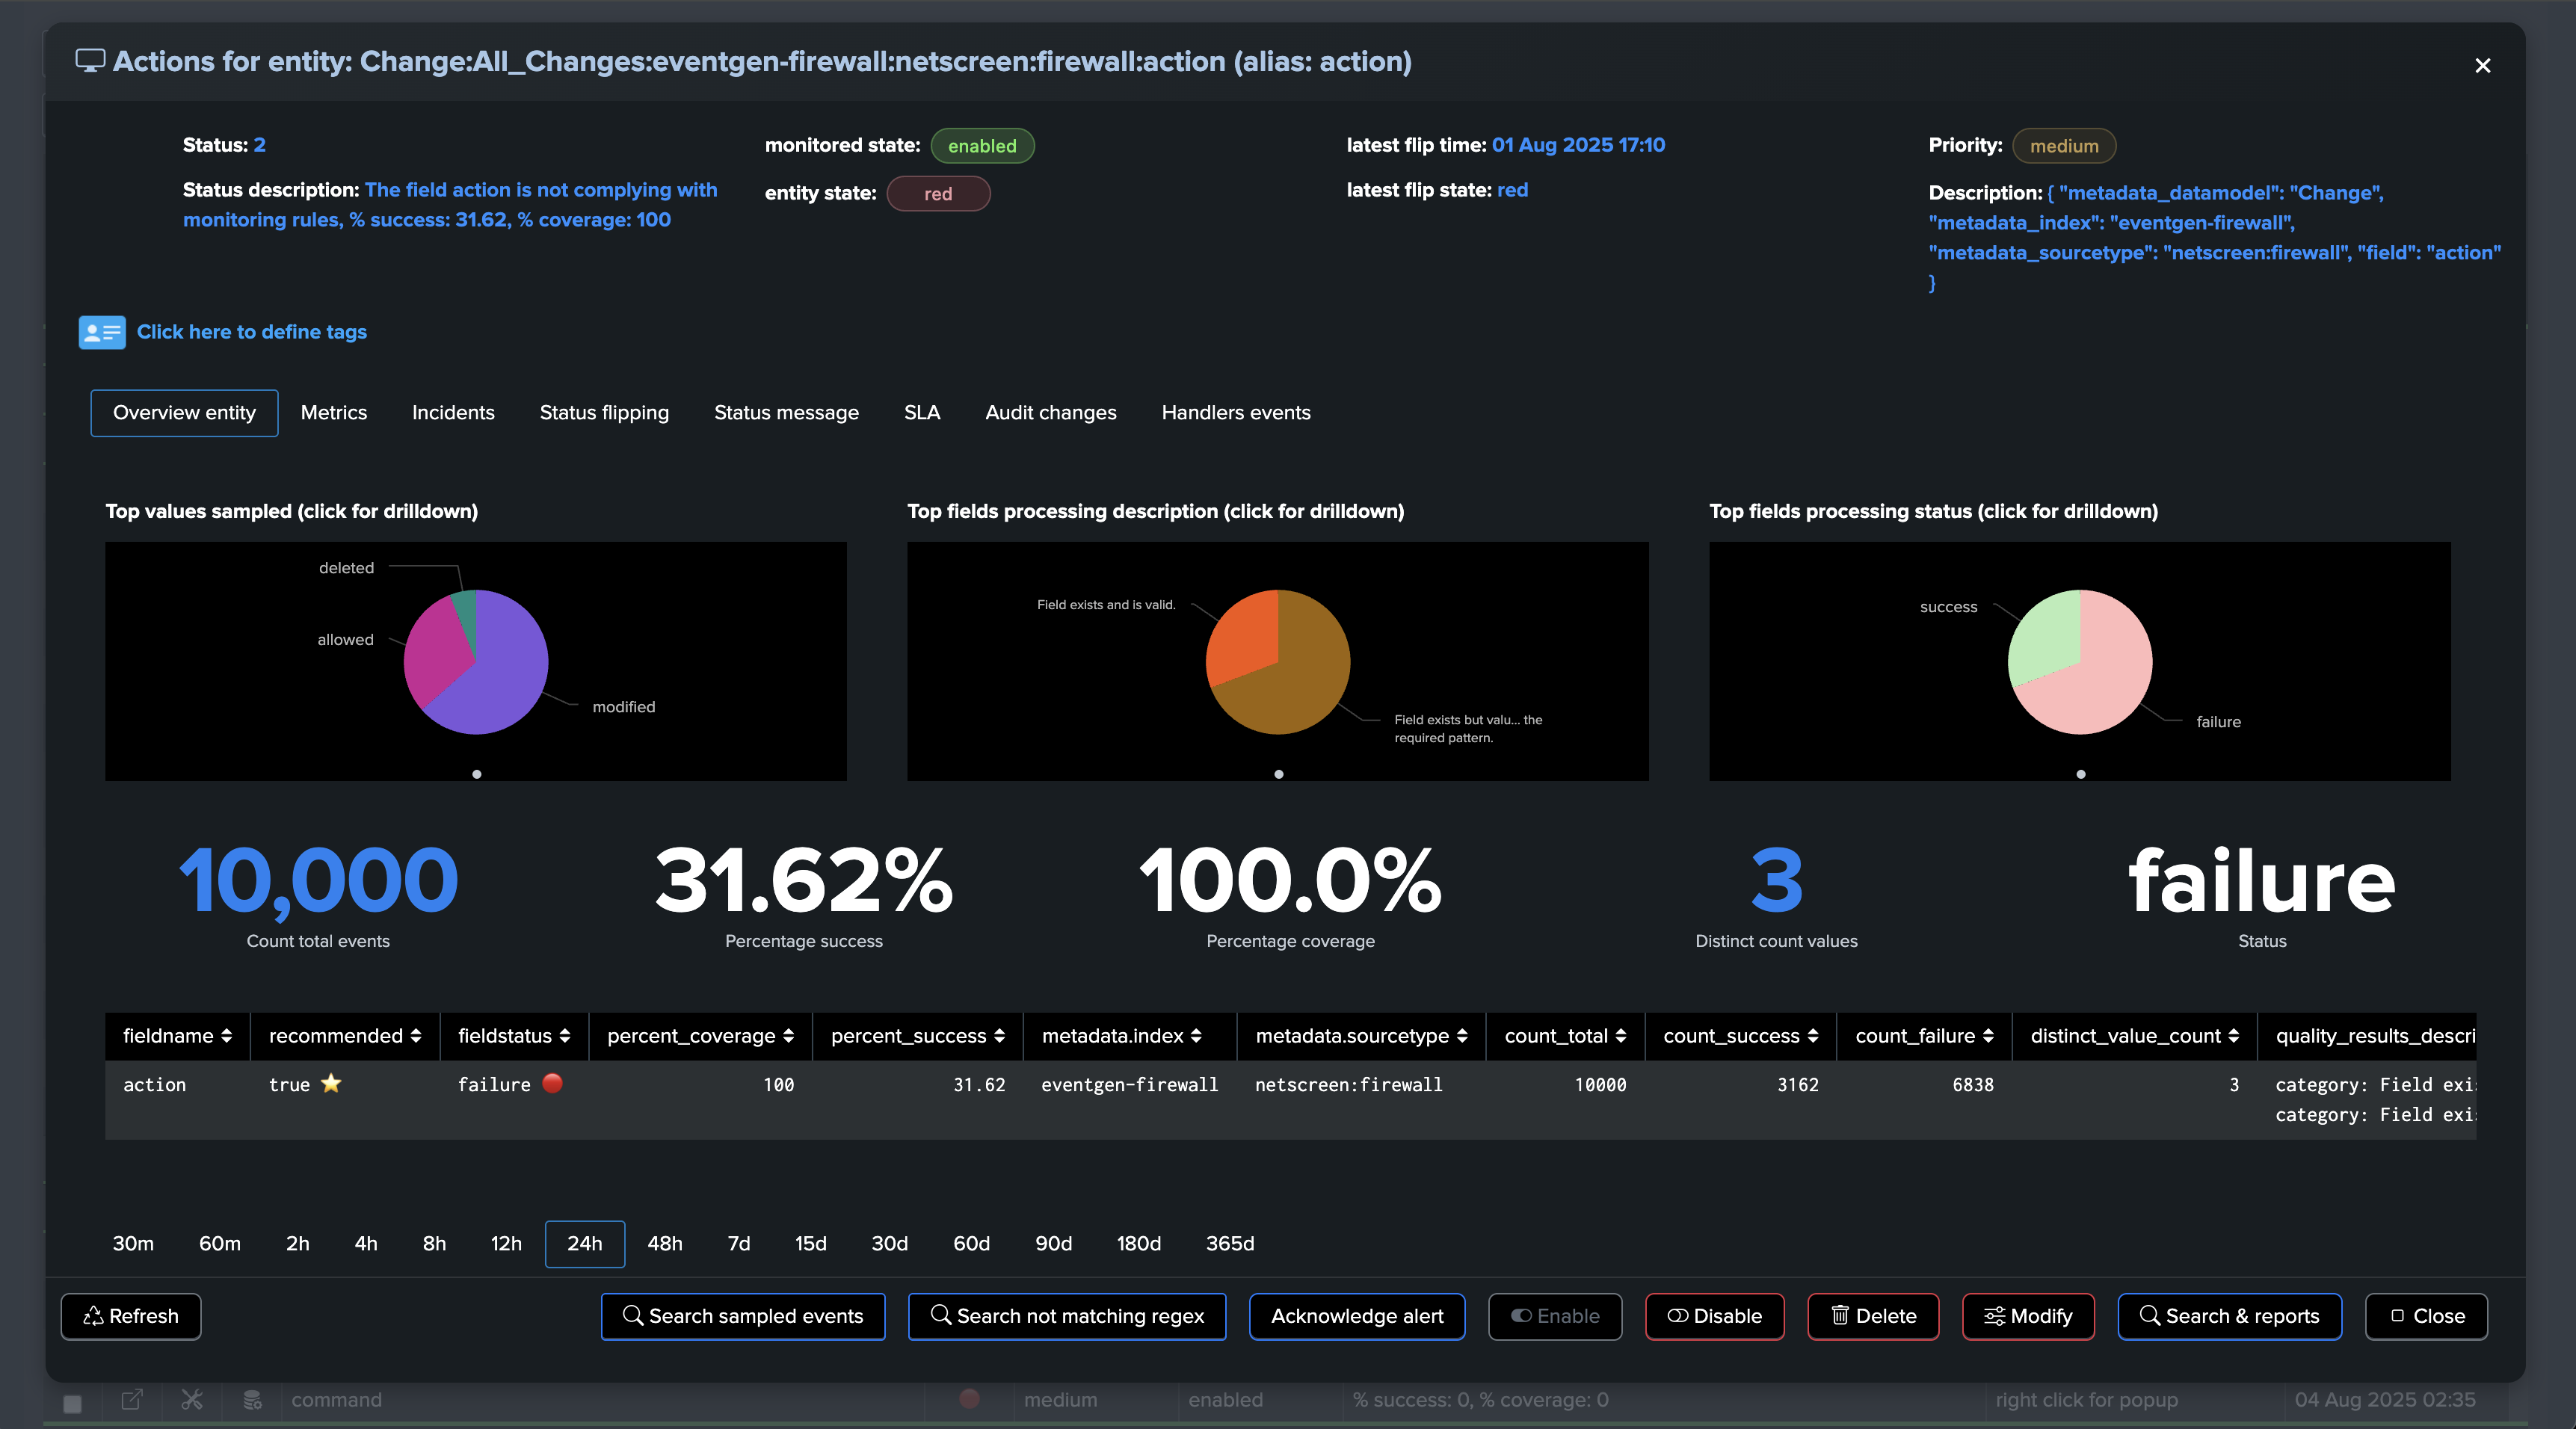
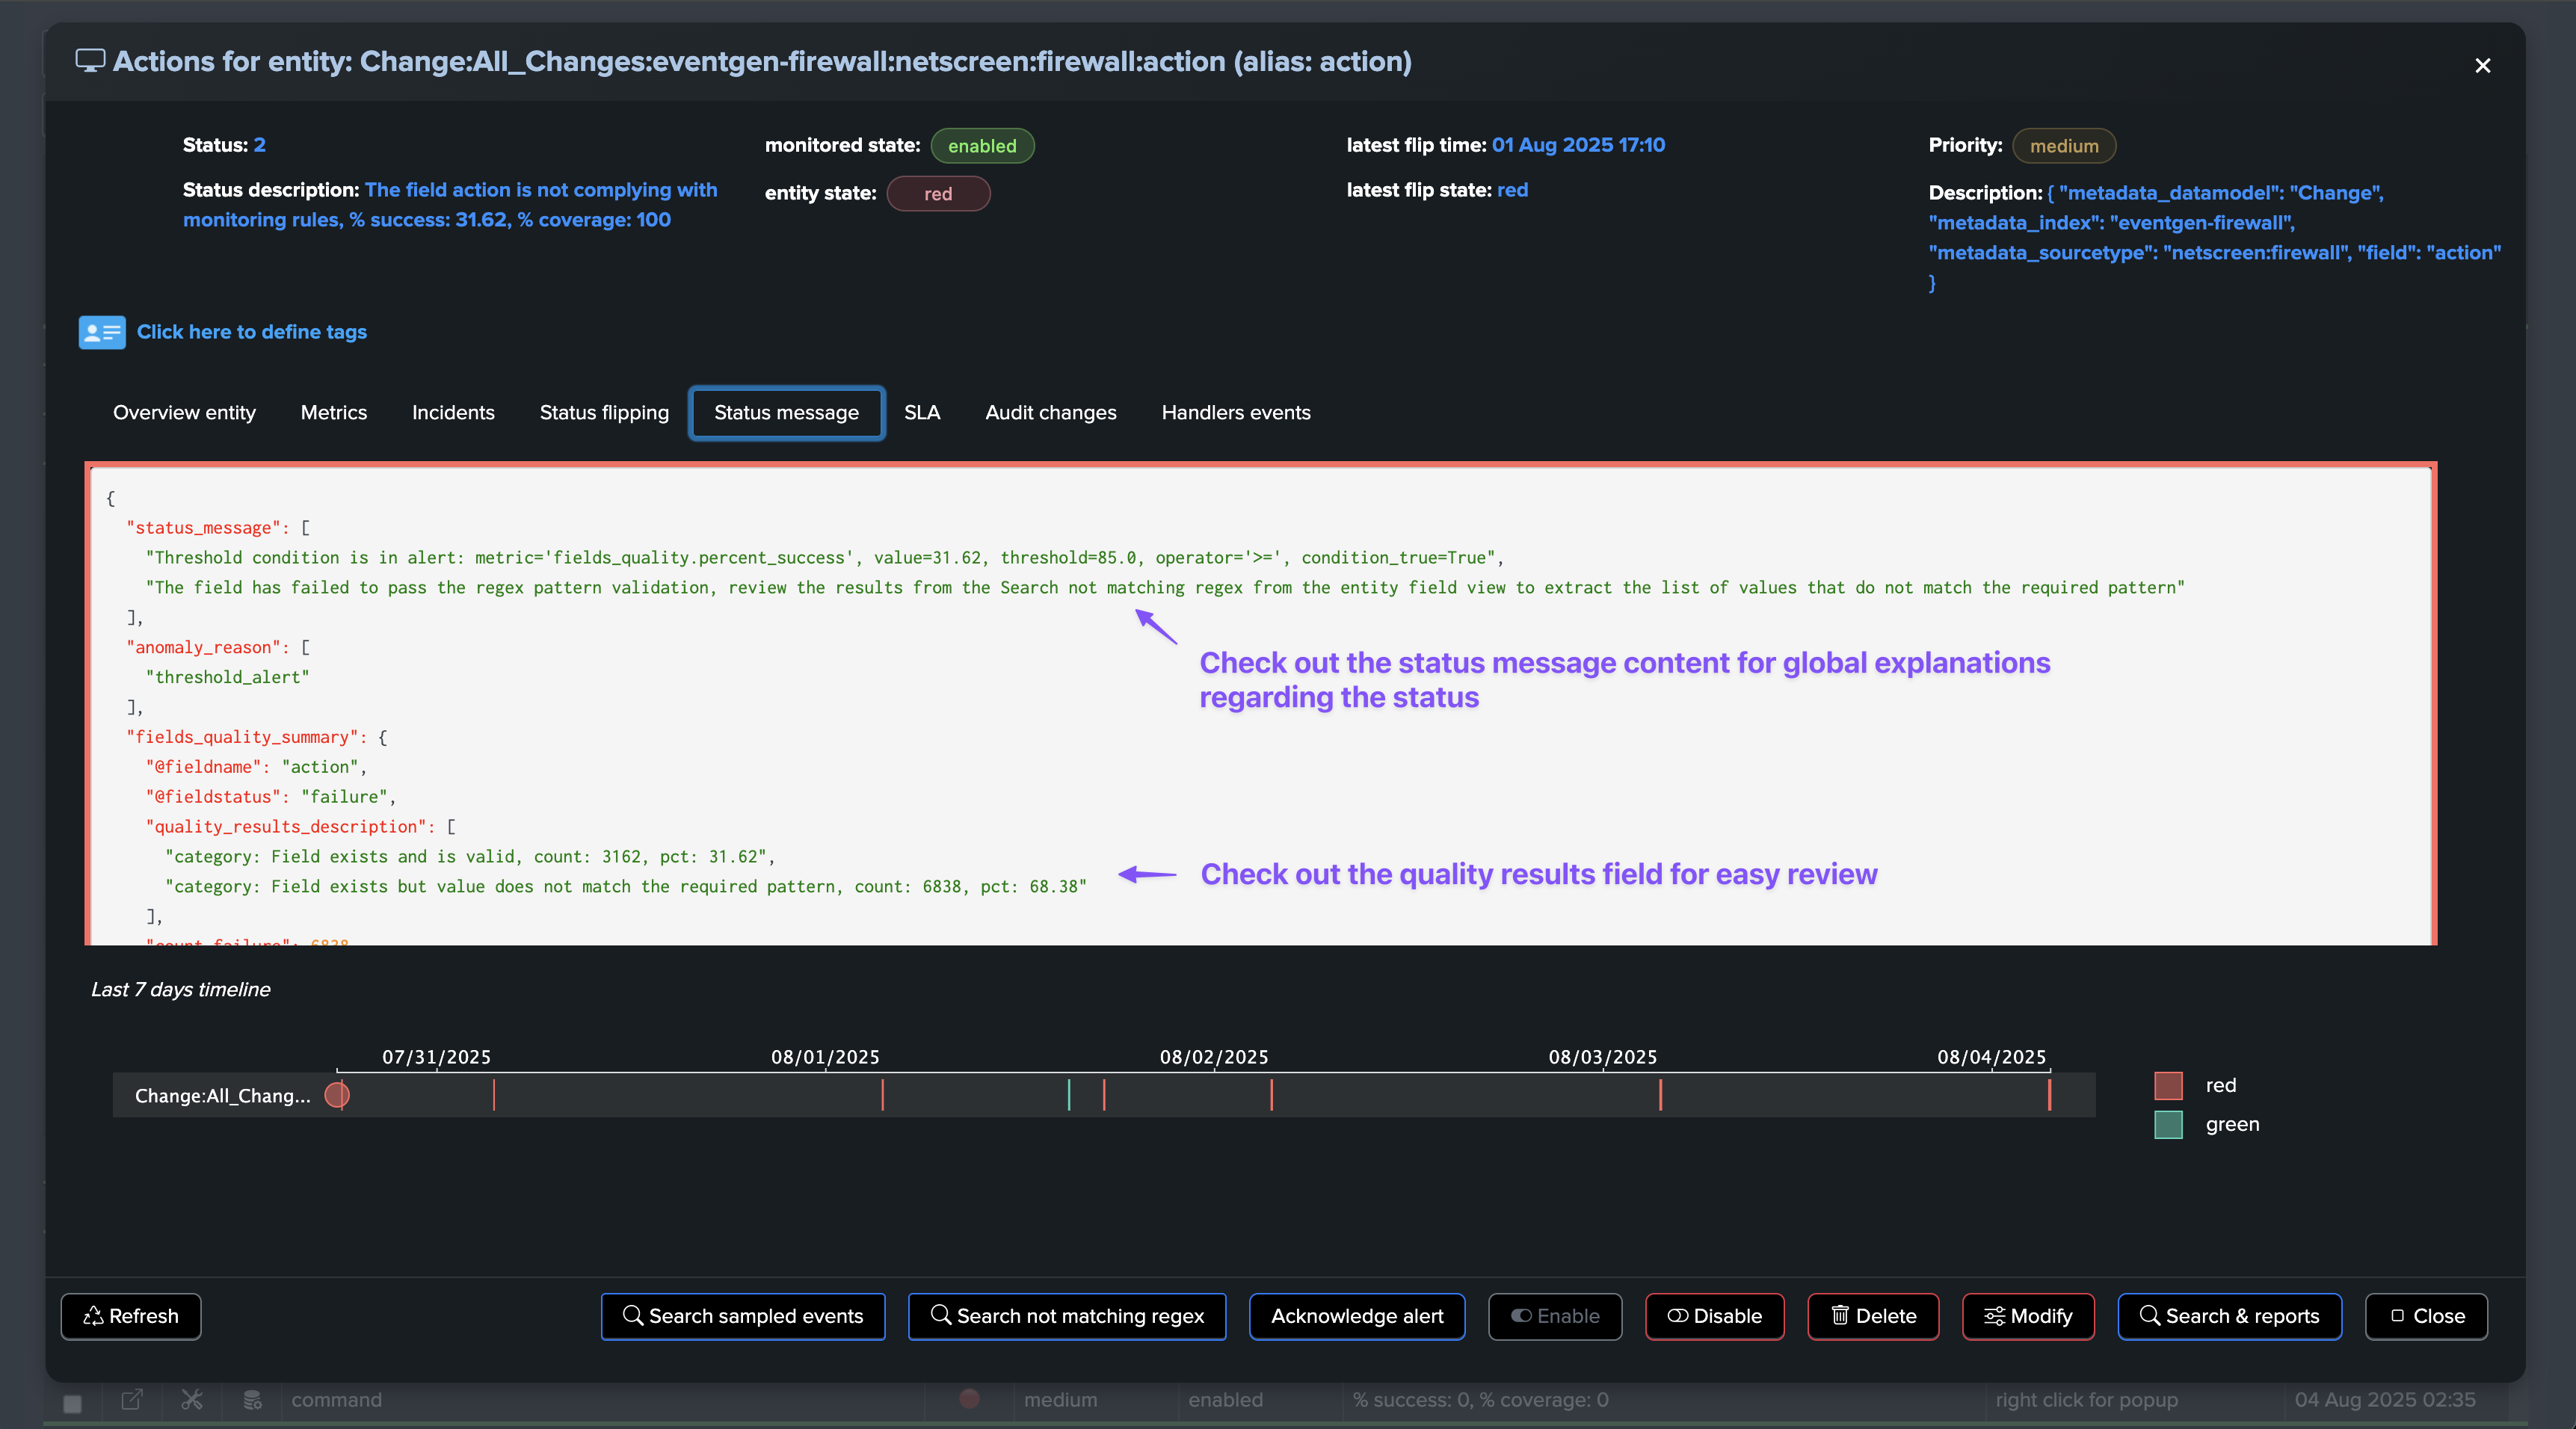
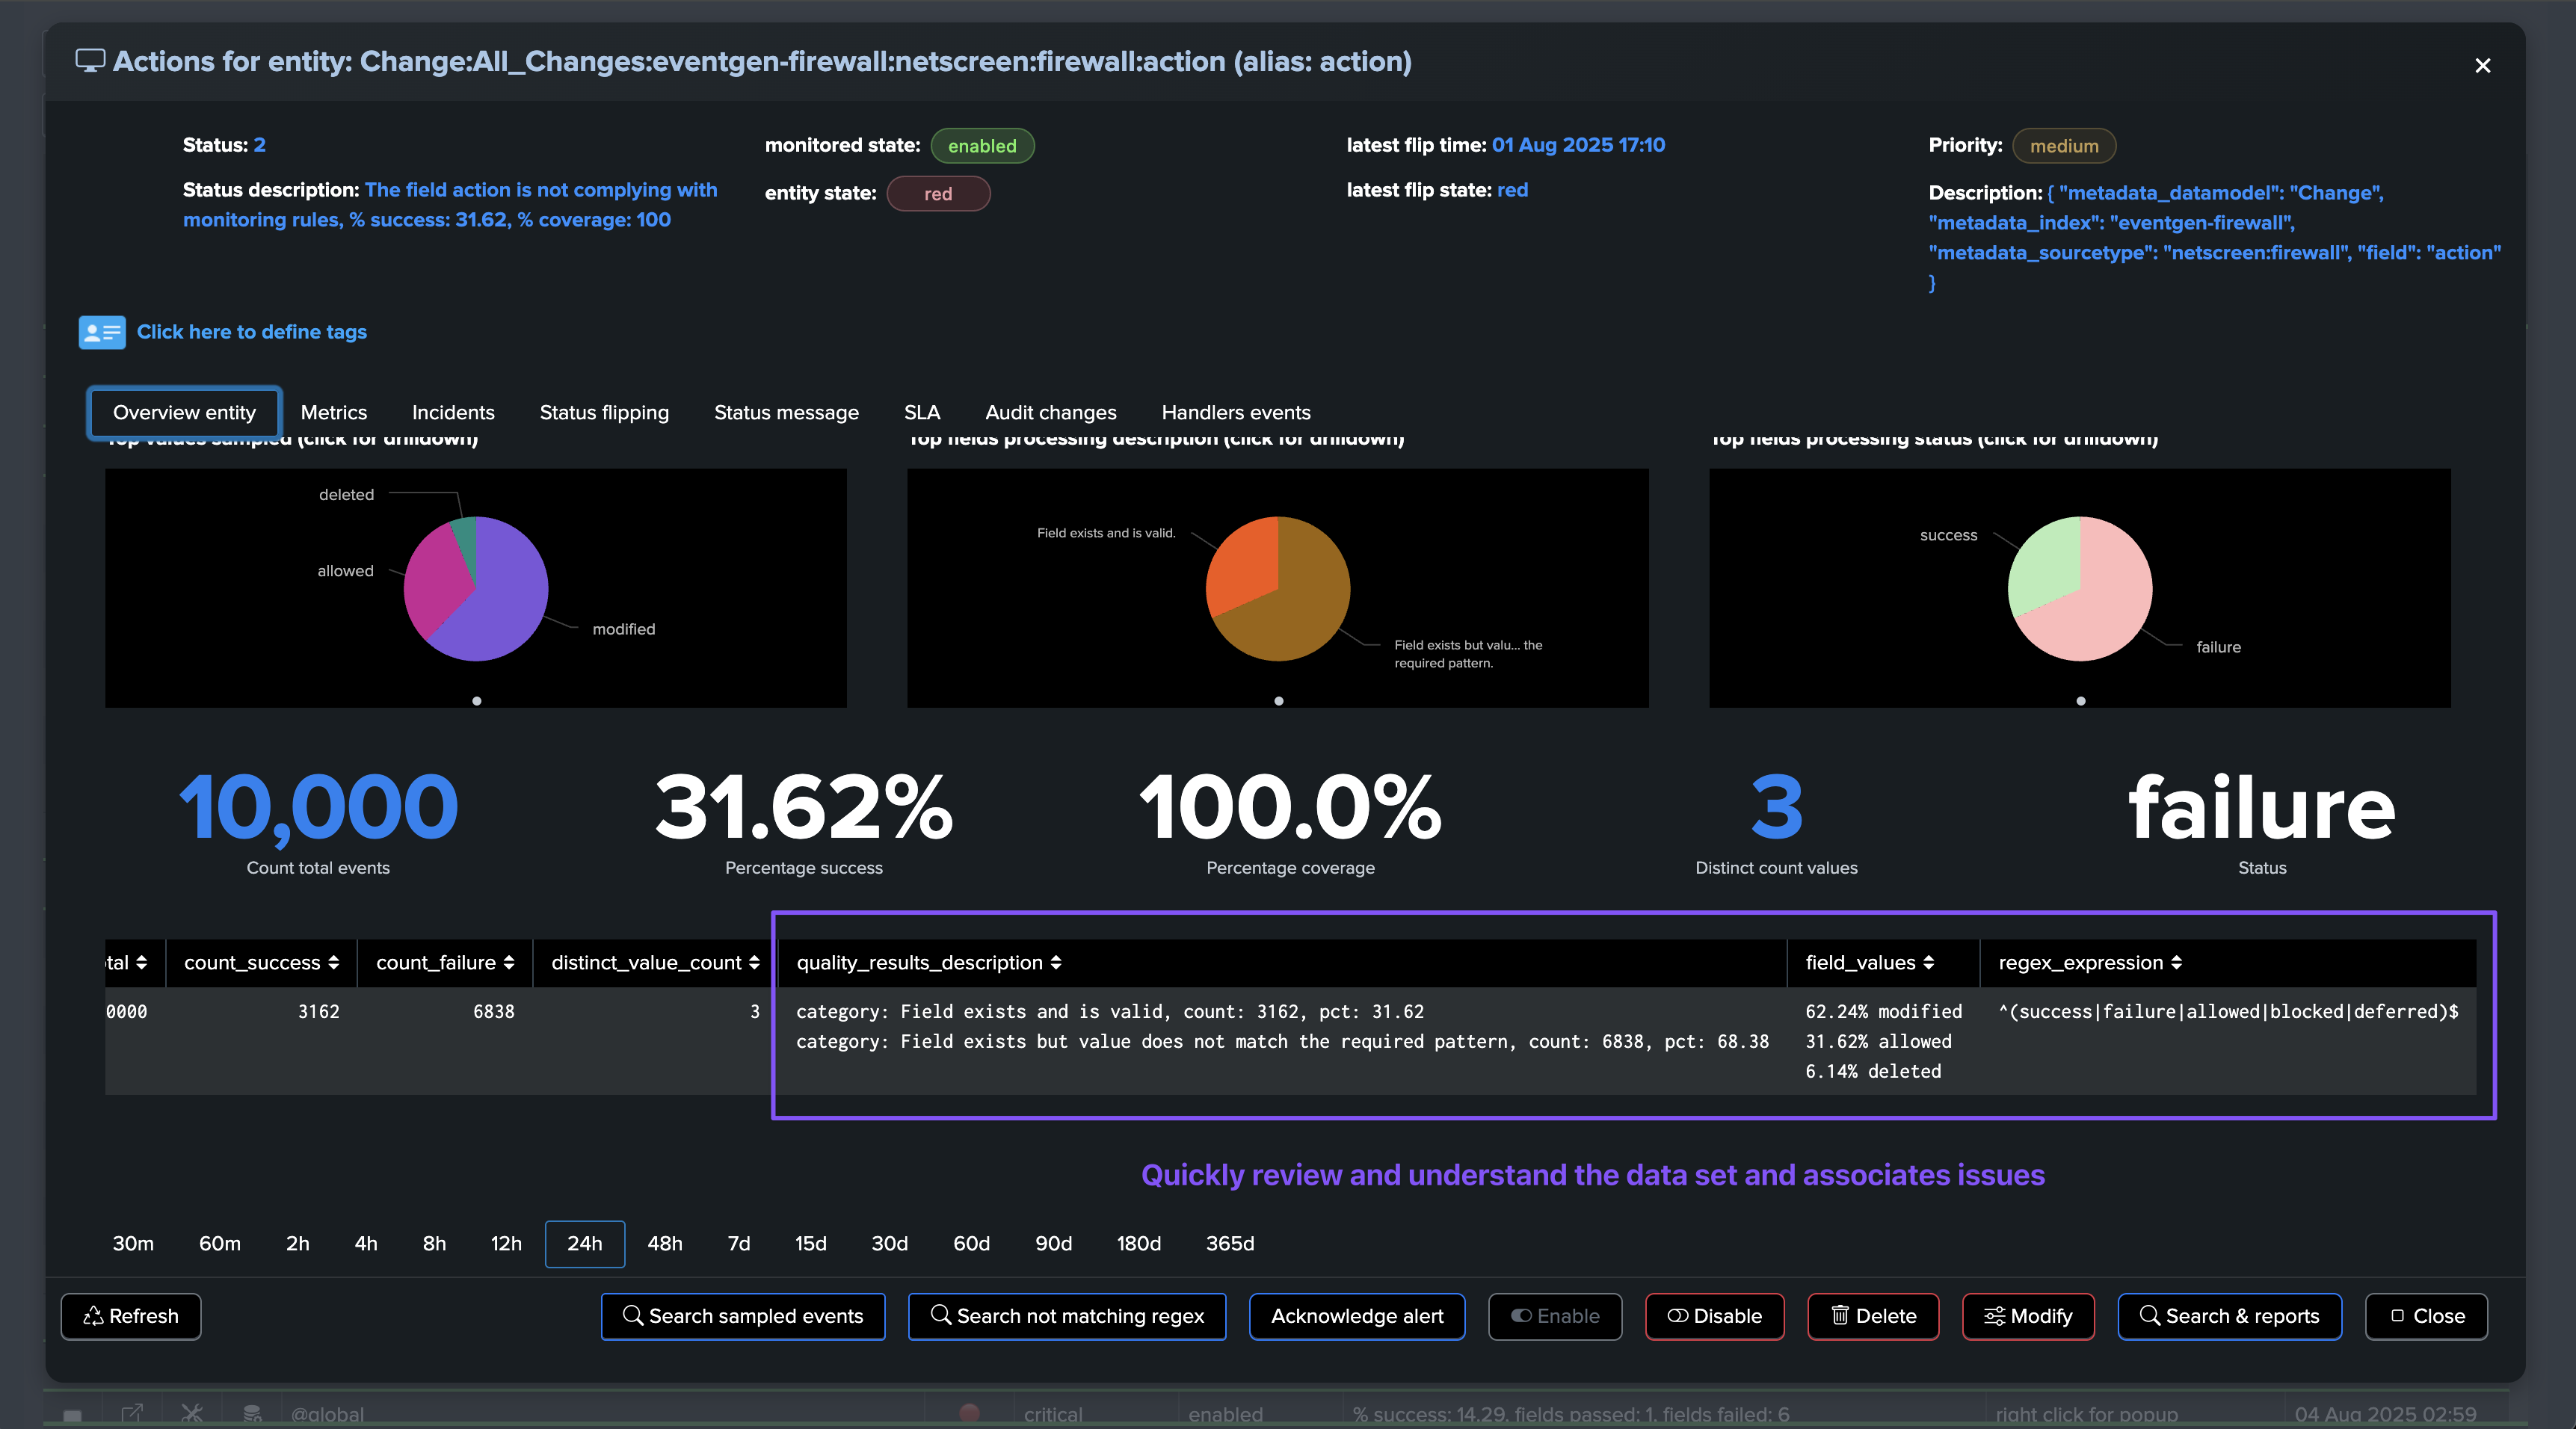
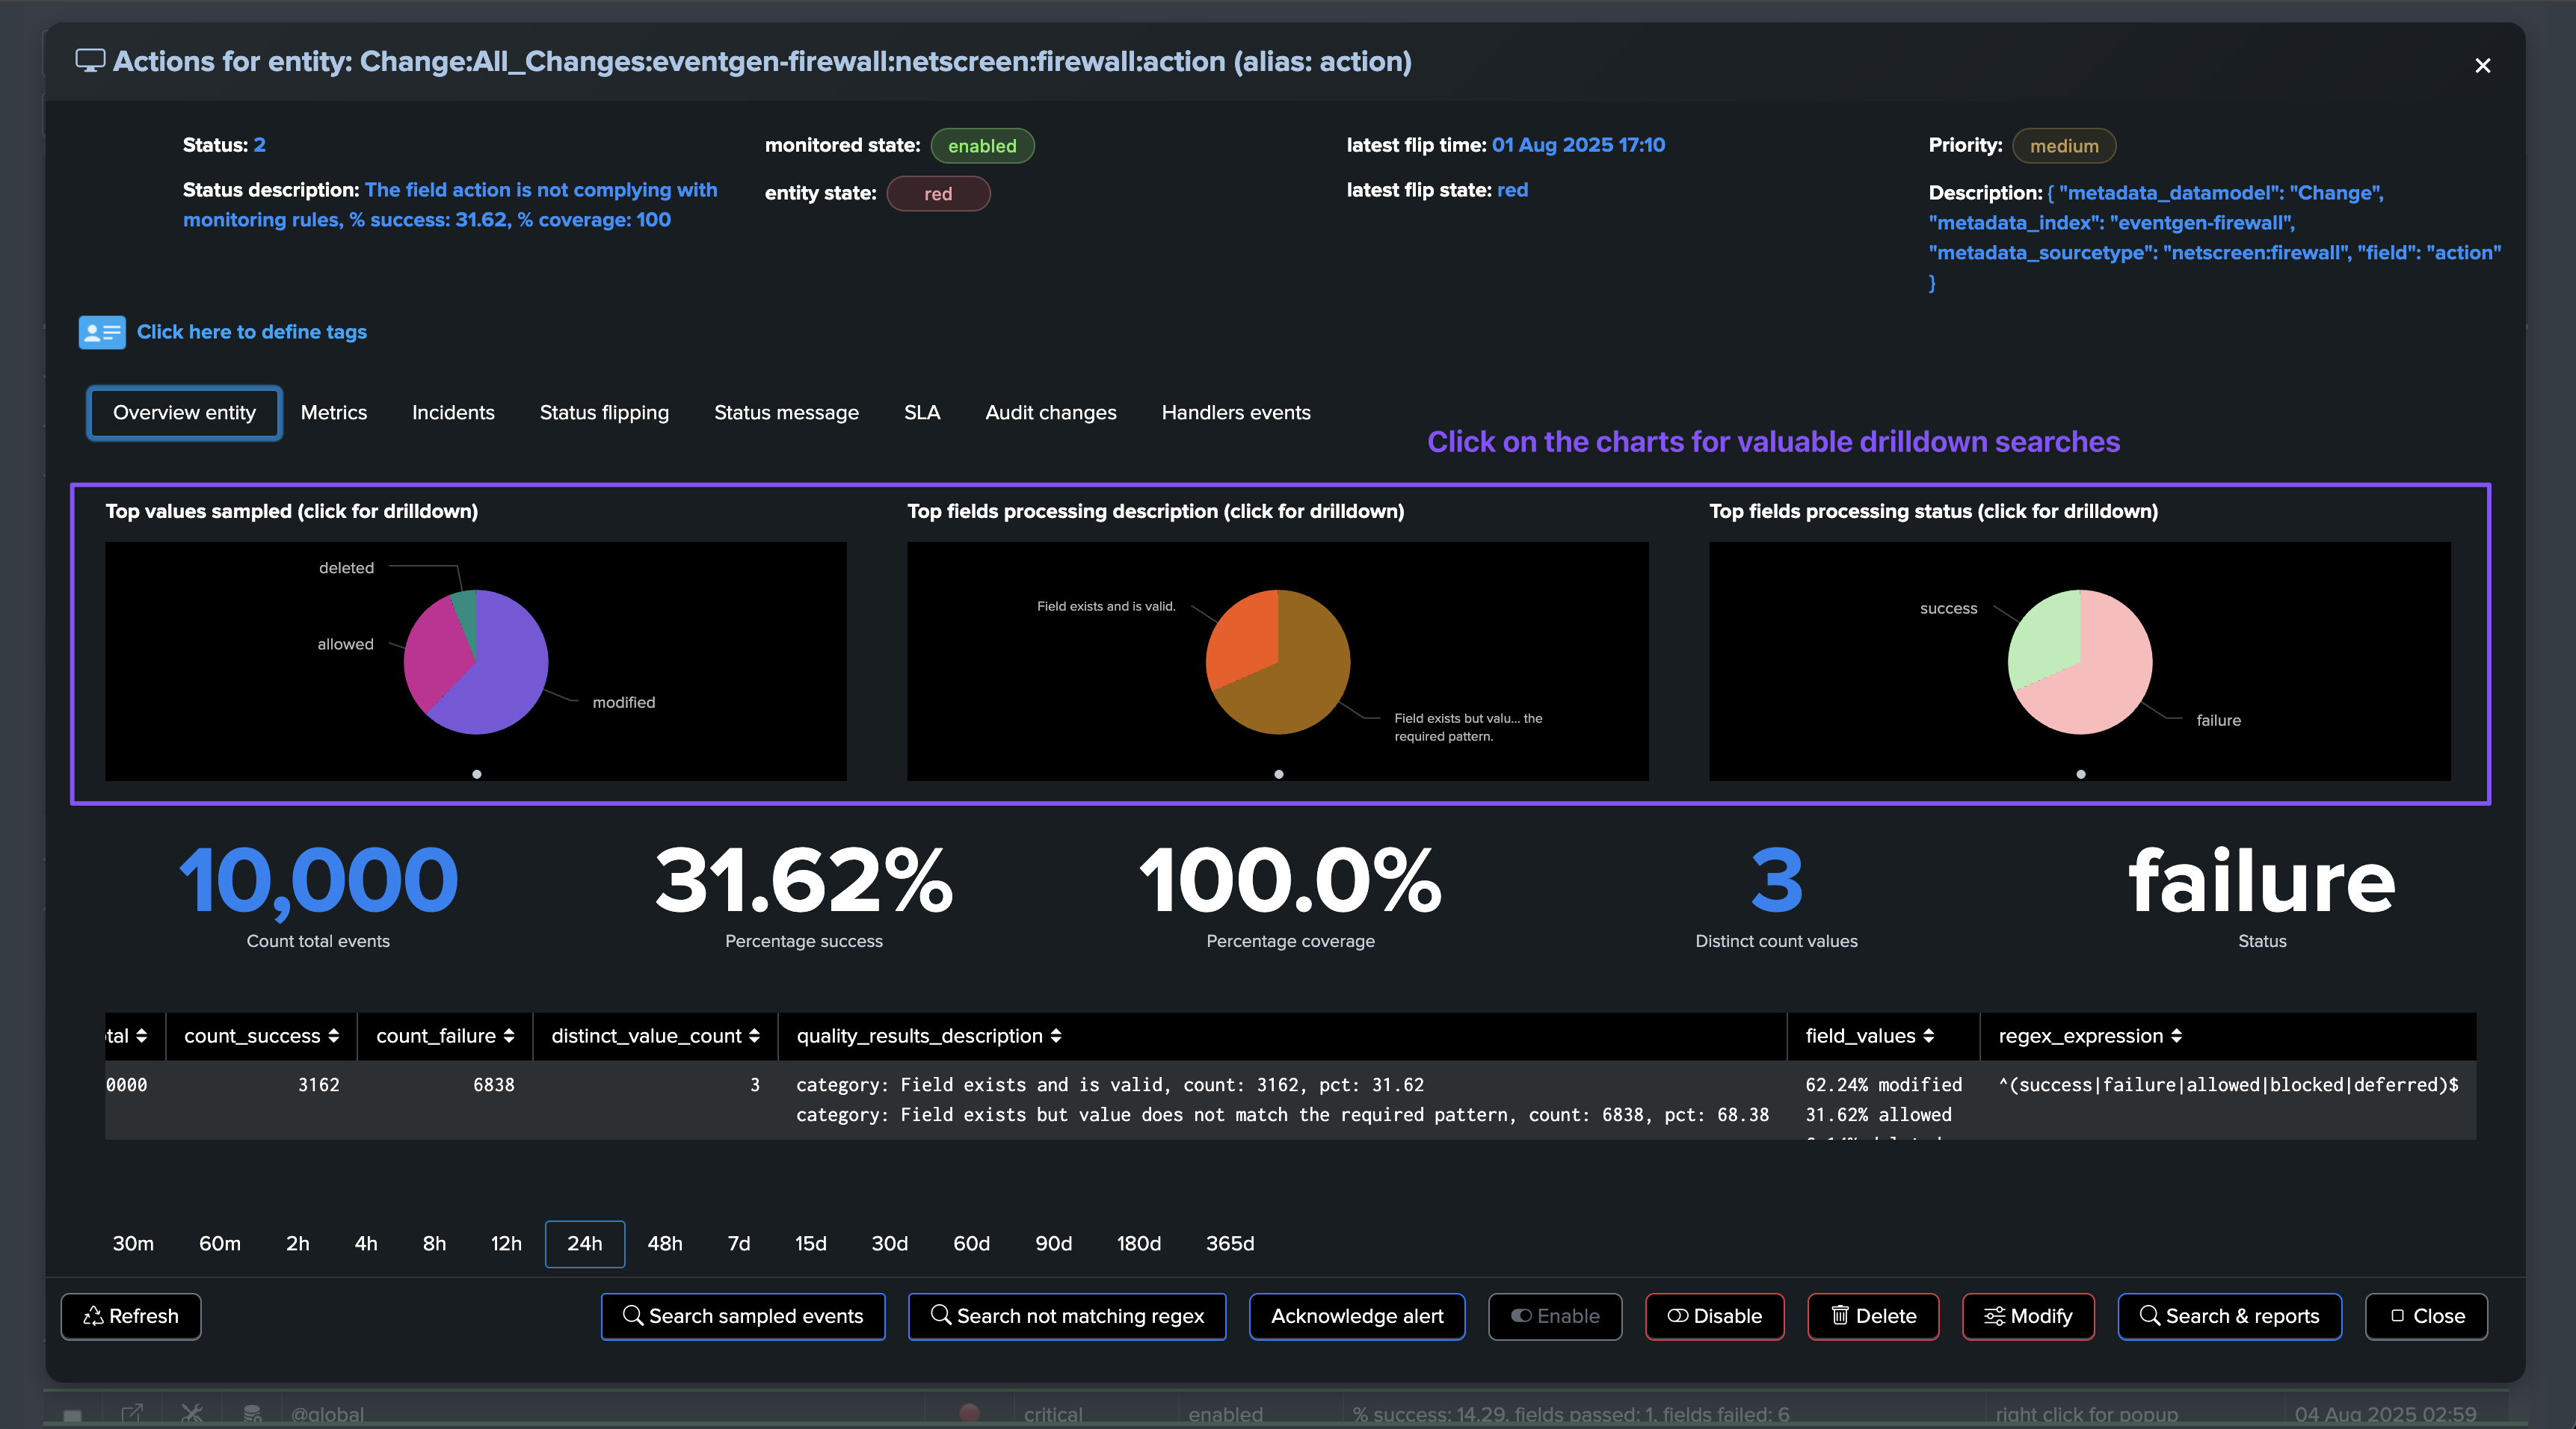
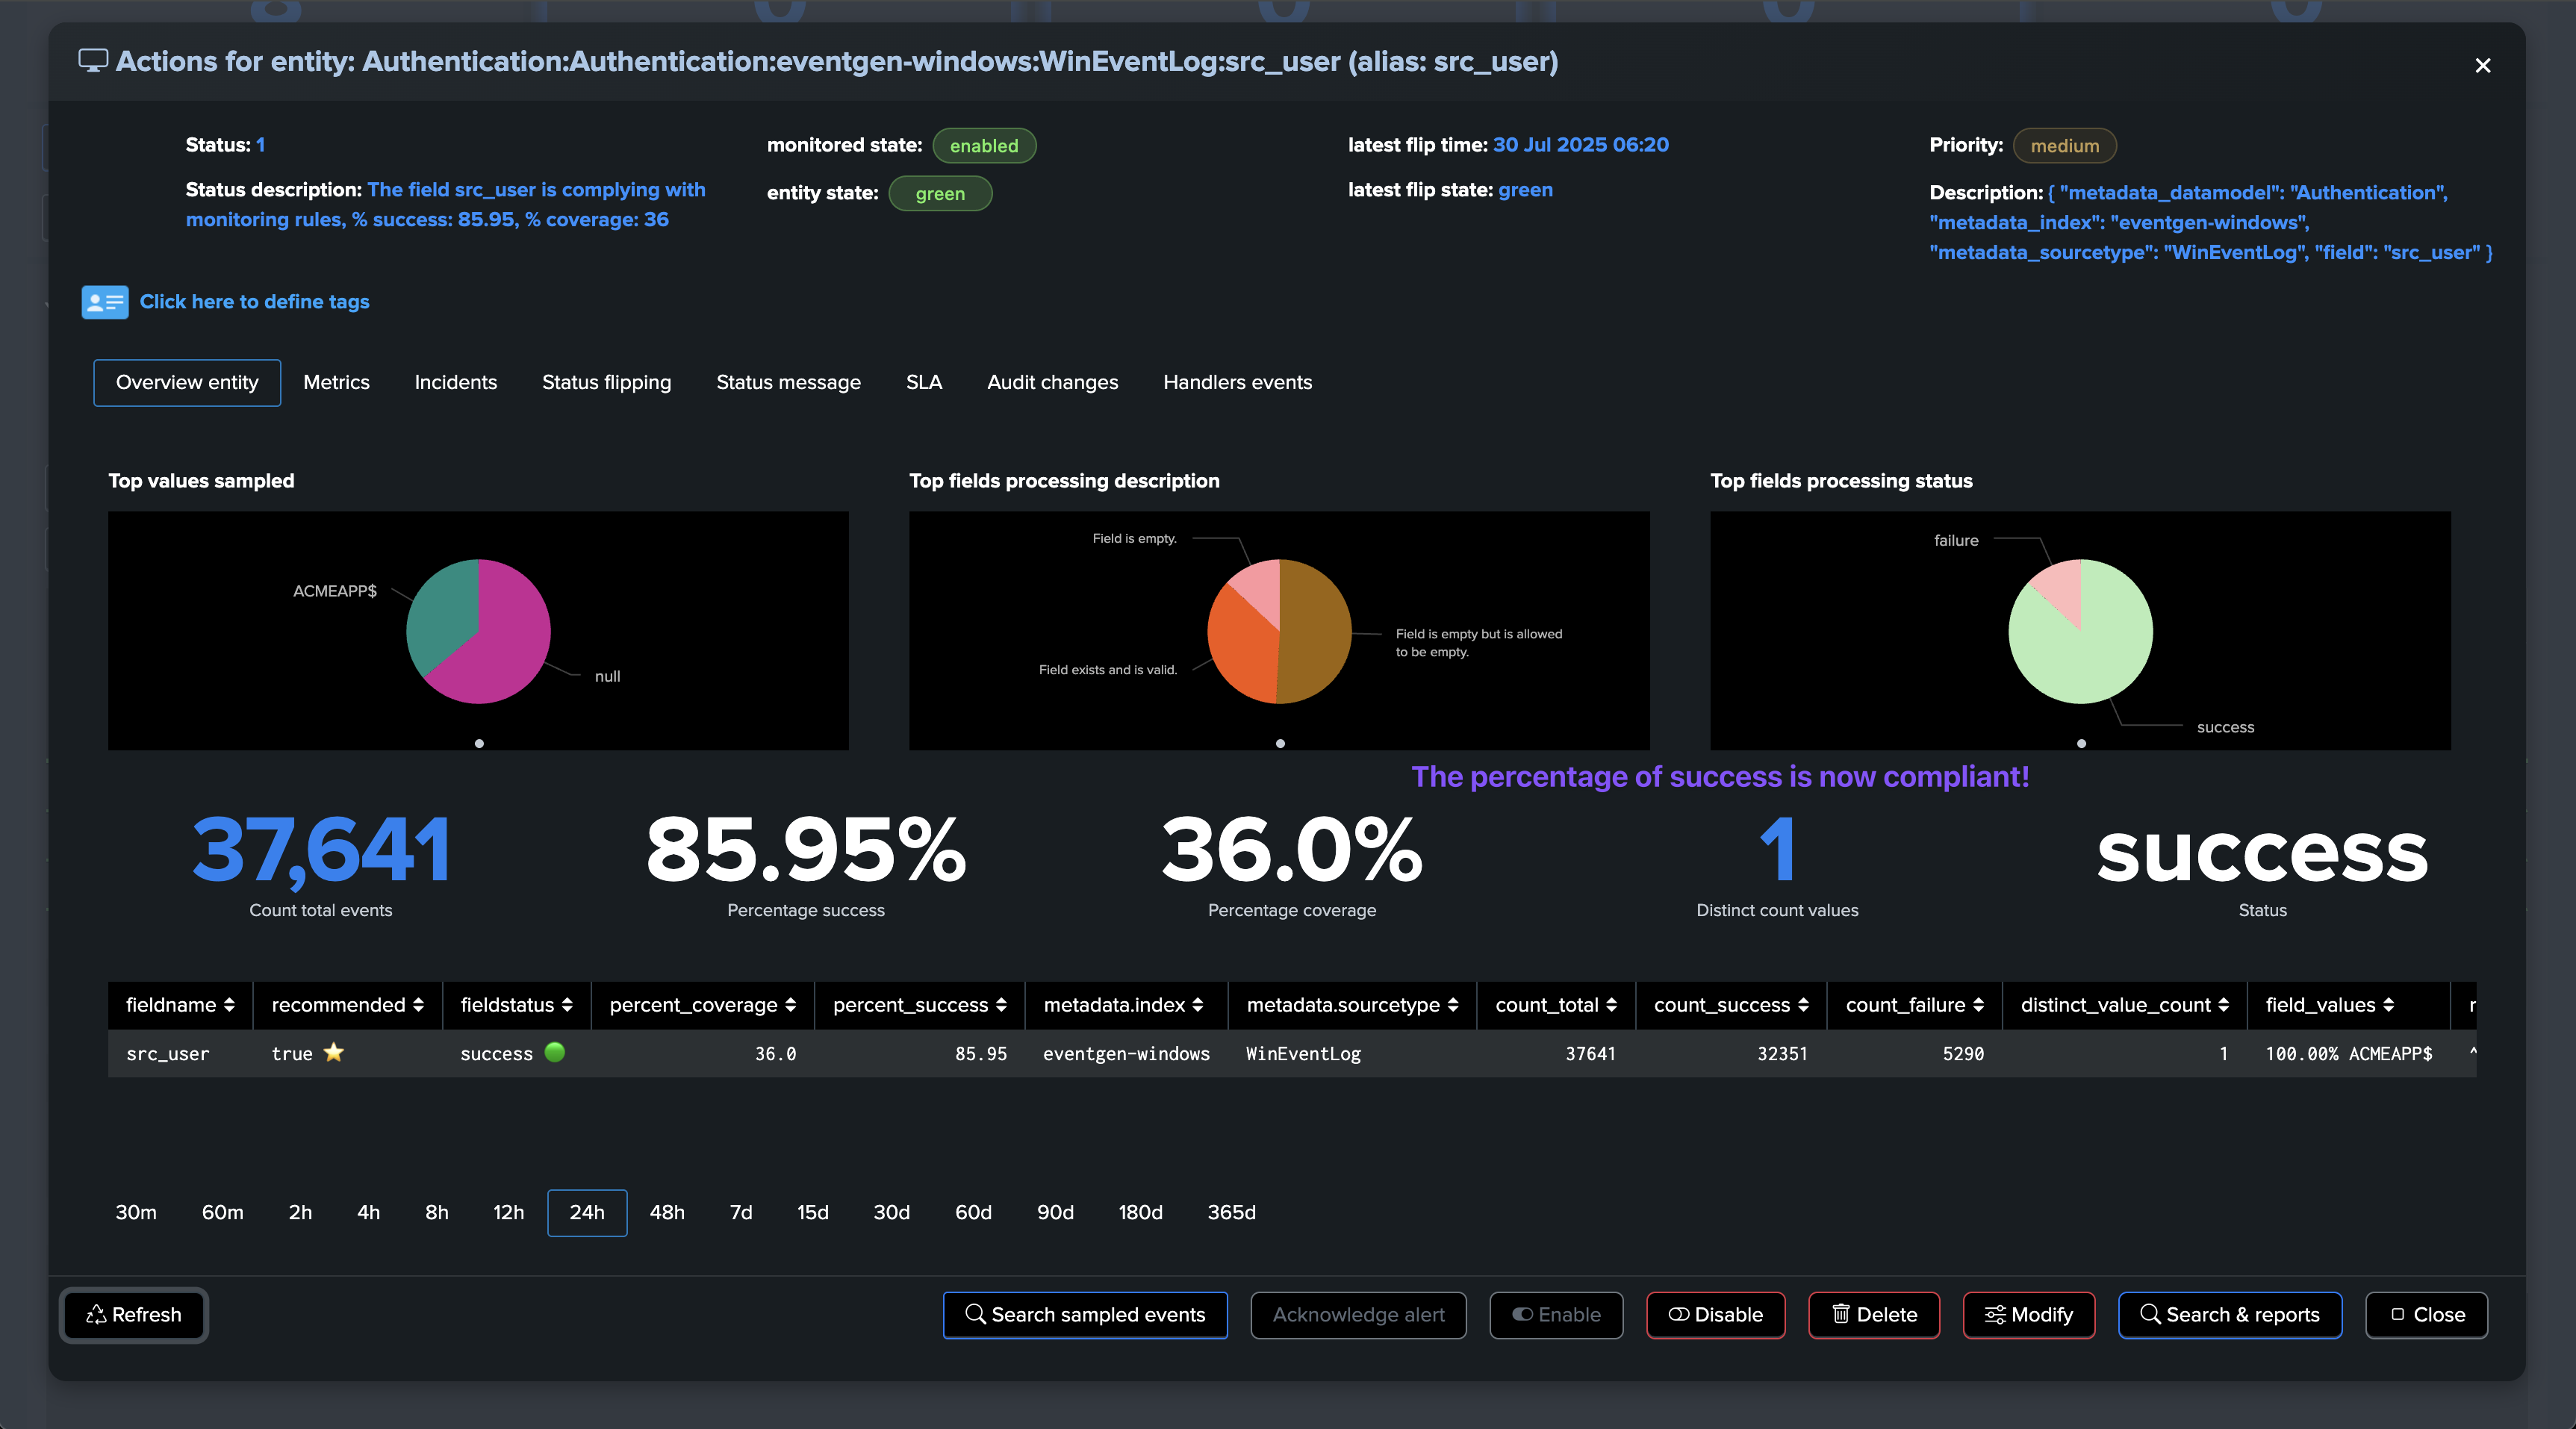
Fields Quality: @global entity
The @global entity is the aggregation of all fields for this breakby context. The UI provides full context and visualization of the entity:
Fields Quality: field view
The field view provides a detailed view of the fields for the entity
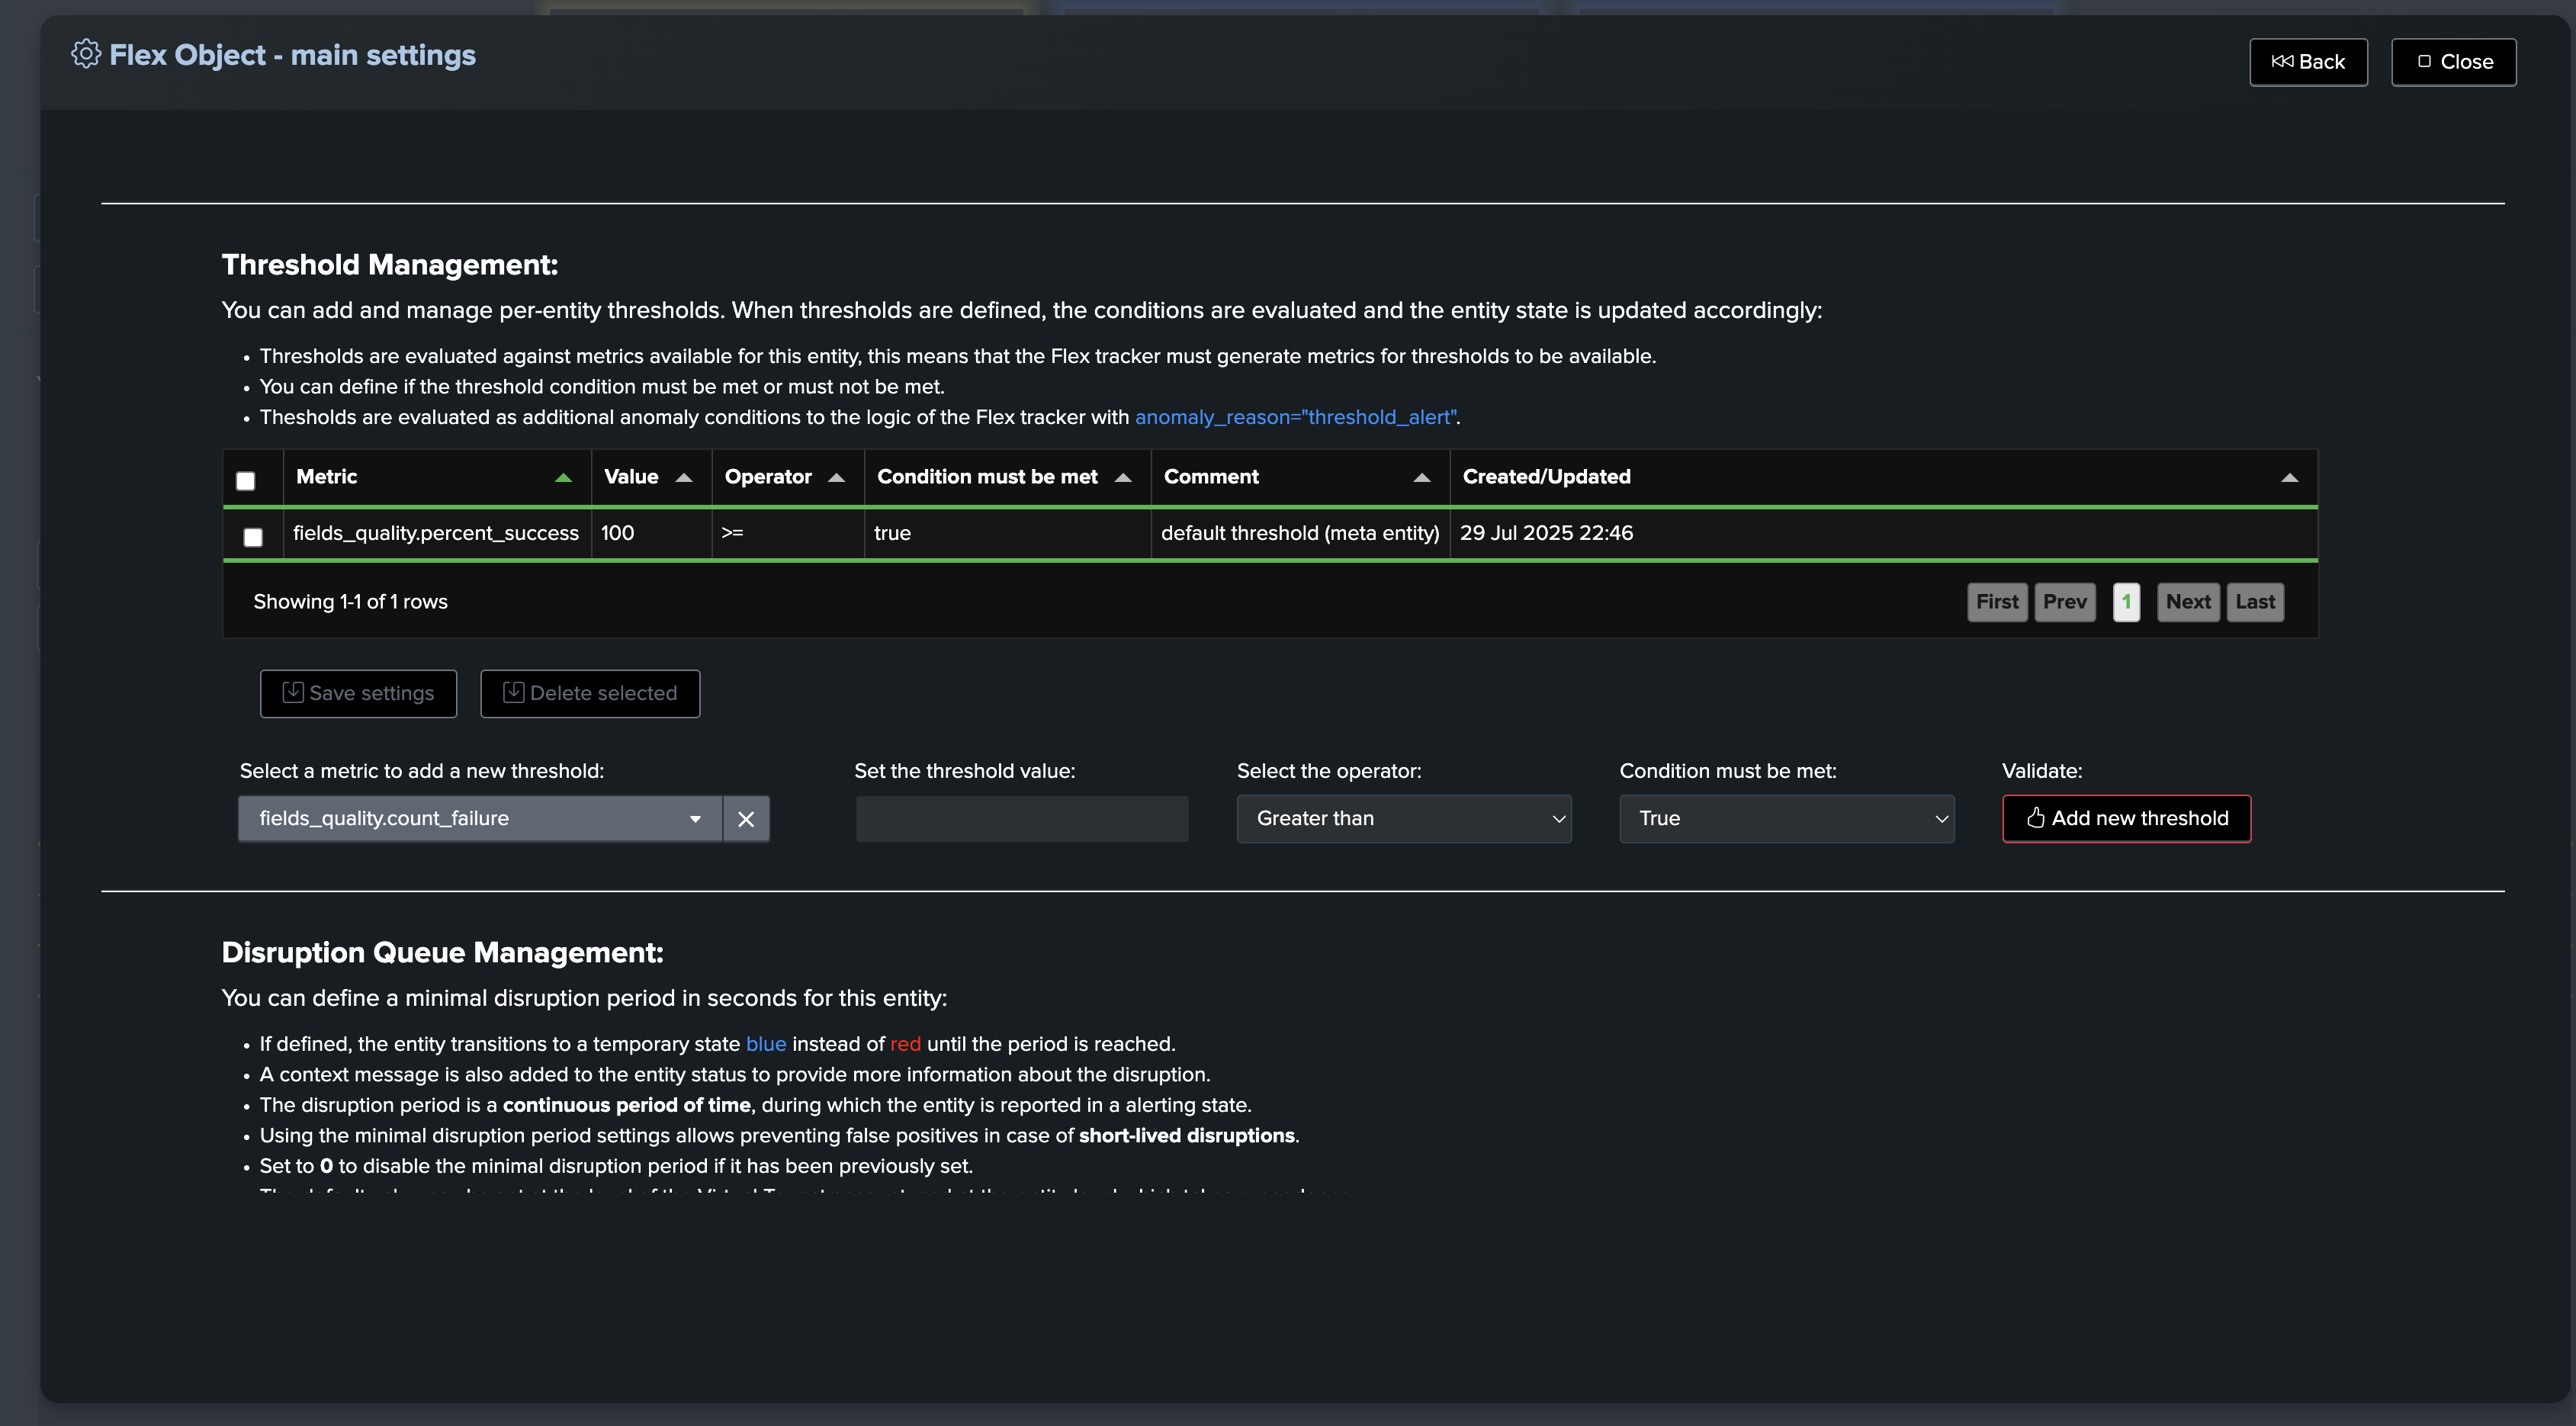
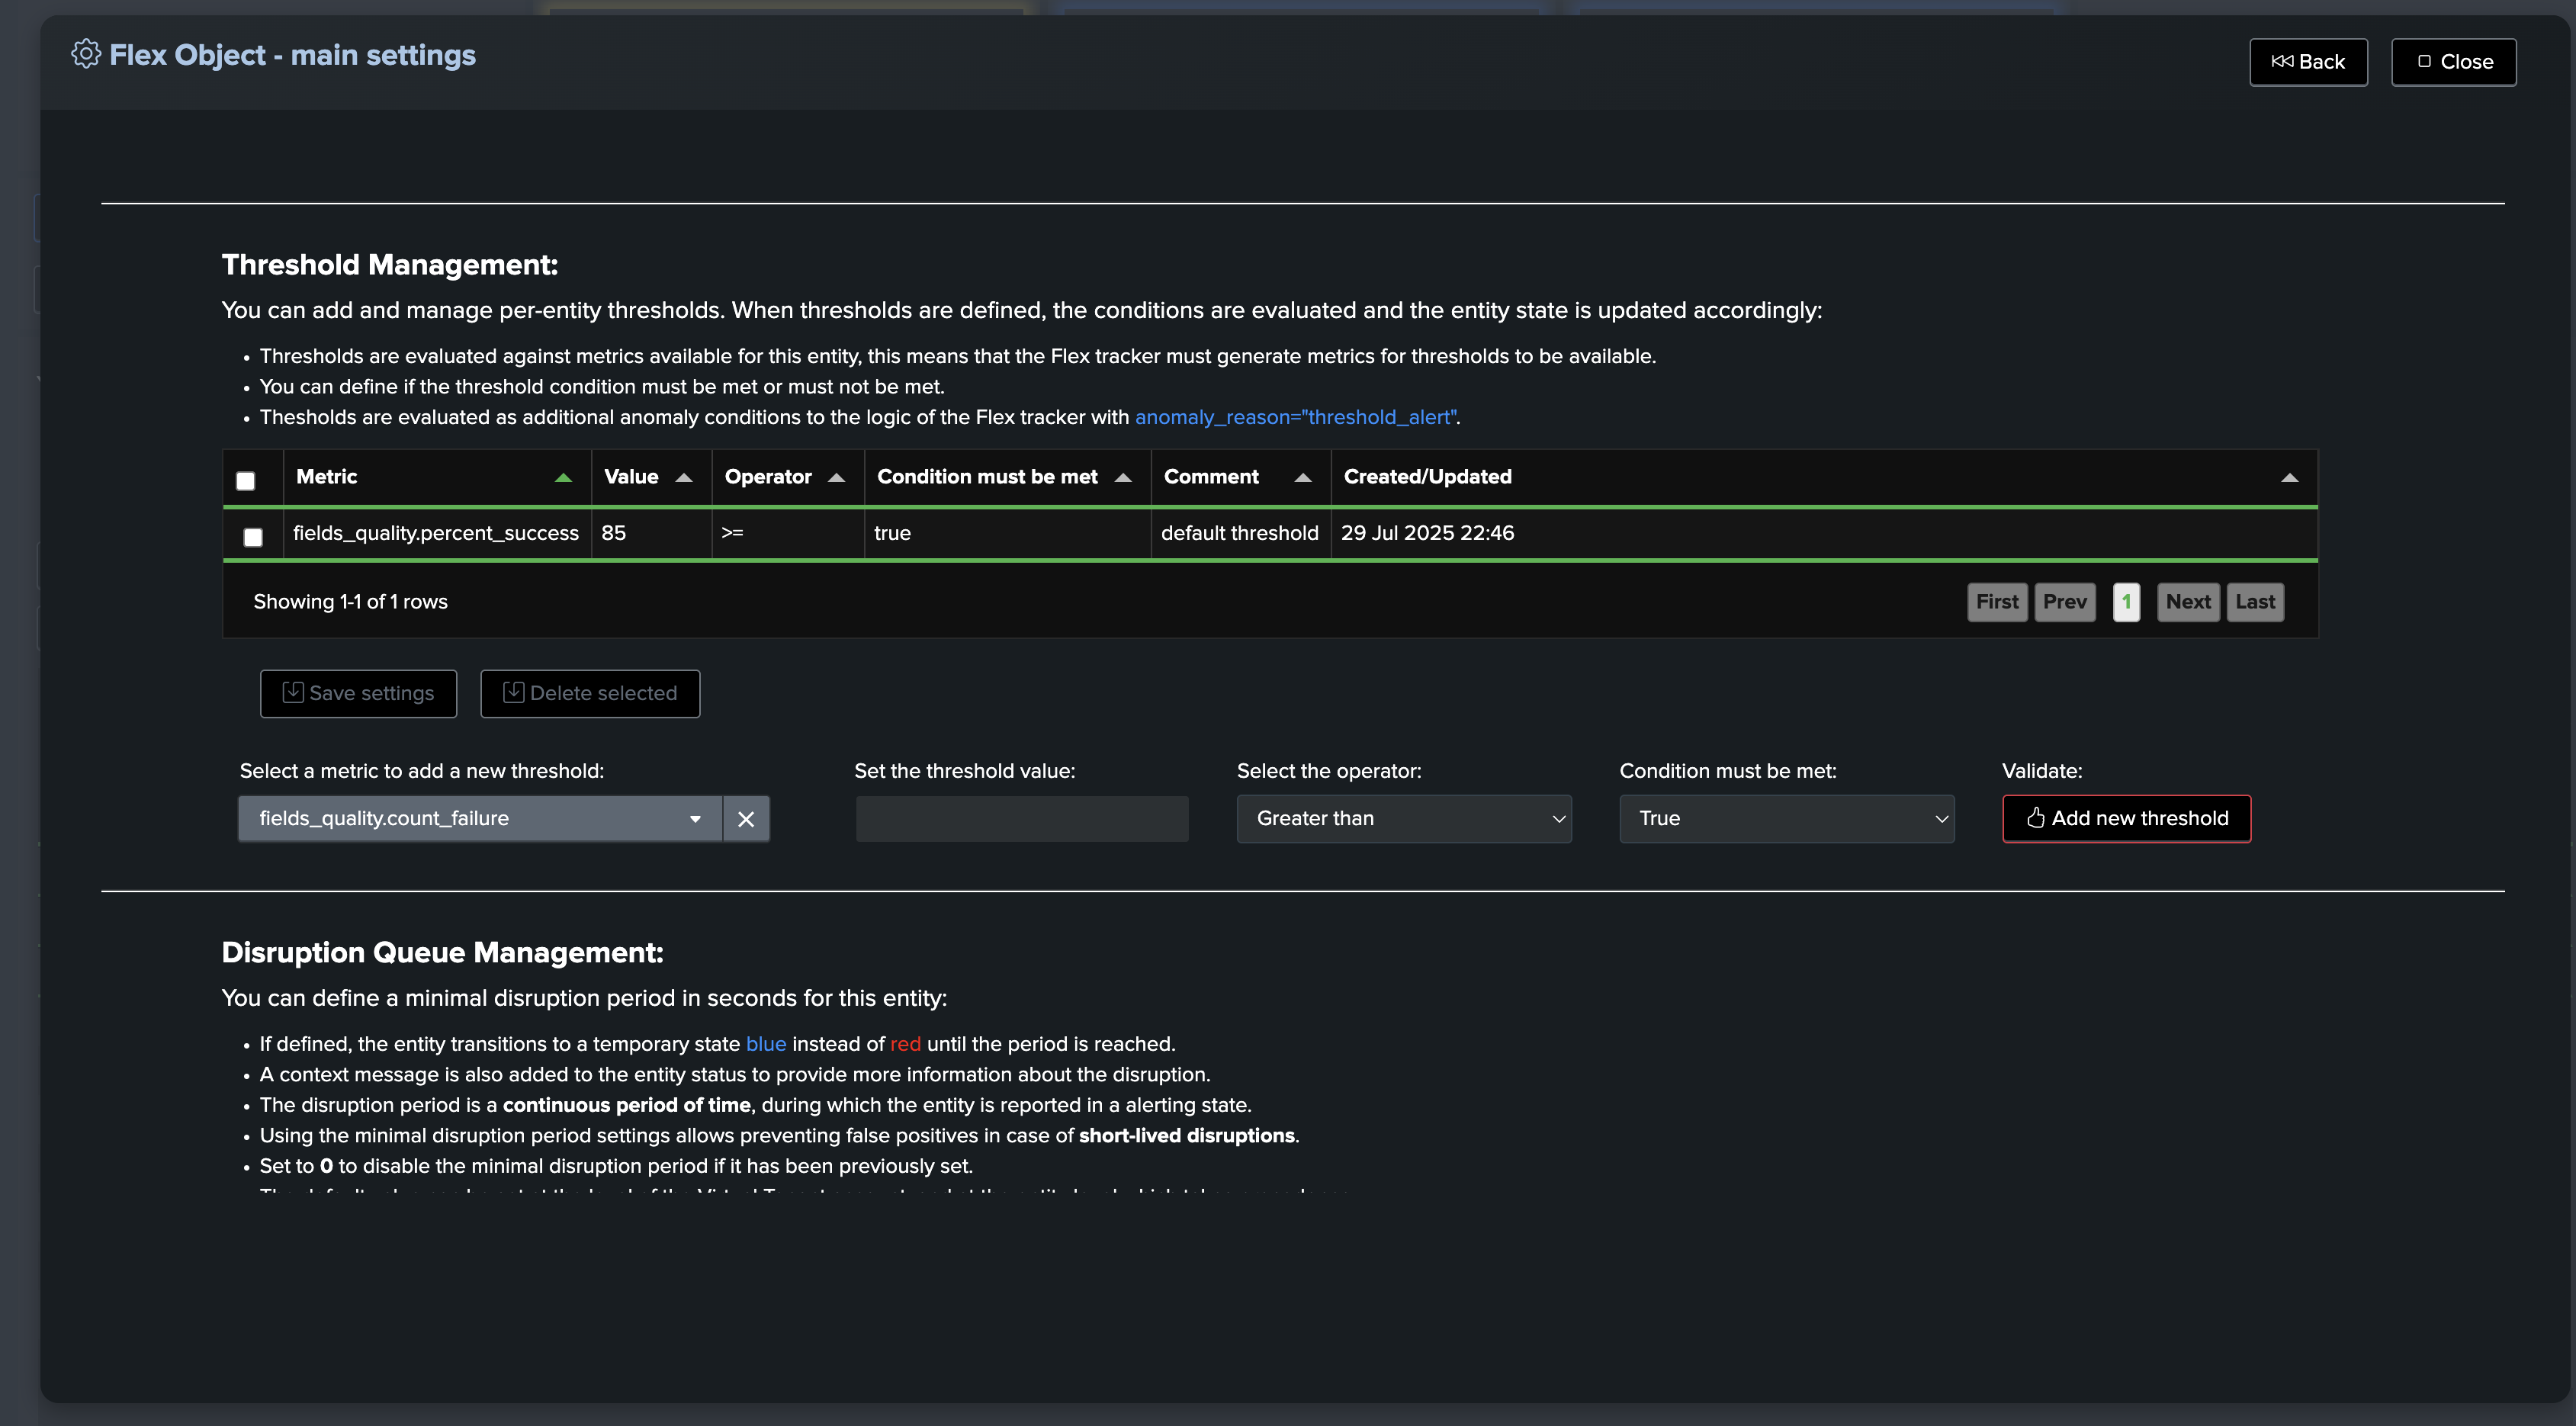
Updating the @global entity and fields entities thresholds
The @global entity and fields entities thresholds can be updated through the entity modification screen:
Hint
About updating fields entities thresholds:
Updating a threshold for a field is immediately reflected in the field entity view.
However, for the @global entity to reflect the new field status, the
monitorphase of the collect job must be executed.
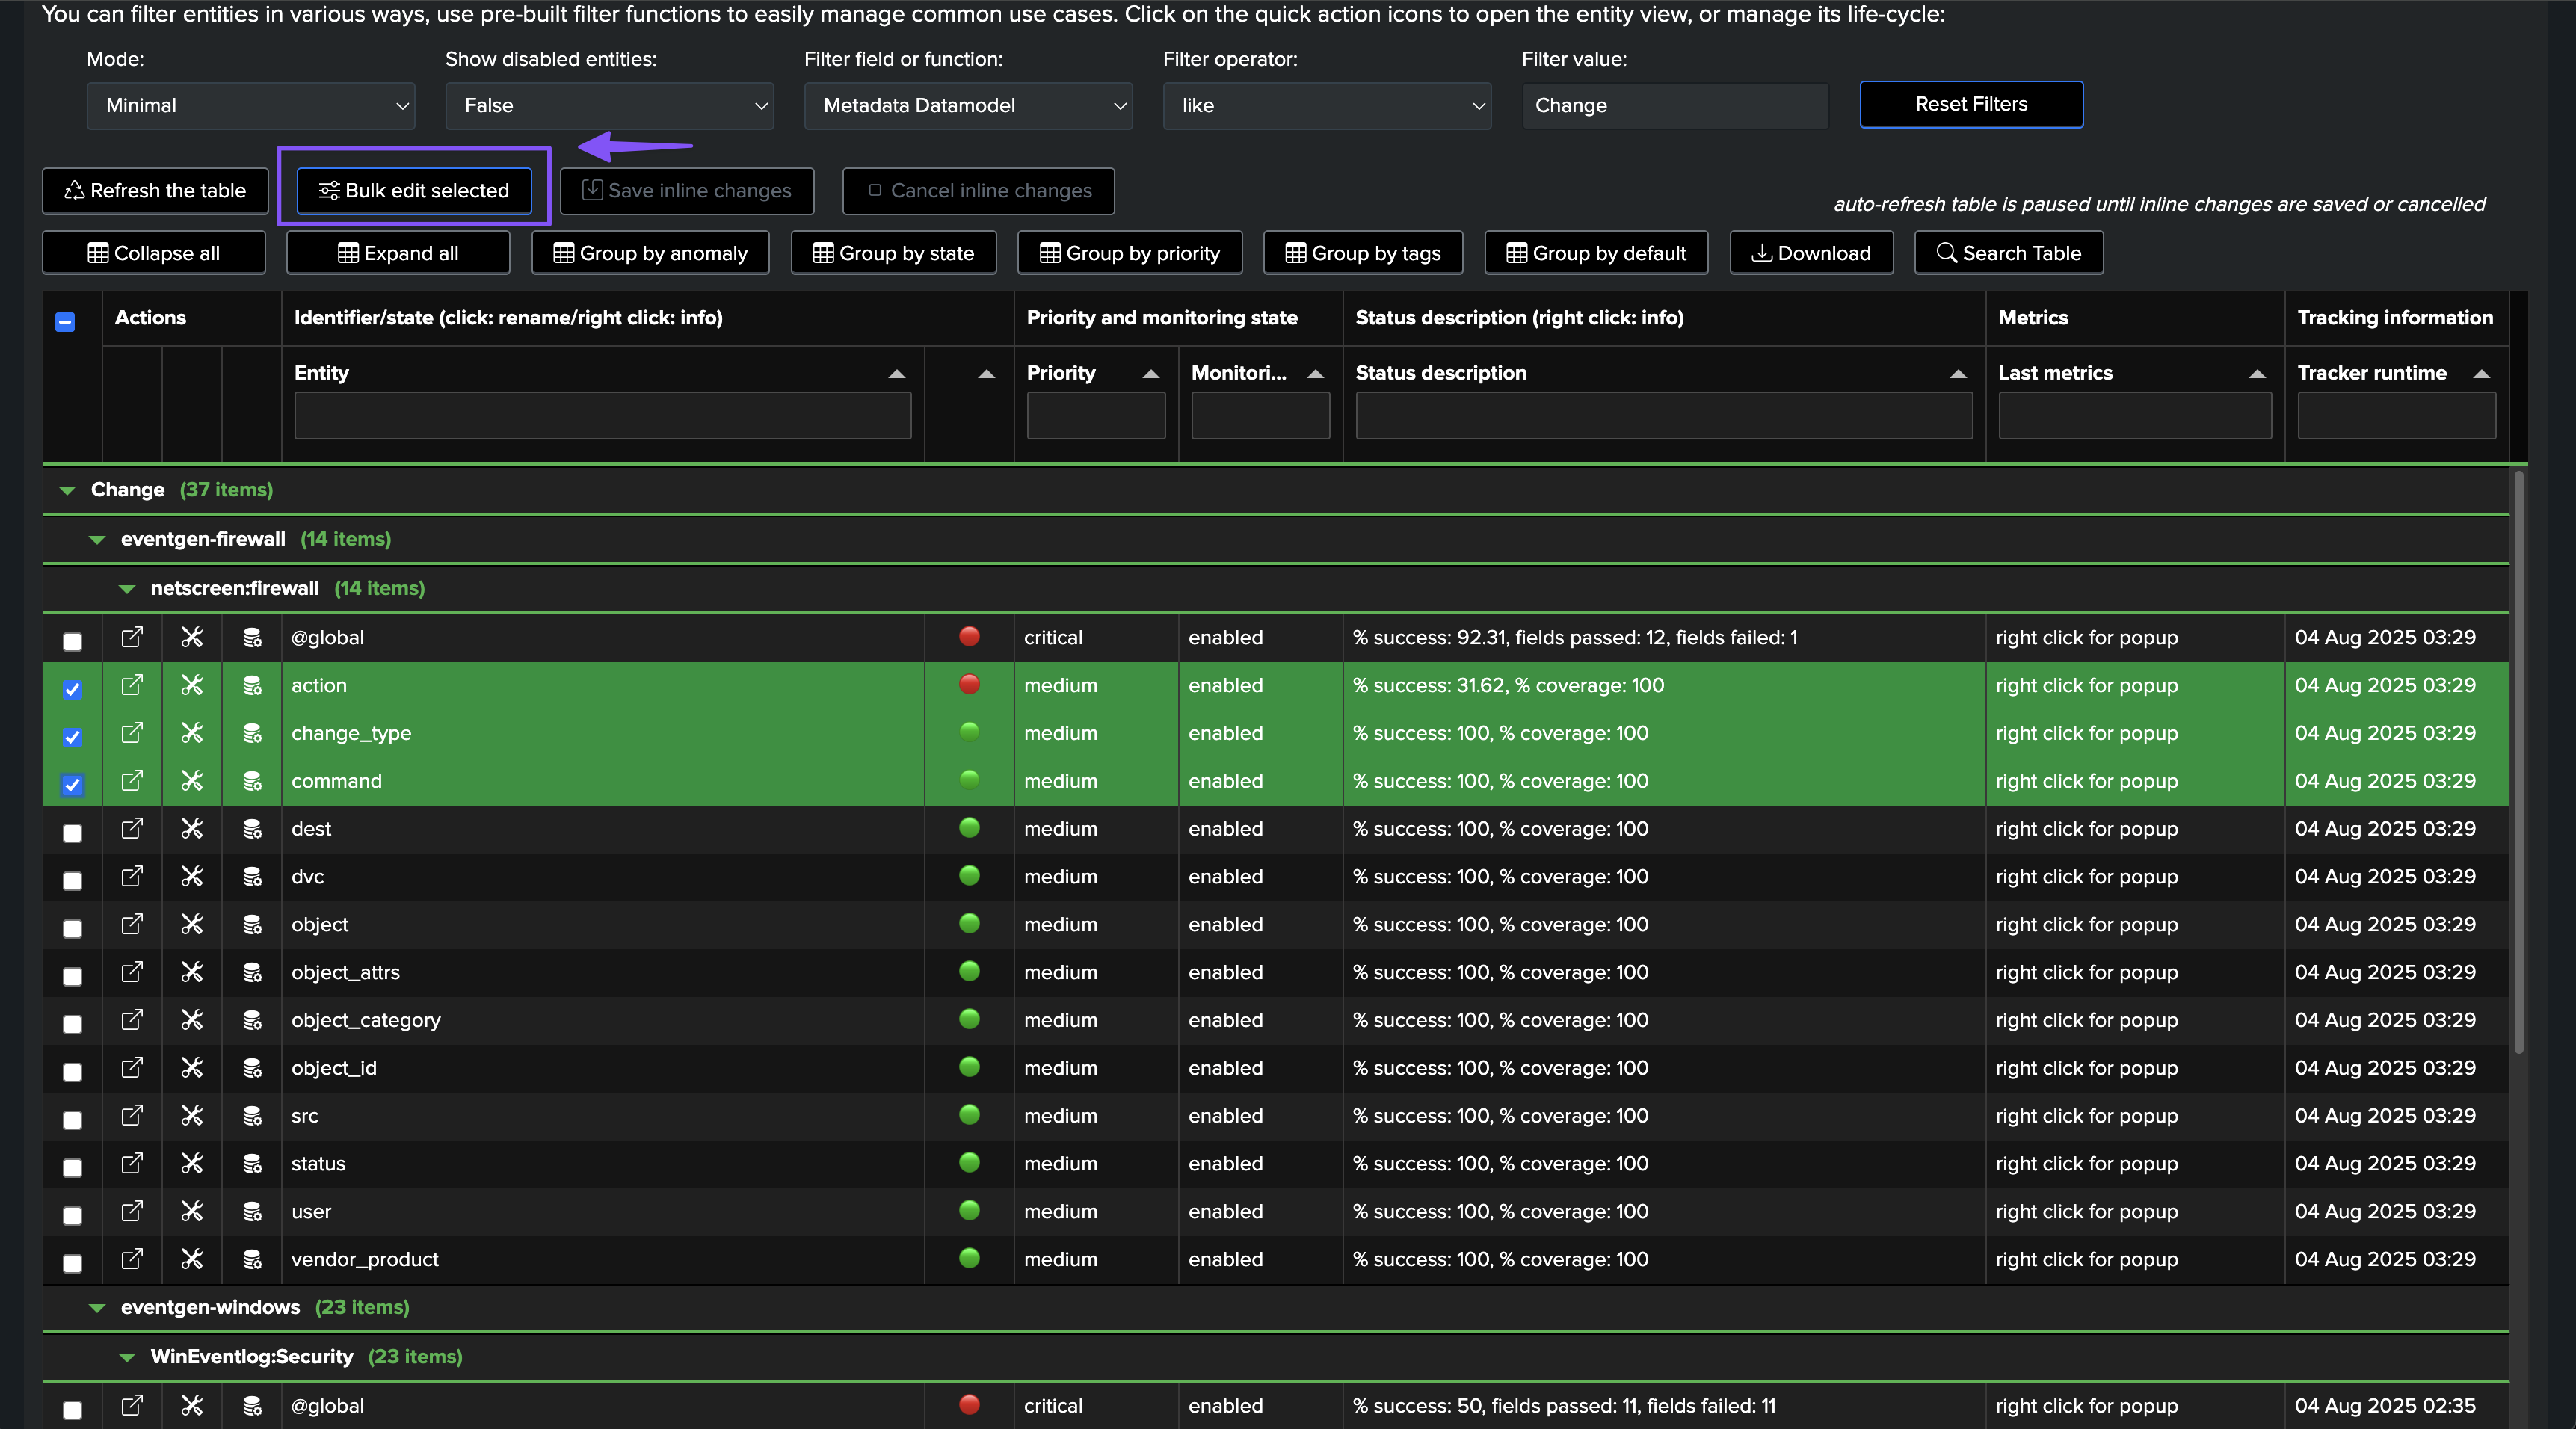
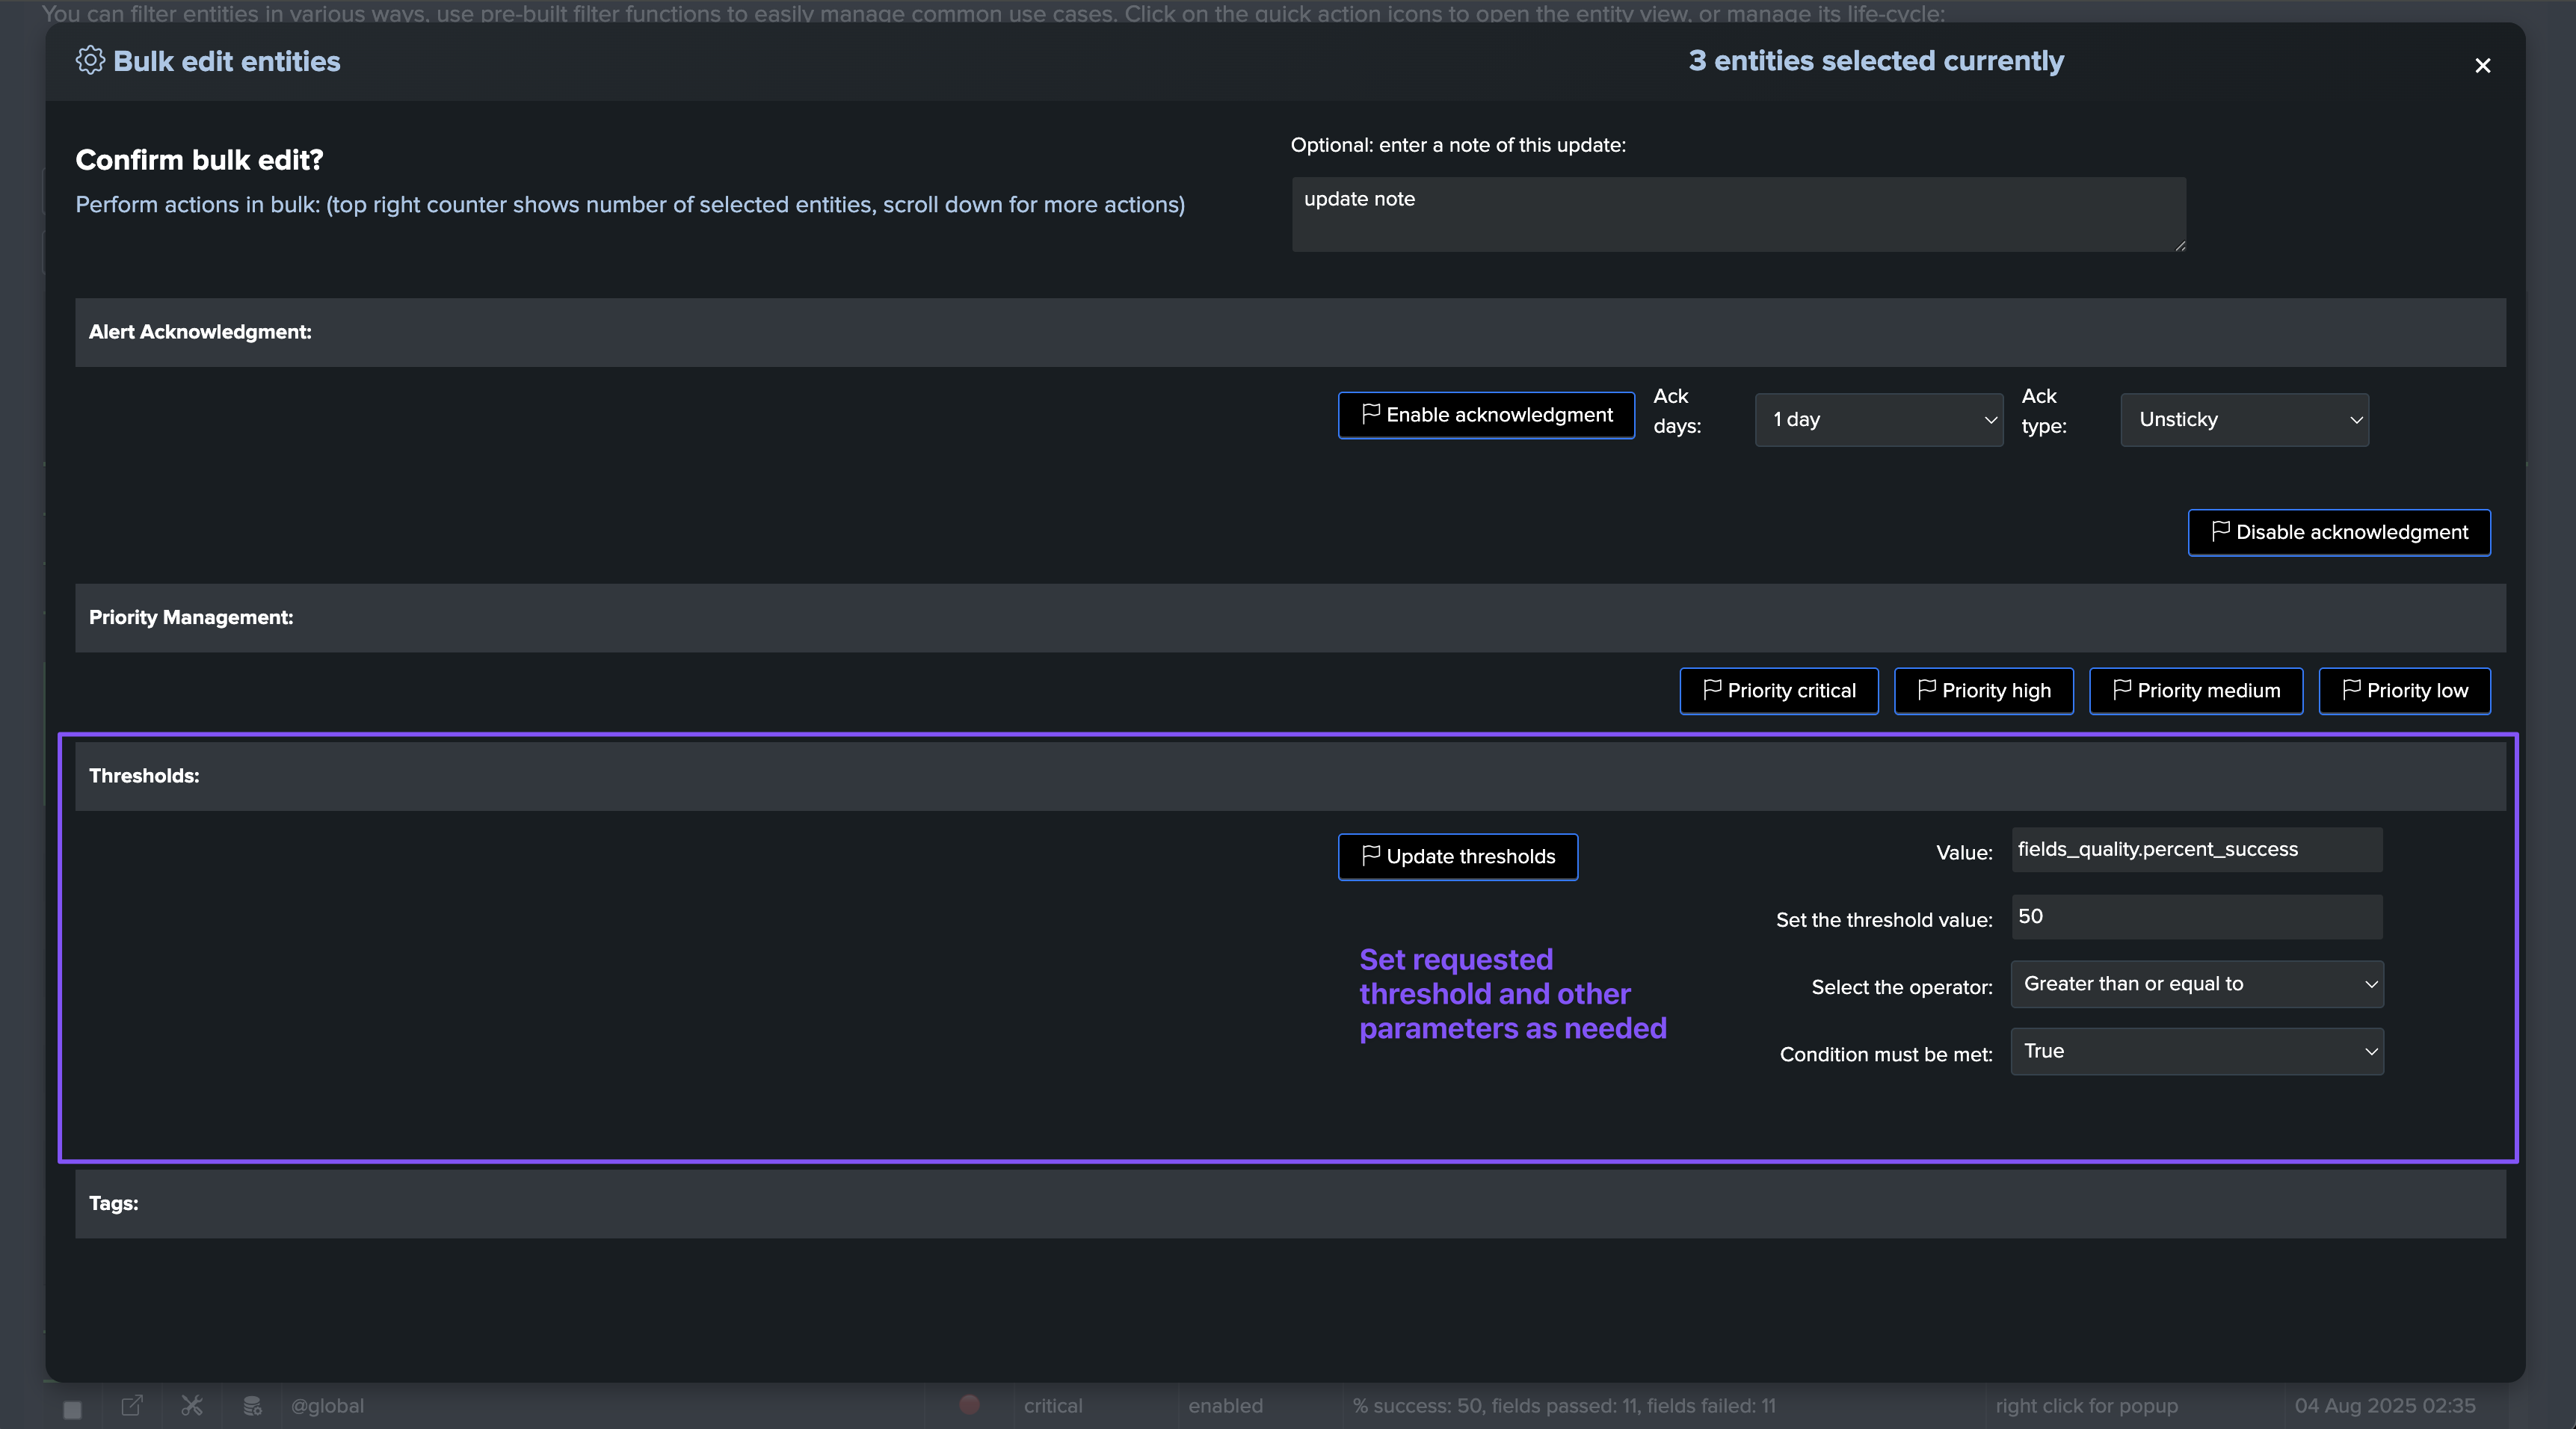
Updating thresholds in bulk after the entities discovery
You can update the thresholds in bulk after the entities discovery, by selecting the entities to be updated and then performing a bulk update through the bulk edit screen:
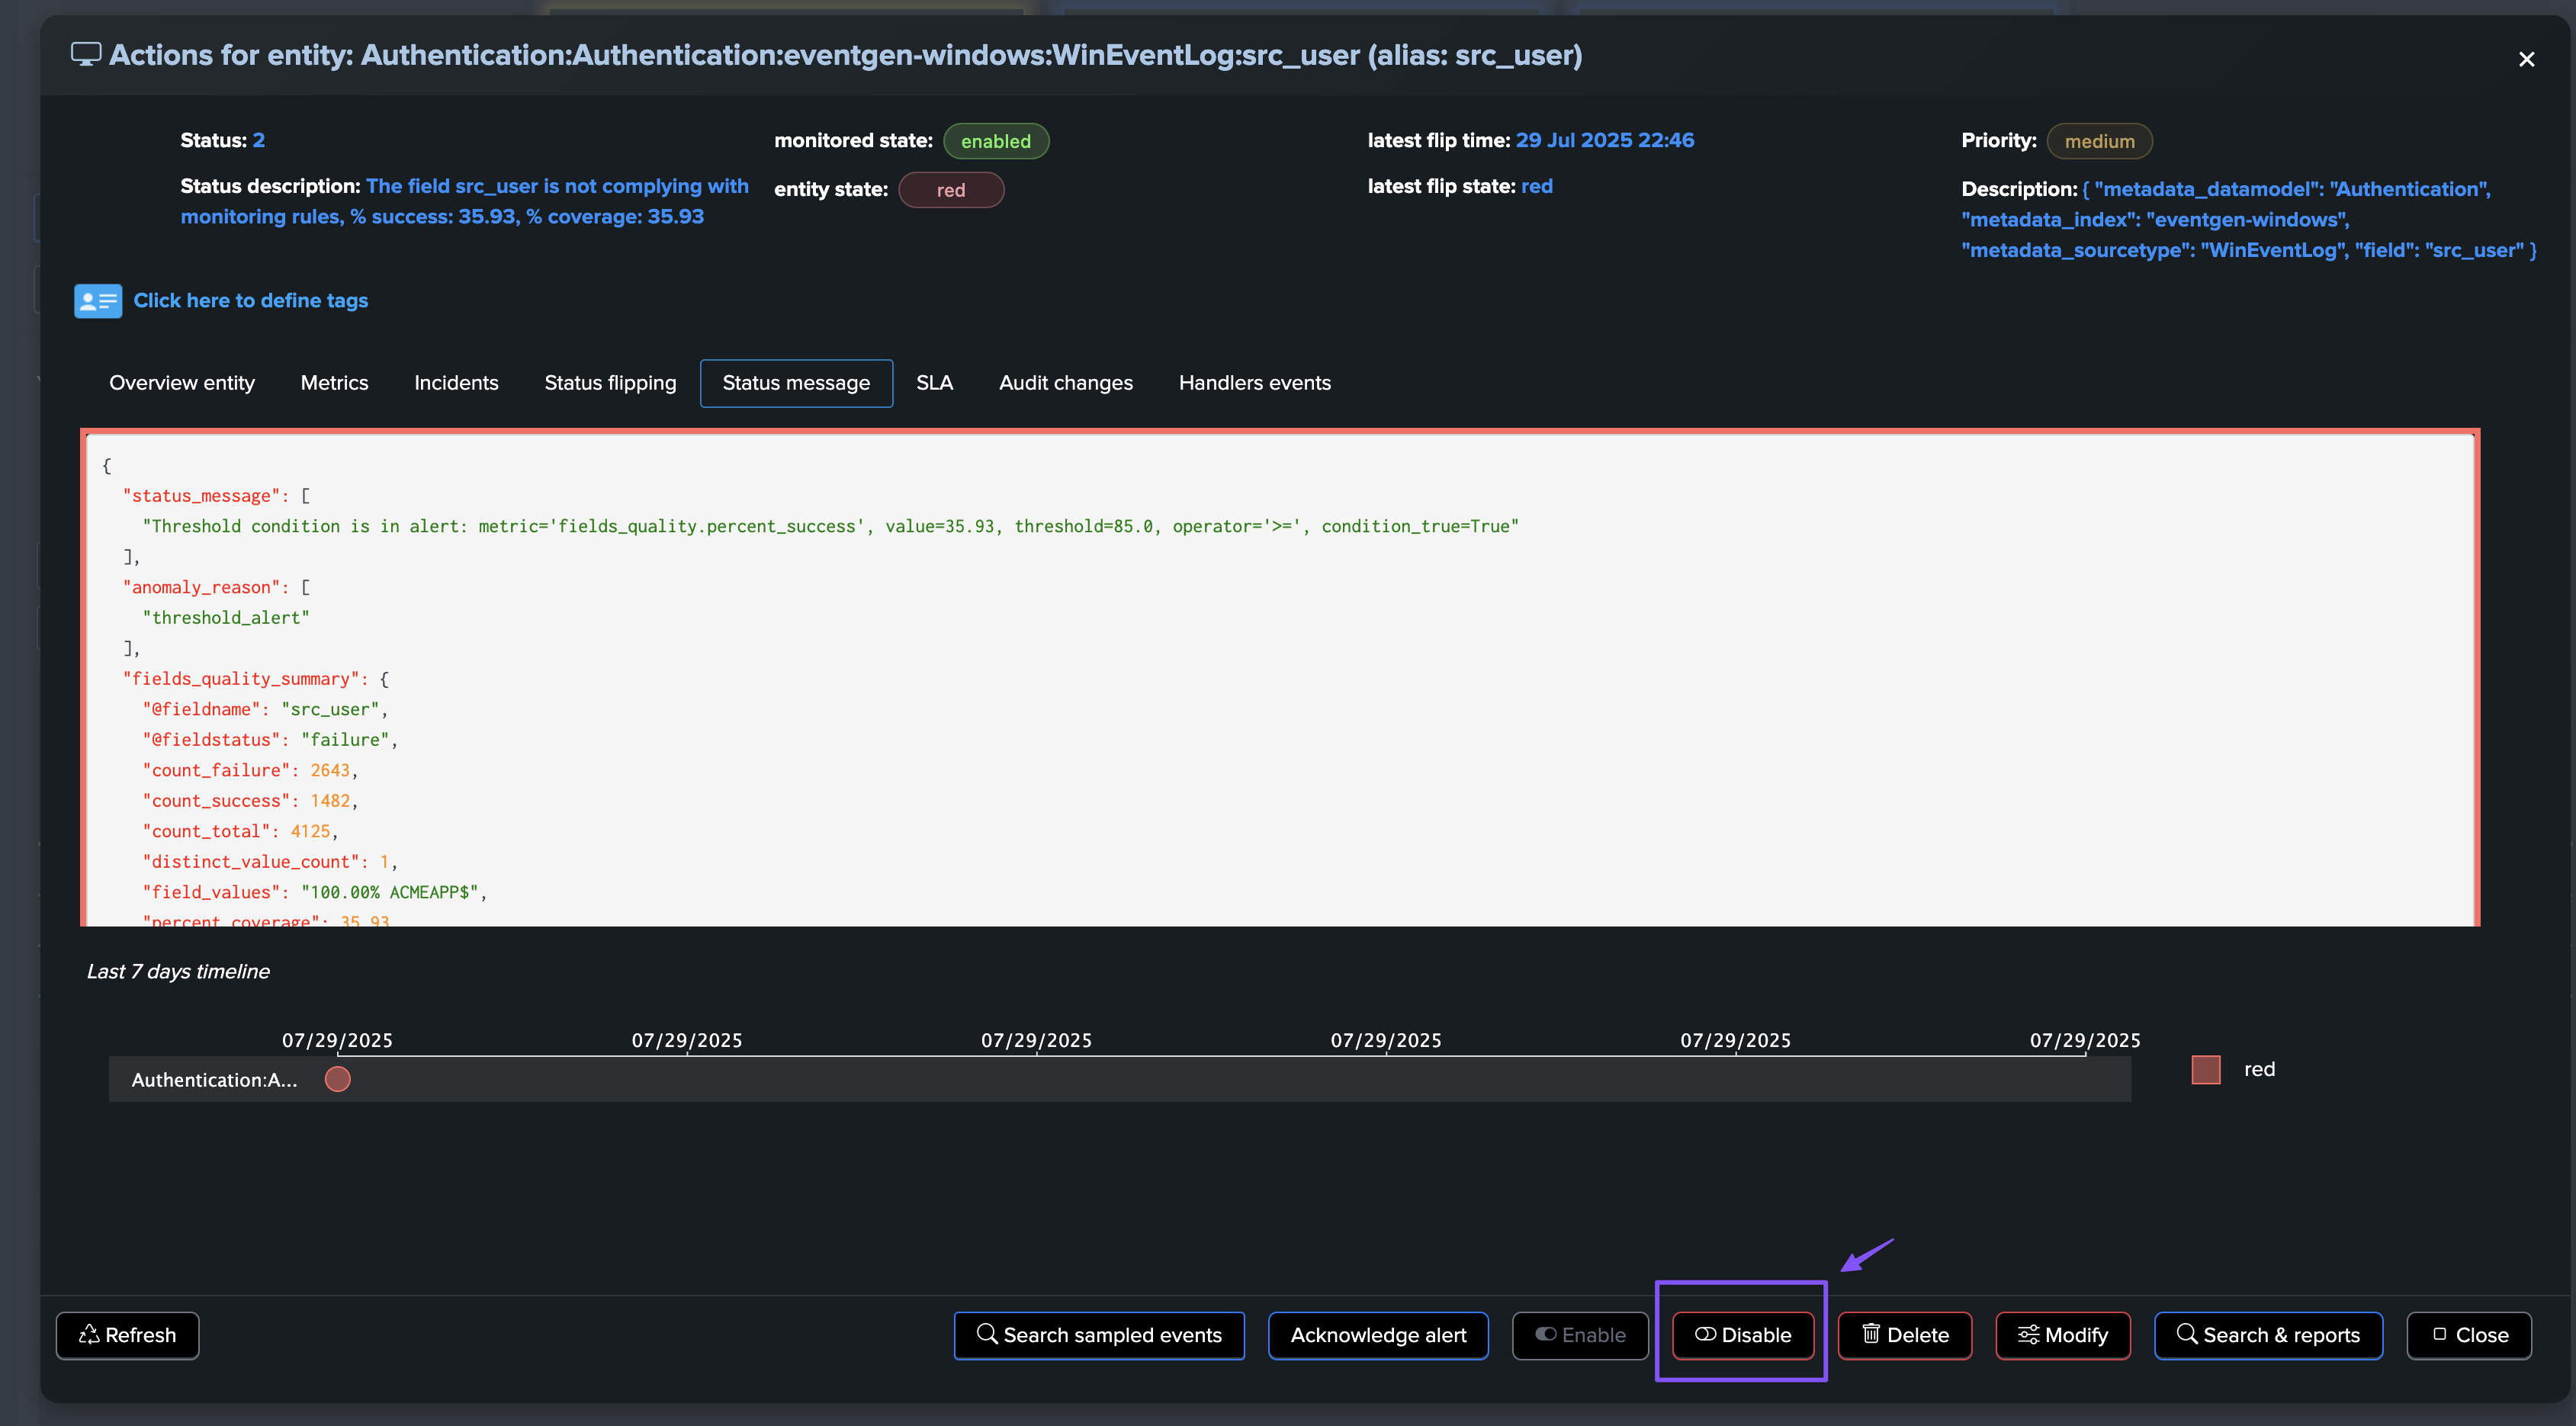
Disabling fields entities
You can use the normal TrackMe workflow to disable a field entity that you wouldn’t want to consider anymore:
Hint
About disabling a field entity and how it is reflected in the @global entity view:
Disabling a field entity is immediately taken into account for the entity itself.
This means that if, for instance, you have created an alert that covers field entities, a disabled field entity will never be considered.
As well, the UI will not show by default entities that are disabled.
However, the @global entity will still aggregate the disabled fields until the
monitorphase of the collect job is executed.
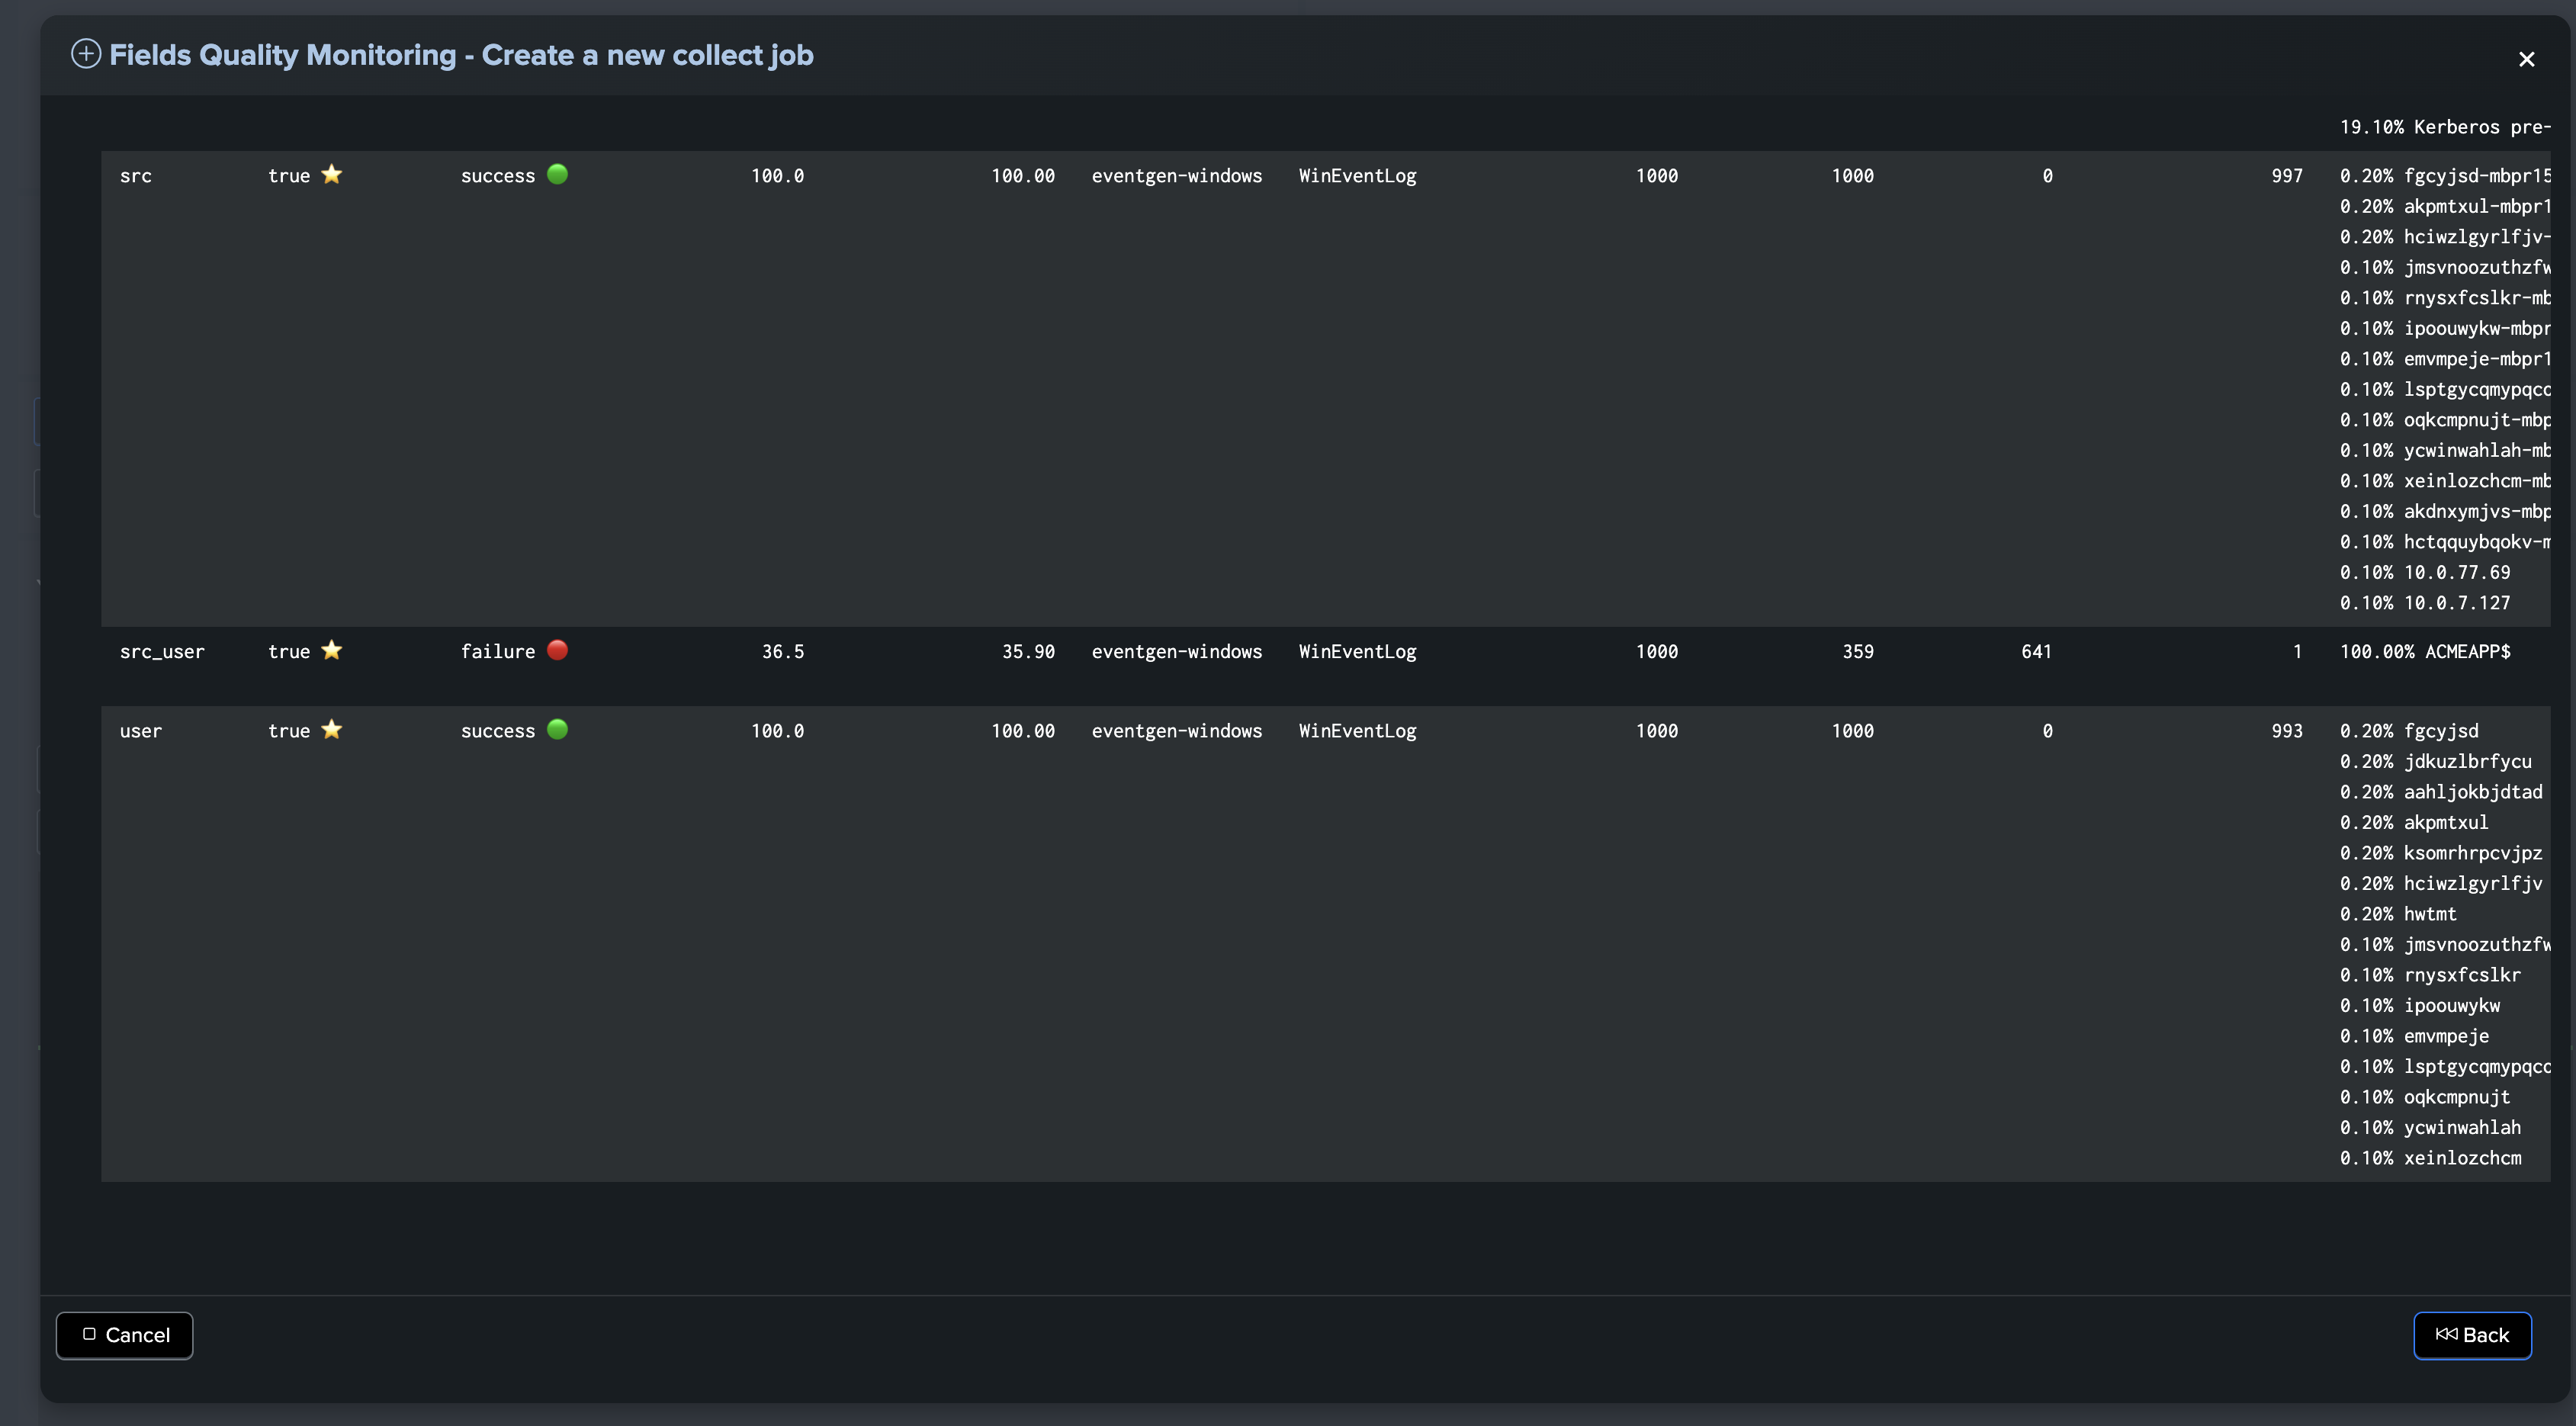
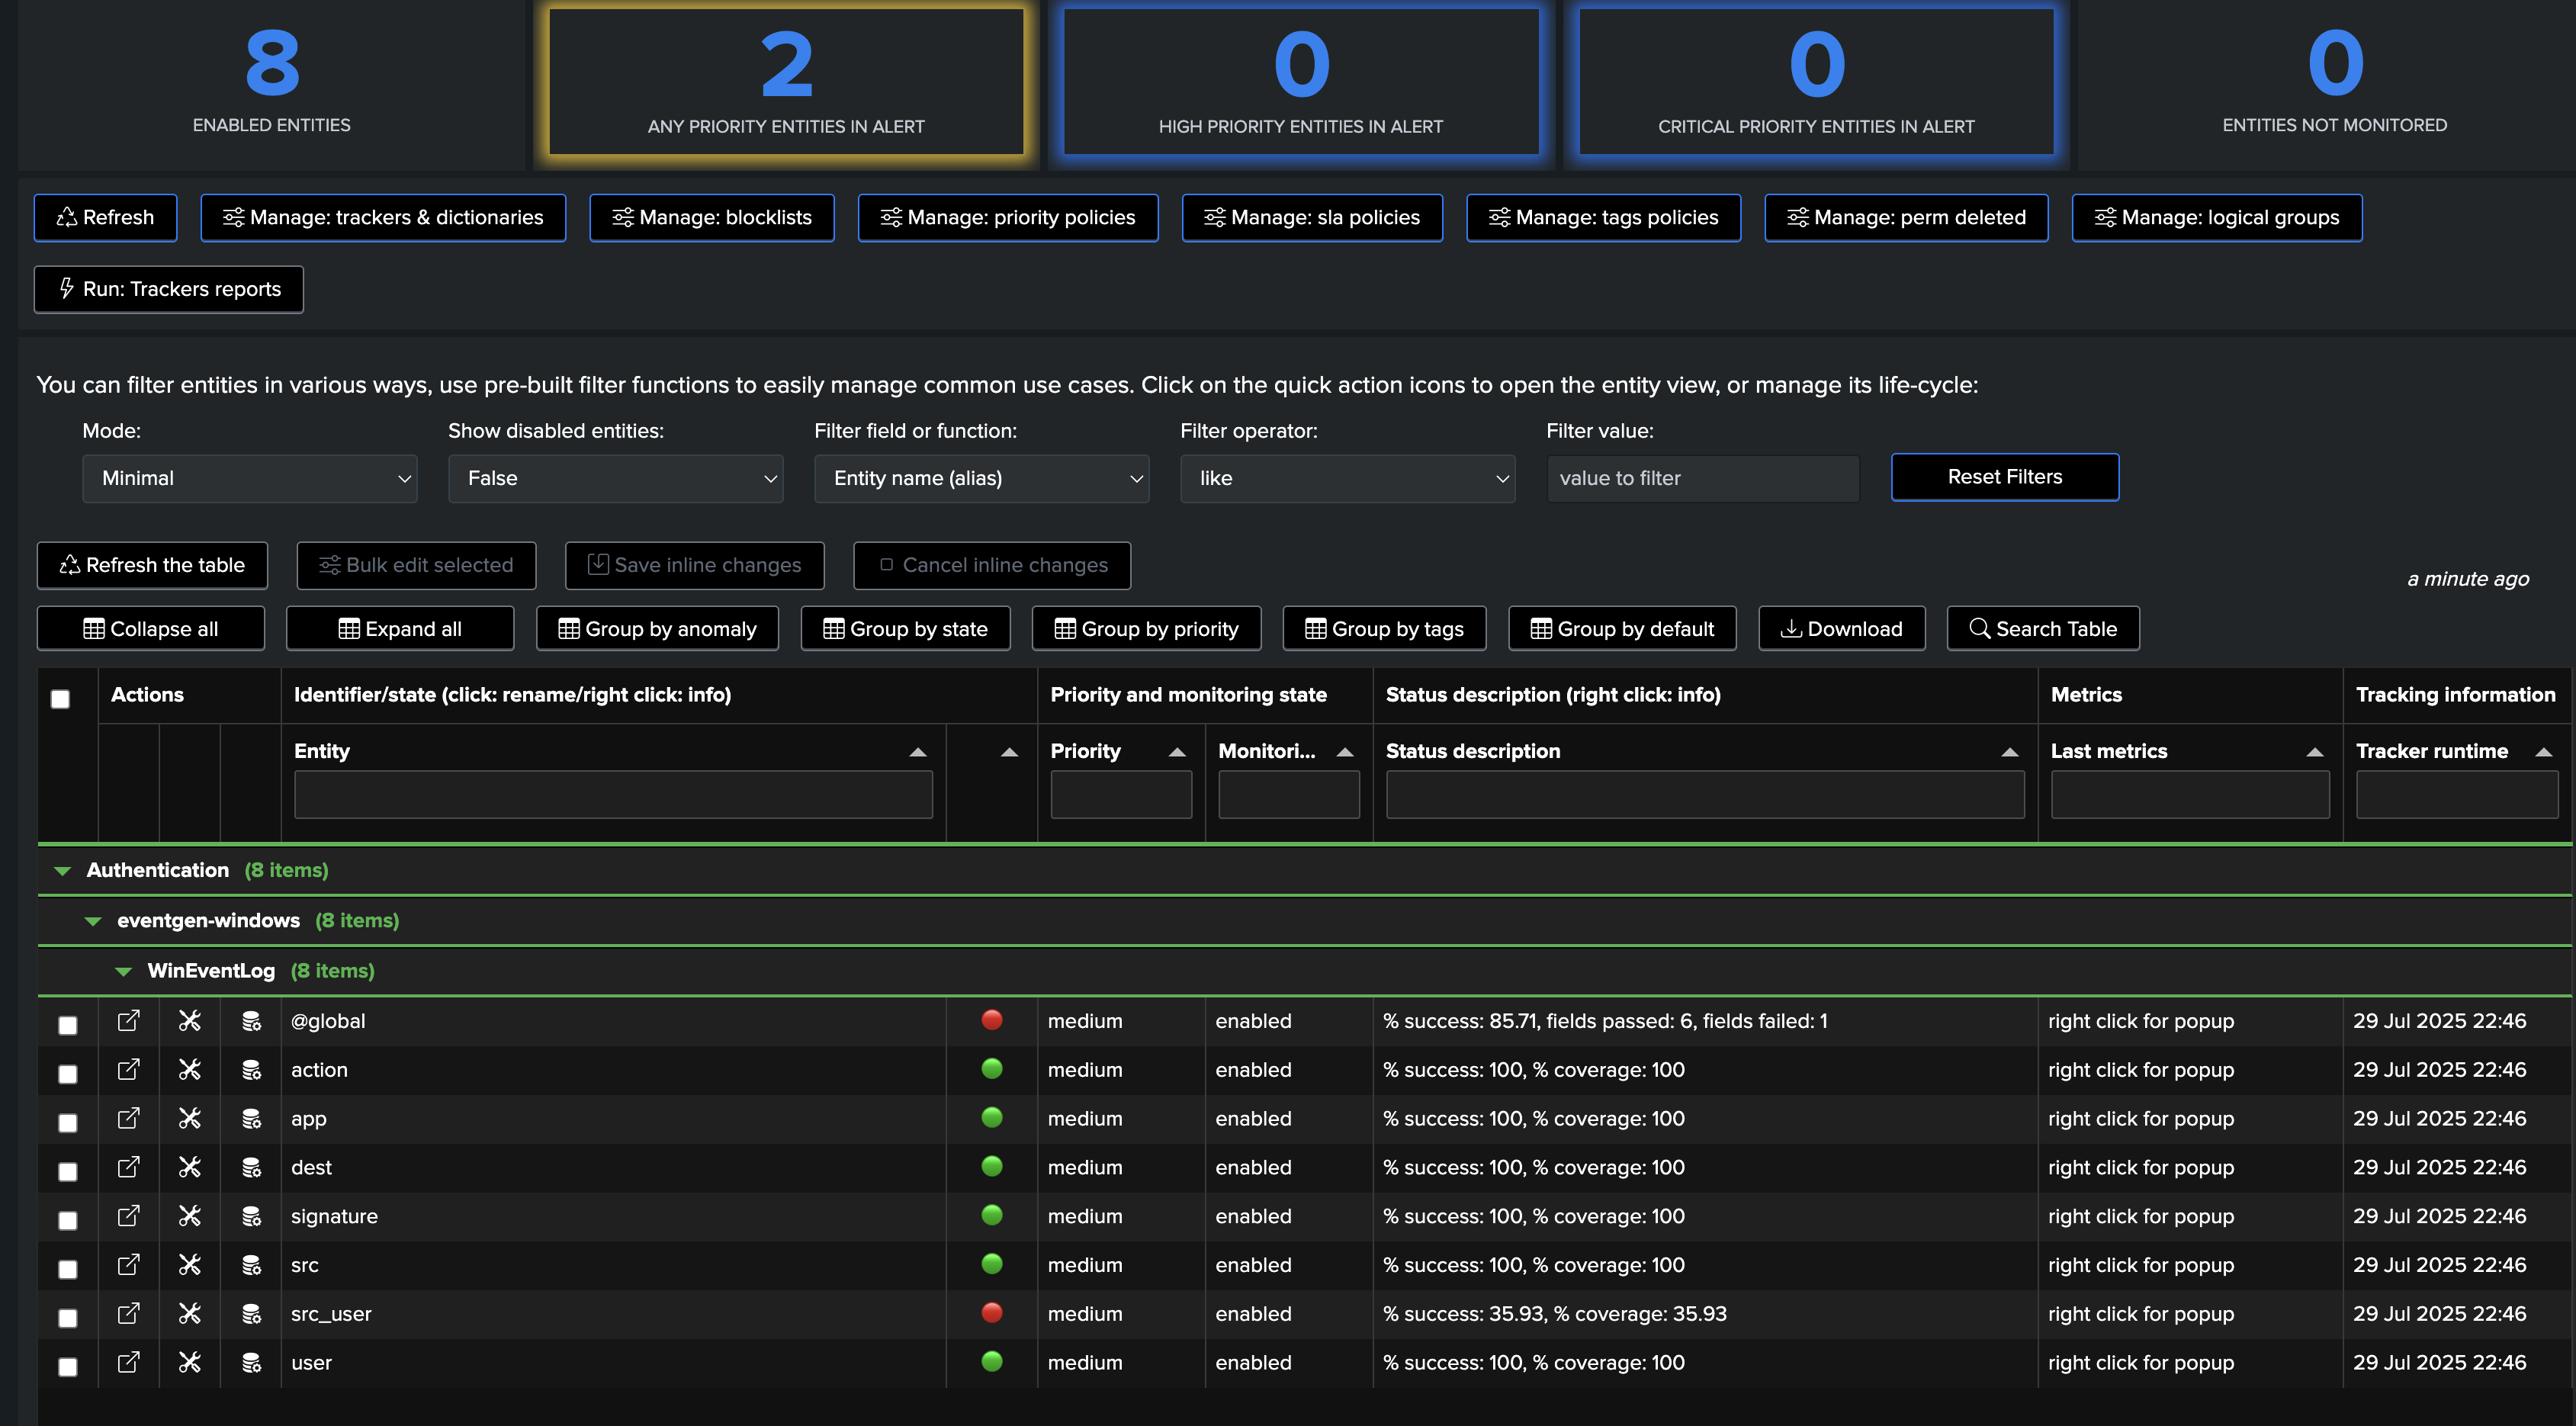
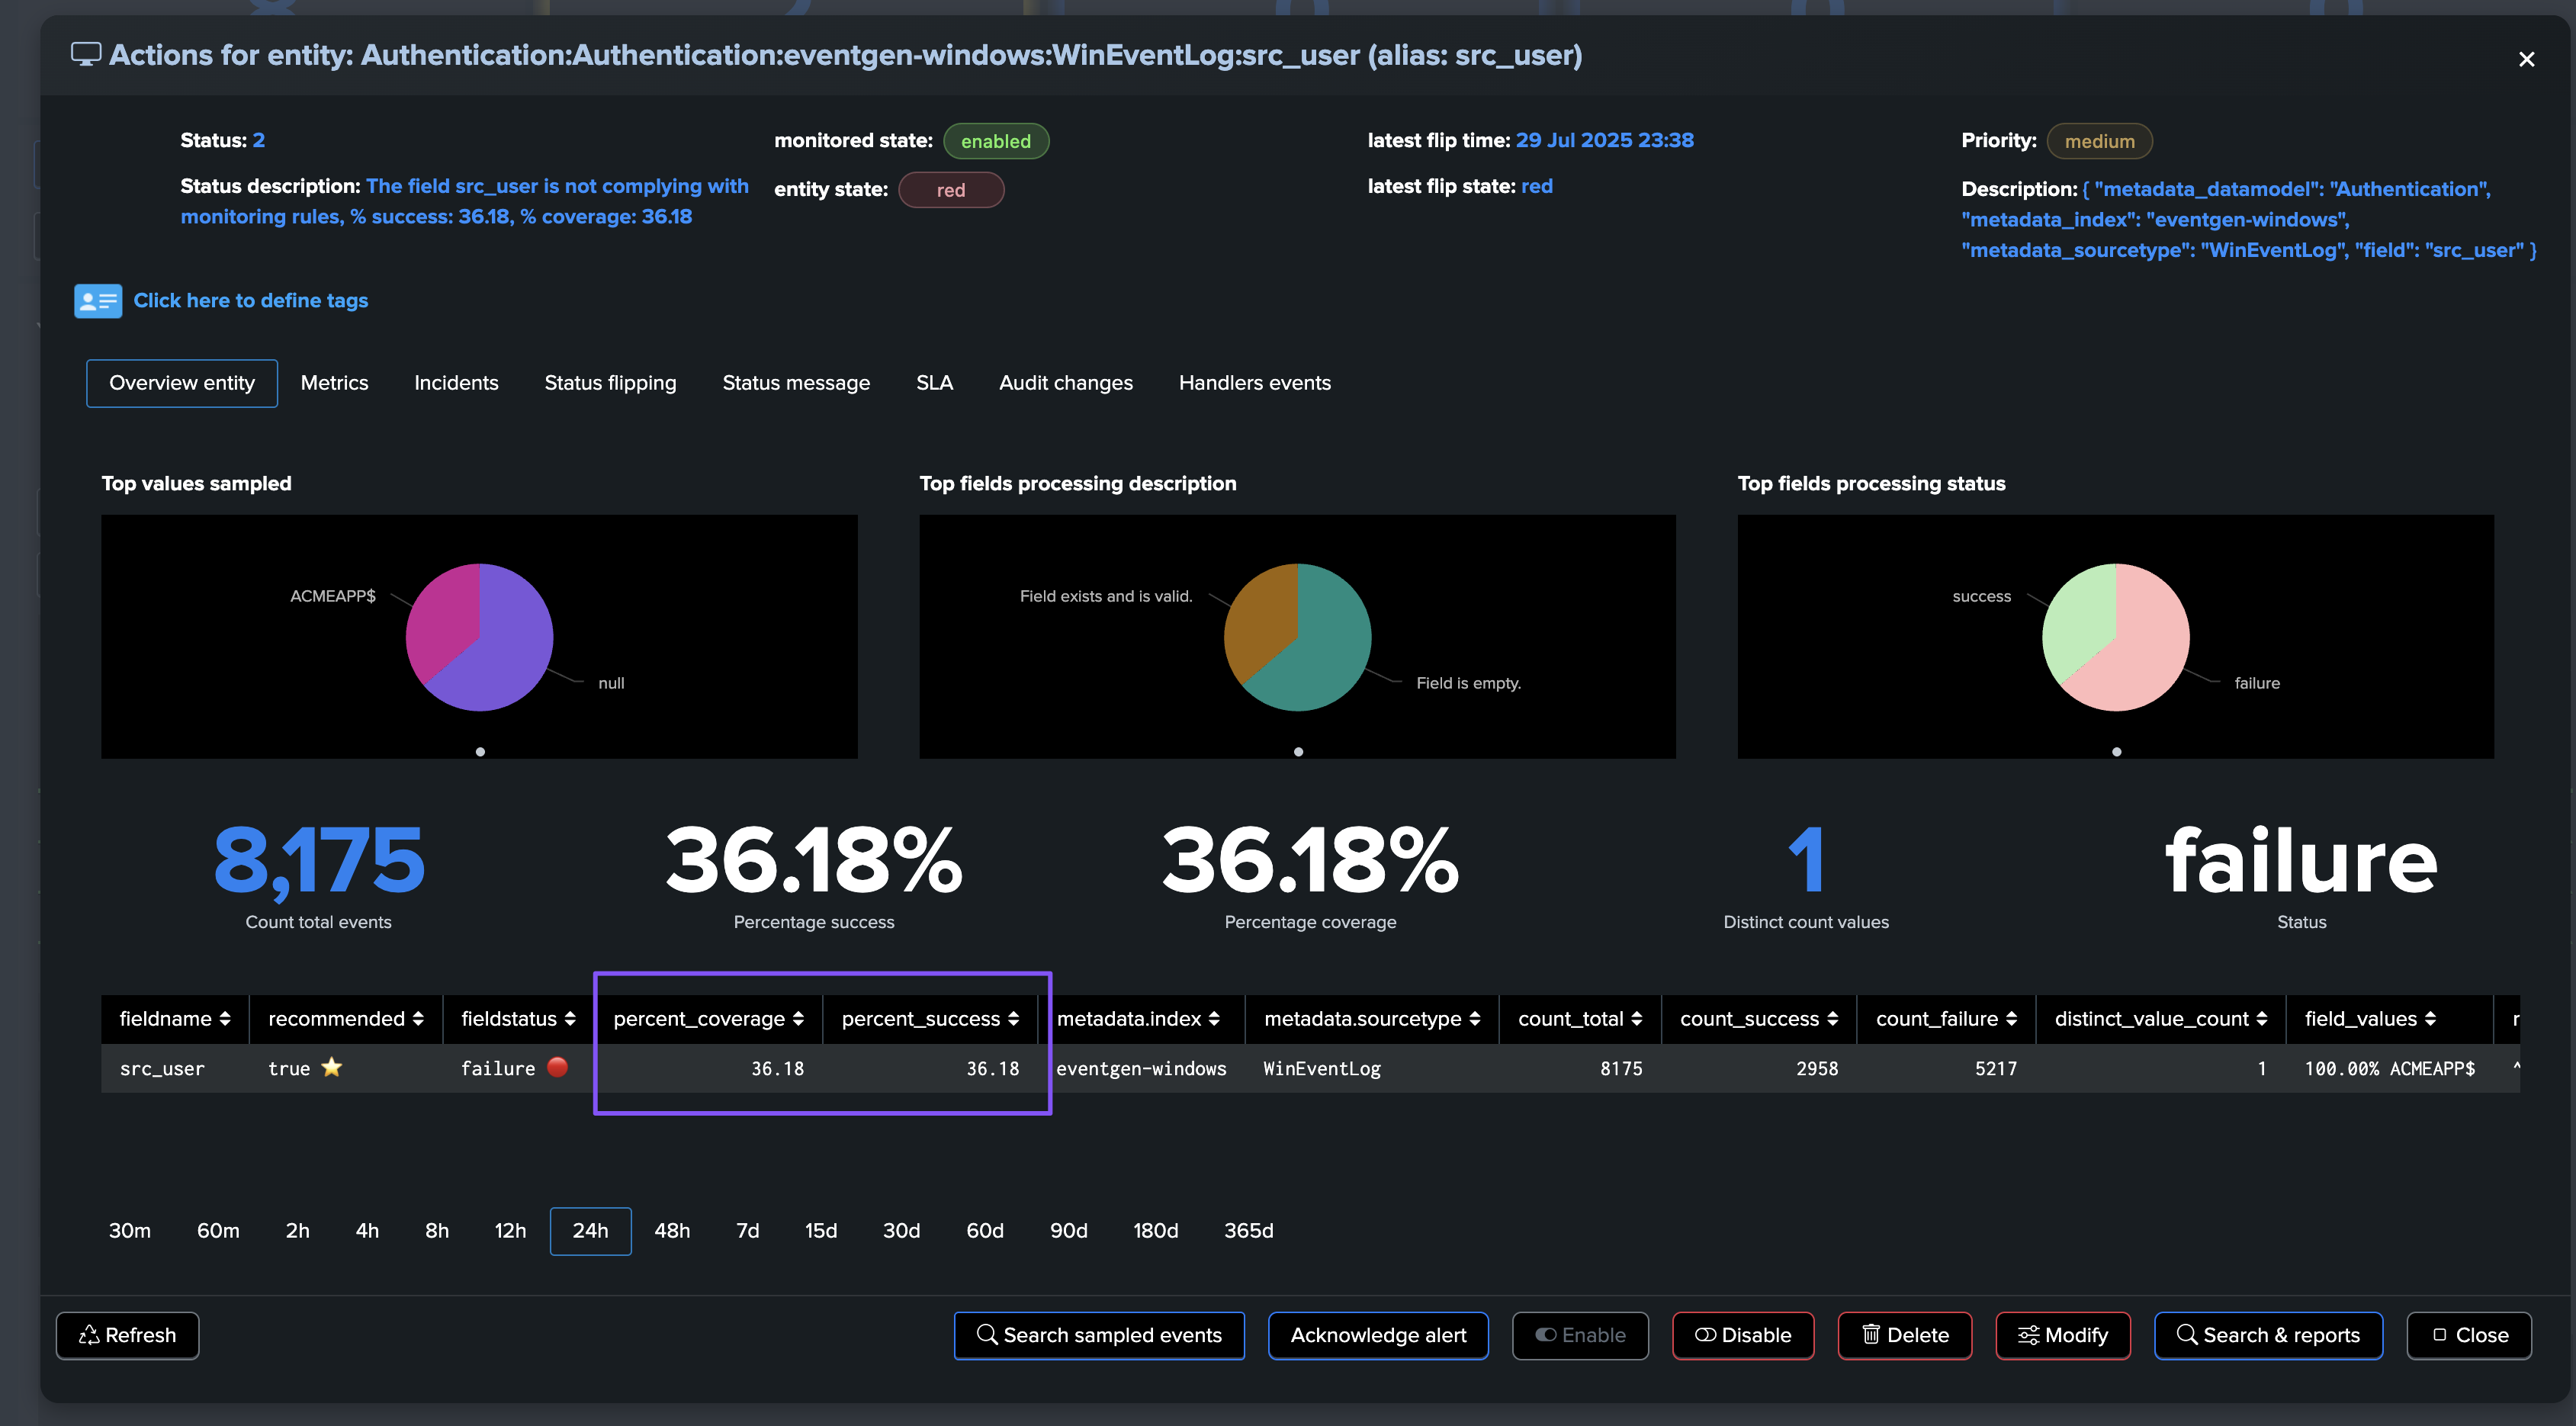
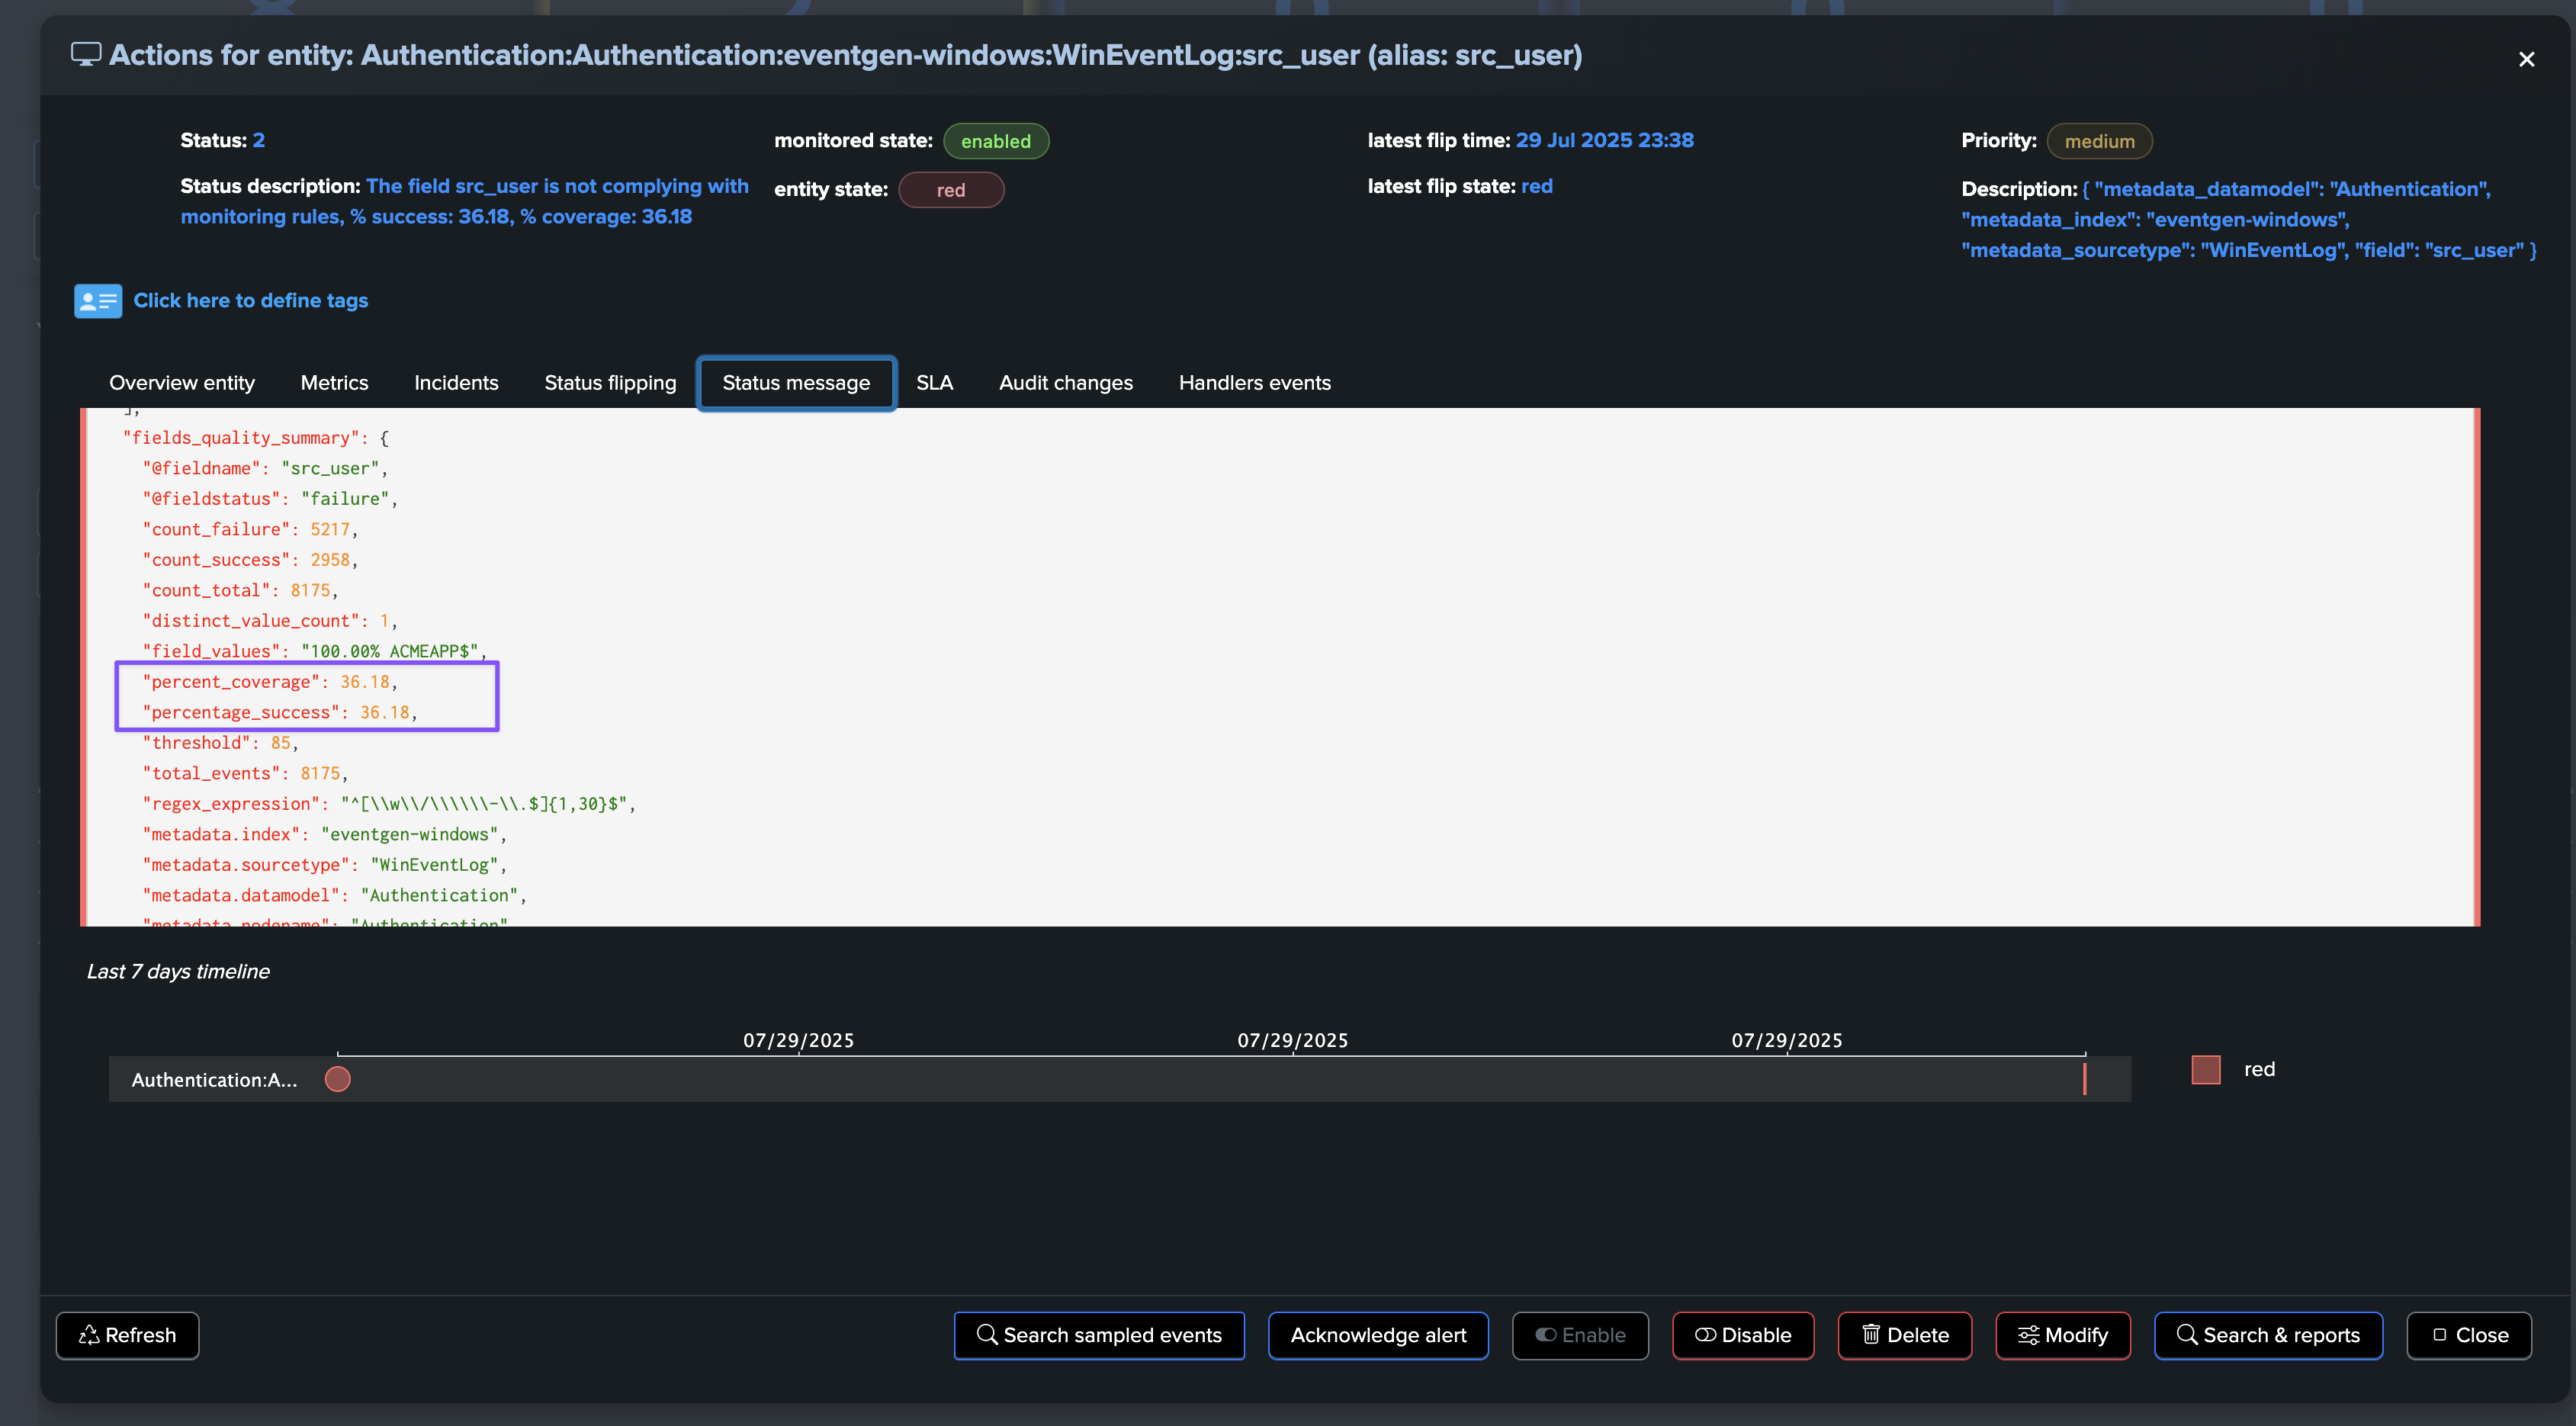
About fields percentage of success and percentage of coverage
For fields entities, TrackMe reports two key metrics:
The percentage of success, which is the percentage of times a field has passed the quality checks according to the dictionary definition: is the field empty, missing or null, unknown, or has the regular expression matched.
The percentage of coverage, which is simply the percentage of times the field was part of the dataset and not empty or null.
Managing Data Dictionaries
You can manage the data dictionaries through the dictionaries management interface:
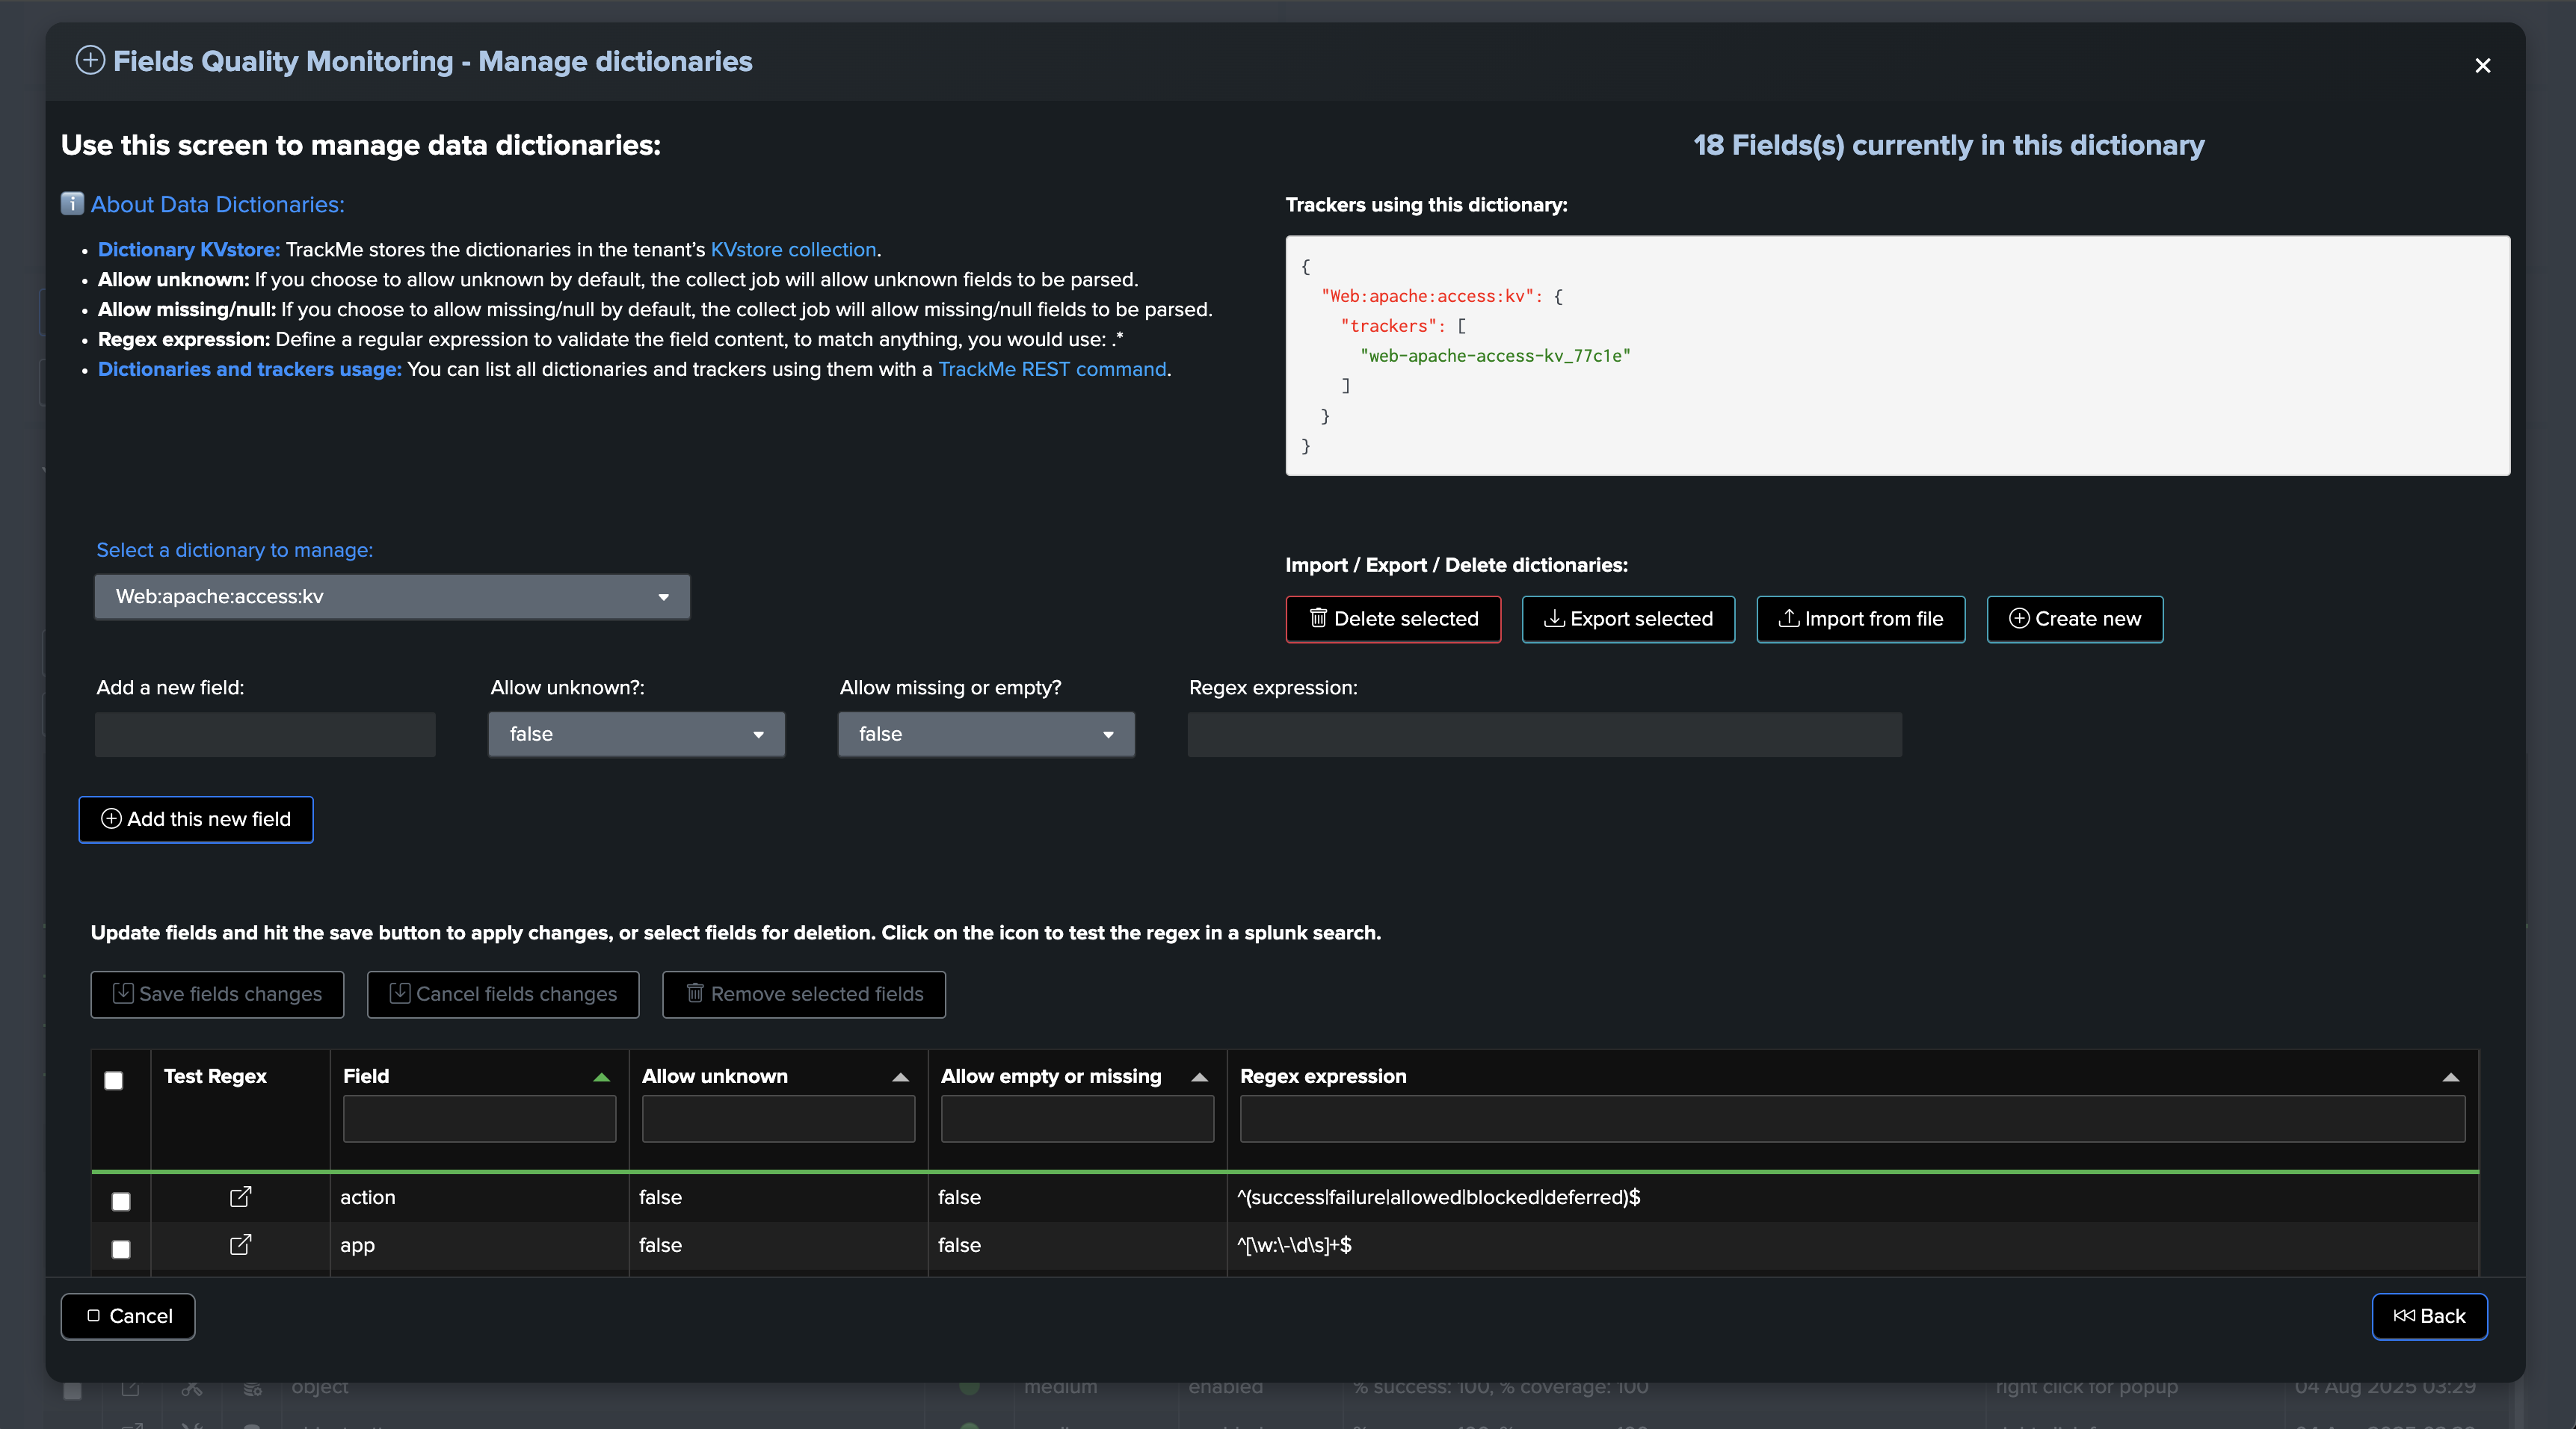
About the data dictionary management:
Dictionary KVstore: TrackMe stores the dictionaries in the tenant’s KVstore collection.
Allow unknown: If you choose to allow unknown by default, the collect job will allow unknown fields to be parsed.
Allow missing/null: If you choose to allow missing/null by default, the collect job will allow missing/null fields to be parsed.
Regex expression: Define a regular expression to validate the field content. To match anything, you would use: .*
Dictionaries and trackers usage: You can list all dictionaries and trackers using them with a TrackMe REST command.
Hint
Actions that can be performed on a data dictionary:
Delete selected dictionary
Export selected dictionary
Import selected dictionary
Adding a new field and specifying allow unknown, allow missing/null, regex expression
Updating existing fields definition and their parameters
Testing a regular expression against the field dataset
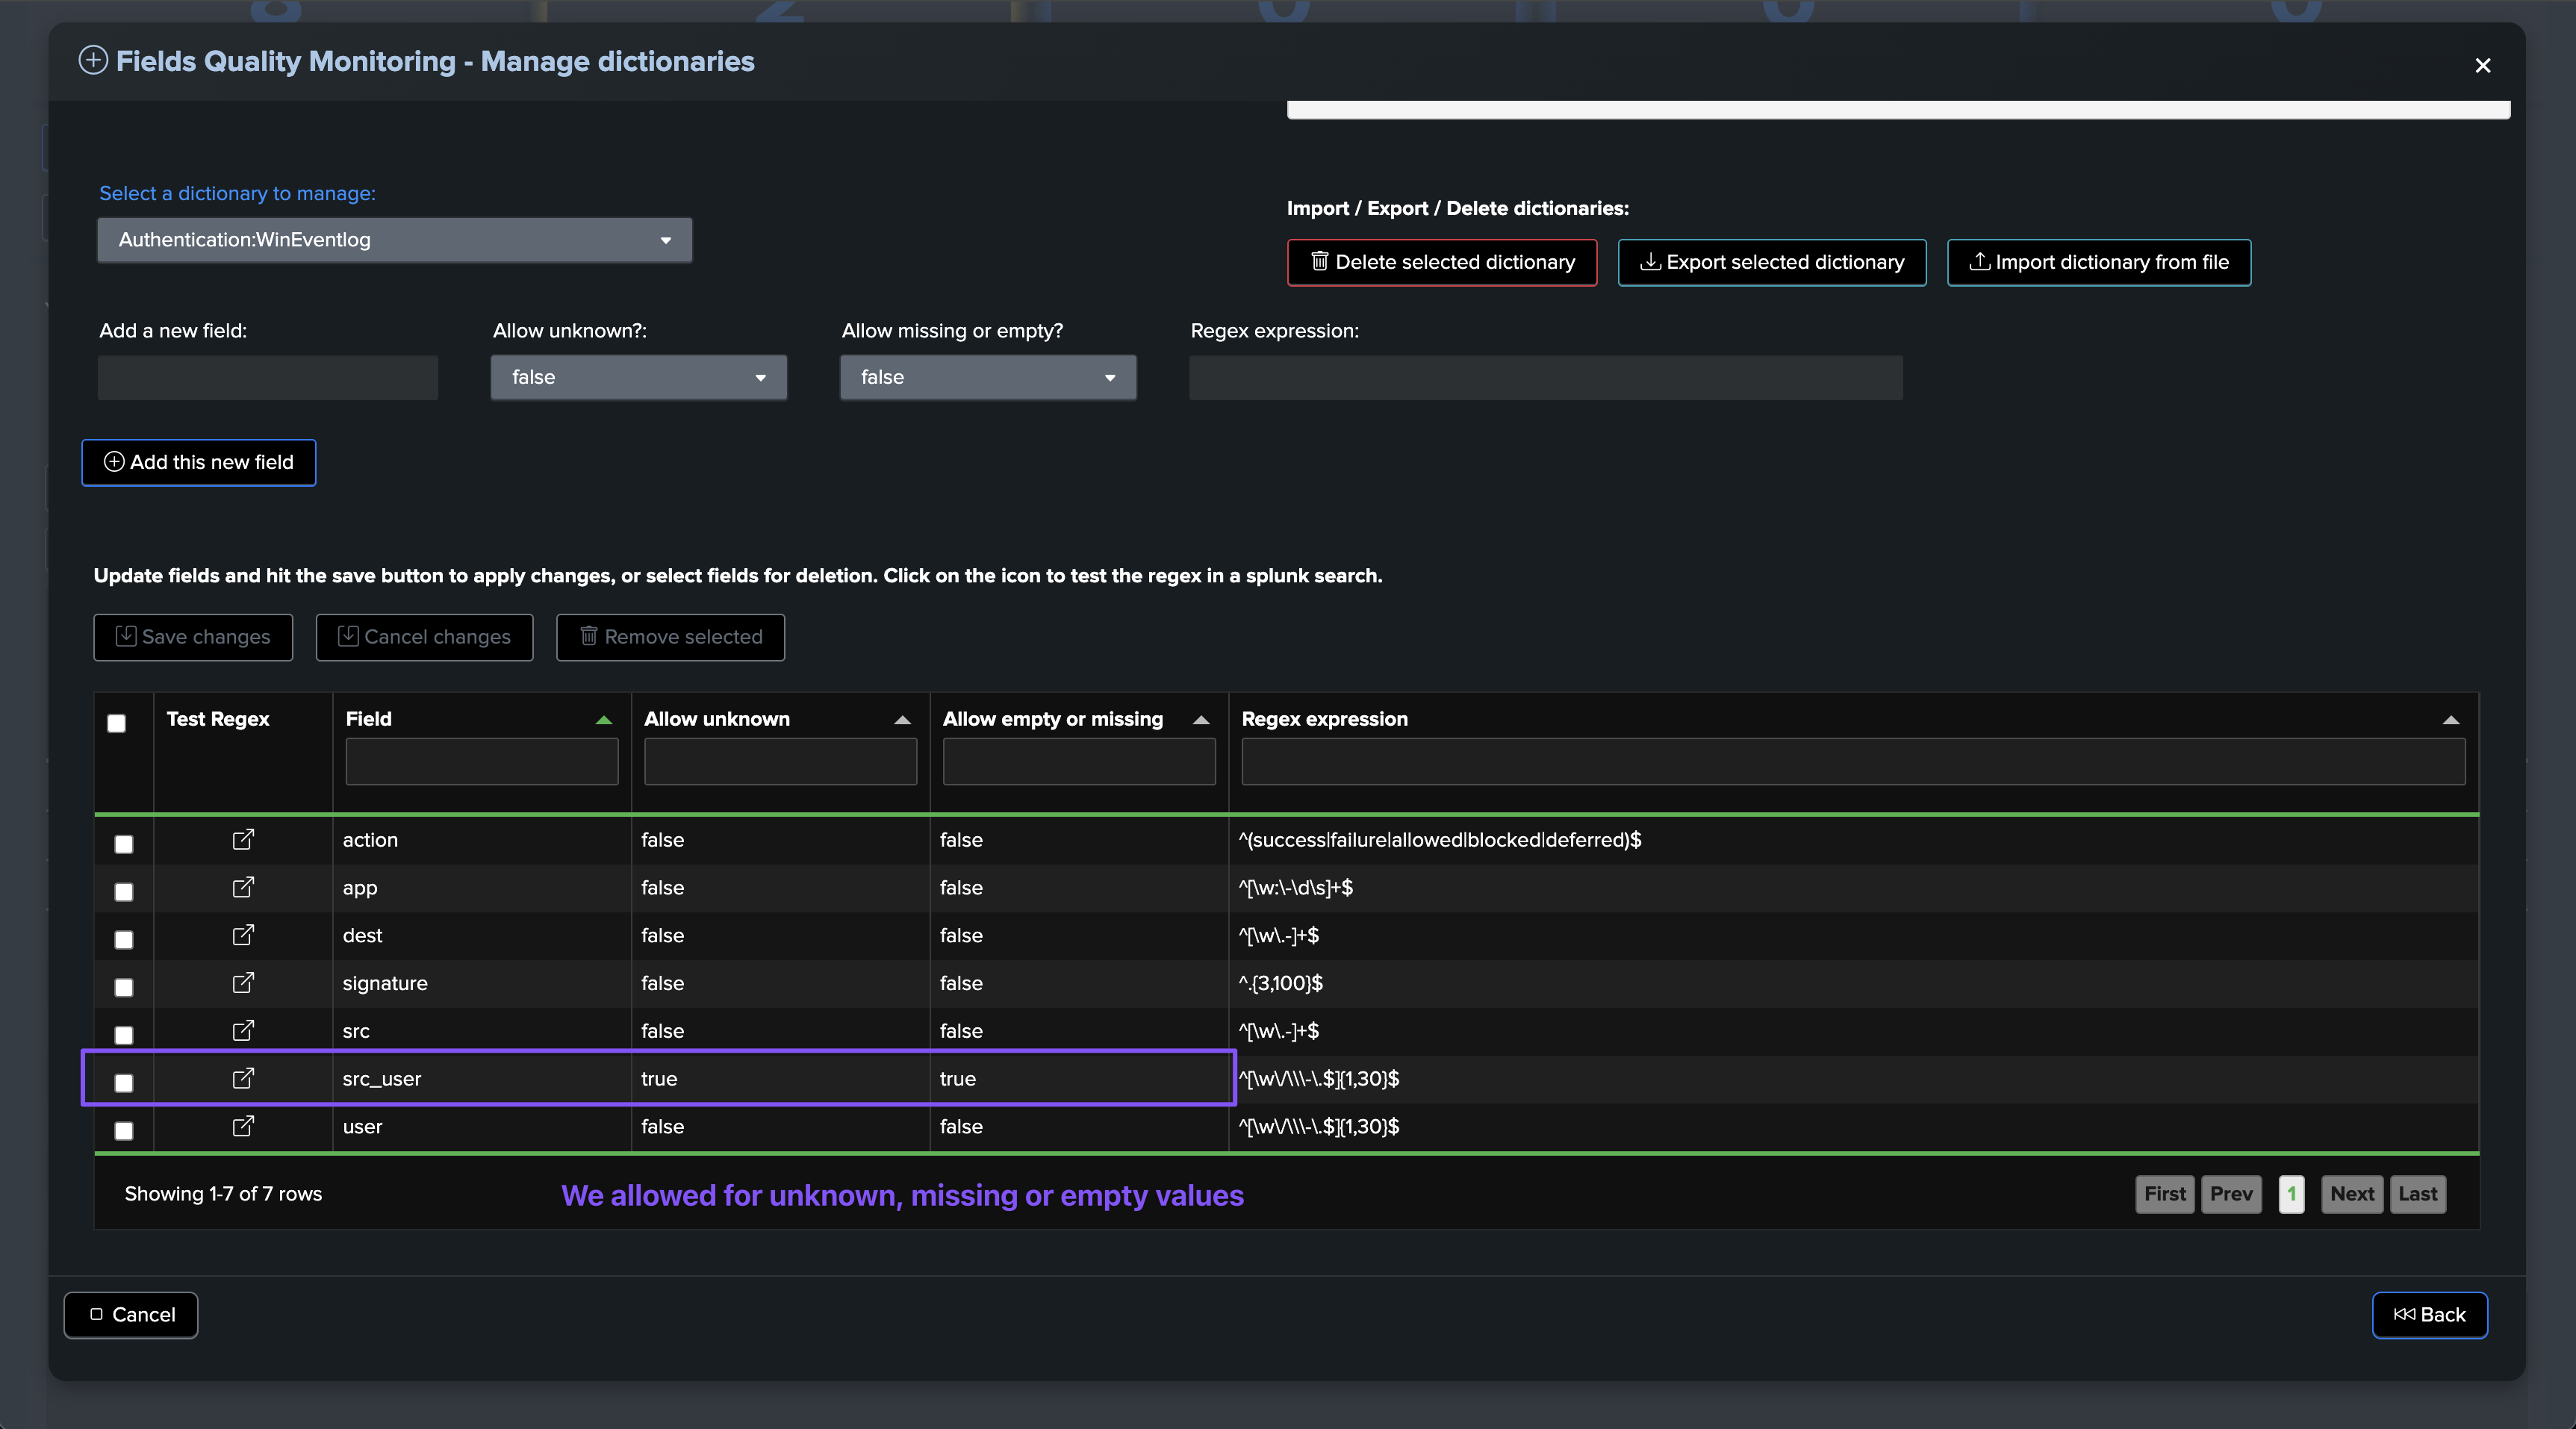
Modifying fields entities compliance rules in the data dictionary
When modifying rules for compliance in the data dictionary, such as:
Allowing the field to be unknown:
allow_unknown:TrueorFalseAllowing the field to be missing/null:
allow_missing_null:TrueorFalseRegular expression:
regex: a regular expression to validate the field content
You have to keep in mind that the percentage of success will be updated according to the events processed and time. If, for instance, we have a field that is initially failing with a condition due to unknown values, and we just modified the data dictionary to allow unknown values:
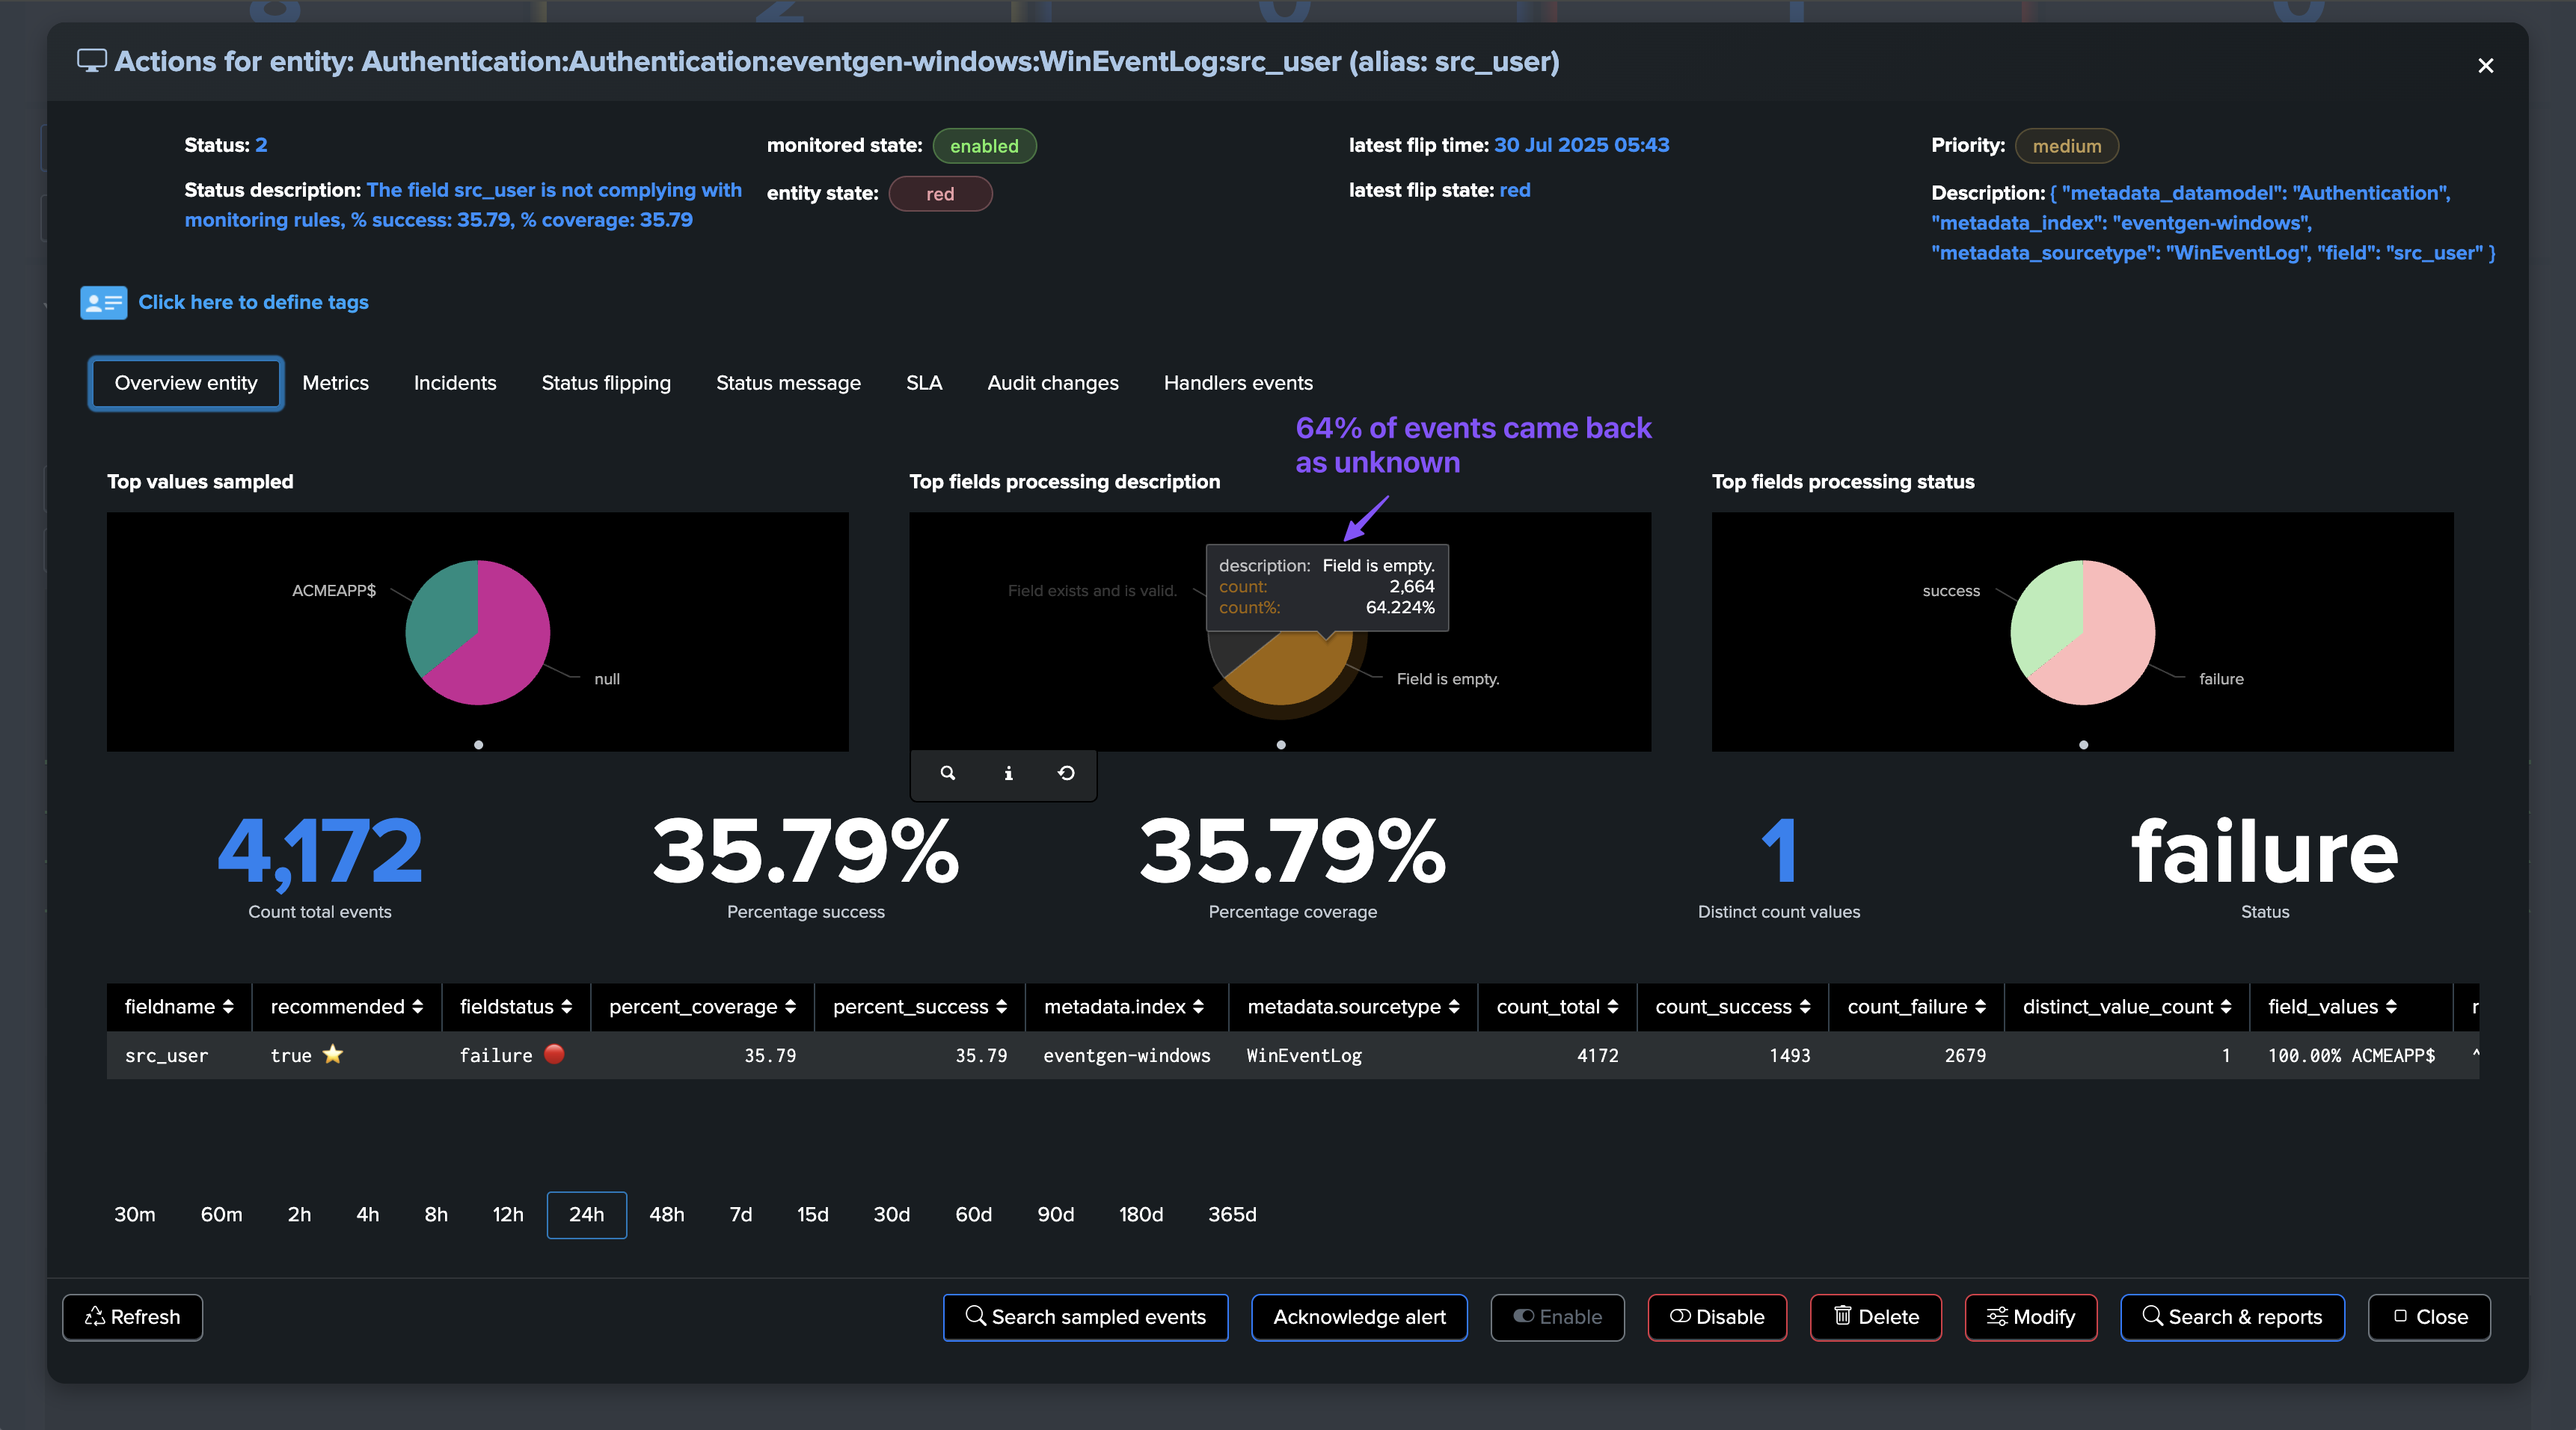
The percentage of success will not grow until we have a new execution of the collect and monitor phases of the collect job.
Therefore, depending on the initial percentage of failures and conditions, it may take several iterations before we reach a stable percentage of success and the field is considered as passing the compliance checks:
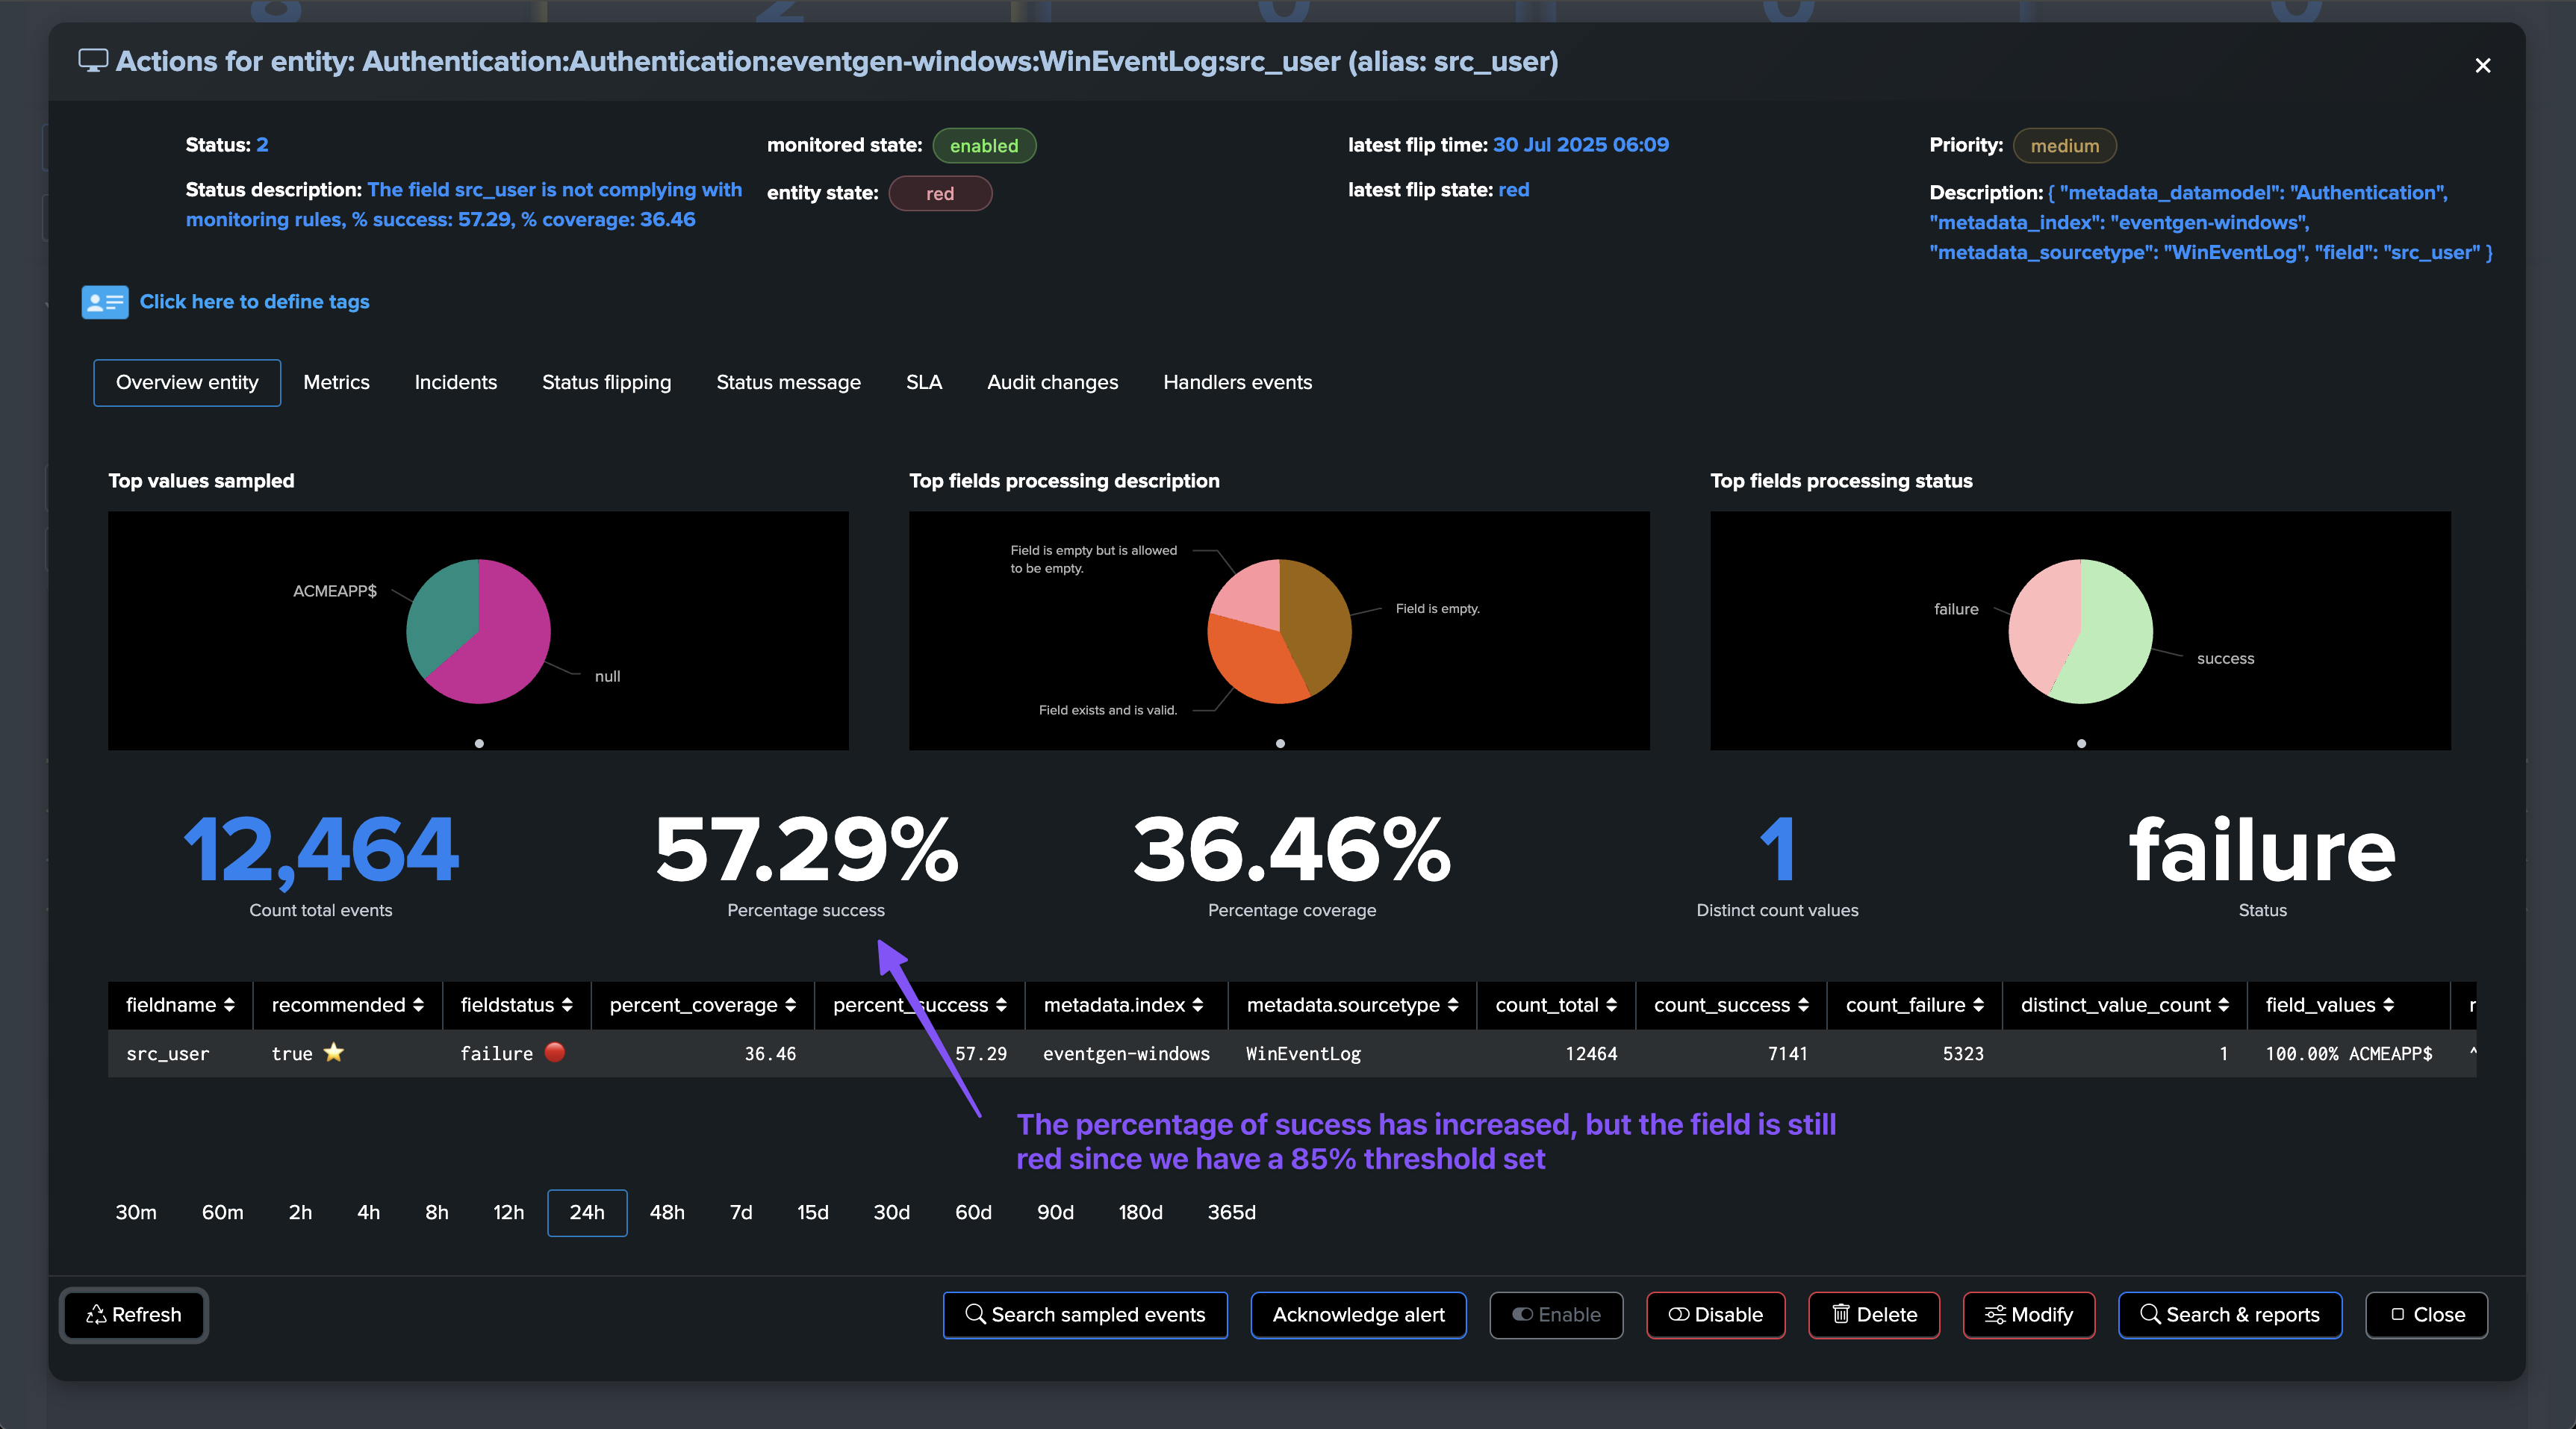
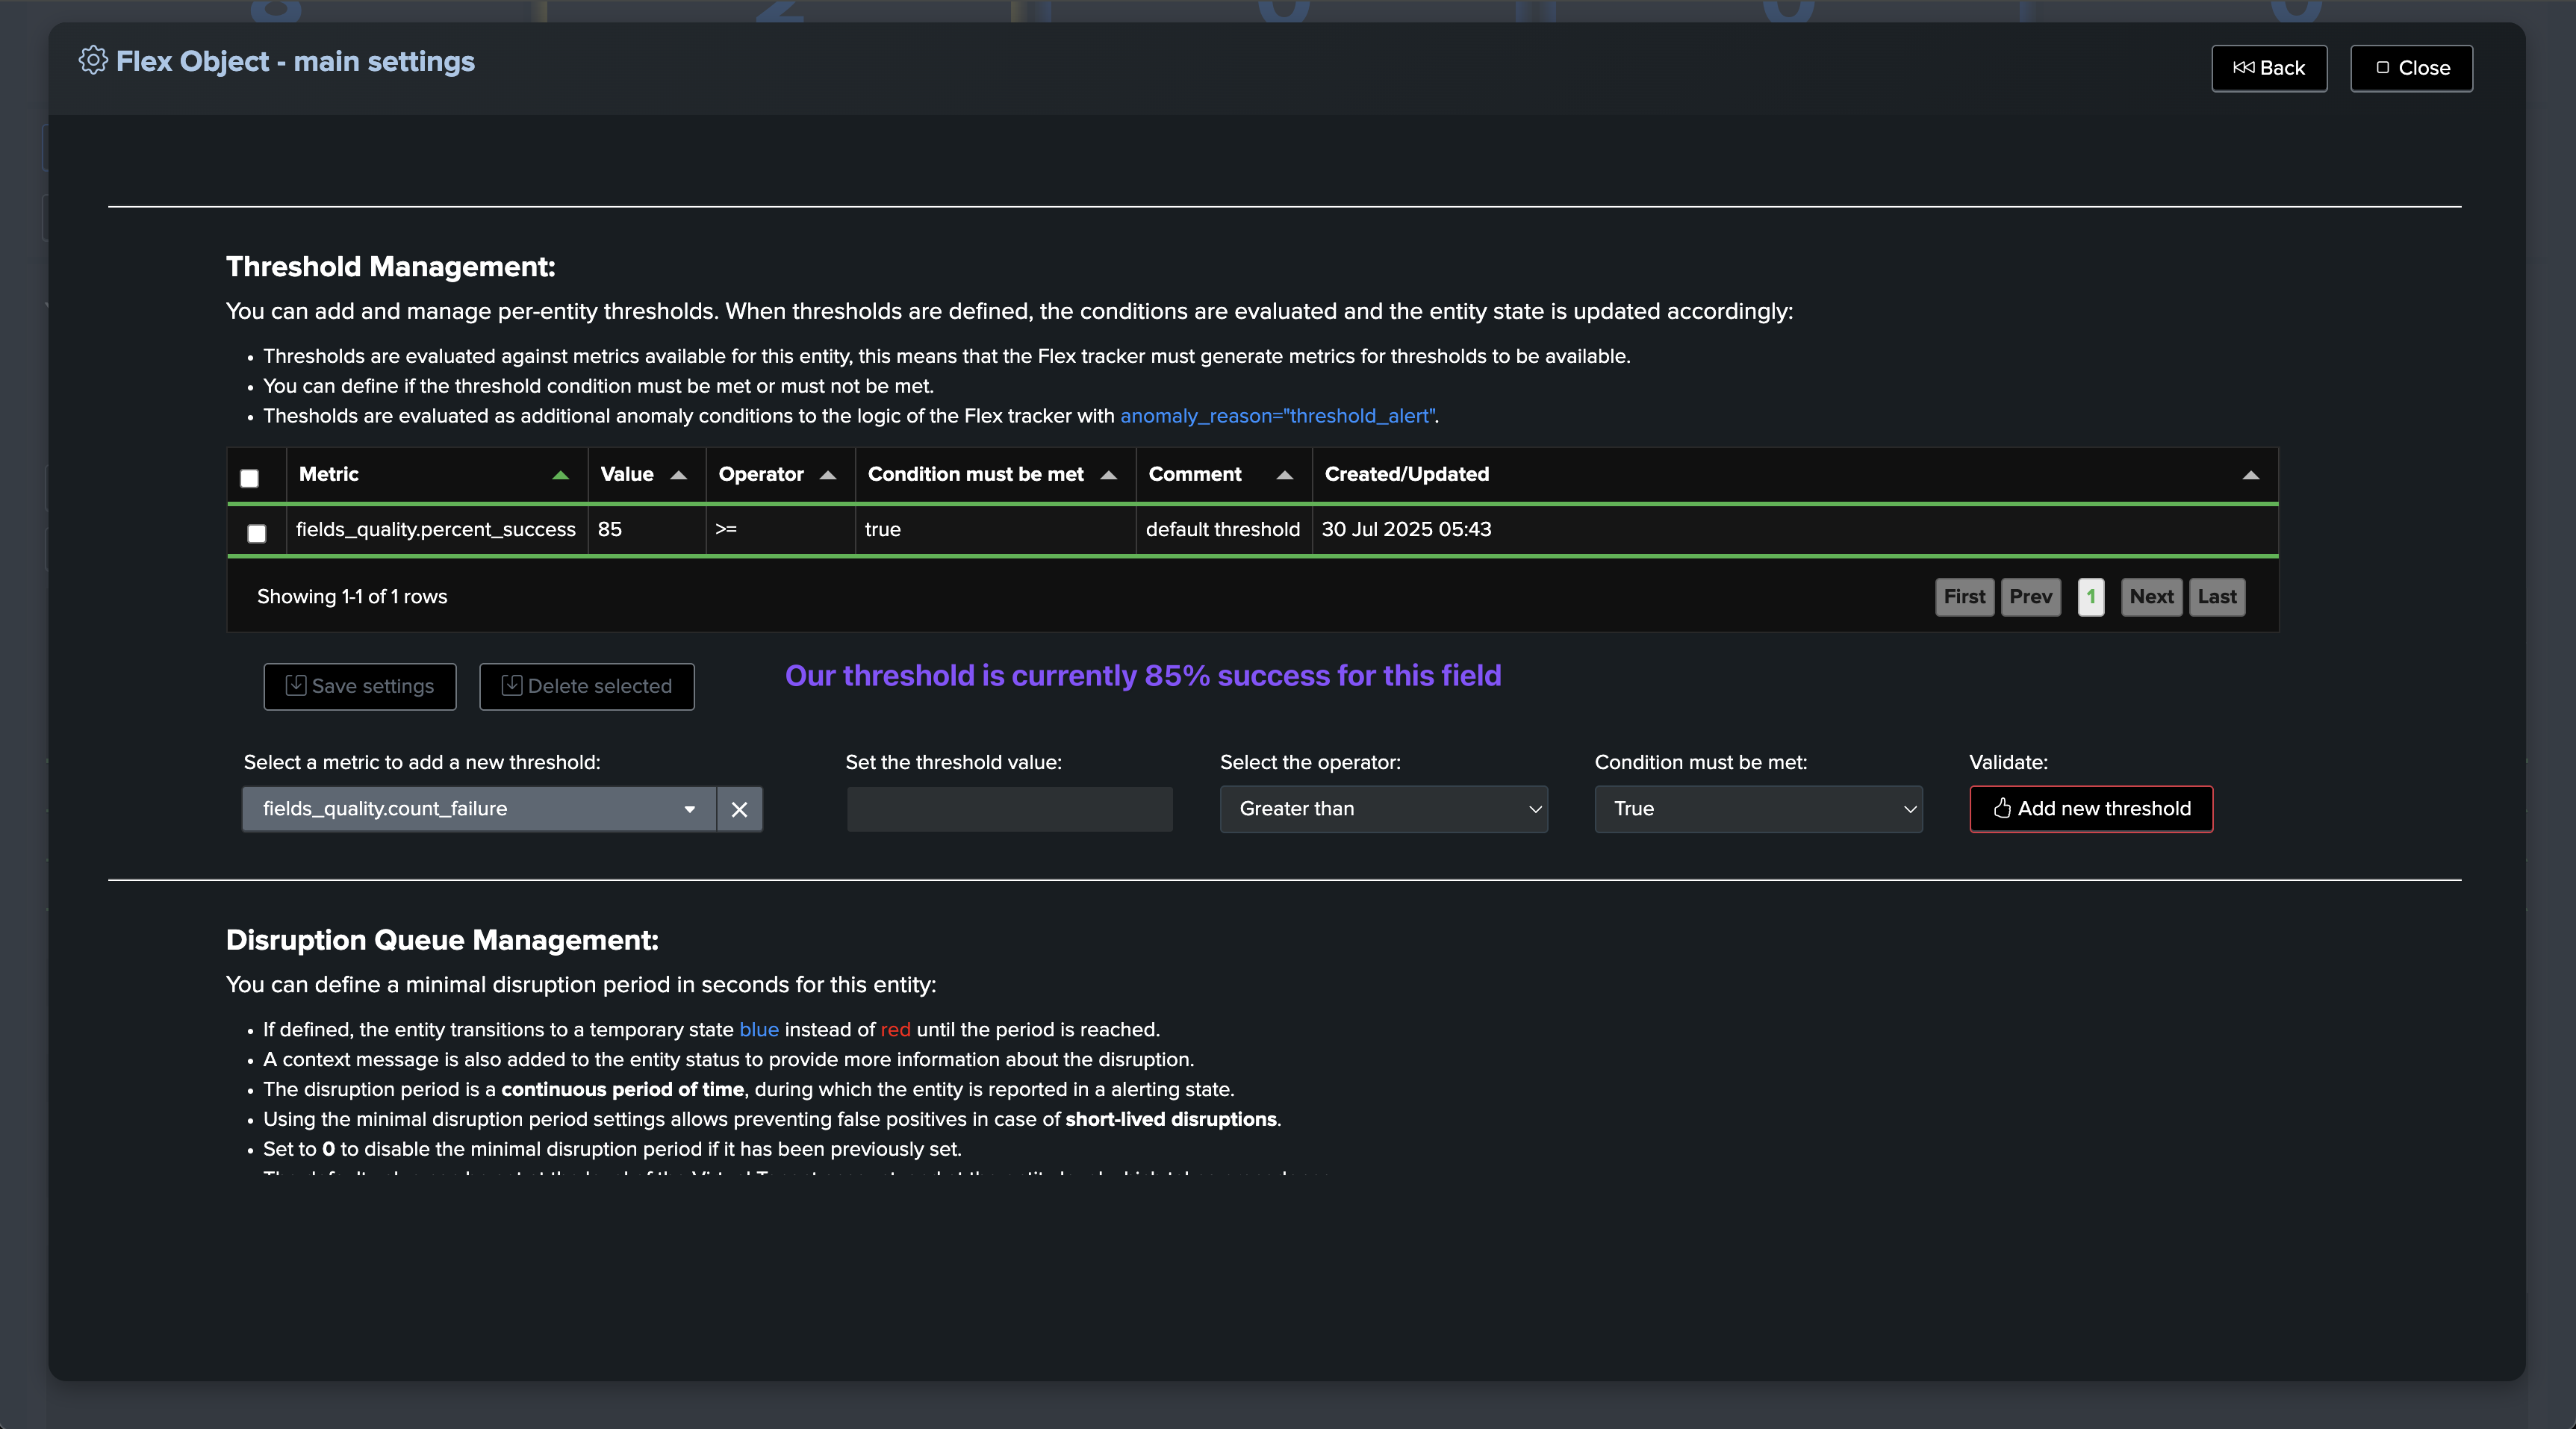
Once conditions are met, or if we lower the requested percentage of success for that field, the field will transition to green and is now compliant according to our requirements:
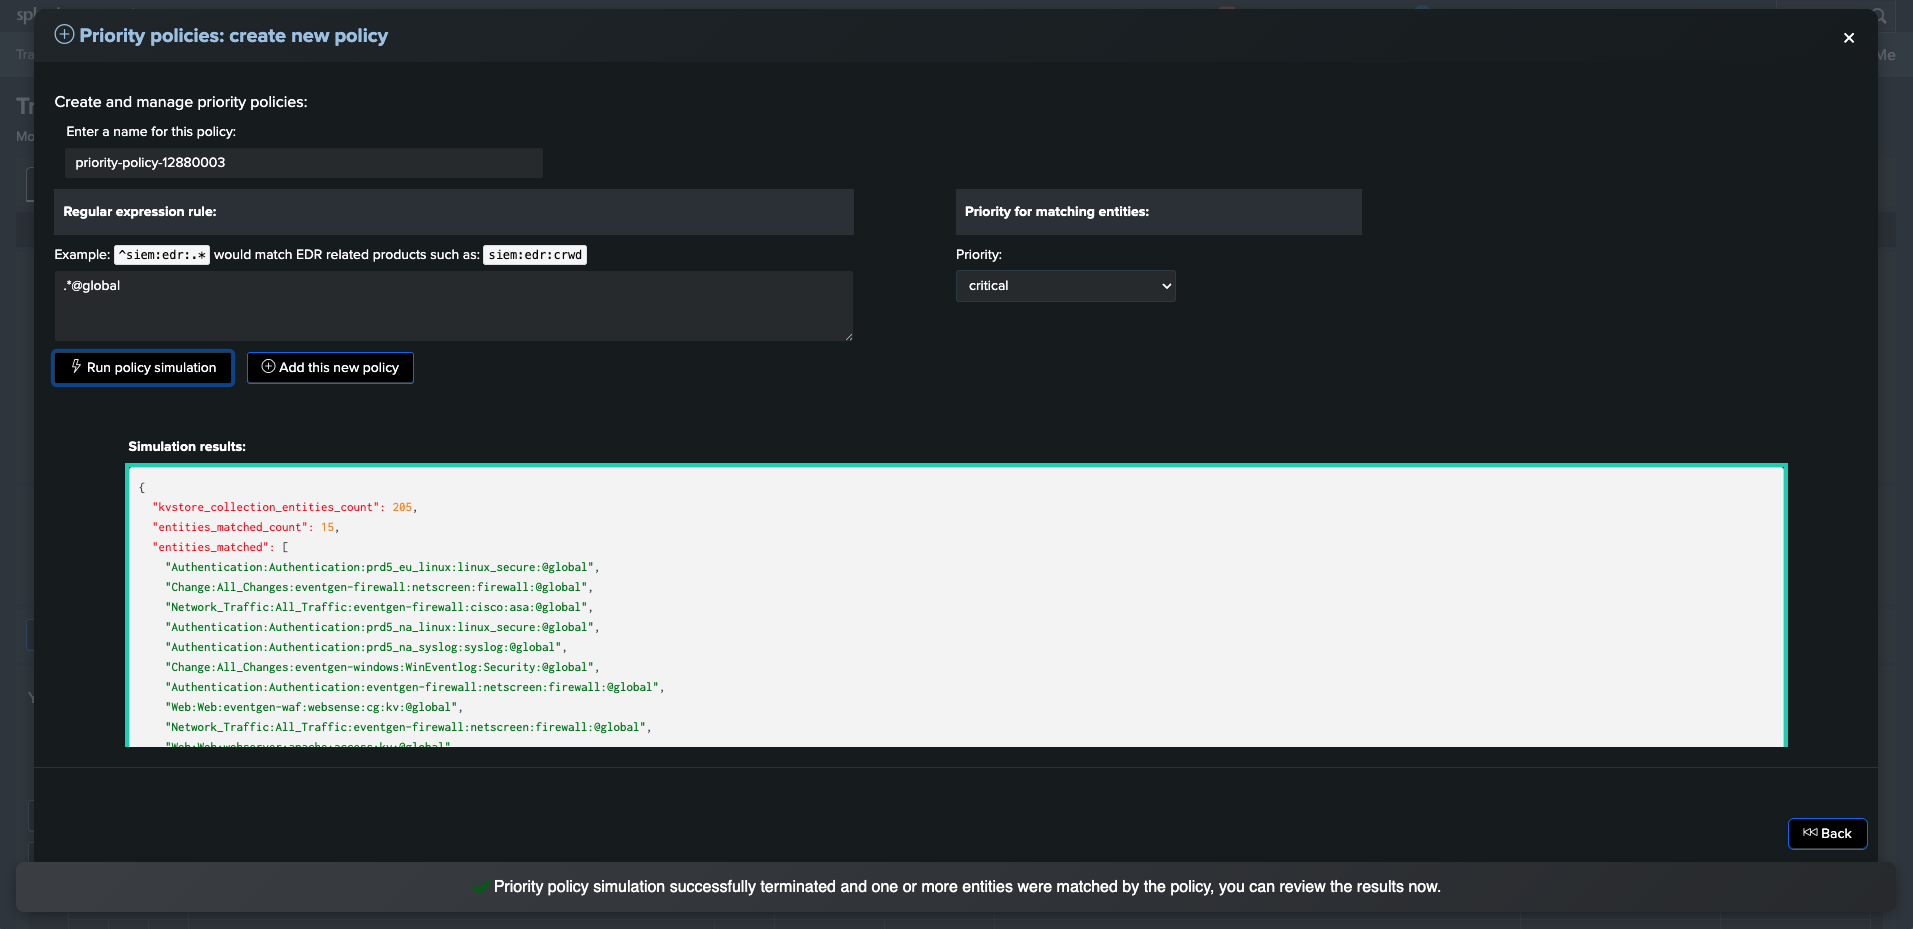
Creating a priority policy for global entities
TrackMe provides a feature called priority policies, which allows to automatically handle the priority level for entities matching a regular expression.
We can easily leverage this feature to automatically set the priority for our @global entity, so that if wanted, we can enable email notifications for all global entities only:
Expression used in the following example:
.*@global

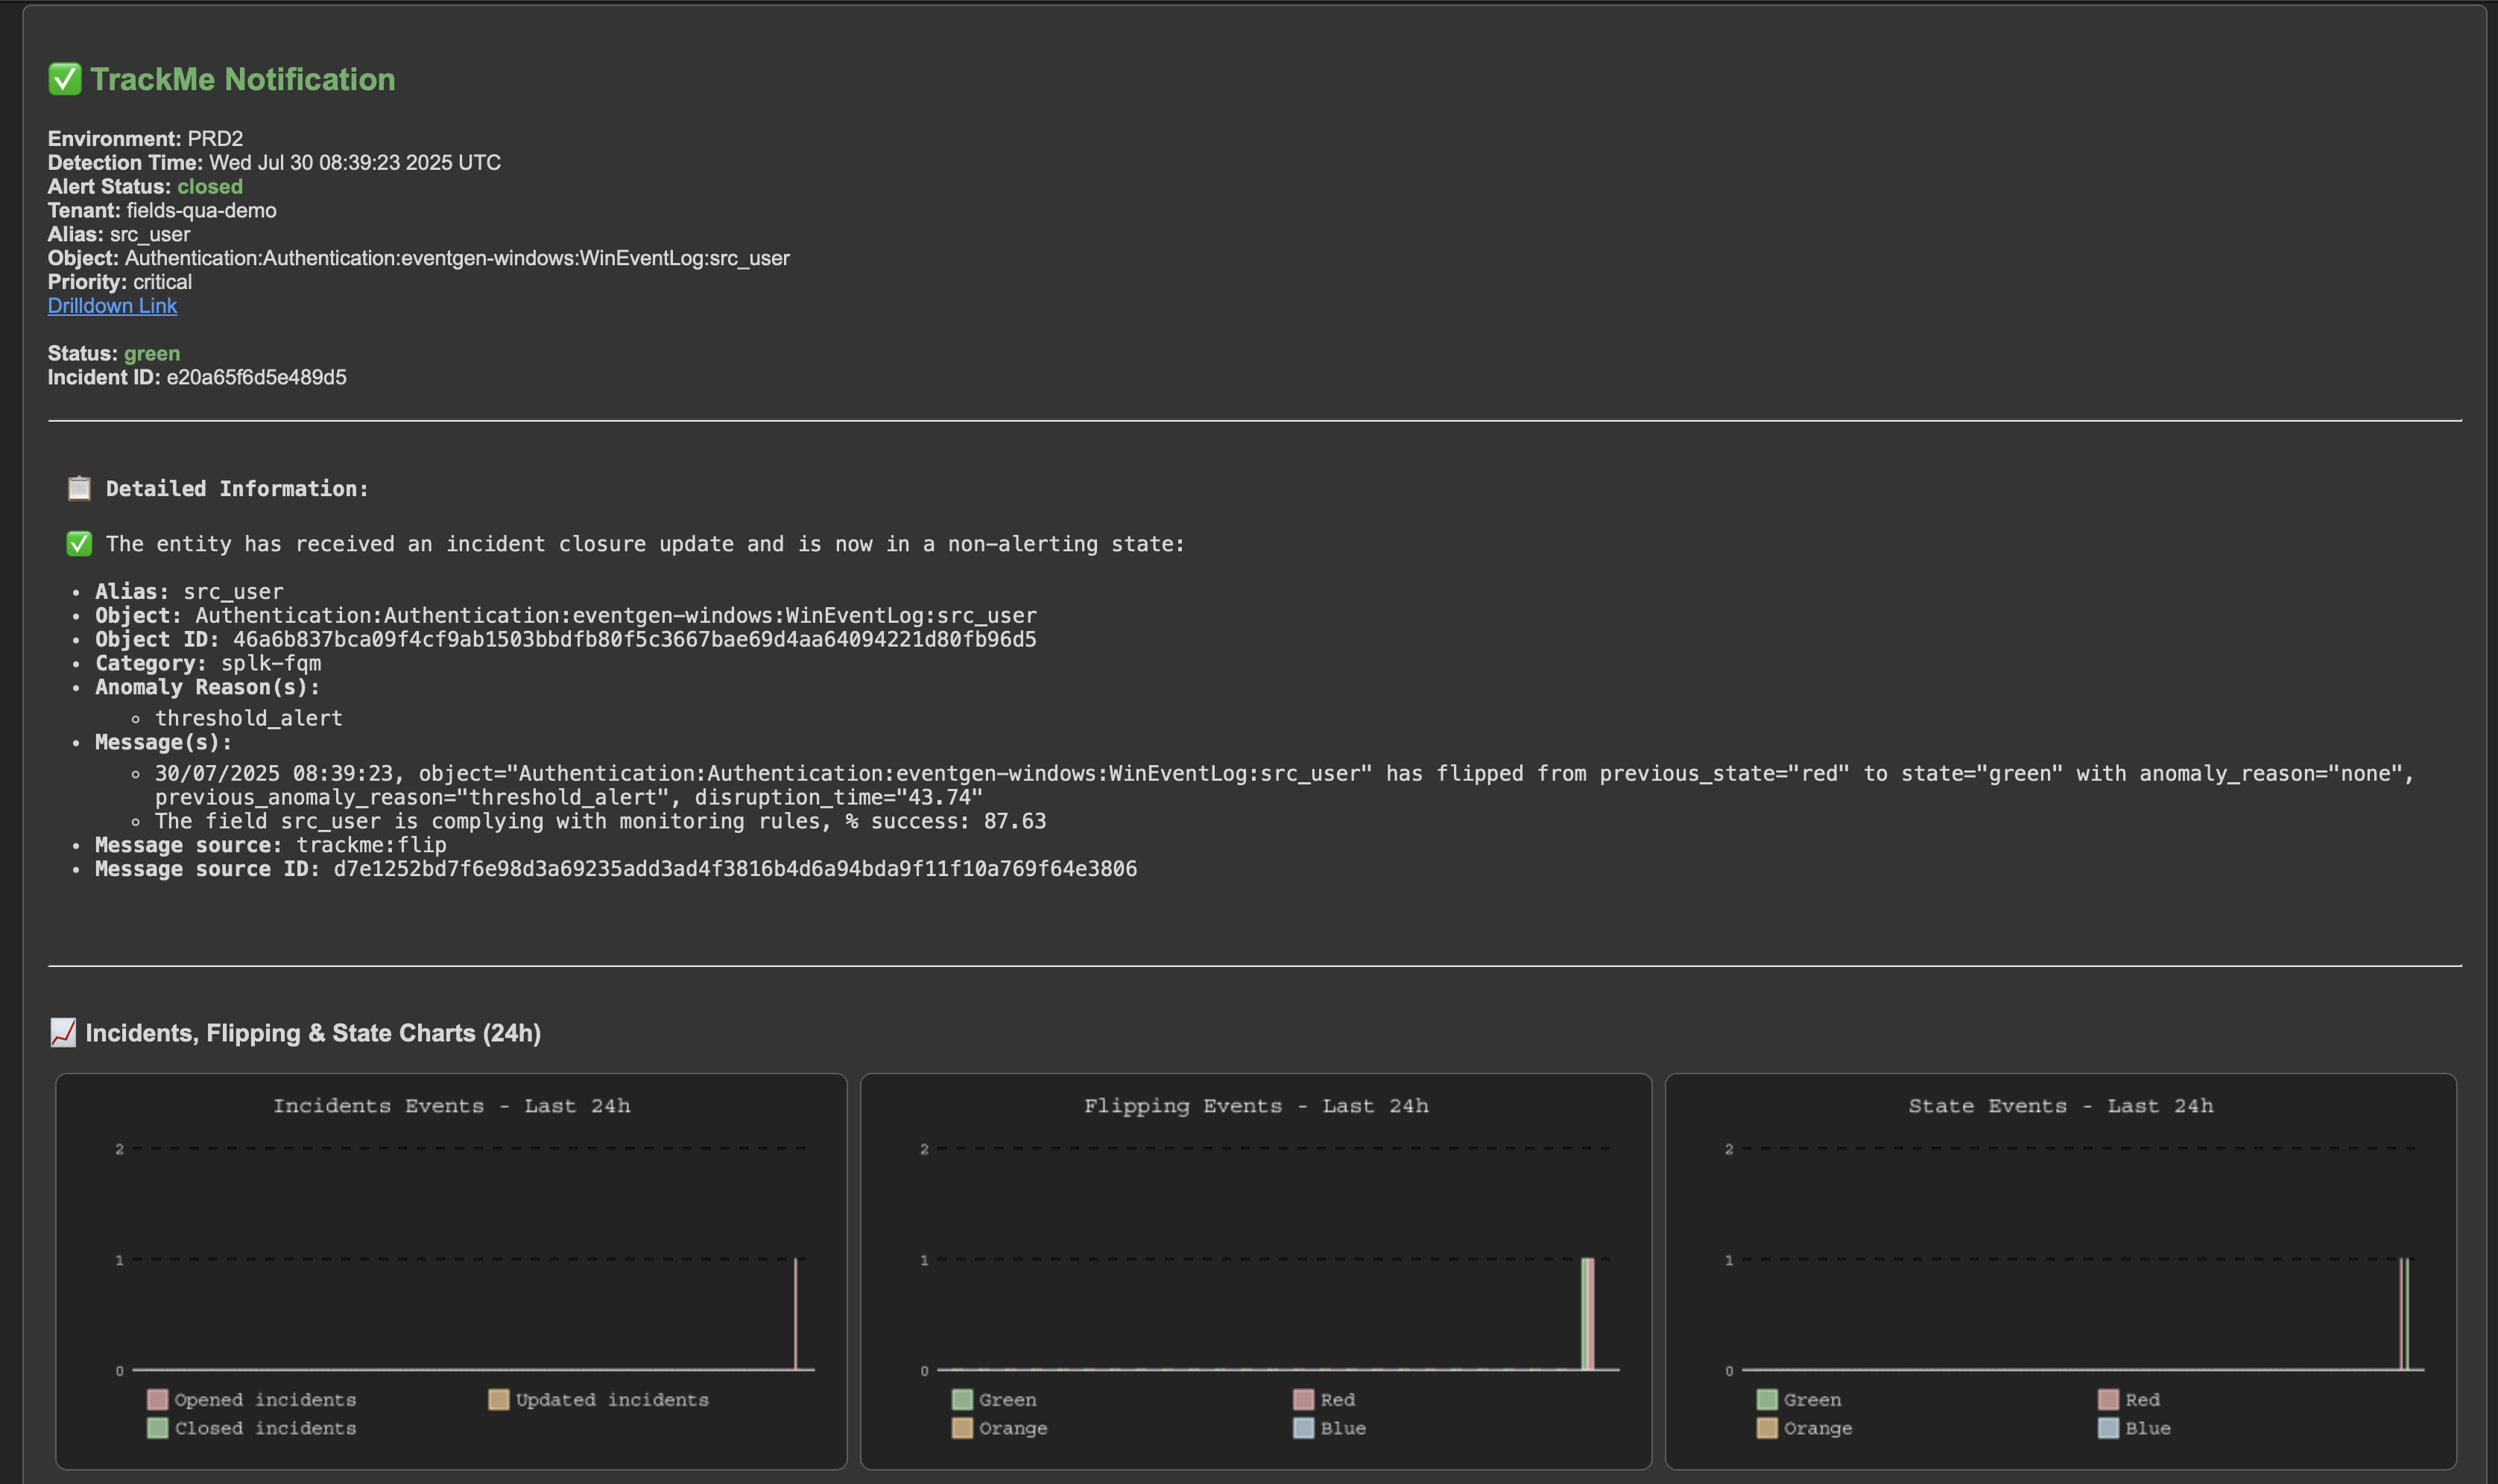
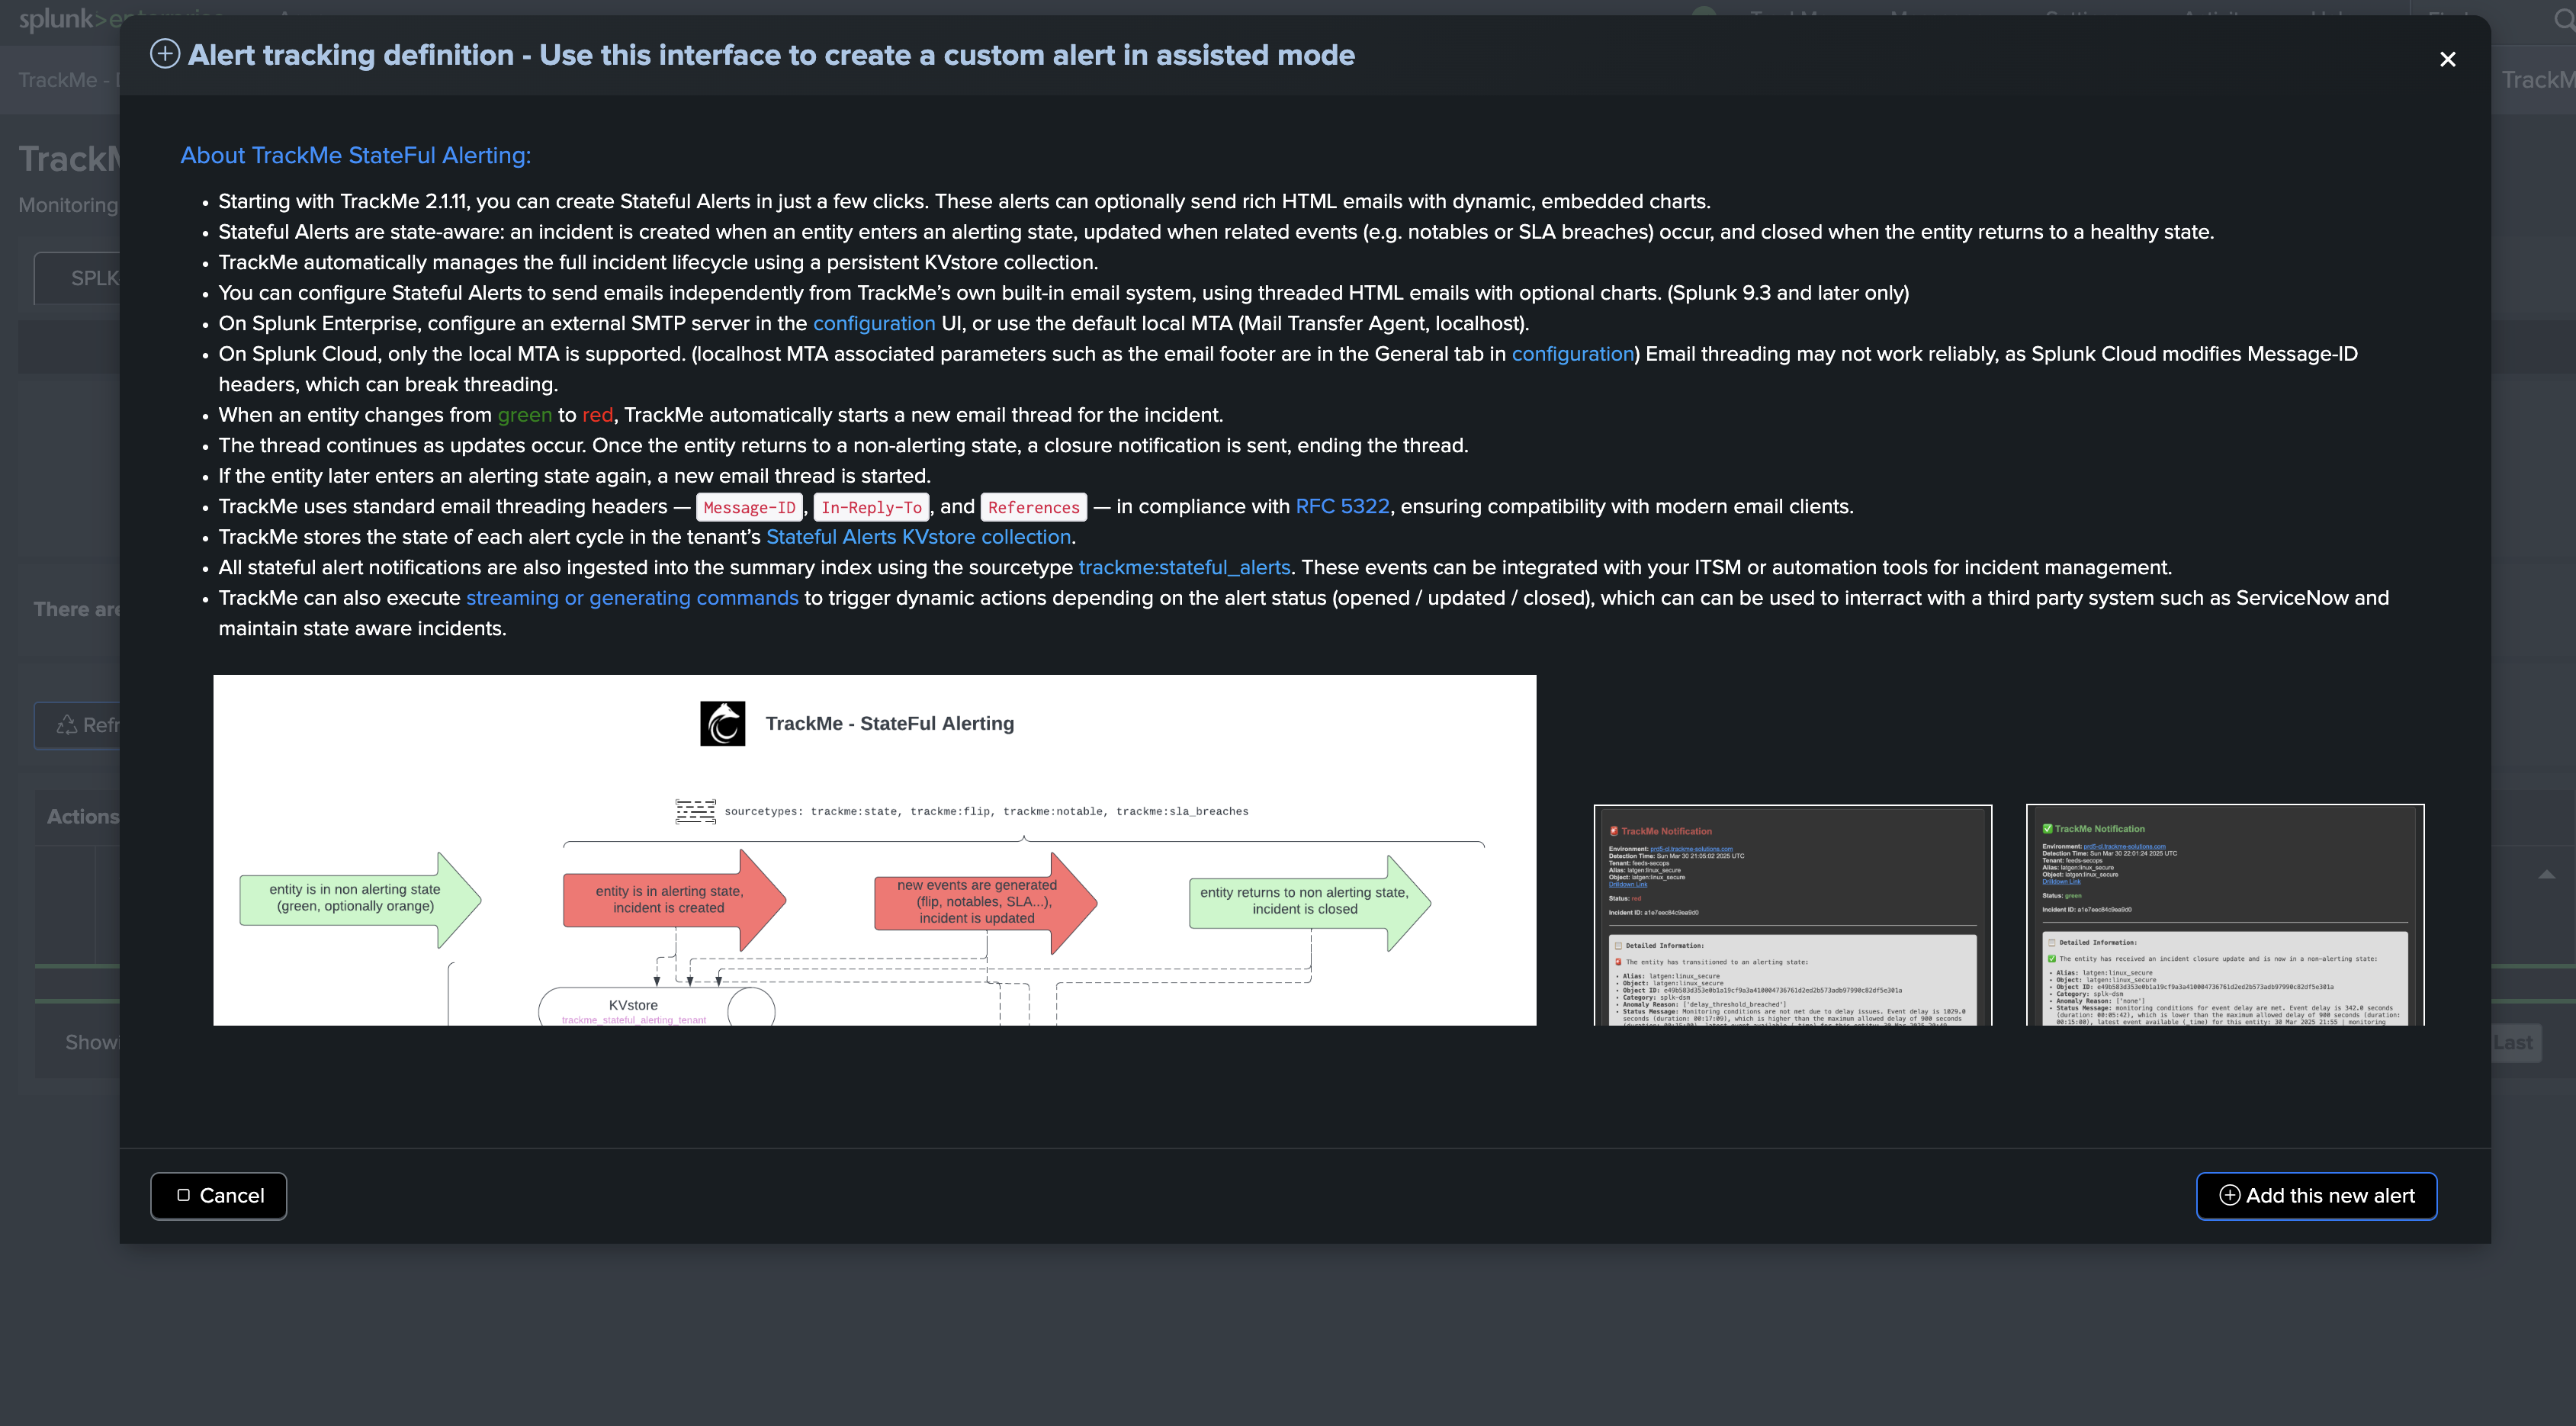
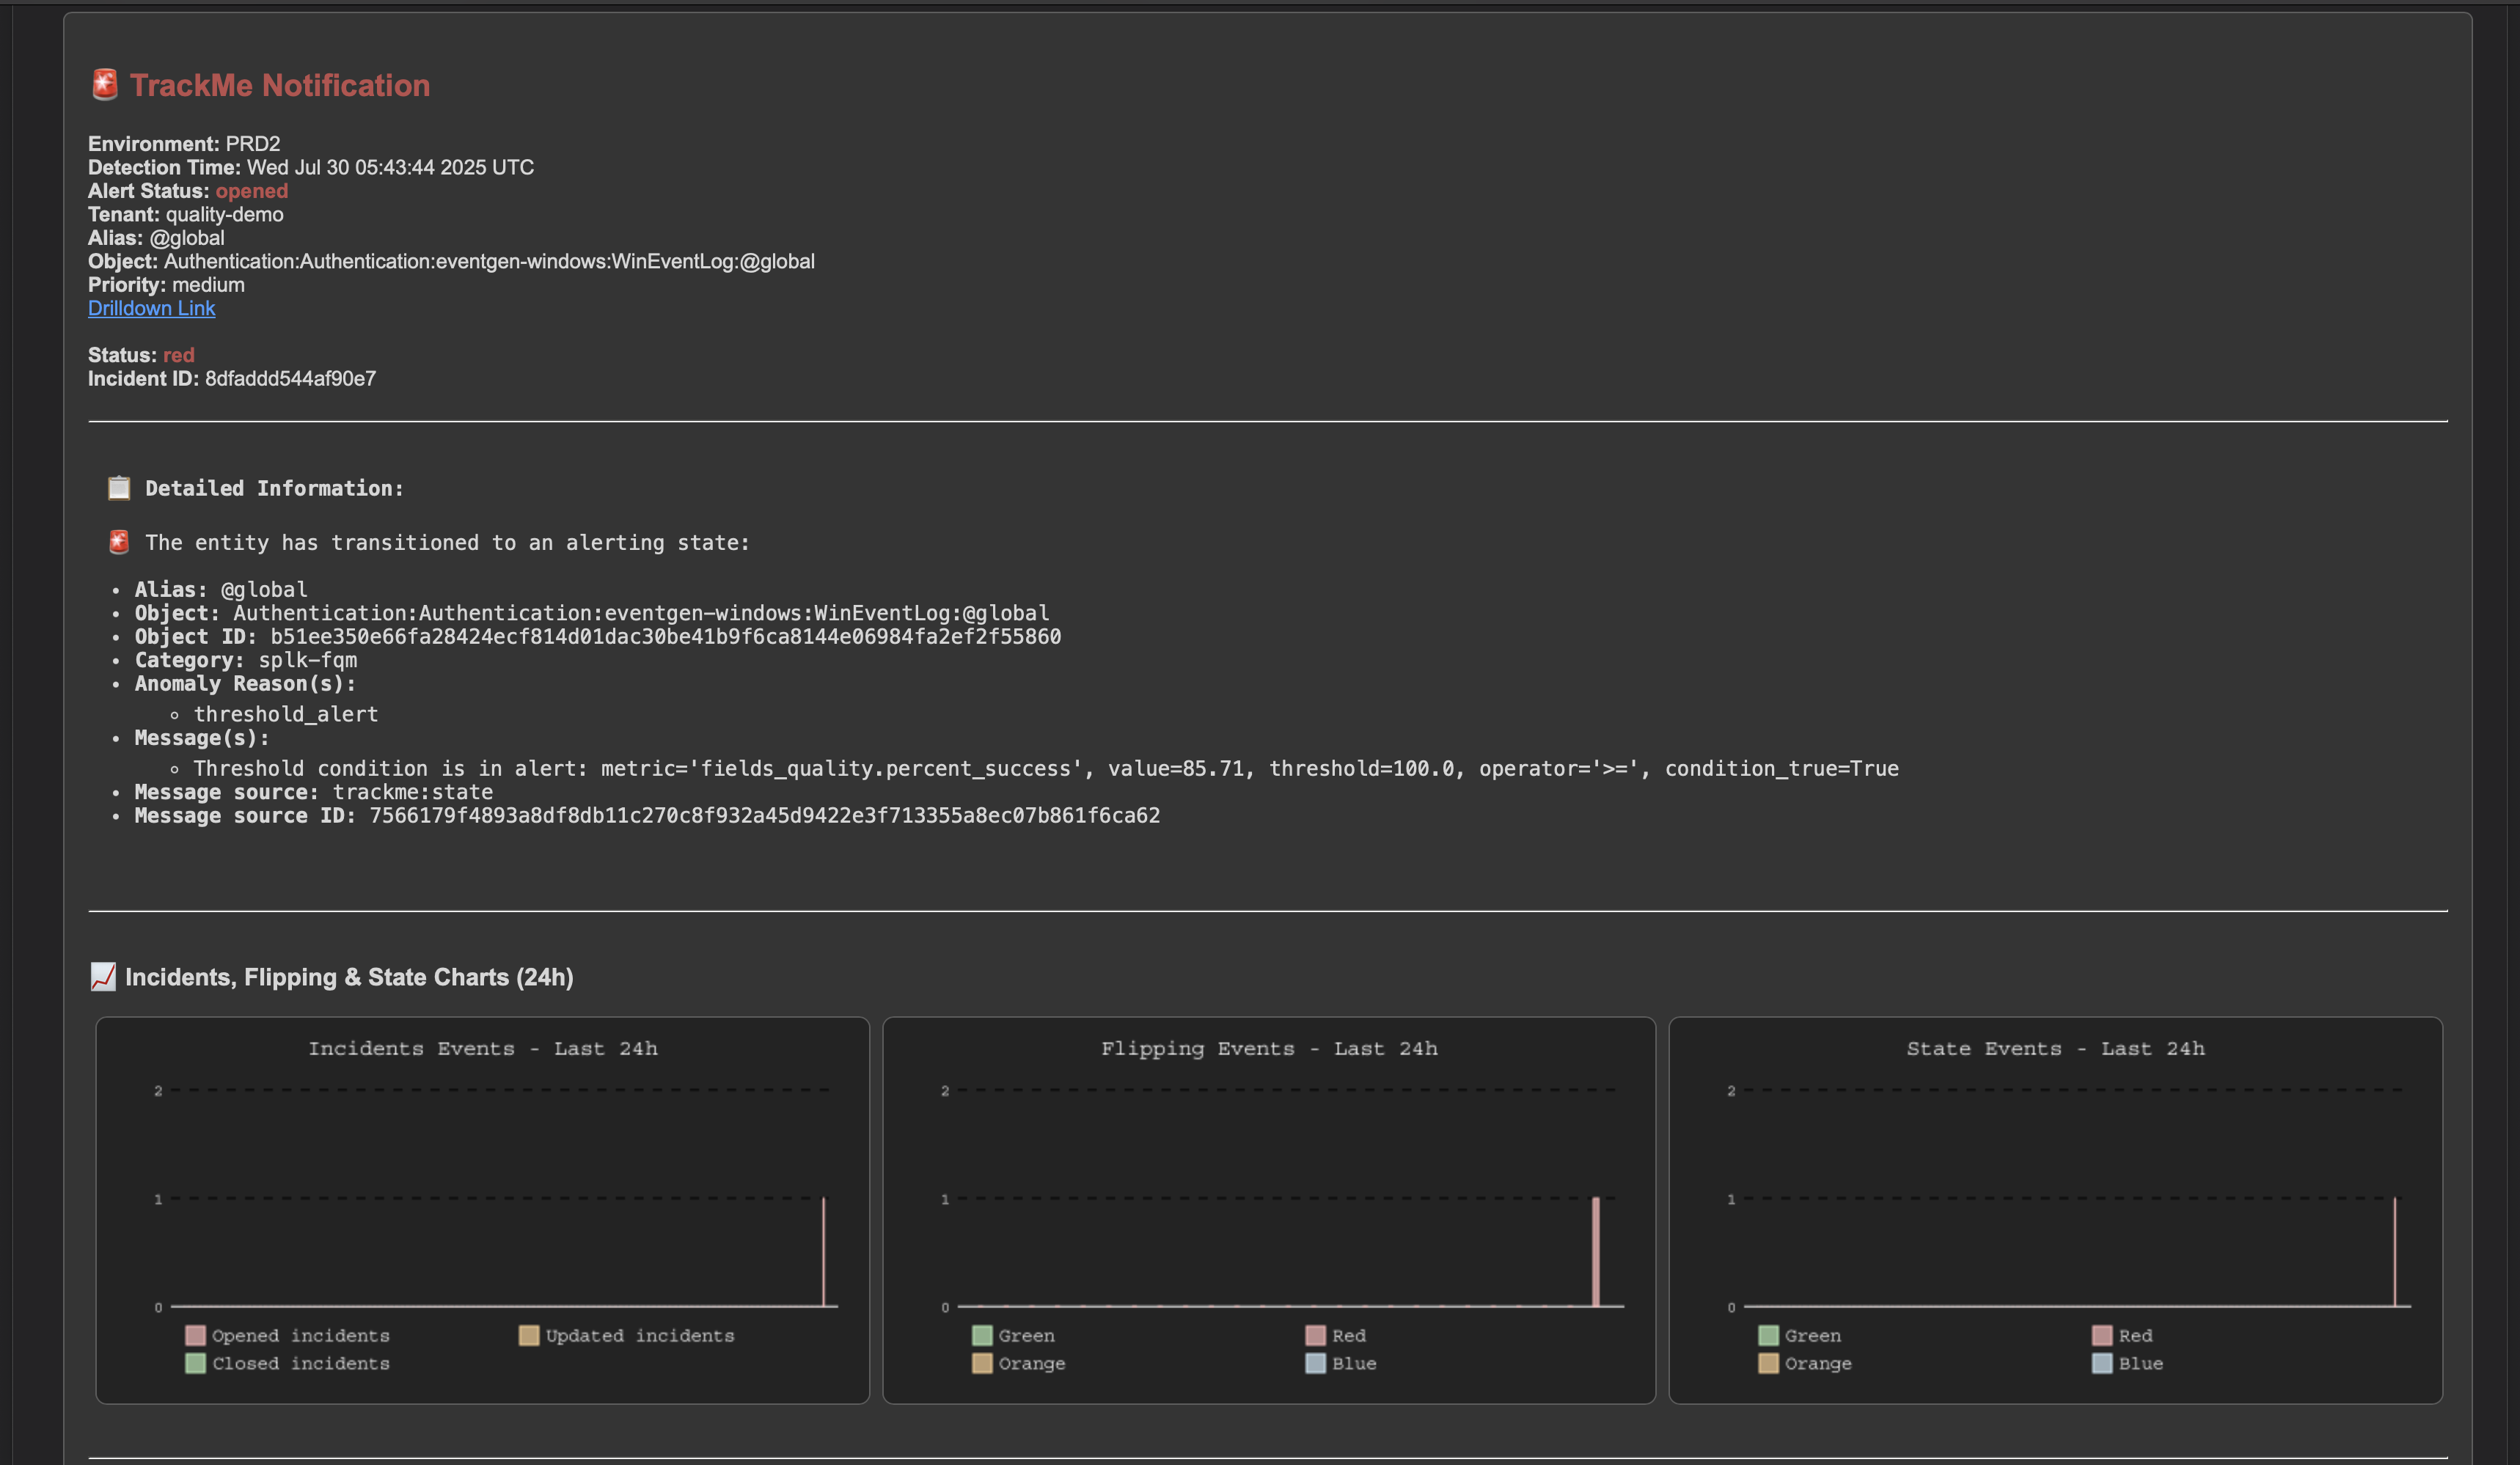
Alerting on fields quality issues, and generating emails or other types of notifications
Alerting on fields quality issues works exactly in TrackMe as for any other component, using our extensive and flexible alerting concepts, such as the Stateful alerts in TrackMe.
Hint
About alerting only against the @global entity, and/or fields entities:
This choice is entirely up to you. You can choose to do both, any kind of combination is possible.
A recommended approach would be to rely on the priority level. You could simply set the @global entity priority to
highorcriticaland set up your alert to trigger on these levels.If you need at some point to alert on certain fields, simply increase the priority level of the field entities you want to alert on.
Annex: usage and options for the command trackmefieldsquality
The command trackmefieldsquality is used in the collect phase to parse and validate the fields compliancy, this is a powerful and flexible Python backend that provides various options.
The command accepts the following parameters:
argument |
description |
default |
example or valid values |
|---|---|---|---|
|
The list of fields to verify, provided as a comma-separated list |
None |
“action,app,bytes,url” |
|
Name of the field containing the list of fields to check (comma-separated) |
None |
“fields_list” |
|
JSON string containing a dictionary of fields to check with optional regex patterns |
None |
‘{“field1”: {“name”: “field1”, “regex”: “^[A-Z]+$”}, “field2”: {“name”: “field2”}}’ |
|
Path to a JSON file containing a dictionary of fields to check with optional regex patterns |
None |
“/opt/splunk/etc/apps/myapp/mydir/web_datamodel.json” |
|
Name of the field containing a JSON string with a dictionary of fields to check |
None |
fields_dict |
|
The search command to use to generate the dictionary of fields to check |
None |
“| trackmefieldsqualitygendict datamodel=Web show_only_recommended_fields=True” |
|
Boolean option to include field values in the JSON summary |
False |
True/False |
|
Boolean option to pretty print the JSON summary |
True |
True/False |
|
The mode to output the results (json or raw) |
json |
json |
|
CSV list of metadata fields to include in the metadata section of the JSON |
index,sourcetype,host,source |
“datamodel” |
|
Defines the name of the summary field |
summary |
“summary” |
|
Defines the name of the metadata field added to the summary JSON |
metadata |
“metadata” |
The first 6 options are mutually exclusive, only one of these options can be used at a time:
fields_to_check_listfields_to_check_fieldnamefields_to_check_dictfields_to_check_dict_pathfields_to_check_dict_fieldnamefields_to_check_search_command
These options exist so that we can cover all use cases, this provides all levels of flexibility to use different Splunk techniques such as subsearches or simply storing the list of fields or models, dynamic generation in SPL, etc.
Let’s take an example over each of these options:
Argument: fields_to_check_list
This is the most simple use case:
Provide the list of fields to be checked as a comma-separated list
For each field, we will check the following: - Missing - Empty - Null - Equal to unknown
If the field passes all these checks, it is declared as valid with a status of success, and failure otherwise.
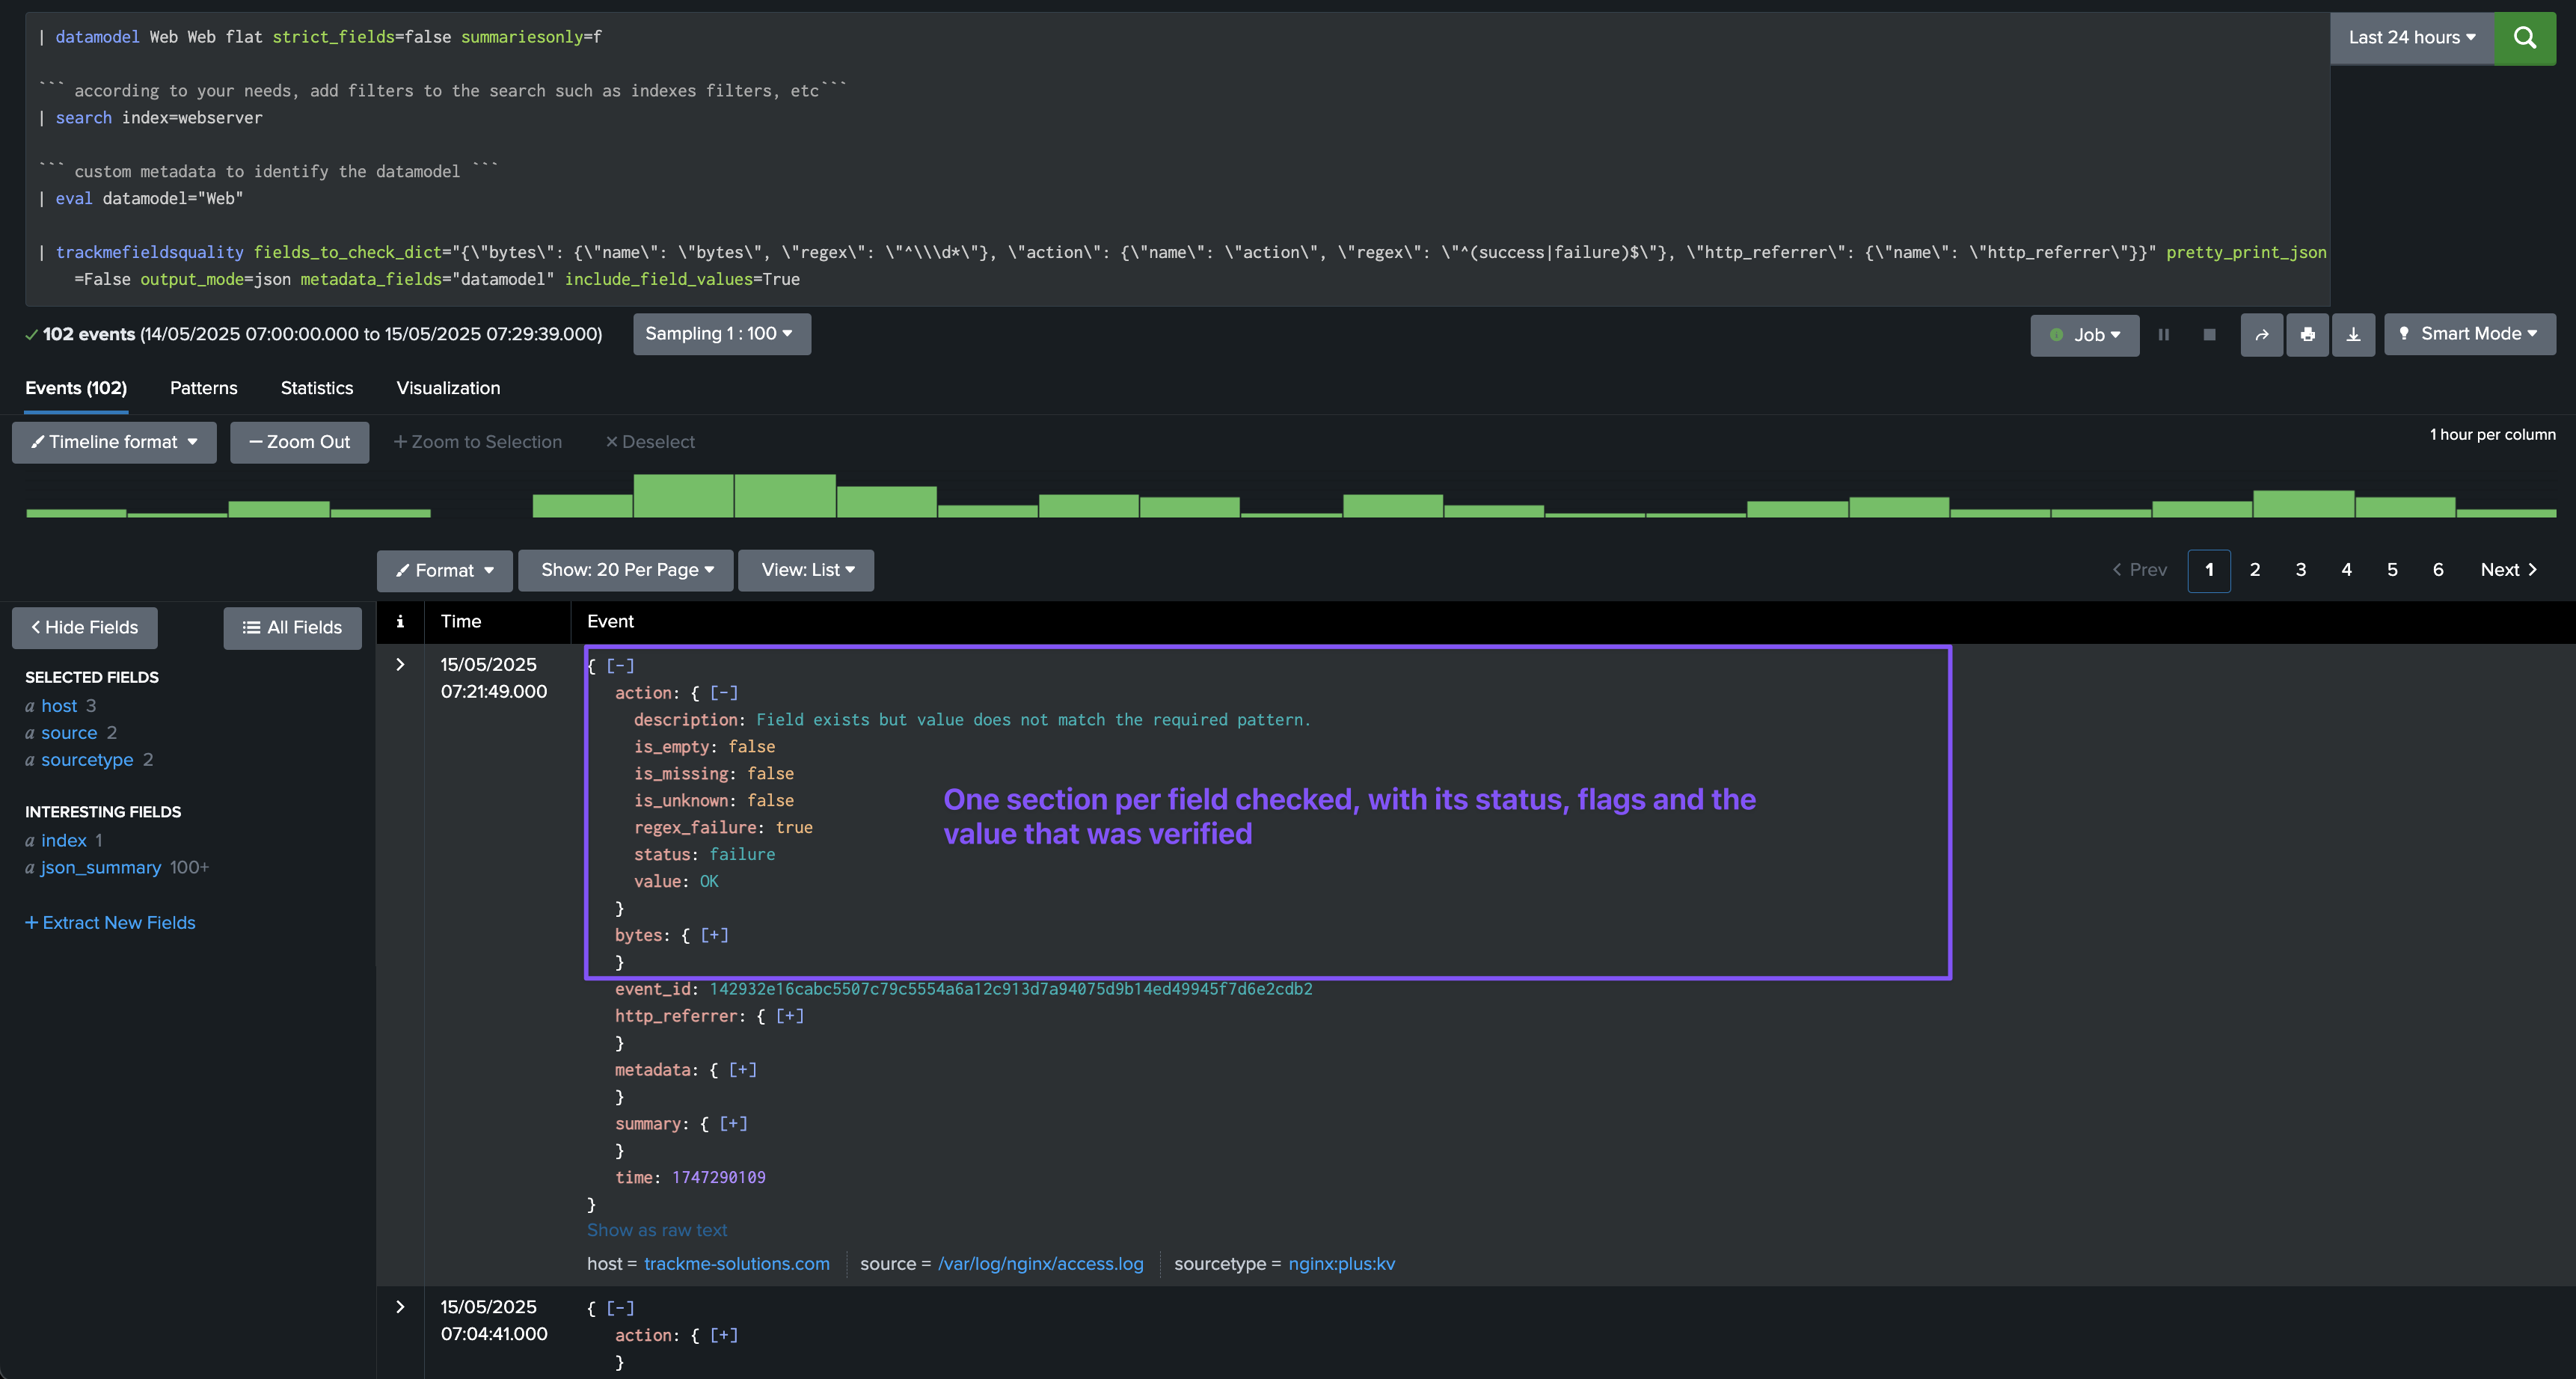
The command will store with the JSON object a section for the field, which includes flags for each check, with a boolean value True or False:
is_missingis_emptyis_unknownregex_failure
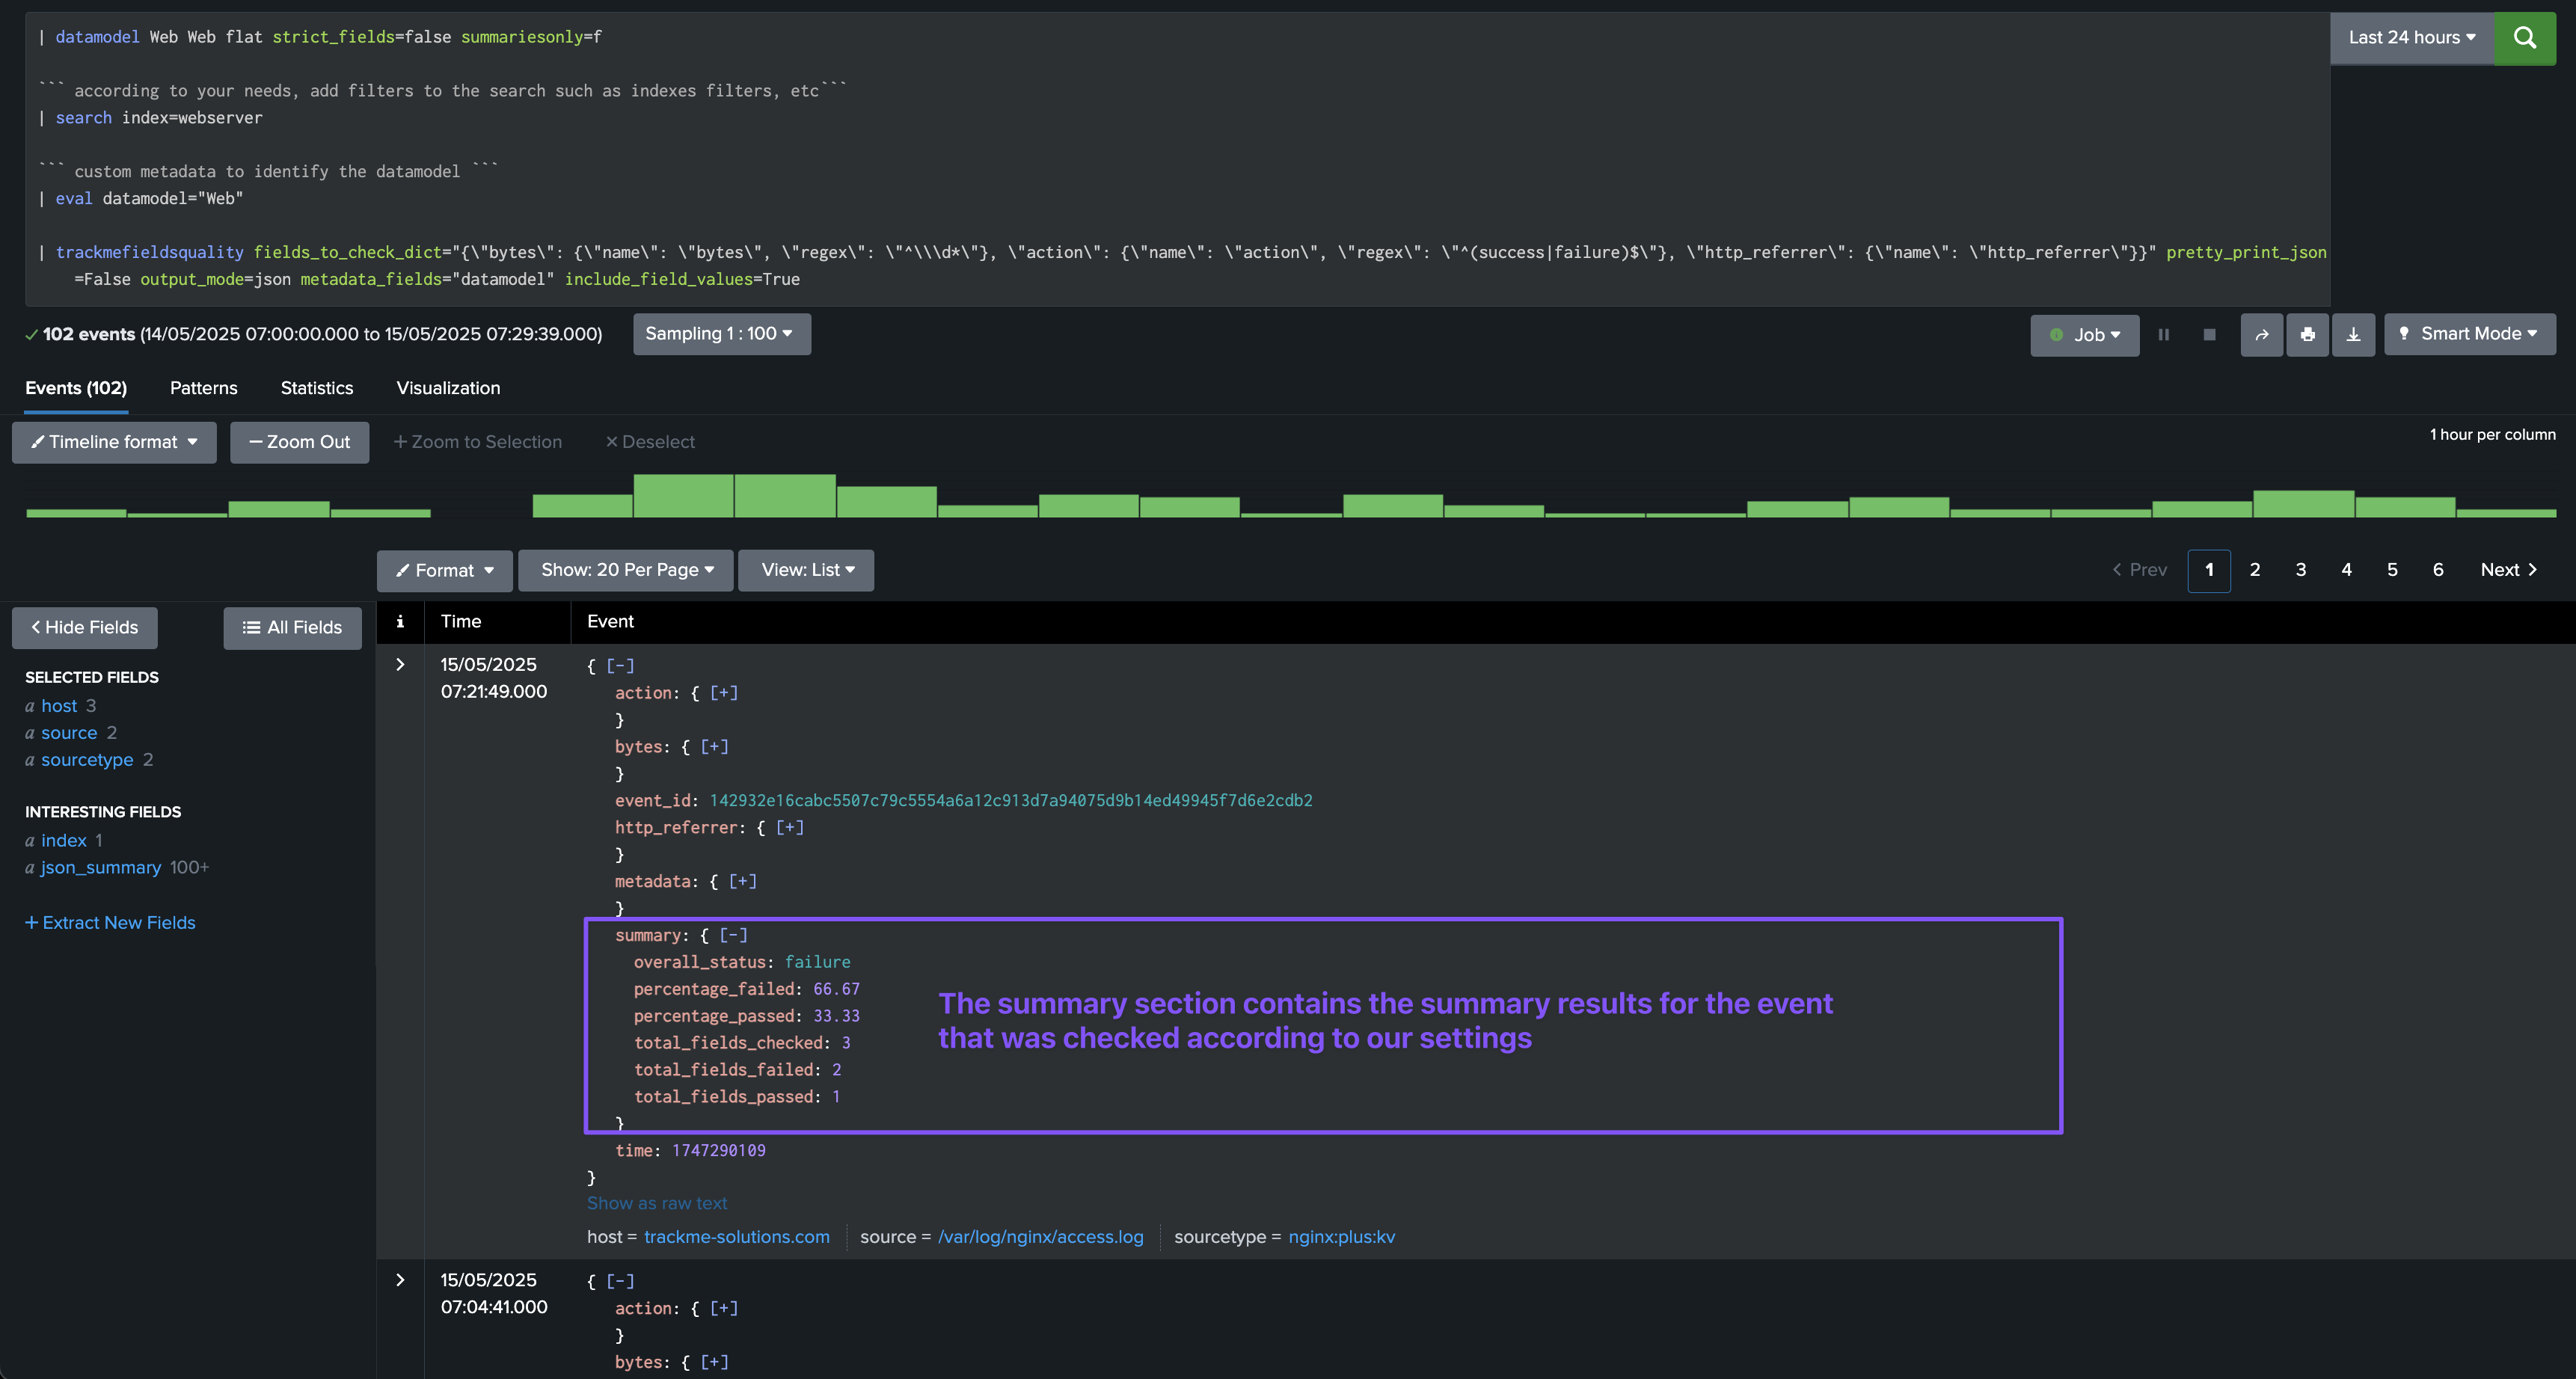
In addition, the command will account the field and its status in the summary section of the JSON object:
overall_status: the overall status of the field checks, eithersuccessorfailuretotal_fields_checked: the total number of fields checkedtotal_fields_failed: the total number of fields that failedtotal_fields_passed: the total number of fields that passedpercentage_failed: the percentage of fields that failedpercentage_passed: the percentage of fields that passed
Note: this argument does NOT process a regular expression to check for the content, therefore the regex_failure flag will always be False. (see next options for this)
Argument: fields_to_check_fieldname
This does exactly the same as fields_to_check_list, but instead of providing the list of fields to check as a comma-separated list, we provide the name of a field that contains the list of fields to check.
You would therefore call the command as follows:
Example:
| eval fields_list="action,app,bytes,url"
| trackmefieldsquality fields_to_check_fieldname="fields_list"
The point of having this option is that could for instance use a Splunk subsearch to generate the list of fields dynamically, for instance by accessing a lookup table where you store the fields depending on your criteria, or any other solution of your choice.
Hint
Providing a JSON dictionary model
The next 3 options allow to provide a JSON dictionary model that models the fields to check, as well as optional parameters for each field.
Especially, you can define a regular expression with the field
regexto be apply against the value, allowing to valid the content of the field according to any needs.You can also define the field
allow_unknownto beTrueorFalse, which can be used to disable the check for the fieldis_unknown.
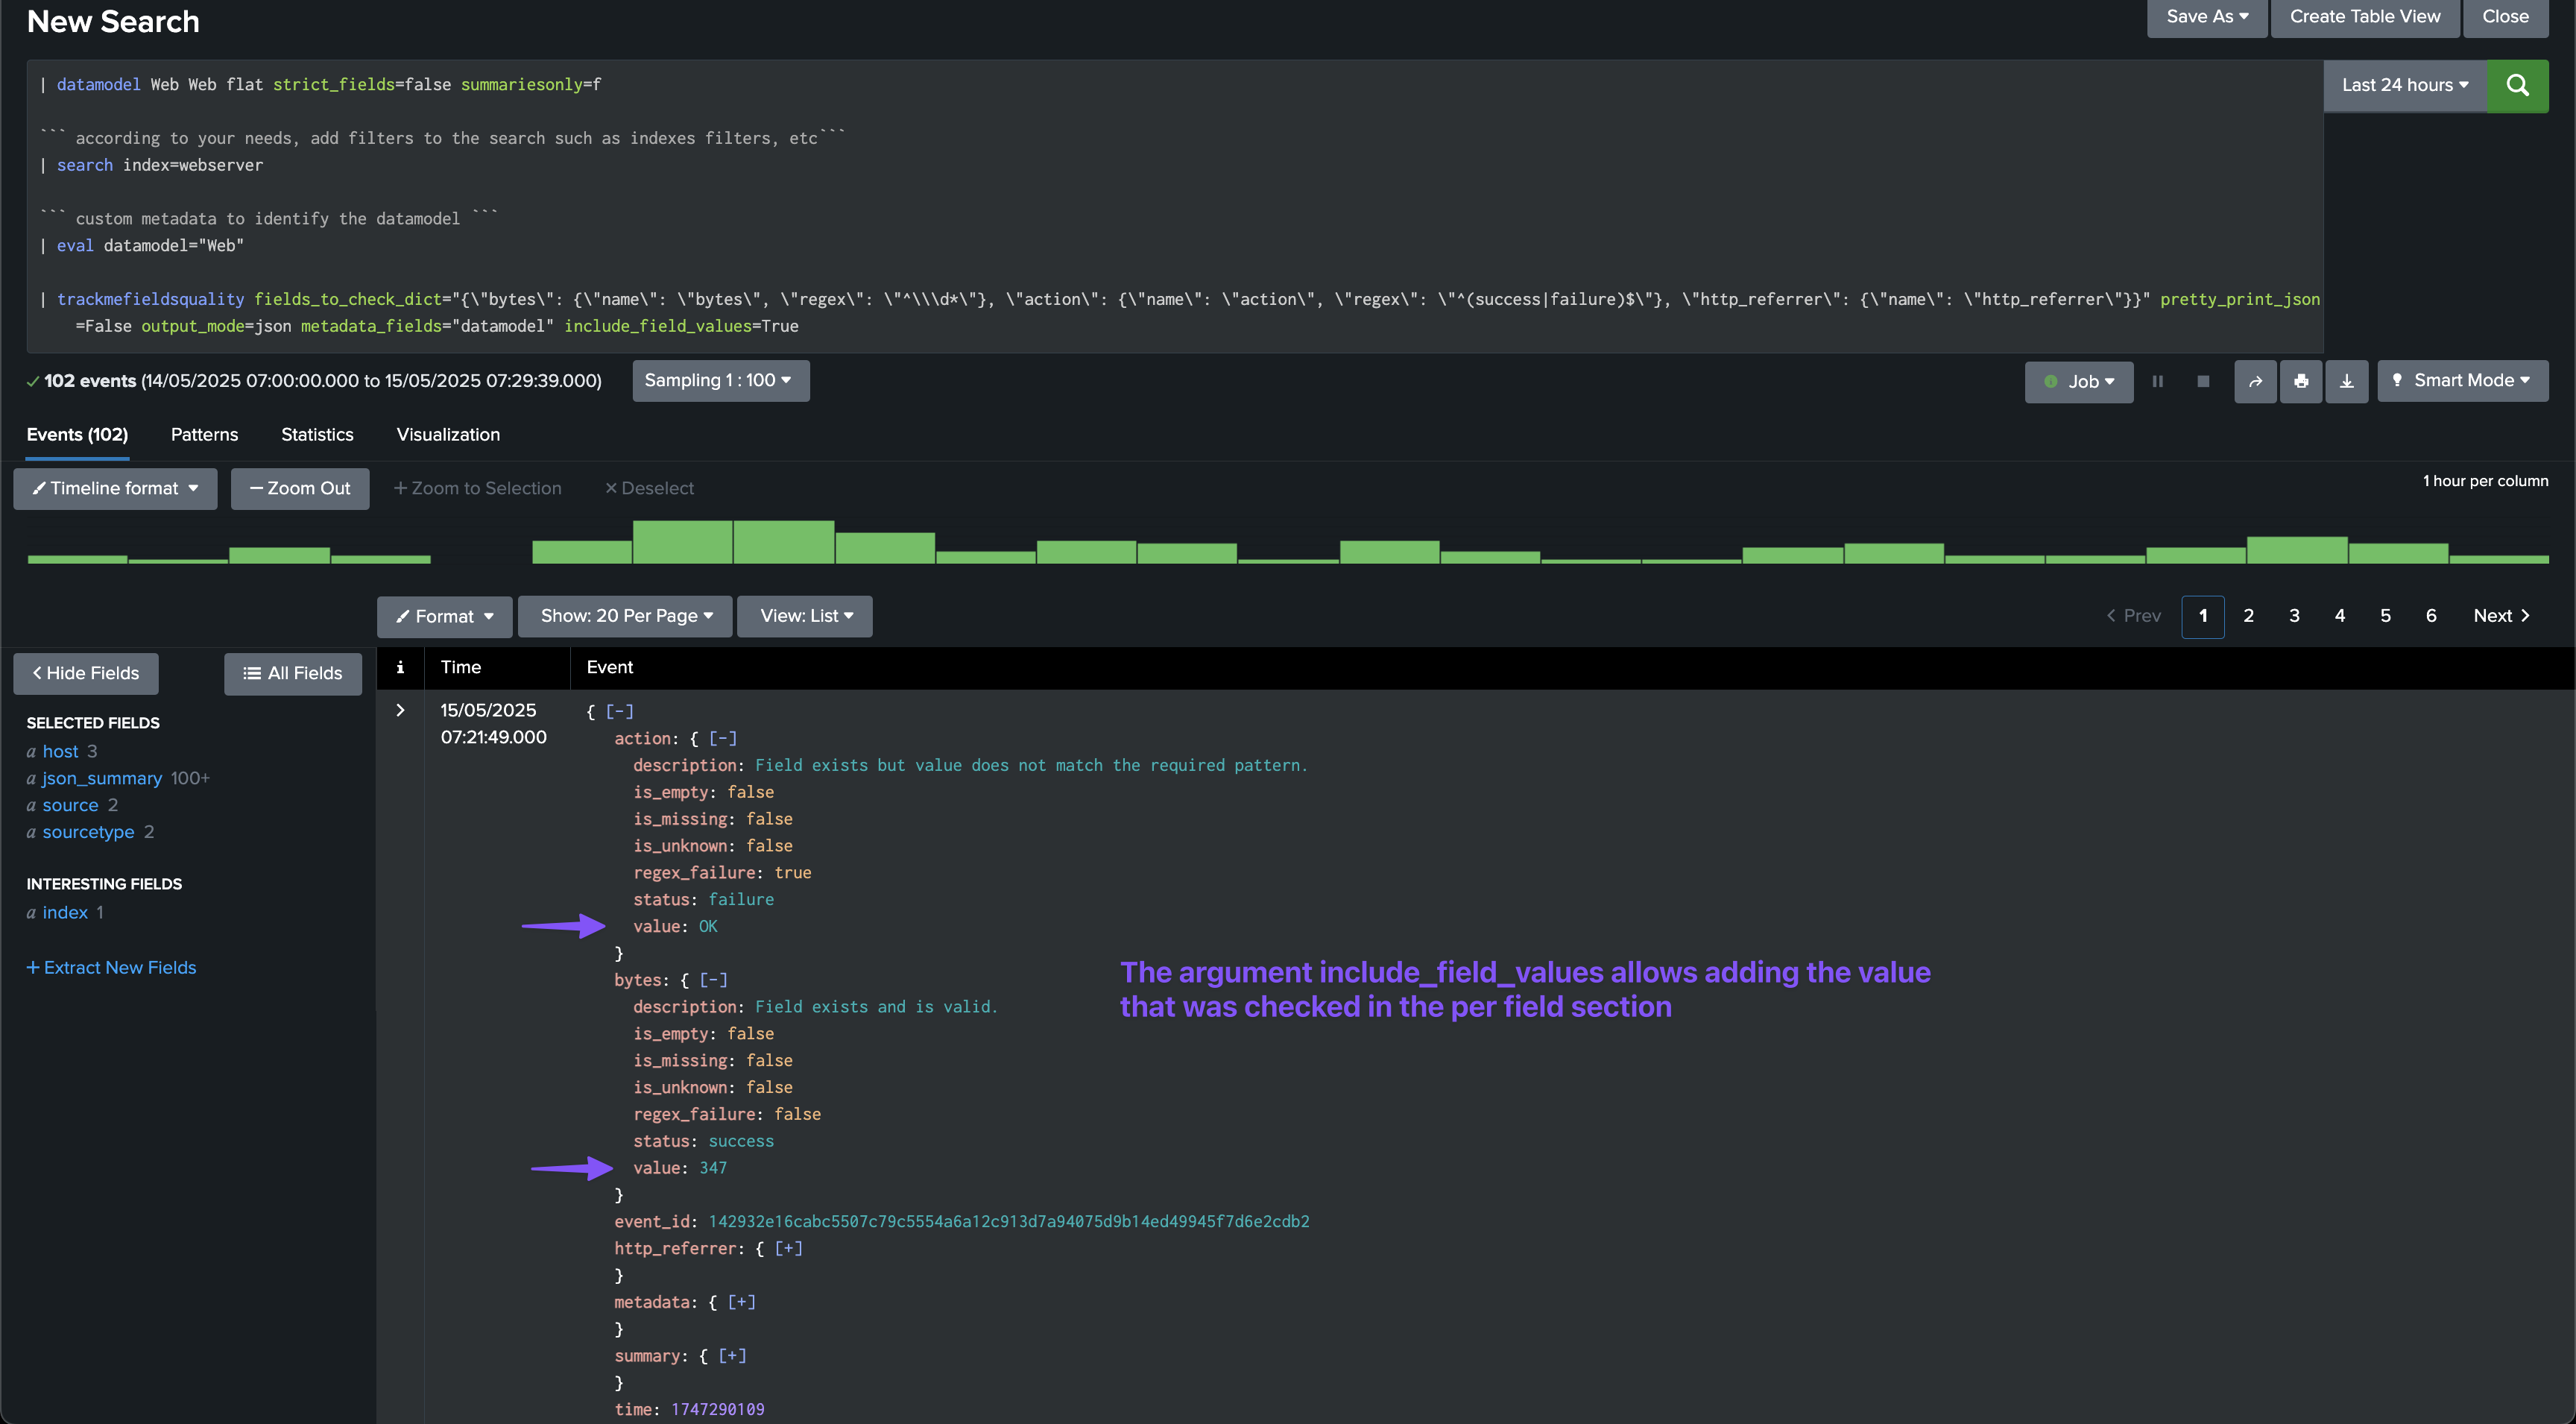
Argument: fields_to_check_dict
This option is more sophisticated and allows to define a dictionnary that models the fields to check, and as well as an option regular expression to be apply against the value.
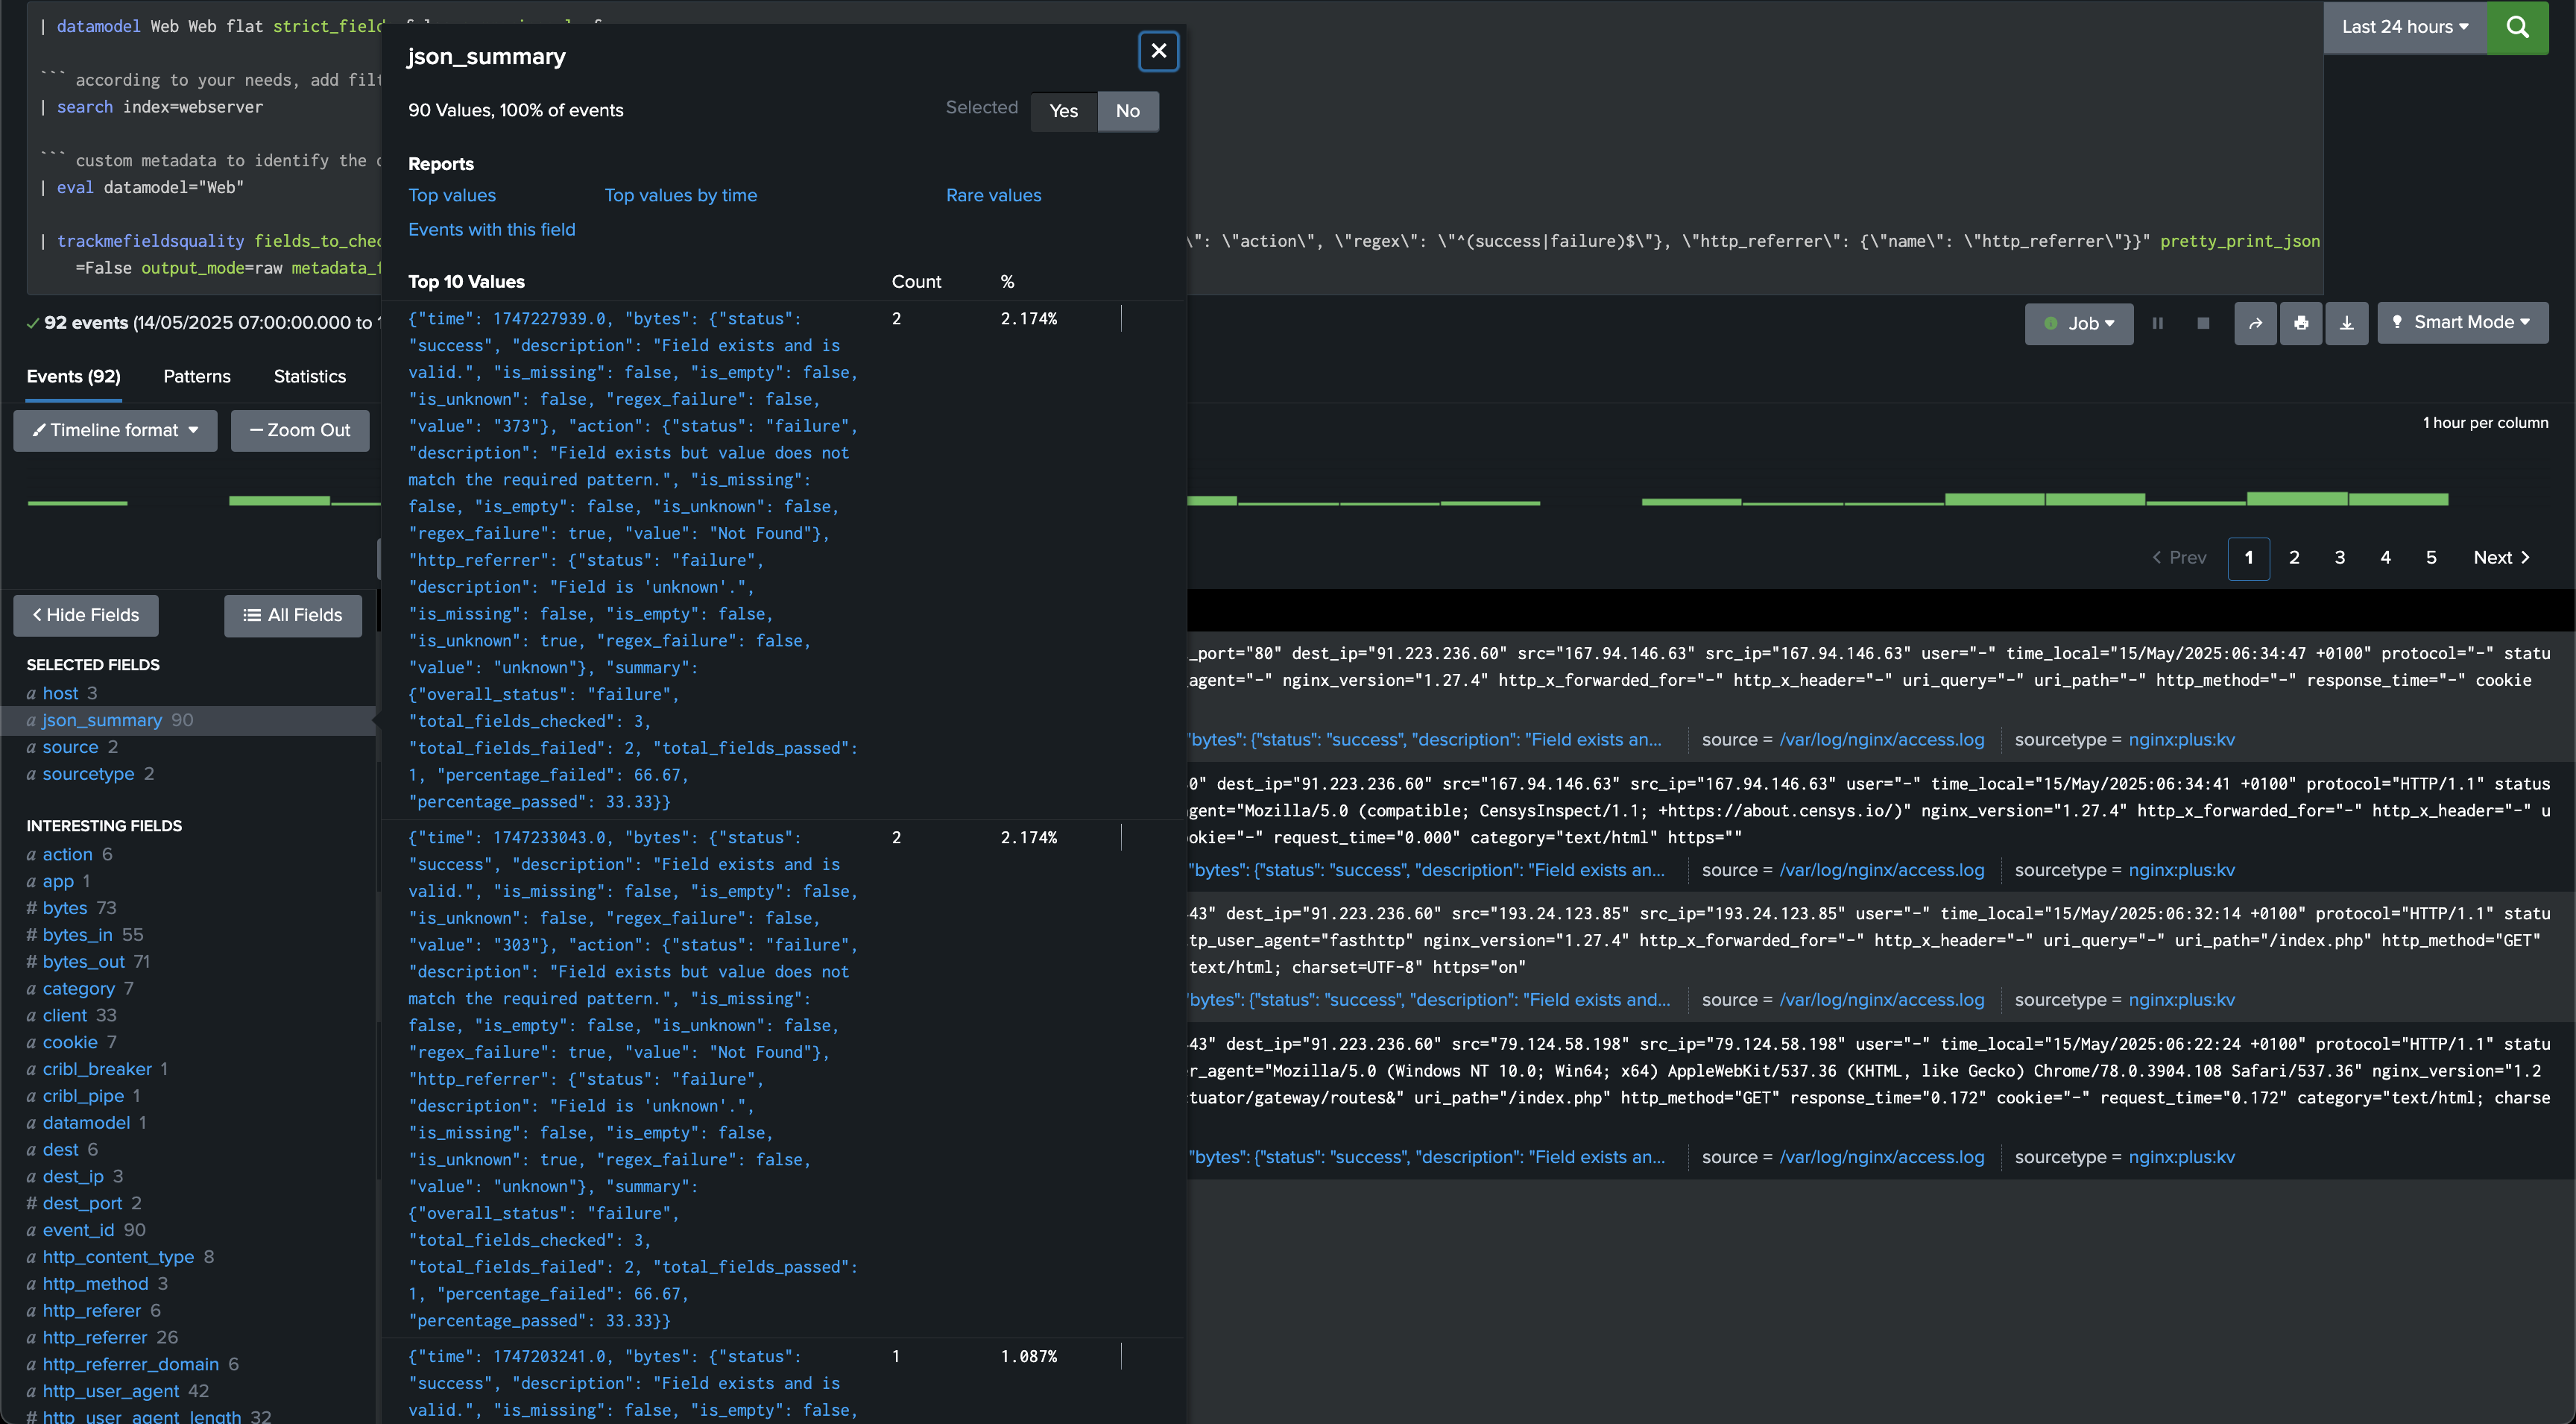
For instance, the following distionnary would verify the fields bytes including the fact that this should be a numerical value using a regular expression, the field action that for instance would accept only success or failure, and finally the field http_referrer where we would only perform the basic checks without verifying that its value matches certain criteria.
| trackmefieldsquality fields_to_check_dict="{\"bytes\": {\"name\": \"bytes\", \"regex\": \"^\\\d*\"}, \"action\": {\"name\": \"action\", \"regex\": \"^(success|failure)$\"}, \"http_referrer\": {\"name\": \"http_referrer\"}}" pretty_print_json=False output_mode=json metadata_fields="datamodel" include_field_values=True
In this case, if a regrex expression is provided, the regex_failure flag will be set to True if the value does not match the regular expression, and False otherwise, which accounts for status of the field in addition to the other checks.
Example of JSON output:
{
    "time": 1747261746,
    "bytes": {
        "status": "success",
        "description": "Field exists and is valid.",
        "is_missing": false,
        "is_empty": false,
        "is_unknown": false,
        "regex_failure": false,
        "value": "309"
    },
    "action": {
        "status": "failure",
        "description": "Field exists but value does not match the required pattern.",
        "is_missing": false,
        "is_empty": false,
        "is_unknown": false,
        "regex_failure": true,
        "value": "Bad Request"
    },
    "http_referrer": {
        "status": "failure",
        "description": "Field is 'unknown'.",
        "is_missing": false,
        "is_empty": false,
        "is_unknown": true,
        "regex_failure": false,
        "value": "unknown"
    },
    "summary": {
        "overall_status": "failure",
        "total_fields_checked": 3,
        "total_fields_failed": 2,
        "total_fields_passed": 1,
        "percentage_failed": 66.67,
        "percentage_passed": 33.33
    },
    "metadata": {
        "time_epoch": 1747261746,
        "time_human": "Wed May 14 22:29:06 2025 UTC",
        "index": "webserver",
        "sourcetype": "nginx:plus:kv",
        "host": "trackme-solutions.com",
        "source": "/var/log/nginx/access.log",
        "datamodel": "Web"
    },
    "event_id": "f5ed1437ee8486a3782ebaea846dad37c52d47b825d1913c1ae7d085ba01f943"
}
Hint
Escaping backslashes and special characters
The tricky part is that you need to pay attention to the JSON provided as input to the command
Especially, double quotes within the JSON string need to be escaped.
The regular expression also needs to be escaped, for instance
^\\\d*which would otherwise be\d*in normal circumstances.
Argument: fields_to_check_dict_fieldname
Similarly to fields_to_check_fieldname, this option allows to provide the name of a field that contains the dictionary of fields to check as in the previous example.
This allows to use a Splunk subsearch to generate the dictionary dynamically, for instance by accessing a lookup table where you store the fields depending on your criteria, or any other solution of your choice.
Example:
| eval fields_dict="{\"bytes\": {\"name\": \"bytes\", \"regex\": \"^\\\d*\"}, \"action\": {\"name\": \"action\", \"regex\": \"^(success|failure)$\"}, \"http_referrer\": {\"name\": \"http_referrer\"}}"
| trackmefieldsquality fields_to_check_dict_fieldname="fields_dict" pretty_print_json=False output_mode=json metadata_fields="datamodel" include_field_values=True
Argument: fields_to_check_search_command
This option allows to provide a search command that will be executed to generate the dictionary of fields to check dynamically. This is particularly useful when you want to generate the dictionary on-the-fly using commands like trackmefieldsqualitygendict or any other search command that produces the required JSON dictionary format.
The search command will be executed and its output will be used as the dictionary for fields quality assessment. This provides maximum flexibility for dynamic dictionary generation.
Example:
| trackmefieldsquality fields_to_check_search_command="| trackmefieldsqualitygendict datamodel=Web show_only_recommended_fields=True" pretty_print_json=False output_mode=json metadata_fields="datamodel" include_field_values=True
Example with custom search command:
| trackmefieldsquality fields_to_check_search_command="| inputlookup my_data_dict_lookup | where somefilter=\"somevalue\"" pretty_print_json=False output_mode=json metadata_fields="datamodel" include_field_values=True
Argument: fields_to_check_dict_path
This option is similar to fields_to_check_dict_fieldname, but instead of providing the dictionary as a JSON string, we provide the path to a JSON file that contains the dictionary.
The file must exist on the file system of the Splunk instance, and the path must be provided as a string.
Our JSON file would look like this:
{
    "action": {
        "name": "action",
        "regex": "^(success|failure)$"
    },
    "bytes": {
        "name": "bytes",
        "regex": "^\\d*"
    },
    "http_referrer": {
        "name": "http_referrer"
    }
}
Example:
| trackmefieldsquality fields_to_check_dict_path="/opt/splunk/etc/apps/myapp/mydir/web_datamodel.json" pretty_print_json=False output_mode=json metadata_fields="datamodel" include_field_values=True
Argument: include_field_values
This option allows to include the field values in the JSON output, which can useful for analytics and reporting purposes.
Argument: pretty_print_json
This option allows to pretty print the JSON output, which can be useful for debugging purposes.
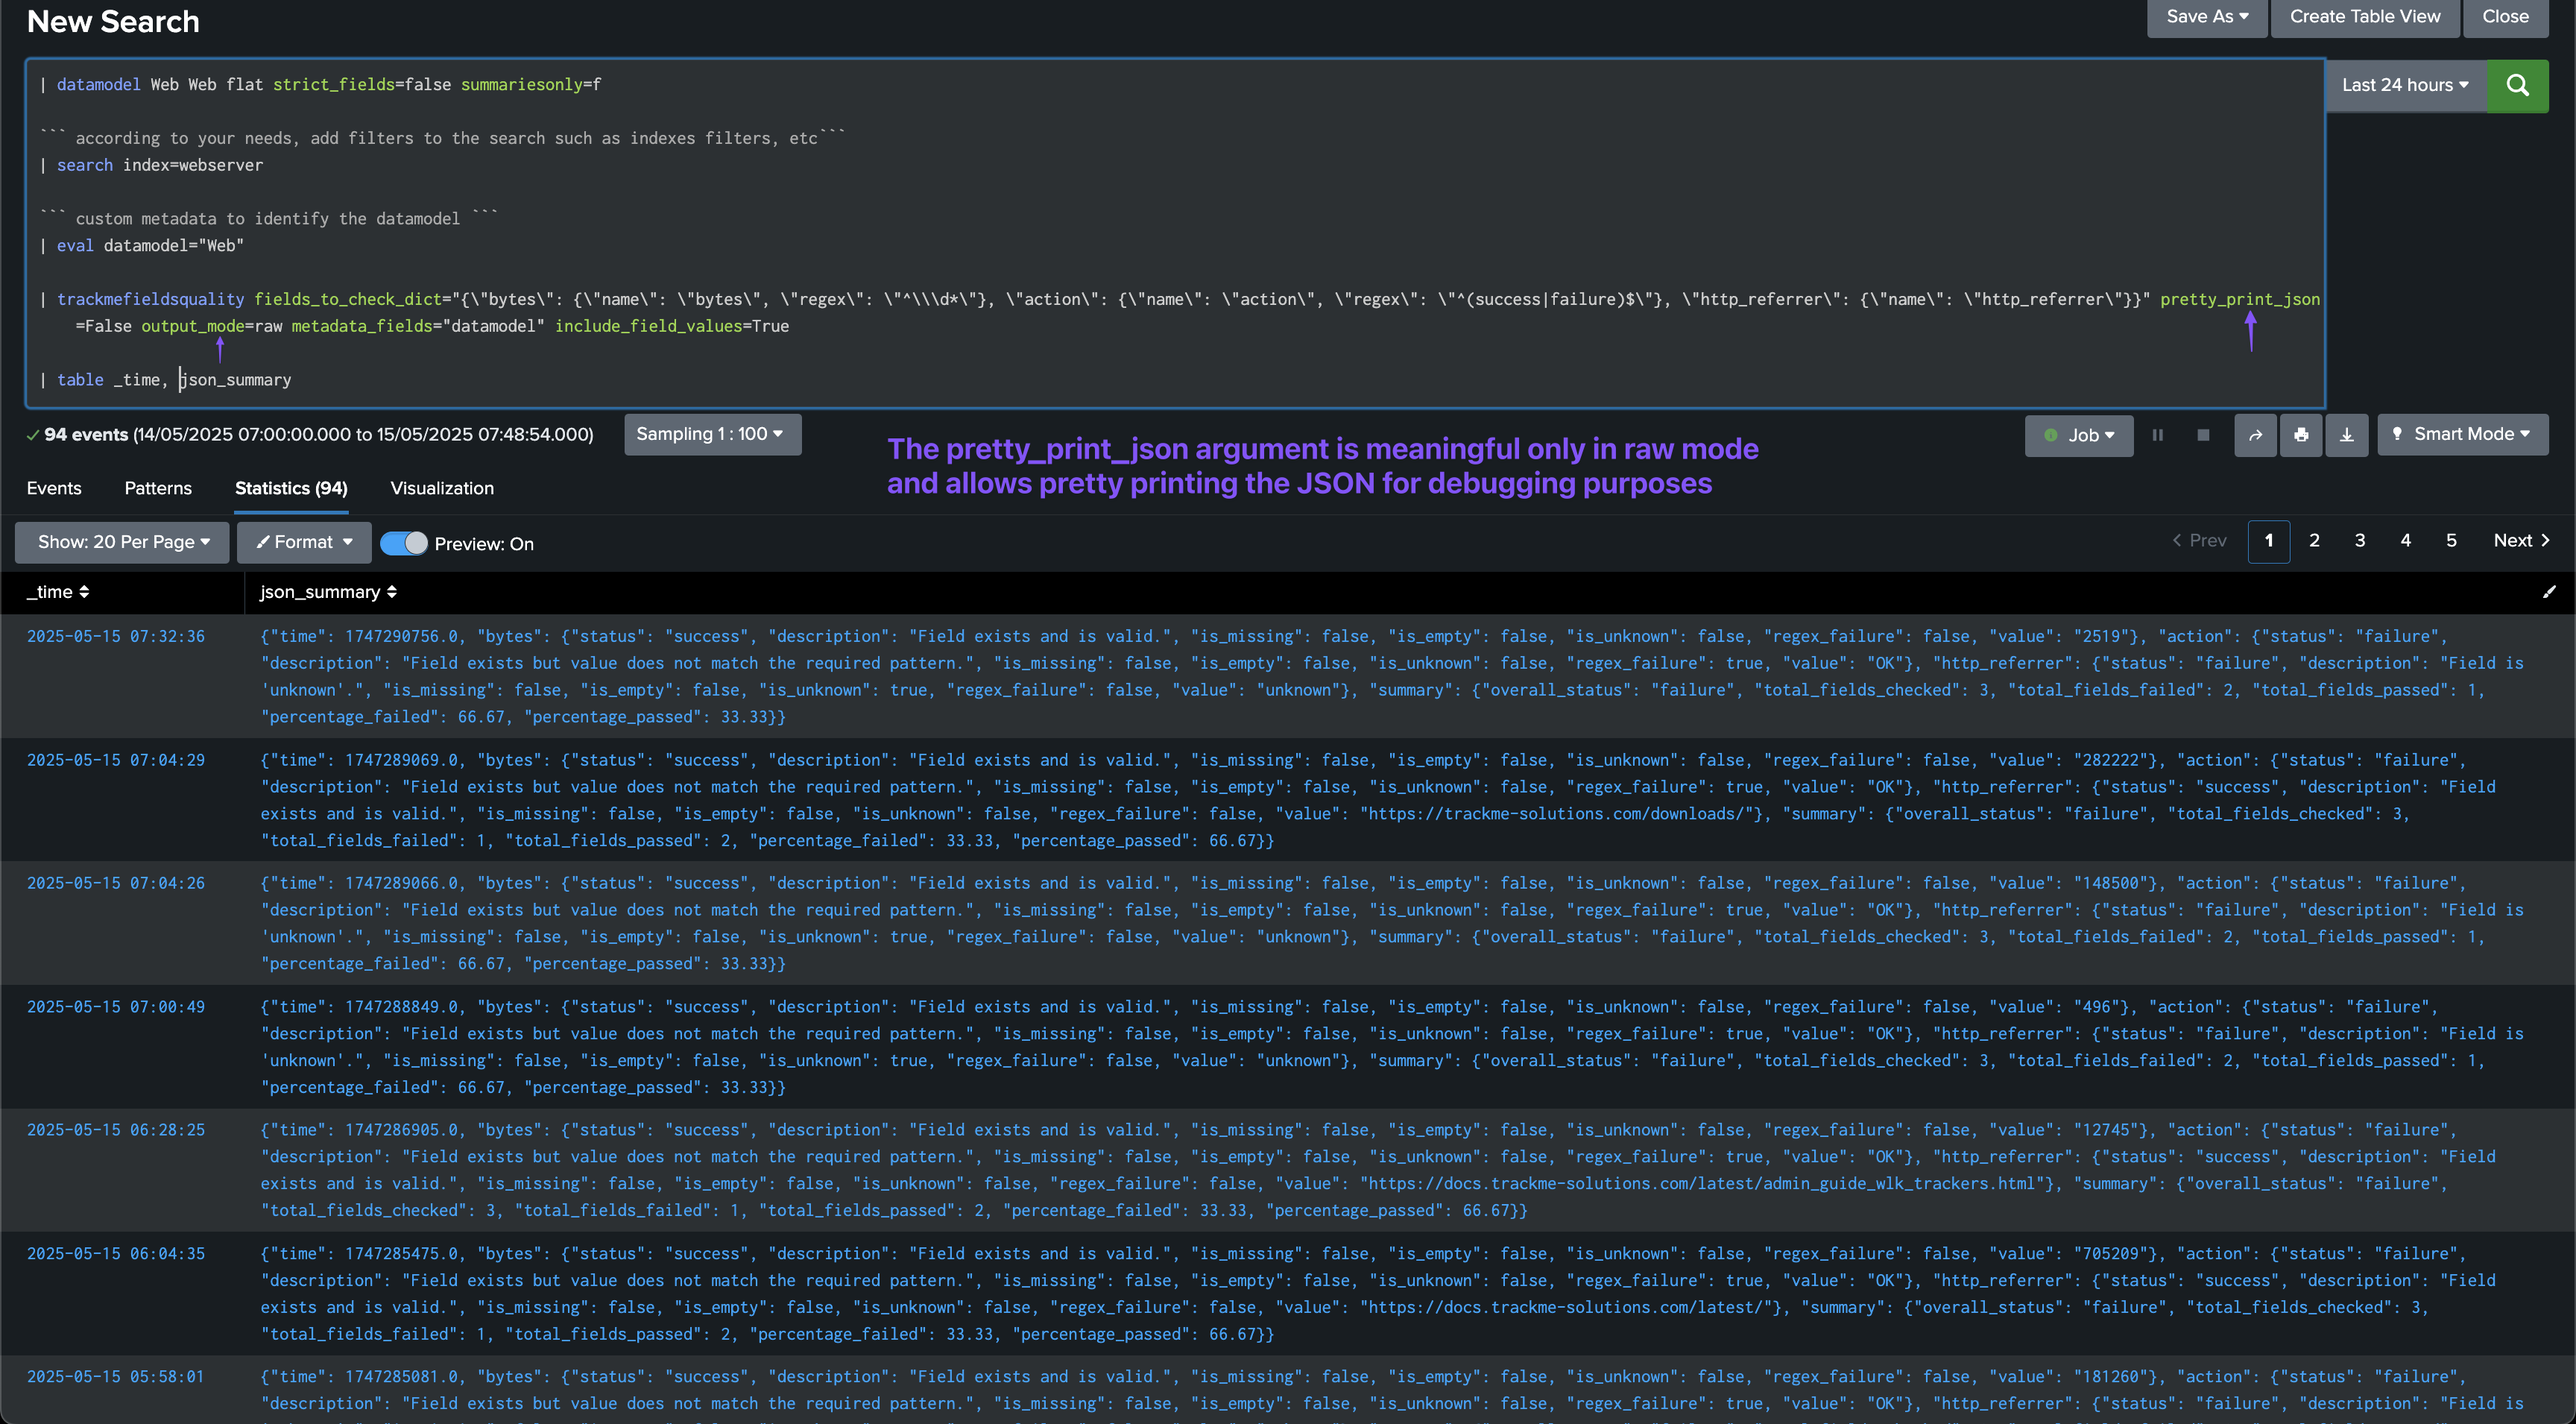
Argument: output_mode
This option allows to specify the output mode, which can be json or raw.
We recommend using the json mode for most use cases, especially this document is focused on the JSON output which is leveraged and indexed using the TrackMe sourcetype trackme:fields_quality.
output_mode=json
In JSON mode, the command verifies the fields and generates a JSON object per event:
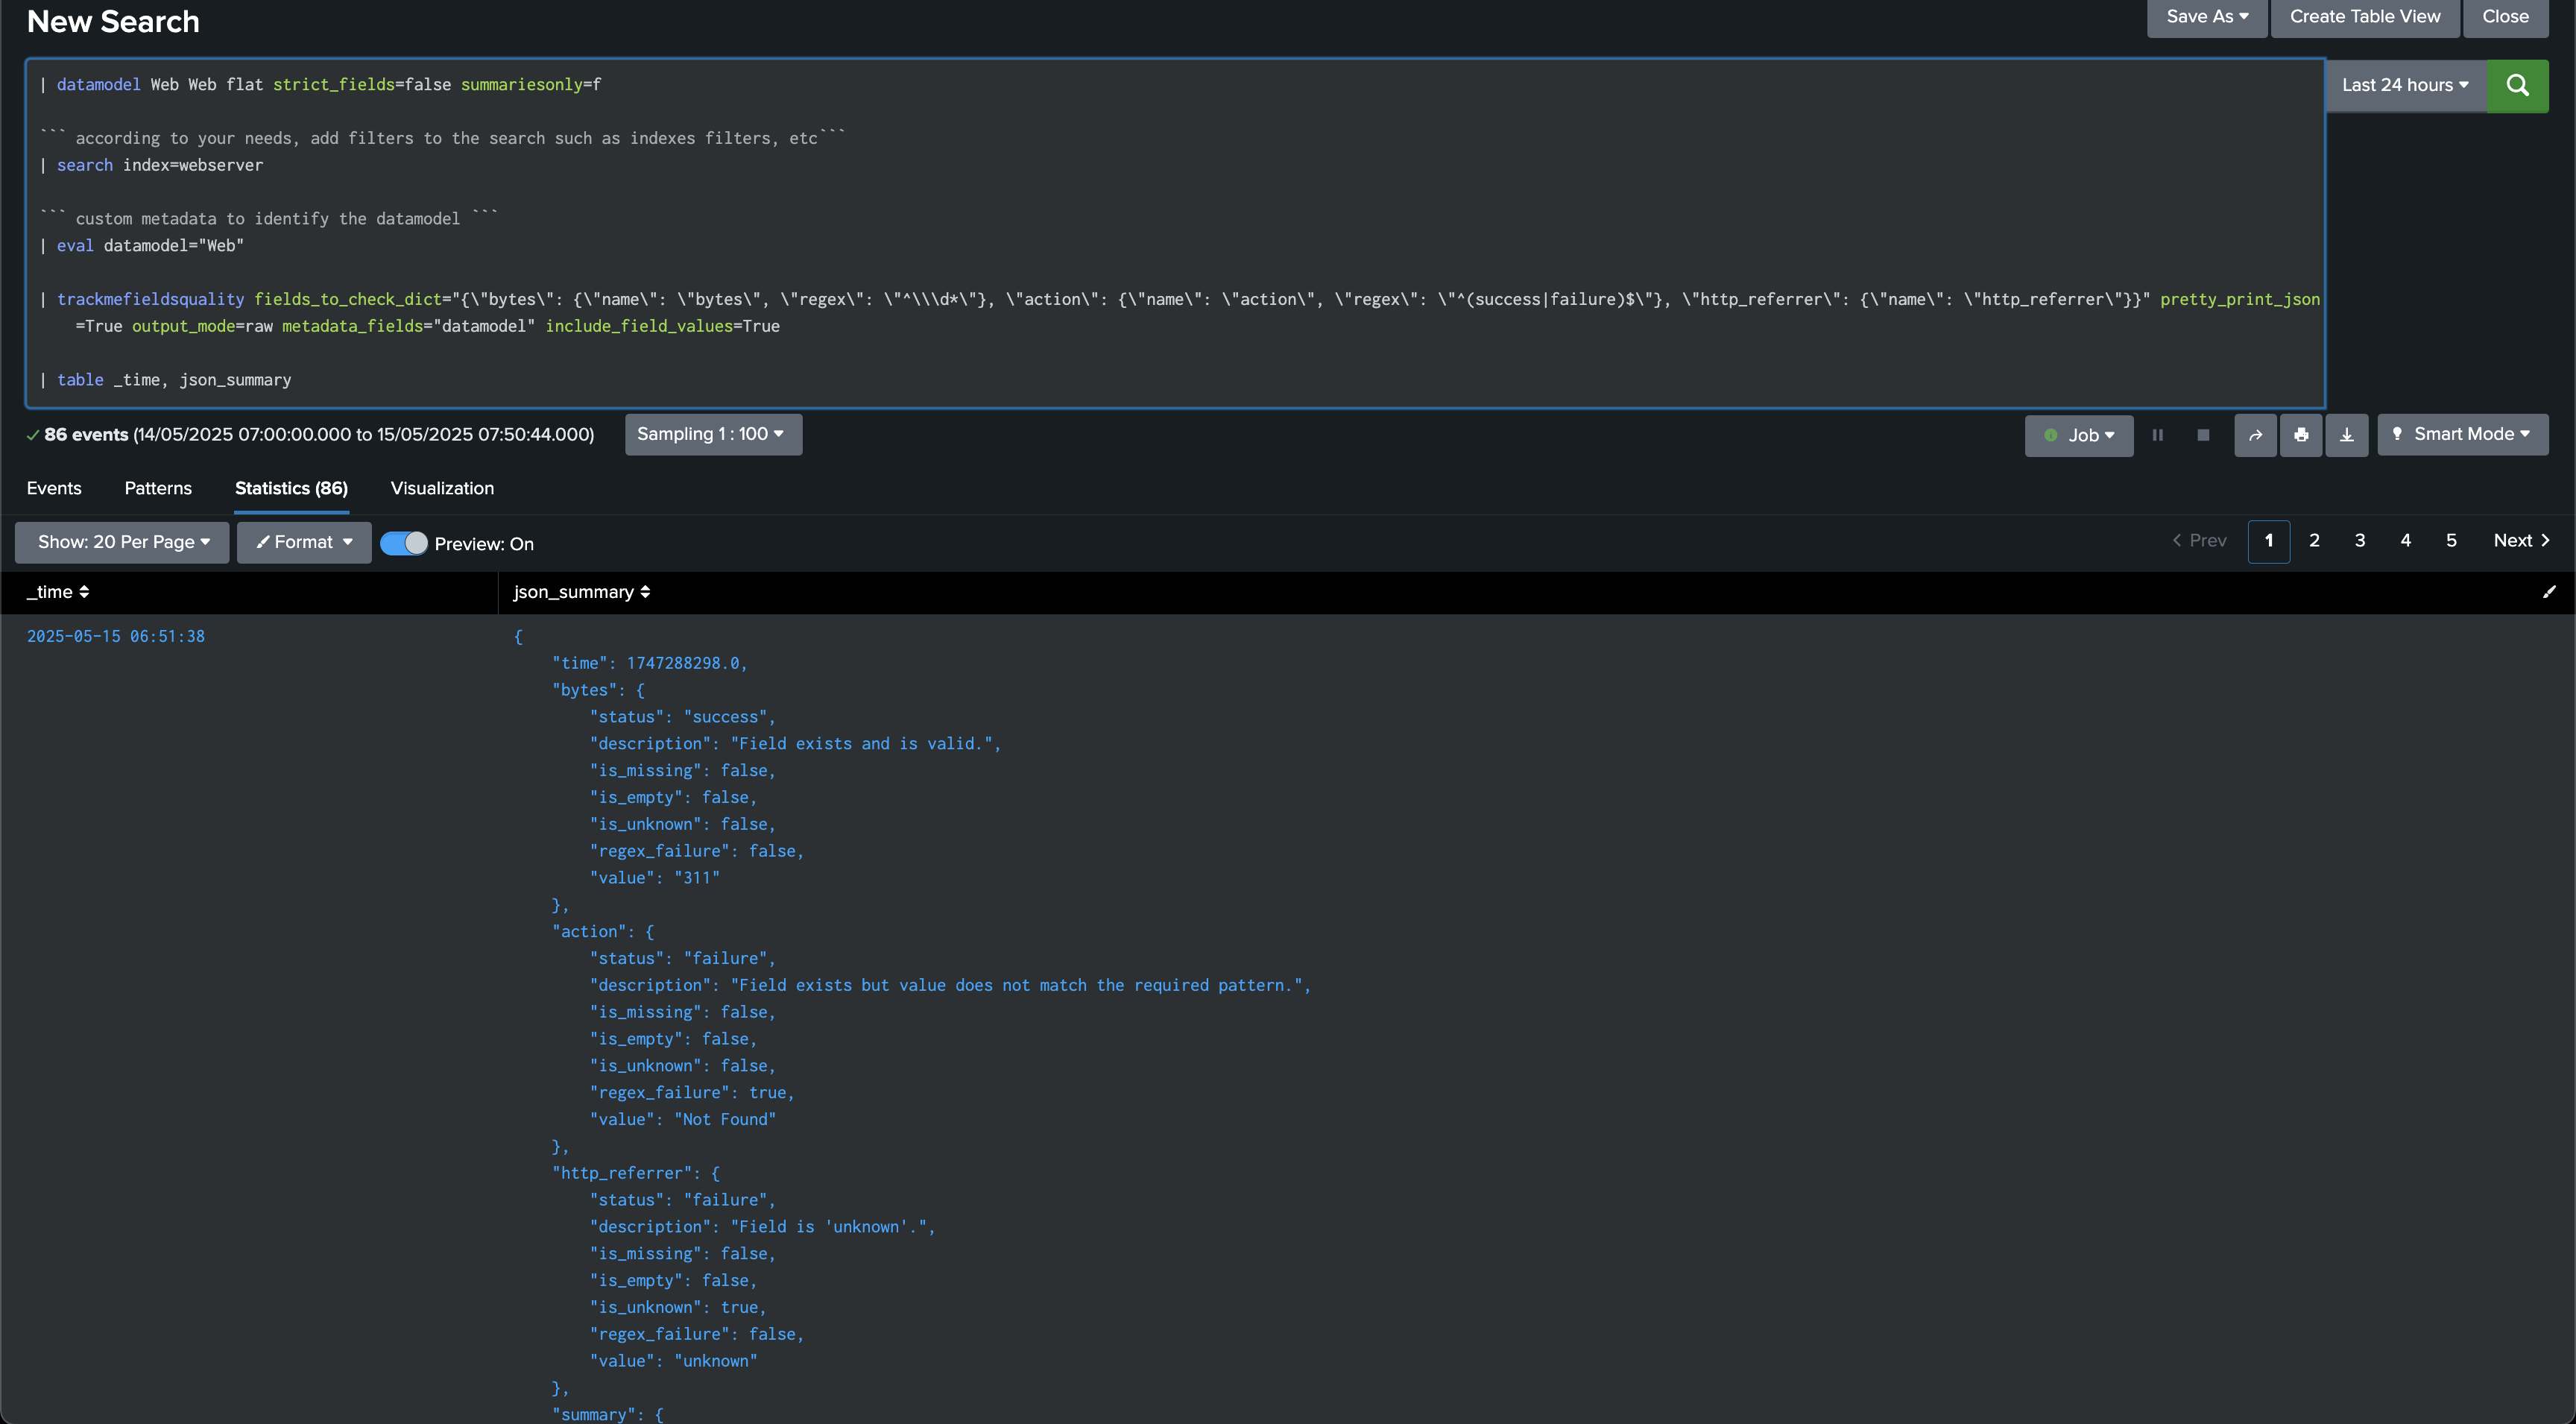
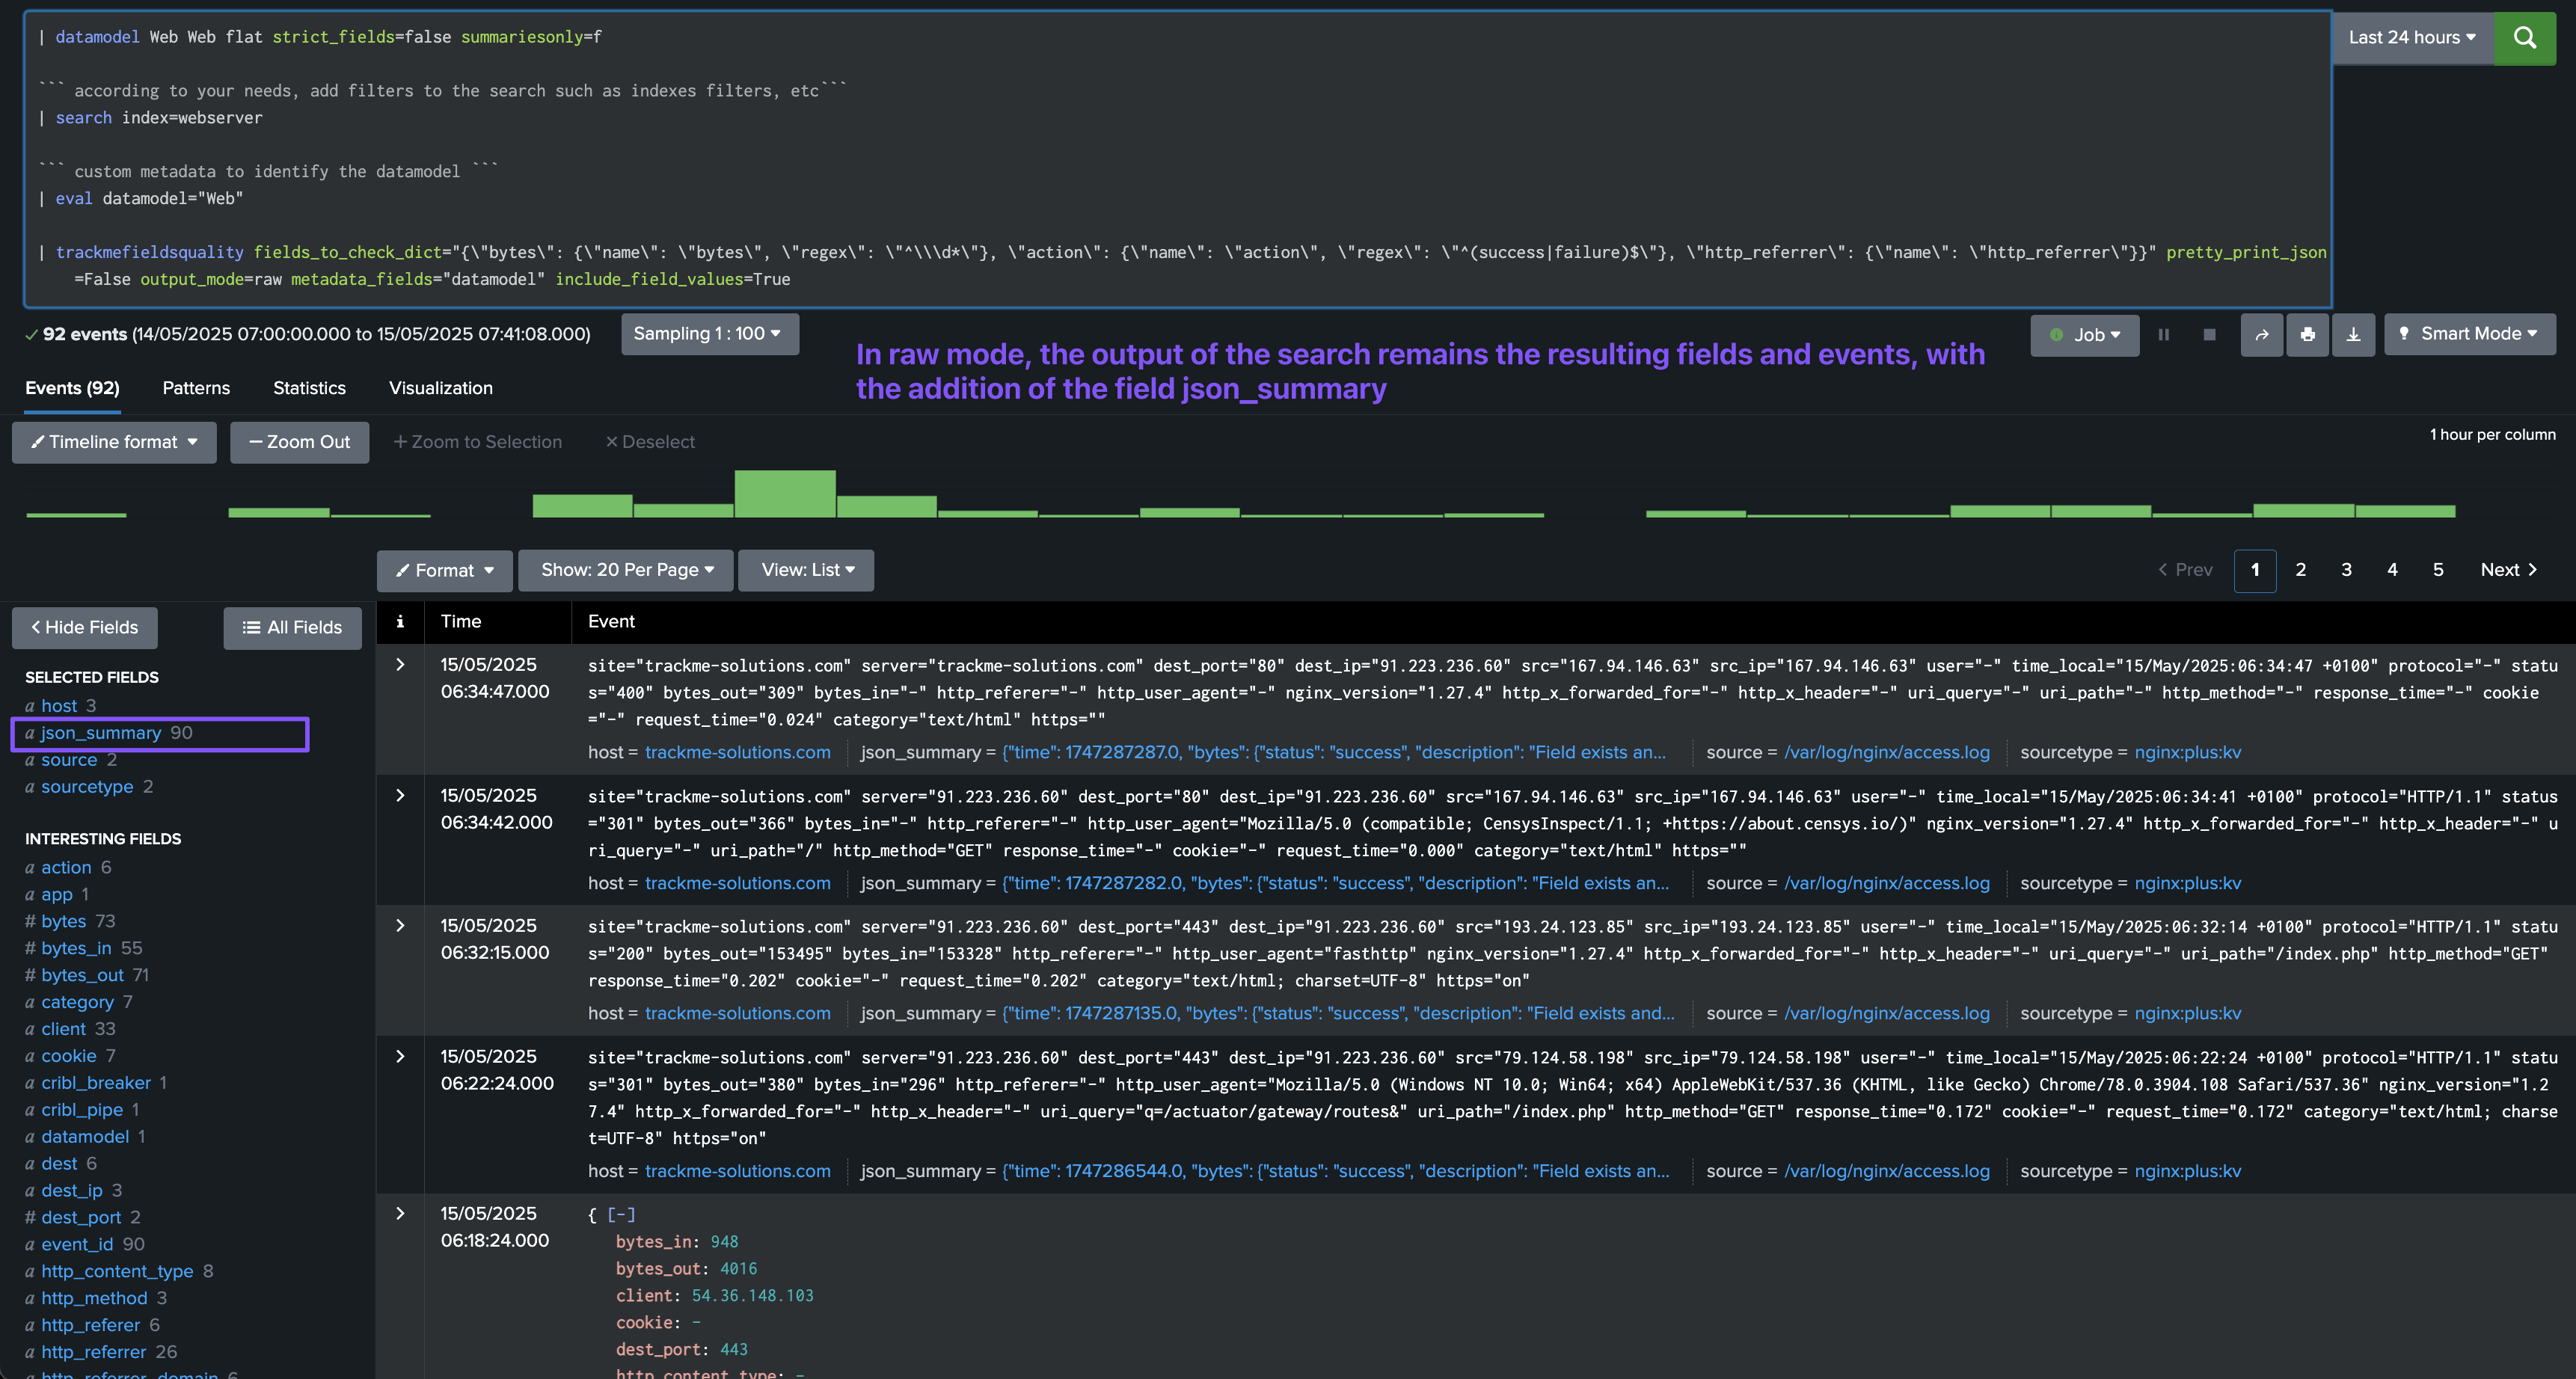
output_mode=raw
In raw mode, the command generates the events as they are, and adds a field called json_summary which contains our JSON object:
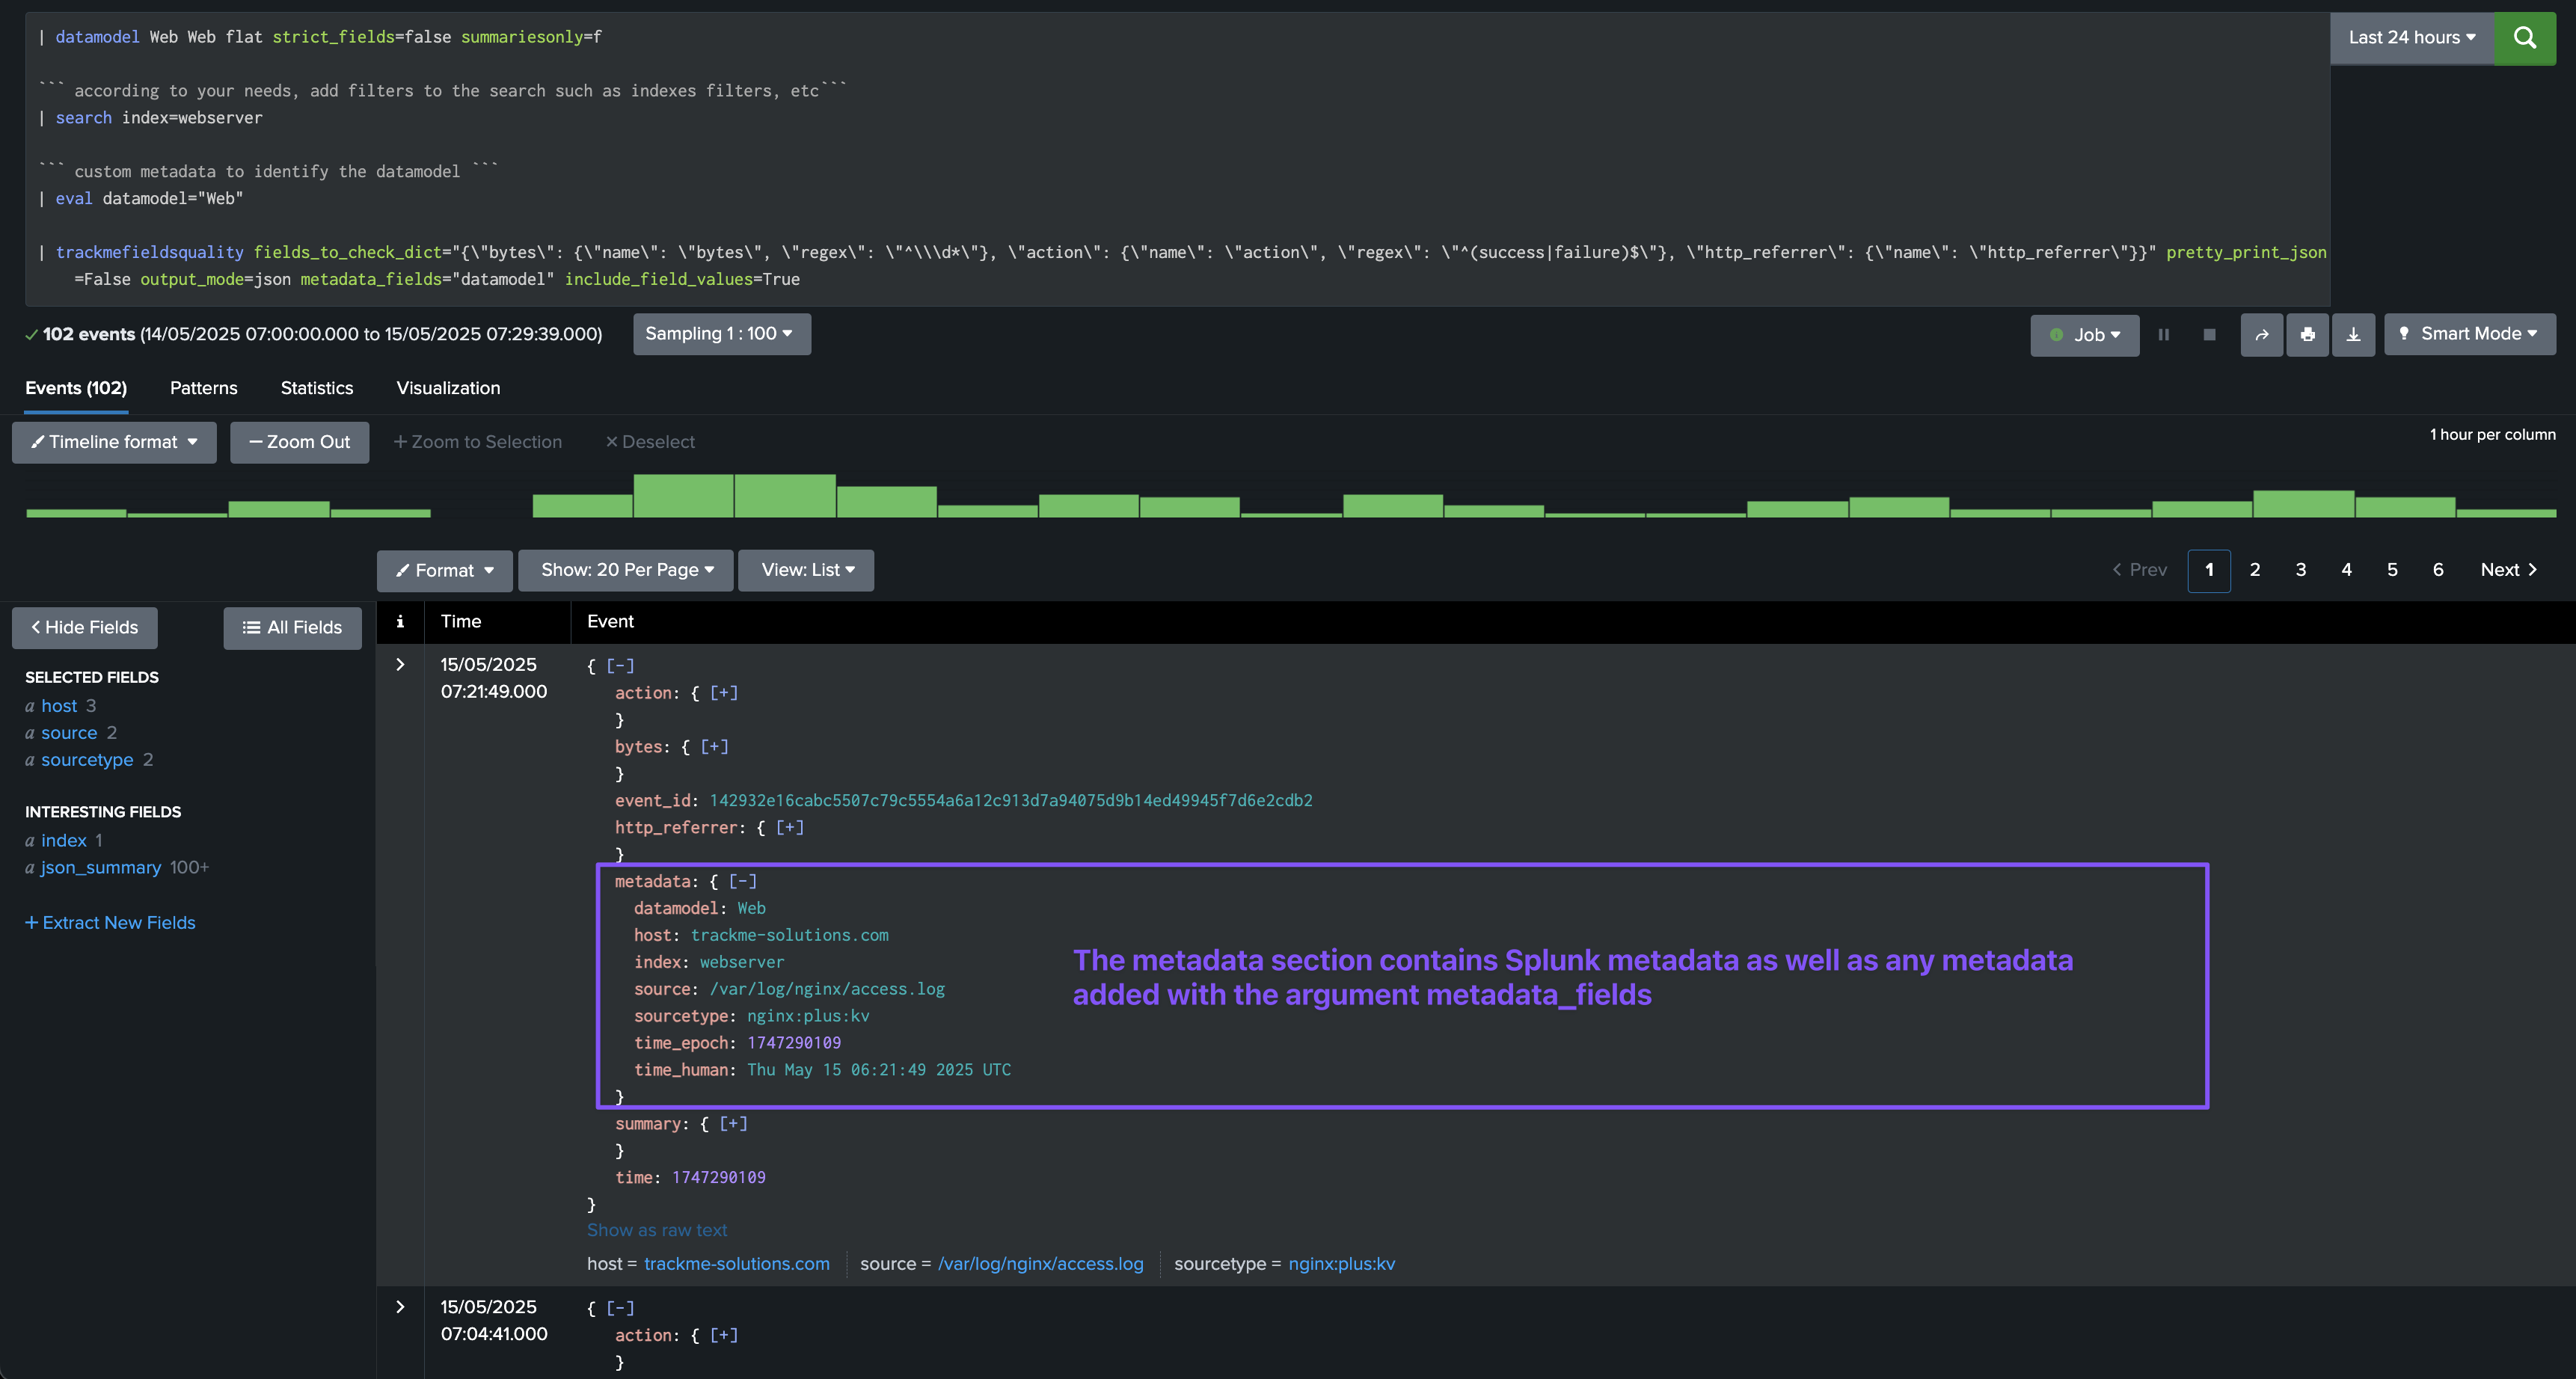
Argument: metadata_fields
This option allows to specify the metadata fields as a comma-separated list of fieldsto include in the JSON output.
The metadata fields always include the following:
index: the index of the eventsourcetype: the sourcetype of the eventhost: the host of the eventsource: the source of the event
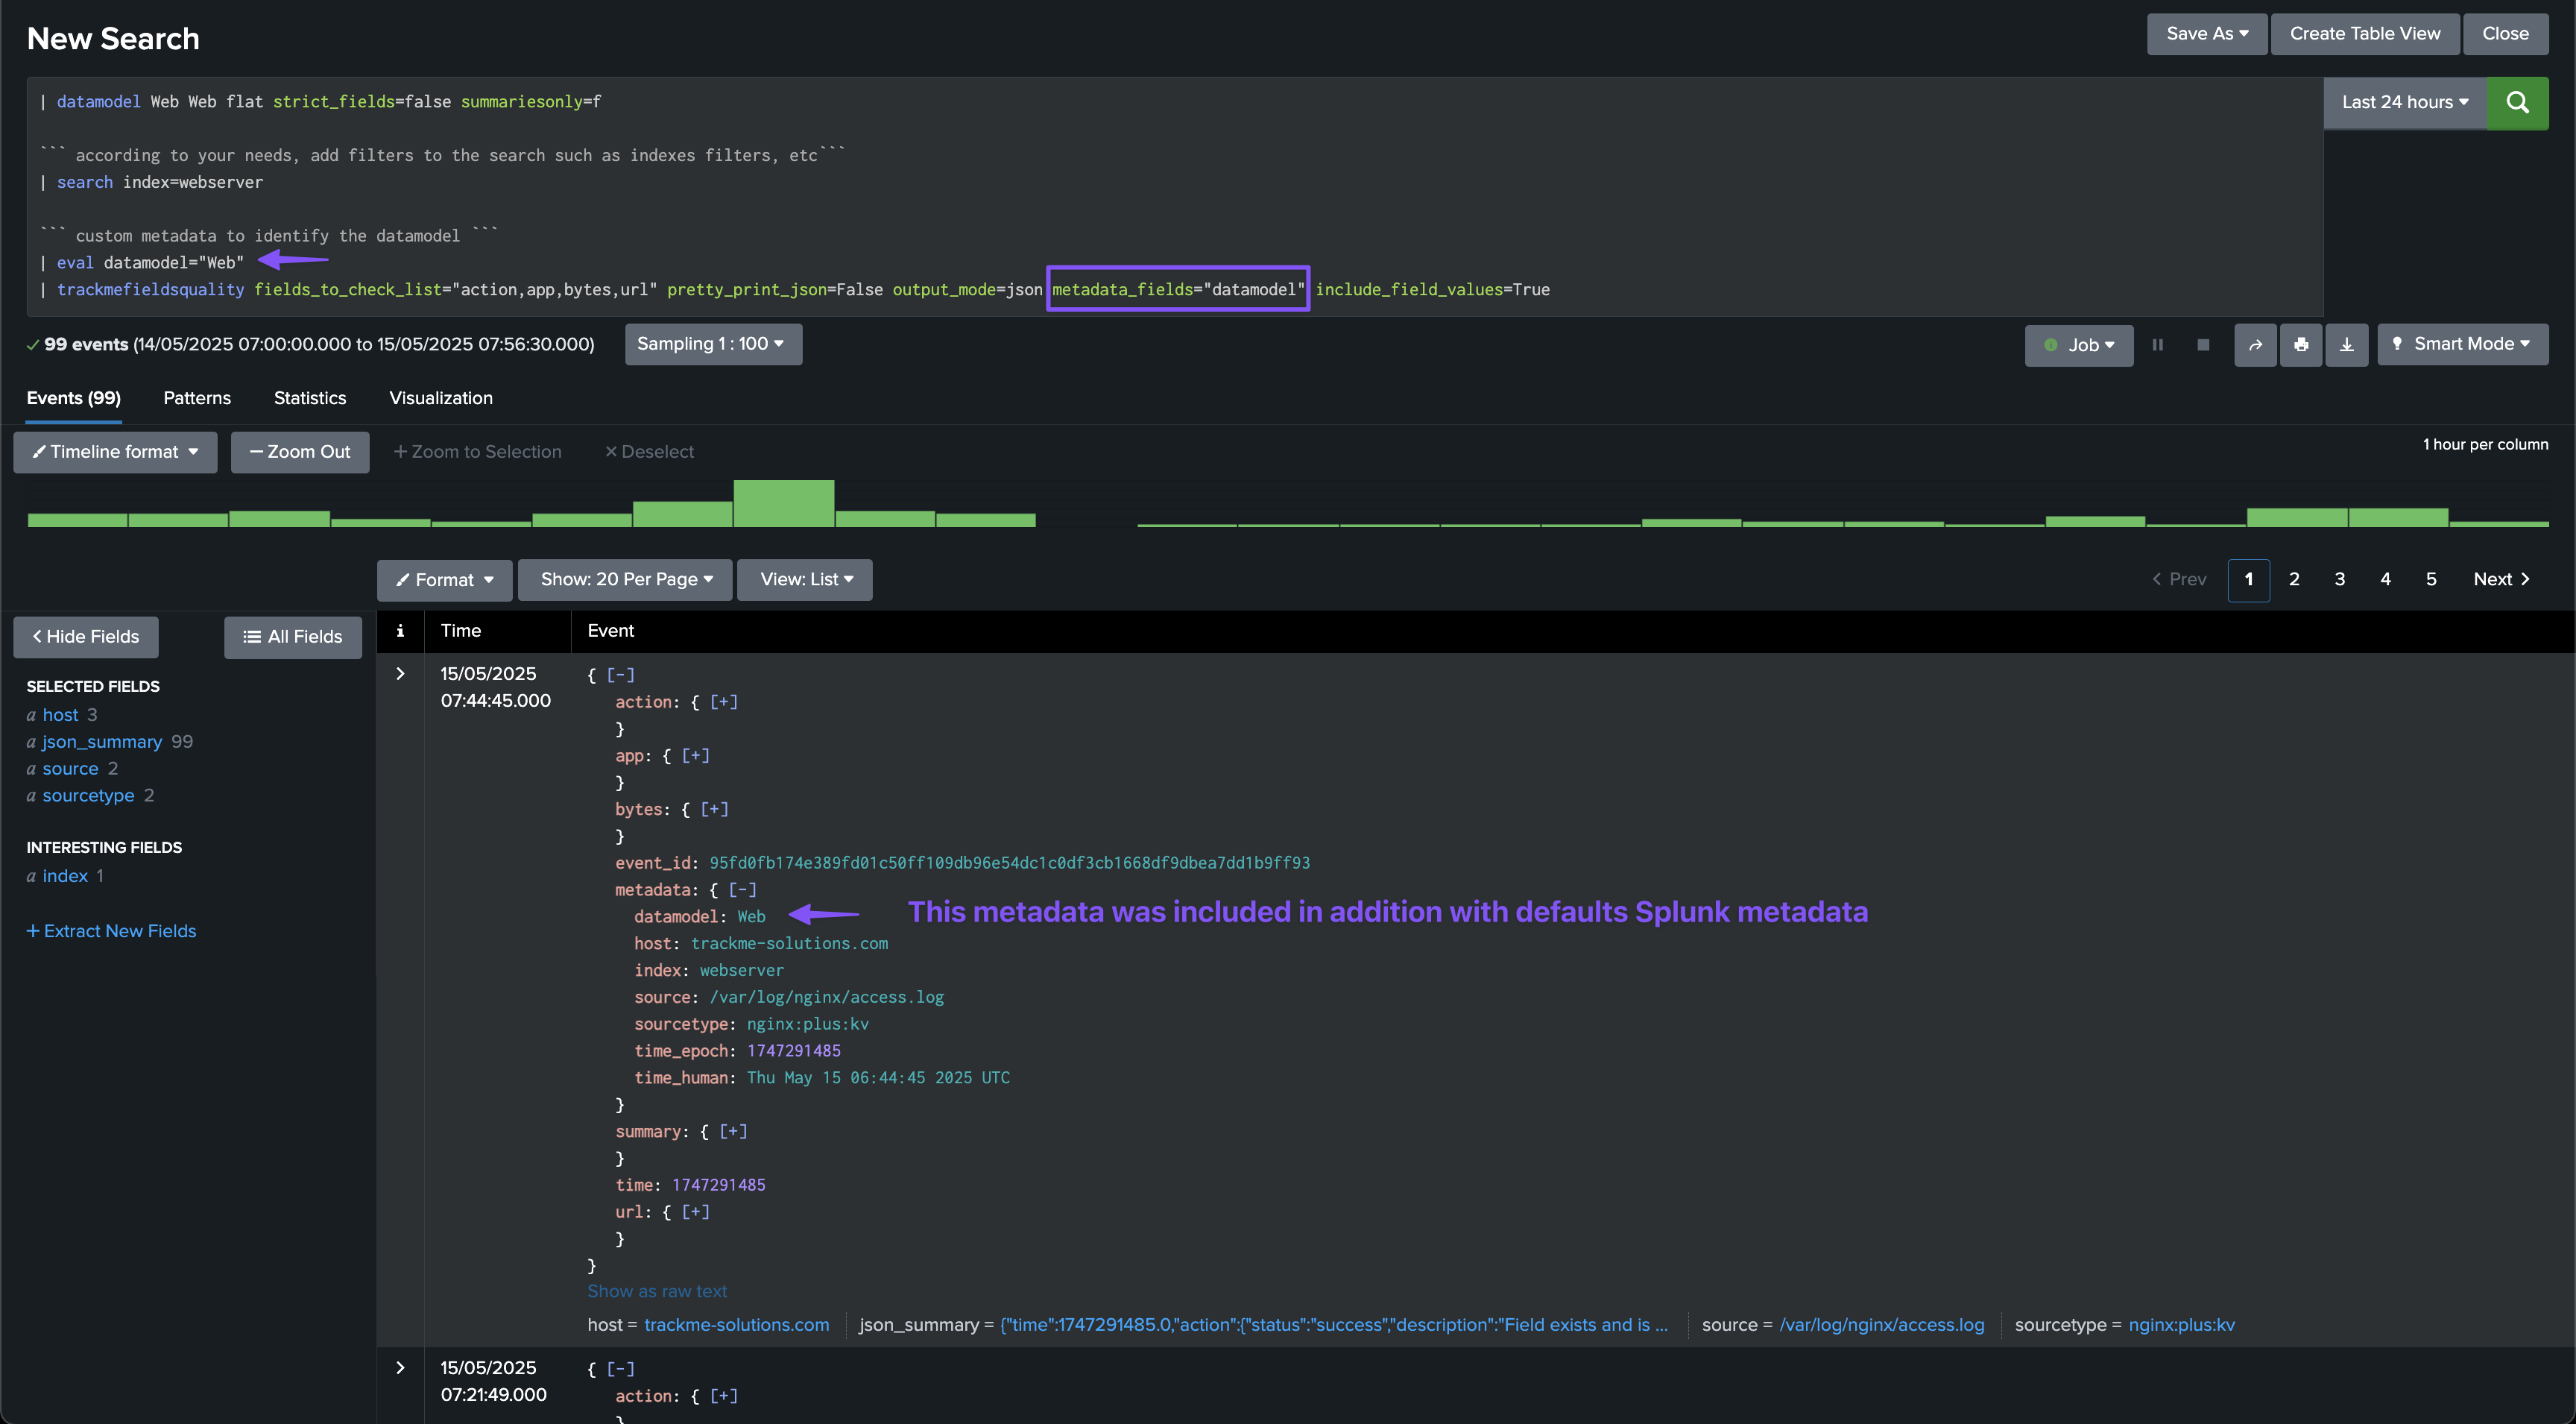
By defining the metadata_fields parameter, you can add additional fields to the JSON output, for instance the datamodel field which in our implementation is used to identify the data model of the event.
In our example, we are defining a field called datamodel using an eval which will be added to the JSON output:
| eval datamodel="Web"
| trackmefieldsquality fields_to_check_list="action,app,bytes,url" pretty_print_json=False output_mode=json metadata_fields="datamodel" include_field_values=True
Argument: summary_fieldname
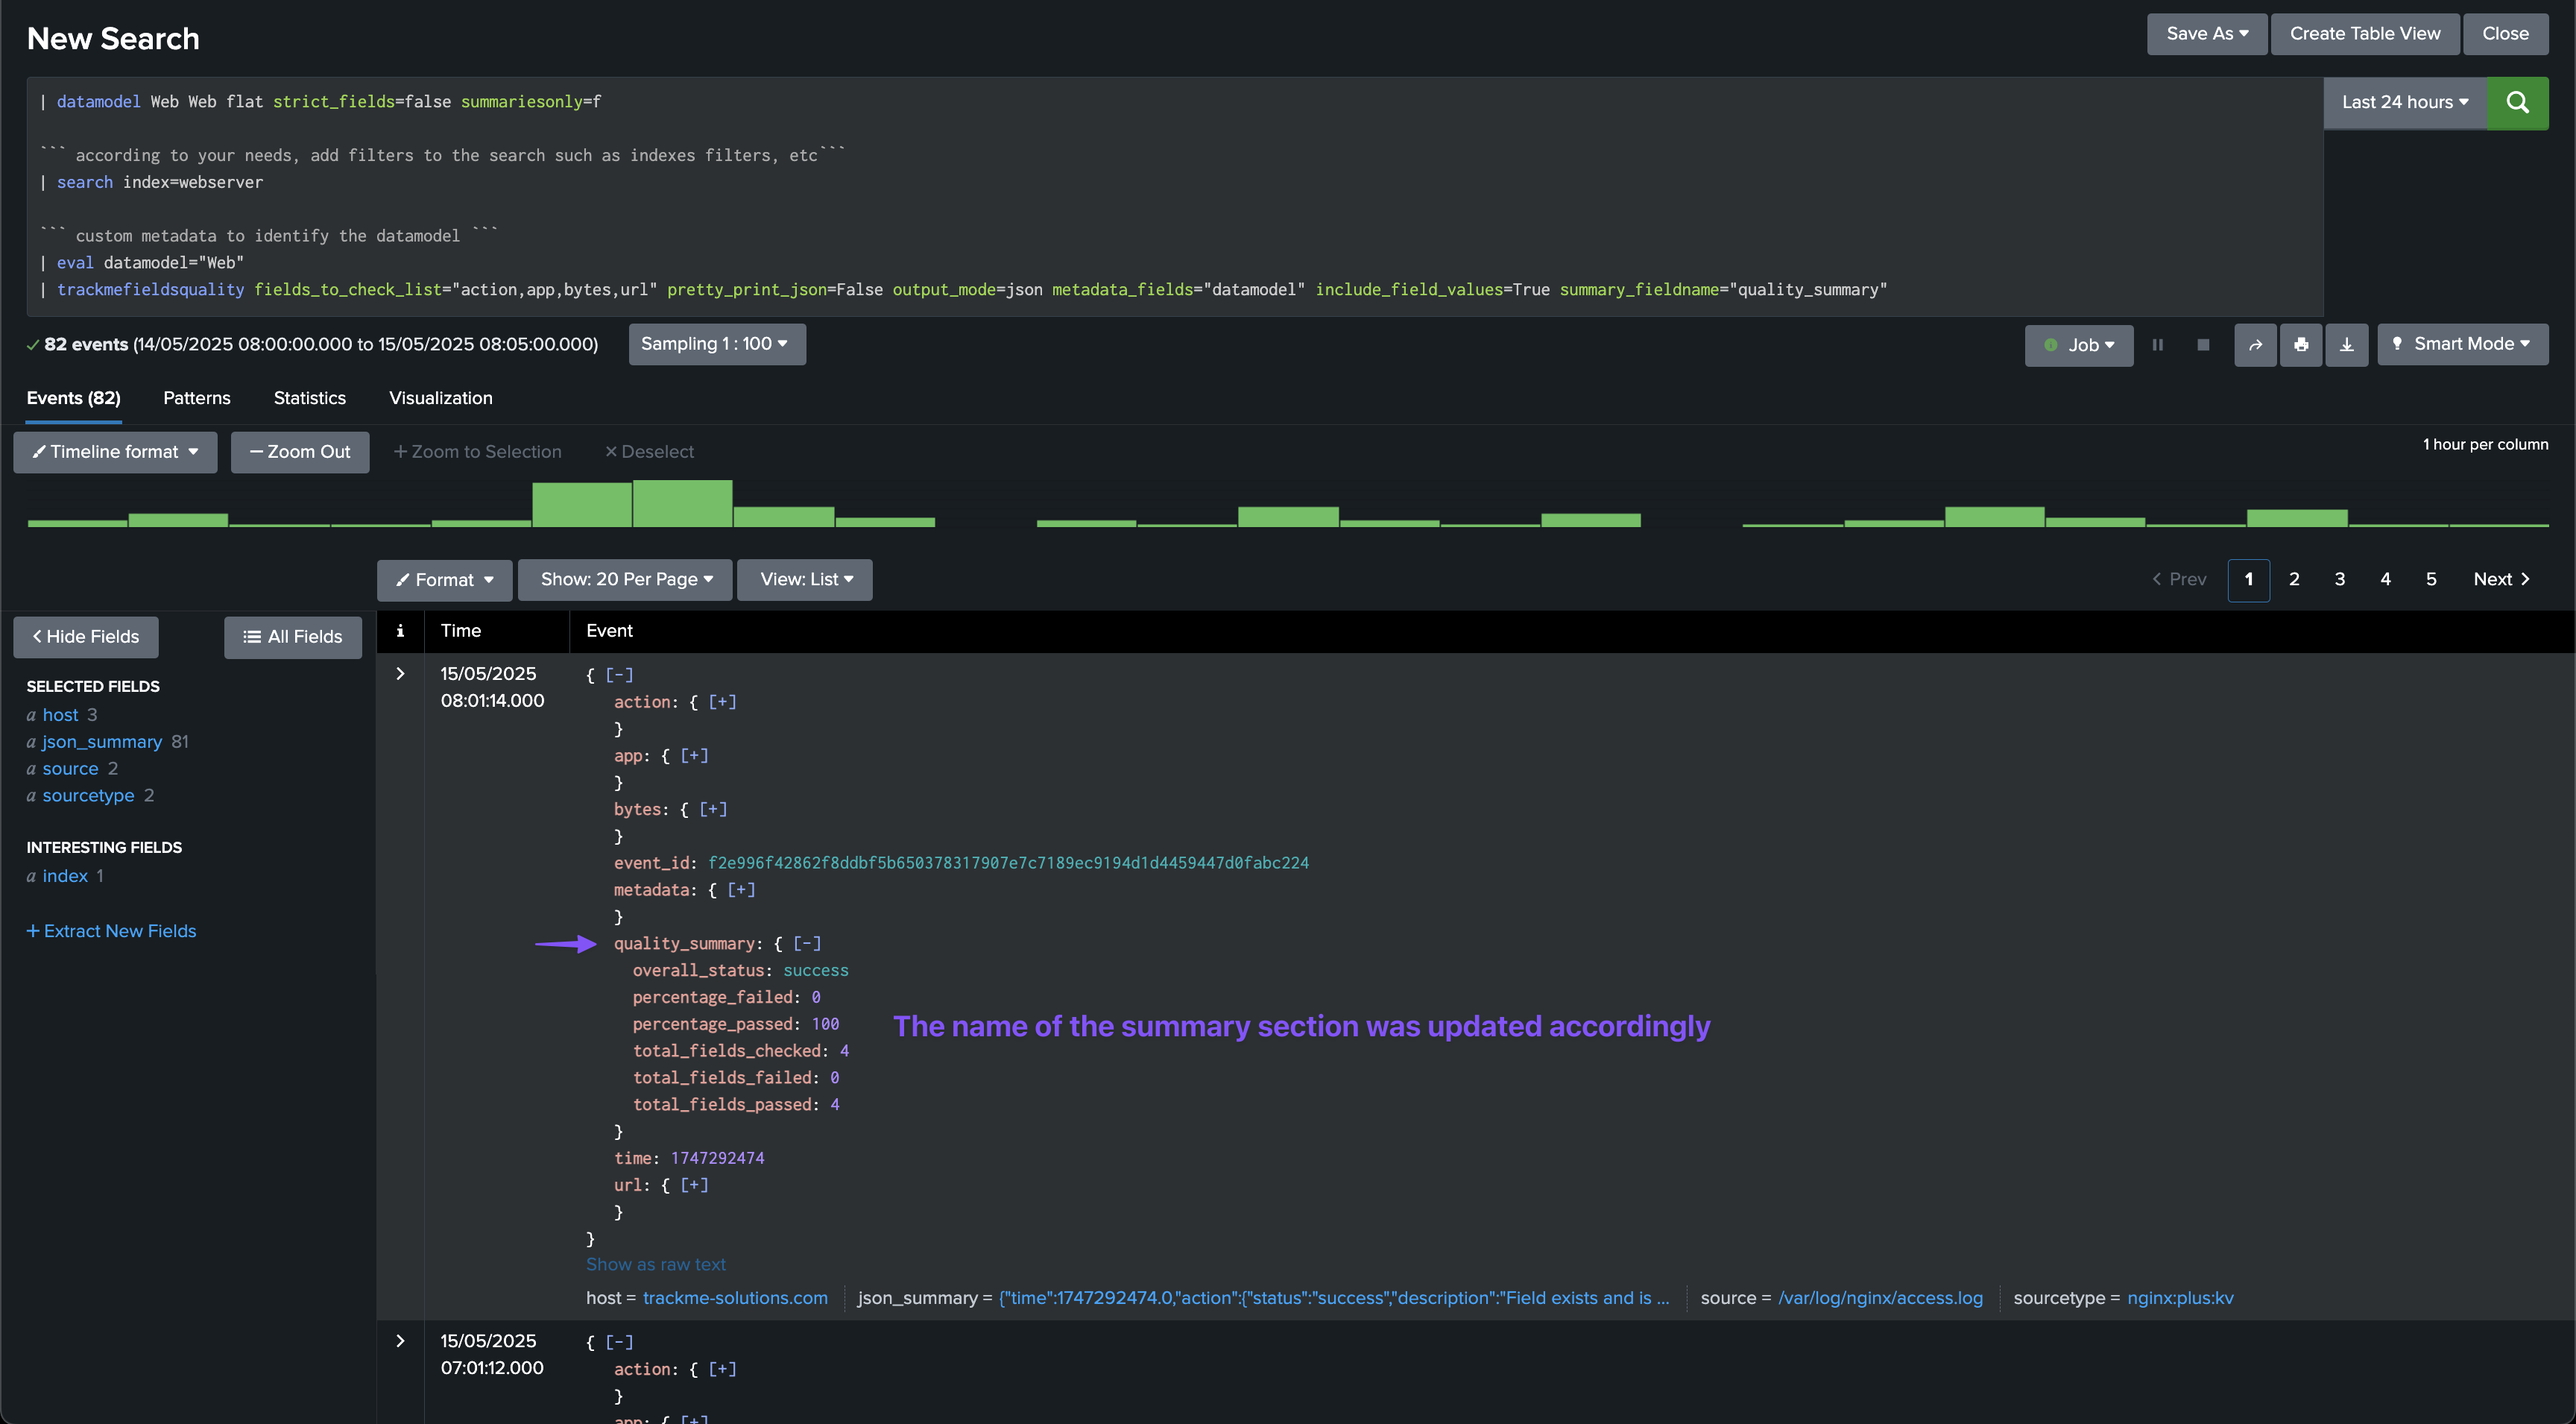
This option allows to specify the name of the summary field in the JSON output, this defaults to summary but can be customised if needed, for instance if there is a conflict with a field from the data model or events.
In this example, instead of summary, we use quality_summary:
| trackmefieldsquality fields_to_check_list="action,app,bytes,url" pretty_print_json=False output_mode=json metadata_fields="datamodel" include_field_values=True summary_fieldname="quality_summary"
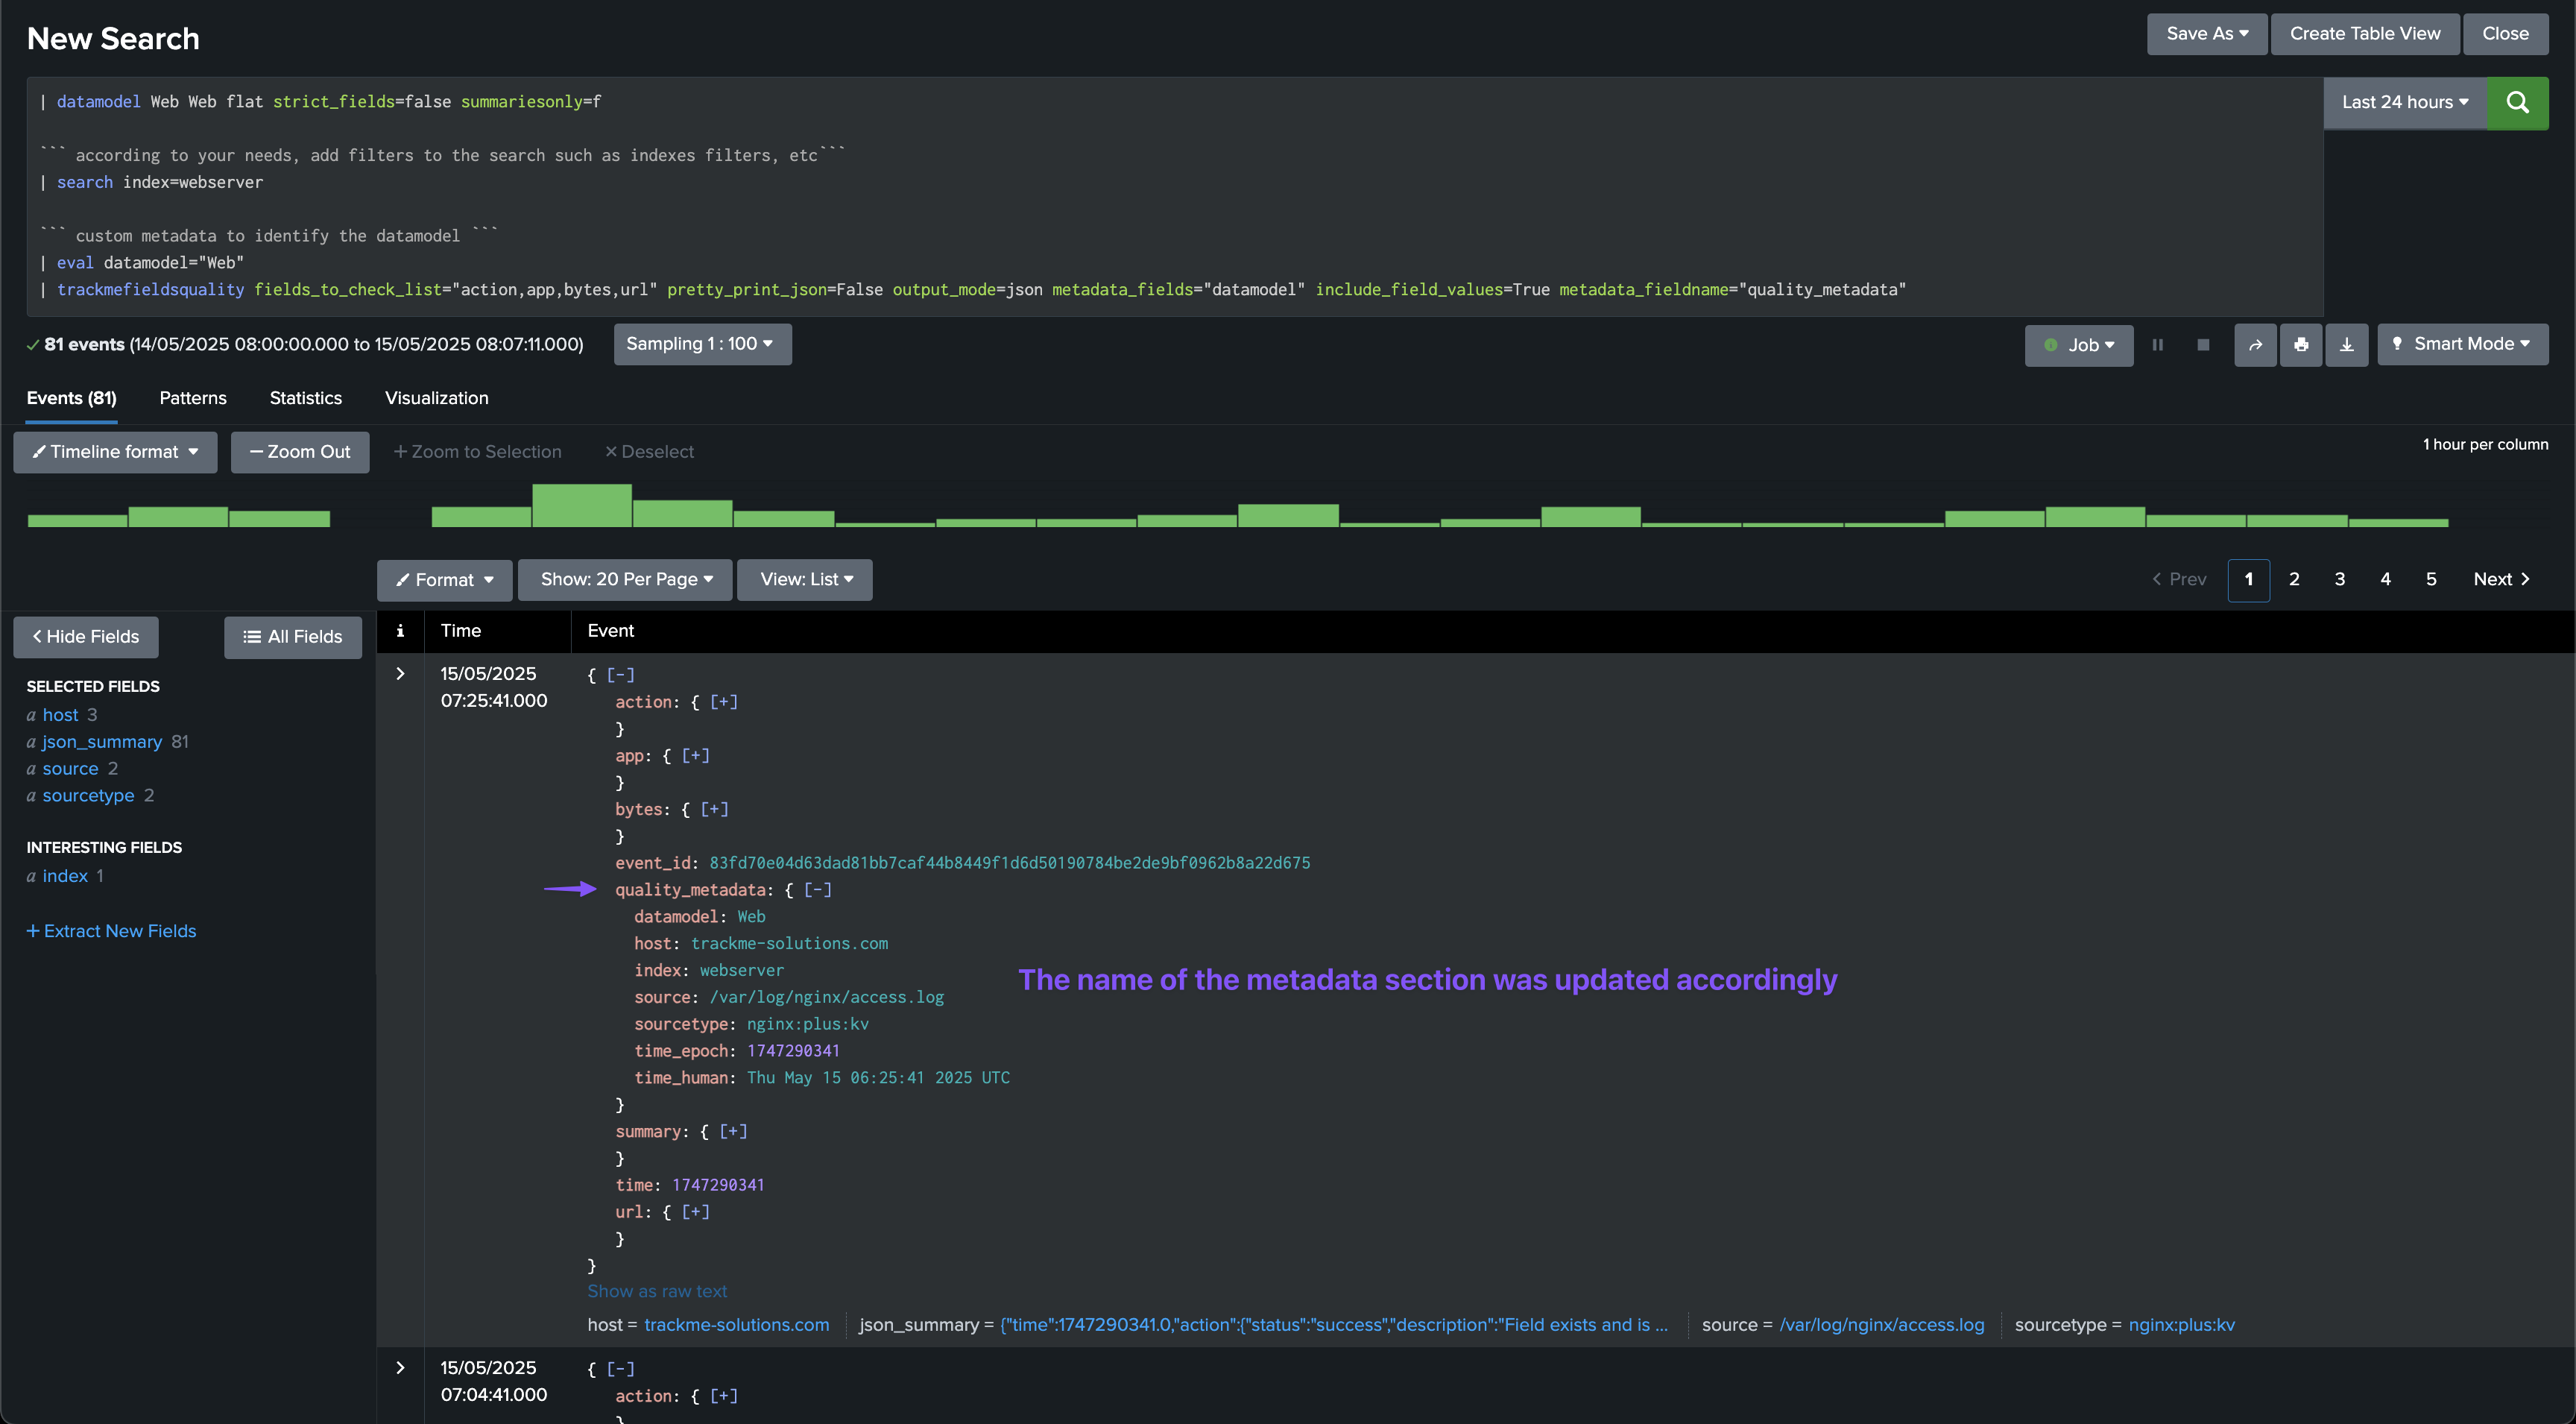
Argument: metadata_fieldname
This option allows to specify the name of the metadata field in the JSON output, this defaults to metadata but can be customised if needed, for instance if there is a conflict with a field from the data model or events.
In this example, instead of metadata, we use quality_metadata:
| trackmefieldsquality fields_to_check_list="action,app,bytes,url" pretty_print_json=False output_mode=json metadata_fields="datamodel" include_field_values=True metadata_fieldname="quality_metadata"
Annex: usage and options for the command trackmefieldsqualitygendict
The command trackmefieldsqualitygendict is used to generate JSON dictionary models for CIM data models, which can then be used with the trackmefieldsquality command for fields quality assessment.
The command accepts the following parameters:
argument |
description |
default |
example or valid values |
|---|---|---|---|
|
The name of the CIM data model to generate the dictionary for |
None (required) |
“Authentication”, “Web”, “Network_Traffic” |
|
Boolean option to only include recommended fields from the data model |
False |
True/False |
|
Boolean option to allow unknown field values |
False |
True/False |
|
Boolean option to allow empty or missing field values |
False |
True/False |
Usage:
| trackmefieldsqualitygendict datamodel=<datamodel name> show_only_recommended_fields=<boolean> allow_unknown=<boolean> allow_empty_or_missing=<boolean>
Examples:
Generate dictionary for Authentication data model with only recommended fields:
| trackmefieldsqualitygendict datamodel="Authentication" show_only_recommended_fields=true
Generate dictionary for Web data model with all fields and allow unknown values:
| trackmefieldsqualitygendict datamodel="Web" show_only_recommended_fields=false allow_unknown=true
Generate dictionary for Network_Traffic data model with only recommended fields and allow empty/missing values:
| trackmefieldsqualitygendict datamodel="Network_Traffic" show_only_recommended_fields=true allow_empty_or_missing=true
Generate dictionary for Authentication data model with all options enabled:
| trackmefieldsqualitygendict datamodel="Authentication" show_only_recommended_fields=true allow_unknown=true allow_empty_or_missing=true
Output:
The command generates a JSON dictionary that can be used with the trackmefieldsquality command. The output includes:
Field names as keys
Field configuration objects as values, including: -
name: The field name -regex: Optional regular expression pattern for validation -allow_unknown: Boolean flag to allow “unknown” values (can be overridden by the command parameter) -allow_empty_or_missing: Boolean flag to allow empty or missing values (can be overridden by the command parameter)
Example output for Web data model:
{
    "action": {
        "name": "action",
        "regex": "^(success|failure|allowed|blocked|deferred)$",
        "allow_unknown": false,
        "allow_empty_or_missing": false
    },
    "app": {
        "name": "app",
        "regex": "^[\\w:\\-\\d\\s]+$",
        "allow_unknown": false,
        "allow_empty_or_missing": false
    },
    "dest": {
        "name": "dest",
        "regex": "^[\\w\\.-]+$",
        "allow_unknown": false,
        "allow_empty_or_missing": false
    },
    "signature": {
        "name": "signature",
        "regex": "^.{3,100}$",
        "allow_unknown": false,
        "allow_empty_or_missing": false
    },
    "src": {
        "name": "src",
        "regex": "^[\\w\\.-]+$",
        "allow_unknown": false,
        "allow_empty_or_missing": false
    },
    "src_user": {
        "name": "src_user",
        "regex": "^[\\w\/\\\\\\-\\.$]{1,30}$",
        "allow_unknown": false,
        "allow_empty_or_missing": false
    },
    "user": {
        "name": "user",
        "regex": "^[\\w\/\\\\\\-\\.$]{1,30}$",
        "allow_unknown": false,
        "allow_empty_or_missing": false
    }
}
Integration with fields quality workflow:
This command is typically used in the first phase of the fields quality workflow to generate the dictionary models that will be stored in lookup tables and used by the collect scheduled searches:
| trackmefieldsqualitygendict datamodel=Authentication show_only_recommended_fields=True
| append [ | trackmefieldsqualitygendict datamodel=Web show_only_recommended_fields=True ]
| append [ | trackmefieldsqualitygendict datamodel=Network_Traffic show_only_recommended_fields=True ]
| table datamodel, json_dict
| trackmeprettyjson fields=json_dict
| outputlookup cim_datamodels_dict.csv
The generated lookup table can then be used in the collect scheduled searches:
| lookup cim_datamodels_dict.csv datamodel OUTPUT json_dict as quality_dict
| trackmefieldsquality fields_to_check_dict_fieldname="quality_dict" output_mode=json metadata_fields="datamodel,nodename" include_field_values=True
Annex: usage and options for the command trackmefieldsqualitygensummary
The command trackmefieldsqualitygensummary is used to generate a summary of the quality of fields in records that have been processed by the trackmefieldsquality command. This command is typically used in the monitoring phase to aggregate and summarize field quality data for reporting and analysis purposes.
The command accepts the following parameters:
argument |
description |
default |
example or valid values |
|---|---|---|---|
|
Max number of distinct values to report in field_values |
15 |
10, 20, 50 |
|
Format of field_values, either list or csv |
csv |
list, csv |
|
Comma-separated list of metadata fields to group by in addition to fieldname |
“” (empty) |
“metadata.datamodel,metadata.nodename,metadata.index,metadata.sourcetype” |
Usage:
| trackmefieldsqualitygensummary maxvals=<max number of distinct values to report> fieldvalues_format=<format of field_values, either list or csv> groupby_metadata_fields=<comma separated list of metadata fields to group by in addition to fieldname>
Examples:
Generate summary with default settings:
| trackmefieldsqualitygensummary
Generate summary with custom maxvals and list format:
| trackmefieldsqualitygensummary maxvals=20 fieldvalues_format=list
Generate summary with grouping by metadata fields:
| trackmefieldsqualitygensummary maxvals=15 fieldvalues_format=csv groupby_metadata_fields="metadata.datamodel,metadata.nodename,metadata.index,metadata.sourcetype"
Output:
The command generates a summary that includes:
fieldname: The name of the field being analyzed
total_events: Total number of events processed for this field
distinct_value_count: Number of distinct values found for this field
percent_coverage: Percentage of events where this field has a value
field_values: Summary of the most common values for this field (limited by maxvals)
Example output:
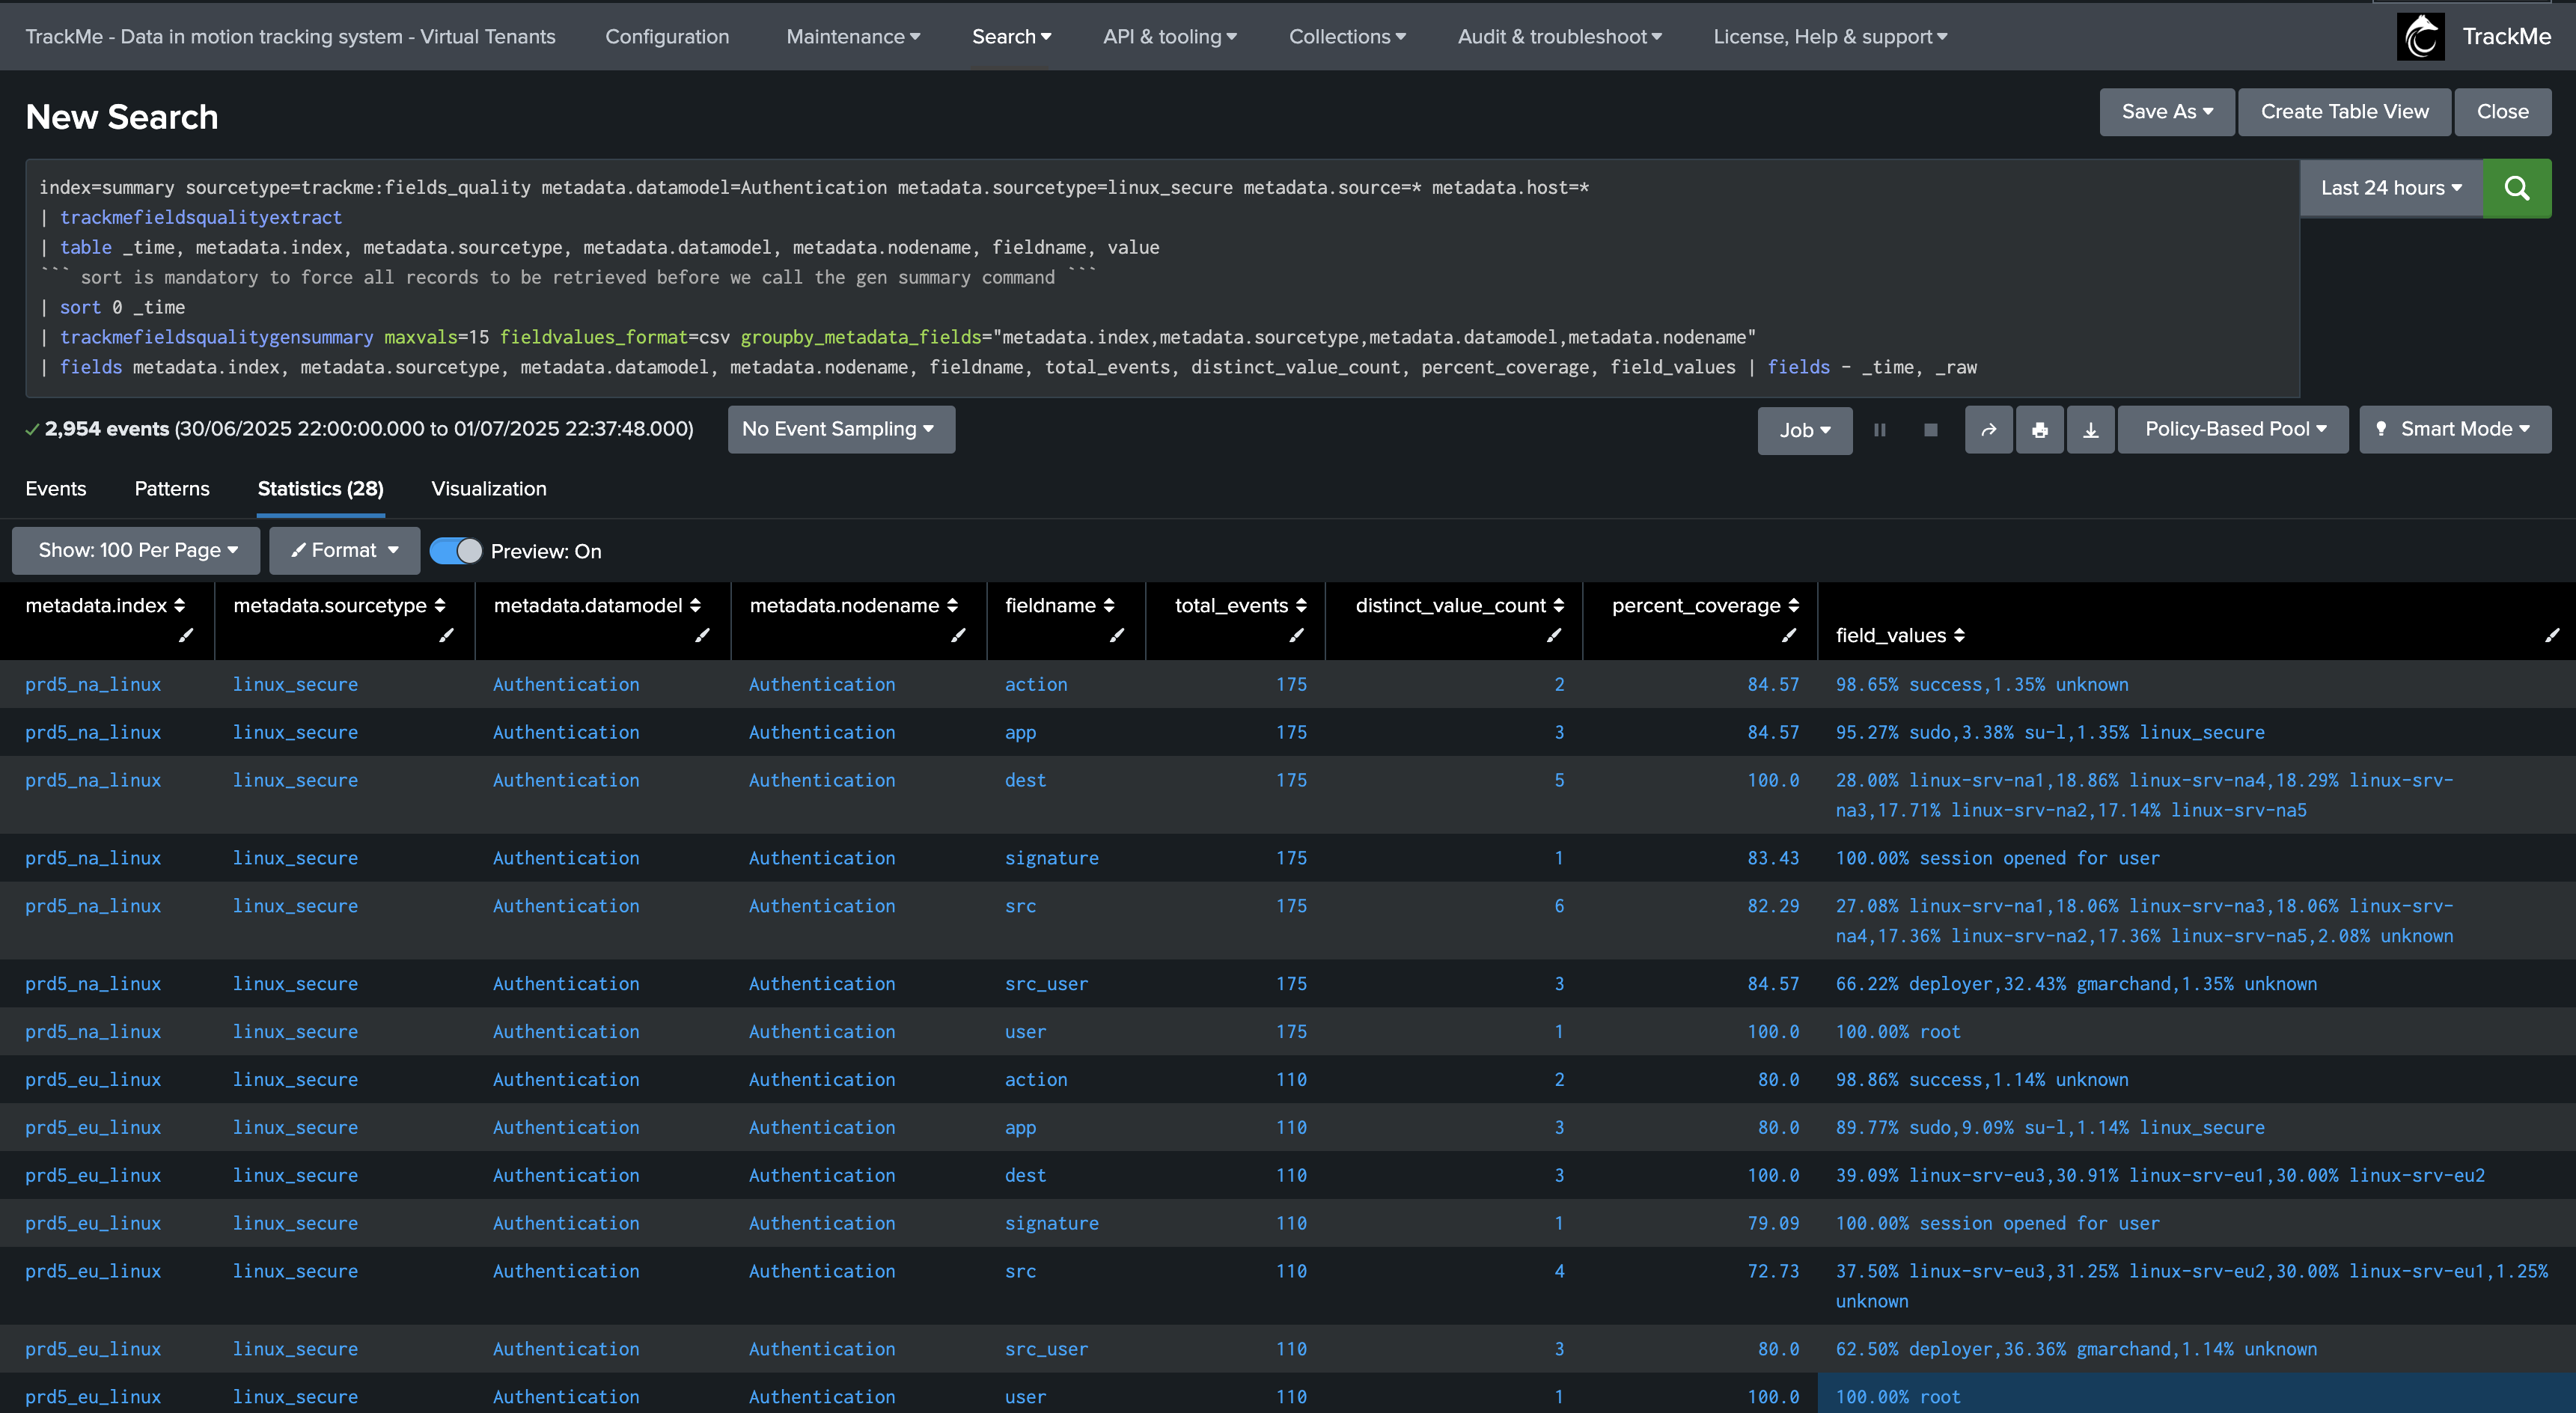
Example of field_values output:
The field_values column contains a summary of the most representative values for each field. For example:
CSV format: “98.65% success,1.35% unknown”
Note: the list format renders the same information but as a proper list, which will appear in Splunk as a multi-value field.
Integration with fields quality workflow:
This command is typically used in the monitoring phase, specifically within the Flex Object tracker SPL logic to generate summaries of field quality data:
| search index=summary sourcetype=trackme:fields_quality metadata.sourcetype=* metadata.source=* metadata.host=*
| trackmefieldsqualityextract
| table _time, metadata.index, metadata.sourcetype, metadata.datamodel, metadata.nodename, fieldname, value
| sort 0 _time
| trackmefieldsqualitygensummary maxvals=15 fieldvalues_format=csv groupby_metadata_fields="metadata.index,metadata.sourcetype,metadata.datamodel,metadata.nodename"
The output from this command is then used to populate the extra_attributes field in the Flex Object tracker, providing detailed field quality information for each entity.
Argument: maxvals
This option controls the maximum number of distinct values to report in the field_values column. This is useful for limiting the output size while still providing meaningful insights into the most common values for each field.
Example:
| trackmefieldsqualitygensummary maxvals=10
This would limit the field_values output to show only the top 10 most common values for each field.
Argument: fieldvalues_format
This option controls the format of the field_values output. Two formats are supported:
csv: Comma-separated values format (default)
list: List format with percentages in parentheses
CSV format example: “98.65% success,1.35% unknown”
List format example: “success (98.65%), unknown (1.35%)”
Example:
| trackmefieldsqualitygensummary fieldvalues_format=list
Argument: groupby_metadata_fields
This option allows grouping the summary by additional metadata fields beyond the default fieldname grouping. This is particularly useful when you want to analyze field quality across different dimensions such as data models, nodes, indexes, or sourcetypes.
Example:
| trackmefieldsqualitygensummary groupby_metadata_fields="metadata.datamodel,metadata.nodename,metadata.index,metadata.sourcetype"
This would generate separate summaries for each combination of datamodel, nodename, index, and sourcetype, allowing for more granular analysis of field quality across different contexts.
Integration example in Flex Object tracker:
In the Flex Object tracker source code, this command is used to generate detailed field summaries that are stored in the entity’s extra_attributes:
| join type=outer metadata.index, metadata.sourcetype, metadata.datamodel, metadata.nodename, fieldname [ search index=summary sourcetype=trackme:fields_quality metadata.sourcetype=* metadata.source=* metadata.host=*
| trackmefieldsqualityextract
| table _time, metadata.index, metadata.sourcetype, metadata.datamodel, metadata.nodename, fieldname, value
| sort 0 _time
| trackmefieldsqualitygensummary maxvals=15 fieldvalues_format=csv groupby_metadata_fields="metadata.index,metadata.sourcetype,metadata.datamodel,metadata.nodename"
| fields metadata.index, metadata.sourcetype, metadata.datamodel, metadata.nodename, fieldname, total_events, distinct_value_count, percent_coverage, field_values, regex_expression | fields - _time, _raw
You can for example run this search to get the percentage of coverage for the field “action” in the datamodel Network_Traffic and nodename All_Traffic, for the sourcetype cisco:asa:
index=summary sourcetype=trackme:fields_quality metadata.datamodel=Network_Traffic metadata.nodename=All_Traffic metadata.sourcetype=cisco:asa metadata.source=* metadata.host=*
| table _time, _raw
| trackmefieldsqualityextract

| table _time, metadata.index, metadata.sourcetype, metadata.datamodel, metadata.nodename, fieldname, value, regex_expression
``` sort is mandatory to force all records to be retrieved before we call the gen summary command ```
| sort 0 _time
| trackmefieldsqualitygensummary maxvals=15 fieldvalues_format=csv groupby_metadata_fields="metadata.index,metadata.sourcetype,metadata.datamodel,metadata.nodename"
| fields metadata.index, metadata.sourcetype, metadata.datamodel, metadata.nodename, fieldname, total_events, distinct_value_count, percent_coverage, field_values, regex_expression | fields - _time, _raw

| where fieldname="action"
This would be equivalent to run the following search:
index=summary sourcetype=trackme:fields_quality metadata.datamodel=Network_Traffic metadata.nodename=All_Traffic metadata.sourcetype=cisco:asa metadata.source=* metadata.host=* | head 100
| table _time, _raw
| trackmefieldsqualityextract
| table _time, metadata.index, metadata.sourcetype, metadata.datamodel, metadata.nodename, fieldname, value, is_empty, is_missing

| where fieldname="action"

| stats count, count(eval(is_empty=0 AND is_missing=0)) as count_covered, count(eval(is_empty=1 OR is_missing=1)) as count_not_covered
| eval percentage_covered=count_covered/count*100
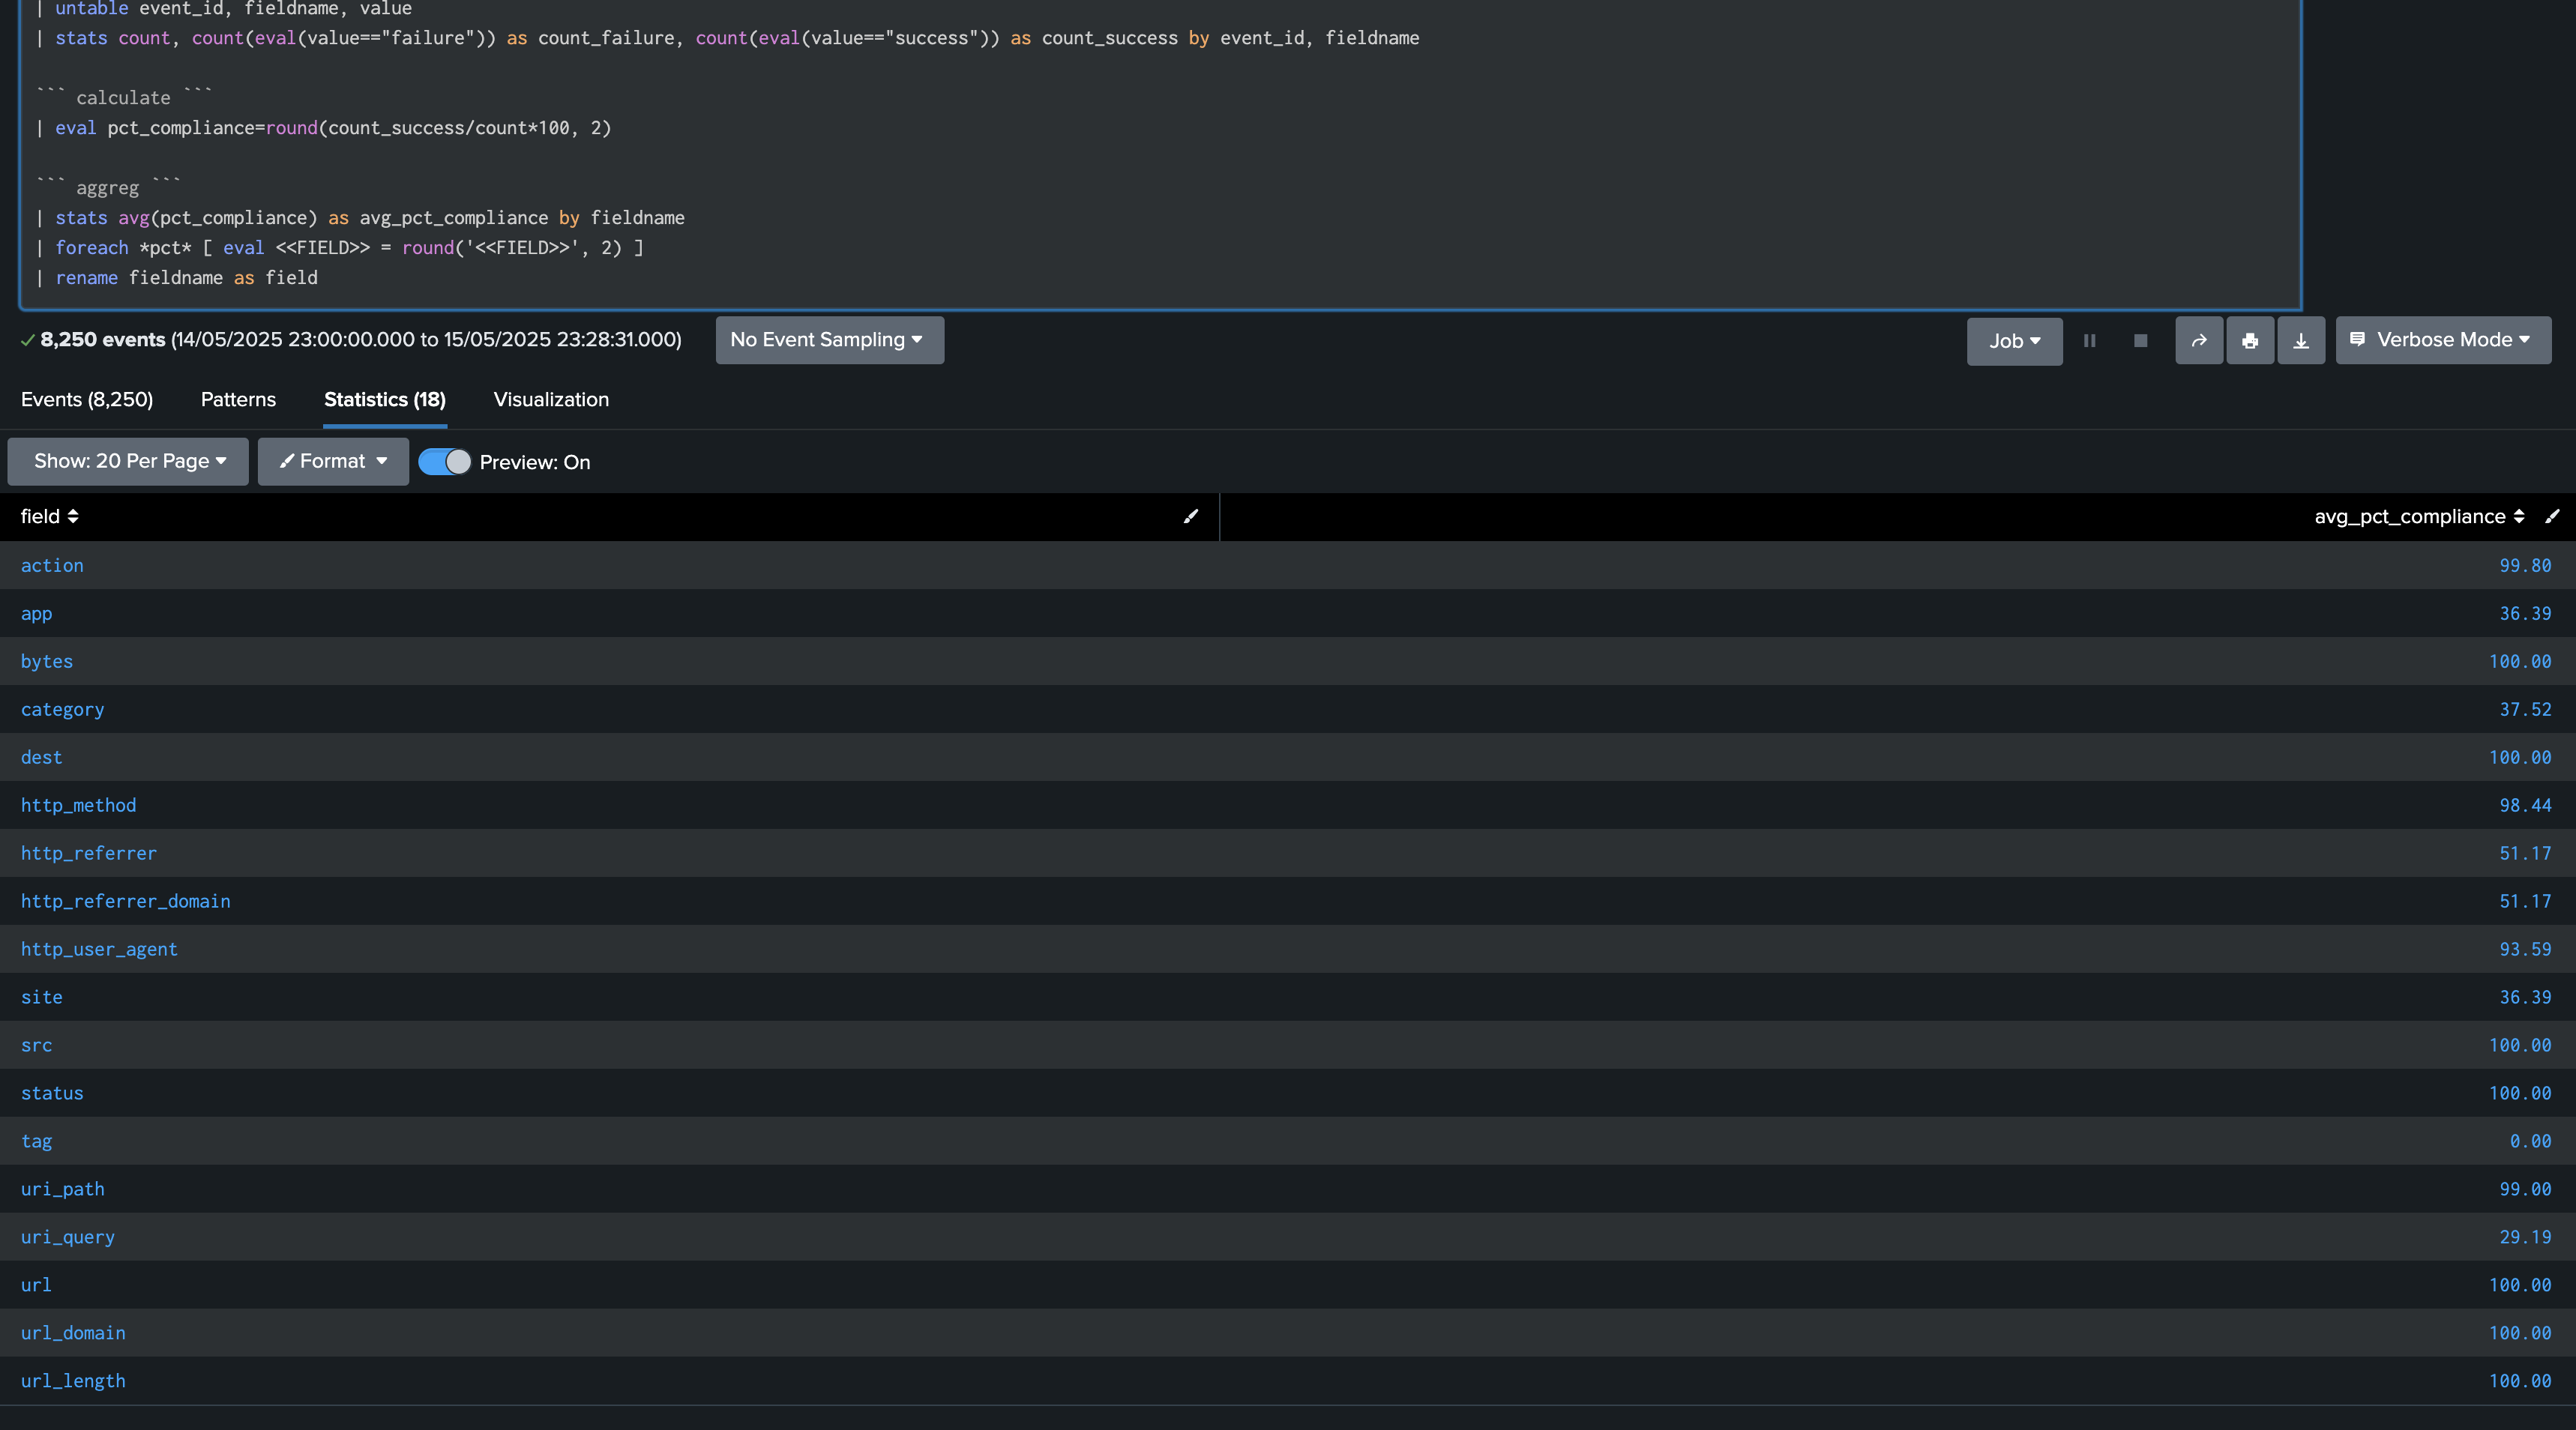
Annex: Per field table statistics
The following search example shows the statistics per field:
index=summary sourcetype=trackme:fields_quality
``` you can filter our metadata fields to focus on a specific sourcetype, index, etc...```
| search metadata.datamodel="Web"

``` stats ```
| fields - summary.* metadata.*
| stats first(*status) as "*status" by event_id
| rename "*.status" as "*"

``` untable ```
| untable event_id, fieldname, value
| stats count, count(eval(value=="failure")) as count_failure, count(eval(value=="success")) as count_success by event_id, fieldname

``` calculate ```
| eval pct_compliance=round(count_success/count*100, 2)

``` aggreg ```
| stats avg(pct_compliance) as avg_pct_compliance by fieldname
| foreach *pct* [ eval <<FIELD>> = round('<<FIELD>>', 2) ]
| rename fieldname as field
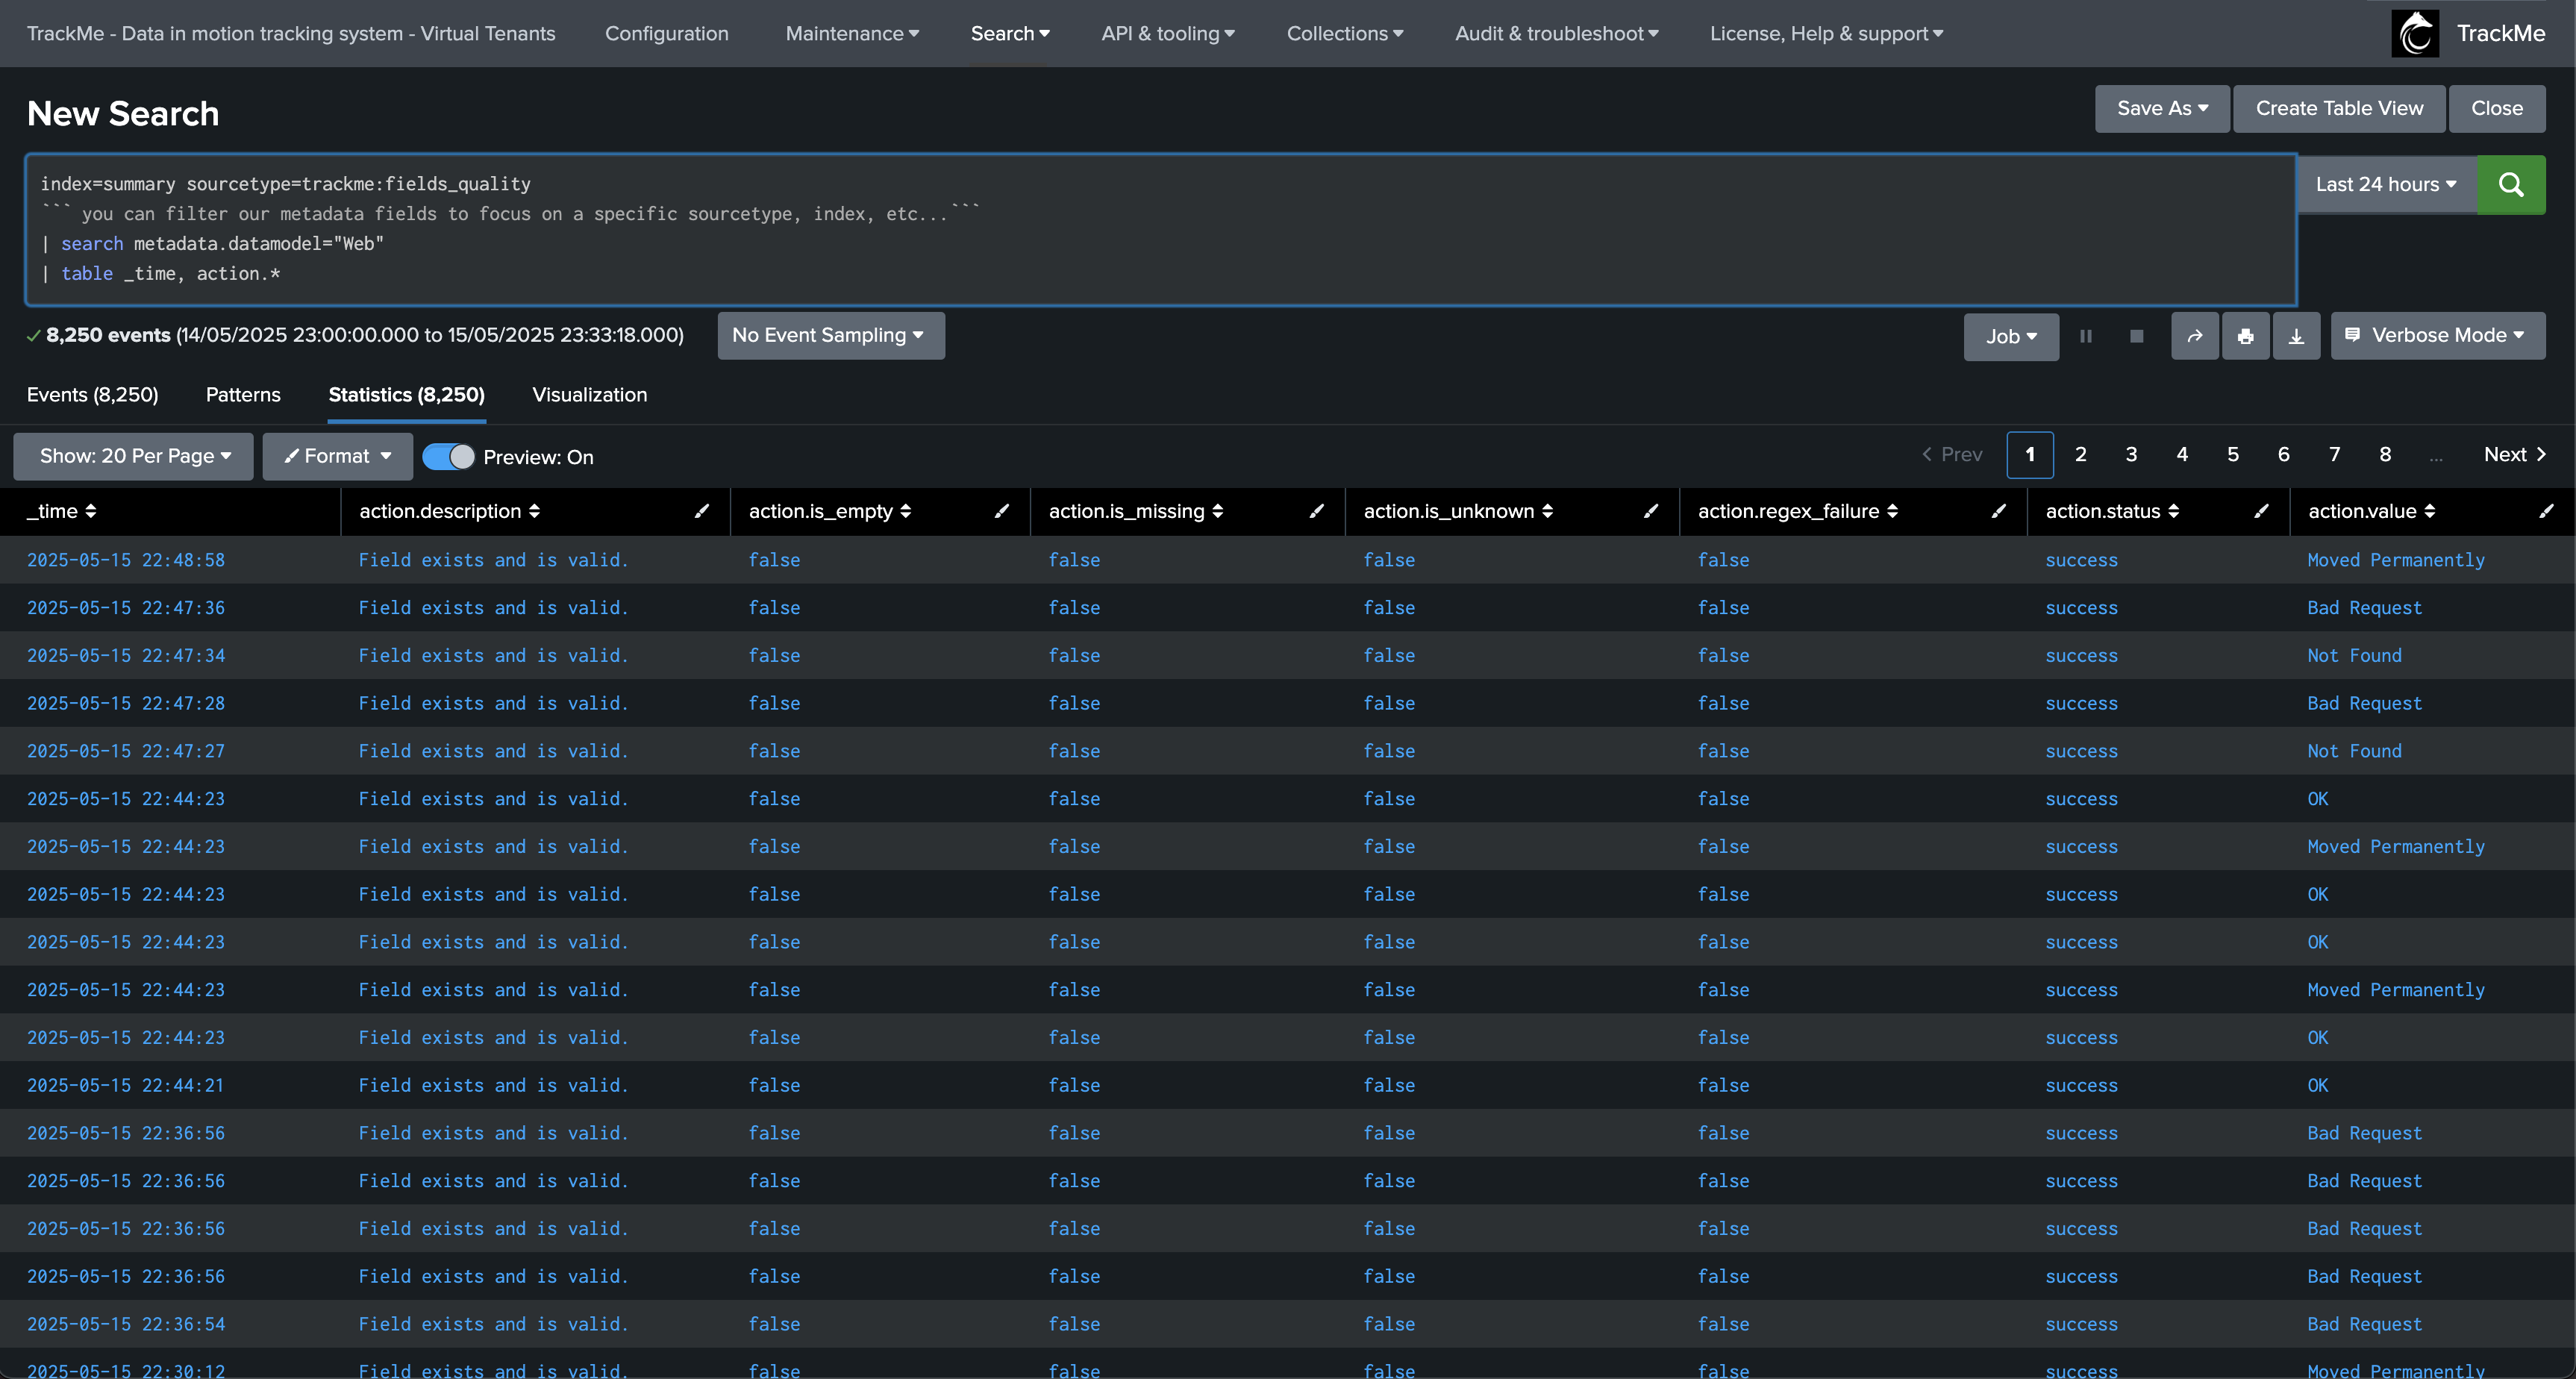
Annex: Looking after a specific field
The following search example shows the statistics per field:
index=summary sourcetype=trackme:fields_quality
``` you can filter our metadata fields to focus on a specific sourcetype, index, etc...```
| search metadata.datamodel="Web"
| table _time, action.*
Annex: Flex Object tracker SPL logic
The following search example shows the Flex Object tracker SPL logic:
index=summary sourcetype=trackme:fields_quality metadata.sourcetype=* metadata.source=* metadata.host=*
| table _time, _raw
| trackmefieldsqualityextract

| stats count as count_total, count(eval(status=="success")) as count_success, count(eval(status=="failure")) as count_failure by fieldname, metadata.index, metadata.sourcetype, metadata.datamodel, metadata.nodename
| eval percentage_success=round(count_success/count_total*100, 2)

``` set the threshold per field, this defines if the field is considered as passed or failed globally, this threshold has to be part of the SPL logic ```
| eval threshold=99

``` flag field ```
| eval fieldstatus=if(percentage_success>=threshold, "success", "failure")

``` join field summary ```
| join type=outer metadata.index, metadata.sourcetype, metadata.datamodel, metadata.nodename, fieldname [ search index=summary sourcetype=trackme:fields_quality metadata.sourcetype=* metadata.source=* metadata.host=*
| trackmefieldsqualityextract
| table _time, metadata.index, metadata.sourcetype, metadata.datamodel, metadata.nodename, fieldname, value, regex_expression
``` sort is mandatory to force all records to be retrieved before we call the gen summary command ```
| sort 0 _time
| trackmefieldsqualitygensummary maxvals=15 fieldvalues_format=csv groupby_metadata_fields="metadata.index,metadata.sourcetype,metadata.datamodel,metadata.nodename"
| fields metadata.index, metadata.sourcetype, metadata.datamodel, metadata.nodename, fieldname, total_events, distinct_value_count, percent_coverage, field_values, regex_expression | fields - _time, _raw
]

``` generate the per field json for reporting purposes, we also rename fieldname to @fieldname so it appears first in the JSON ```
| rename fieldname as @fieldname, fieldstatus as @fieldstatus
| tojson
| rename _raw as per_field_json

``` calculate ```
| stats values(eval(if('@fieldstatus'=="success", '@fieldname', null()))) as list_fields_passed, values(eval(if('@fieldstatus'=="failure", '@fieldname', null()))) as list_fields_failed, values(per_field_json) as per_field_json, max(total_events) as total_events_parsed by metadata.index, metadata.sourcetype, metadata.datamodel, metadata.nodename

``` format the per_field_json ```
| eval per_field_json = "[" . mvjoin(per_field_json, ", ") . "]"

``` build the list of fields that passed and failed ```
| eval all_fields = mvappend(list_fields_failed, list_fields_passed)
| eval all_fields = mvdedup(all_fields)
| eval final_state = mvmap(
all_fields,
if(
mvfind(list_fields_failed, "^" . all_fields . "$") >= 0,
all_fields . "|failed",
all_fields . "|success"
)
)
| eval success_fields = mvfilter(match(final_state, "\|success$"))
| eval failed_fields = mvfilter(match(final_state, "\|failed$"))
| eval success_fields = mvmap(success_fields, mvindex(split(success_fields, "|"), 0))
| eval failed_fields  = mvmap(failed_fields,  mvindex(split(failed_fields, "|"), 0))
| fields - final_state
| eval success_fields=if(isnull(success_fields), "", success_fields), failed_fields=if(isnull(failed_fields), "", failed_fields)
| fields - list_fields_passed, list_fields_failed

``` calculate ```
| eventstats dc(all_fields) as total_fields_checked, dc(success_fields) as total_fields_passed, dc(failed_fields) as total_fields_failed by metadata.index, metadata.sourcetype, metadata.datamodel, metadata.nodename
| eval percentage_passed=round(total_fields_passed/total_fields_checked*100, 2), percentage_failed=round(total_fields_failed/total_fields_checked*100, 2)

``` rename ```
| rename metadata.* as "*"

``` save this as parts of extra attributes ```
| eval extra_attributes = "{" . "\"success_fields\": \"" . mvjoin(success_fields, ",") . "\", \"failed_fields\": \"" . mvjoin(failed_fields, ",") . "\", " . "\"fields\":" . per_field_json . "}"
| fields - per_field_json

``` set principal metadata for the flex entity ```
| eval group = datamodel
| eval object = nodename . ":" . index . ":" . sourcetype, alias=index . ":" . sourcetype
| eval object_description = "CIM Quality for DM: " . datamodel . ":" . nodename . ", index:" . index . ", sourcetype:" . sourcetype

``` gen metrics ```
| eval metrics = "{" .
"\"fields_quality.percentage_passed\": " . if(isnum(percentage_passed), percentage_passed, 0) . ", " .
"\"fields_quality.percentage_failed\": " . if(isnum(percentage_failed), percentage_failed, 0) . ", " .
"\"fields_quality.total_fields_checked\": " . if(isnum(total_fields_checked), total_fields_checked, 0) . ", " .
"\"fields_quality.total_fields_failed\": " . if(isnum(total_fields_failed), total_fields_failed, 0) . ", " .
"\"fields_quality.total_fields_passed\": " . if(isnum(total_fields_passed), total_fields_passed, 0) . ", " .
"\"fields_quality.total_events_parsed\": " . if(isnum(total_events_parsed), total_events_parsed, 0) . "}"

``` no outliers for now ```
| eval outliers_metrics="{}"

``` basic status, thresholds can be defined on a per entity basis ```
| eval status=1
| eval status_description="DM Quality: " . metrics
| eval status_description_short="% passed: " . percentage_passed . ", checked: " . total_fields_checked . ", passed: " . total_fields_passed . ", failed: " . total_fields_failed

``` this sets a default threshold, which can then be overriden on a per entity basis via the TrackMe UI ```
| eval default_threshold = "{'metric_name': 'fields_quality.percentage_passed', 'operator': '>=', 'value': 95, 'condition_true': 1}"

```alert if inactive for more than 2 days```
| eval max_sec_inactive=86400*2
Annex: Understanding & troubleshooting the percentage of success
The percentage of success is calculated by the main Flex tracker SPL logic, it represents the percentage of times the field is passing the quality check, a field is considered as passing the quality check if:
is_empty: falseis_null: falseis_unknown: false(depending on if a dictionary is used and if in the dictionary and for this field, unknown is allowed or not)regex_failure: false(depending on if a dictionary is used and if there is a regex expression for this field)
index=summary sourcetype=trackme:fields_quality metadata.sourcetype=* metadata.source=* metadata.host=*
| table _time, _raw
| trackmefieldsqualityextract

| stats count as count_total, count(eval(status=="success")) as count_success, count(eval(status=="failure")) as count_failure by fieldname, metadata.index, metadata.sourcetype, metadata.datamodel, metadata.nodename
| eval percentage_success=round(count_success/count_total*100, 2)
In this example, we are looking at the percentage of success for the field “action” in the datamodel Network_Traffic and nodename All_Traffic, for the sourcetype cisco:asa:
index=summary sourcetype=trackme:fields_quality metadata.datamodel=Network_Traffic metadata.nodename=All_Traffic metadata.sourcetype=cisco:asa metadata.source=* metadata.host=*
| table _time, _raw
| trackmefieldsqualityextract

| stats values(value) as values, values(regex_expression) as regex_expression, count as count_total, count(eval(status=="success")) as count_success, count(eval(status=="failure")) as count_failure by fieldname, metadata.index, metadata.sourcetype, metadata.datamodel, metadata.nodename
| eval percentage_success=round(count_success/count_total*100, 2)

``` set the threshold per field, this defines if the field is considered as passed or failed globally, this threshold has to be part of the SPL logic ```
| eval threshold=99

``` flag field ```
| eval fieldstatus=if(percentage_success>=threshold, "success", "failure")

| where fieldname="action"
Annex: Understanding and troubleshooting the percentage of coverage and others summary information per field
The percentage of coverage is reported by the trackmefieldsqualitygensummary command, it represents the percentage of events where the field has a value, that is not null and not empty. (it is for instance present equally in the CIM Vladiator table)
In the Flex tracker, this is the join part:
search index=summary sourcetype=trackme:fields_quality metadata.sourcetype=* metadata.source=* metadata.host=*
| trackmefieldsqualityextract
| table _time, metadata.index, metadata.sourcetype, metadata.datamodel, metadata.nodename, fieldname, value, regex_expression
``` sort is mandatory to force all records to be retrieved before we call the gen summary command ```
| sort 0 _time
| trackmefieldsqualitygensummary maxvals=15 fieldvalues_format=csv groupby_metadata_fields="metadata.index,metadata.sourcetype,metadata.datamodel,metadata.nodename"
| fields metadata.index, metadata.sourcetype, metadata.datamodel, metadata.nodename, fieldname, total_events, distinct_value_count, percent_coverage, field_values, regex_expression | fields - _time, _raw
You can for example run this search to get the percentage of coverage for the field “action” in the datamodel Network_Traffic and nodename All_Traffic, for the sourcetype cisco:asa:
index=summary sourcetype=trackme:fields_quality metadata.datamodel=Network_Traffic metadata.nodename=All_Traffic metadata.sourcetype=cisco:asa metadata.source=* metadata.host=*
| table _time, _raw
| trackmefieldsqualityextract

| table _time, metadata.index, metadata.sourcetype, metadata.datamodel, metadata.nodename, fieldname, value, regex_expression
``` sort is mandatory to force all records to be retrieved before we call the gen summary command ```
| sort 0 _time
| trackmefieldsqualitygensummary maxvals=15 fieldvalues_format=csv groupby_metadata_fields="metadata.index,metadata.sourcetype,metadata.datamodel,metadata.nodename"
| fields metadata.index, metadata.sourcetype, metadata.datamodel, metadata.nodename, fieldname, total_events, distinct_value_count, percent_coverage, field_values, regex_expression | fields - _time, _raw

| where fieldname="action"
This would be equivalent to run the following search:
index=summary sourcetype=trackme:fields_quality metadata.datamodel=Network_Traffic metadata.nodename=All_Traffic metadata.sourcetype=cisco:asa metadata.source=* metadata.host=* | head 100
| table _time, _raw
| trackmefieldsqualityextract
| table _time, metadata.index, metadata.sourcetype, metadata.datamodel, metadata.nodename, fieldname, value, is_empty, is_missing

| where fieldname="action"

| stats count, count(eval(is_empty=0 AND is_missing=0)) as count_covered, count(eval(is_empty=1 OR is_missing=1)) as count_not_covered
| eval percentage_covered=count_covered/count*100