Analyse log messages logging level to detect behaviour anomalies using TrackMe’s Flex Object and Machine Learning Anomaly Detection
Detecting increasing volumes, globally and per index with TrackMe
This TrackMe whitepaper tutorial demonstrates how you can leverage TrackMe to detect Splunk instances and deployments abnormal conditions by analysing log messages and their logging level through the lens of Machine Learning Outliers detection.
This use case tracks Splunk internal logs and their logging level, turning these into KPIs and submitting them to TrackMe’s Machine Learning Outliers detection engine.
The objective is then to detect abnormal trends, such as an increase of the number of errors or a lack of informational messages, which would be symptomatic of potentially serious conditions affecting Splunk instances and deployments.
The same use philosophy can be applied to any application log messages, and detect abnormal behaviour in any application or system.
Hint
Requires TrackMe licence:
This use case is designed using TrackMe’s restricted component Flex Object.
This component is only available to licensed users of TrackMe, and is not available with the free community edition of TrackMe.
Objective: Making sense of Splunk log messages logging level and detect Splunk abnormal conditions
The basic logic is to track Splunk internal log messages through the lens of their logging level, similarly to the following Splunk search:
Let’s take an example:
index=_internal host=* log_level=* (log_level=ERROR OR log_level=INFO OR log_level=WARN OR log_level=FATAL)

``` The basis break by statement logic happens on a per host basis, you may want to update the logic to group by tiers logic, such as grouping by indexer cluster, Search head, Search Head Cluster and so forth ```
| bucket _time span=30m
| stats
count(eval(log_level="INFO")) as info,
count(eval(log_level="WARN")) as warn,
count(eval(log_level="ERROR")) as error,
count(eval(log_level="FATAL")) as fatal
by _time, host
| fillnull value=0

| timechart span=30m sum(info) as info, sum(warn) as warn, sum(error) as error, sum(fatal) as fatal
Several challenges need to be tackled:
volume: the volume of log messages can be very high, running large searches can be very resource consuming, or not even realistic in a continuous monitoring context.
variability: the volume of log messages can vary a lot, depending on time conditions, users activity and so forth.
relevance:: Simply tracking for errors is not meaningful, errors happen all the time, and are not necessarily symptomatic of a problem. The key is to detect abnormal trends.
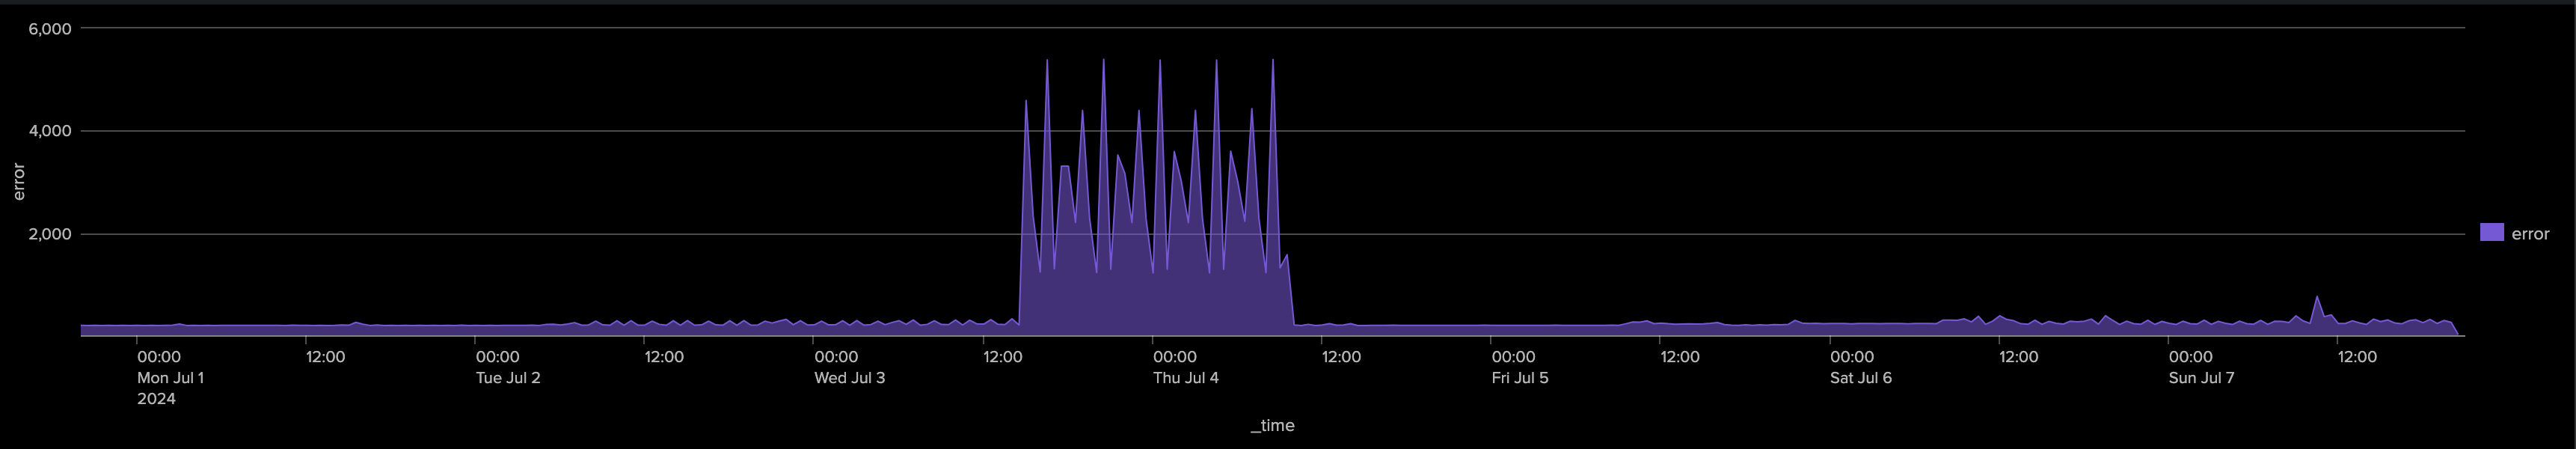
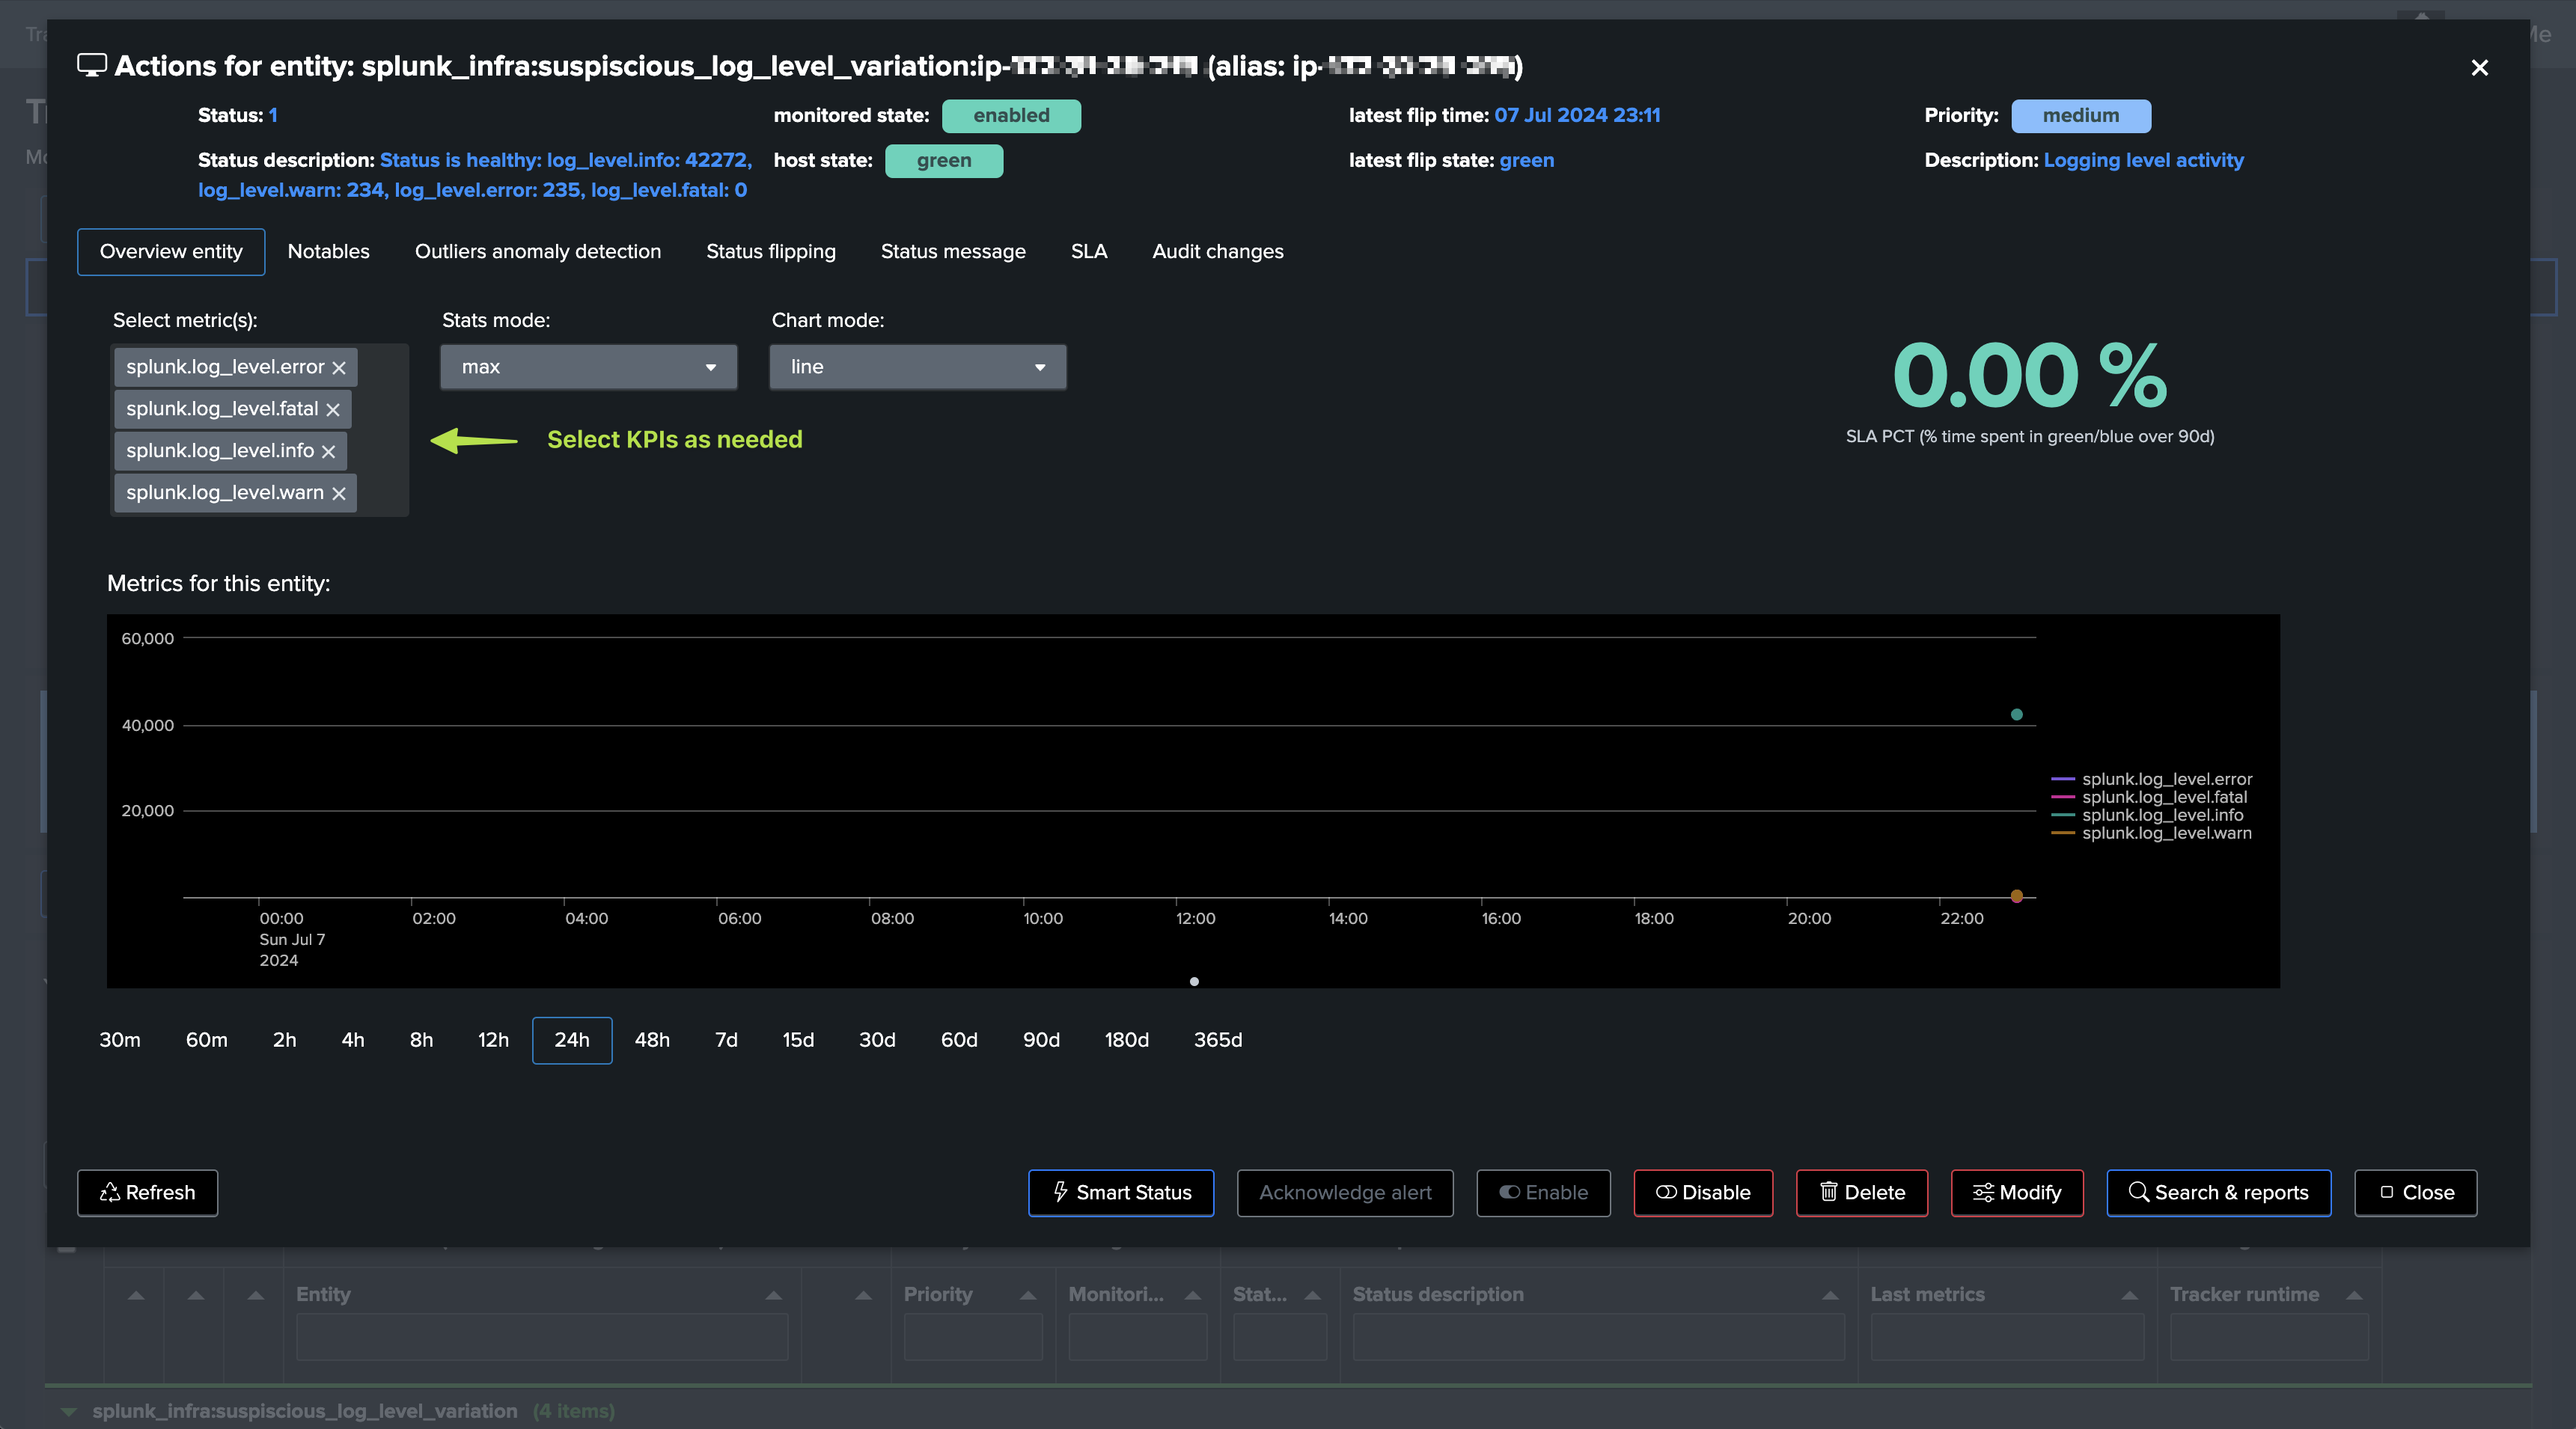
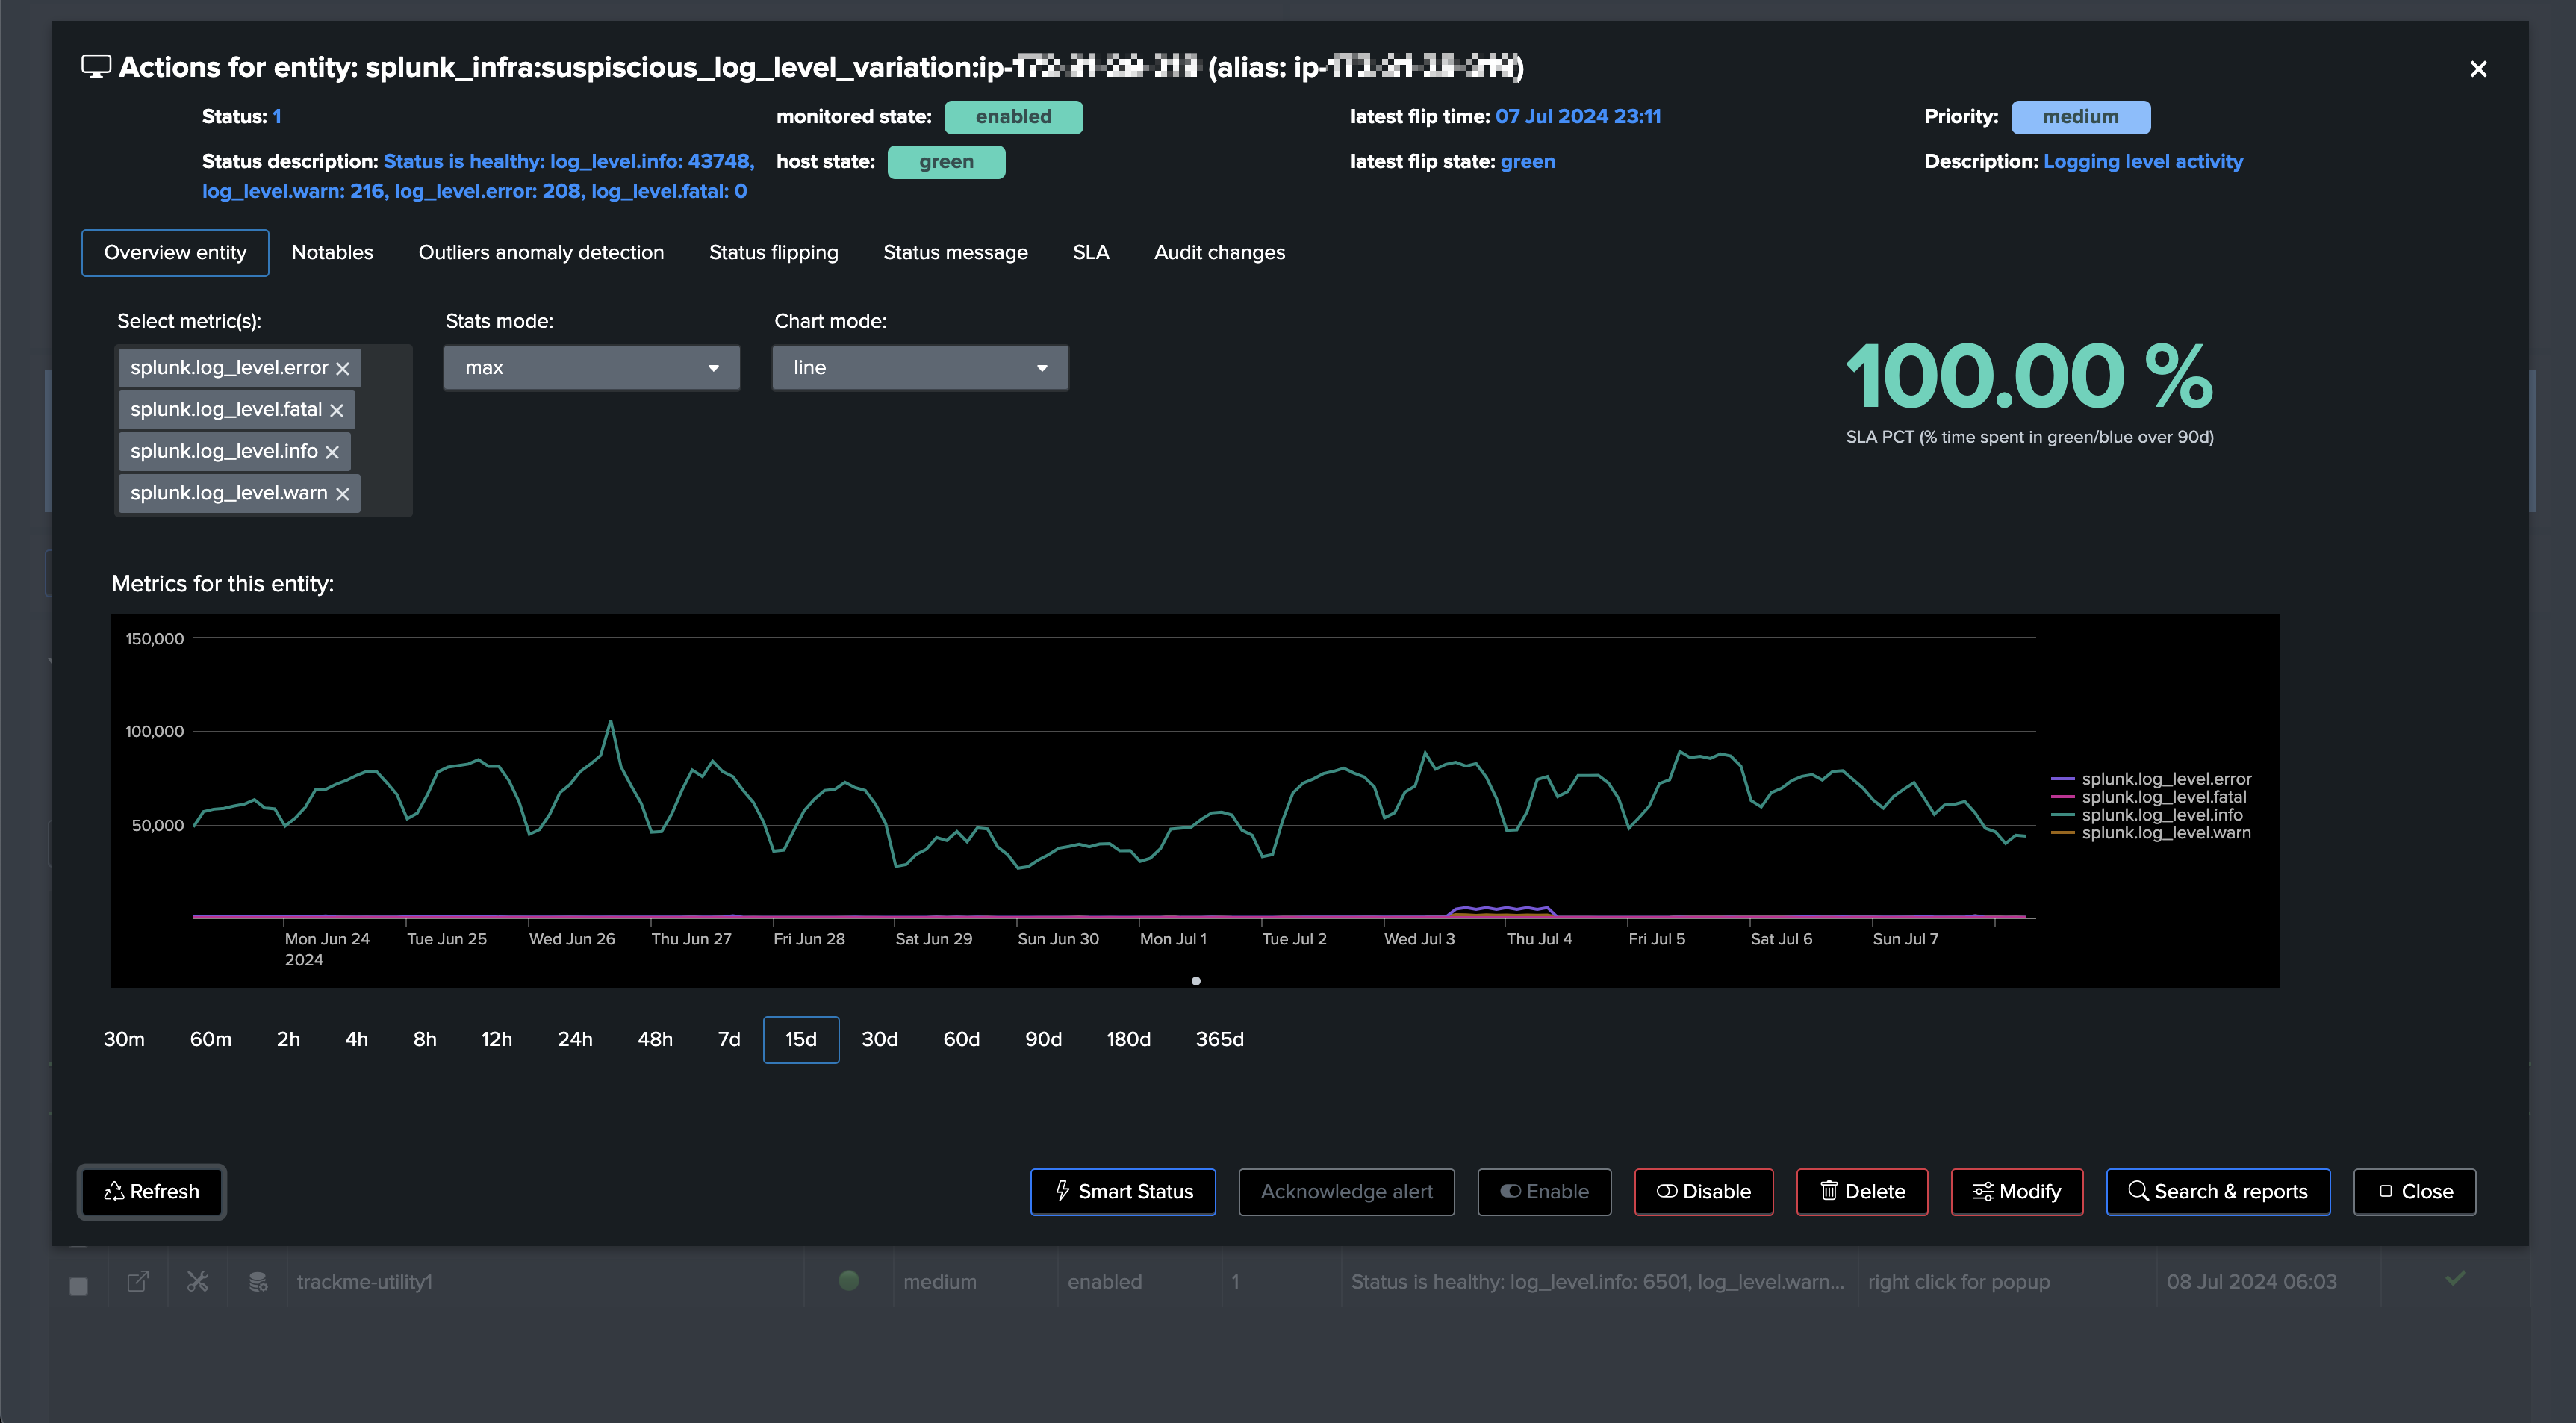
The following chart shows the challenges quite well:
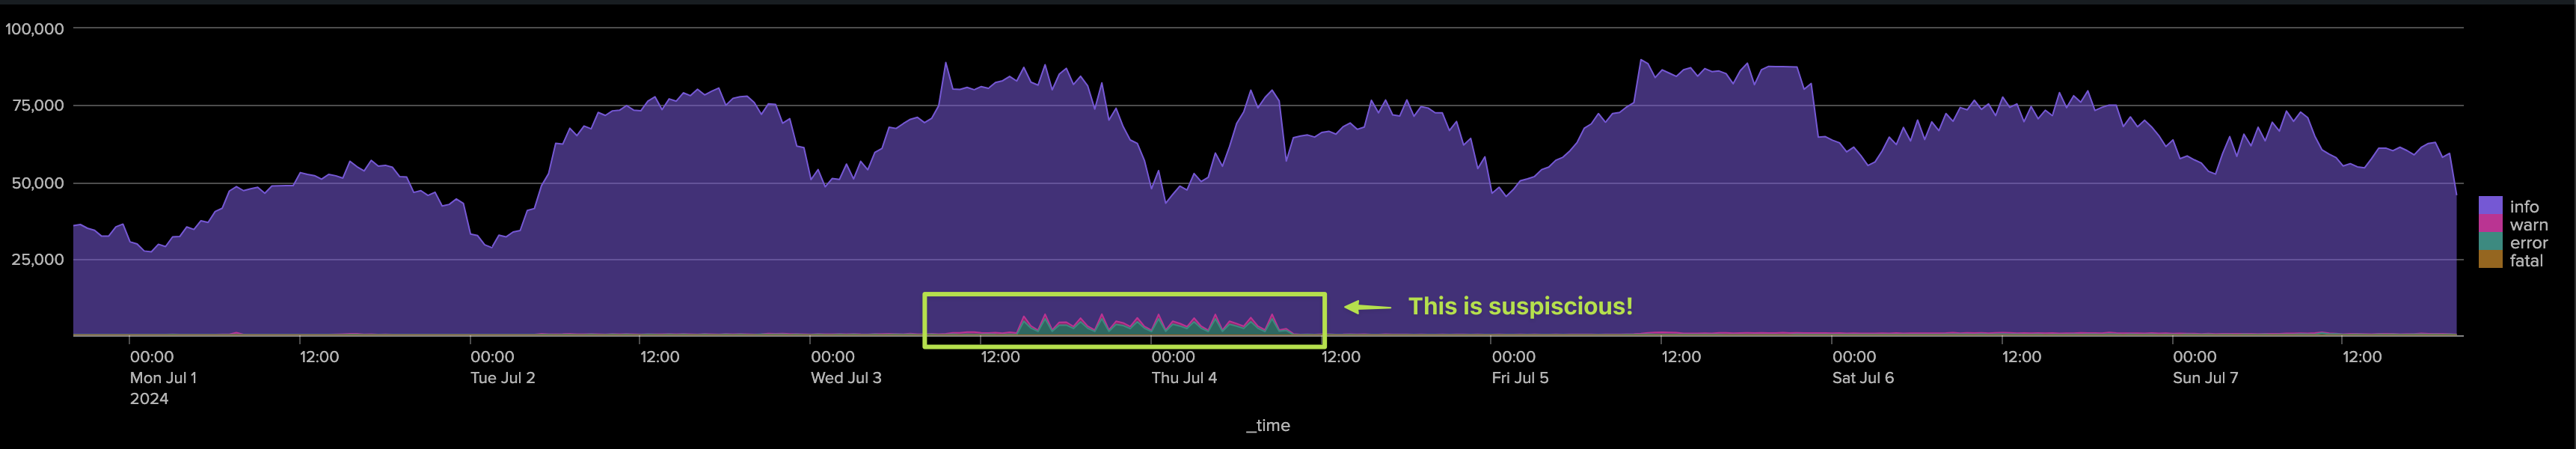
An ad-hoc investigation can possibly detect an abnormal condition, our goal is to leverage TrackMe to do this work efficiently:
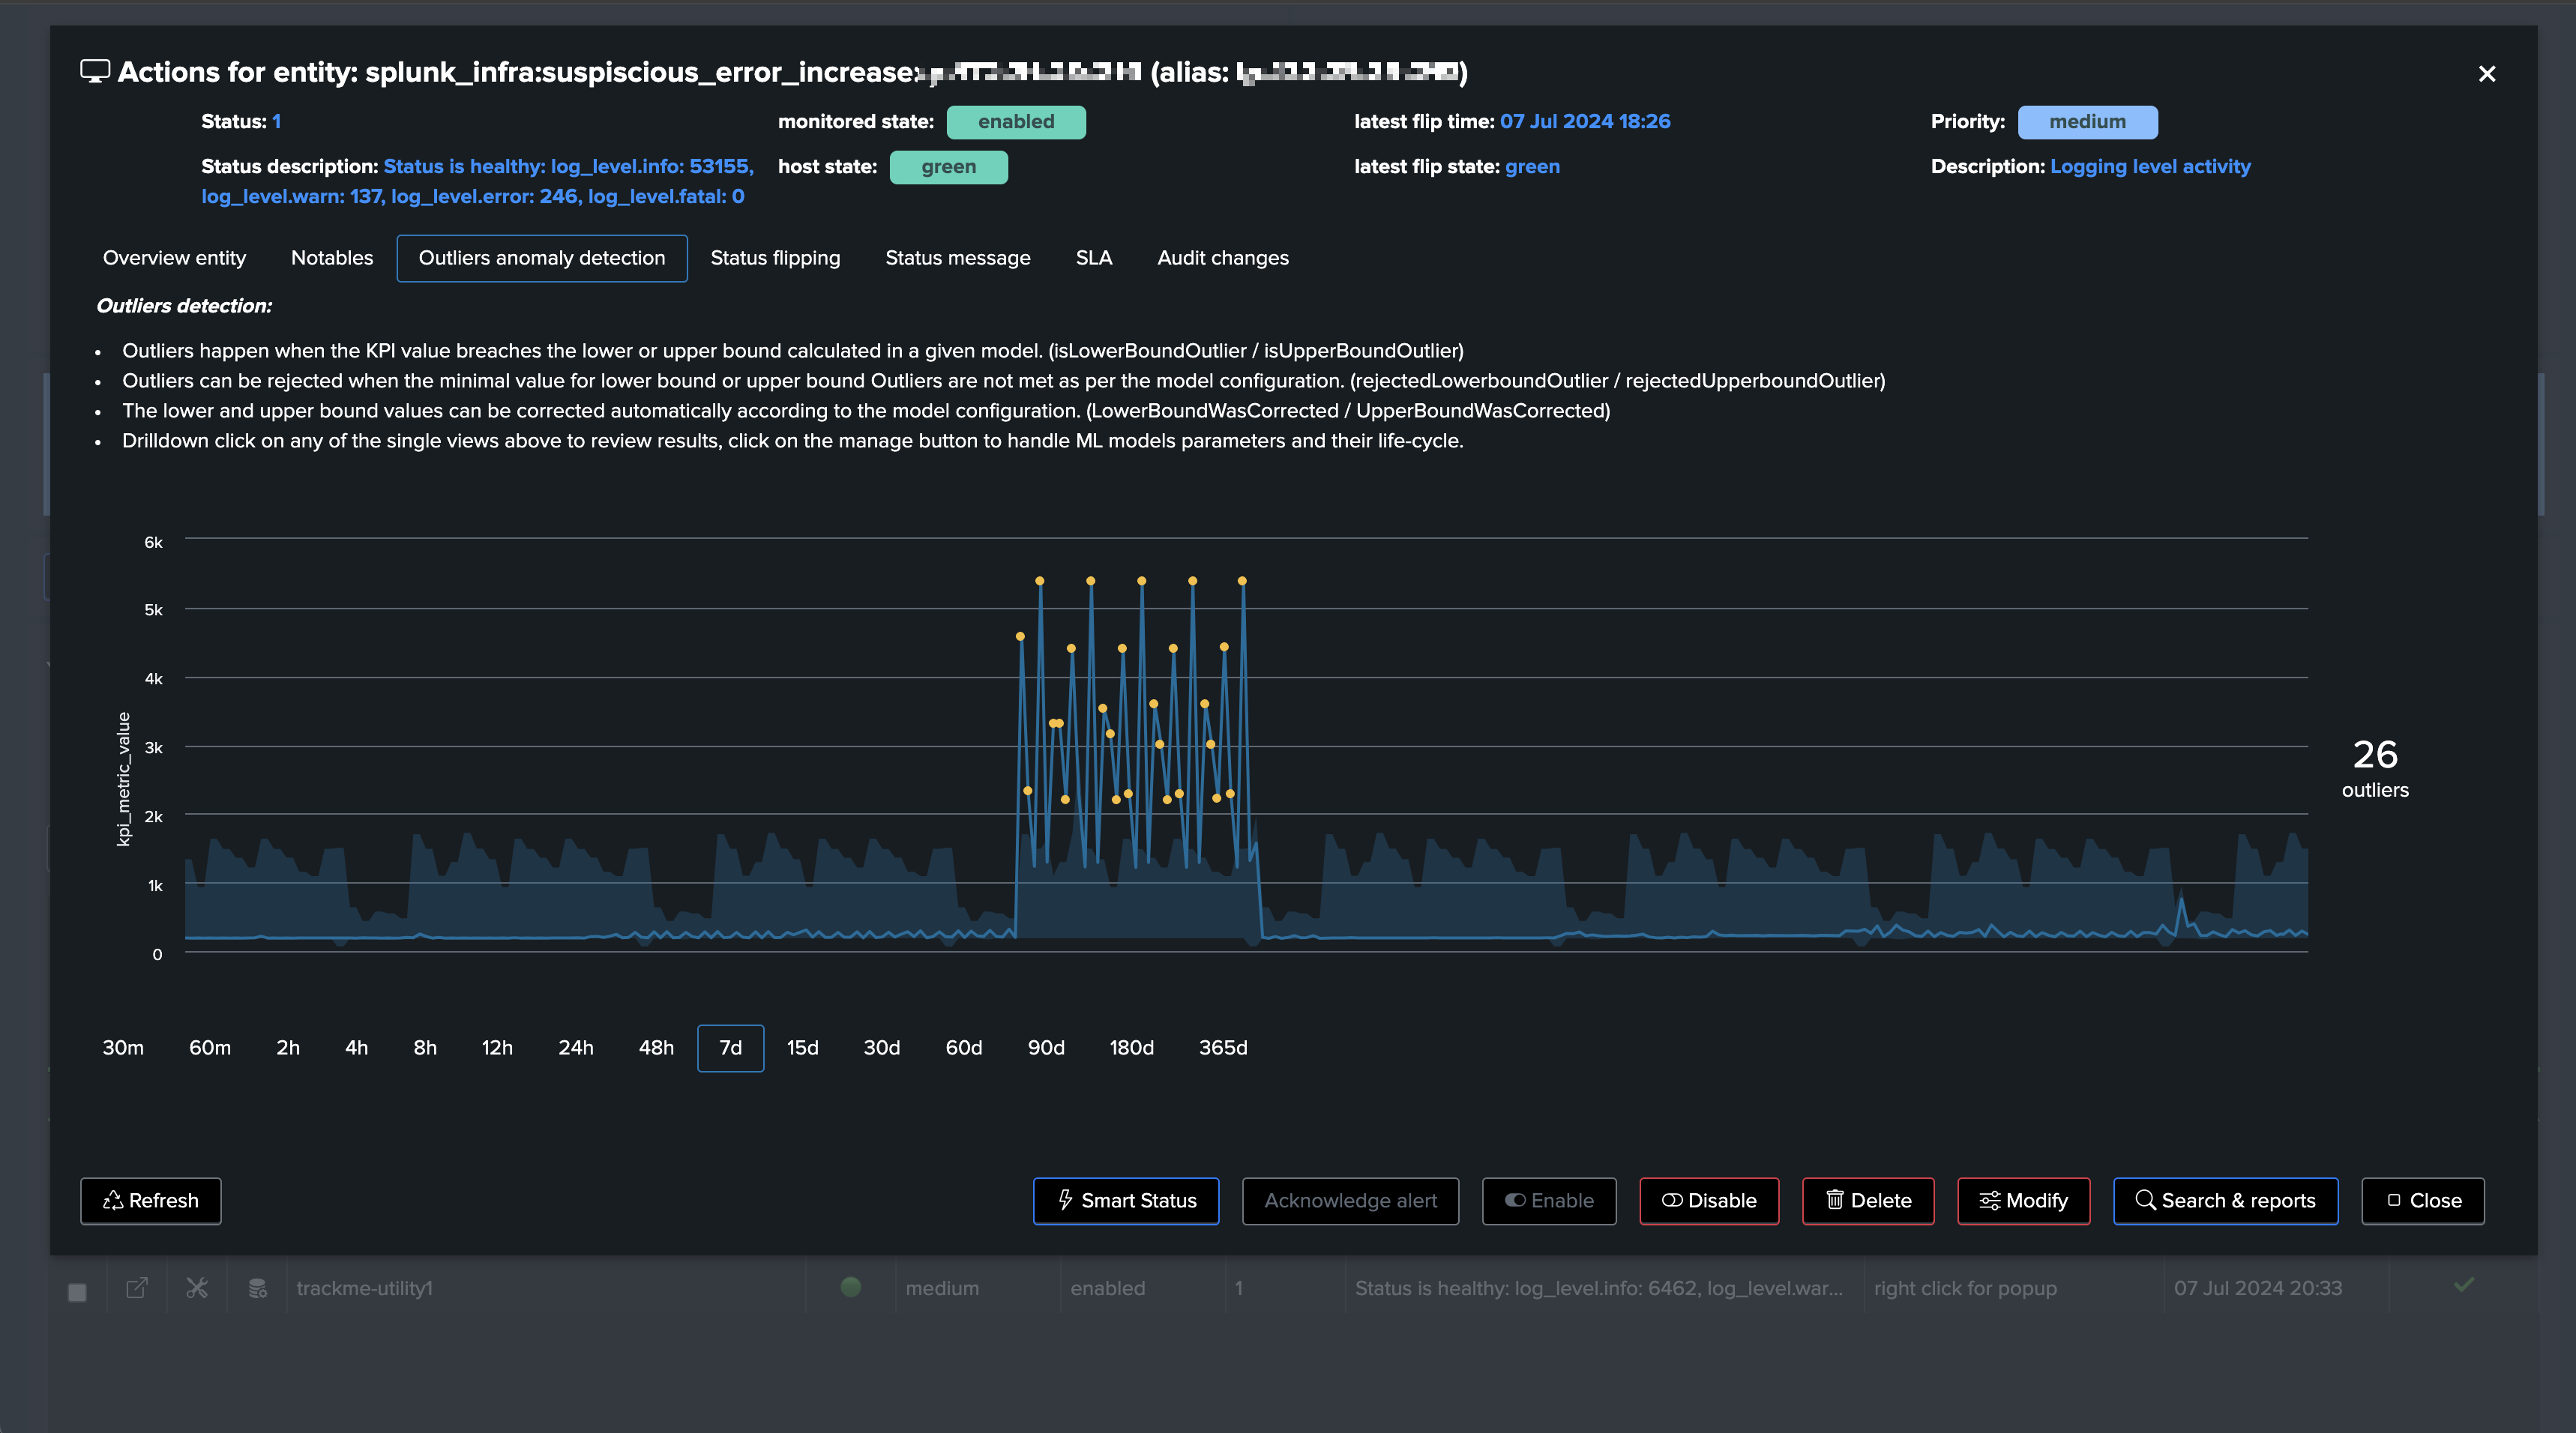
TrackMe’s Machine Learning Outliers detection:
Implementation in TrackMe
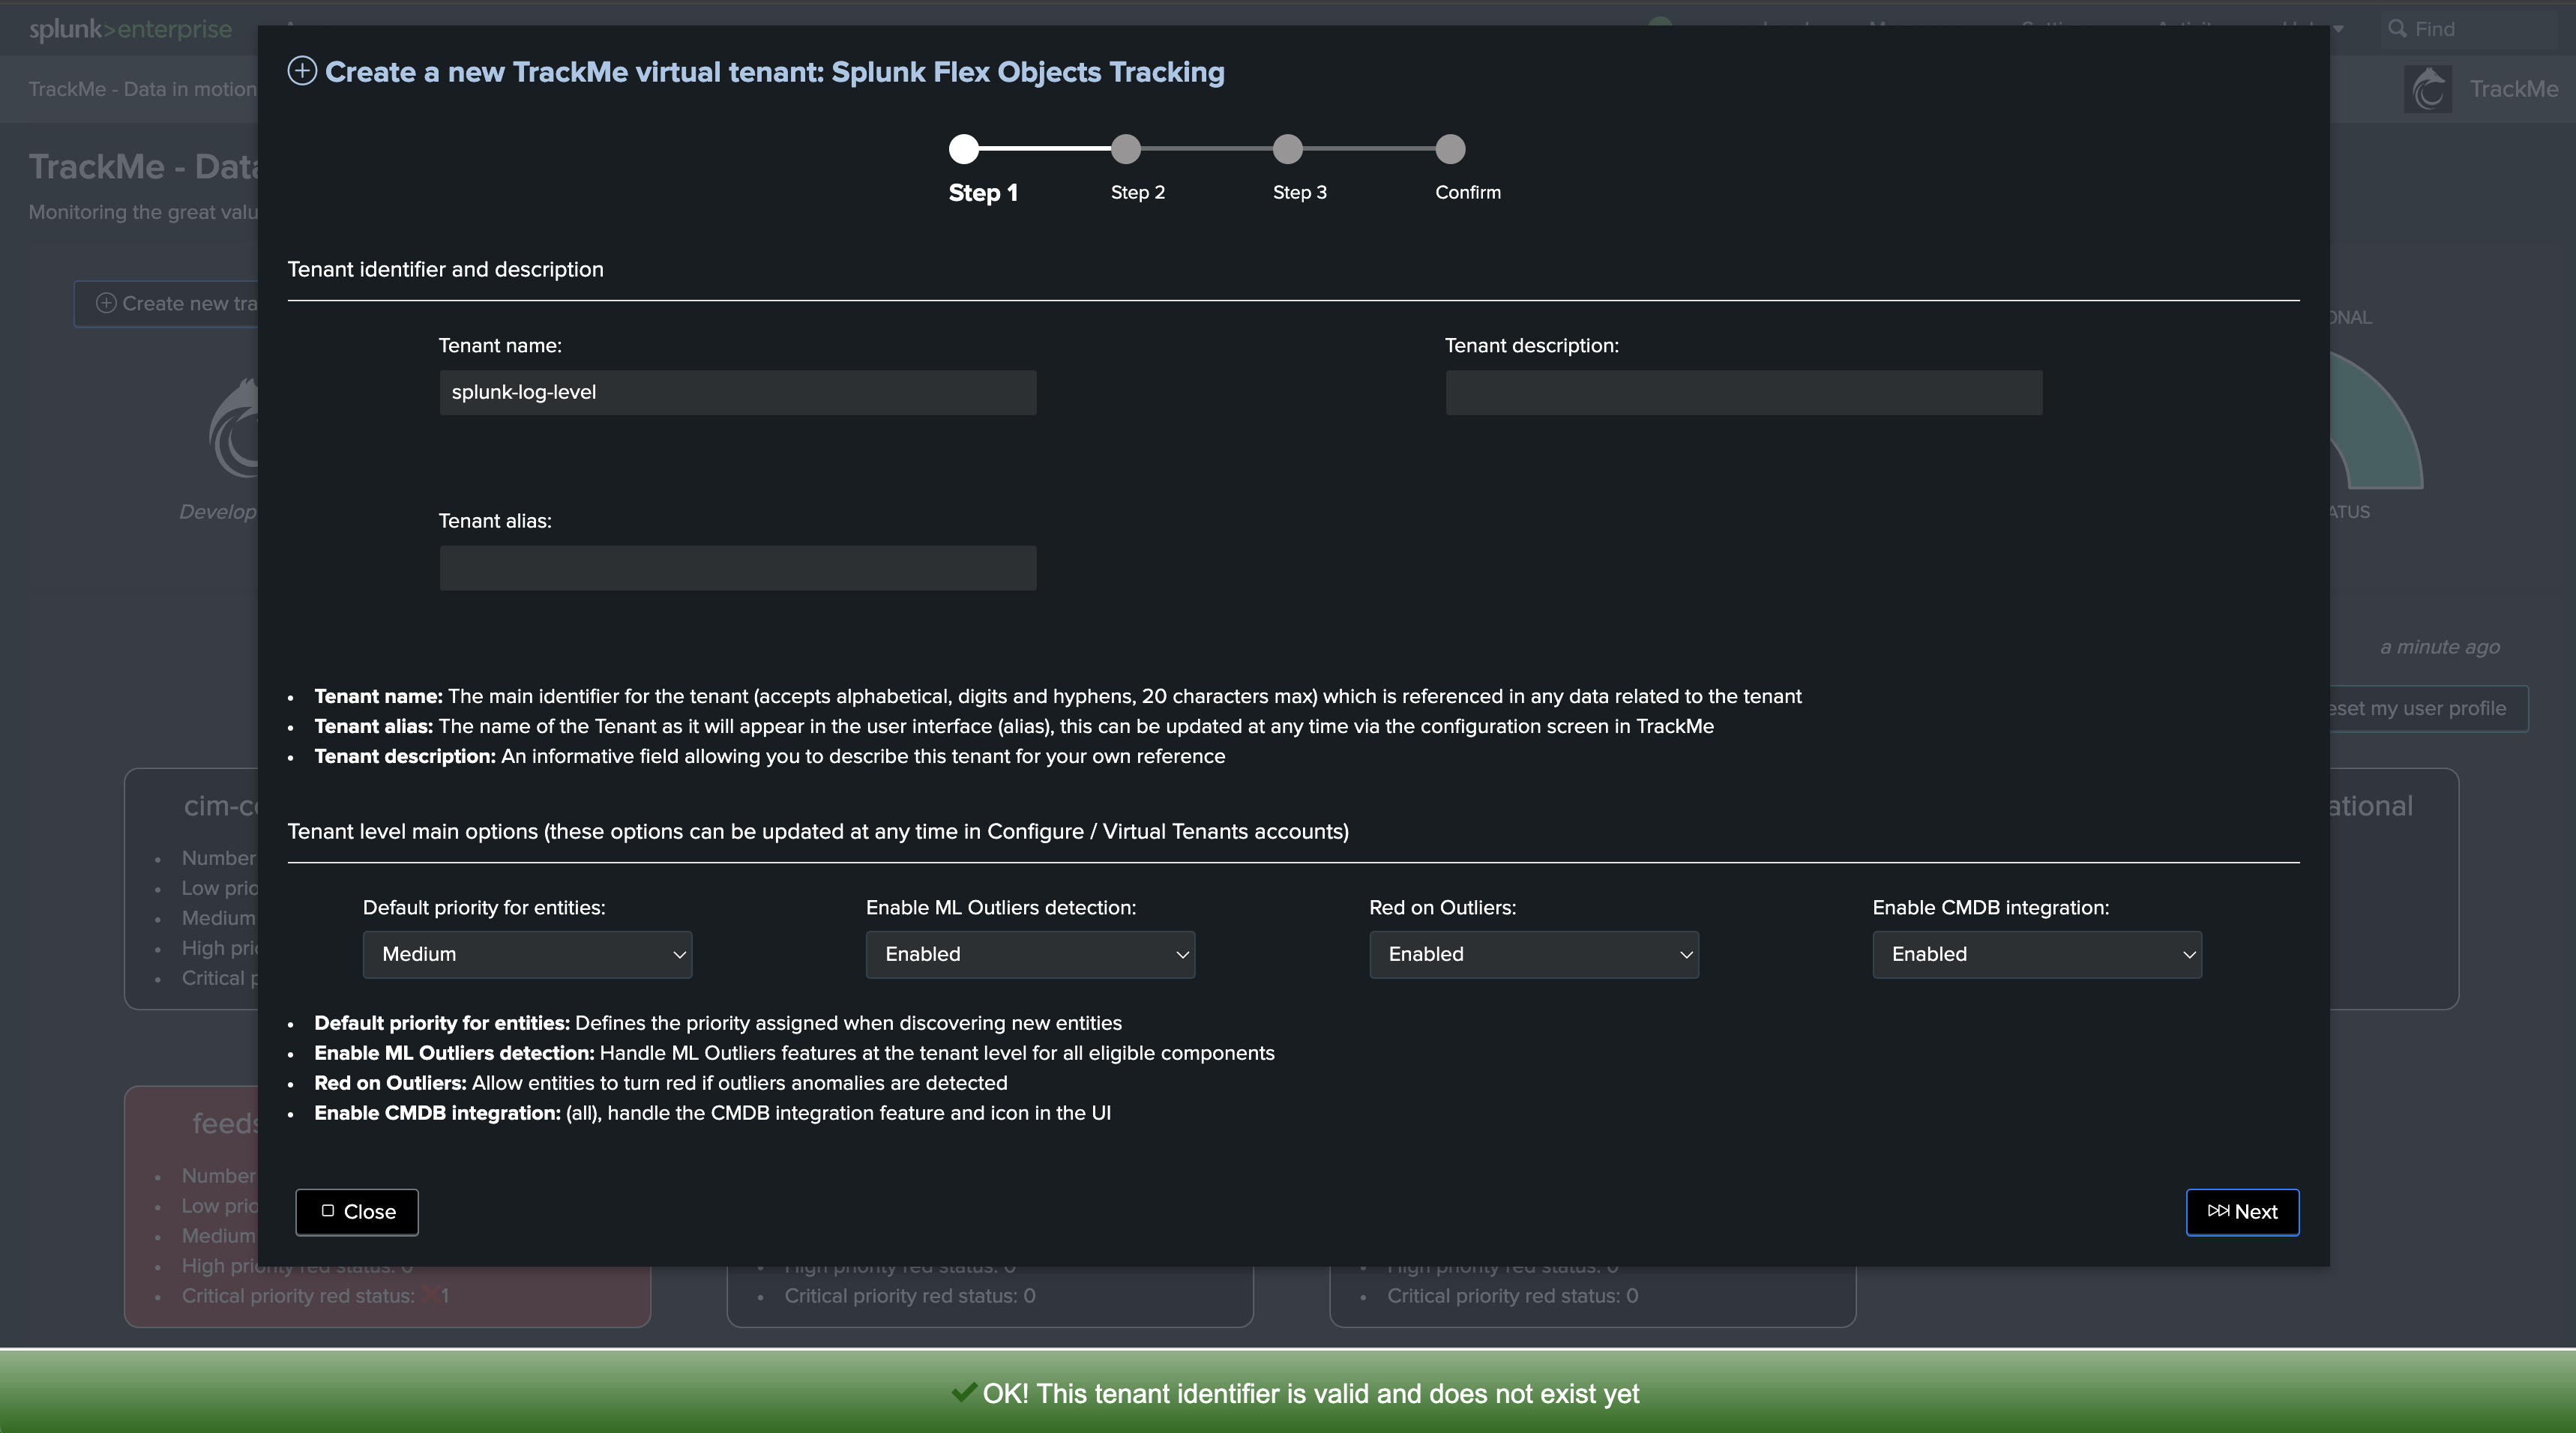
Step 1: Create a Virtual Tenant
First, let’s create a new Virtual Tenant for our use case, we may well simply use an existing Virtual Tenant, for the purposes of the documentation we will simply create a new tenant:
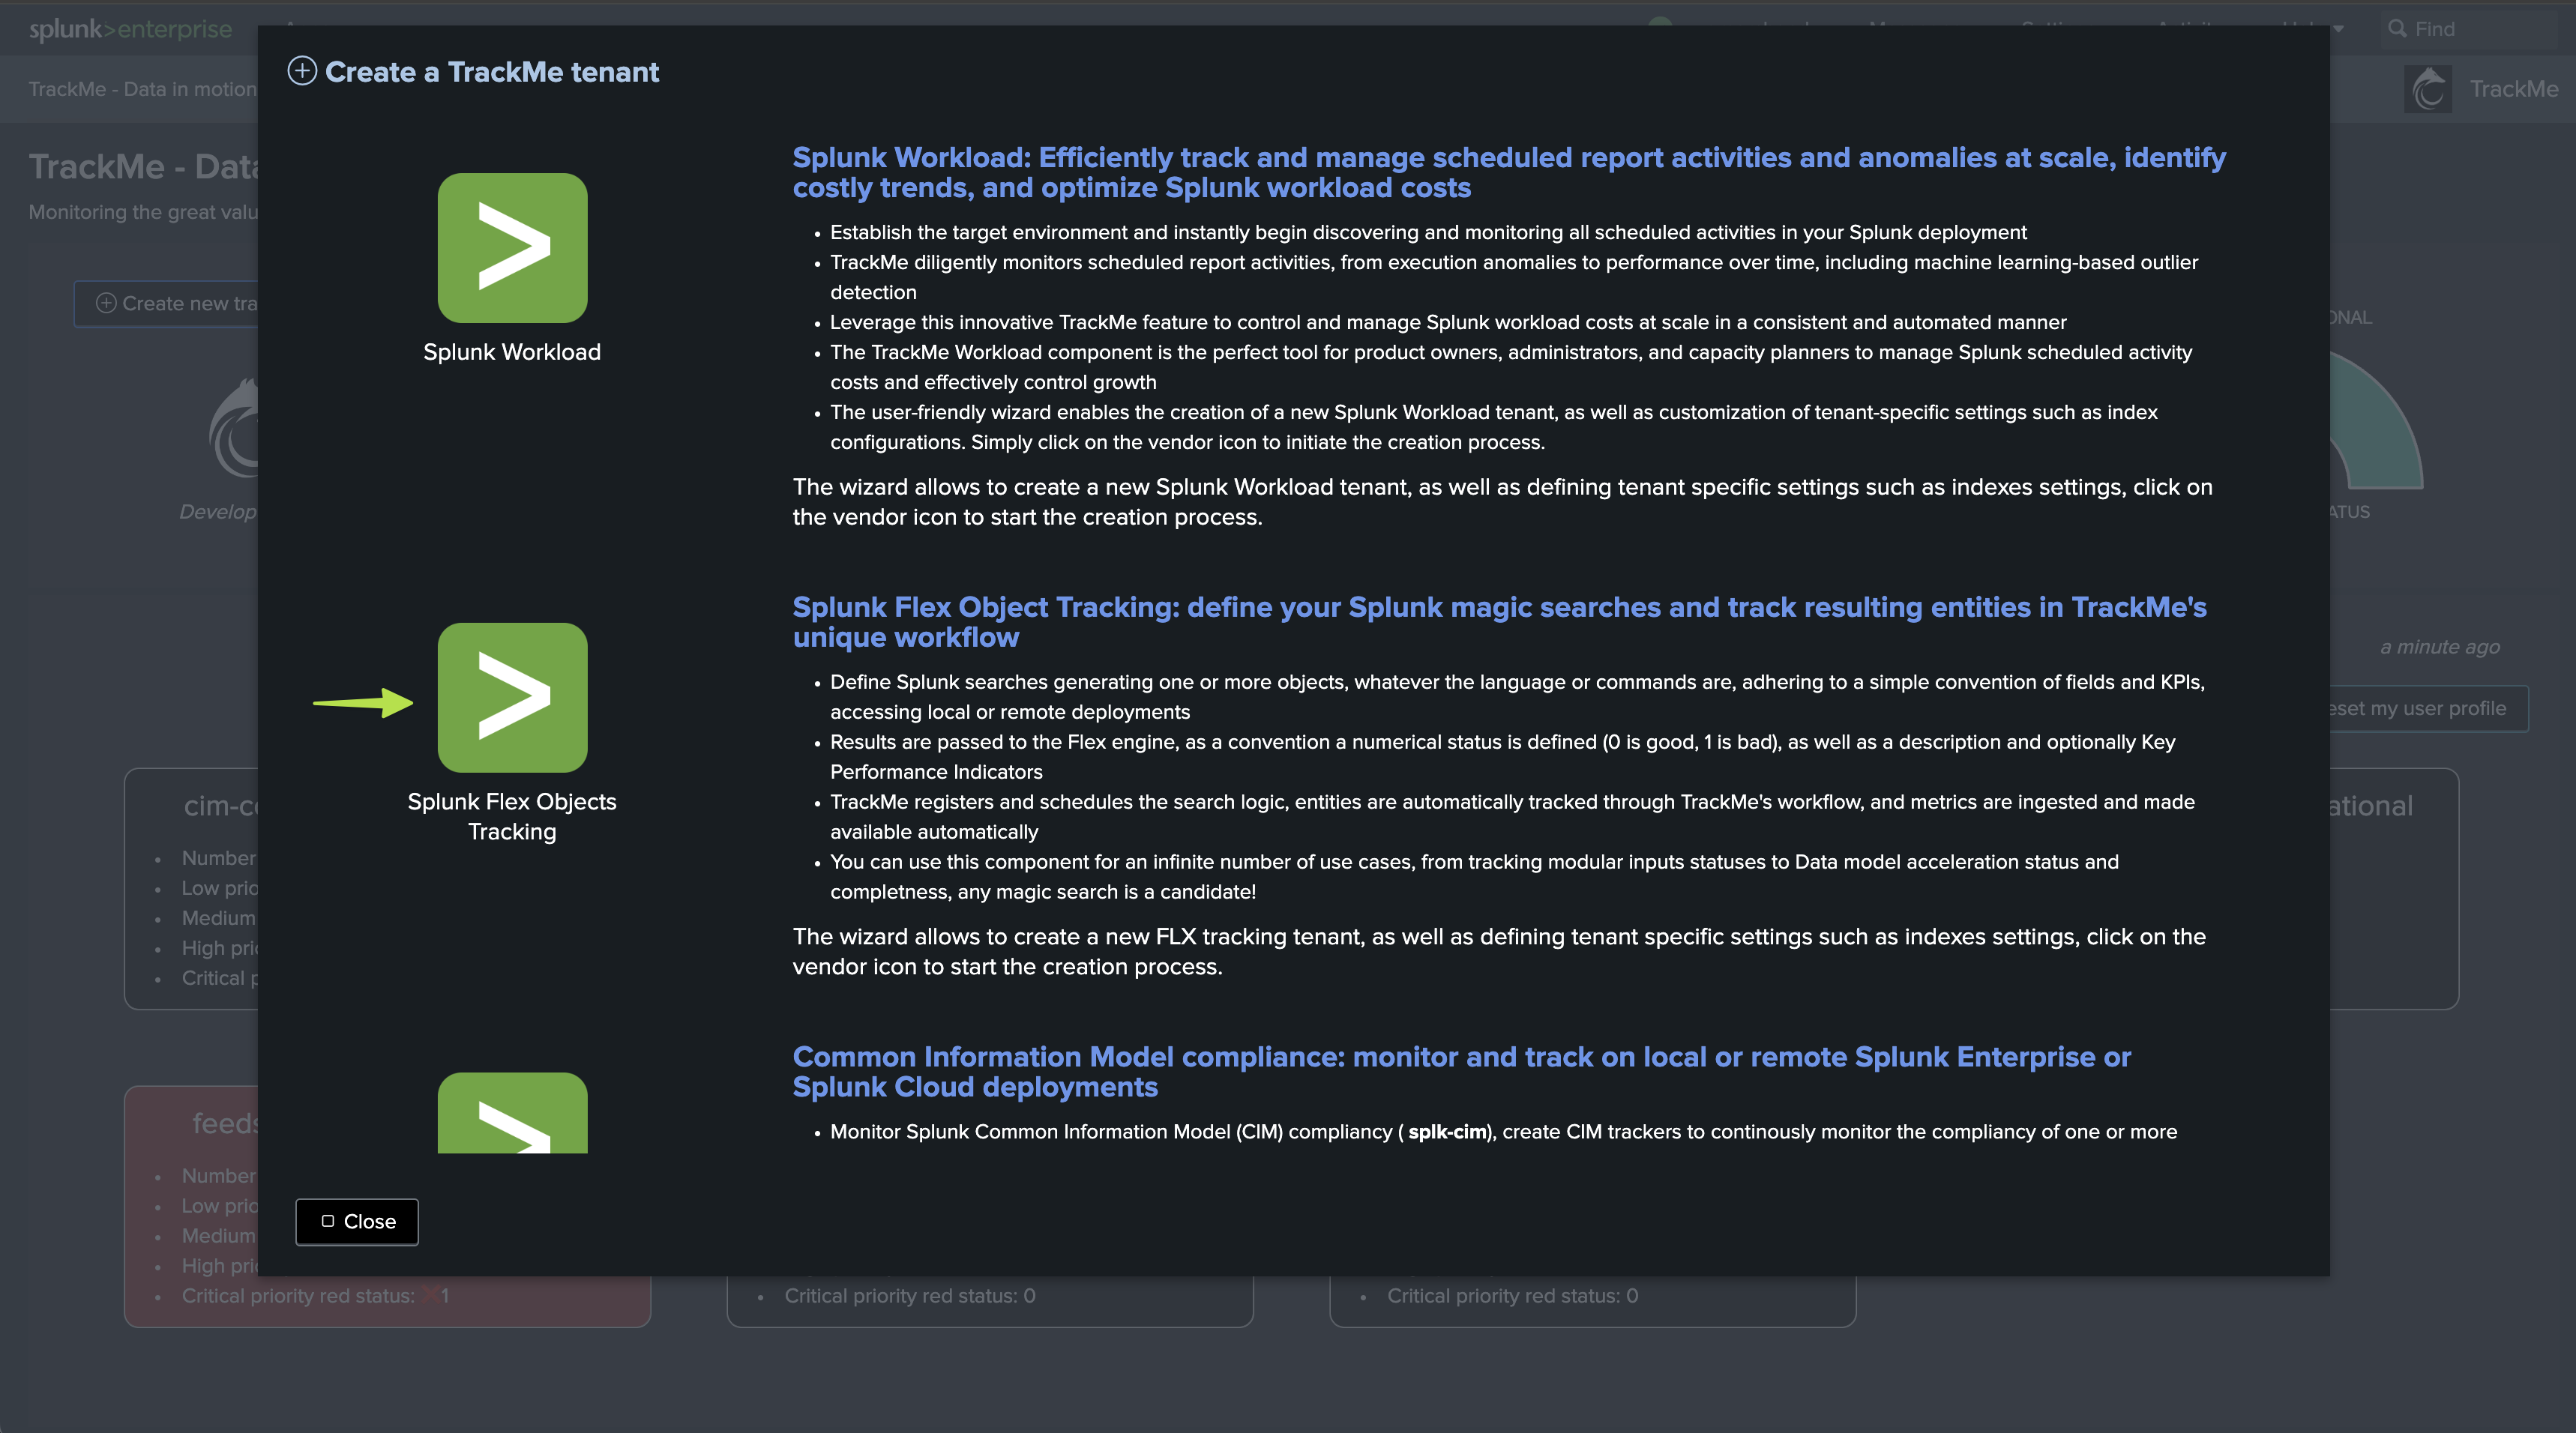
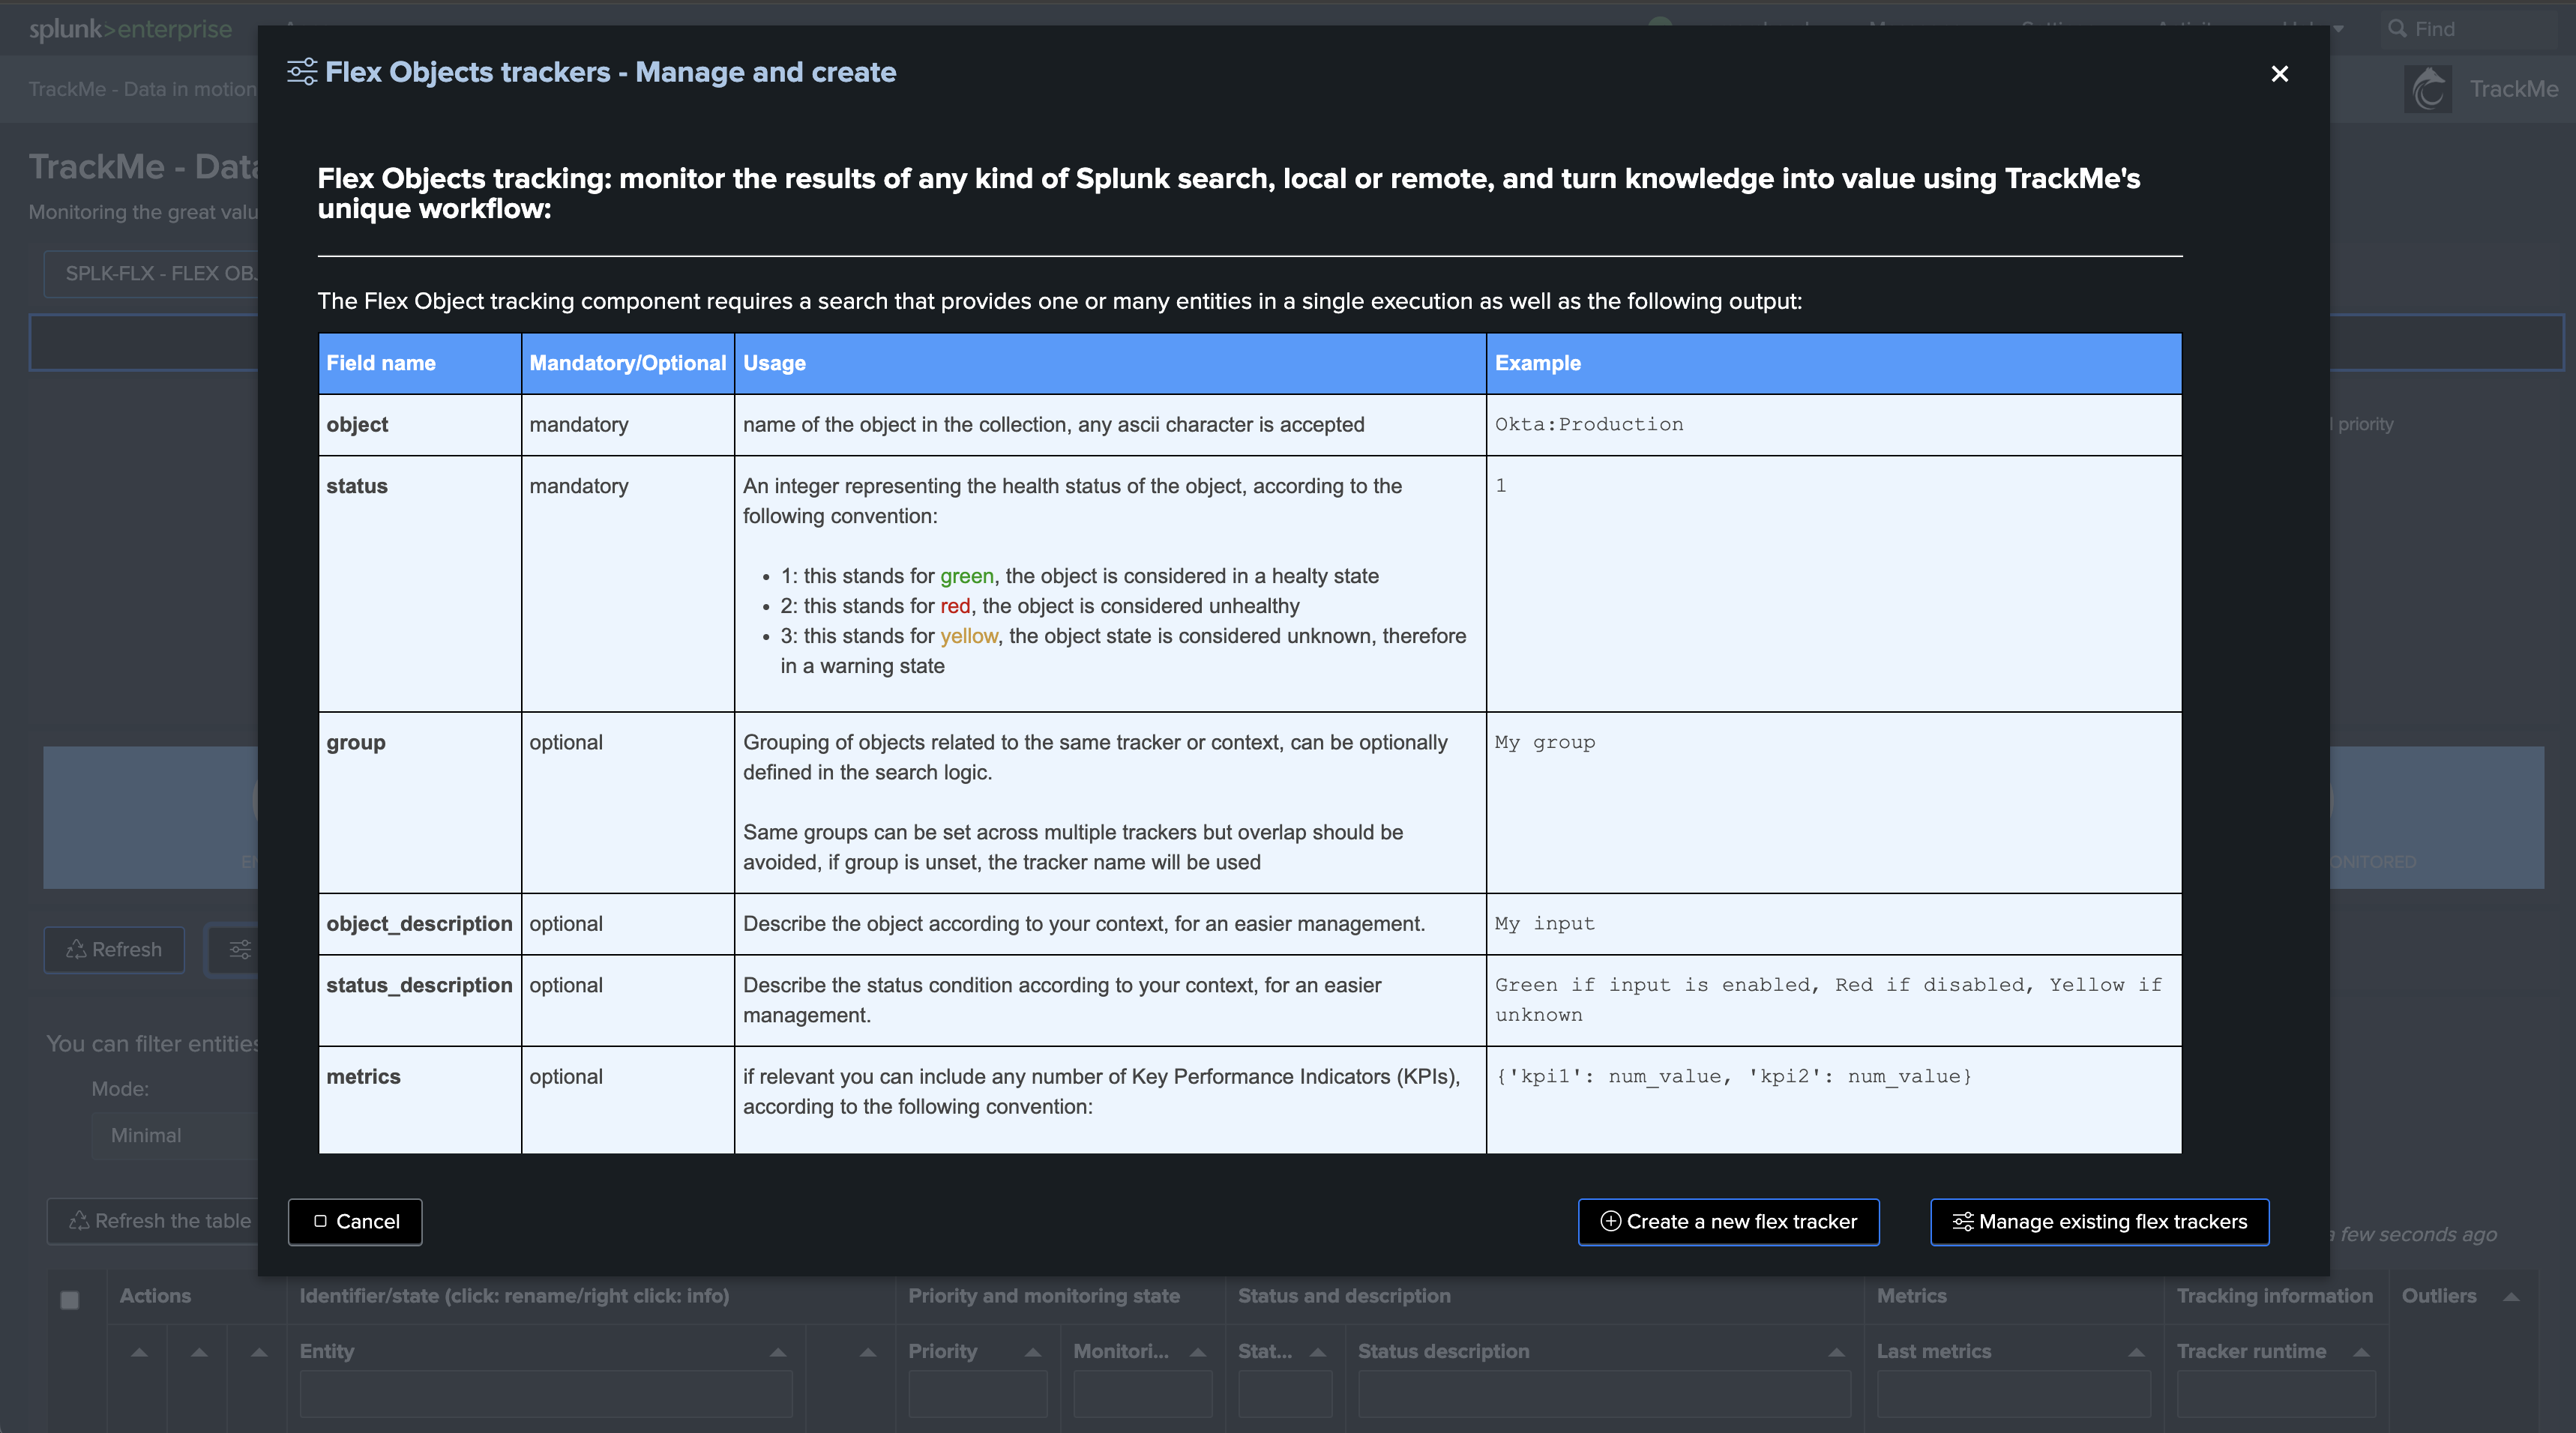
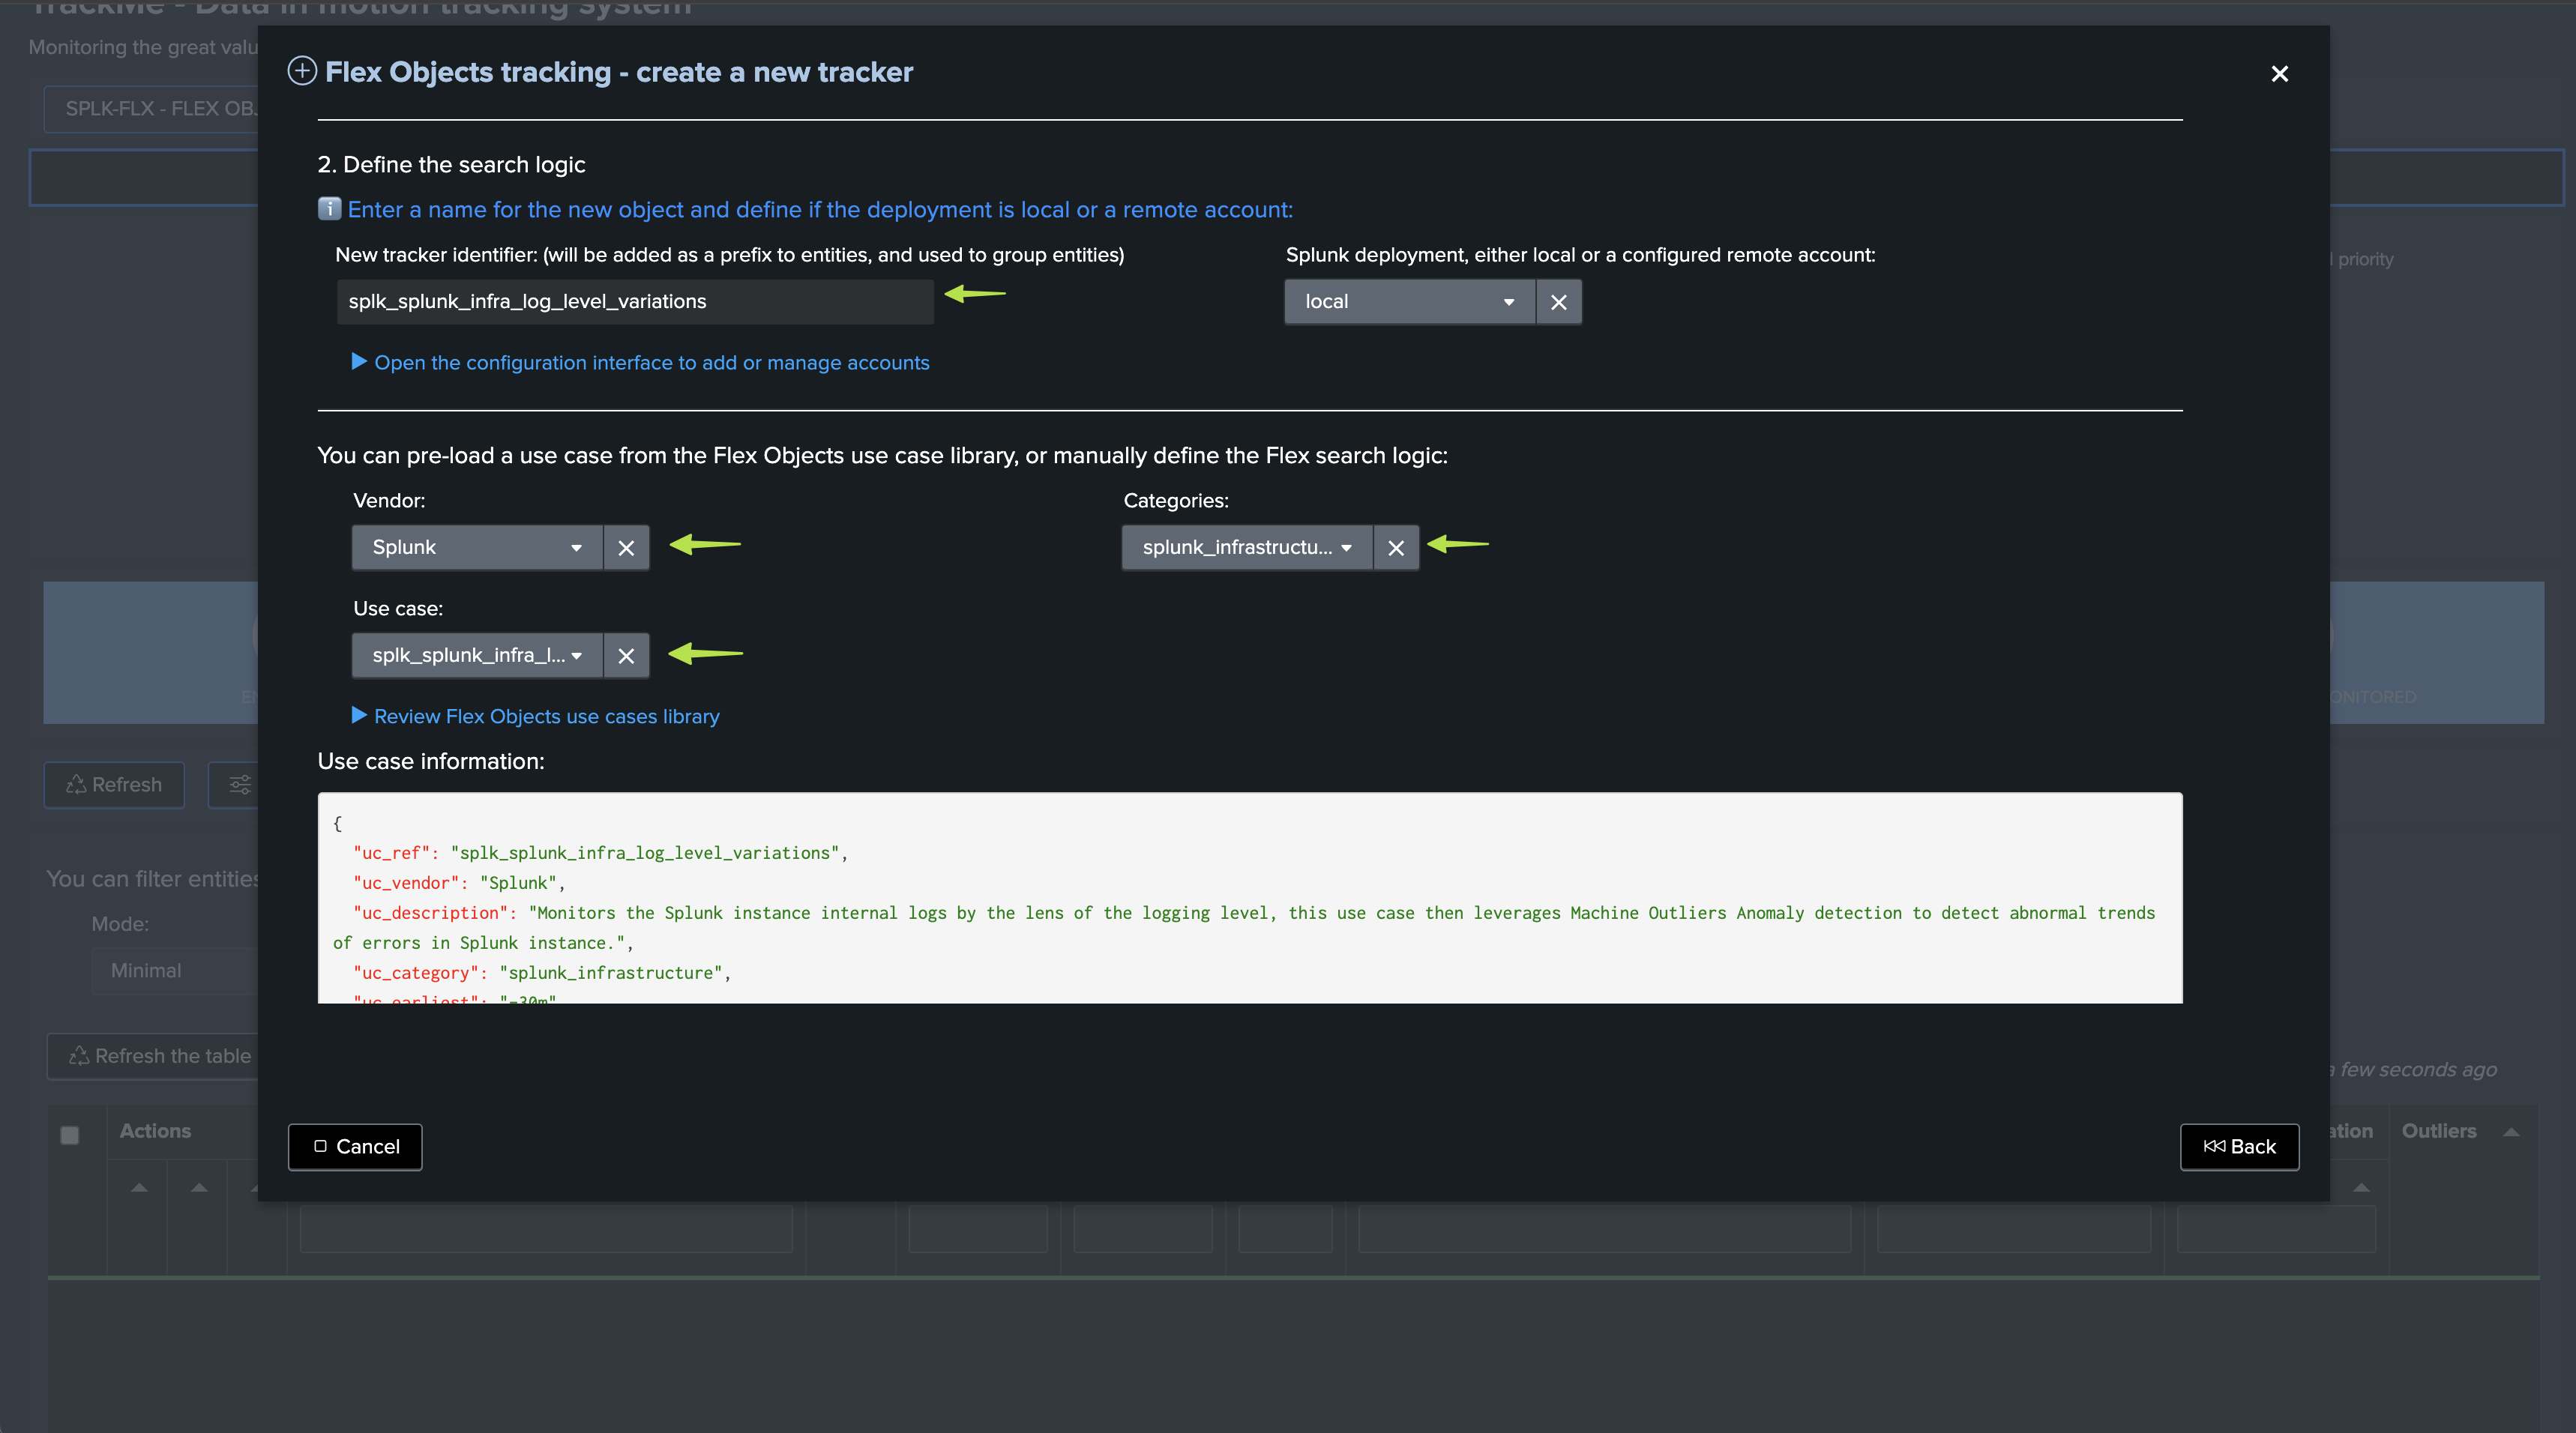
Step 2: Create the new Flex Object tracker
The use case was integrated in the Flex Object library in TrackMe 2.0.97, so you can simply call the template splk_splunk_infra_log_level_variations:
Note: You can find the use case search at the end of this document
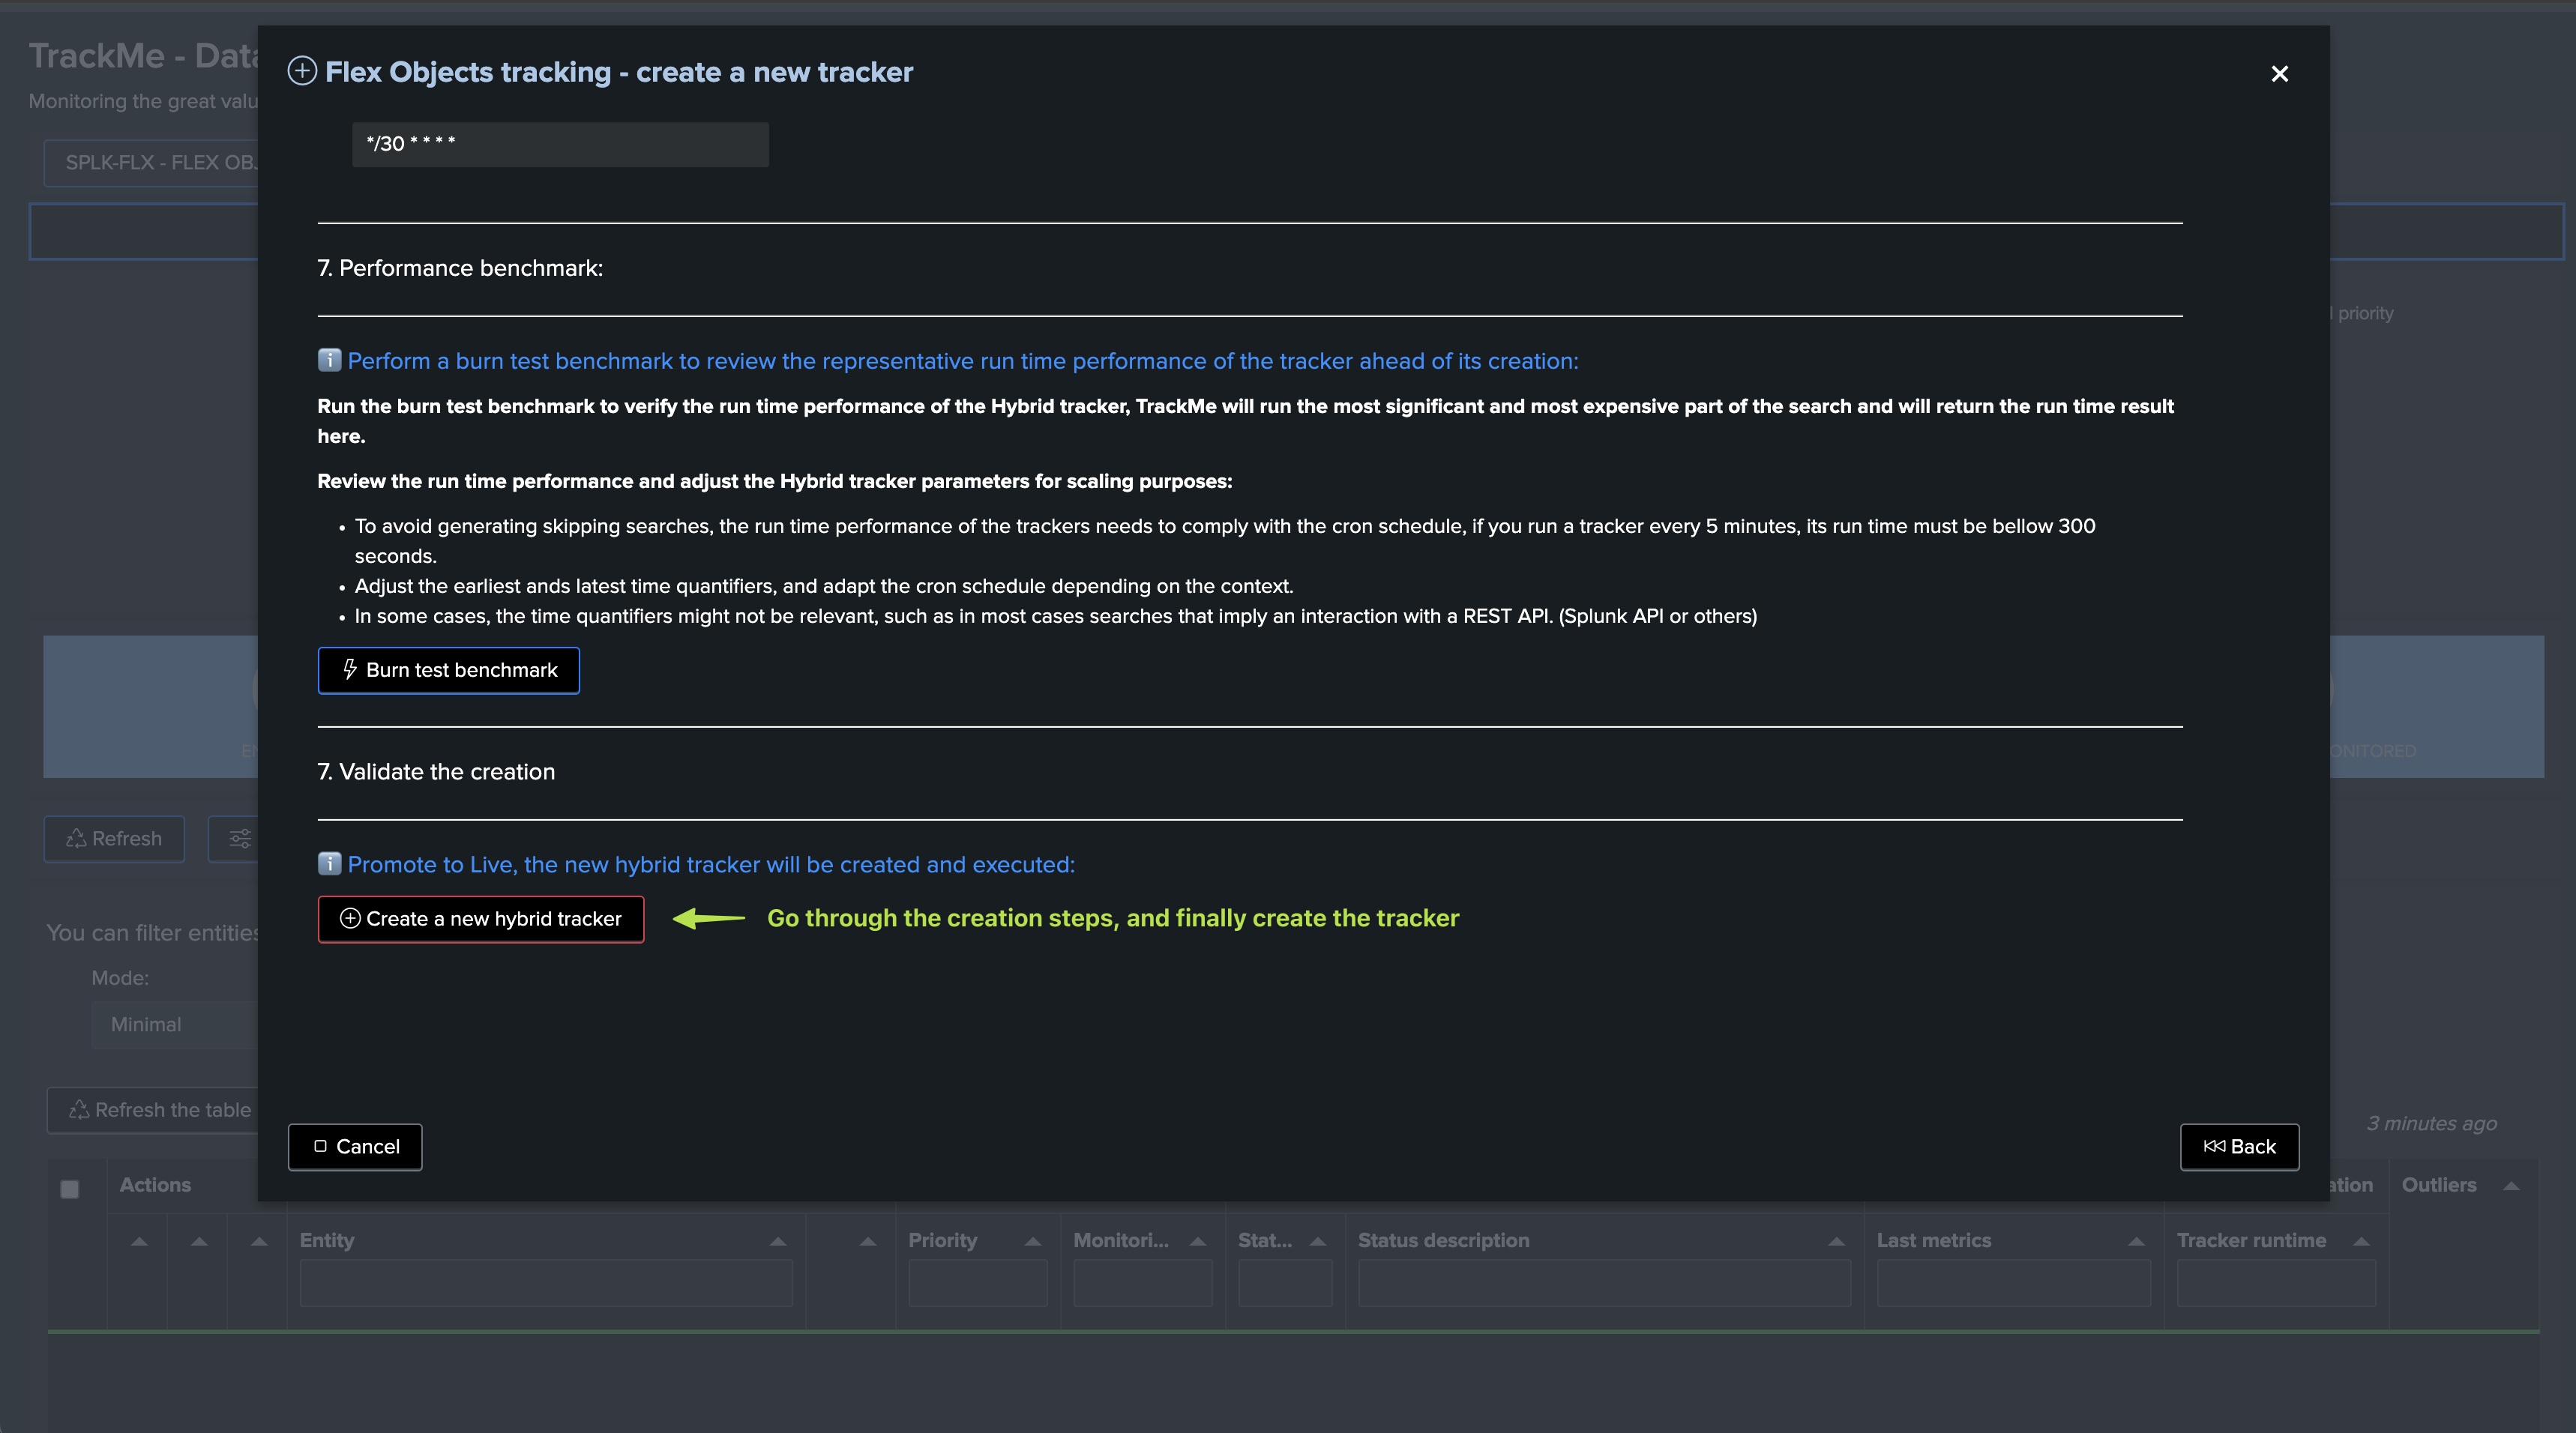
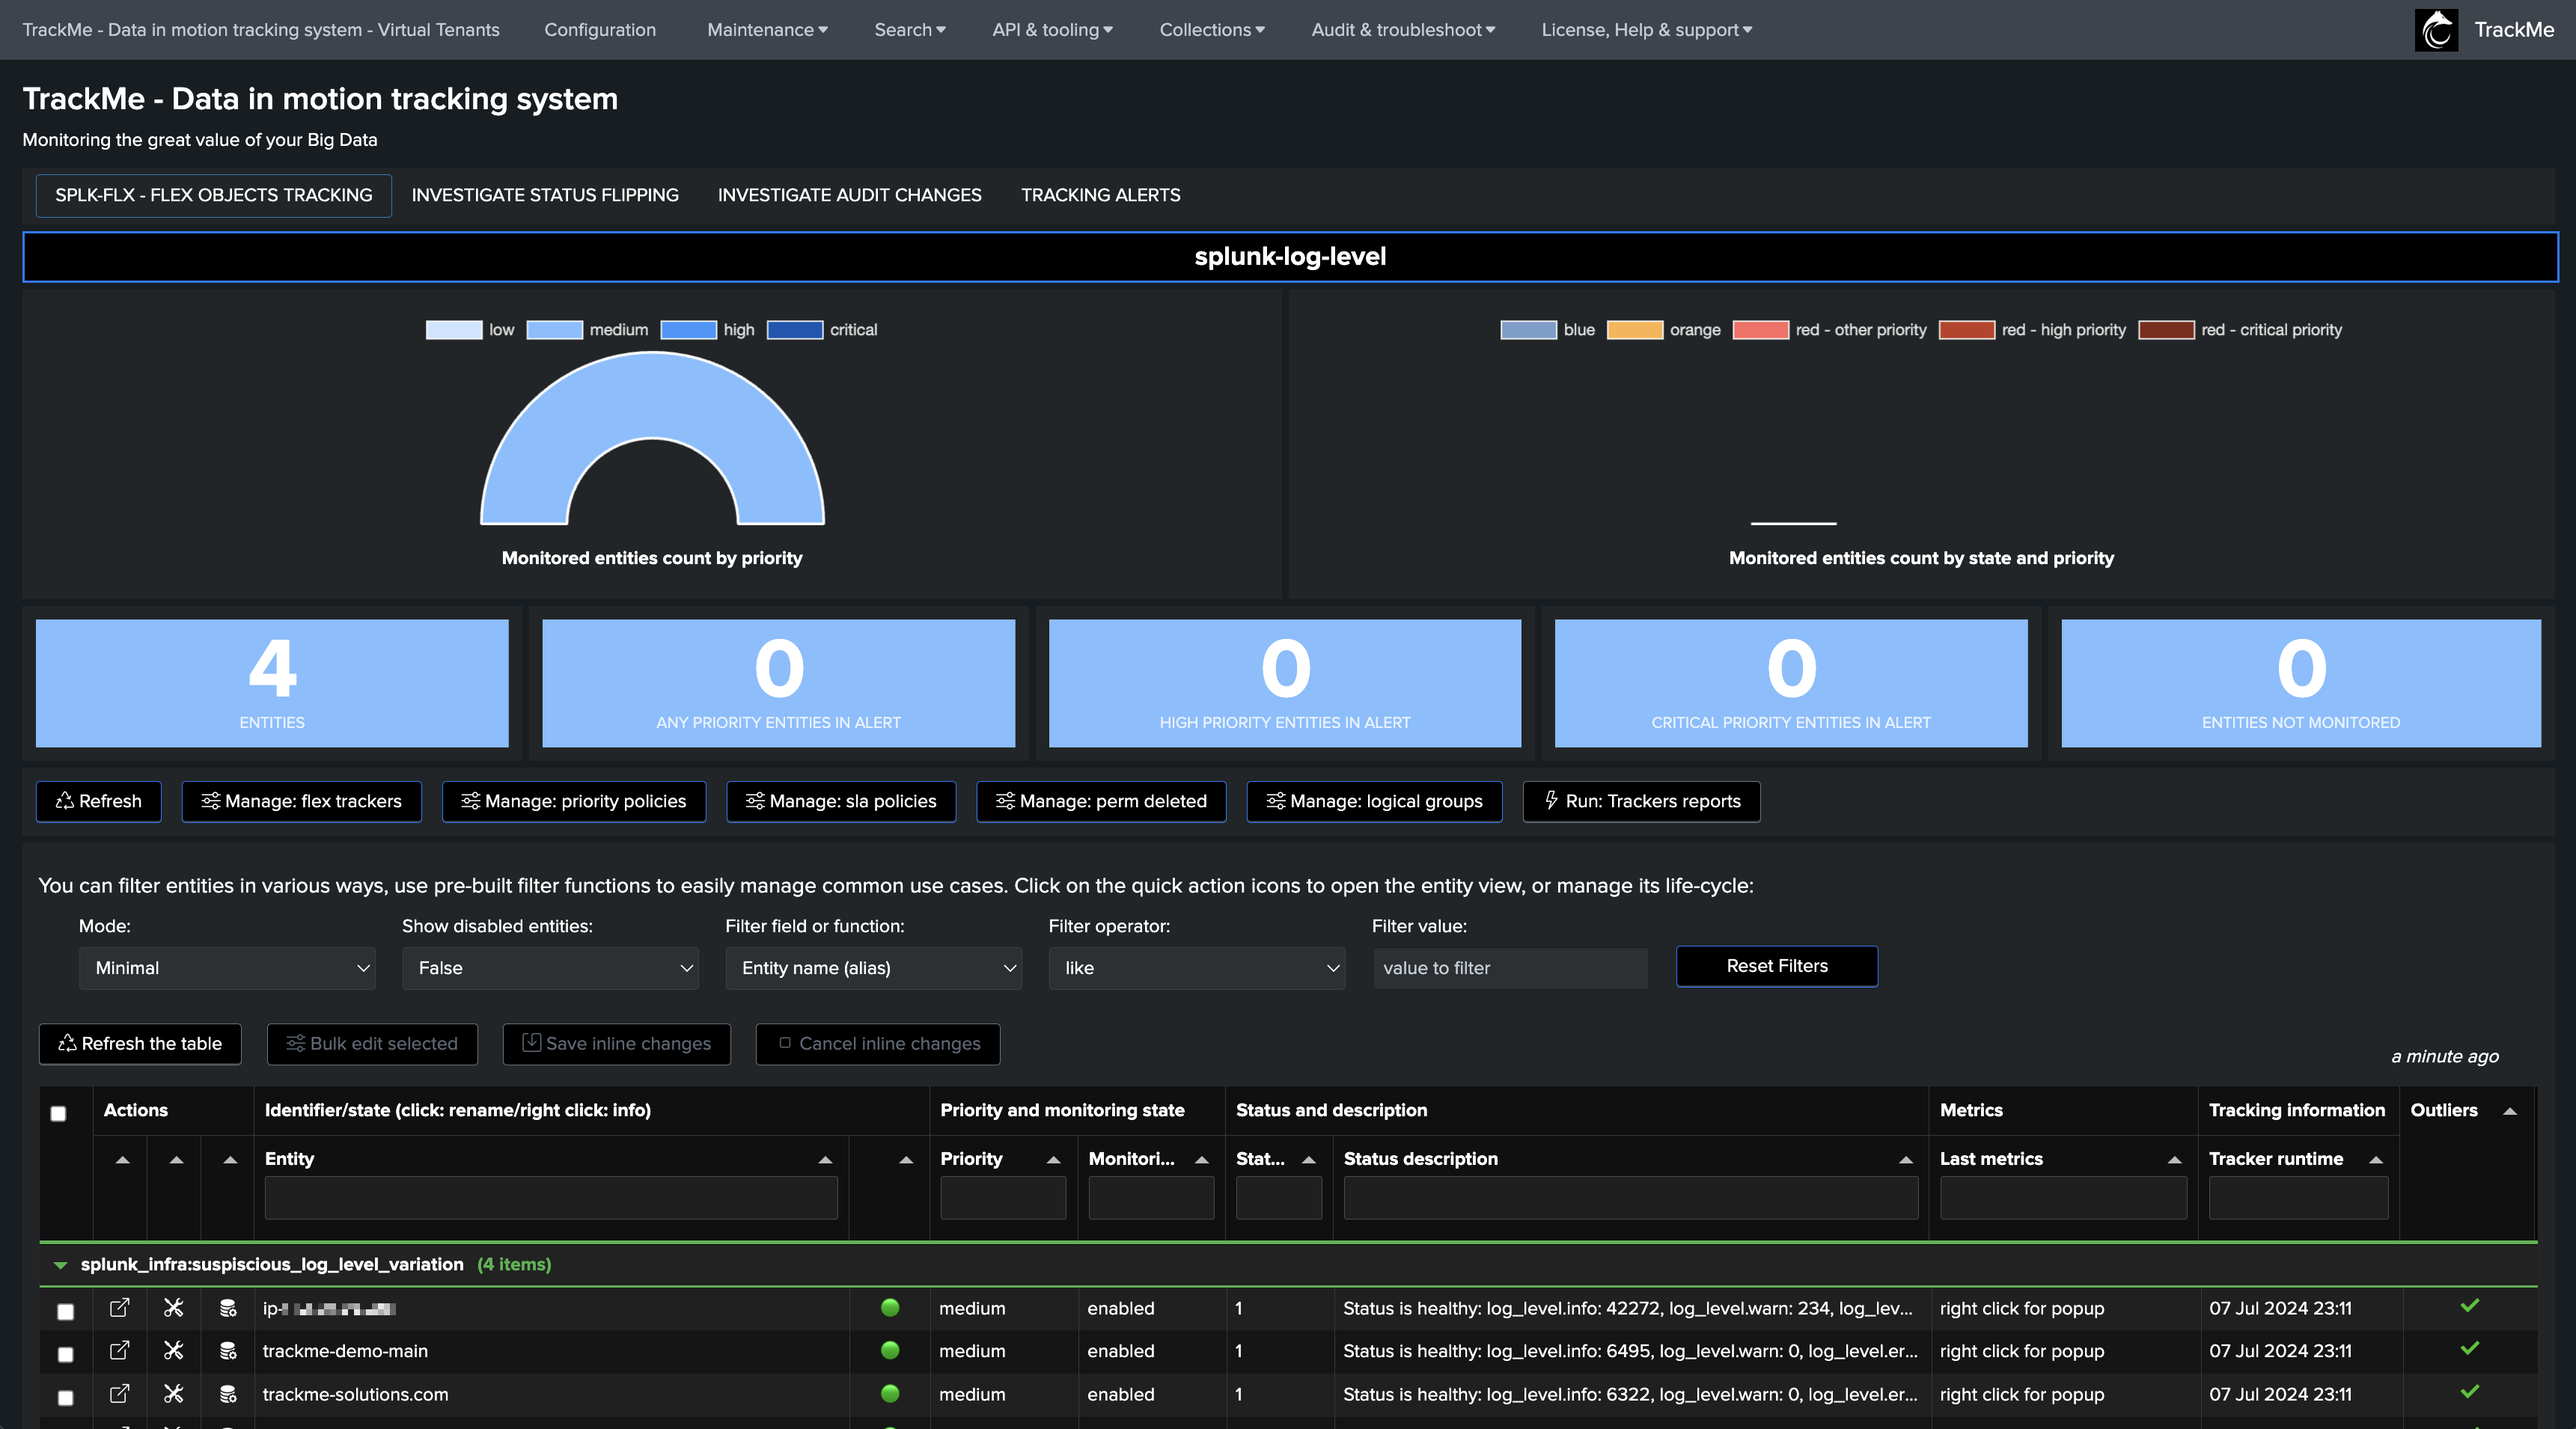
Once the tracker has been executed at least once, we start tracking the log messages logging level on a per Splunk instance basis (which you can customise):
Step 3: (optional) backfill KPIs
You can optionally backfill the KPIs, so ML models can be trained with proper dataset immediately:
Note: ensure to replace the name of the tenant in the Splunk search
index=_internal host=* log_level=* (log_level=ERROR OR log_level=INFO OR log_level=WARN OR log_level=FATAL) earliest=-30d@d latest=now

``` The basis break by statement logic happens on a per host basis, you may want to update the logic to group by tiers logic, such as grouping by indexer cluster, Search head, Search Head Cluster and so forth ```
| bucket _time span=30m
| stats
count(eval(log_level="INFO")) as "trackme.splk.flx.splunk.log_level.info"
count(eval(log_level="WARN")) as "trackme.splk.flx.splunk.log_level.warn"
count(eval(log_level="ERROR")) as "trackme.splk.flx.splunk.log_level.error"
count(eval(log_level="FATAL")) as "trackme.splk.flx.splunk.log_level.fatal"
by _time, host
| fillnull value=0

| eval alias=host
| lookup trackme_flx_tenant_splunk-log-level alias OUTPUT _key as object_id, object, object_category, tenant_id

| mcollect index=trackme_metrics split=t object, object_category, object_id, tenant_id
Once processed, KPIs should be backfilled depending on if the internal index retention allowed it:
Step 4: Review Machine Learning Outliers detection
Once TrackMe has trained Machine Learning models, you can review the results in the Machine Learning Outliers detection dashboard:
Note: You can manually run the mltrain job to force training the models now, or train a particular model through the UI
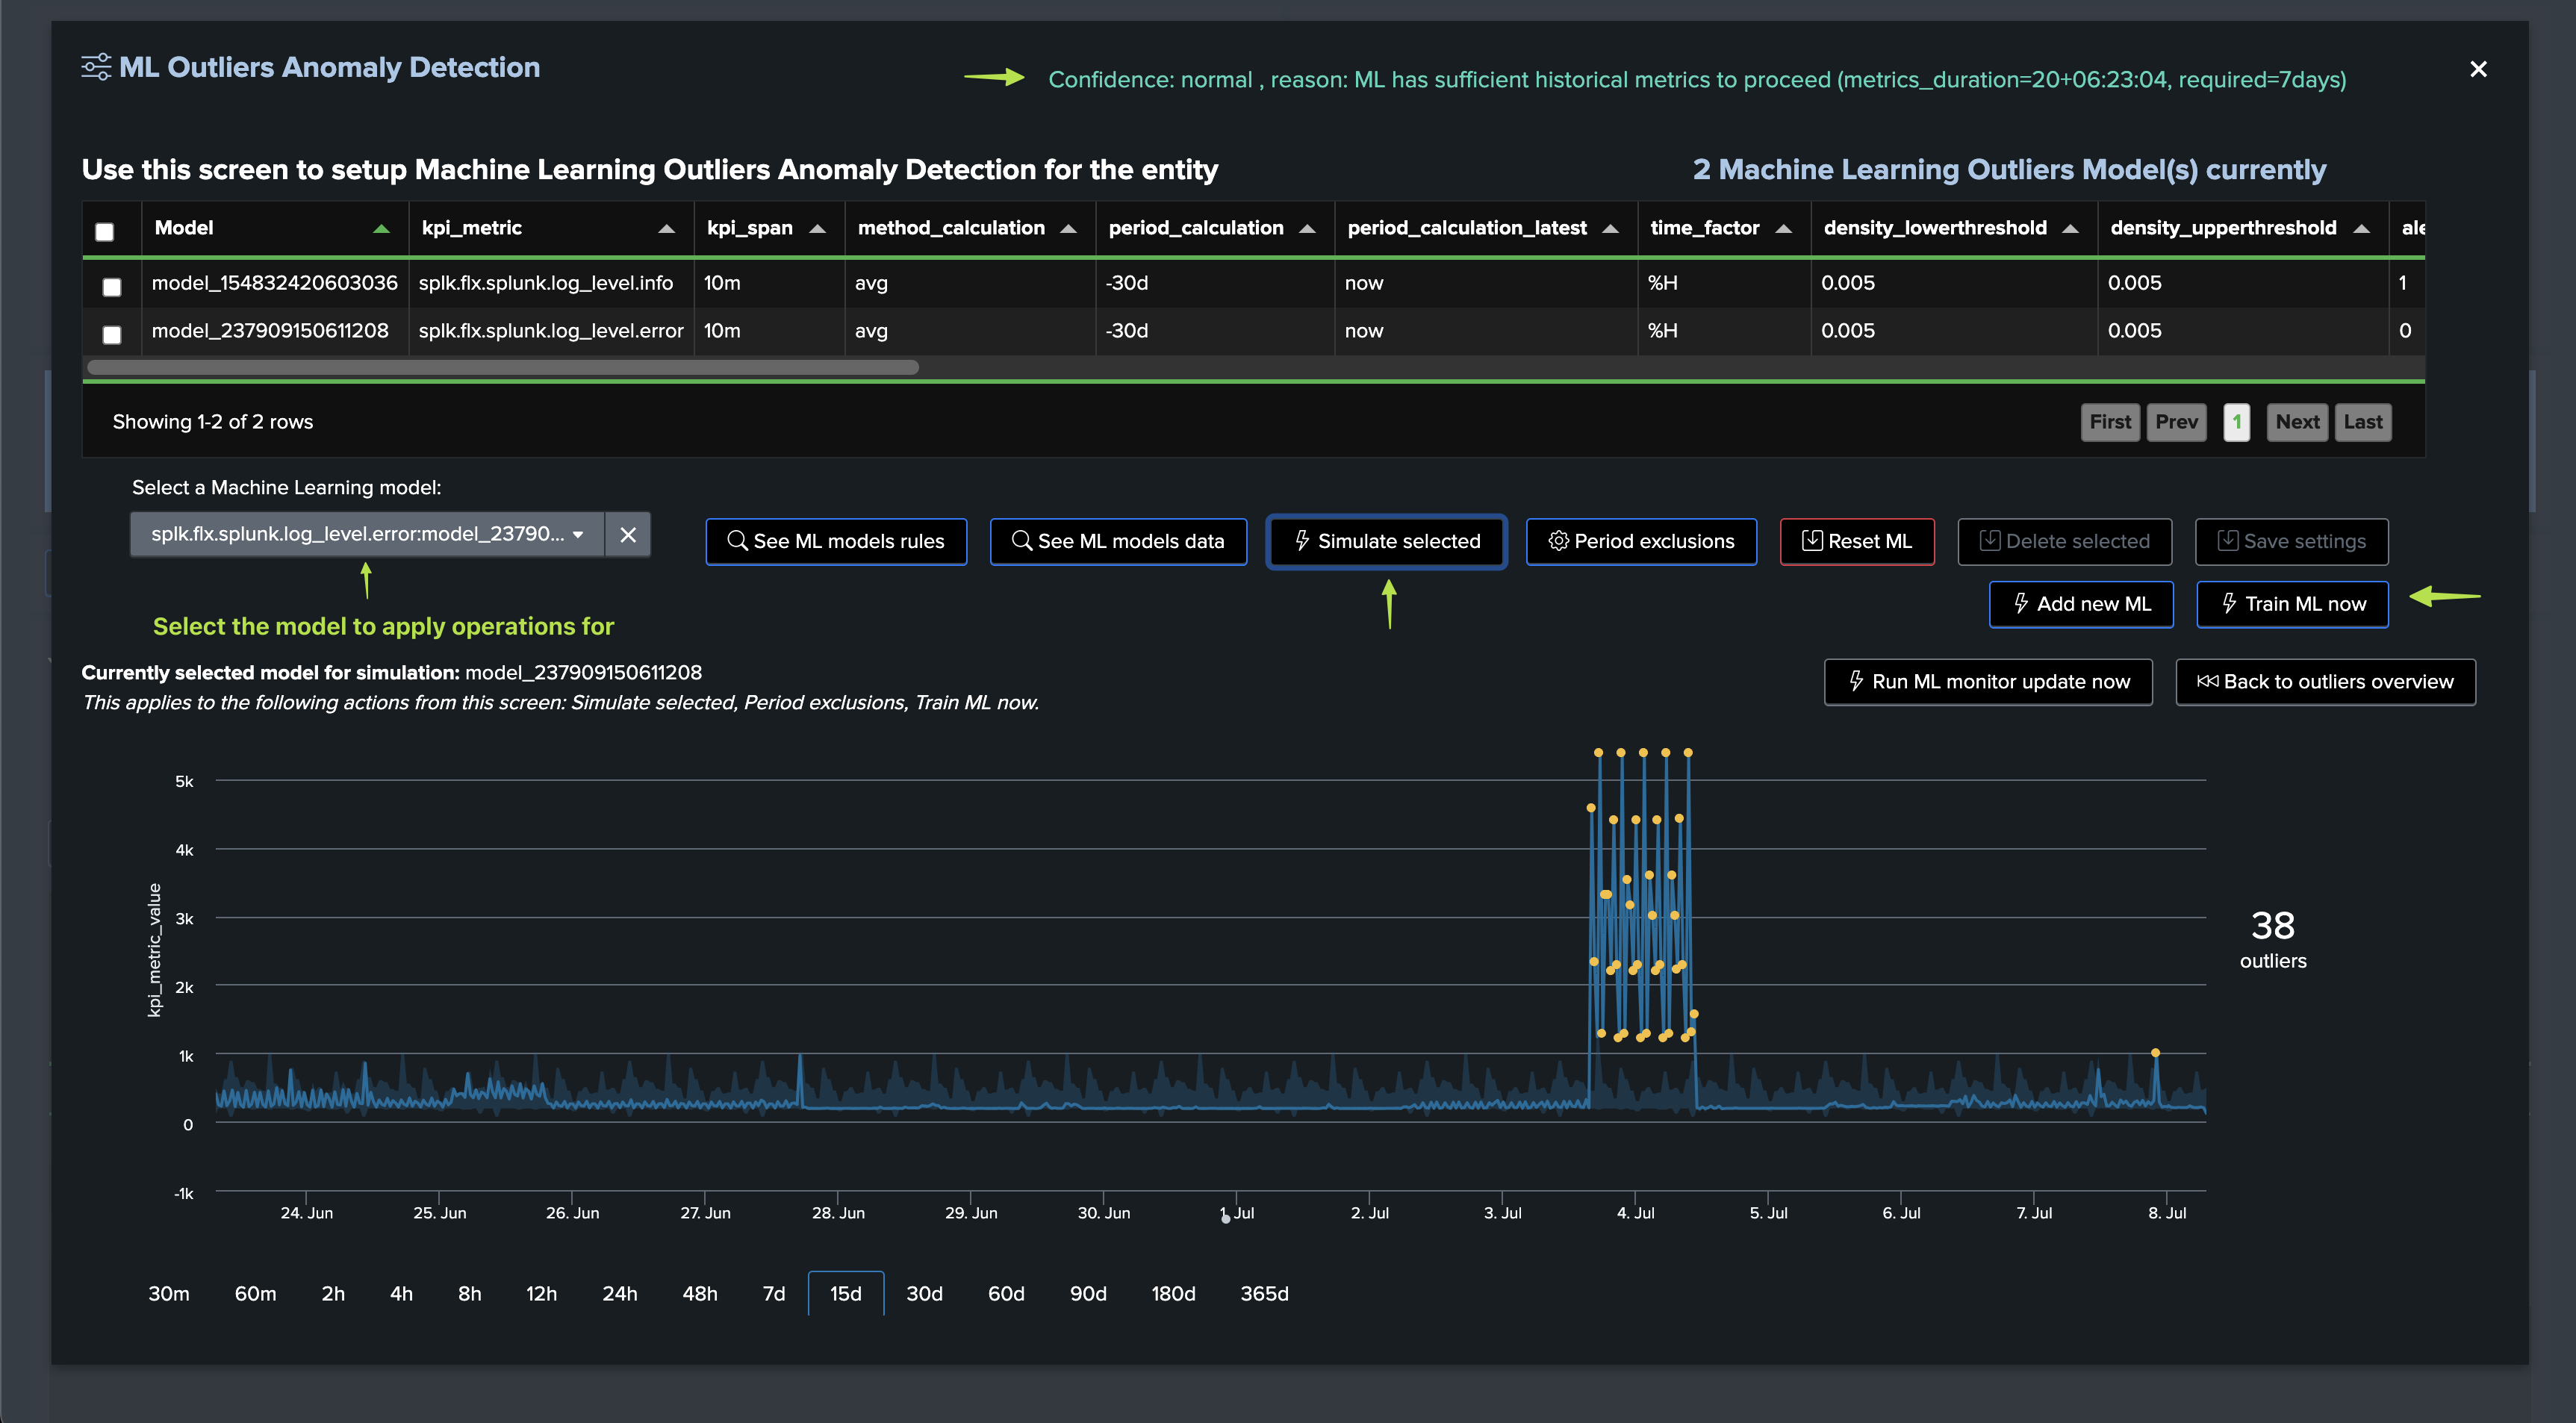
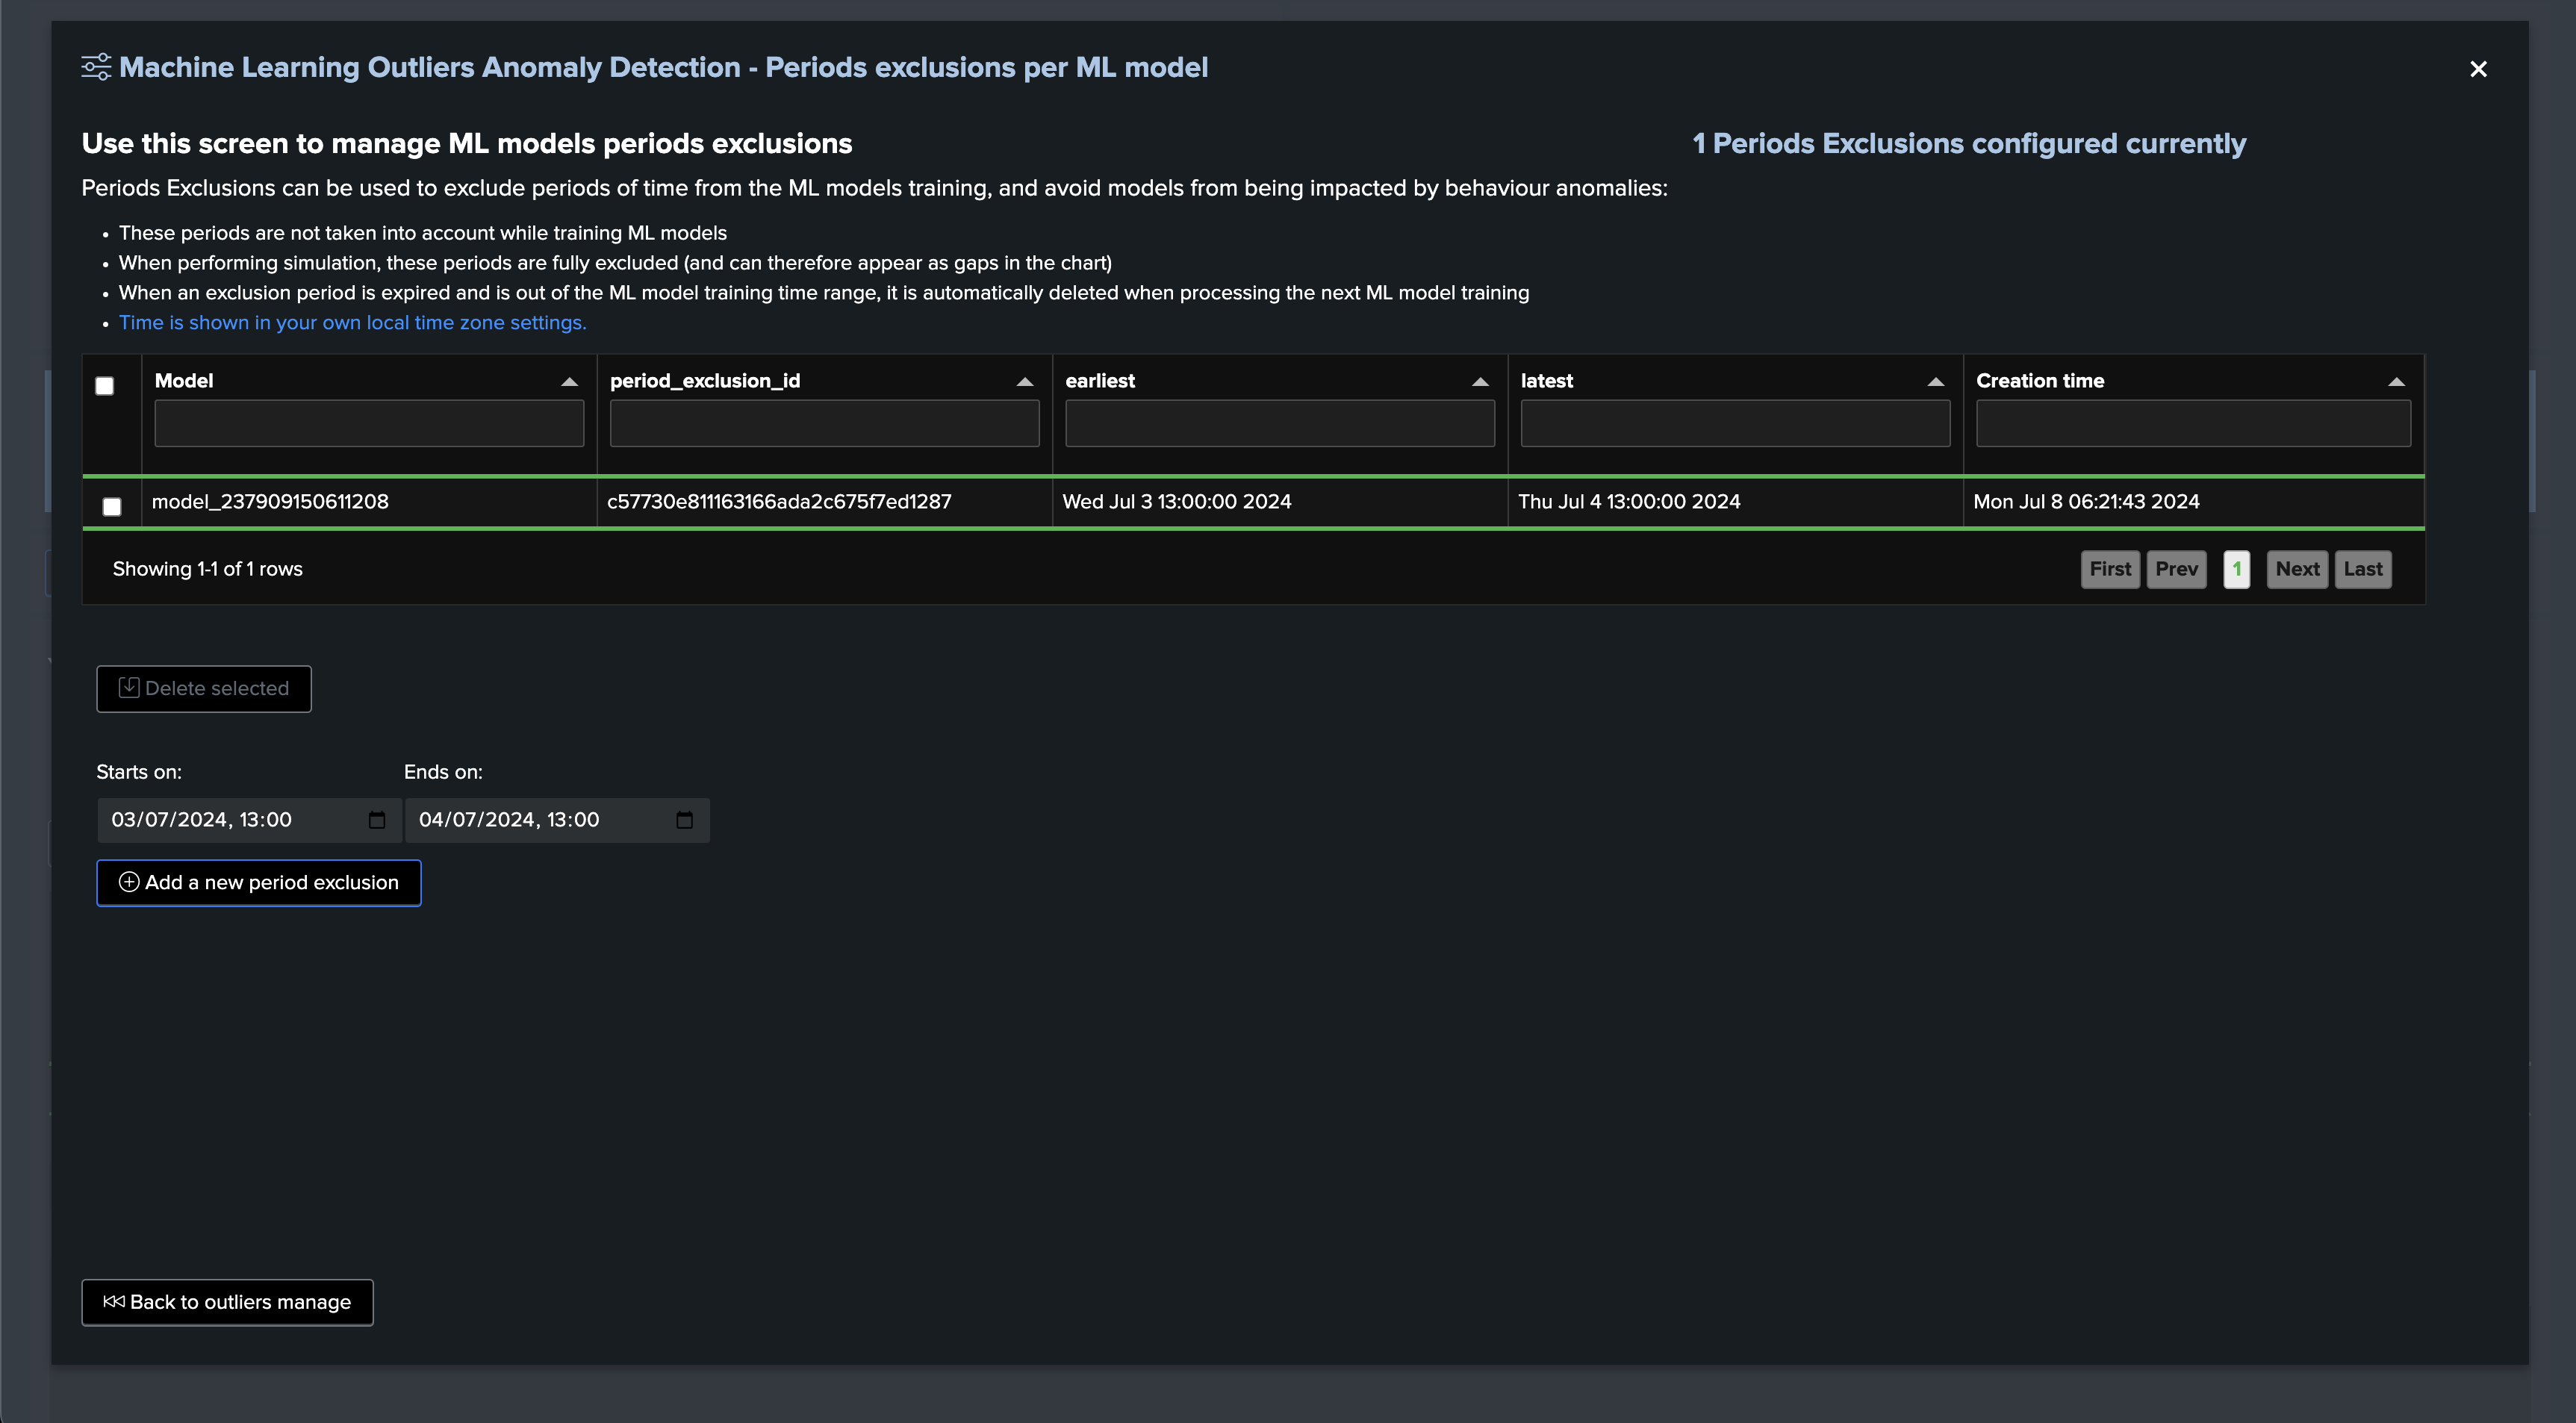
In our demo case, we know we already have an abnormal period, which can add as an exclusion so the models are not affected by this period:
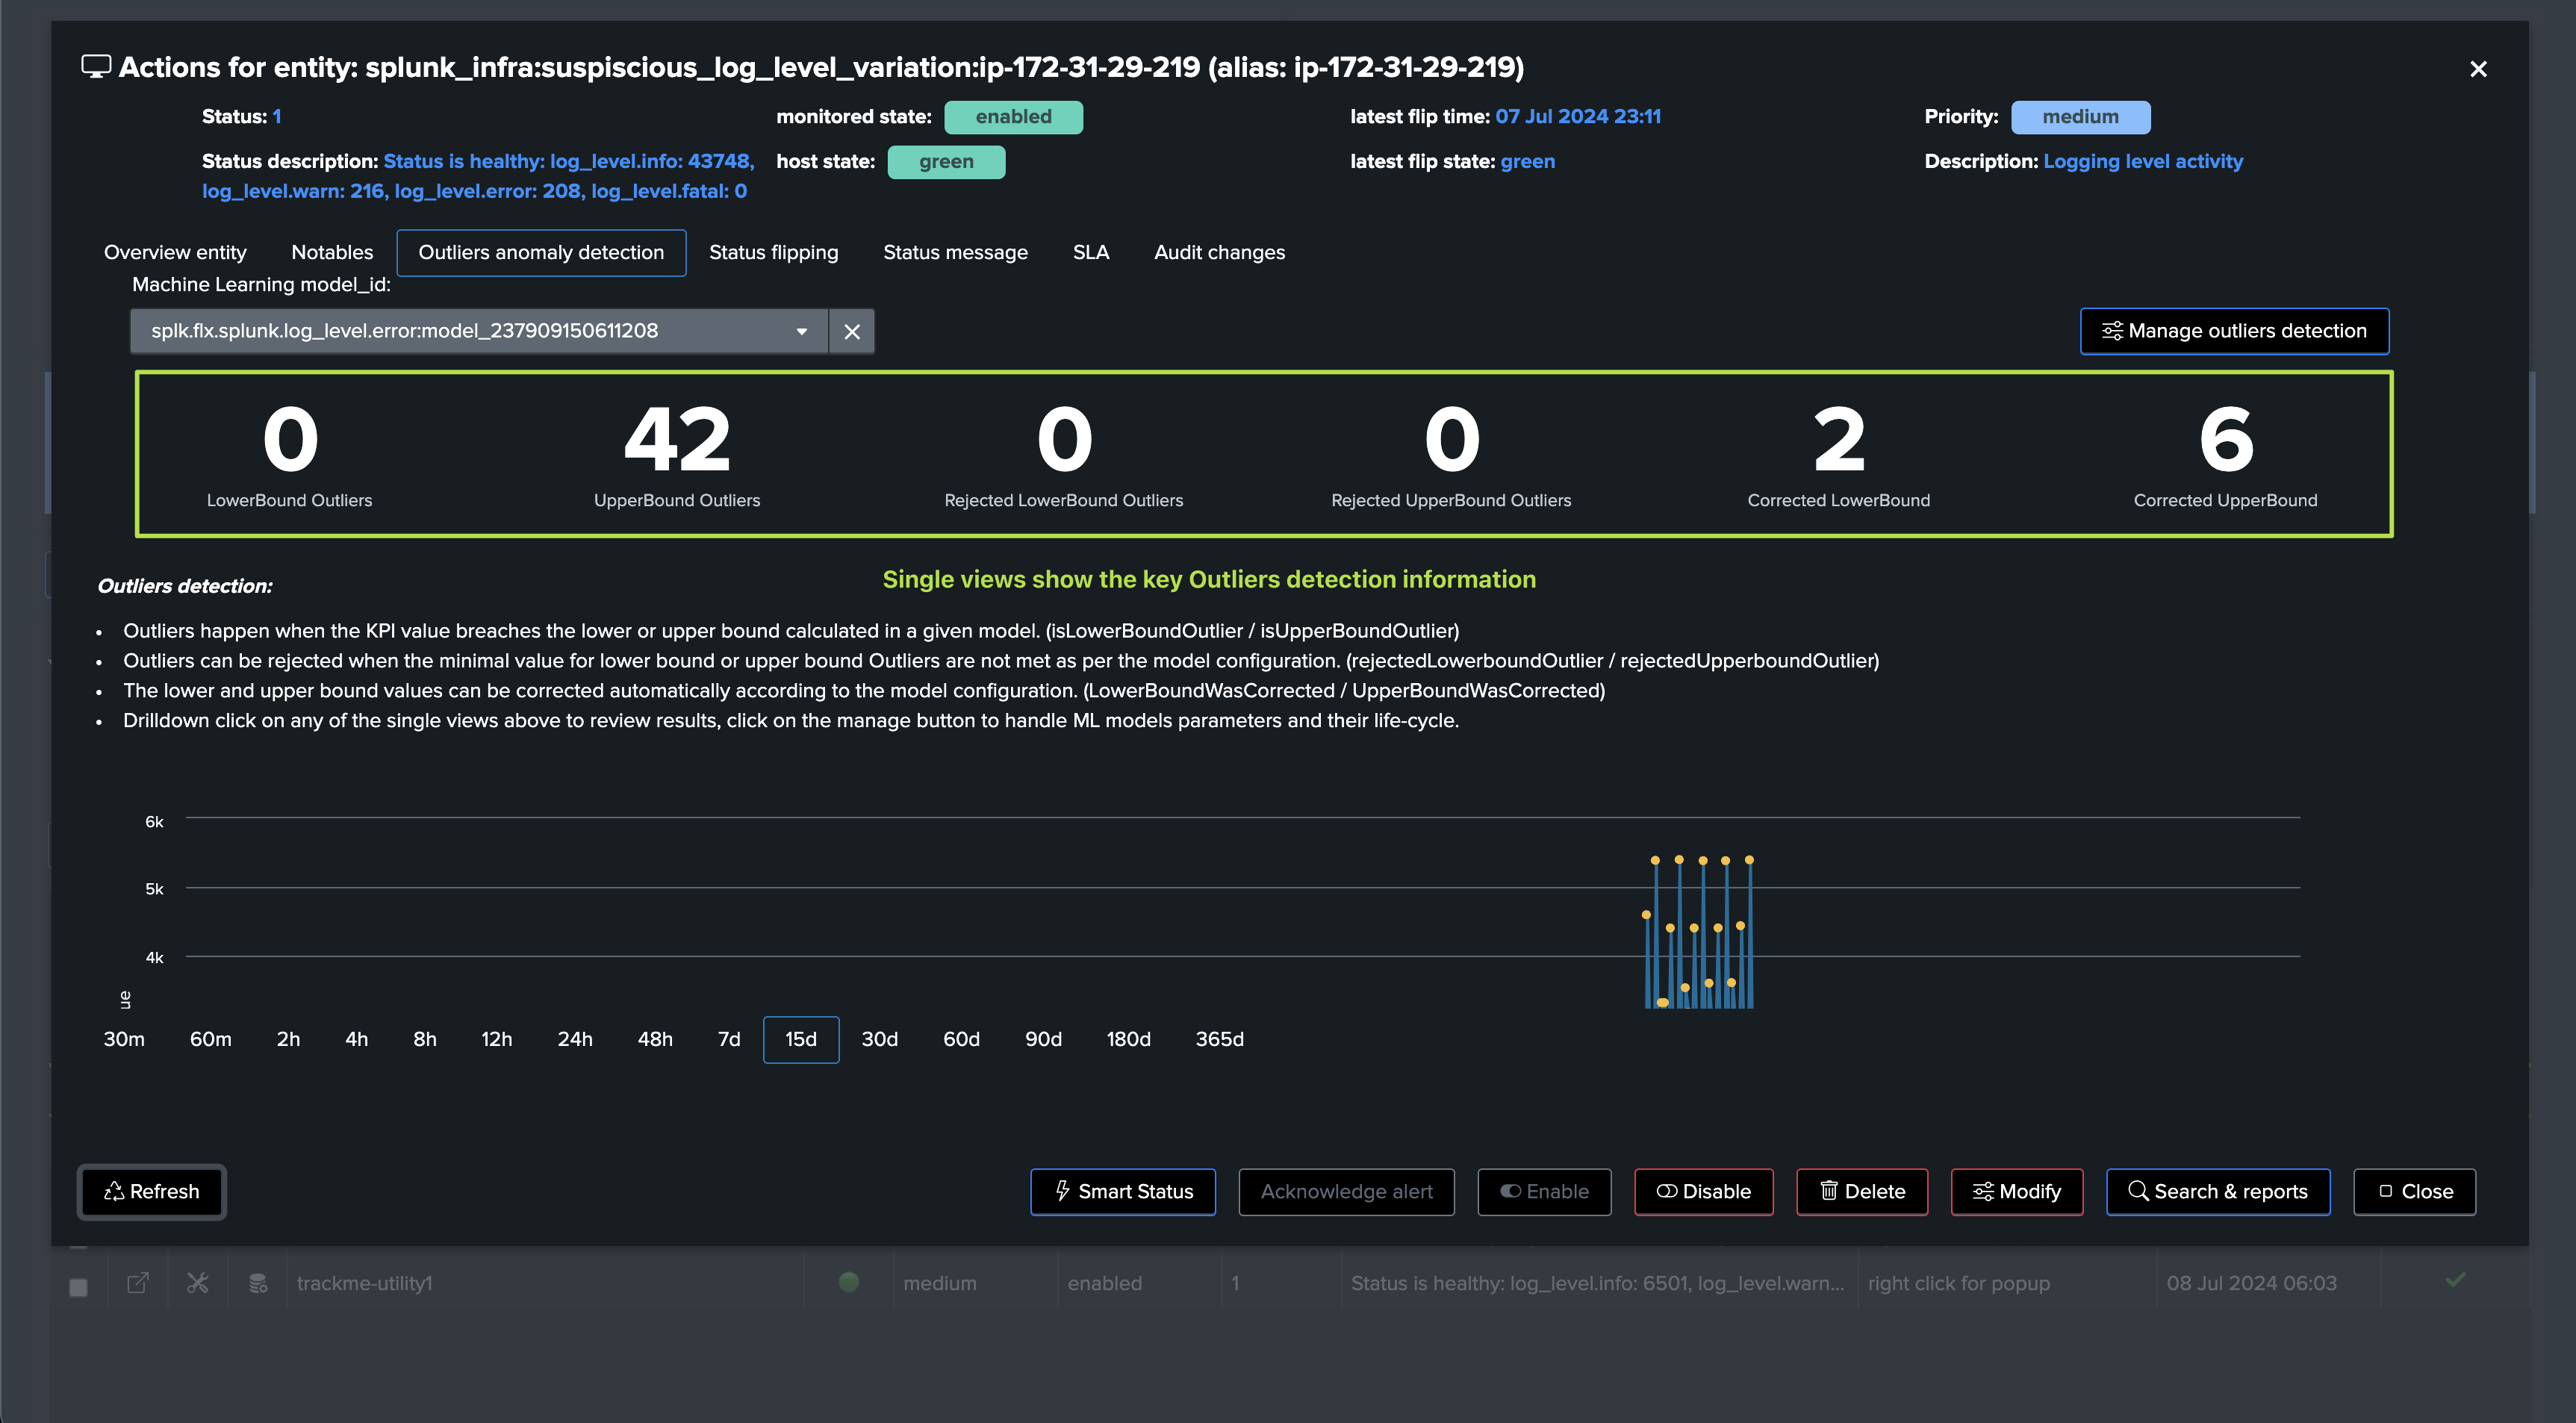
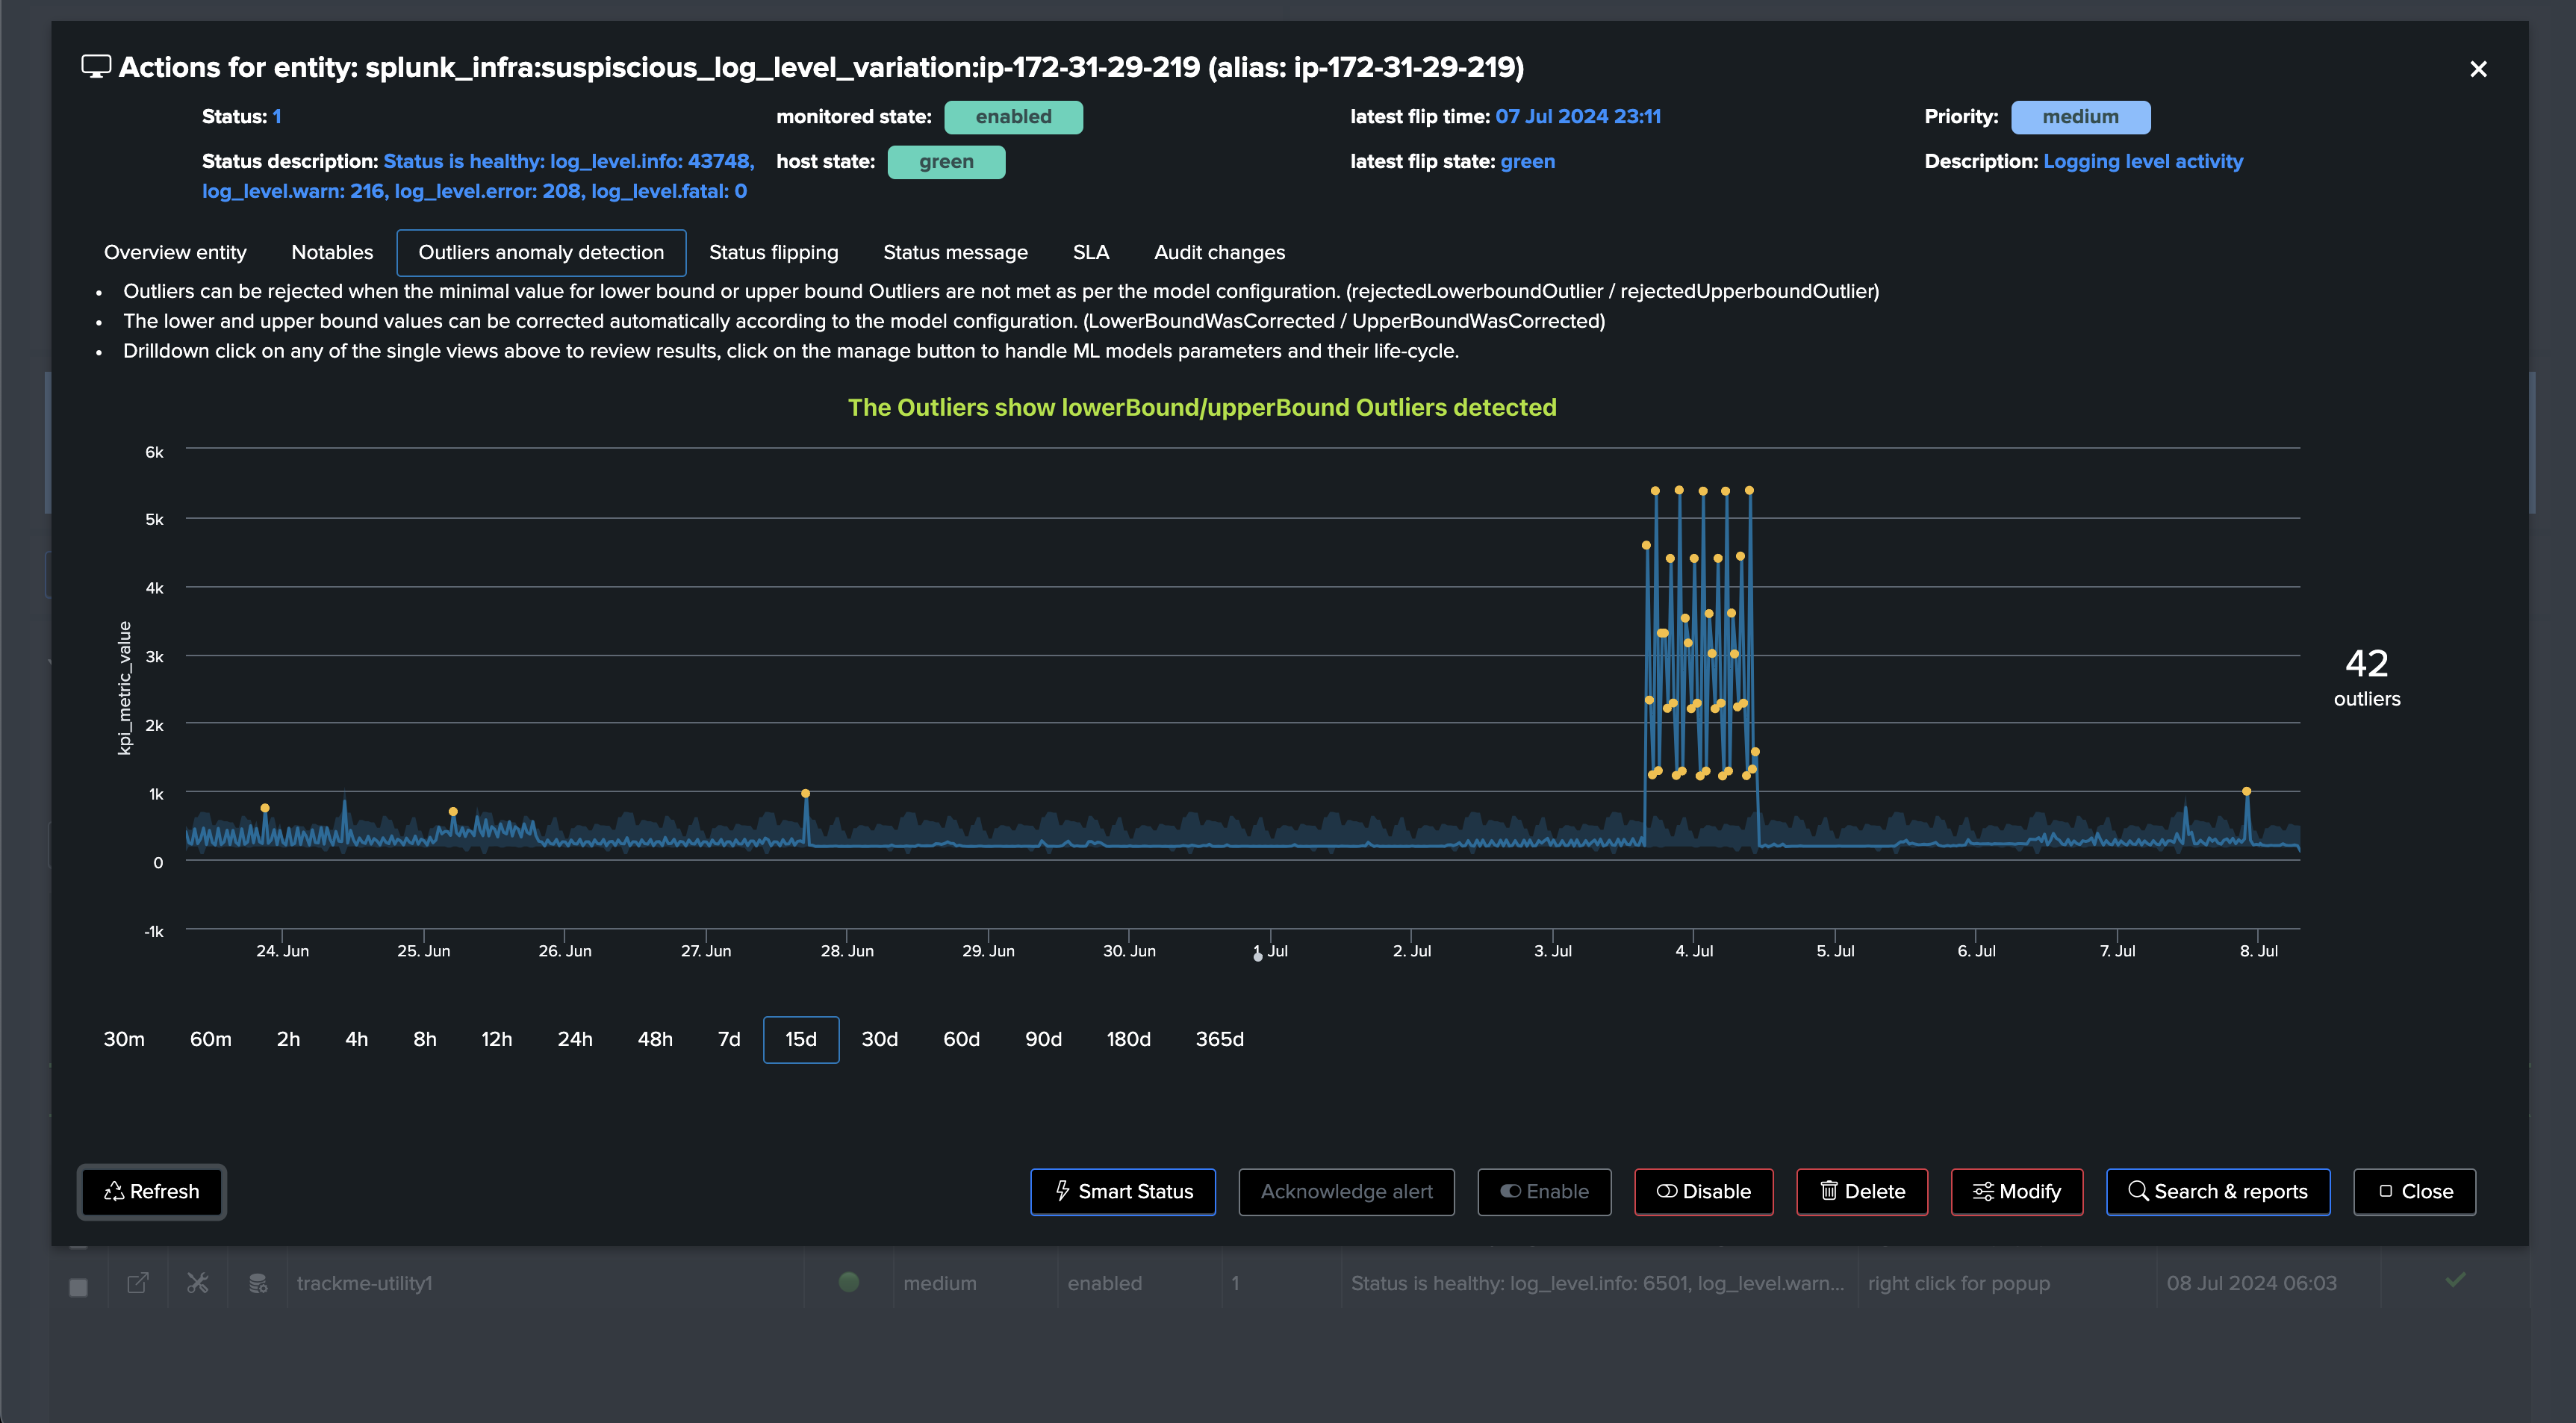
Detecting abnormal error logging increasing trend:
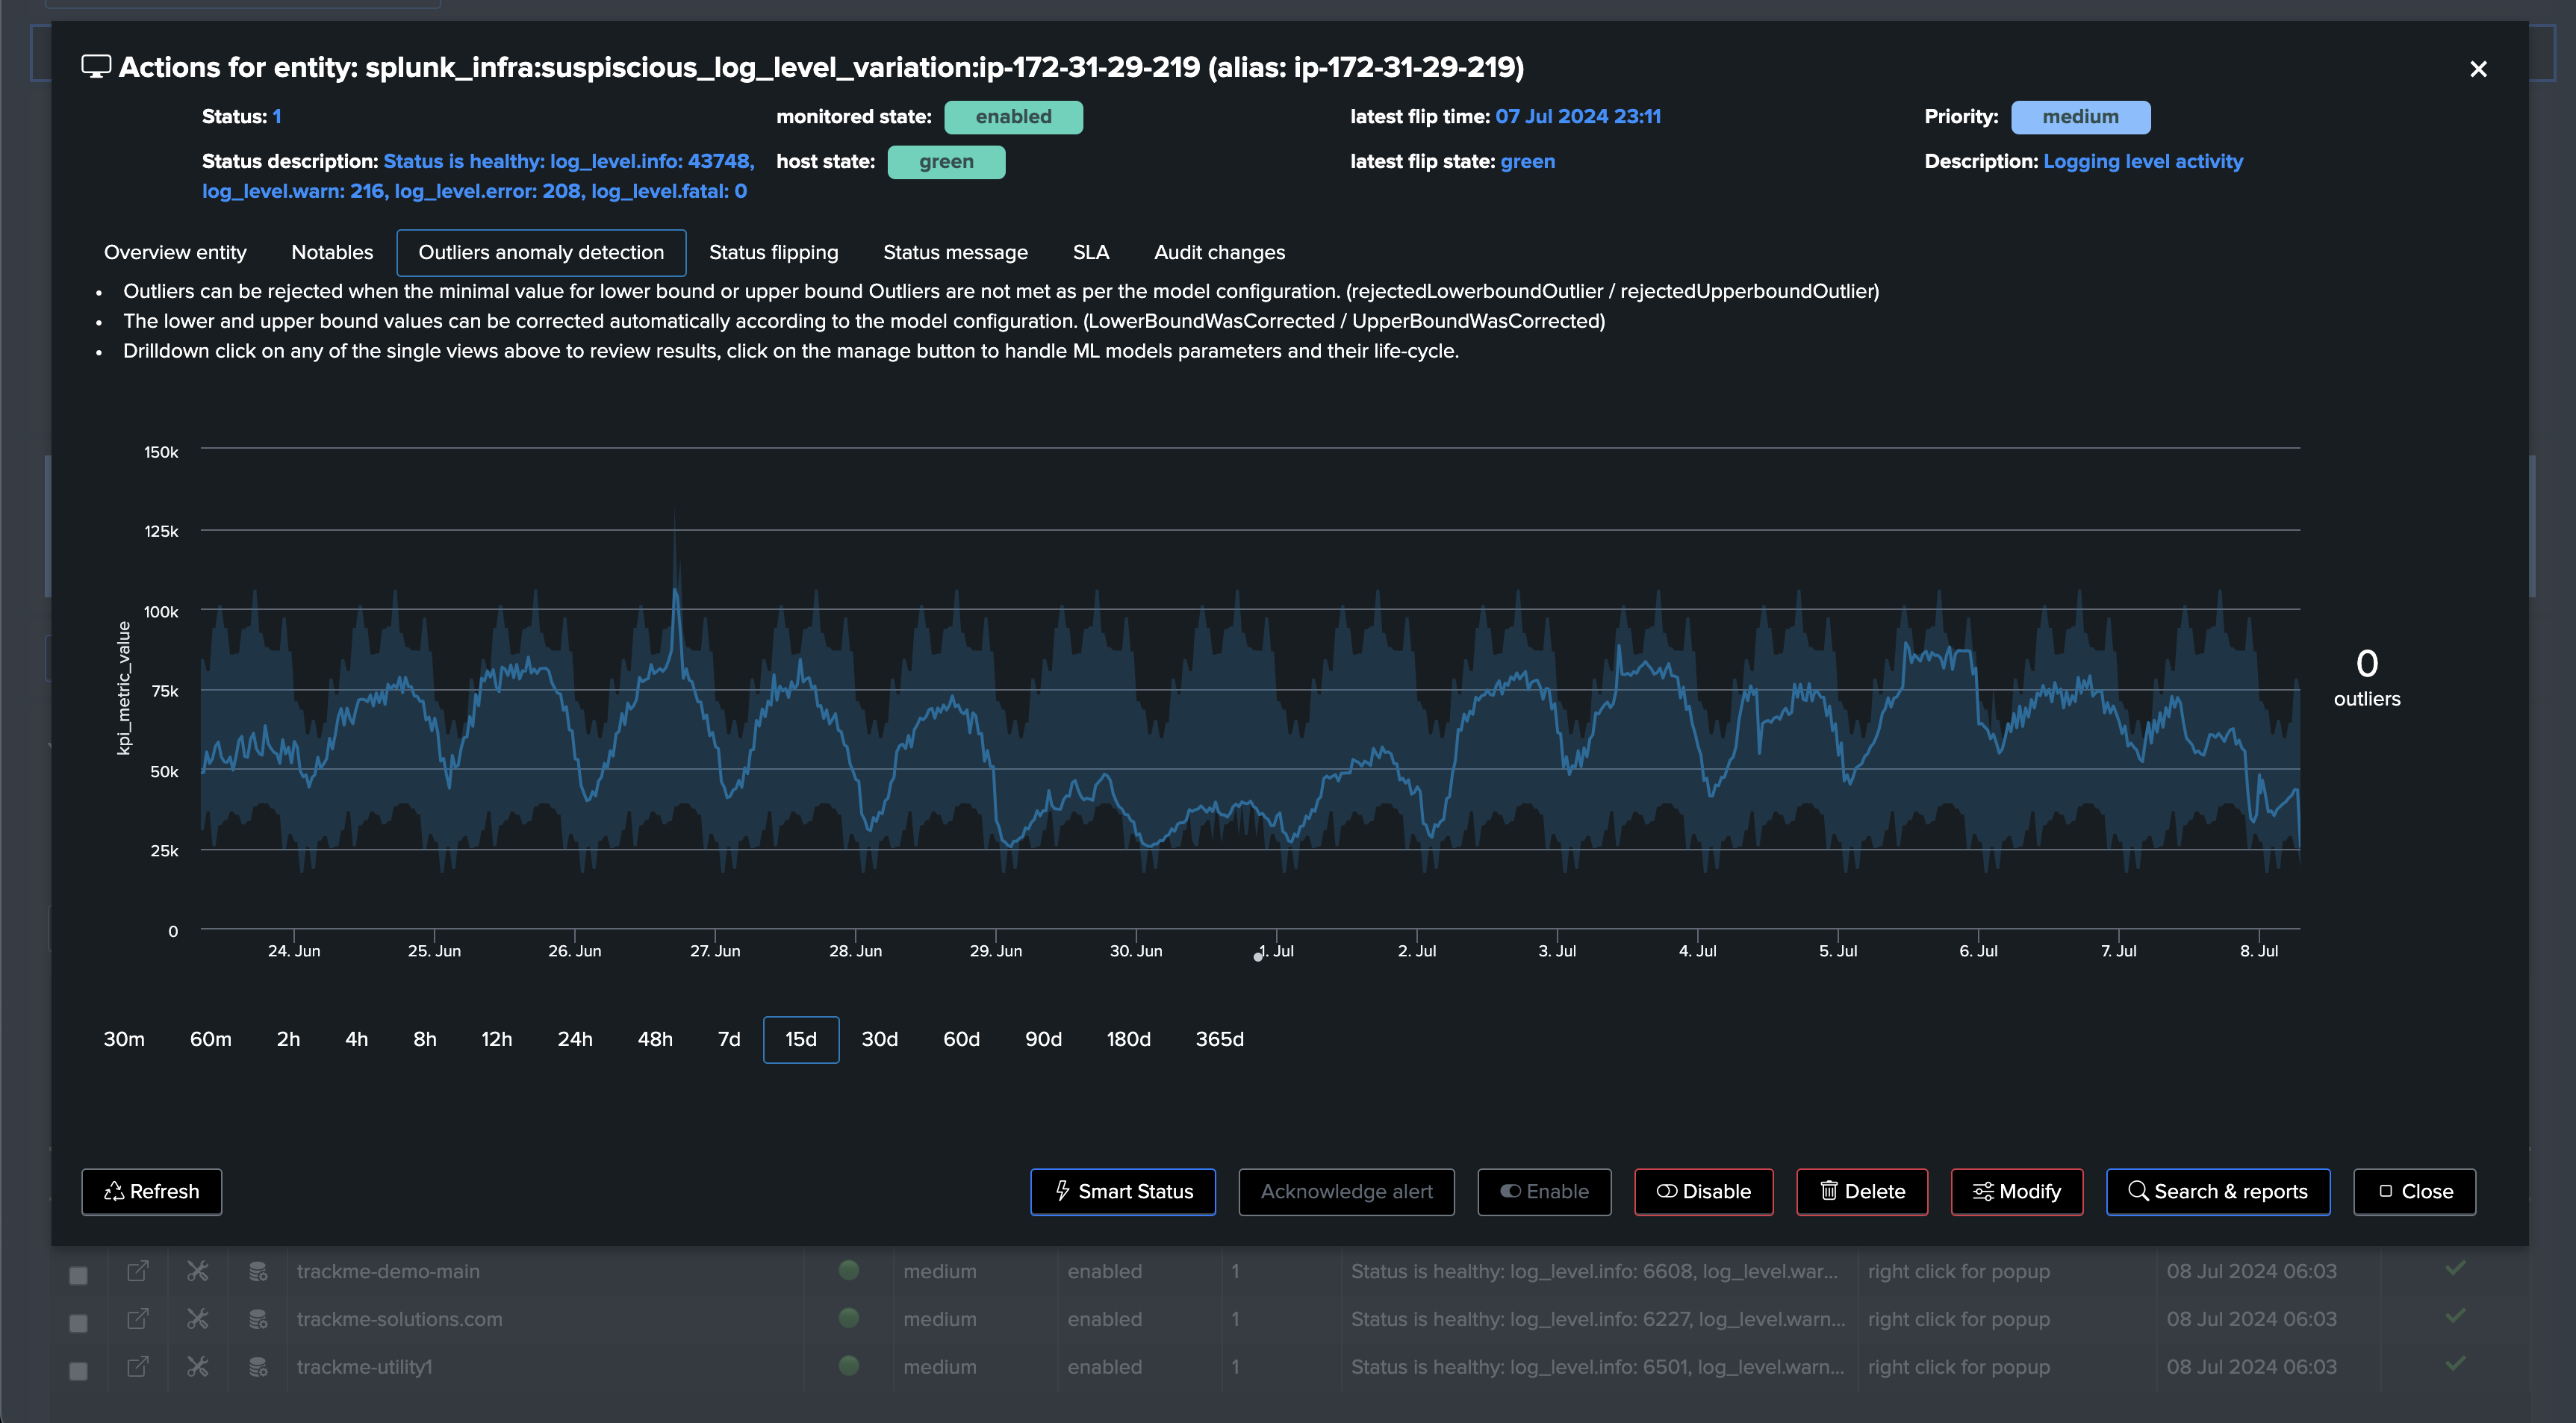
Detecting insufficient informational logging:
Our detection is now fully ready, and TrackMe will alert us if abnormal conditions are detected on the Splunk instances and deployments.