Status Message
Introduction to the Status Message
The TrackMe status message is a human-readable status that describes the reasons why TrackMe defines the entity status. It is the fastest and easiest way for an analyst to understand the reasons behind the status of a TrackMe entity. TrackMe entities can have the following statuses:
Green: The entity is considered to be in a healthy state.
Red: The entity is considered to be in a non-healthy state.
Orange: This is an intermediate status, indicating a condition such as the detection of data in the future.
Blue: The entity is a member of a logical group that fulfills the monitoring conditions but is in a non-healthy state.
The status is influenced by different factors, such as Key Performance Indicators and additional features such as the Machine Learning Outliers detection.
Factors Influencing the Status
These conditions differ depending on the type of TrackMe component.
For instance, with the splk-dsm TrackMe component (which stands for Data Source Monitoring), the essential factors can be:
If the entity is suffering from latency at the ingestion (the maximal acceptable threshold for the latency for this entity was breached)
If the entity is suffering from delay (the data flow is interrupted according to the entity threshold)
Quality anomalies were found by the Data Sampling TrackMe feature (events format recognition)
Outliers were detected by the Machine Learning engine
And more.
The “status_message” field is a readable translation of the machine status for that entity, adding context to easily and quickly understand the reasons behind the status.
Availability of the Status Message
The status message is made available in different parts of TrackMe, such as:
A graphical object in the user interface for the analyst to review
As part of a notable event created by a TrackMe alert
As part of the alert results themselves
Stored in the main KVstore of the TrackMe Virtual Tenant and component, in the status_message field
Reviewing the Status Message
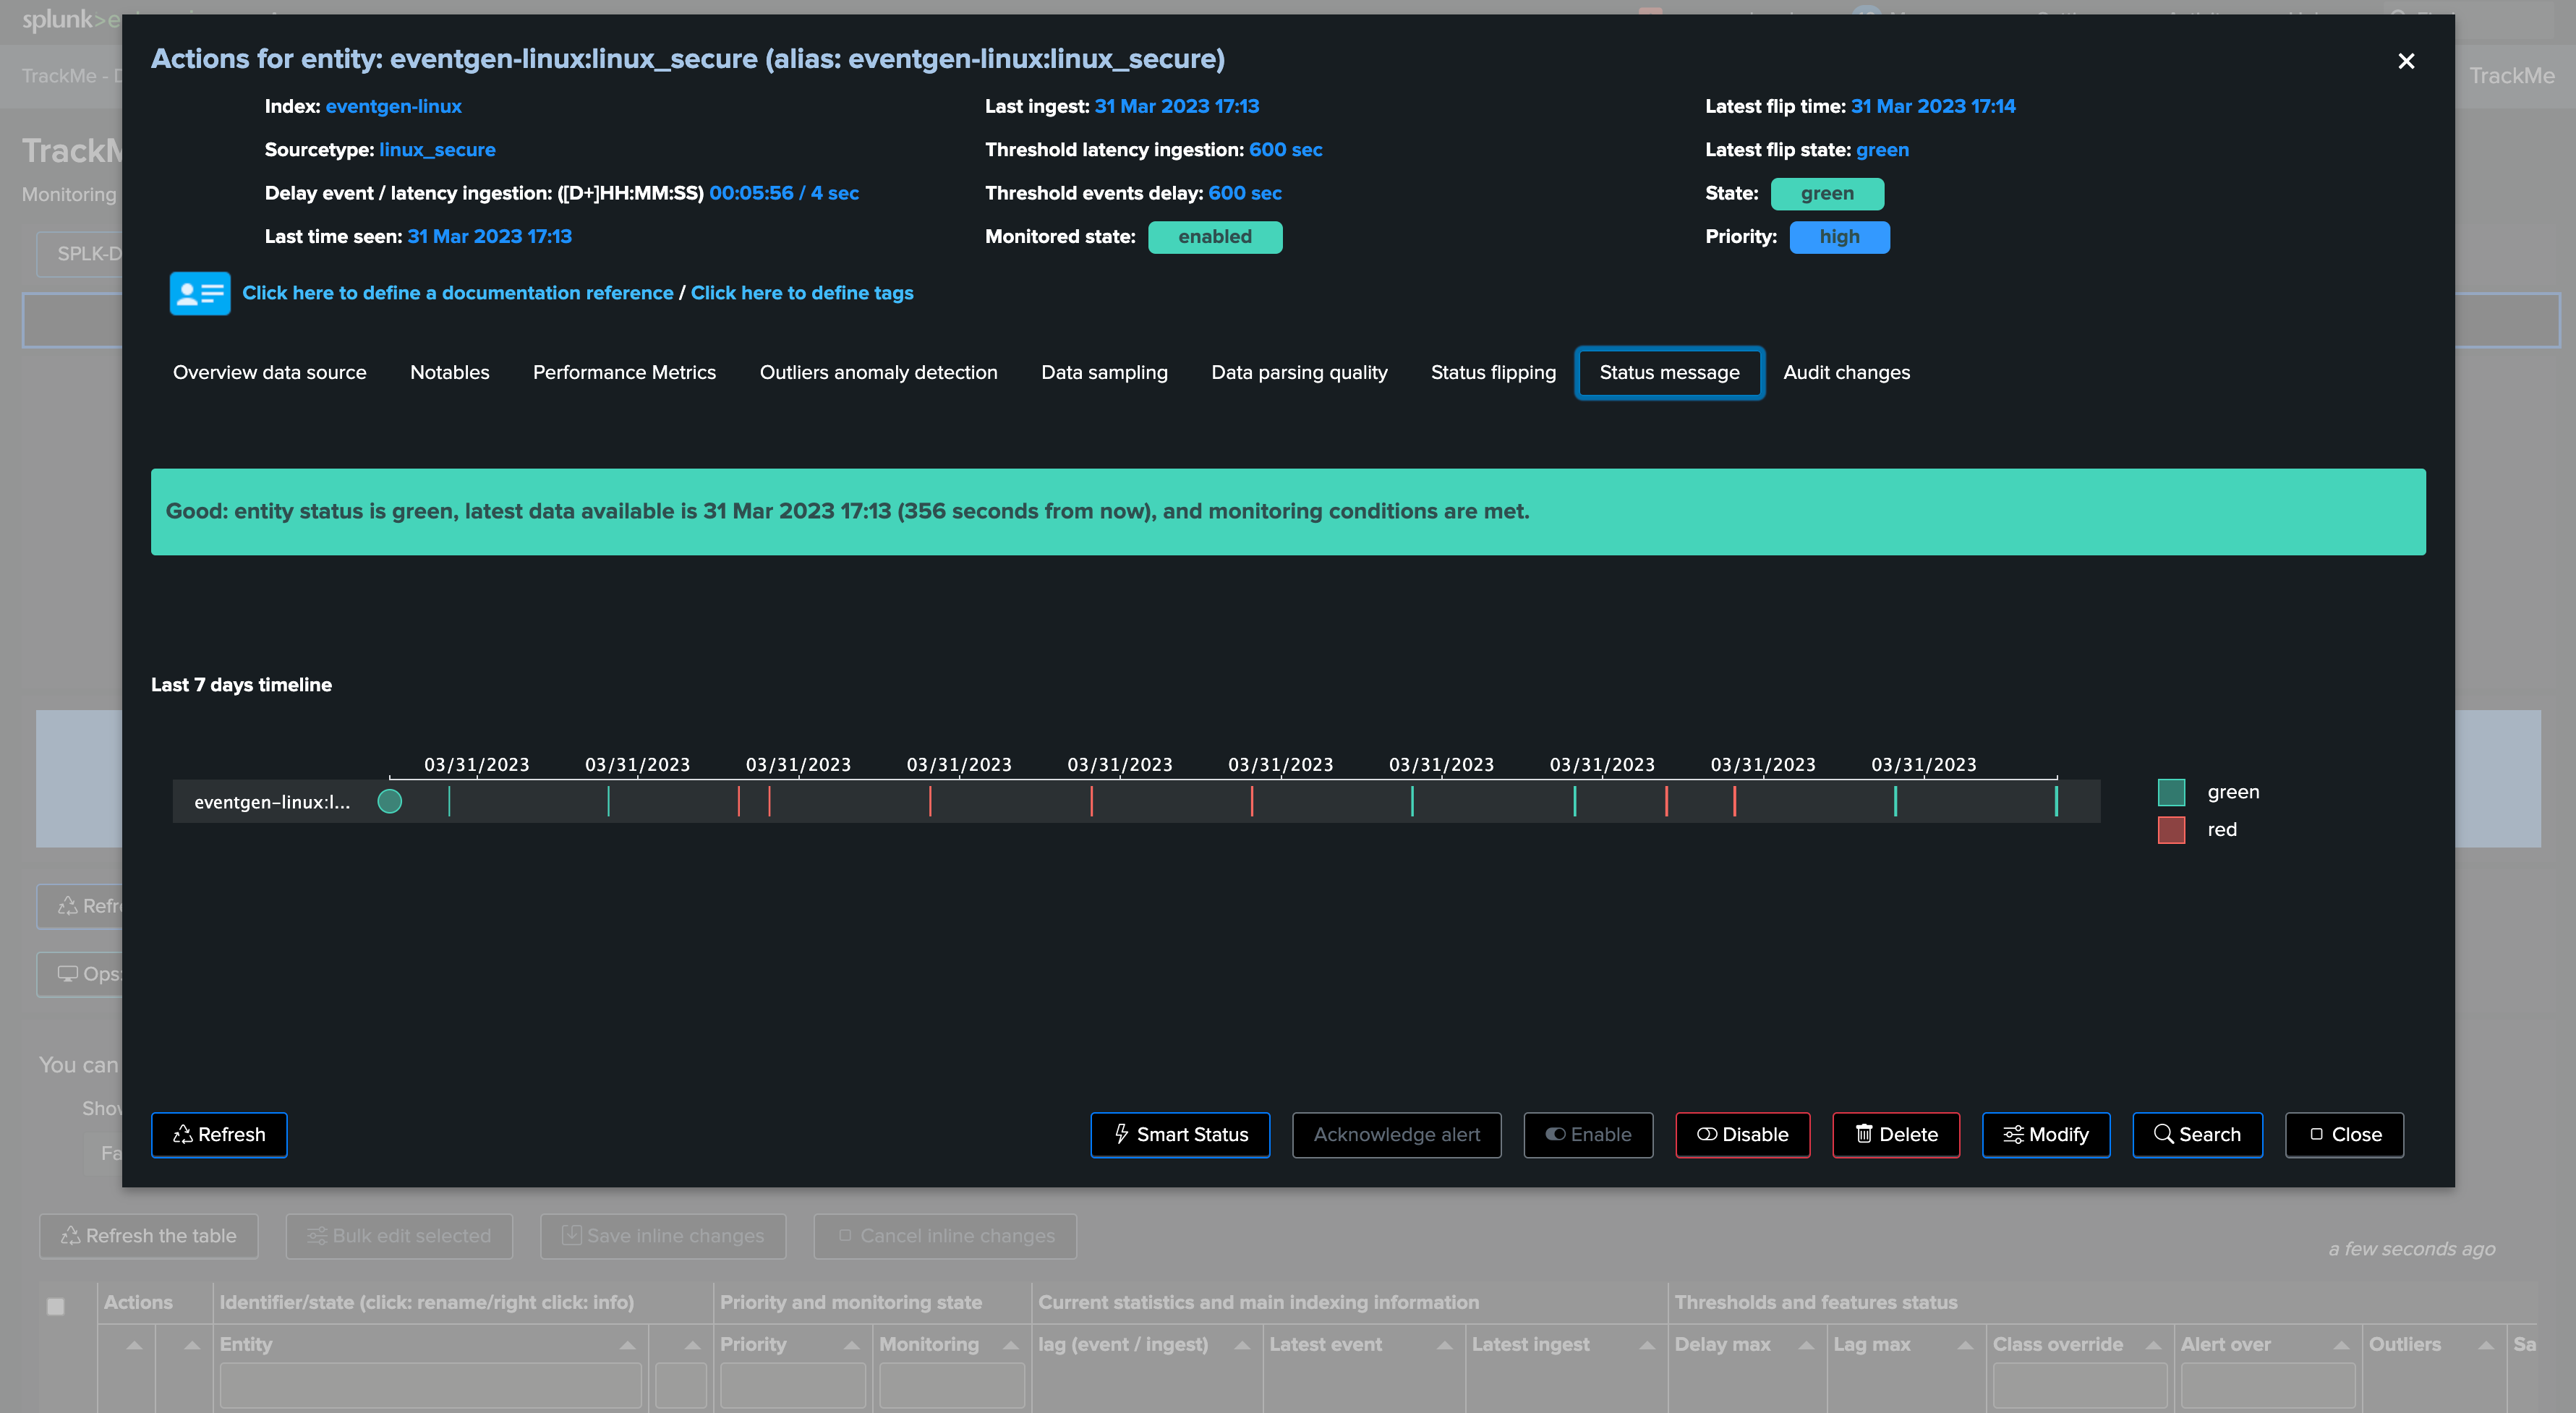
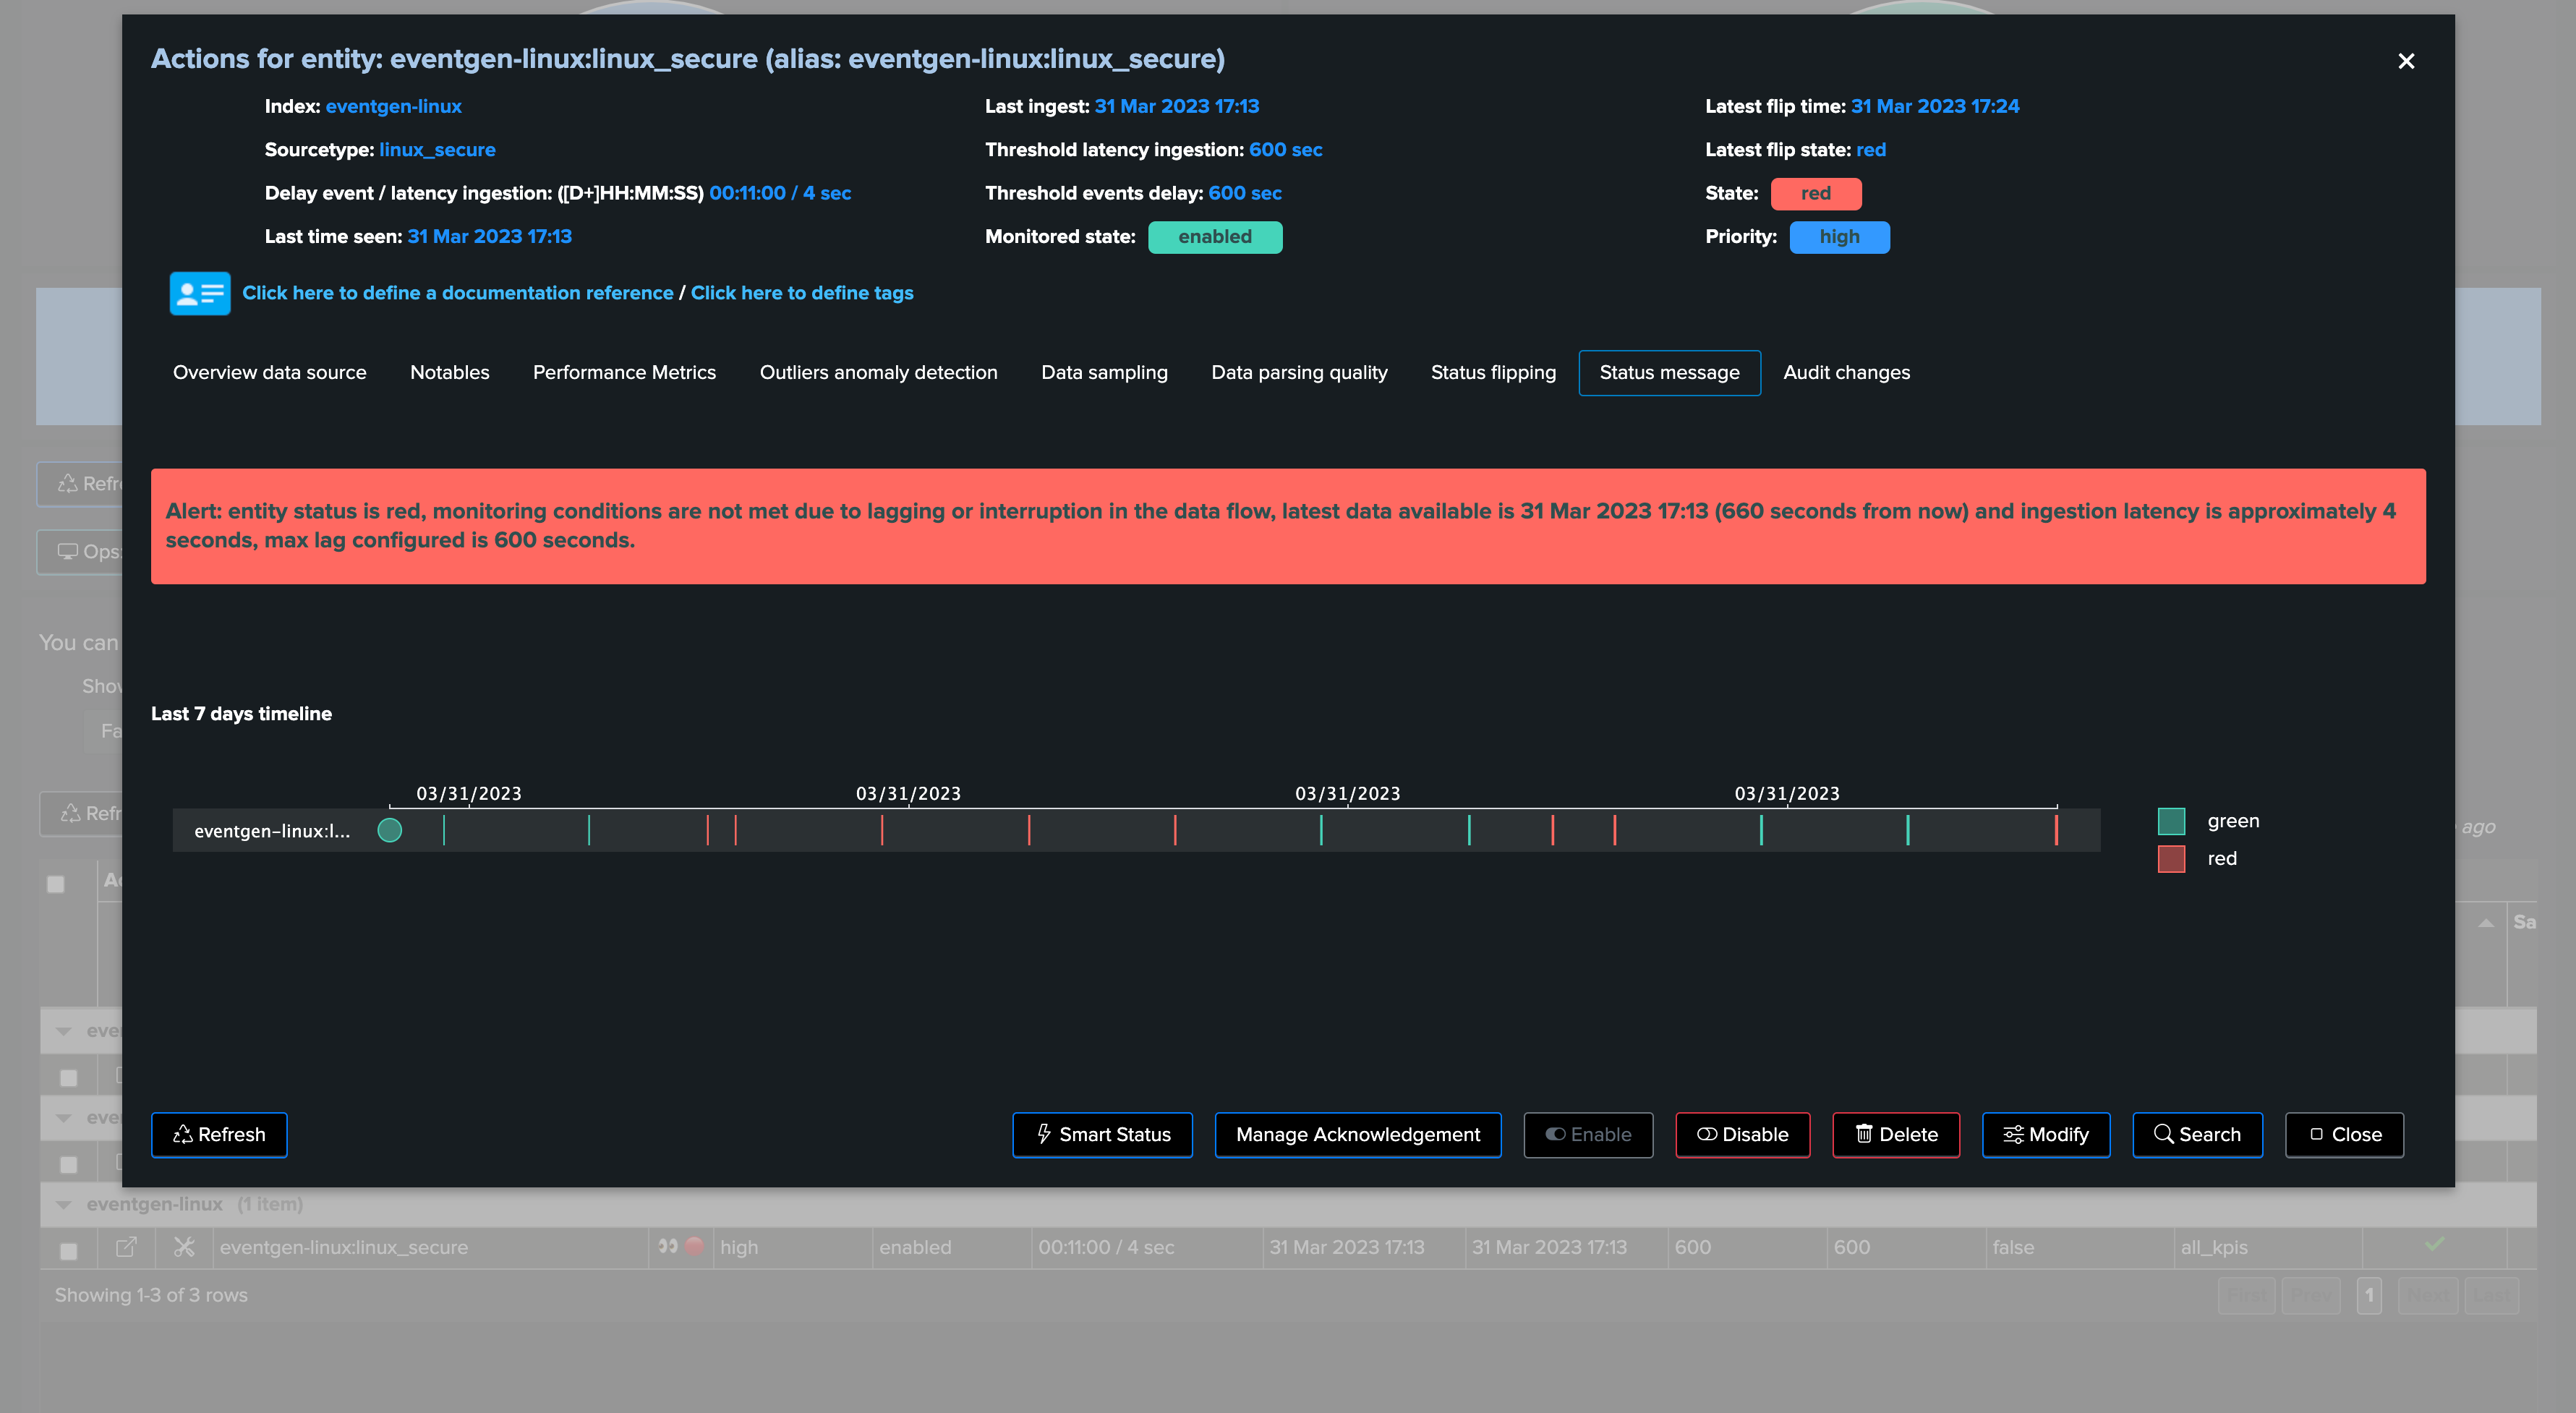
The status message of an entity is easily accessible from the tab called “Status message” in the entity main screen. The message content is associated with the color code of the entity state, such as red, green, etc.
Examples of Status Messages
Here are some examples of status messages:
Green:
{
    "status_message": [
        "monitoring conditions for event delay are met. Event delay is 49.565 seconds (duration: 00:00:49), which is lower than the maximum allowed delay of 3600 seconds (duration: 01:00:00), latest event available (_time) for this entity: 15 Aug 2025 10:55",
        "monitoring conditions for ingest latency are met. Ingestion latency is approximately 21.828 seconds (duration: 00:00:21), which is lower than the maximum allowed latency of 3600 seconds (duration: 01:00:00), latest event indexed (_indextime) for this entity: 15 Aug 2025 10:55",
        "Logical Group cribl with key=\"689da1a47feddc2e090b8c49\" is in normal state. The current green percentage of the group is 33.33% which is higher or equal to the minimal green percentage of 5.0%, object_group_members_count=3, object_group_members_red=['cribl_datagen:cribl:business', 'cribl_datagen:pan:traffic']"
    ],
    "anomaly_reason": [
        "none"
    ]
}
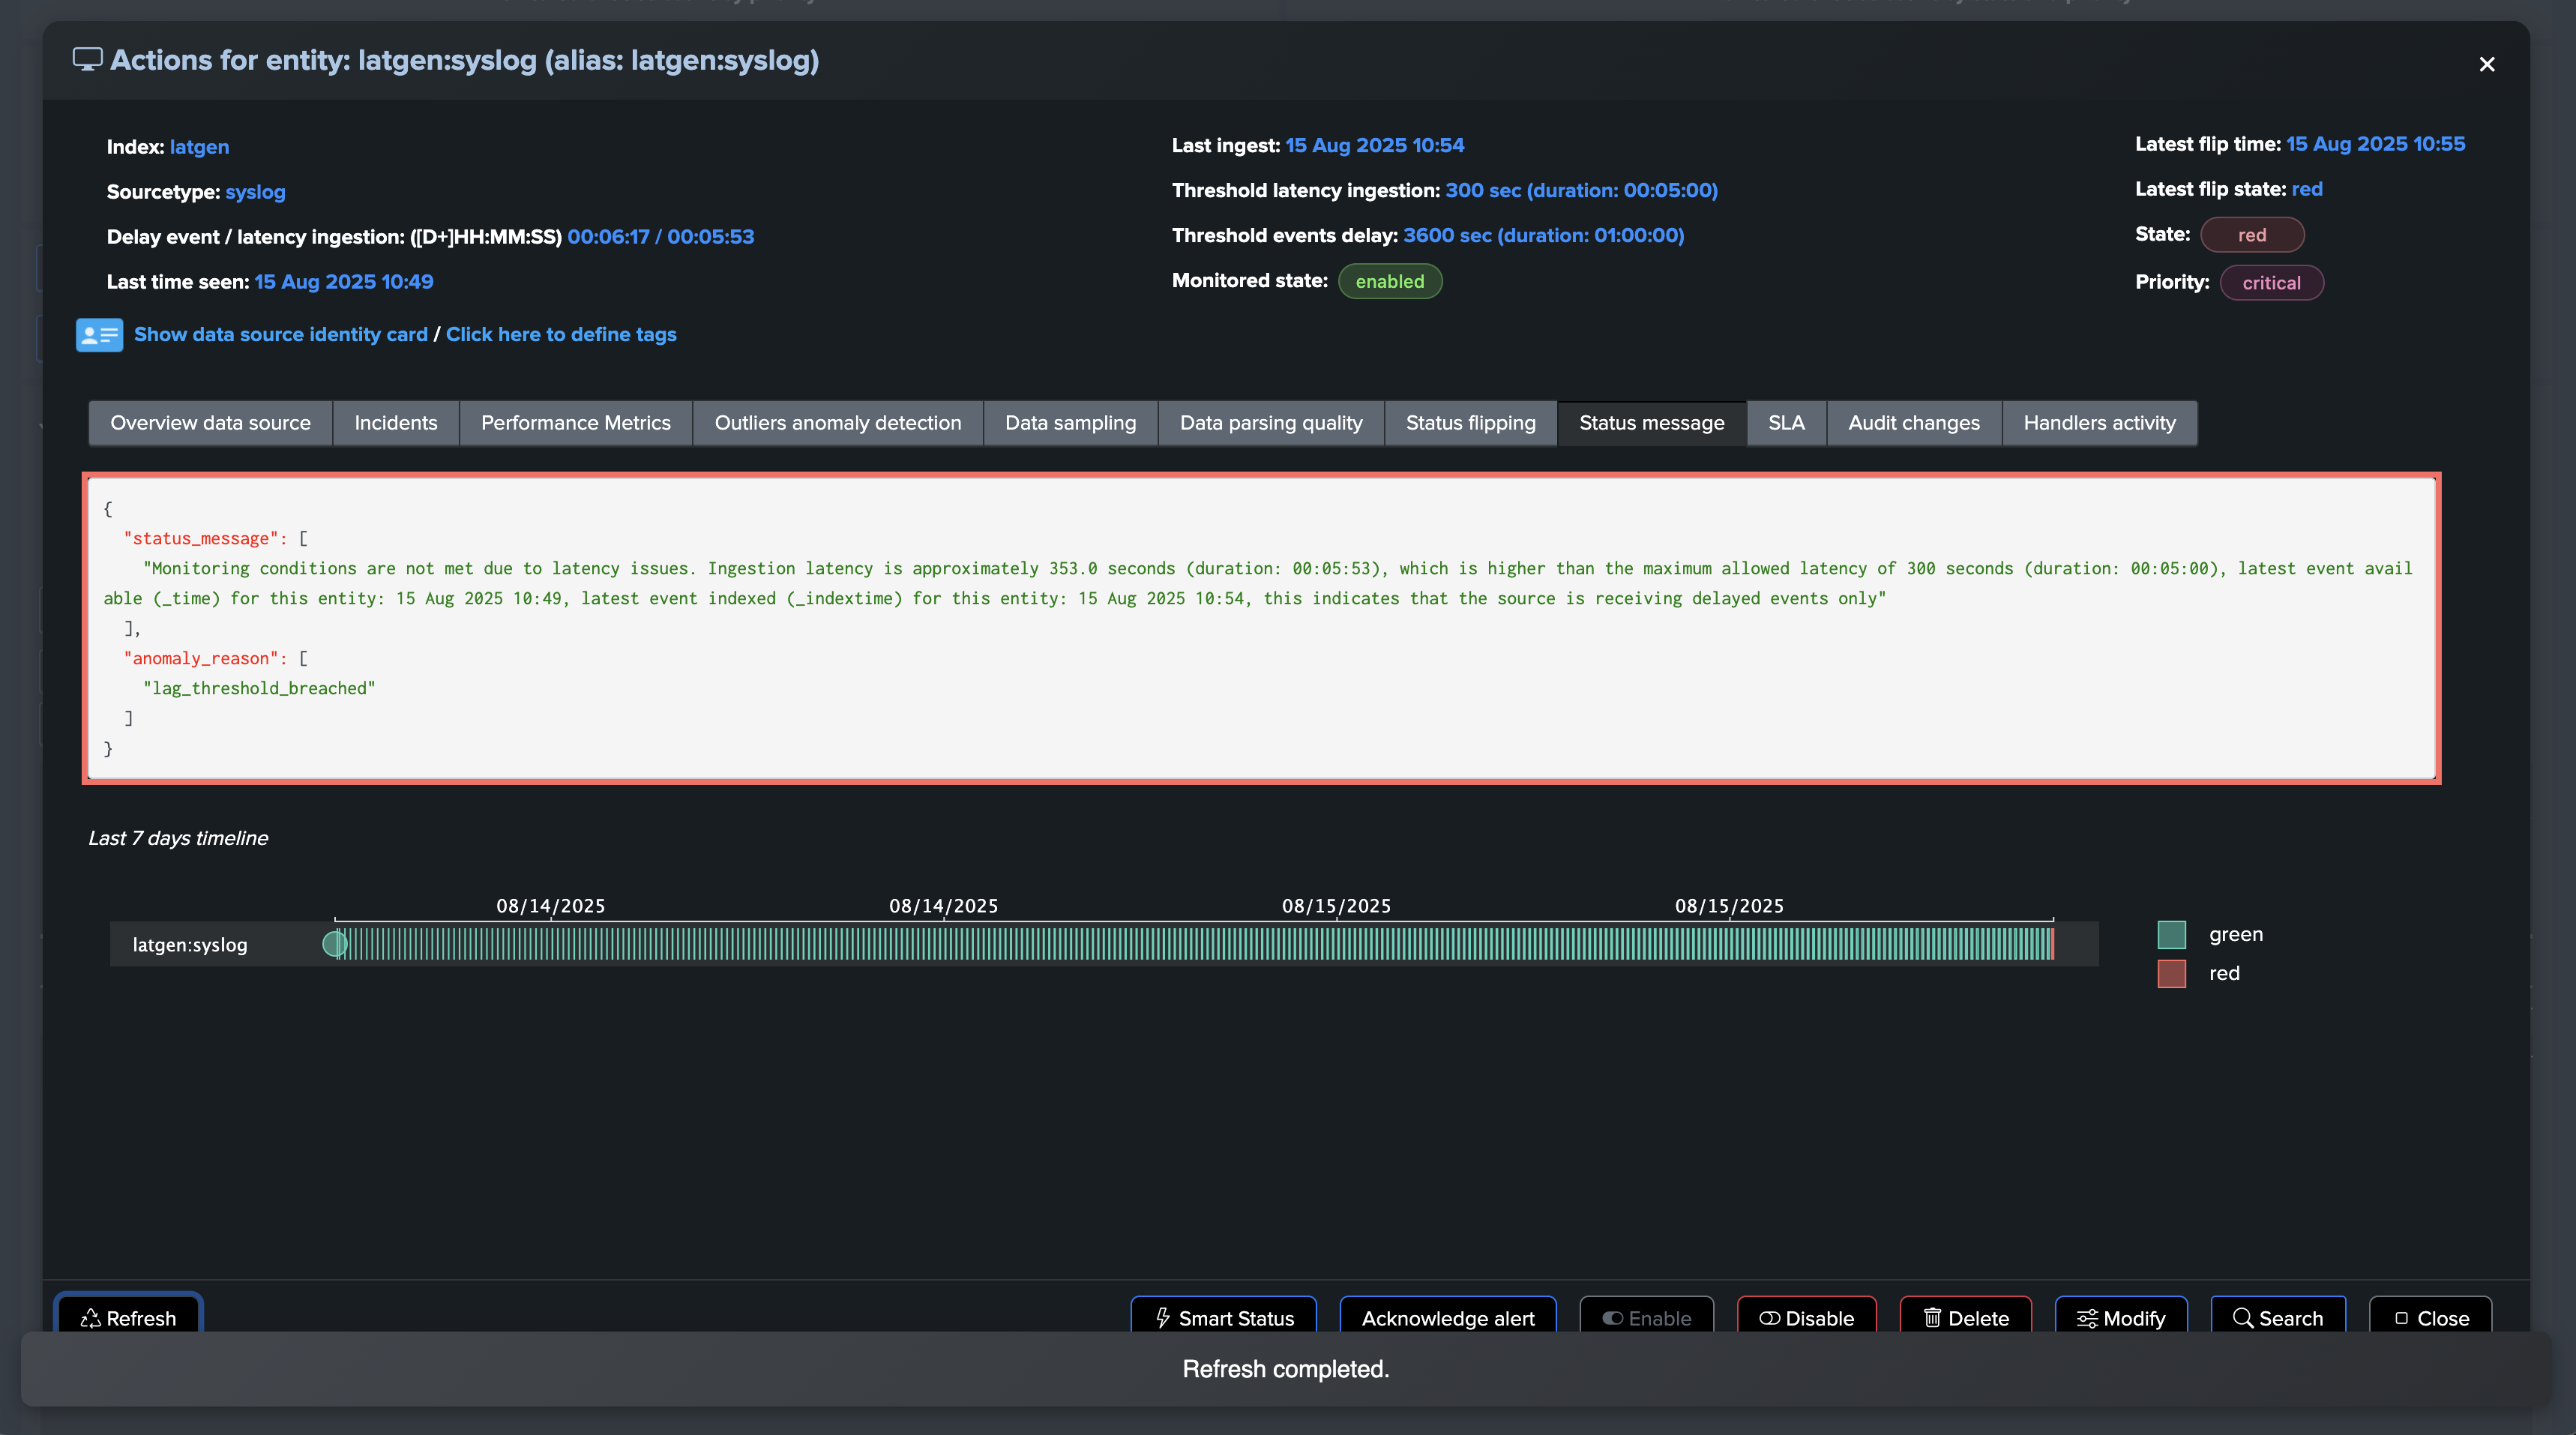
Red (latency threshold breached):
{
    "status_message": [
        "Monitoring conditions are not met due to latency issues. Ingestion latency is approximately 353.0 seconds (duration: 00:05:53), which is higher than the maximum allowed latency of 300 seconds (duration: 00:05:00), latest event available (_time) for this entity: 15 Aug 2025 10:49, latest event indexed (_indextime) for this entity: 15 Aug 2025 10:54, this indicates that the source is receiving delayed events only"
    ],
    "anomaly_reason": [
        "lag_threshold_breached"
    ]
}
Red (delay threshold breached):
{
    "status_message": [
        "Monitoring conditions are not met due to delay issues. Event delay is 17880.563 seconds (duration: 04:58:00), which is higher than the maximum allowed delay of 3600 seconds (duration: 01:00:00), latest event available (_time) for this entity: 15 Aug 2025 05:58, latest event ingested (_indextime) for this entity: 15 Aug 2025 06:00. This incidates that the source is receiving events with timestamps older than the threshold defined for this entity."
    ],
    "anomaly_reason": [
        "delay_threshold_breached"
    ]
}
The TrackMe status message is an essential feature for quickly understanding the reasons behind an entity’s status, making it easier to determine what needs to be addressed to monitor and track data availability and quality effectively.