Cribl Logstream monitoring in TrackMe
Hint
Version 2.0.45 and later
The SOAR integration requires TrackMe version 2.0.45 and later
1. Introduction to Cribl Logstream monitoring
TrackMe provides builtin use cases to efficiently monitor at scale one or more Cribl Logstream environments.
Cribl Logstream monitoring is performed via the TrackMe Flex Object component (splk-flx) which is a restricted component not available with the Free community edition of TrackMe.
The monitoring relies on Cribl internal metrics sent to Splunk associated with TrackMe’s Flex Object concepts, and provides the following use cases:
uc_ref |
uc_description |
uc_metrics |
|---|---|---|
|
Monitors Cribl Logstream health inputs status |
cribl_logstream.health.health_inputs |
|
Monitors Cribl Logstream health outputs status |
cribl_logstream.health.health_outputs |
|
Monitors Cribl Logstream hosts CPU usage and triggers on high usage thresholds |
cribl_logstream.avg_cpu_usage |
|
Monitors Cribl Logstream destination output blocked and under backpressure statuses |
cribl_logstream.output.blocked_outputs, cribl_logstream.output.backpressure_outputs |
|
Monitors Cribl Logstream Pipelines |
cribl_logstream.pipeline.in_events, cribl_logstream.pipeline.out_events, cribl_logstream.pipeline.dropped_events, cribl_logstream.pipeline.pct_sent_events, cribl_logstream.pipeline.pct_dropped_events |
|
Monitors Cribl Logstream Route traffic |
cribl_logstream.route.route_in_bytes, cribl_logstream.route.route_out_bytes, cribl_logstream.route.route_in_mbytes, cribl_logstream.route.route_out_mbytes, cribl_logstream.route.route_in_events, cribl_logstream.route.route_out_events |
|
Monitors Cribl Logstream total input traffic |
cribl_logstream.total.total_in_bytes, cribl_logstream.total.total_in_events, cribl_logstream.total.total_in_mbytes |
|
Monitors Cribl Logstream total output traffic |
cribl_logstream.total.total_out_bytes, cribl_logstream.total.total_out_events, cribl_logstream.total.total_out_mbytes |
These use cases are provided via the Flex Object use cases library, but note that you can also manually implement new use cases, or customise builtin use cases as needed.
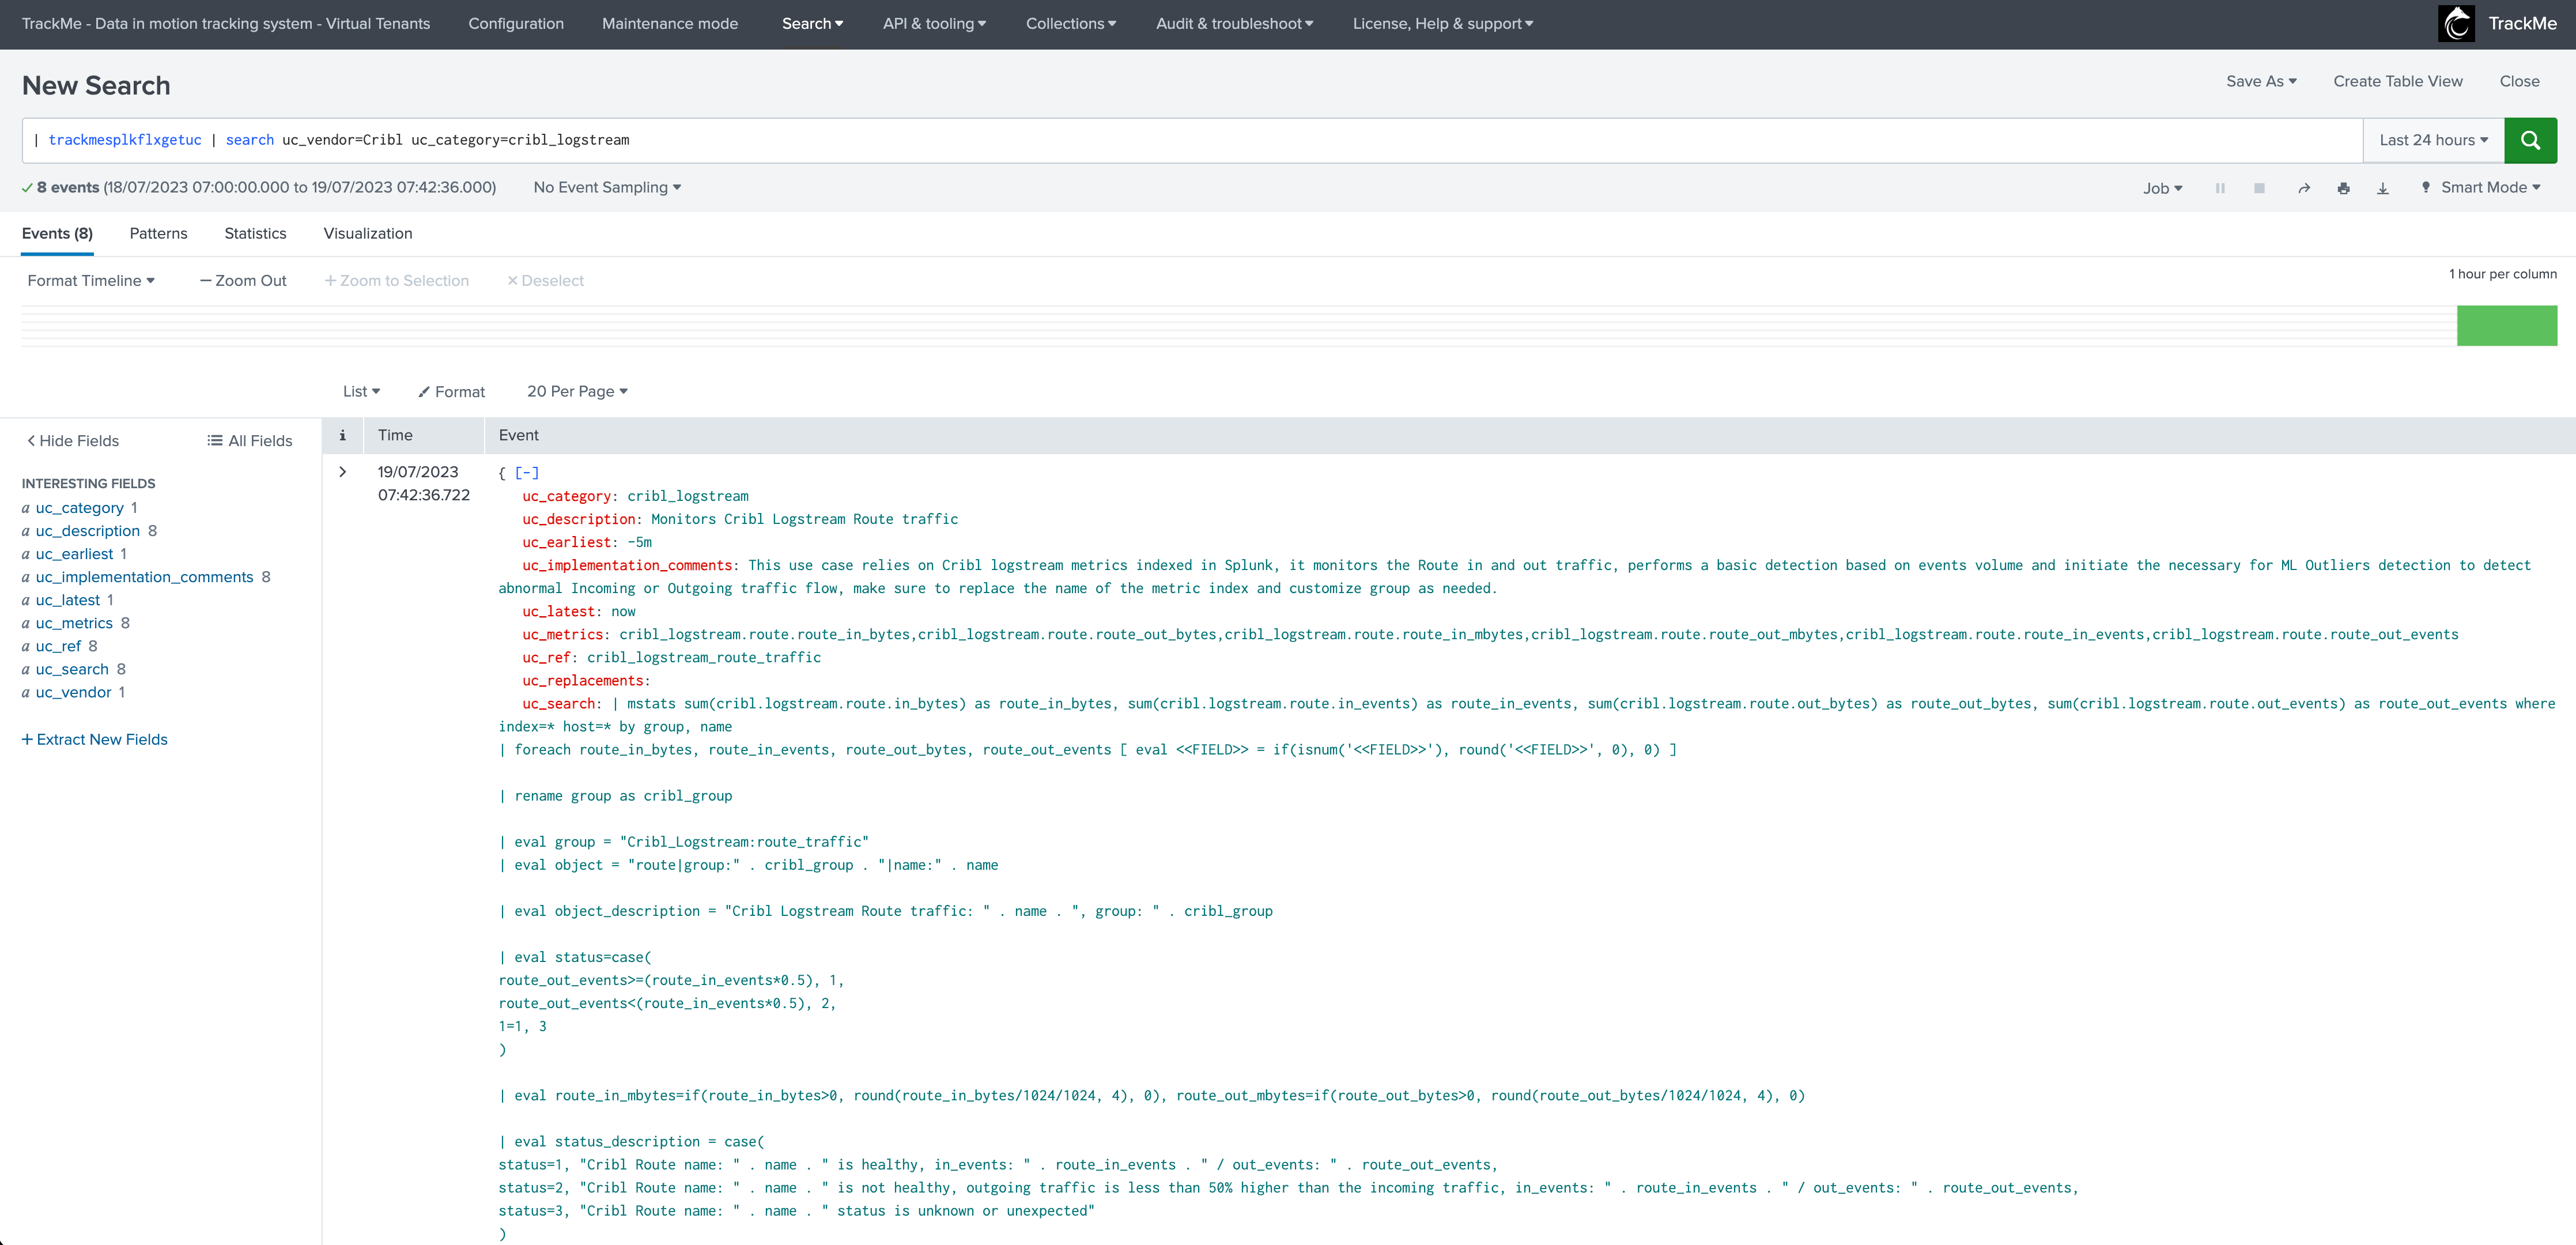
You can review the use case details ahead of their creation in TrackMe with the following command:
| trackmesplkflxgetuc | search uc_vendor=Cribl uc_category=cribl_logstream
2. Requirements for Cribl Logstream monitoring
Cribl Internal metrics
TrackMe for Cribl Logstream monitoring relies on Cribl internal metrics indexed in Splunk.
The pre-built use cases searches search in all metric indexes by default using where index=*, for optimisation purposes you can update the search during the creation of the Flex trackers, example:
| mstats sum(cribl.logstream.route.in_bytes) as route_in_bytes, sum(cribl.logstream.route.in_events) as route_in_events, sum(cribl.logstream.route.out_bytes) as route_out_bytes, sum(cribl.logstream.route.out_events) as route_out_events where index=* host=* by group, name
For more information to Cribl Logstream metrics in Splunk:
Hint
Multiple worker groups
If your Cribl Logstream deployment is composed by multiple worker groups, there is nothing to do and you can have a single tracker managing all worker groups individually
All searches break against the Cribl Logstream group dimension, which information is also used to create and maintain the entity
TrackMe tenant with the Flex Object component
You need a TrackMe tenant with the Flex Object component enabled, you can decide to create a dedicated tenant for the monitoring of Cribl Logstream, and use any existing tenant of your choice.
Once the Flex trackers have been created, TrackMe automatically groups the resulting entities for Cribl Logstream into the following groups:
uc_ref |
grouping |
|---|---|
cribl_logstream_health_inputs |
Cribl_Logstream:health |
cribl_logstream_health_outputs |
Cribl_Logstream:health |
cribl_logstream_hosts_cpu_usage |
Cribl_Logstream:infrastructure |
cribl_logstream_output_destination_pressure |
Cribl_Logstream:Destination |
cribl_logstream_pipeline |
Cribl_Logstream:pipeline_traffic |
cribl_logstream_route_traffic |
Cribl_Logstream:route_traffic |
cribl_logstream_total_traffic_inputs |
Cribl_Logstream:traffic_in_total |
cribl_logstream_total_traffic_outputs |
Cribl_Logstream:traffic_out_total |
3. Implementation for Cribl Logstream monitoring
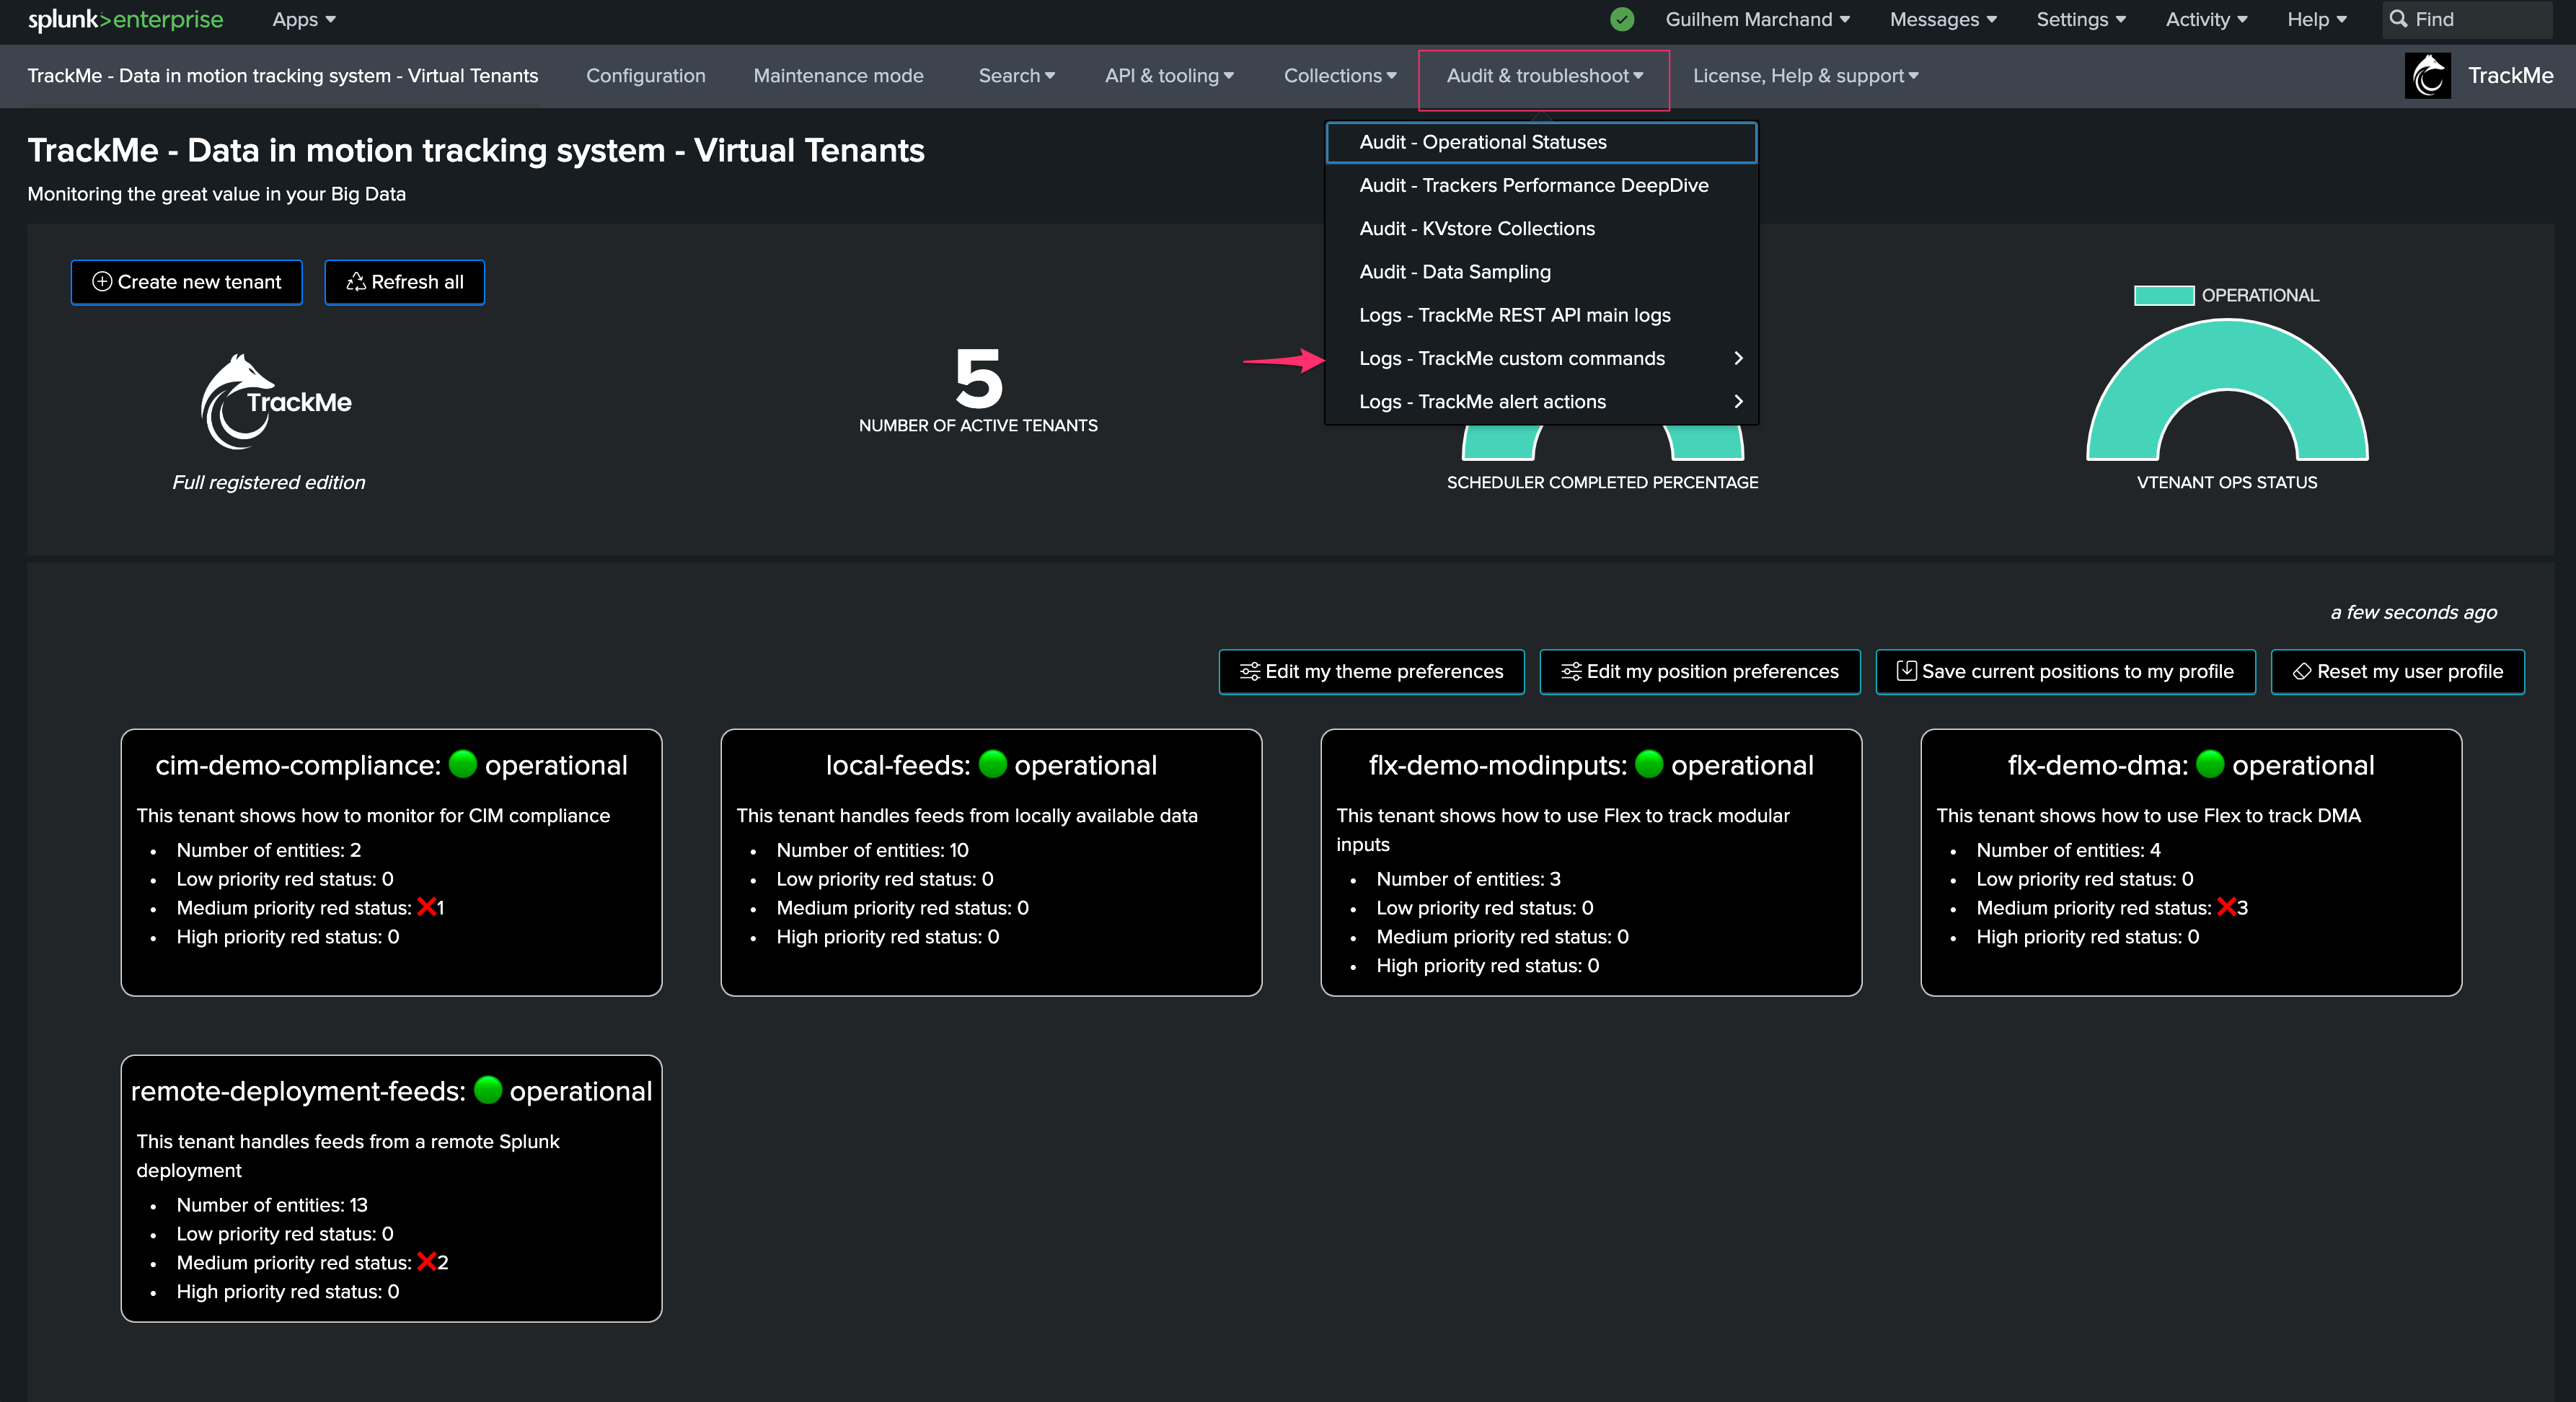
The integration is really straightforward, in your target tenant, access the Flex tracker management screen and load Flex use cases of your choice:
Let’s load the health inputs use cases, which rely on the health metrics for Cribl Logstream inputs:
Enter a meaningful name for the tracker
Select Cribl as the vendor
Select the use case reference identifier
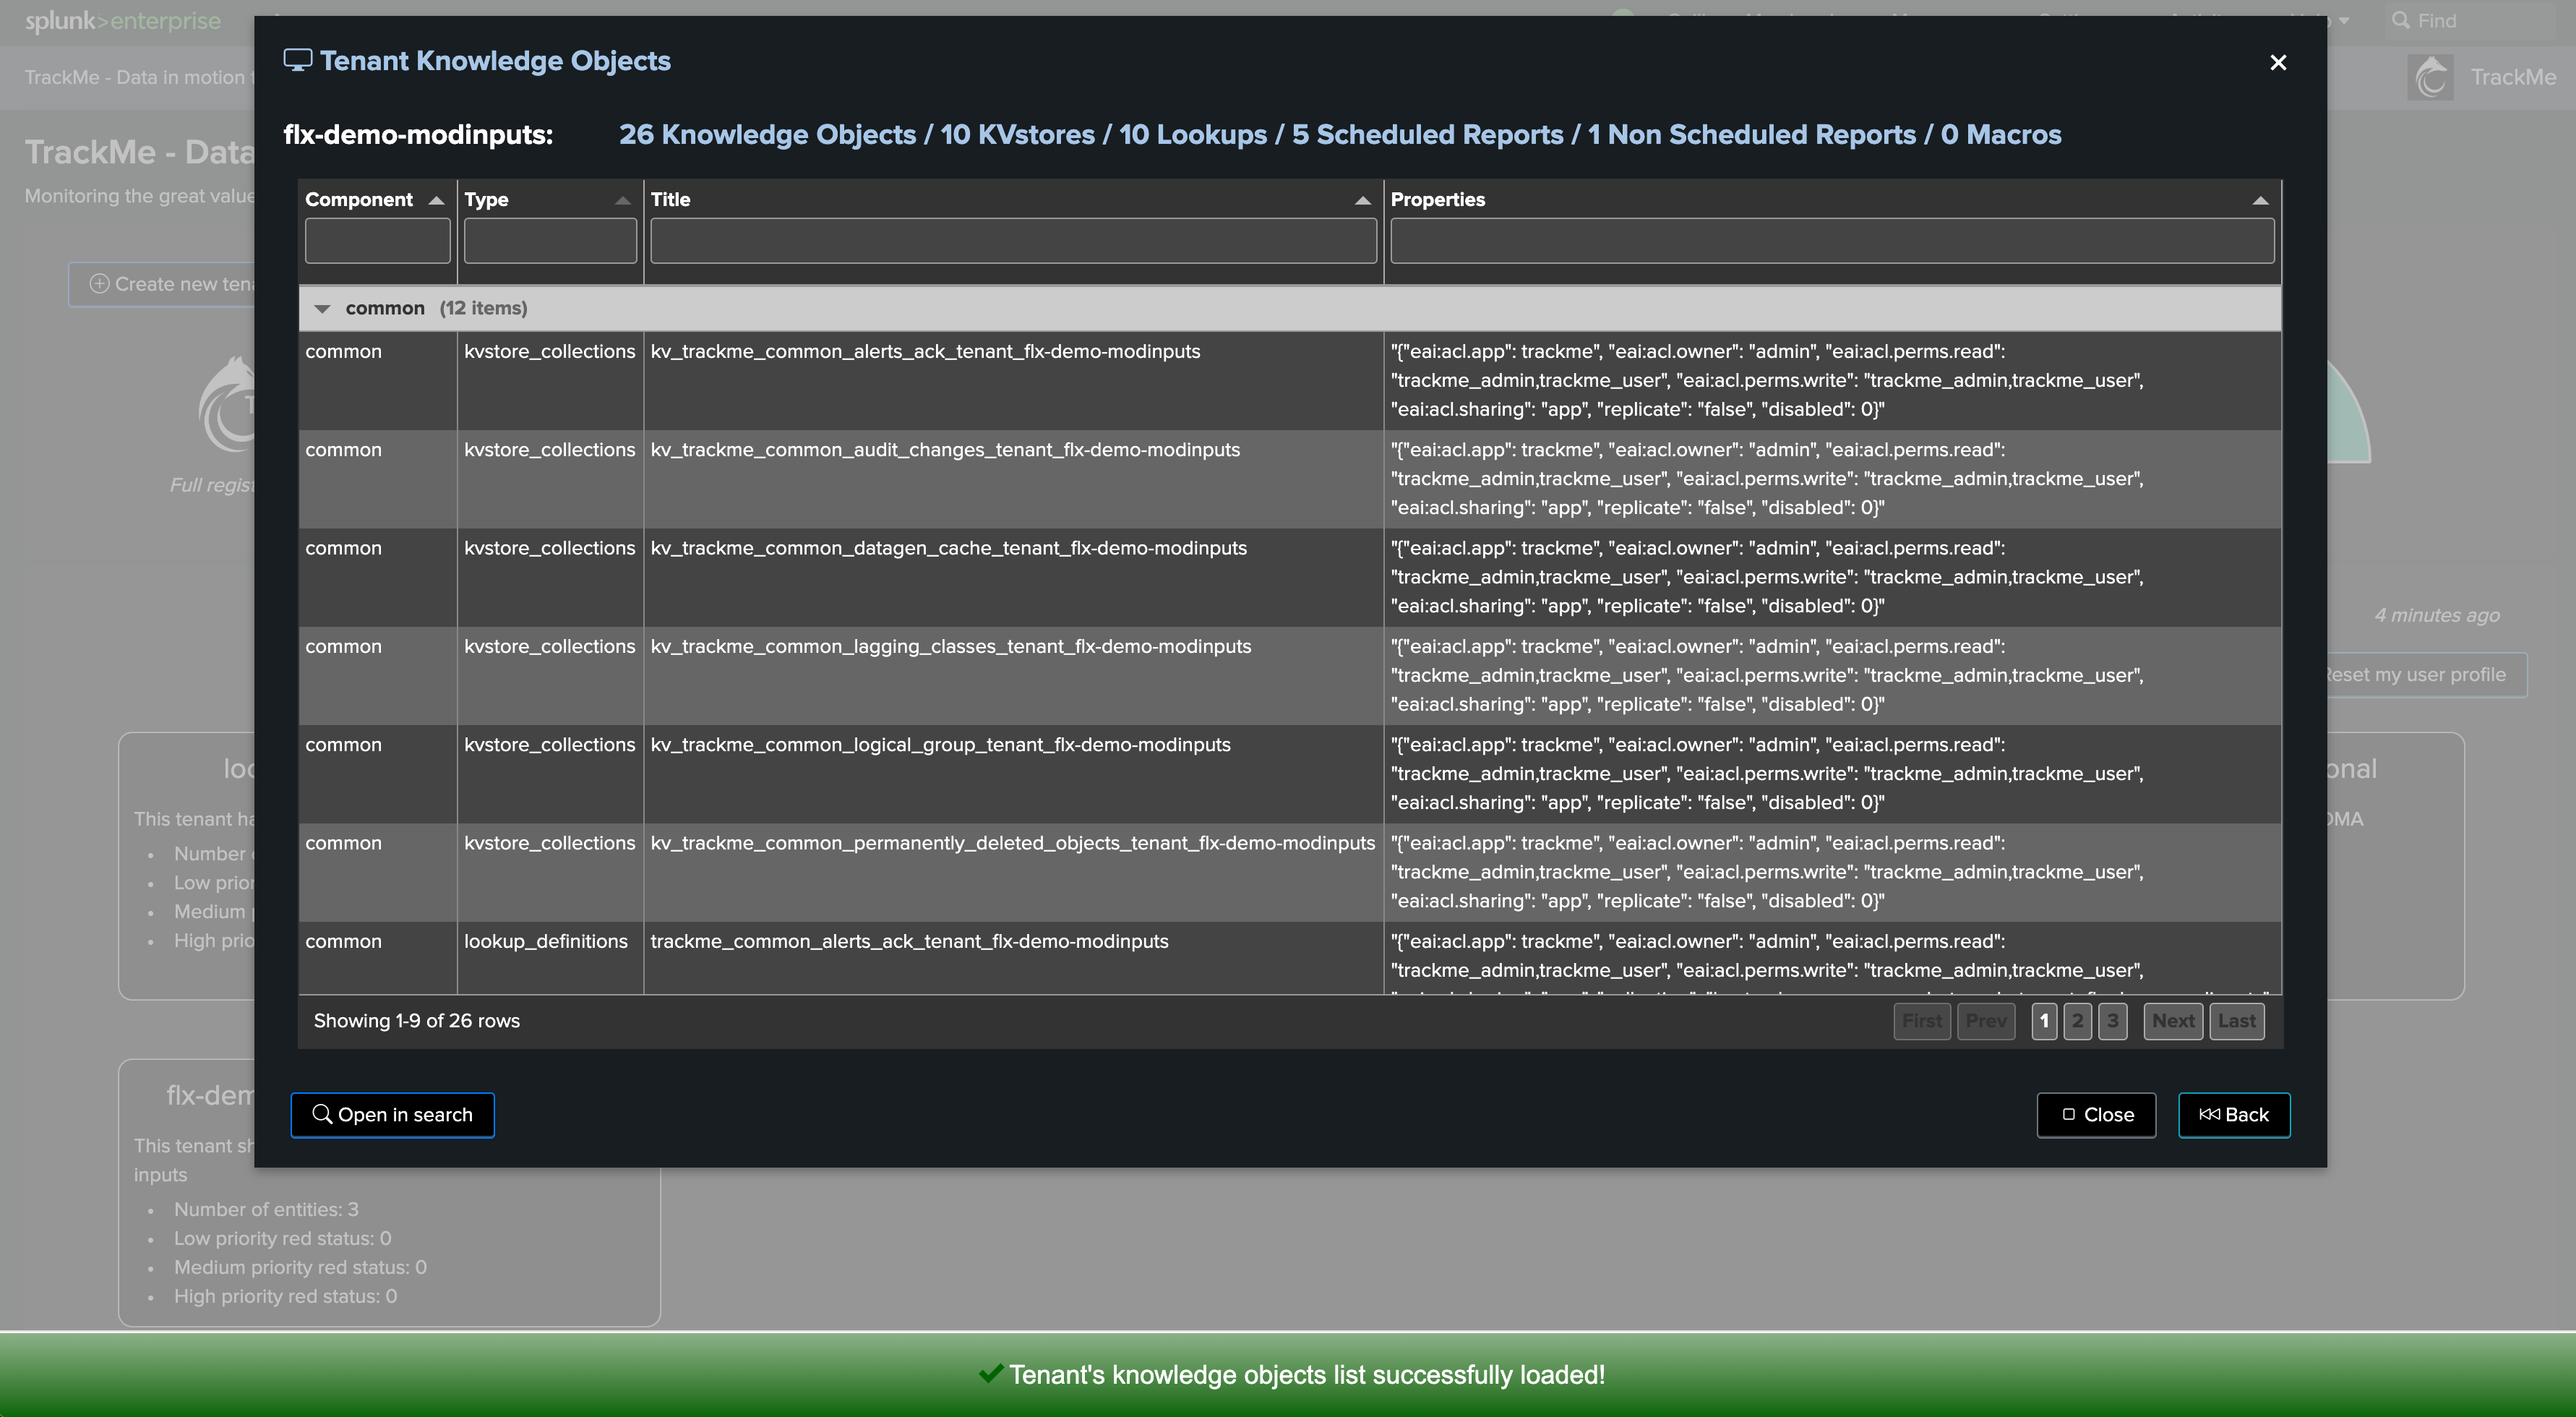
TrackMe provides high level information for the use case, such as metrics that will be generated, requirements or recommendations:
Review the search generated by TrackMe, you may want for instance to set explicitly the name of the metric index containing Cribl internal metrics:
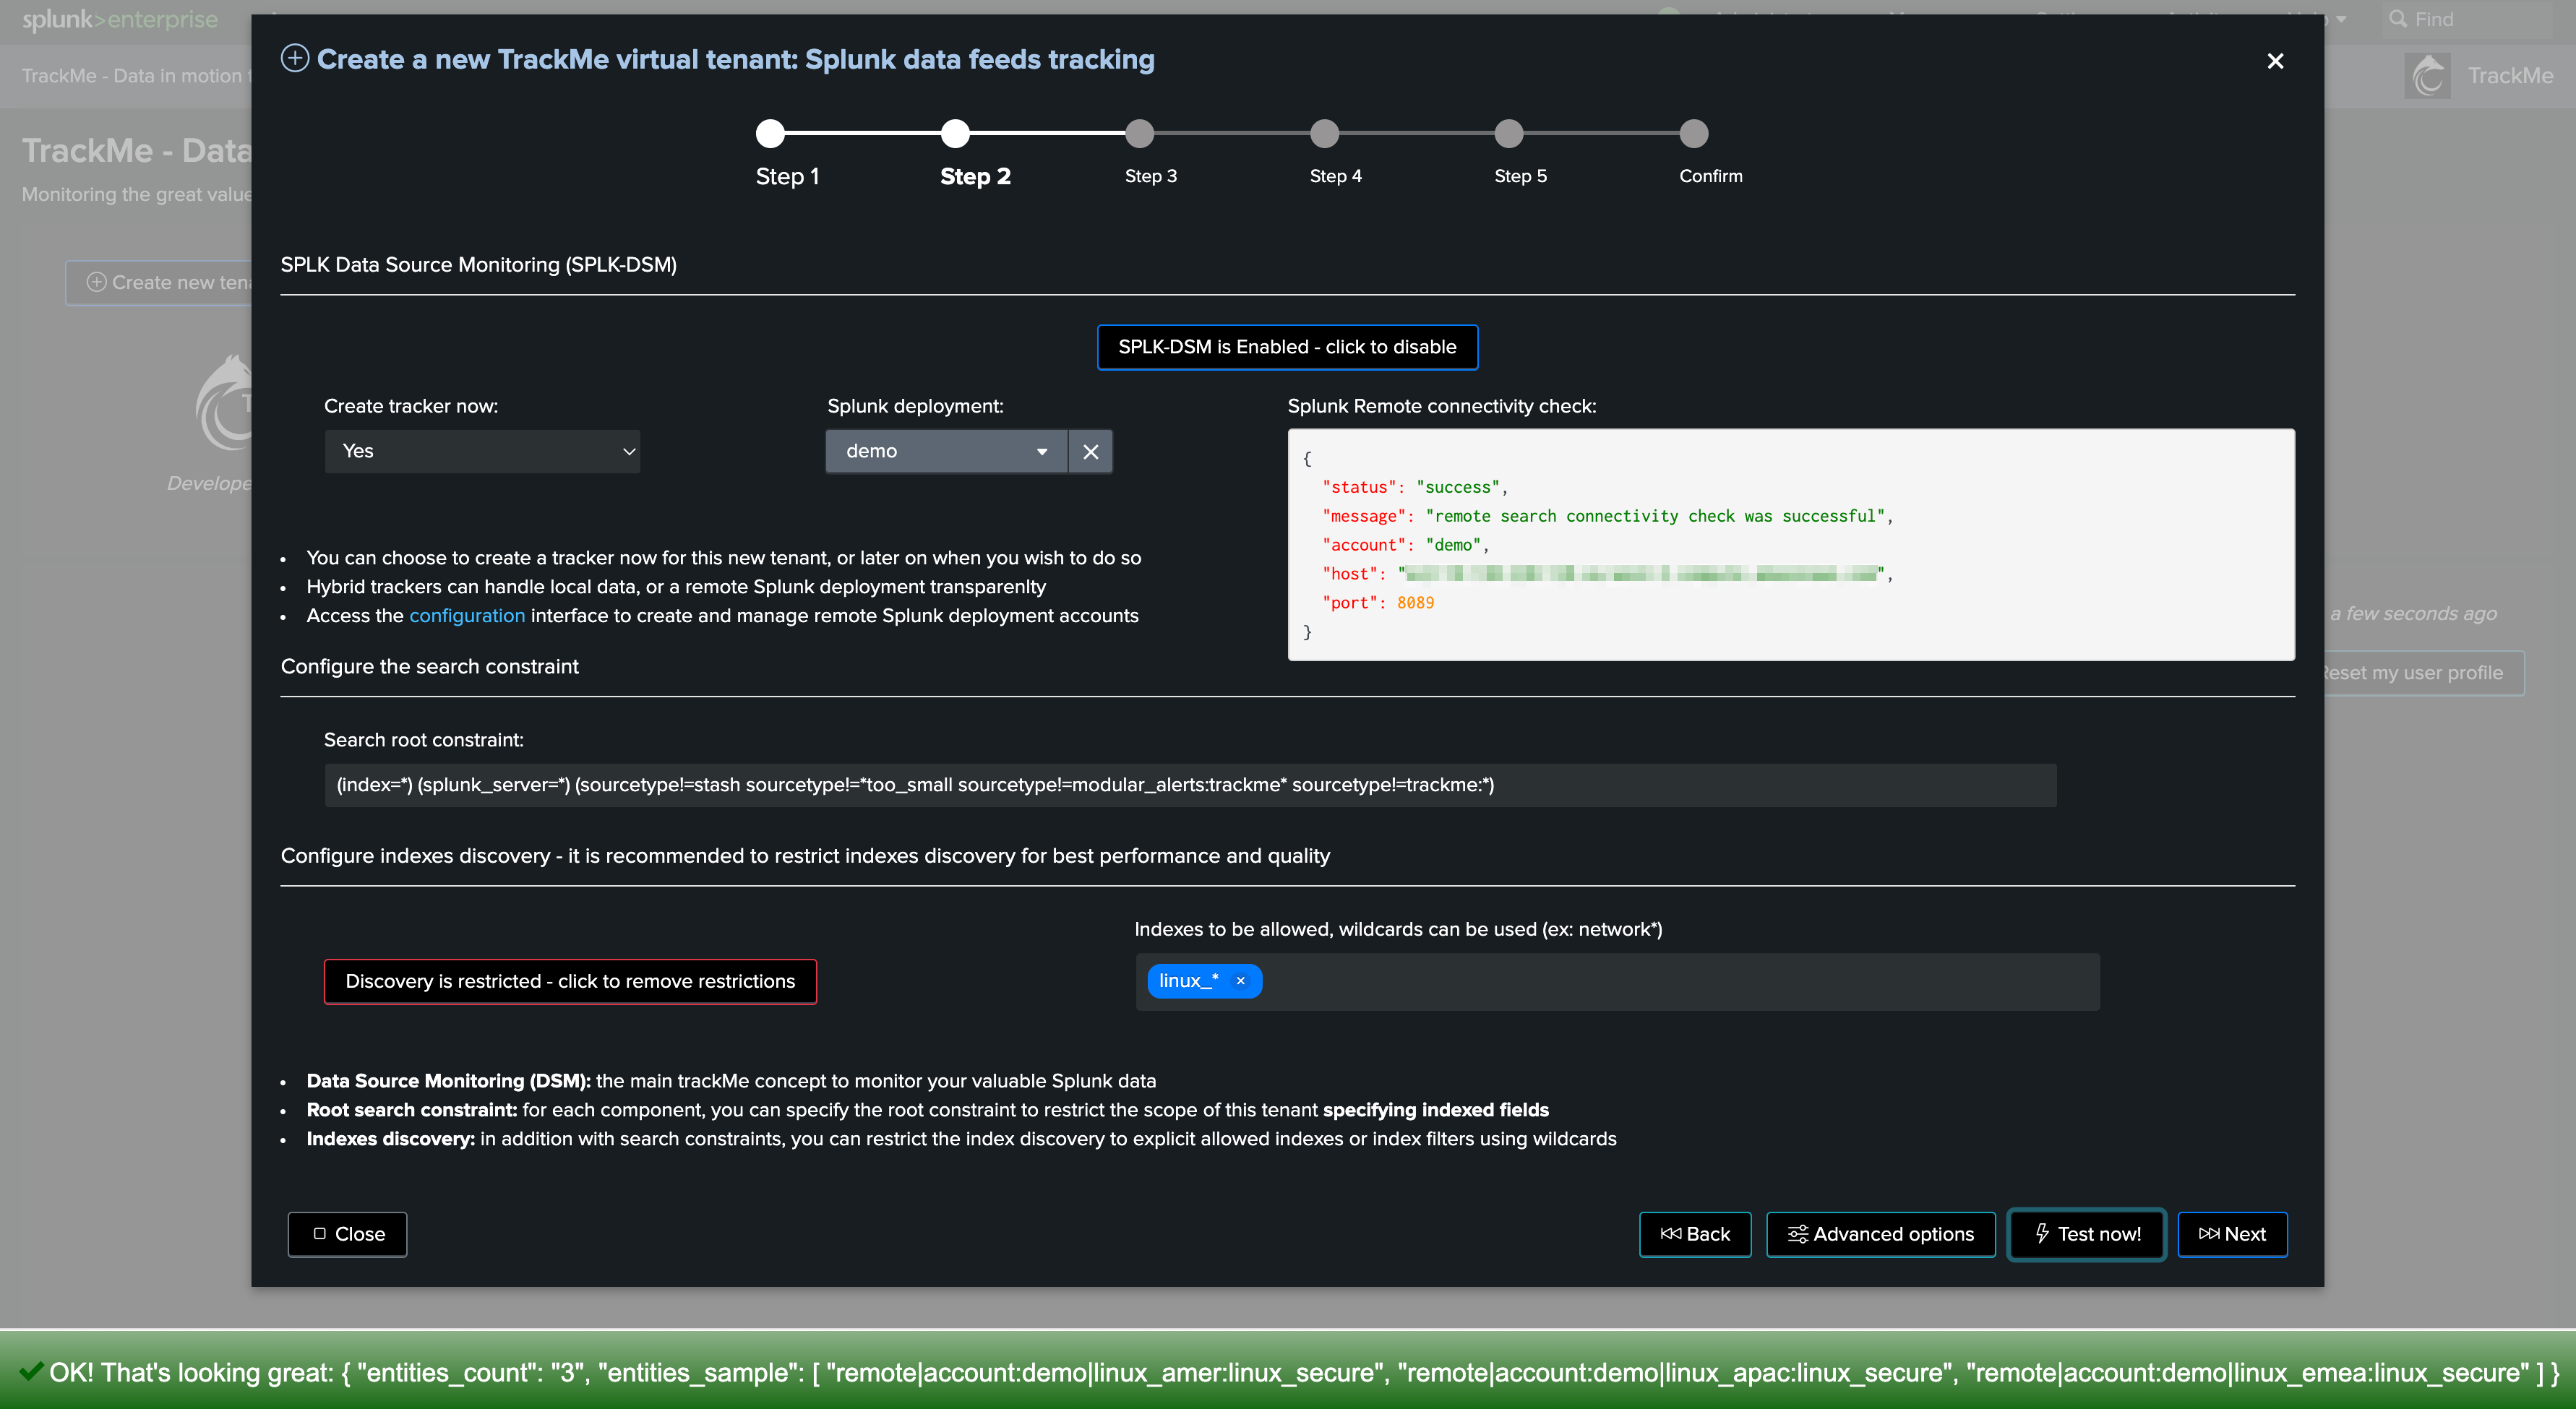
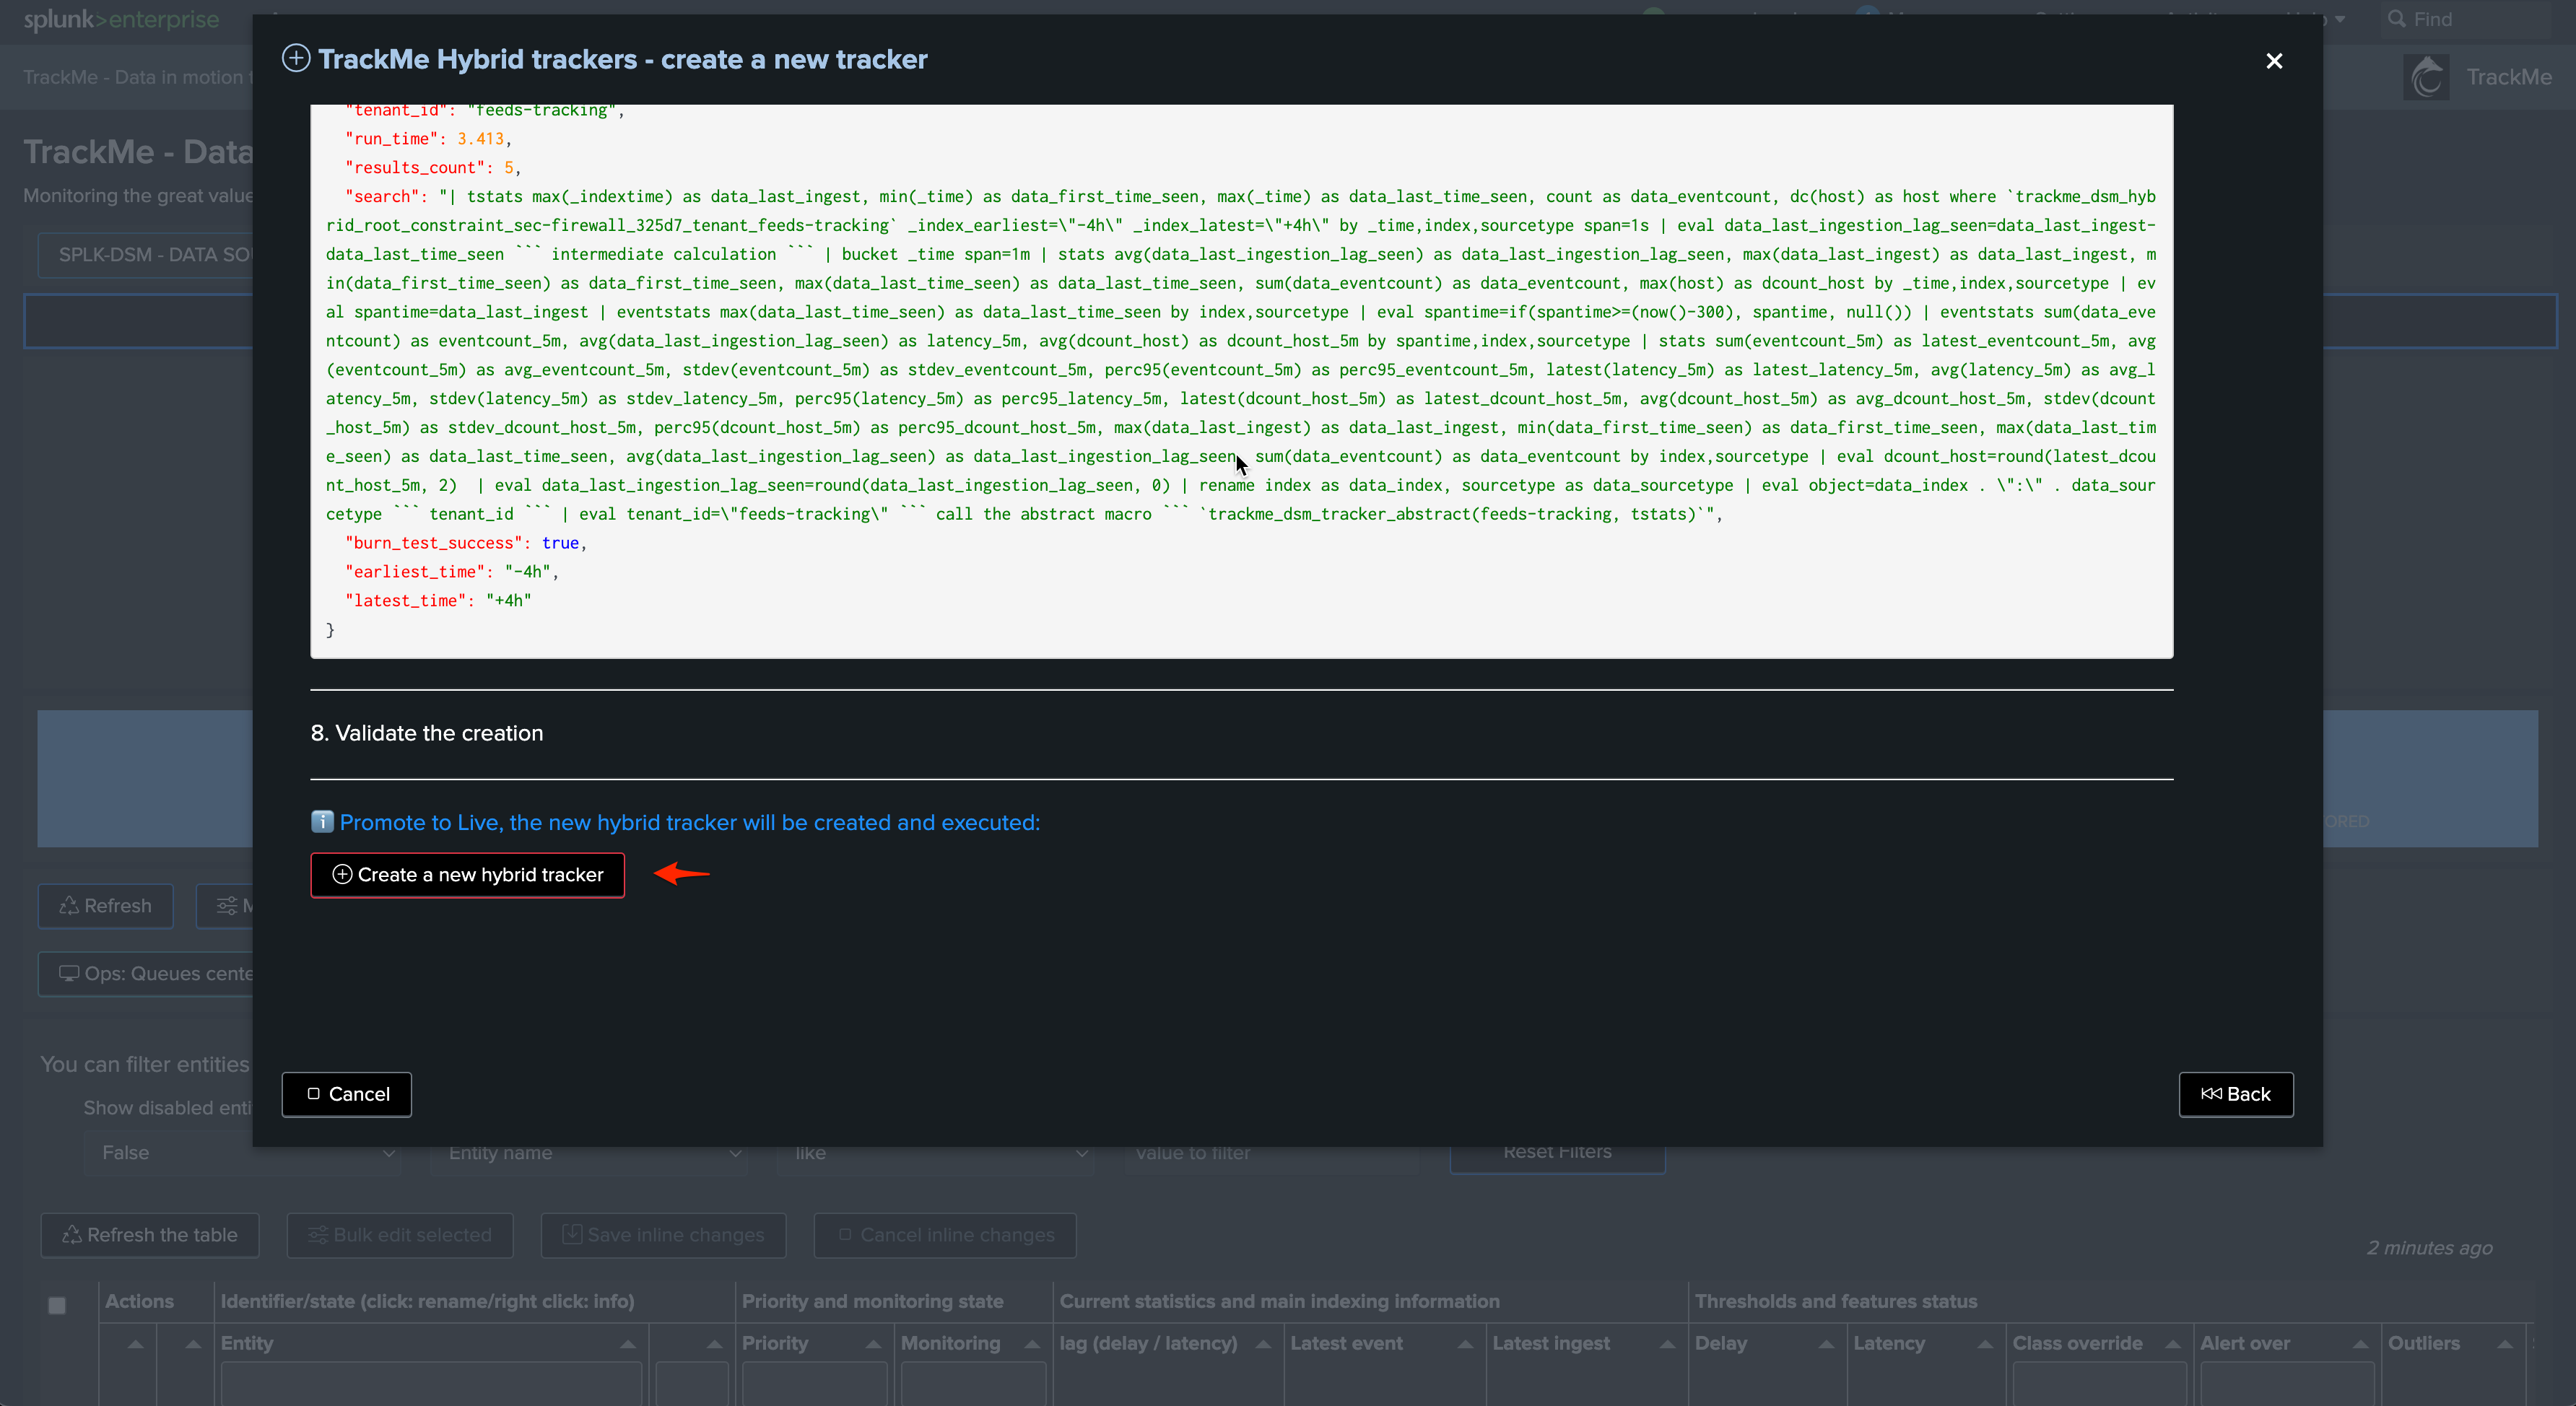
This is all you need, earliest and latest time are defined automatically, click on Simulate the search, review results and proceed to the creation of the tracker
4. Review
Once you have completed the integration, a full coverage of key monitoring aspect of your Cribl Logstream environment is effective:
Shall an issue occur, TrackMe will automatically detect the condition with the support of Cribl internal metrics, and reflect this depending on the conditions, in the following example we simulate an outage affecting one of the Splunk destinations used in Cribl Logstream (Splunk S2S output):
