TrackMe Data Sampling - Events and Format Recognition for Quality Inspection in TrackMe
Introduction to TrackMe’s Events Format Recognition Engine
This documentation applies from TrackMe 2.1.0:
TrackMe 2.1.0 welcomed the sampling engine v2.0, which is a major rewrite and improvement of the previous version.
Therefore, this documentation applies to TrackMe 2.1.0 and later versions.
About TrackMe’s data sampling features:
TrackMe’s data sampling engine is a component of the splk-dsm module, which is responsible for the recognition of events and formats in the data being ingested by Splunk.
The data sampling engine feature provides automated quality assessment of the data being ingested by Splunk, at scale.
It works by regularly sampling events and applying built-in and custom rules to recognize the format of the events, which is called inclusive matching.
The engine categorizes events by model match, and tracks the percentage of events matched per model, identifying the major model of the data.
The inclusive major model percentage is then compared against the minimum acceptable threshold, and if the percentage is below the threshold, the entity is marked as in data sampling anomaly.
How Does the Data Sampling Stand in TrackMe’s Workflow
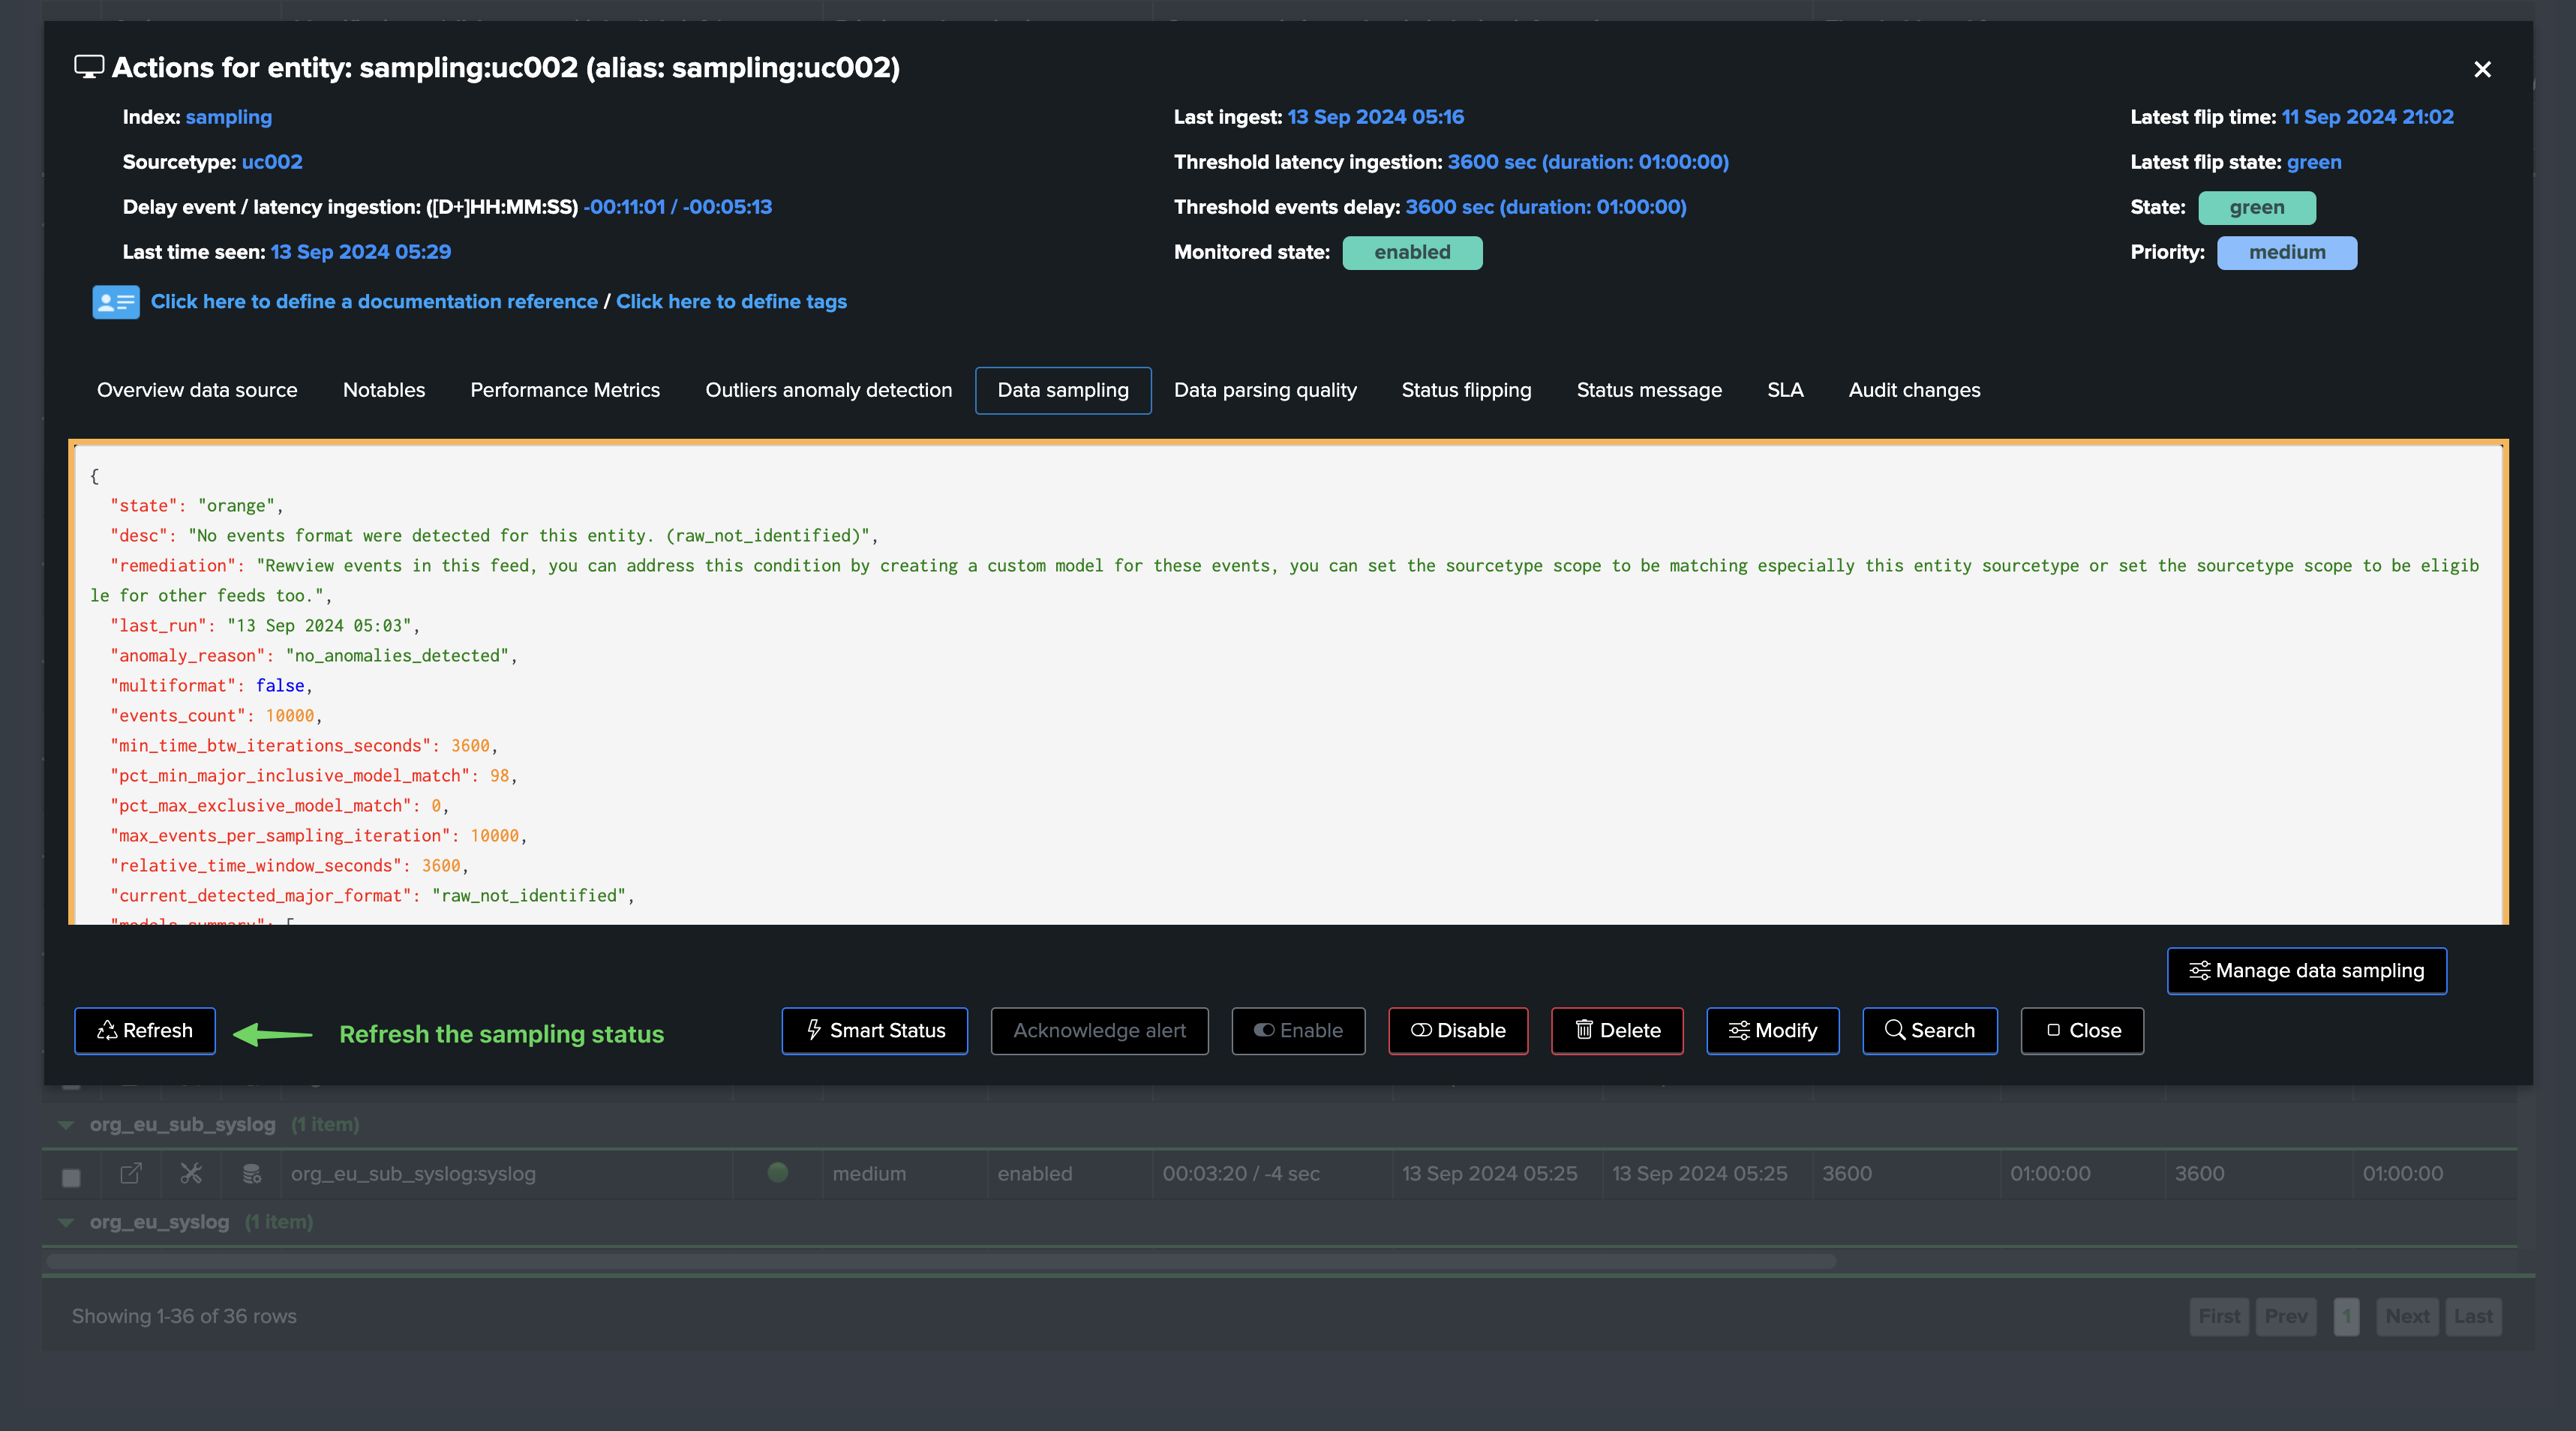
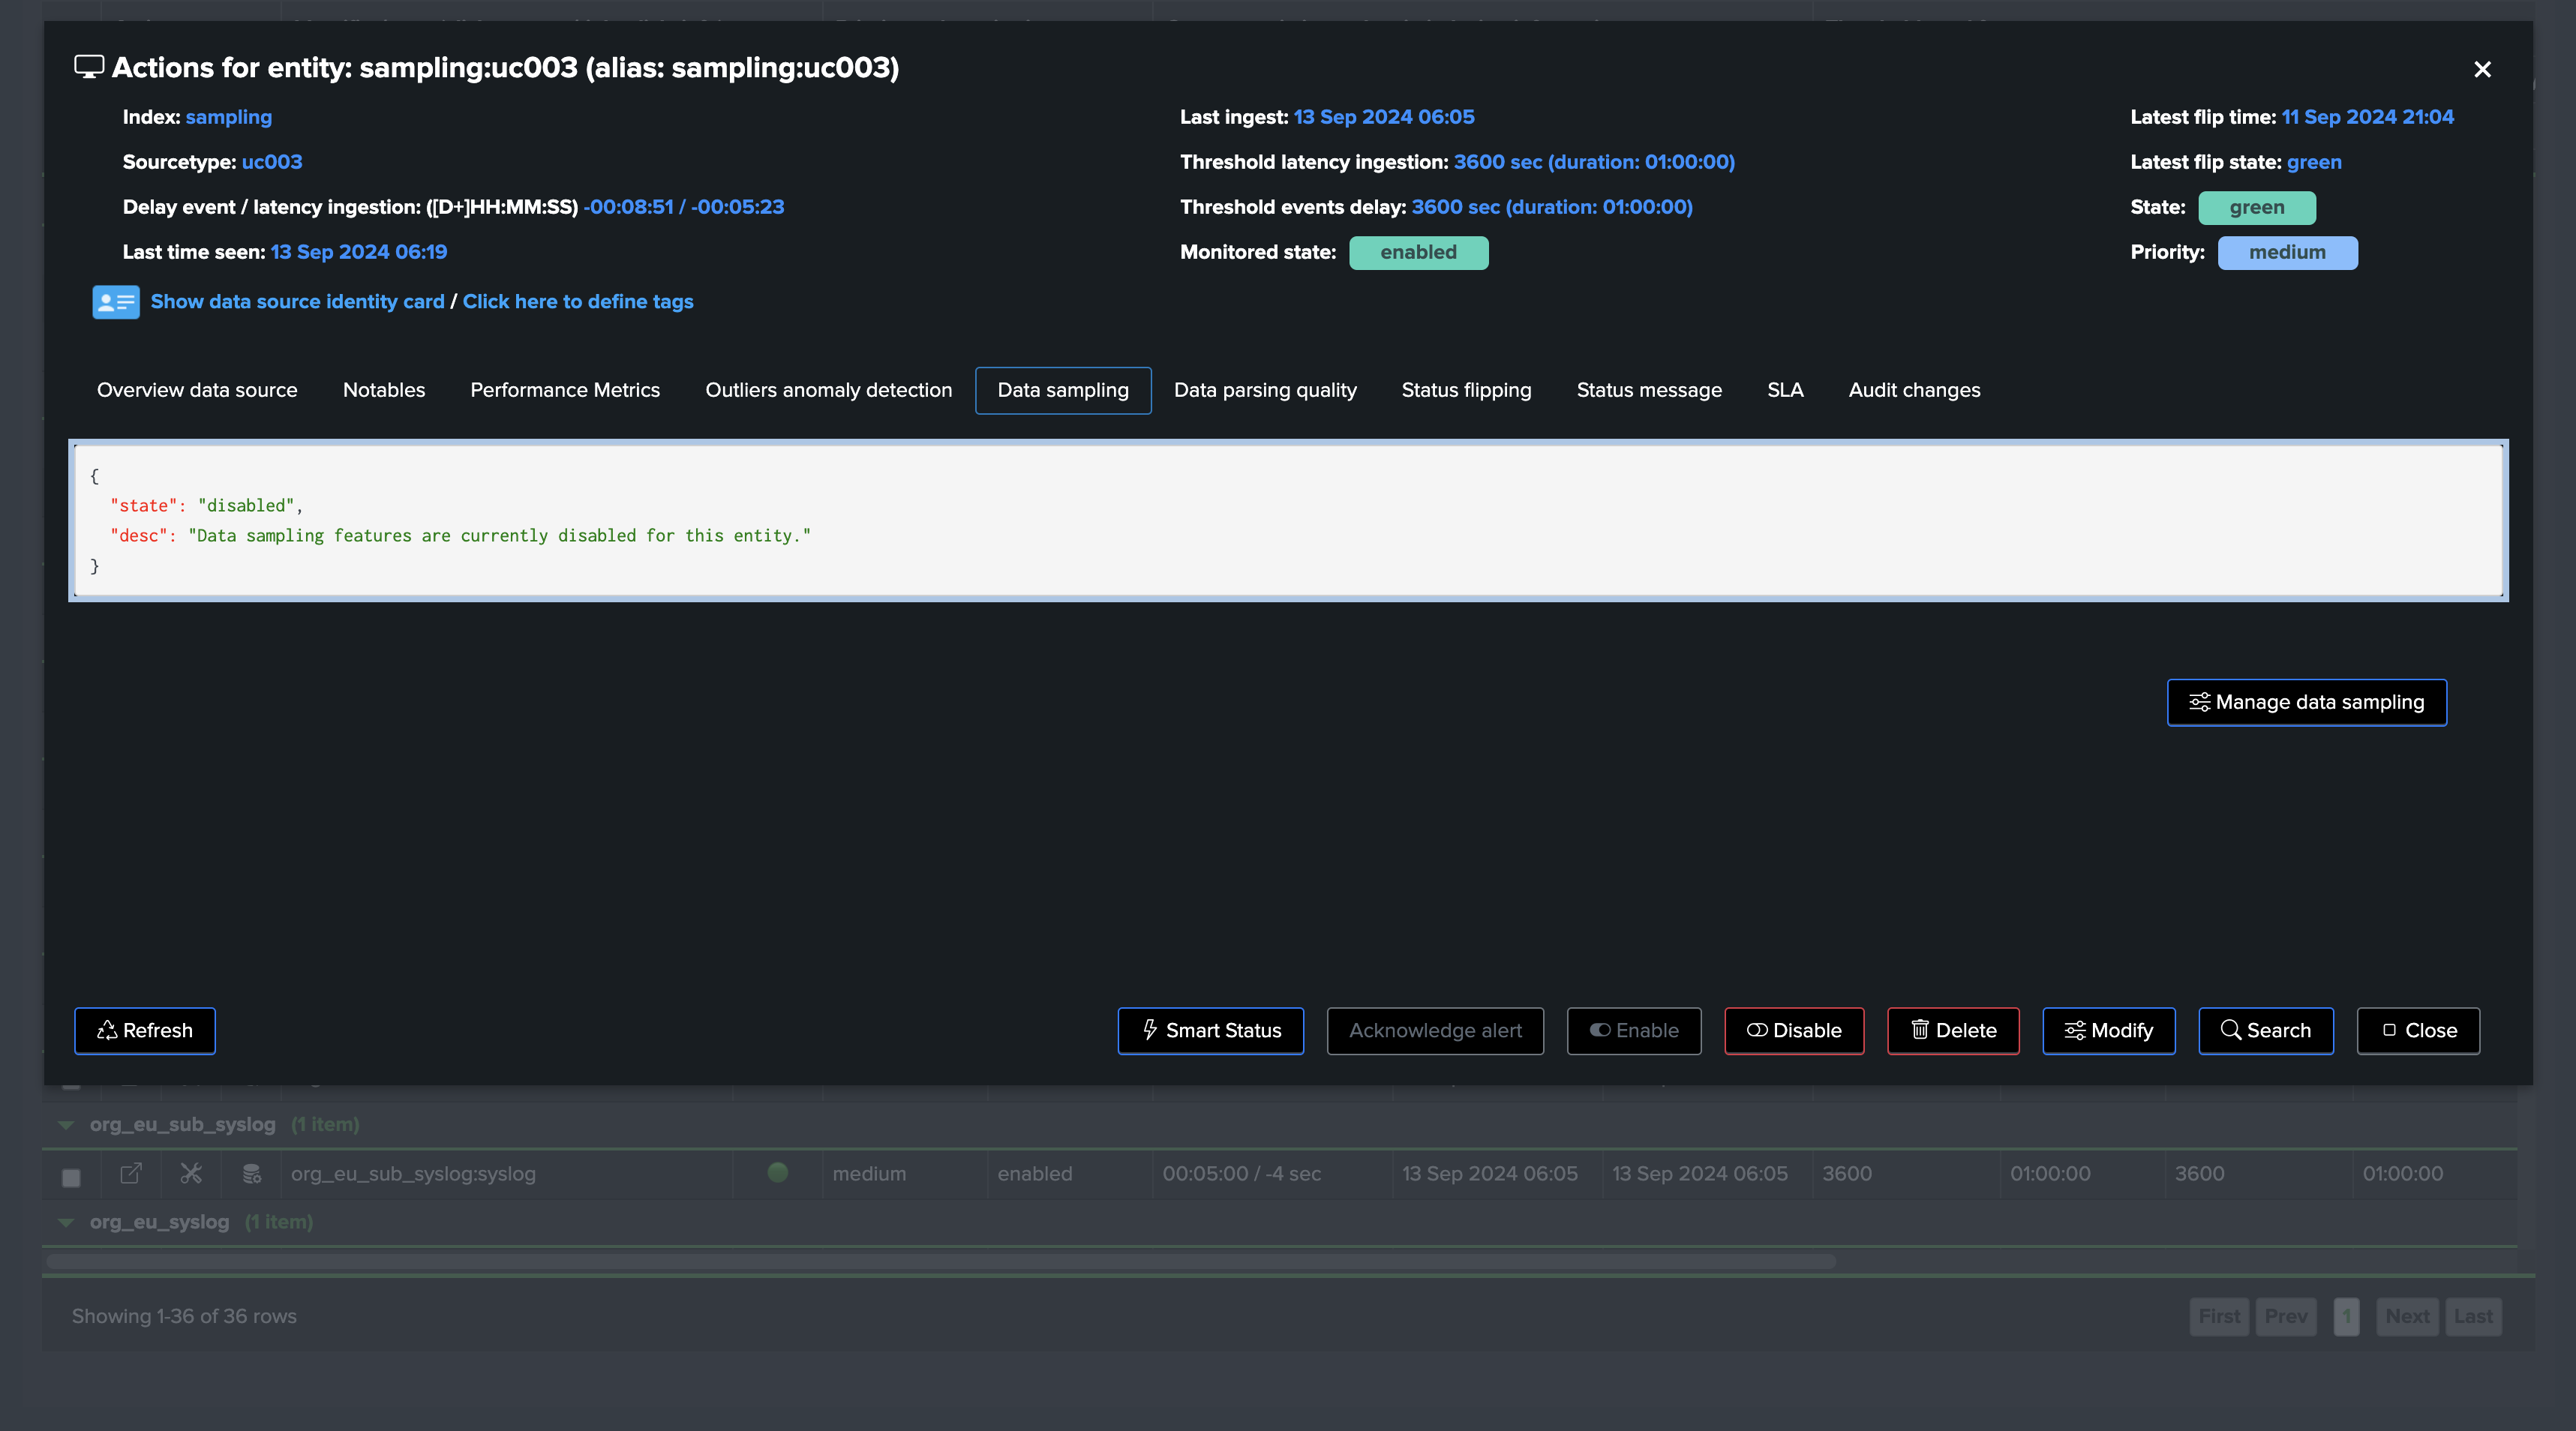
You can find the data sampling status and access to its management in TrackMe’s entity view, in the Data Sampling tab:
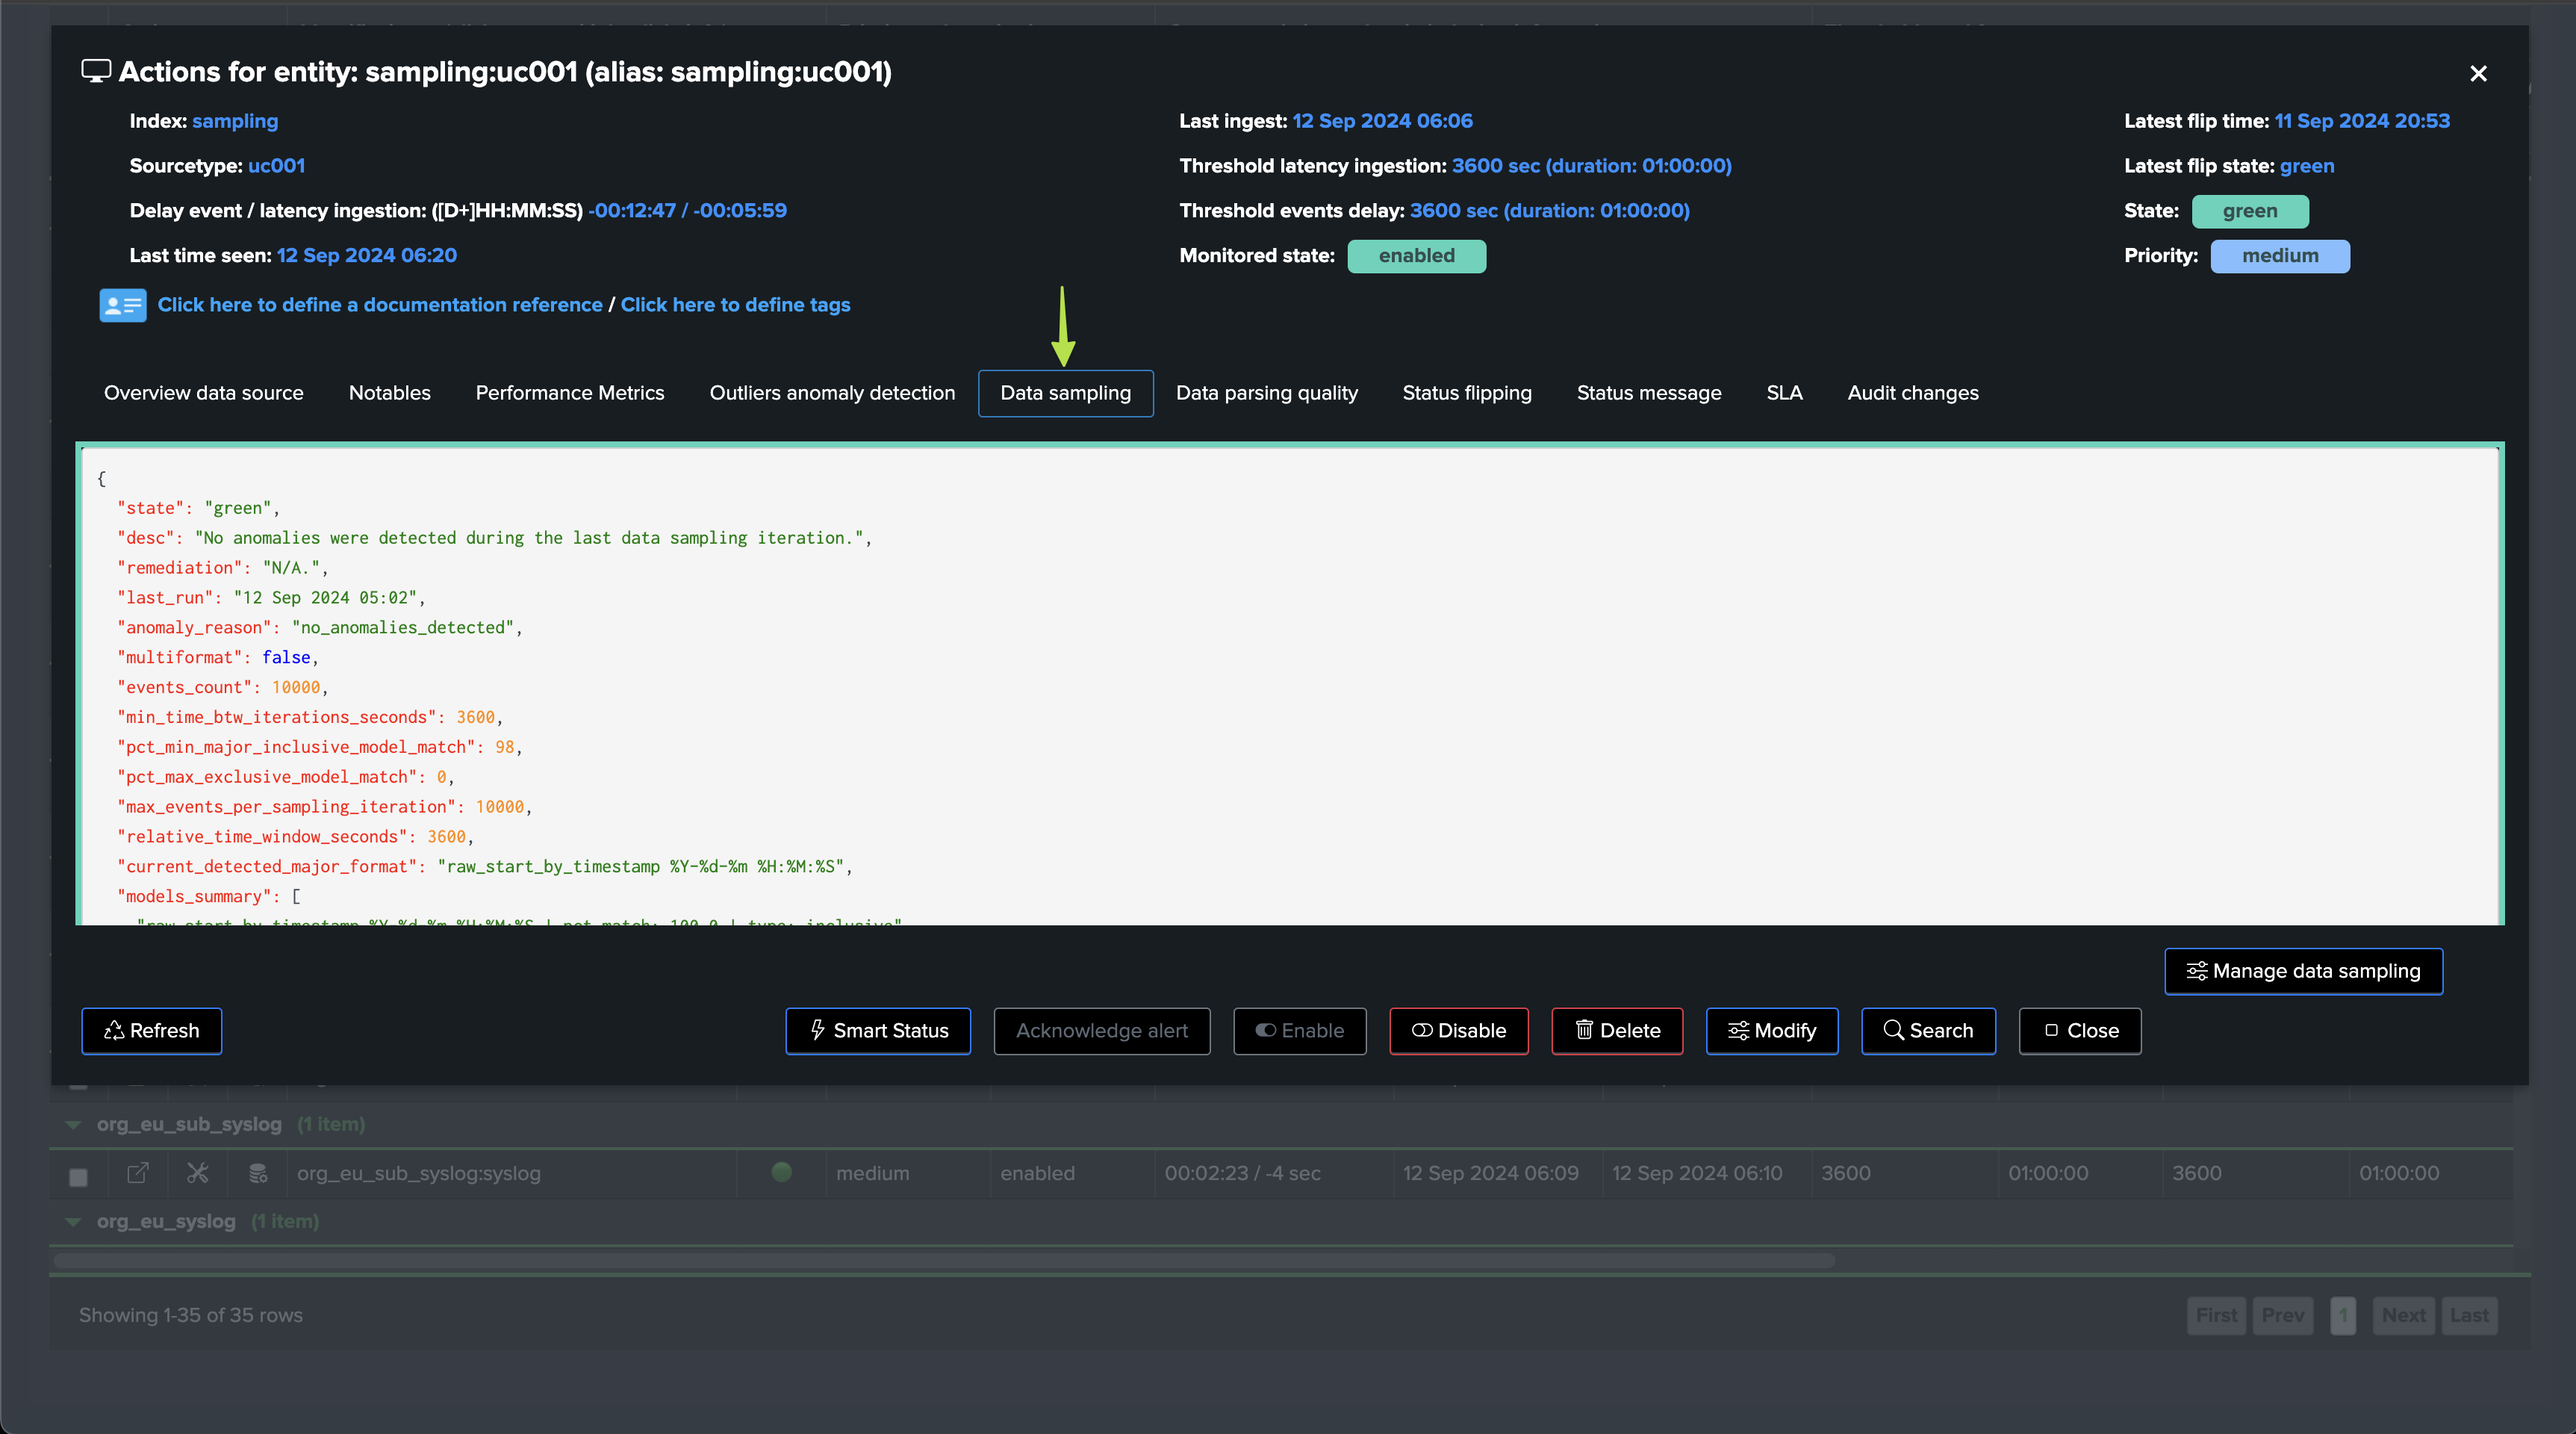
Depending on the status of the data sampling, as well as the global Virtual tenant configuration, the sampling status may or may not influence the entity status.
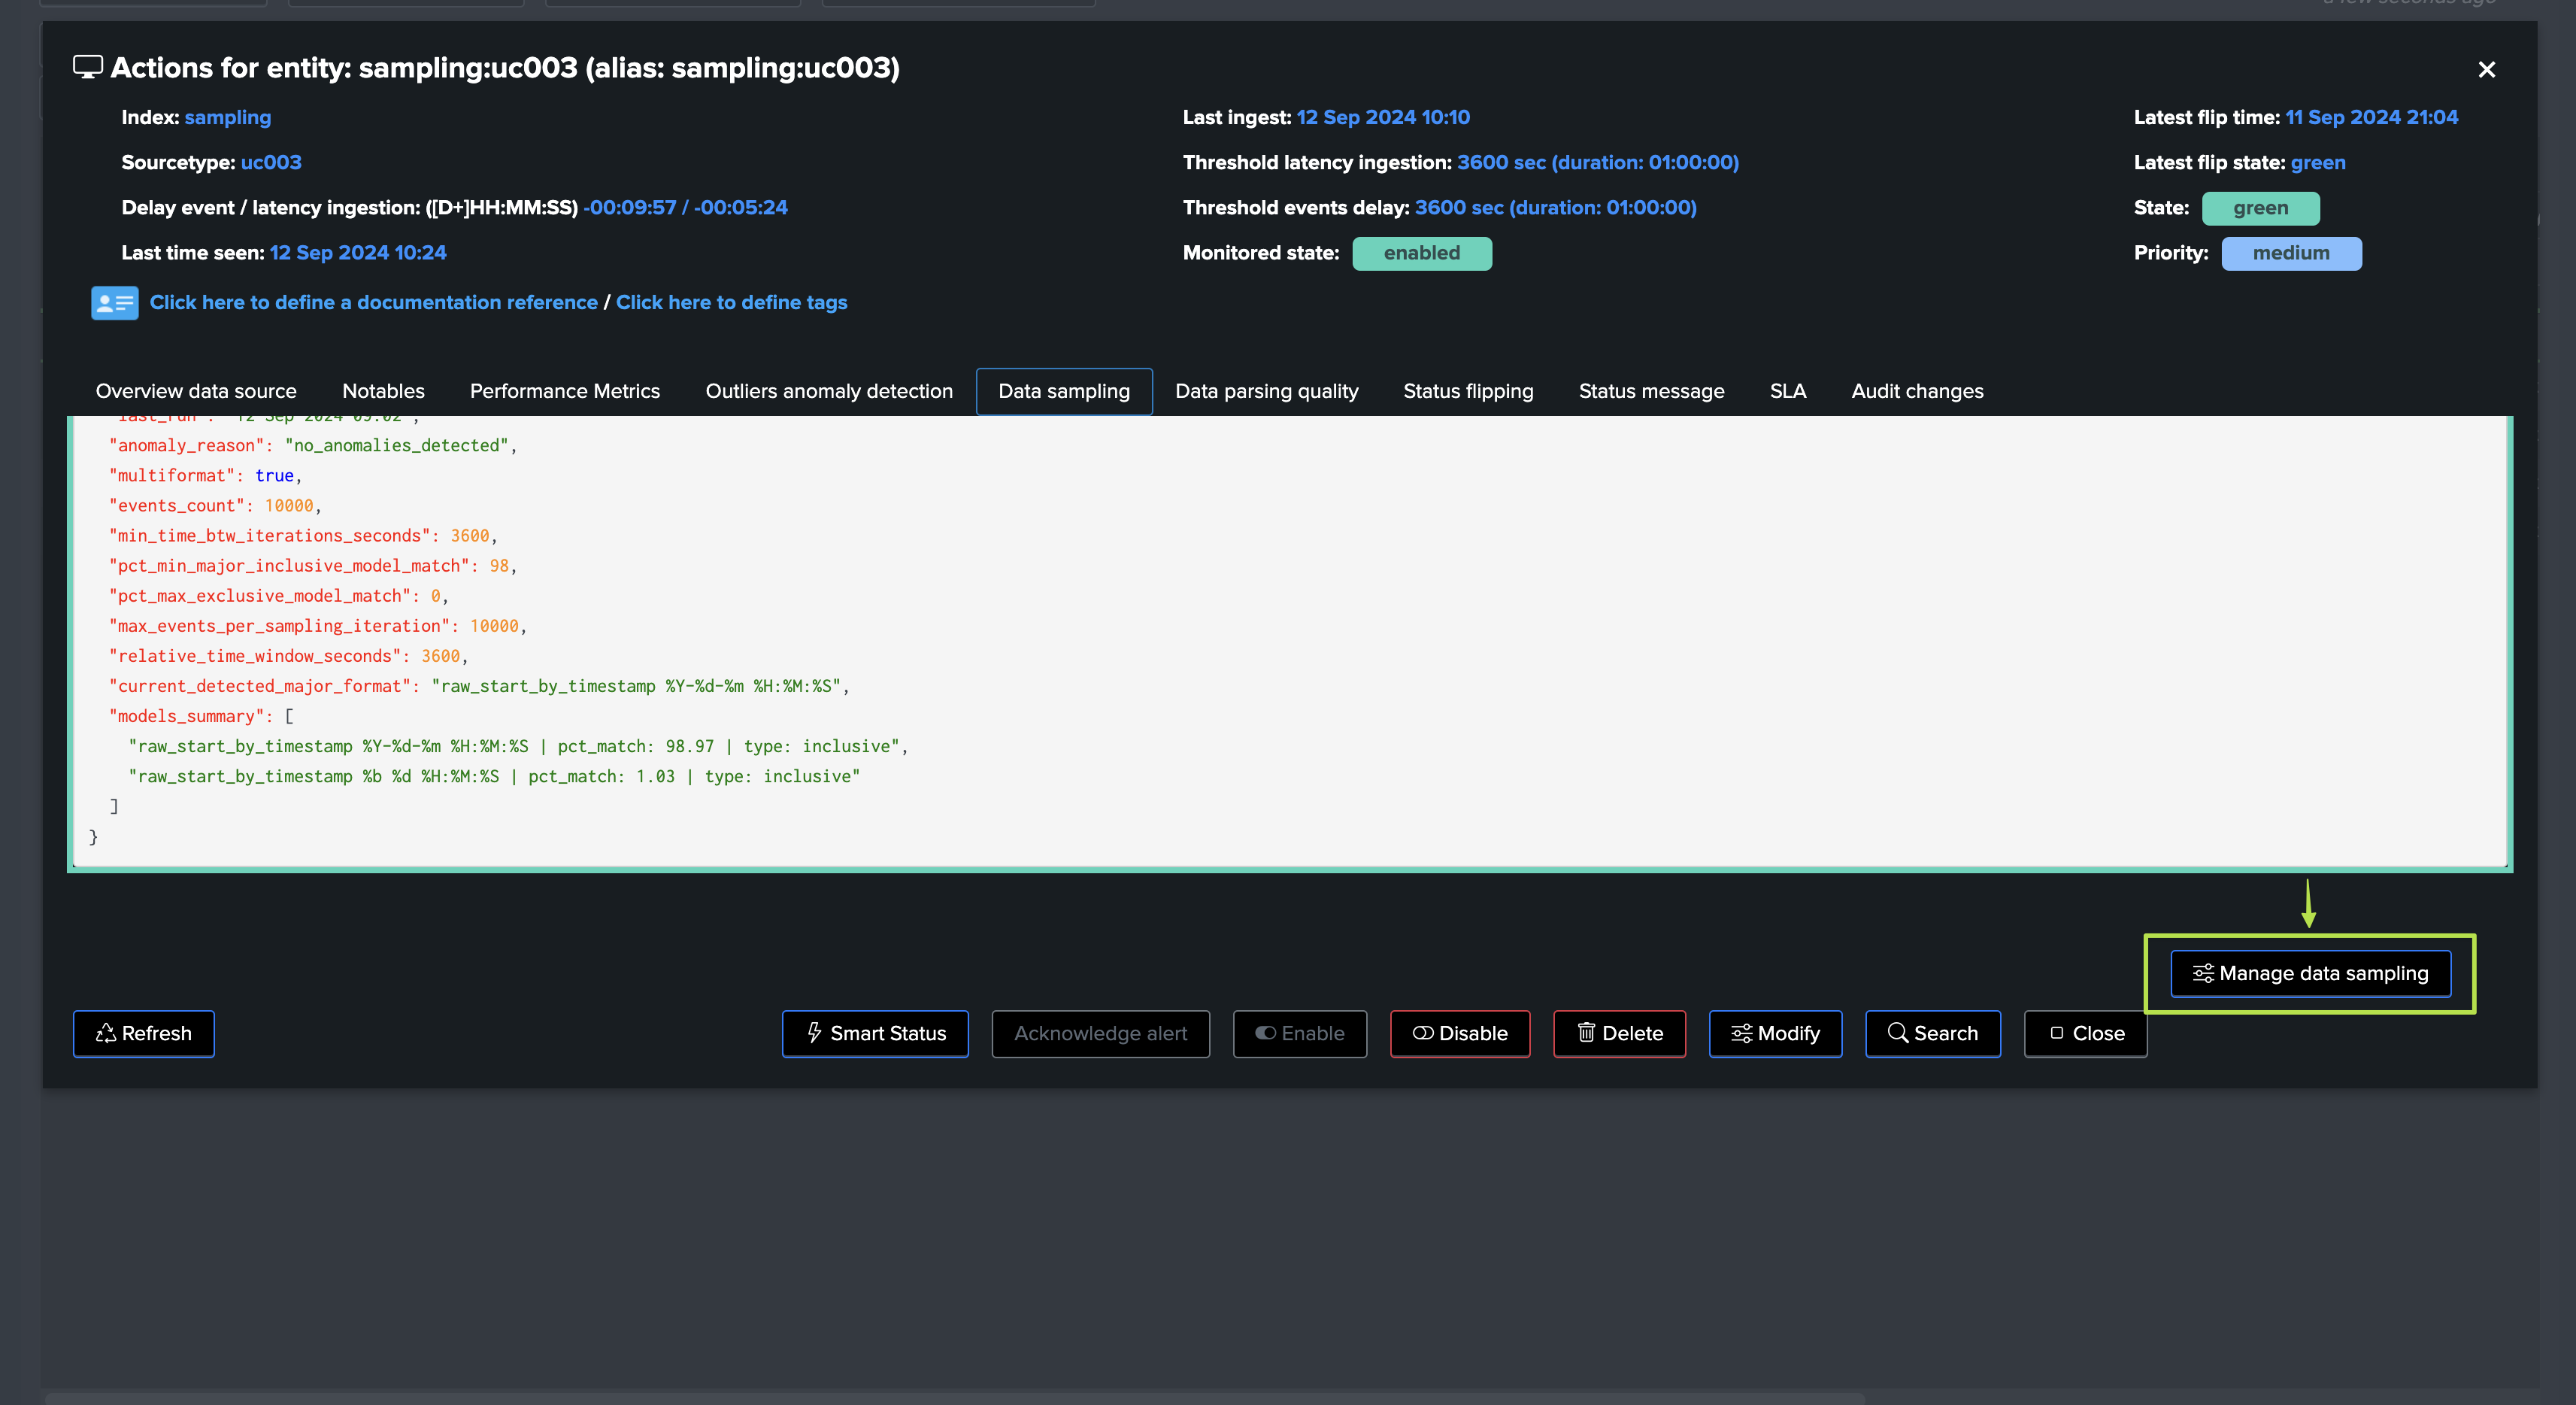
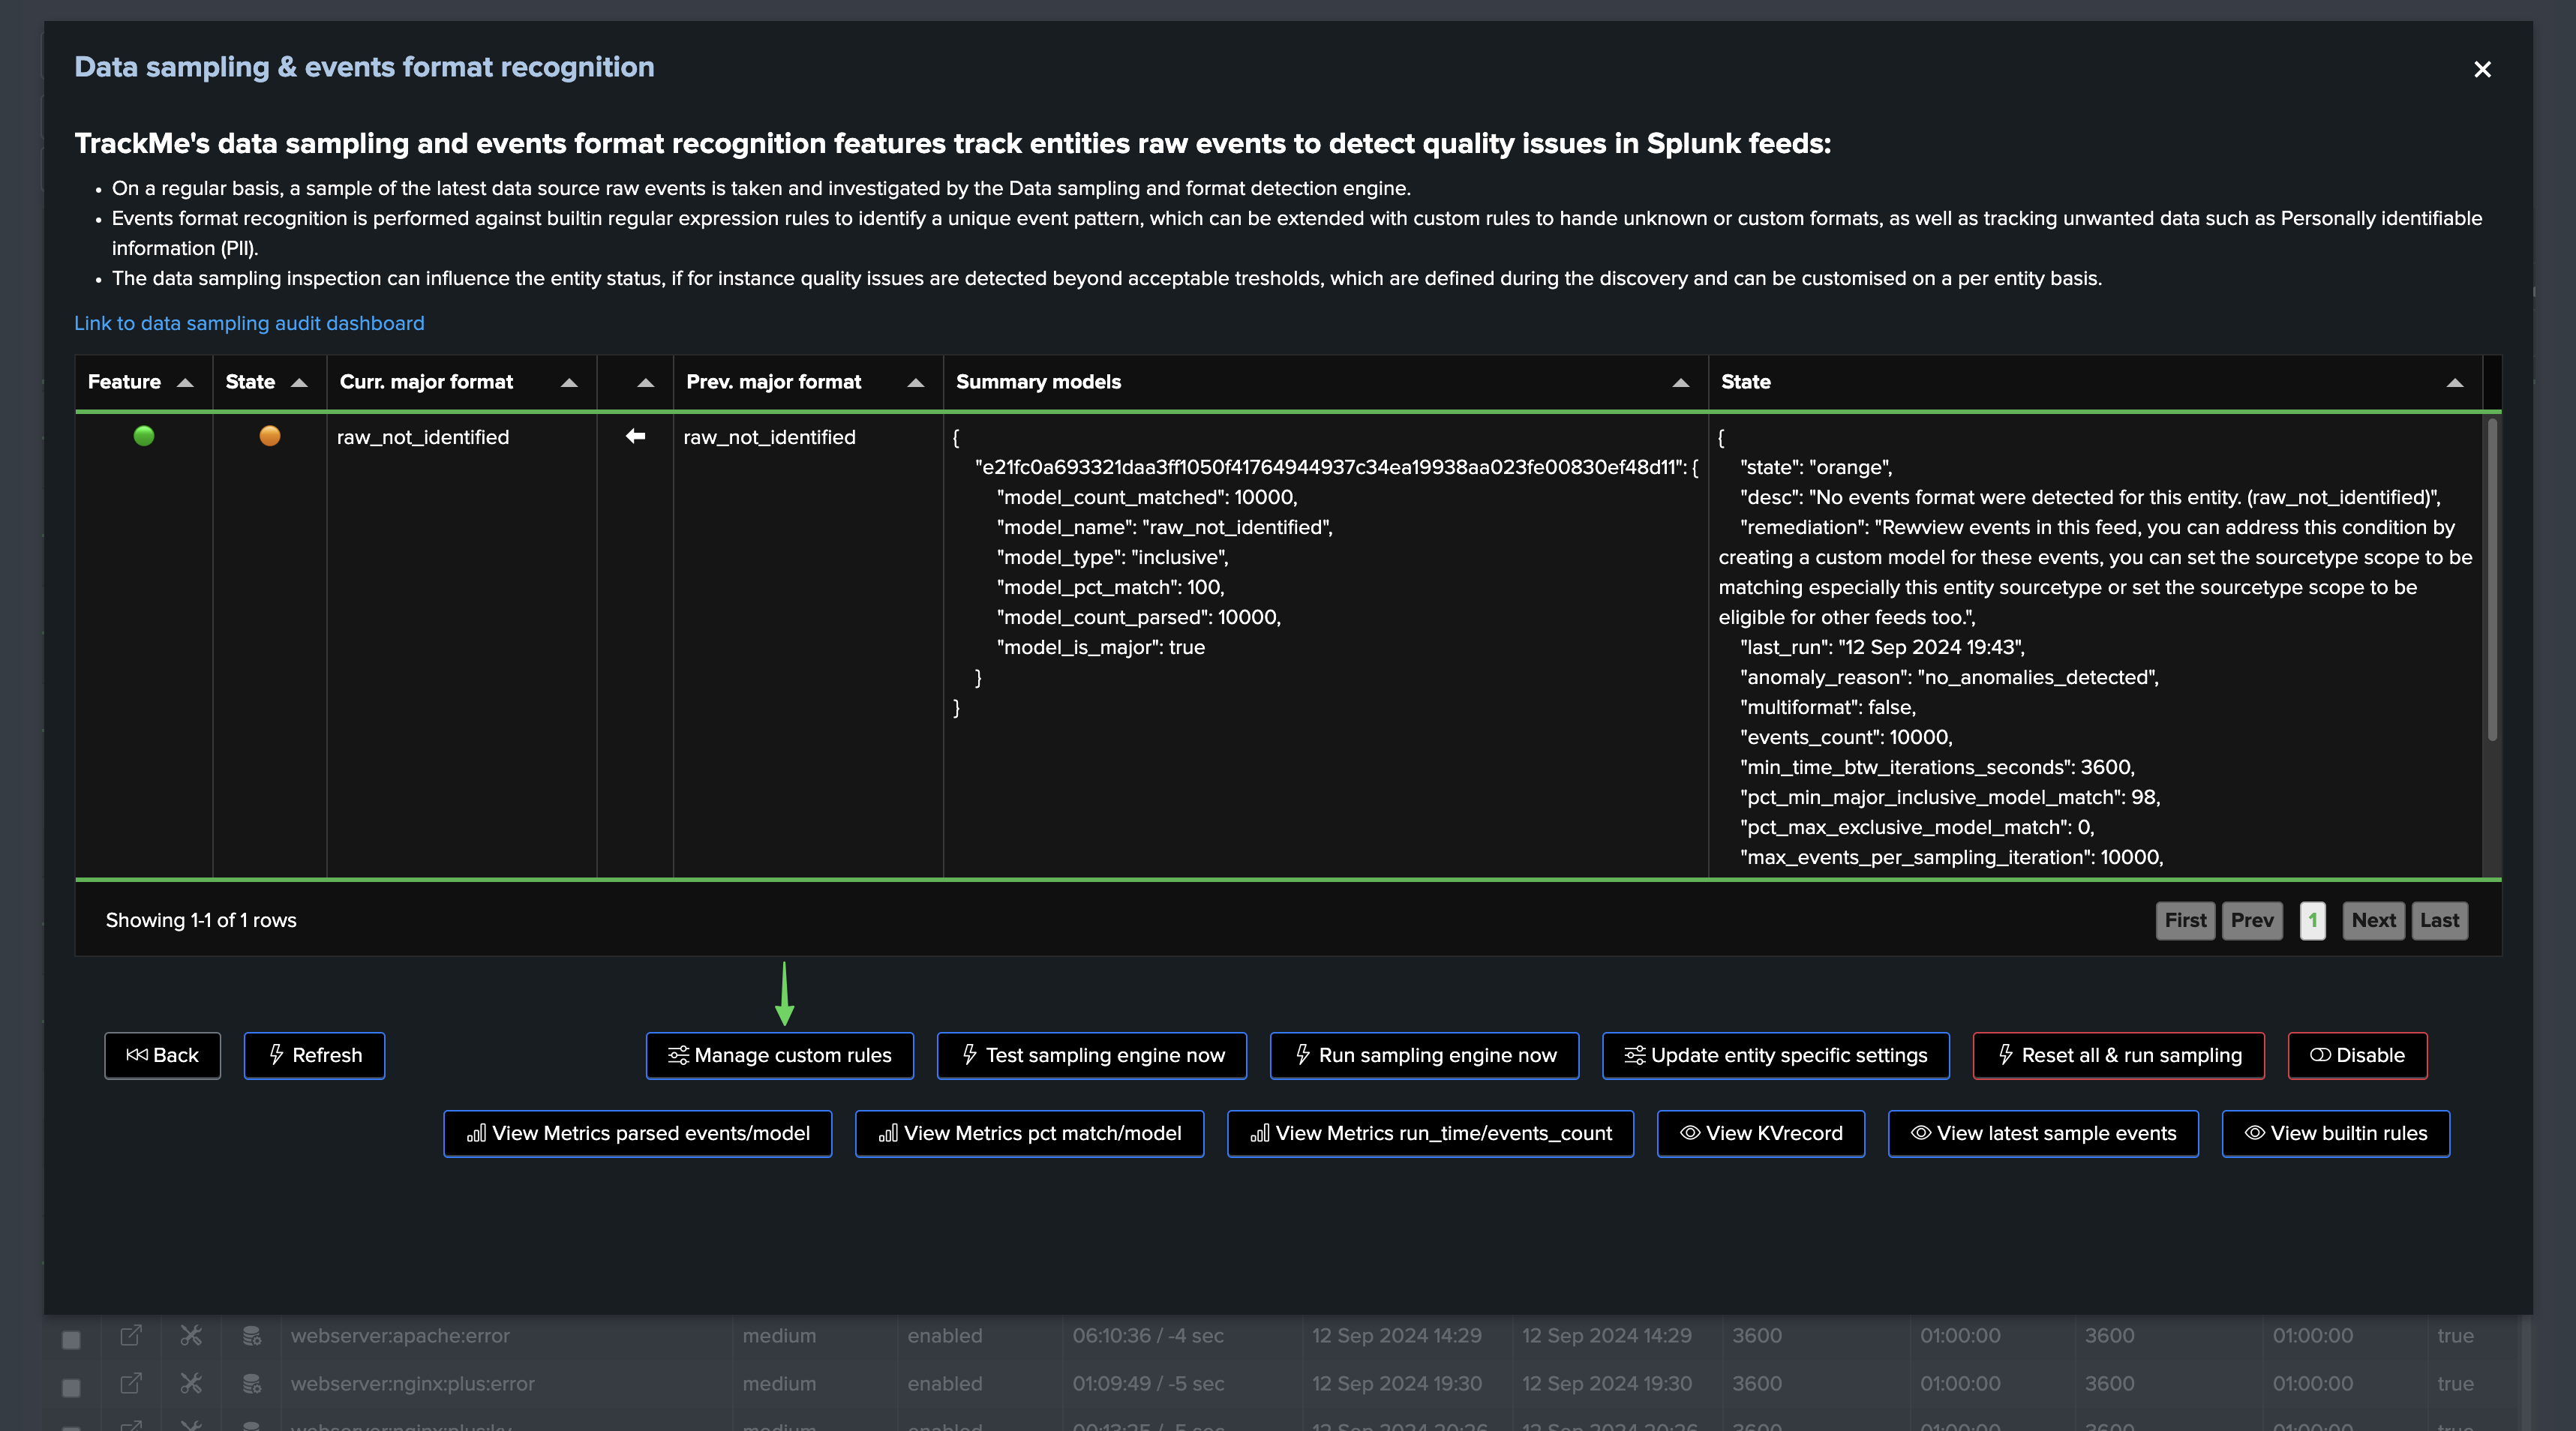
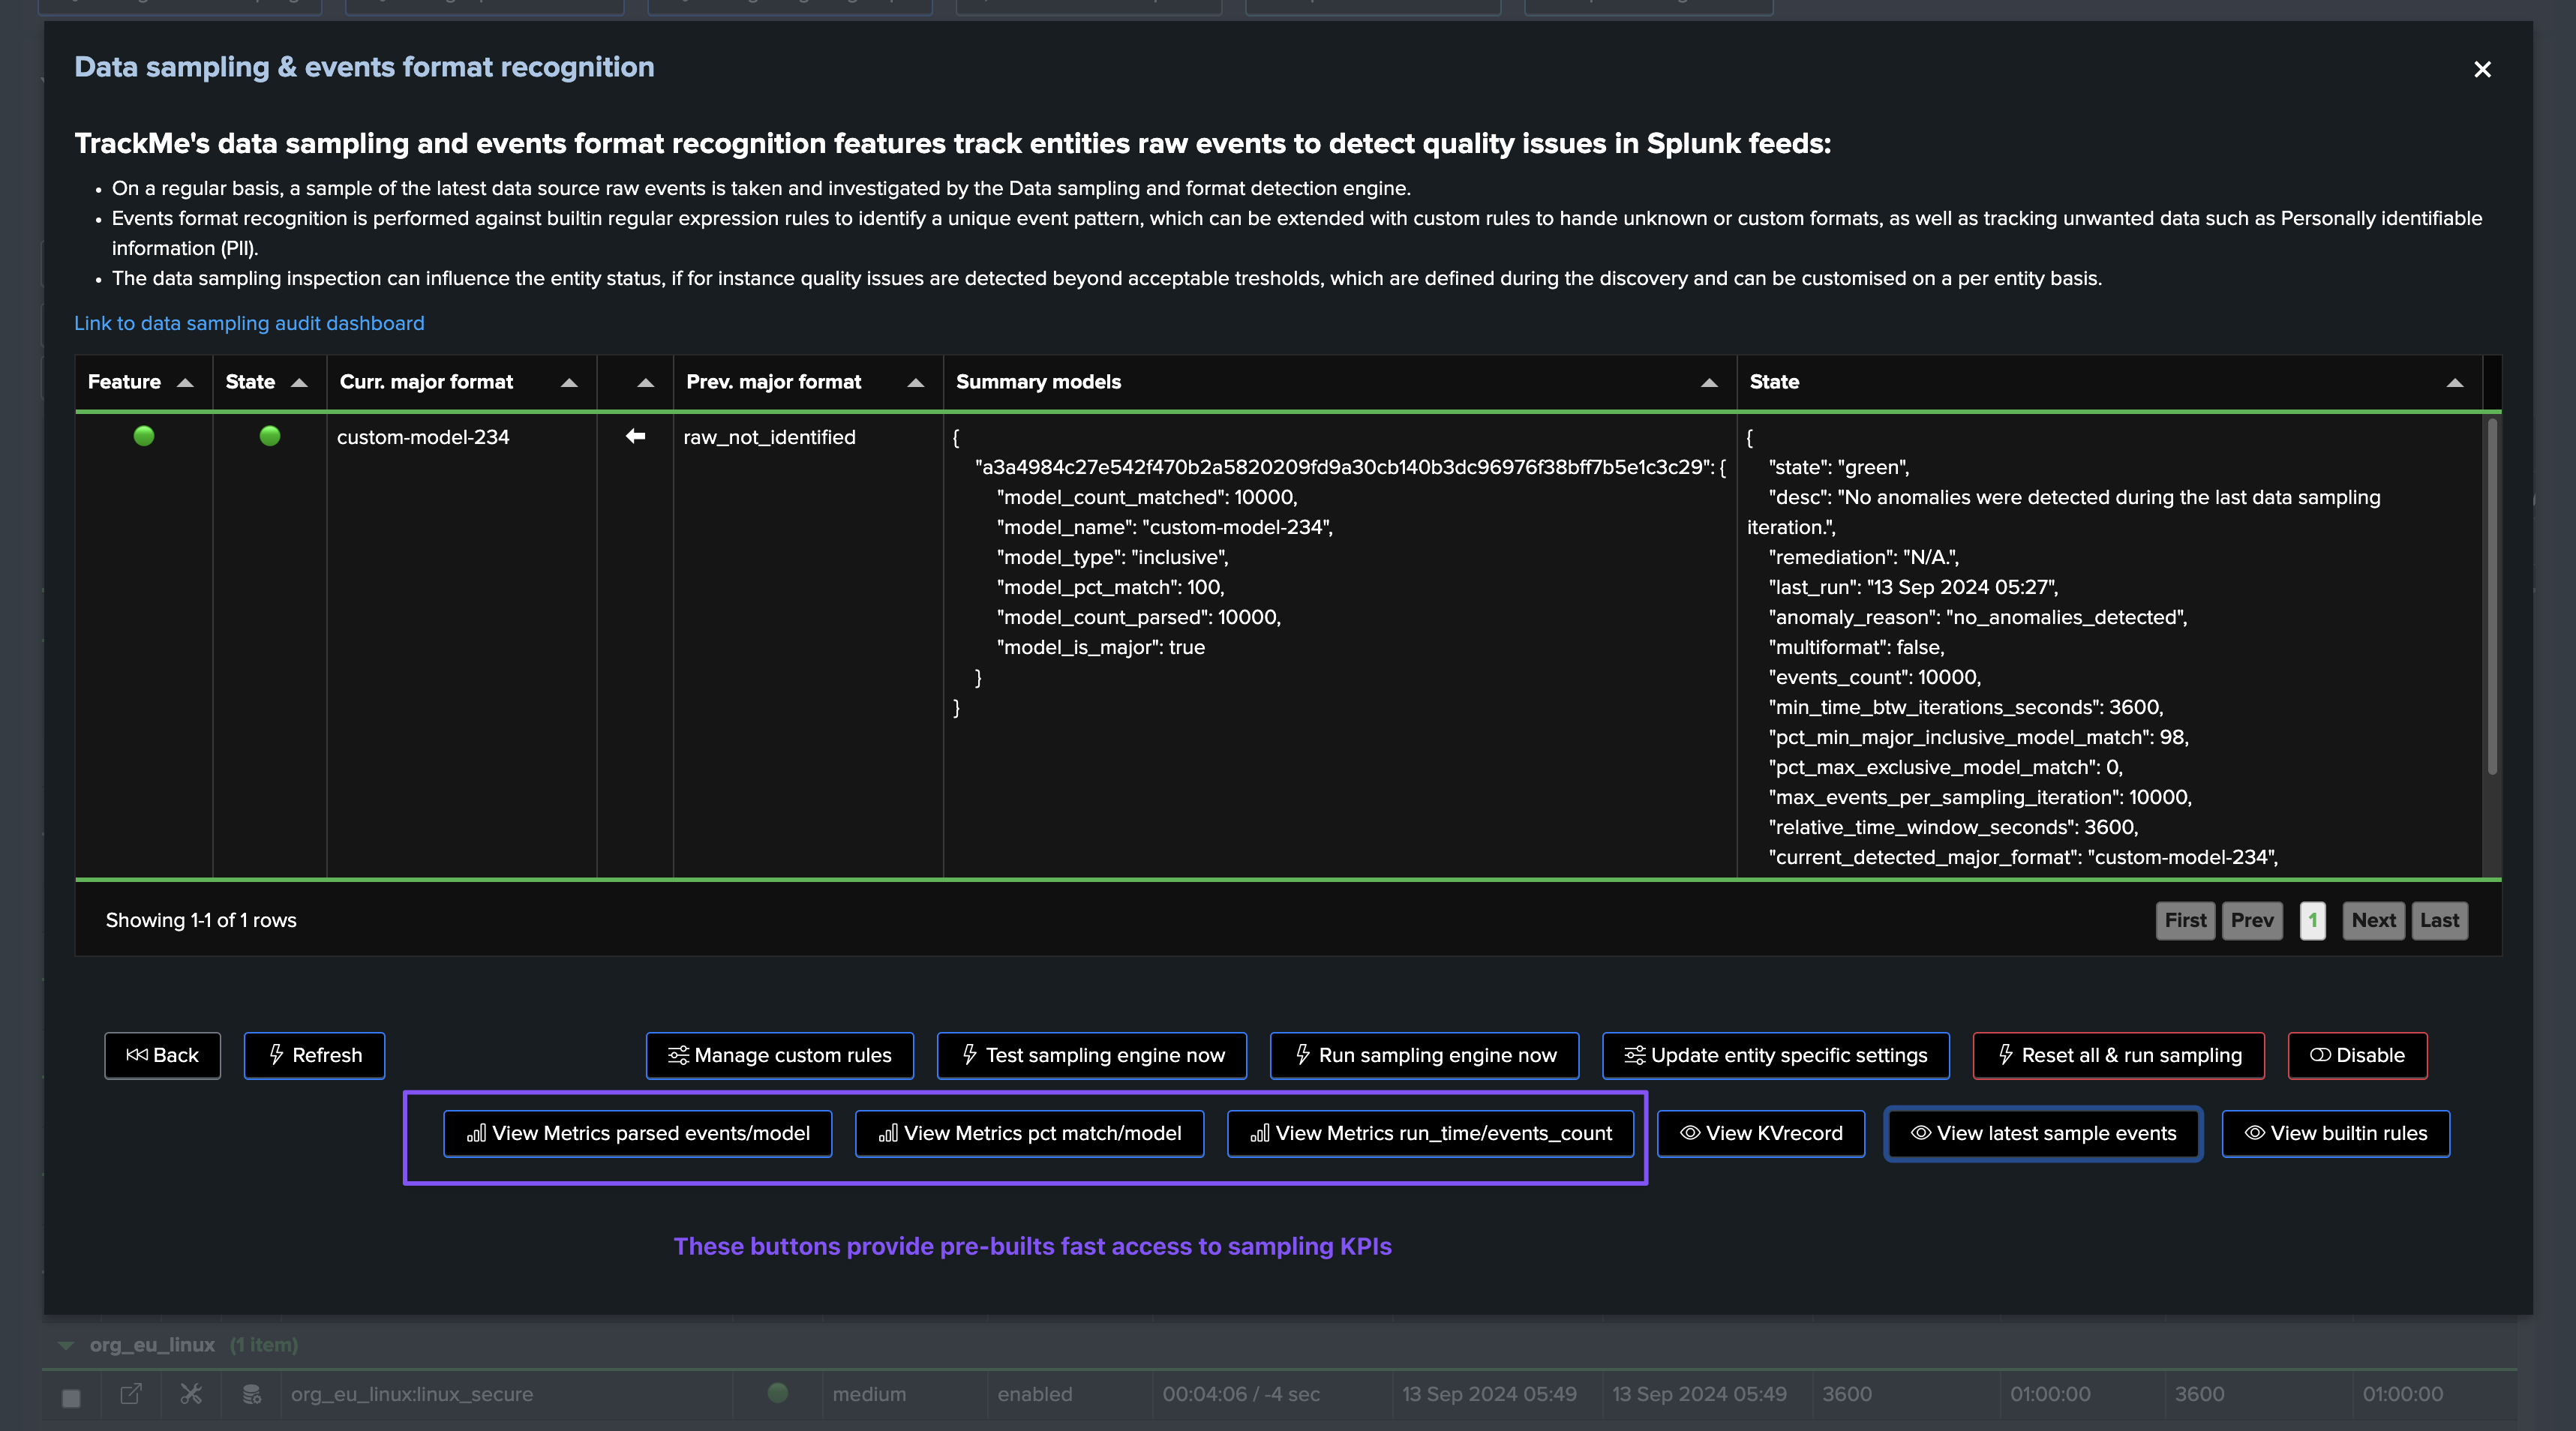
You access to the full detailed by clicking on “Manage Data sampling” button:
High-Level Overview of the Data Sampling Process
In a very high-level overview, the data sampling process works as follows:
Step 1: Data Sampling Tracker Execution and Entities to be Sampled Identification
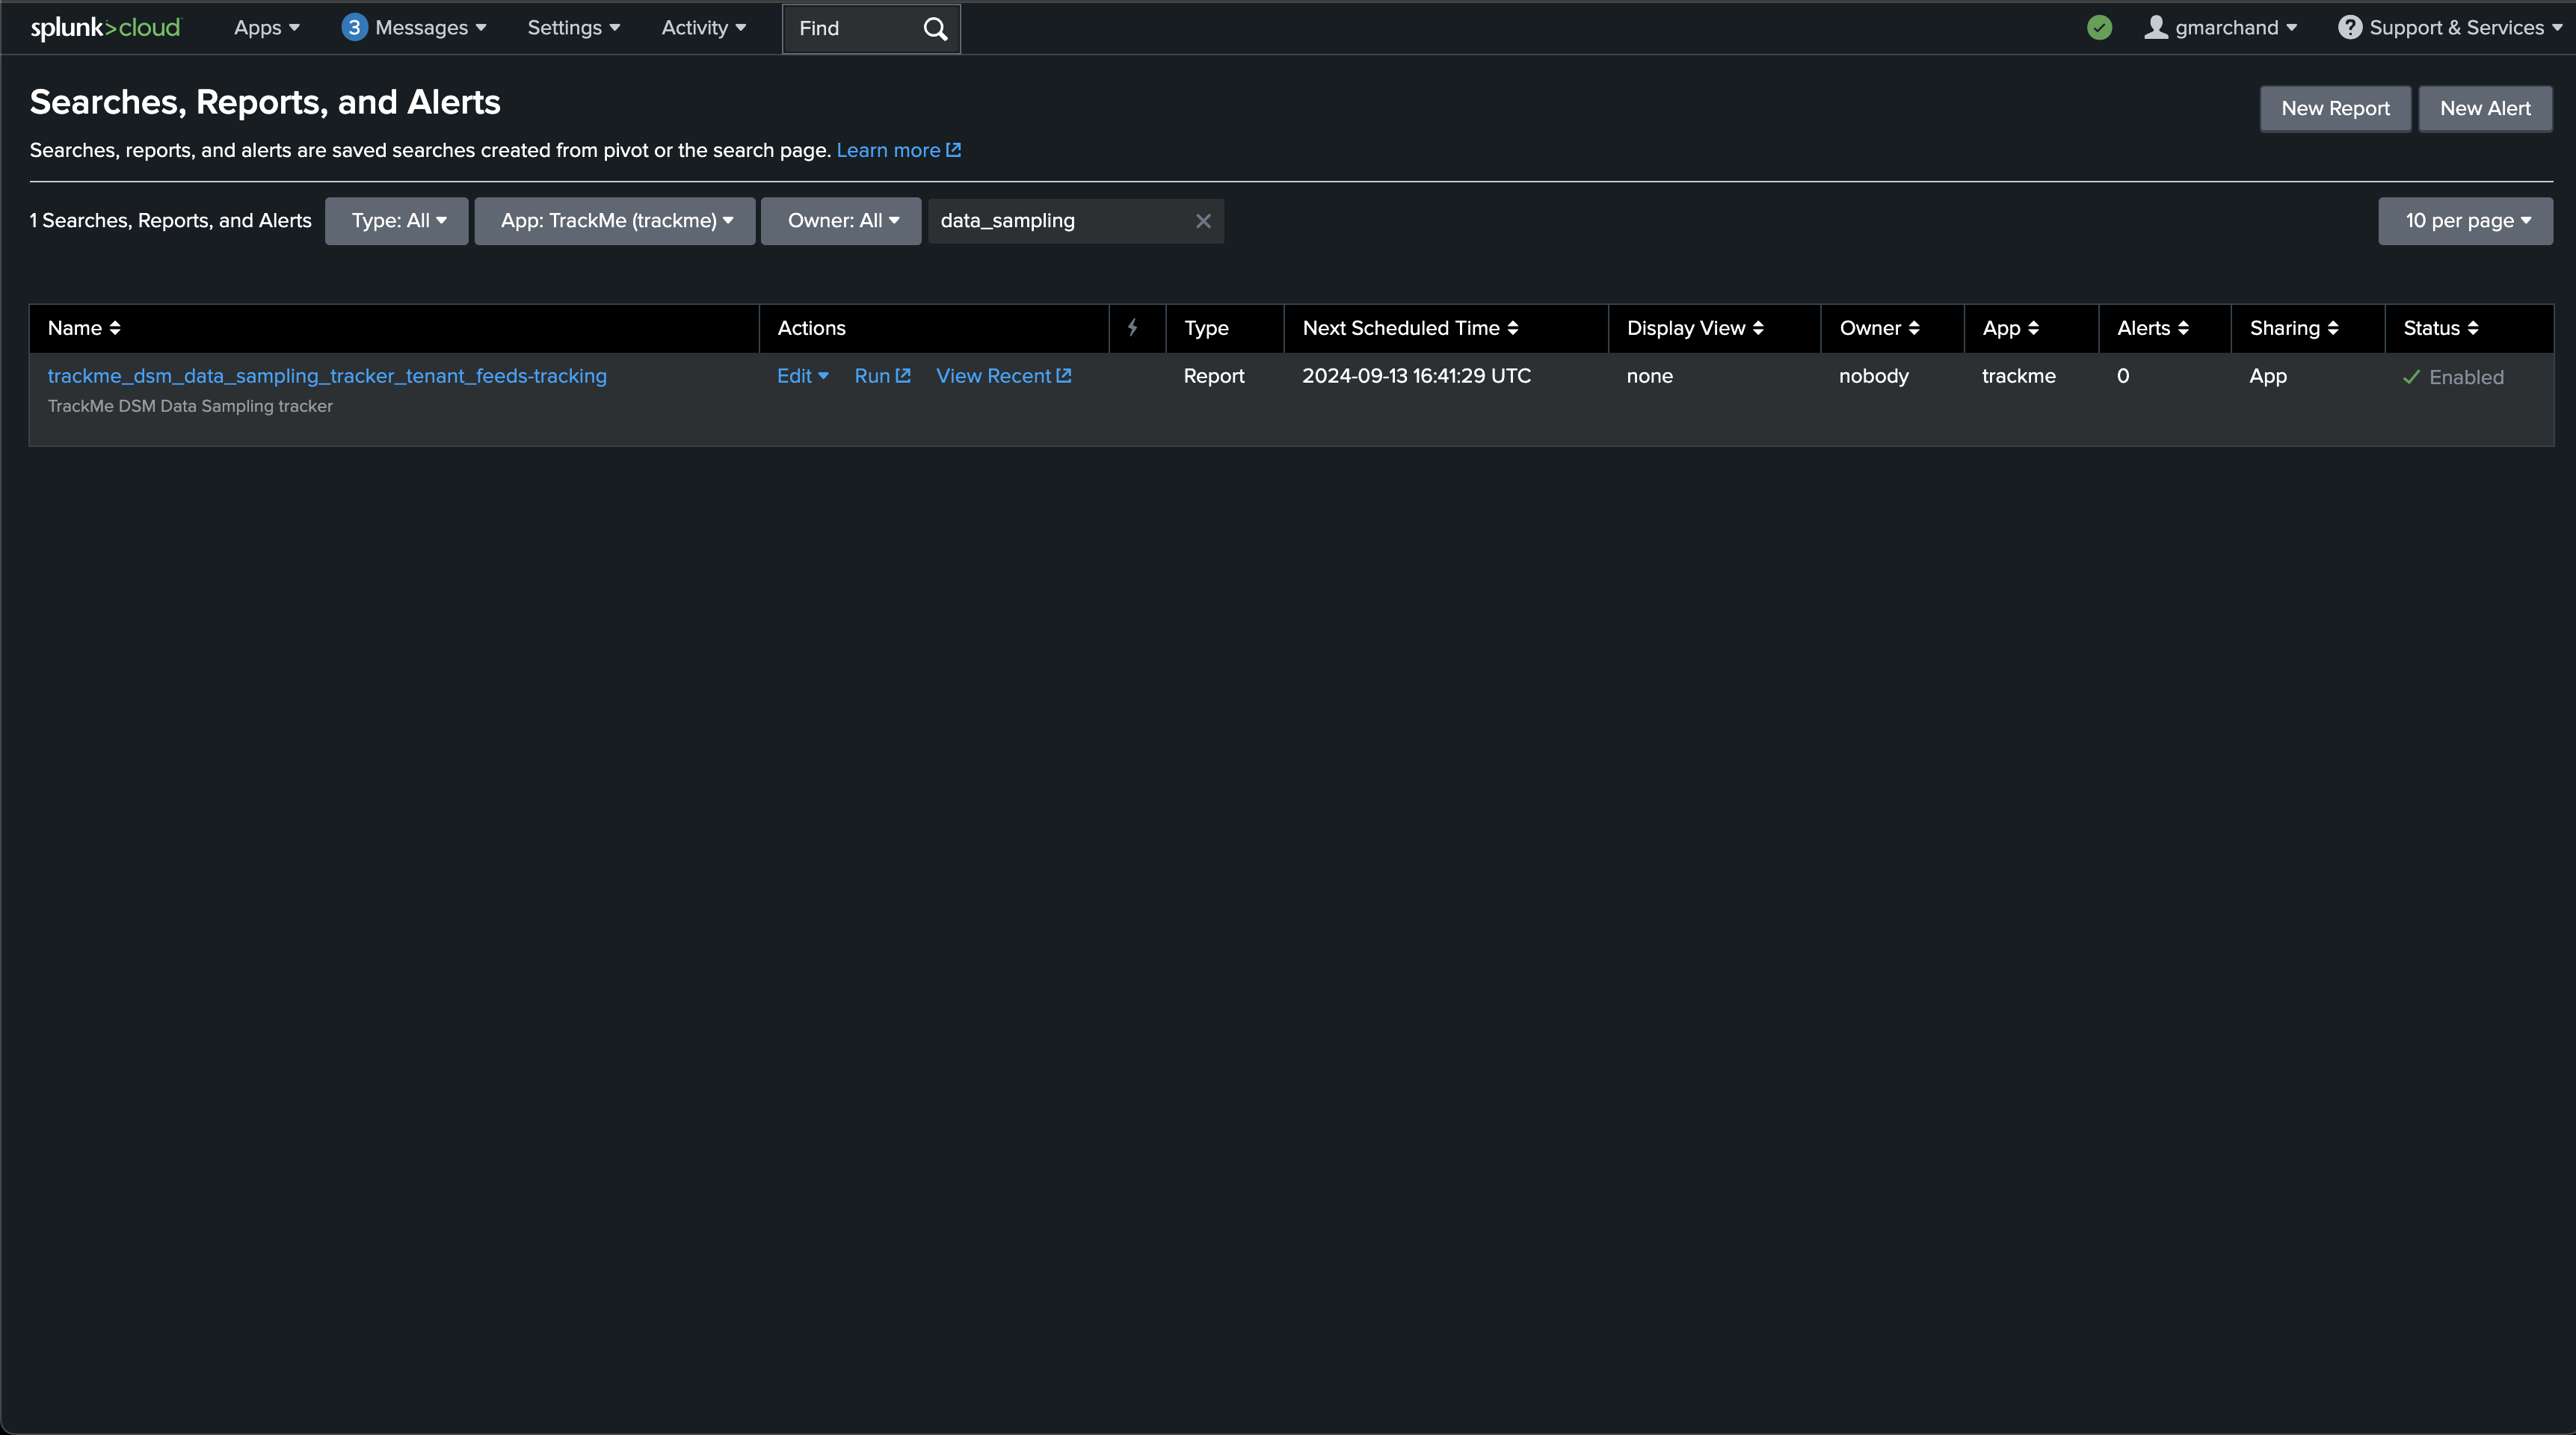
The Virtual Tenant’s Data sampling tracker, which is a scheduled job called trackme_dsm_data_sampling_tracker_tenant_<tenant_id>, is executed every 20 minutes.
The scheduled backend starts by extracting the list of TrackMe entities to be sampled, using the following Splunk search:
Example:
| inputlookup trackme_dsm_tenant_mytenant where monitored_state="enabled"
| eval key=_key
| `trackme_exclude_badentities`
| where data_last_time_seen>relative_time(now(), "-24h")
| lookup trackme_dsm_data_sampling_tenant_mytenant object OUTPUT data_sample_feature, relative_time_window_seconds, data_sample_last_entity_epoch_processed, min_time_btw_iterations_seconds, data_sample_mtime
``` only consider entities where the last processed epoch (data_sample_last_entity_epoch_processed) is older than data_last_time_seen, or null (entities has not been processed yet) ```
| where (isnull(data_sample_last_entity_epoch_processed) OR data_sample_last_entity_epoch_processed<data_last_time_seen)
| eval data_sample_feature=if(isnull(data_sample_feature), "enabled", data_sample_feature) | where (data_sample_feature!="disabled")
``` only consider entities where the min_time_btw_iterations_seconds is older than the current time (bigger or equal to the time spent since last run, or null for new entities) ```
| eval time_spent_since_last_run=now()-data_sample_mtime
| where (isnull(min_time_btw_iterations_seconds) OR time_spent_since_last_run>=min_time_btw_iterations_seconds)
``` define a priority rank, entities that have been set as disabled_auto should be processed last compared to entities in disabled_audo ```
| eval priority_rank=if(data_sample_feature=="enabled", 1, 2)
``` order ```
| sort limit=0 priority_rank, data_sample_mtime
| fields object, key, data_last_time_seen, *
| eval earliest_target=if(isnum(relative_time_window_seconds), data_last_time_seen-relative_time_window_seconds, data_last_time_seen-3600)
Notes:
Some of these settings are defined at the system wide level, the search without variable values is the following, the example above is a simplified version of the search for a tenant named “mytenant”
To see what is the actual search executed by TrackMe, look at:
index=_internal sourcetype=trackme:custom_commands:trackmesamplingexecutor "Executing upstream definition search"
Step 2: Run the Data Sampling Process for Each Entity
For each entity to be sampled, the data sampling process is executed.
This process means that TrackMe identifies the search to be executed, which depends on the context of the entity as well as various settings such as the relative time window (against the last known event for that entity).
The search is executed, each event result from the search goes through the rules, customer rules if any, and the built-in rules.
The engine extracts a sample of events per model matched and per entity, which will be stored in the data sampling KVstore collection for investigation purposes.
Additionally, the engine performs various calculations, notably the percentage of events matched per model, and the major model of the entity.
Finally, the engine generates various metrics (KPIs) in the tenant metrics index, and updates the KVstore record defining the data sampling status, messages, and other metadata.
Notes:
You can review the logs associated with the data sampling operation of a given TrackMe entity as easy as:
index=_internal sourcetype=trackme:custom_commands:trackmesamplingexecutor object="<object value>"
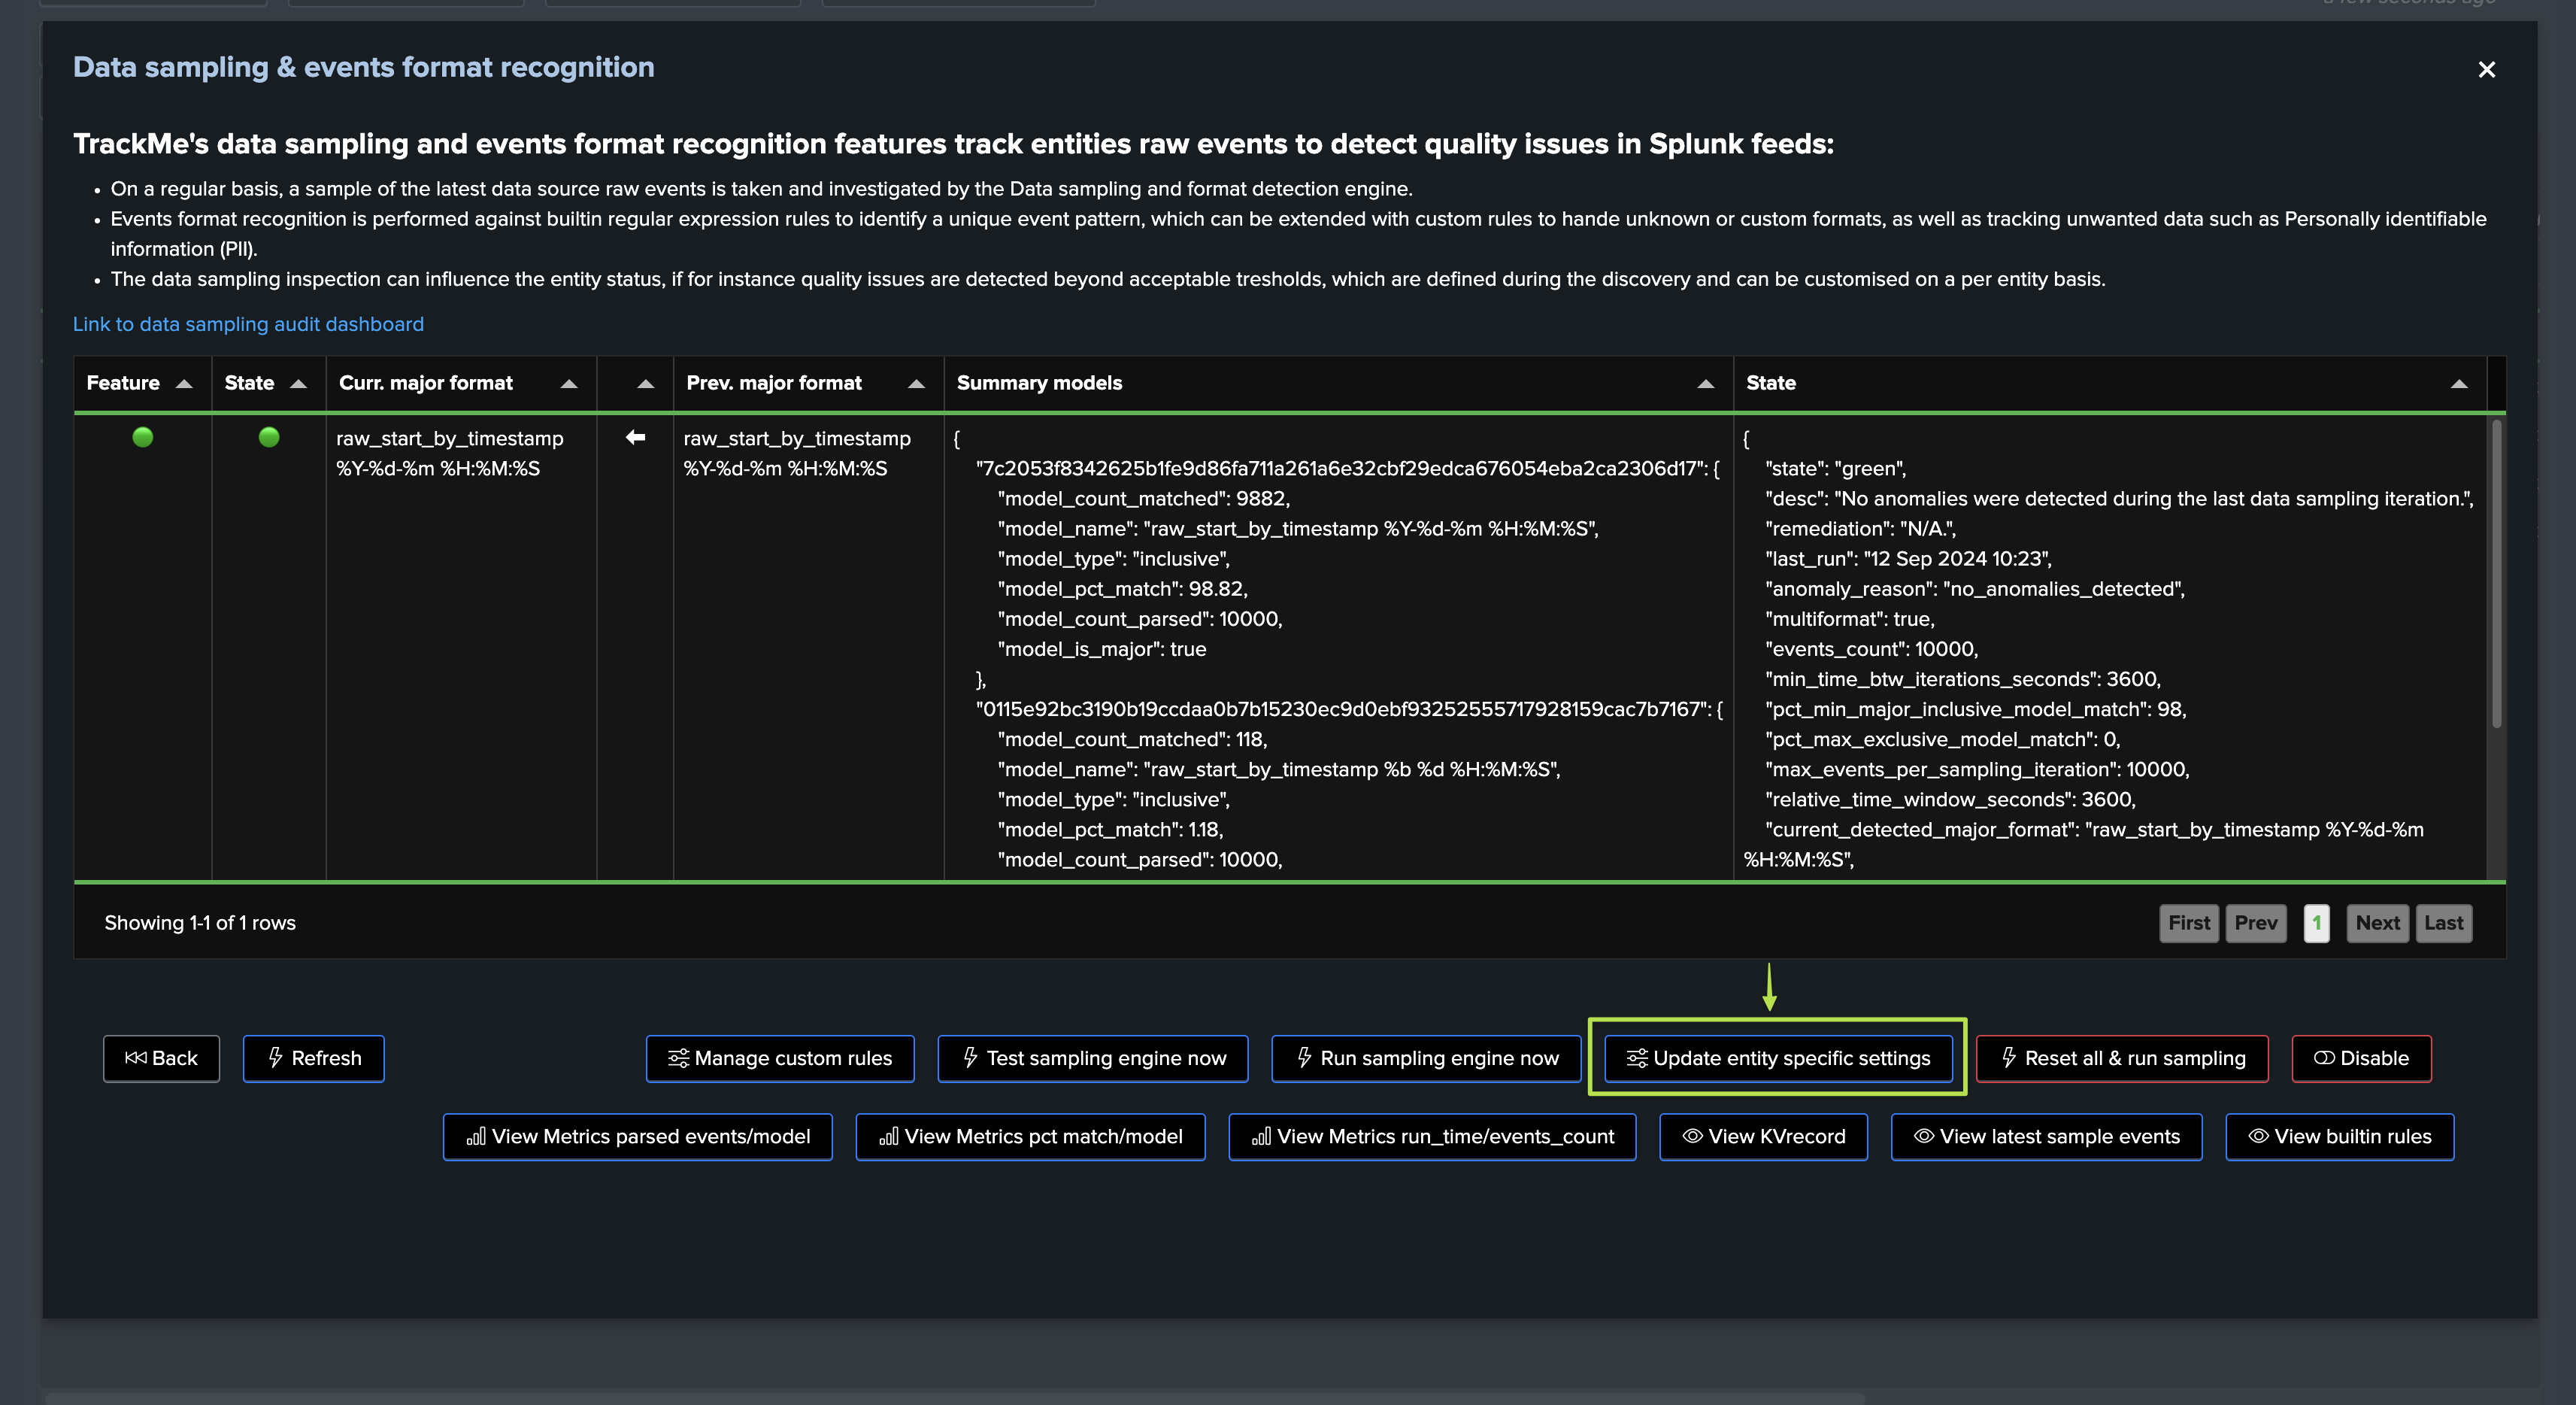
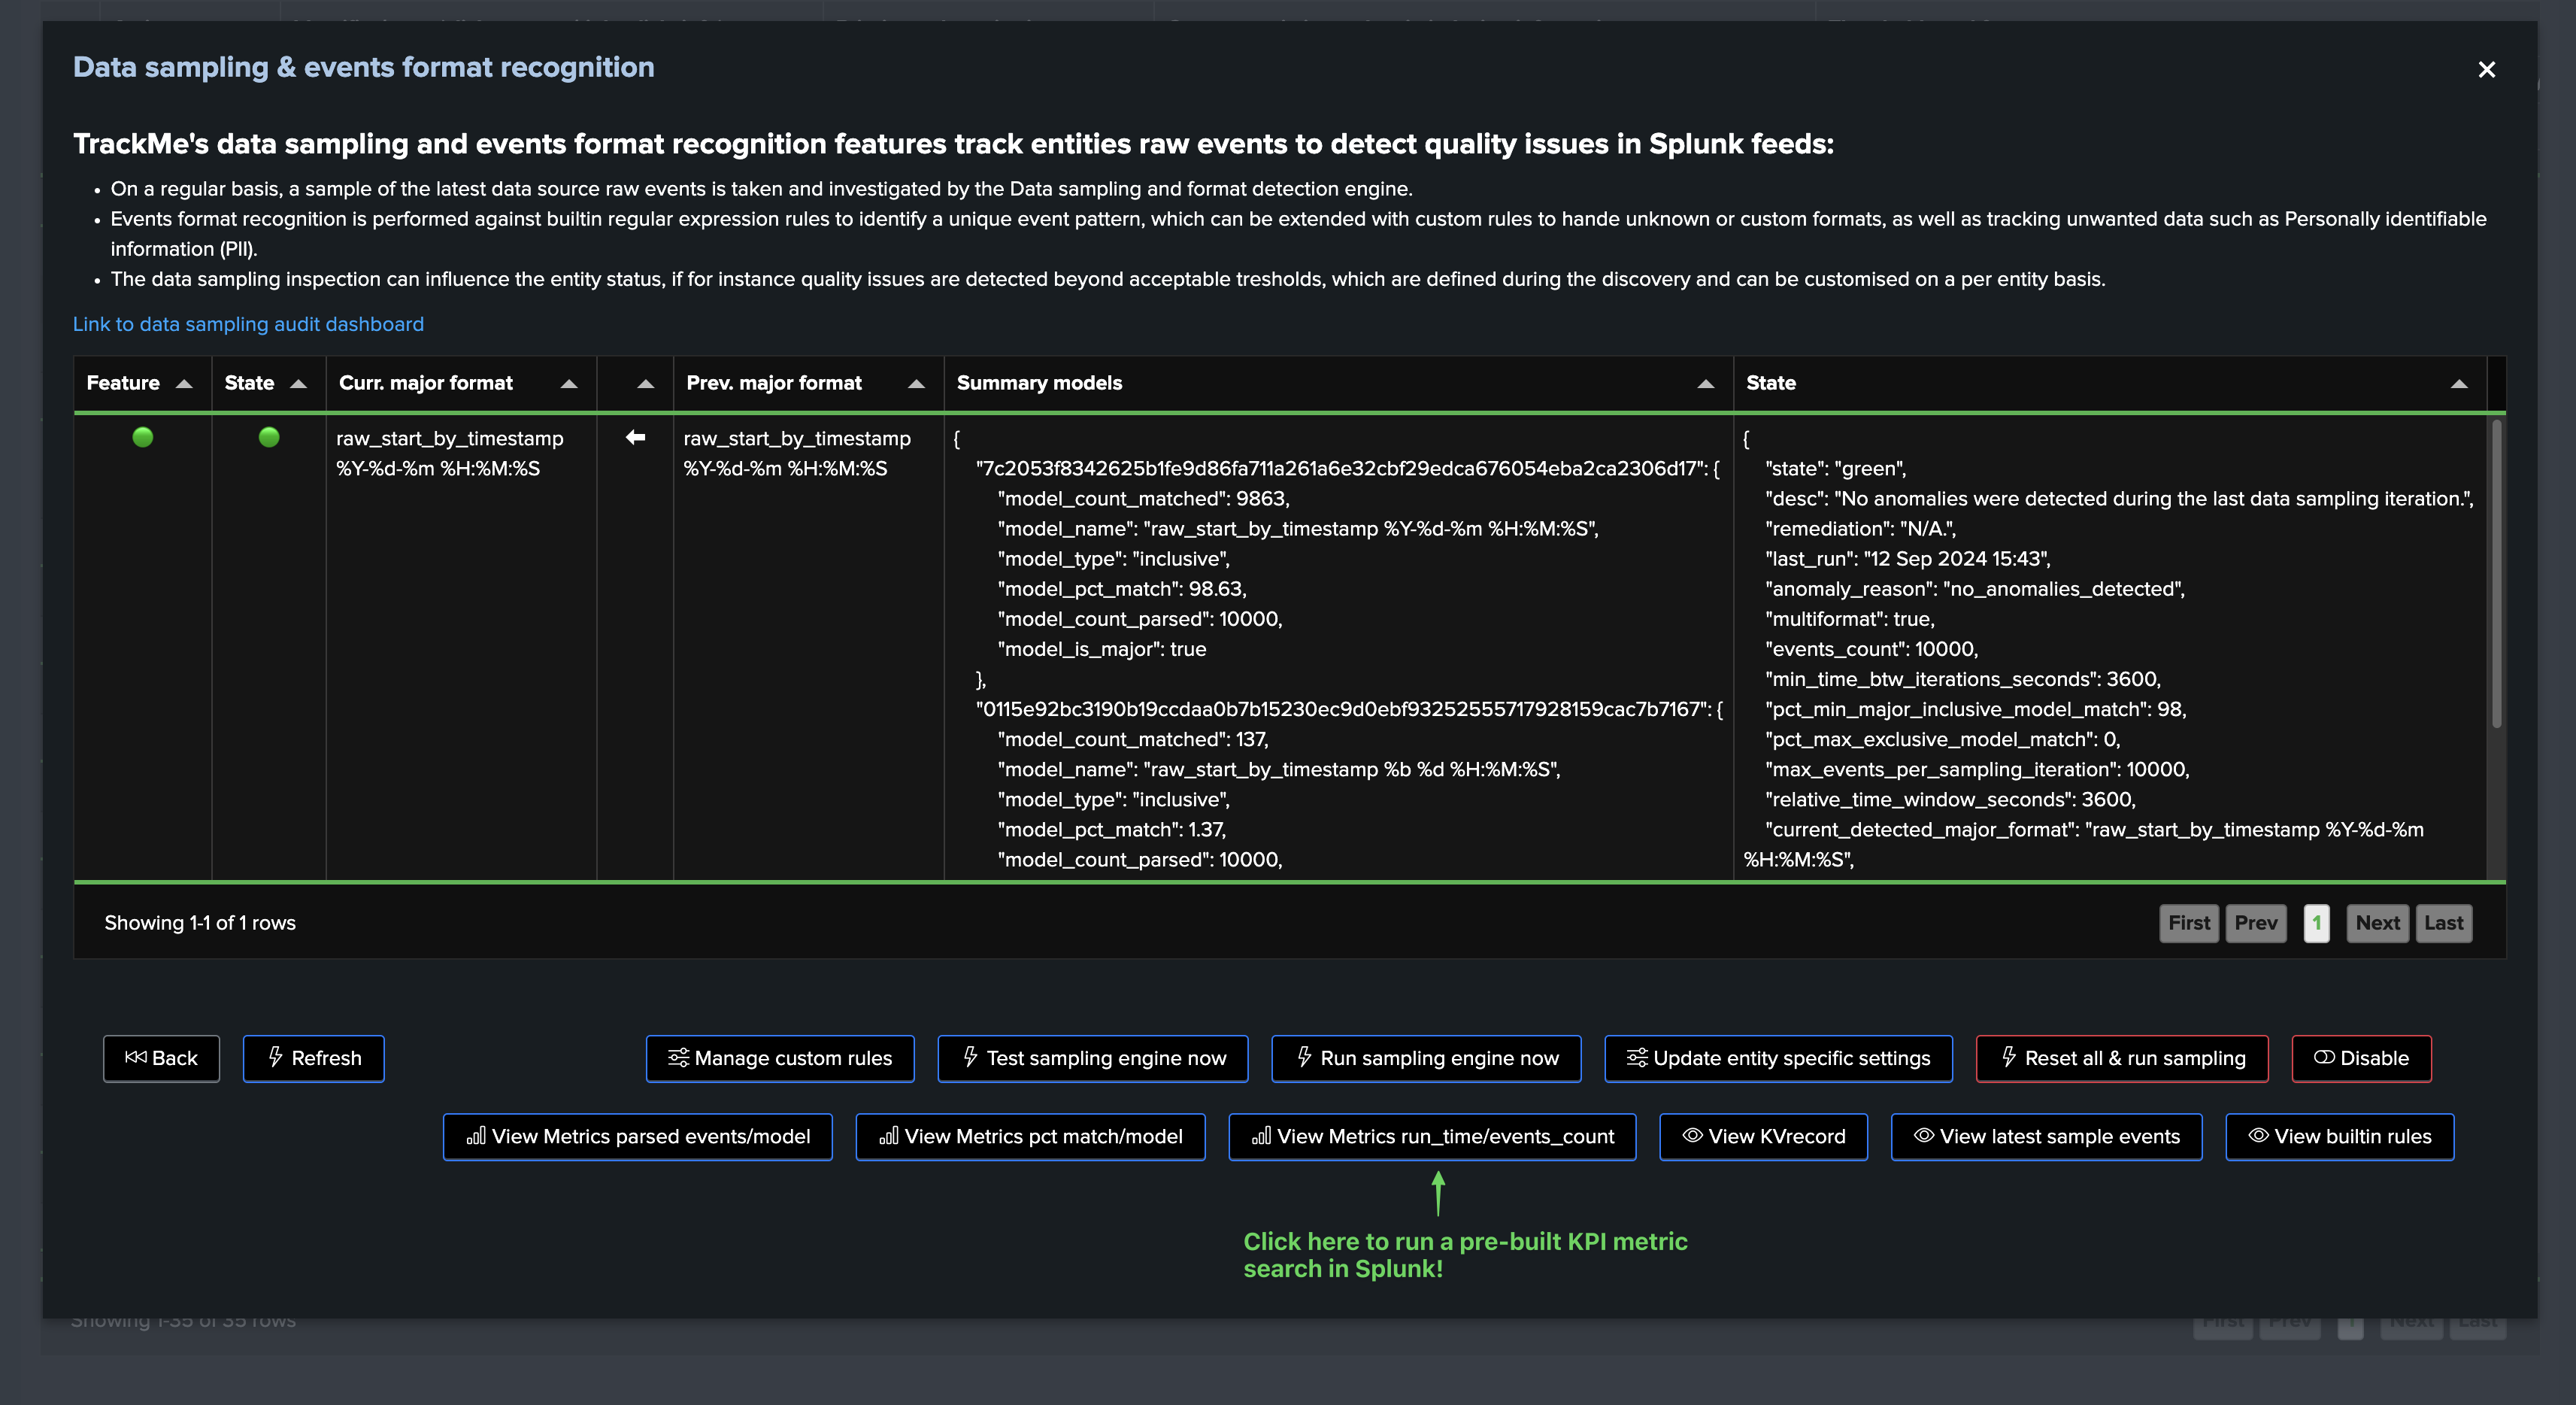
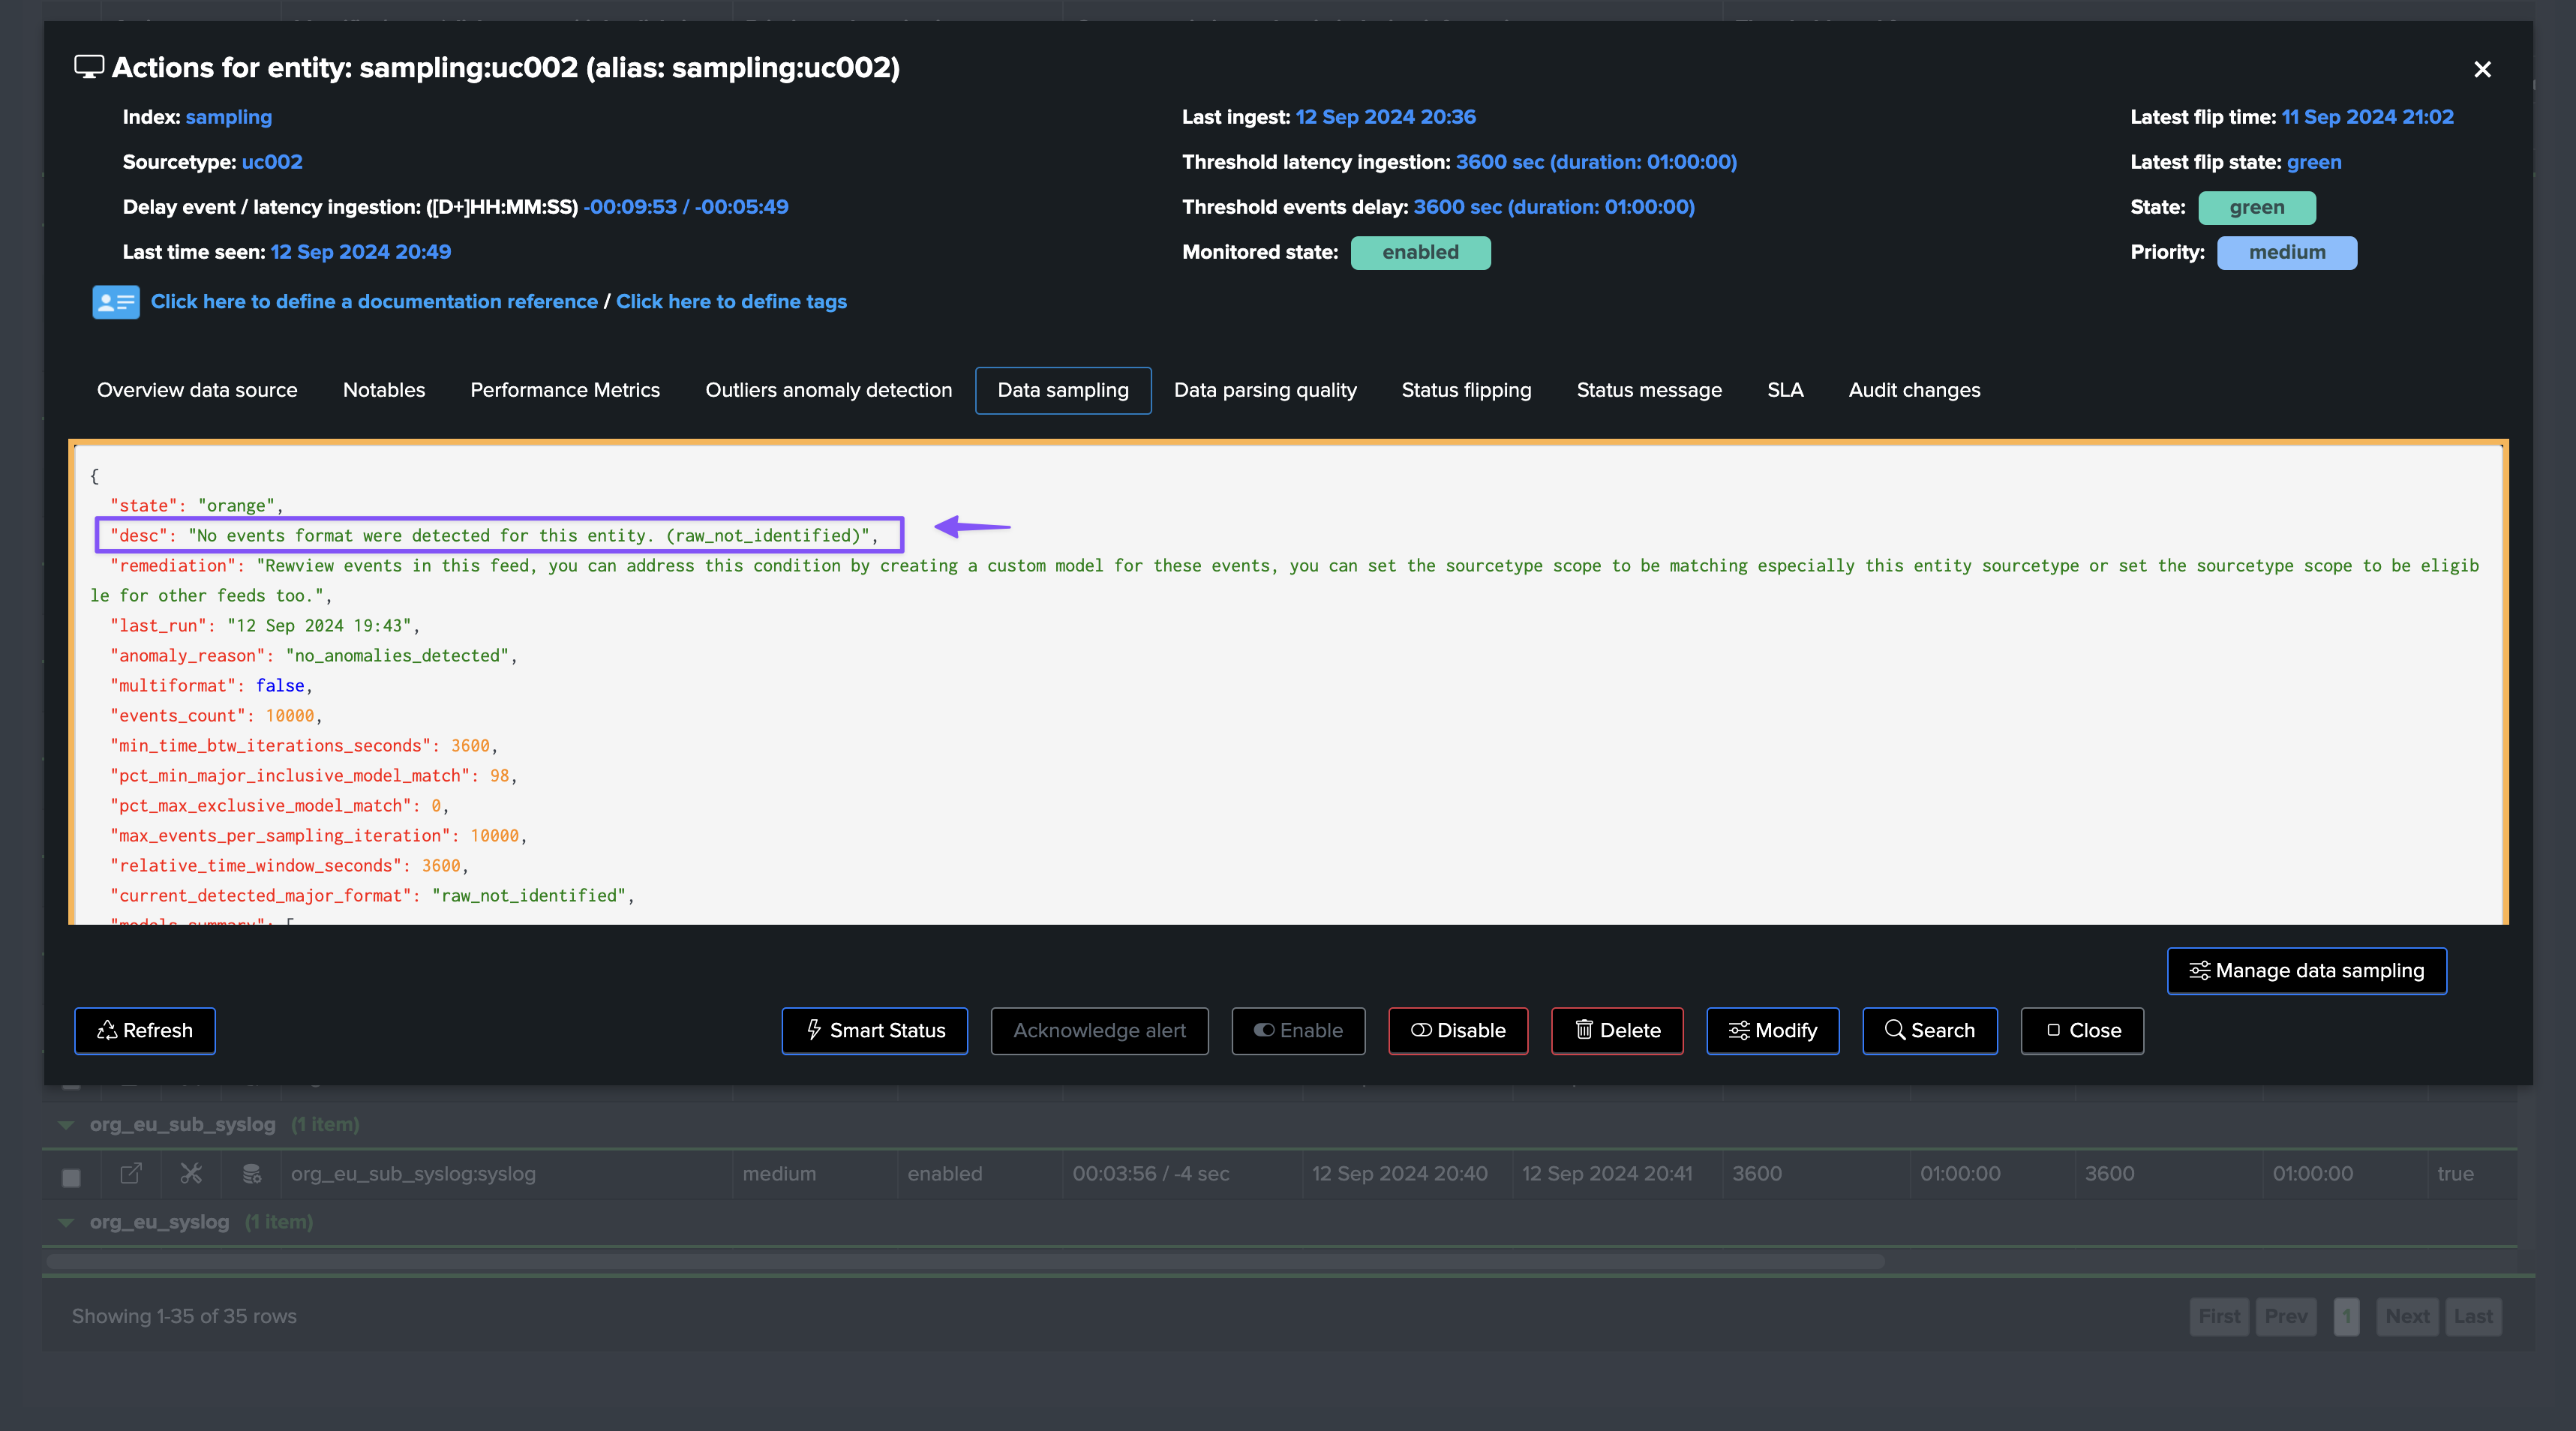
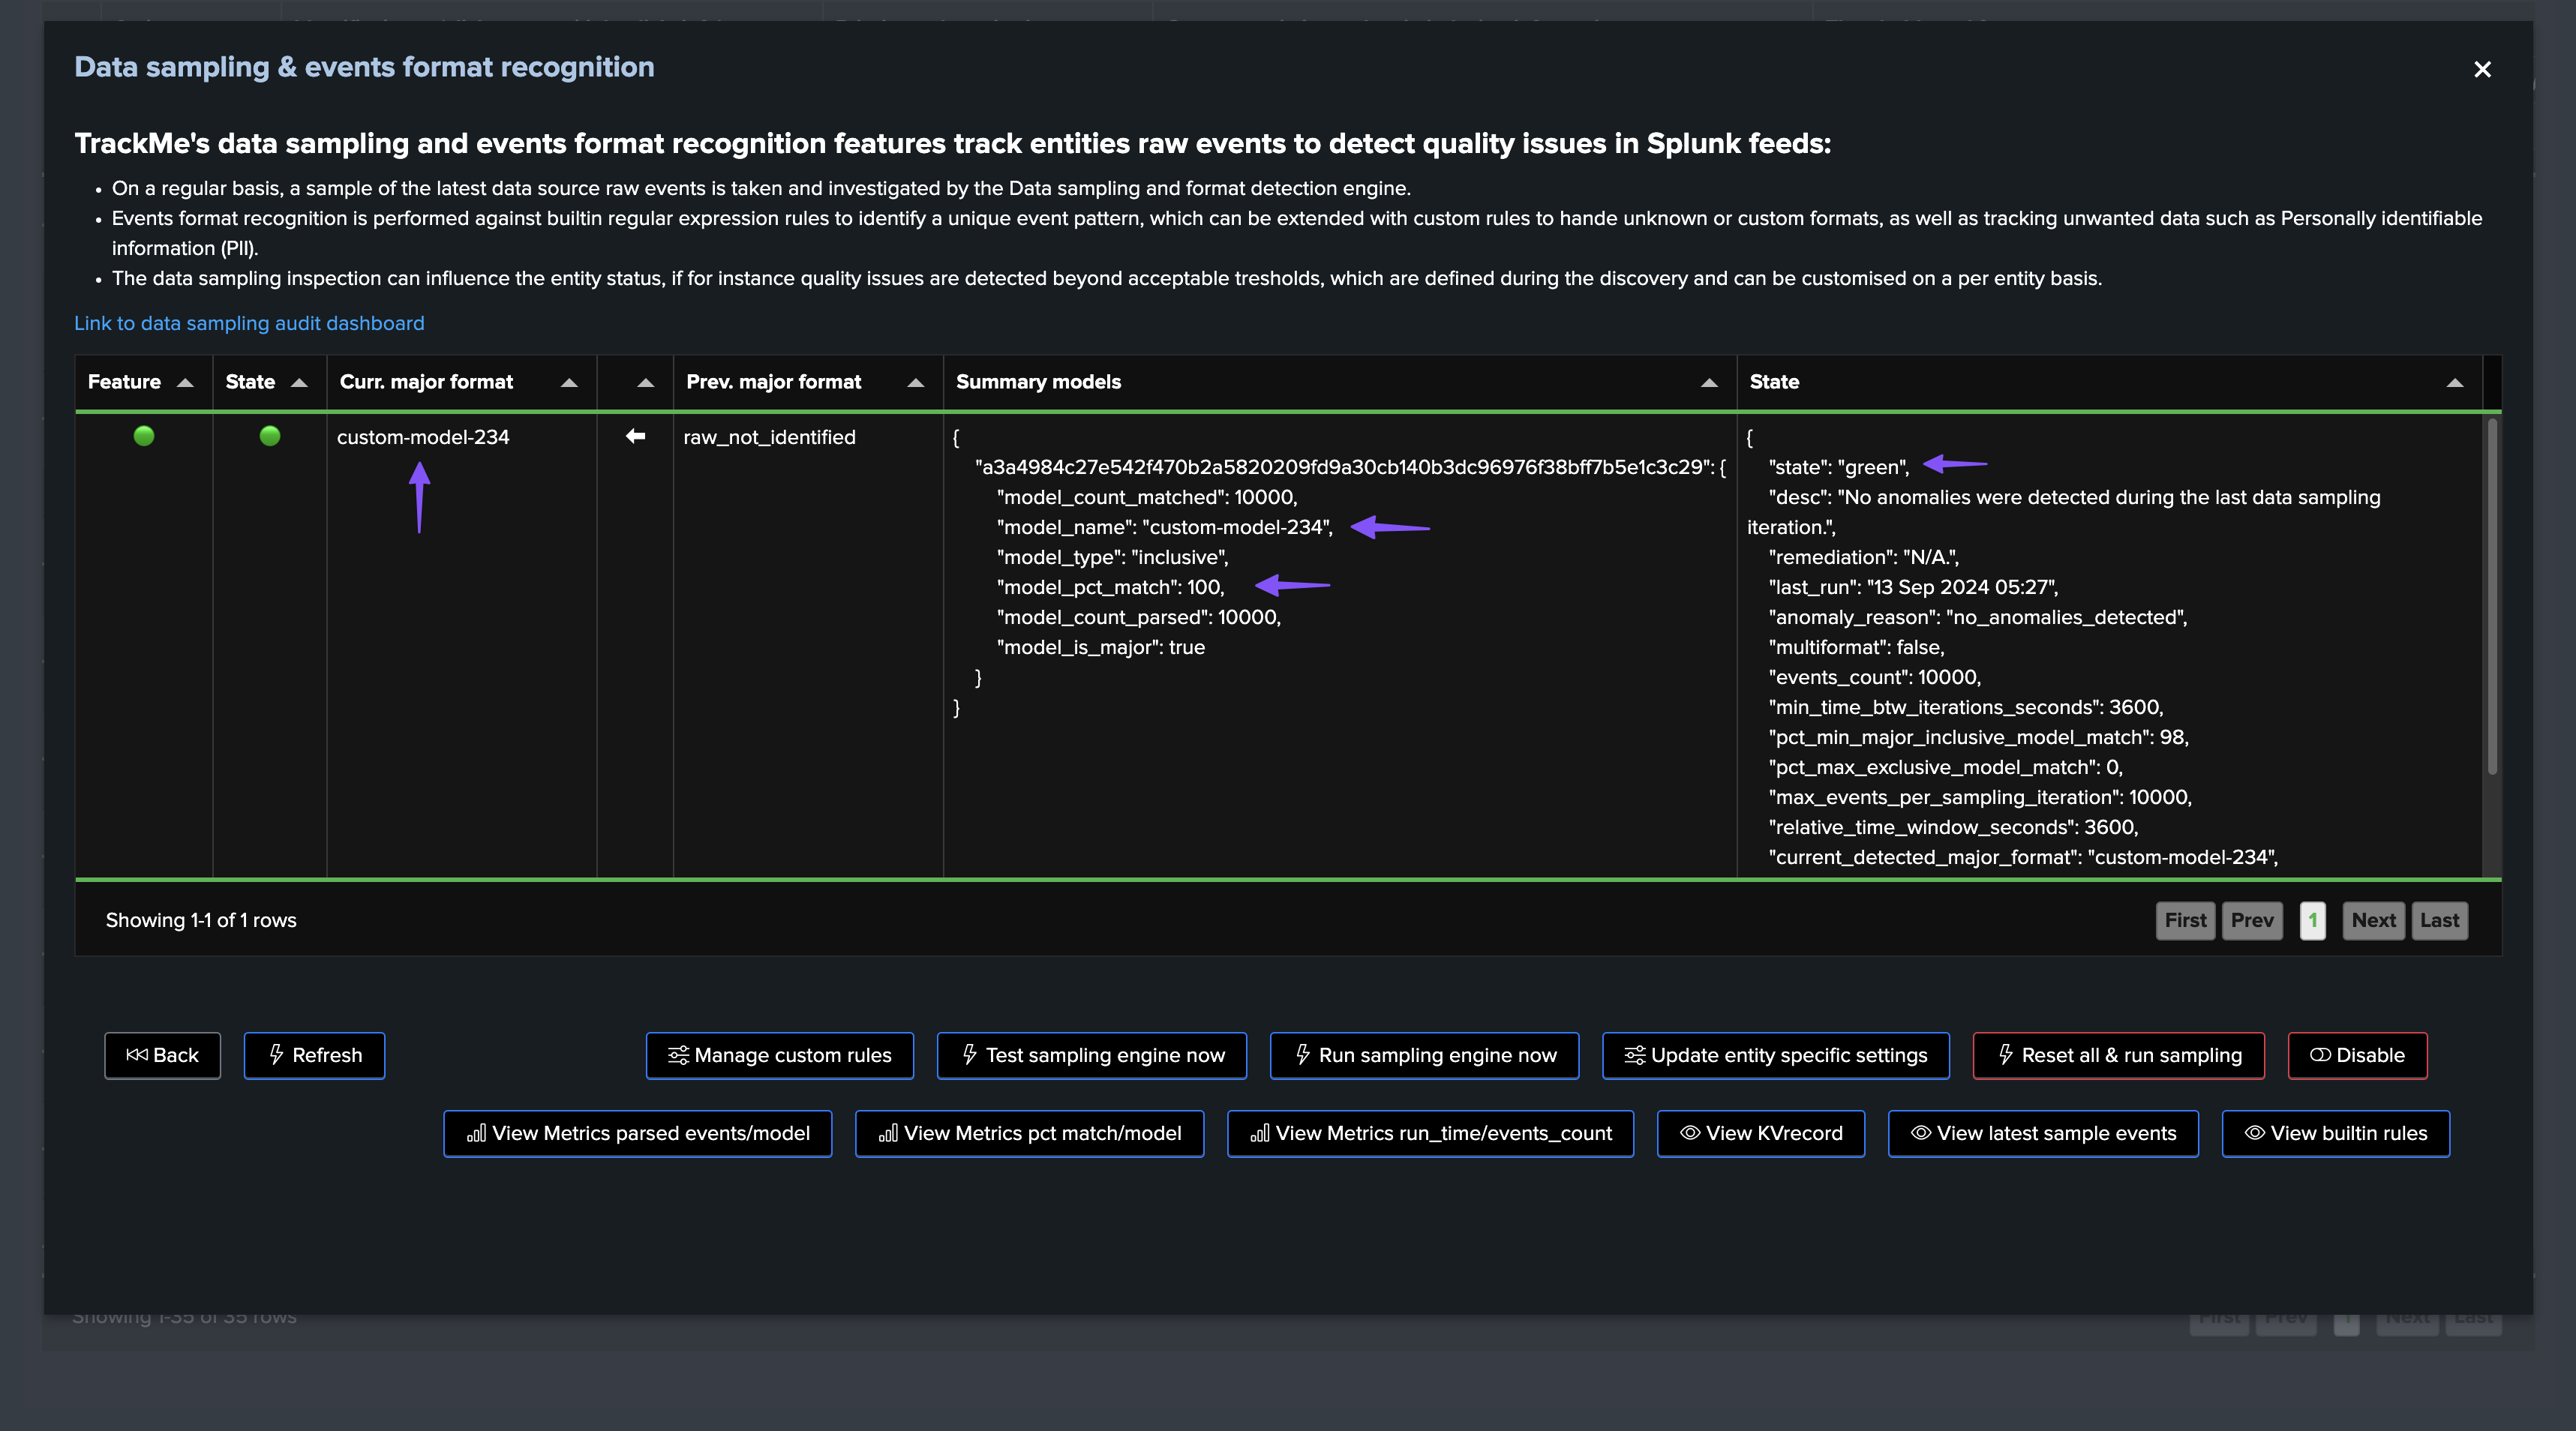
Inspecting the anomaly status summary message
In this screen, TrackMe provides a summary of the data sampling status in JSON format, which includes various high level information so you can understand easily the current status, example:
{
    "state": "green",
    "desc": "No anomalies were detected during the last data sampling iteration.",
    "remediation": "N/A.",
    "last_run": "12 Sep 2024 05:02",
    "anomaly_reason": "no_anomalies_detected",
    "multiformat": false,
    "events_count": 10000,
    "min_time_btw_iterations_seconds": 3600,
    "pct_min_major_inclusive_model_match": 98,
    "pct_max_exclusive_model_match": 0,
    "max_events_per_sampling_iteration": 10000,
    "relative_time_window_seconds": 3600,
    "current_detected_major_format": "raw_start_by_timestamp %Y-%d-%m %H:%M:%S",
    "models_summary": [
        "raw_start_by_timestamp %Y-%d-%m %H:%M:%S | pct_match: 100.0 | type: inclusive"
    ]
}
Data sampling statuses
field: state
The data sampling state can be reported as:
Value |
Description |
|---|---|
green |
No anomalies were detected during the last data sampling iteration. |
red |
Anomalies were detected during the last data sampling iteration, if the Virtual Tenant configuration allows it, it will turn the entity red with anomaly_reason containing data_sampling. |
orange |
Since the discovery of the entity, TrackMe has detected quality issues and anomalies, TrackMe will continue performing sampling in case conditions change, but it will not affect the overall entity status. |
The state is also reflected as the border colour of the data sampling tab in the entity view.
field: anomaly_reason
The data sampling anomaly reason can be reported as:
Value |
Description |
|---|---|
no_anomalies_detected |
No anomalies were detected during the last data sampling iteration. |
exclusive_rule_match |
Anomalies detected, one or more exclusive rules have been matched. |
inclusive_rule_match |
Anomalies detected, quality issues were detected, the min percentage of the major model matched does not meet requirements which indicates that a too large number of events do not share the same format as the majority of events. |
format_change |
The major event format (the format previously detected for the majority of events) has changed from <model_name> to <model_name>, this might indicate a non expected quality issue or condition change in the ingestion of this feed in Splunk. |
anomalies_at_discovery |
Anomalies were detected since the entity discovery, multiple formats were detected and the major model is under the acceptable threshold of percentage of events matched by the major model. The data sampling feature was automatically disabled (disabled_auto) to avoid generating false positives for this entity (the feature will not be allowed to influence the entity status), however TrackMe will continue attempting to process in case conditions for this feed change. |
anomalies_since_discovery |
Anomalies were detected since the entity discovery, multiple formats were detected and the major model is under the acceptable threshold of percentage of events matched by the major model. The data sampling feature was automatically disabled (disabled_auto) to avoid generating false positives for this entity (the feature will not be allowed to influence the entity status), however TrackMe will continue attempting to process in case conditions for this feed change. |
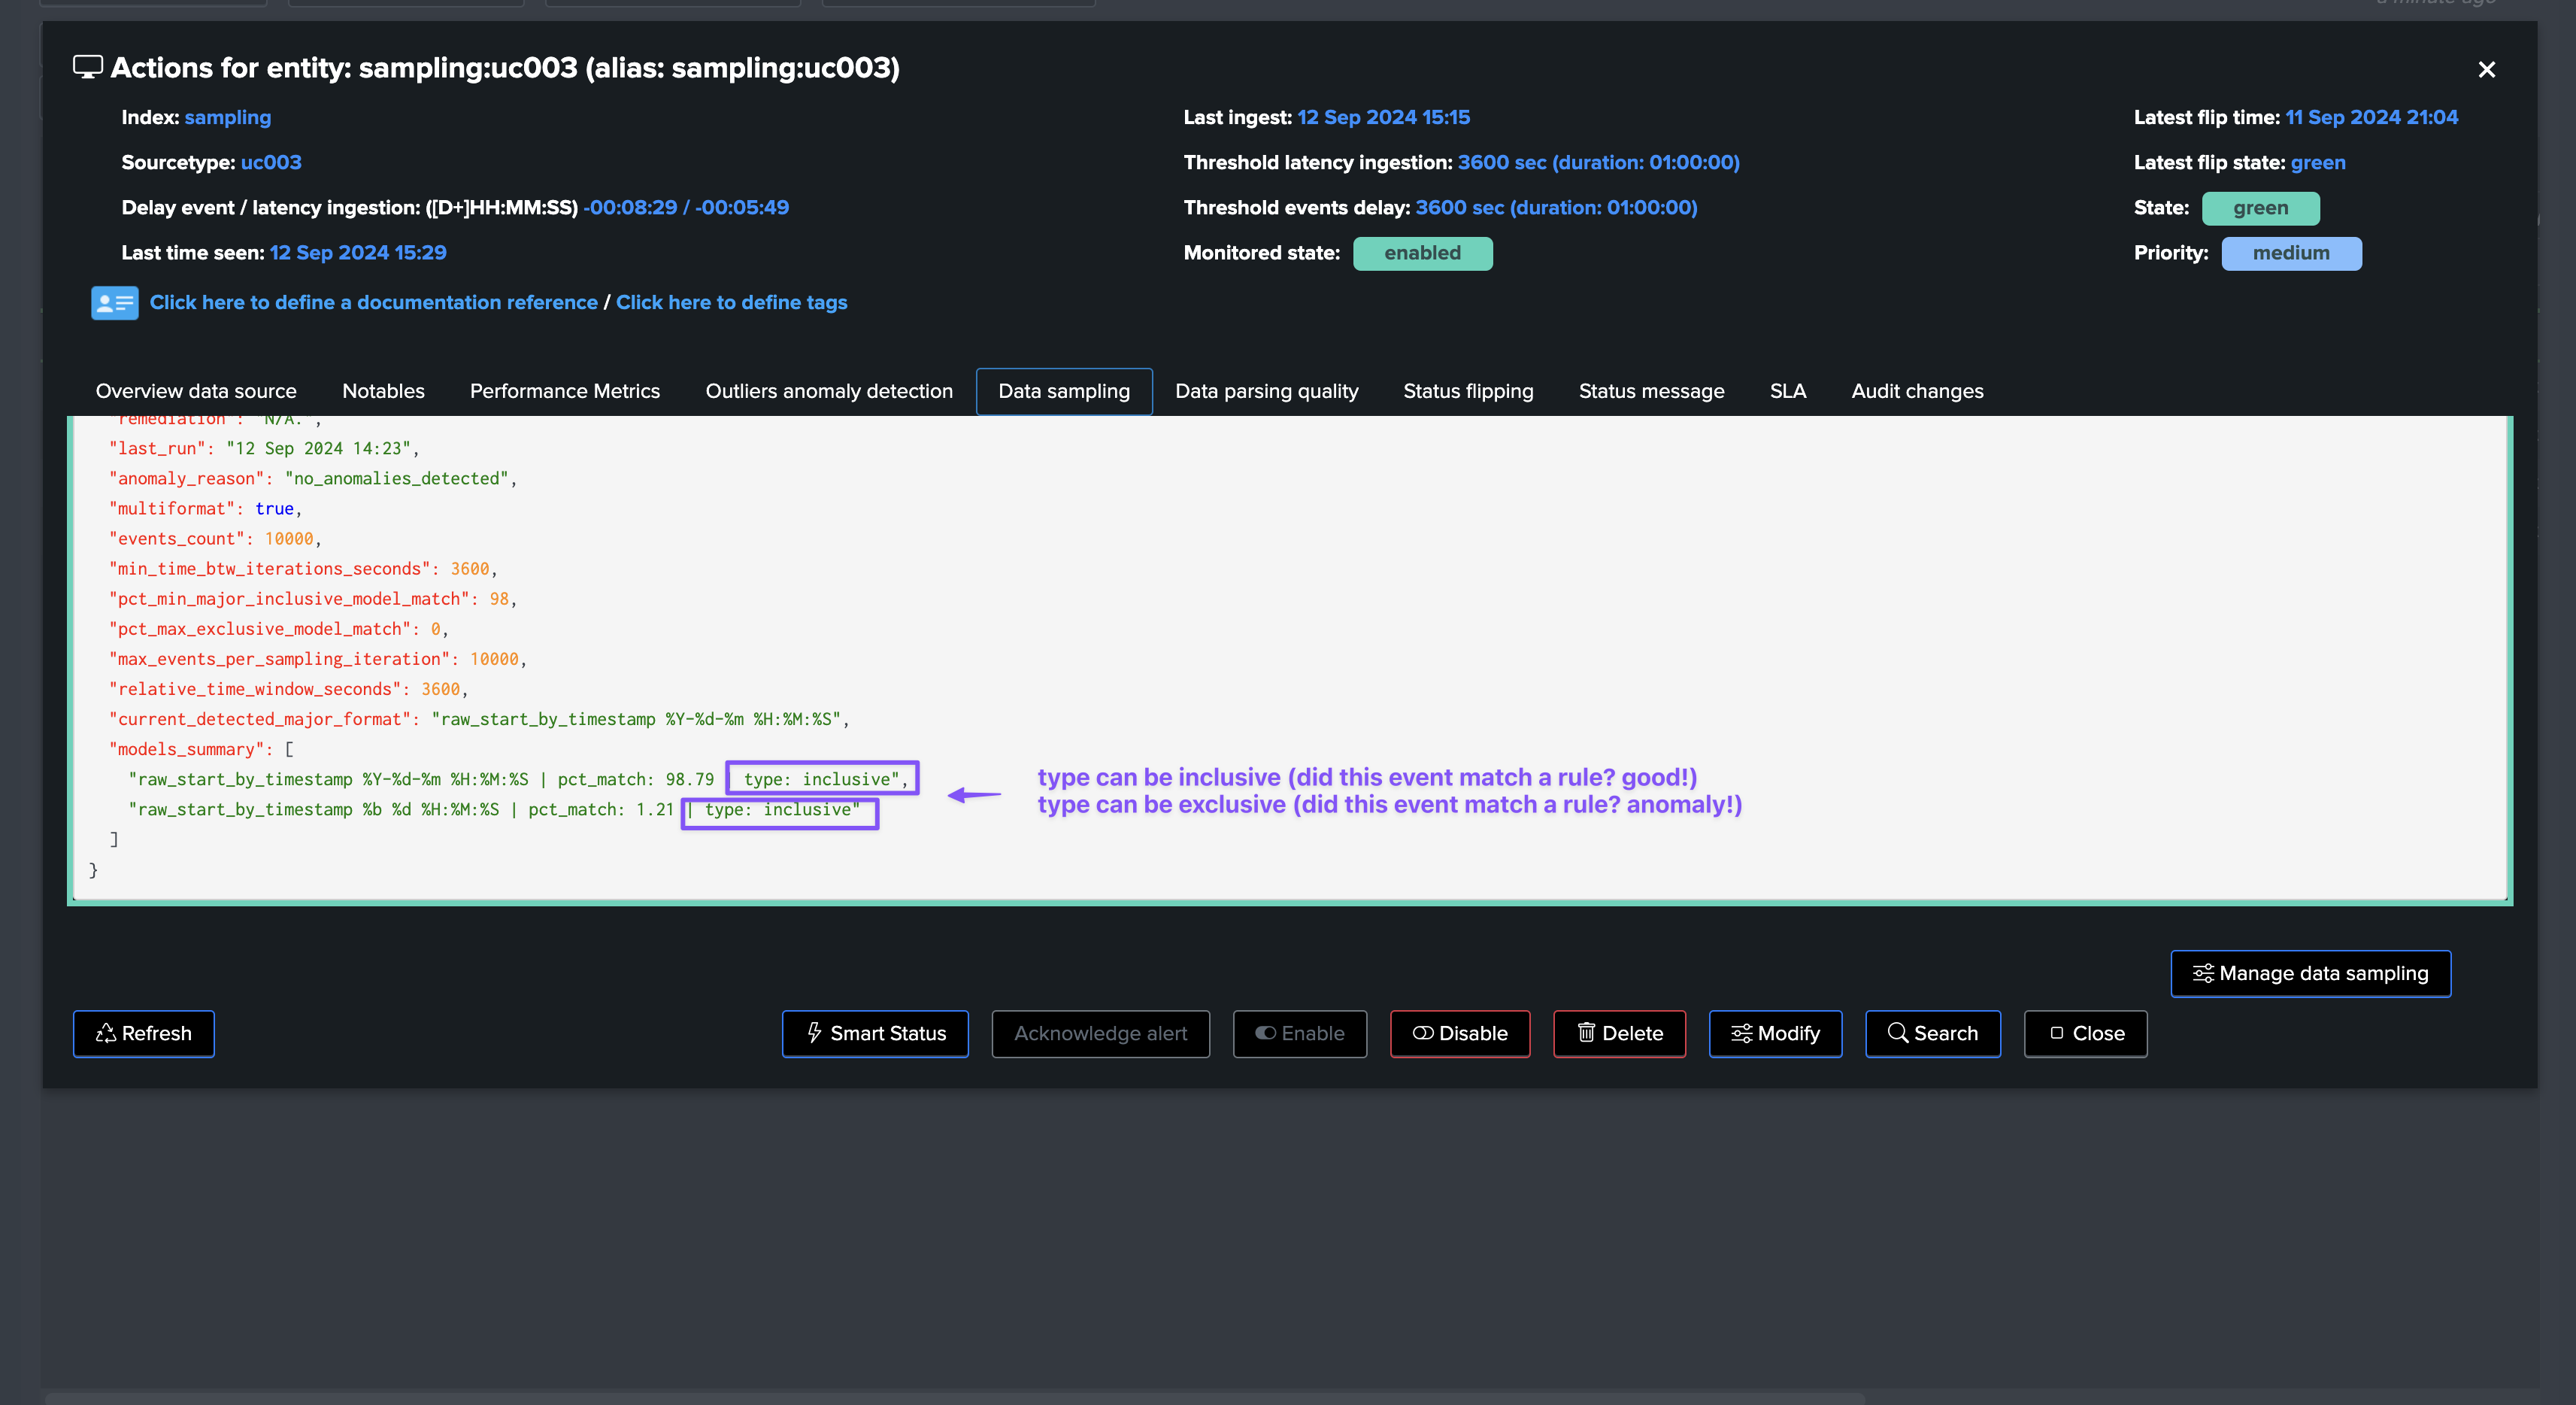
field: models_summary
This field is a list of the models detected during the last data sampling iteration, with the following information:
The model name (model_name)
The percentage of events matched by this model (pct_match)
The type of match (inclusive or exclusive)
Example:
"models_summary": [
    "raw_start_by_timestamp %Y-%d-%m %H:%M:%S | pct_match: 100.0 | type: inclusive"
]
When multiple models are matched, the list will contain multiple entries, example:
"models_summary": [
    "raw_start_by_timestamp %Y-%d-%m %H:%M:%S | pct_match: 98.97 | type: inclusive",
    "raw_start_by_timestamp %b %d %H:%M:%S | pct_match: 1.03 | type: inclusive"
]
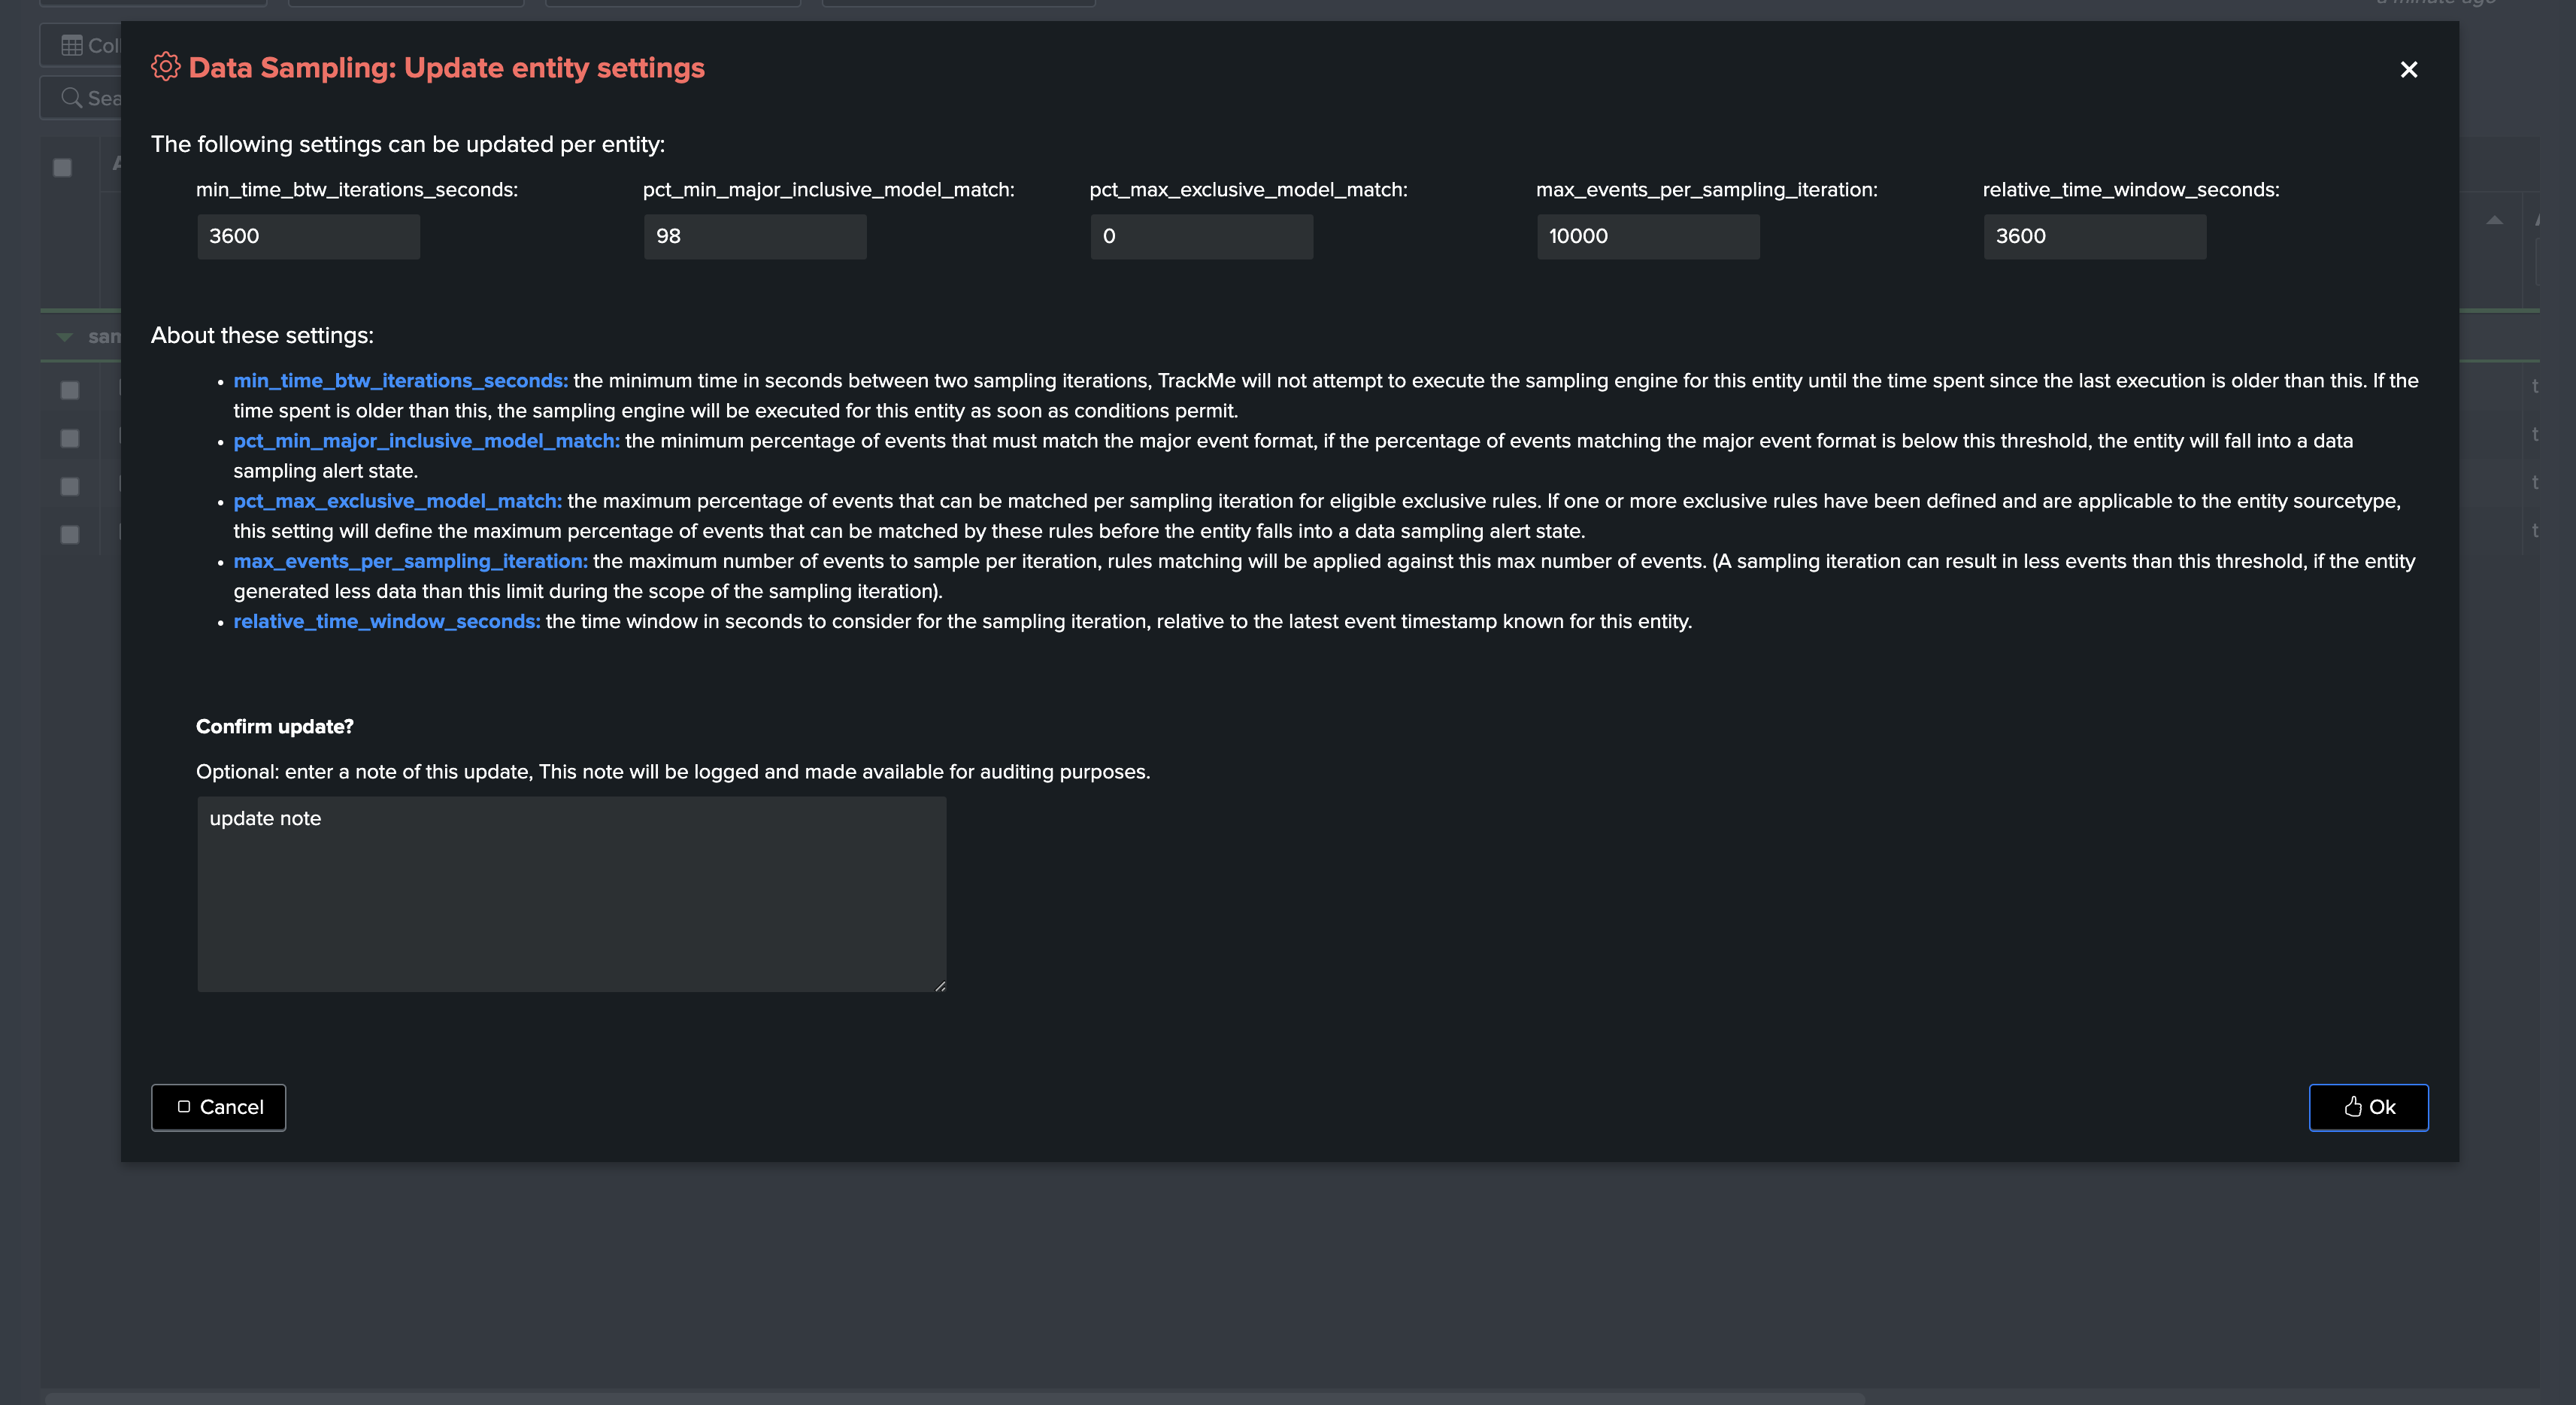
fields: settings for this entity (min_time_btw_iterations_seconds, etc)
The following fields are settings for this entity, defined when the entity was discovered using system wide corresponding settings, and that can be updated on a per entity basis:
Value |
Description |
Default Value |
|---|---|---|
min_time_btw_iterations_seconds |
Minimum time in seconds between two iterations of sampling per entity. TrackMe will never attempt to perform sampling for a given entity if the time since the last iteration is lower than this value. |
3600 |
relative_time_window_seconds |
The size in seconds of the time window for the sampling operation, relative to the latest event time known for the entity. This is used to calculate the earliest time for the sampling search. |
3600 |
max_events_per_sampling_iteration |
Defines the number of records to be sampled and verified per entity during the data sampling process. Increasing this value improves event format recognition at the cost of more processing per entity. |
10000 |
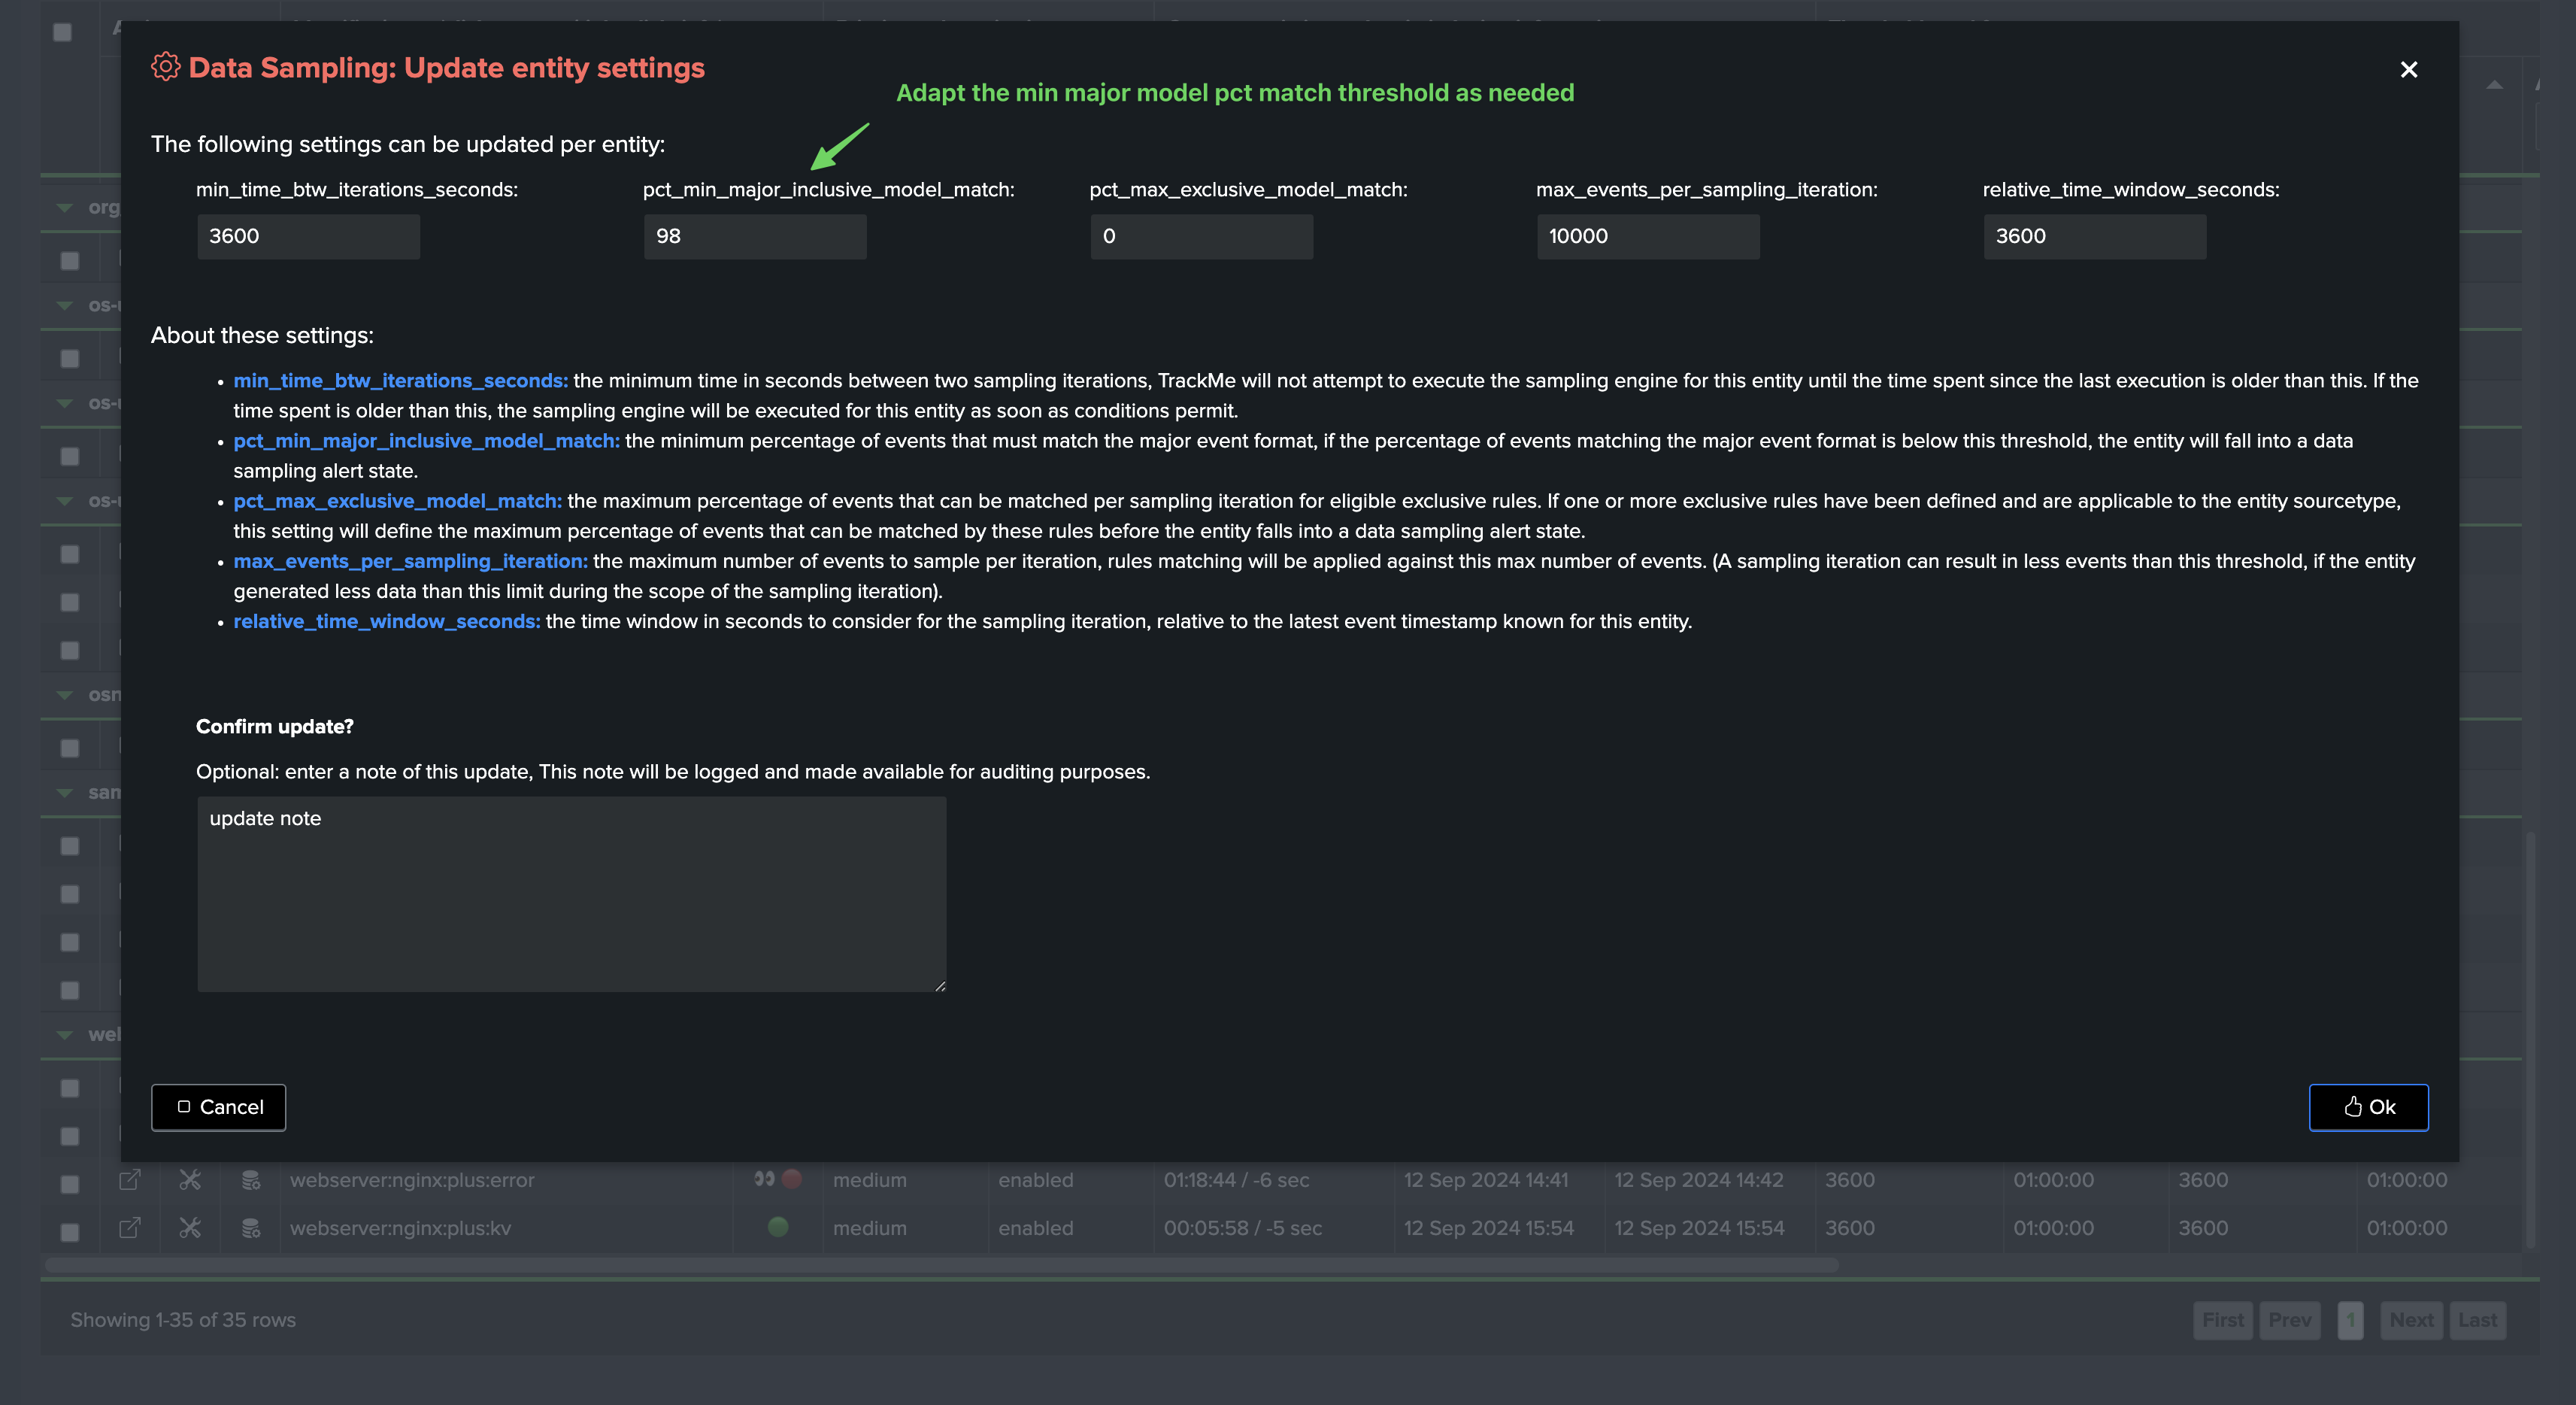
pct_min_major_inclusive_model_match |
The minimal percentage of events to match the major inclusive model. If the main model matched has less than this percentage of events matching, the entity state will be impacted. |
98 |
pct_max_exclusive_model_match |
Defines the maximum percentage of events matching an exclusive model that can be accepted per iteration. By default, no events matching an exclusive model are accepted. |
95 |
Hint
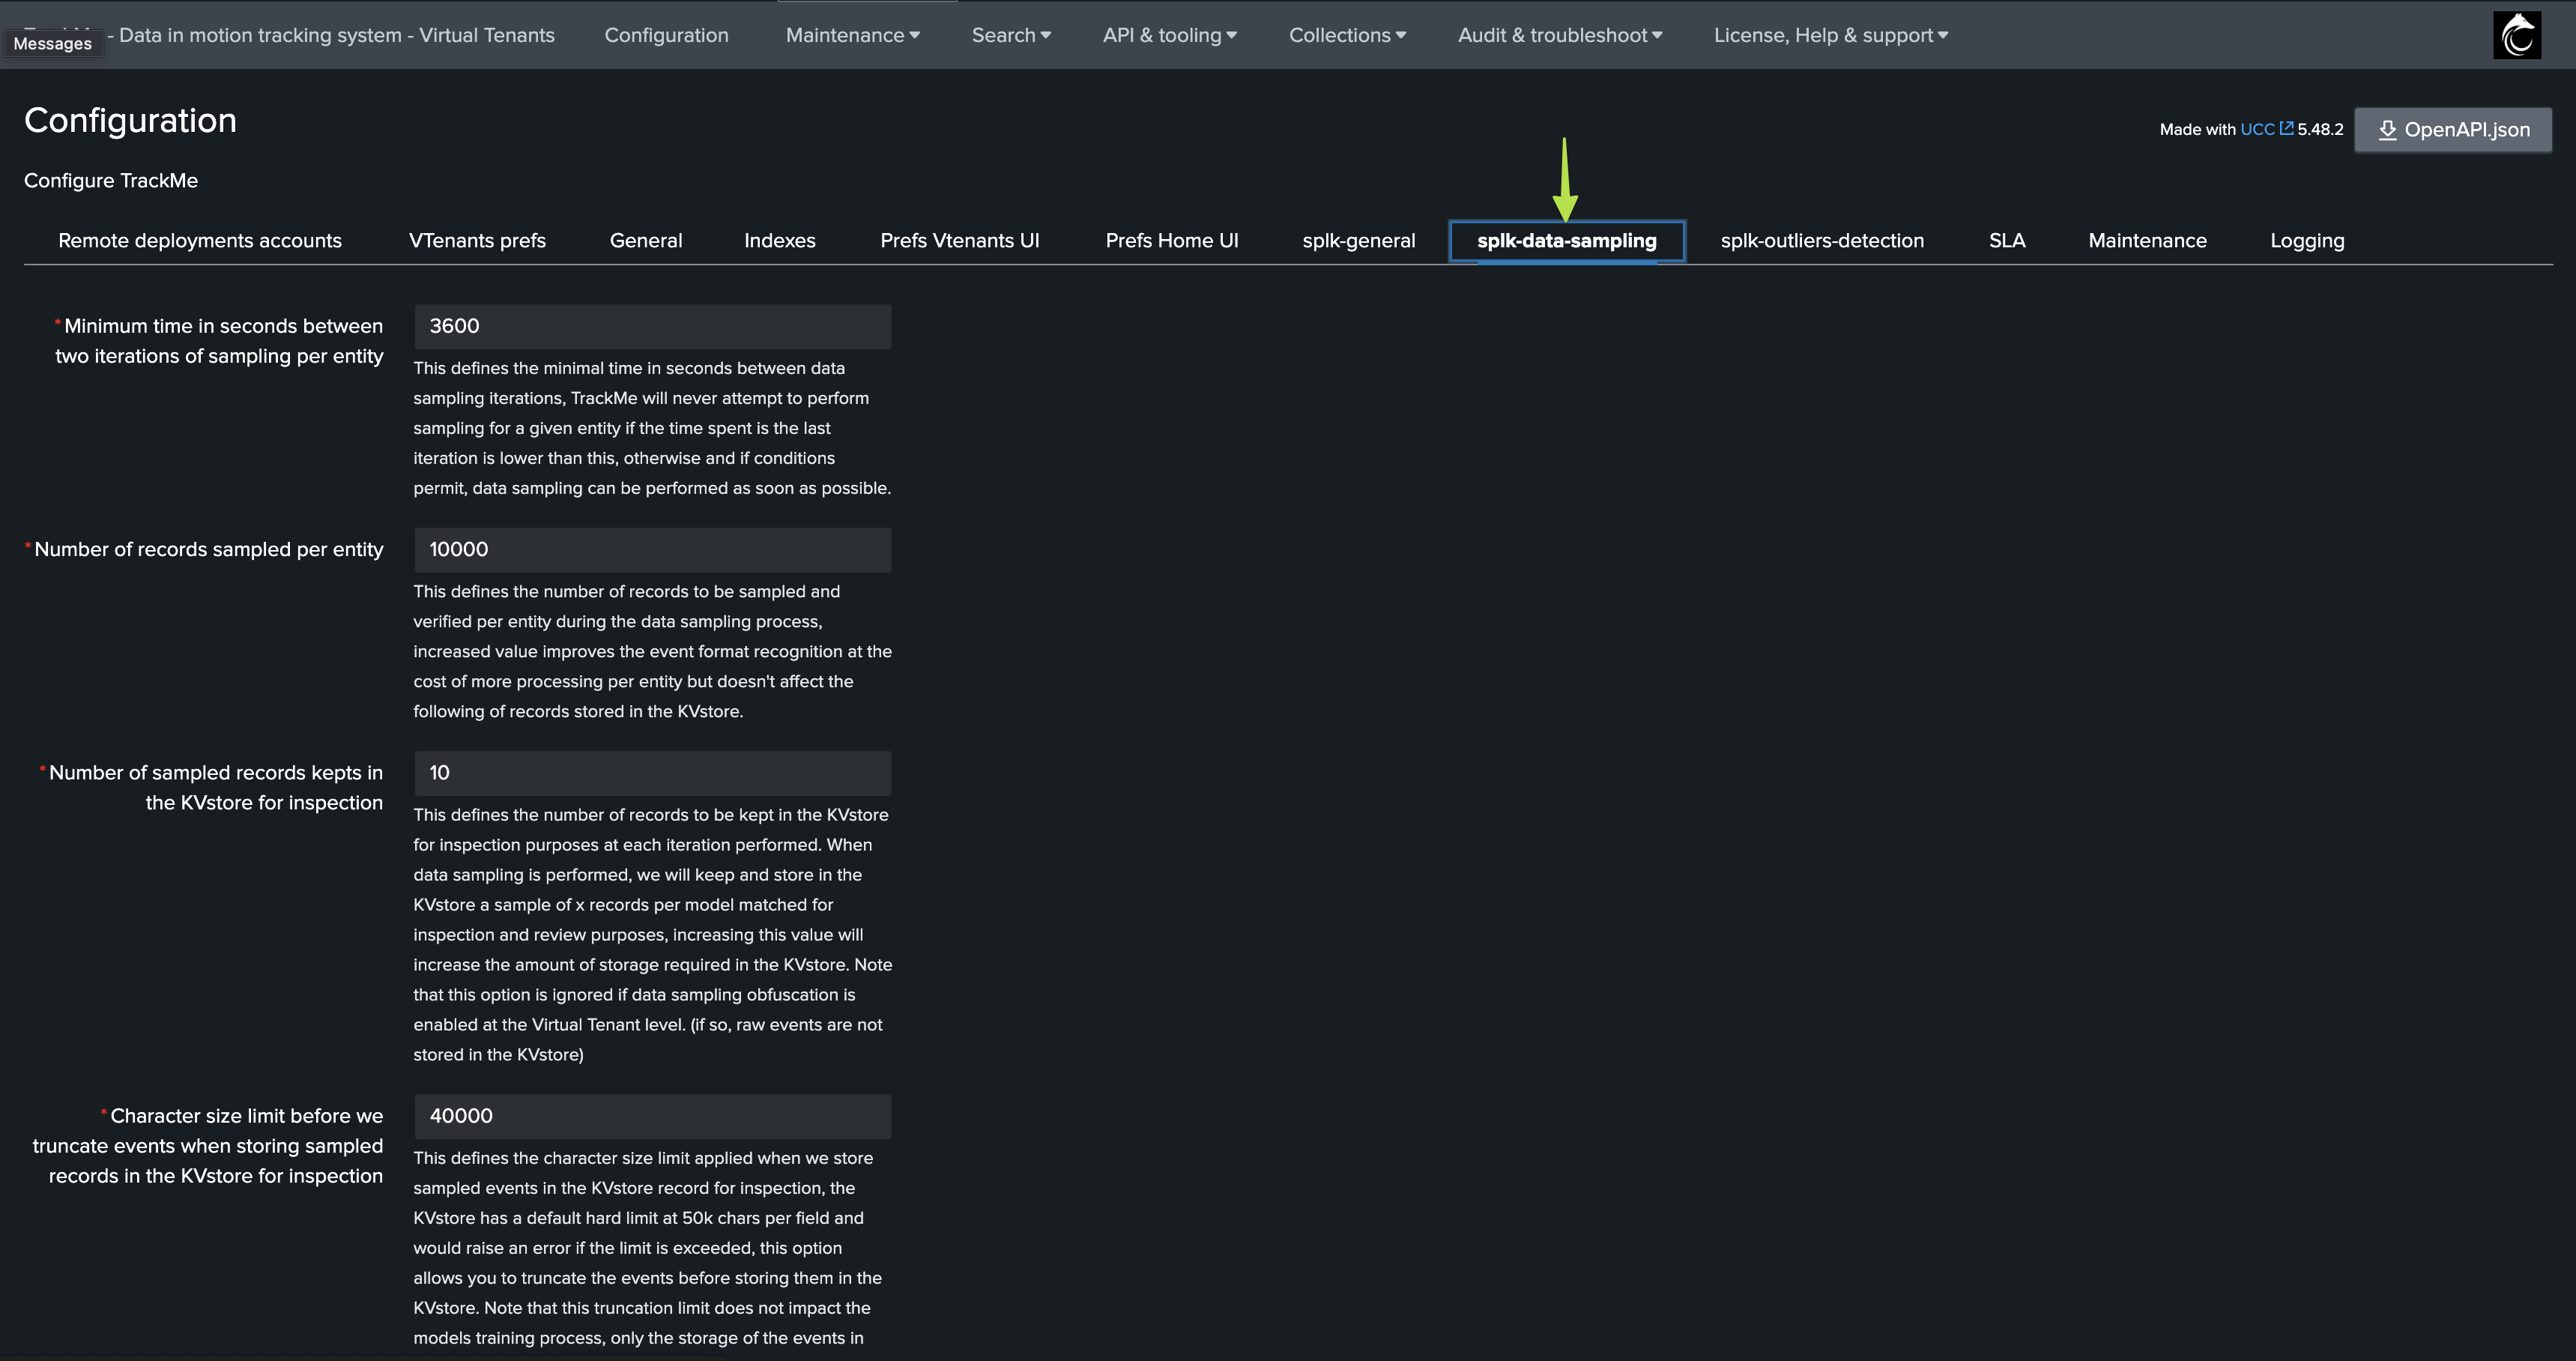
System level settings:
These settings are applied at the level of TrackMe entities where the data sampling discovers the entity.
Each of these settings can be updated on a per entity basis, and the entity settings will override the system level settings.
System level settings screen:
Entity level settings management screen:
Inclusive and Exclusive Models Matching, Sourcetype Scope, Major Model and Thresholds
Hint
About these concepts:
Built-in rules in TrackMe are always inclusive rules, with sourcetype_scope=*.
For inclusive rules, when a given event matches a certain rule, the engine stops processing other rules for this event, therefore, an event can only match one rule.
For exclusive rules, a given event can match multiple rules (as we basically look for “bad things” such as PII data), and the engine will track the percentage of events matching each exclusive rule.
You can create custom rules which can be inclusive OR exclusive, but not both.
Each rule is associated with a sourcetype_scope, which can be an explicit sourcetype, a list of sourcetypes, and as well any combination of wildcards for each.
Inclusive and exclusive models matching
Data sampling rules in TrackMe can be defined with two types of matching:
inclusive: The rule is applied to the events for format recognition purposes, this means “does the rule regular expression match the event?”.exclusive: The rule is applied to the events, however, if the rule is matched this means that a bad condition is detected “this rule should never match events”.
Sourcetype scope
When TrackMe’s data sampling engine processes an event, it will only apply the rules that are associated with the sourcetype of the event, relying on the sourcetype_scope:
All builtin rules are inclusive type rules, with a sourcetype_scope of “*”.
Custom rules can be defined with a specific sourcetype_scope, which can be a single sourcetype, a list of sourcetypes, and wildcards can be used in each value submitted.
When creating custom rules, the sourcetype_scope predicates which events will be processed by the rule, and which will not.
Major model
When the data sampling engine performs an iteration for a given entity, it calculates the percentage of events that match each model, and identifies the major model:
The major model matters for the entity status, as it is the model that the majority of events match.
This concept applies only to inclusive rules matching.
During the sampling process, if the percentage of events matching the major model is below the threshold
pct_min_major_inclusive_model_match, a sampling anomaly status will be raised asinclusive_rule_match.However, if this happens at the first iteration of the entity, the status will be raised as
anomalies_at_discovery, and will not be allowed to influence the entity status.If from the second iteration, the issue persists, the status will be raised as
anomalies_since_discovery, TrackMe will continue to attempt to process sampling for this entity in case conditions change, but it will not allow the entity status to be impacted.If later on in the life cycle of the Splunk feed, the percentage of events matched for a given model meets the minimal threshold, the status will be updated to
no_anomalies_detectedand it becomes eligible for data sampling.Then, if later on a quality issue affects that same entity, the sampling engine would raise an alert for this entity.
In short!
The concept of major model is used to make the distinction between the models that represent the vast majority of events, so we can exclude minor pollution while focussing on the true events formats.
We can then detect abnormal variations, such as a format change or a quality issue that is introduced in the feed, while at the same time avoiding false positives.
Finally, the threshold can be customised per entity, so the engine can adapt to the specificities of all feeds with flexibility.
Max Events count per iteration, relative time period, and minimum interval between iterations
When the engine performs a data sampling iteration, it also takes into account the following concepts and settings:
max_events_per_sampling_iteration: This setting defines the maximum number of events that will be sampled per iteration for a given entity. Increasing this value will improve the quality of the data sampling, but will also increase the processing time.
relative_time_window_seconds: This setting defines the time window for the sampling operation, relative to the latest event time known for the entity. This is used to calculate the earliest time for the sampling search. (In short, if the value is 3600 seconds, and the last event time known for the entity is 12:00, the search’s earliest time will start at 11:00).
min_time_btw_iterations_seconds: This setting defines the minimum time in seconds between two iterations of sampling per entity. TrackMe will never attempt to perform sampling for a given entity if the time since the last iteration is lower than this value.
About processing time, truncation and costs:
About processing time: These settings will influence the processing time of each sampling iteration, the more events to be processed and the larger the time window, the more time it will take to process the entity.
About truncation: The sampling engine is not affected by truncation, the regular expression is applied to the full events, truncation is only applied against a subset of the sampled events which we store in the KVstore for investigation purposes.
About costs: The sampling engine generates run_time and processed events count KPIs, so you can easily track and understand the run time costs of the sampling operations.
The total run time costs of the data sampling tracker itself can be tracked using TrackMe’s deepdive UI:
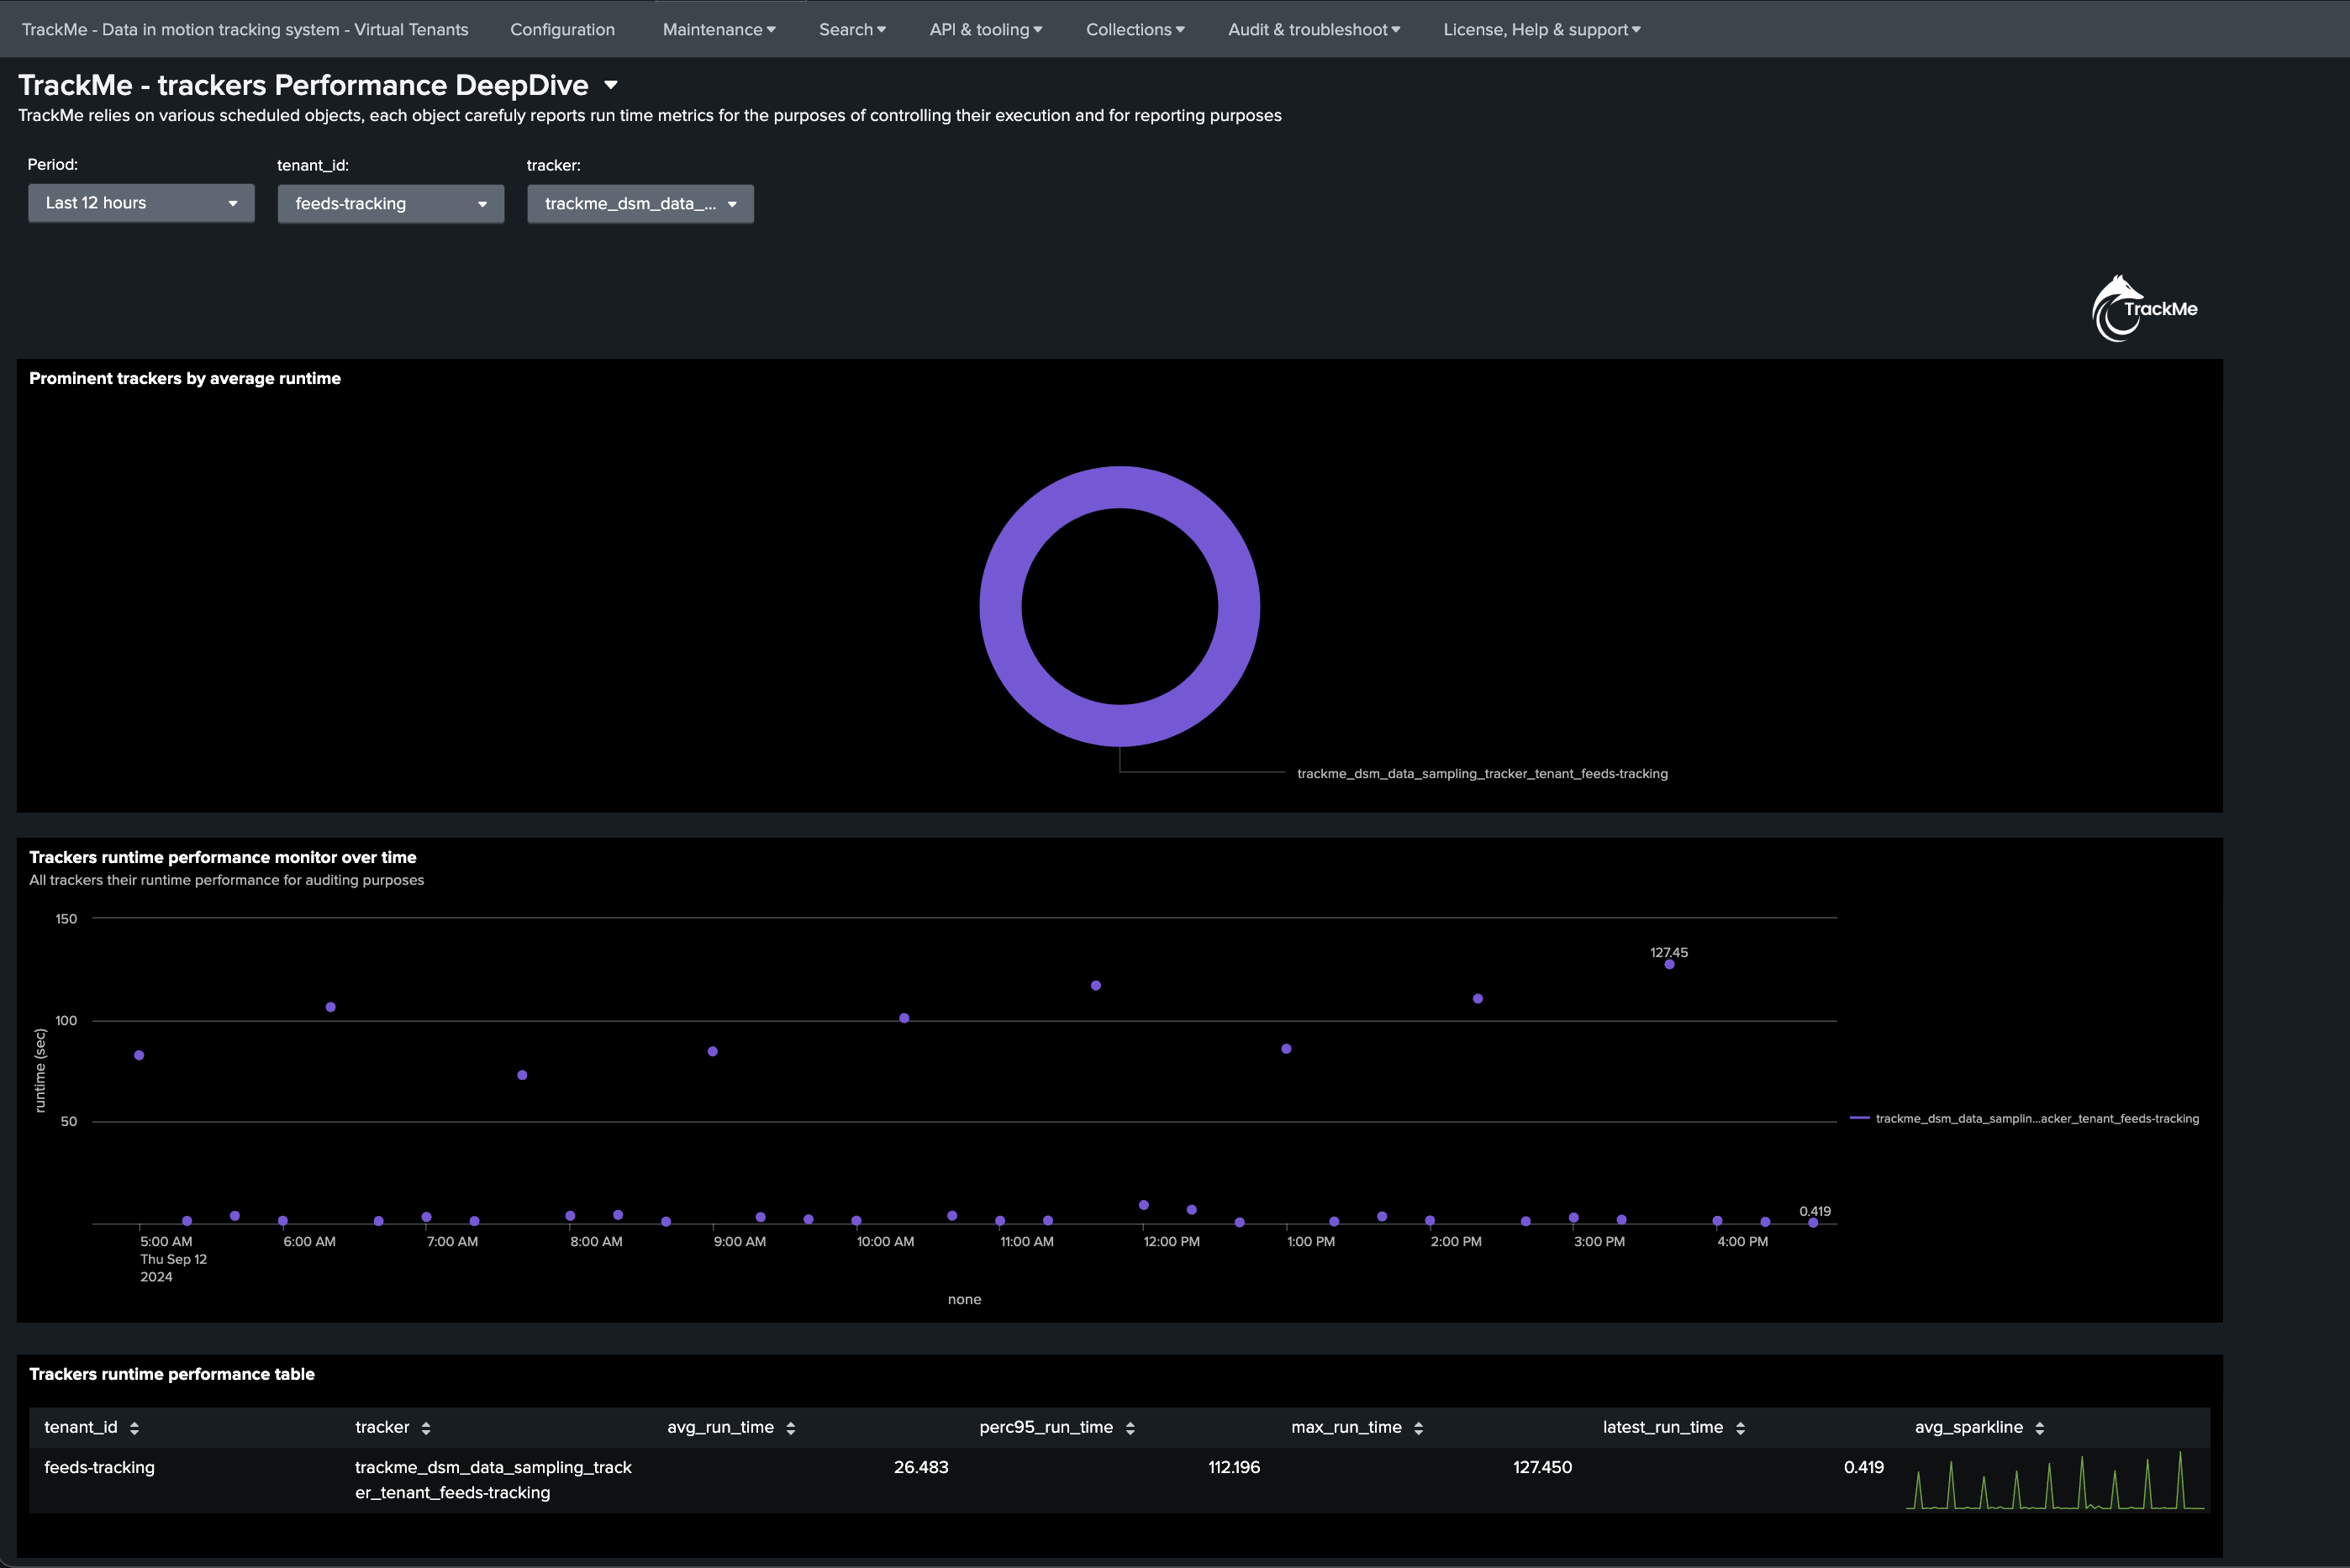
About the run time of the data sampling tracker!
The data sampling tracker is a scheduled job that runs every 20 minutes, and it will process all entities that are eligible for sampling.
In fact, it will attempt to process as many entities as possible in its eligible time frame, and will stop automatically before generating skipping searches.
At the next iteration, it will process the next chunk of entities, which are ordered based on their latest iteration, as well as a priority rank based on if a format was detected or not.
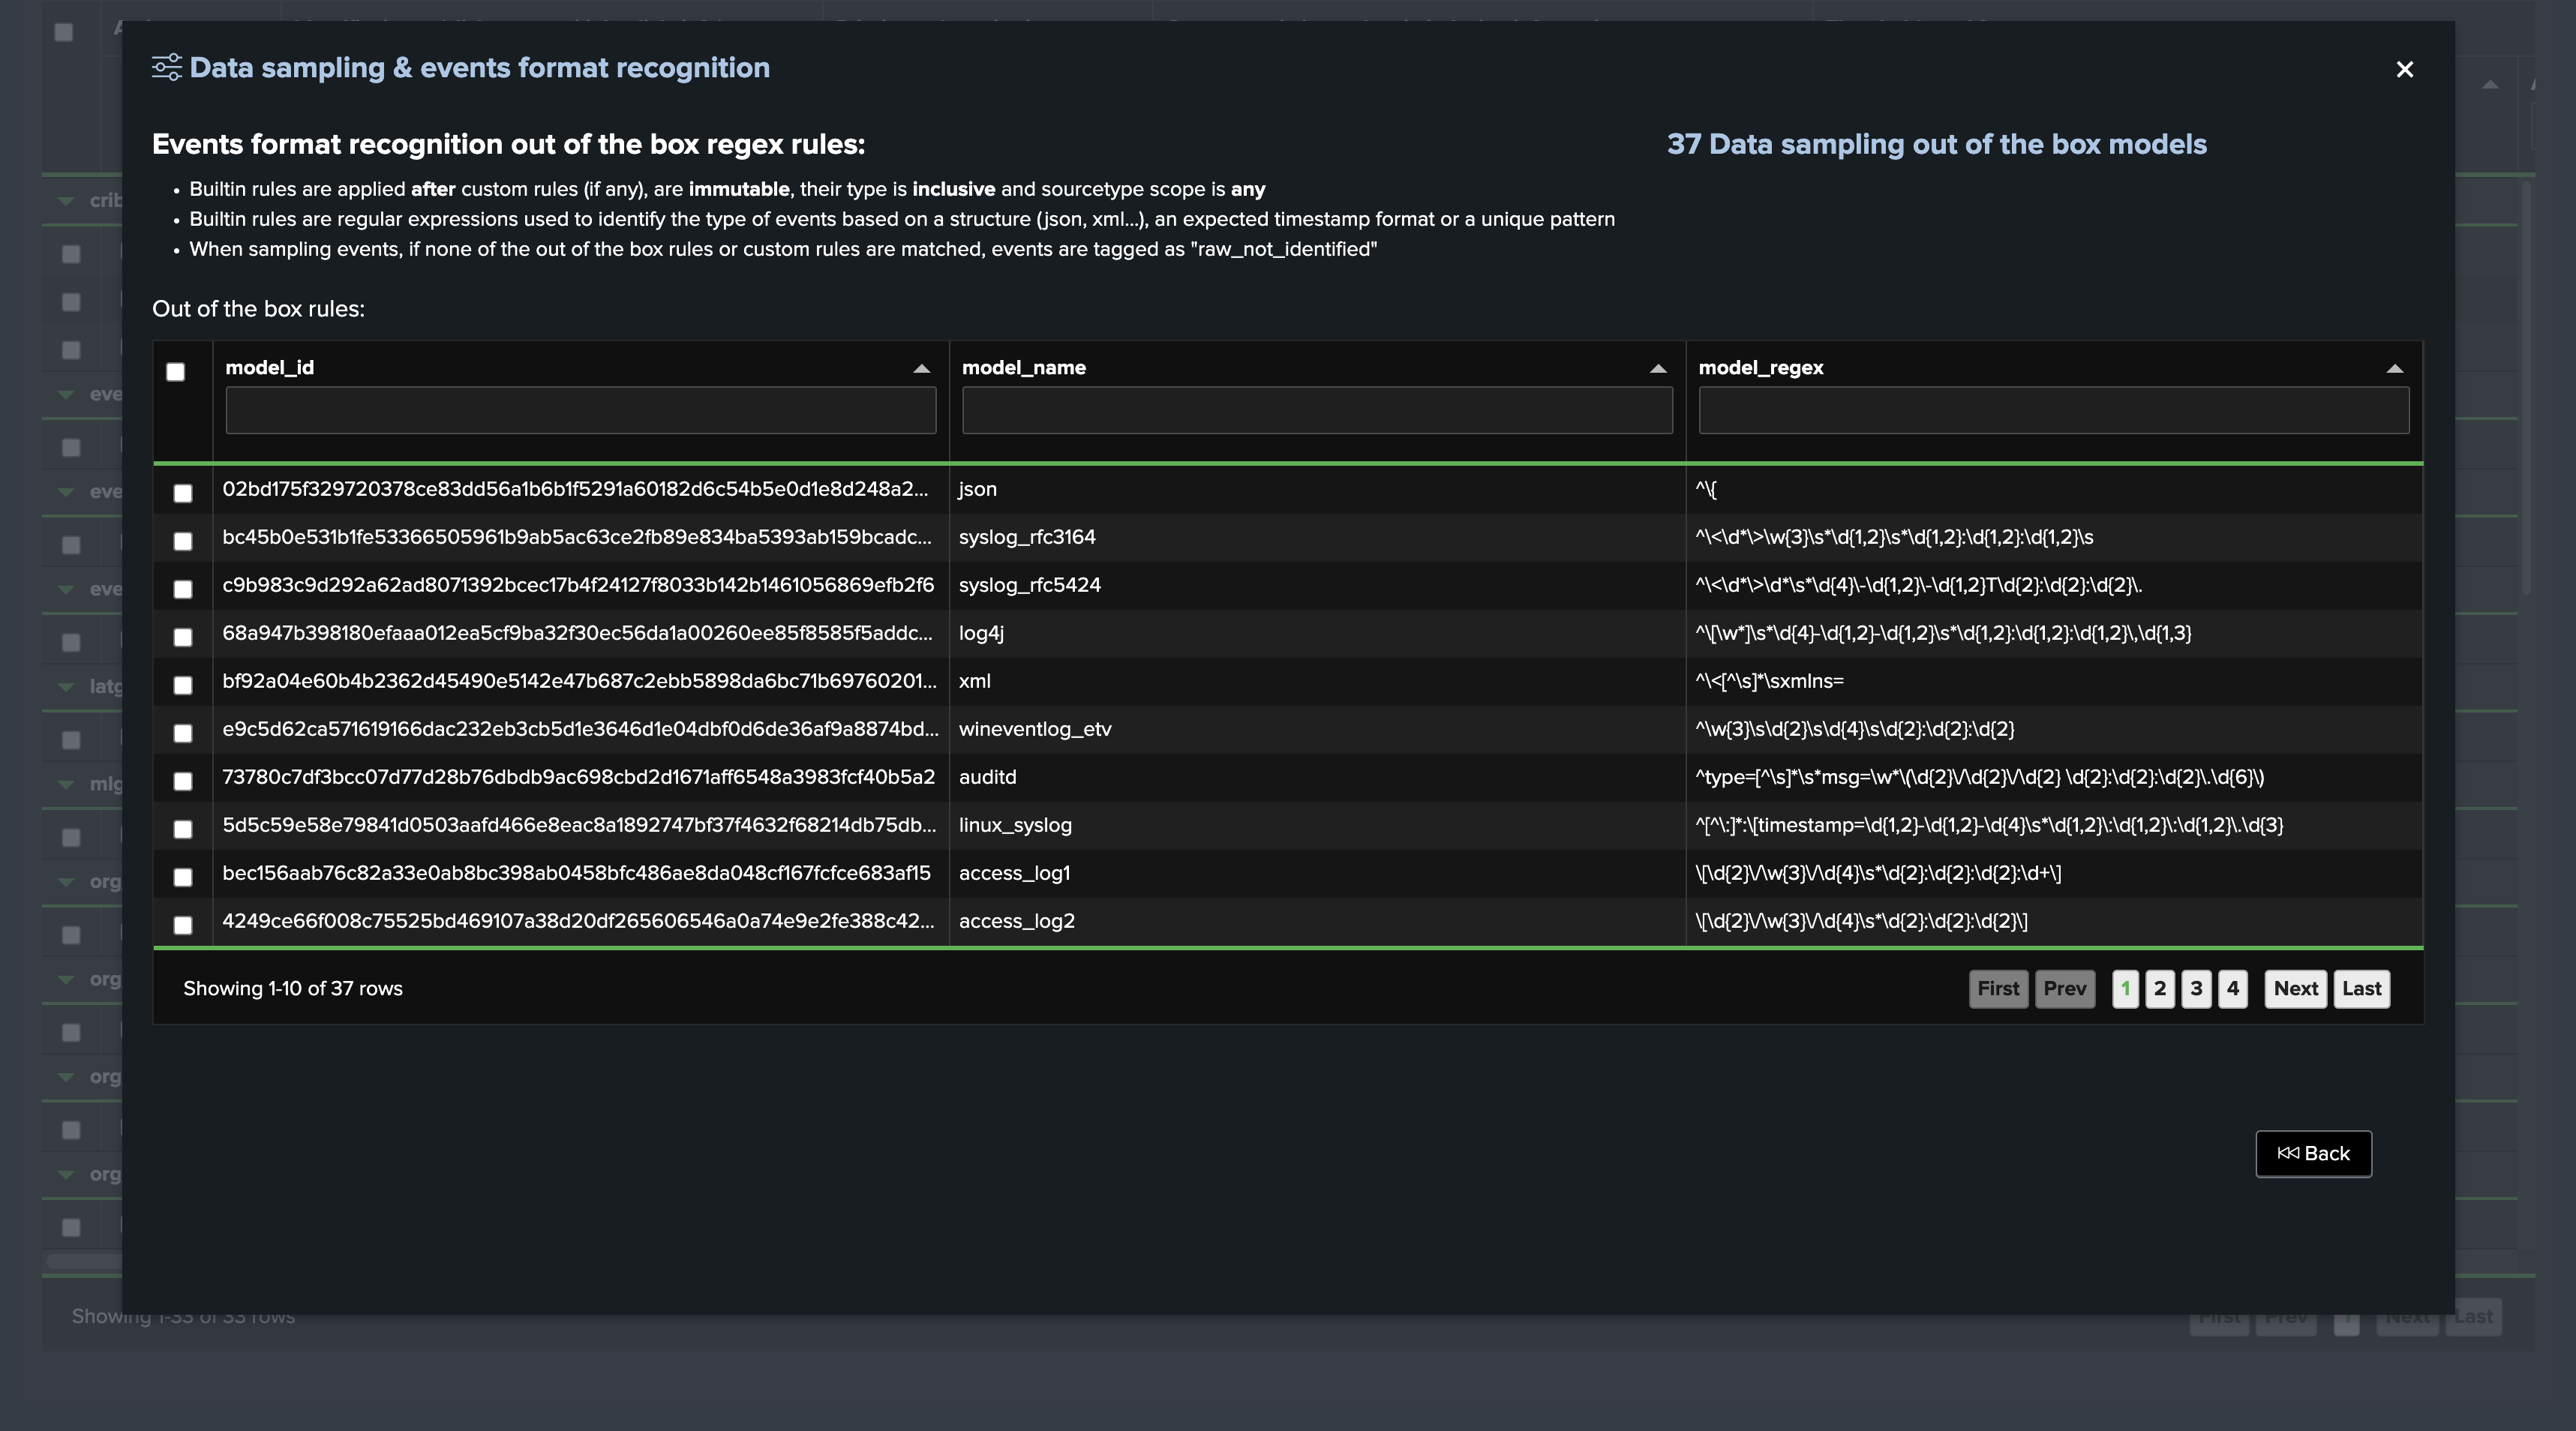
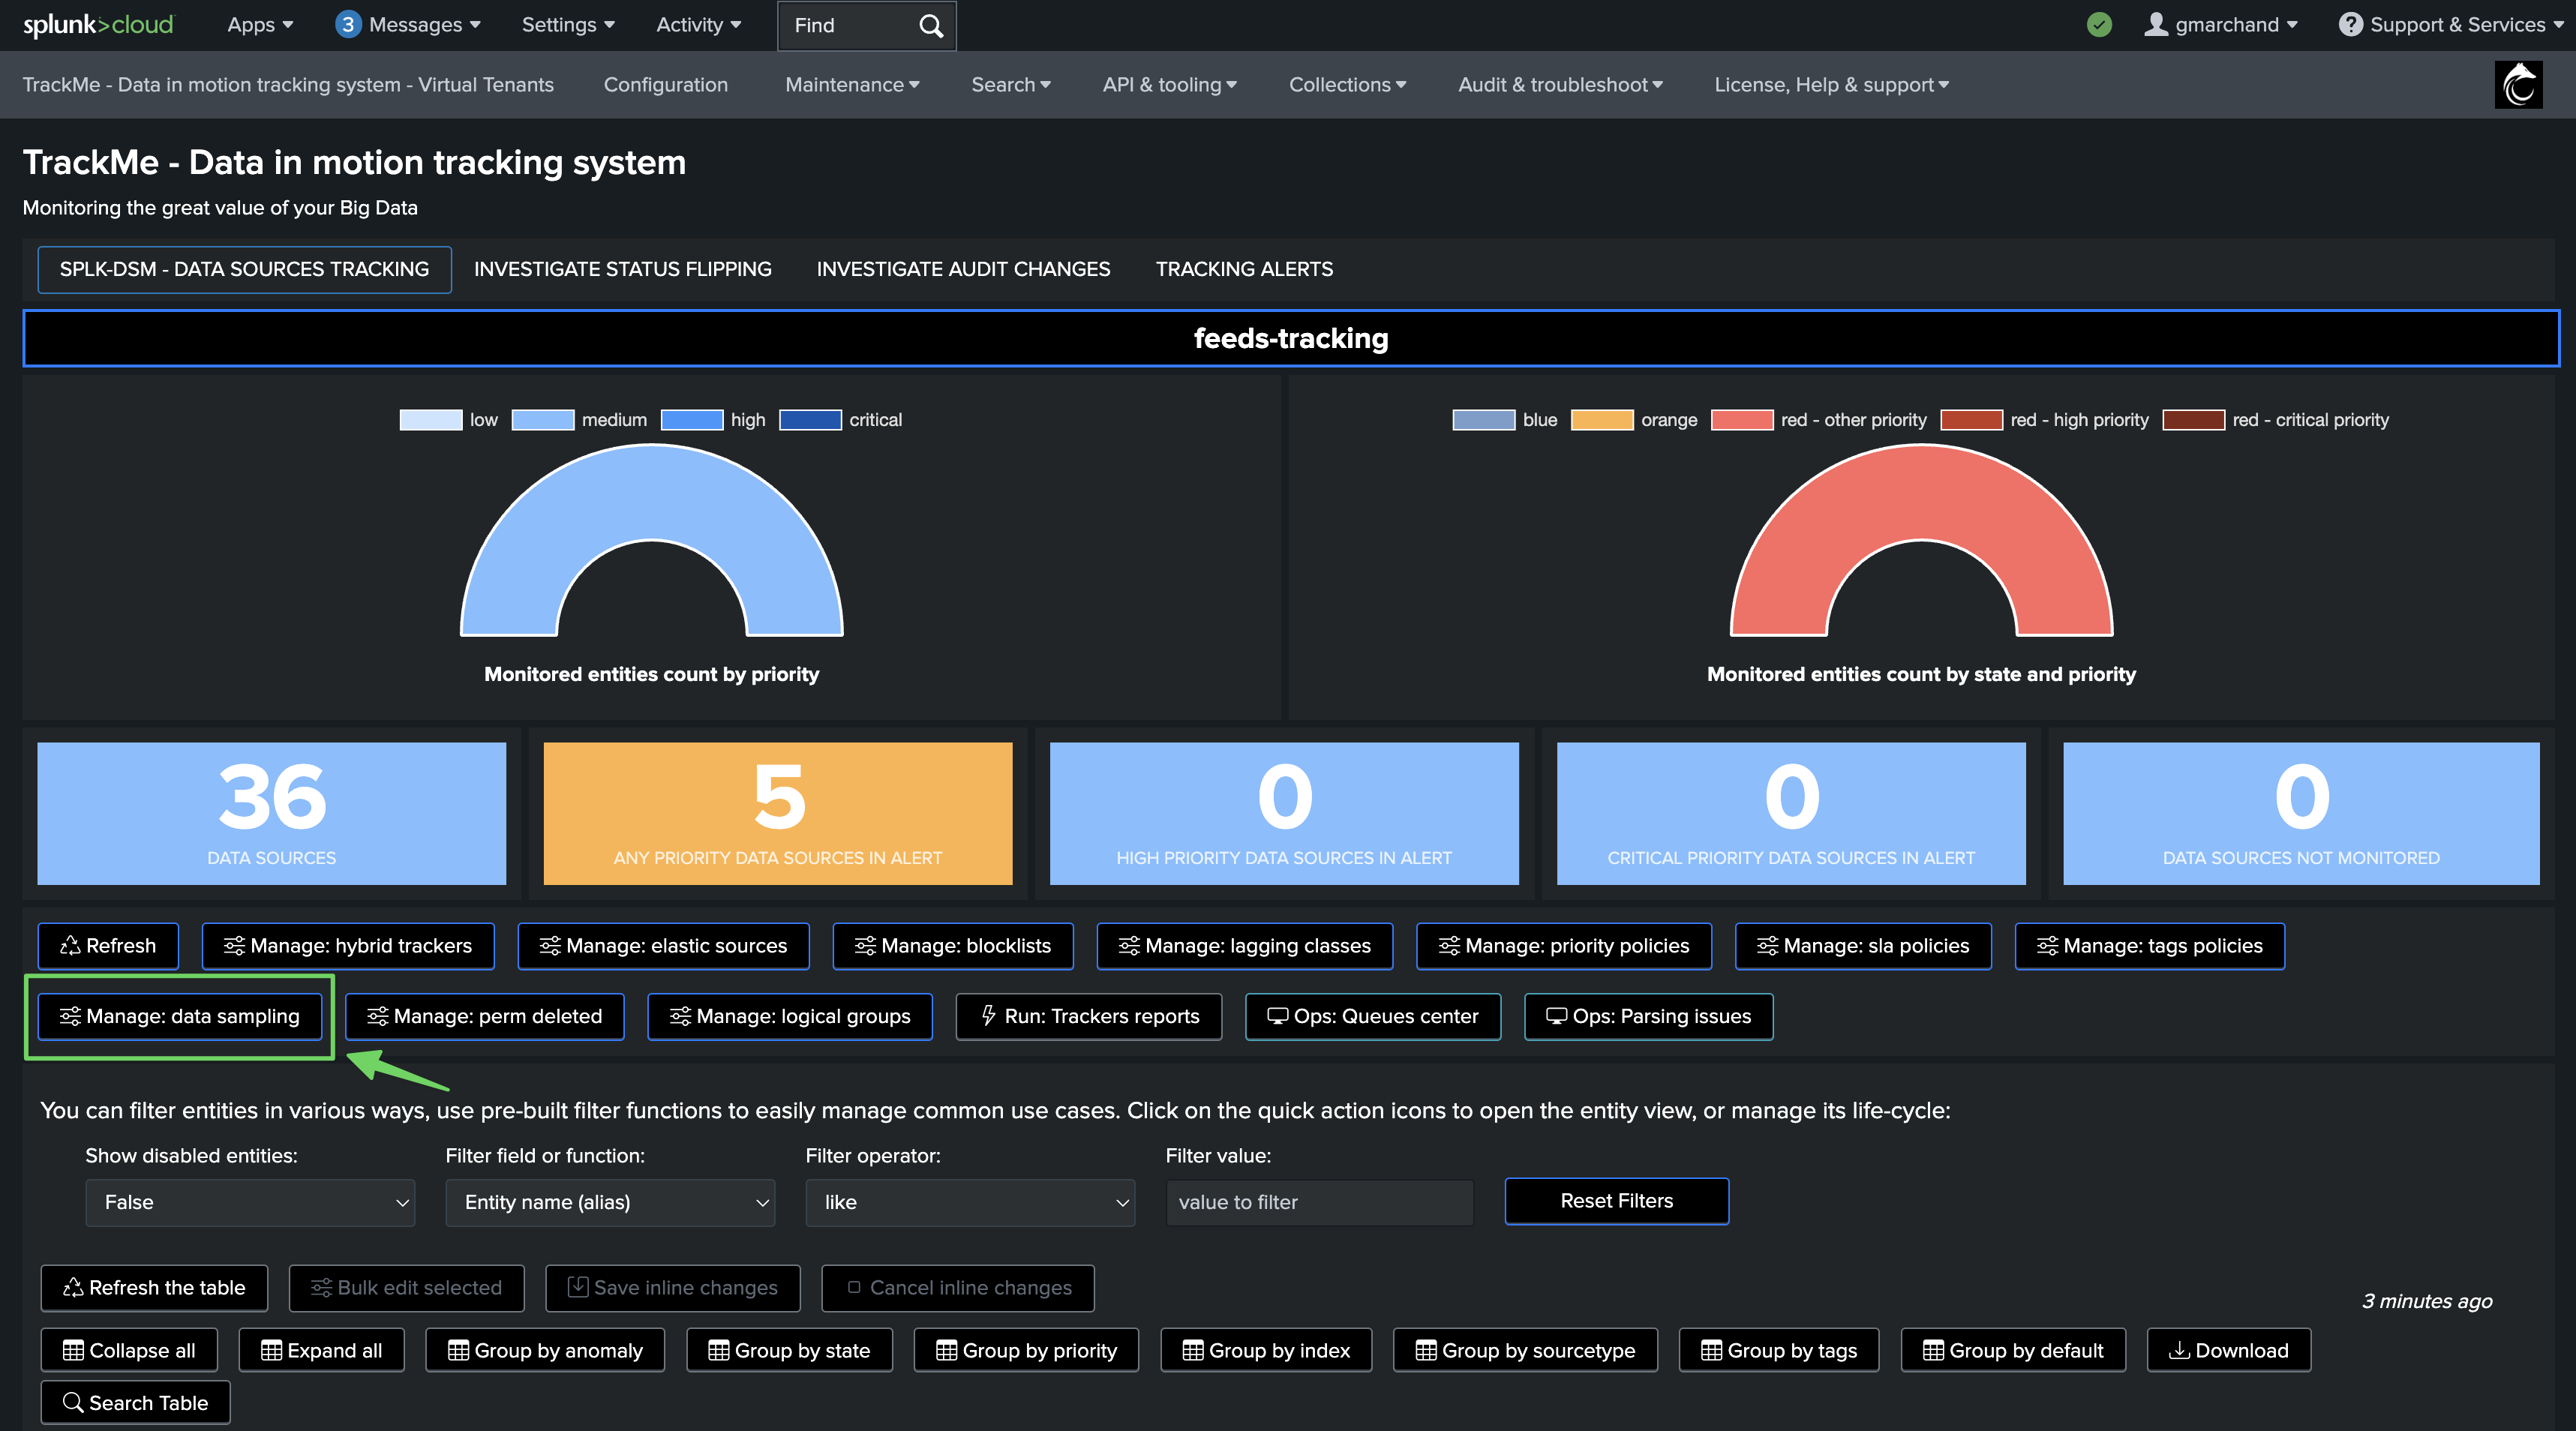
Out-of-the-Box Sampling Rules
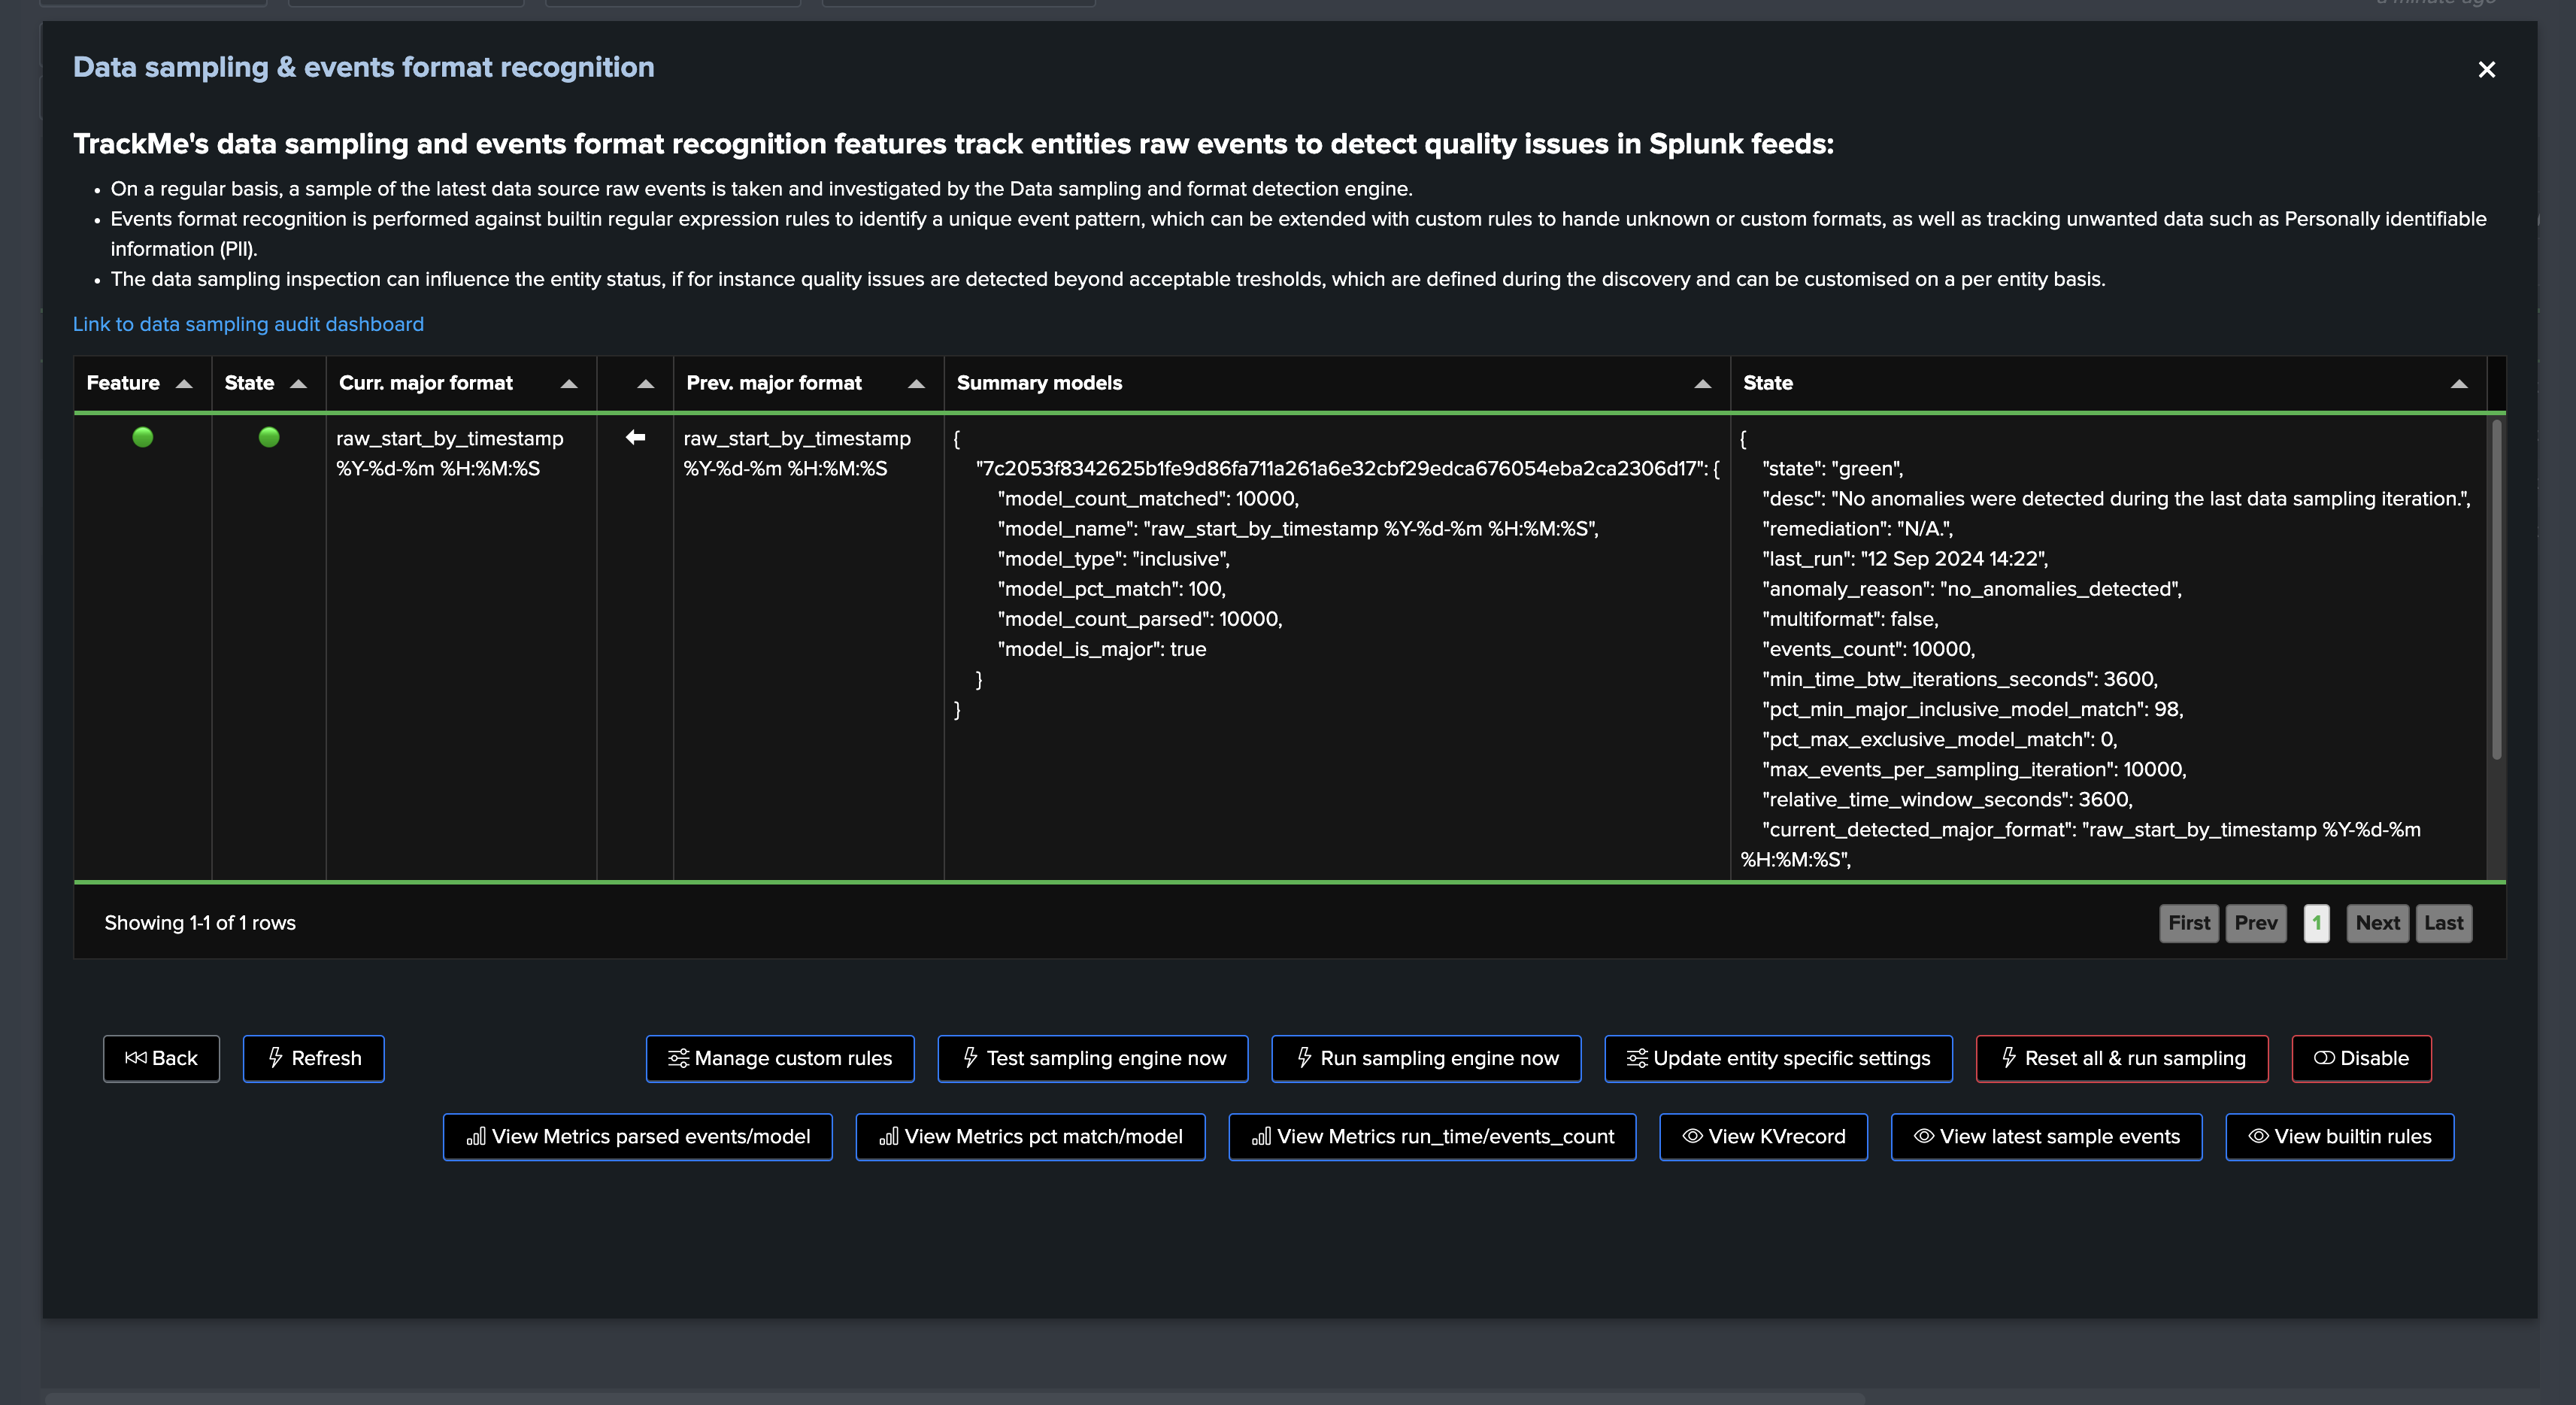
TrackMe provides a set of built-in rules that are applied to the events during the data sampling process, you can access these through the sampling management screen:
About out-of-the-box rules:
Out-of-the-box rules are always inclusive rules, with sourcetype_scope=*.
Out-of-the-box rules are always applied after custom rules, if any.
For inclusive rules, the engine breaks for a given event at the first rule that matches the event, so an event can only match one rule. (with custom rules applied first)
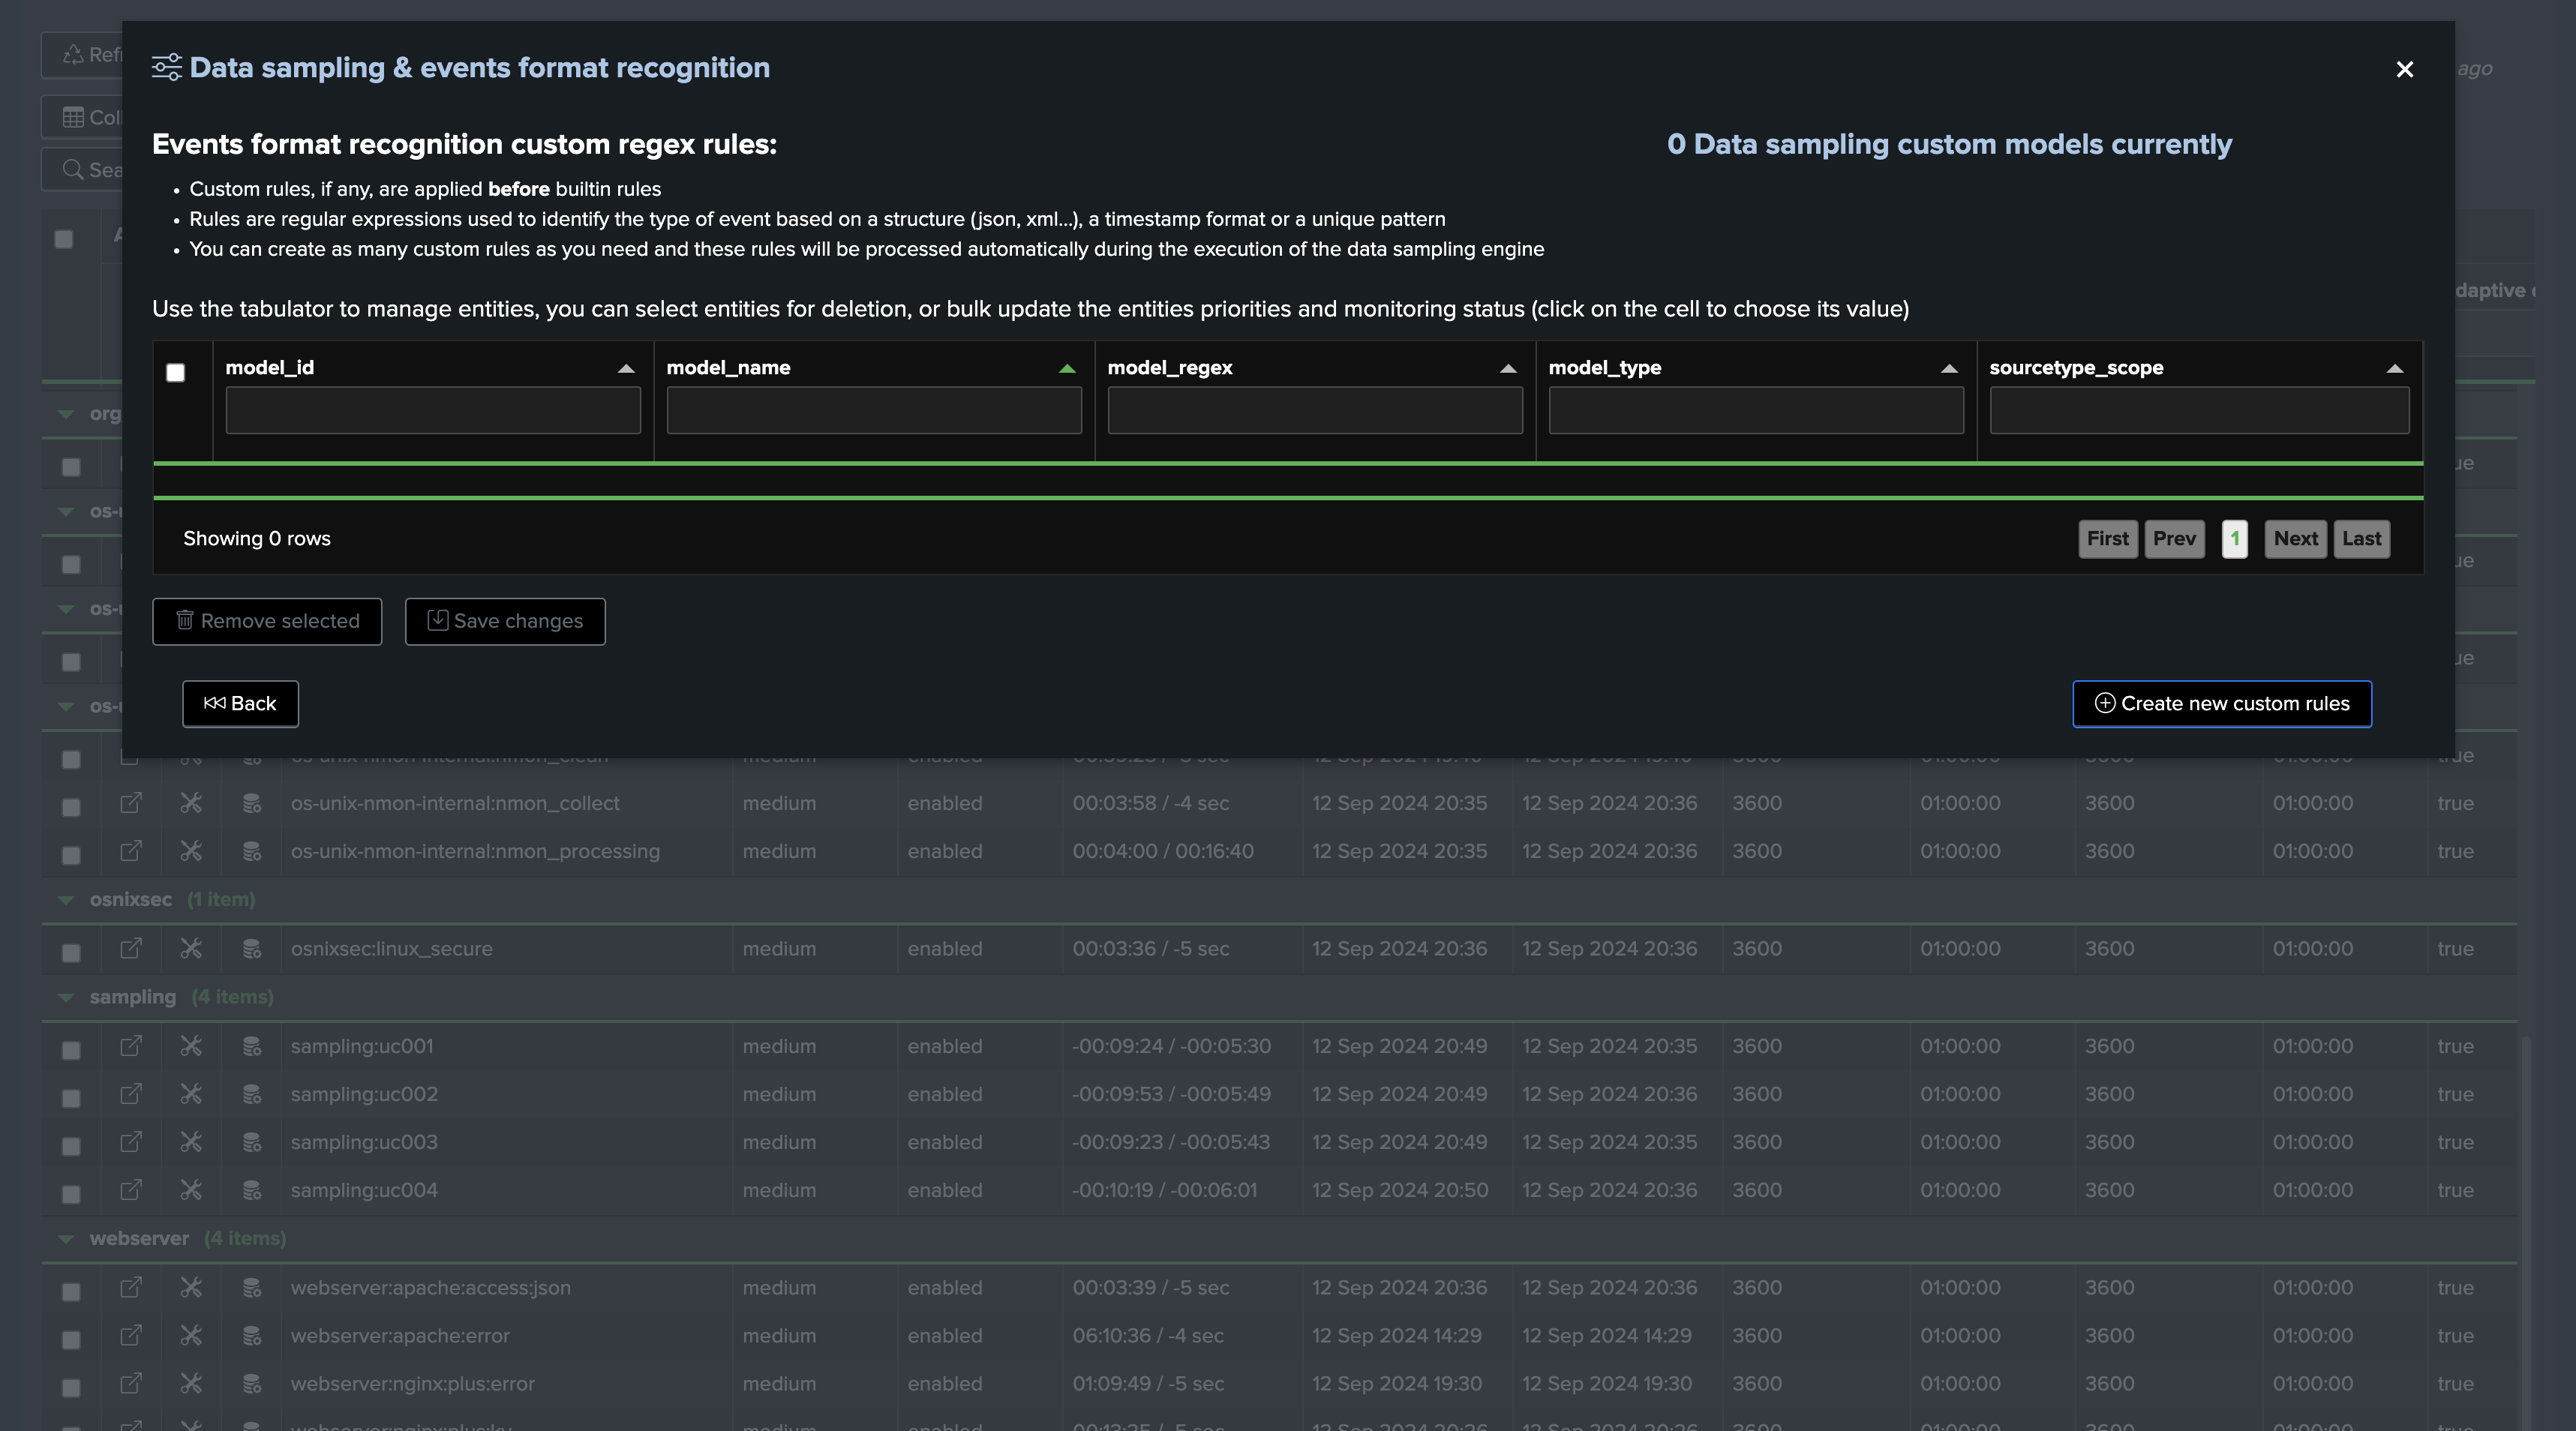
Custom Rules: Creating and Managing Custom Rules
Custom rules can be created to address custom formats, or event formats which are not detected by TrackMe, you can access custom rules management from the entity screen:
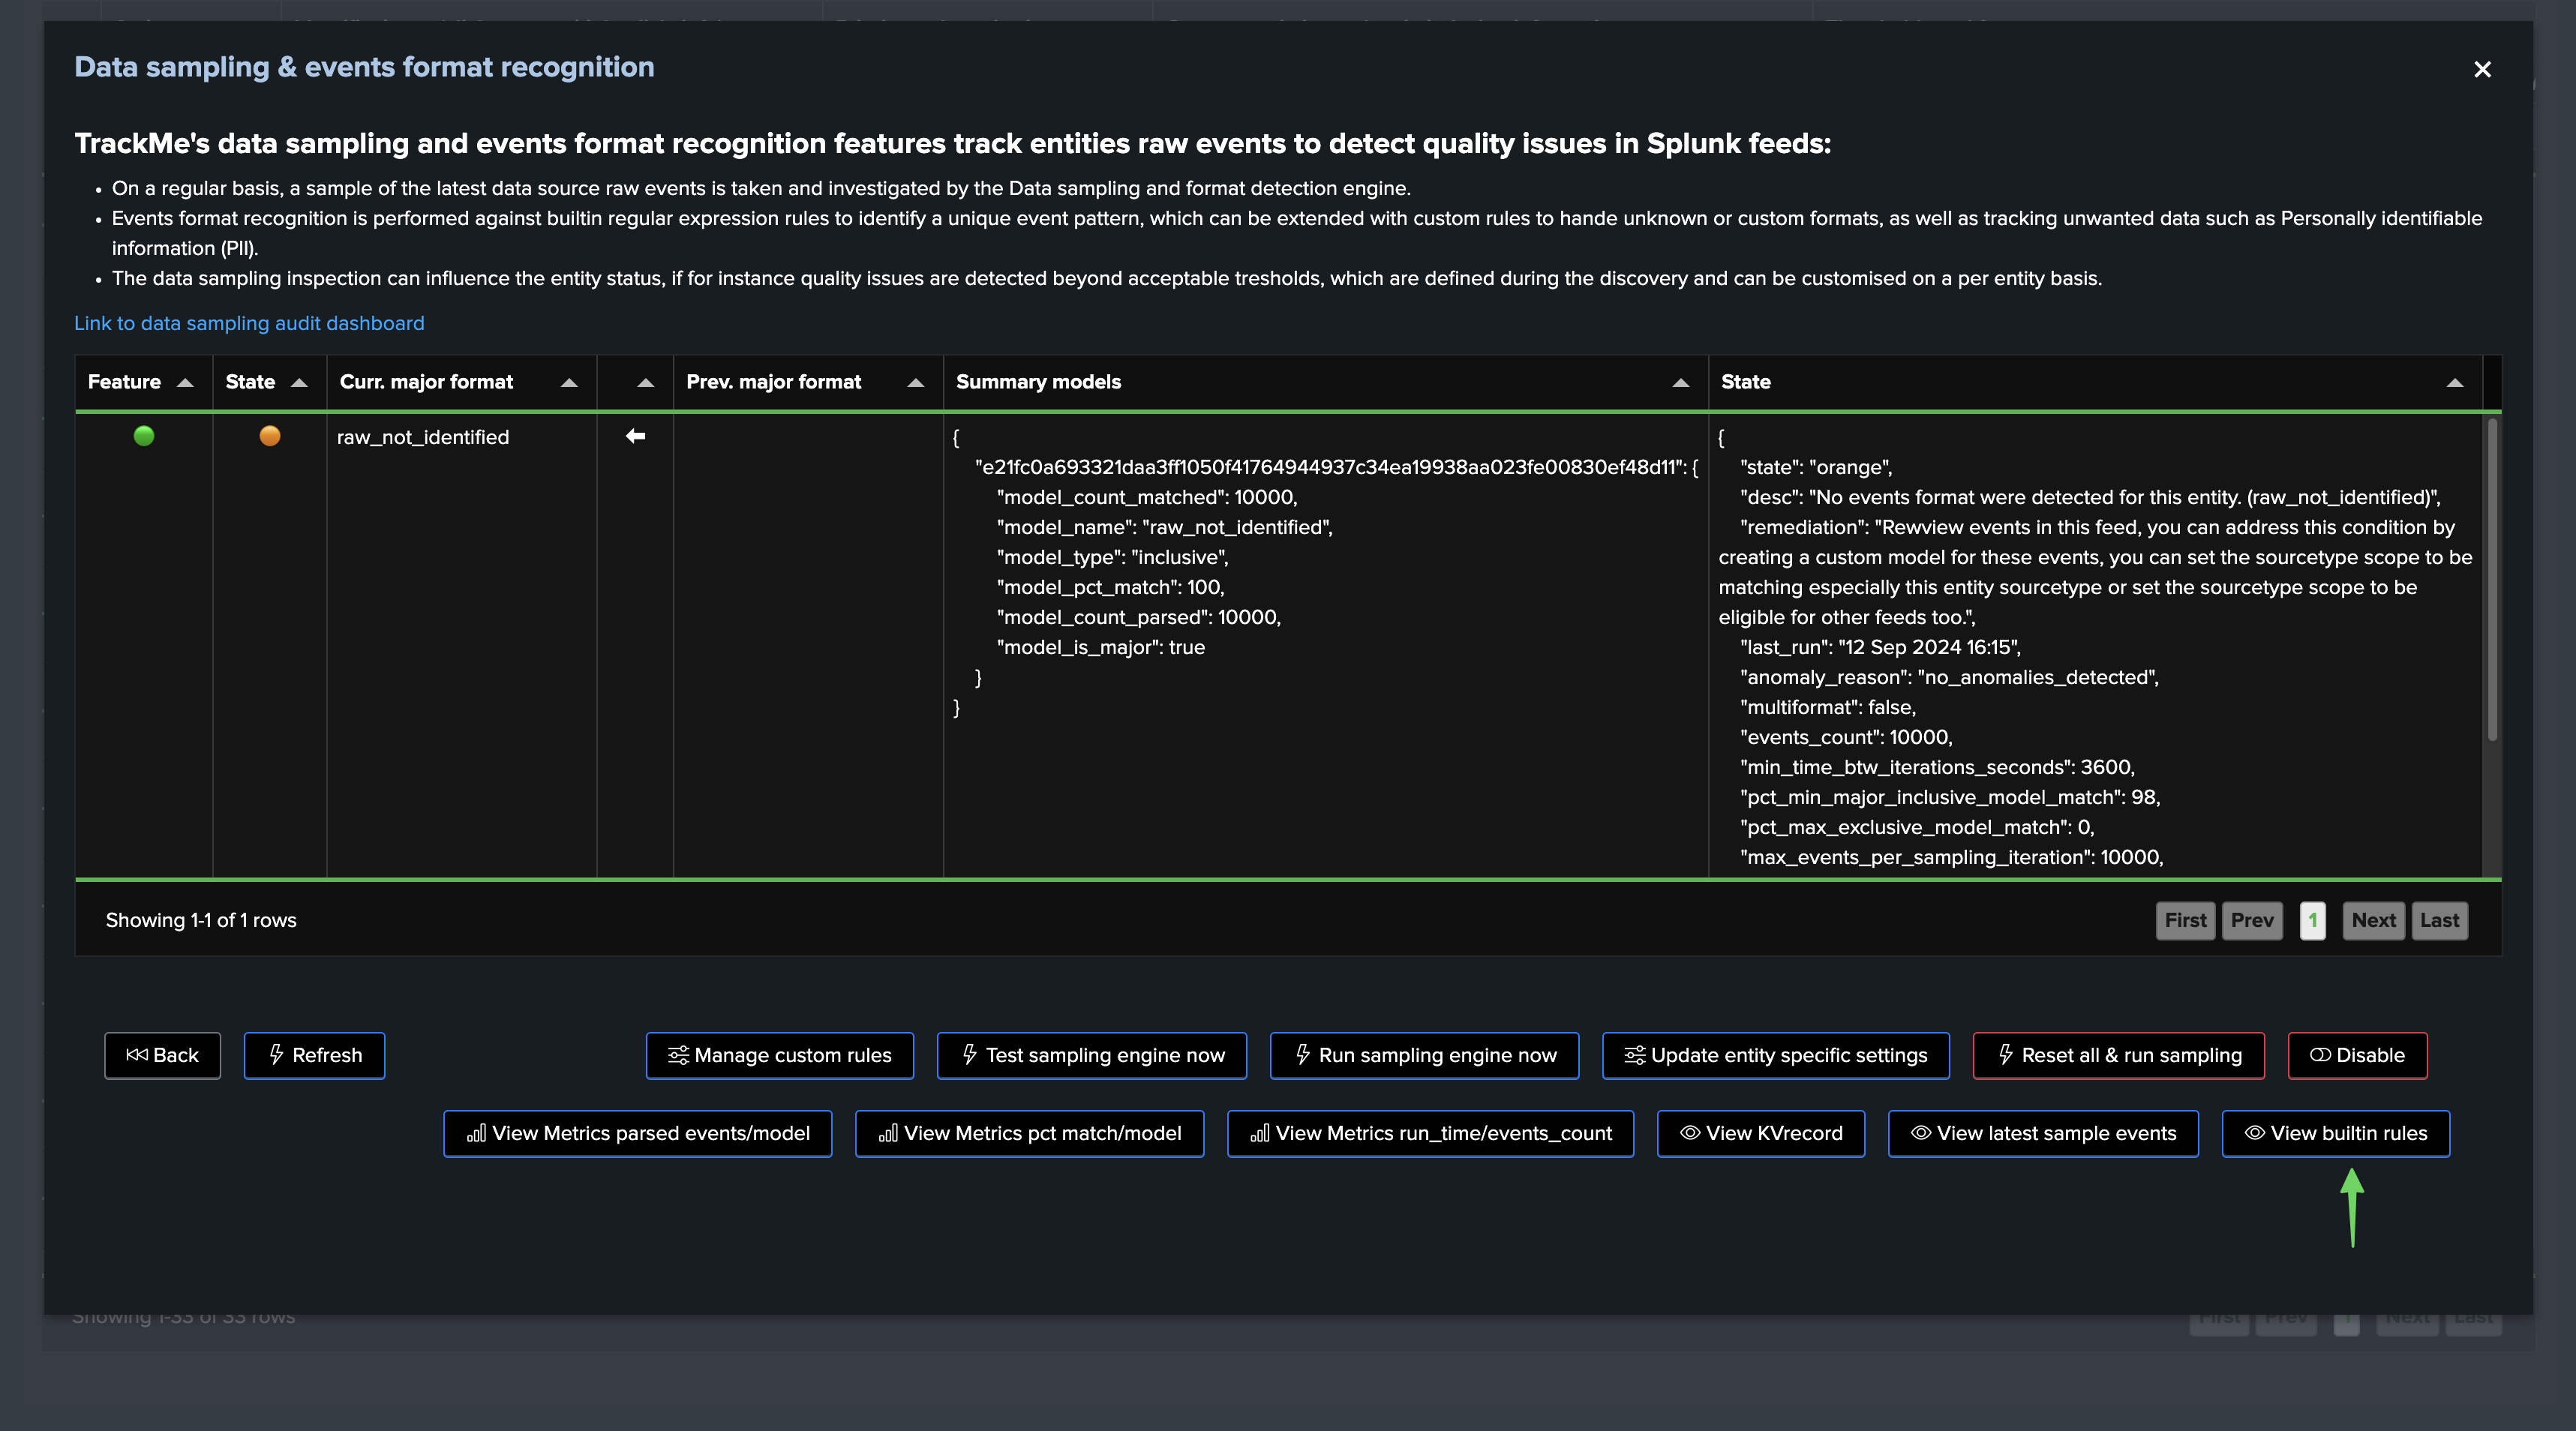
Example of Creating a Custom Rule
In the following example, we can see that the engine does not recognize the format of the events, and we can create a custom rule to address it, so that the engine can start tracking the format of the events:
The following screen shows the welcome start of the custom rule creation screen:
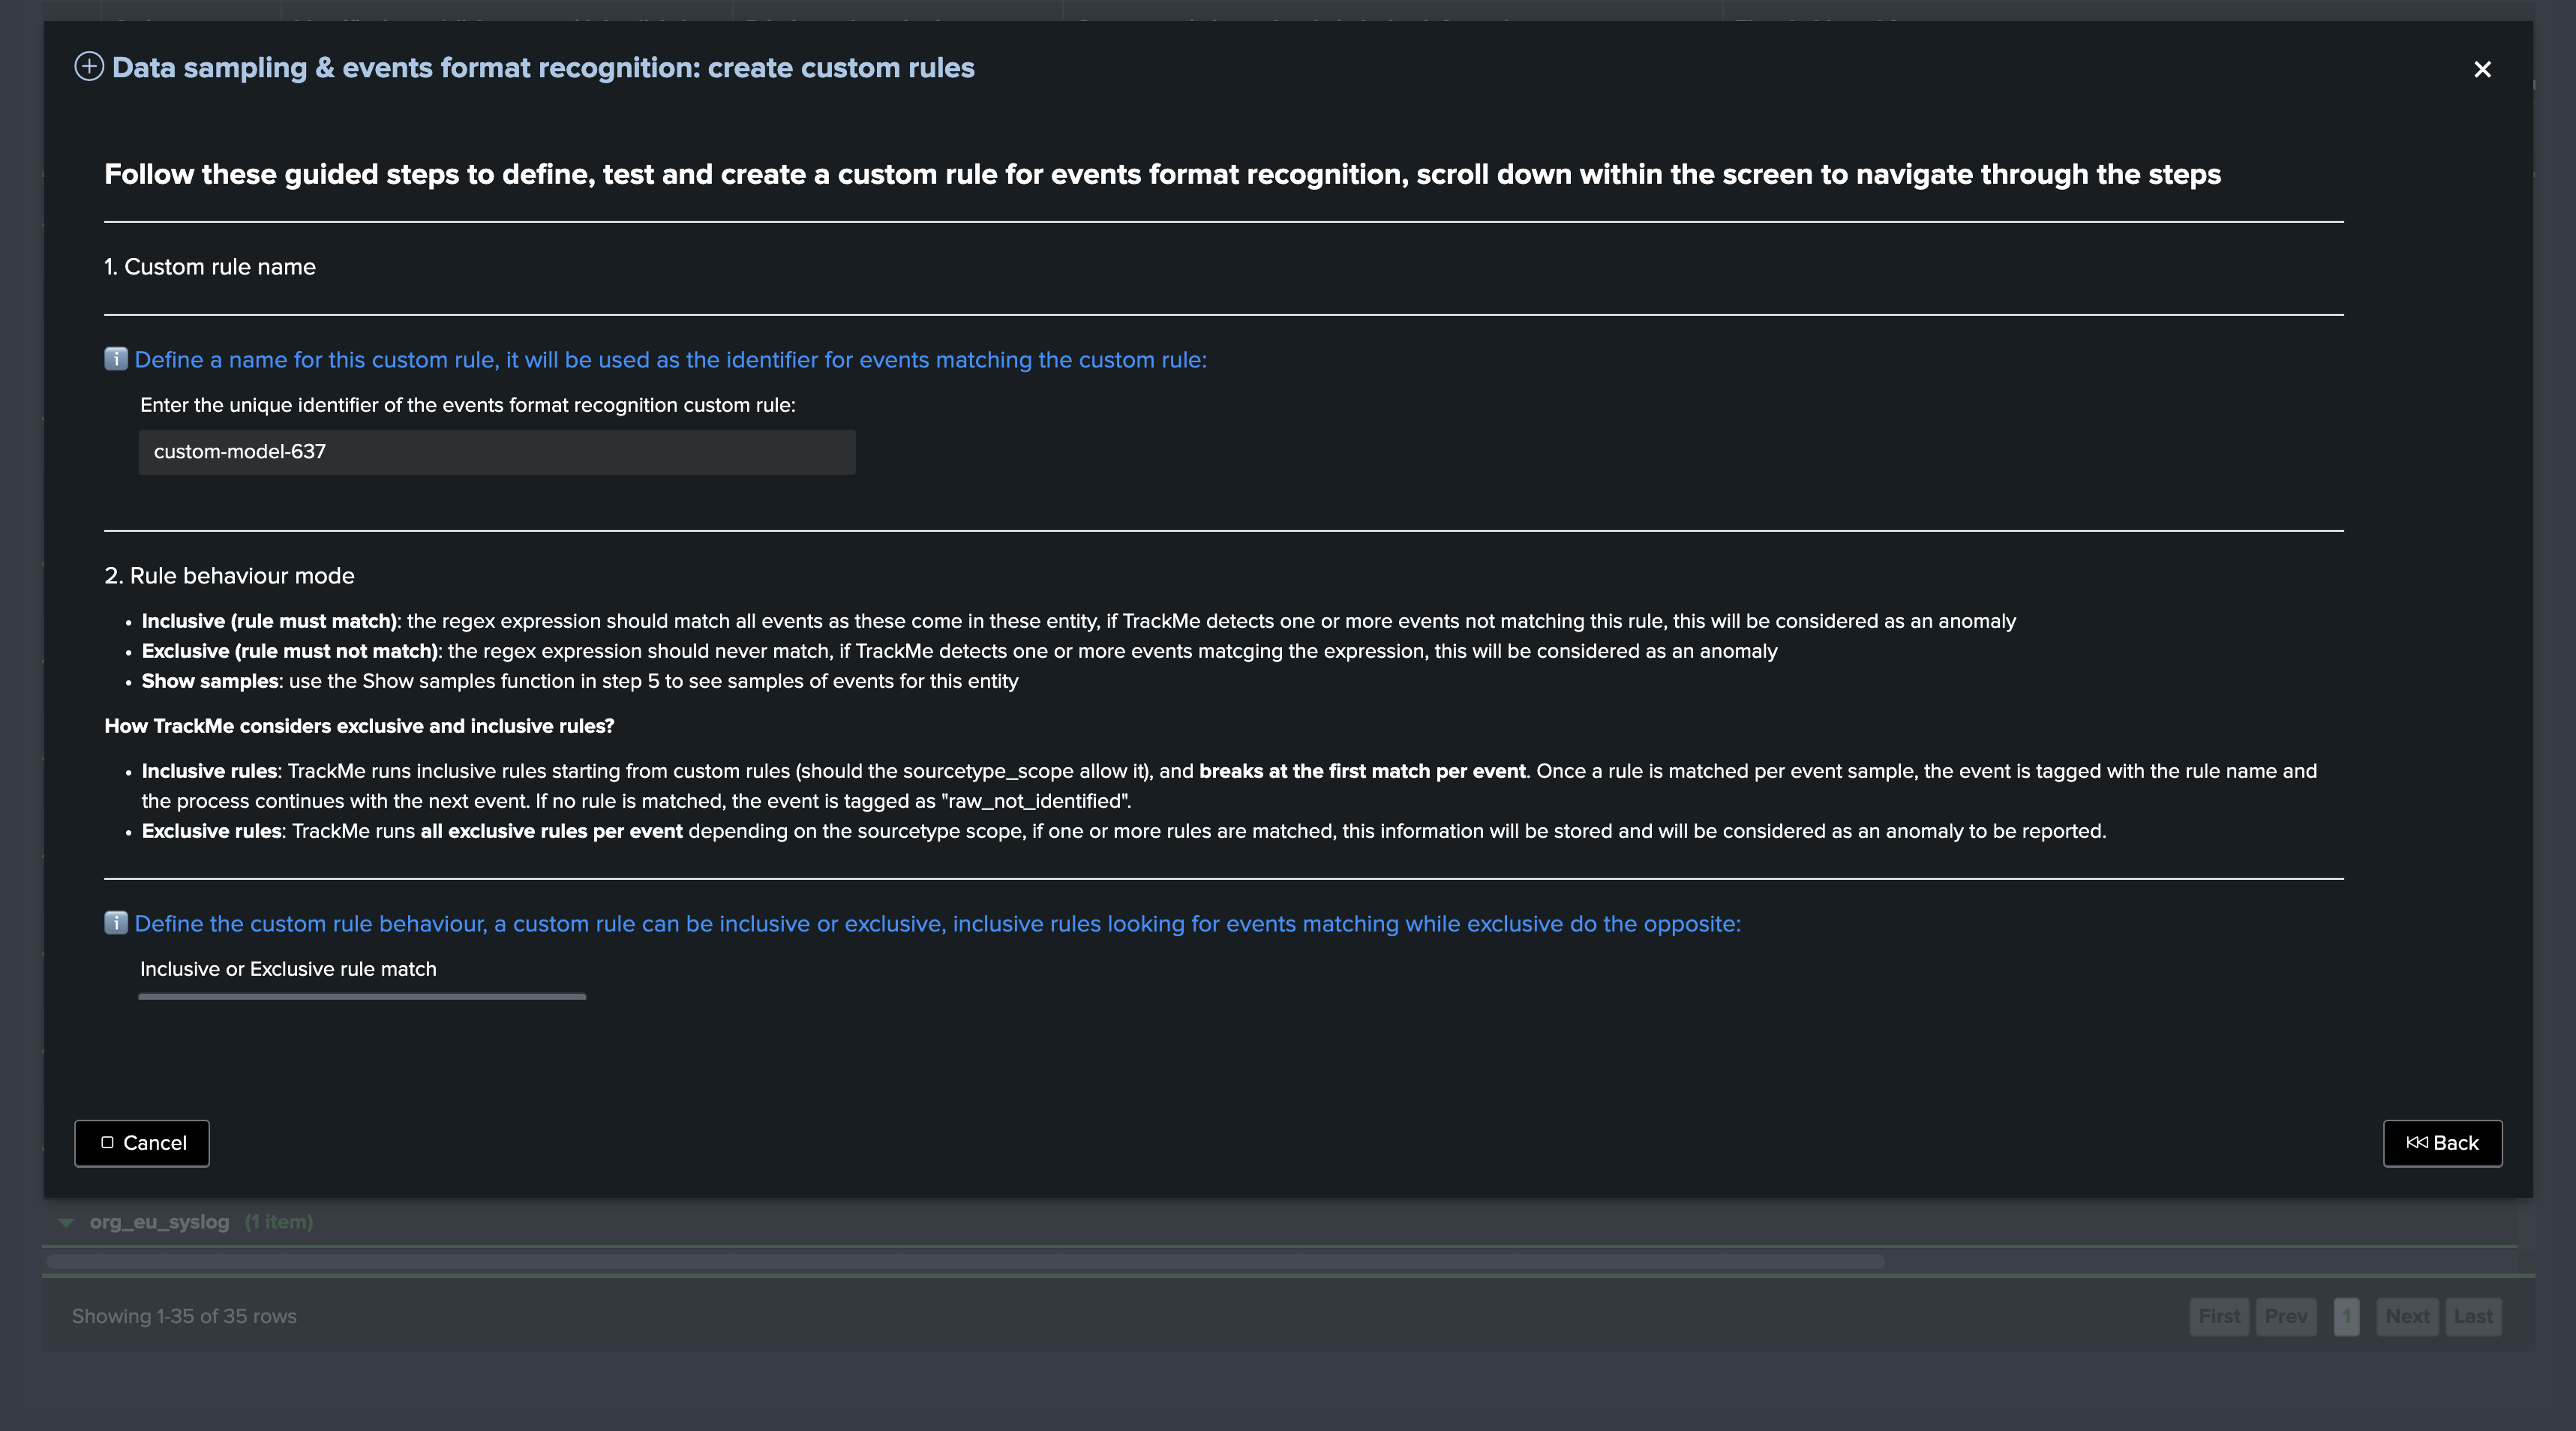
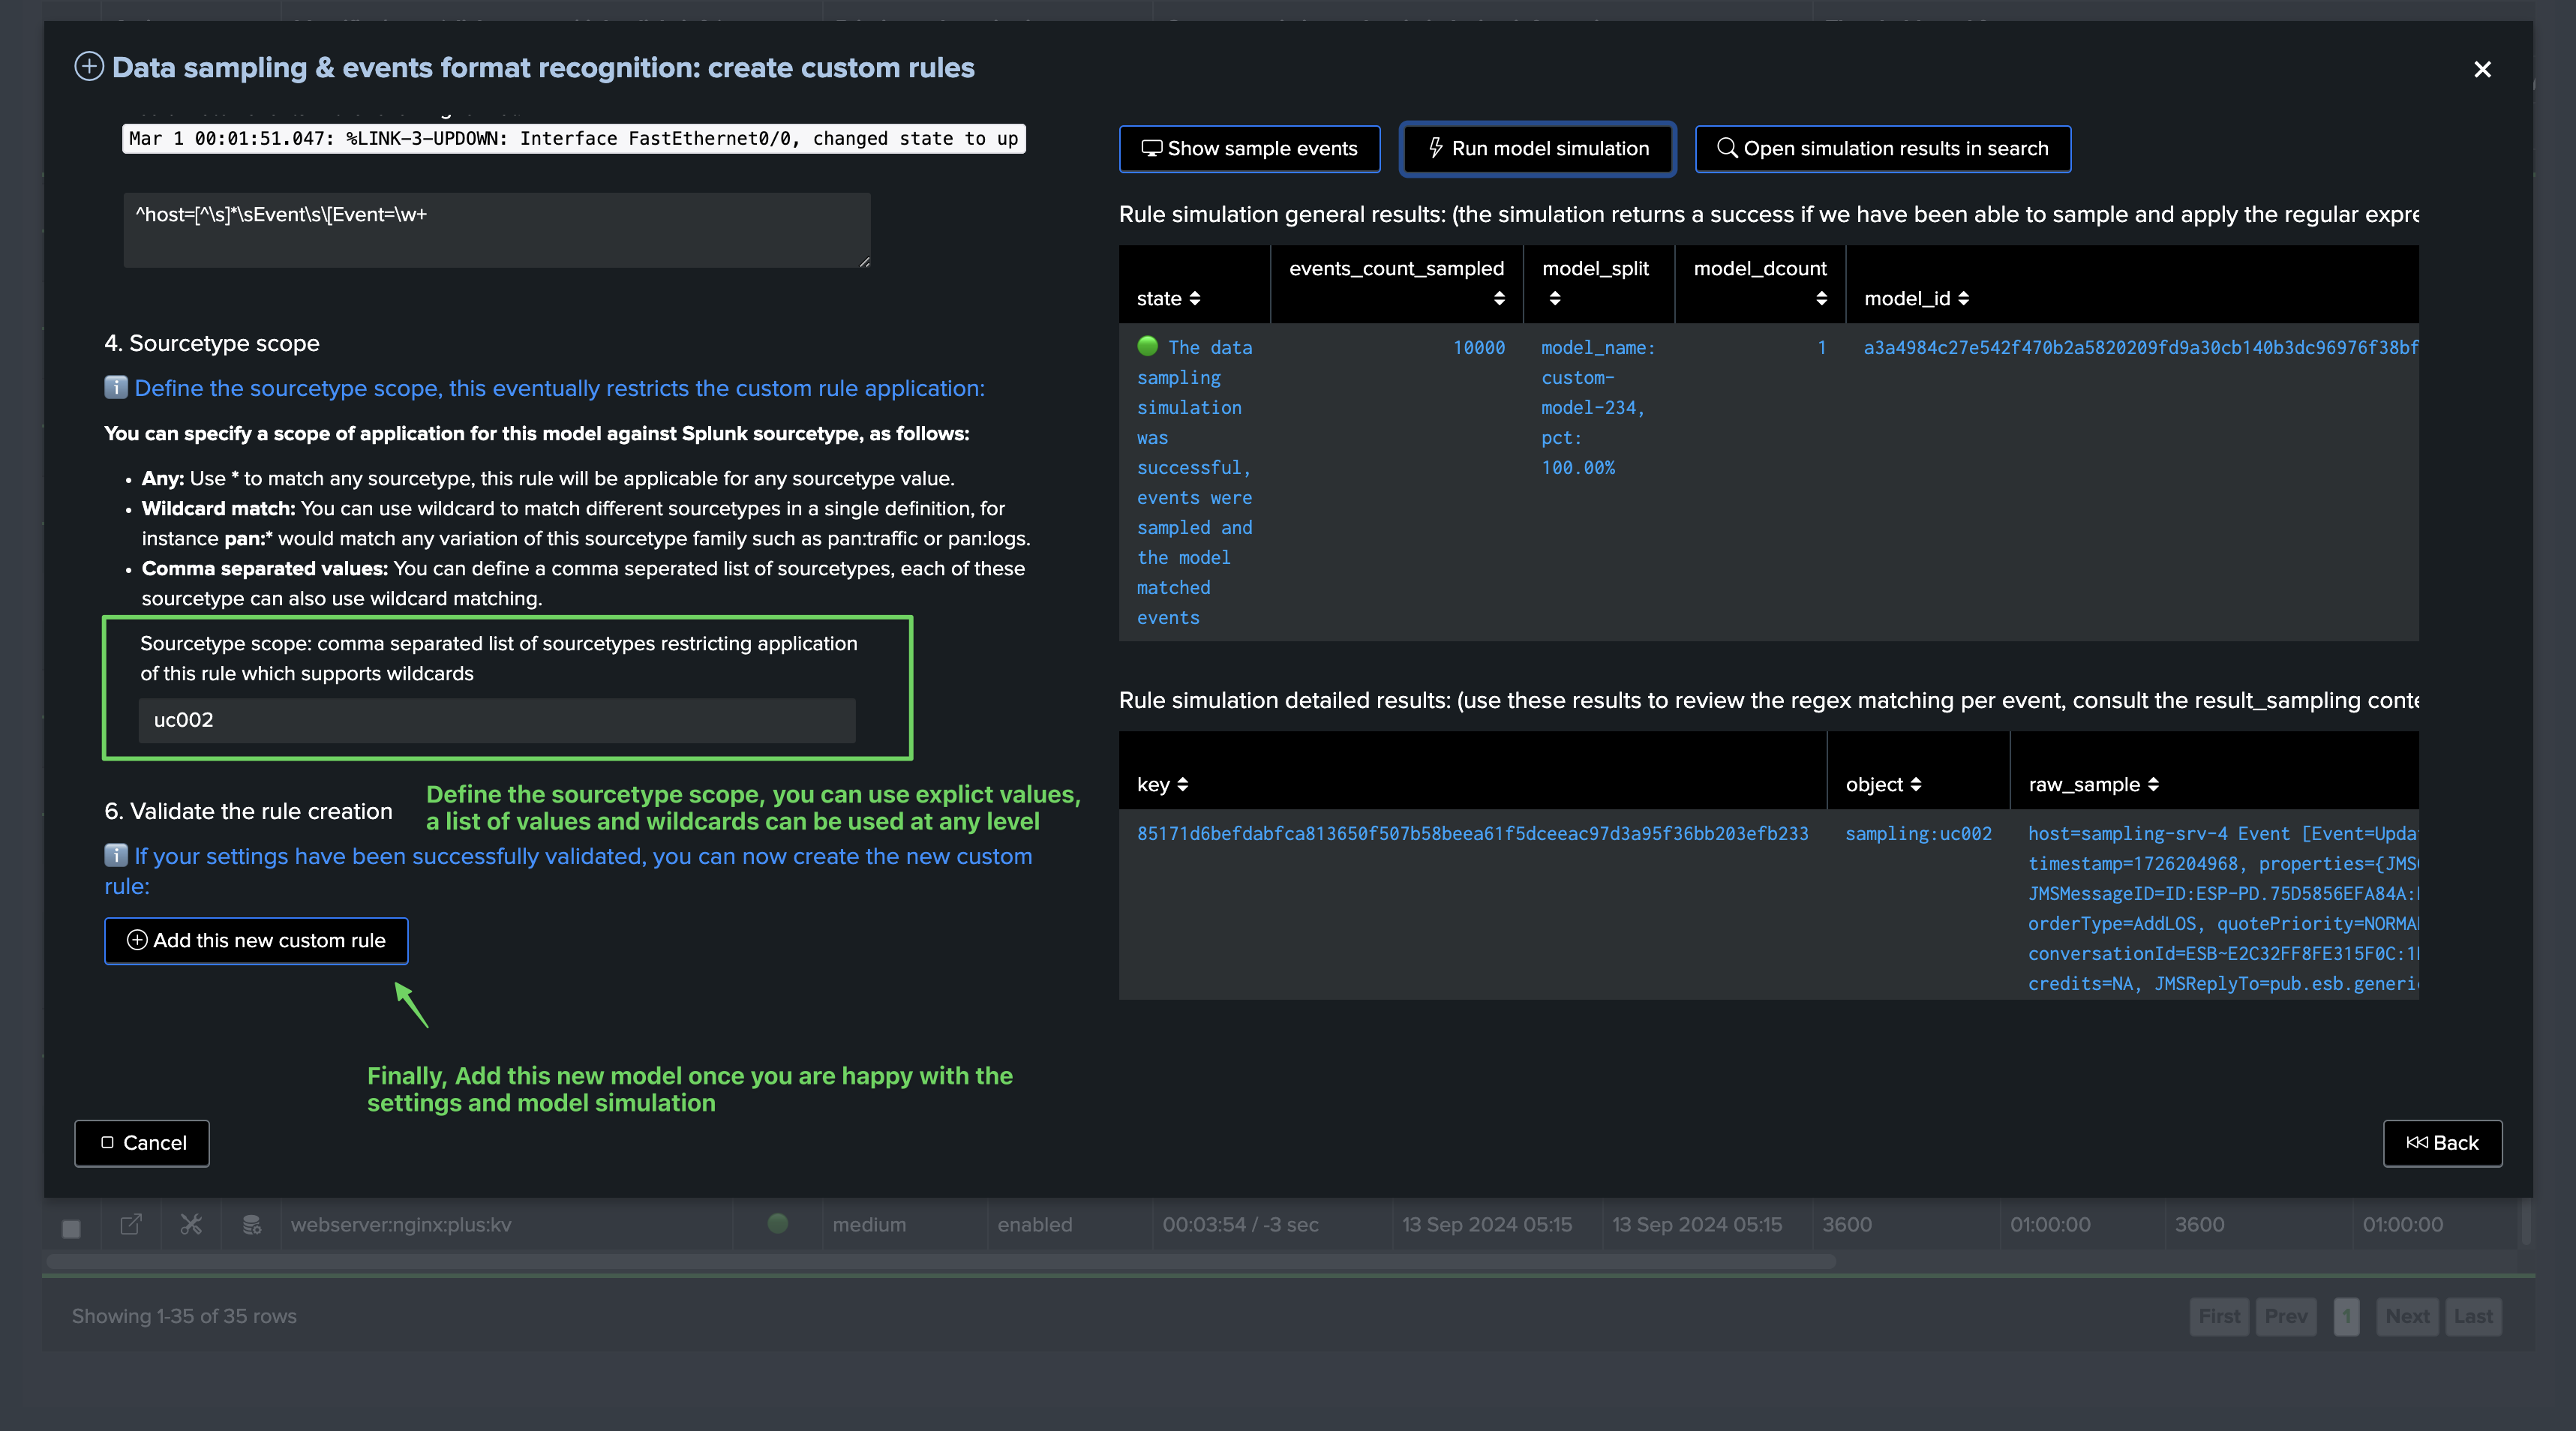
Scroll down, you can from the UI define the sourcetype scope of the custom rule, as well as displaying a sample of events, defining the regular expression of the rule and testing in real conditions the rule:
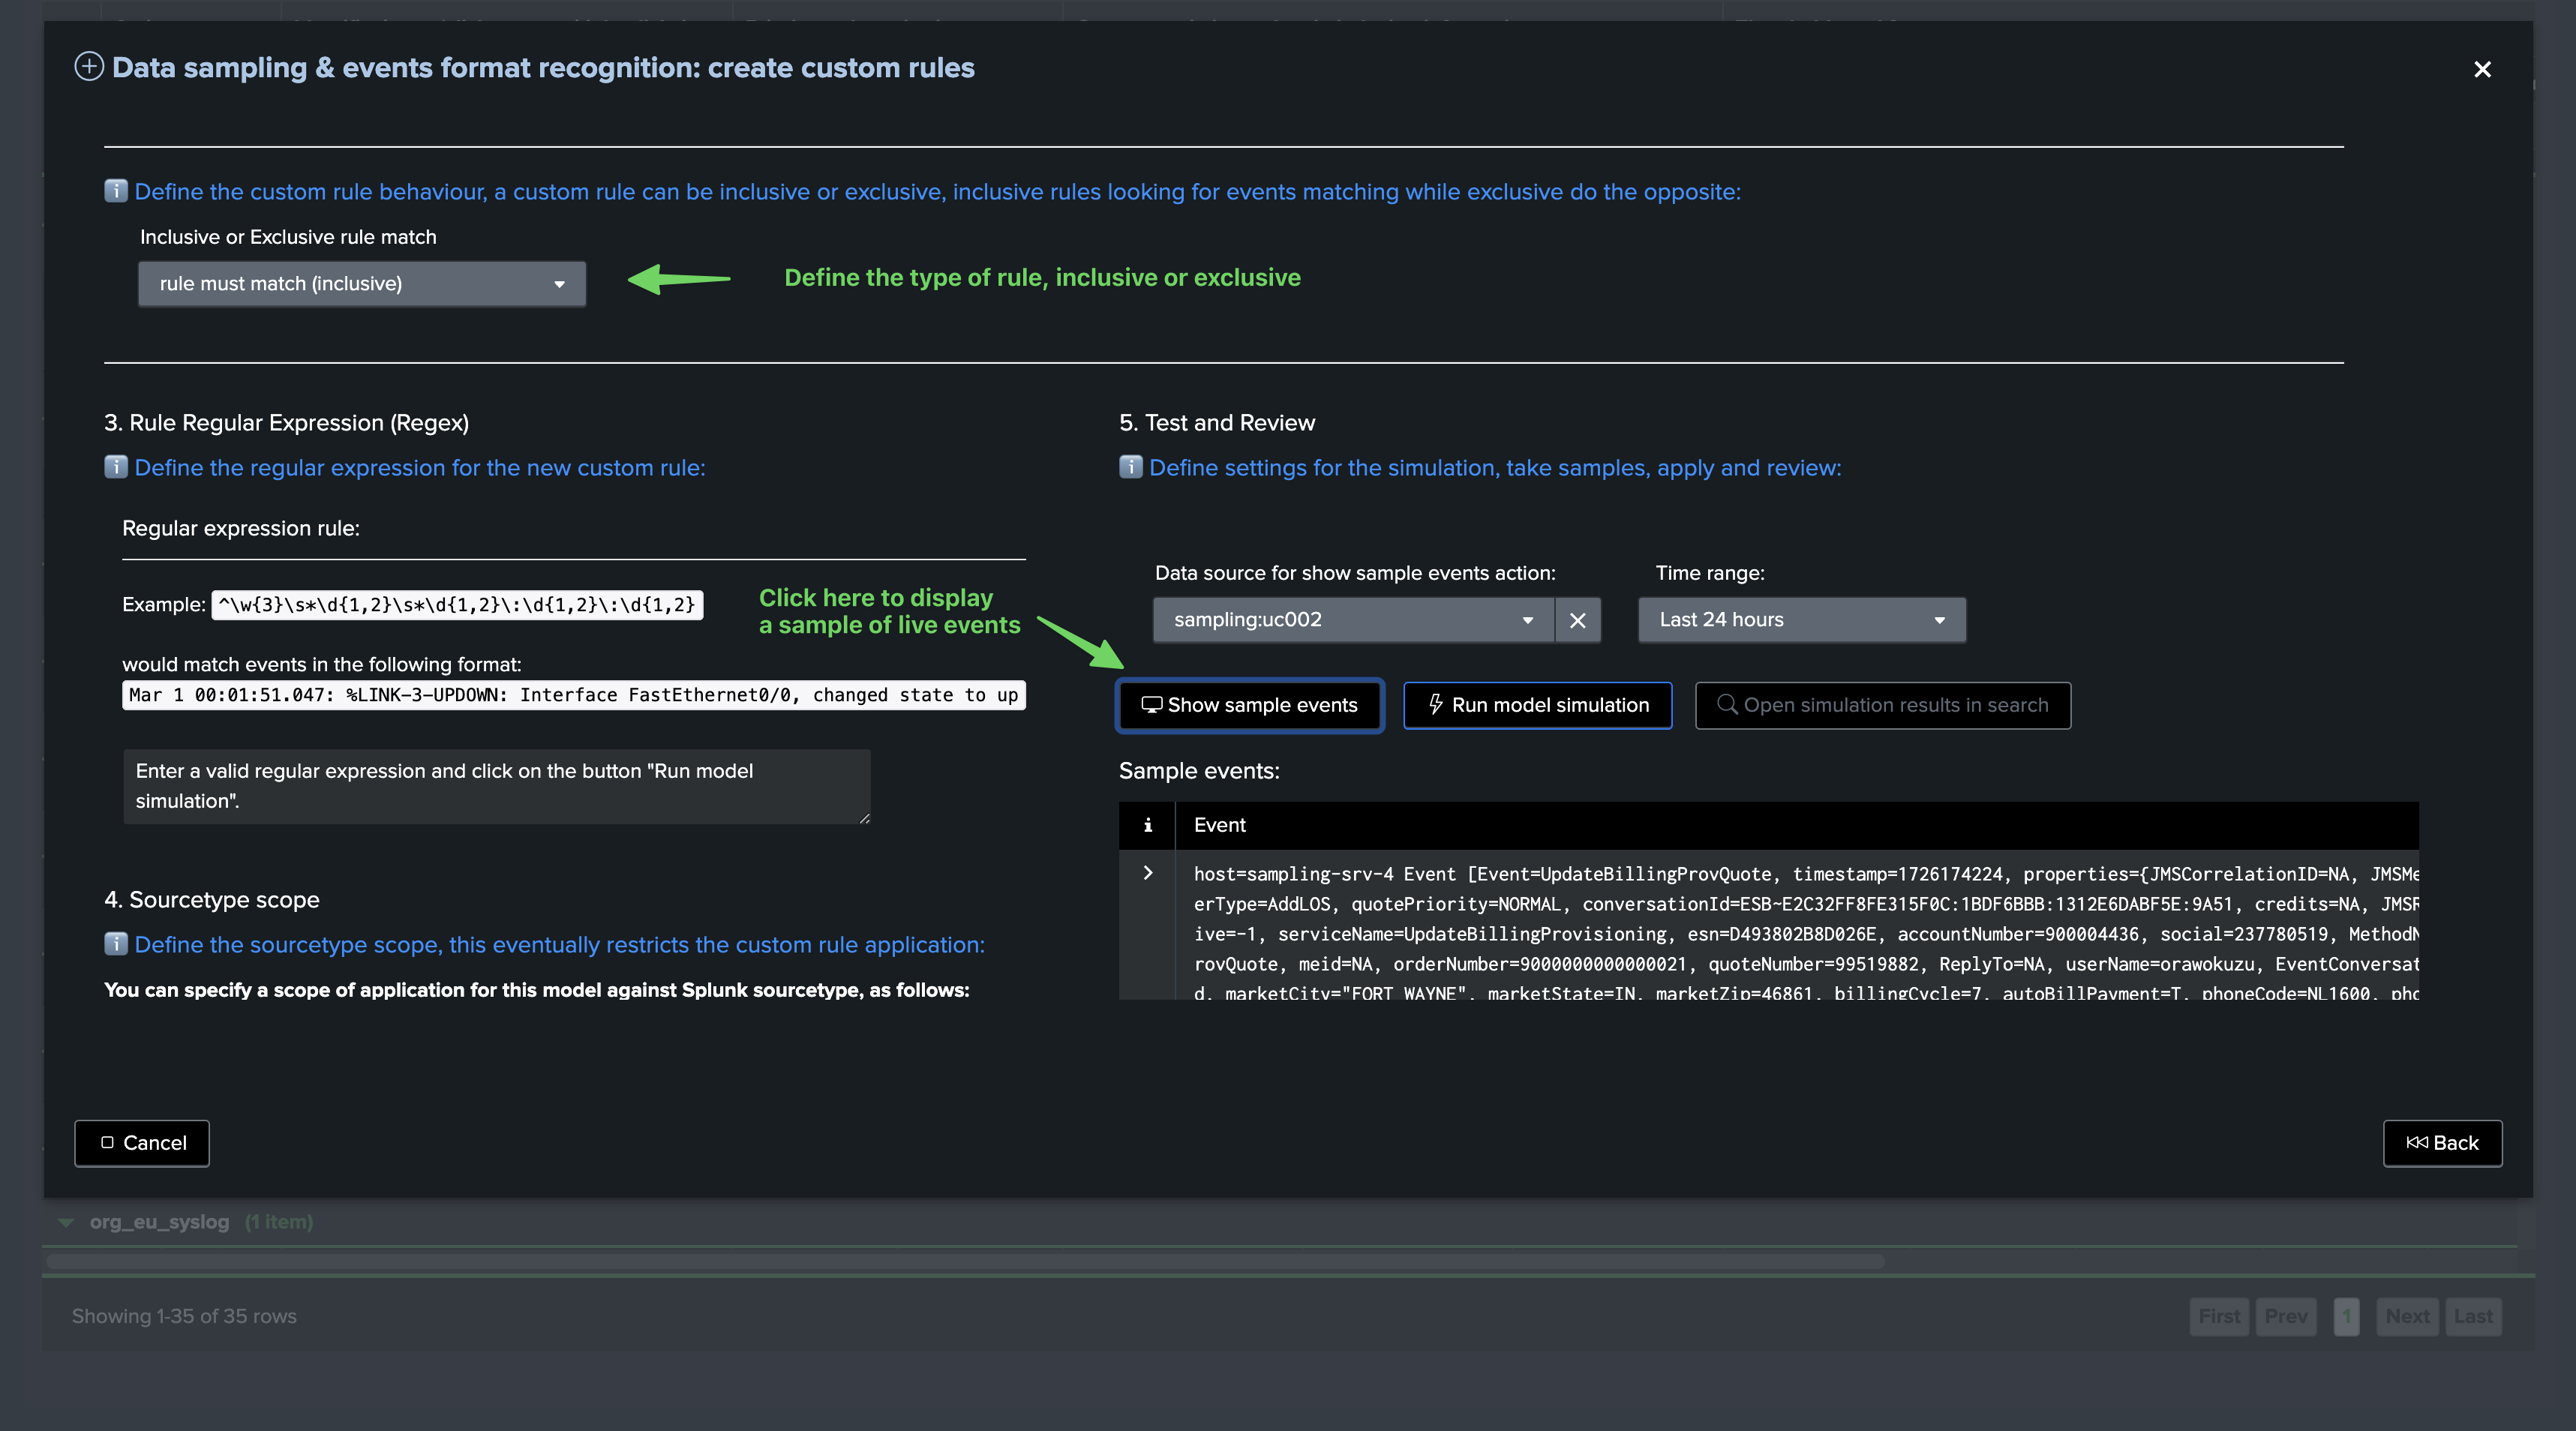
The “Show sample events” button executes underneath the following TrackMe command:
Notes: replace mytenant and myobject with the actual tenant and object values
| trackmesamplingexecutor tenant_id="mytenant" object="myobject" mode="get_live_samples" get_samples_max_count="10000" earliest="-24h" latest="now"
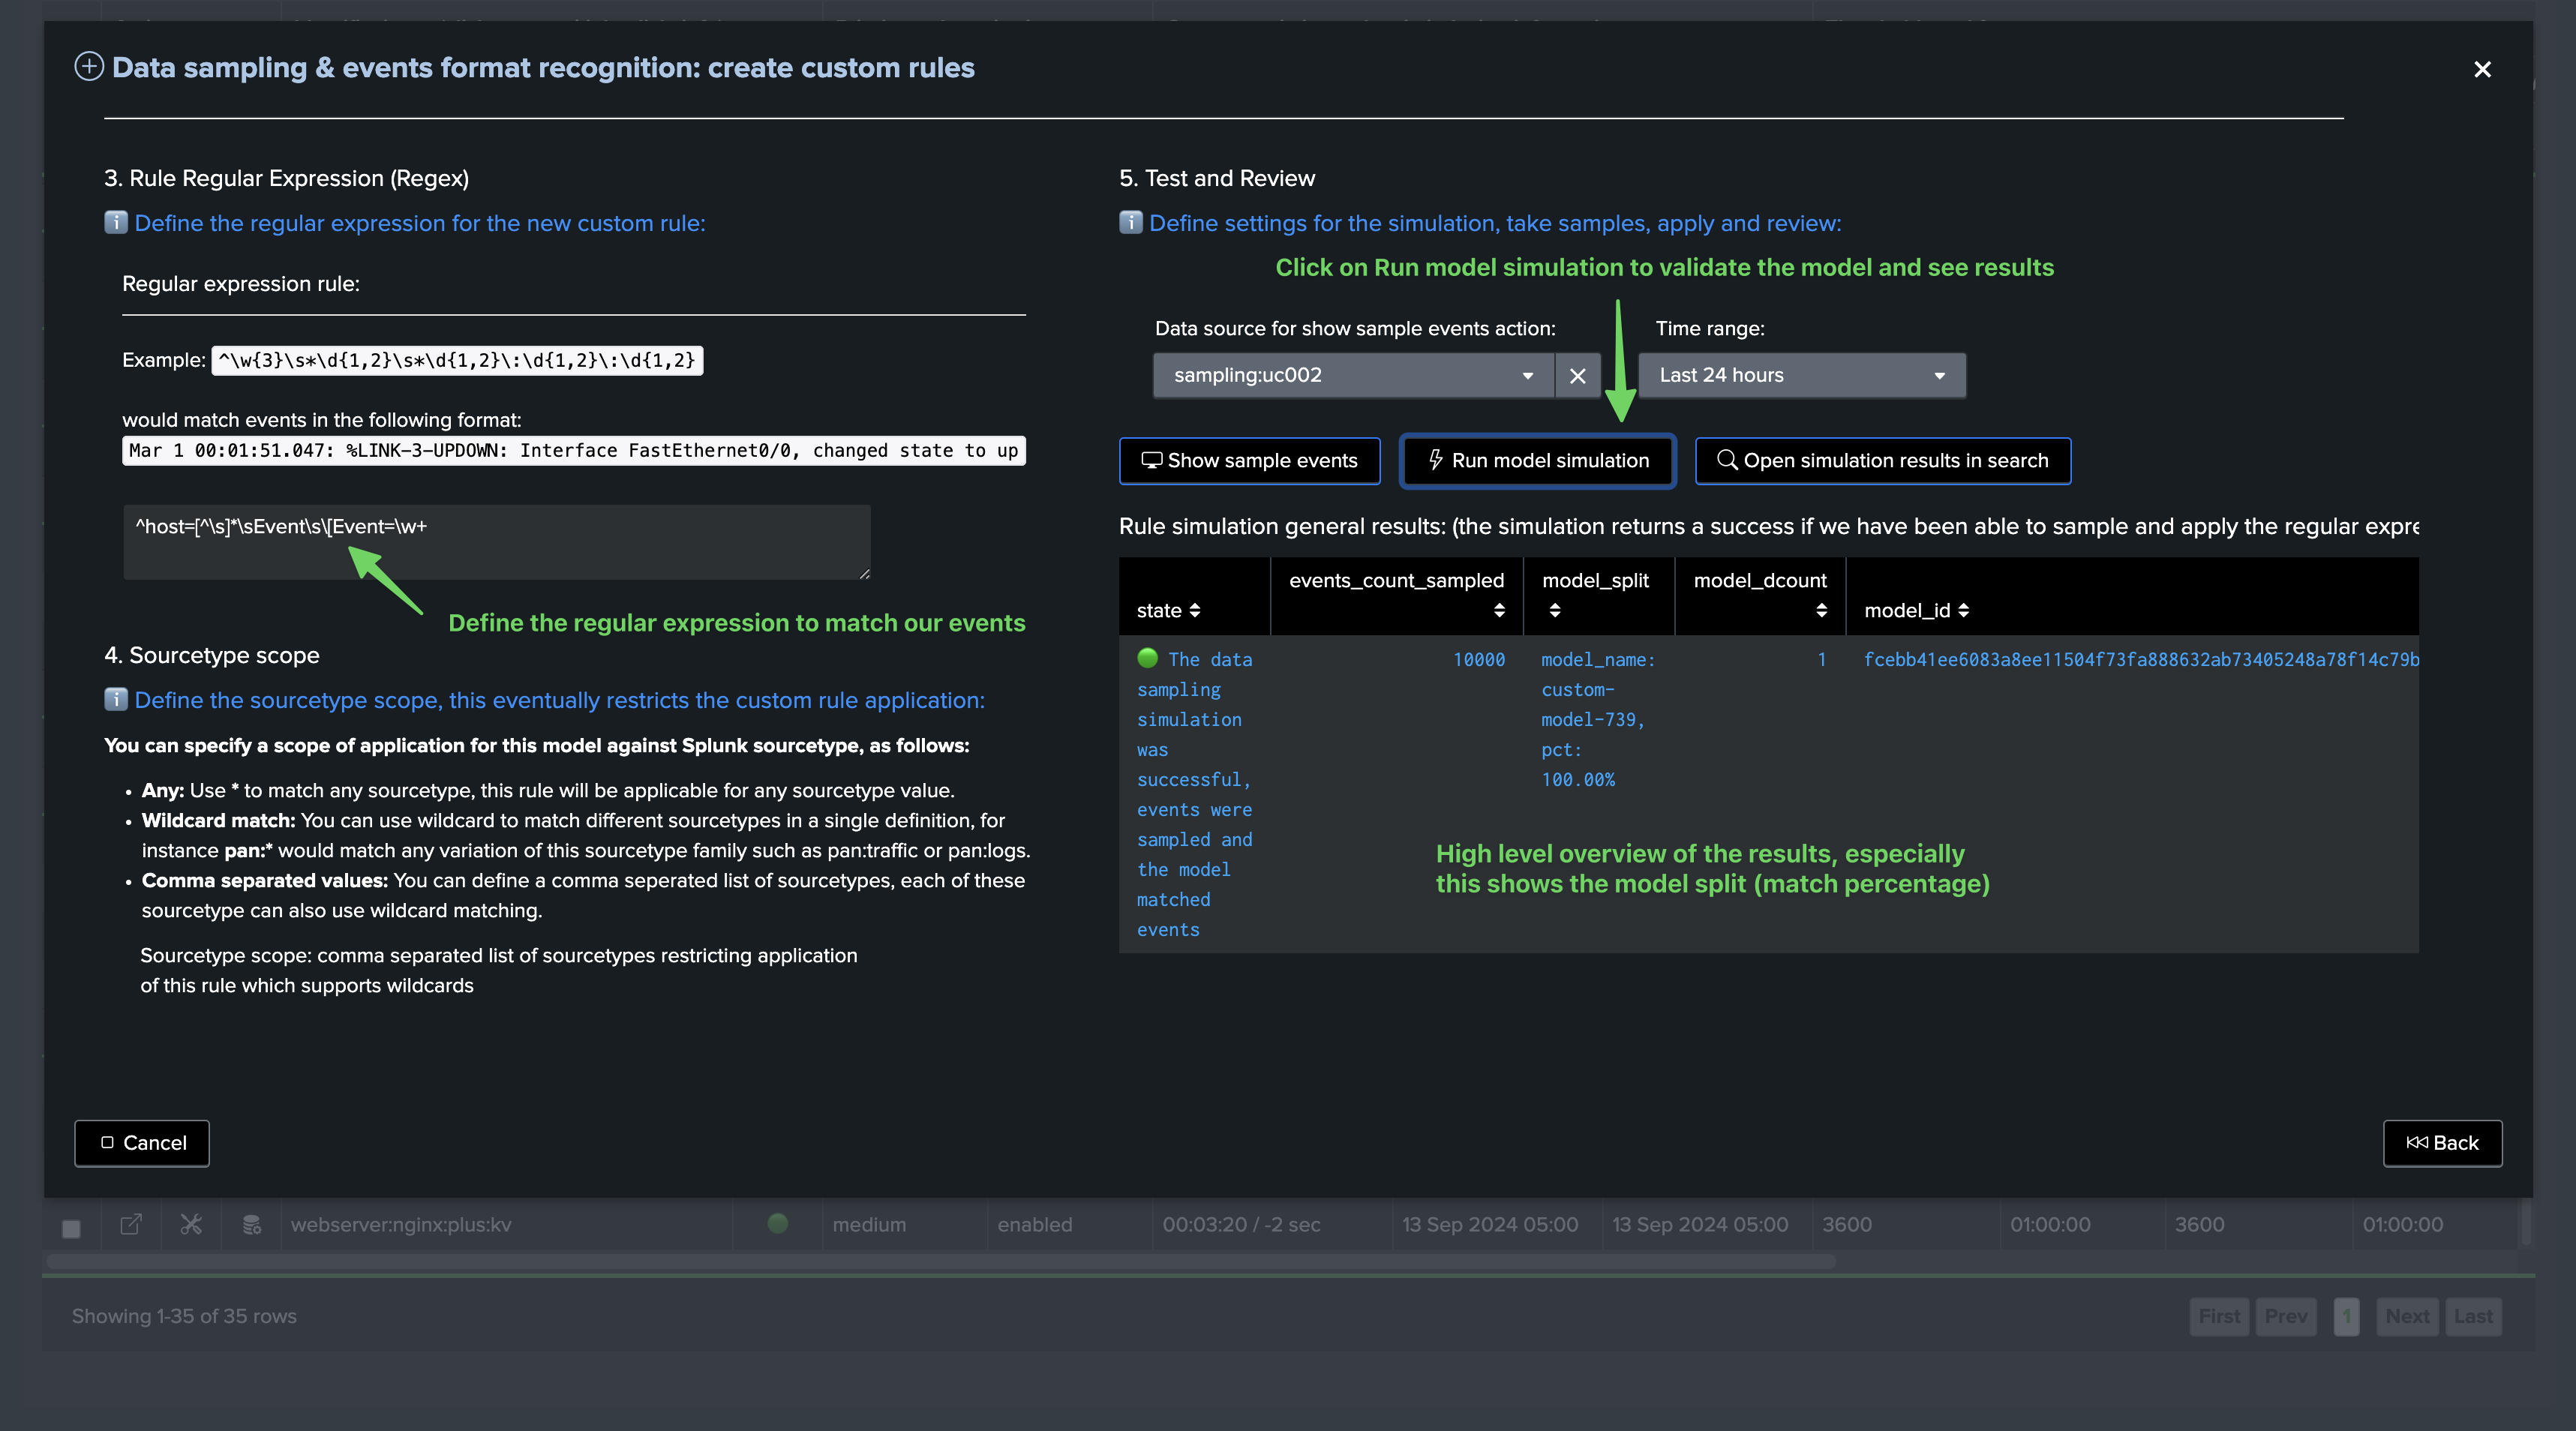
Define the regular expression for the model and click on “Run model simulation”, the top table shows the high-level overview of the model simulation and notably its matching percentage:
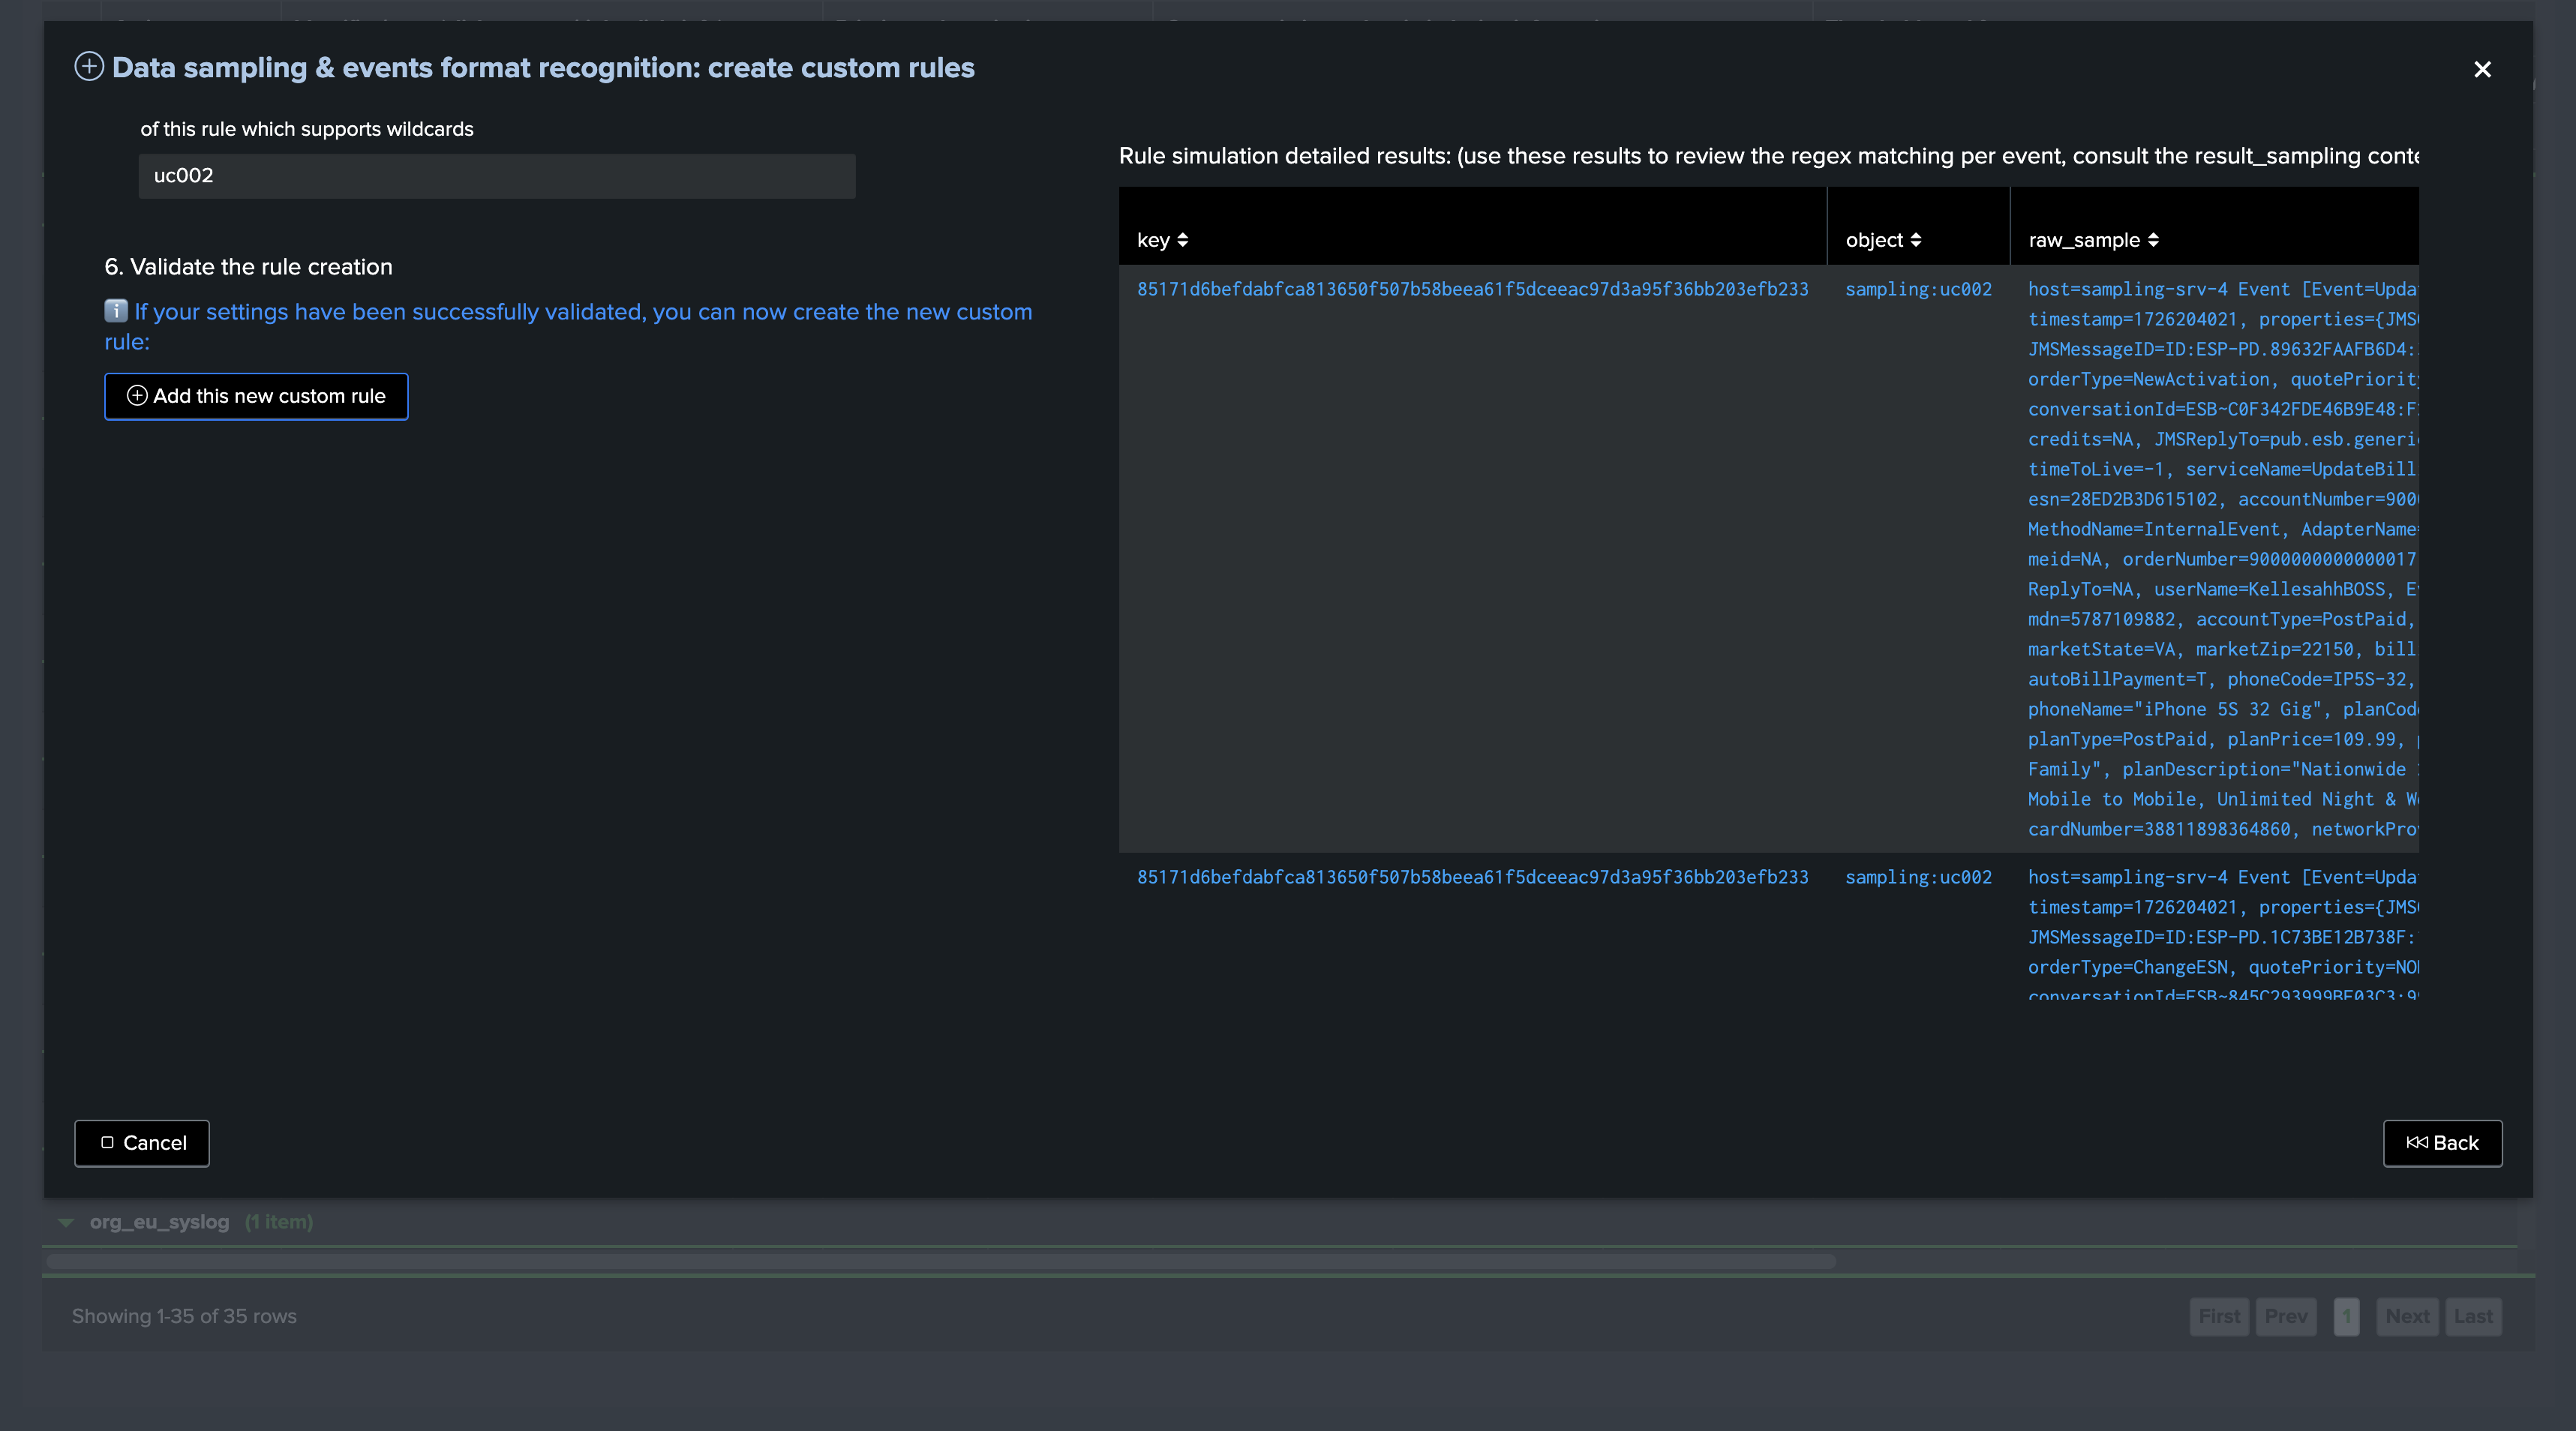
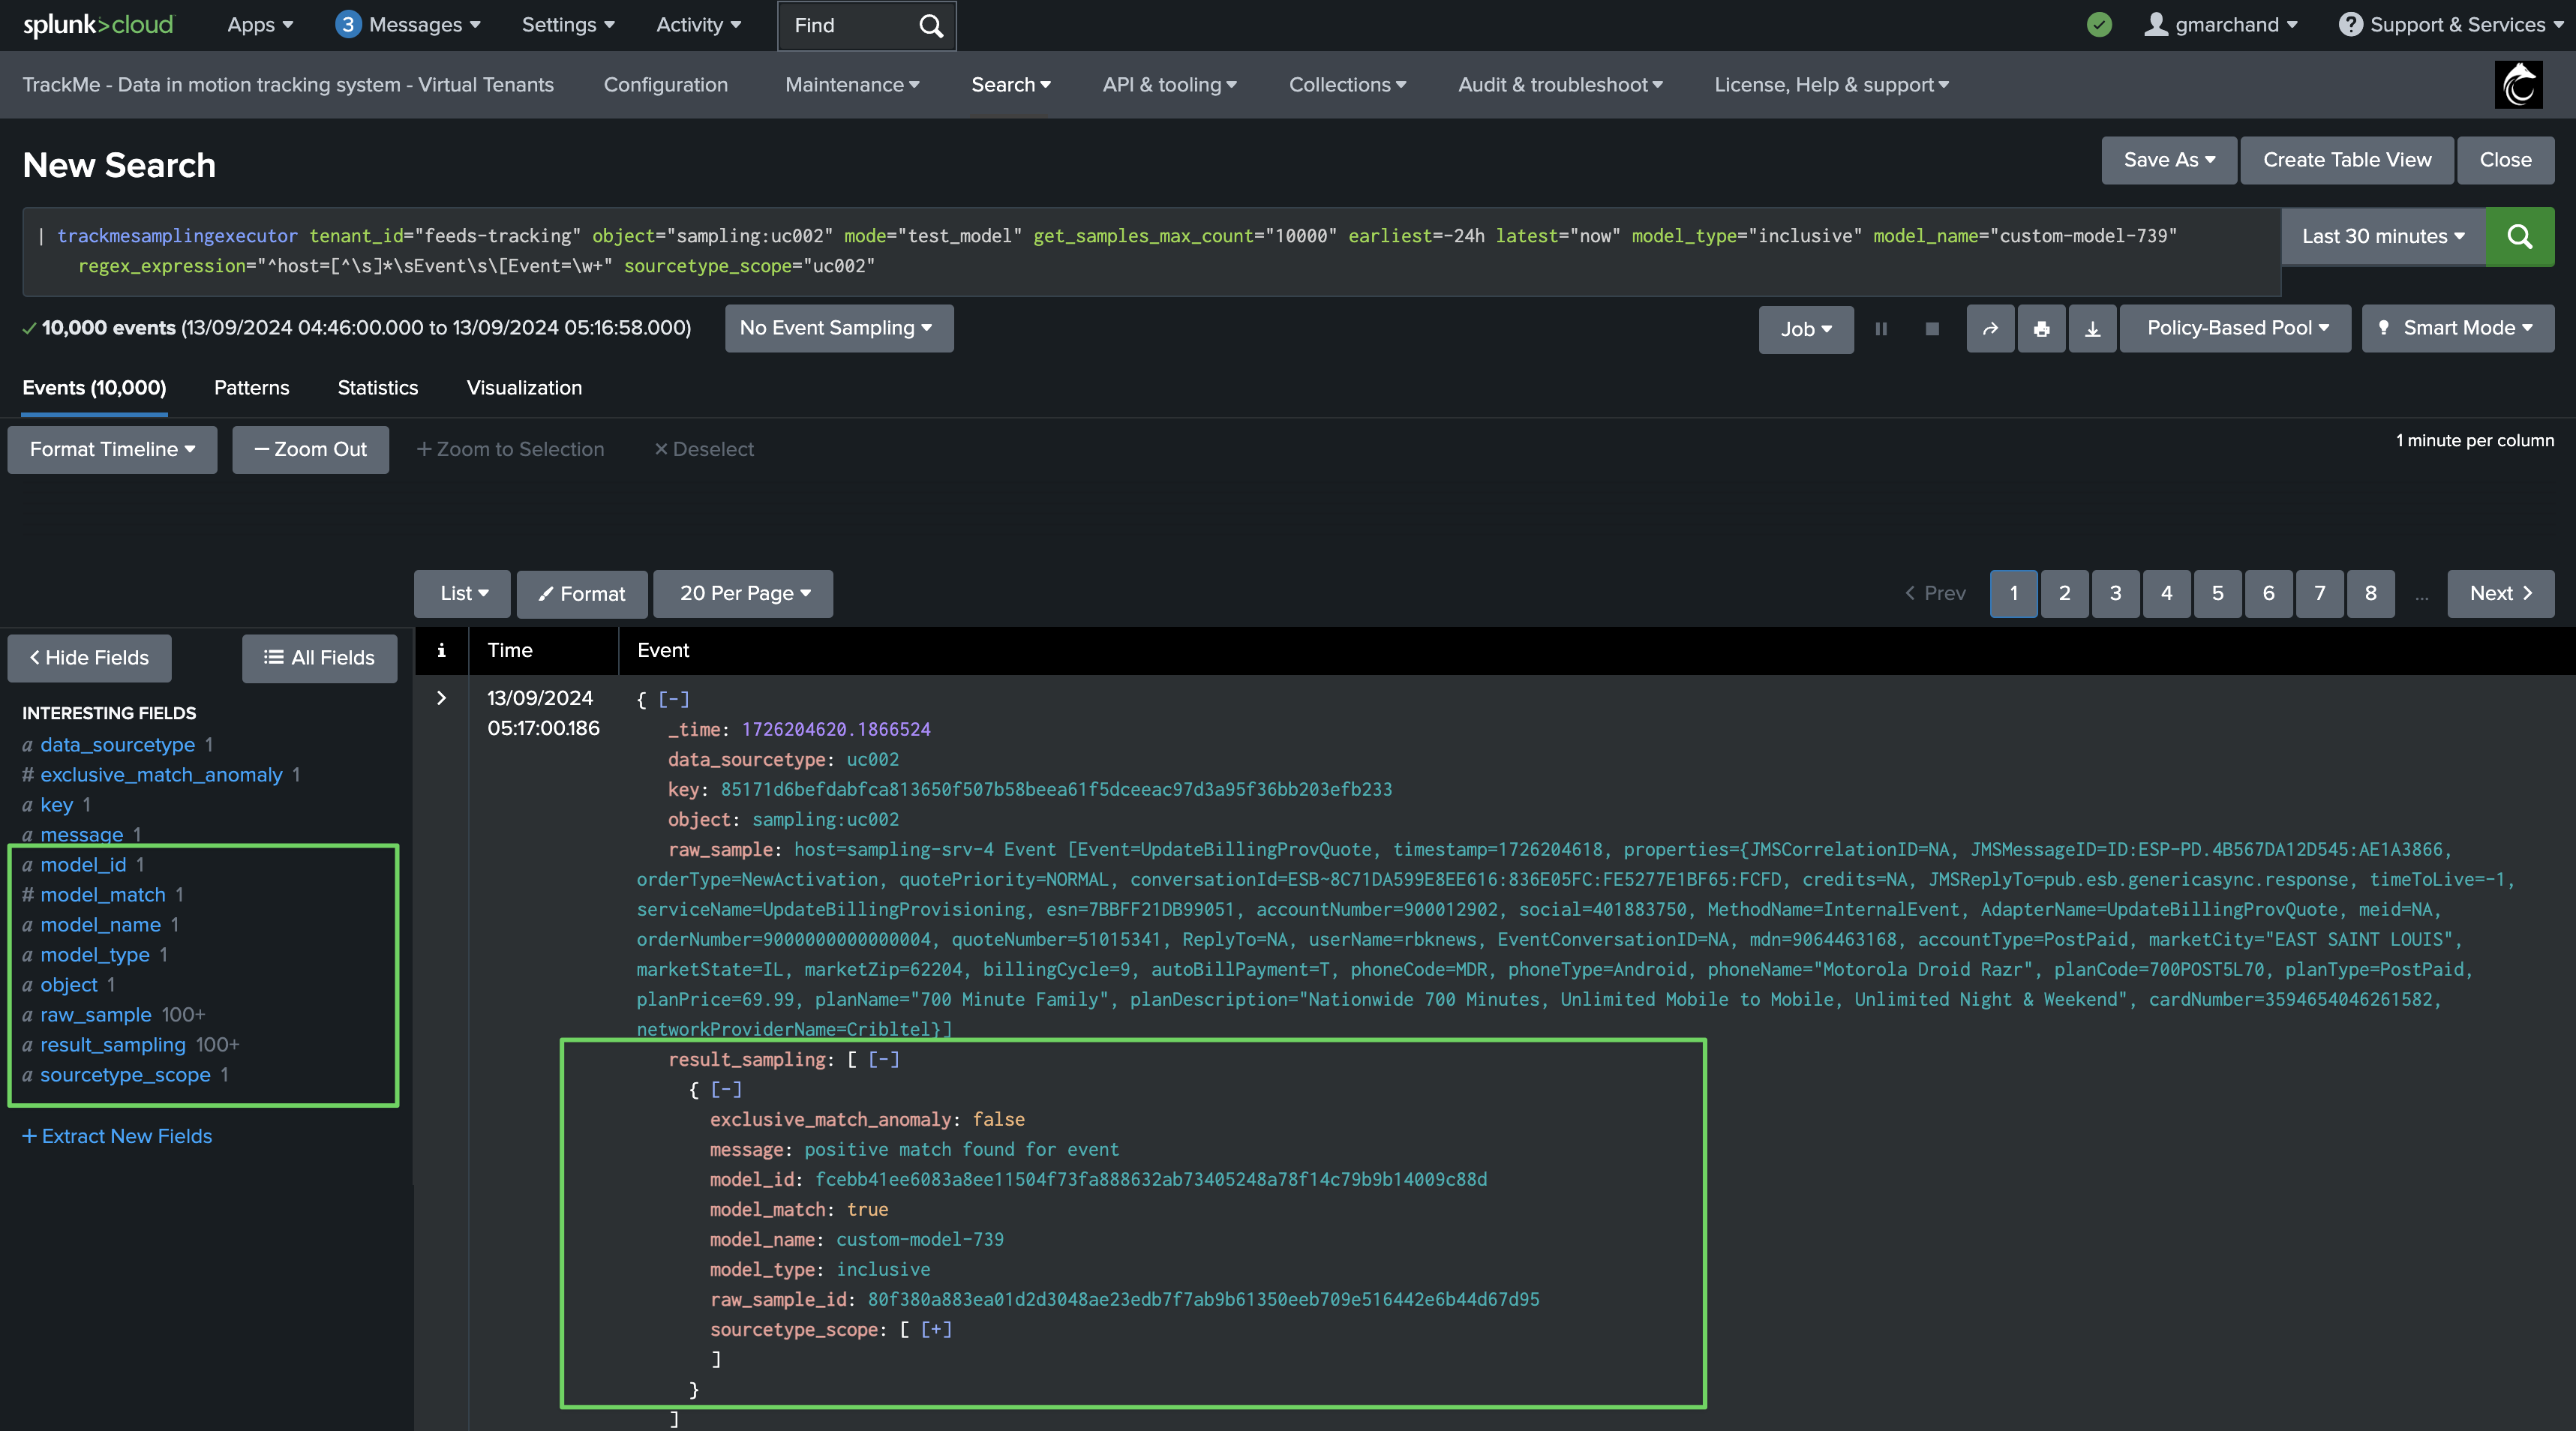
Scroll down to see the detailed result of the sampling exercise per event:
The overview table is powered by the following TrackMe command:
Notes: this command below shows the context for this simulation, tenant_id, object, sourcetype_scope, model_name and model_regex especially are dynamically defined based on your inputs
| trackmesamplingexecutor tenant_id="feeds-tracking" object="sampling:uc002" mode="test_model" get_samples_max_count="10000" earliest="-24h" latest="now" model_type="inclusive" model_name="custom-model-739" regex_expression="^host=[^\s]*\sEvent\s\[Event=\w+" sourcetype_scope="uc002" | `trackme_data_sampling_format_simulation_results`
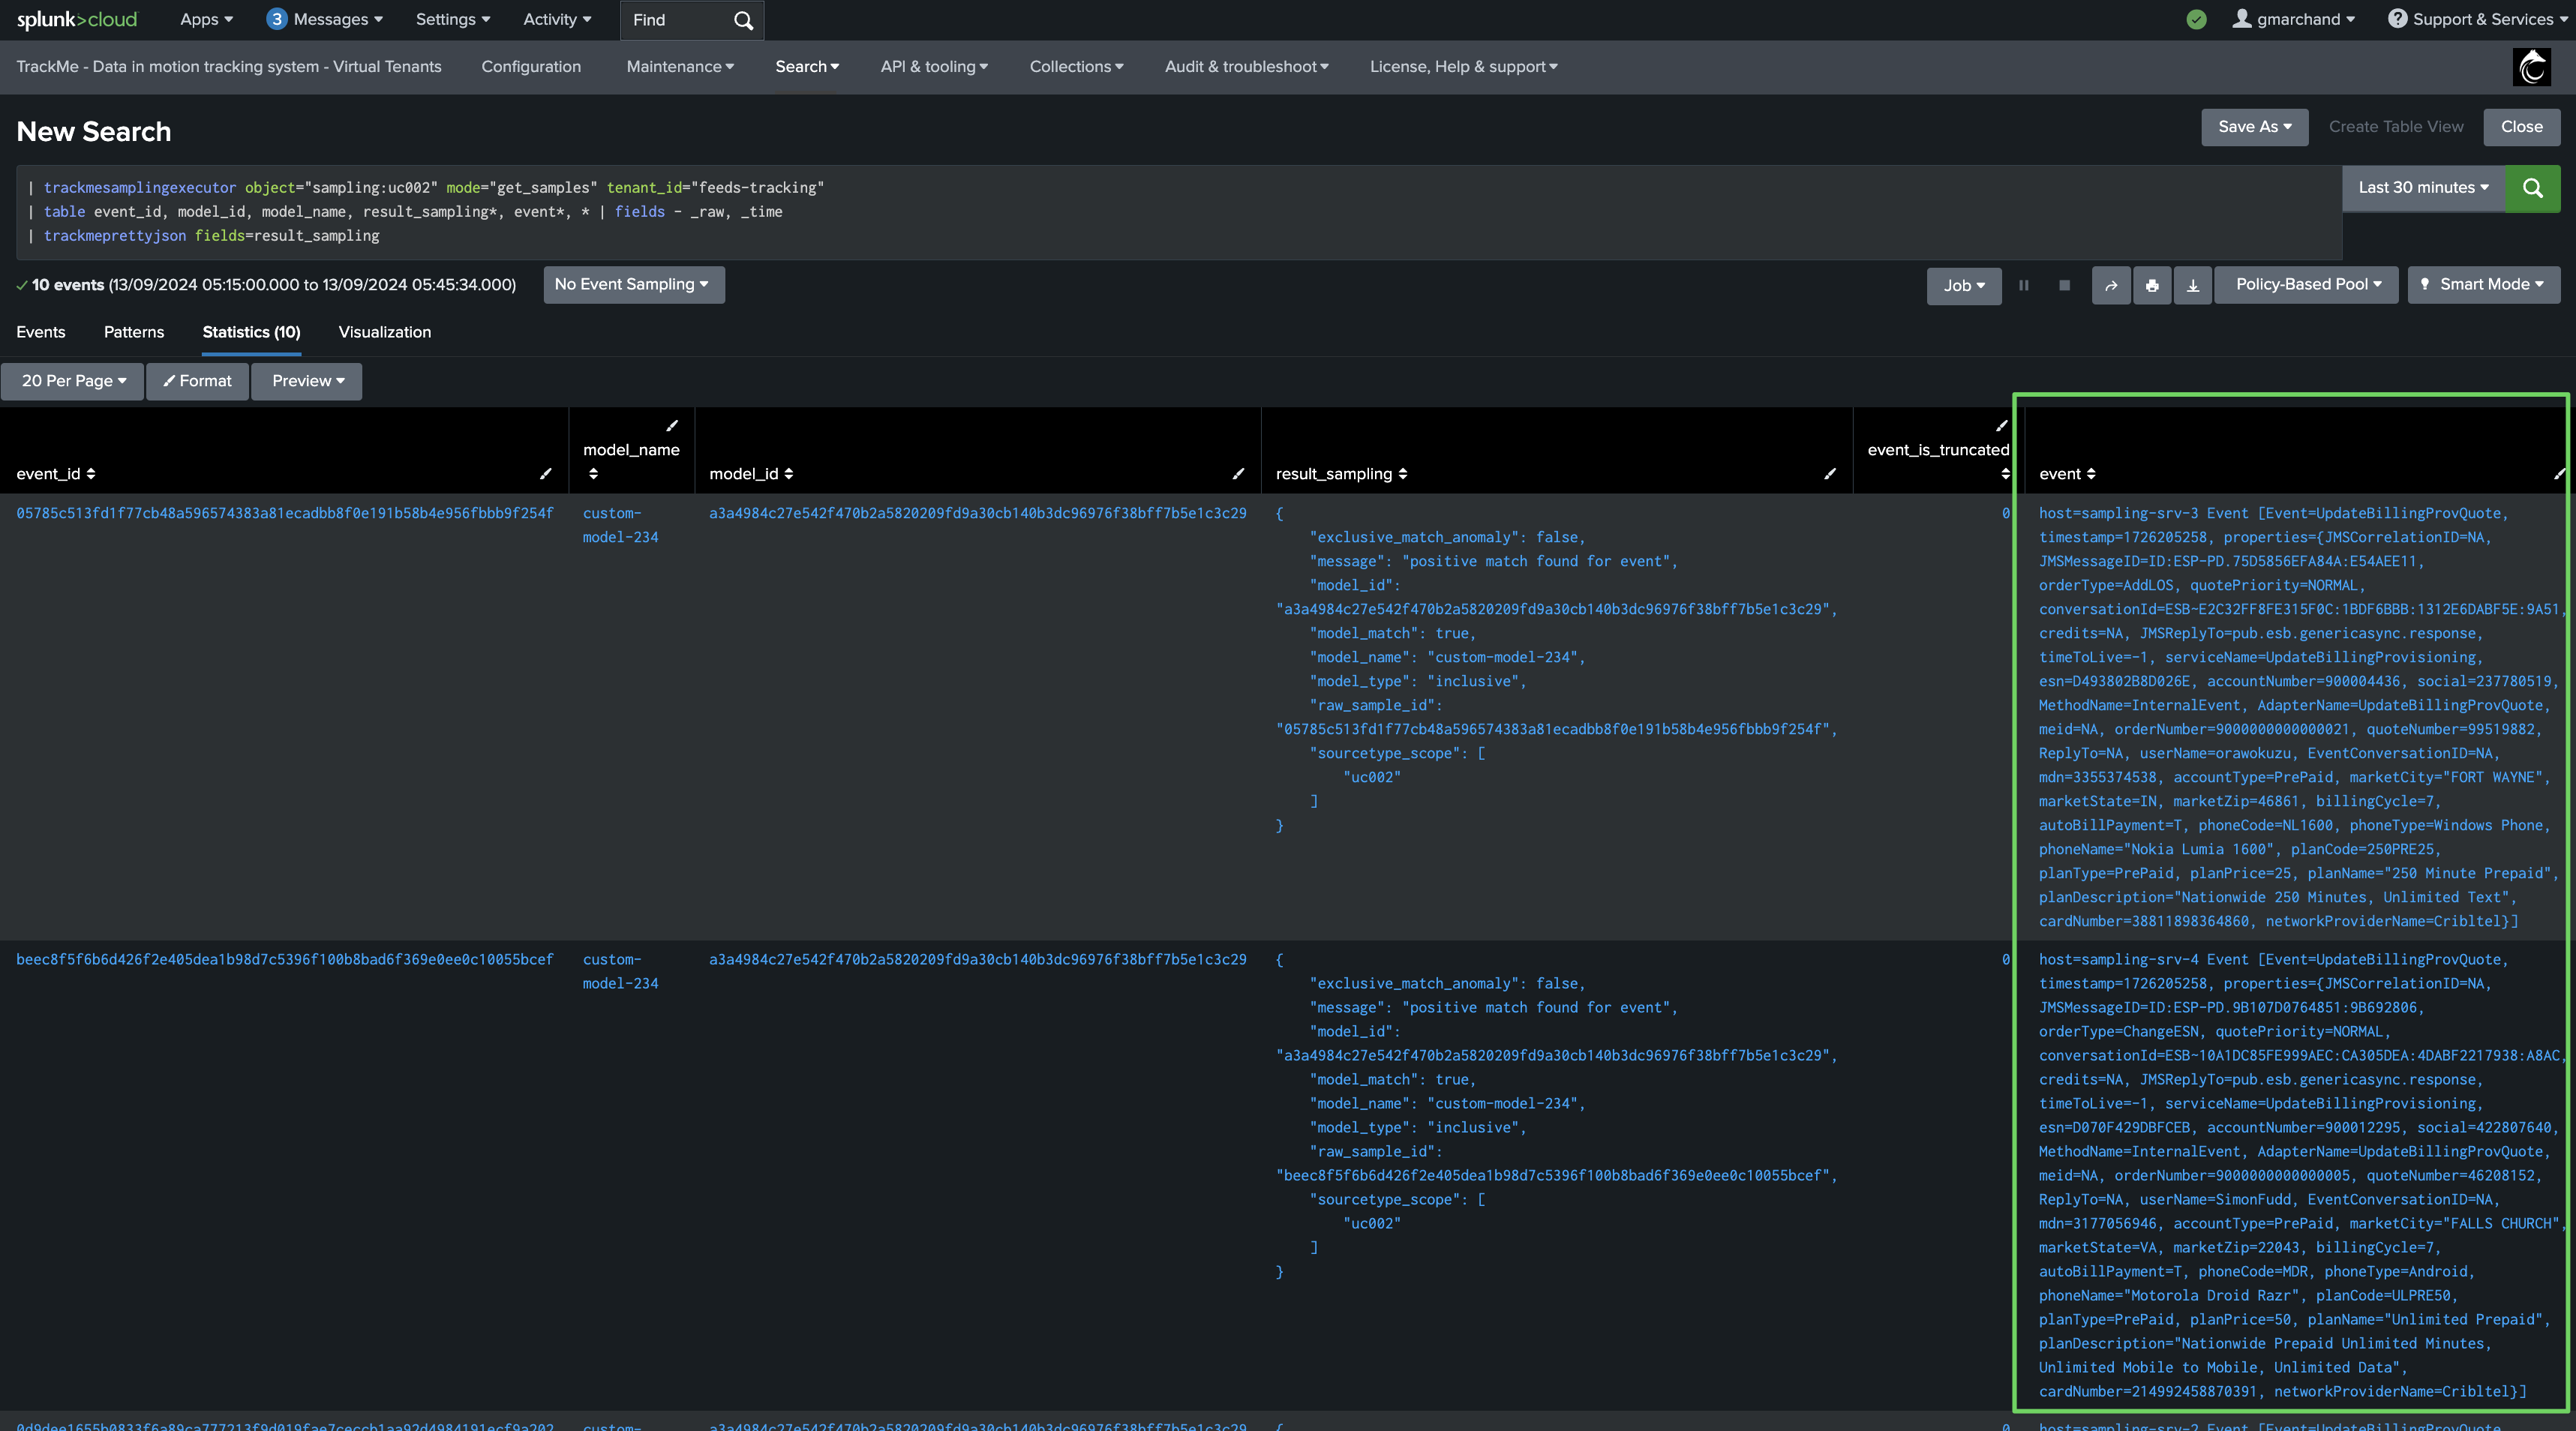
The detailed table is powered by the following TrackMe command:
| trackmesamplingexecutor tenant_id="feeds-tracking" object="sampling:uc002" mode="get_live_samples" get_samples_max_count="10000" earliest="-24h" latest="now"
You can click on “Open simulation results in search” to review results in Splunk search UI:
Finally, define the sourcetype scope and add the model:
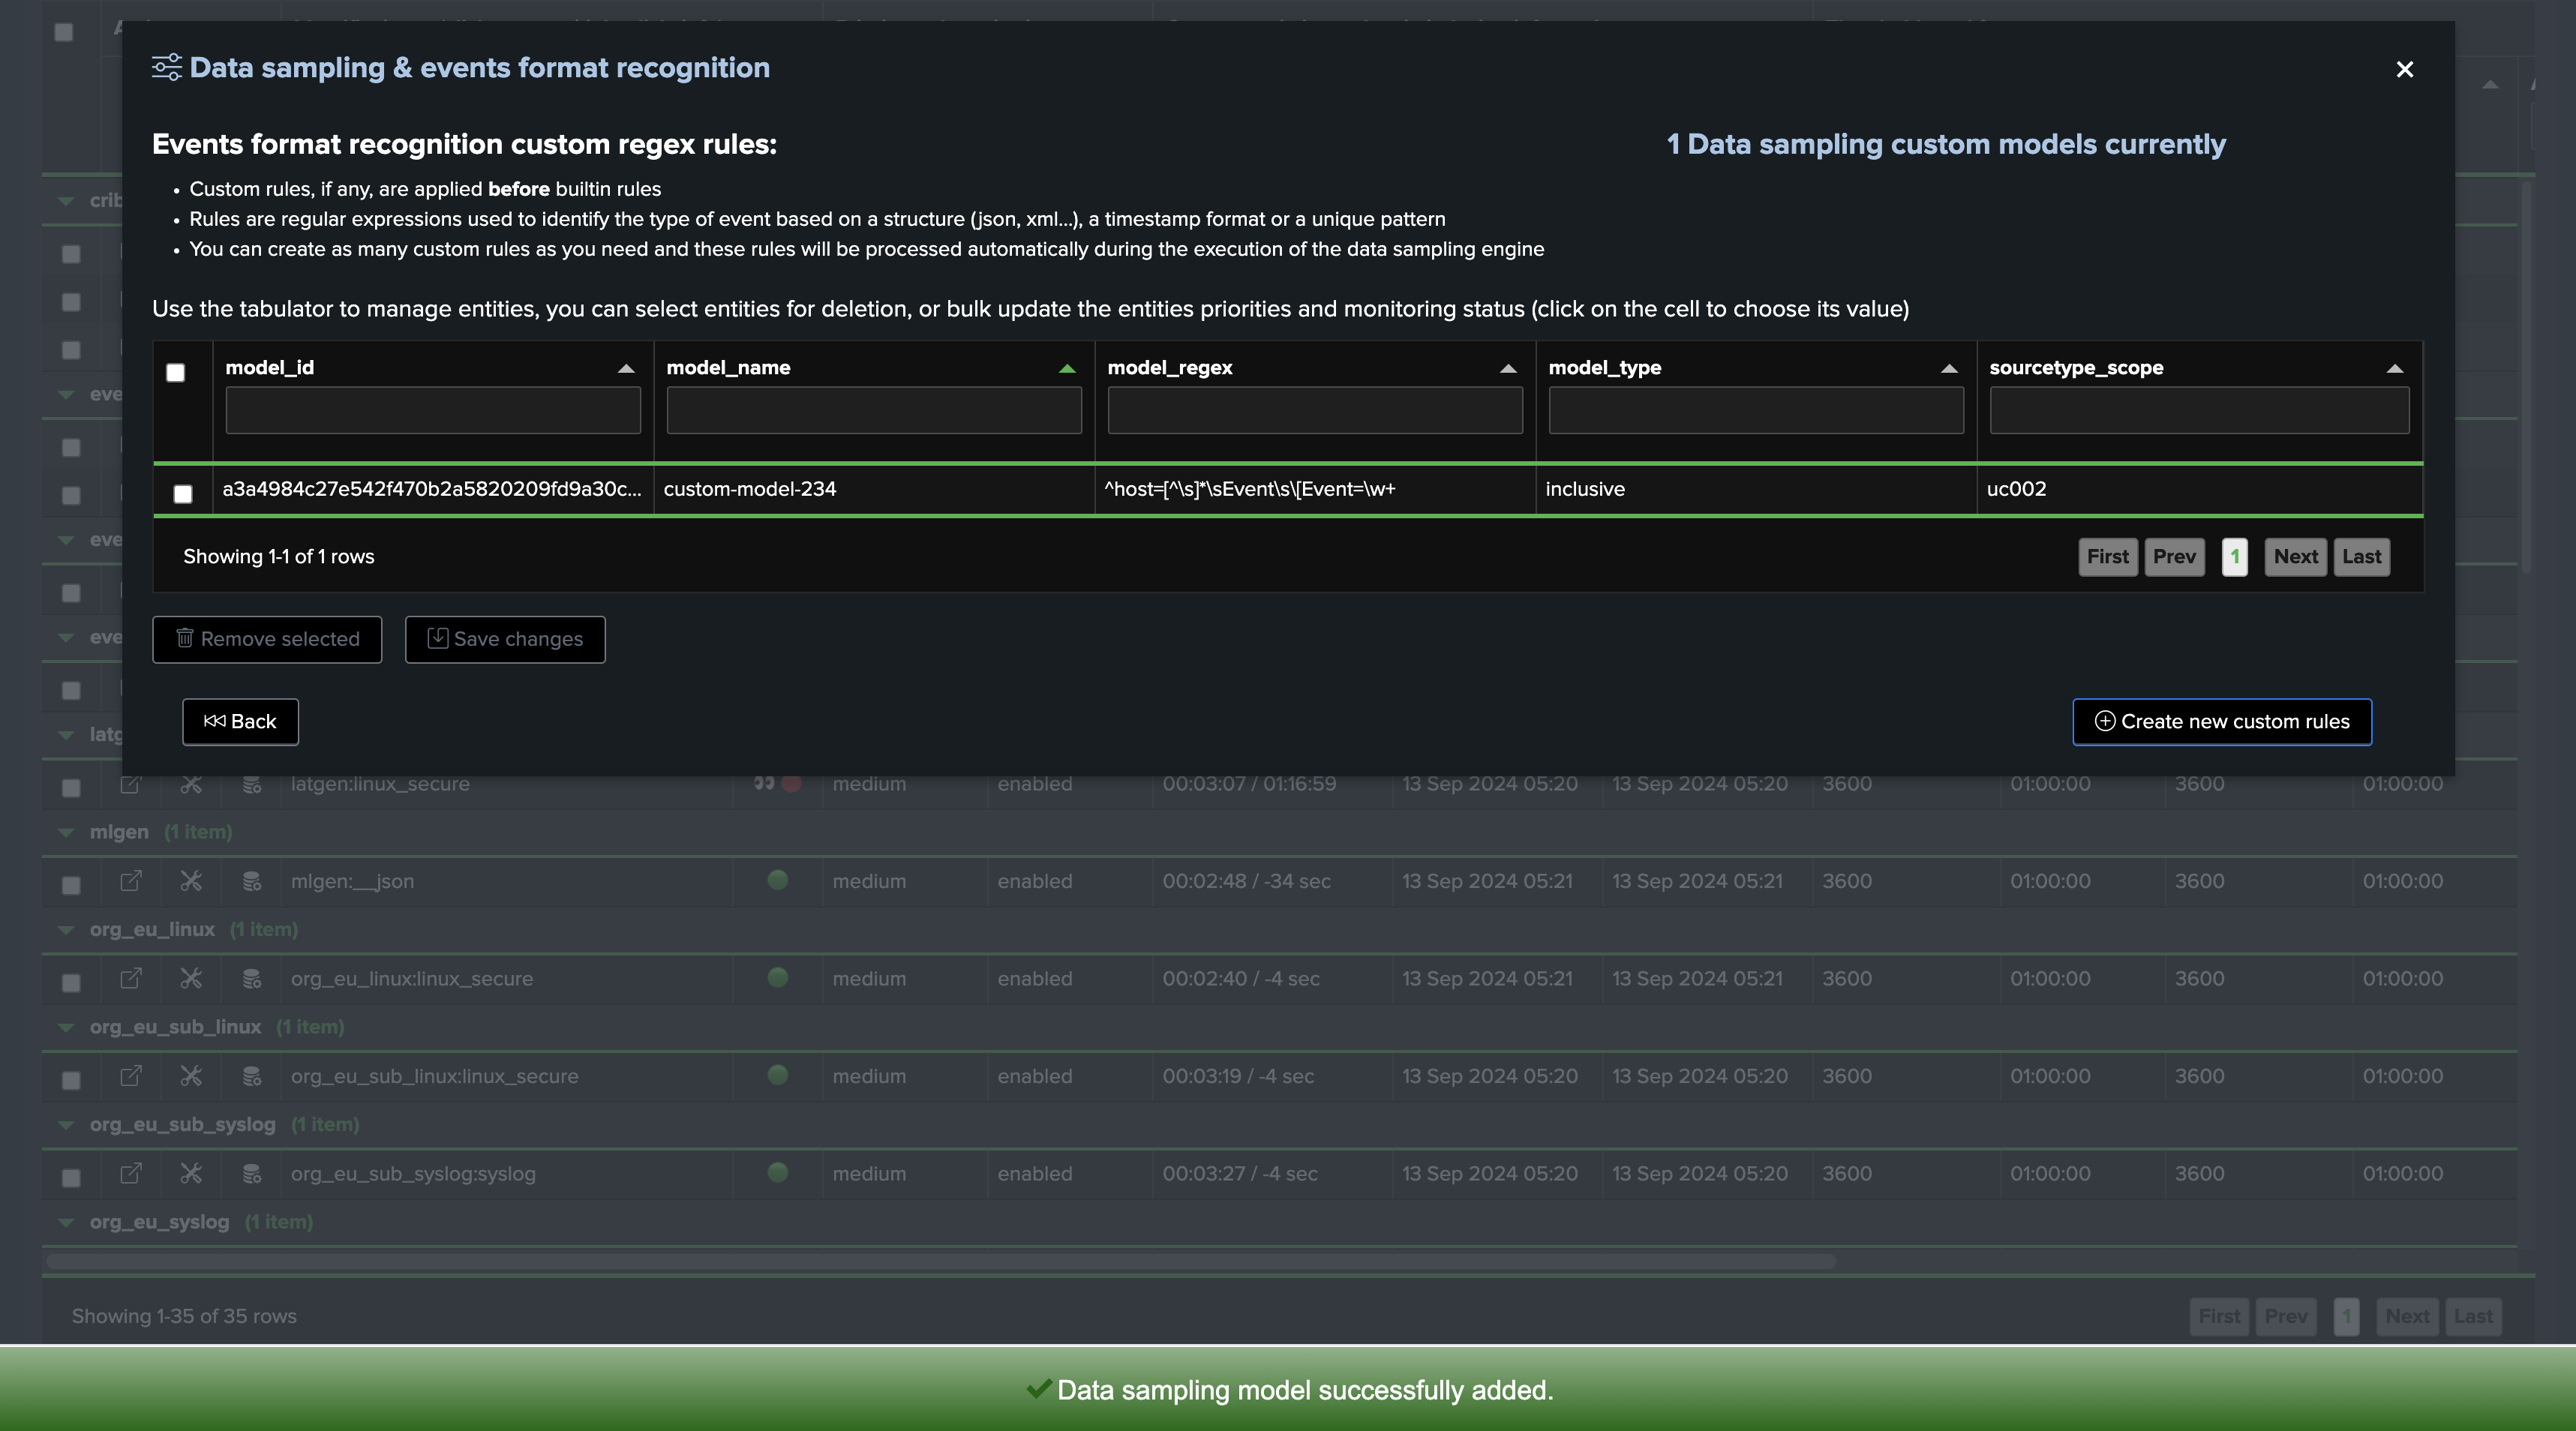
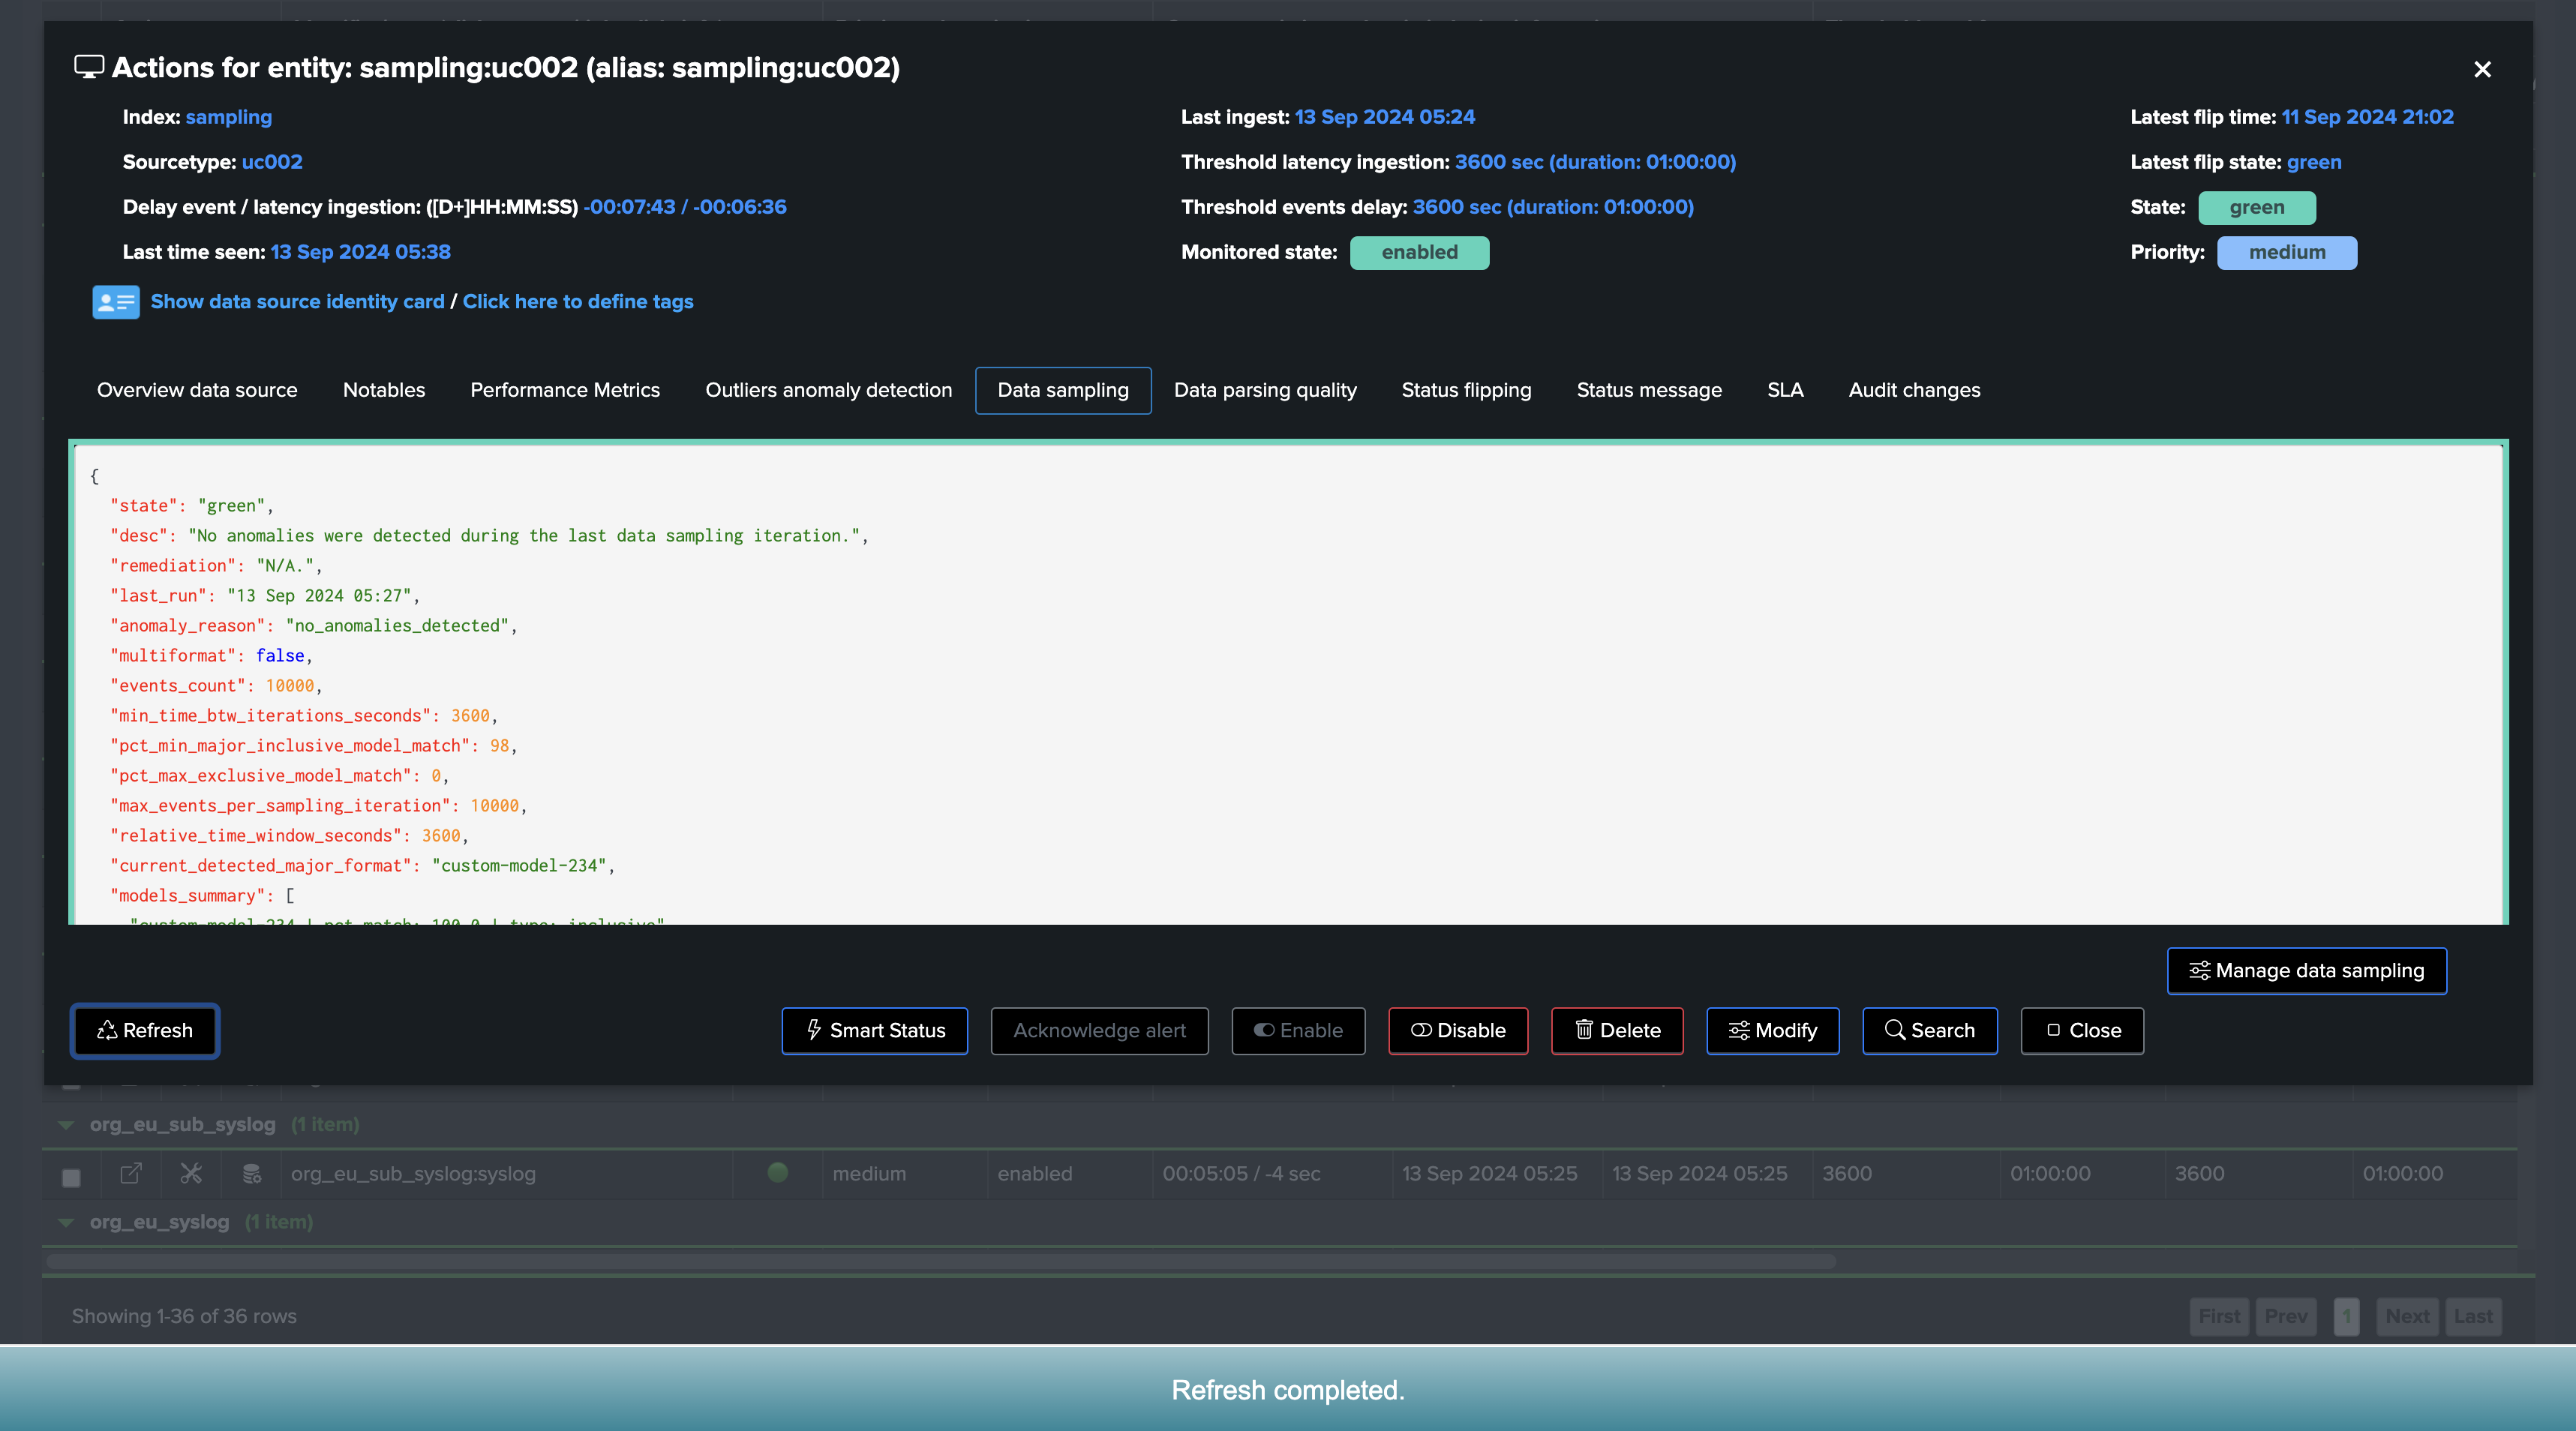
The model has been added, we can request a manual execution so the model is applied immediately:
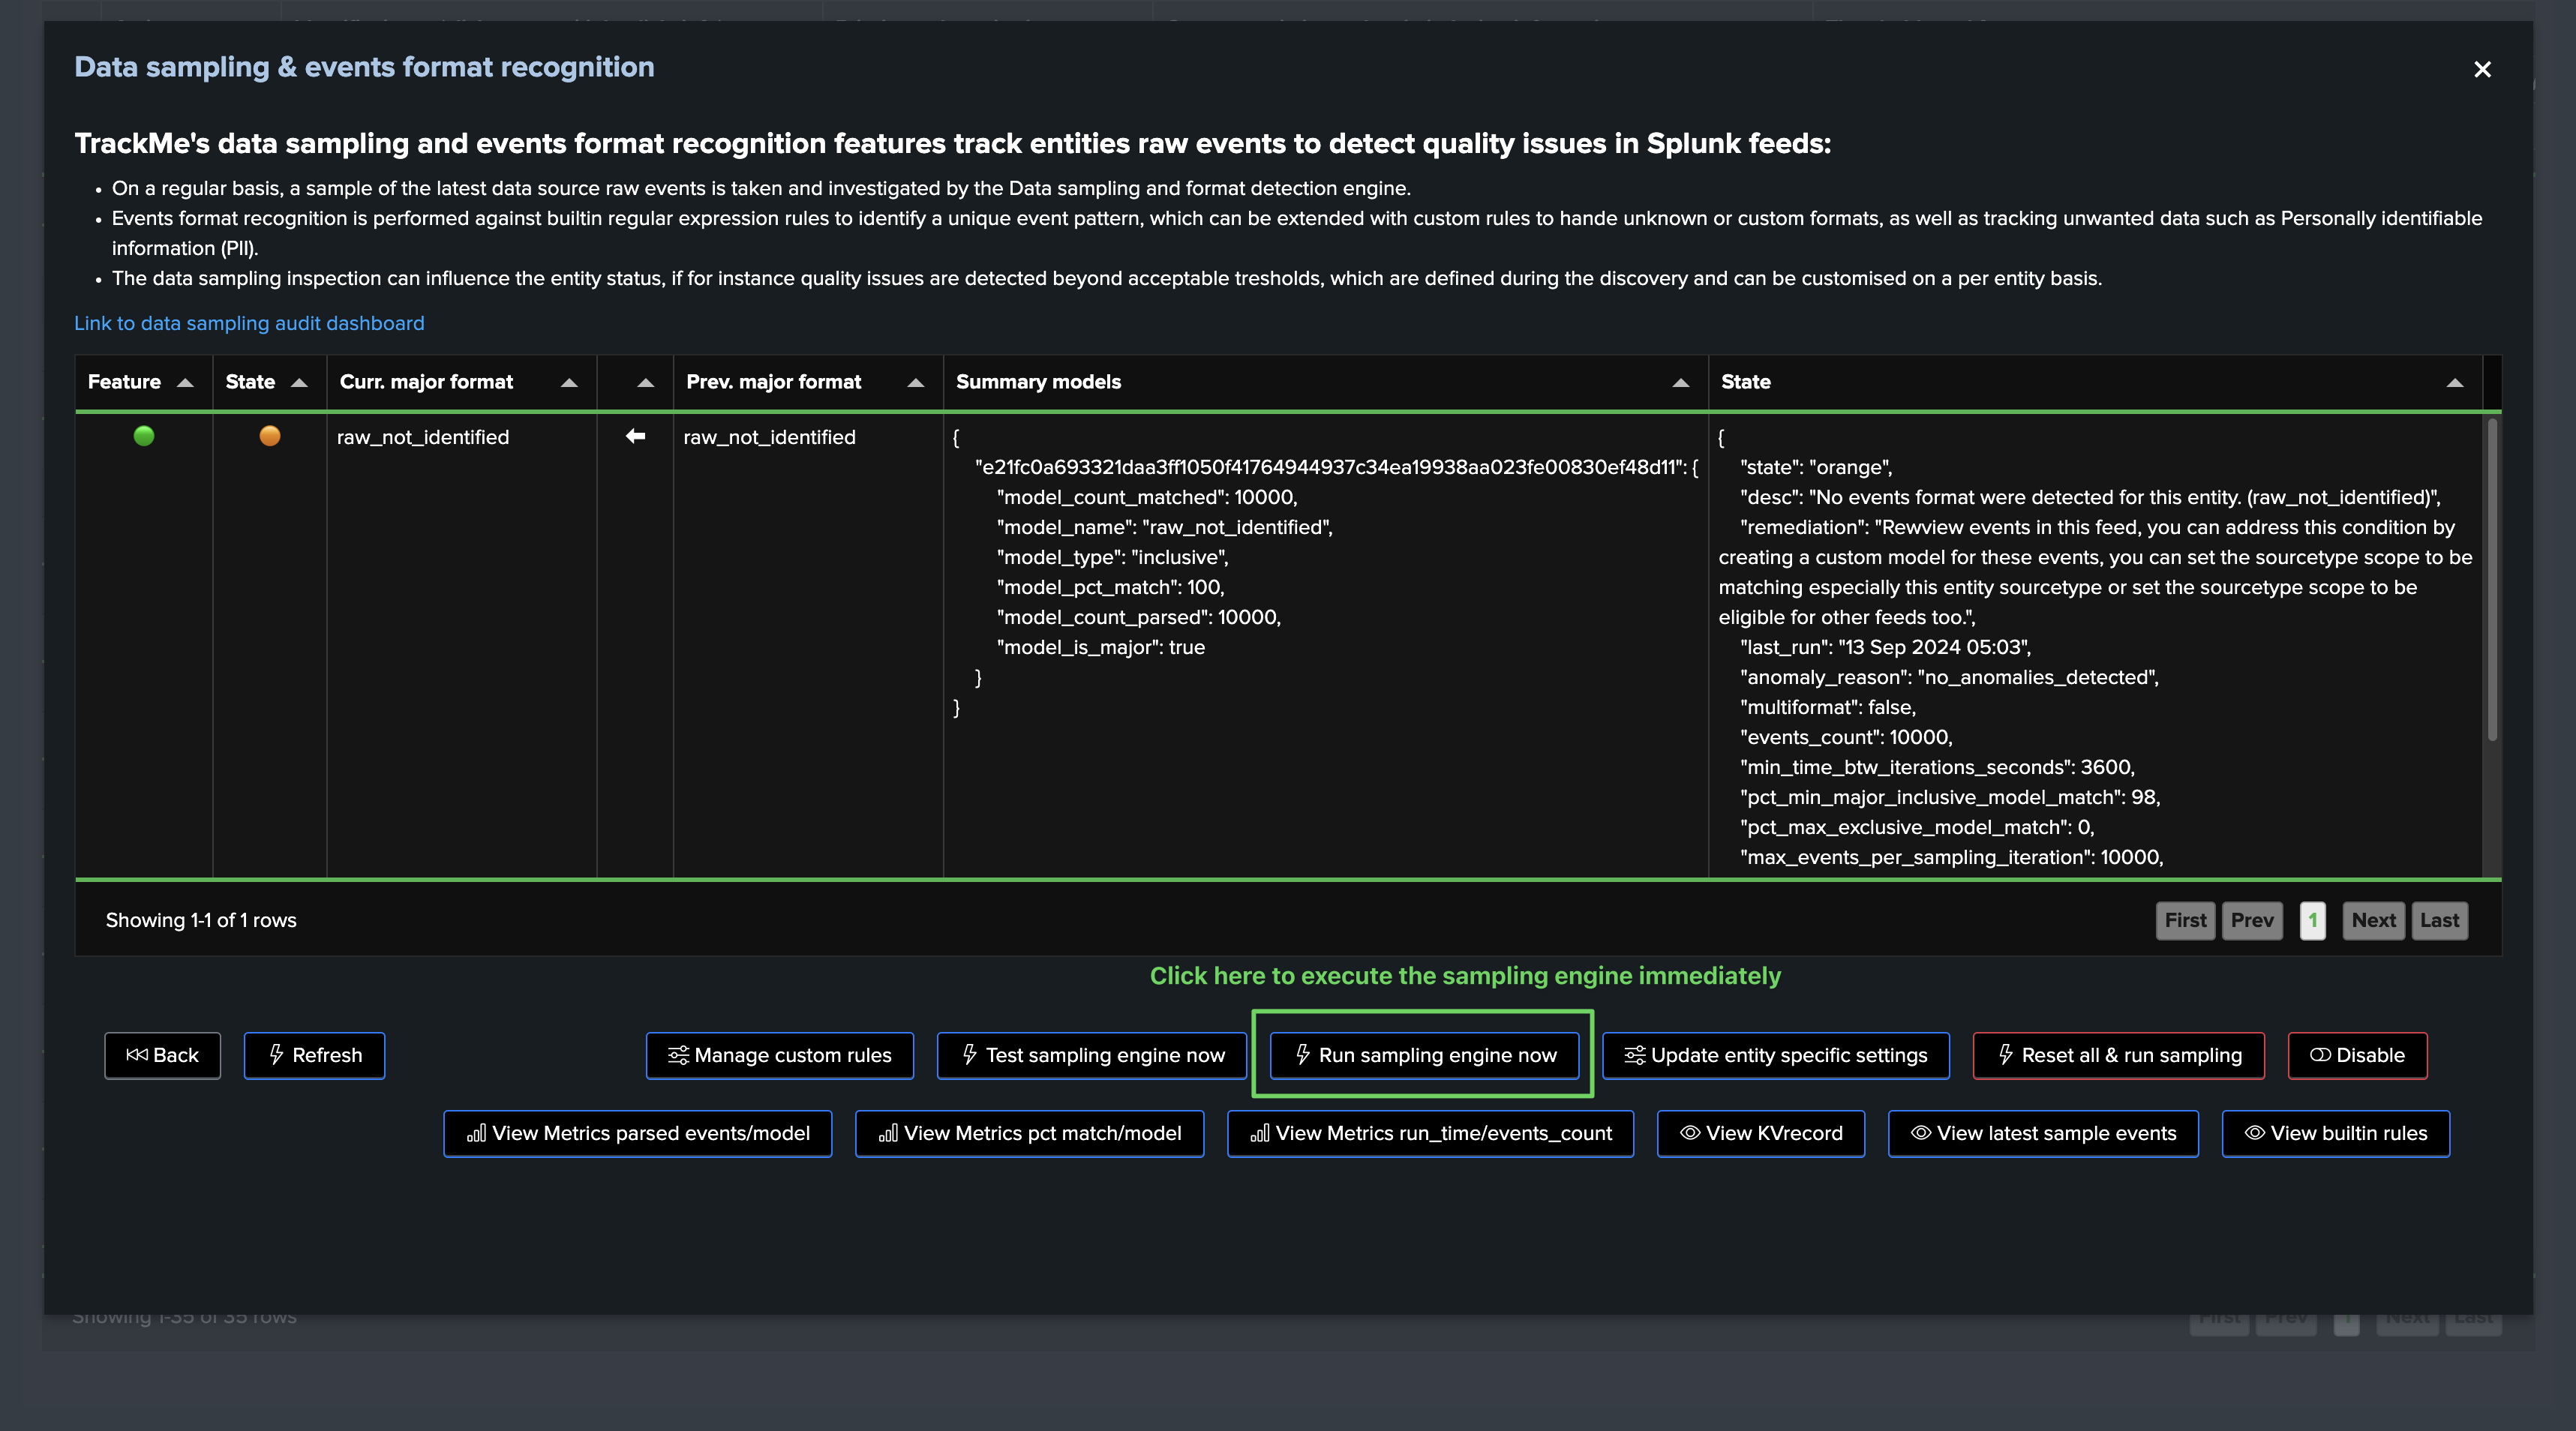
Once executed, the engine took our new model into account, the sampling results updates the status and from this stage, sampling is operational and tracking events for this entity:
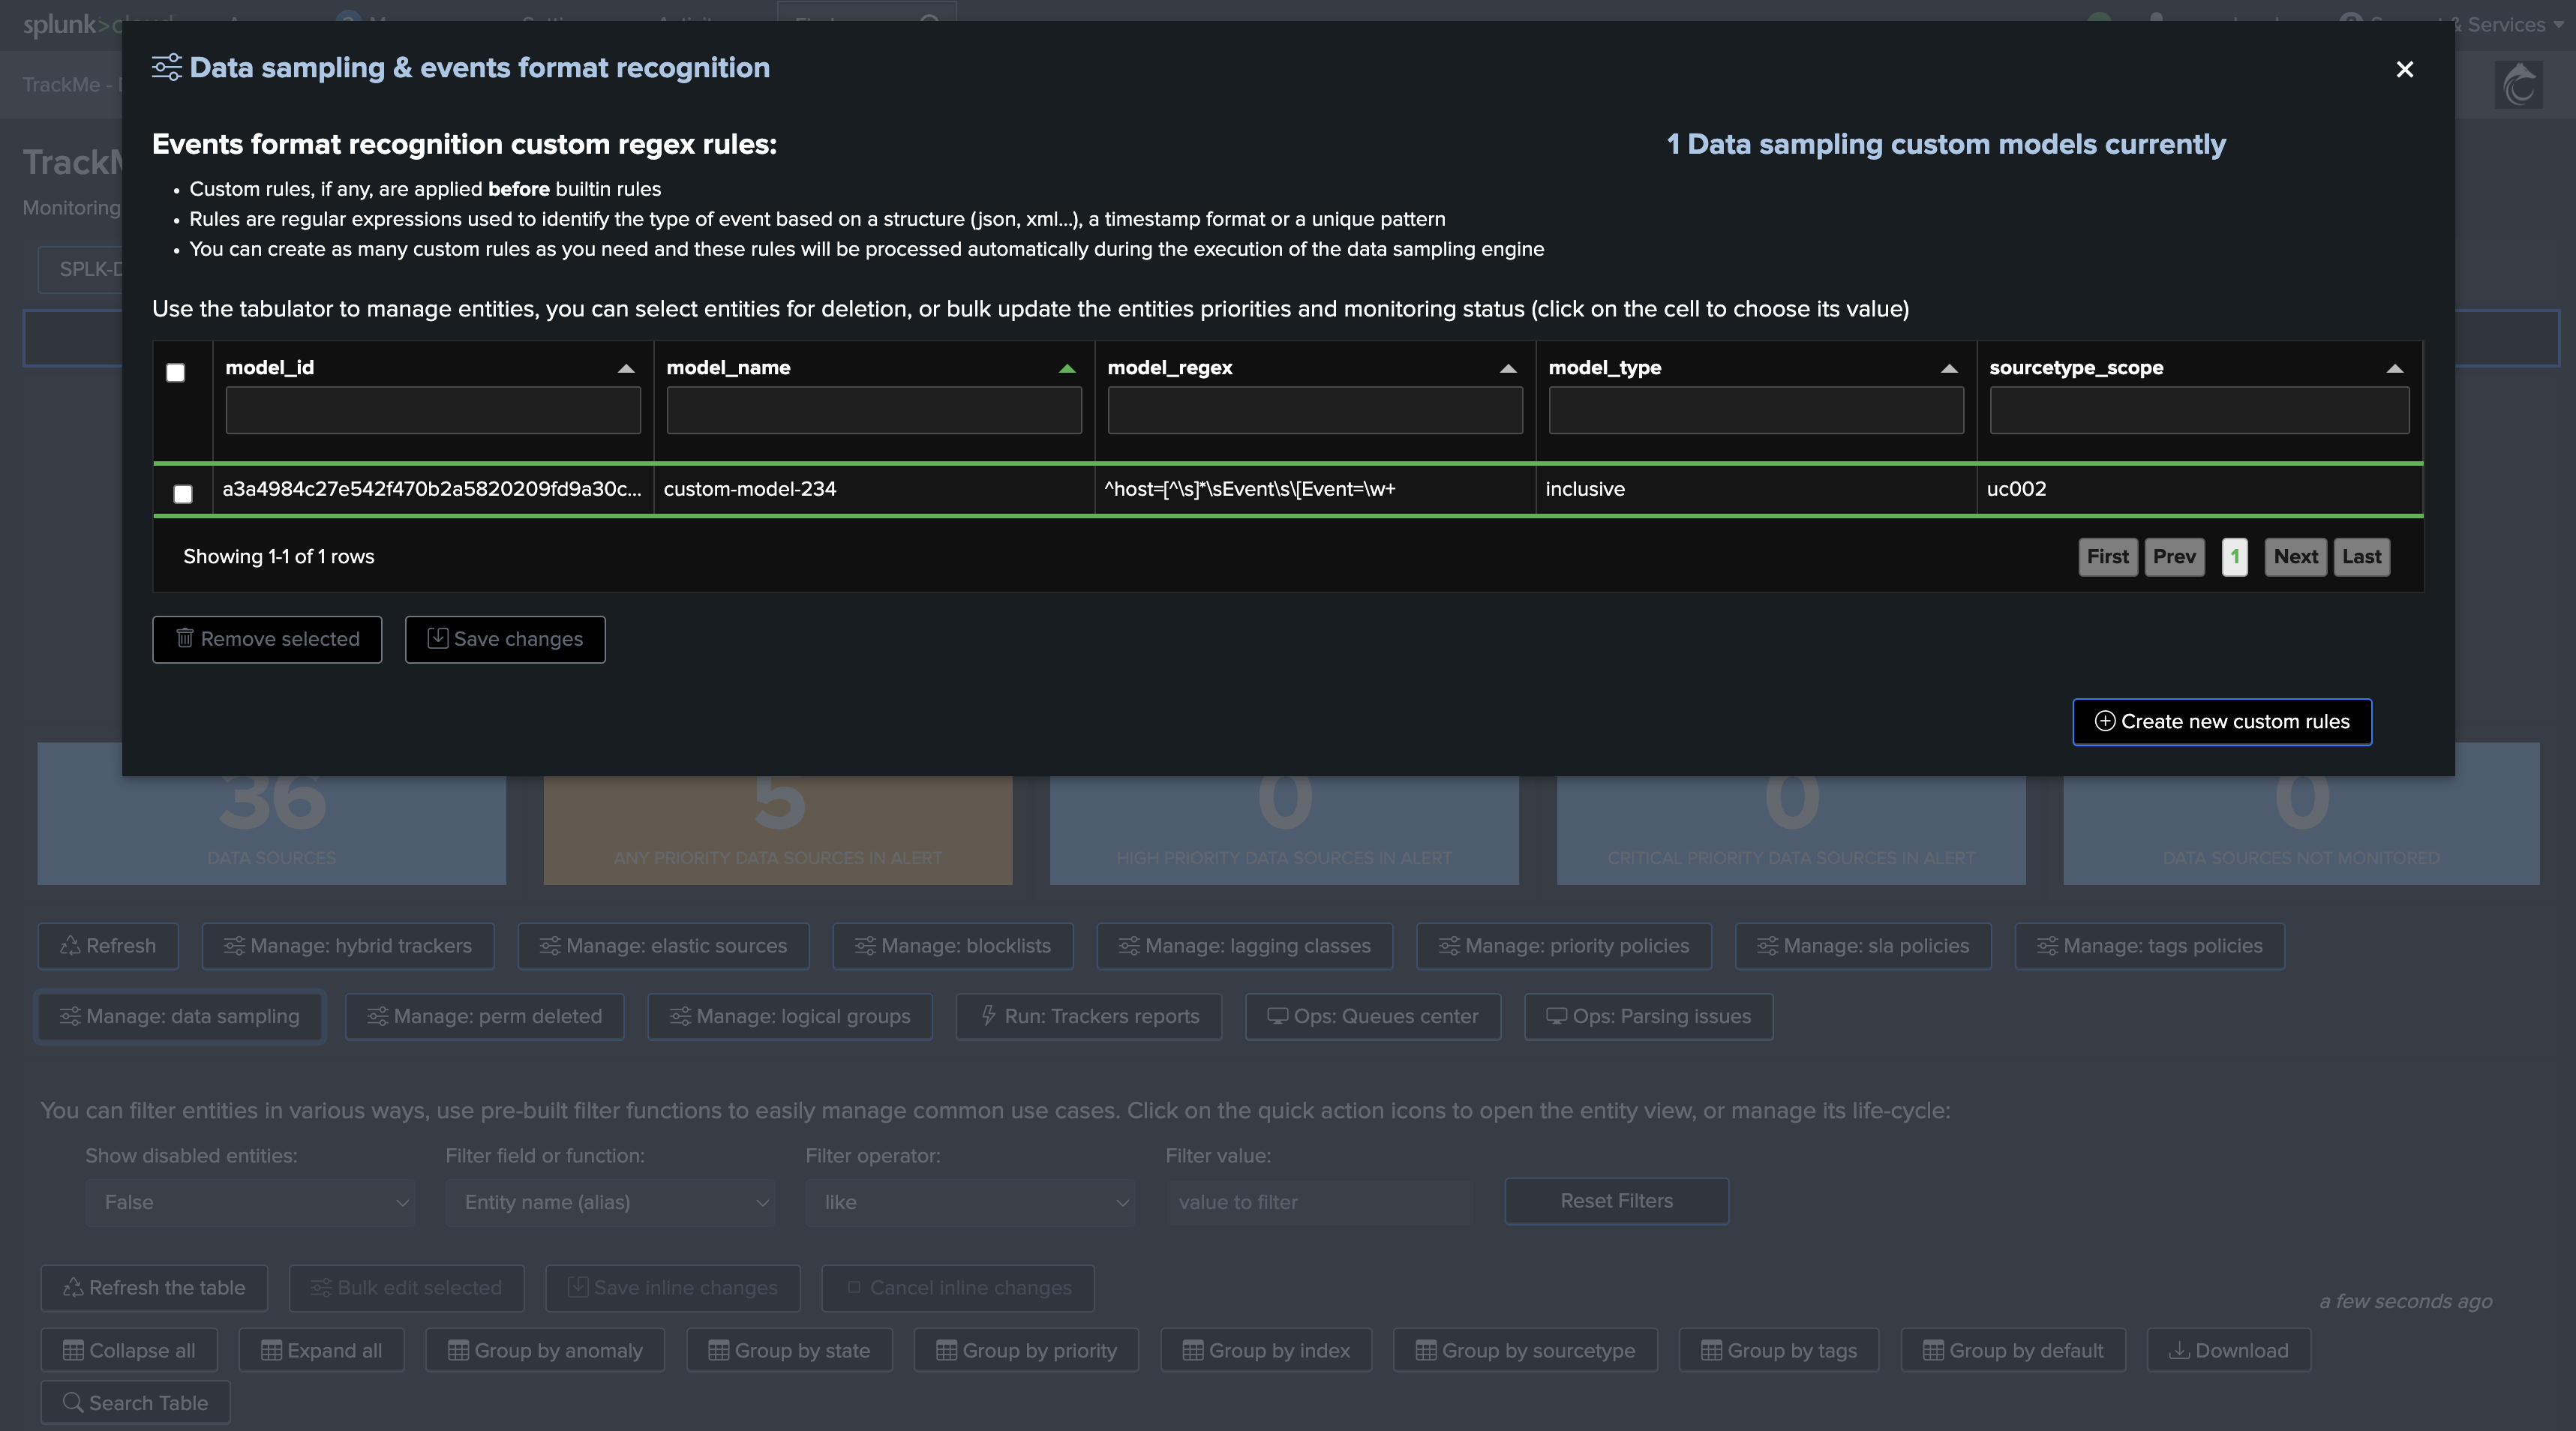
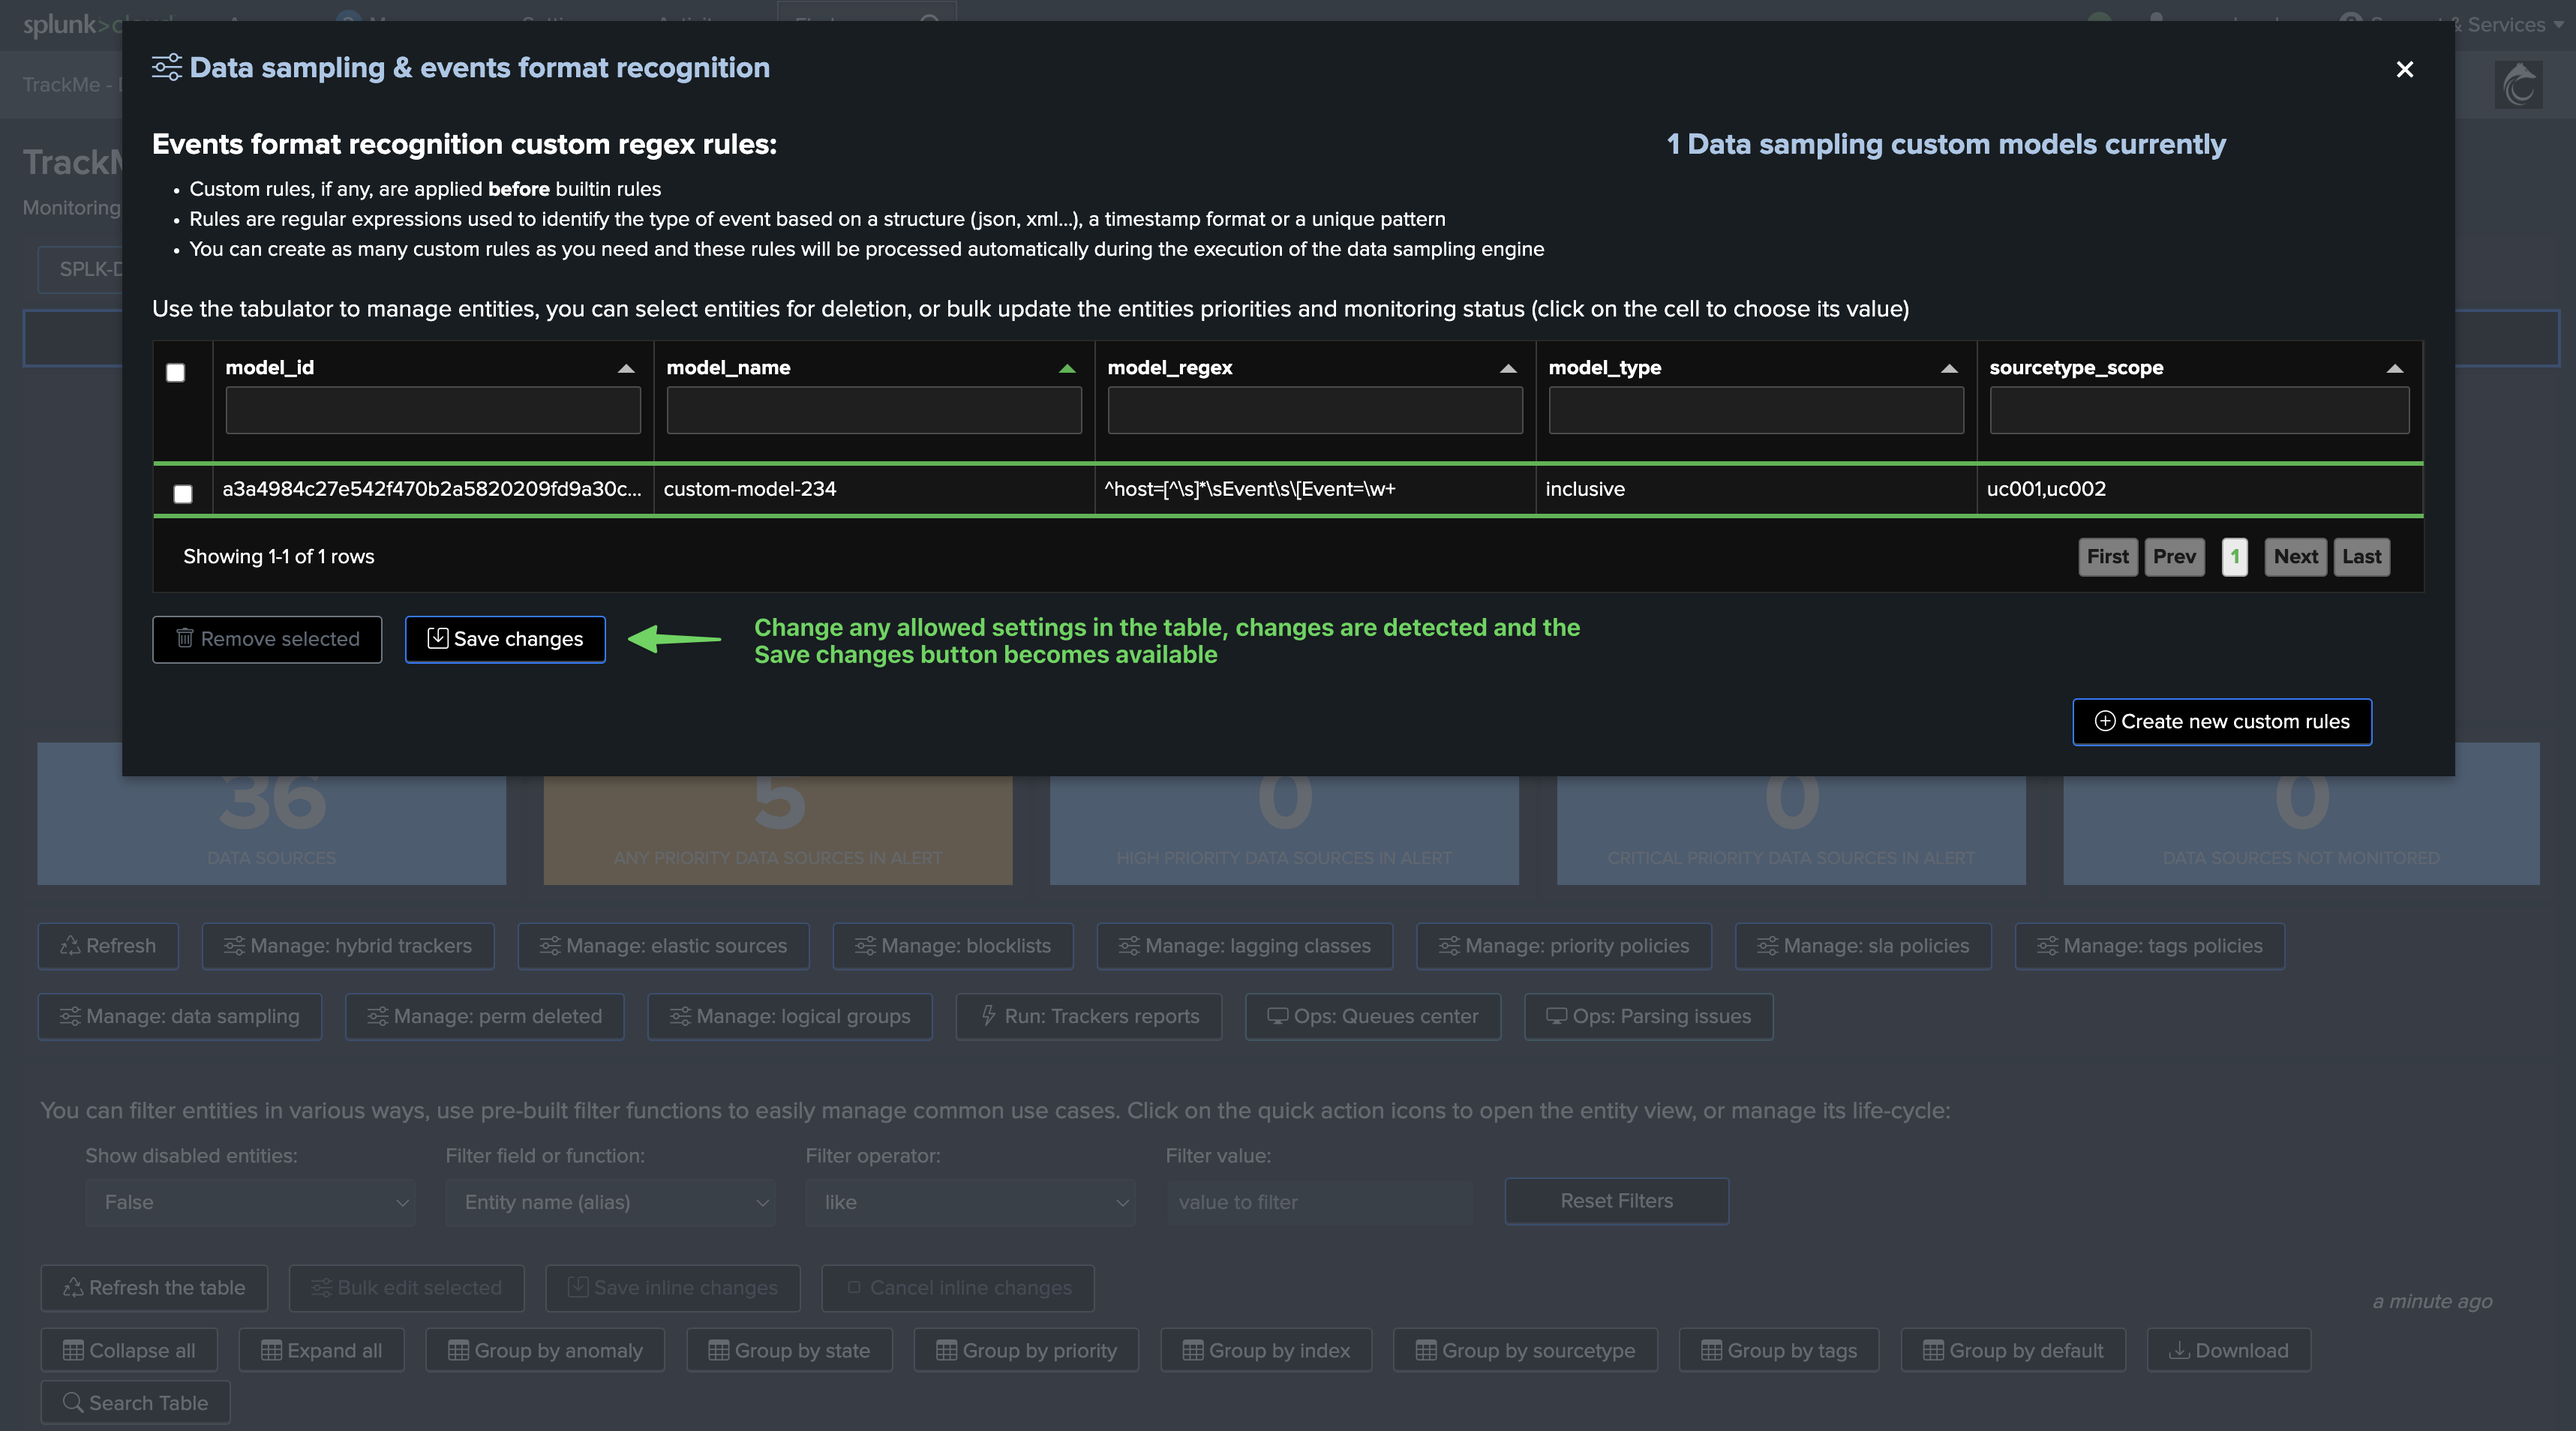
Managing Models
You can manage models at any time, either from the entity screen, or from the data sampling management screen:
From this screen, you can modify the model settings (sourcetype scope, regular expression), or you can delete the model:
Entity KVstore Record and Data Sampling KVstore Collection
Entity KVrecord and Metadata Fast Access
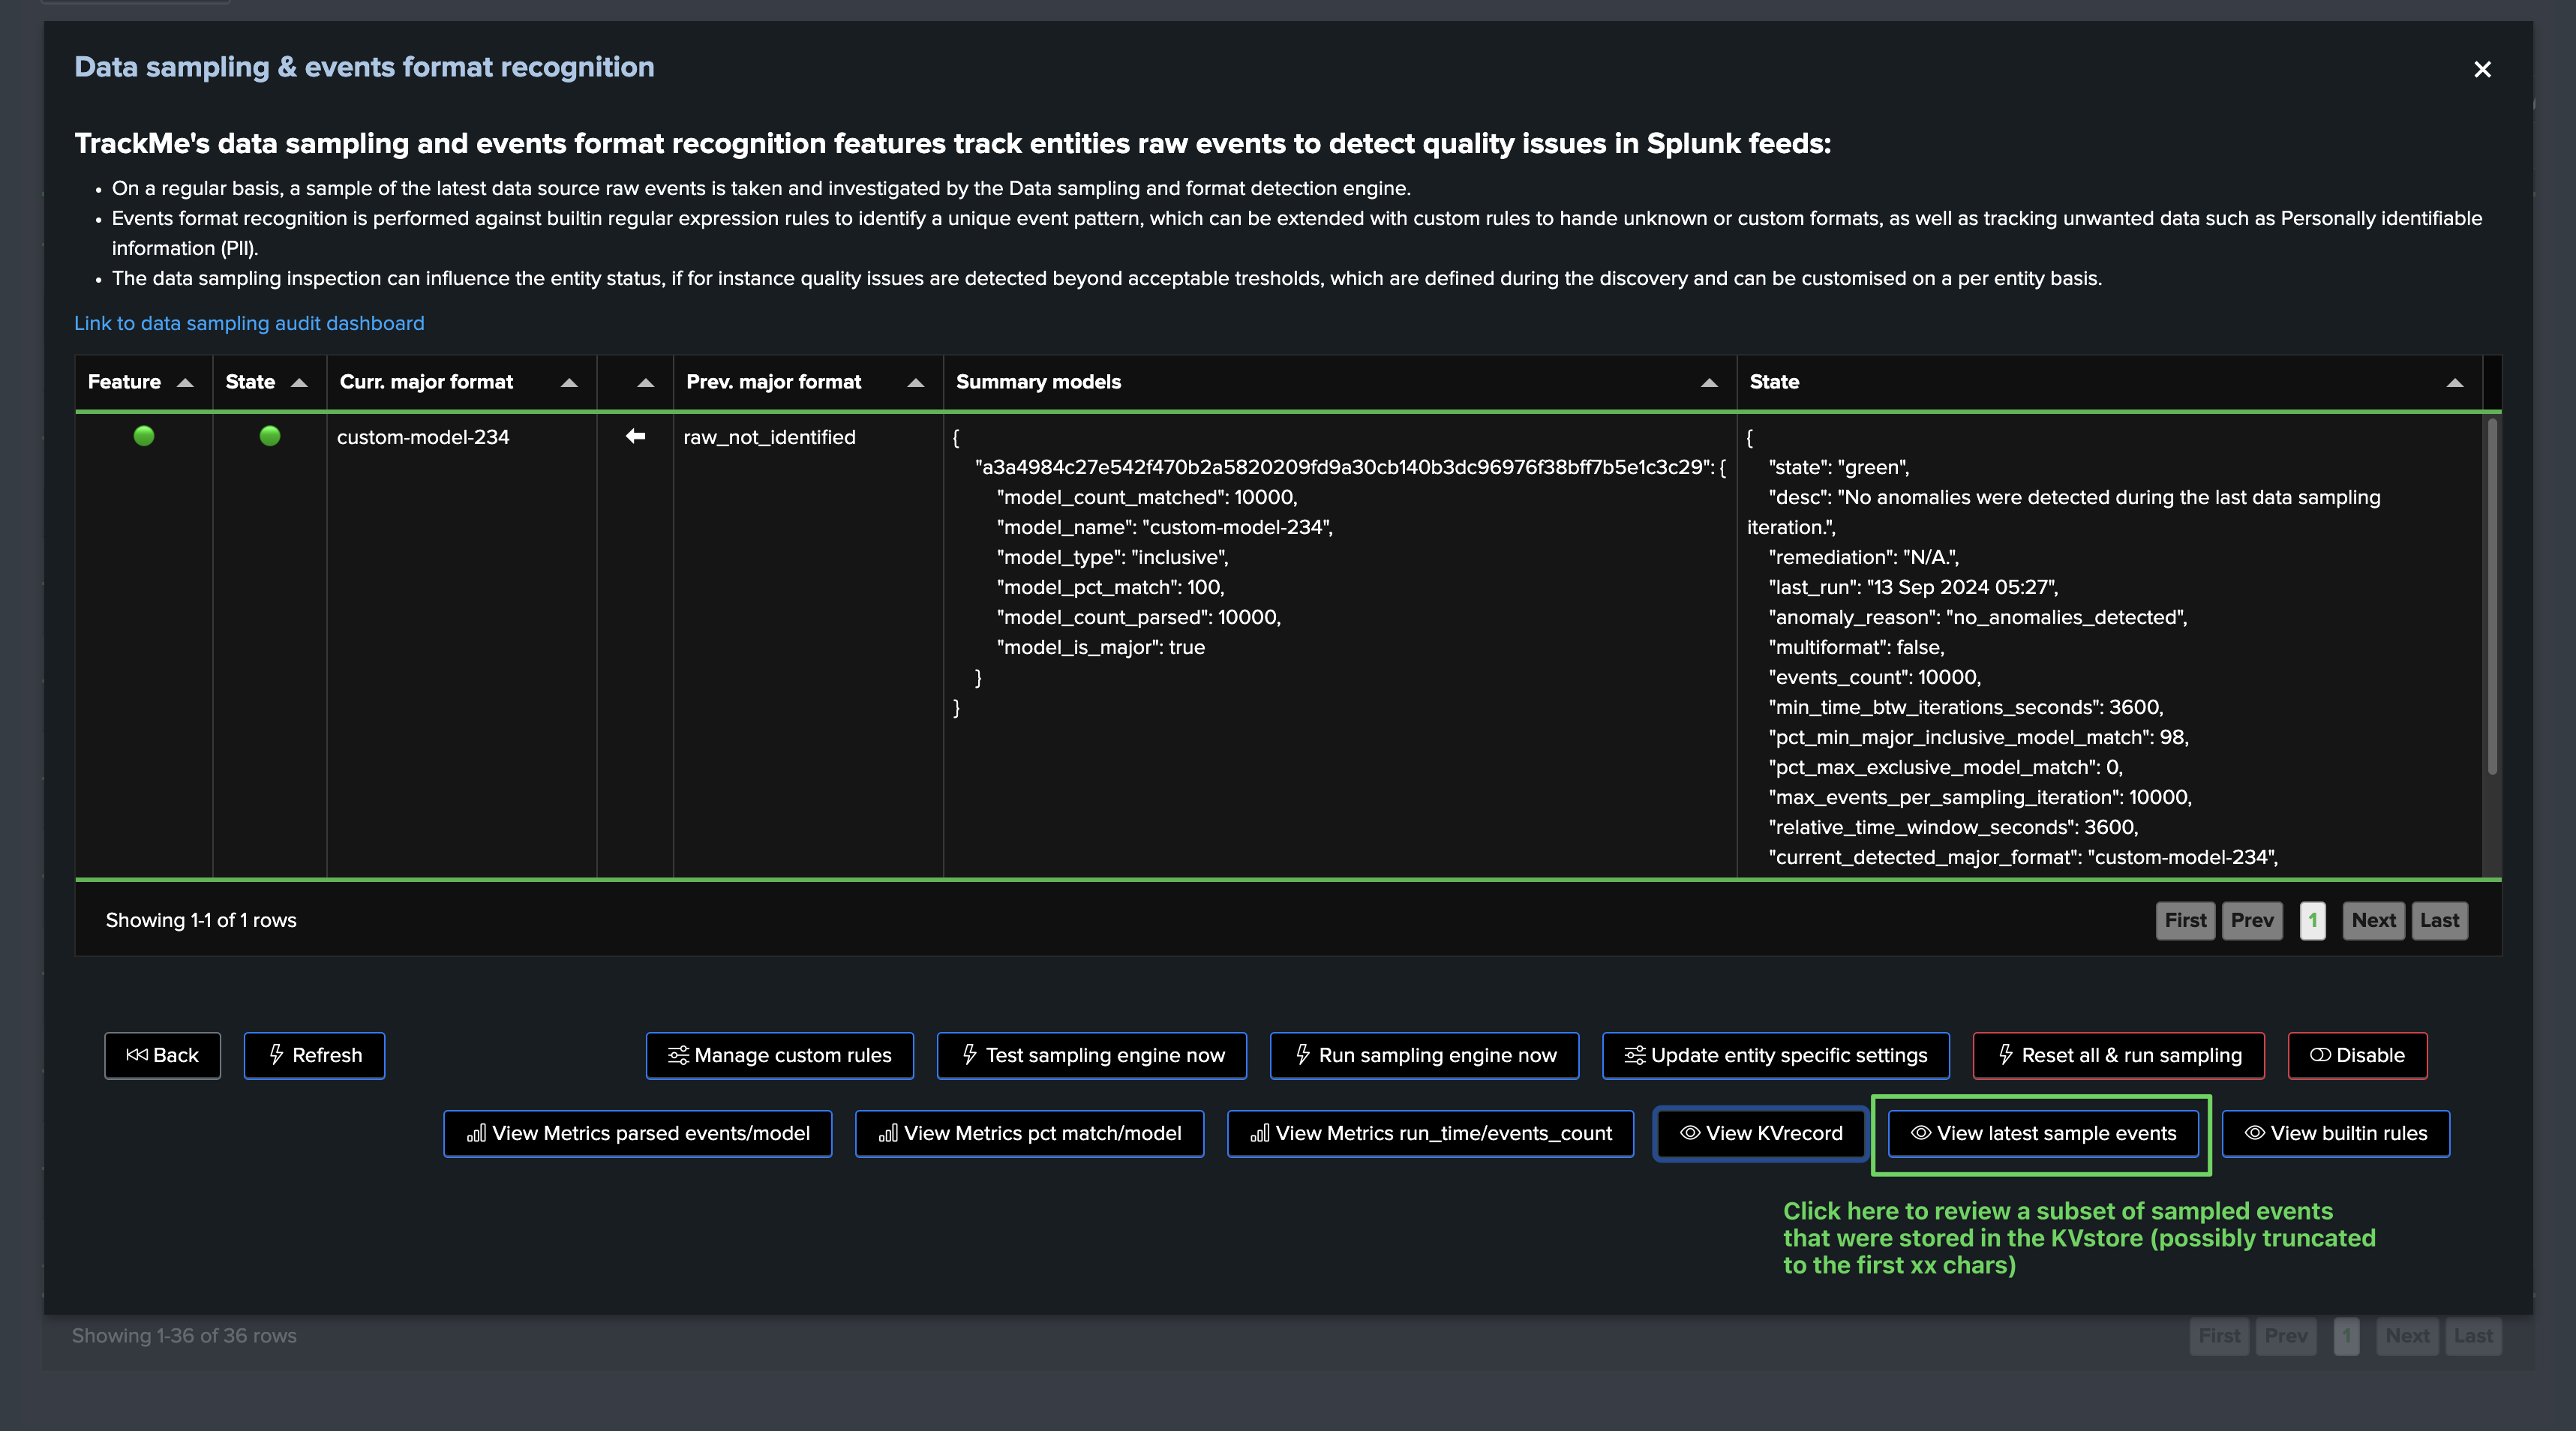
The sampling engine stores and maintains entity-level Metadata as well as a subset of the sampled events for investigation purposes, you can easily access the KVrecord via the UI:
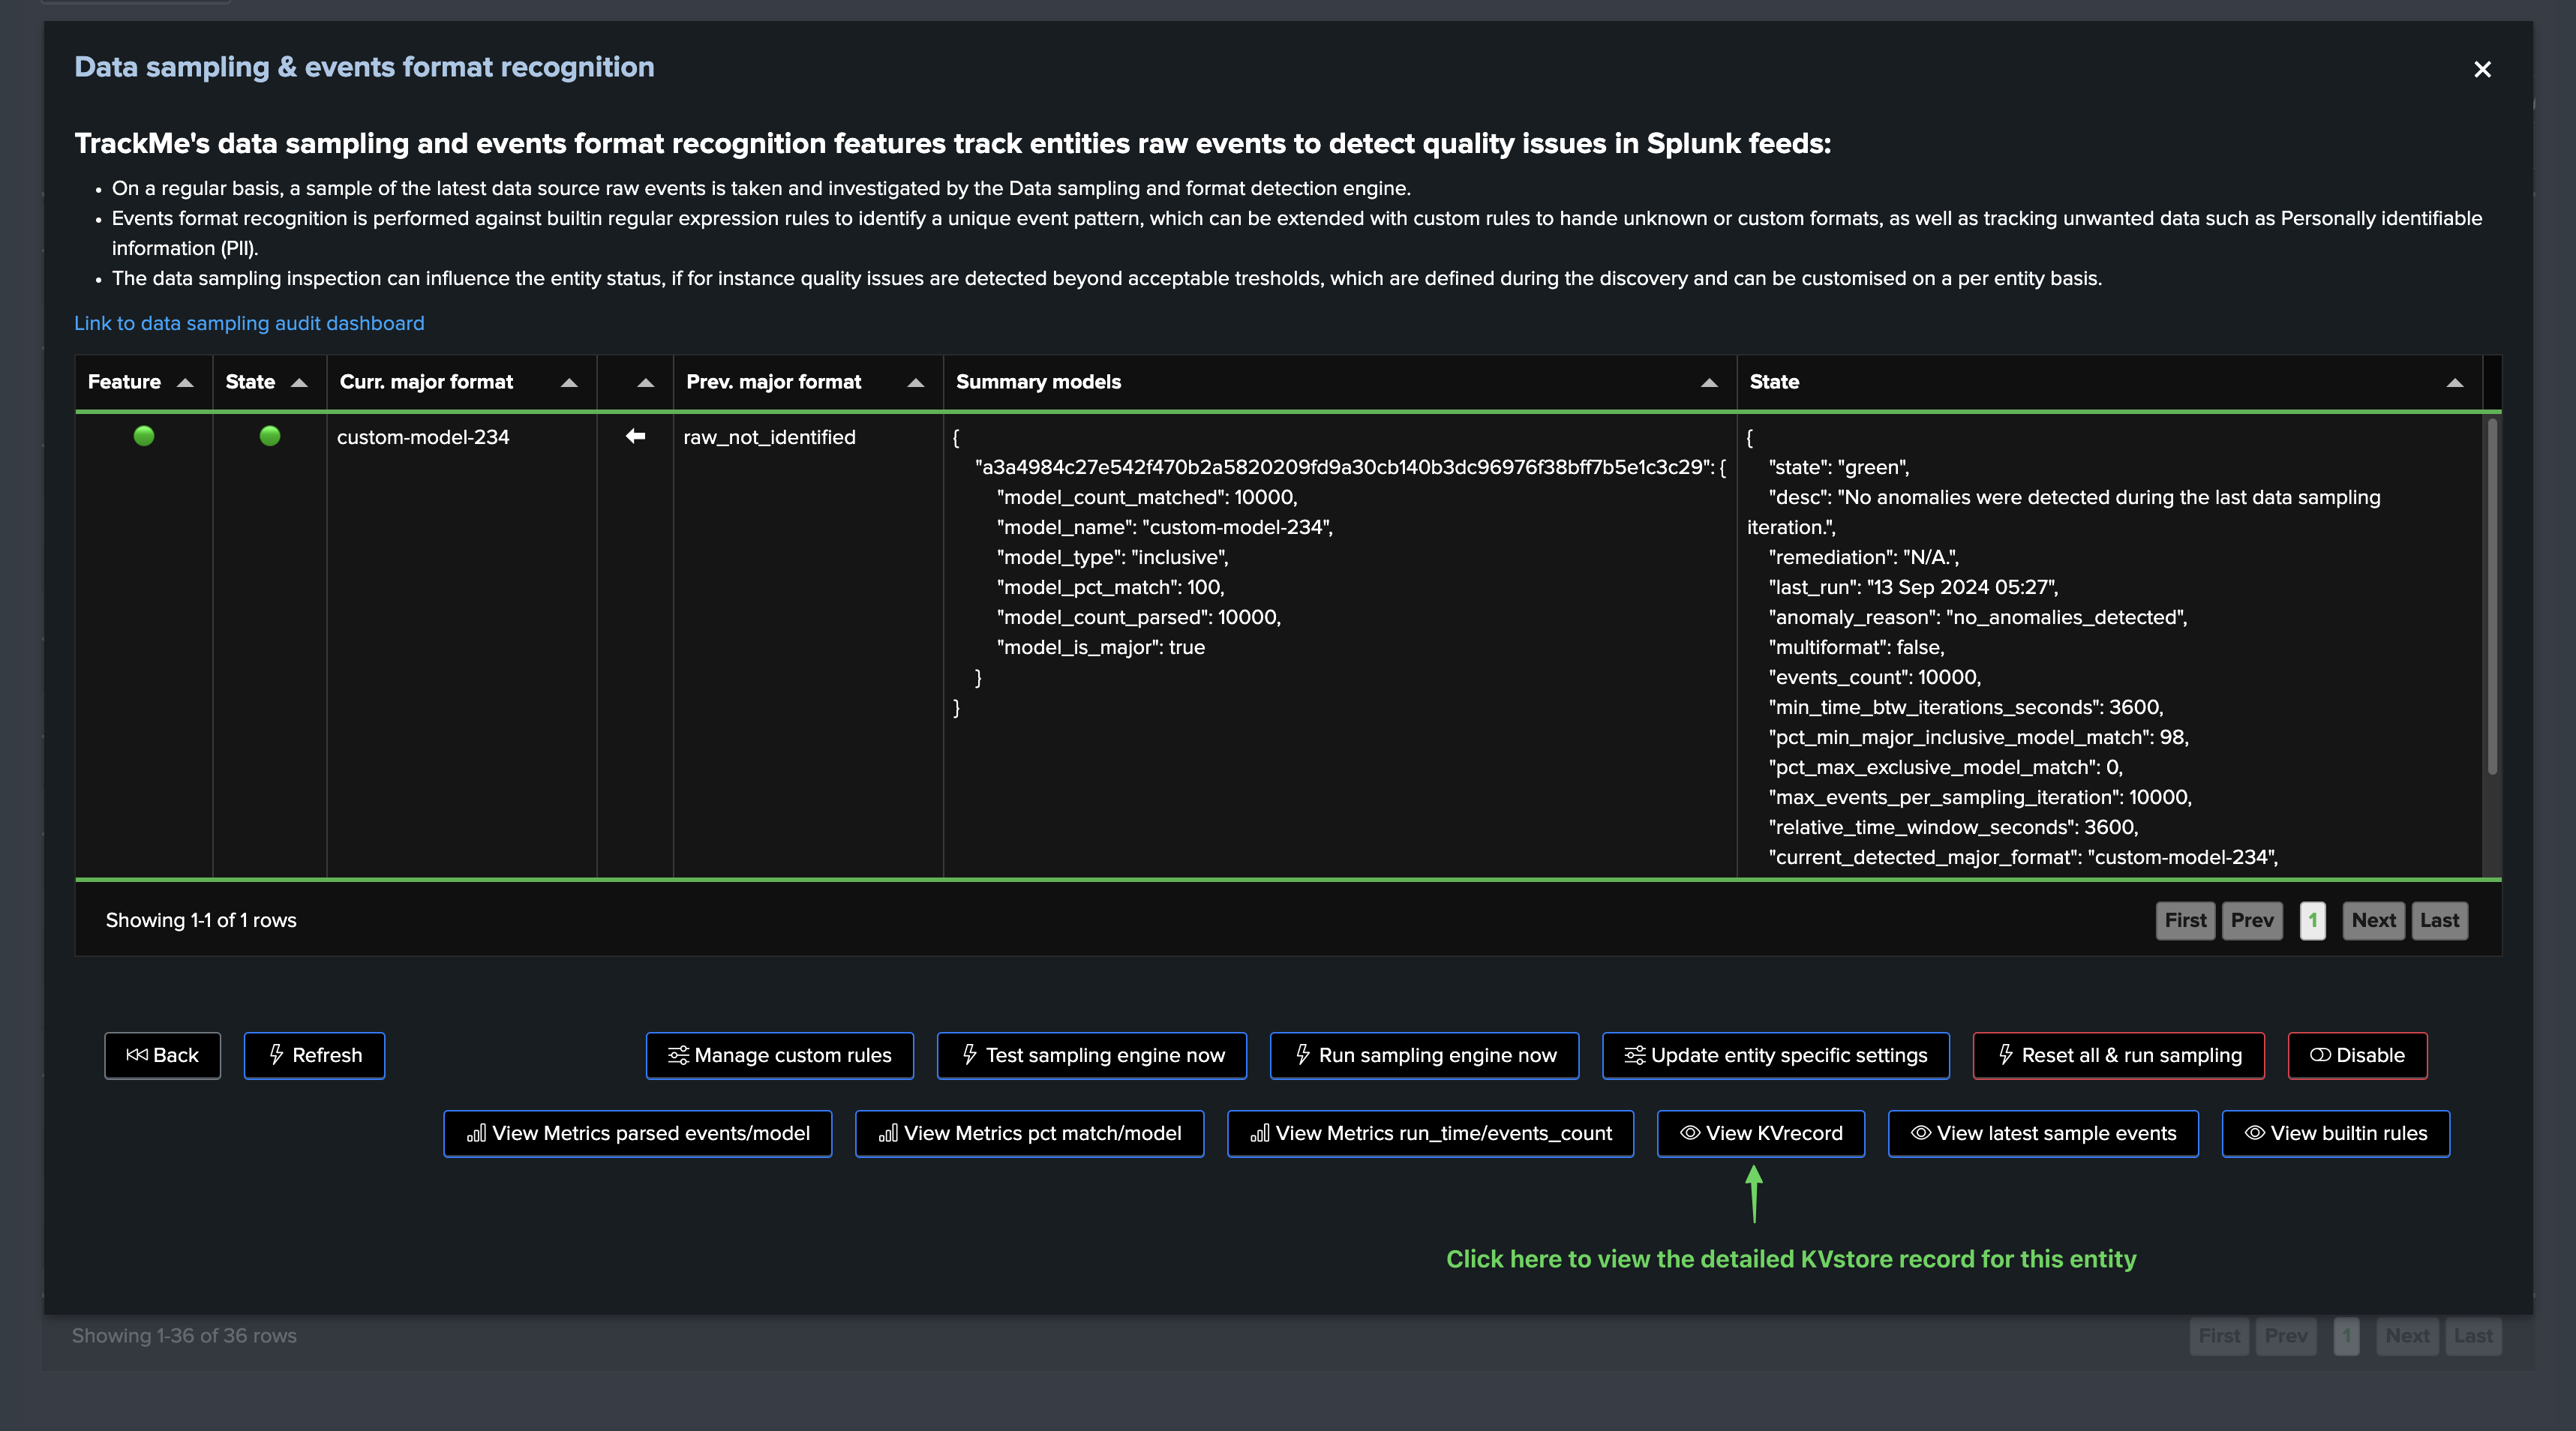
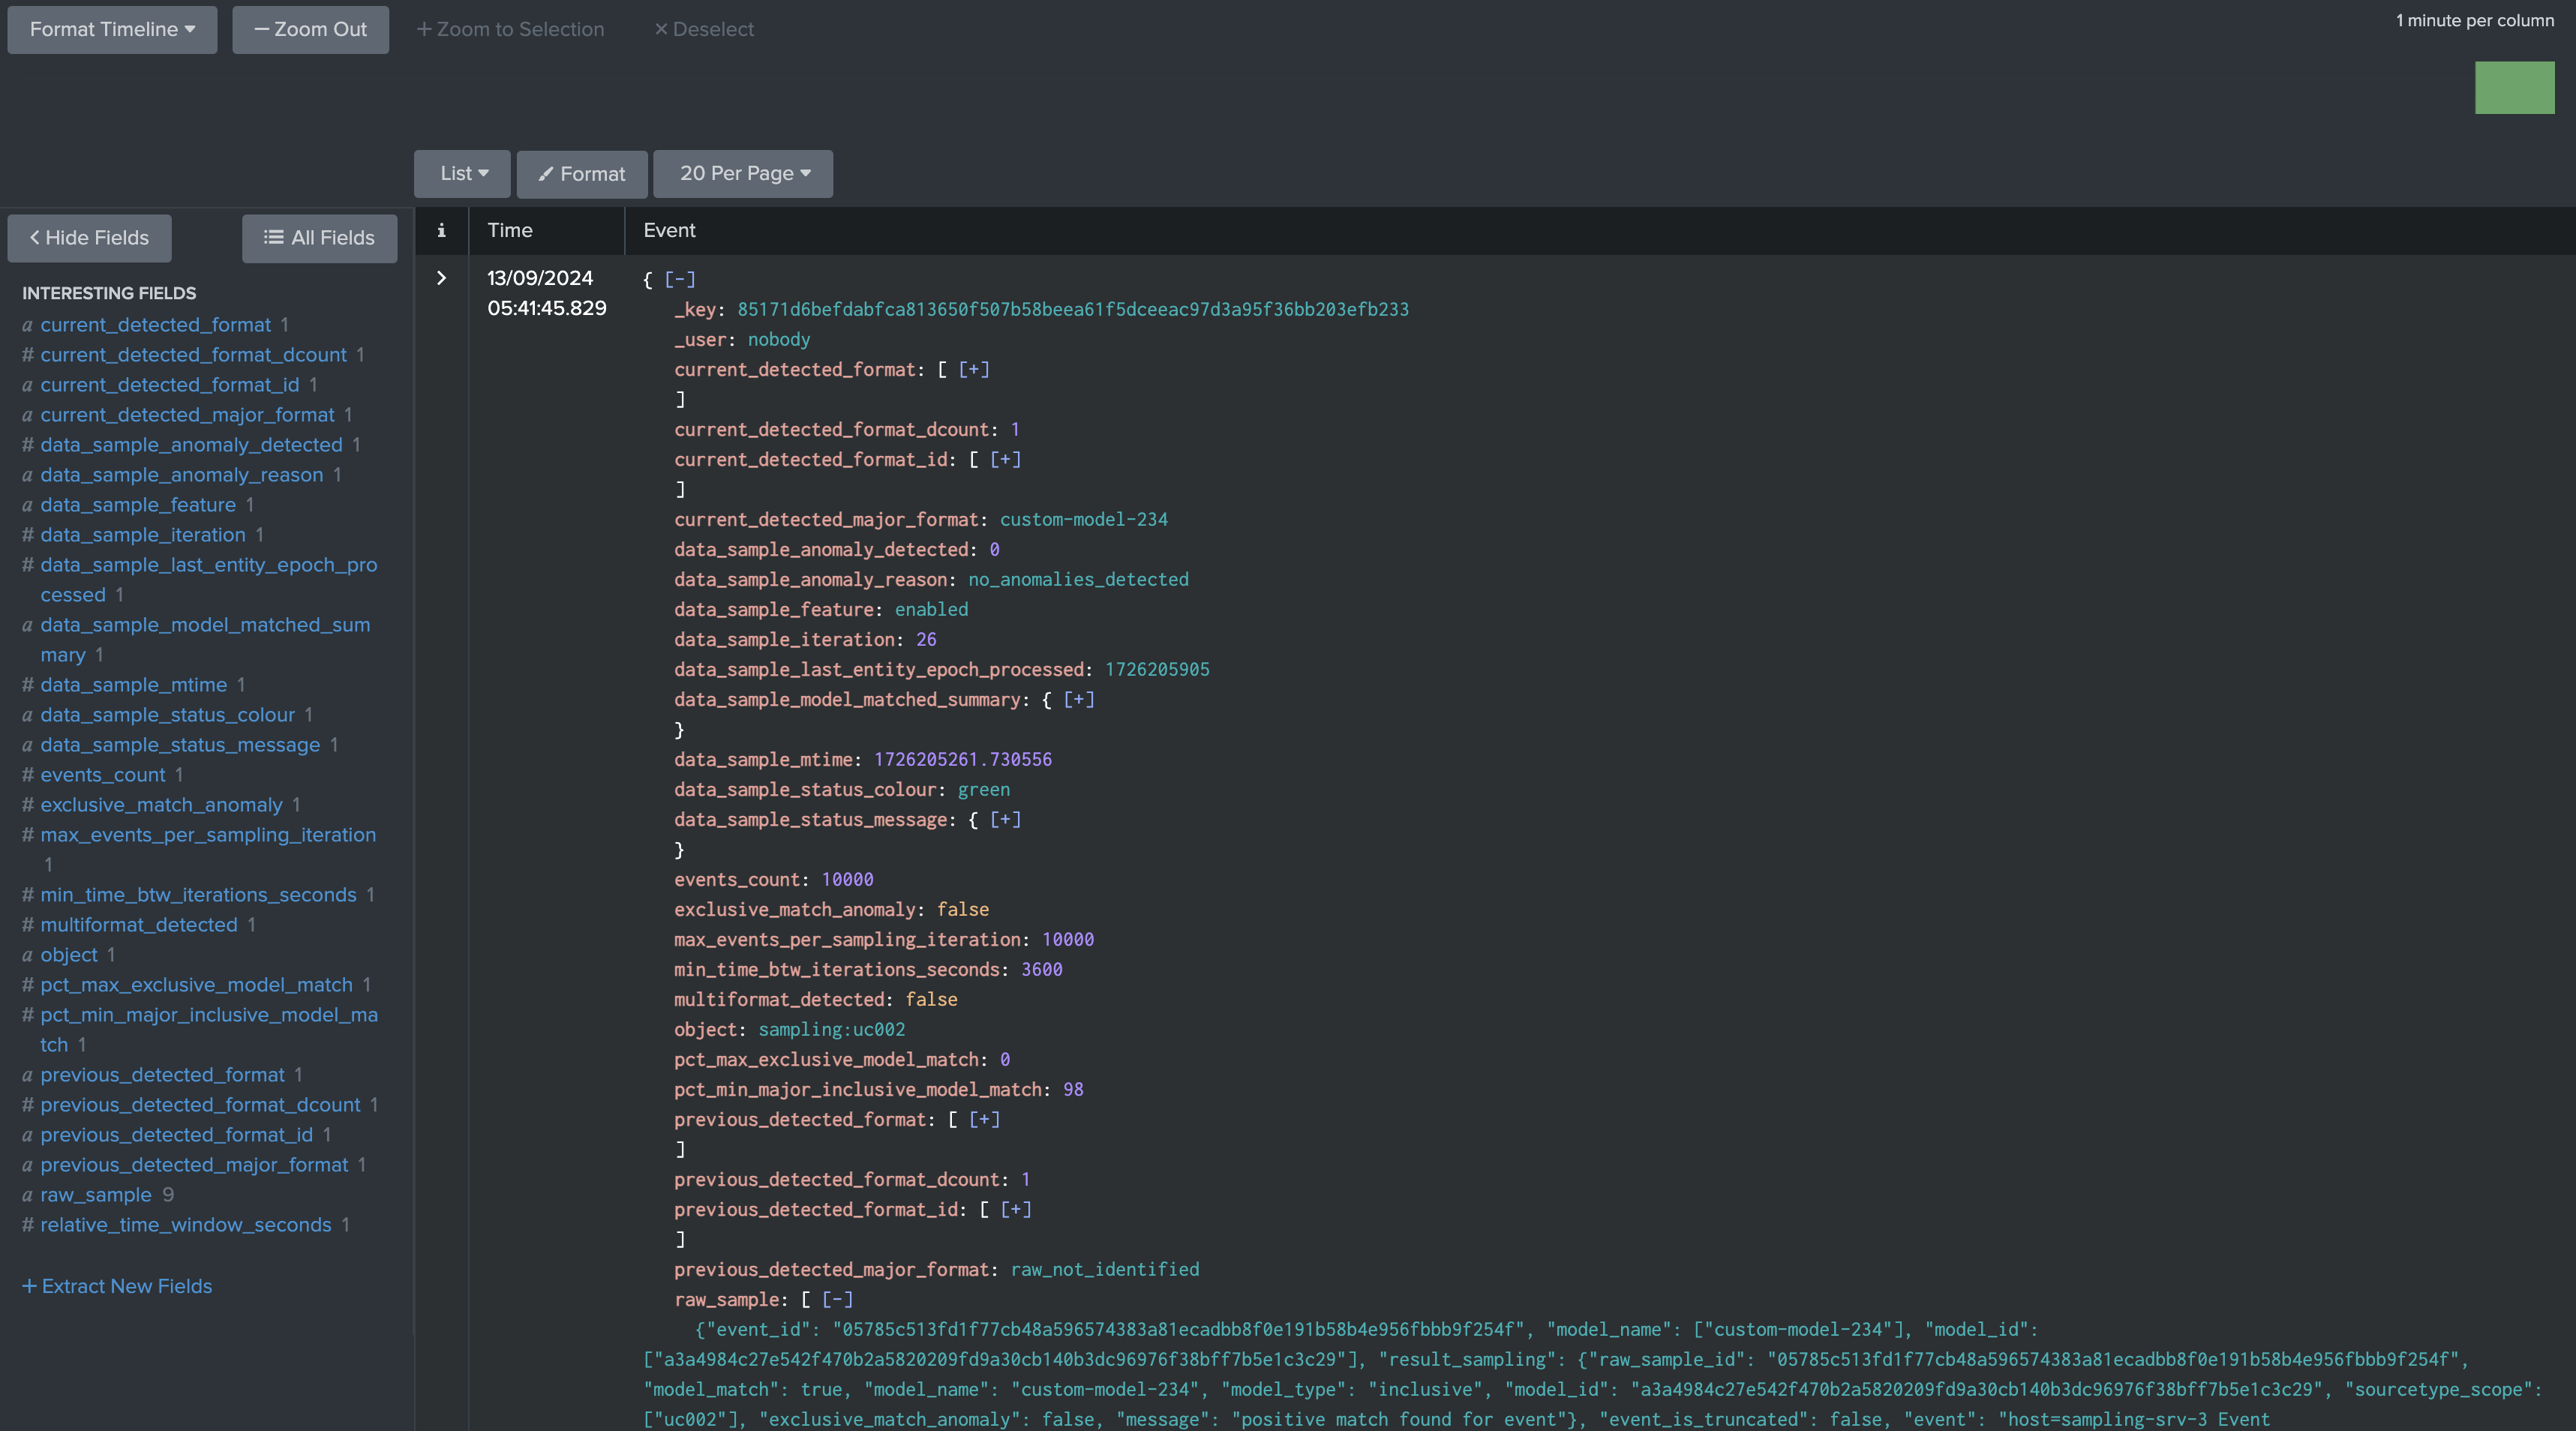
We can see that the engine stores and maintains a subset of sampled events, in fact by default it will take a subset of 10 events per model matched, and it will truncate these events to the first 40k characters, you can also access the stored samples via the button “Show samples”
Hint
About number of events stored in the KVstore collection and truncation:
The number of events stored in the KVstore collection per entity and per model matched is defined by the system-wide setting “splk_data_sampling_no_records_saved_kvrecord”.
The truncation is only applied when the engine stores events in the KVstore for investigation purposes, not when the regular expression is applied to the event.
The truncation limit is defined by the system-wide setting “splk_data_sampling_records_kvrecord_truncate_size”.
Data Sampling KVstore Collection
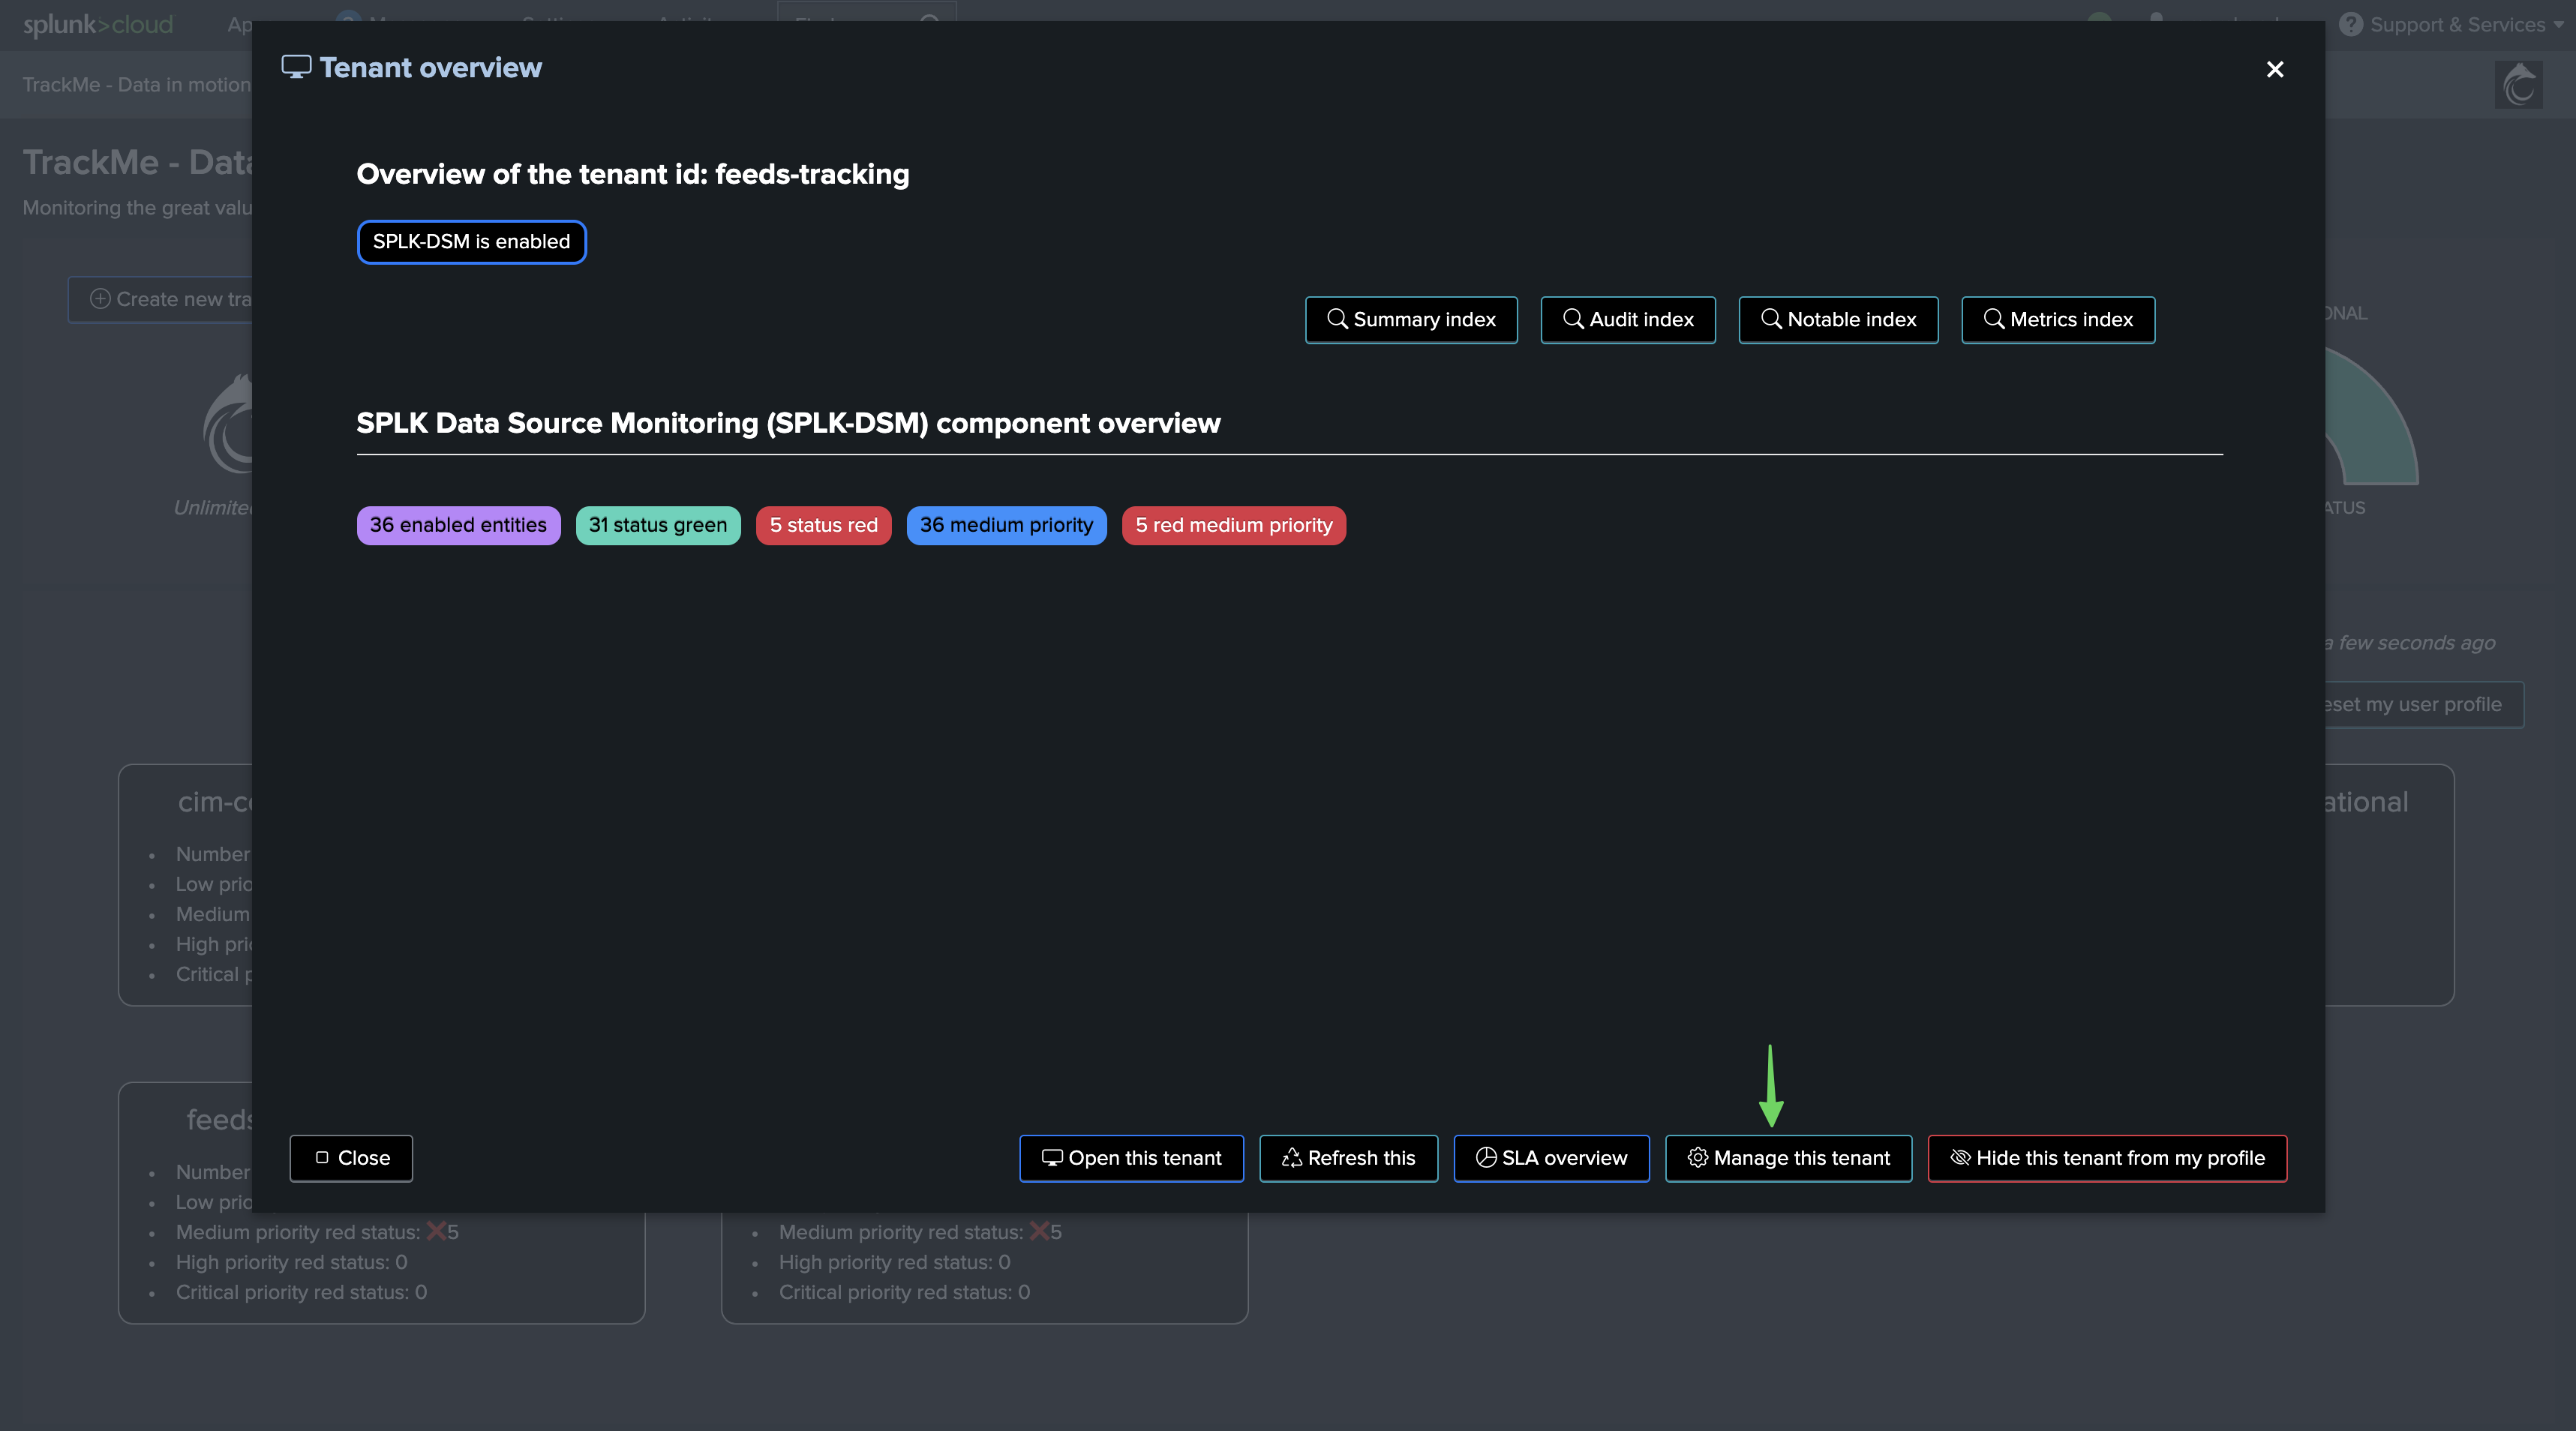
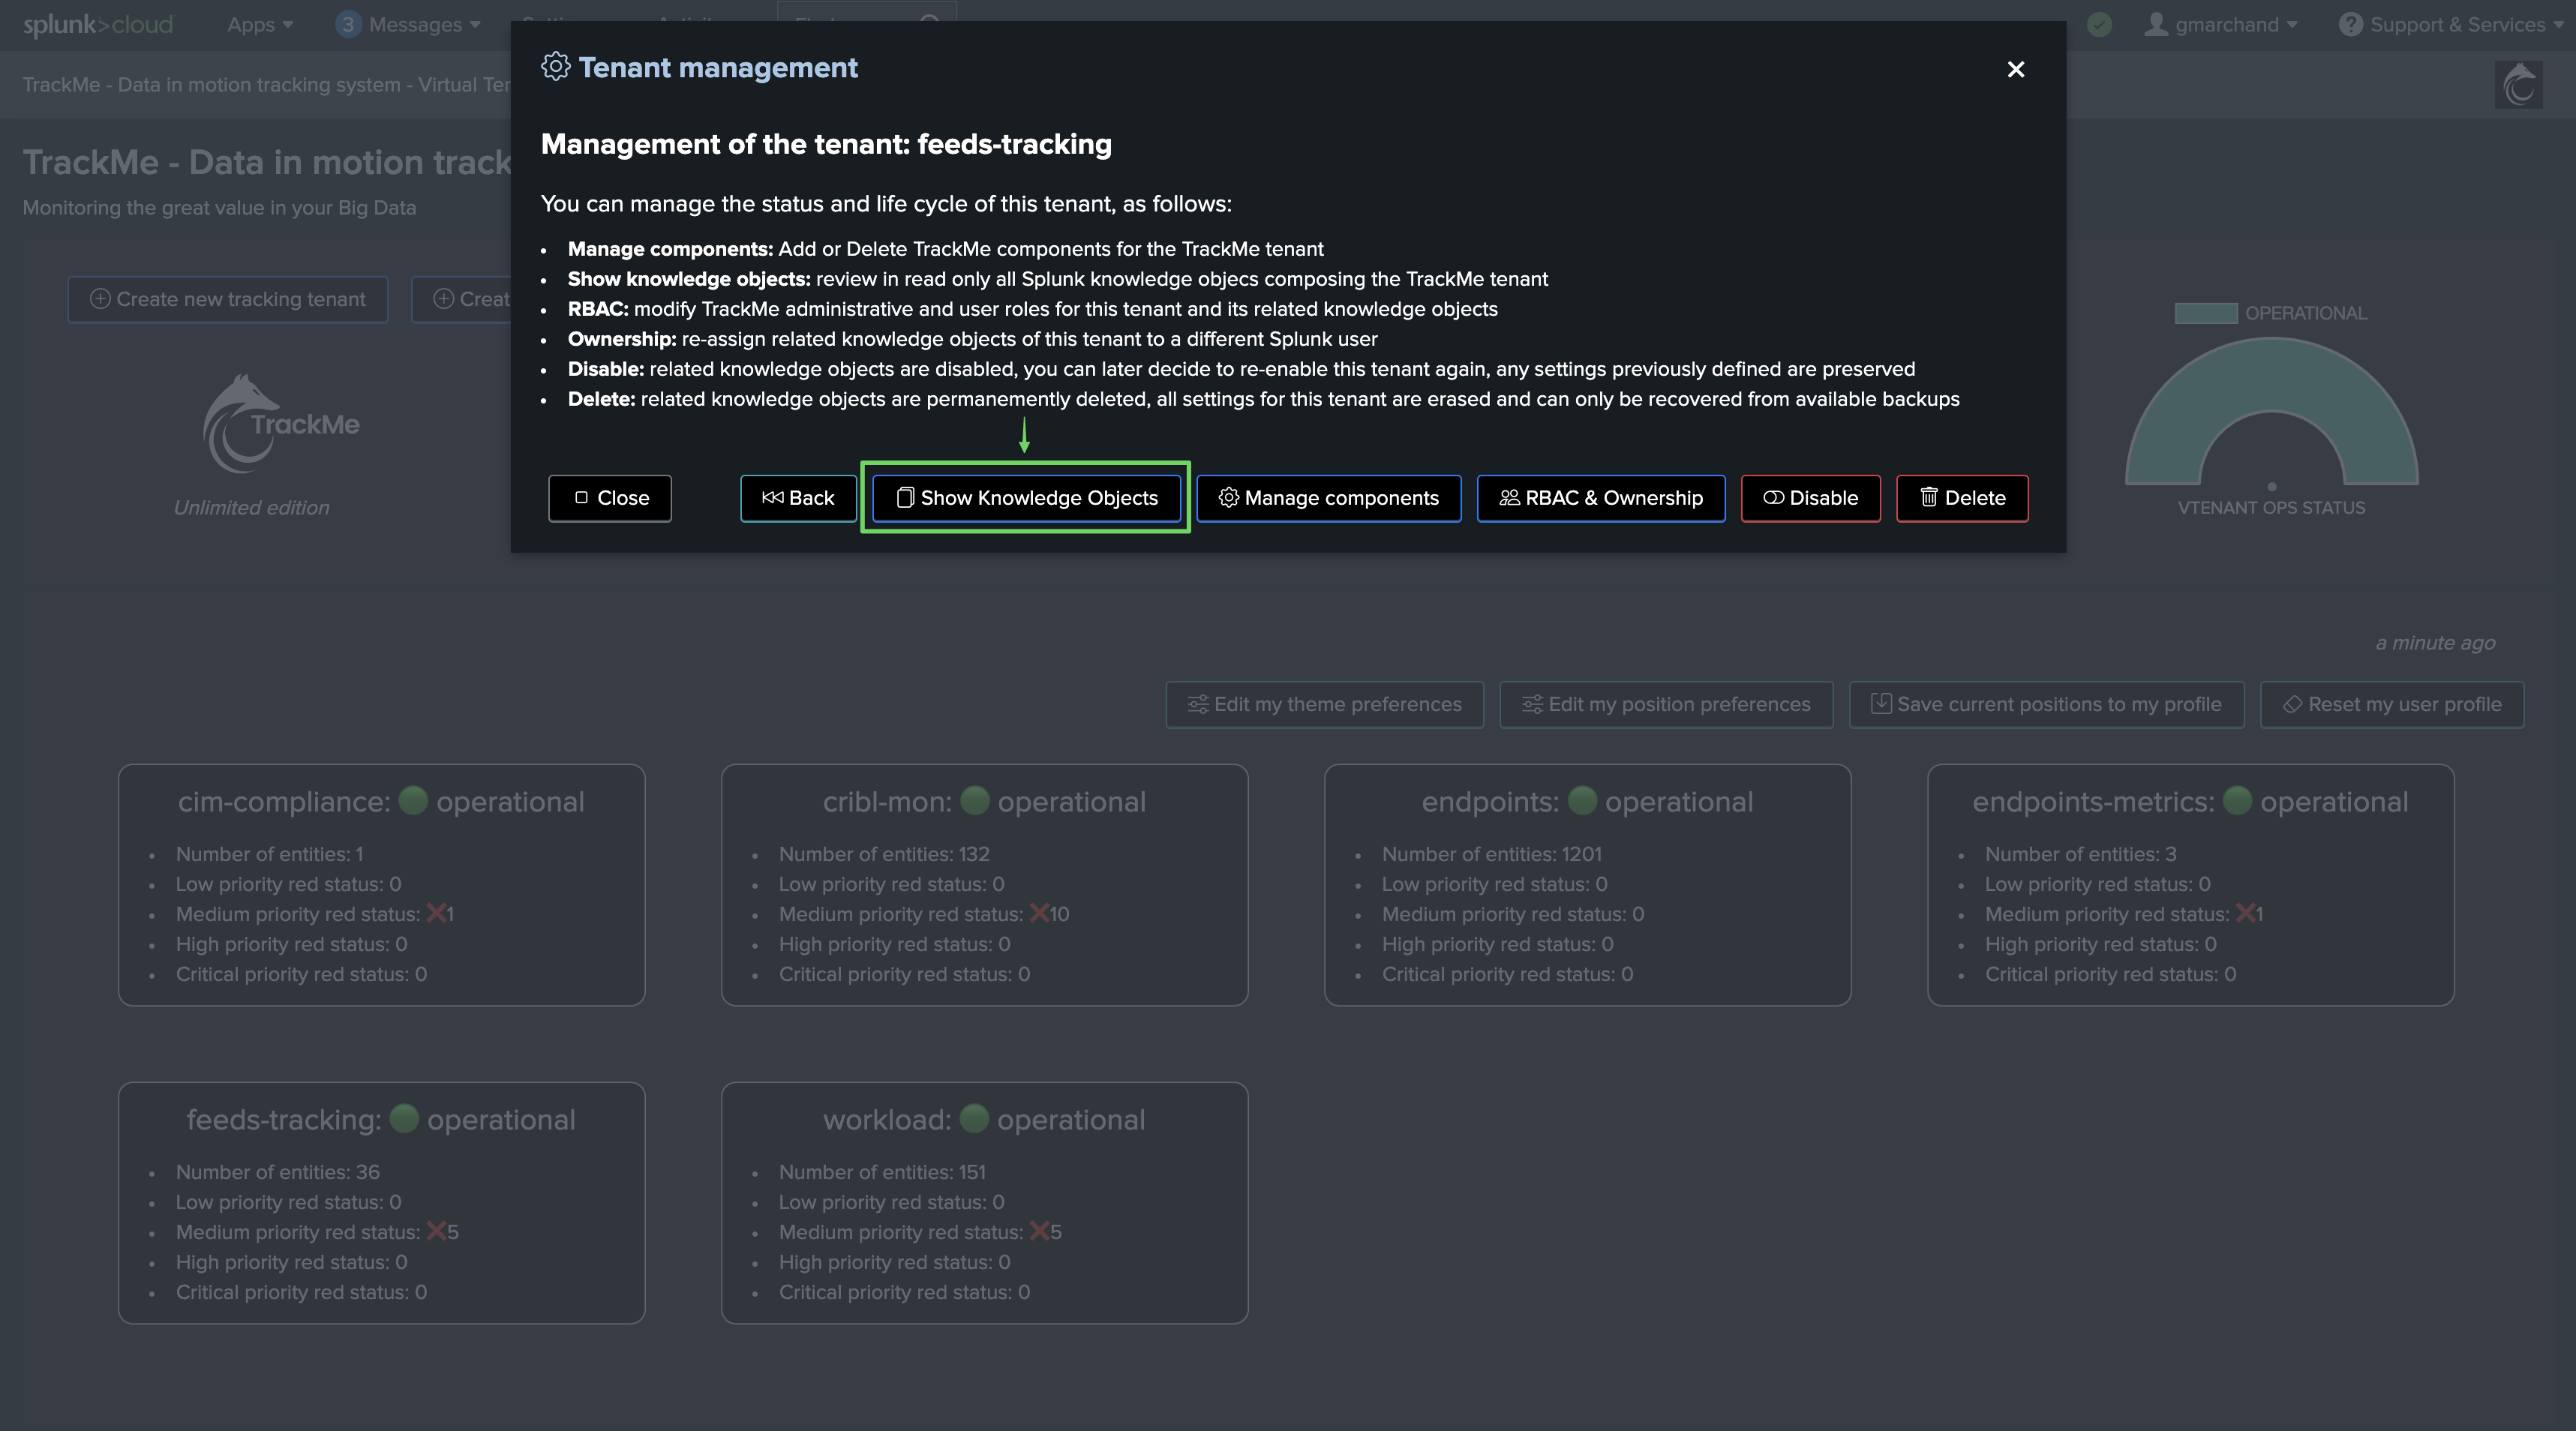
The data sampling KVstore collection is created when the Virtual Tenant is created, you can find out the KVstore collection and the transforms name easily from the Virtual Tenant UI:
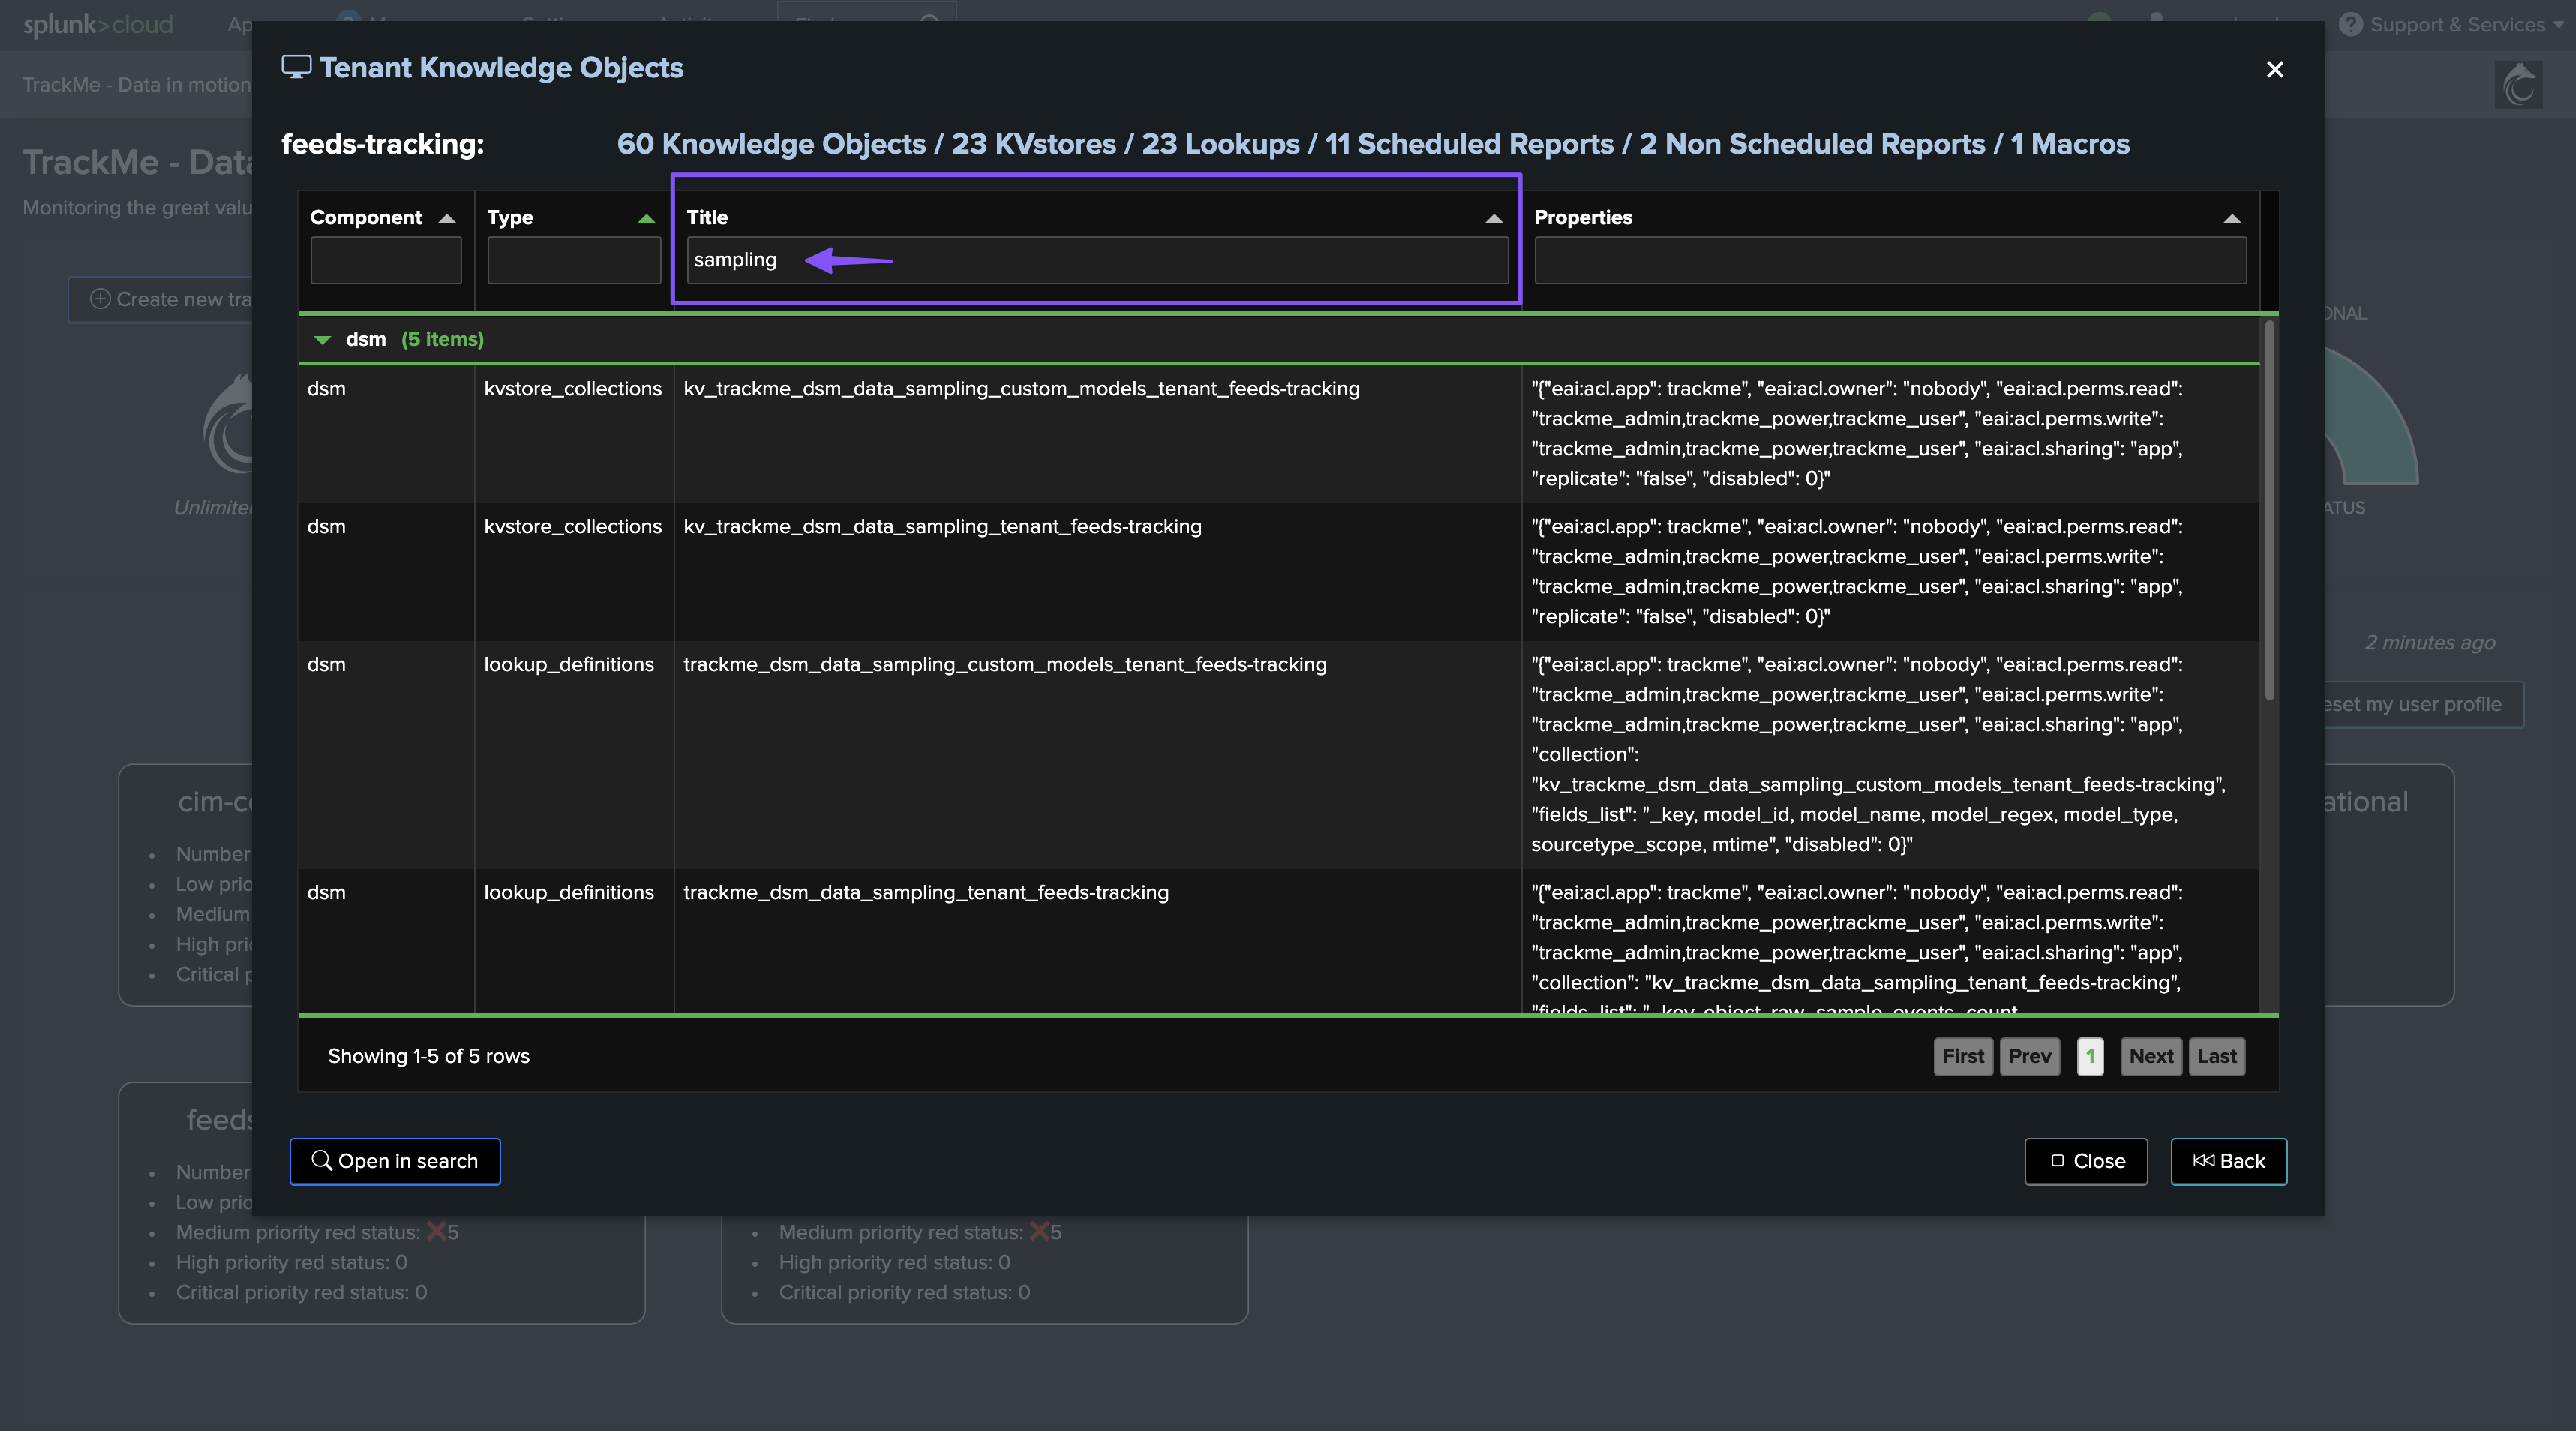
The KVstore collection transforms definition is honoring the following convention:
| inputlookup trackme_dsm_data_sampling_tenant_<tenant_id> | eval key=_key
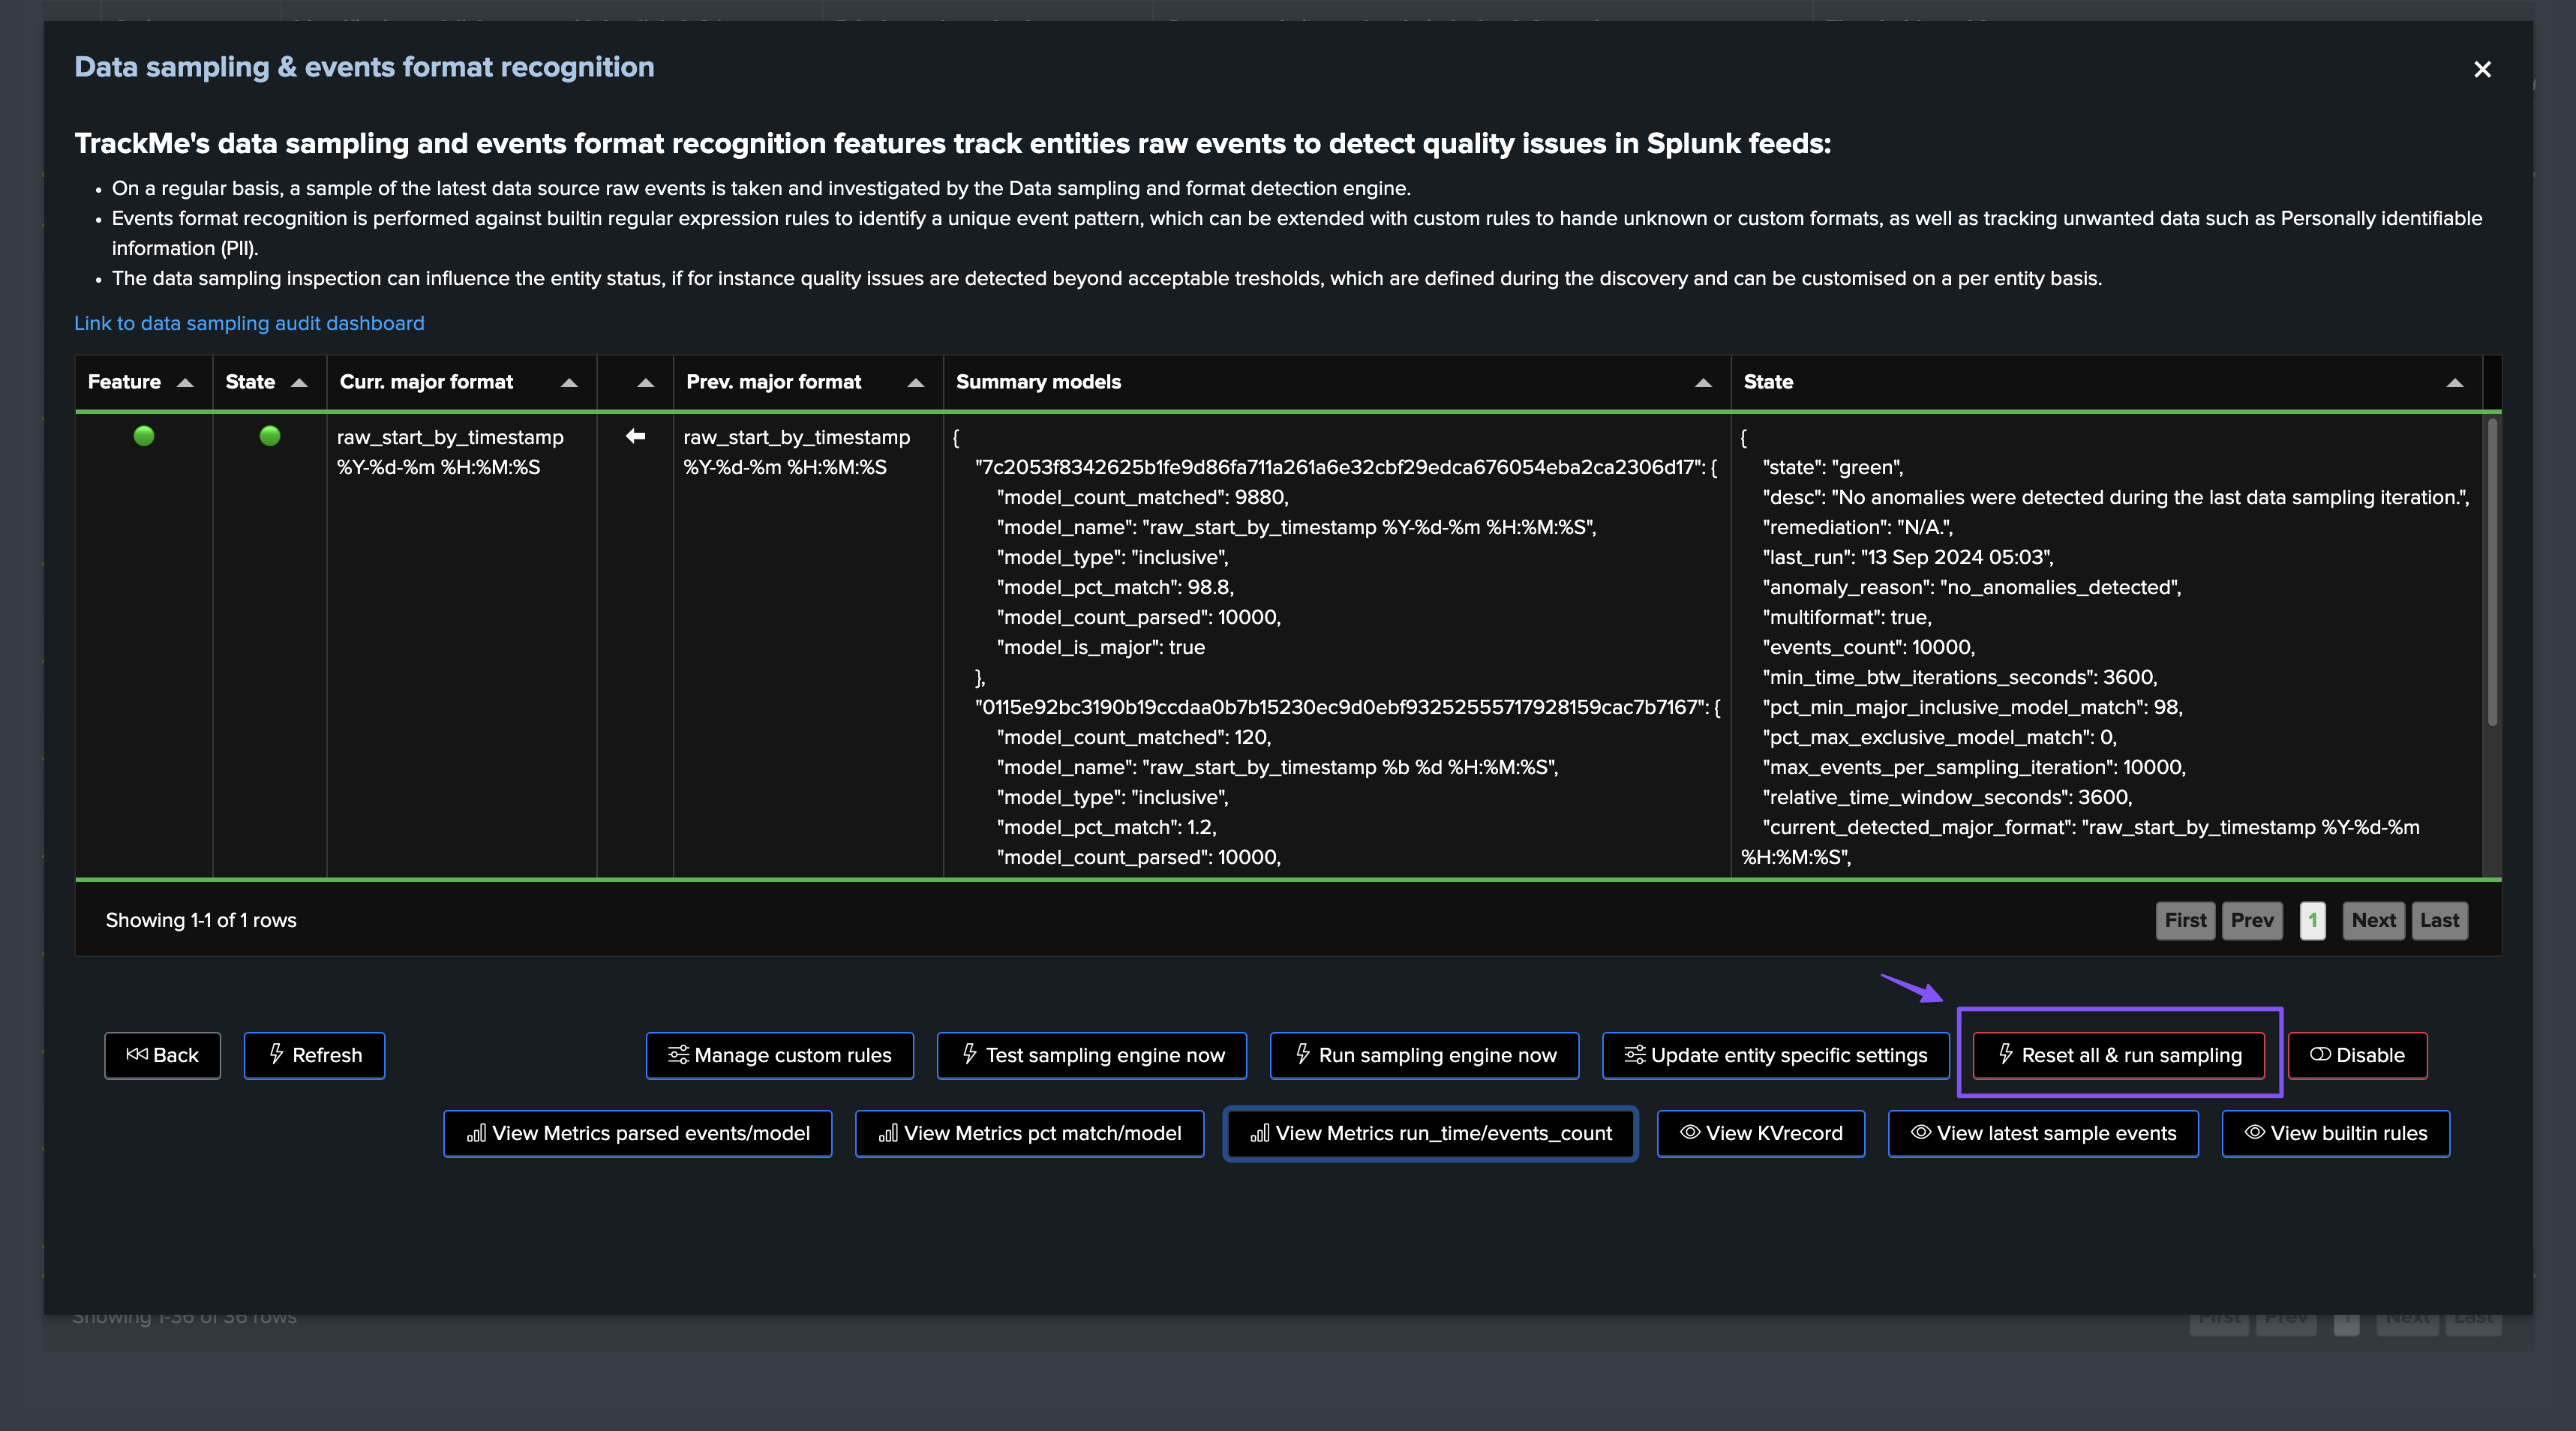
Resetting Data Sampling Status and Settings for a Given Entity
Reset Status & Settings for a Given Entity
You can reset the data sampling status and settings for a given entity, this will reset the data sampling status, the models, and the settings to the default values, you can access this feature from the entity screen:
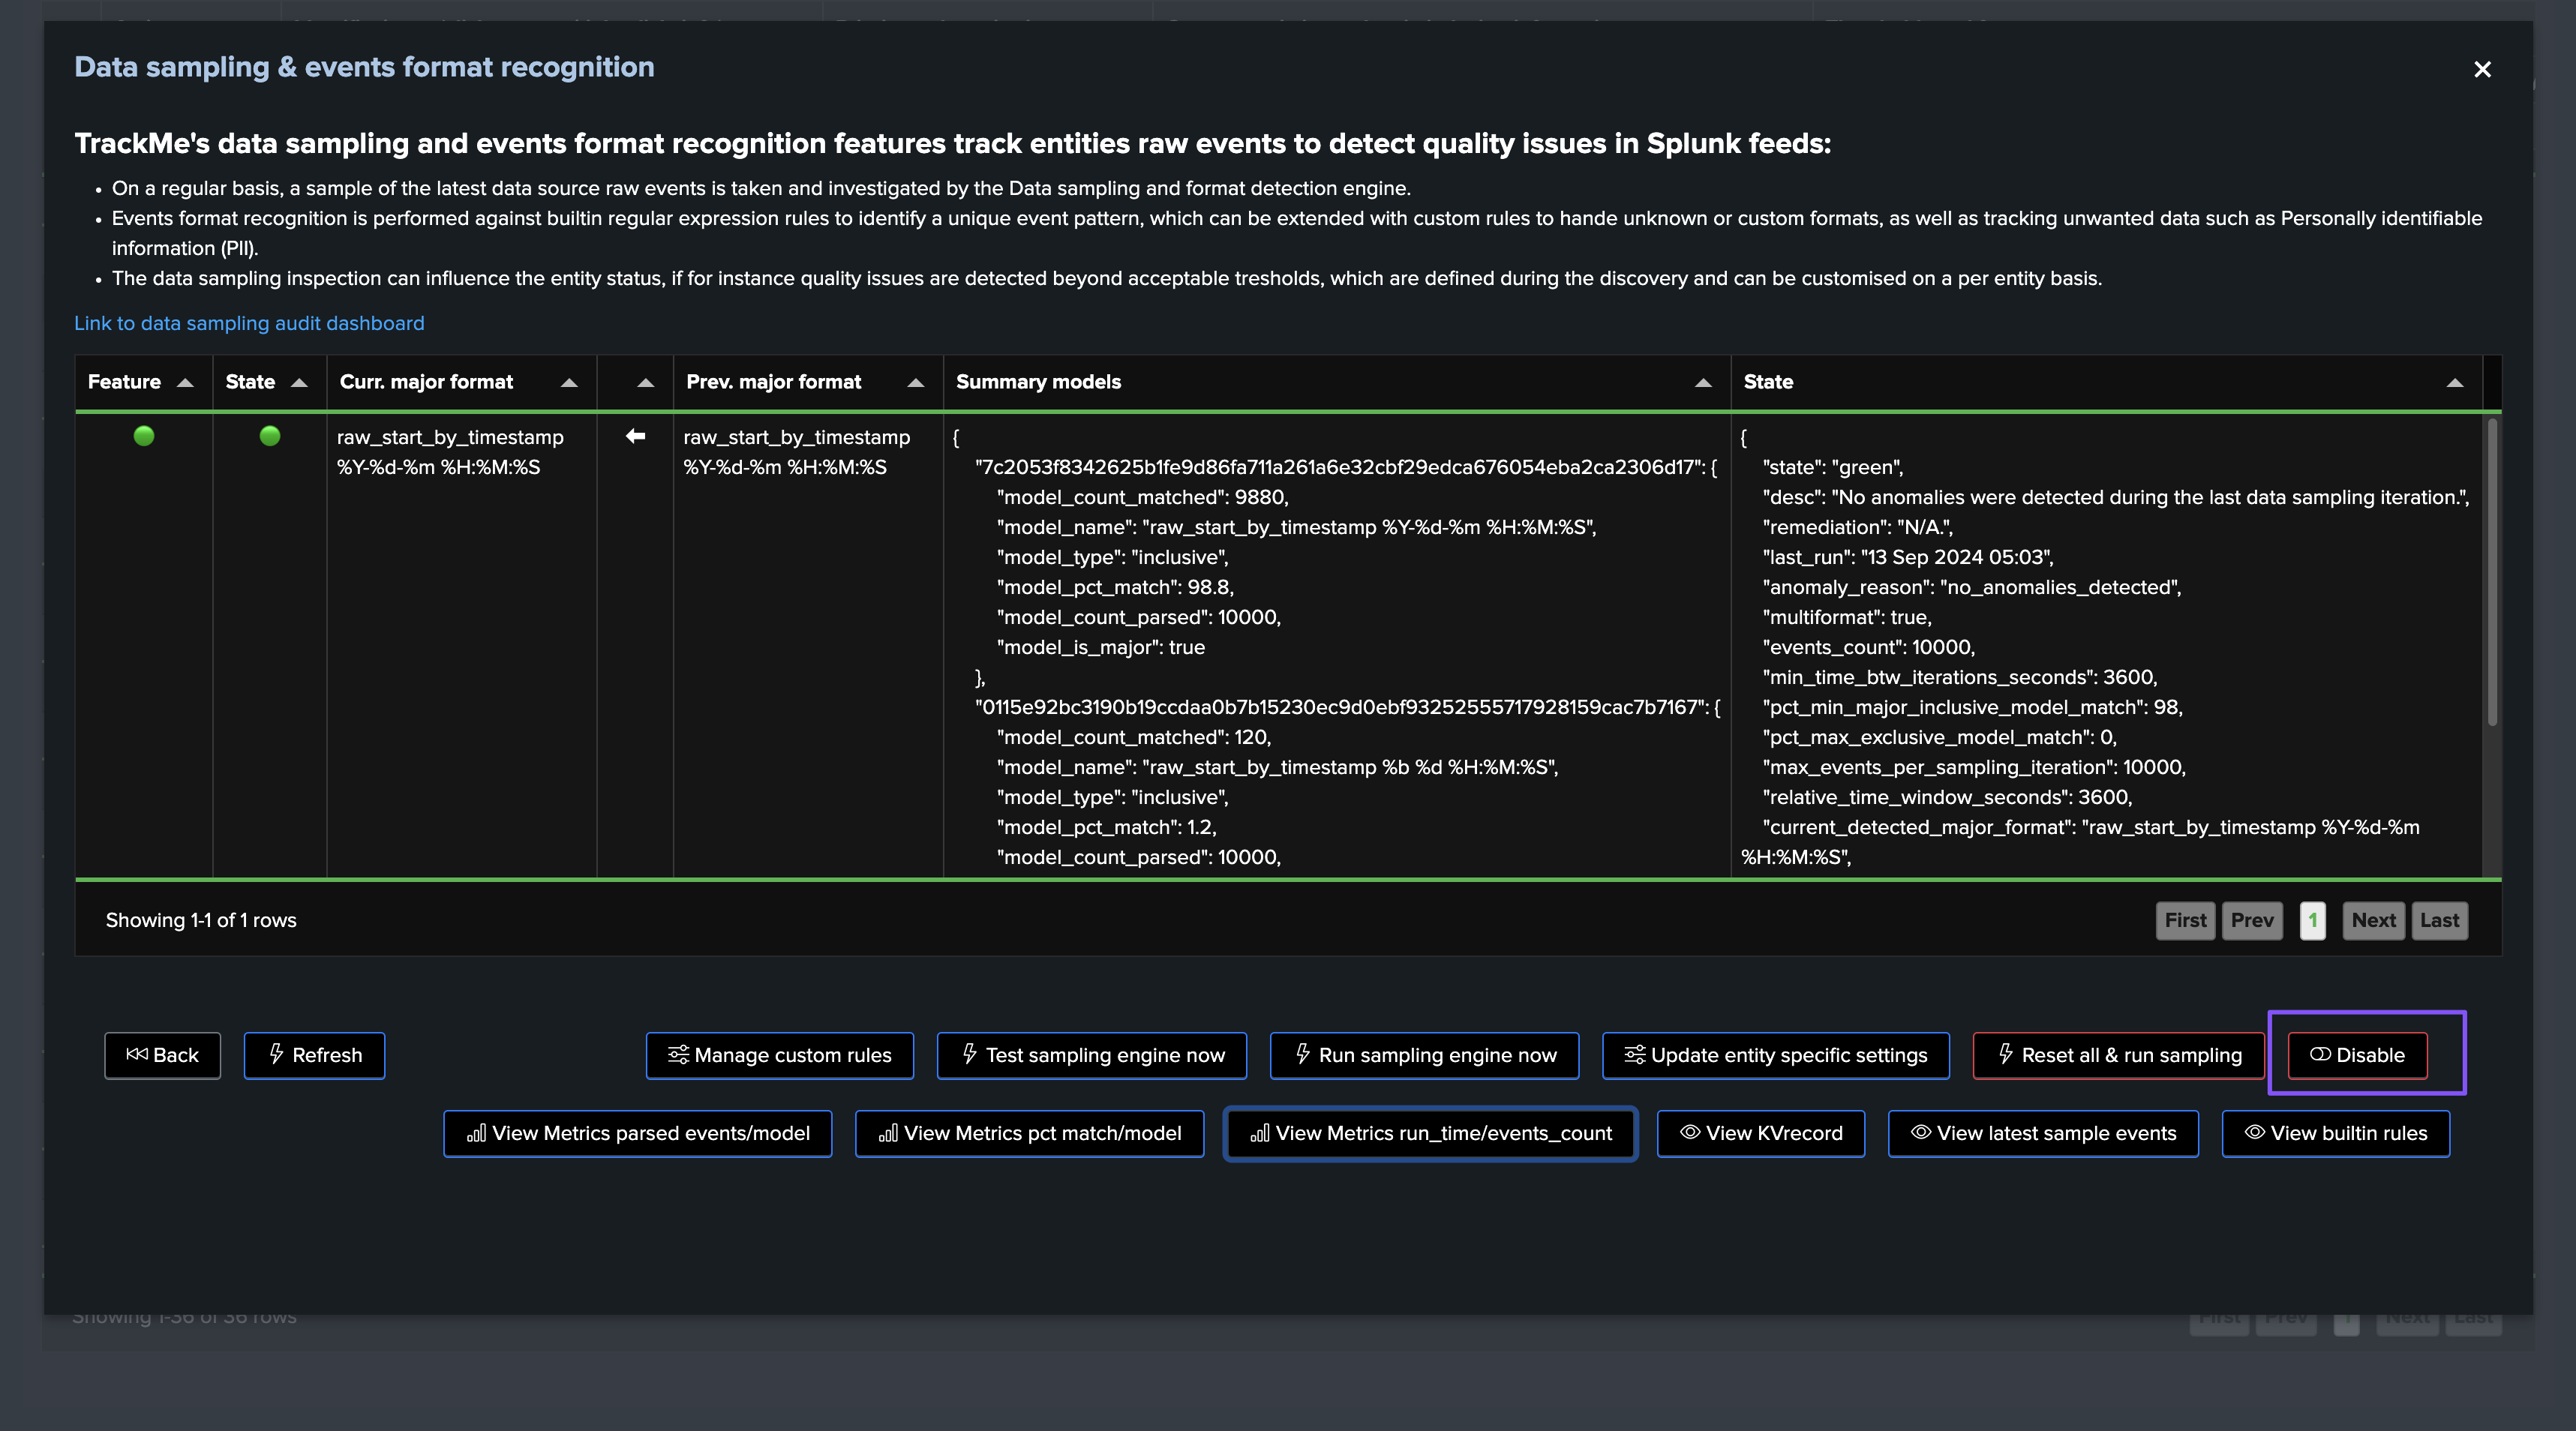
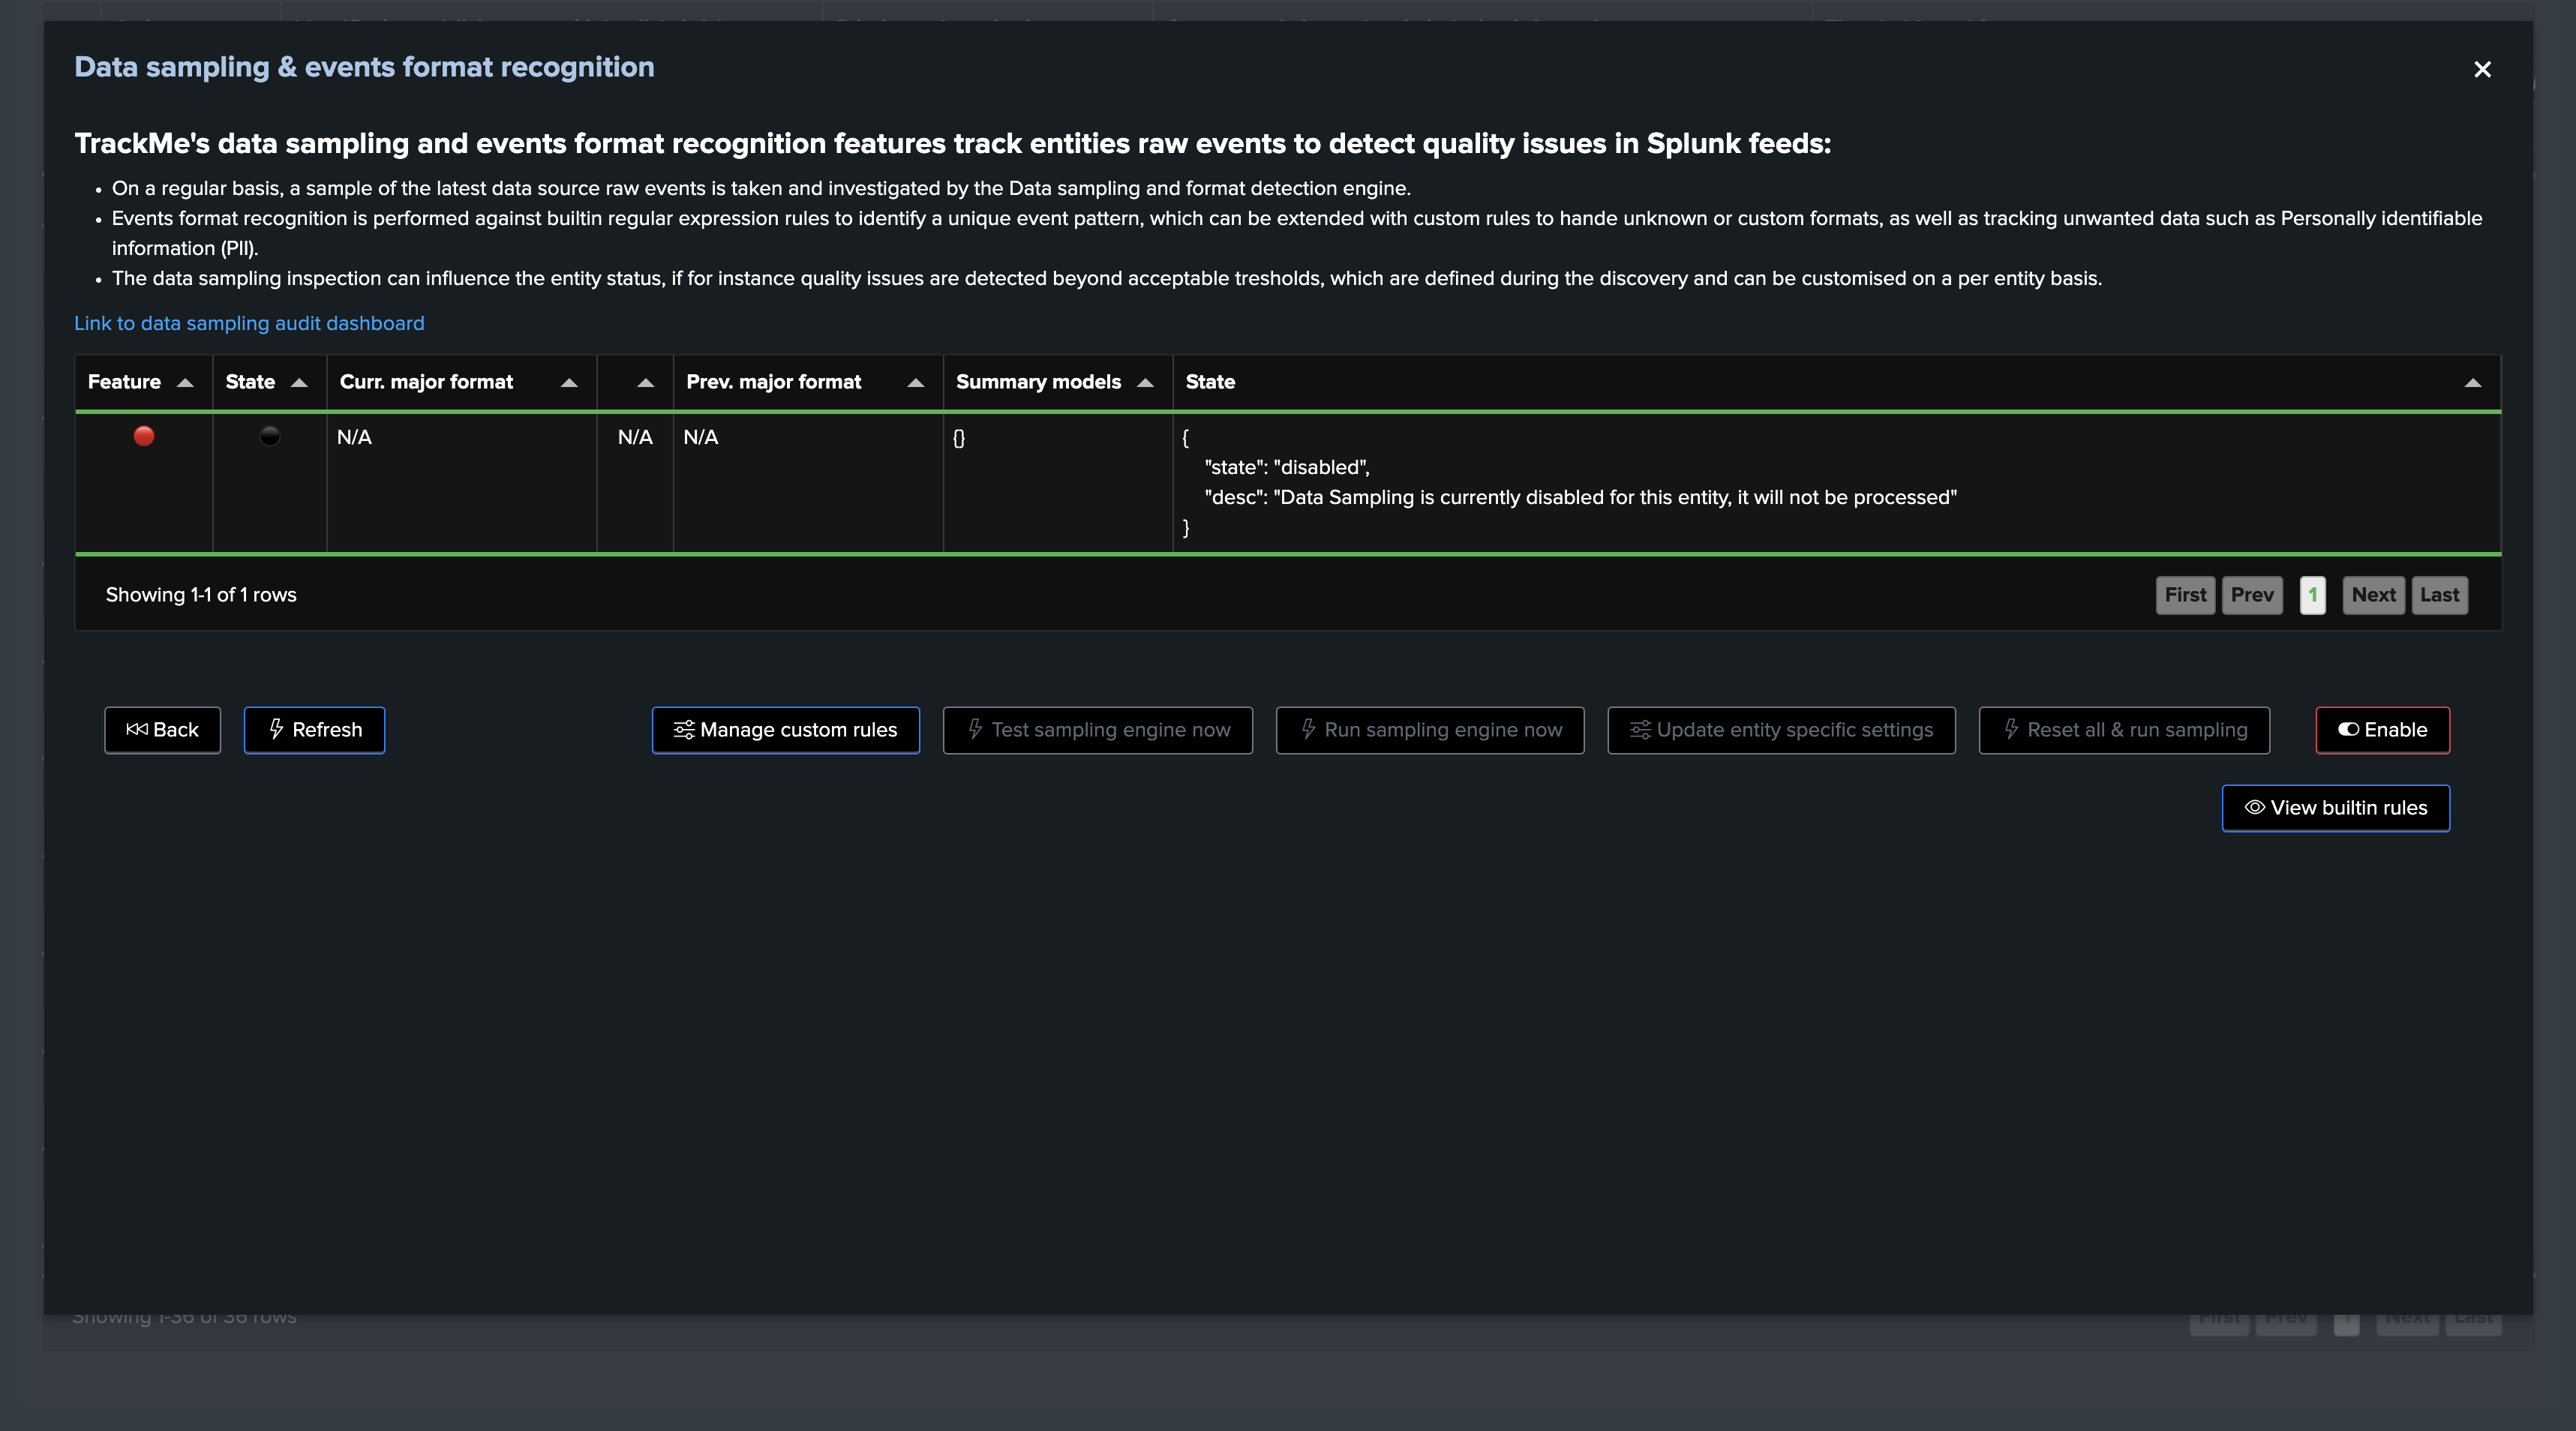
Disable Sampling for a Given Entity
You can disable the data sampling feature for a given entity, the sampling feature will be entirely disabled and the engine will never attempt to process sampling for it:
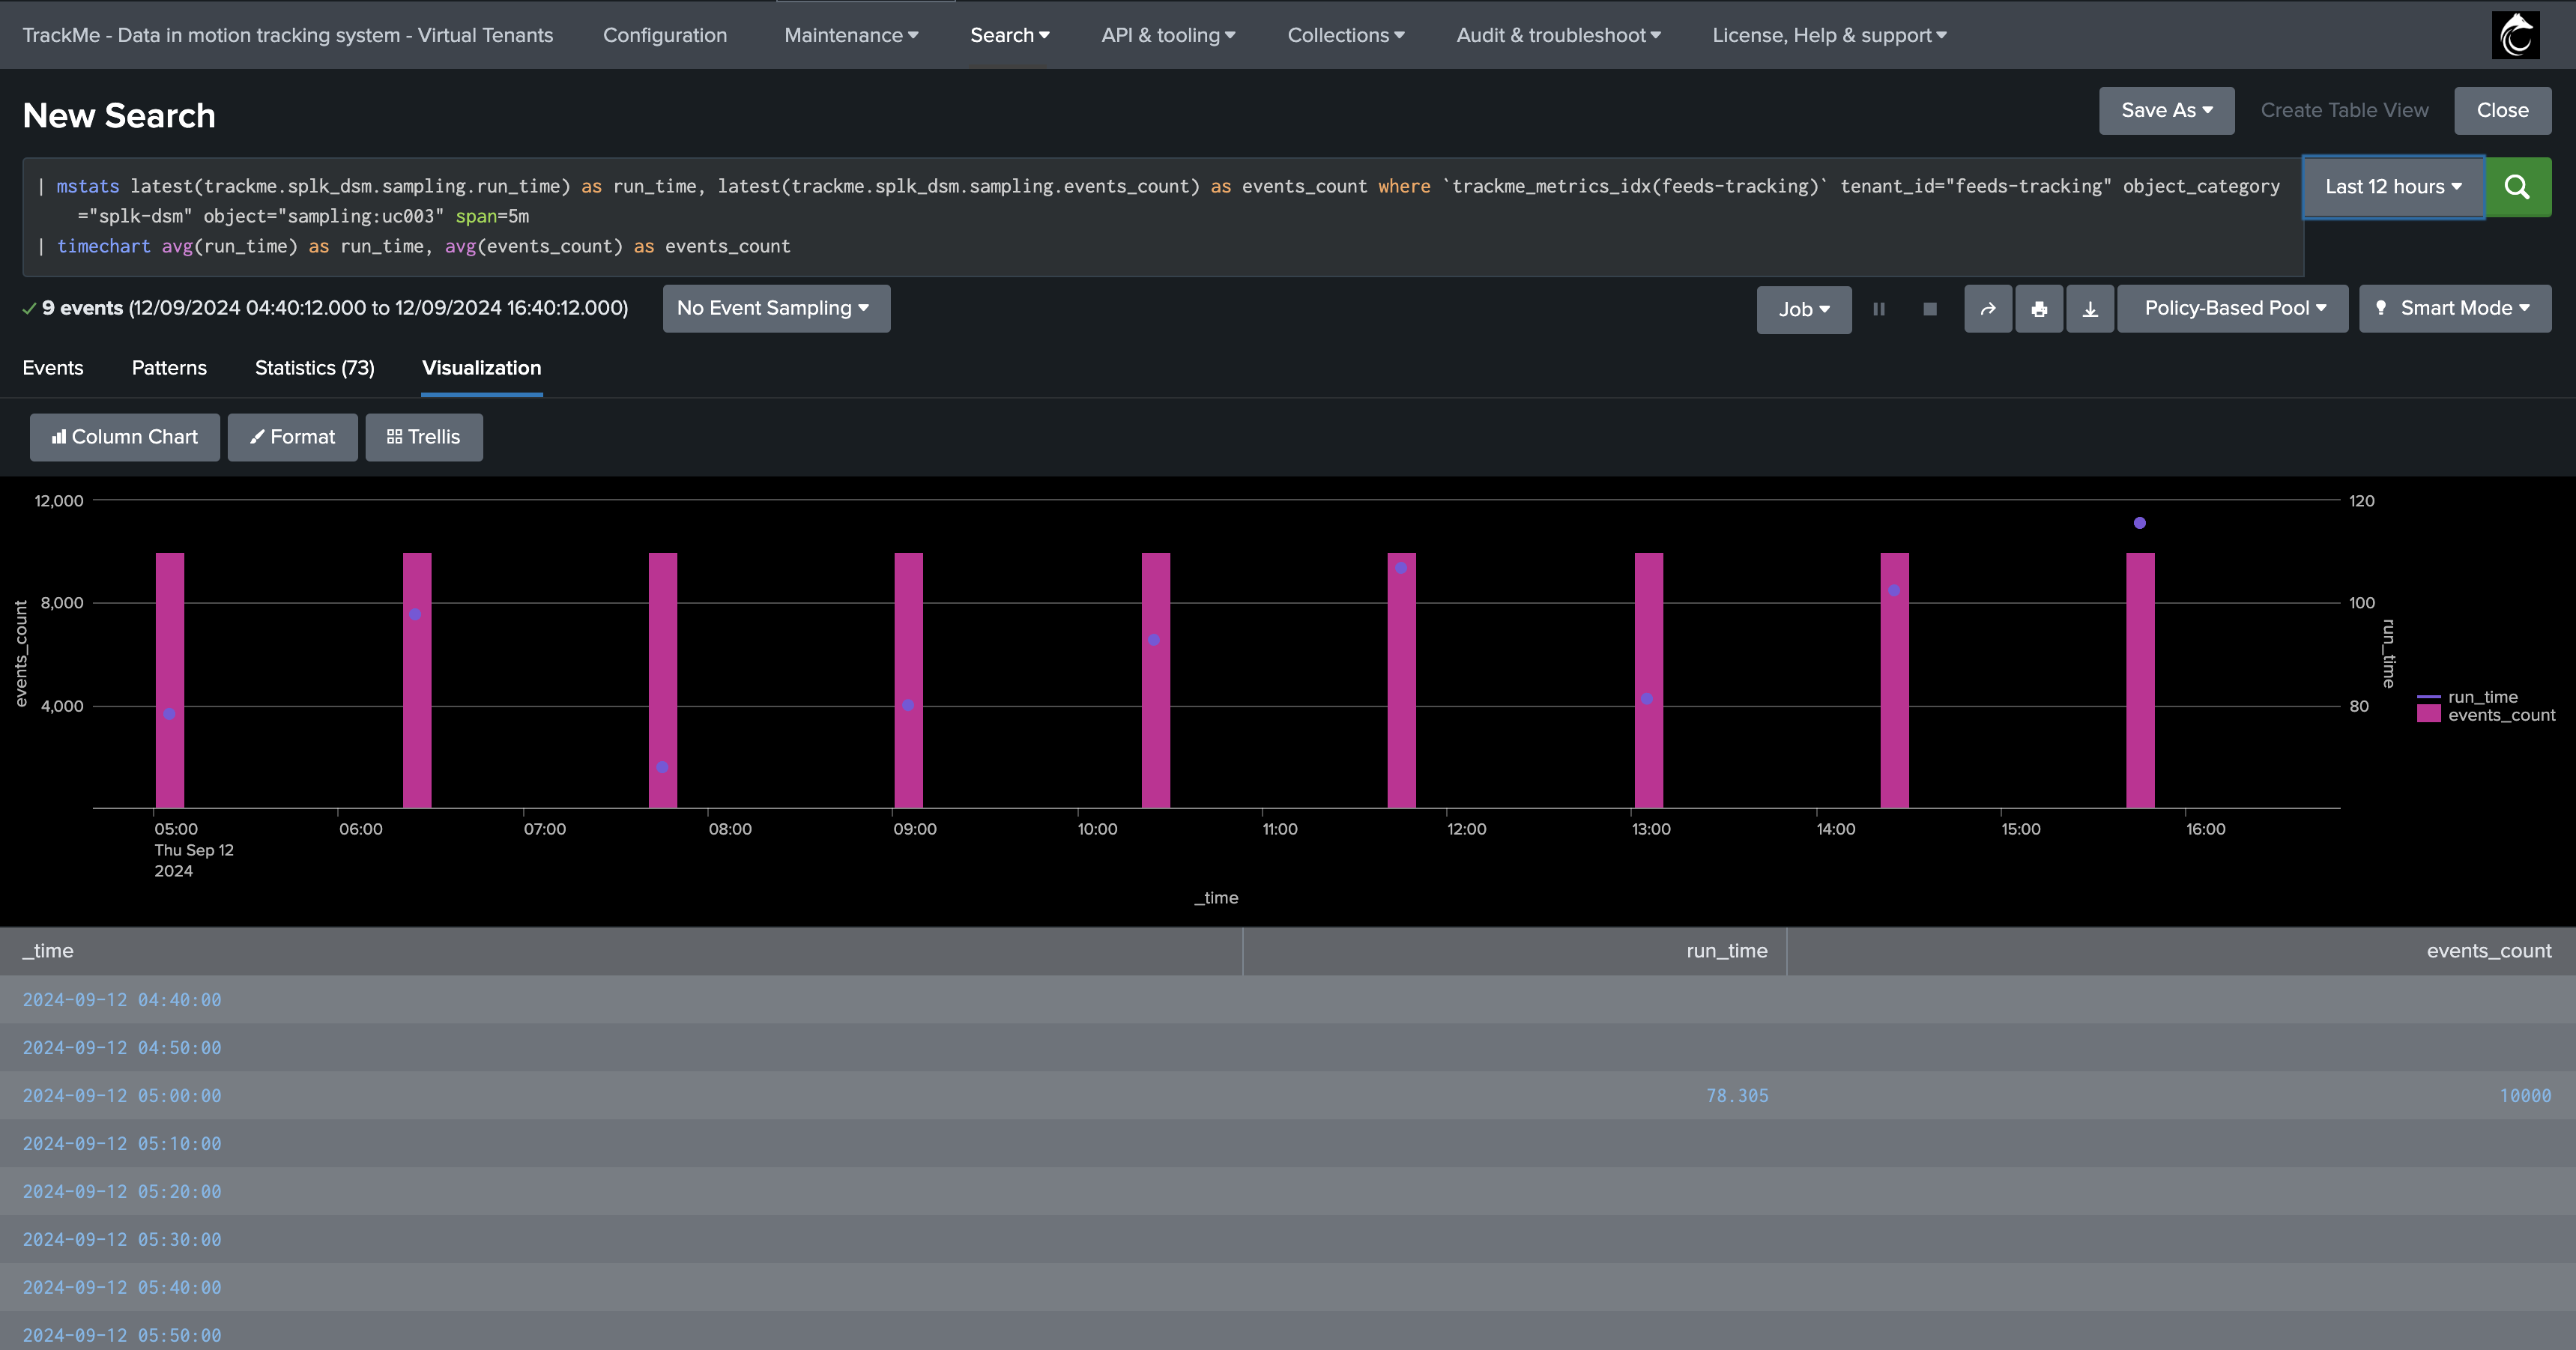
KPIs and Metrics
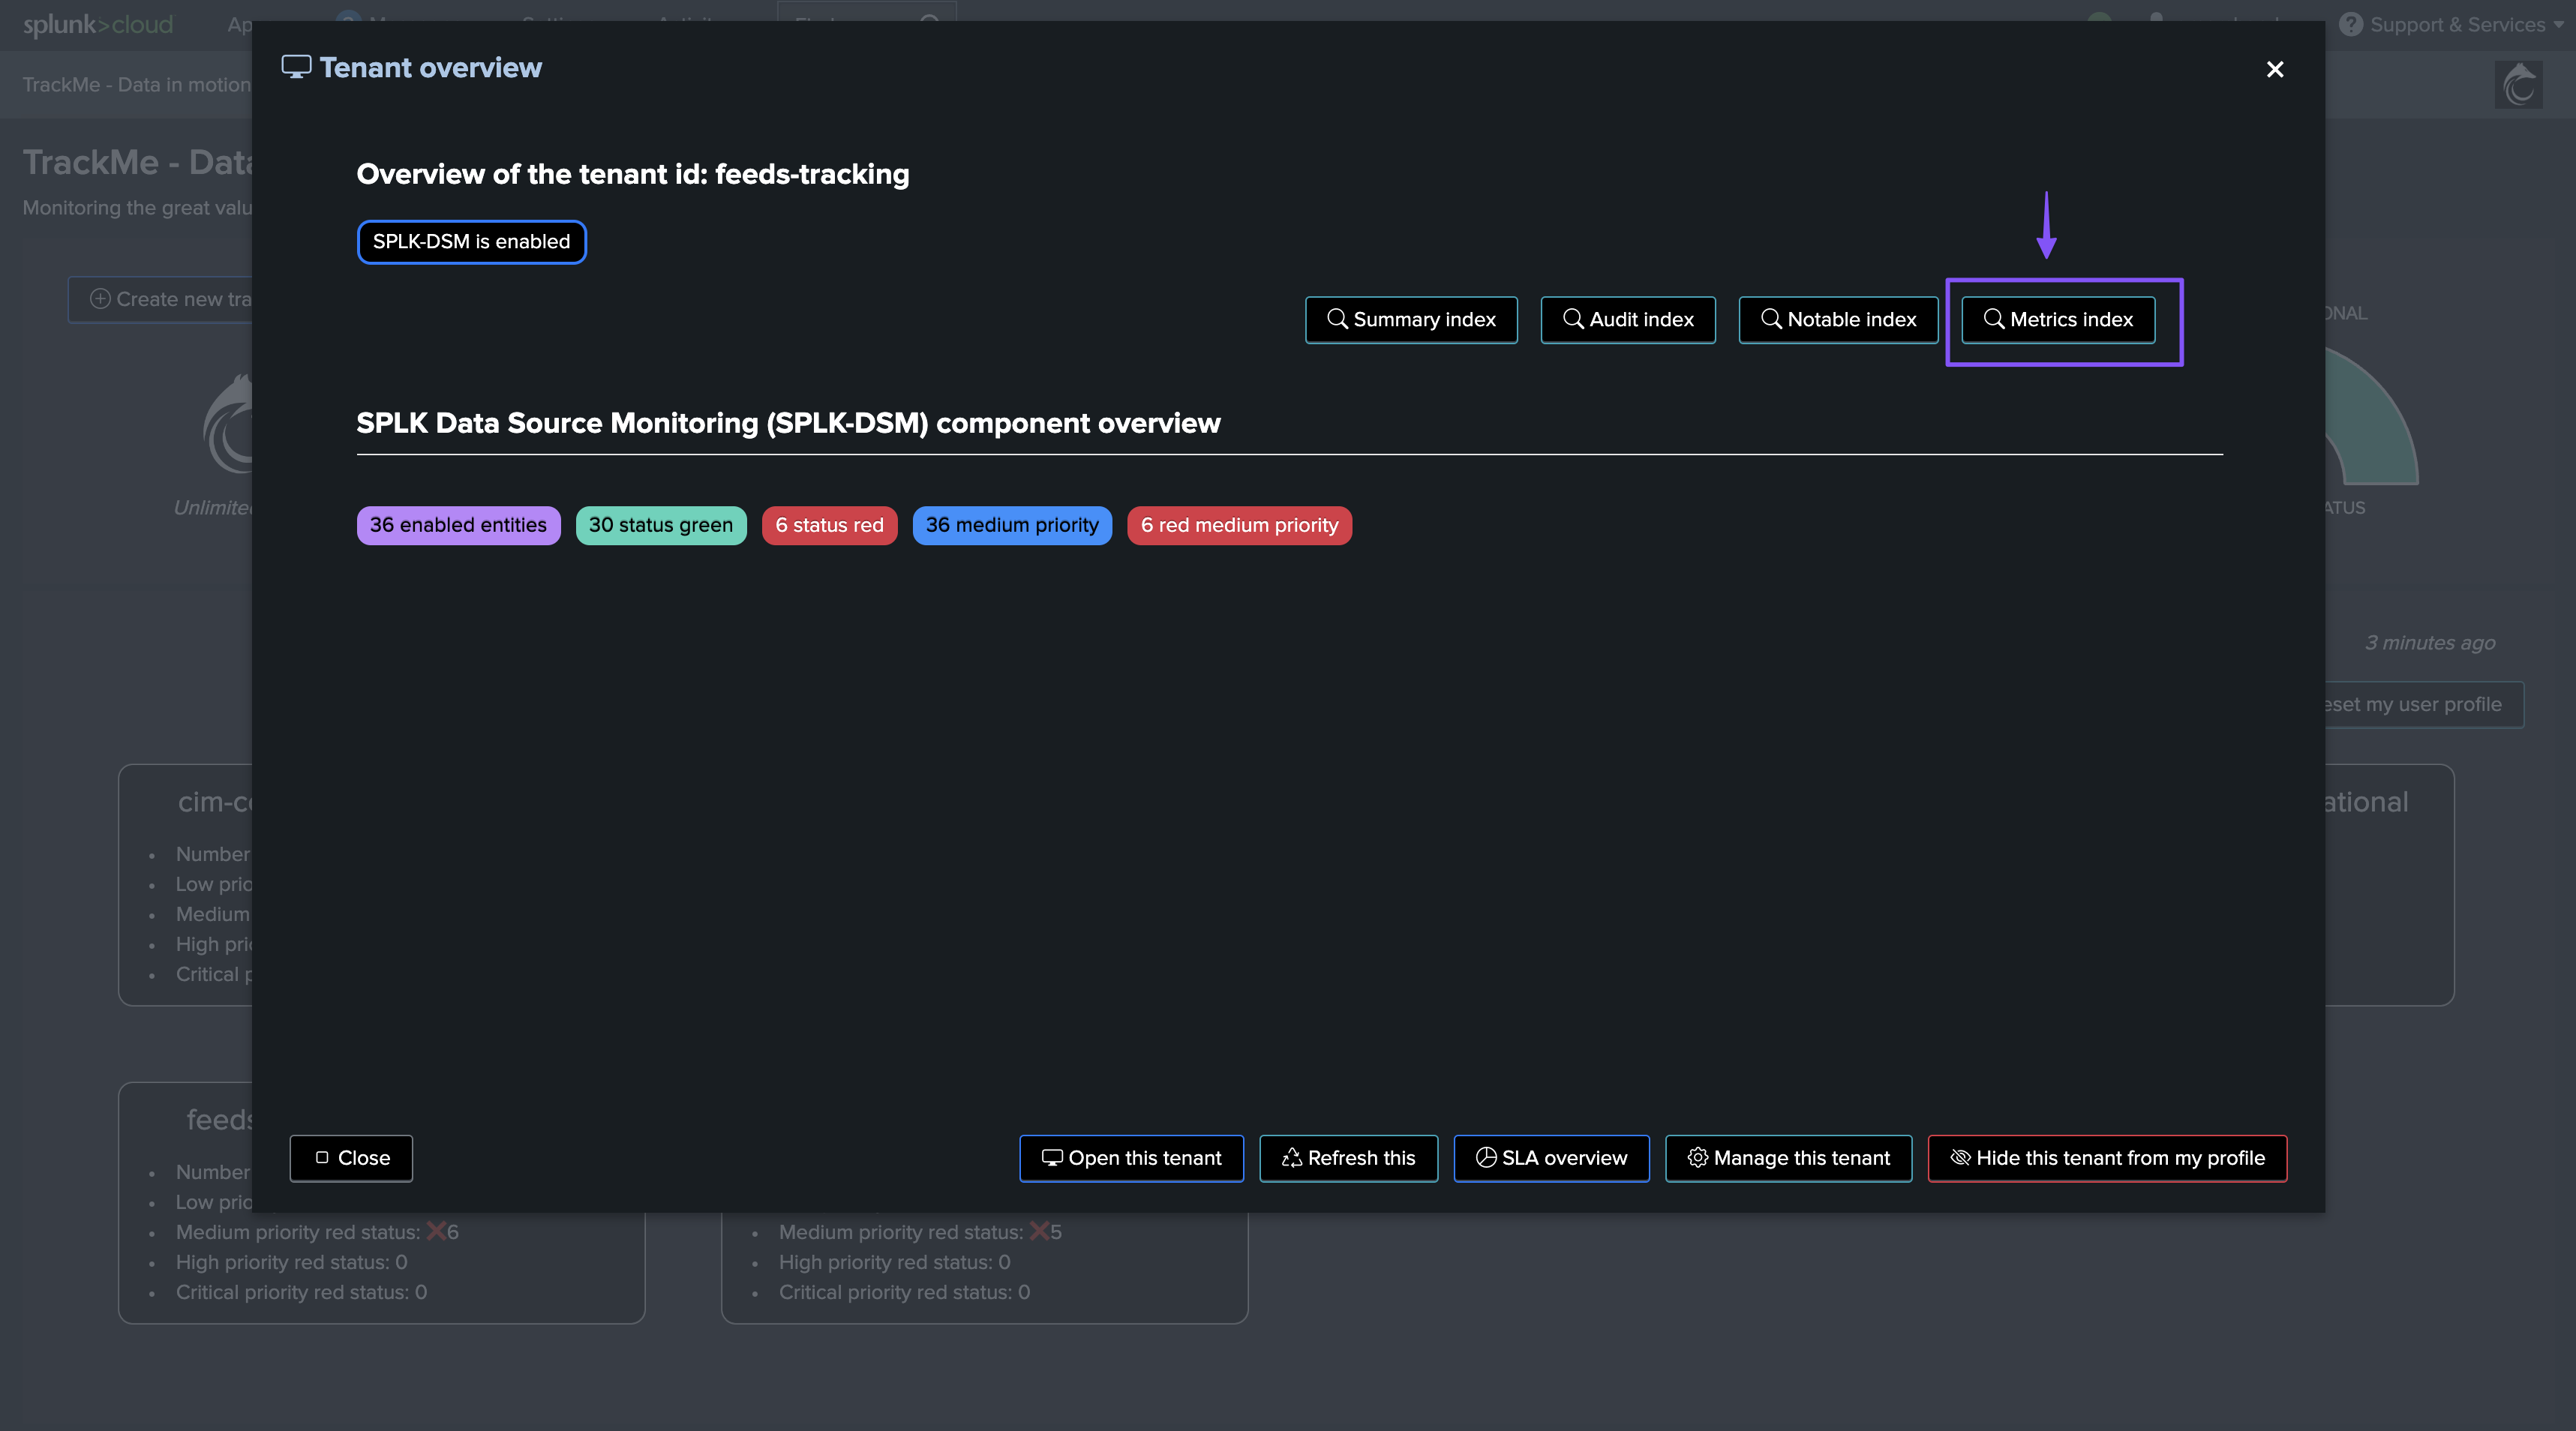
The data sampling engine generates various KPIs and metrics, which are stored in the tenant metrics index, you can access these metrics via the UI:
Examples:
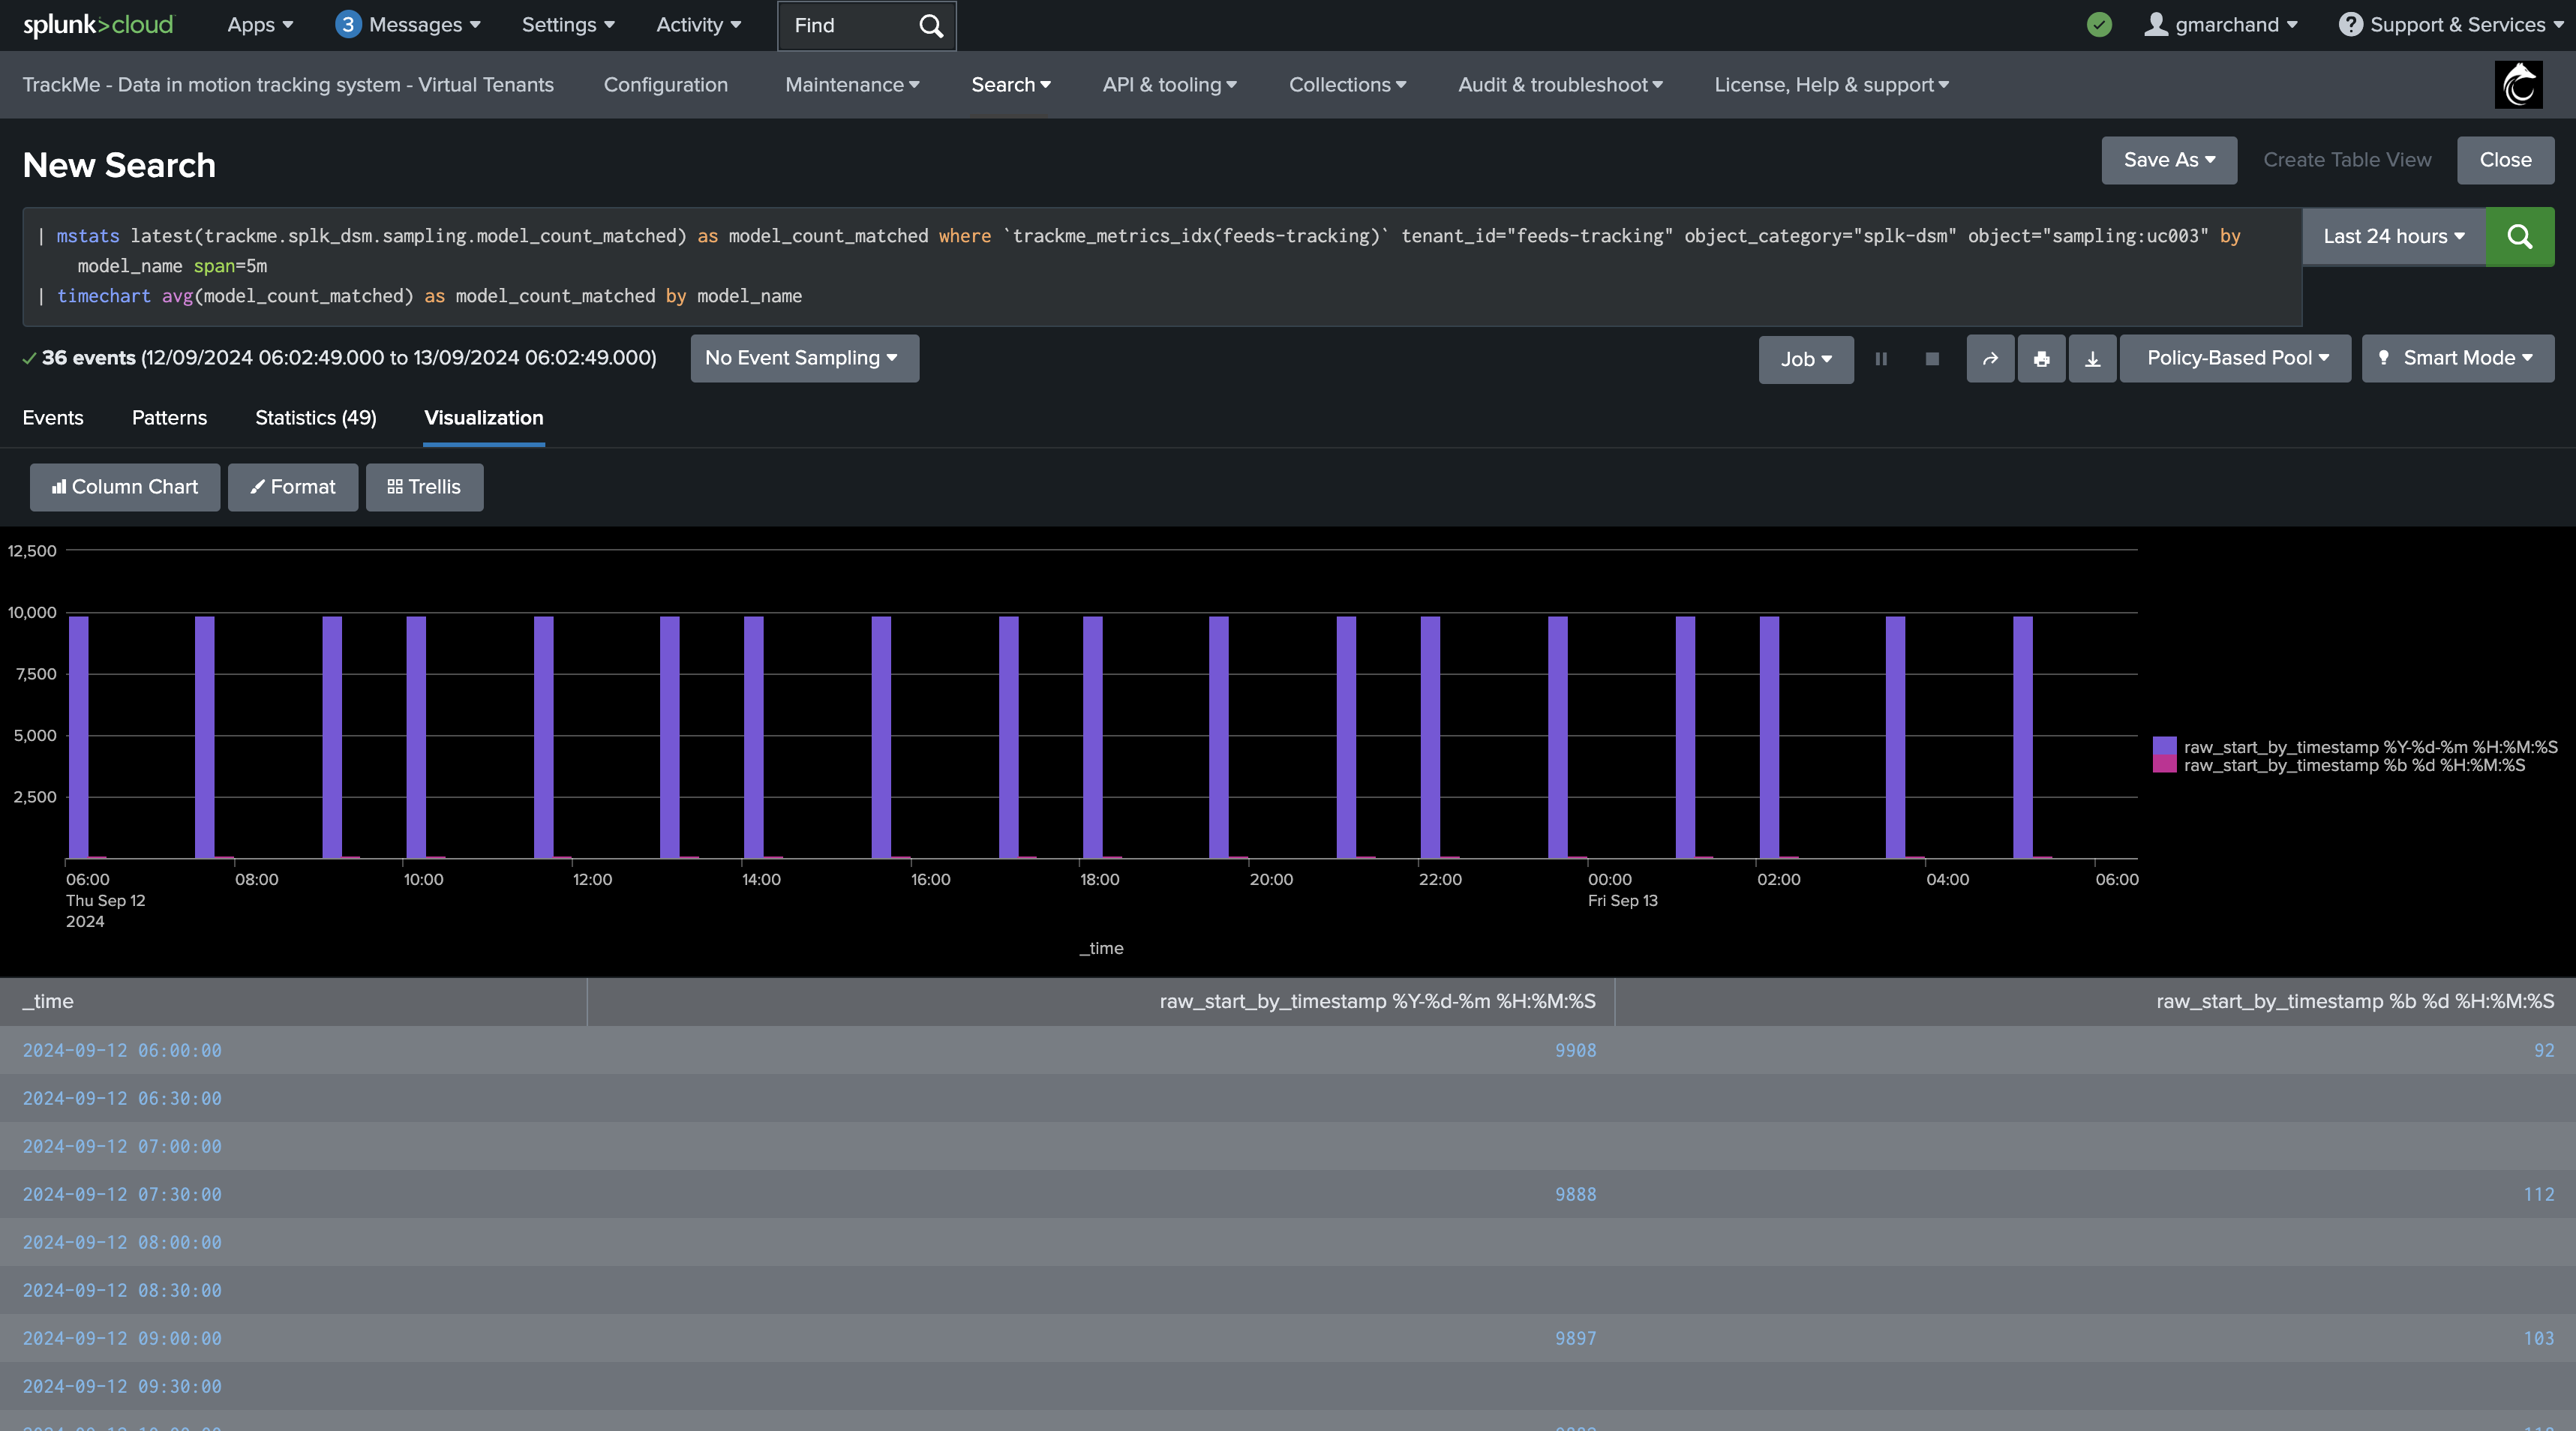
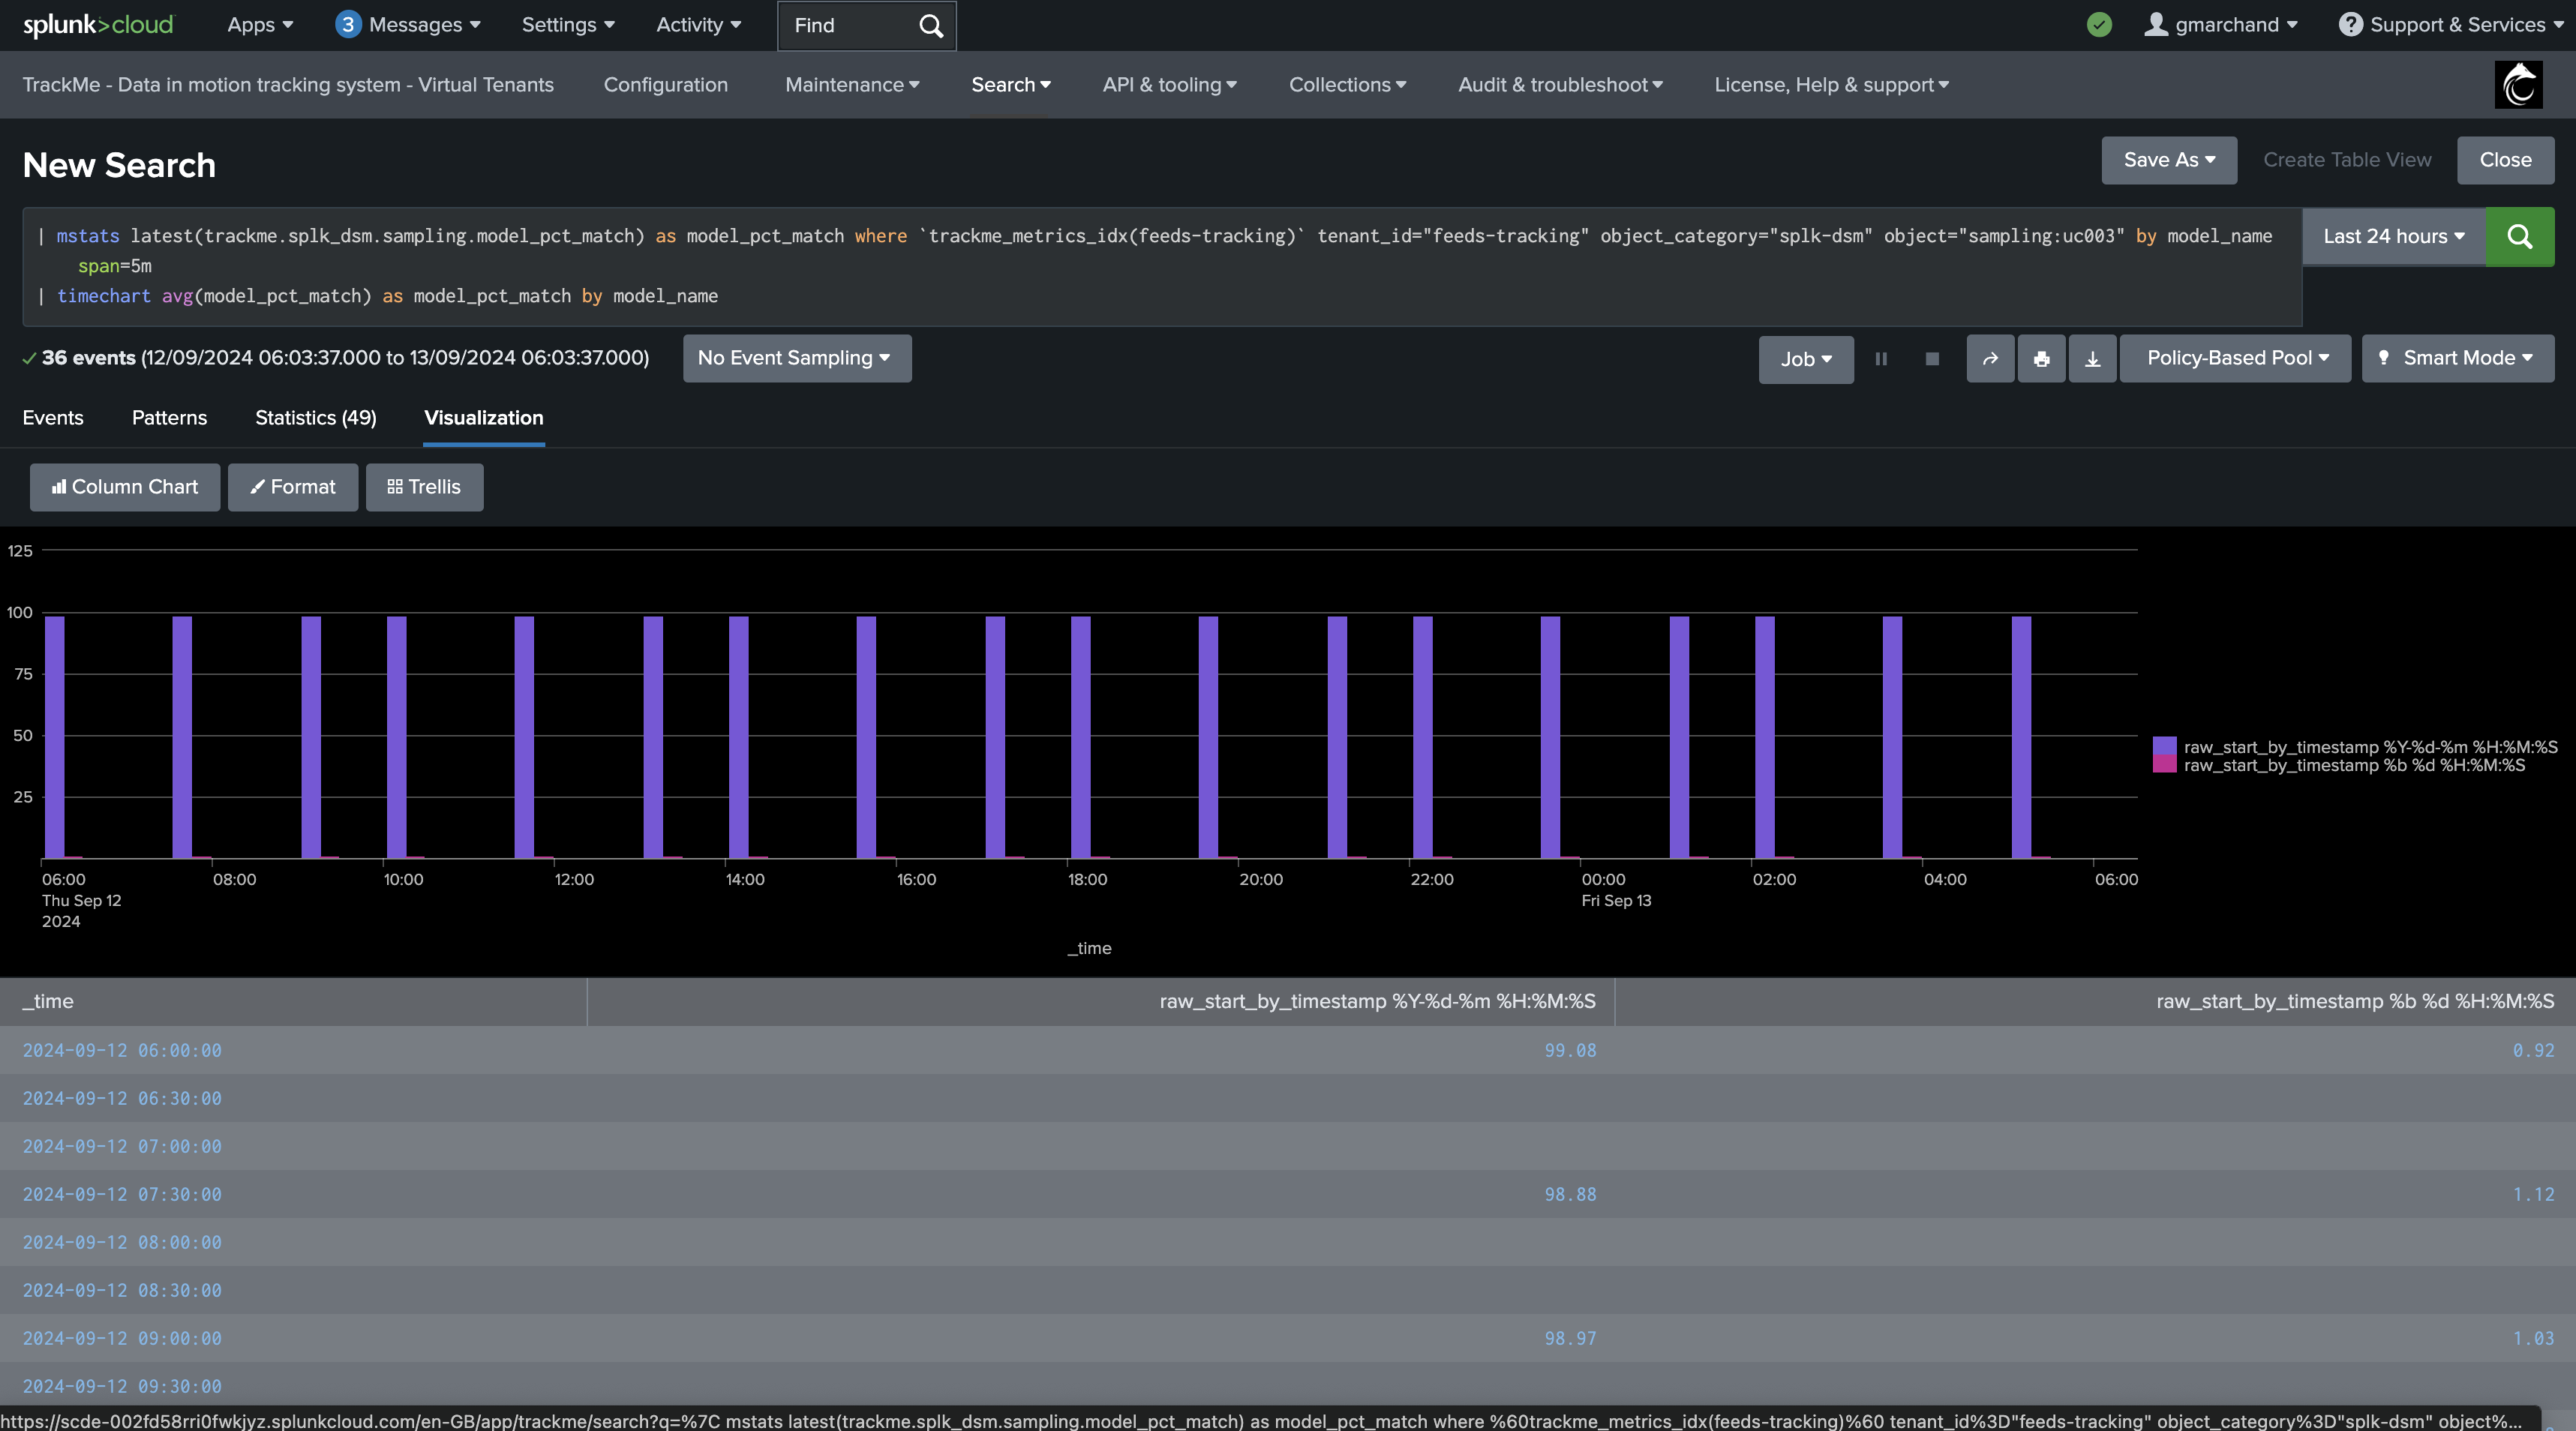
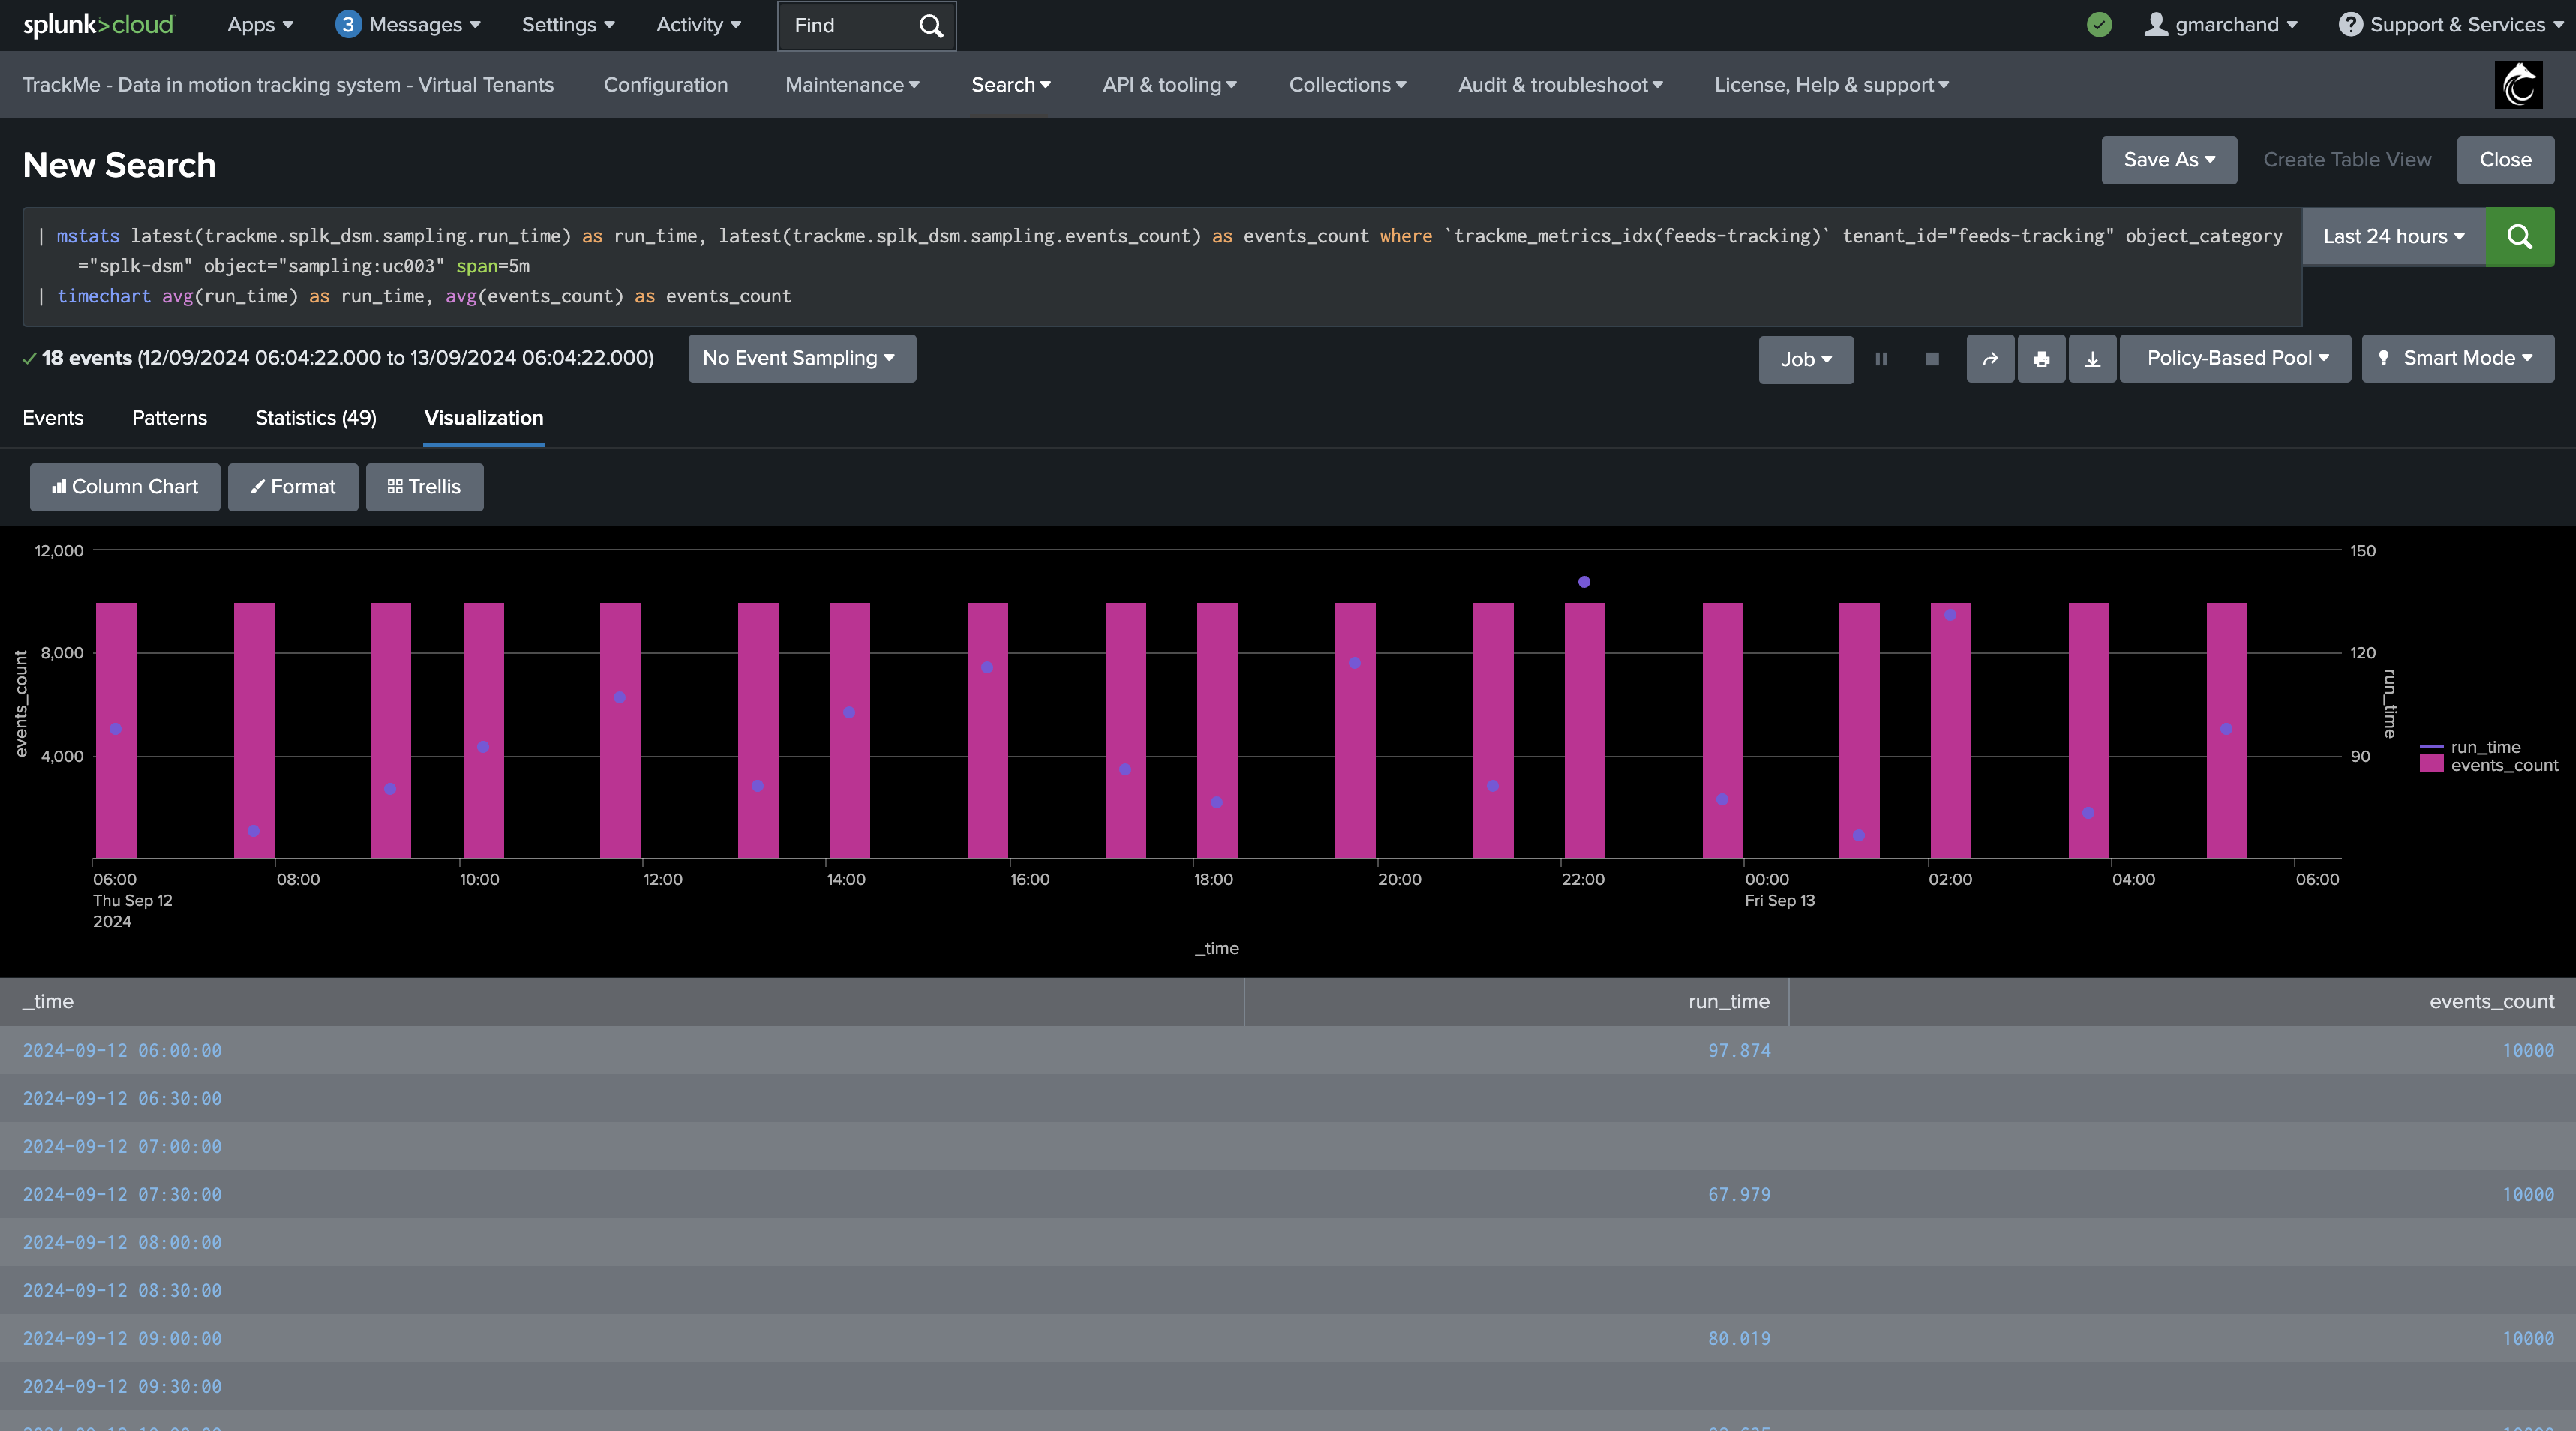
The Virtual Tenants UI provides a quick mpreview access to the tenant-related metrics:
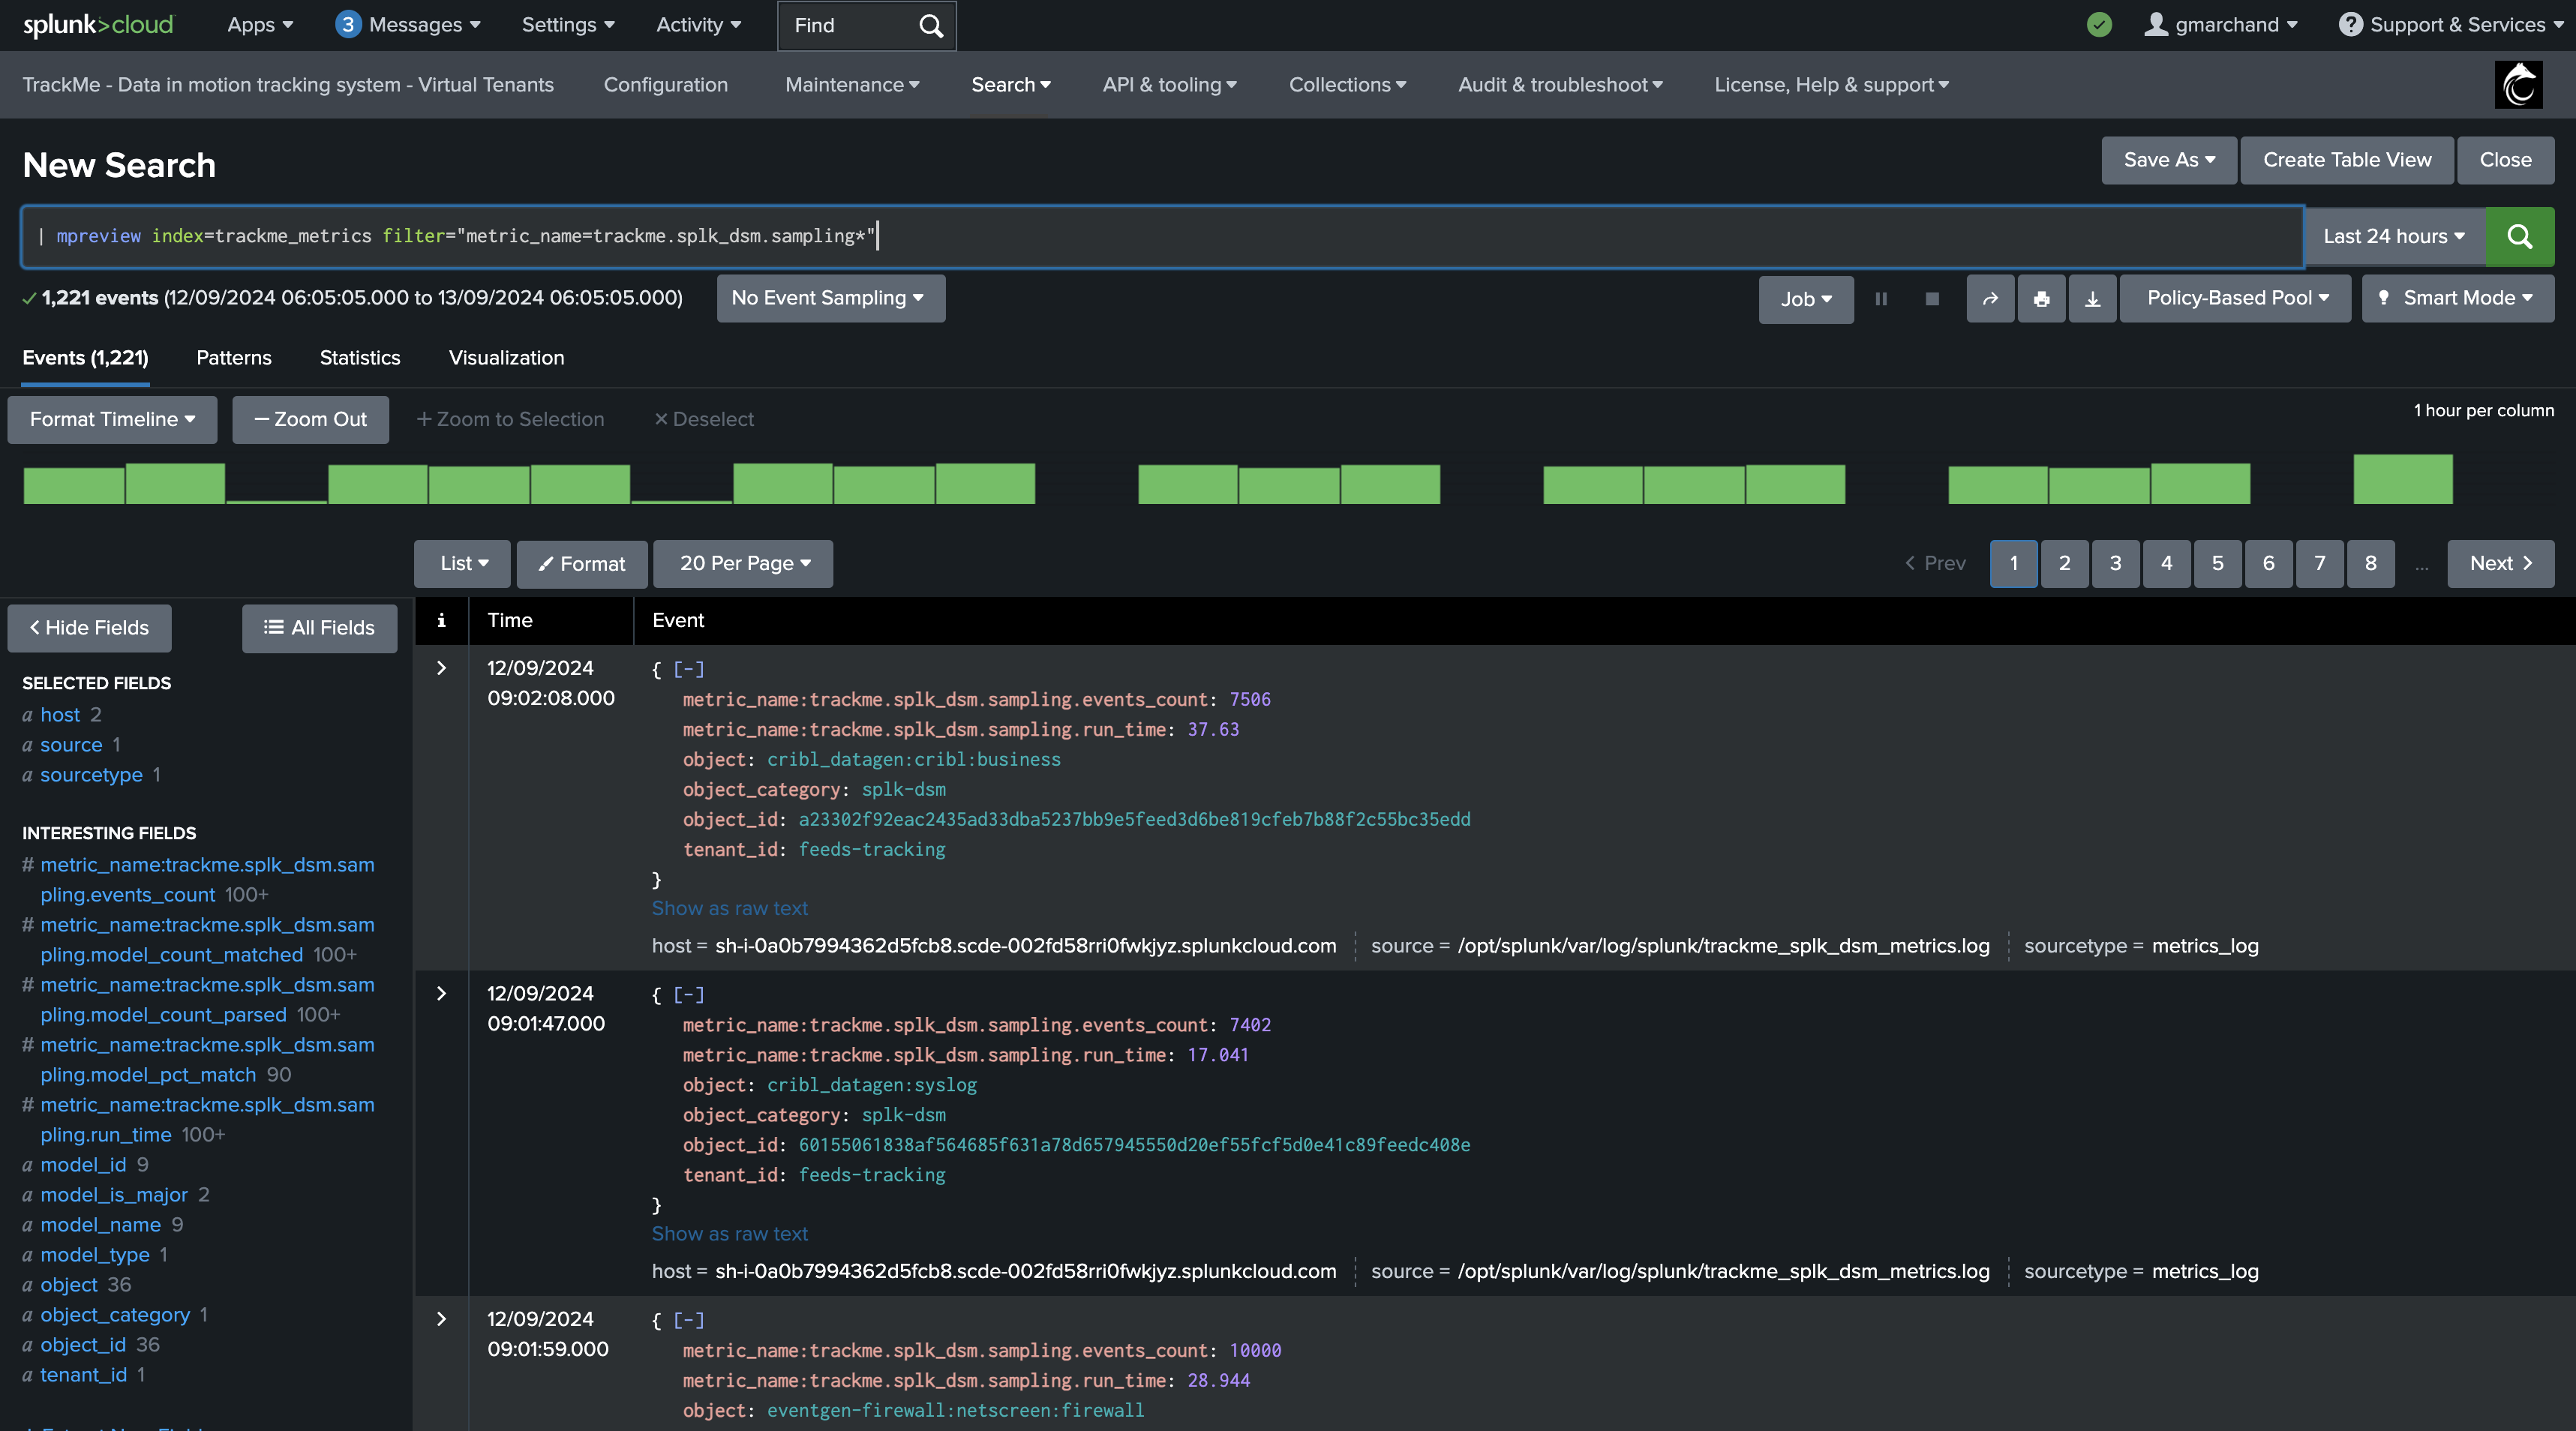
You can also use the following generic mpreview command to access the metrics: (adapt the index name if needed)
| mpreview index=trackme_metrics filter="metric_name=trackme.splk_dsm.sampling*"
Troubleshooting
Sampling Logging
Data Sampling tracker logs can be inspected through the following search:
index=_internal sourcetype=trackme:custom_commands:trackmesamplingexecutor
Any errors, unexpected exceptions can be found easily using the log_level:
index=_internal sourcetype=trackme:custom_commands:trackmesamplingexecutor log_level=error
Activity related to a specific Splunk feed, a TrackMe entity, can easily be inspected by filtering on the object value:
index=_internal sourcetype=trackme:custom_commands:trackmesamplingexecutor object="<object value>"
Inspecting the Data Sampling Tracker Execution
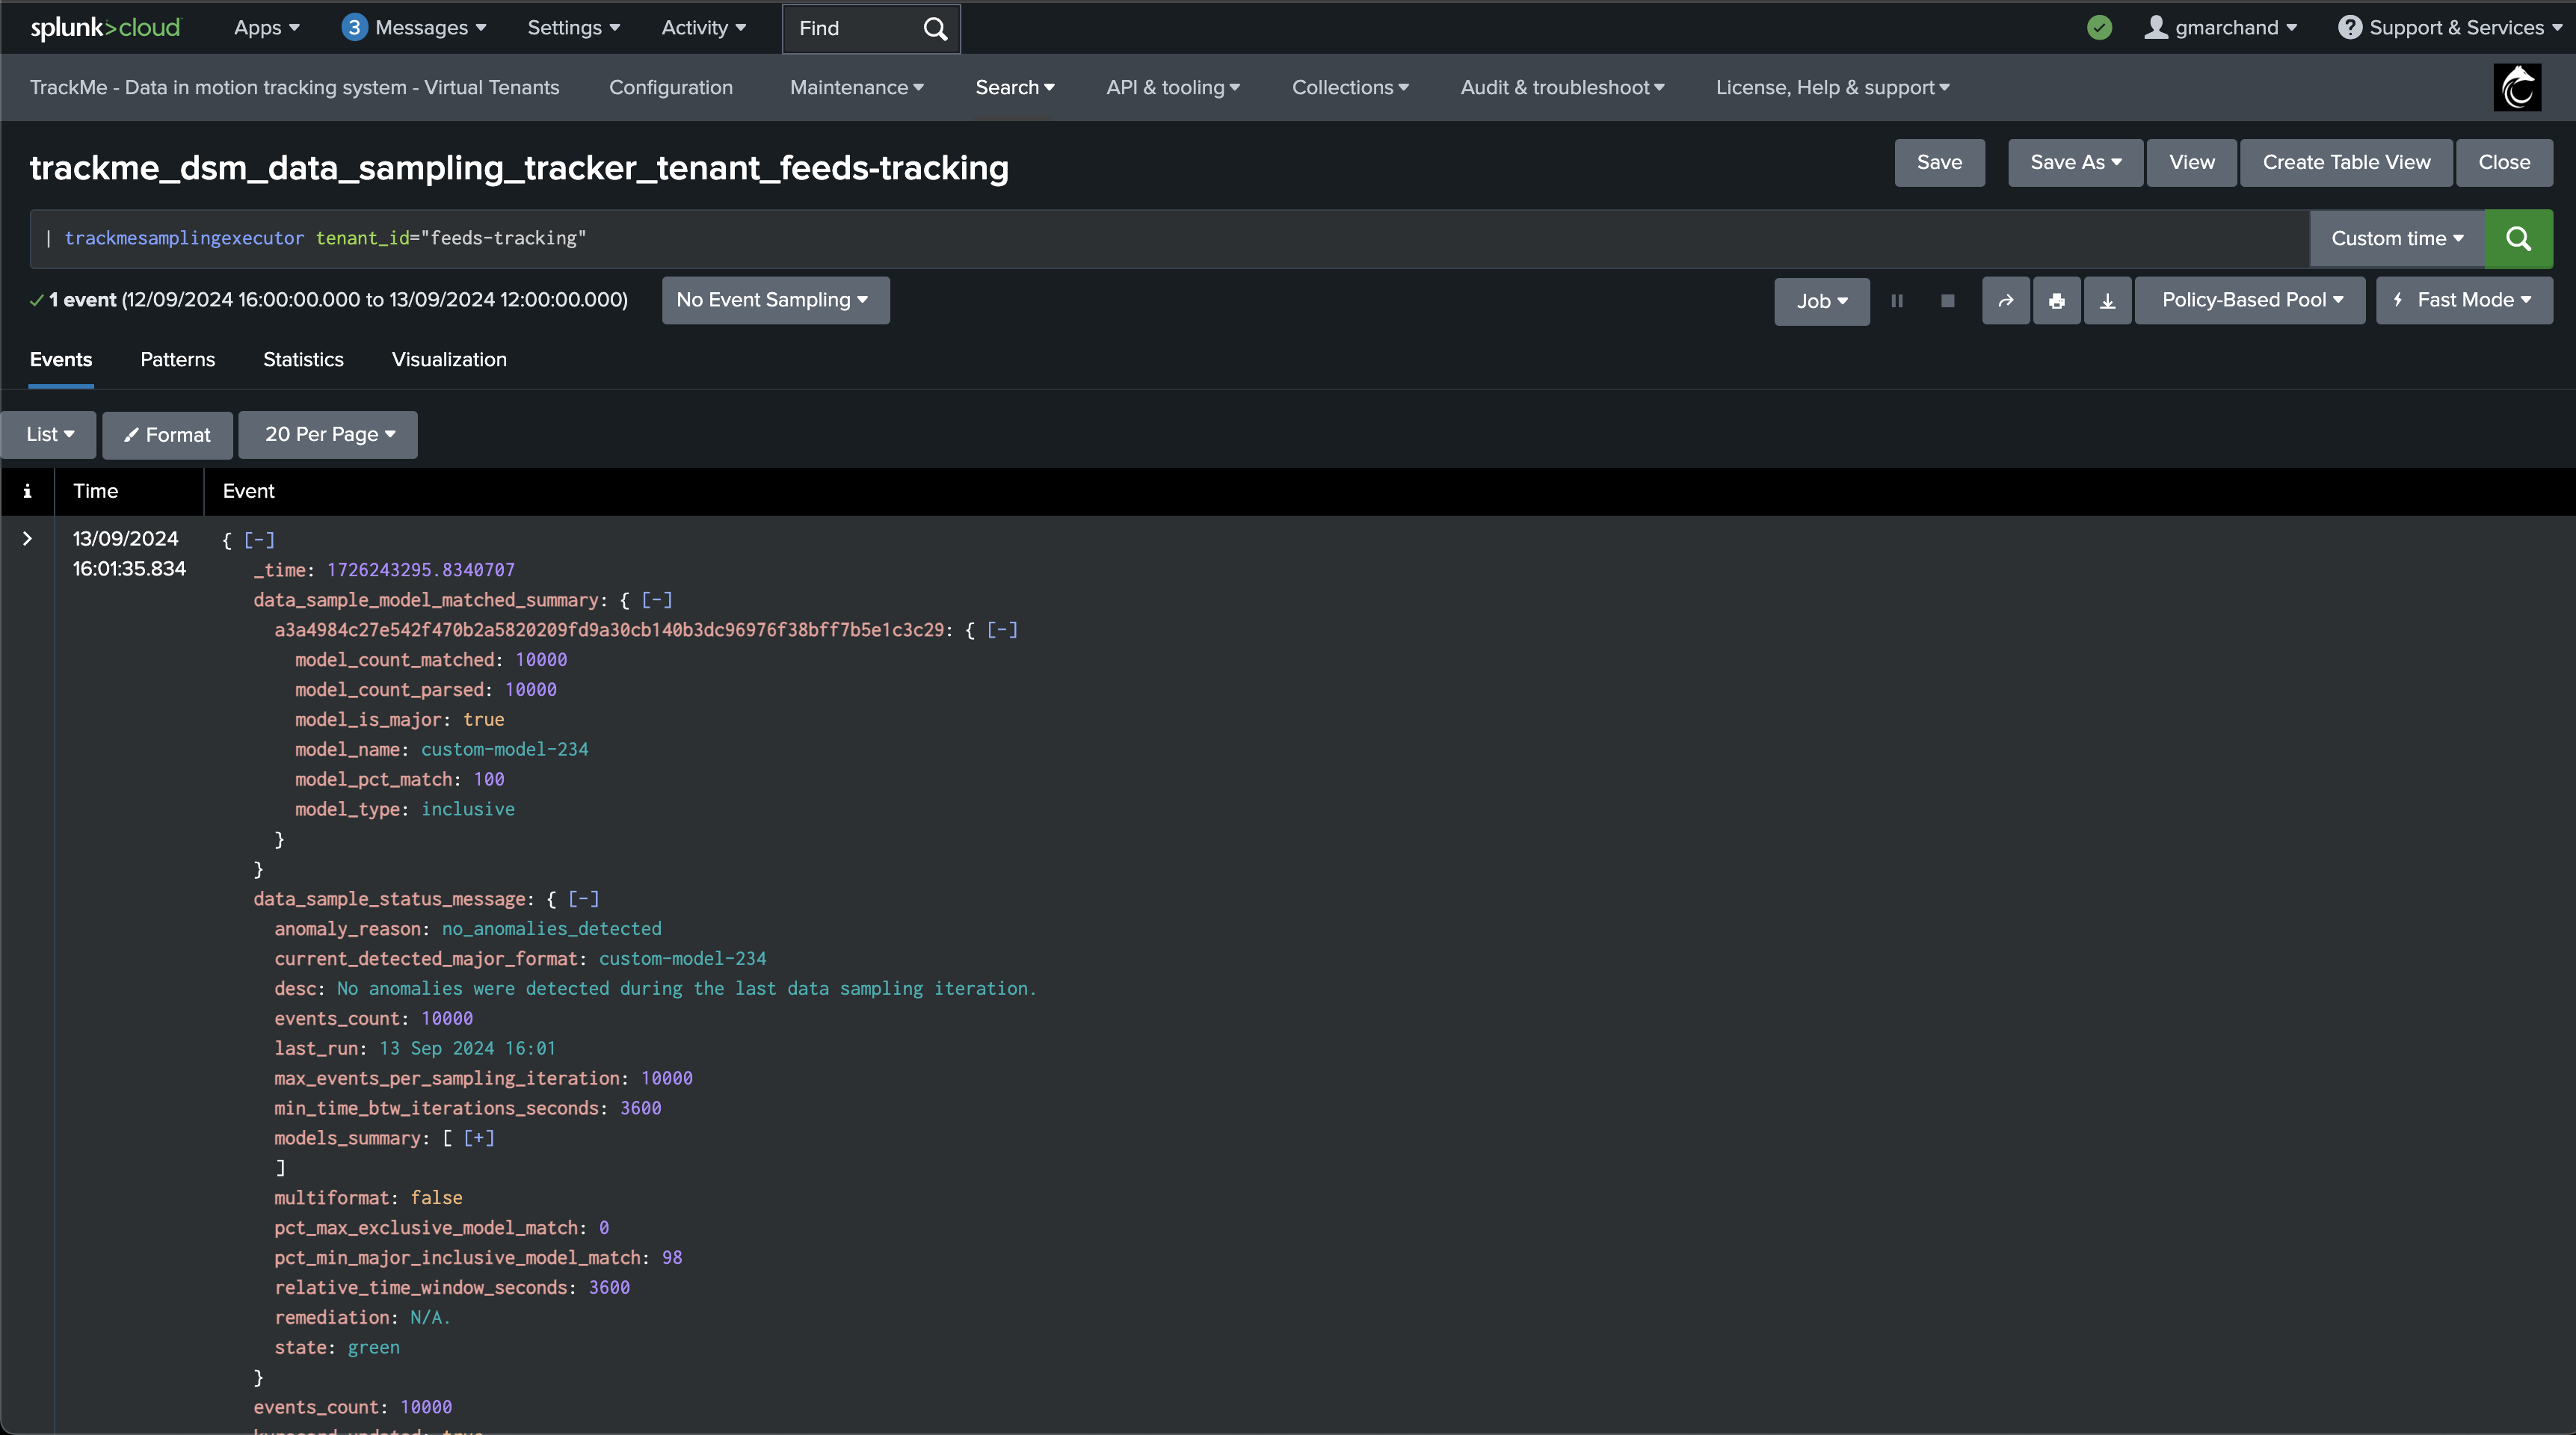
In Splunk, you can easily review the data sampling scheduled tracker, you can access the previous artifacts, or manually execute the job in case of issues:
Each entity processed results in one JSON event with all the details of the data sampling status:
Annexes
Annexe 1: System-wide Settings
Value |
Description |
Default Value |
|---|---|---|
splk_data_sampling_min_time_btw_iterations_seconds |
This defines the minimal time in seconds between data sampling iterations. TrackMe will never attempt to perform sampling for a given entity if the time since the last iteration is lower than this value. |
3600 |
splk_data_sampling_no_records_per_entity |
Defines the number of records to be sampled and verified per entity during the data sampling process. Increasing this value improves event format recognition but requires more processing per entity. |
10000 |
splk_data_sampling_no_records_saved_kvrecord |
Defines the number of records kept in the KVstore for inspection purposes at each iteration. This sample is stored for inspection and review, and increasing this value requires more KVstore storage. |
10 |
splk_data_sampling_records_kvrecord_truncate_size |
Defines the character size limit before truncating events when storing sampled records in the KVstore for inspection. This truncation only affects storage and does not impact the model training process. |
40000 |
splk_data_sampling_pct_min_major_inclusive_model_match |
Defines the minimum percentage of events that must match the major inclusive model. If the main model has less than this percentage of matching events, the entity’s state will be impacted. |
98 |
splk_data_sampling_pct_max_exclusive_model_match |
Defines the maximum percentage of events matching an exclusive model that can be accepted. By default, no events matching an exclusive model are accepted, but this can be increased per entity. |
95 |
splk_data_sampling_relative_time_window_seconds |
Defines the size of the time window for sampling operations in seconds, relative to the latest event time known for the entity. This time window is used to calculate the earliest time for sampling searches. |
3600 |