Use Case Demo: This is All About Feeds
Hint
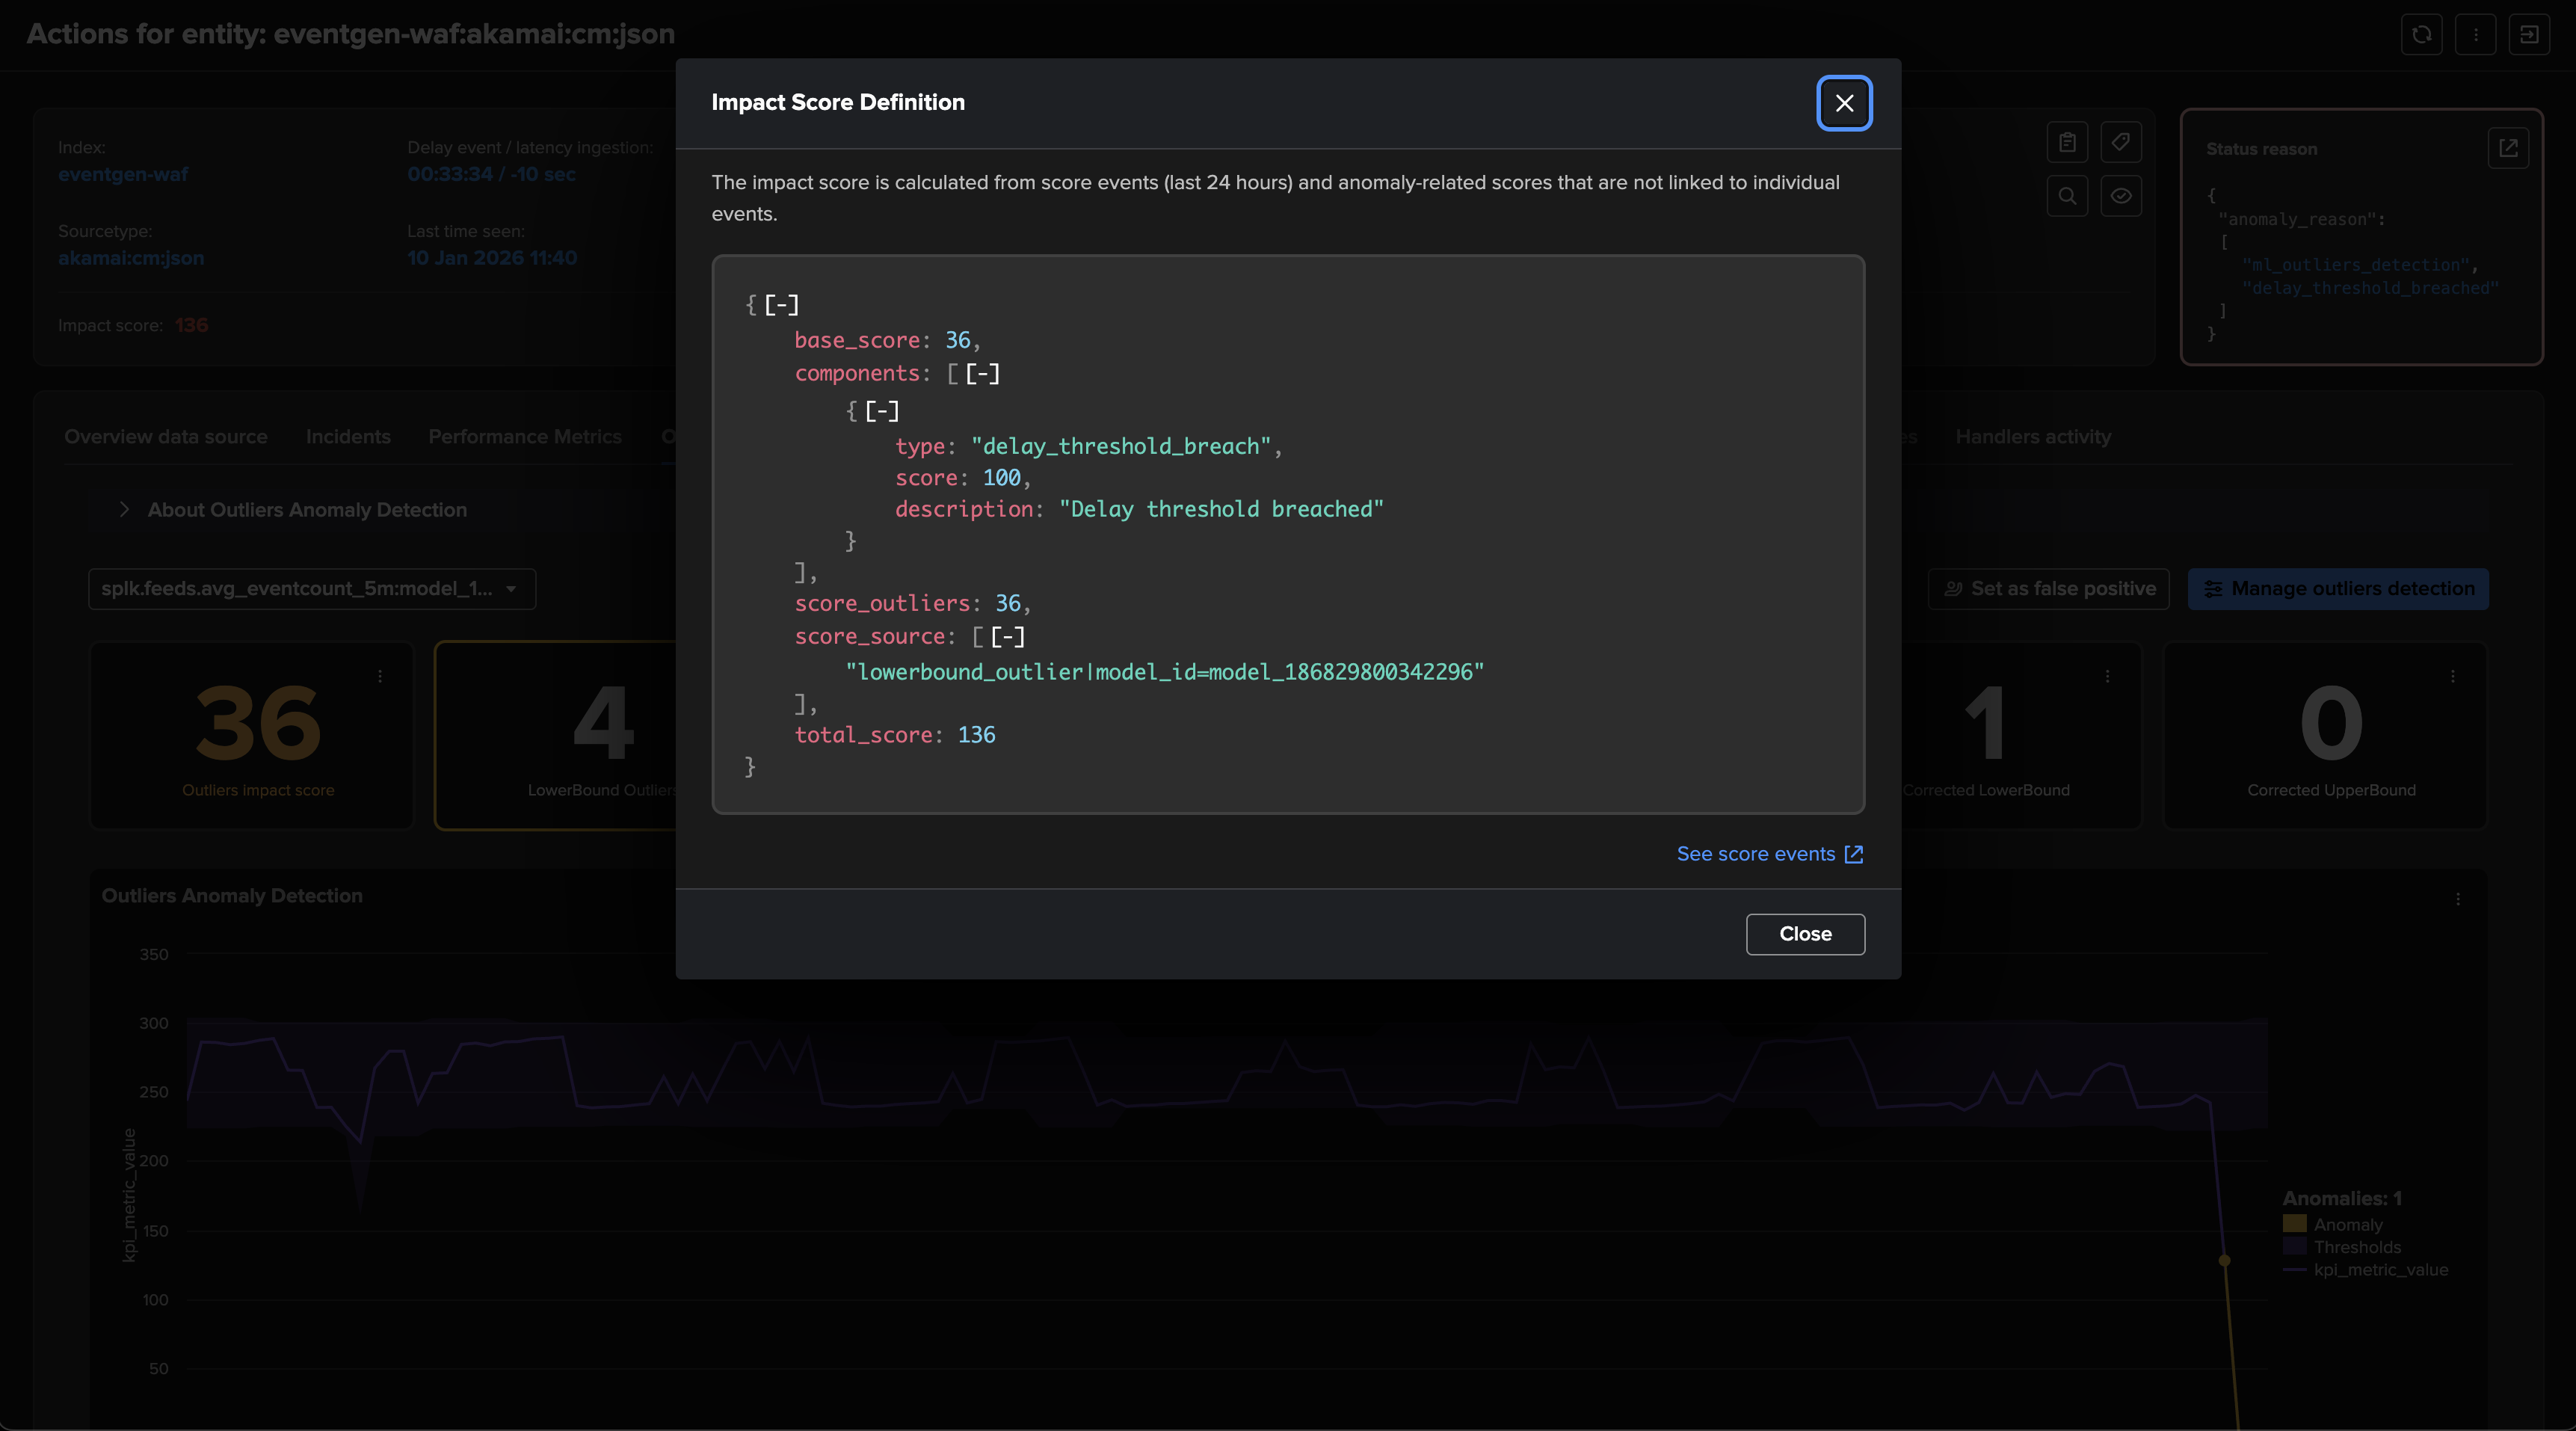
About impact score since TrackMe v2.3.5
Since this release, TrackMe implements an impact score system to determine the status of an entity based on the KPIs, thresholds and anomalies.
Impact score based analysis provides deep flexibility and control.
The impact score is influenced by anomalies weights, such as a delay breach, as well as score events that can be generated by analysts (declaring false positives, manual score influence, etc.) or the system itself. (outliers detection for instance)
Use Case Demo: This is All About Feeds
This white paper provides an overview of Splunk feeds tracking with TrackMe.
It covers the key concepts and features around tracking data sources and hosts availability and indexing performance.
Feeds tracking is a key feature of TrackMe, representing the root use case of TrackMe, and in many cases, the first reason why customers use TrackMe.
This use case demo documentation explains and demonstrates the key features of TrackMe feeds tracking.
High Level Overview
At the source of TrackMe concepts stands the idea of tracking data sources and hosts availability and indexing performance.
The key features can be summarized as follows:
Discovery: Discover and organize data sources automatically based on meaningful key metadata.Persistence: Persist entities and their key information over iterations, using various features from Splunk KVstore collections to events and metrics indexing.Availability: Track entities availability over time based ondelaythresholds, to detect when a given entity has stopped forwarding events to Splunk.Performance: Track entities indexing performance over time based onlatencythresholds, to detect when a given entity is suffering from indexing performance issues.Quality: Provide out-of-the-box and automated capabilities to detect meaningful lack of quality in the entities data.Metrics: Generate and store metrics in a high-performance way, using Splunk metric store capabilities.Knowledge: Accumulate knowledge over time to improve investigations and decision-making.Machine Learning: Implement meaningful and automated Machine Learning models to detect volume variations and potential anomalies on entities.Flexibility: Provide flexible and powerful capabilities to cover from basic tracking use cases to the most complex ones.Alerting: Provide out-of-the-box powerful and advanced alerting capabilities, from state-aware alerting to rich email deliveries, state-aware actions, and more.Scalability: Scale at any level, from few terabytes environments to hundreds of terabytes environments.User Experience: Provide a rich, easy, and fast user experience, with user interfaces and APIs that provide fast answers and browsing capabilities with TrackMe entities.
This use demo documentation covers four common and most valuable feeds related use cases:
Feed Interruption DetectionFeed Indexing Performance Issues DetectionFeed Volume Variation DetectionFeed Quality Issues DetectionFeed Hosts Distinct Count Anomaly Detection
Many more use cases can be implemented with TrackMe, and through our Flex Trackers components, you can create custom monitoring solutions tailored to your specific needs.
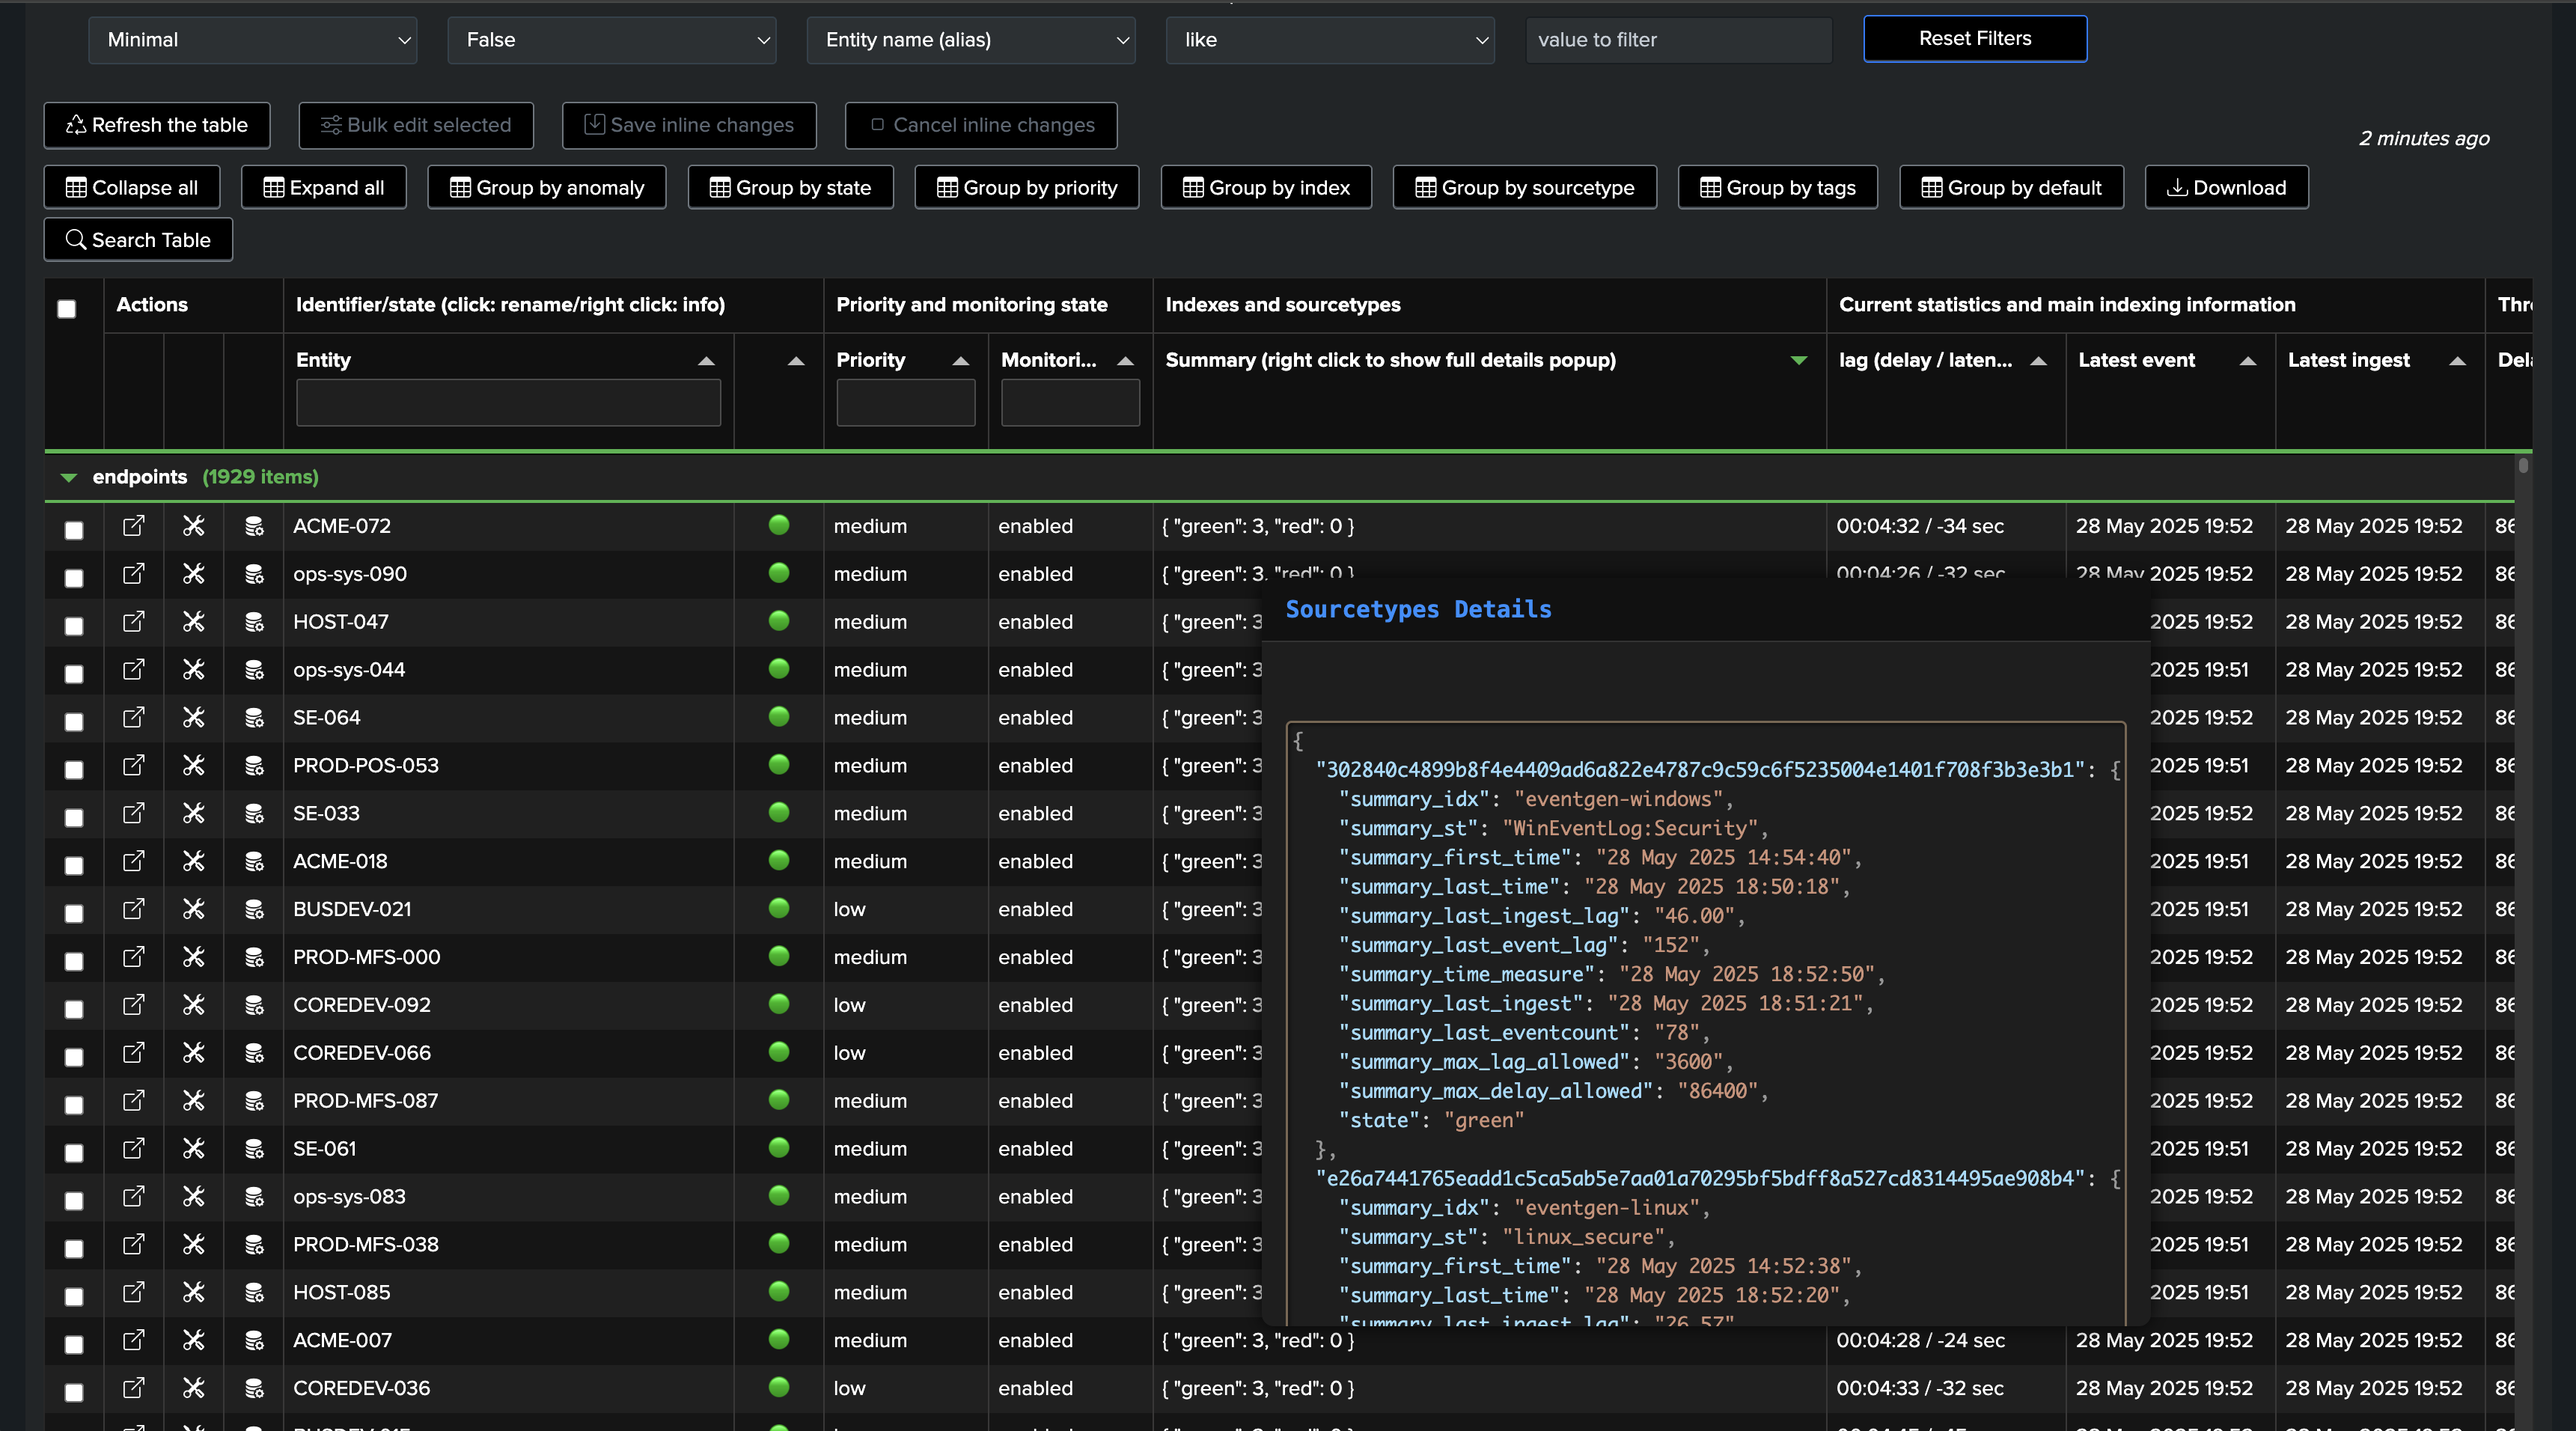
Feeds Tracking with TrackMe Data Sources Monitoring (splk-dsm)
The Data Sources Monitoring TrackMe component (splk-dsm) is the key component to track data sources availability and indexing performance.
In its simplest form, it is tracking feeds, creating and organising entities based on indexes and sourcetypes metadata.
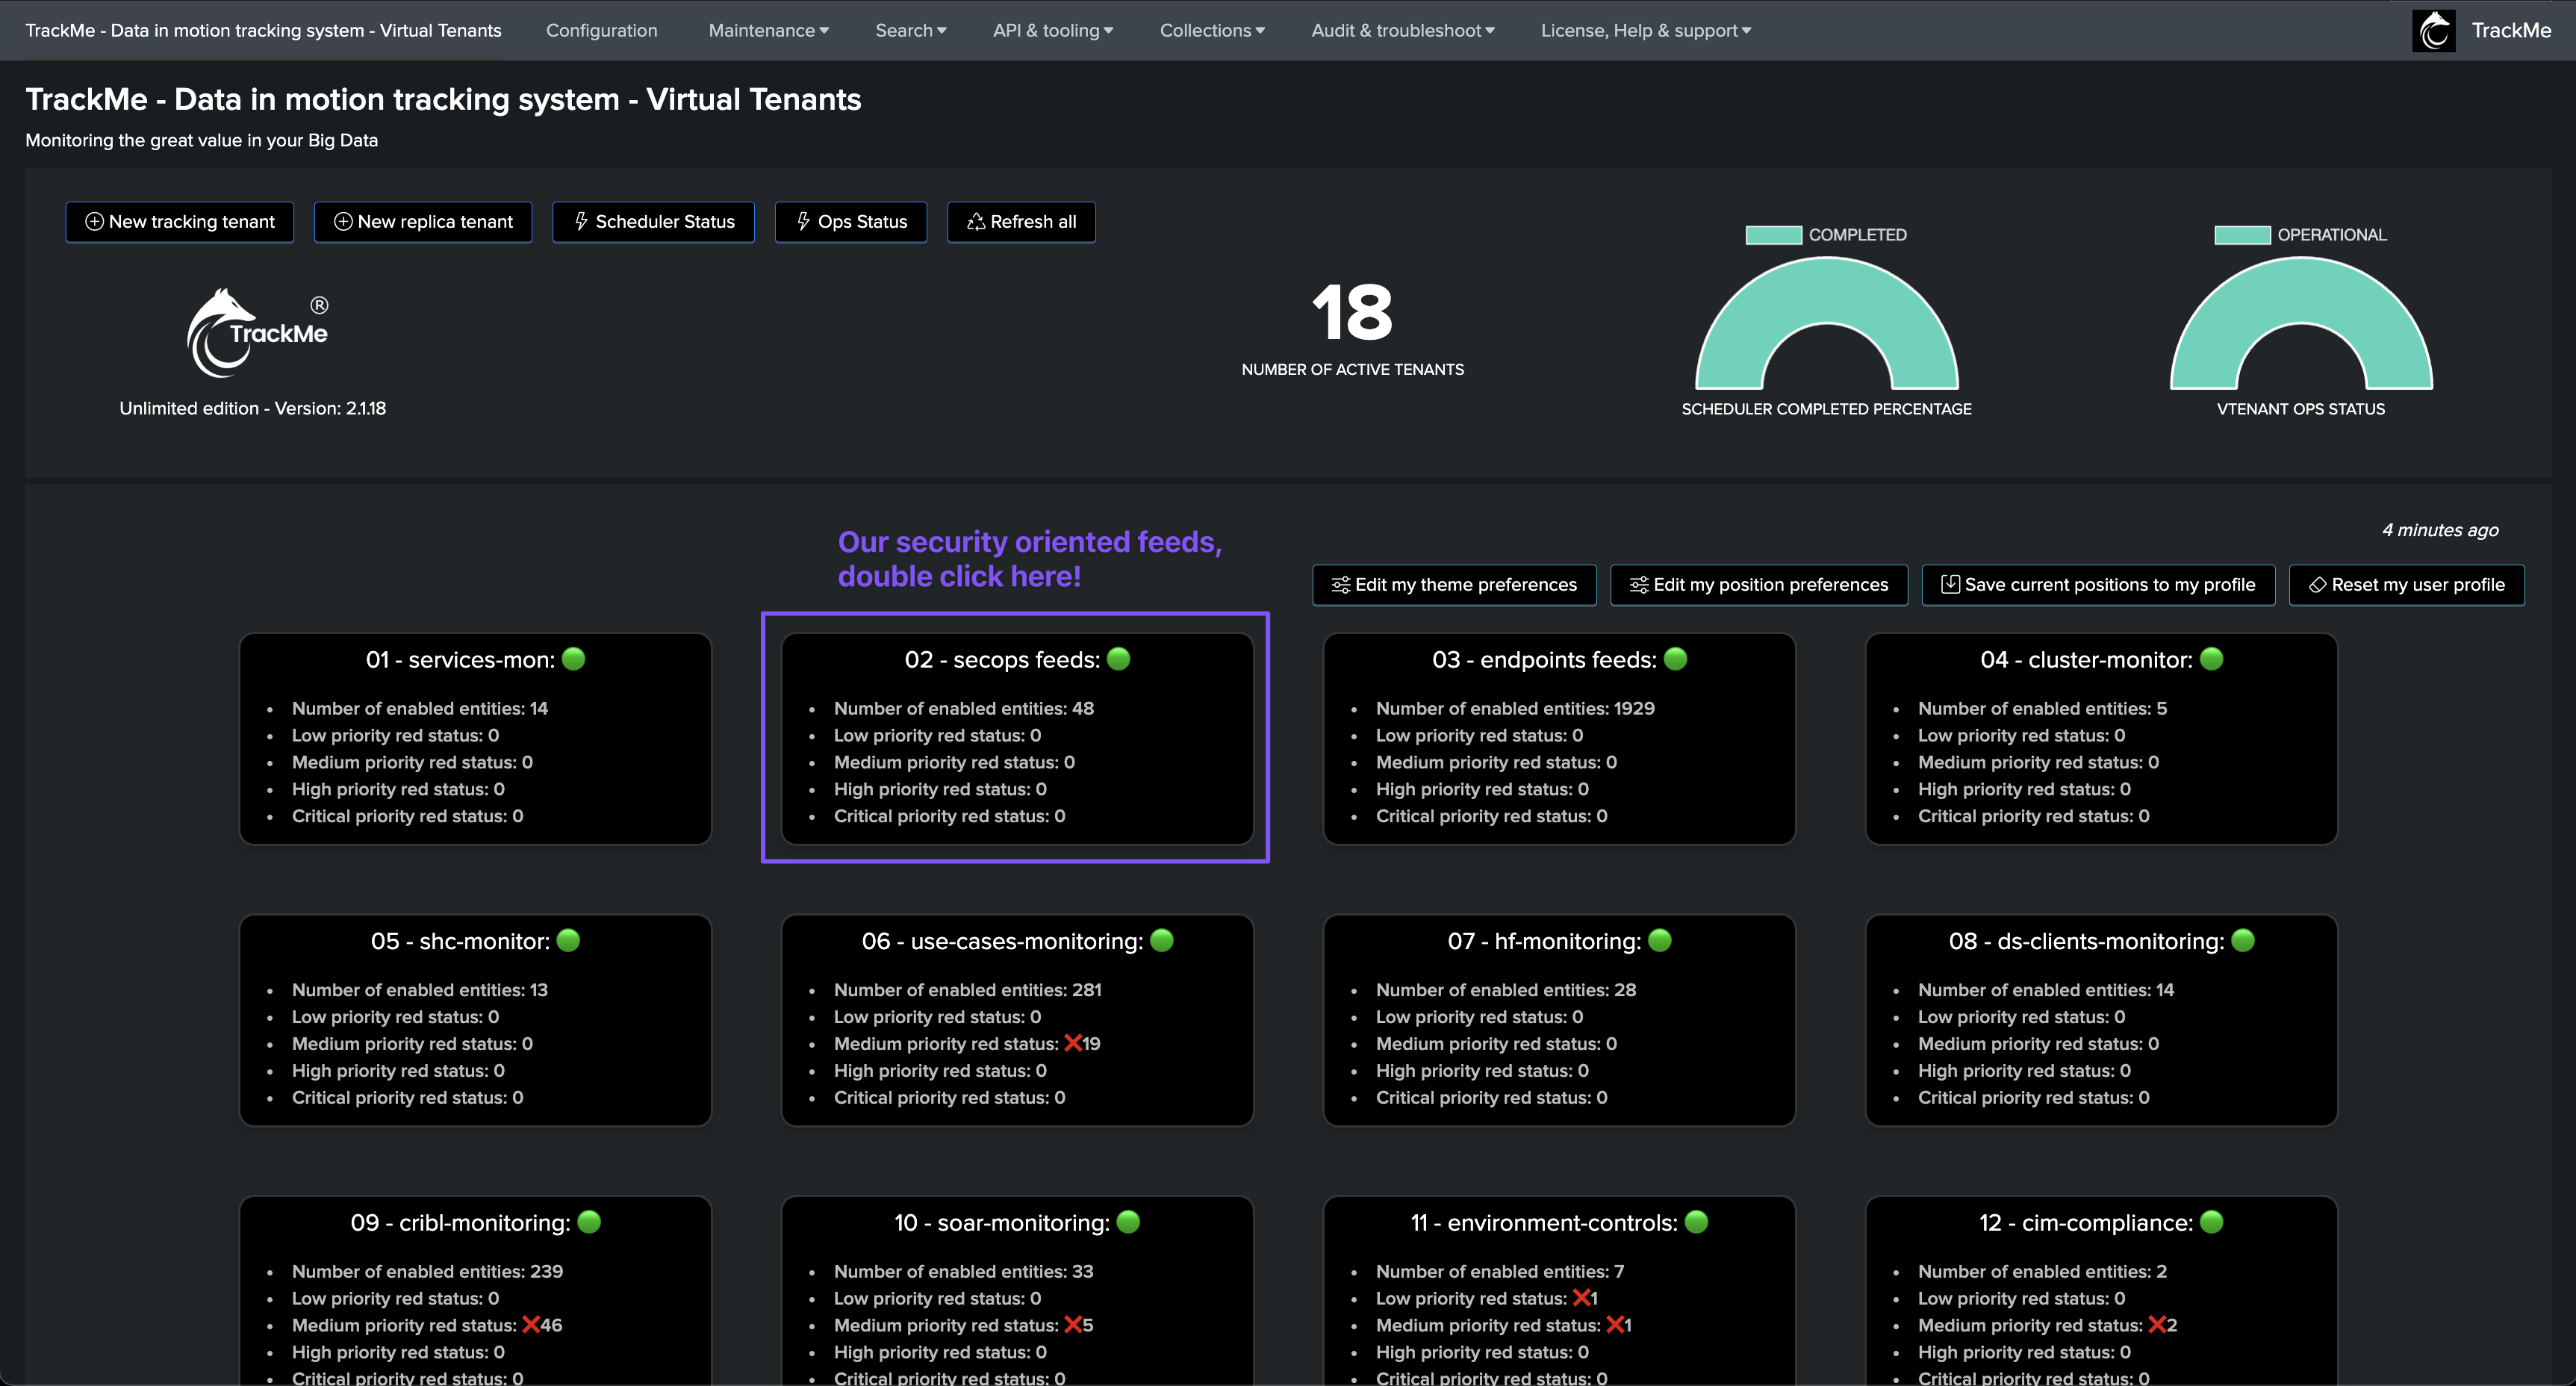
The Virtual Tenants UI
Virtual Tenants allow customers to segment use cases based on their needs, from geographically oriented use cases to use cases based on data sensitivity or perimeters:
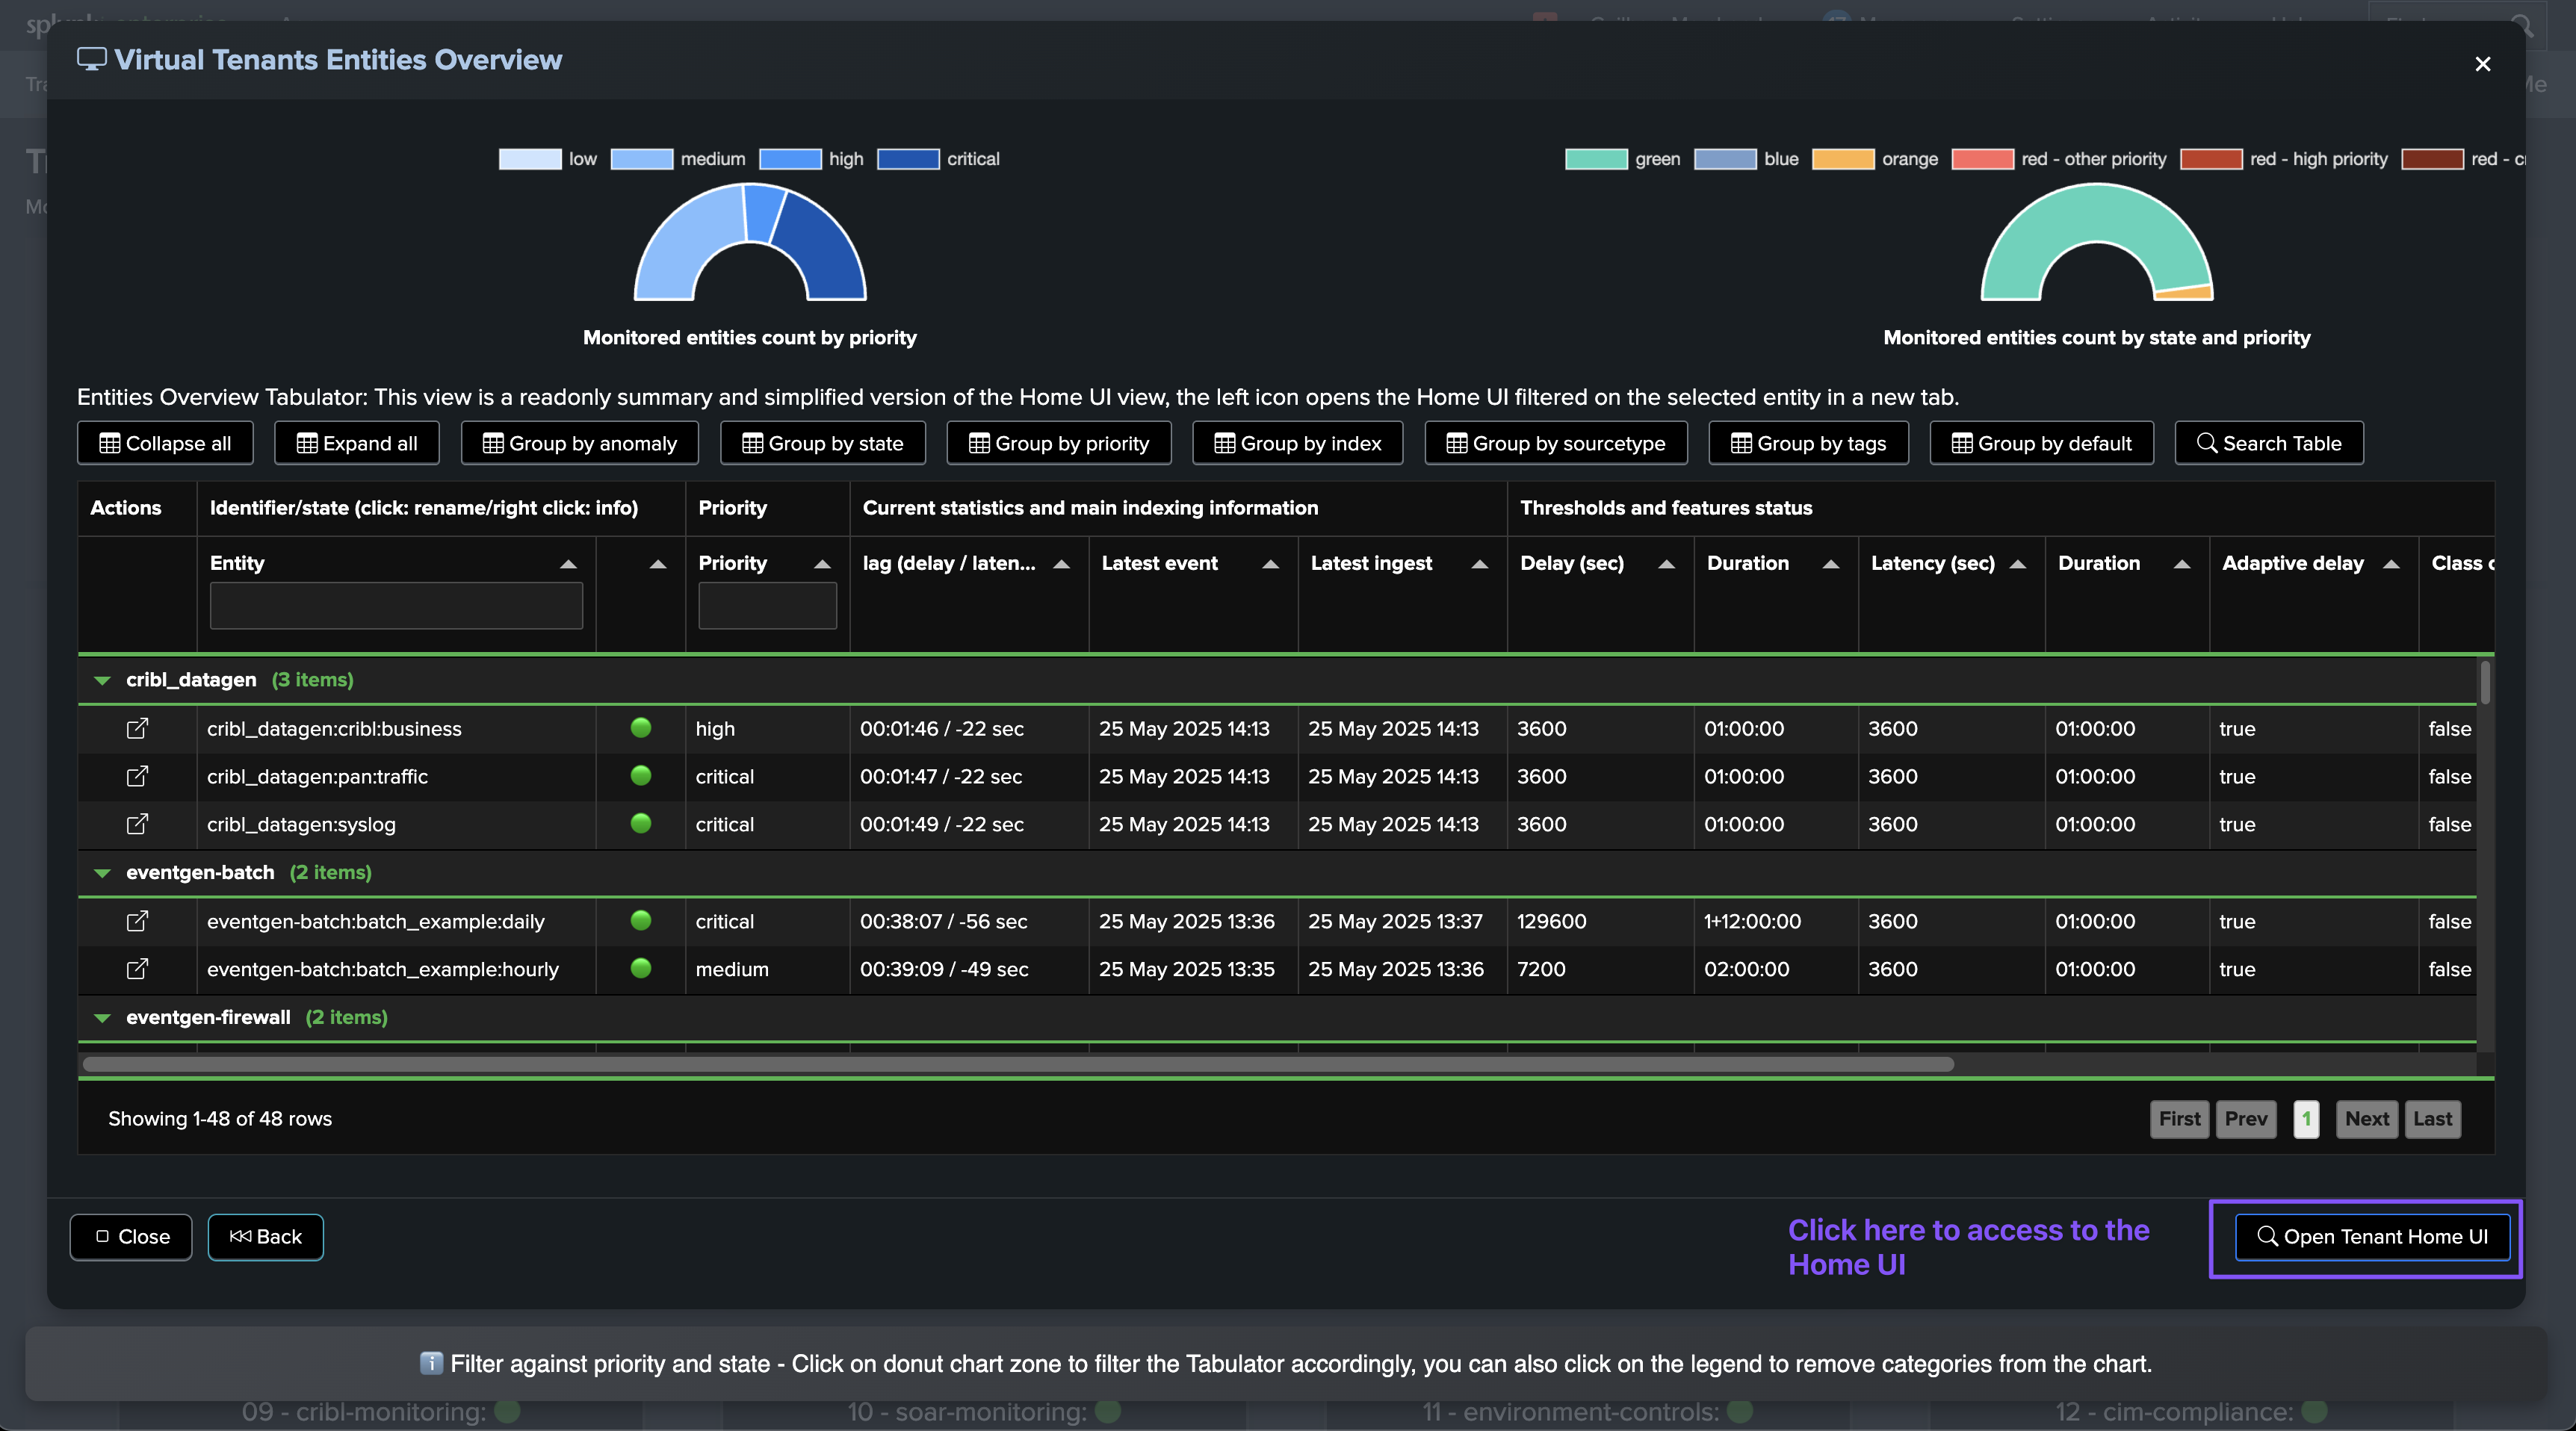
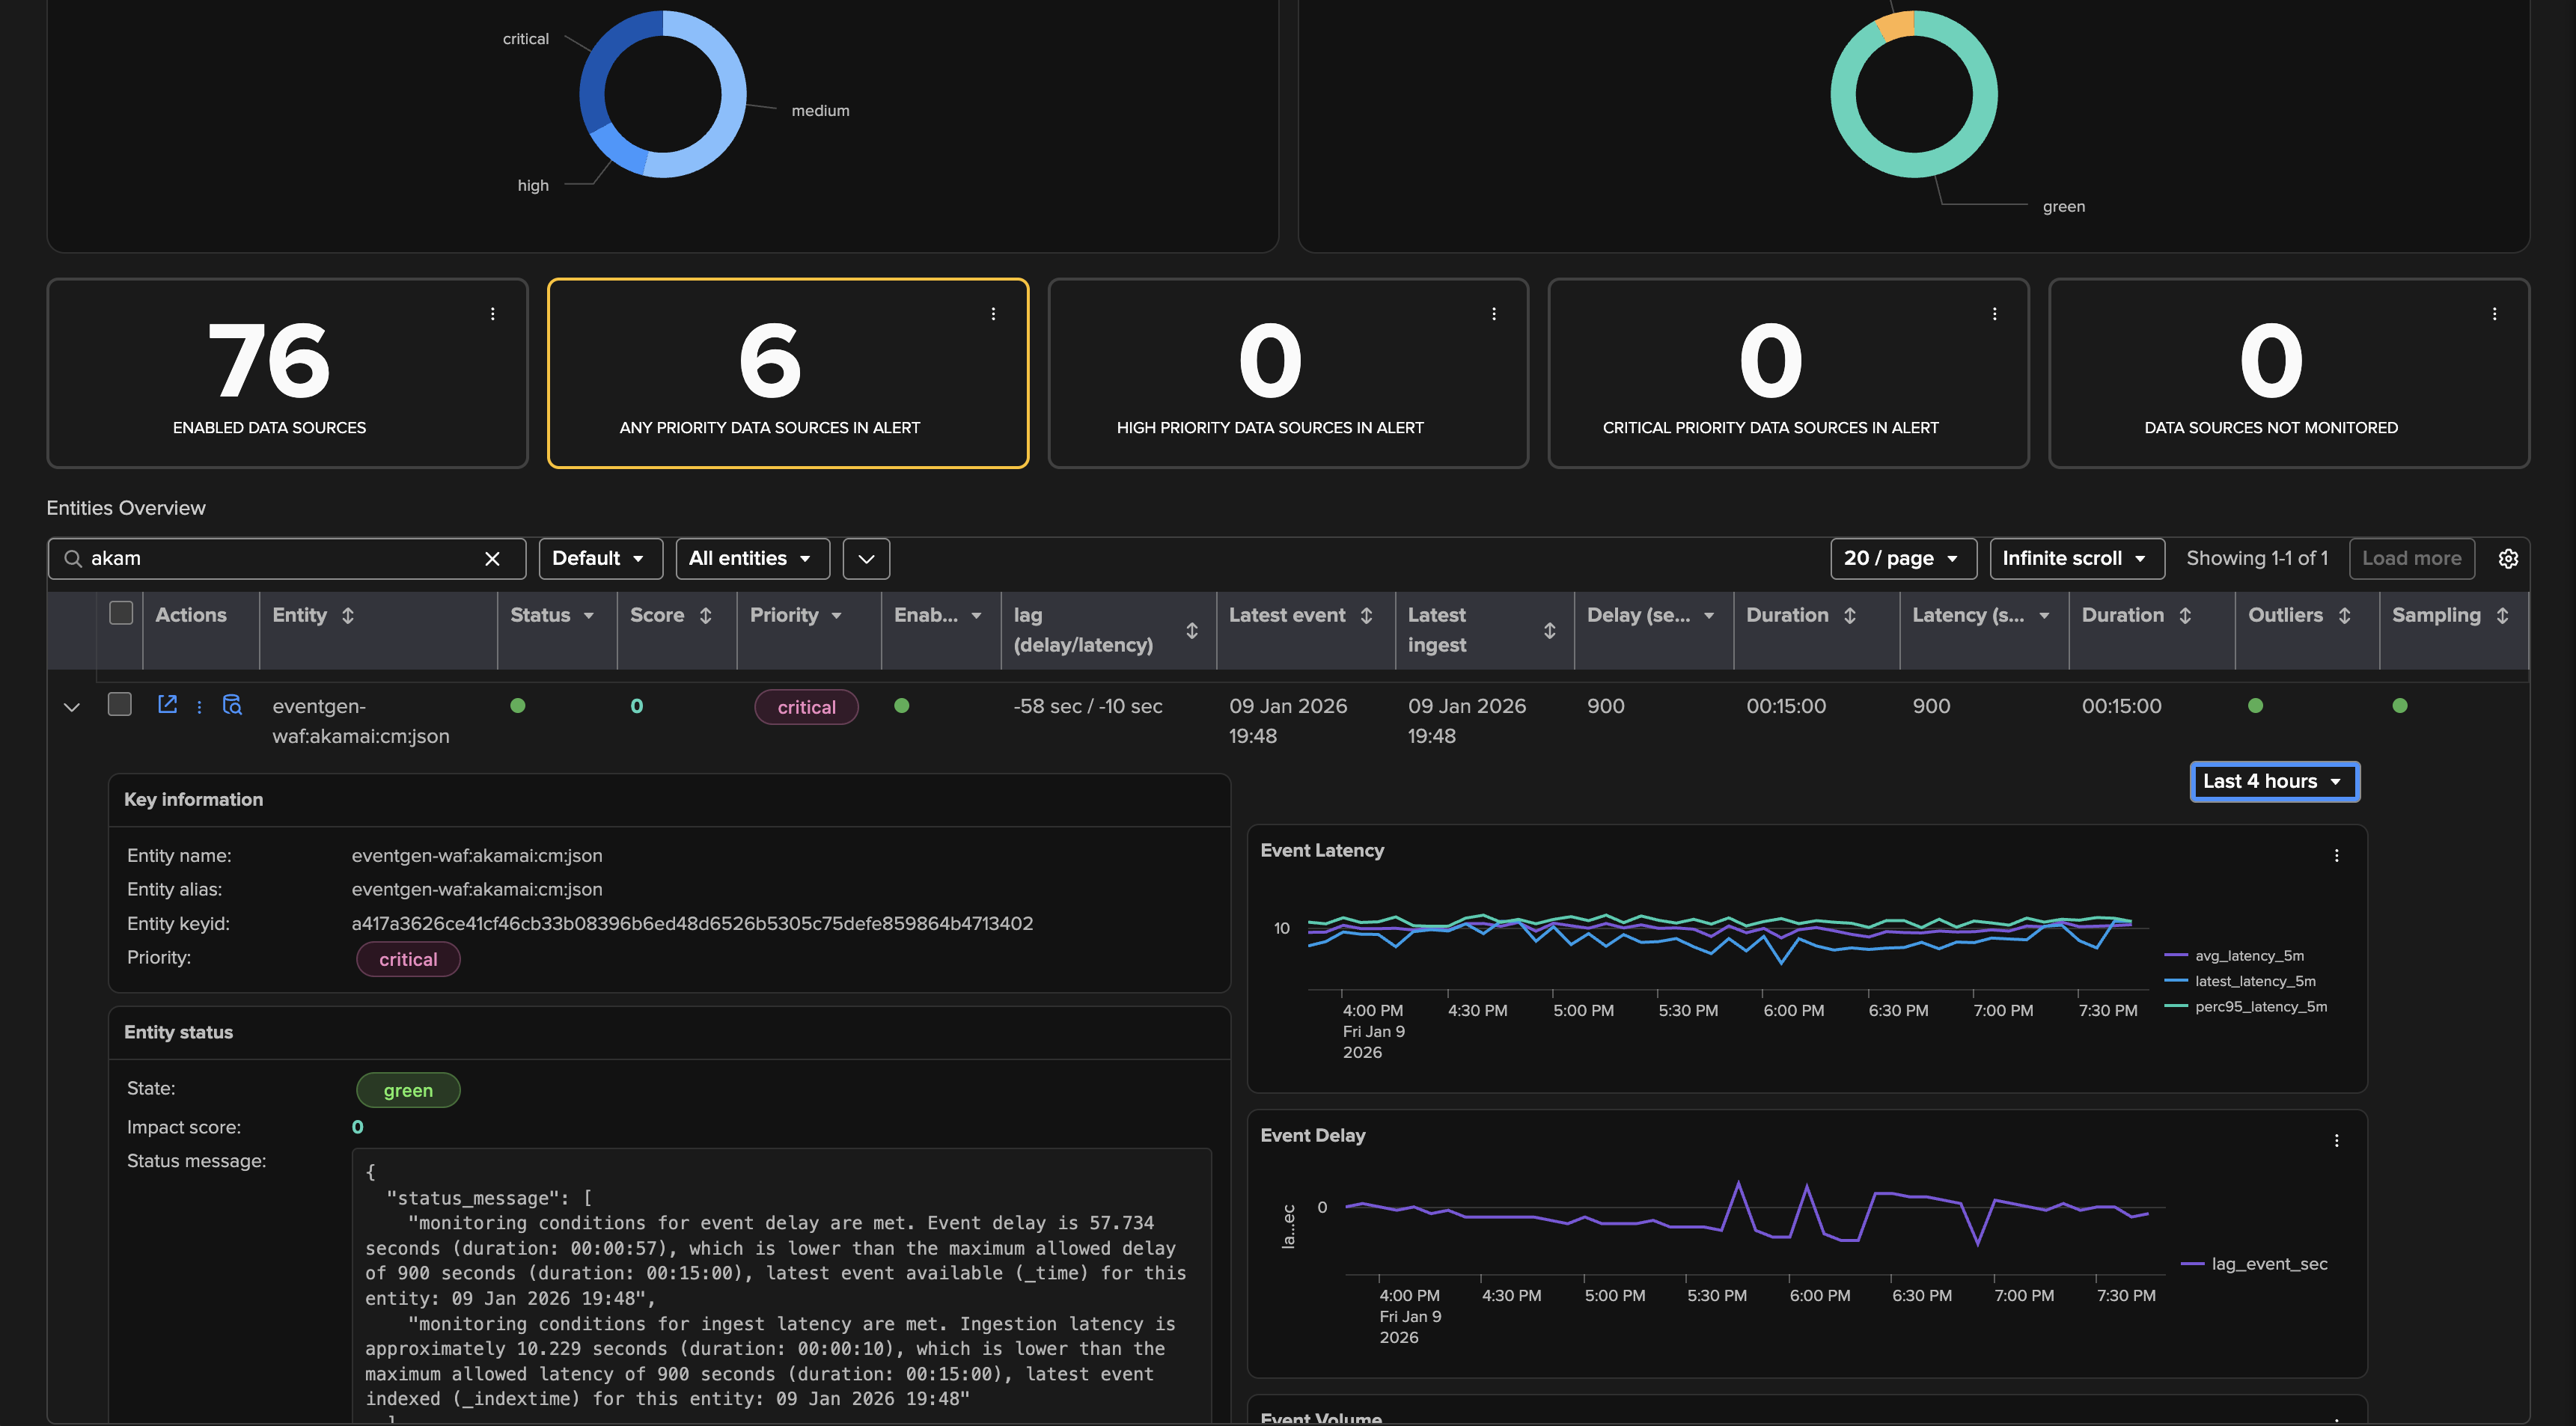
Virtual Tenant Entities Overview:
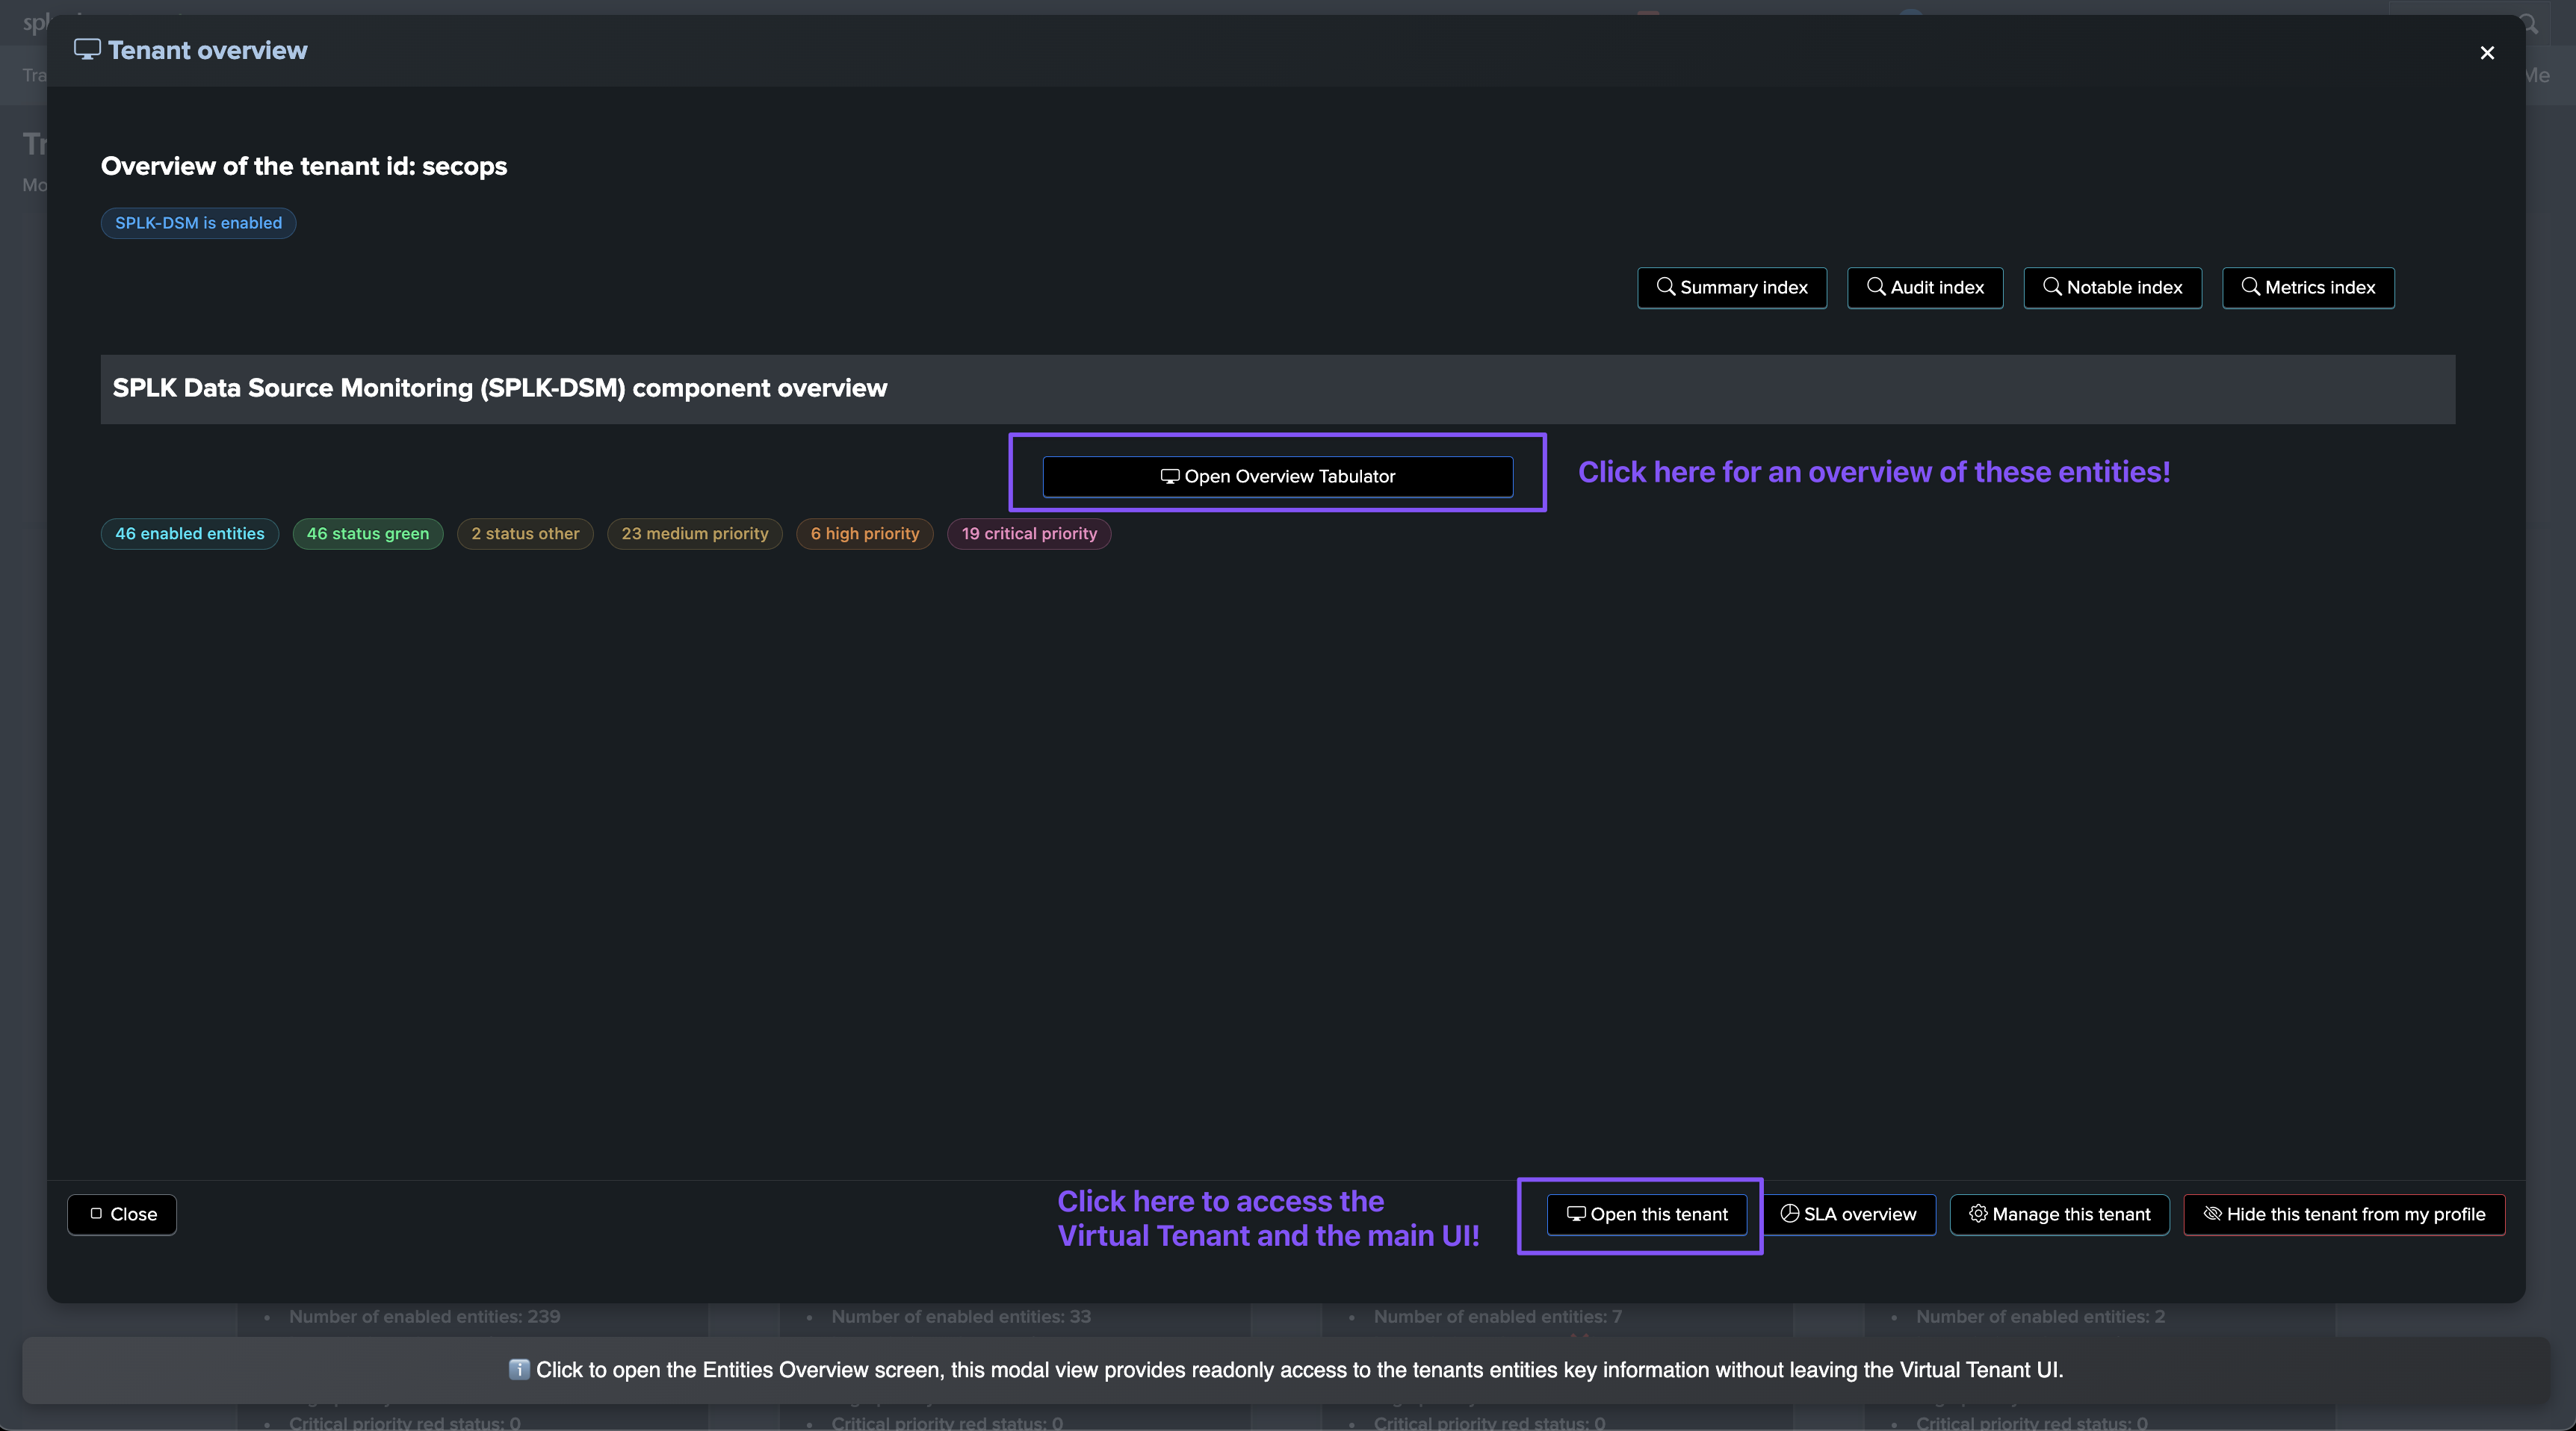
Expand or click on the name of an entity access the entity overview screen:
The Tenants Home UI
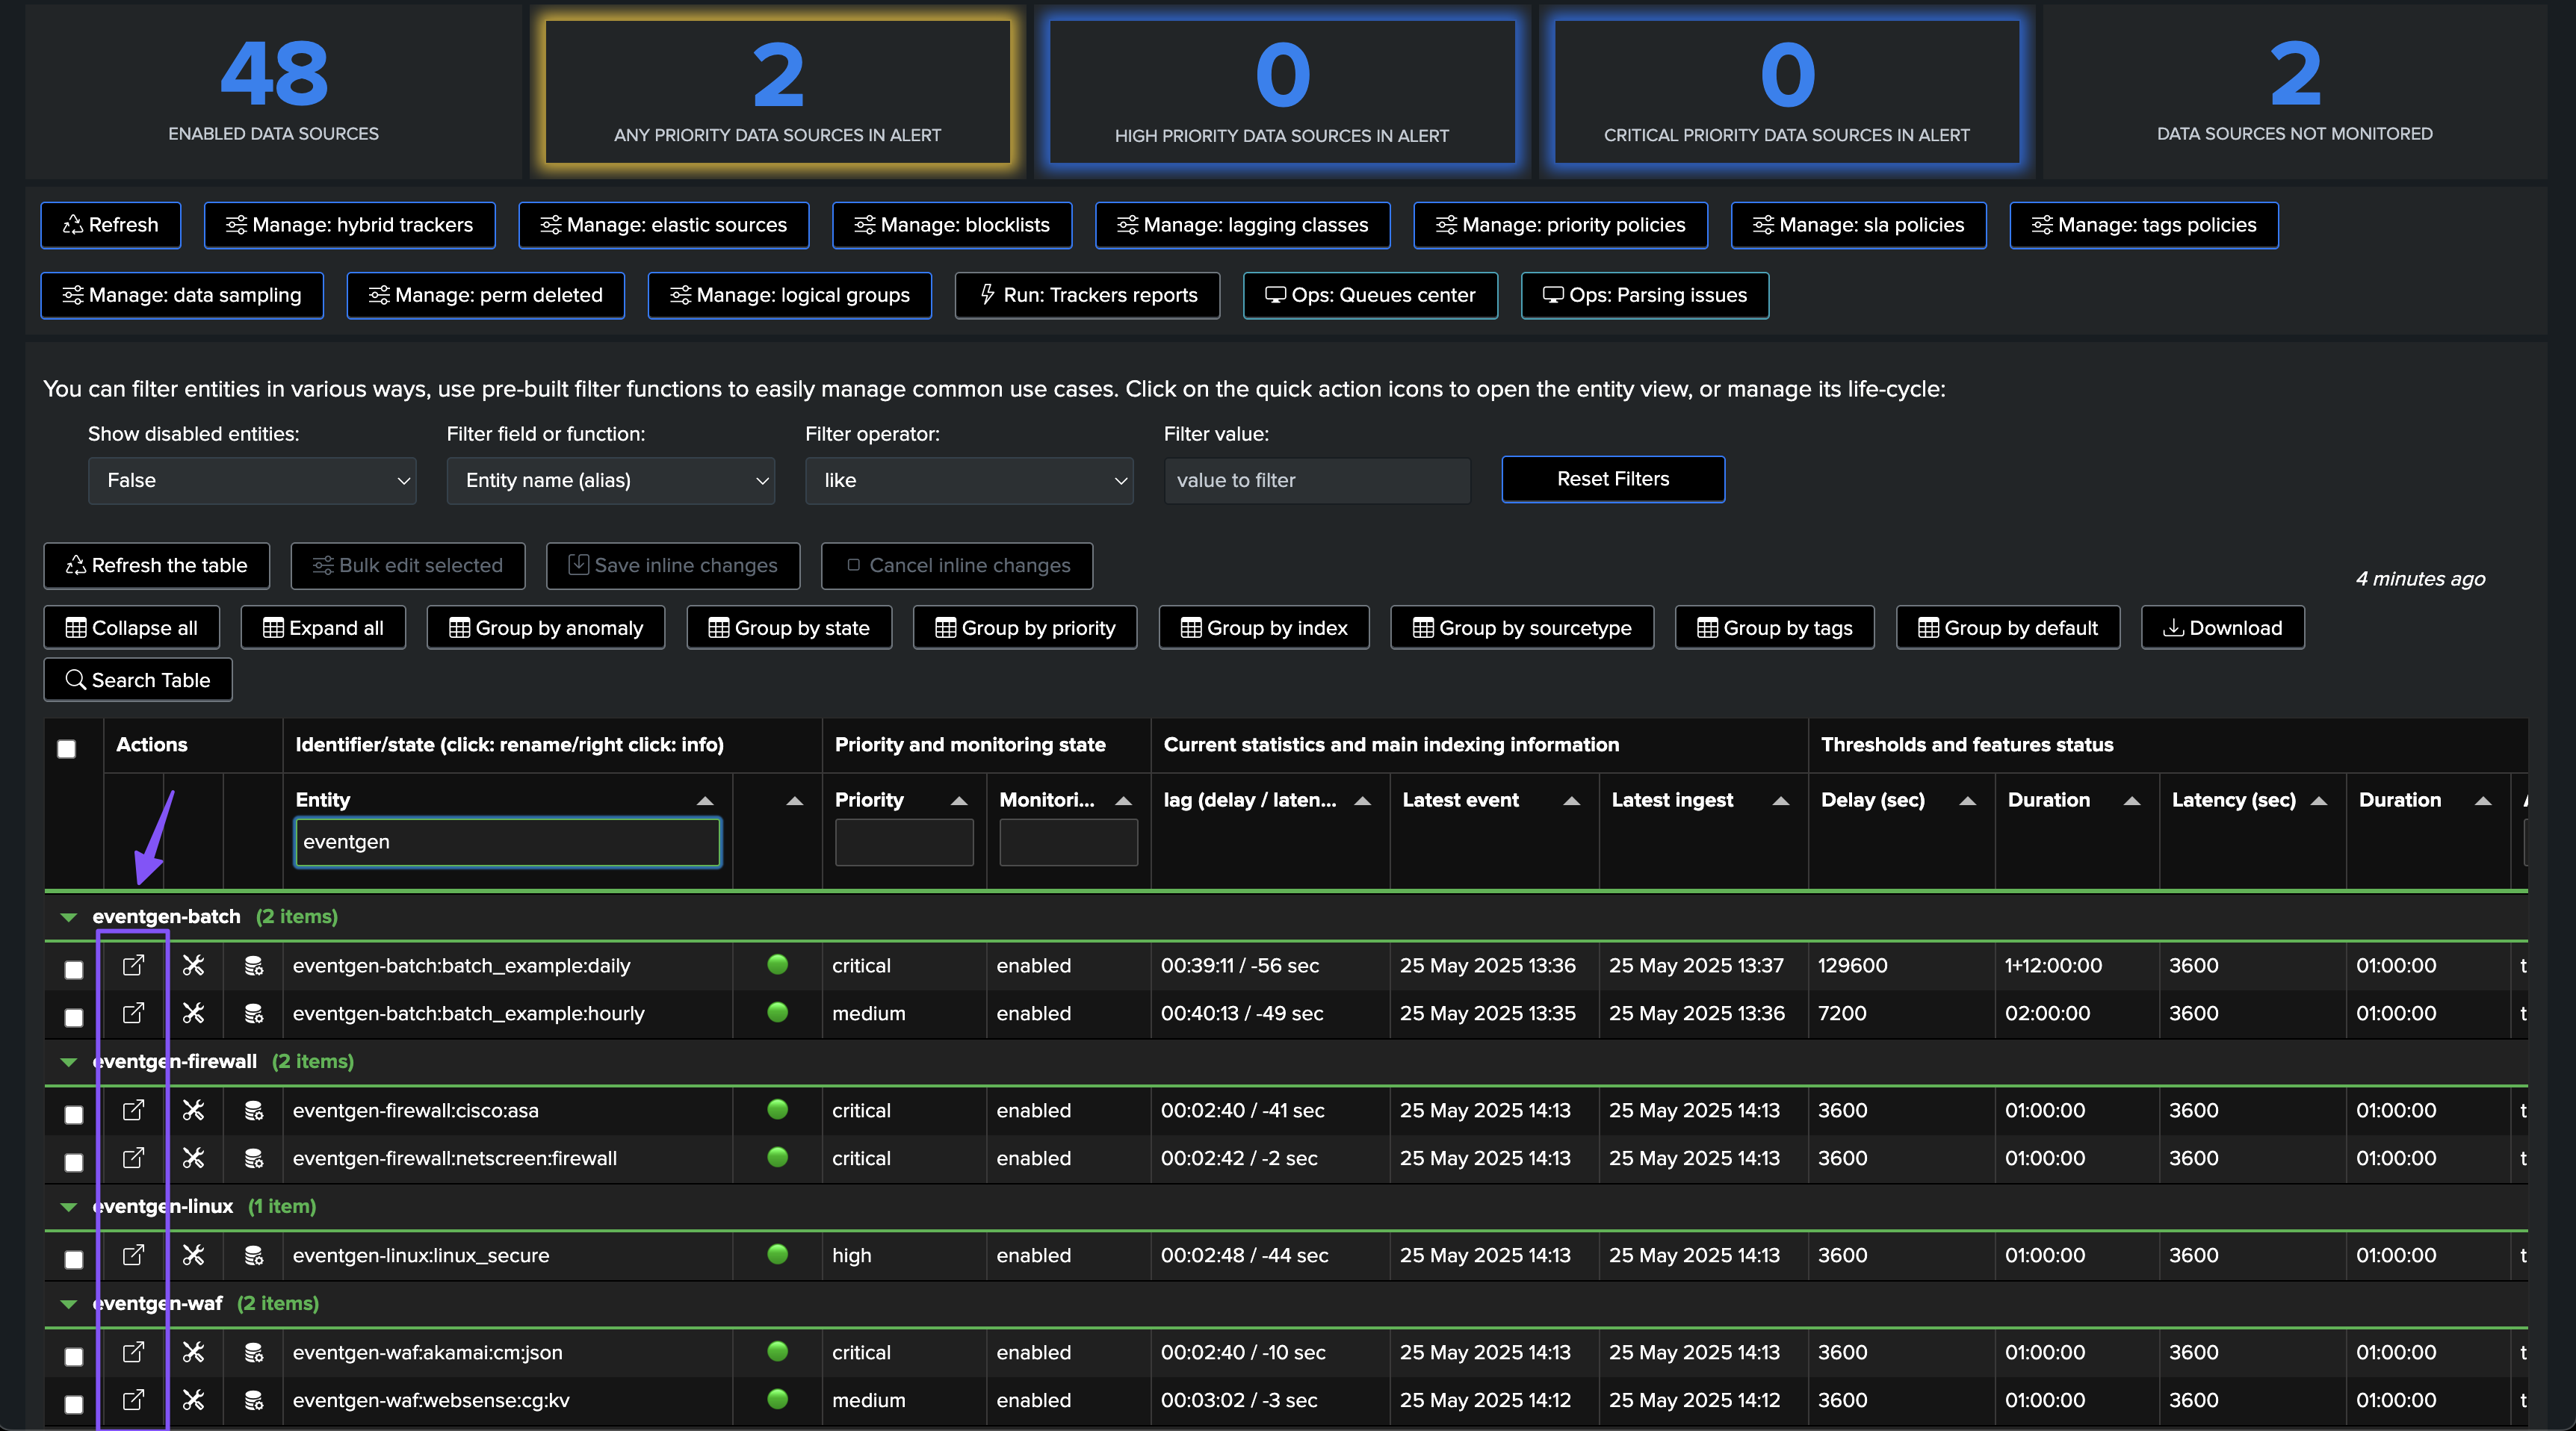
The Home UI is the main user interface to manage your TrackMe entities:
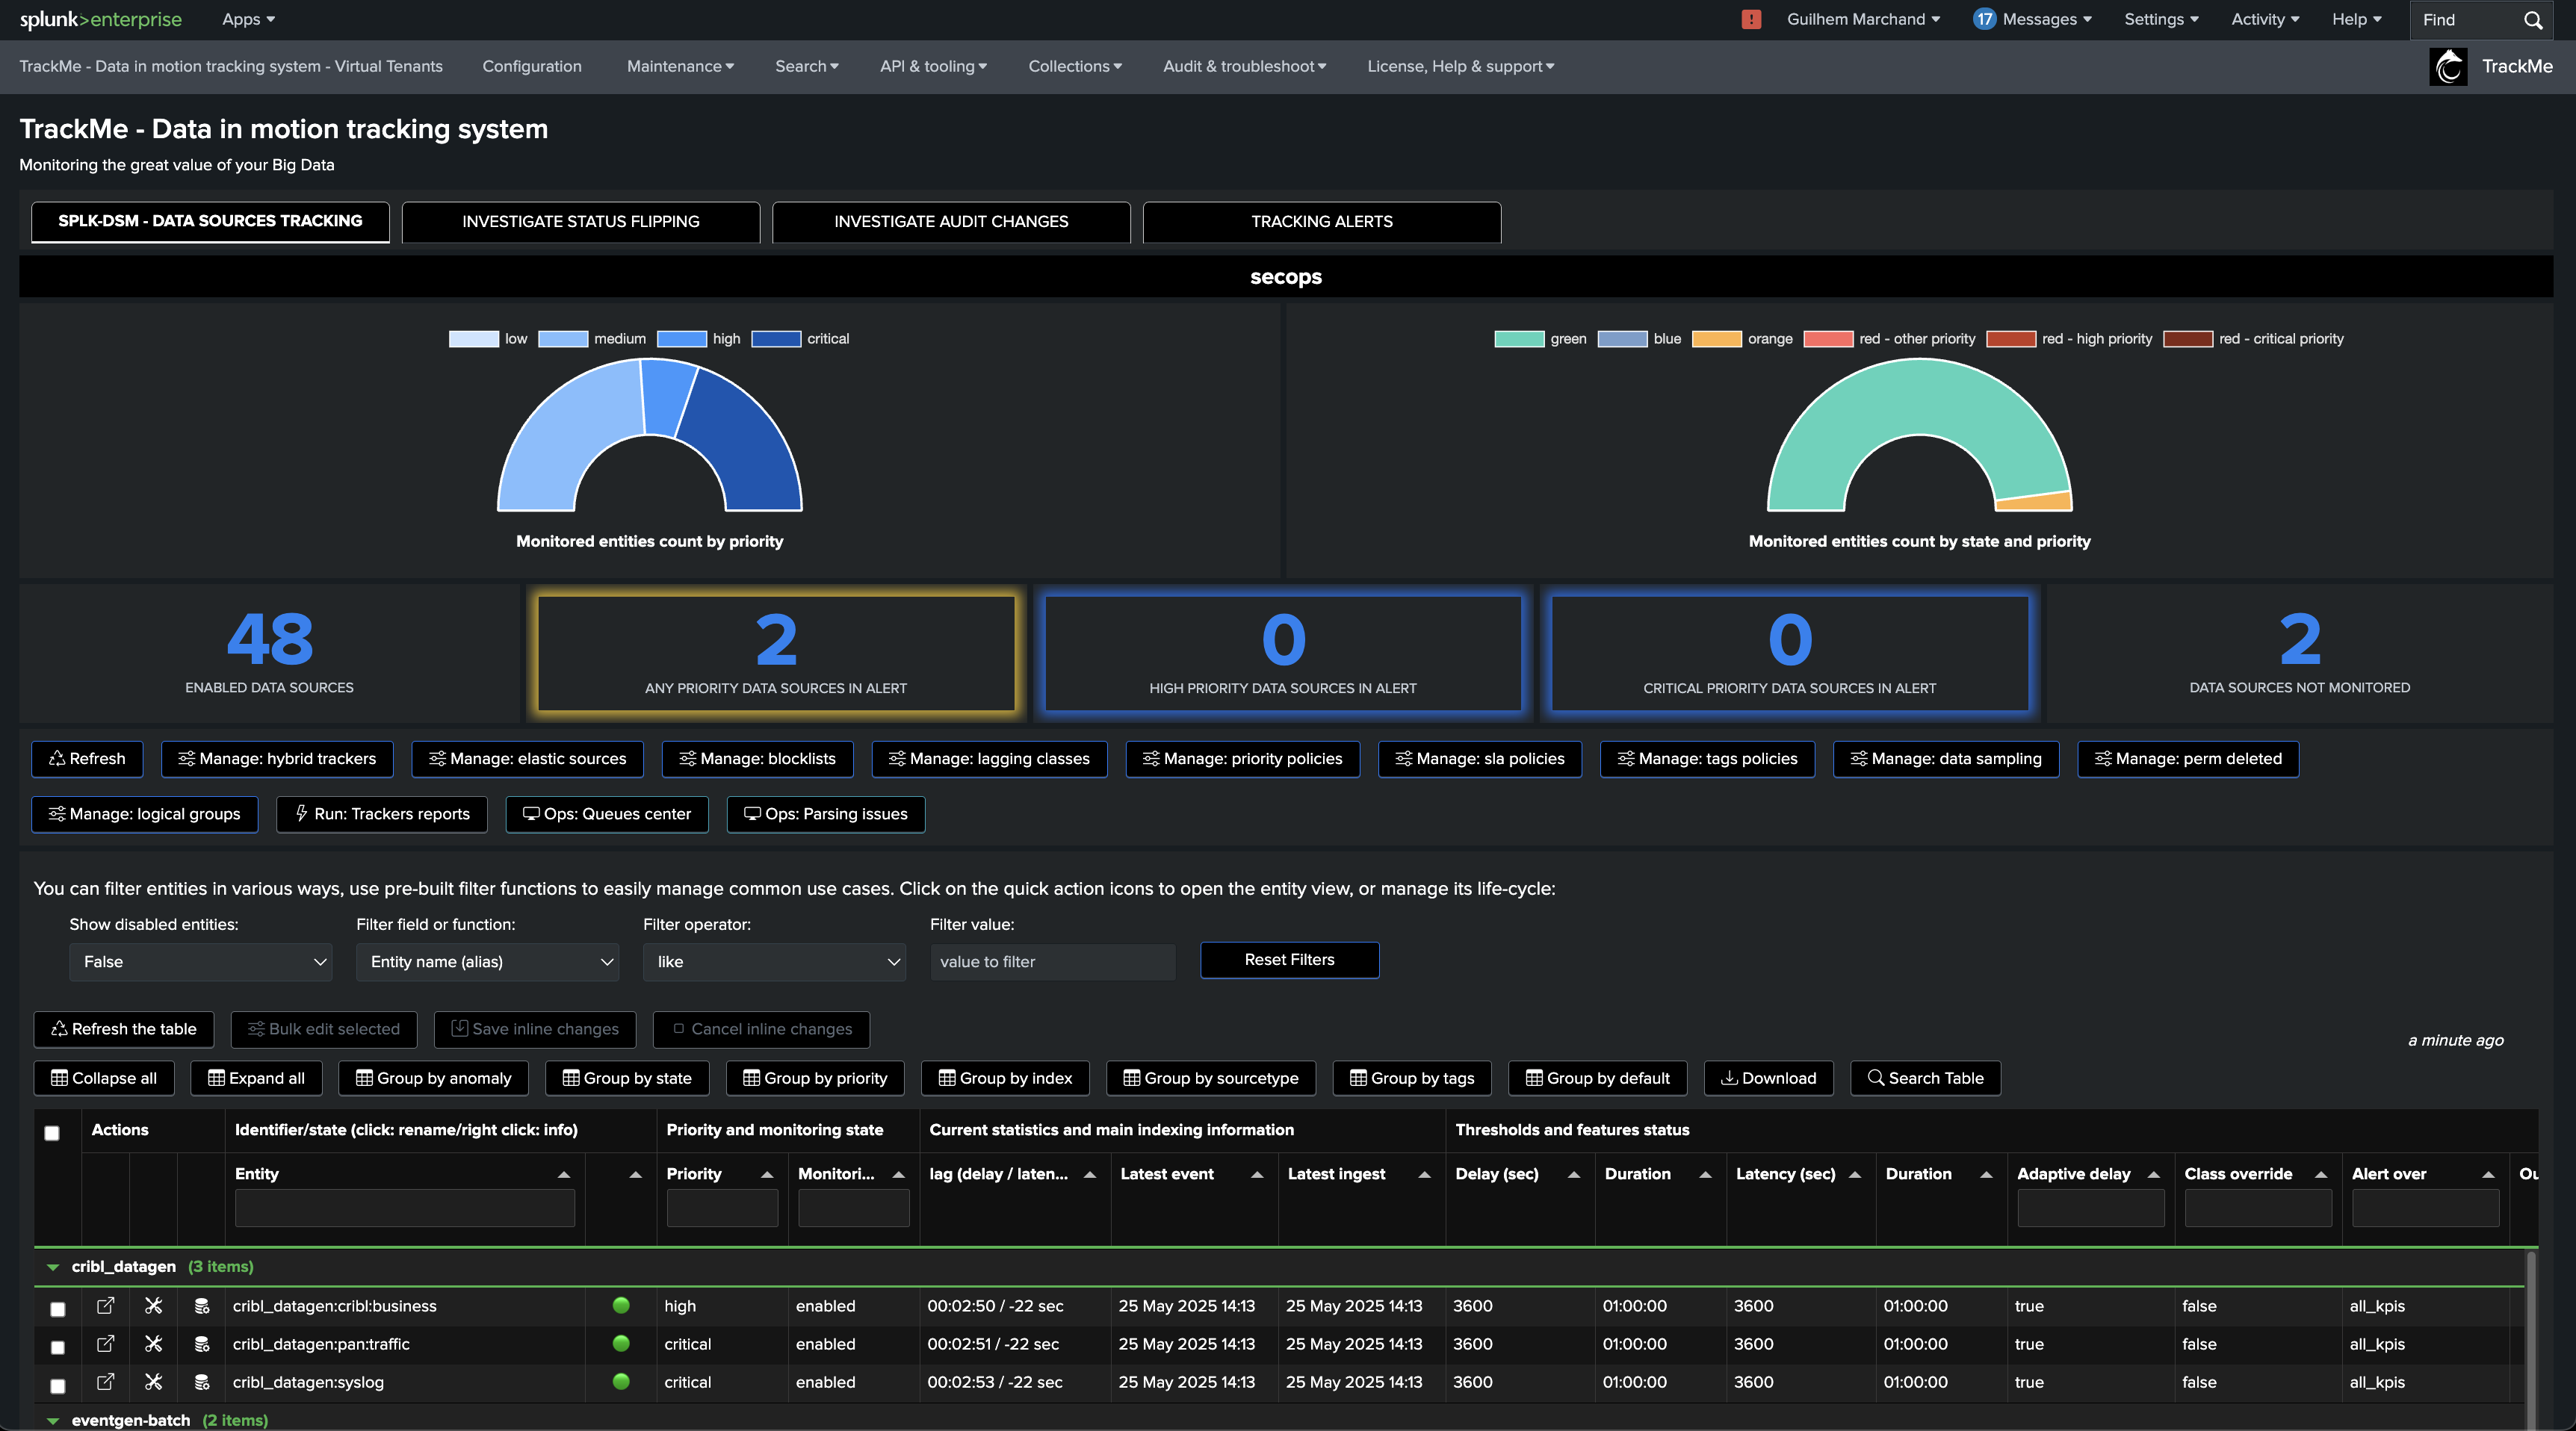
You can similarly access the entity overview by expanding or clicking on the name of an entity in the Tenants Home UI:
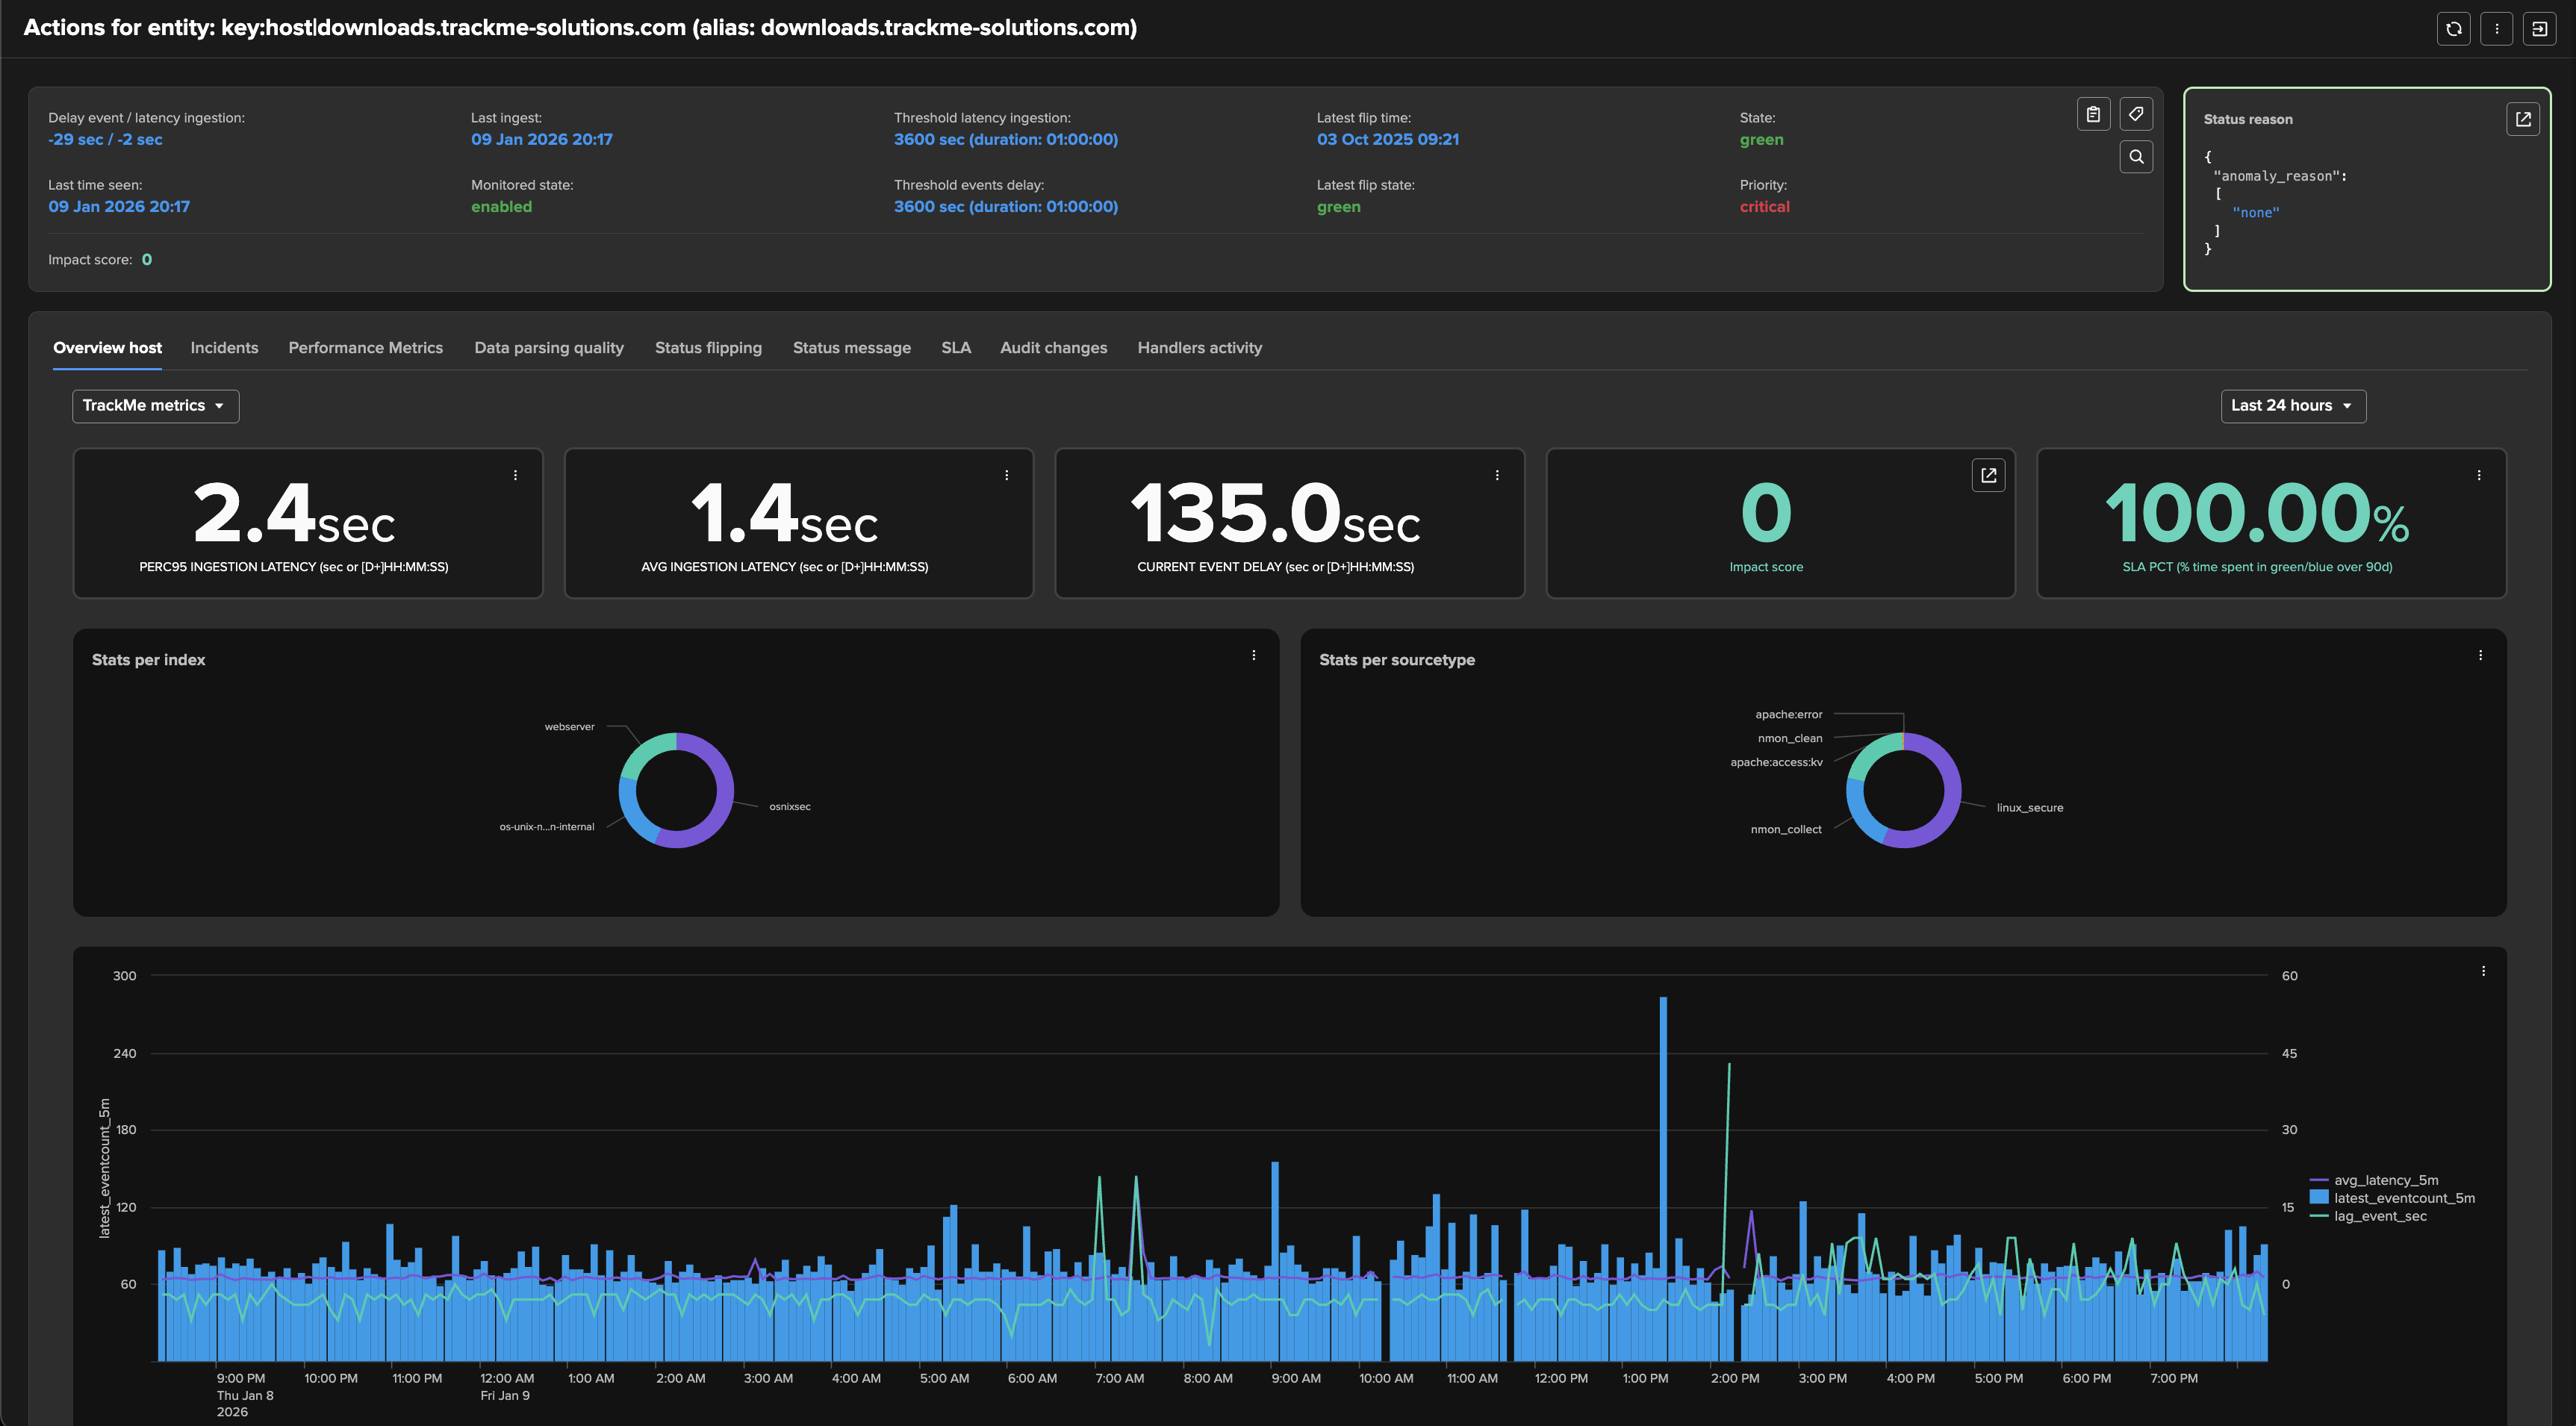
To Access to the status of a given entity, representing a Splunk feed (by default through its index and sourcetype metadata), click on the left hande side icon:
The entity details page provides a rich set of information about the entity, including its status, availability, indexing performance, metrics, knowledge, machine learning, flexibility, alerting, scalability, user experience, and more:
Hosts Tracking with TrackMe Hosts Sources Monitoring (splk-dhm)
The second main components for feeds tracking is the Hosts Sources Monitoring TrackMe component (splk-dhm).
It acts similarly to the Data Sources Monitoring TrackMe component (splk-dsm), at the difference that it is tracking data from host events producer perspective, which means sourcetypes associates with a given host depending on the tracker scope of data:
Primary Feeds Key Performance Indicators (KPIs)
Hint
About impact score since TrackMe v2.3.5
Since this release, TrackMe implements an impact score system to determine the status of an entity based on the KPIs, thresholds and anomalies.
Impact score based analysis provides deep flexibility and control.
For feeds tracking and primary delay and latency KPIs, the default behaviour sets a delay breach anomaly as a major factor weight, and latency as a secondary factor weight.
This means that by default, a feed affected by latency issues only appears in a warning state, while a feed affected by delay issues appears in a alerting state.
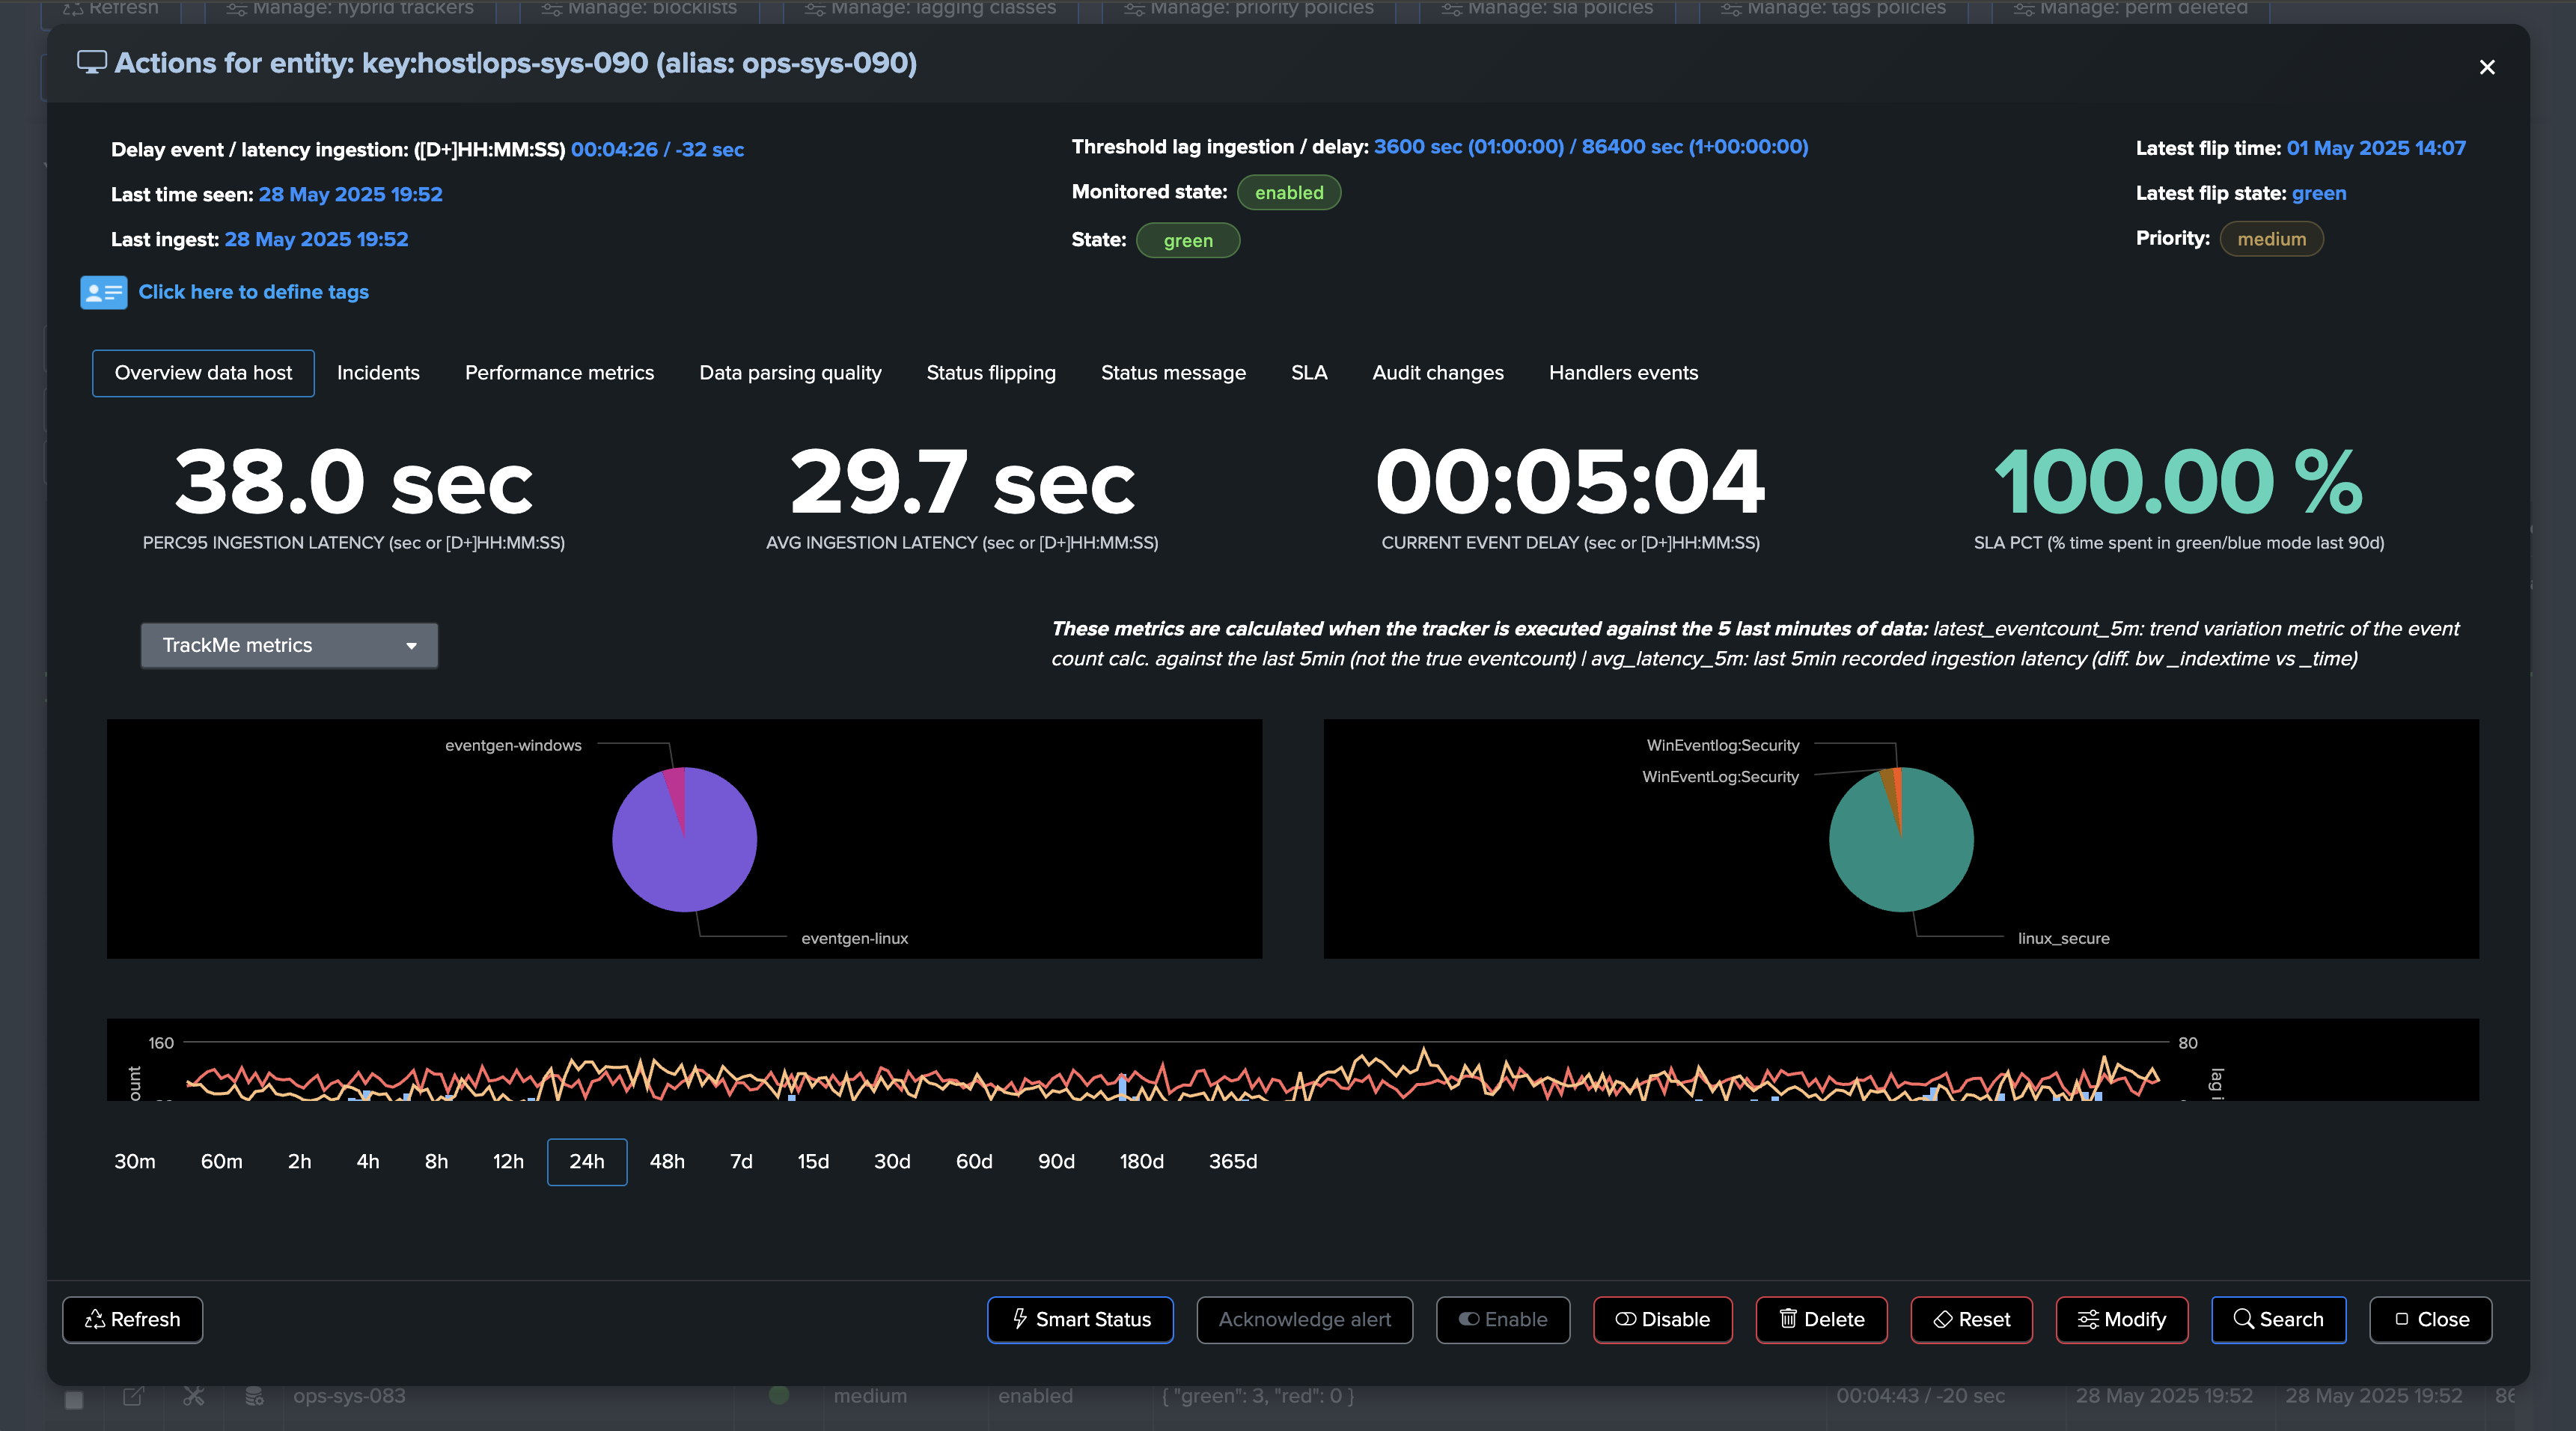
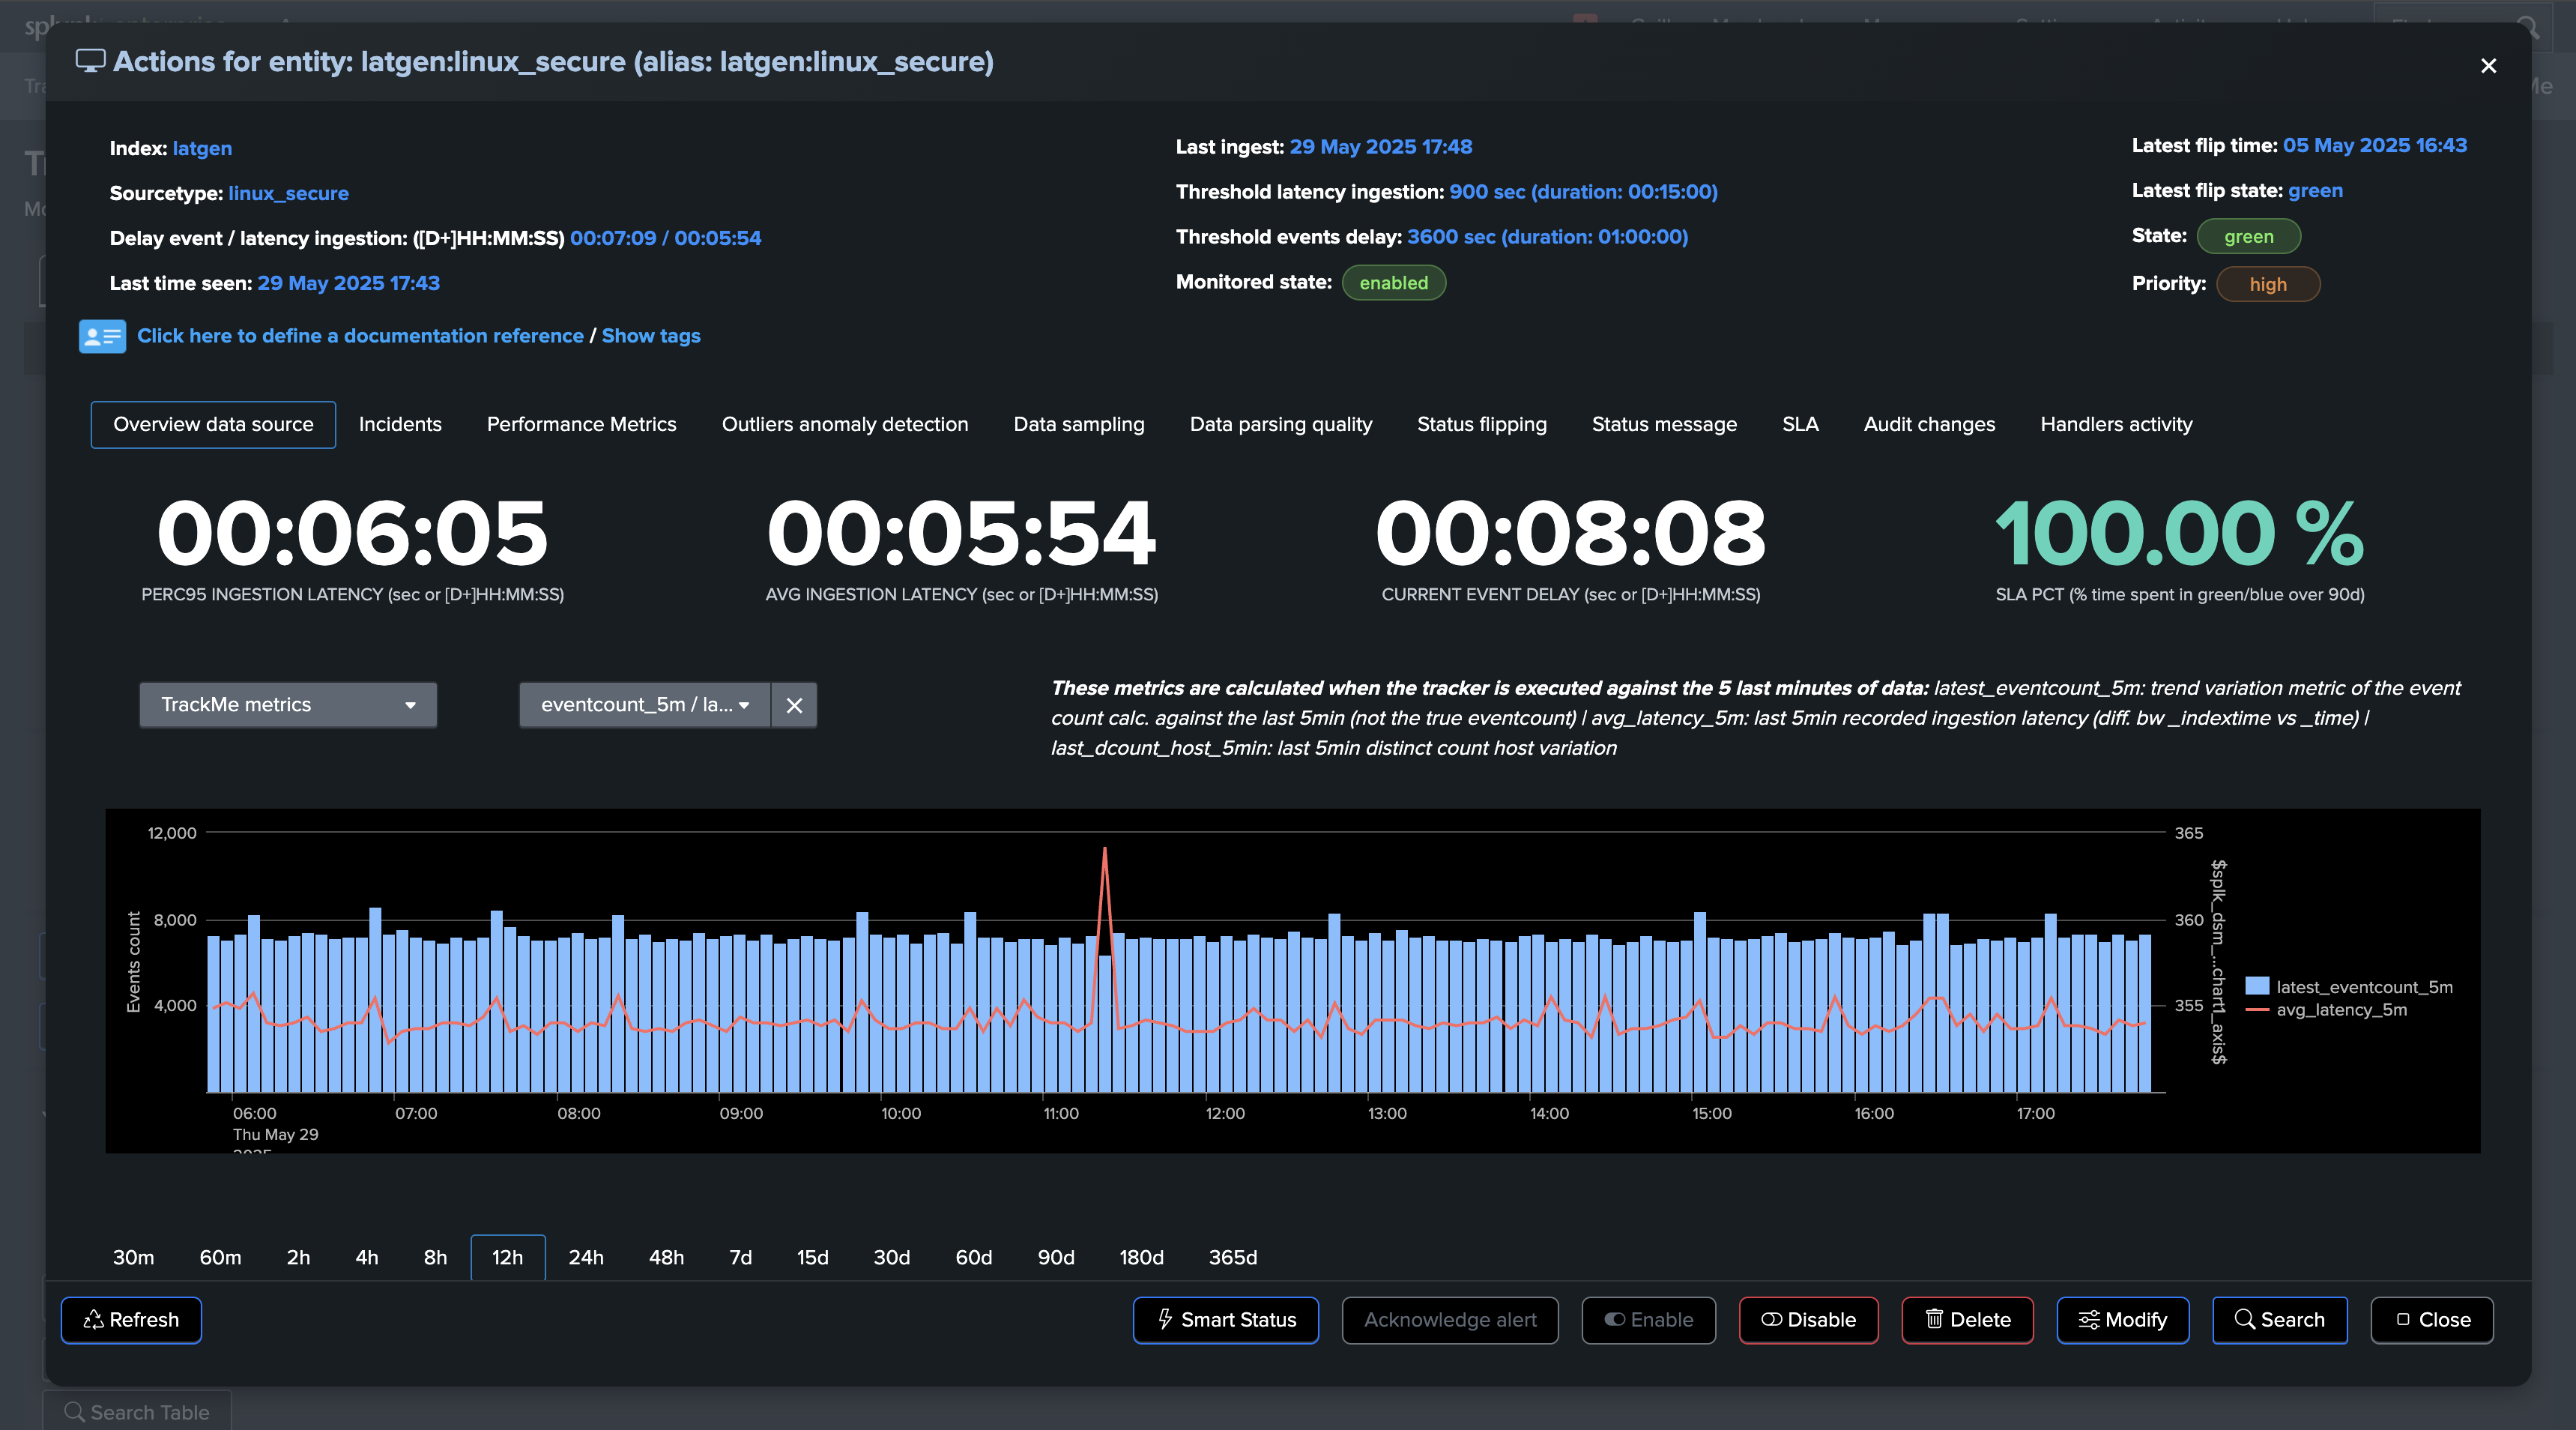
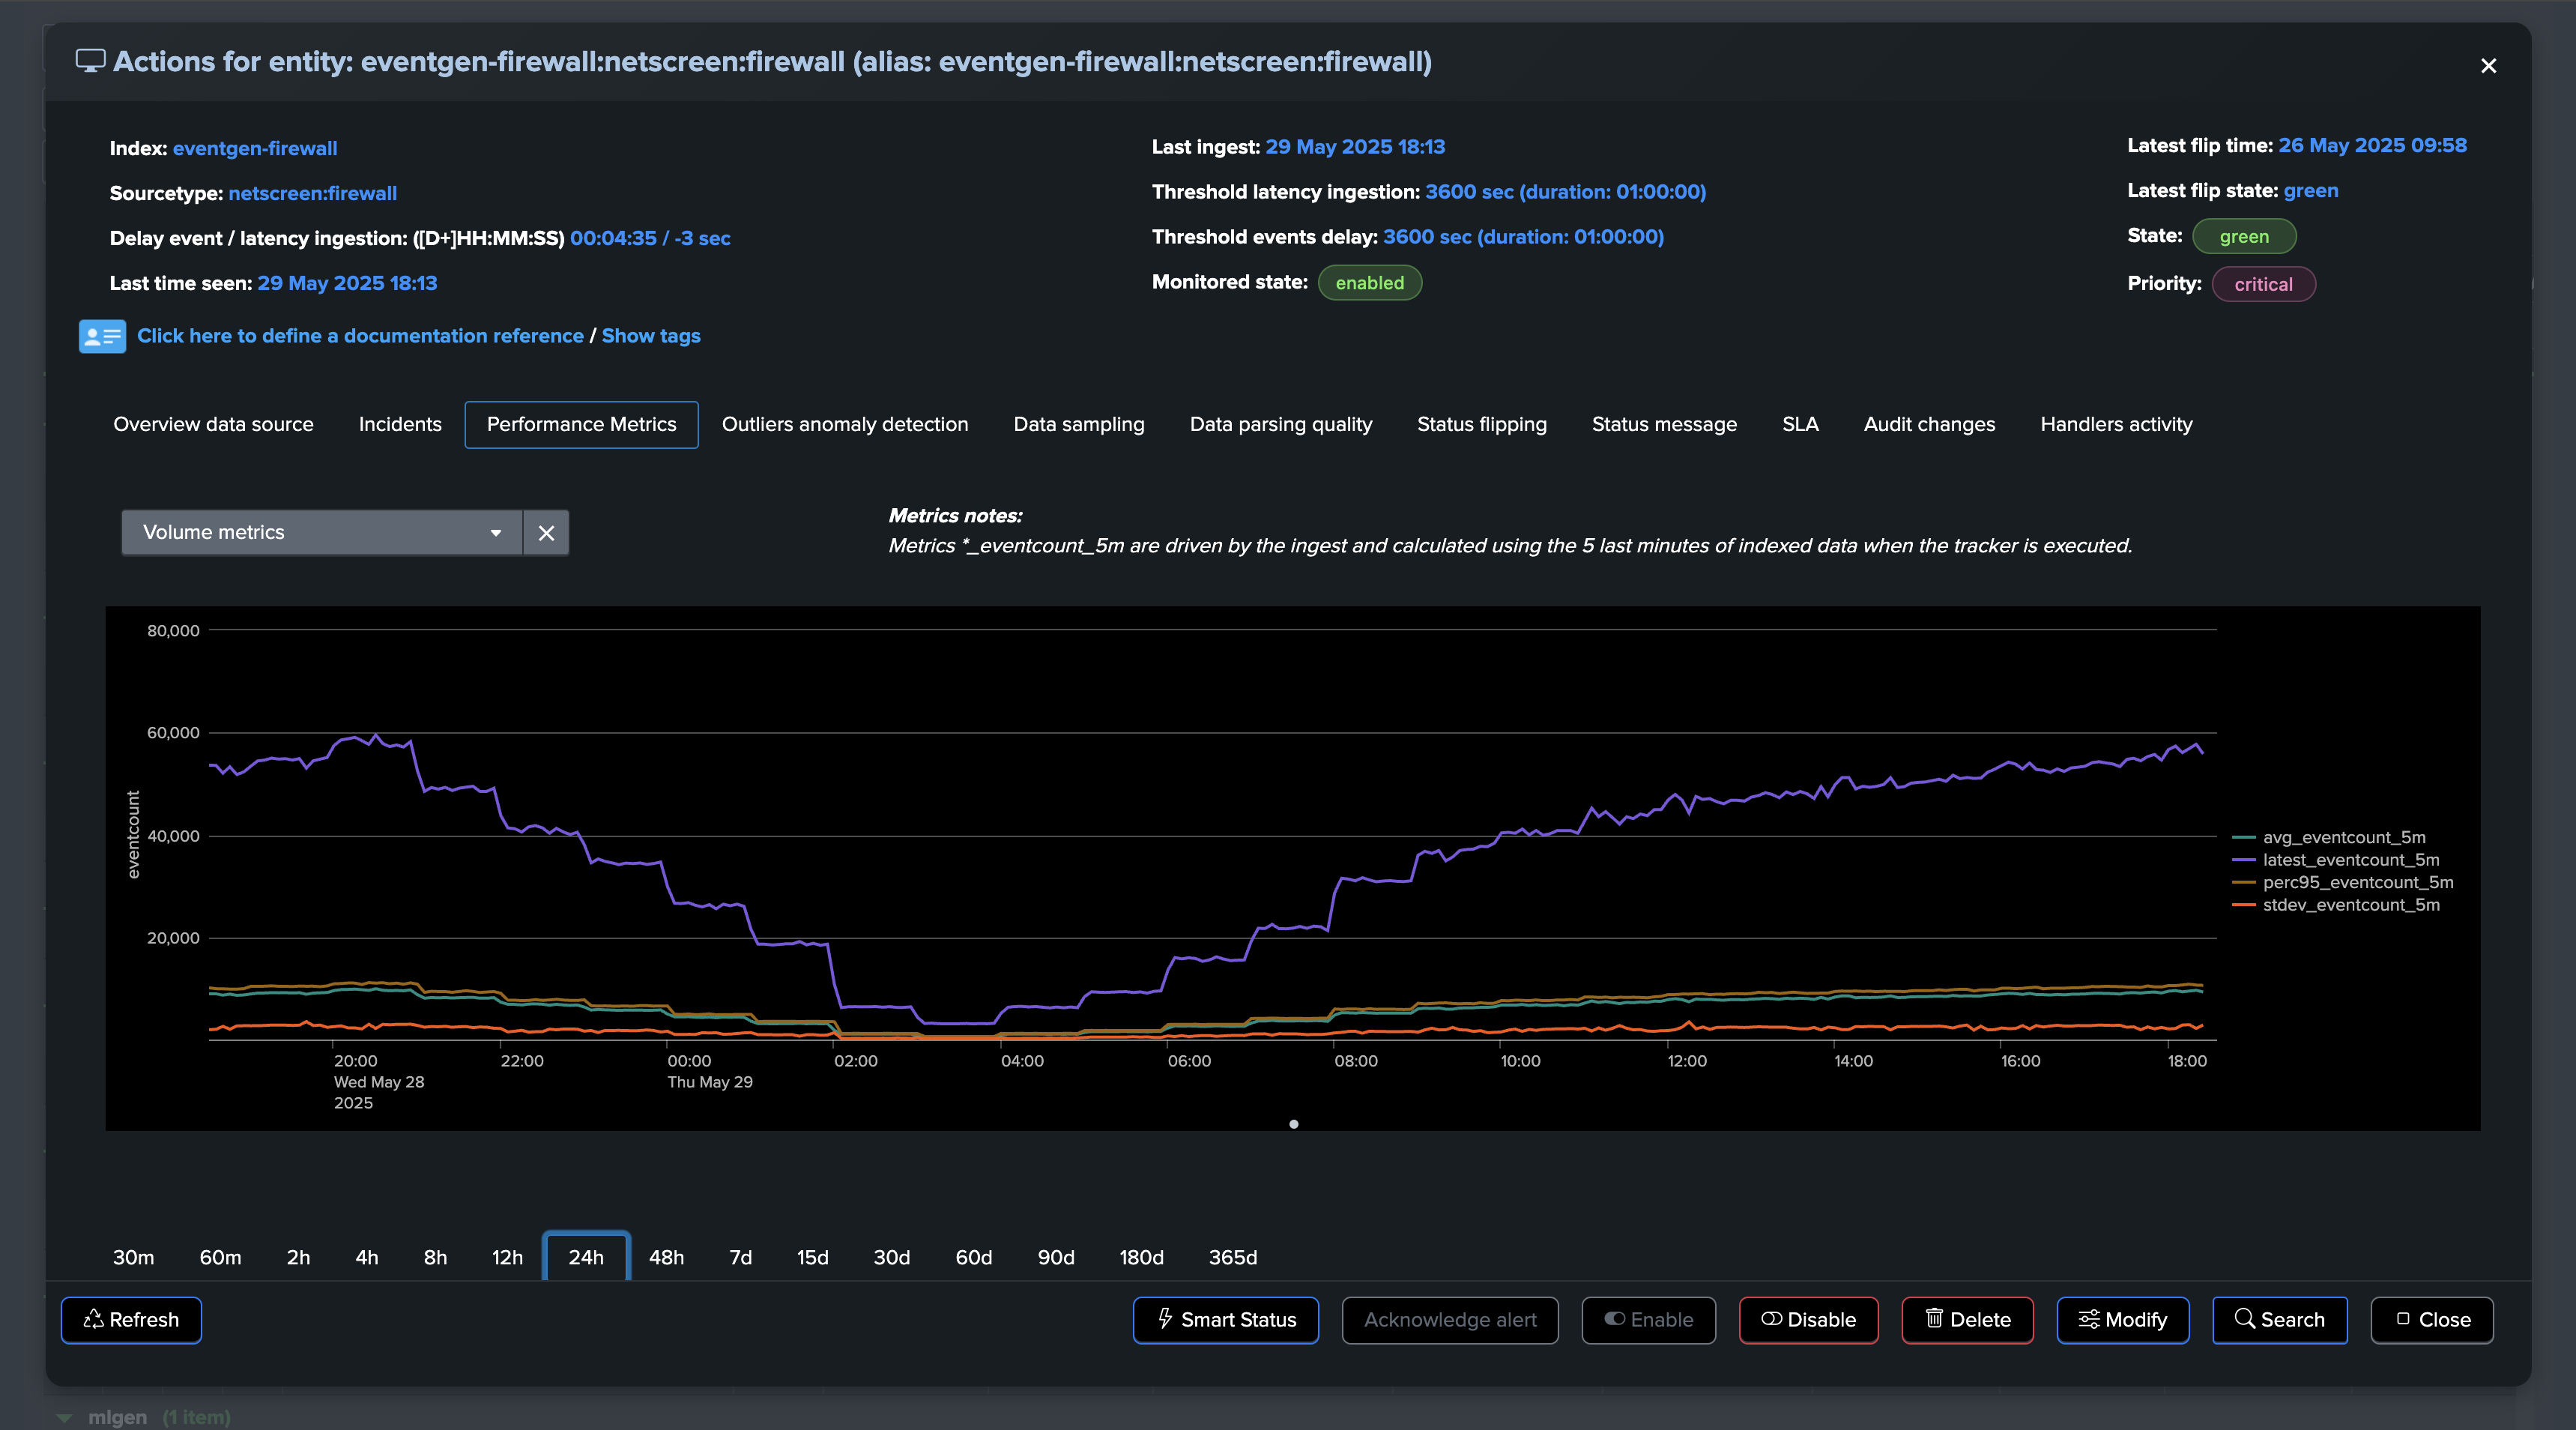
TrackMe is all about Key Performance Indicators (KPIs) and high performing metrics, this means that whatever the use case, we turn data into metrics then act against these.
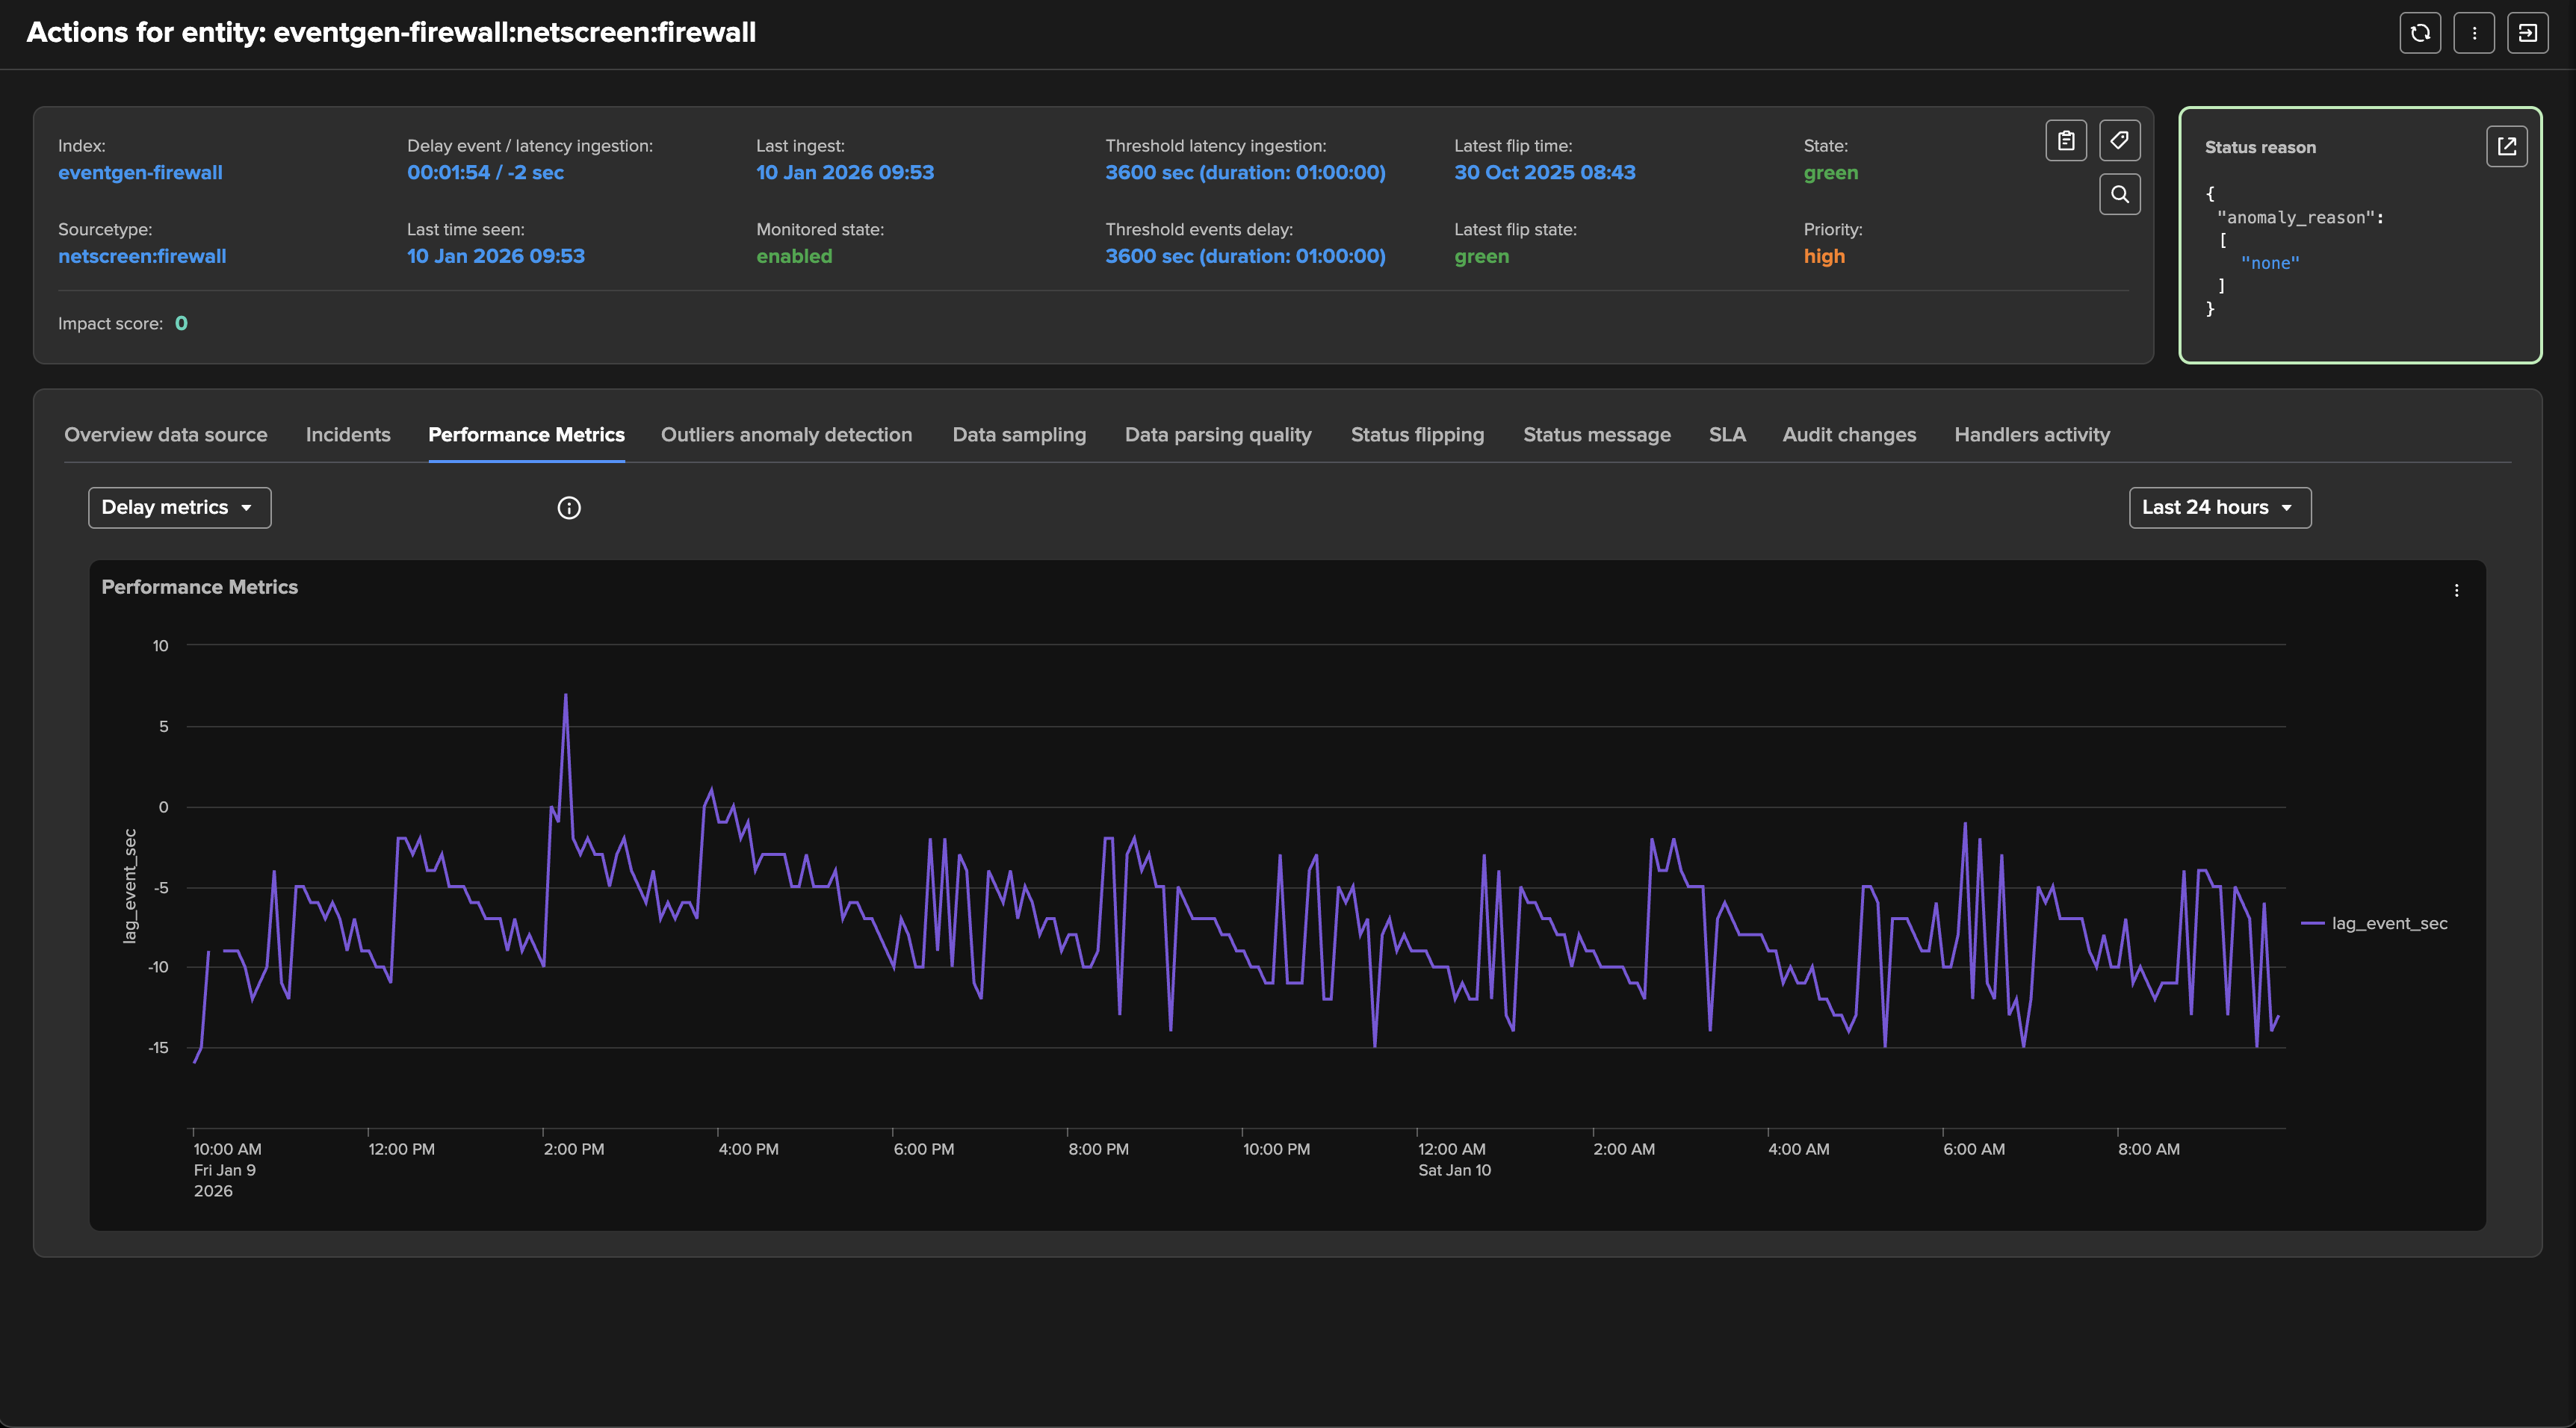
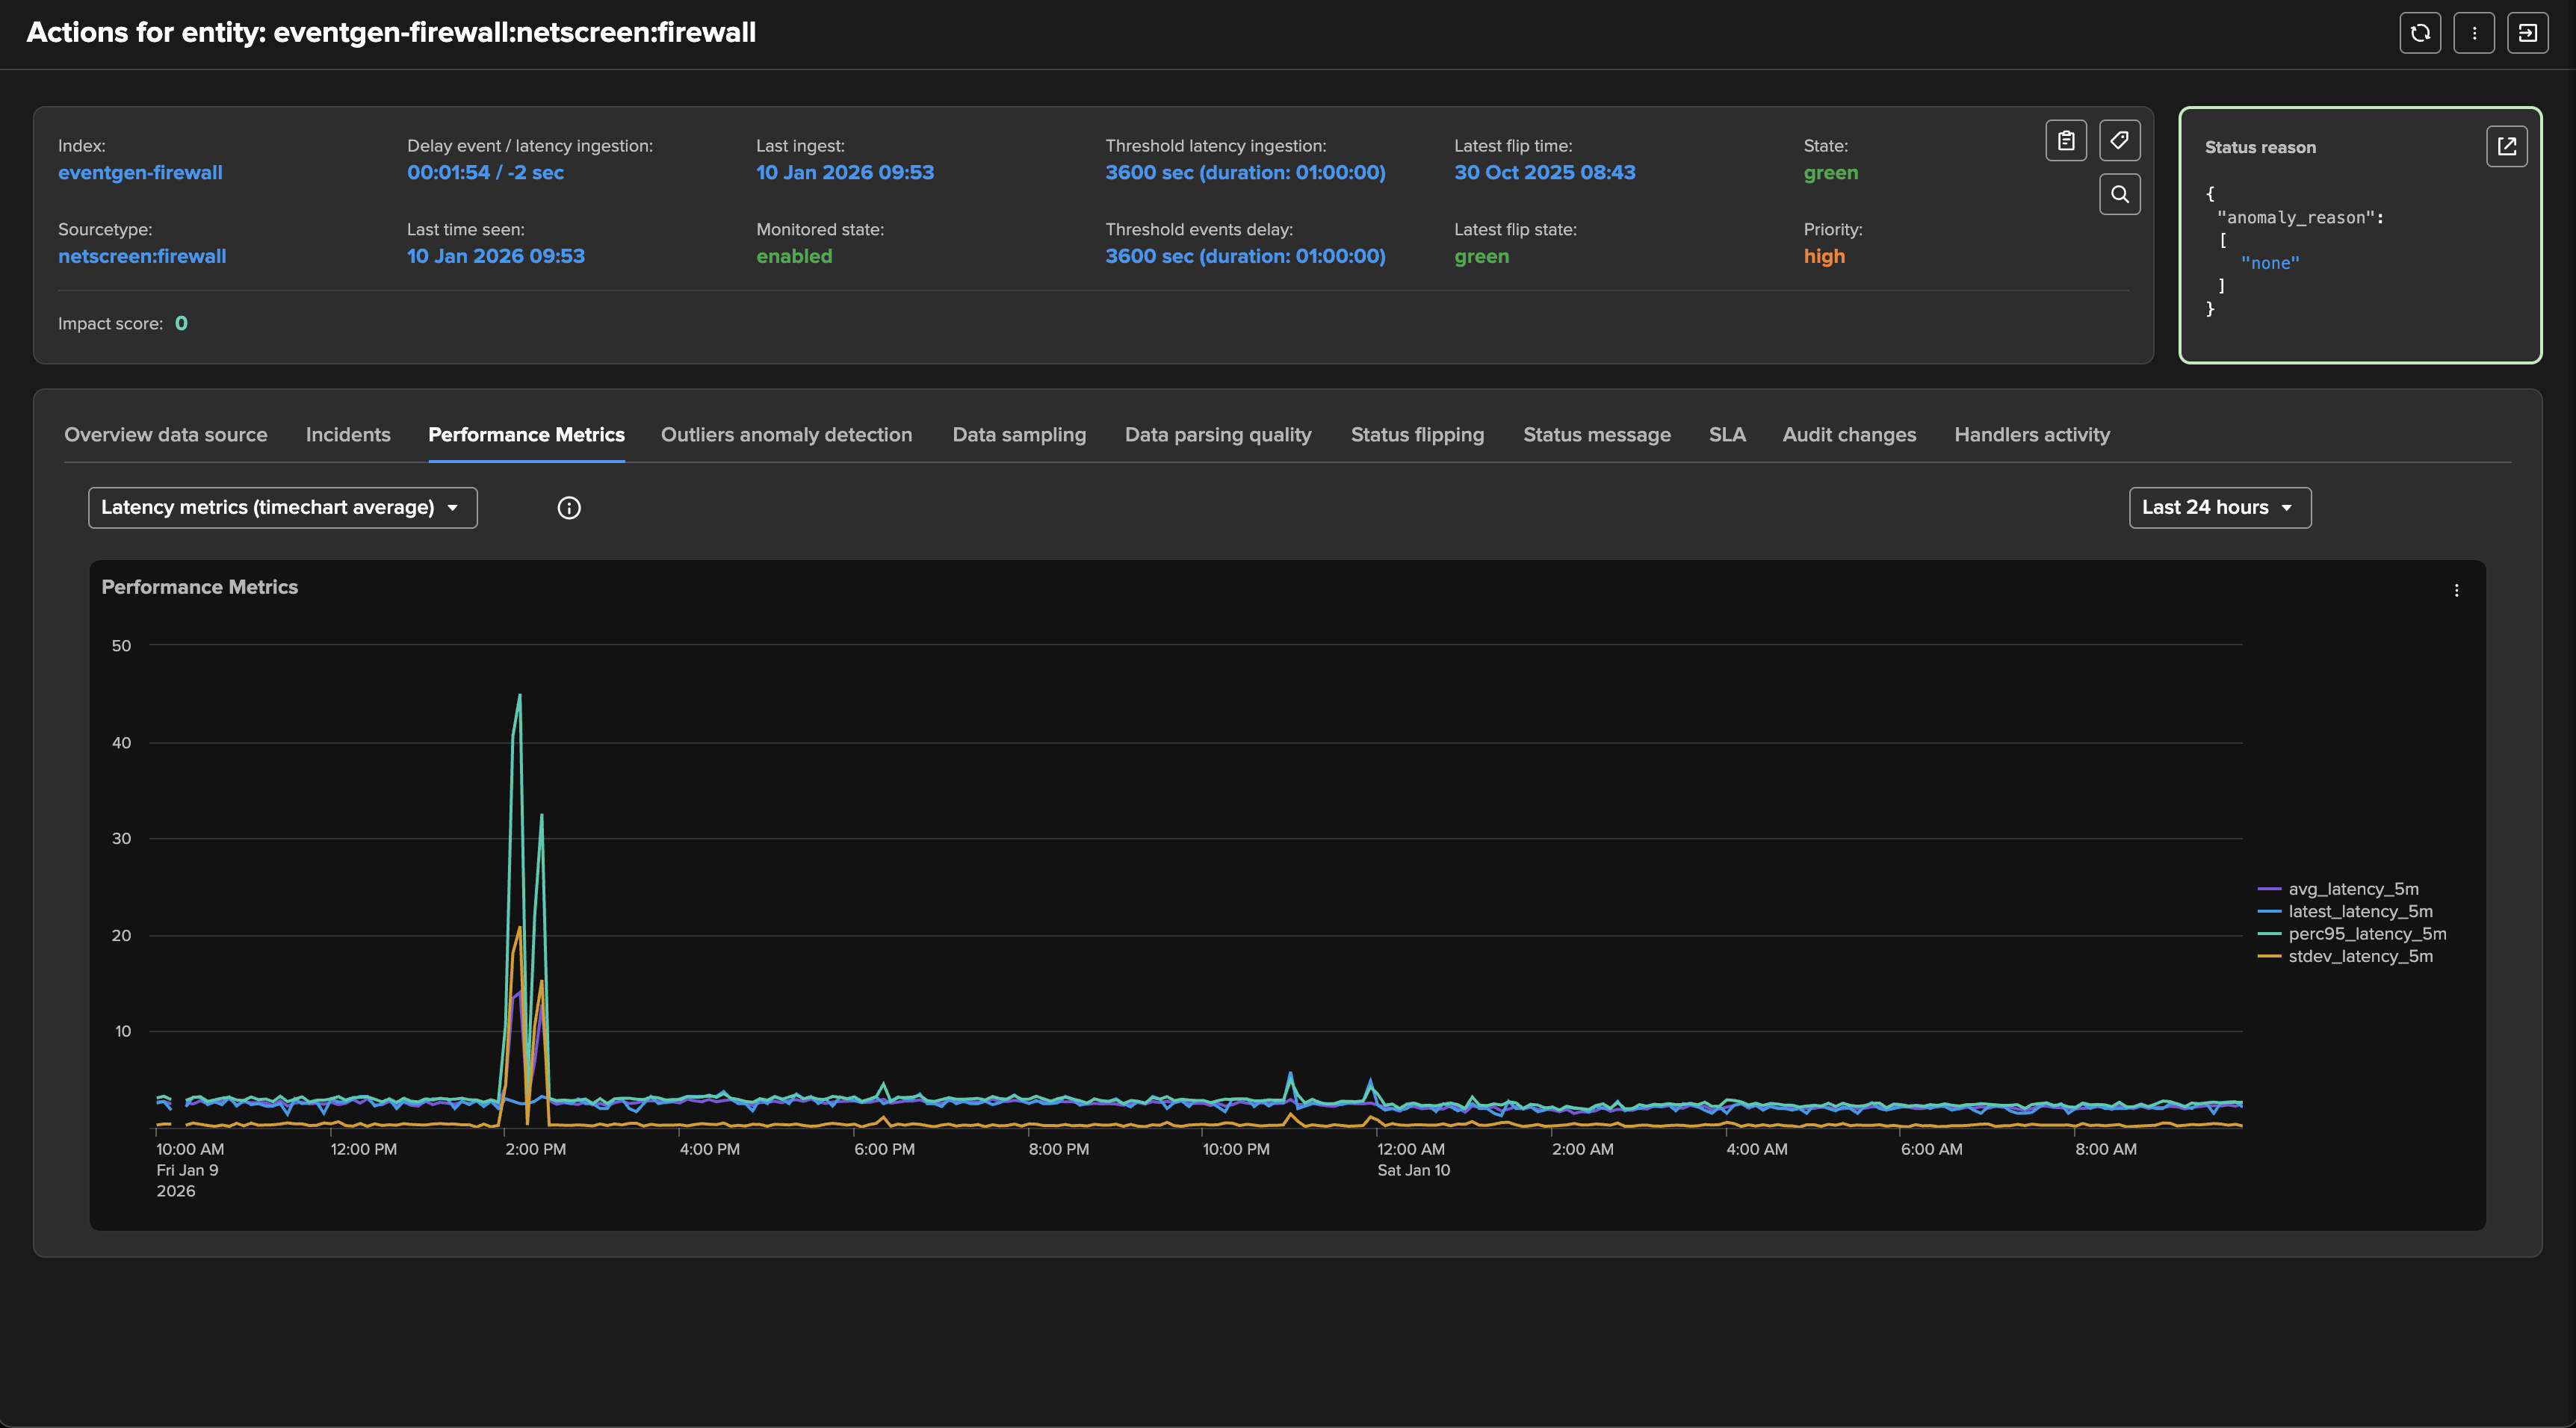
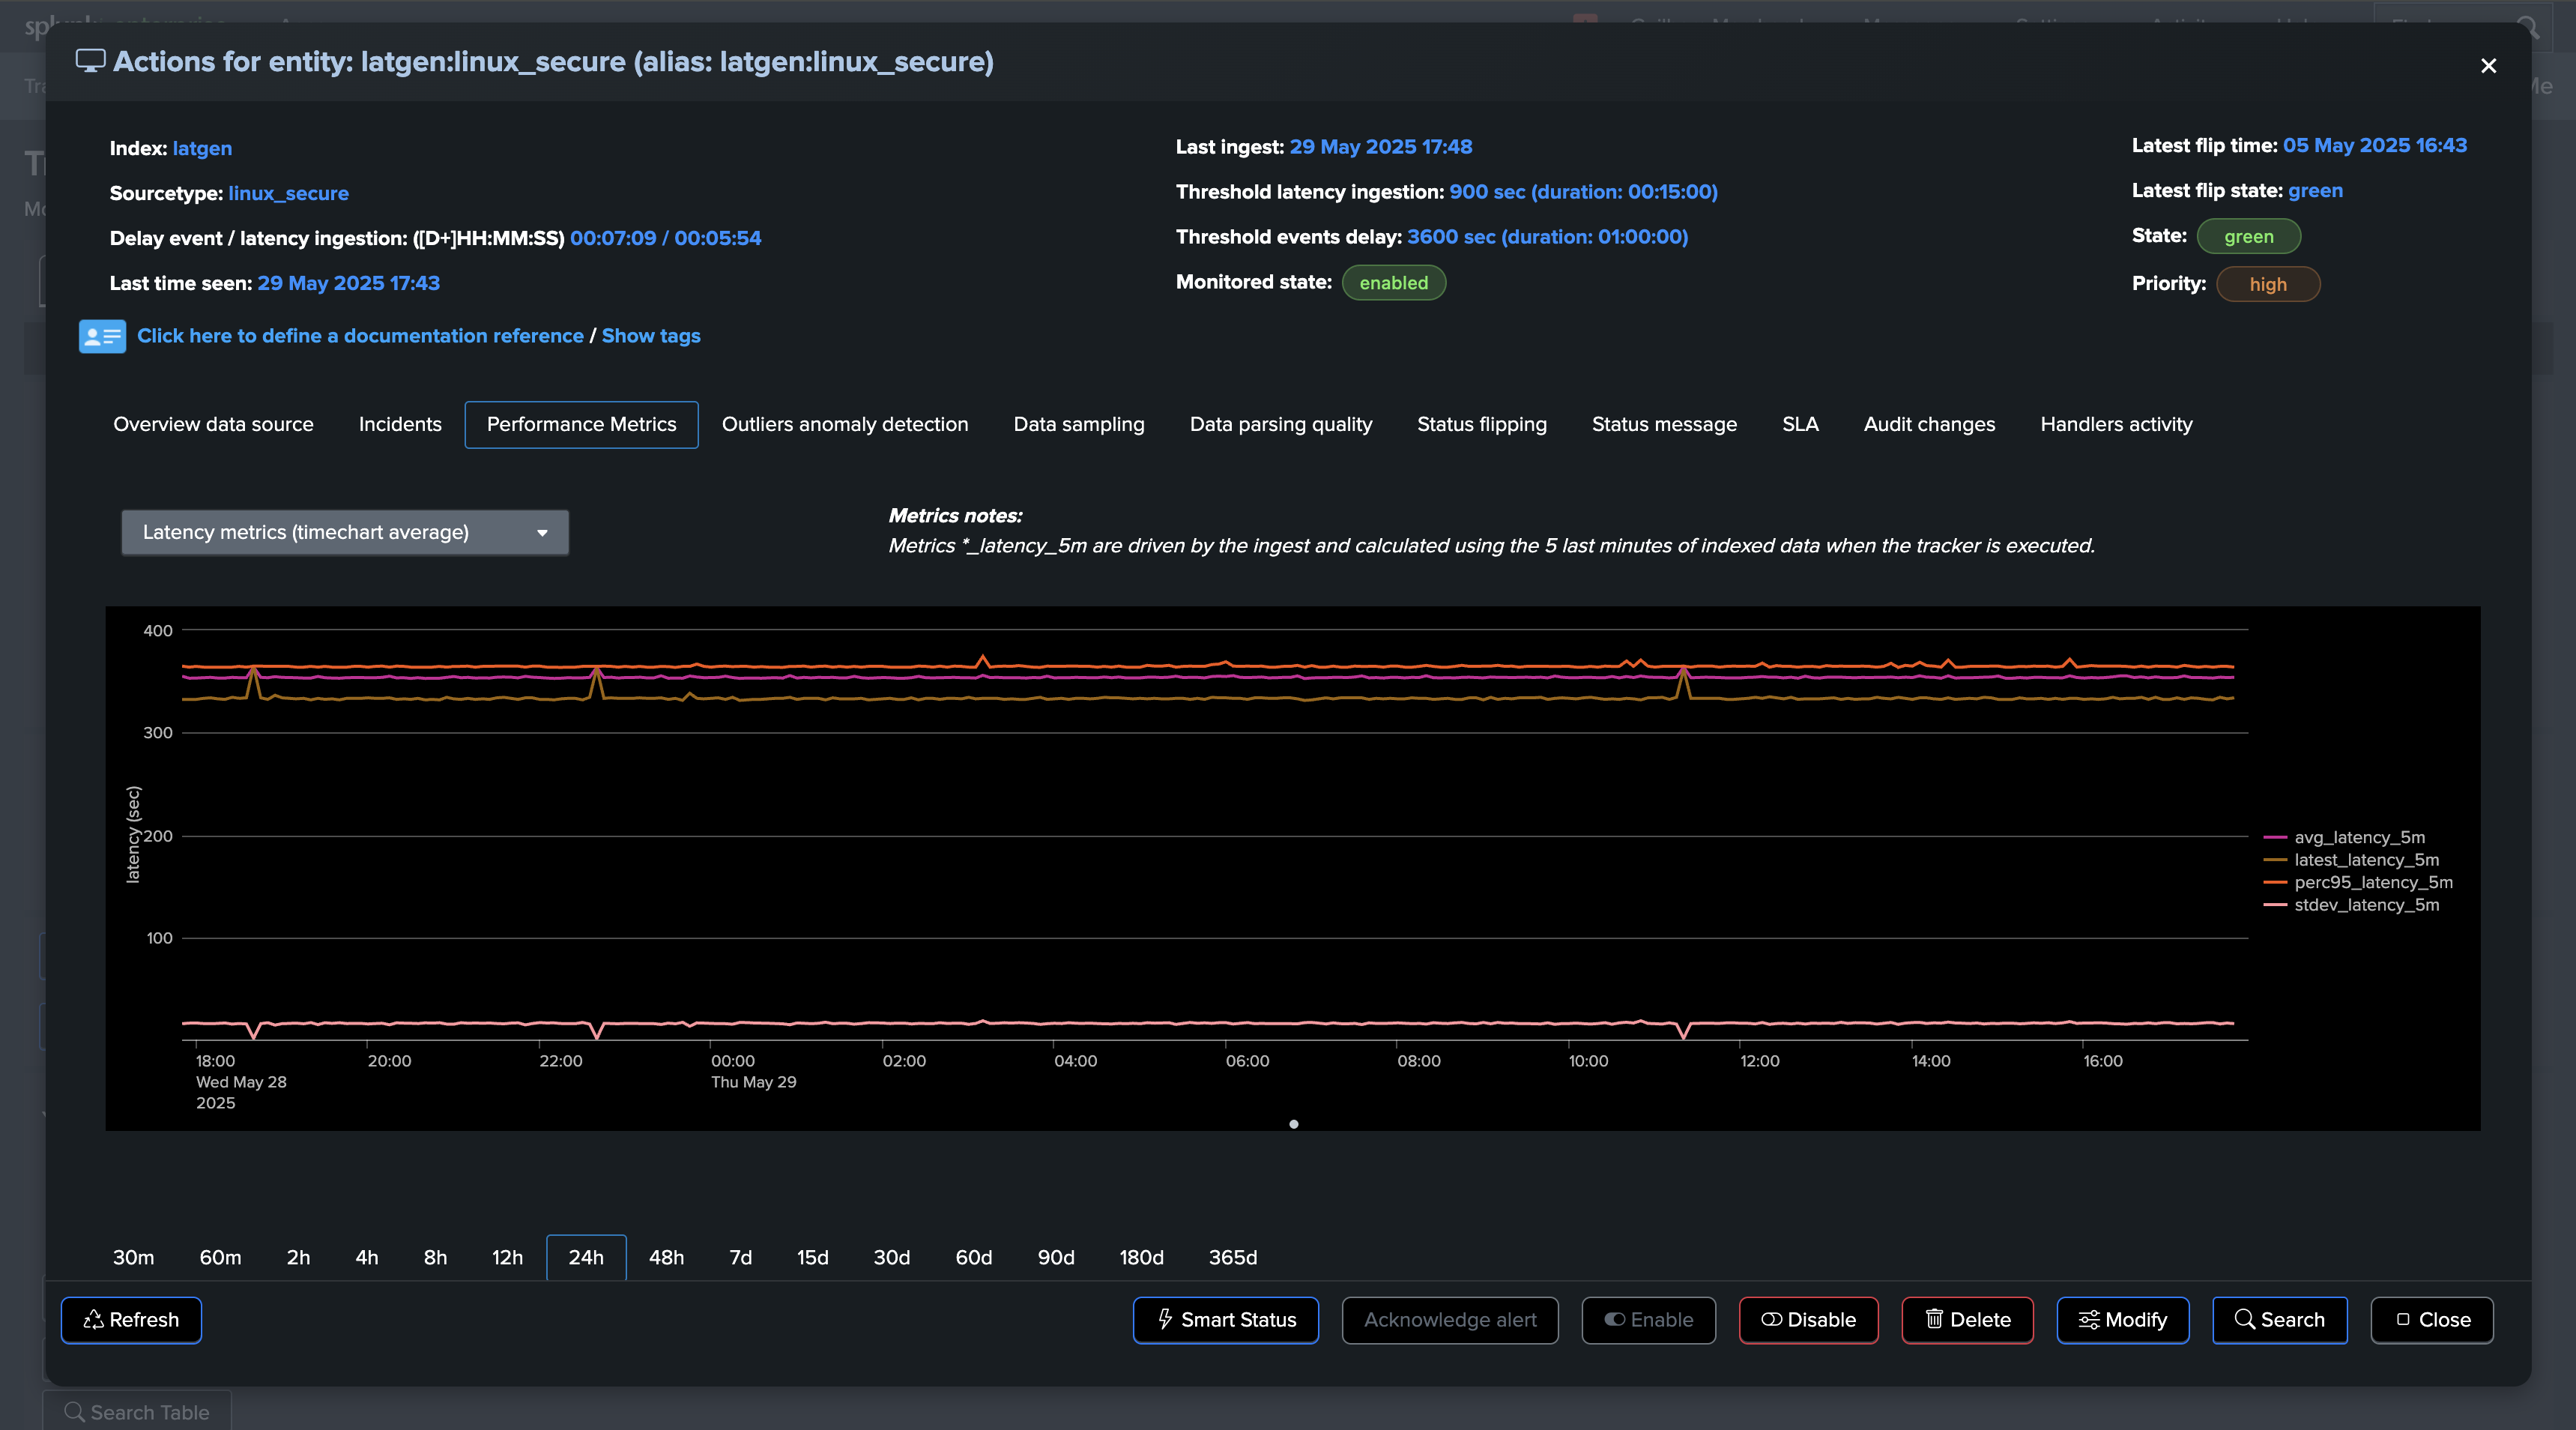
In all components, you will find a tab called Performance Metrics which lists available metrics for the given entity.
For Data Sources and Hosts, the primary KPIs are:
Latency: The performance at the indexing level from the Splunk perspective, as the difference between the indexed time and the event time.Delay: How late the data is, calculated as the difference between now when the tracker is executed, and the very last event time.
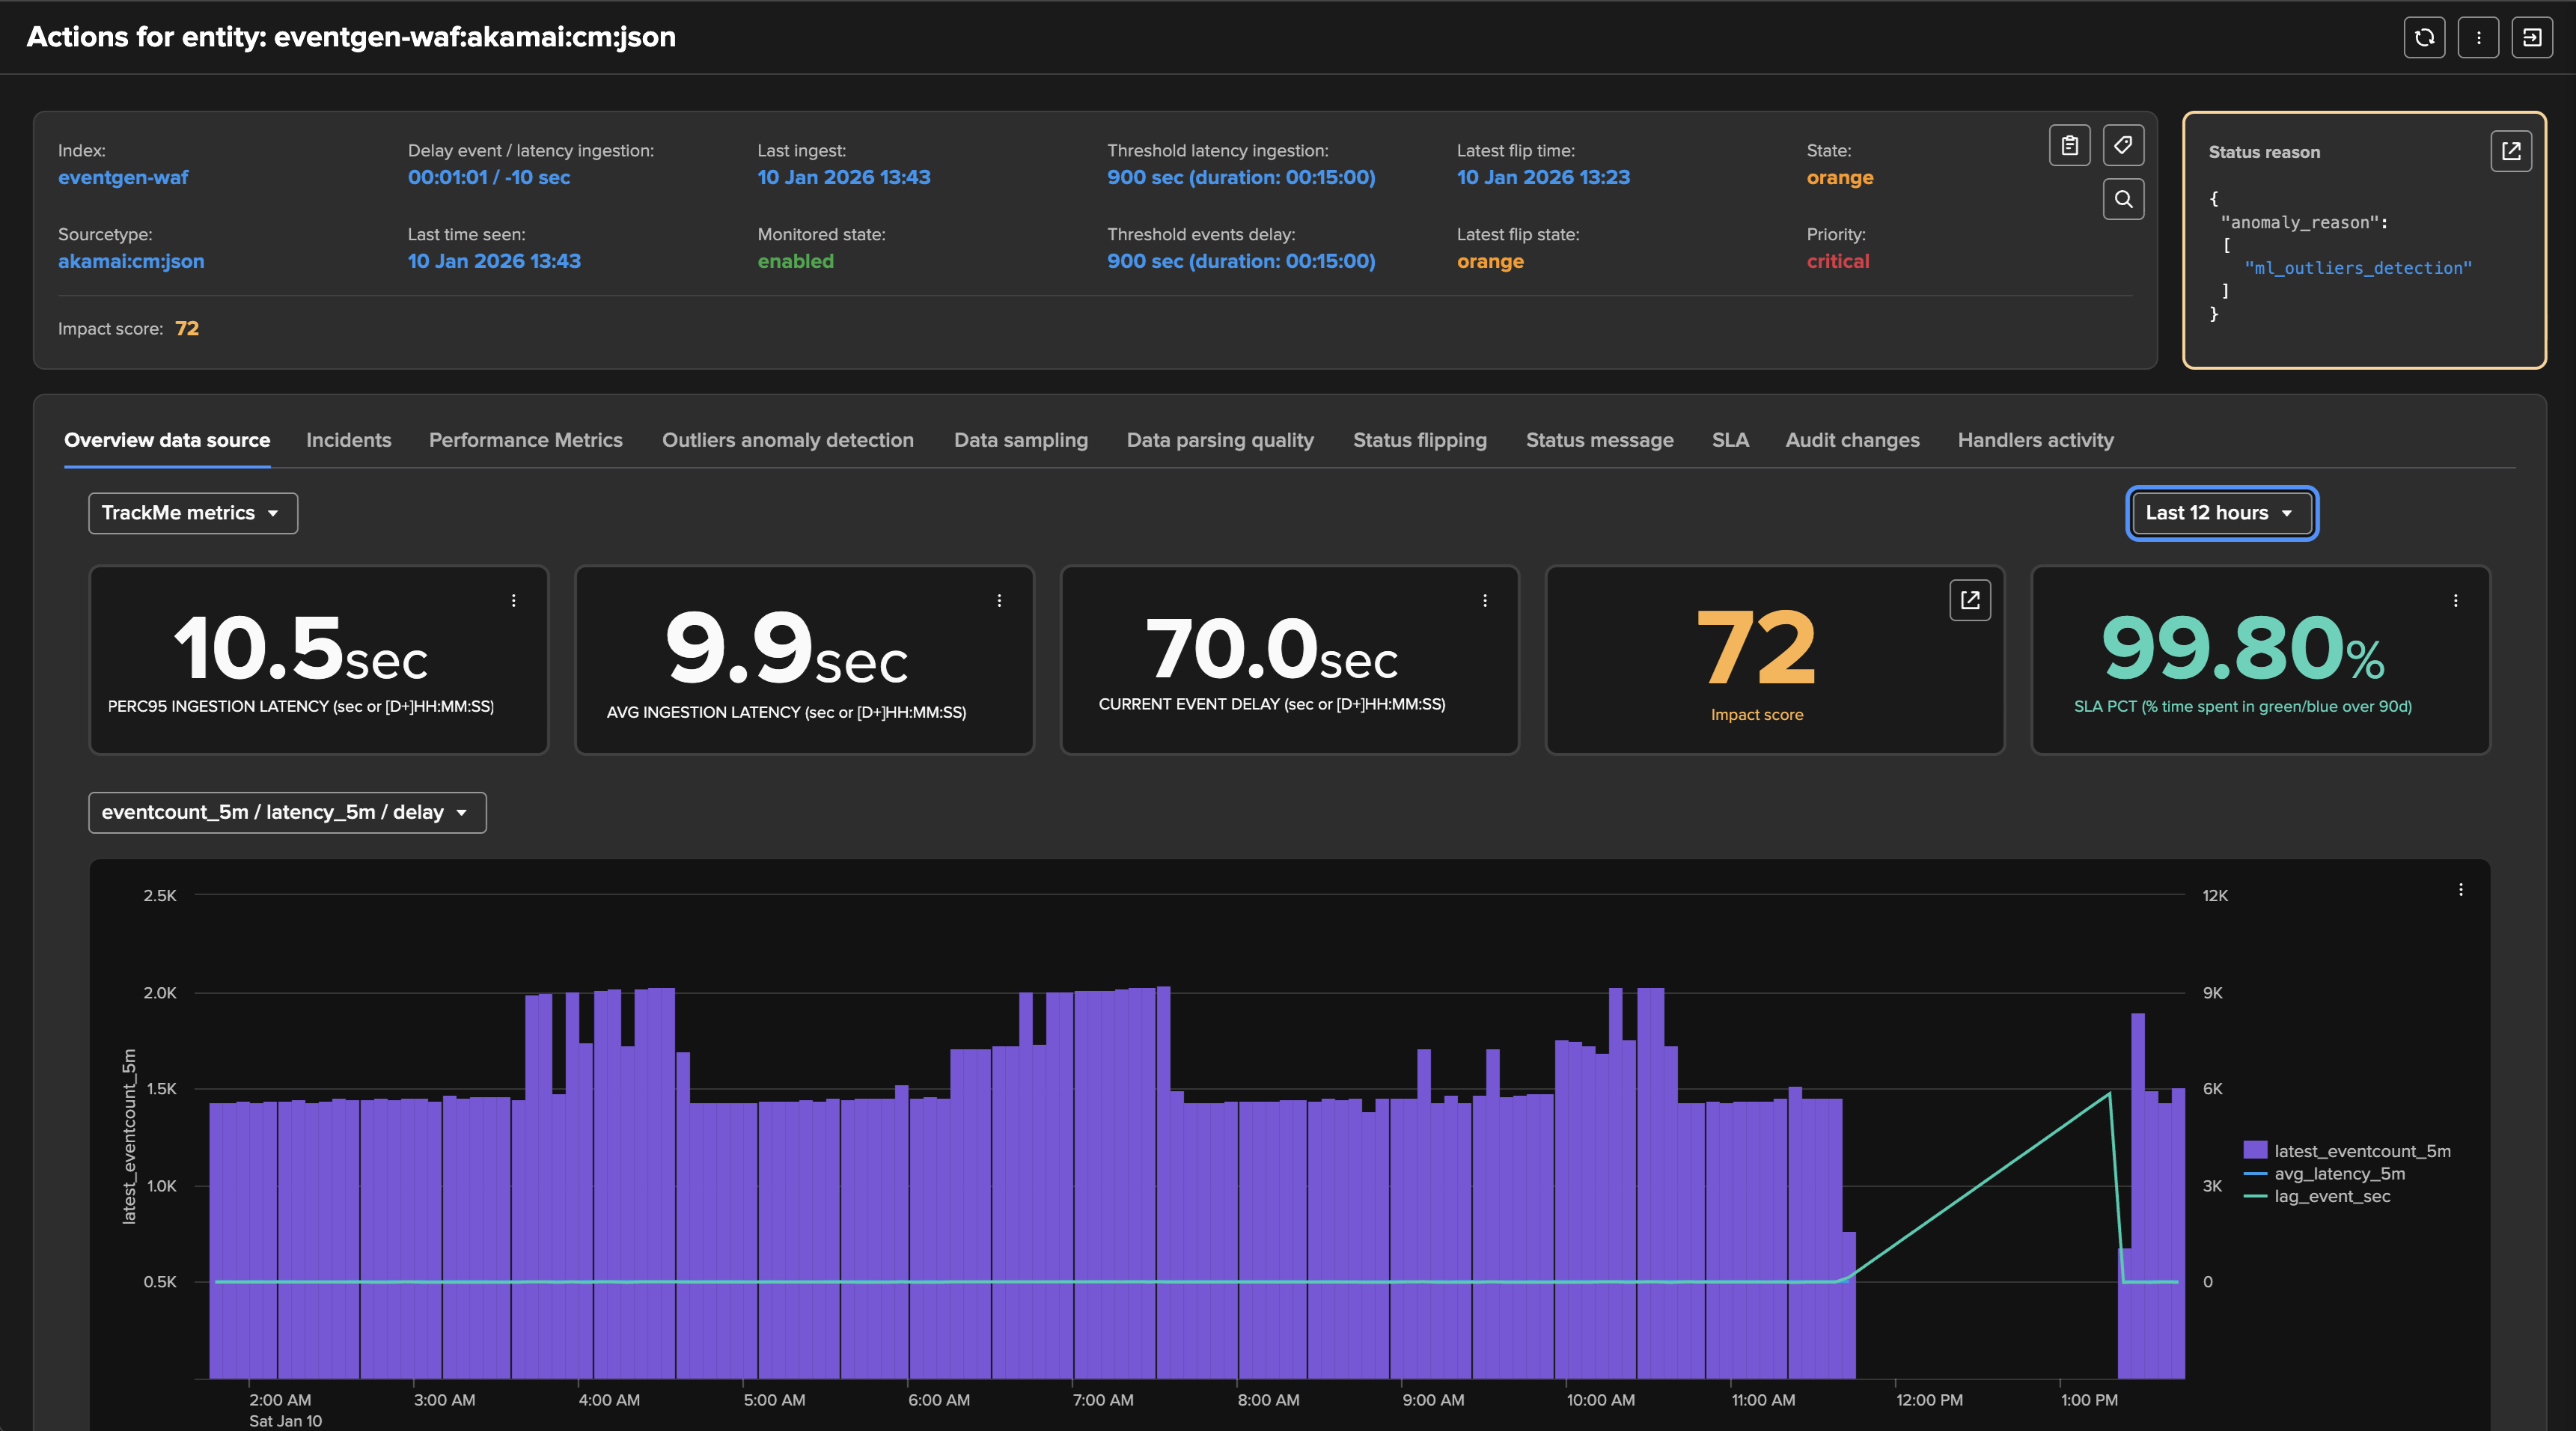
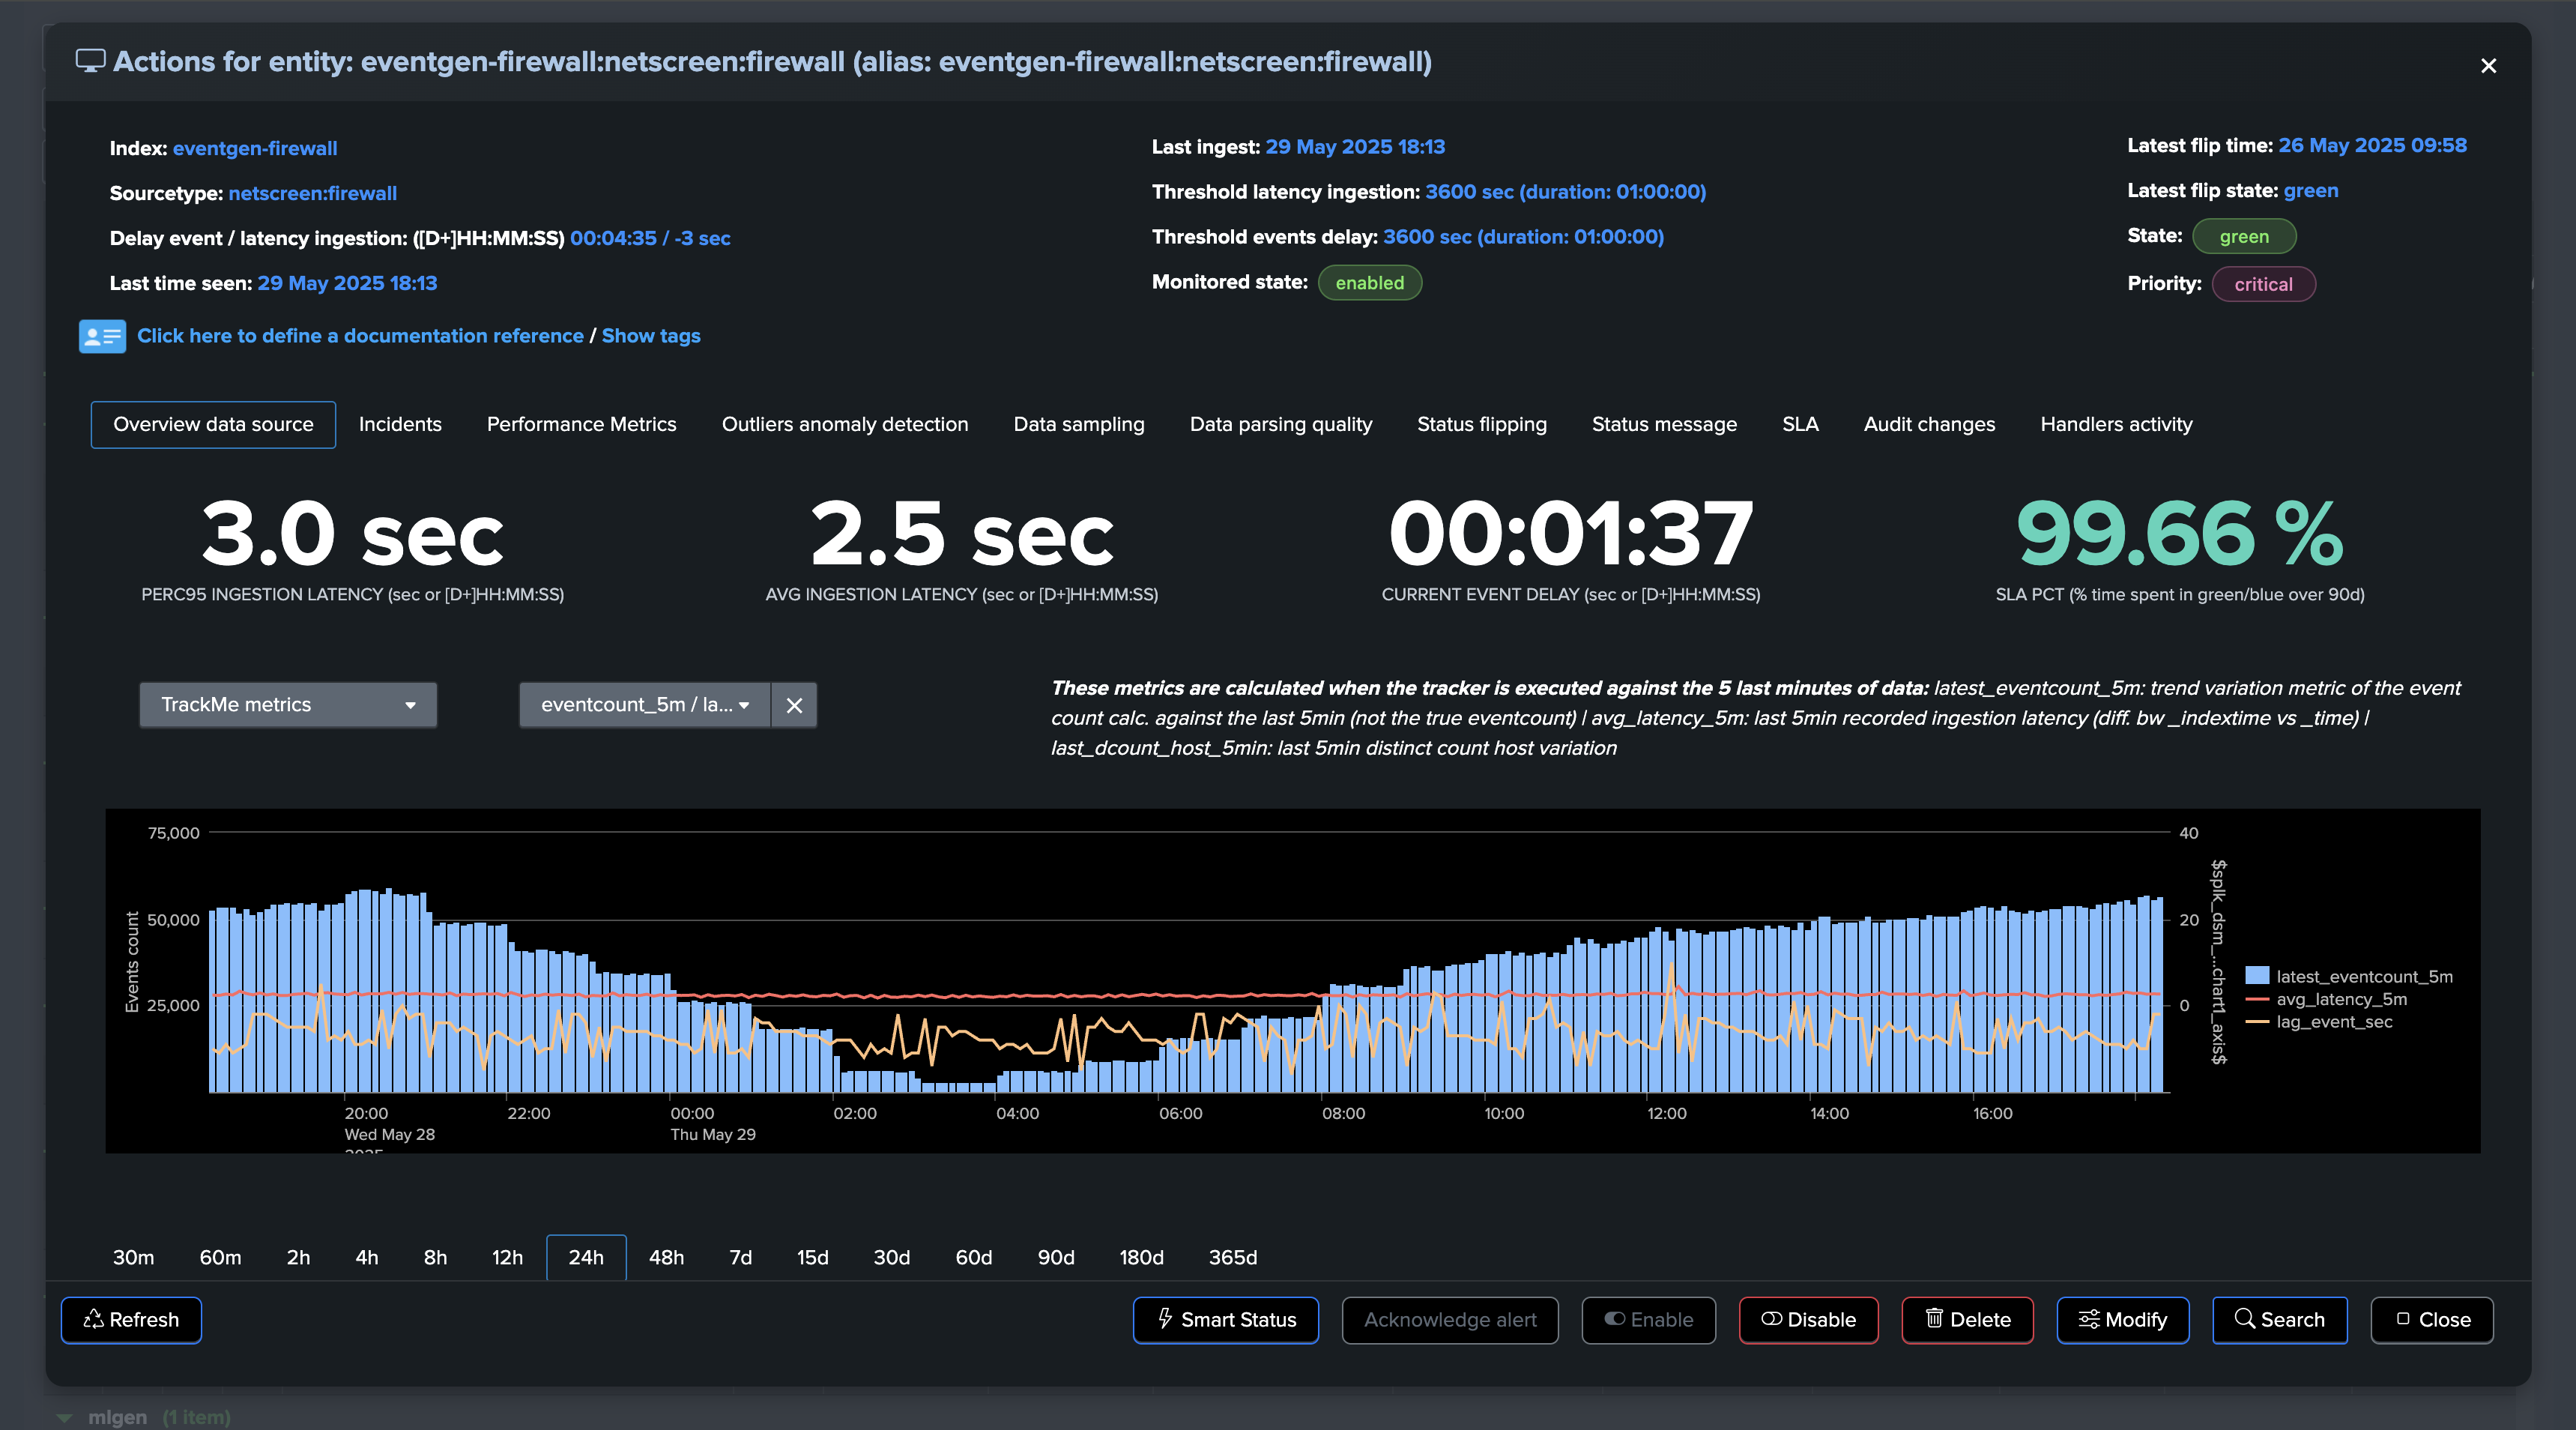
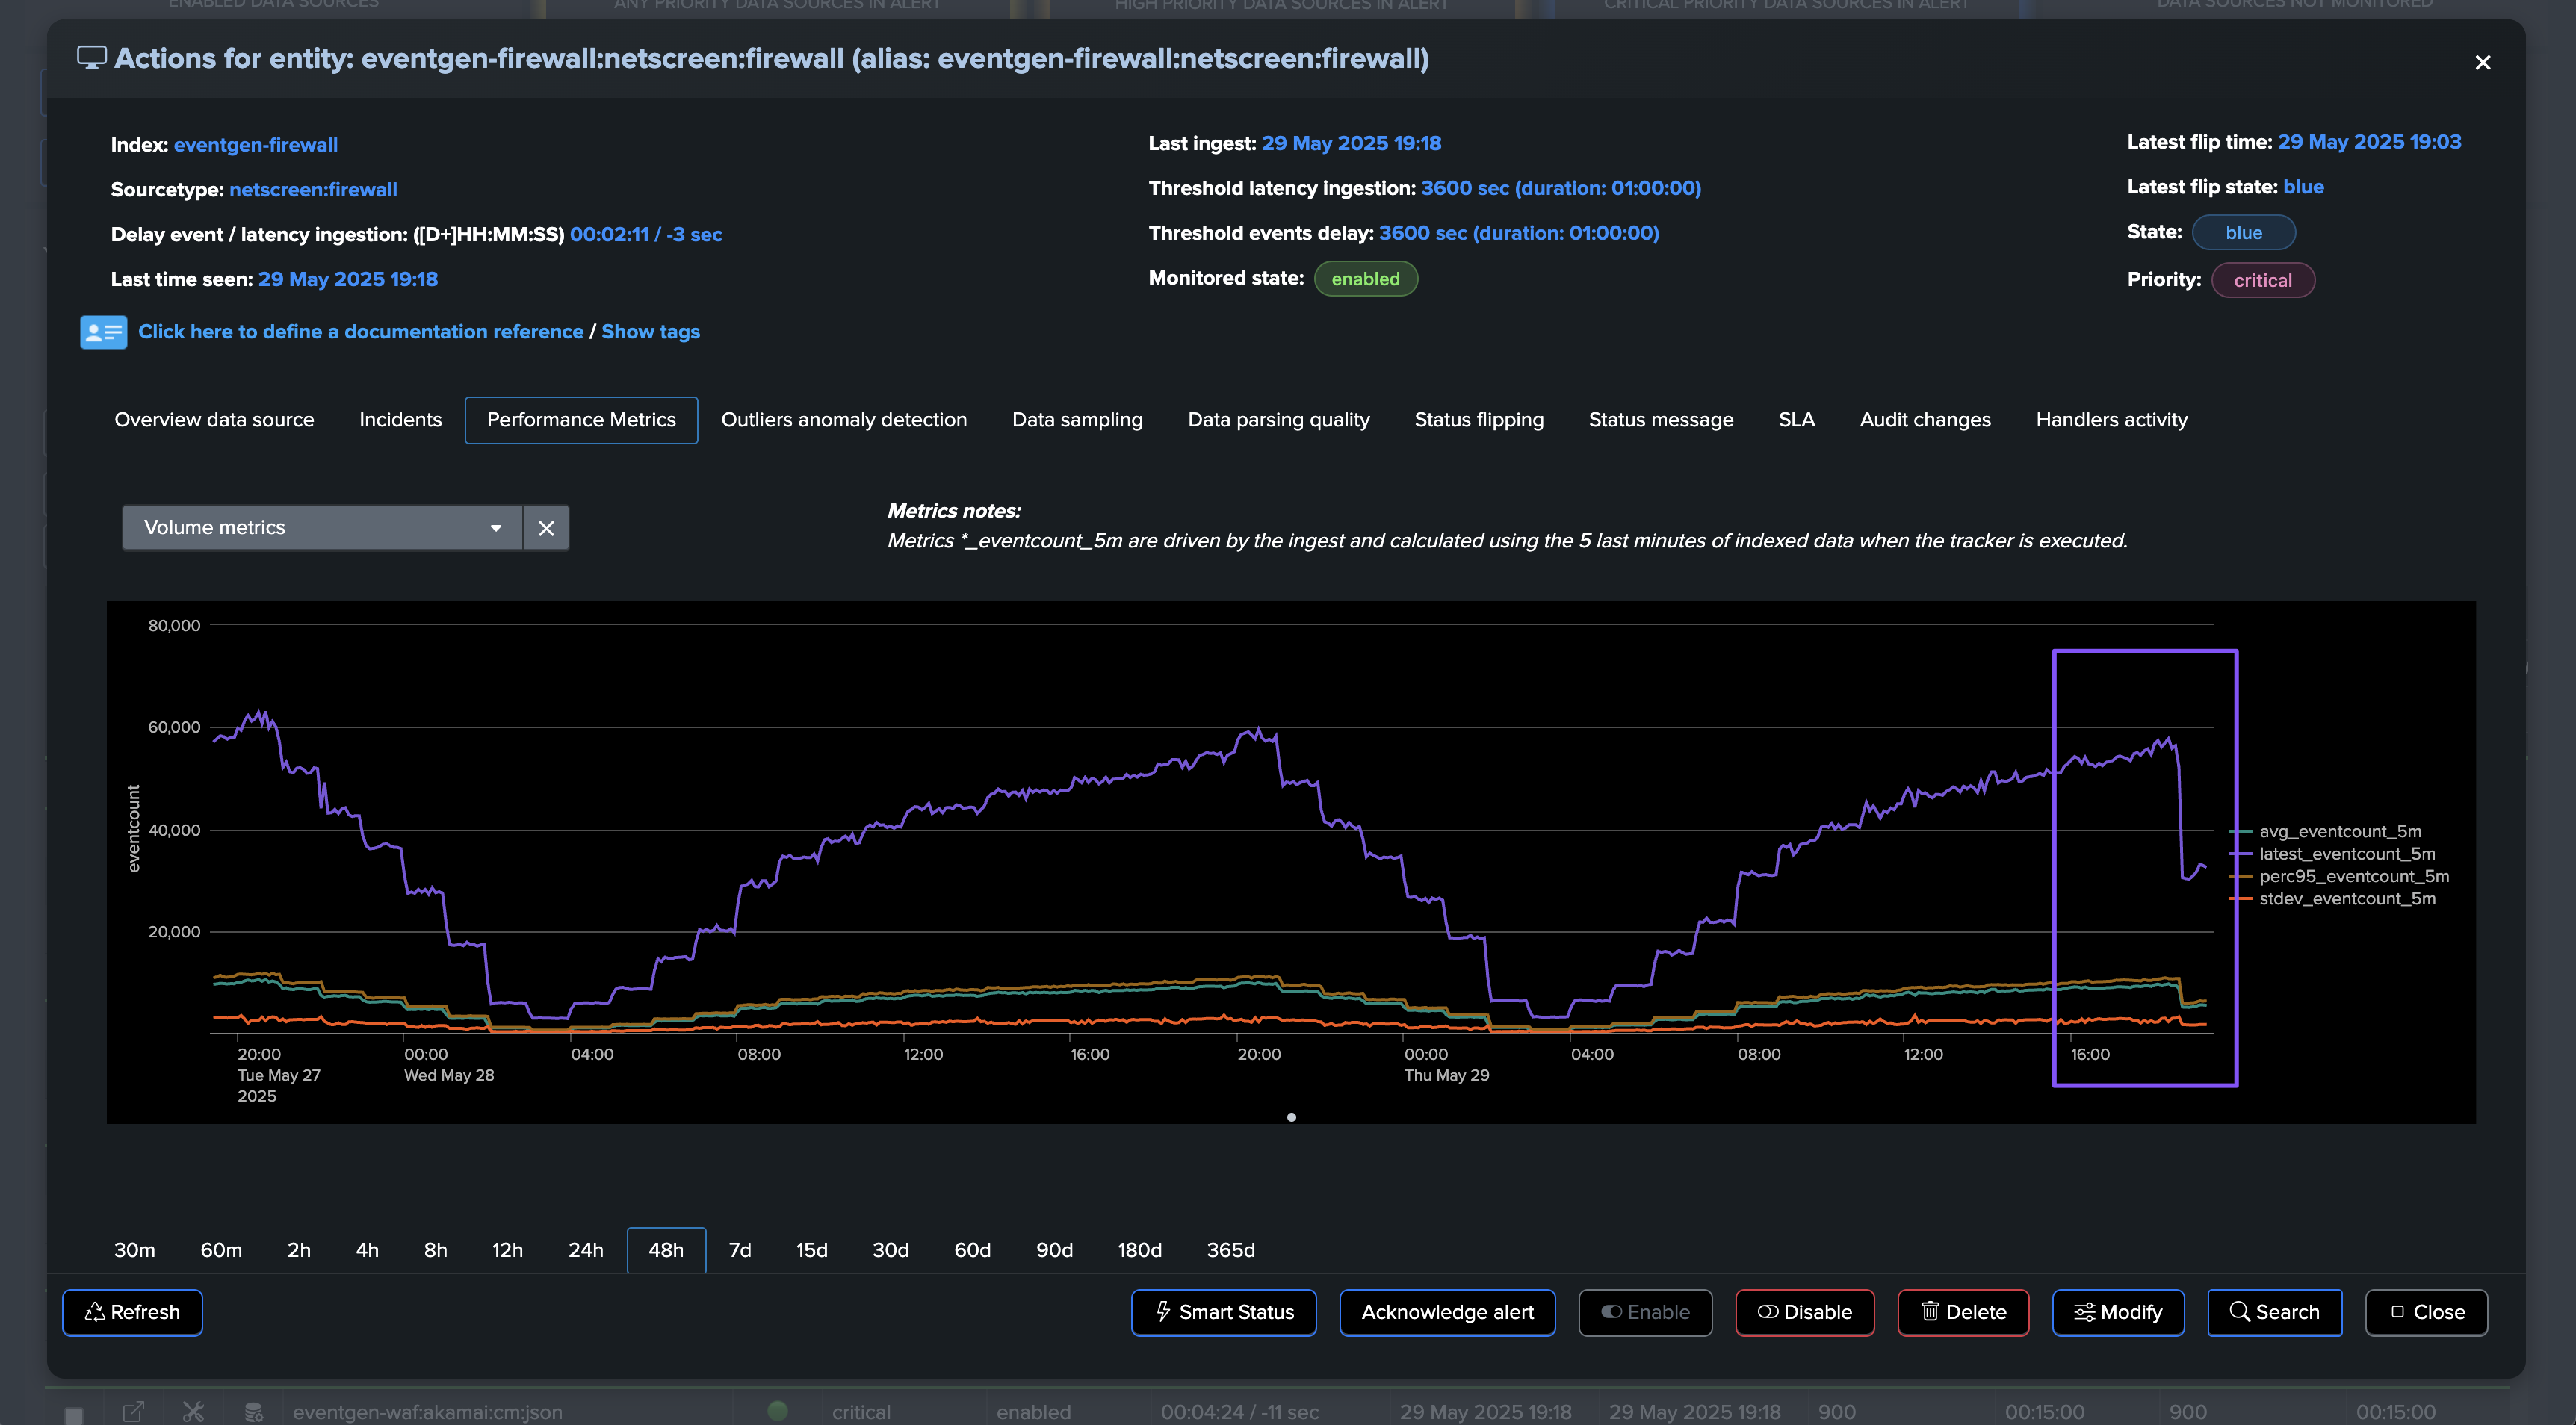
The Entity overview shows both KPIs in the main view:
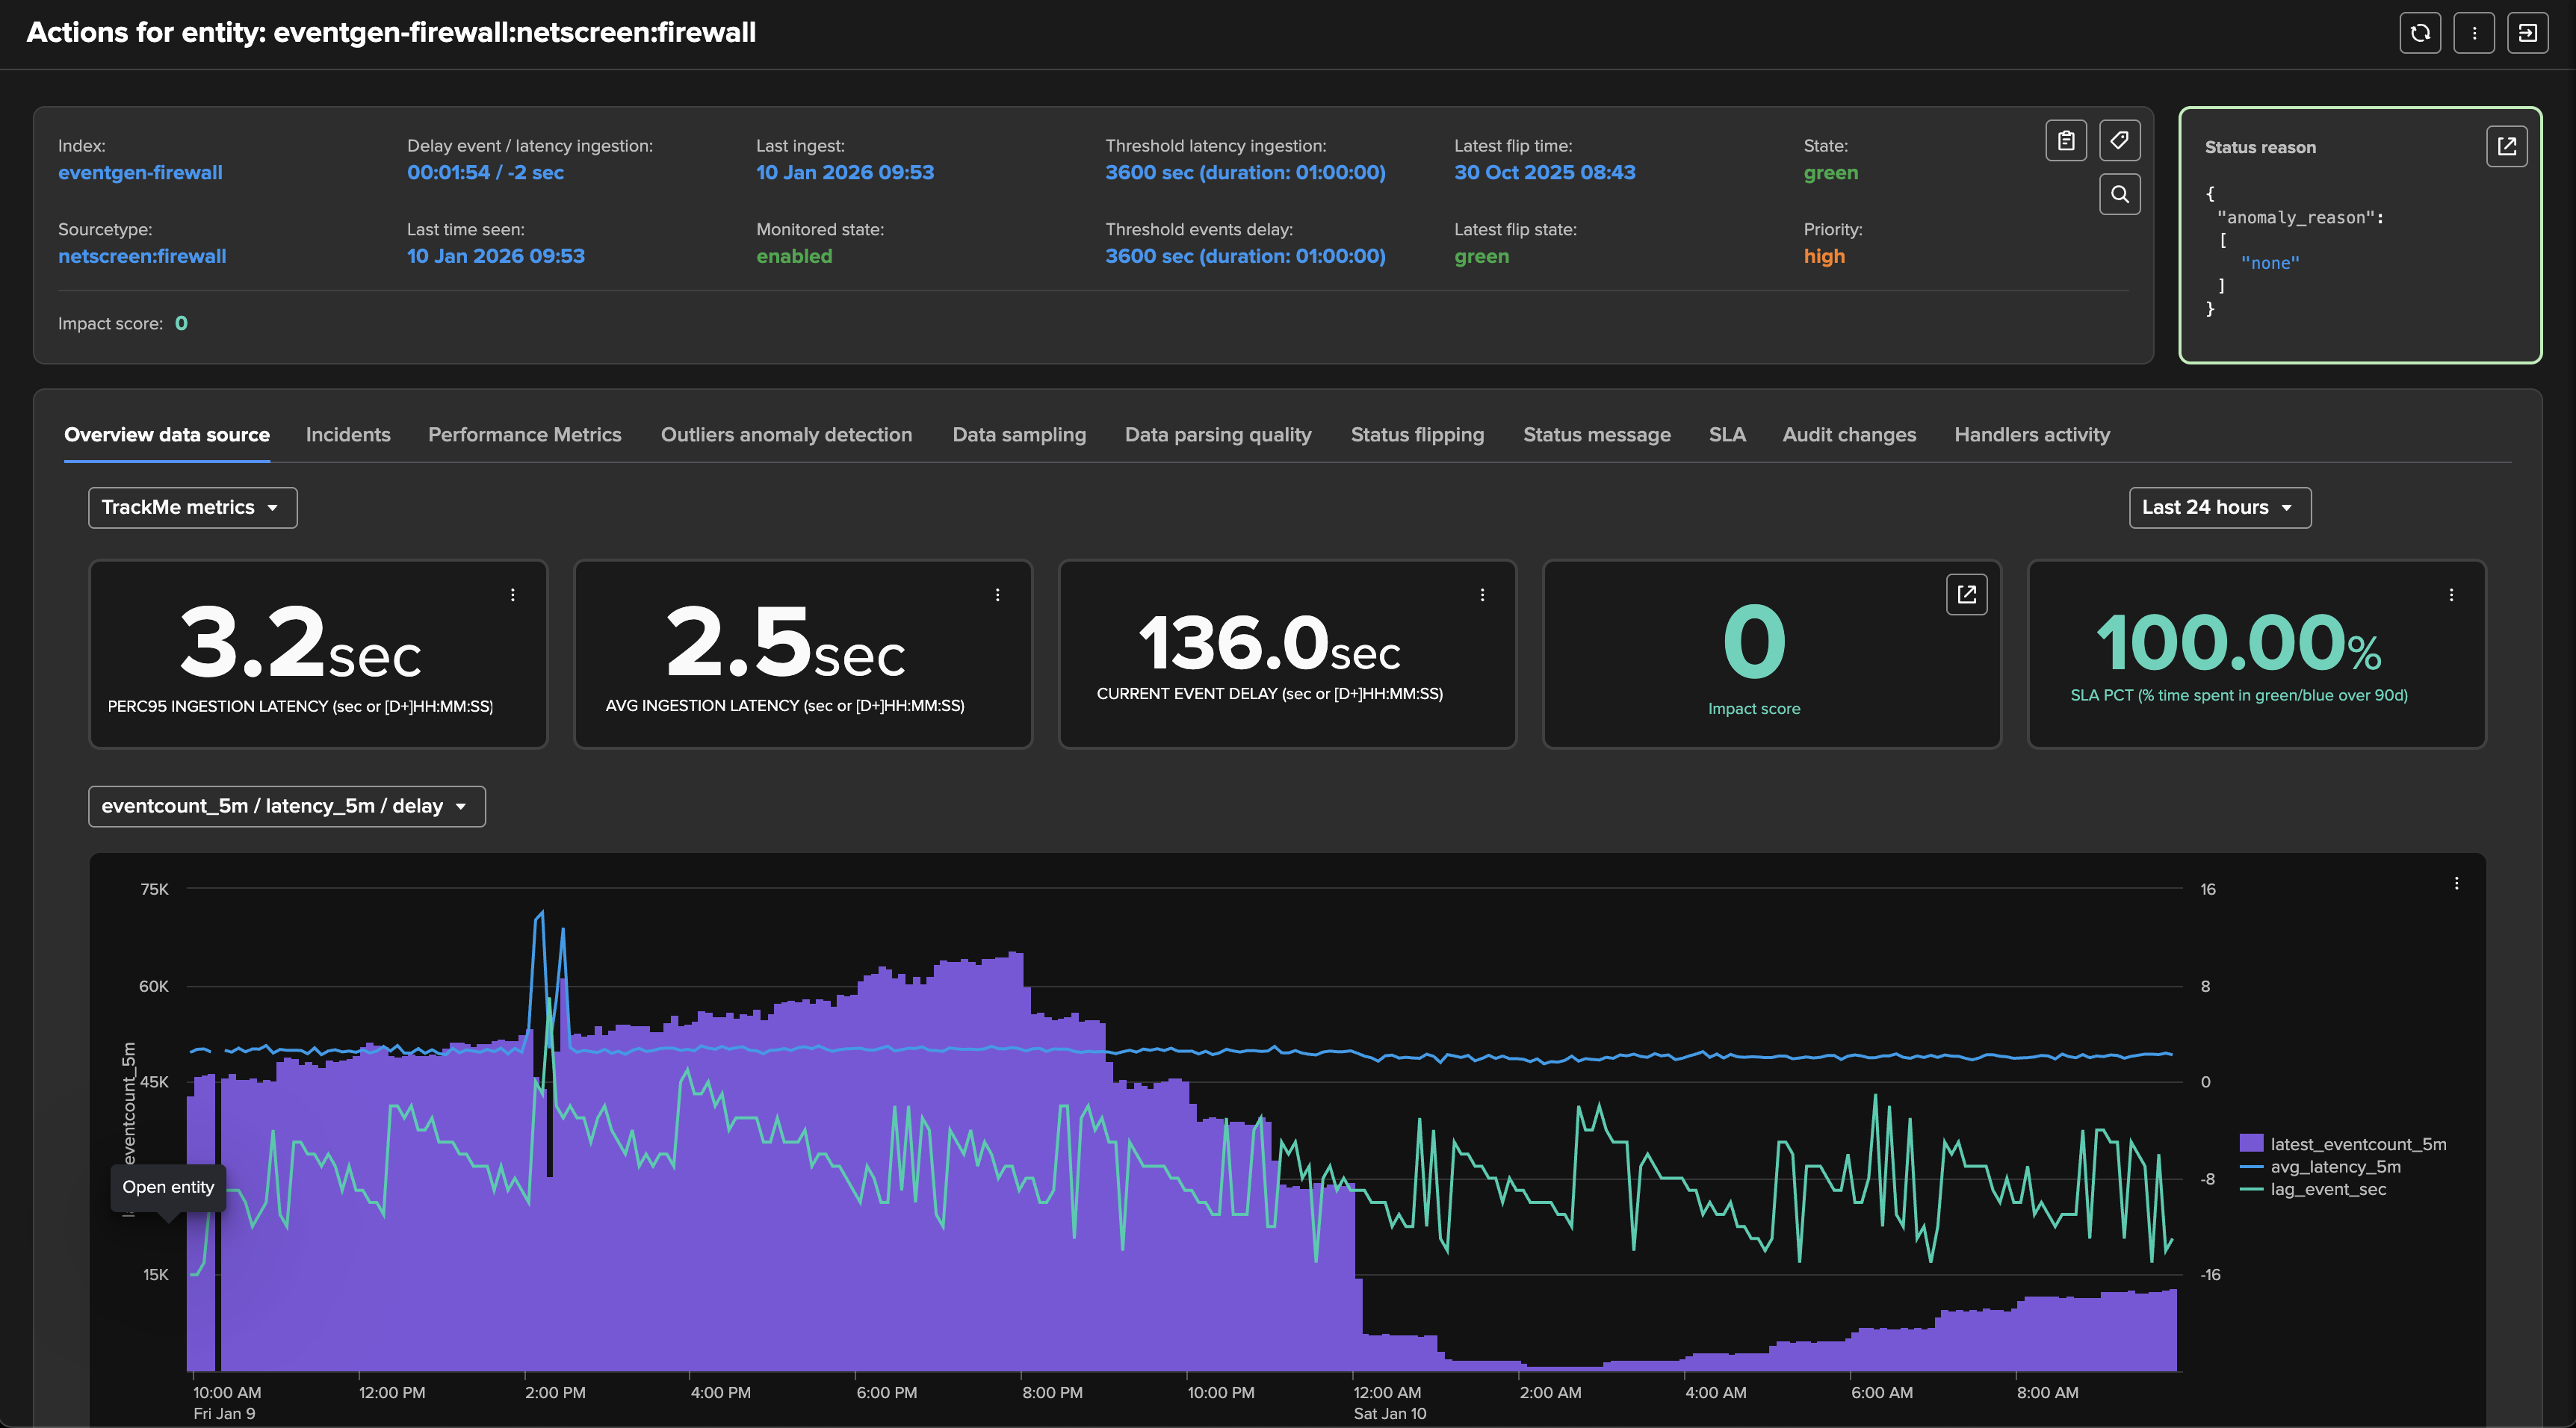
You can review in details metrics in the “Performance metrics” tab:
TrackMe applies configurable thresholds to influence the impact score calculation:

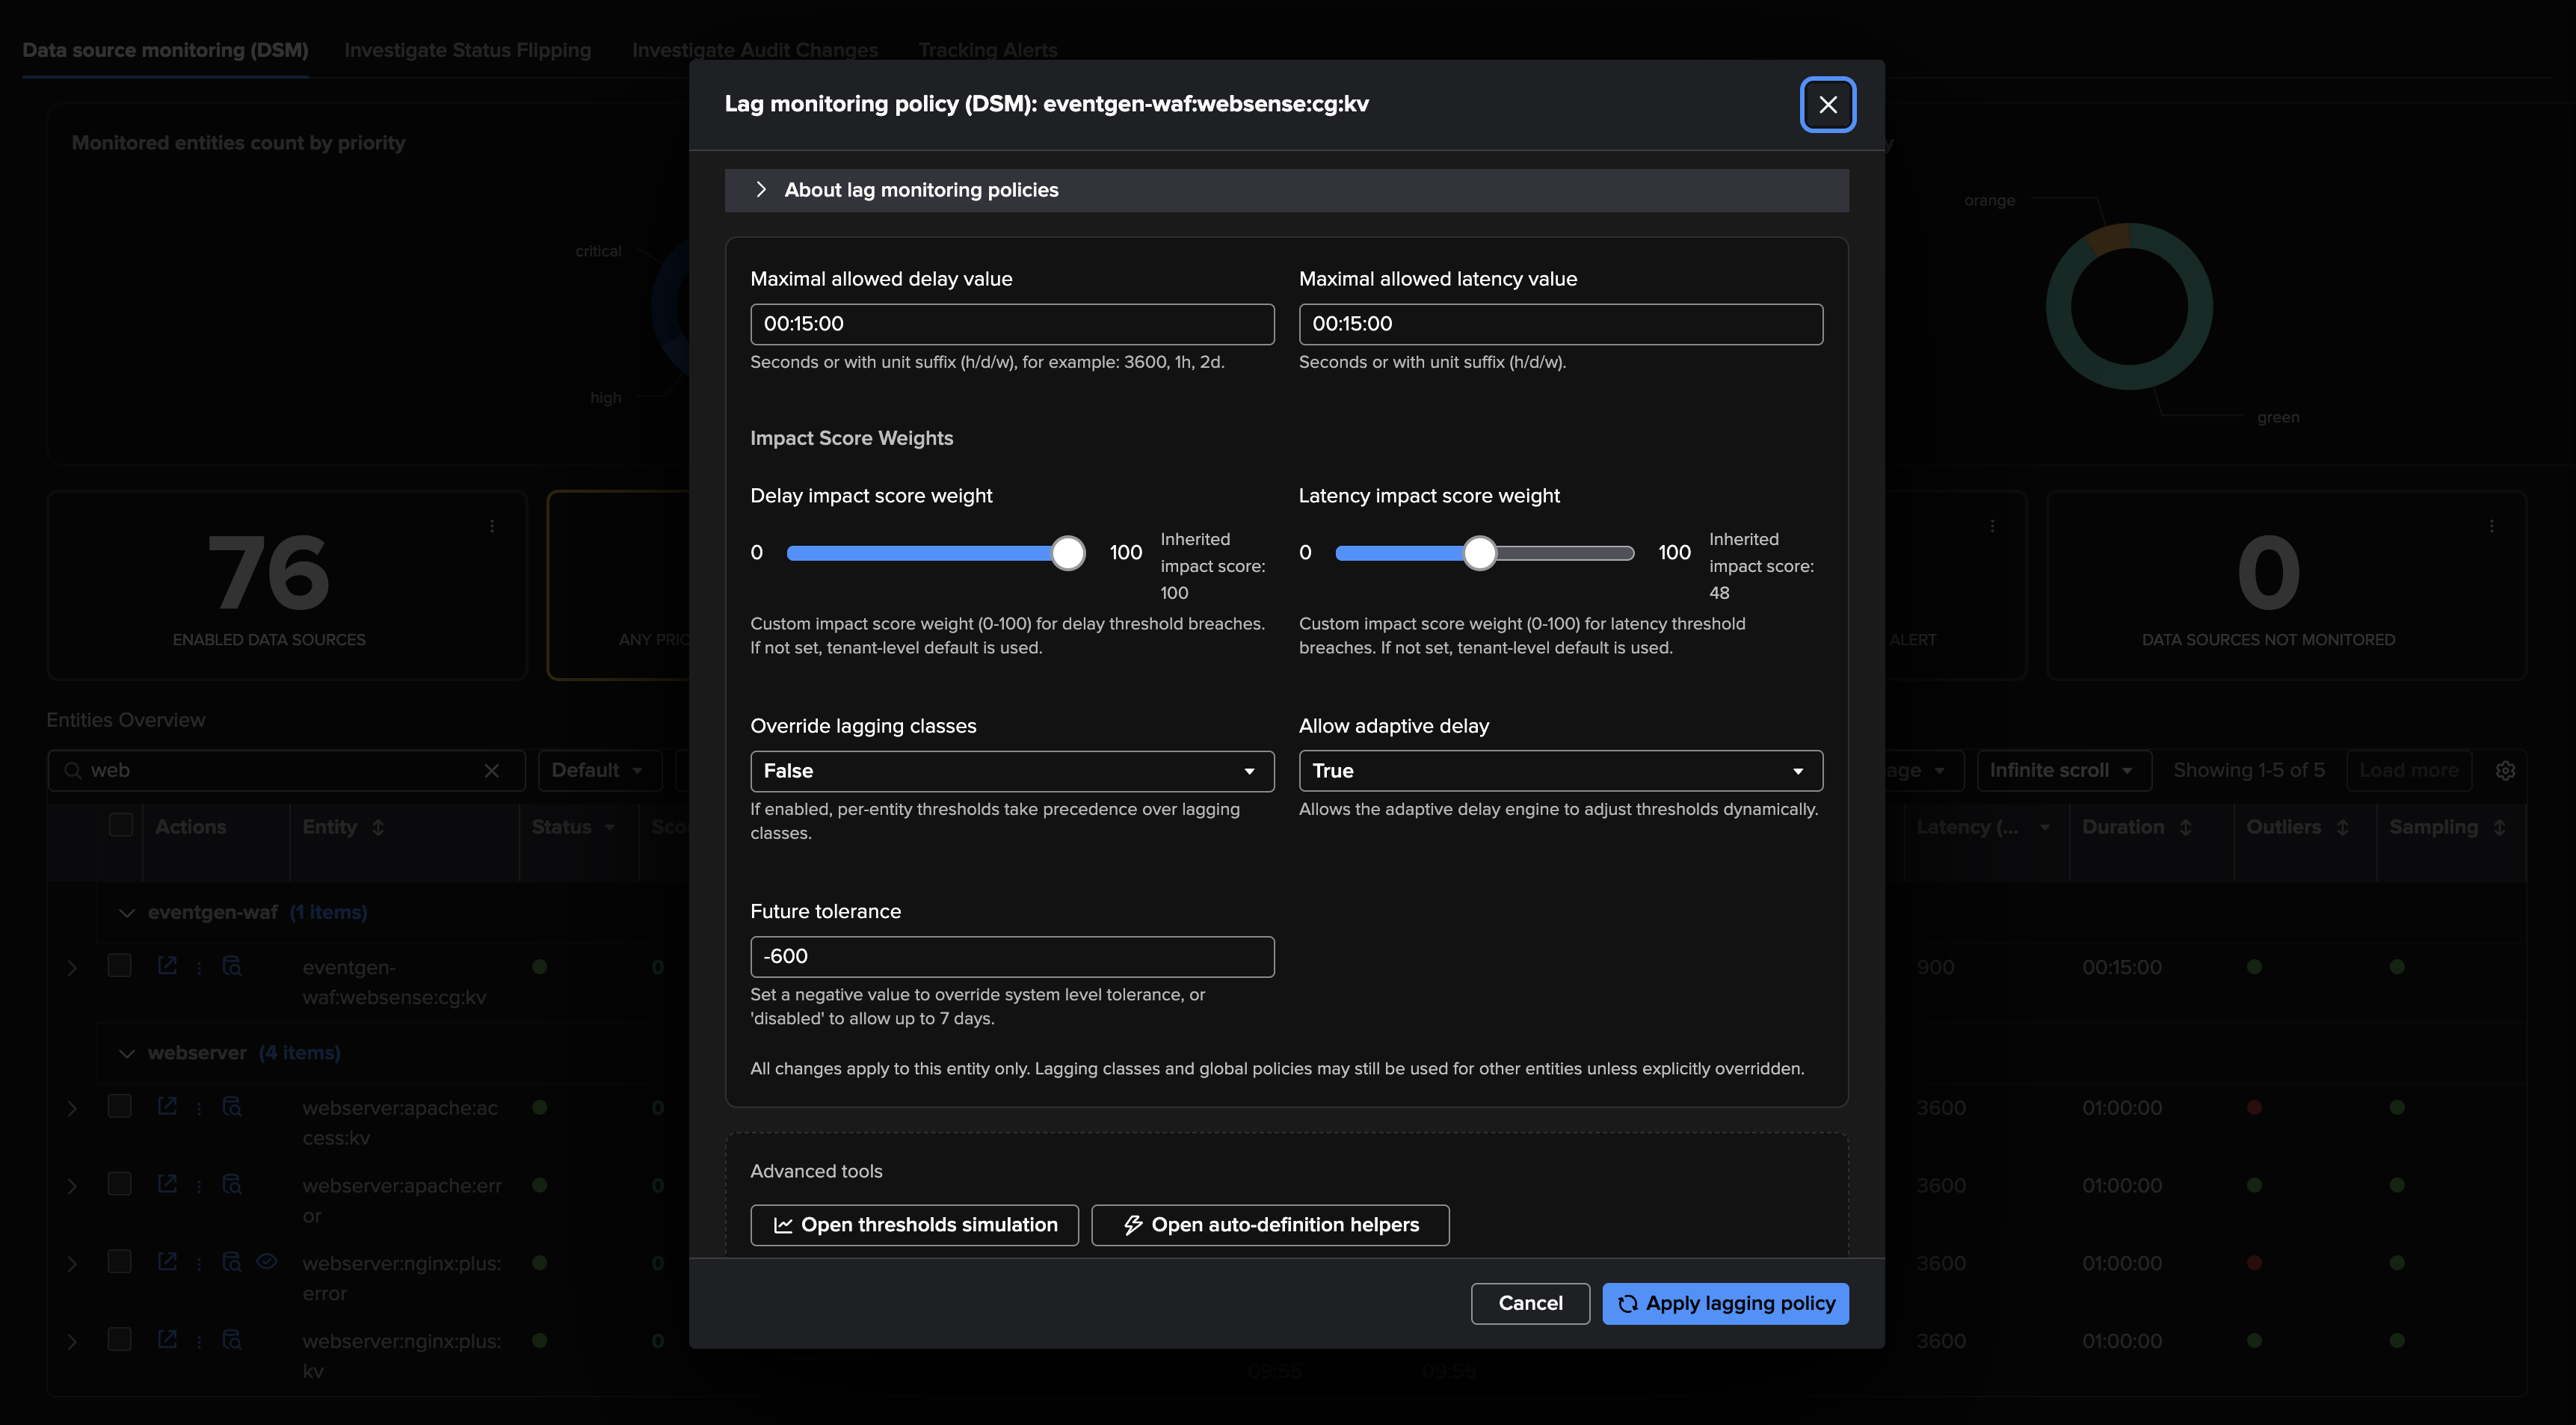
Use Case: Feed Interruption Detection
A first essential use case you want to cover when it comes to feeds availability monitoring is the detection of feed interruptions. In many use cases, you might expect the data to be flowing into Splunk in real-time or semi-real-time, though this isn’t necessarily the case, and you need to have the capabilities to handle this on a case-by-case basis.
To cover this use case, TrackMe tracks the very latest event available on a per-entity basis, that is the event from the timestamp point of view (field _time). We calculate the difference between now, when the tracker is executed, and the last event, which gives you an indicator in seconds.
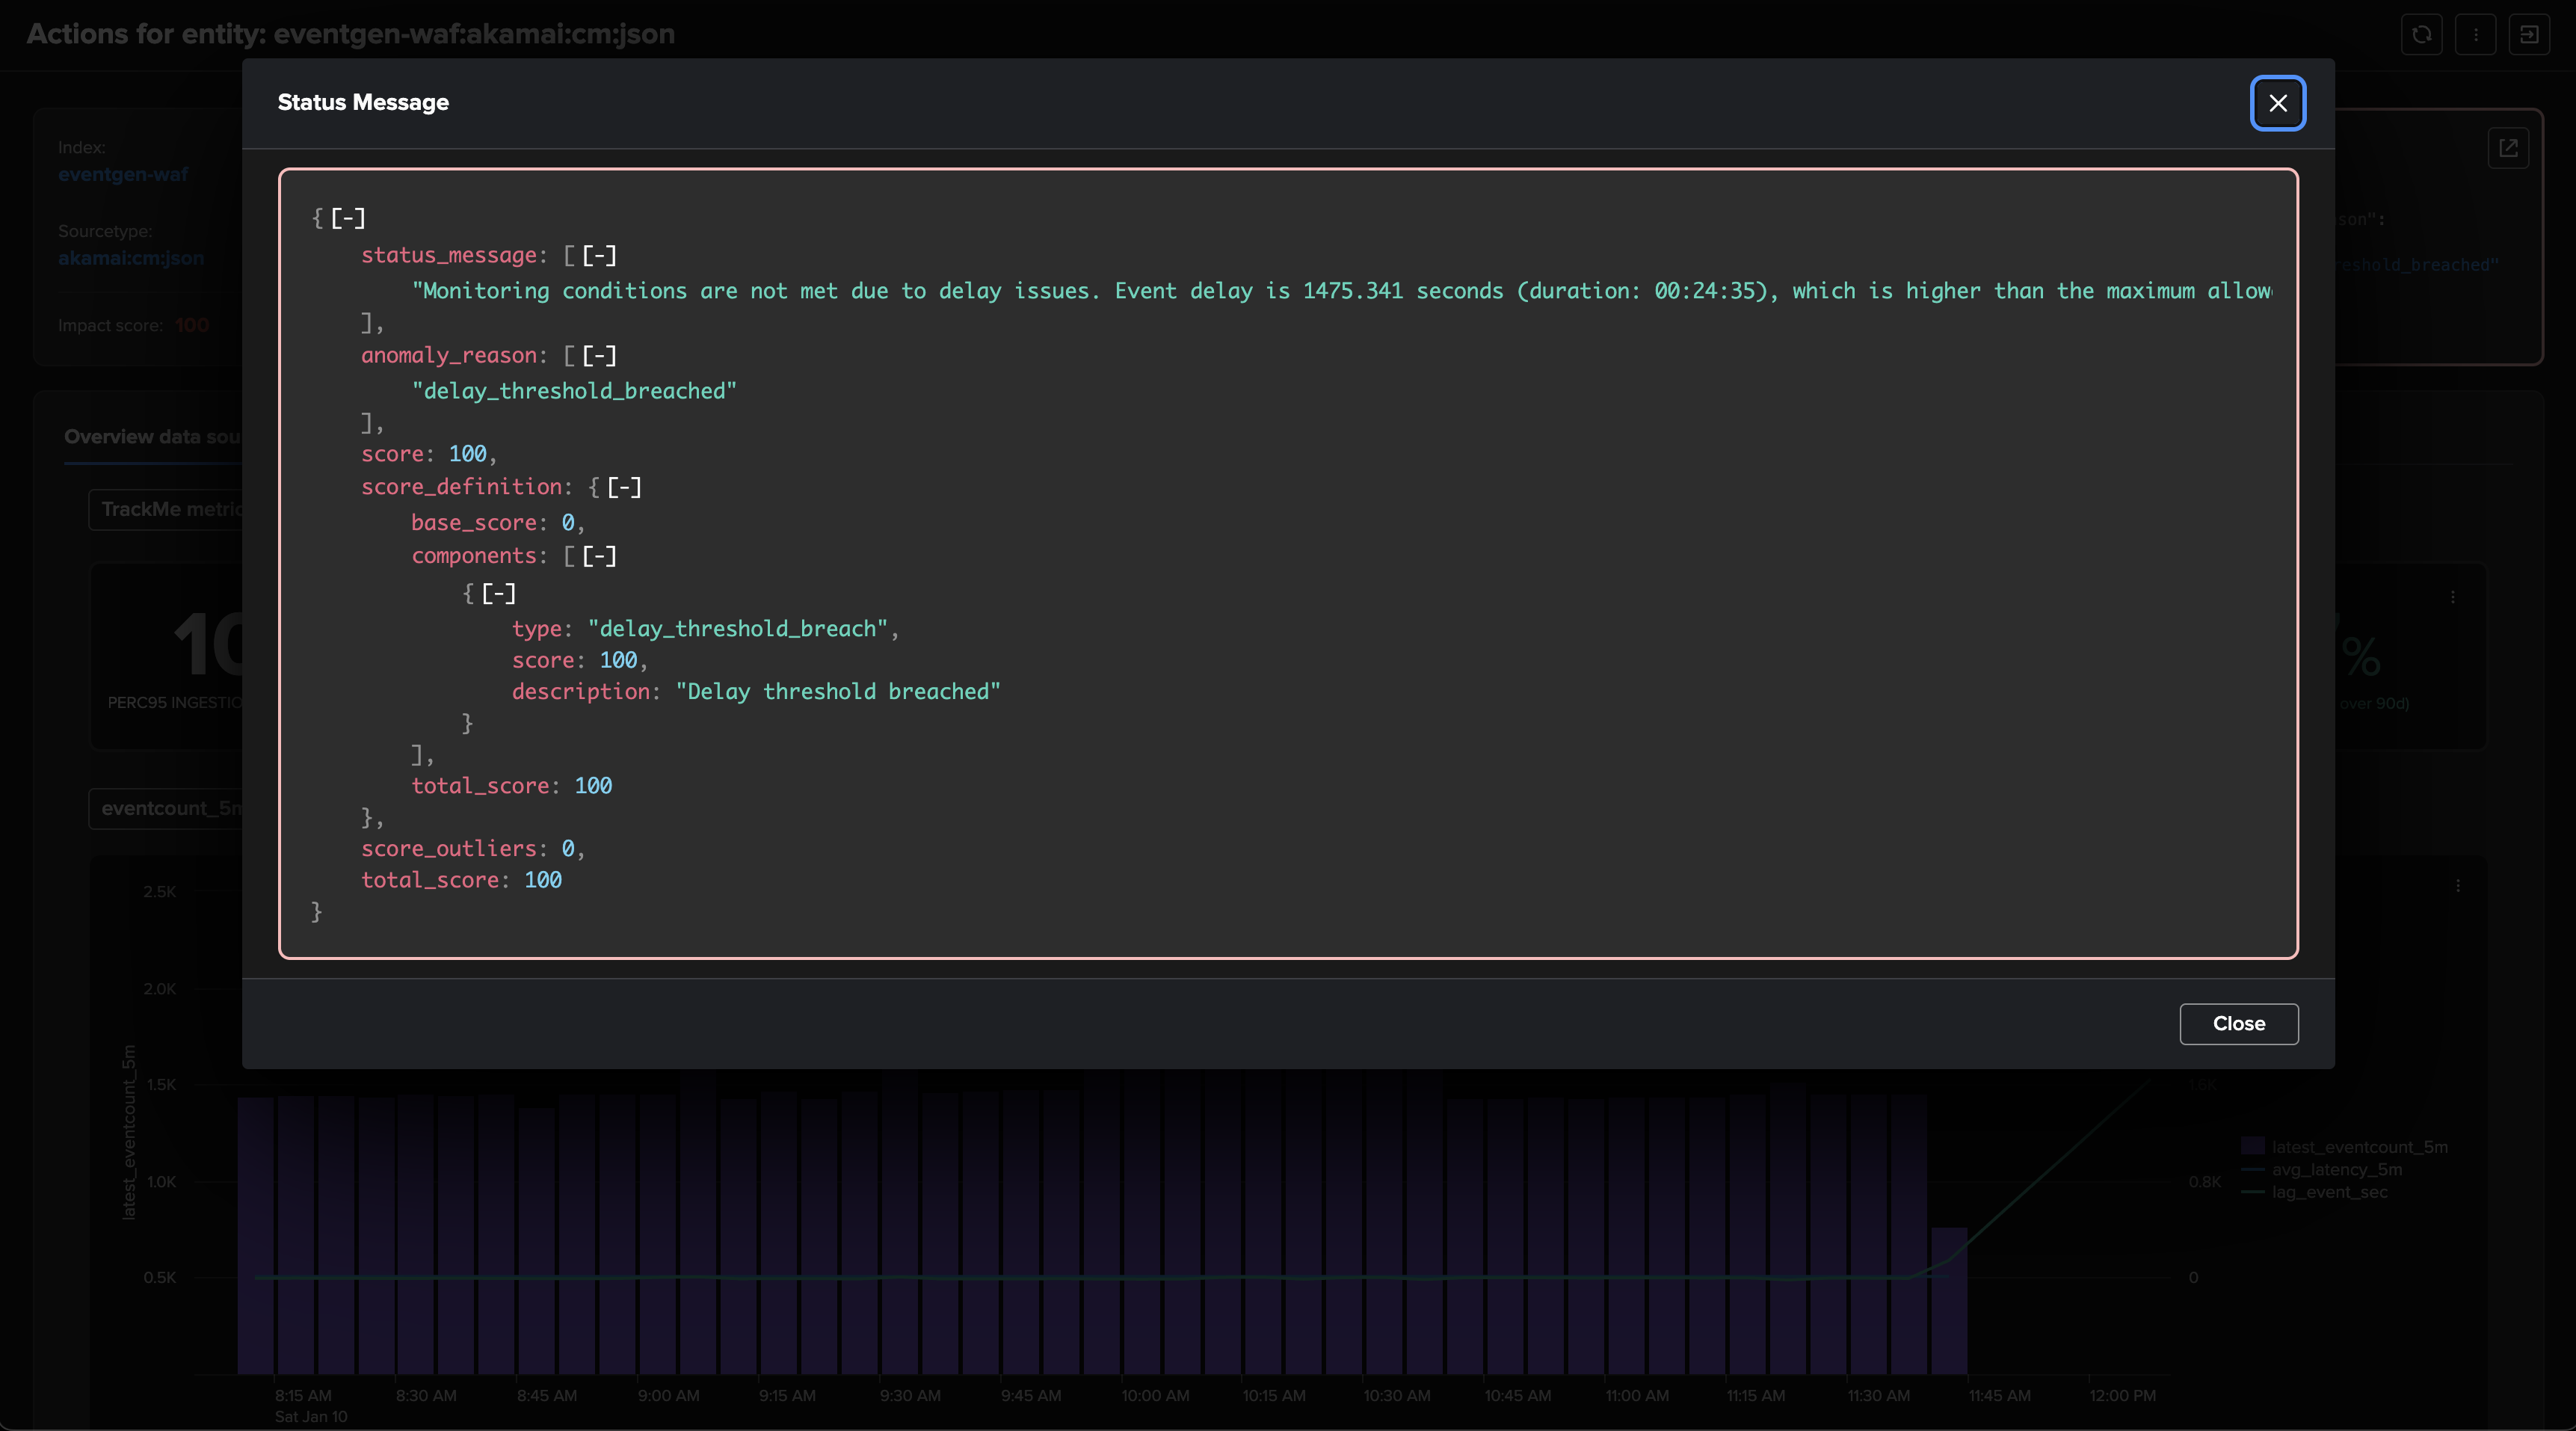
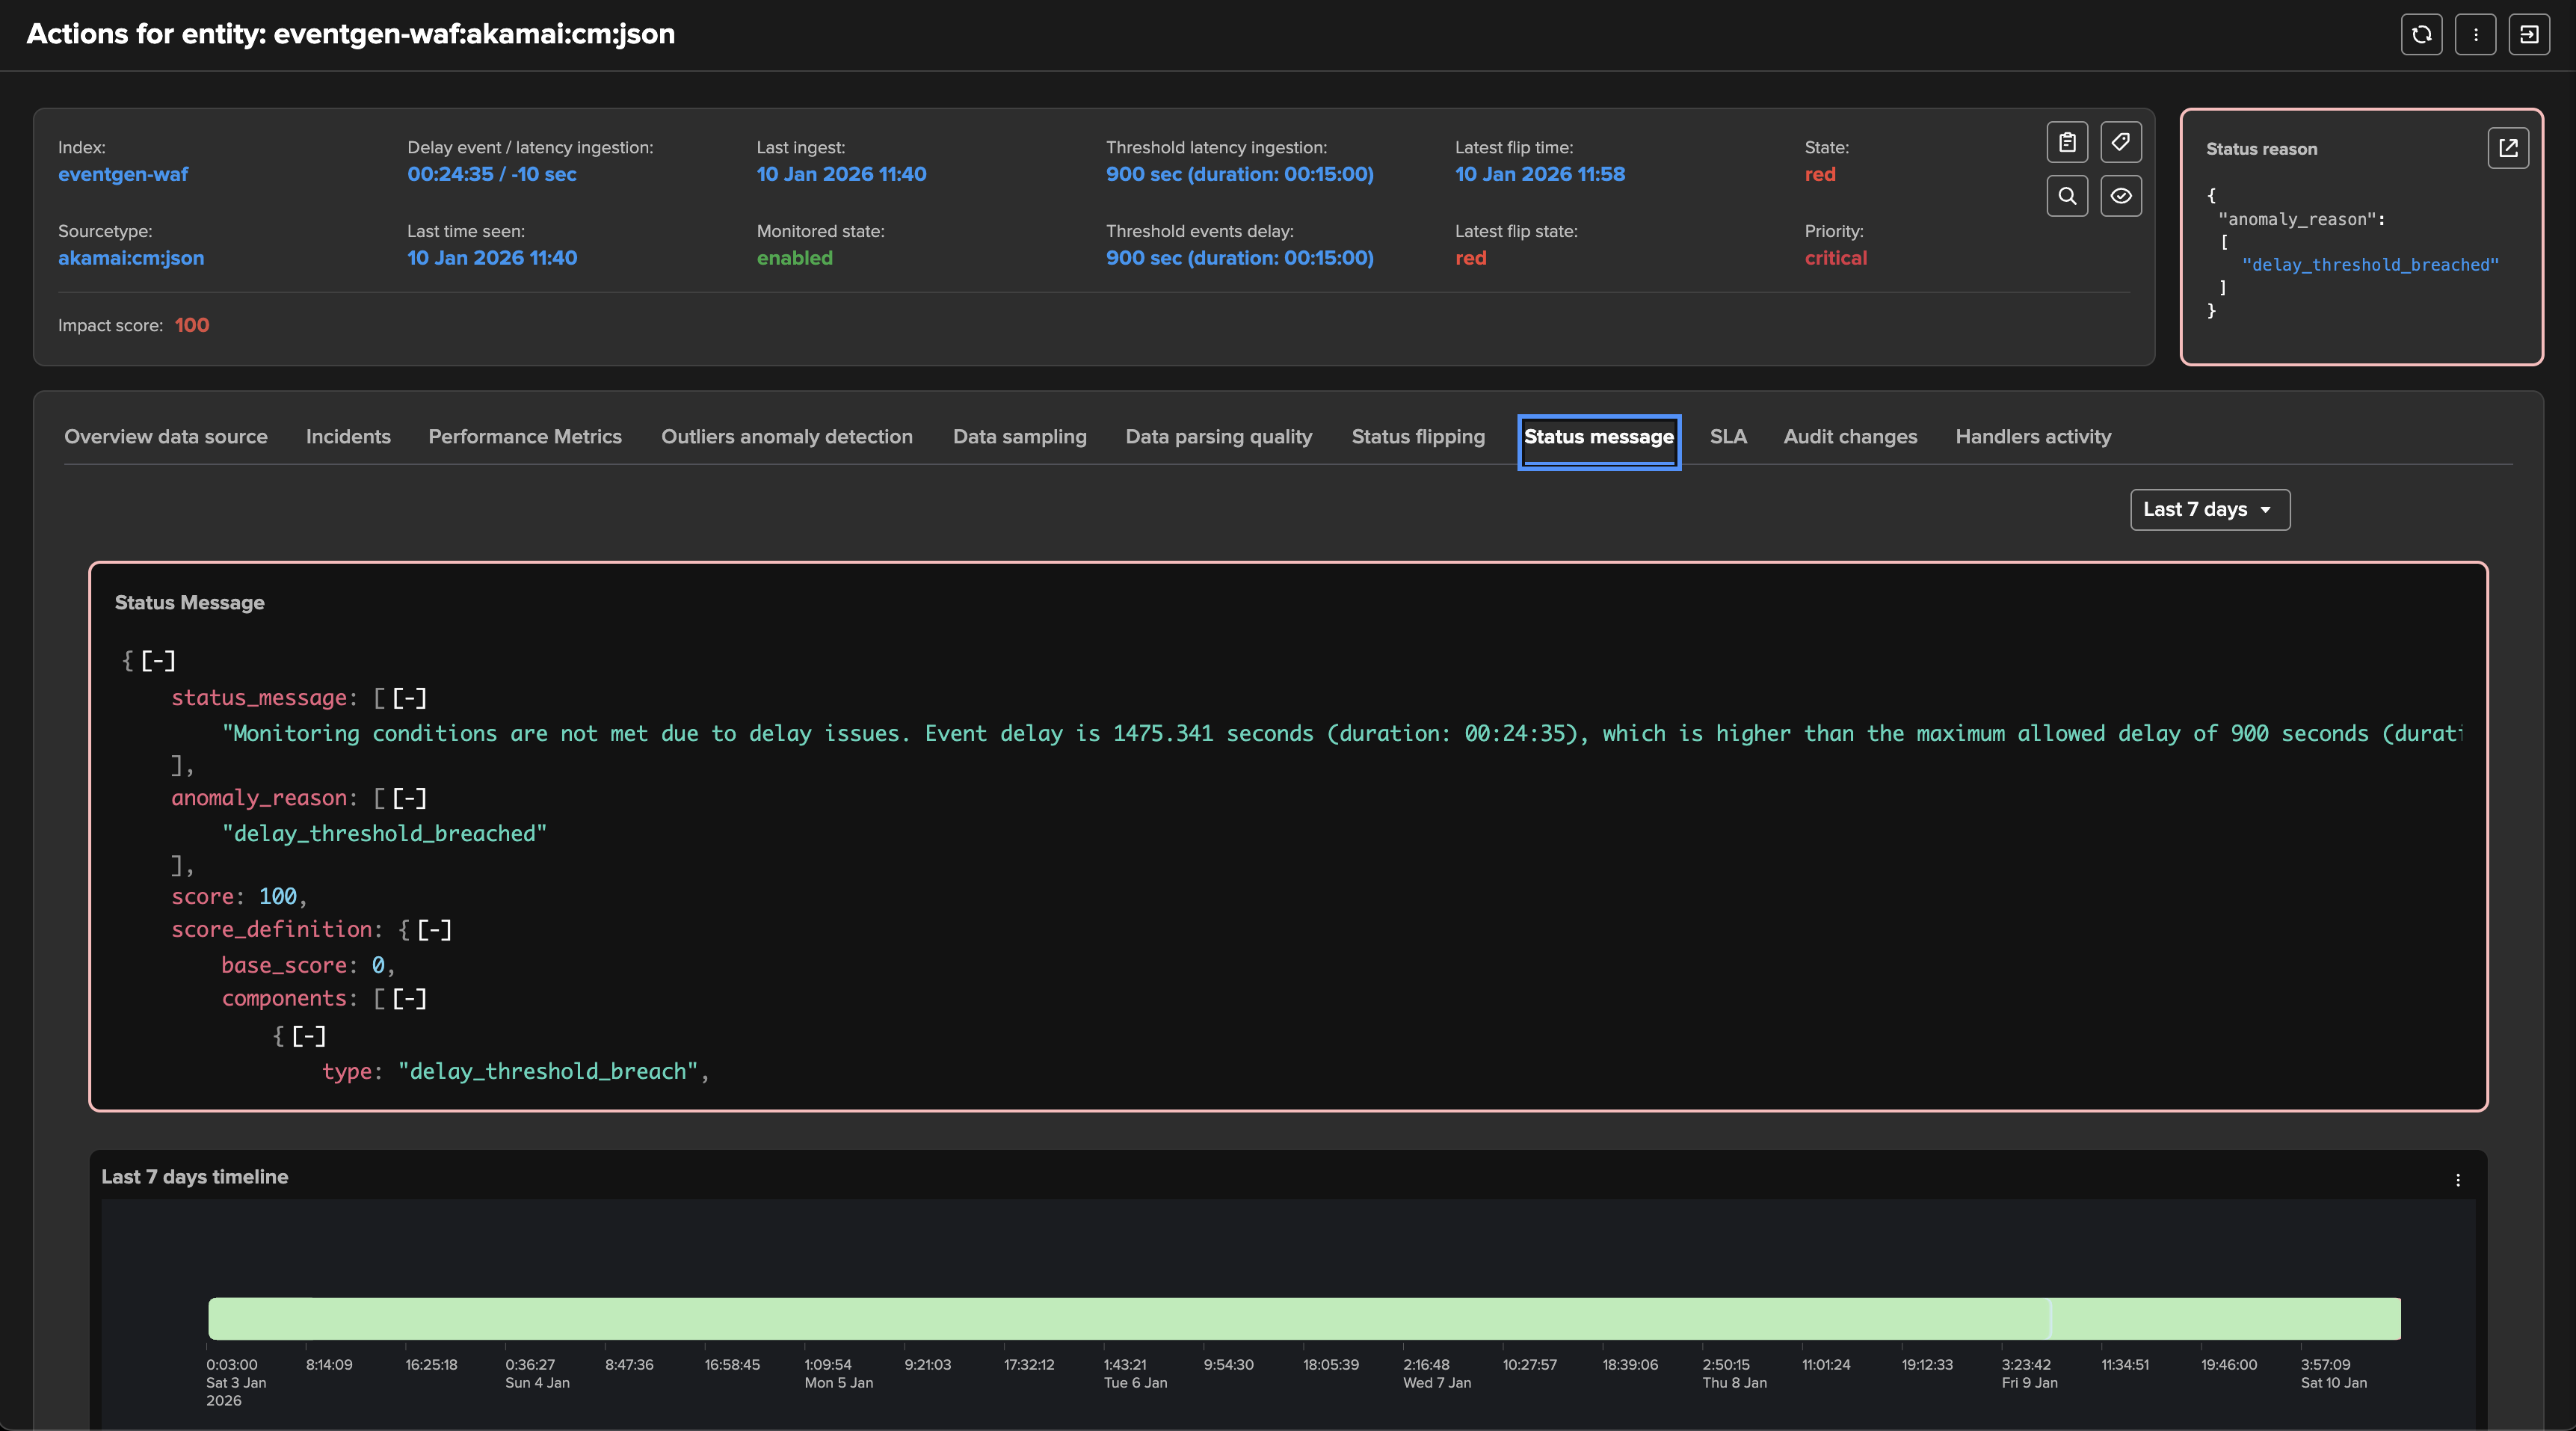
If this indicator breaches the threshold:
The impact score is increased by 100 points by default, which raises the entity status to alert.
The anomaly reason is set to “delay_threshold_breached”.
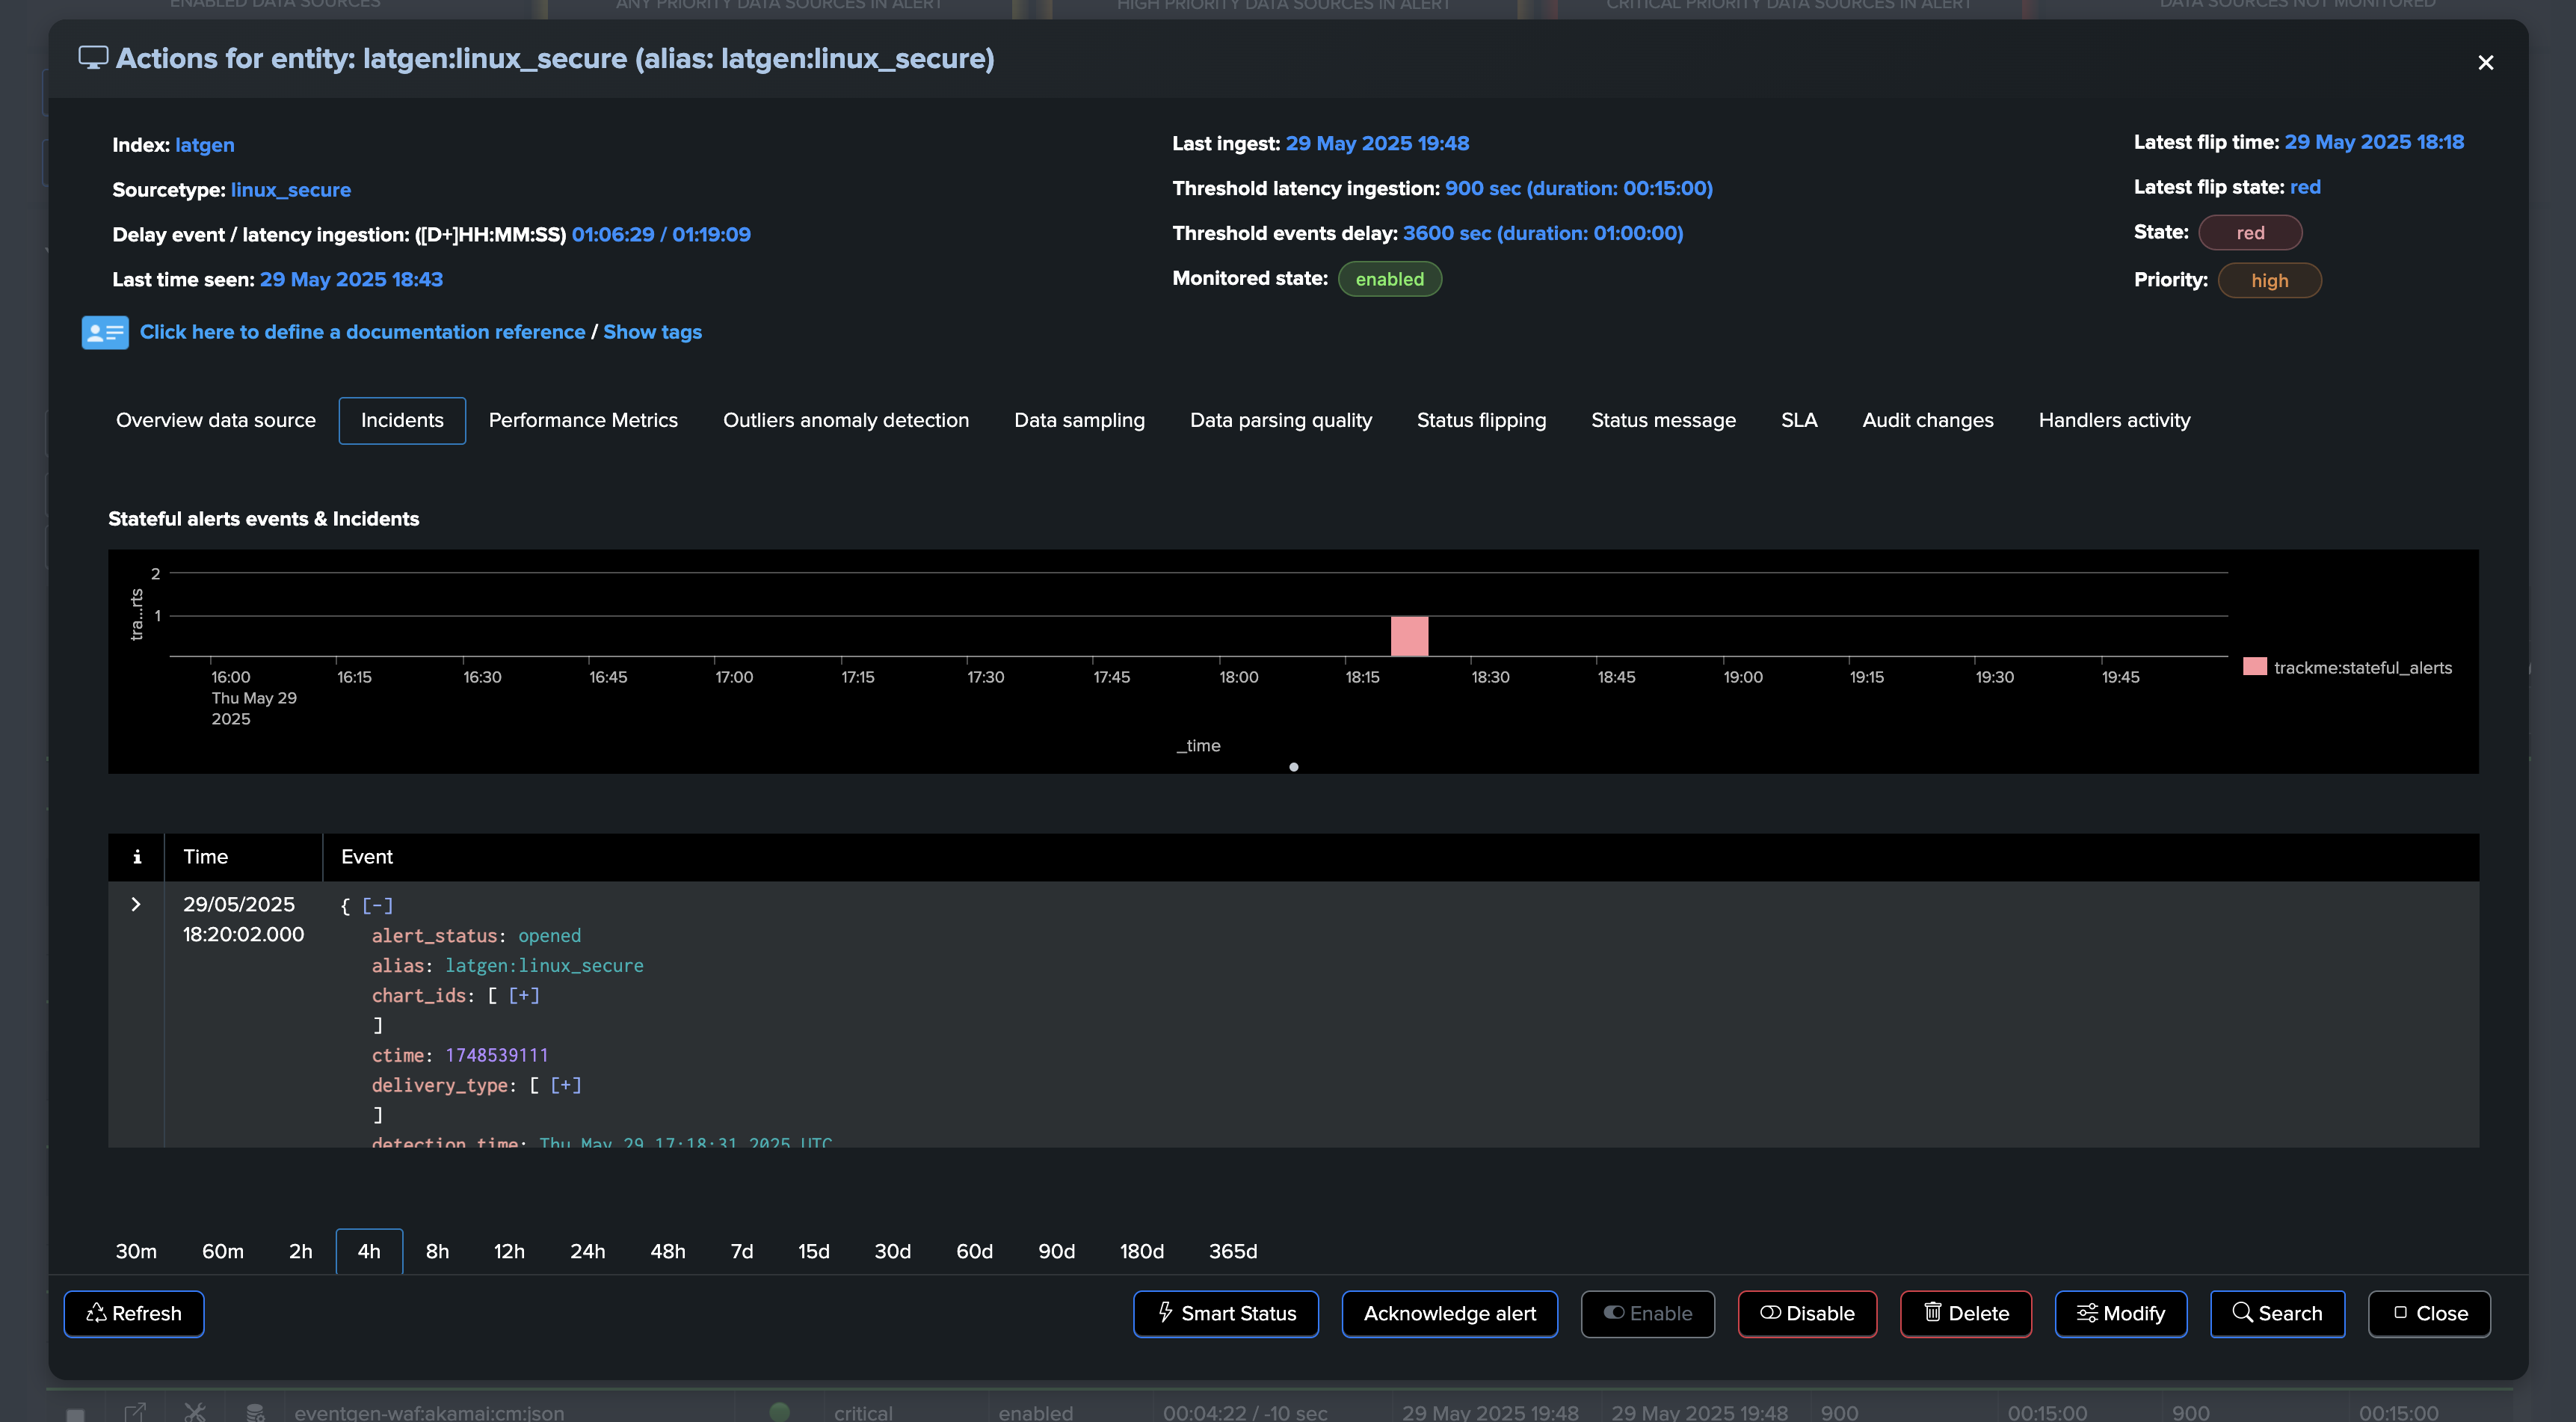
The workflow can be summarized as follows:
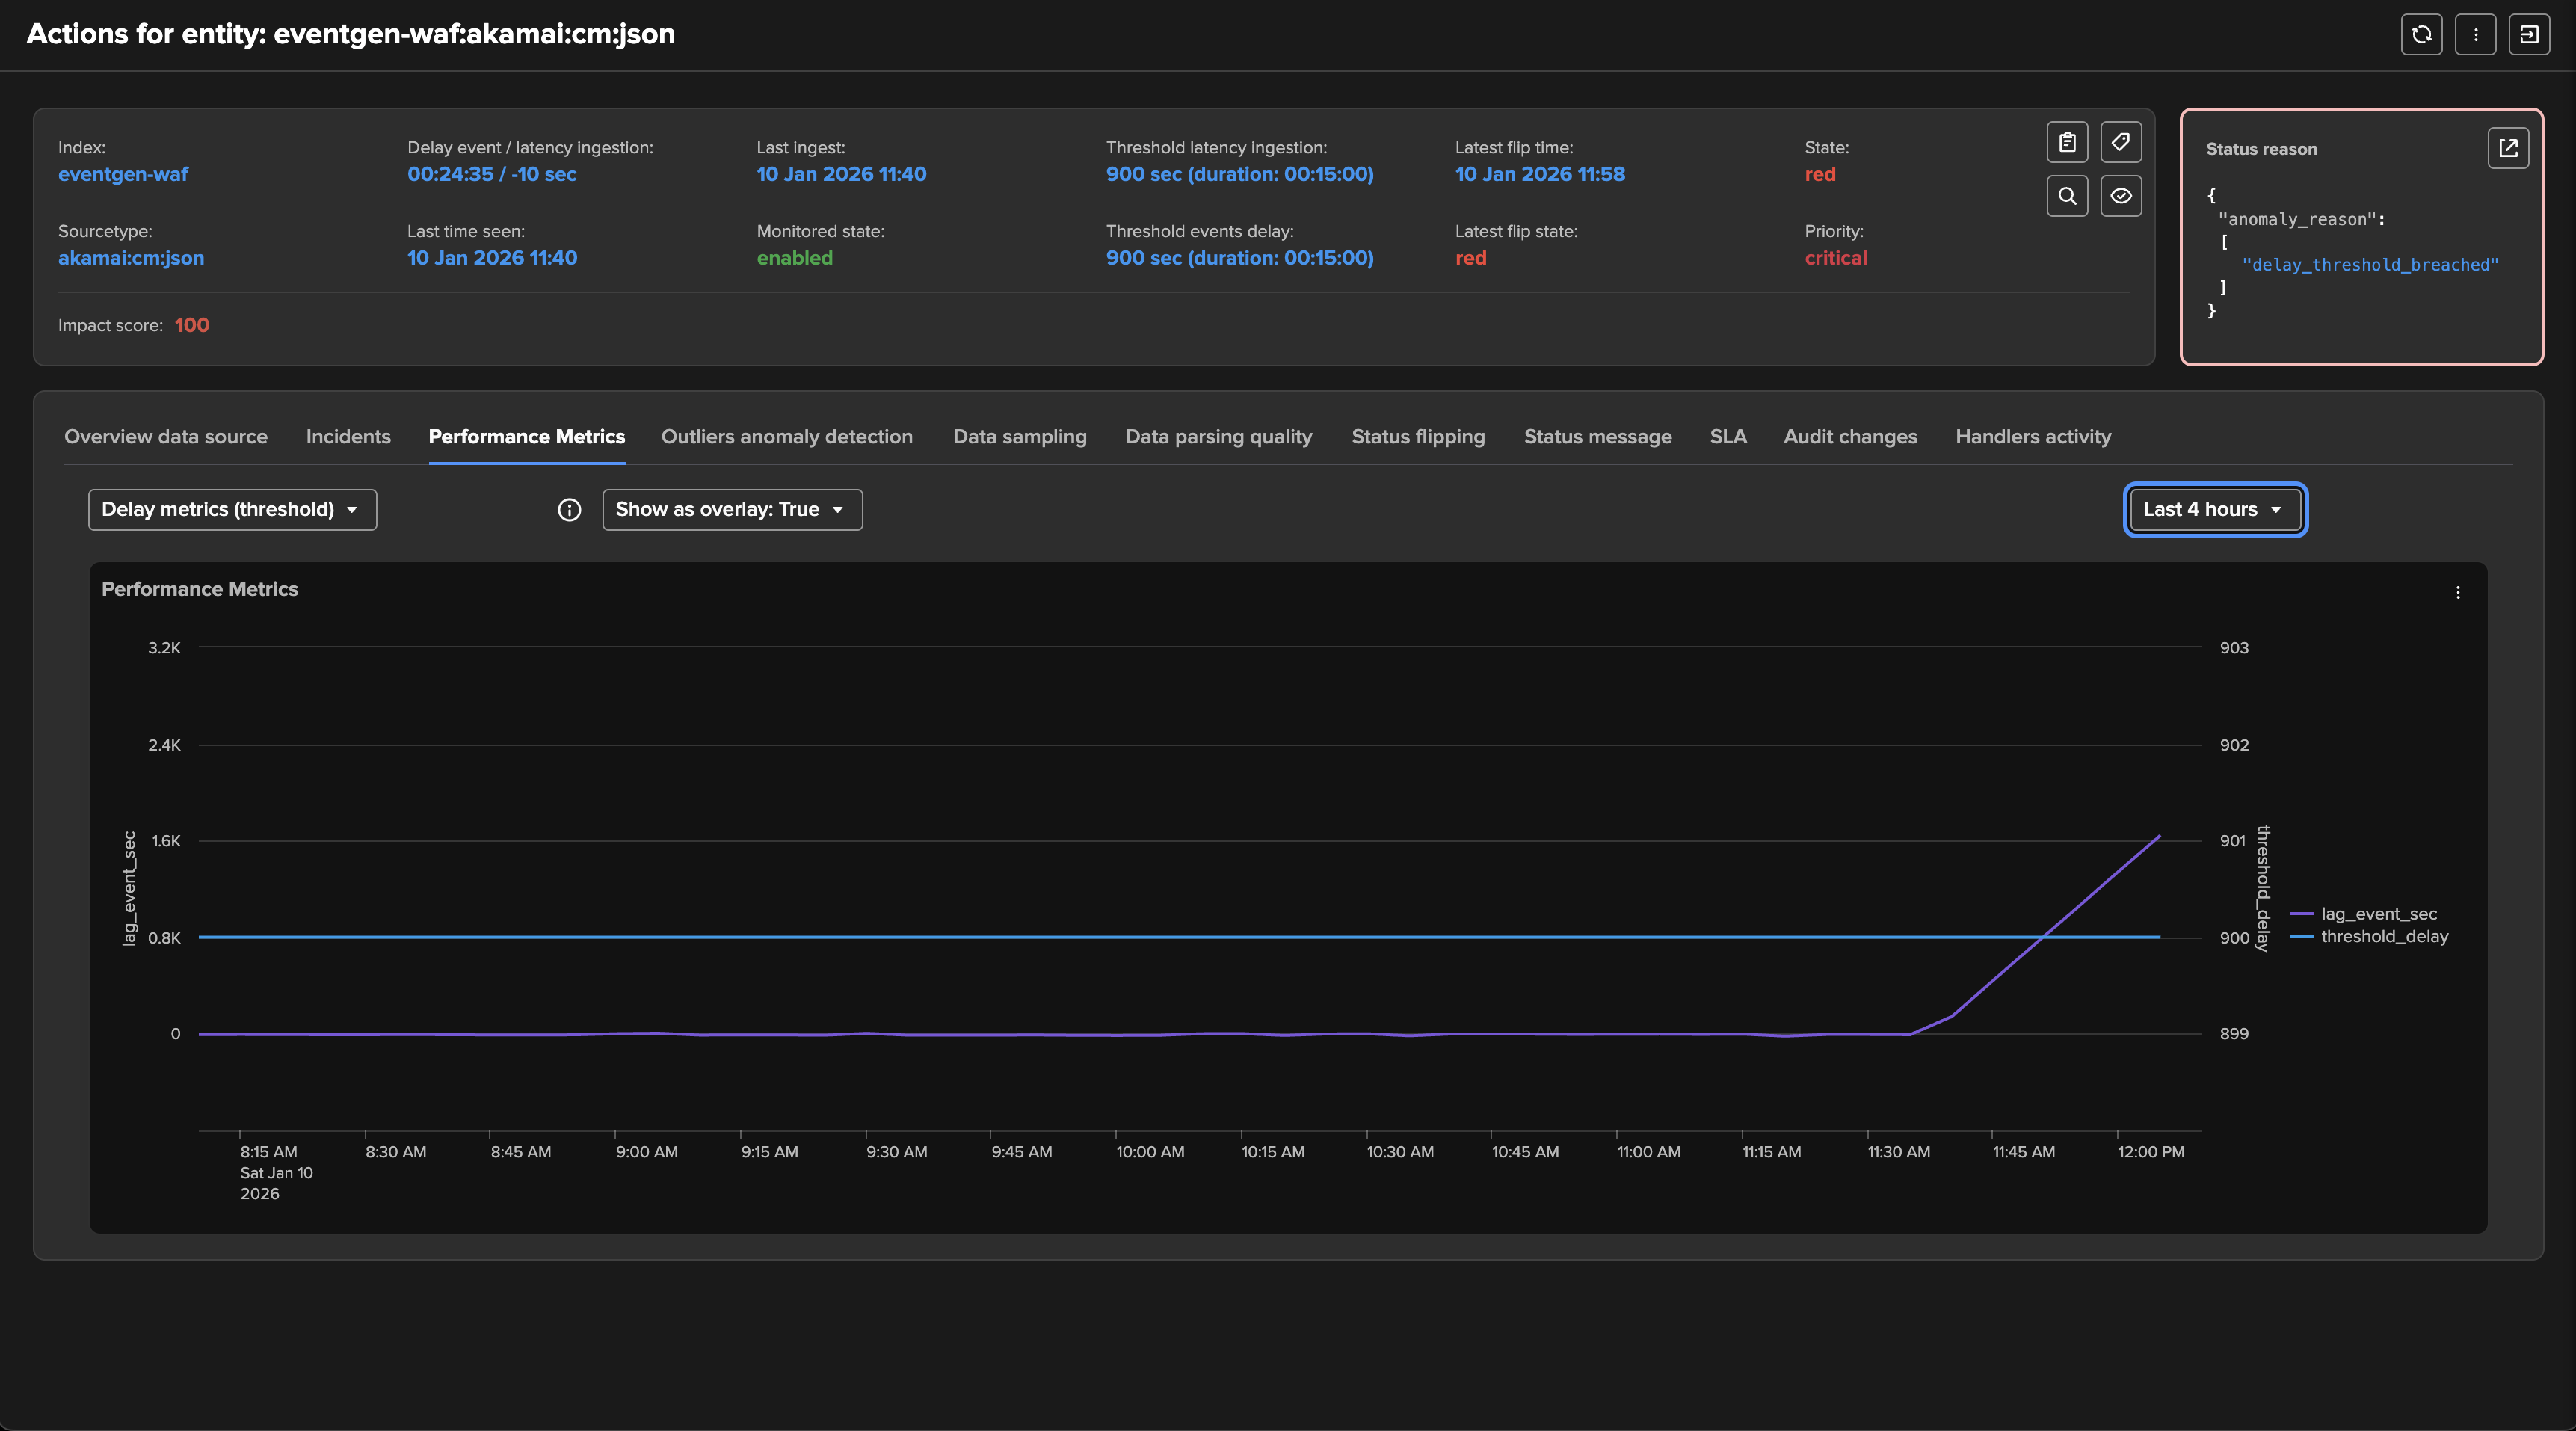
The delay key performance indicator breaches the configured threshold value for this entity.
TrackMe identifies the issue and raises the impact score by the associated weight, 100 by default. (anomalies score weight can be configured at the level of the tenant and overriden per entity)
If the impact score is greater or equal to 100, the entity status is set red. (alerting state)
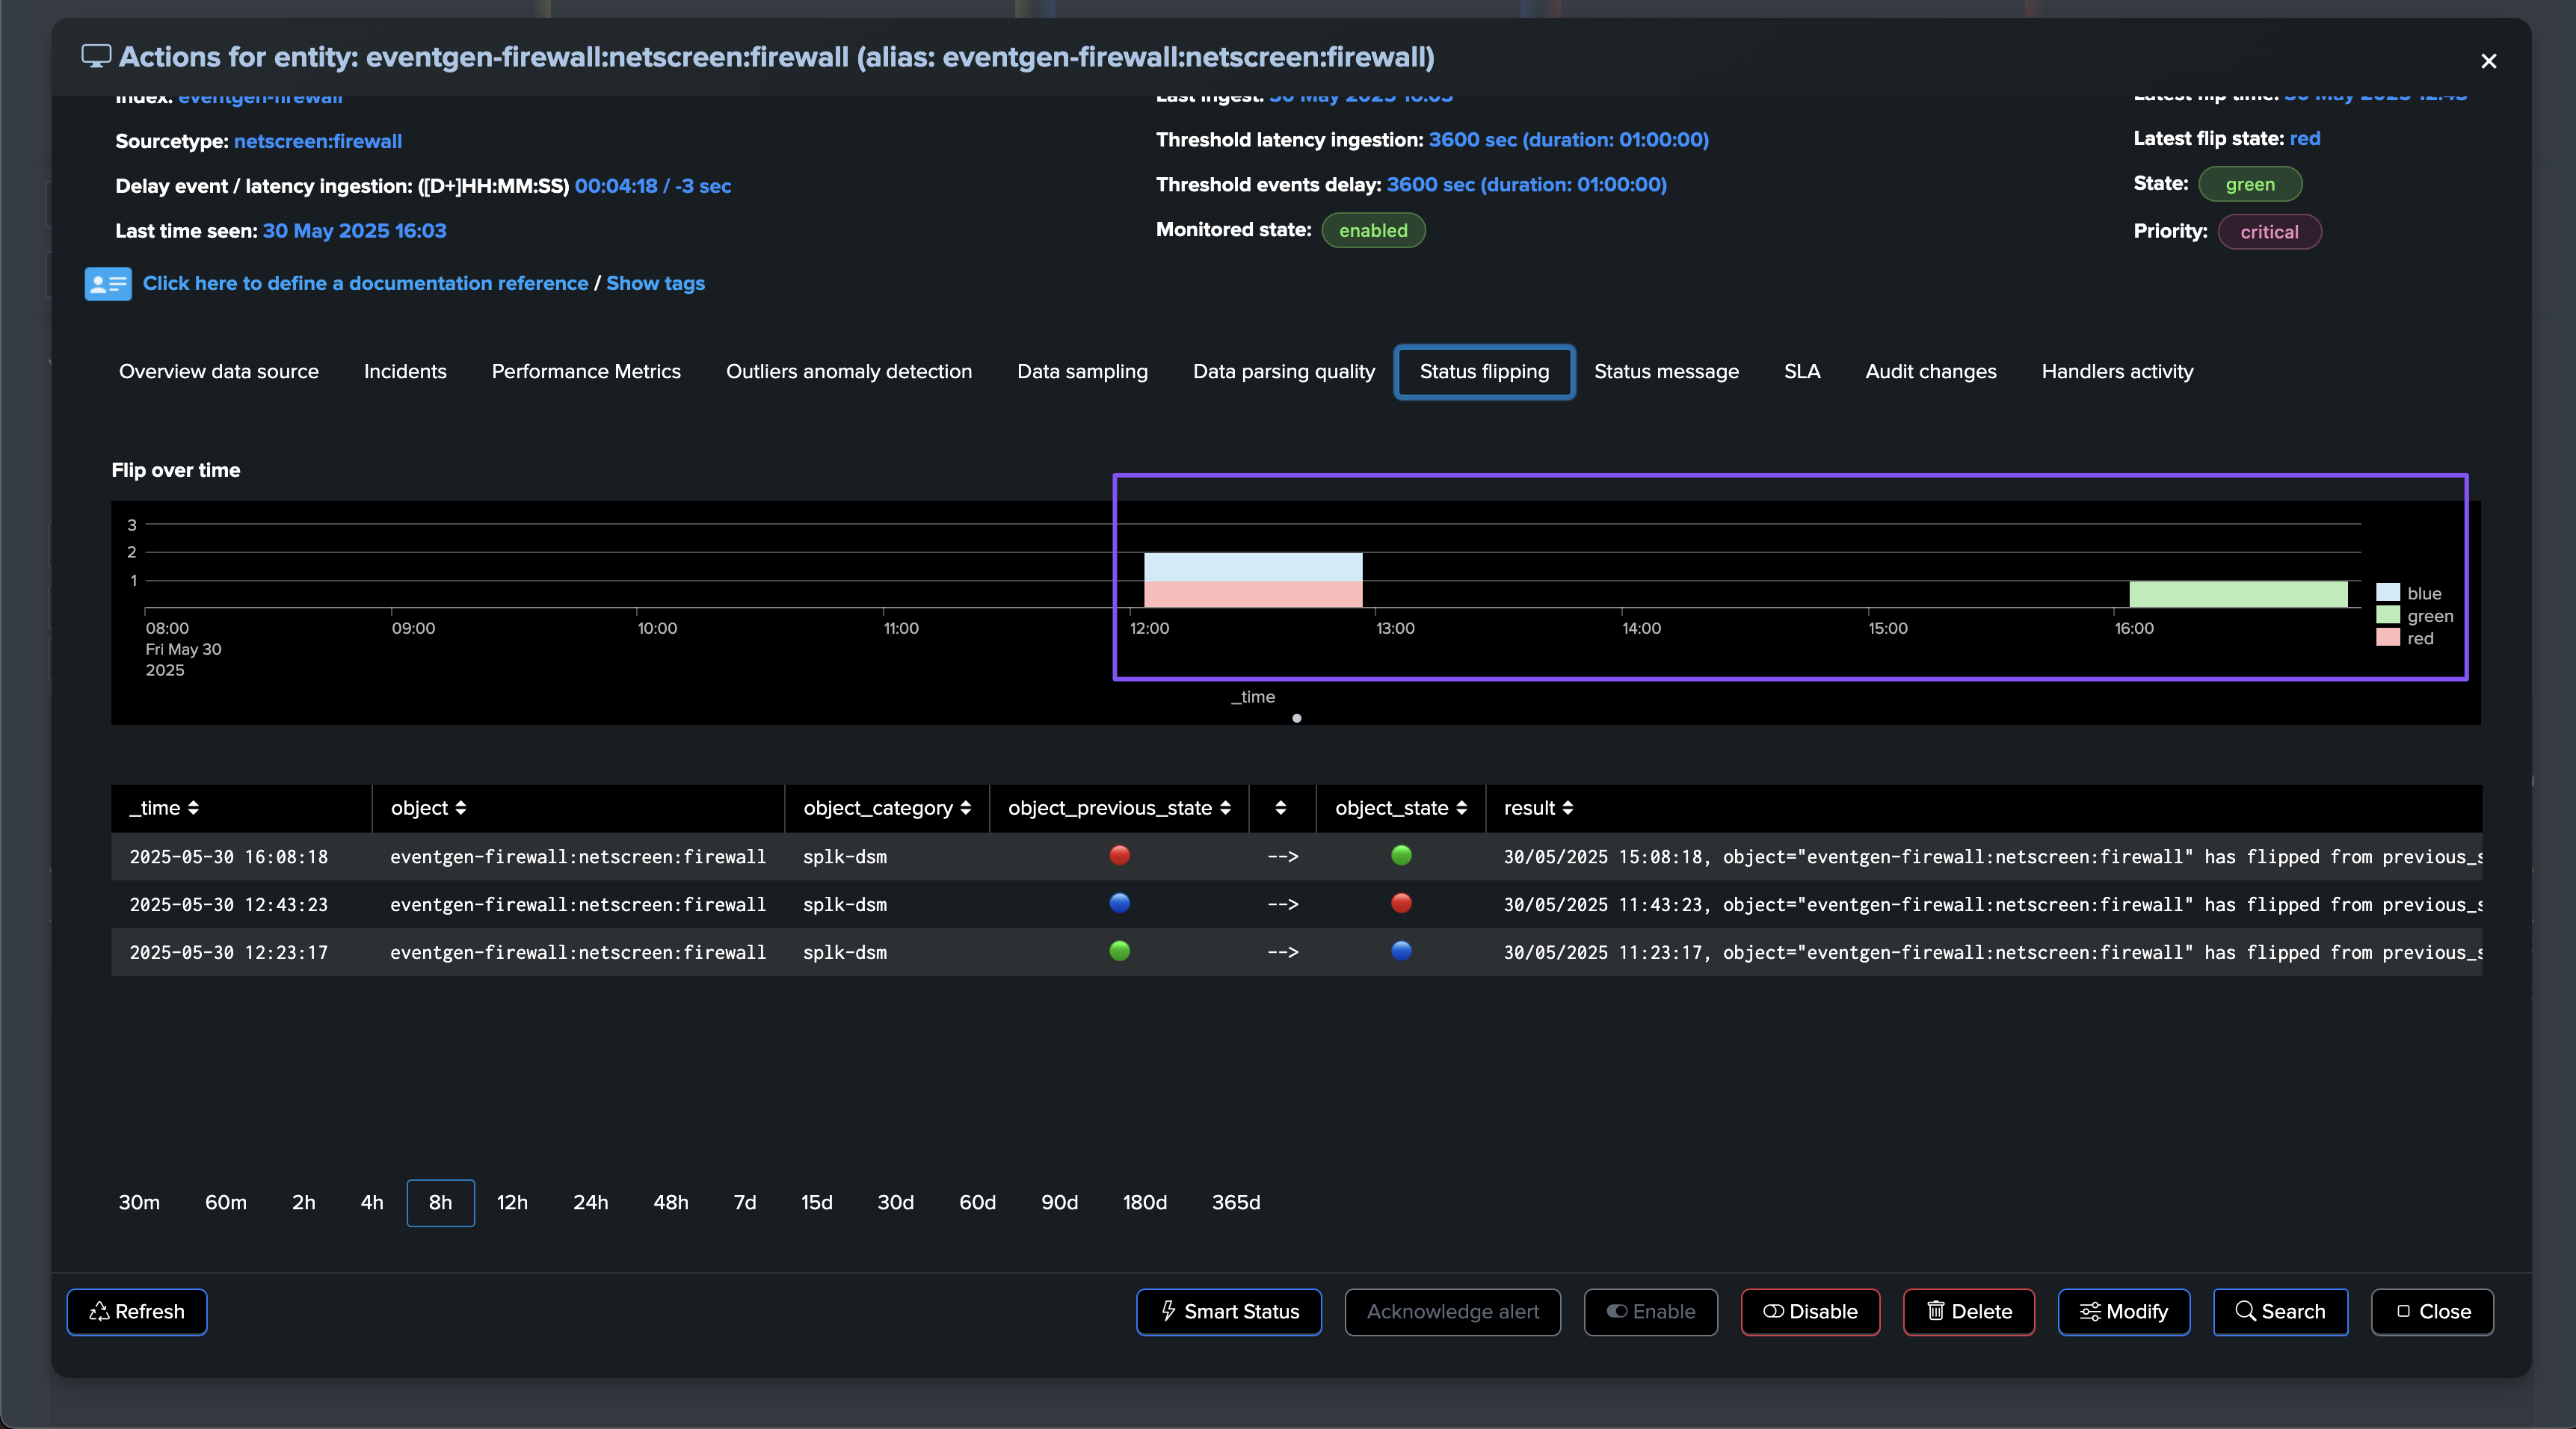
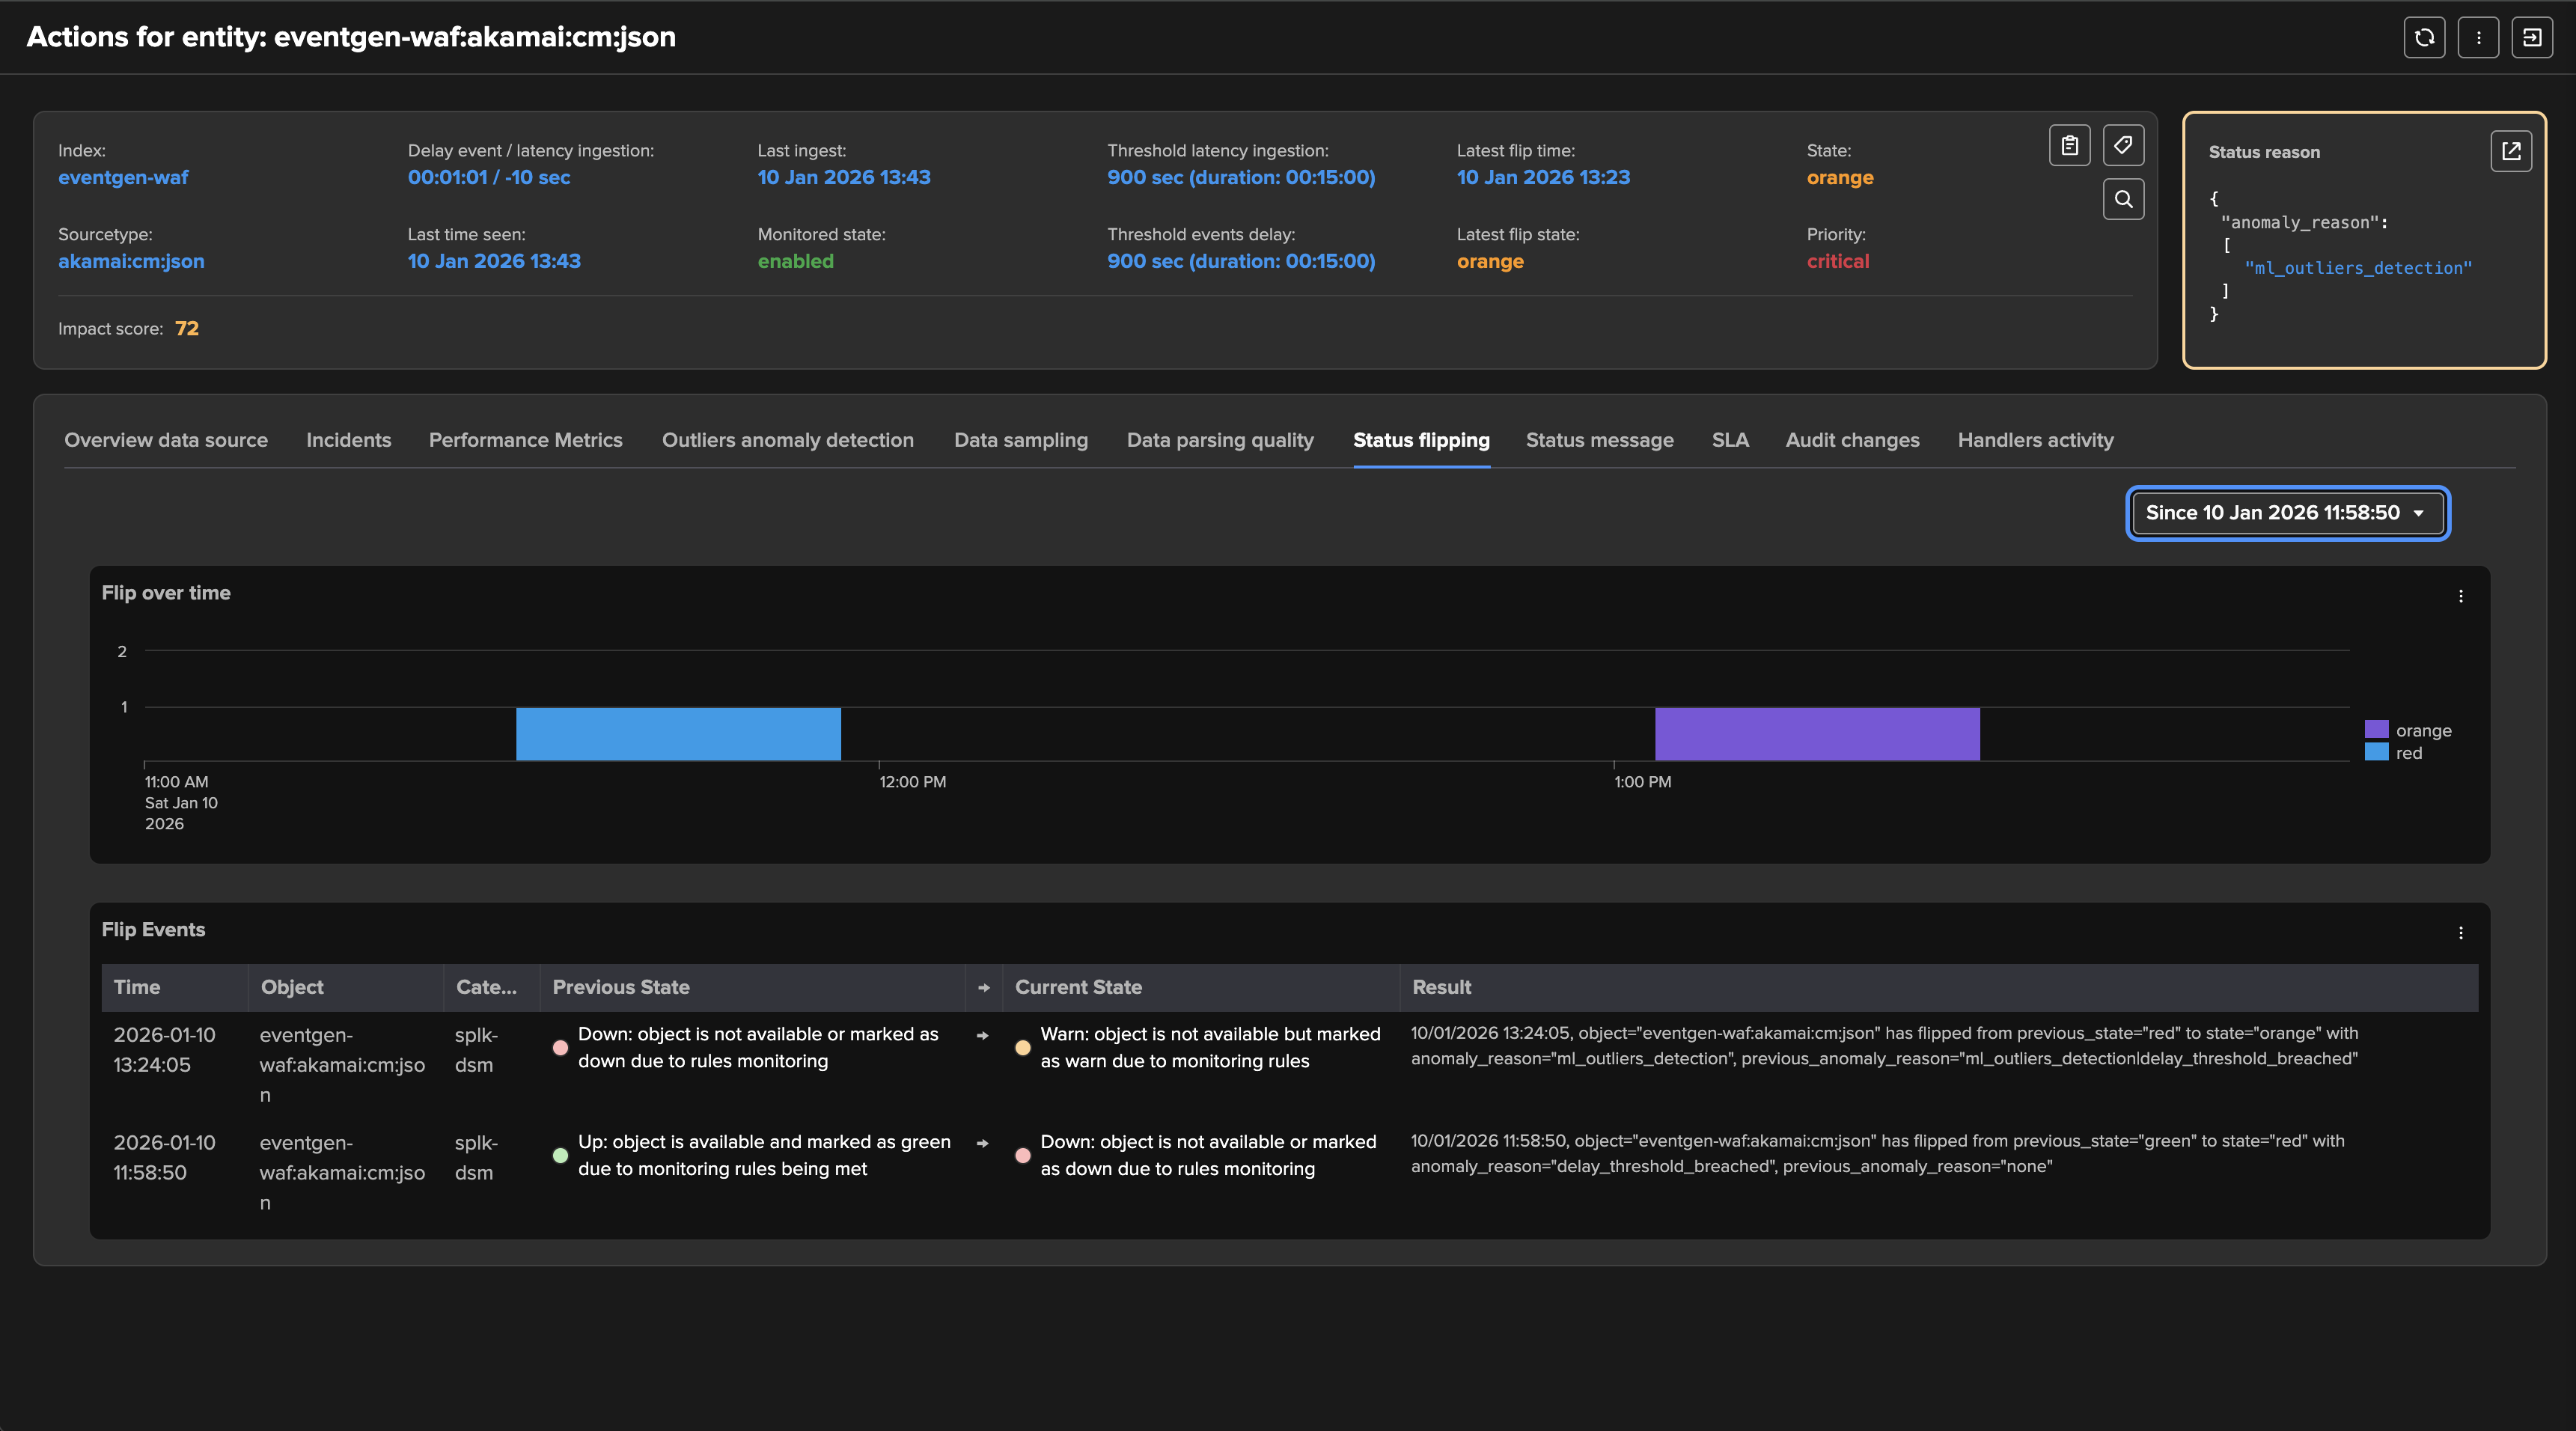
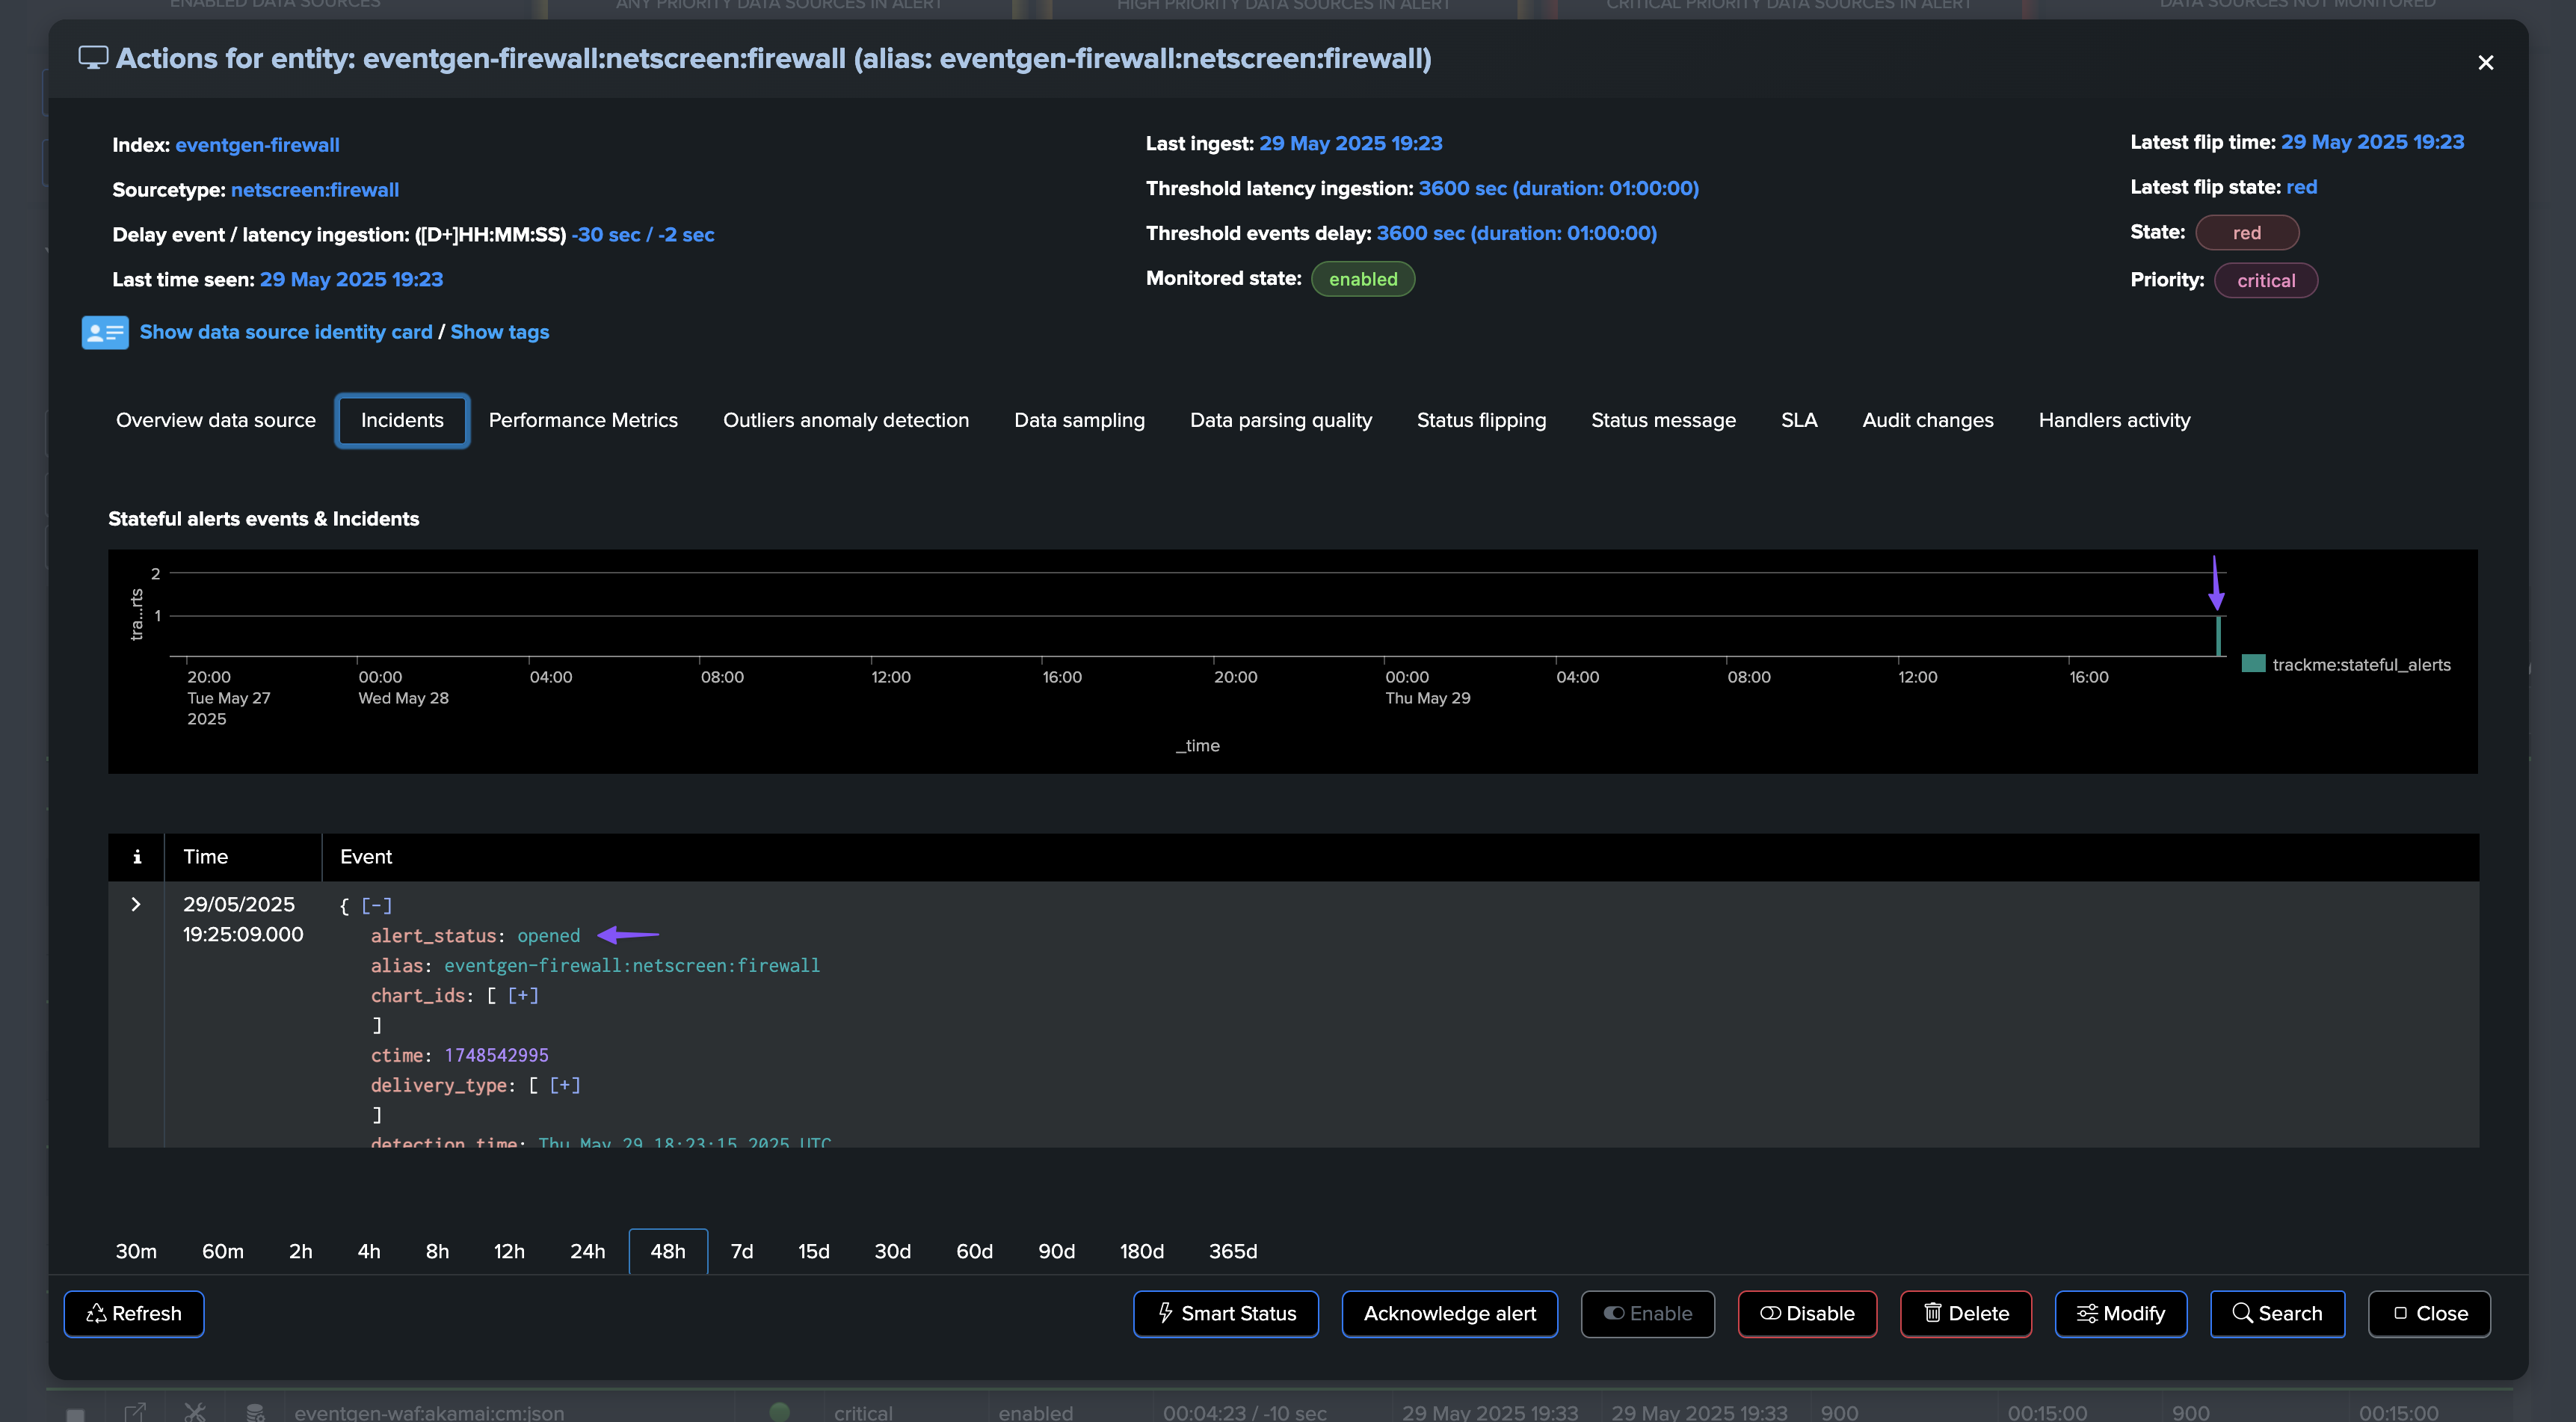
TrackMe generates a flipping event which marks the entity state transition.
If a TrackMe alert is configured, the alert fires and TrackMe runs associated actions. (email notification, incident creation, automated acknowledgement, etc.)


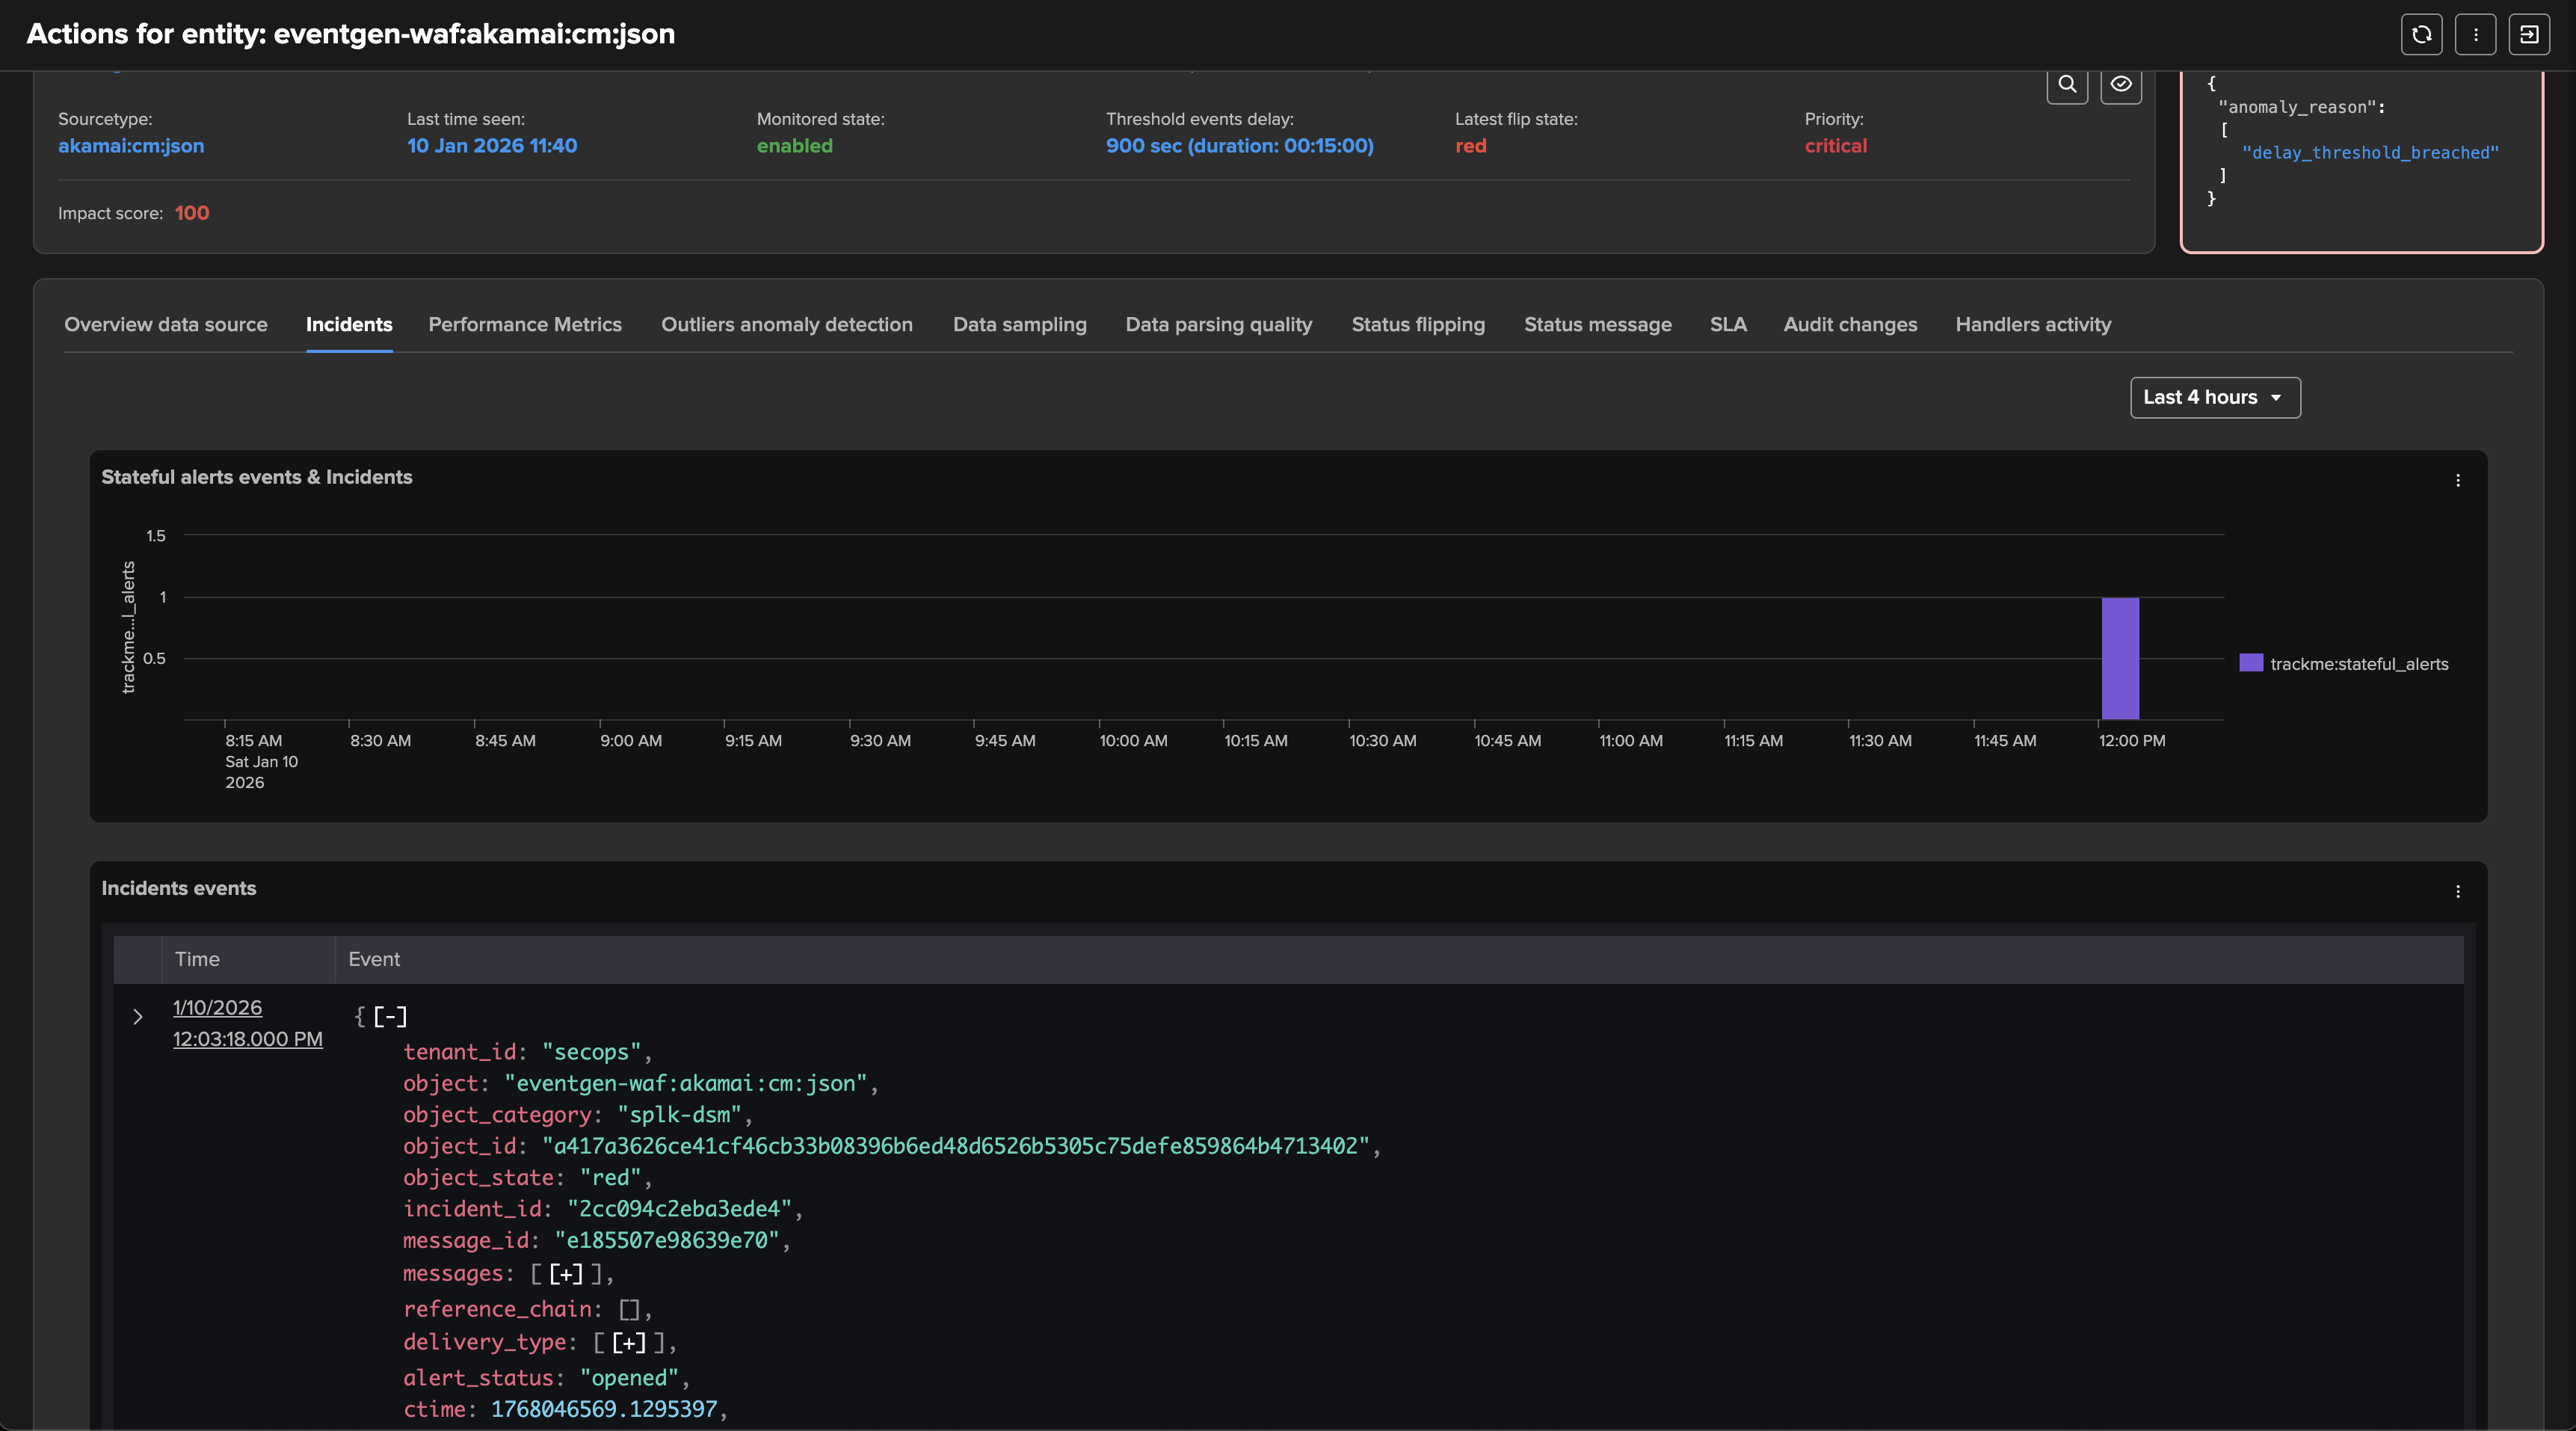

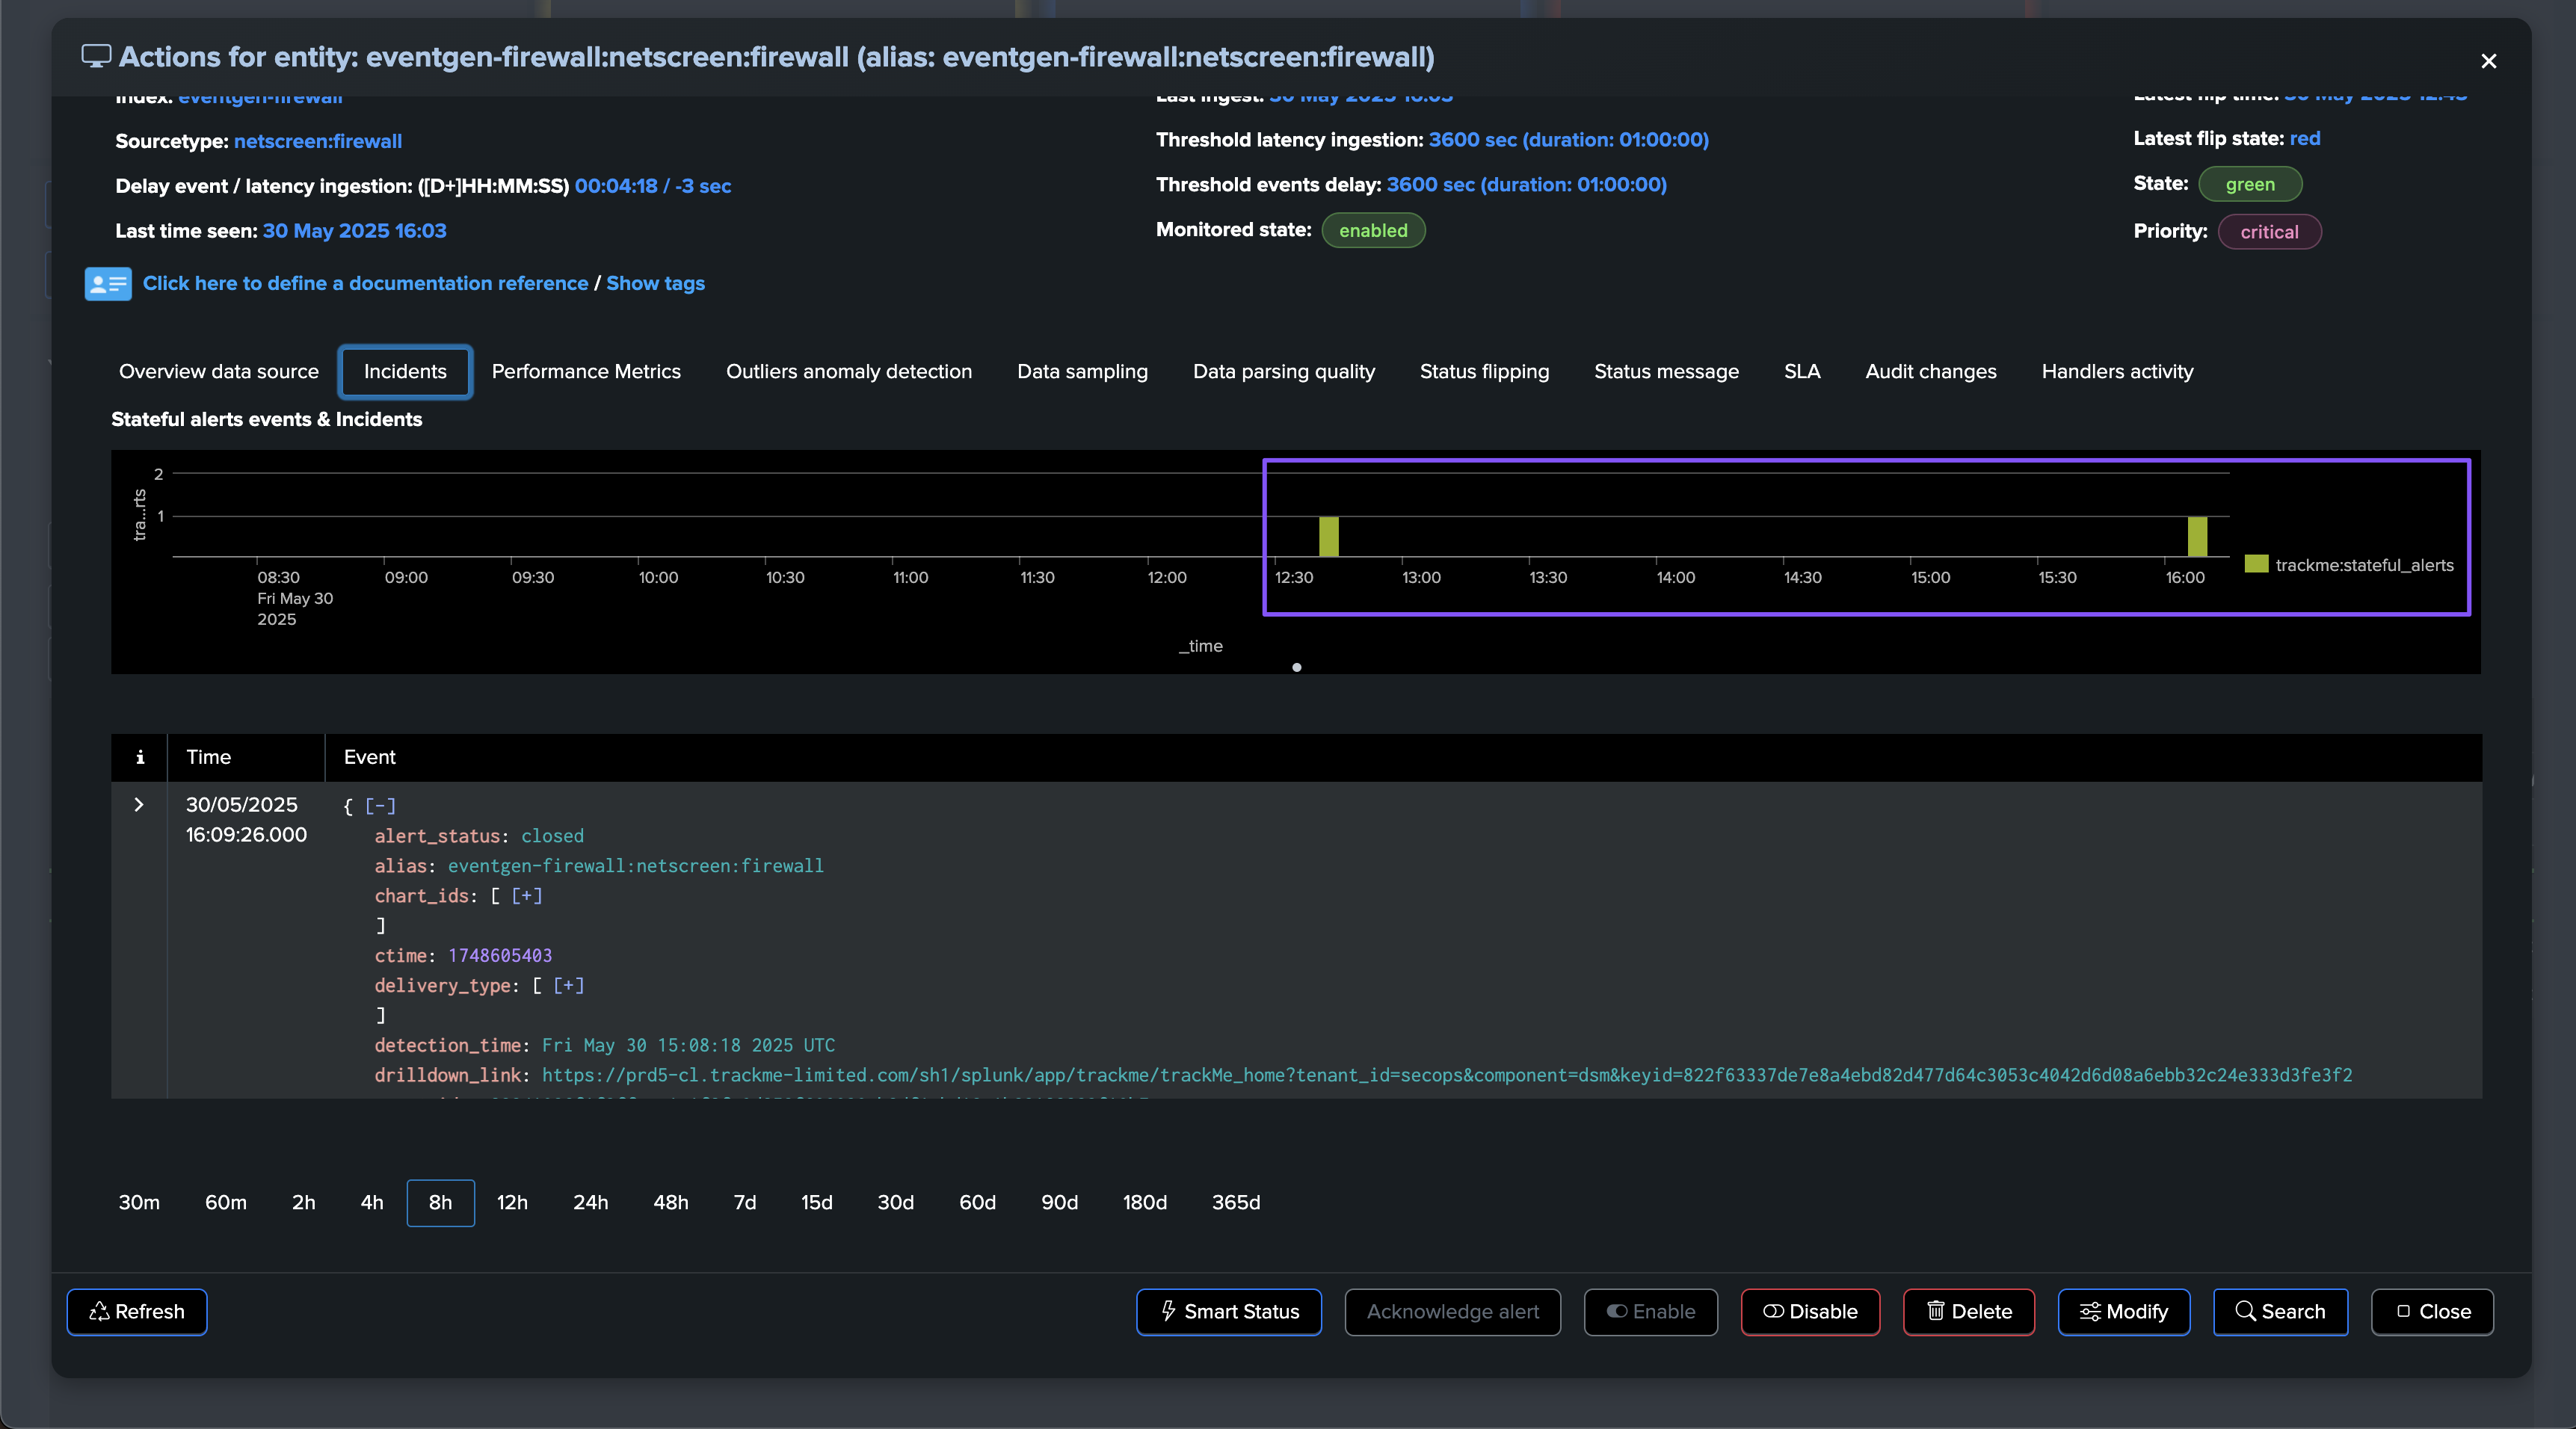
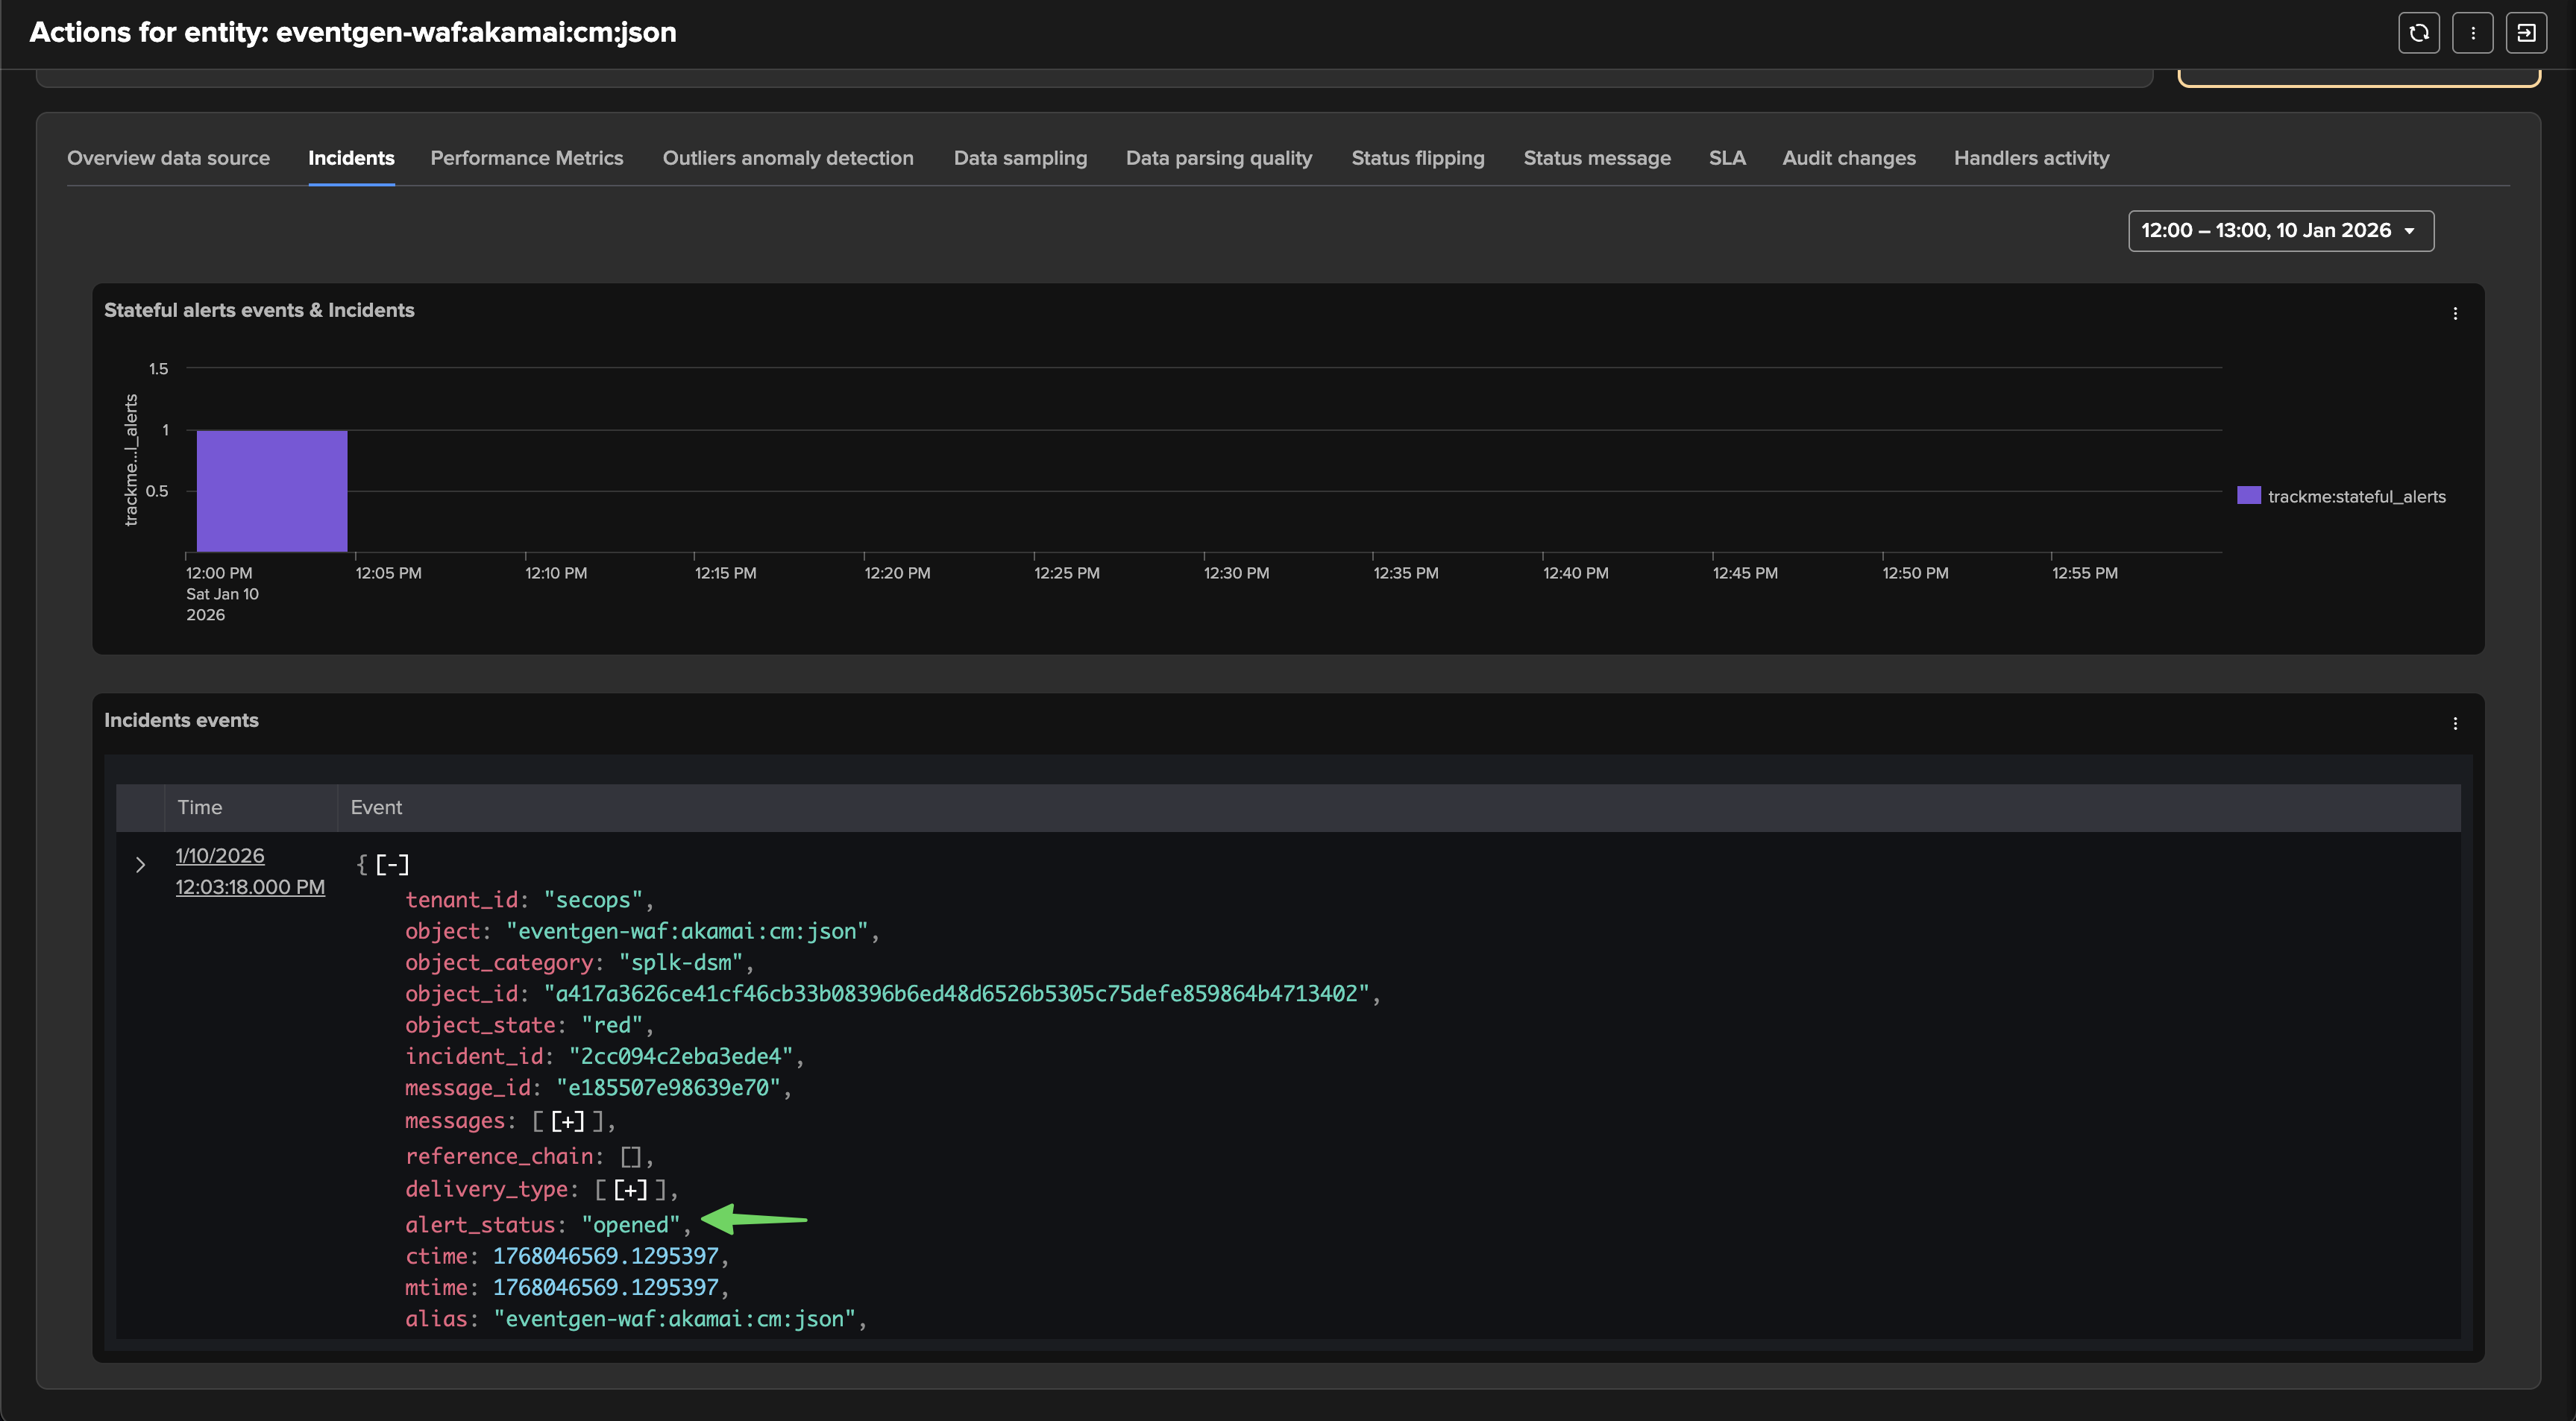
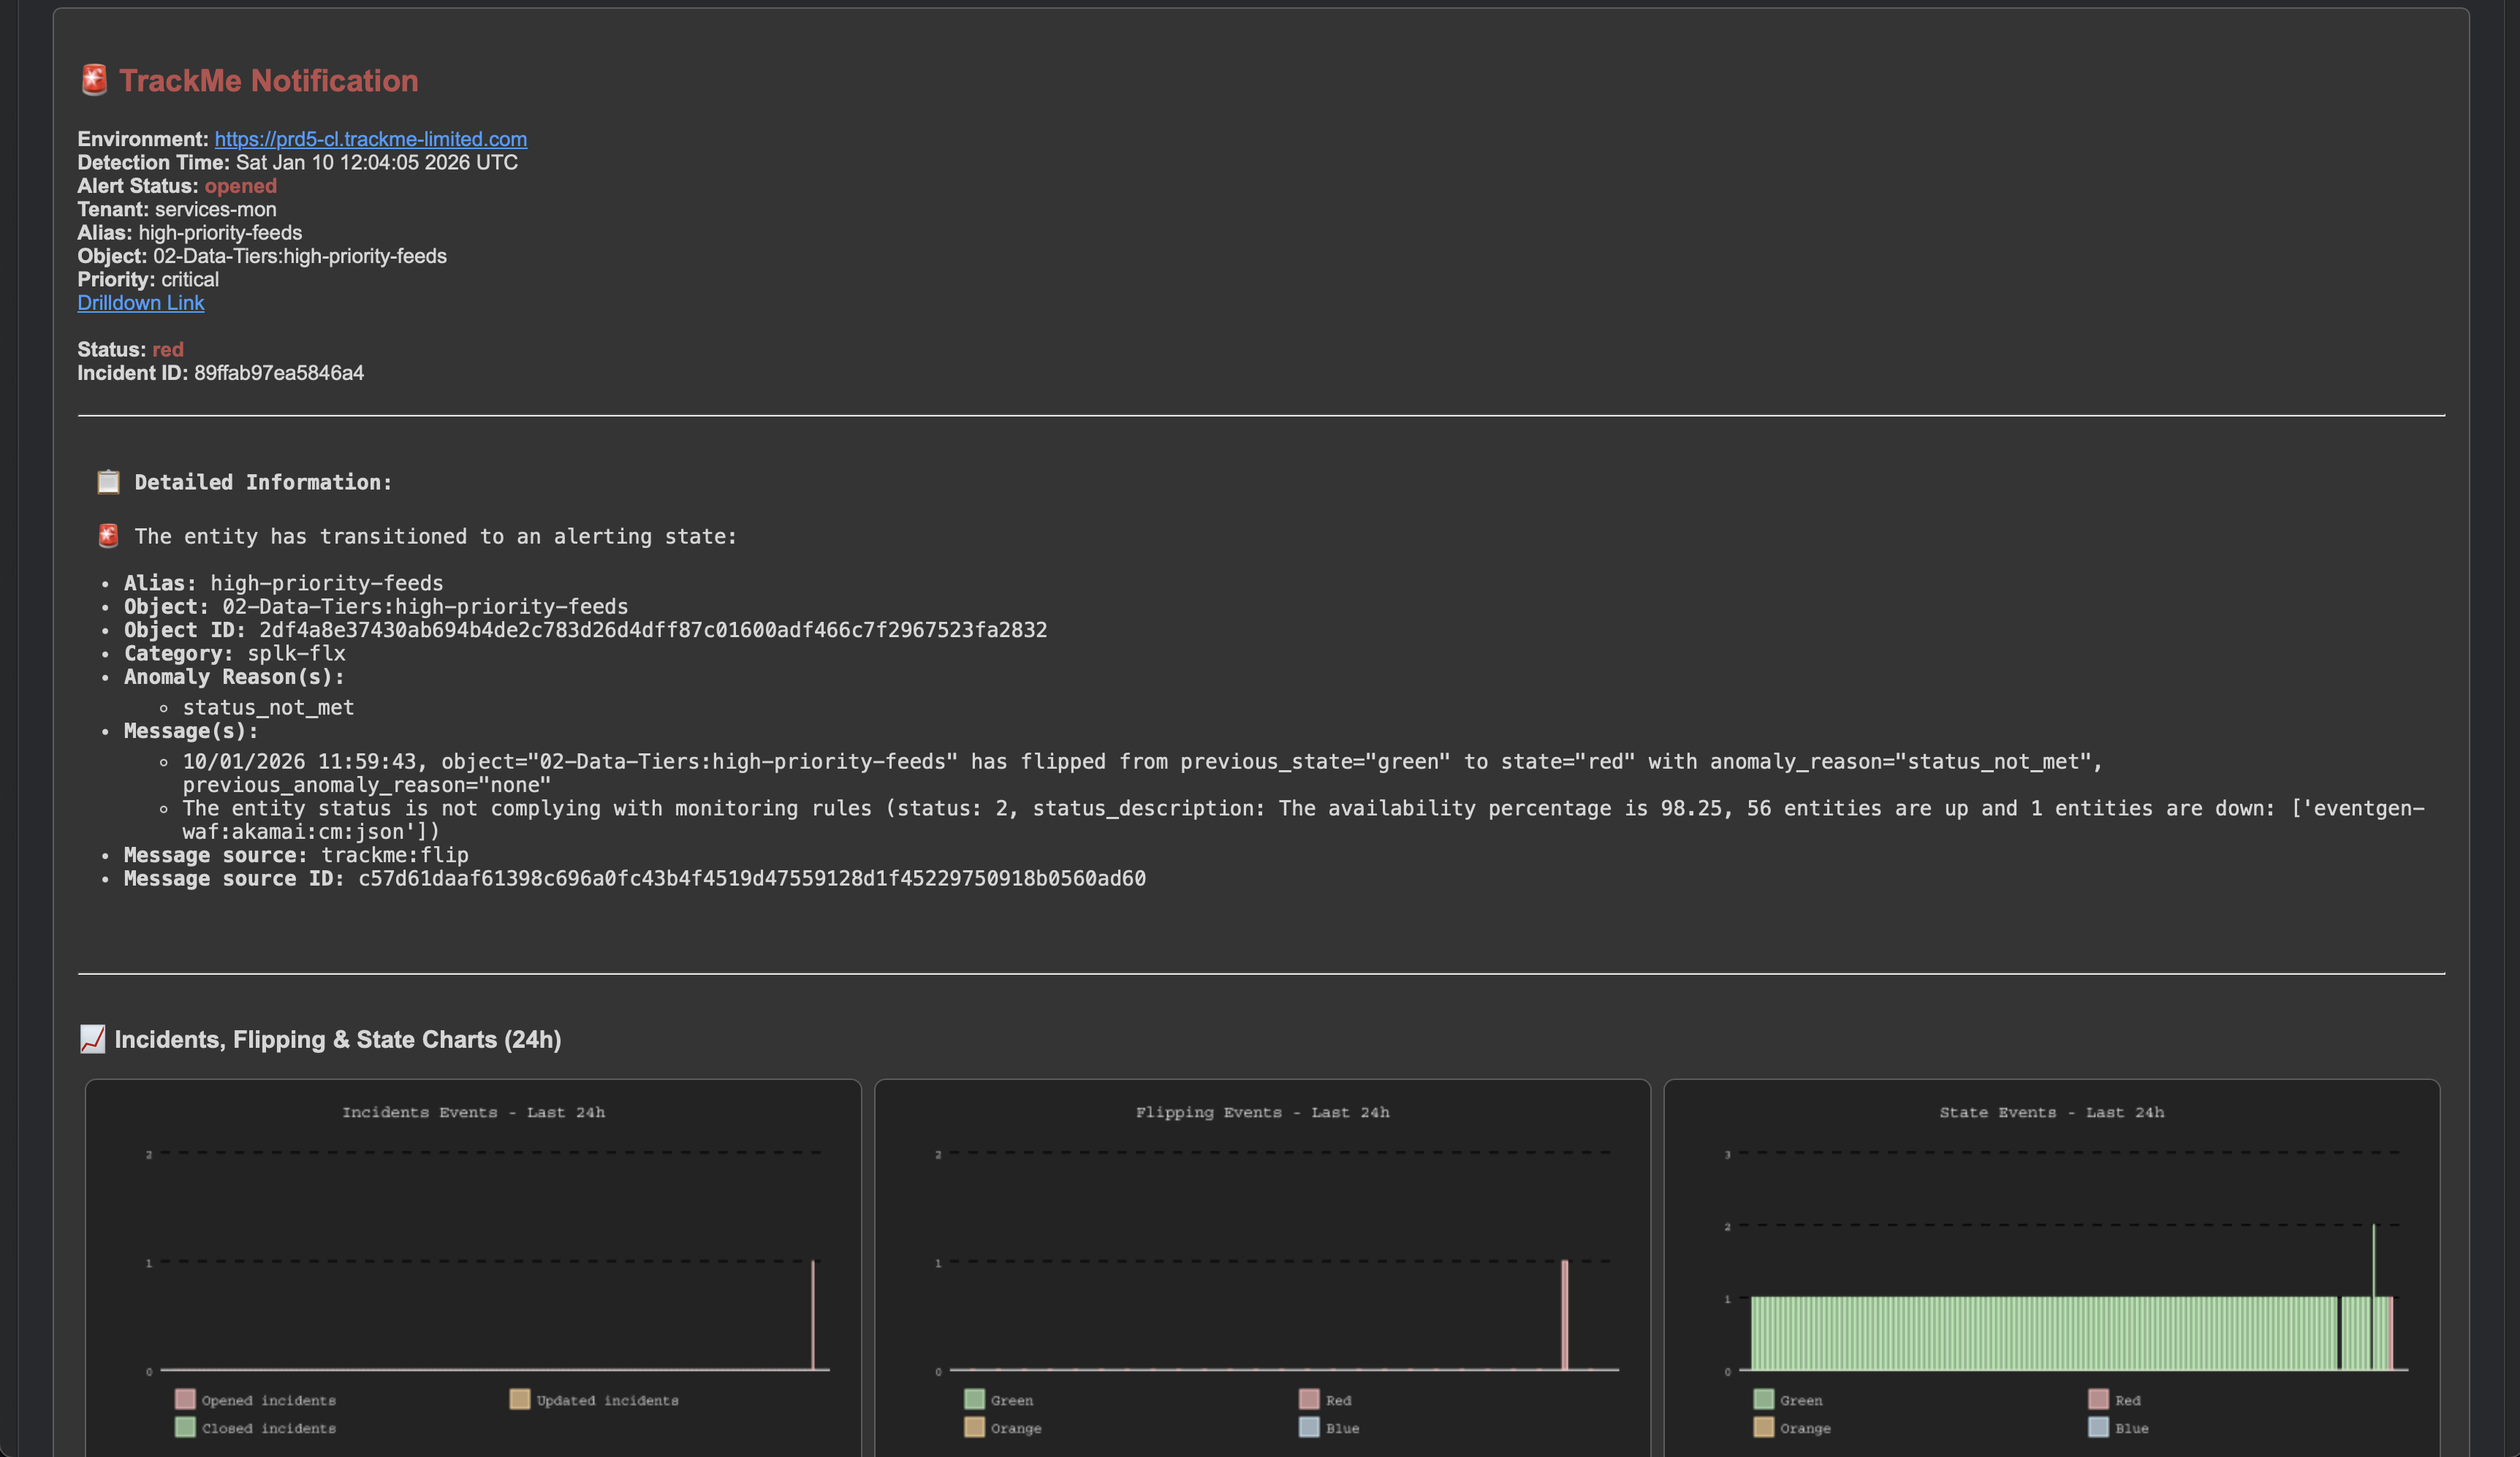
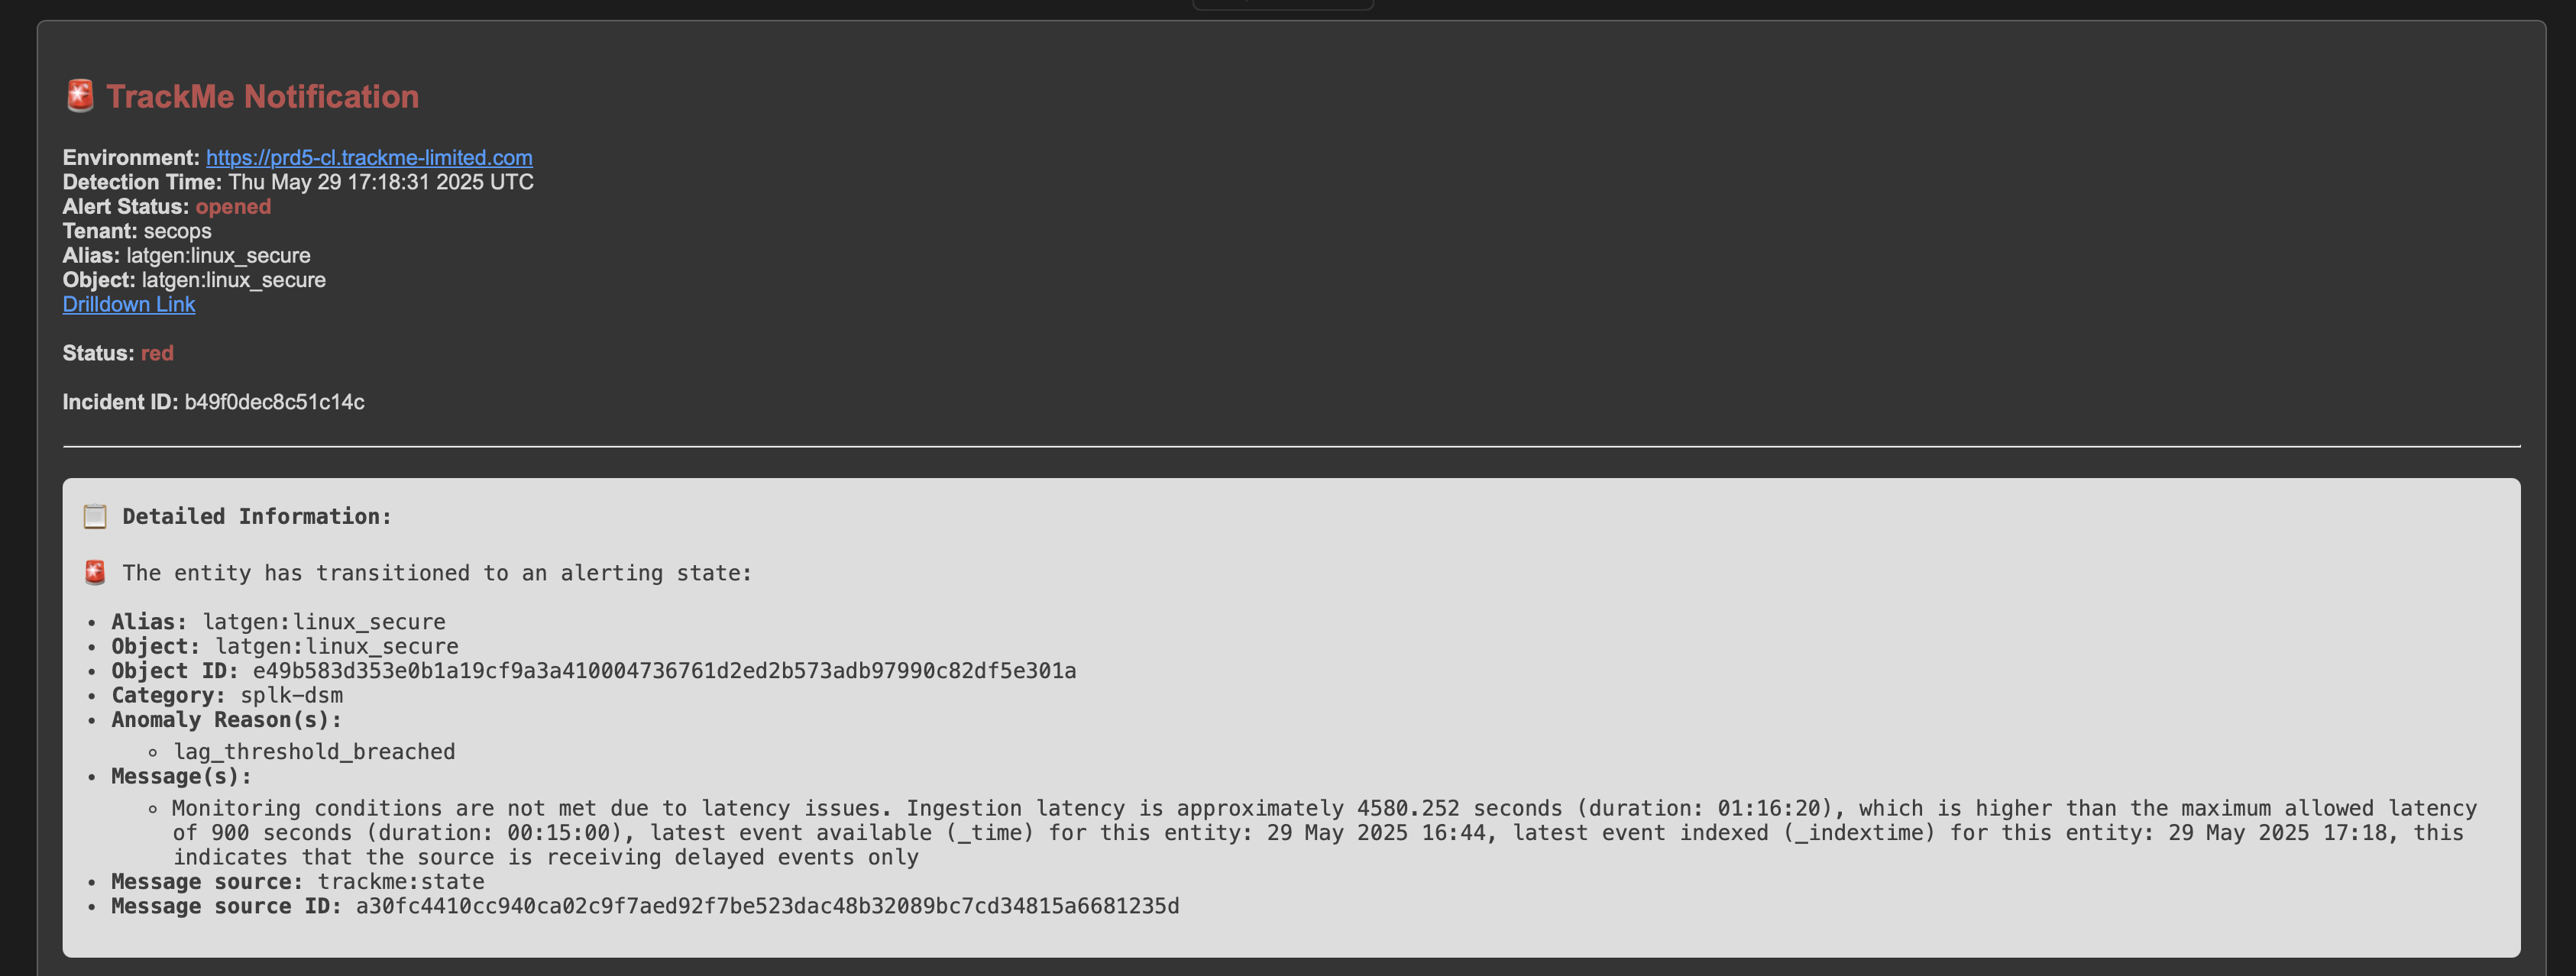
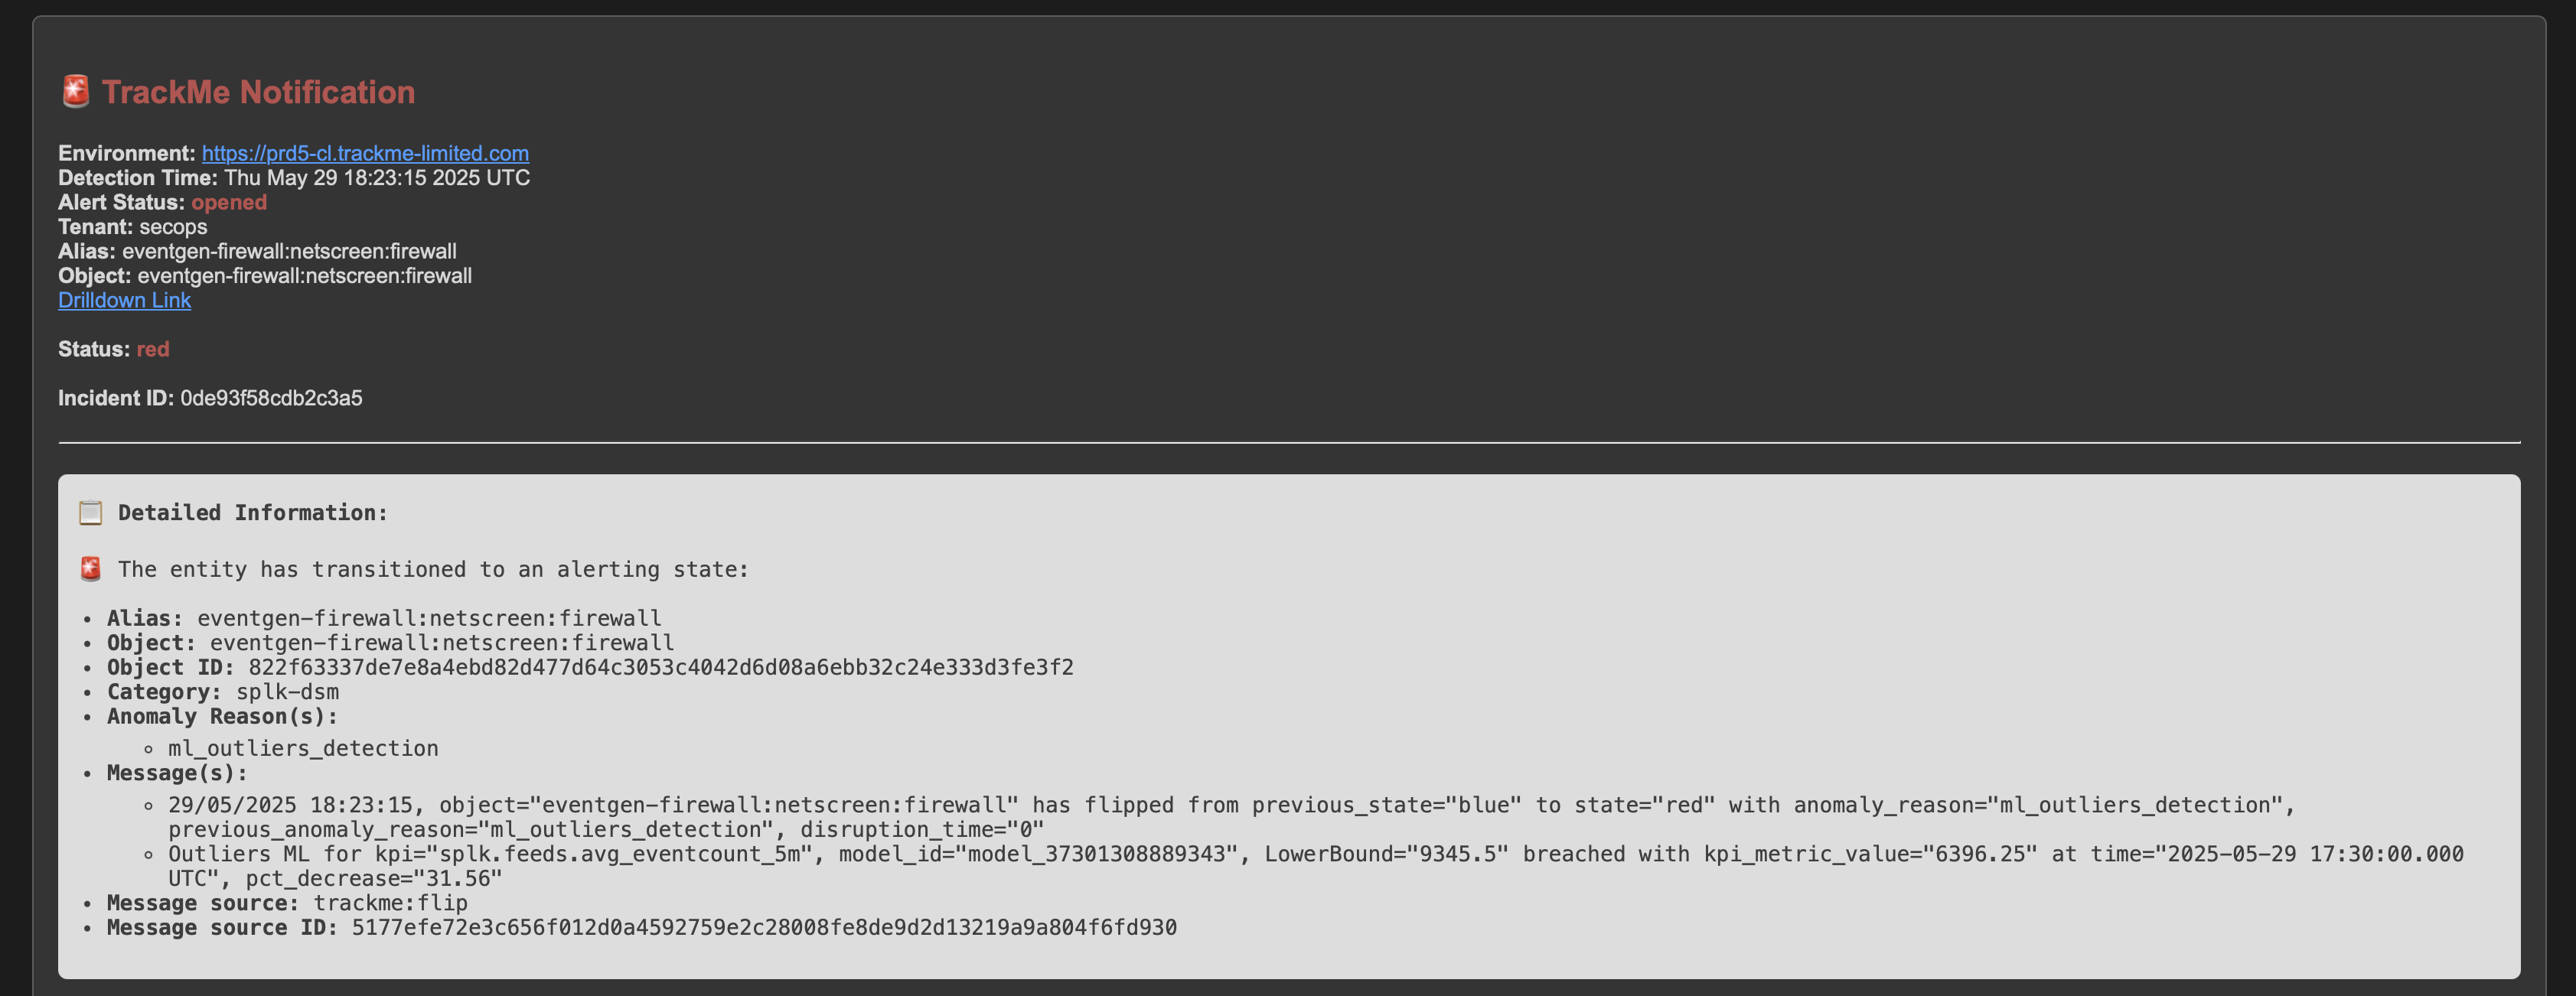
If alerting has been setup, TrackMe would generate an alert with this content:
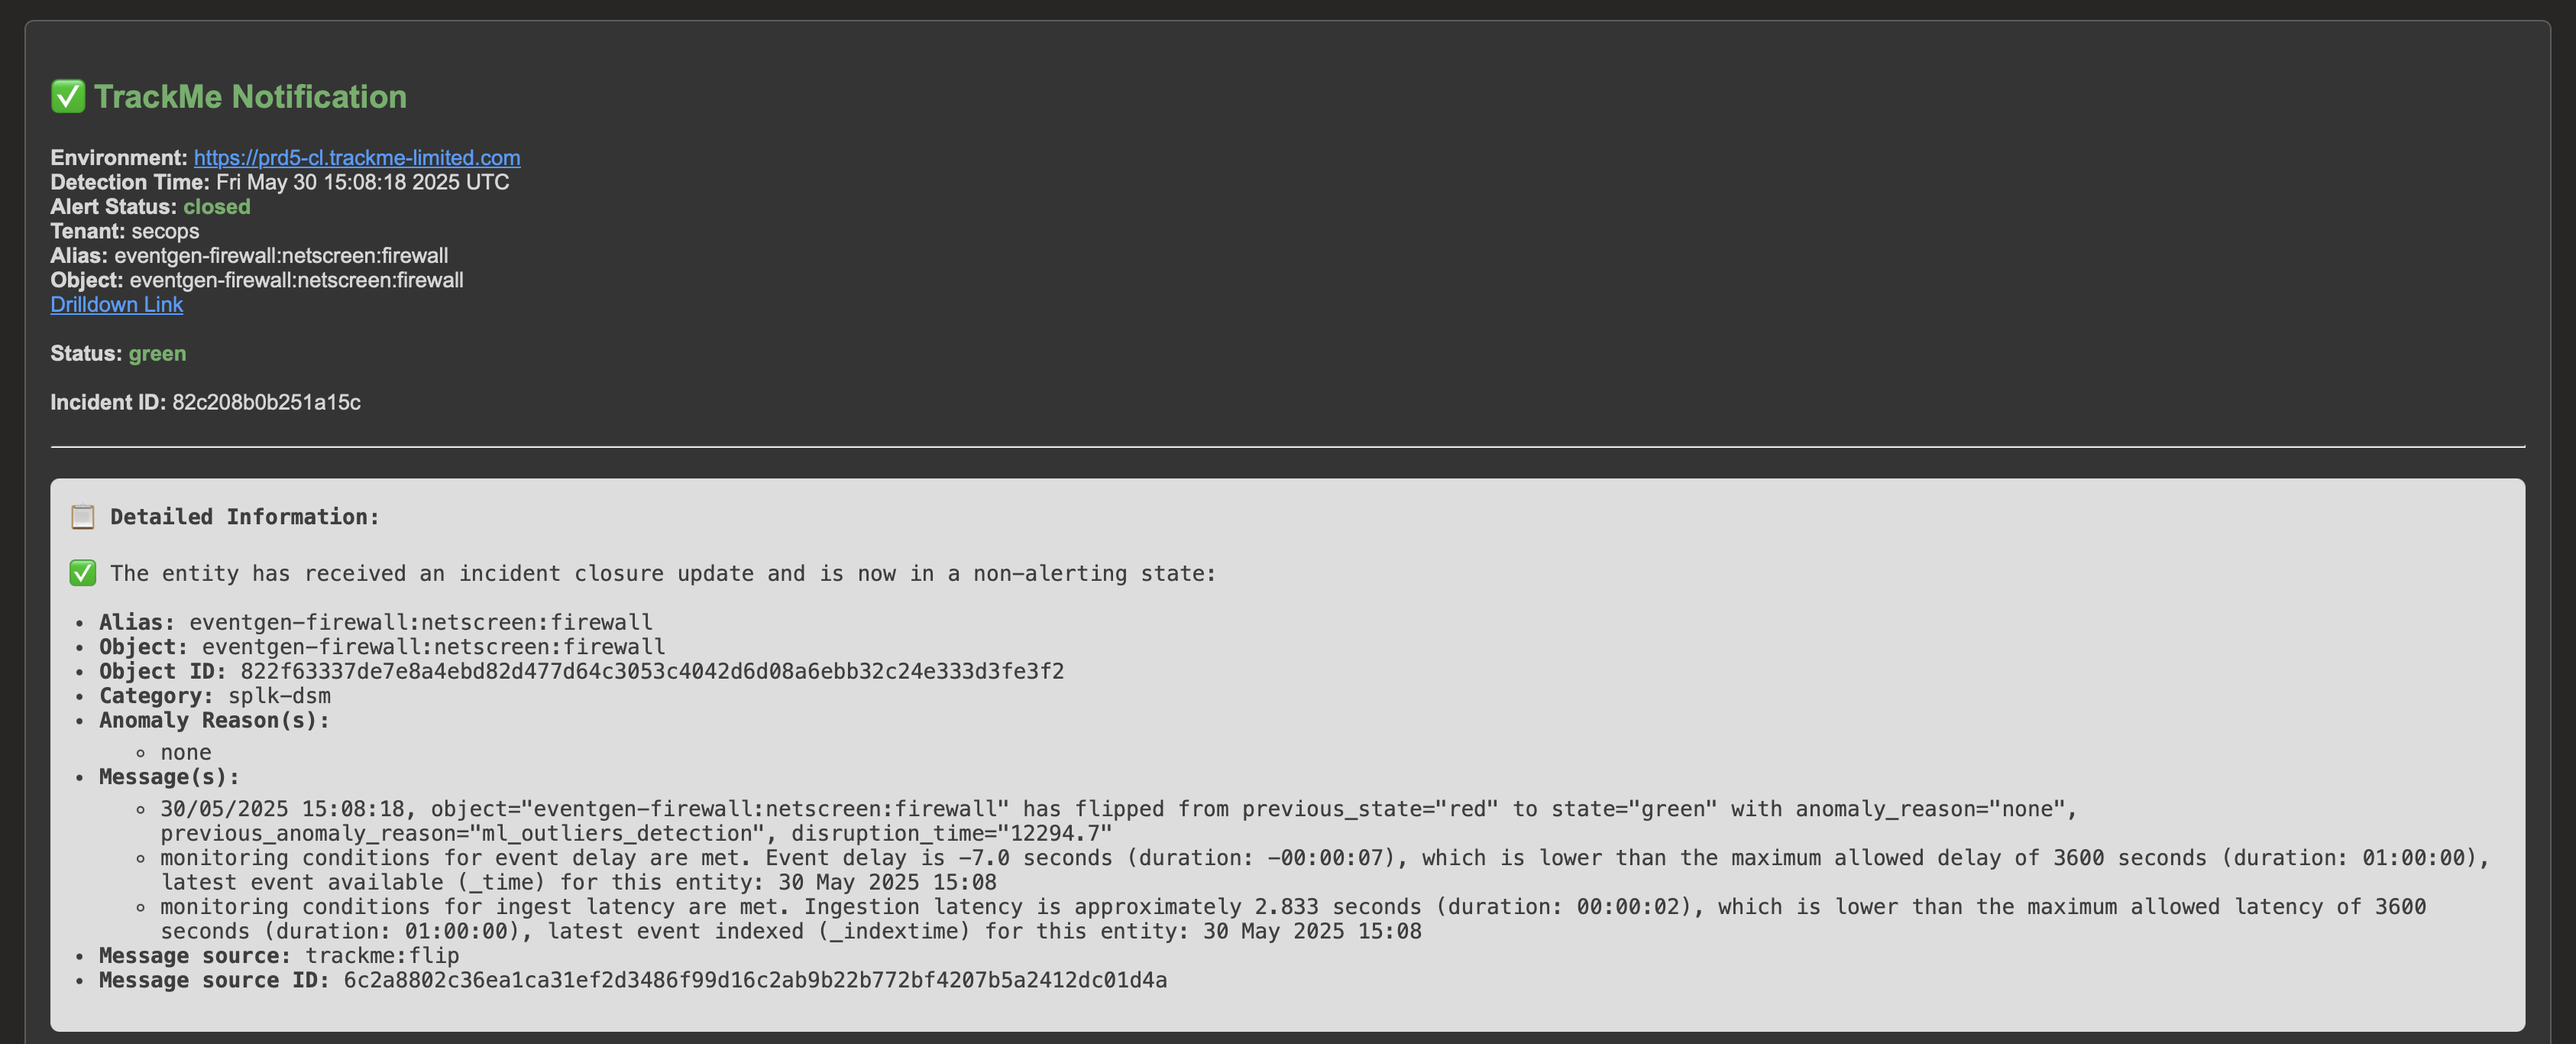
At some point, the issue was resolved and the data is back in Splunk:

The alert is resolved and a closure notification is generated and sent:

About Adaptive Delay Thresholding
In addition with the threshold concept above, TrackMe also leverages Machine Learning to adapt the delay threshold based on the knowedge accumulated over time on a per entity basis, and depending on the conditions.
This is called “Adaptive Delay Thresholding” and and is widely documented here: Splunk Feeds Delayed & Inactive Entities (splk-feeds).
This feature is very valuable to reduce the administration costs by automatically defining the best suitable values according to the entity behaviour, it can increase and decrease thesholds in function of the events and statuses.
Use Case: Feed Indexing Performance Issues Detection
Understanding Latency in Splunk
Latency is a critical metric that measures the time gap between when an event is generated and when it becomes available in Splunk. Think of it as the “travel time” for your data:
Why Latency Matters
When latency issues occur, they can cause significant problems:
Search Inconsistency: Searches run at different times may return different results
Delayed Insights: Critical information arrives later than expected
Resource Impact: Can indicate underlying system problems
Common Causes of Latency
Latency issues can stem from various sources:
Queue congestion
Resource constraints
Network bottlenecks
System overload
Configuration issues
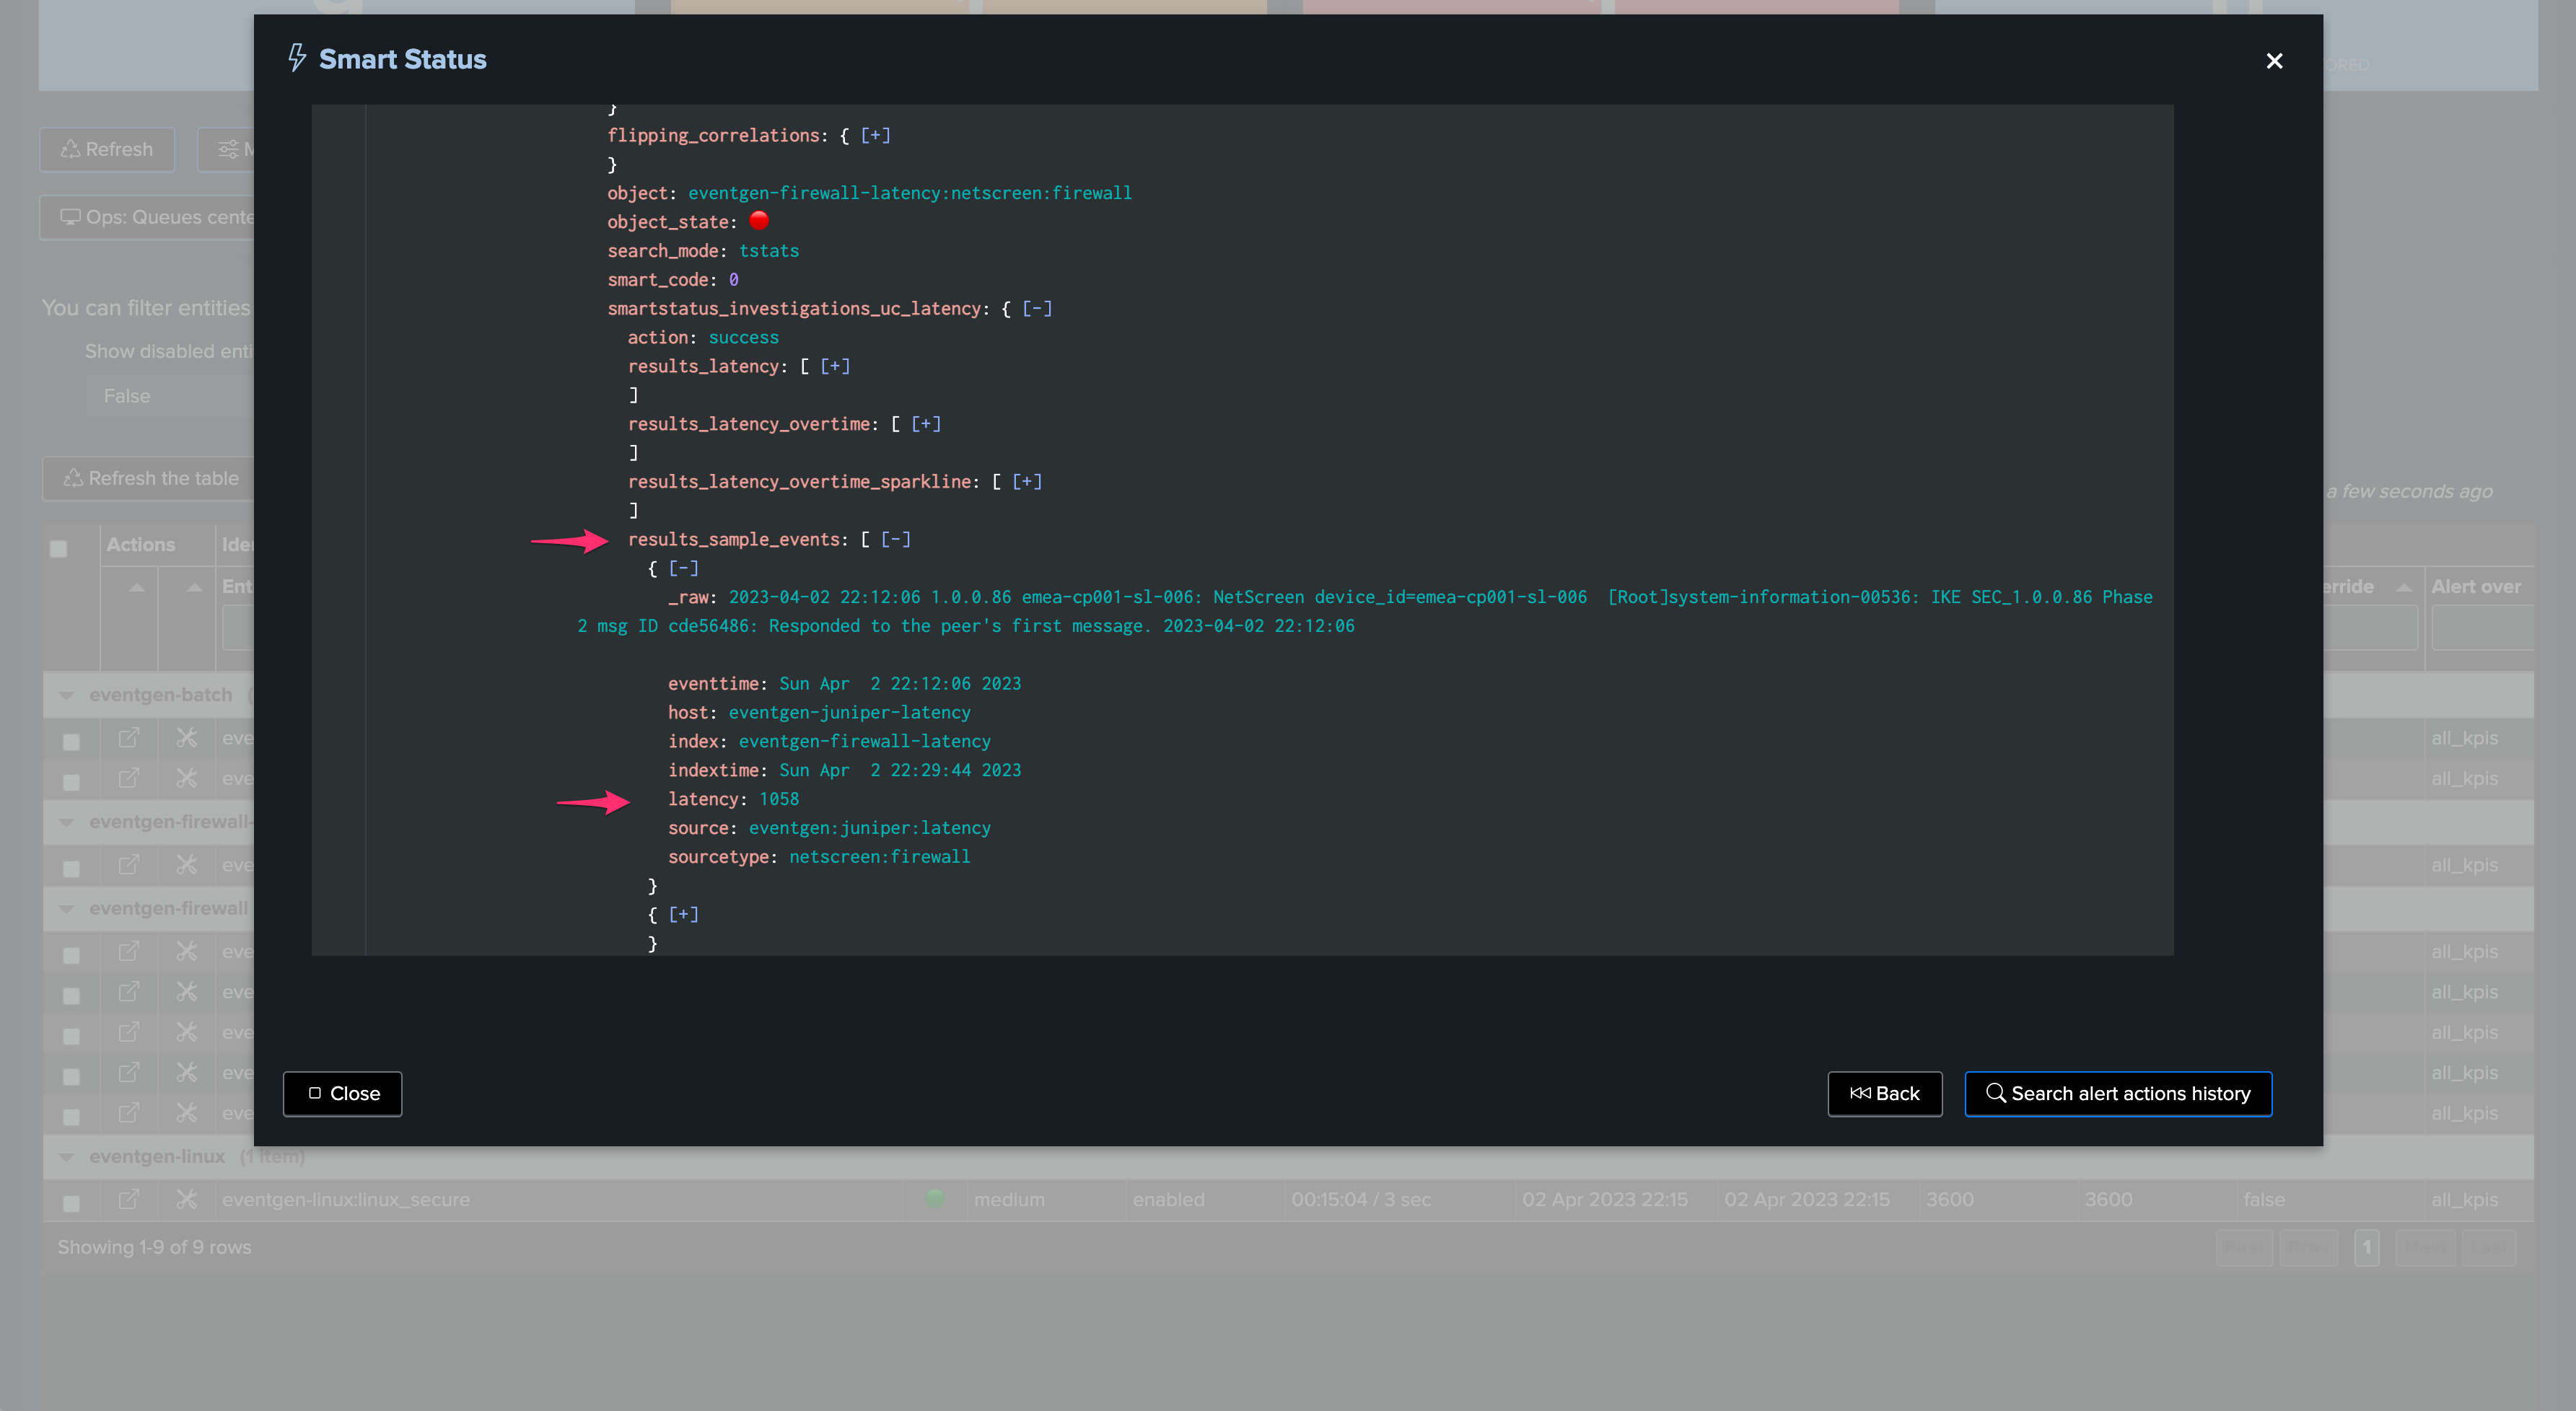
How TrackMe Detects Latency Issues
TrackMe monitors latency by comparing the indexed time against the event time. When latency exceeds your configured threshold, TrackMe triggers an anomaly with anomaly_reason="latency_threshold_breached".
Let’s consider the following entity, currently the latency is very low and the entity is considered as healthy:
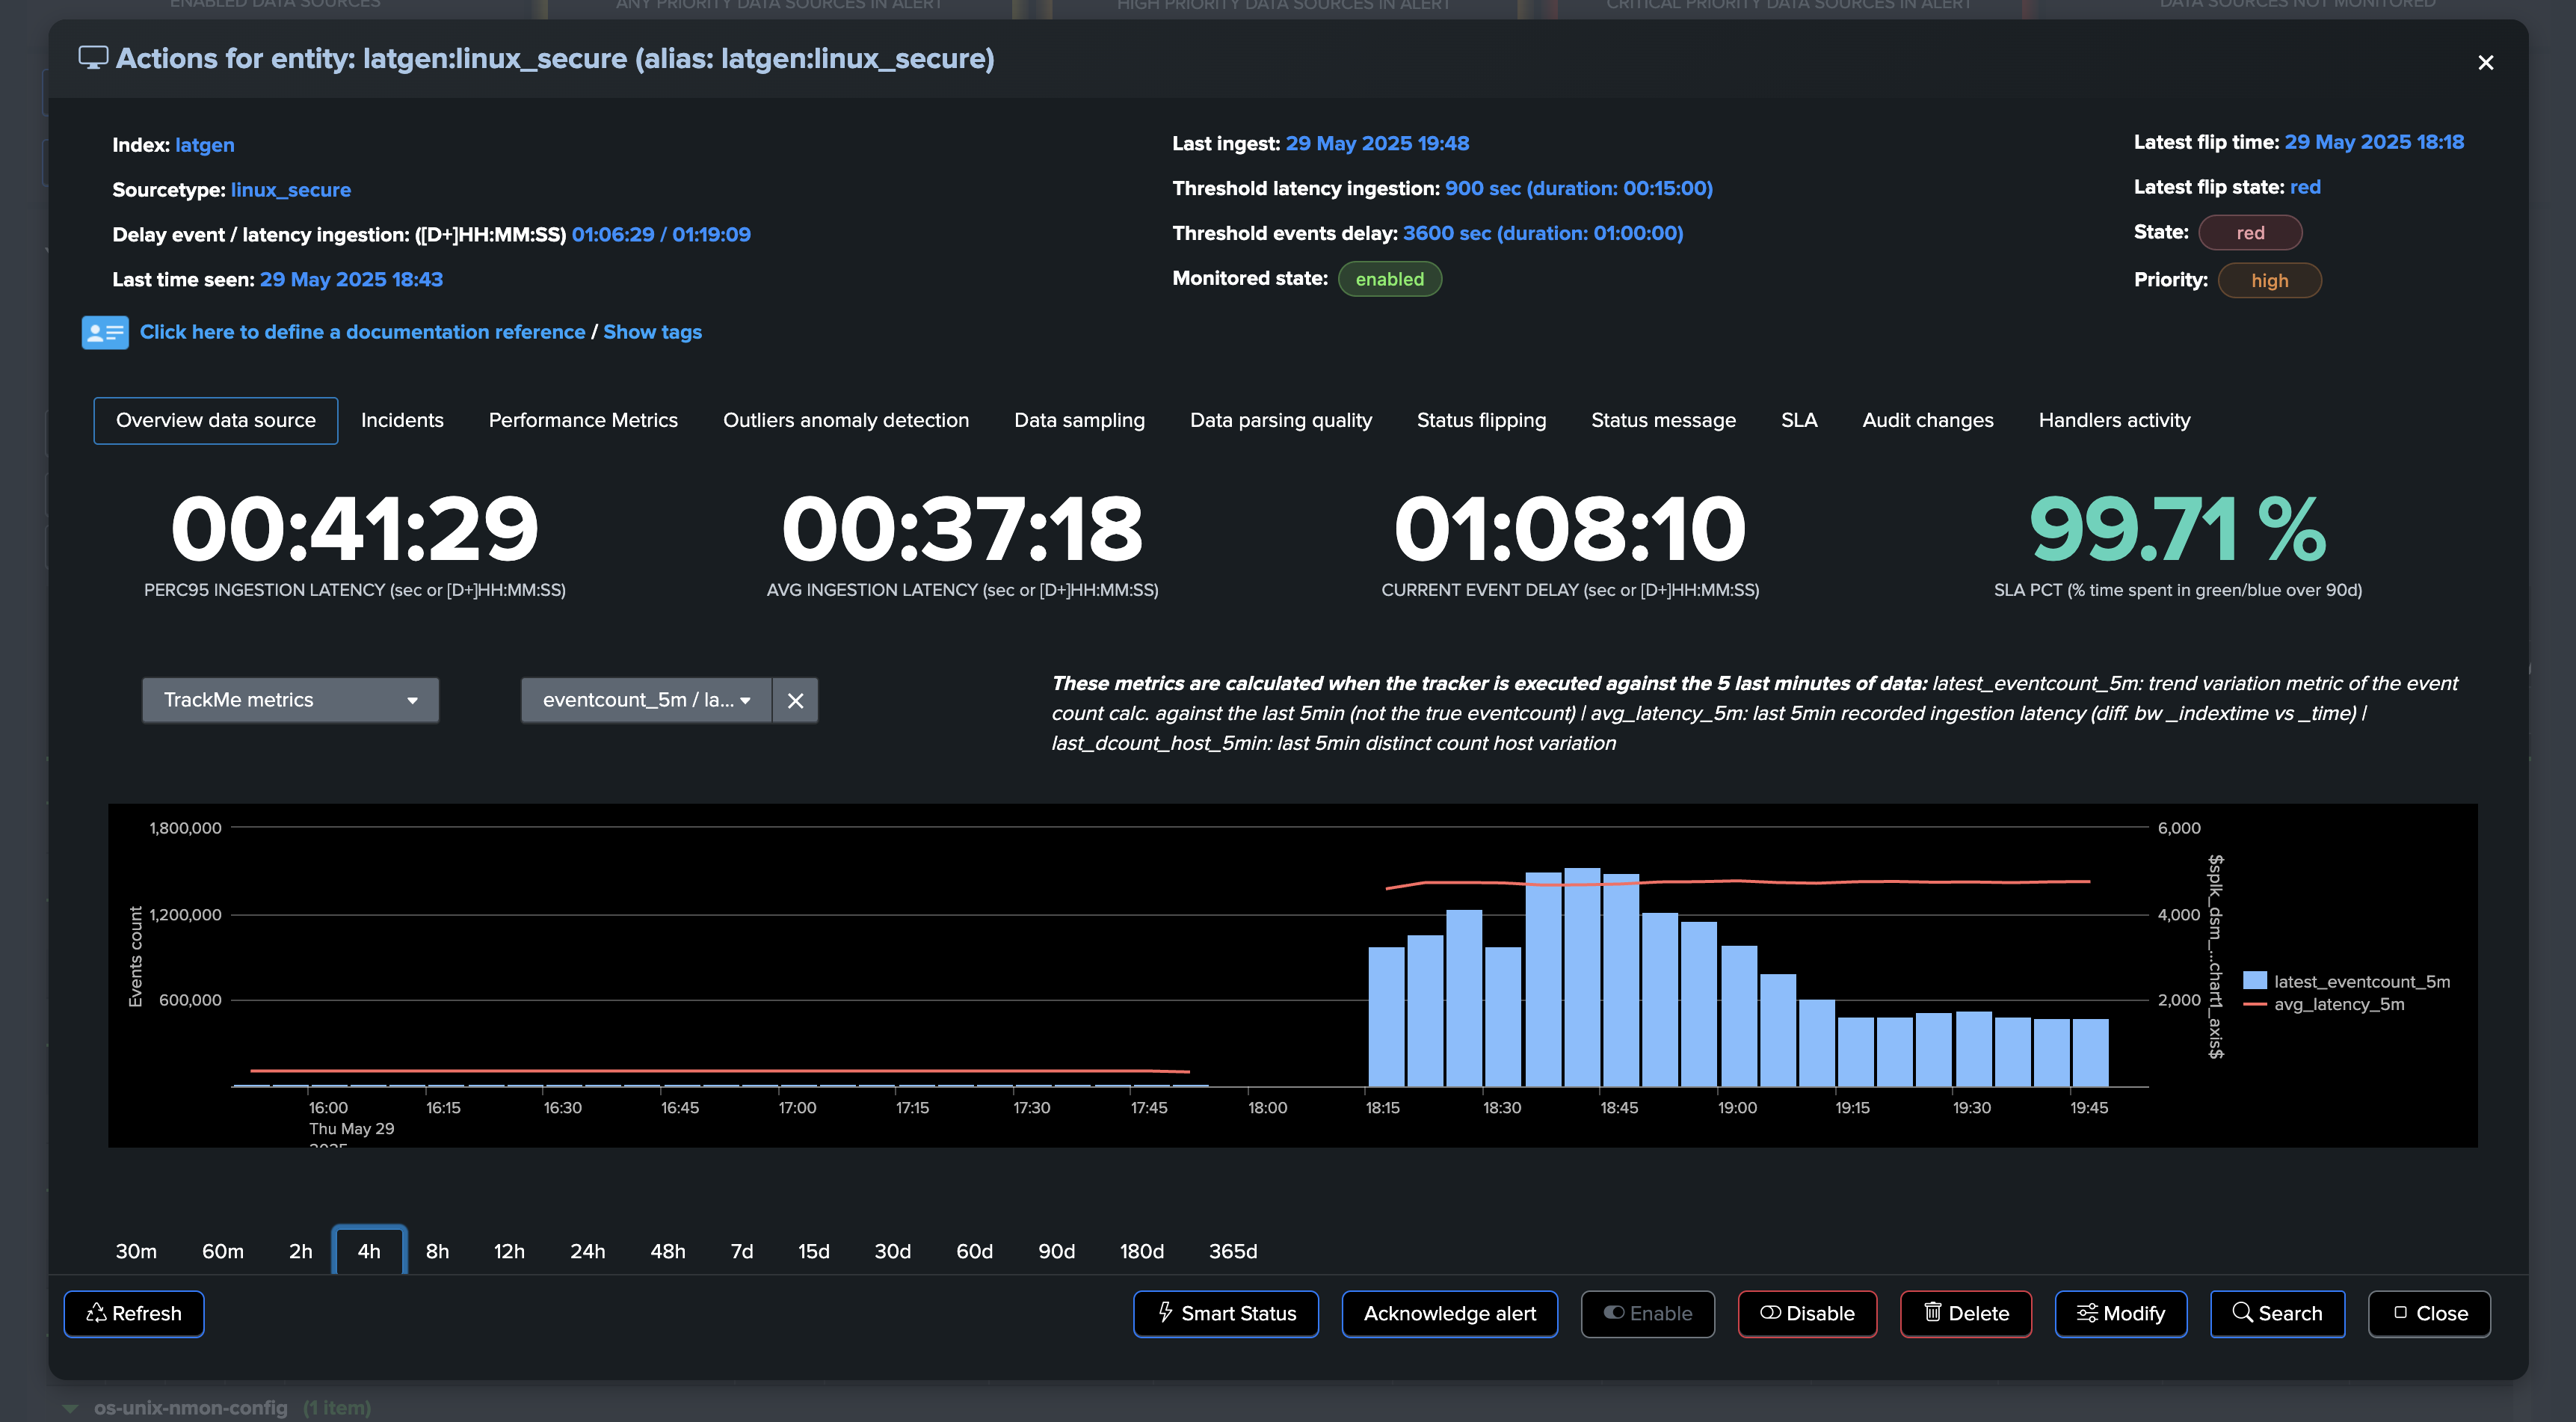
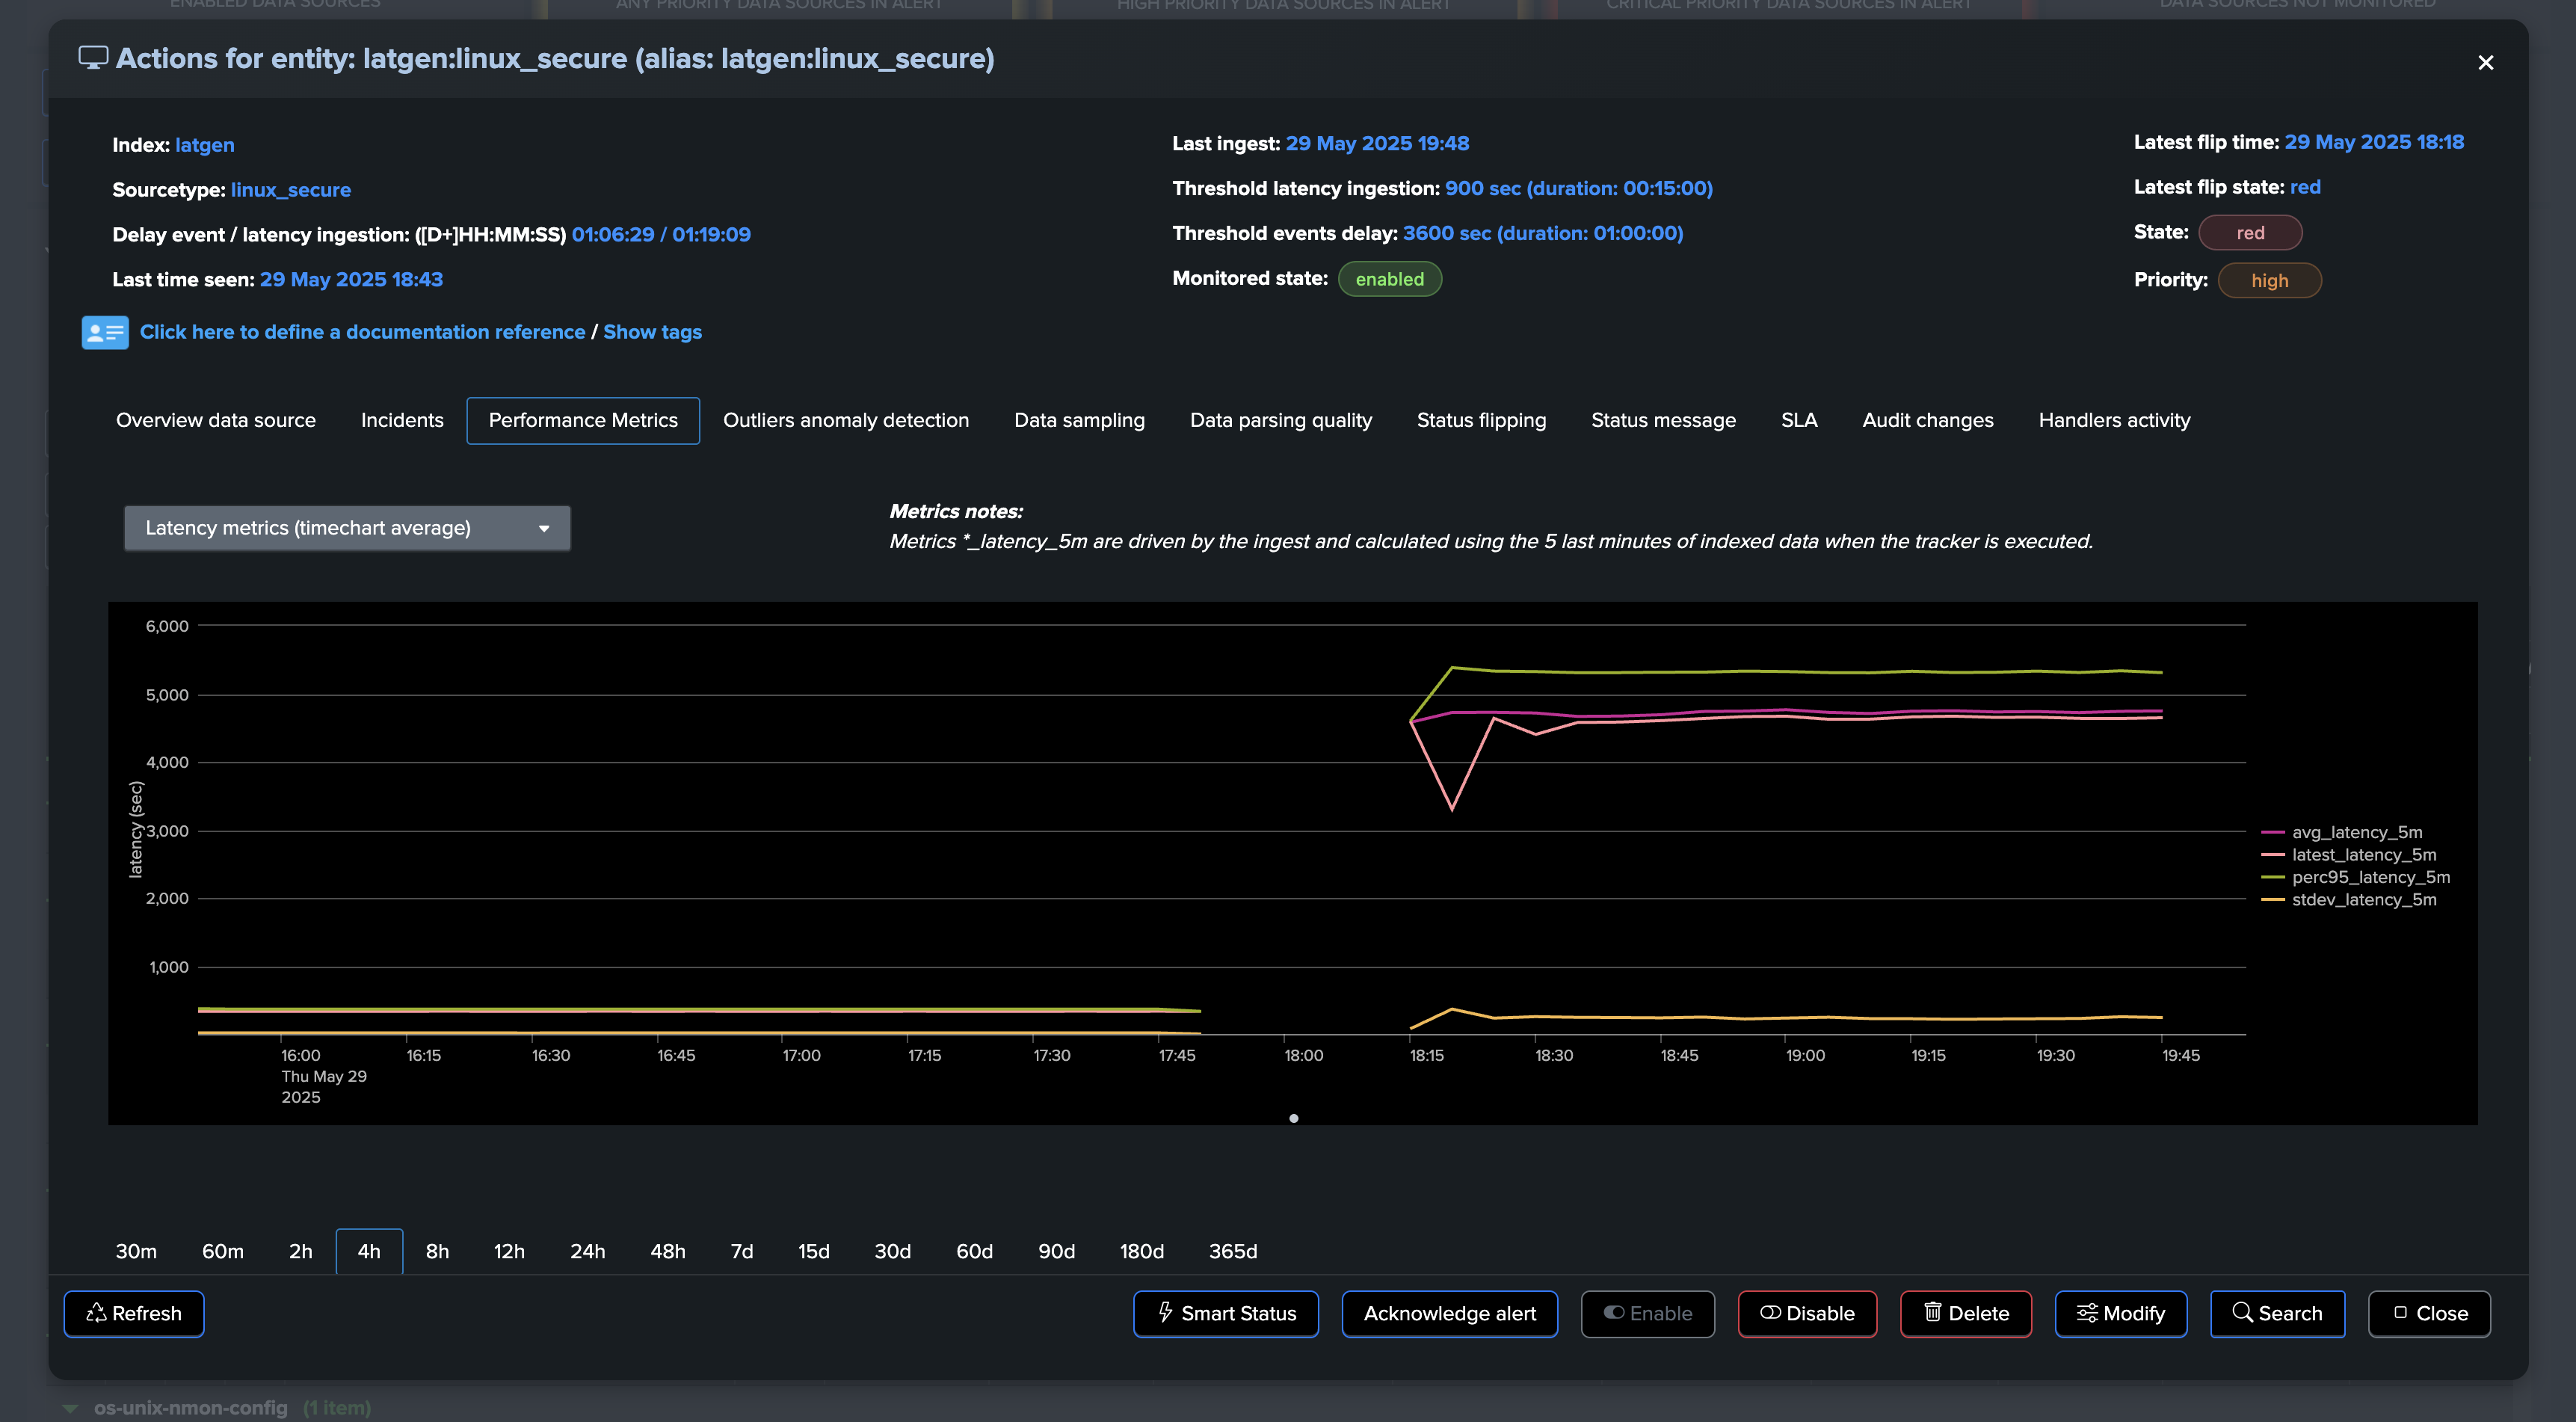
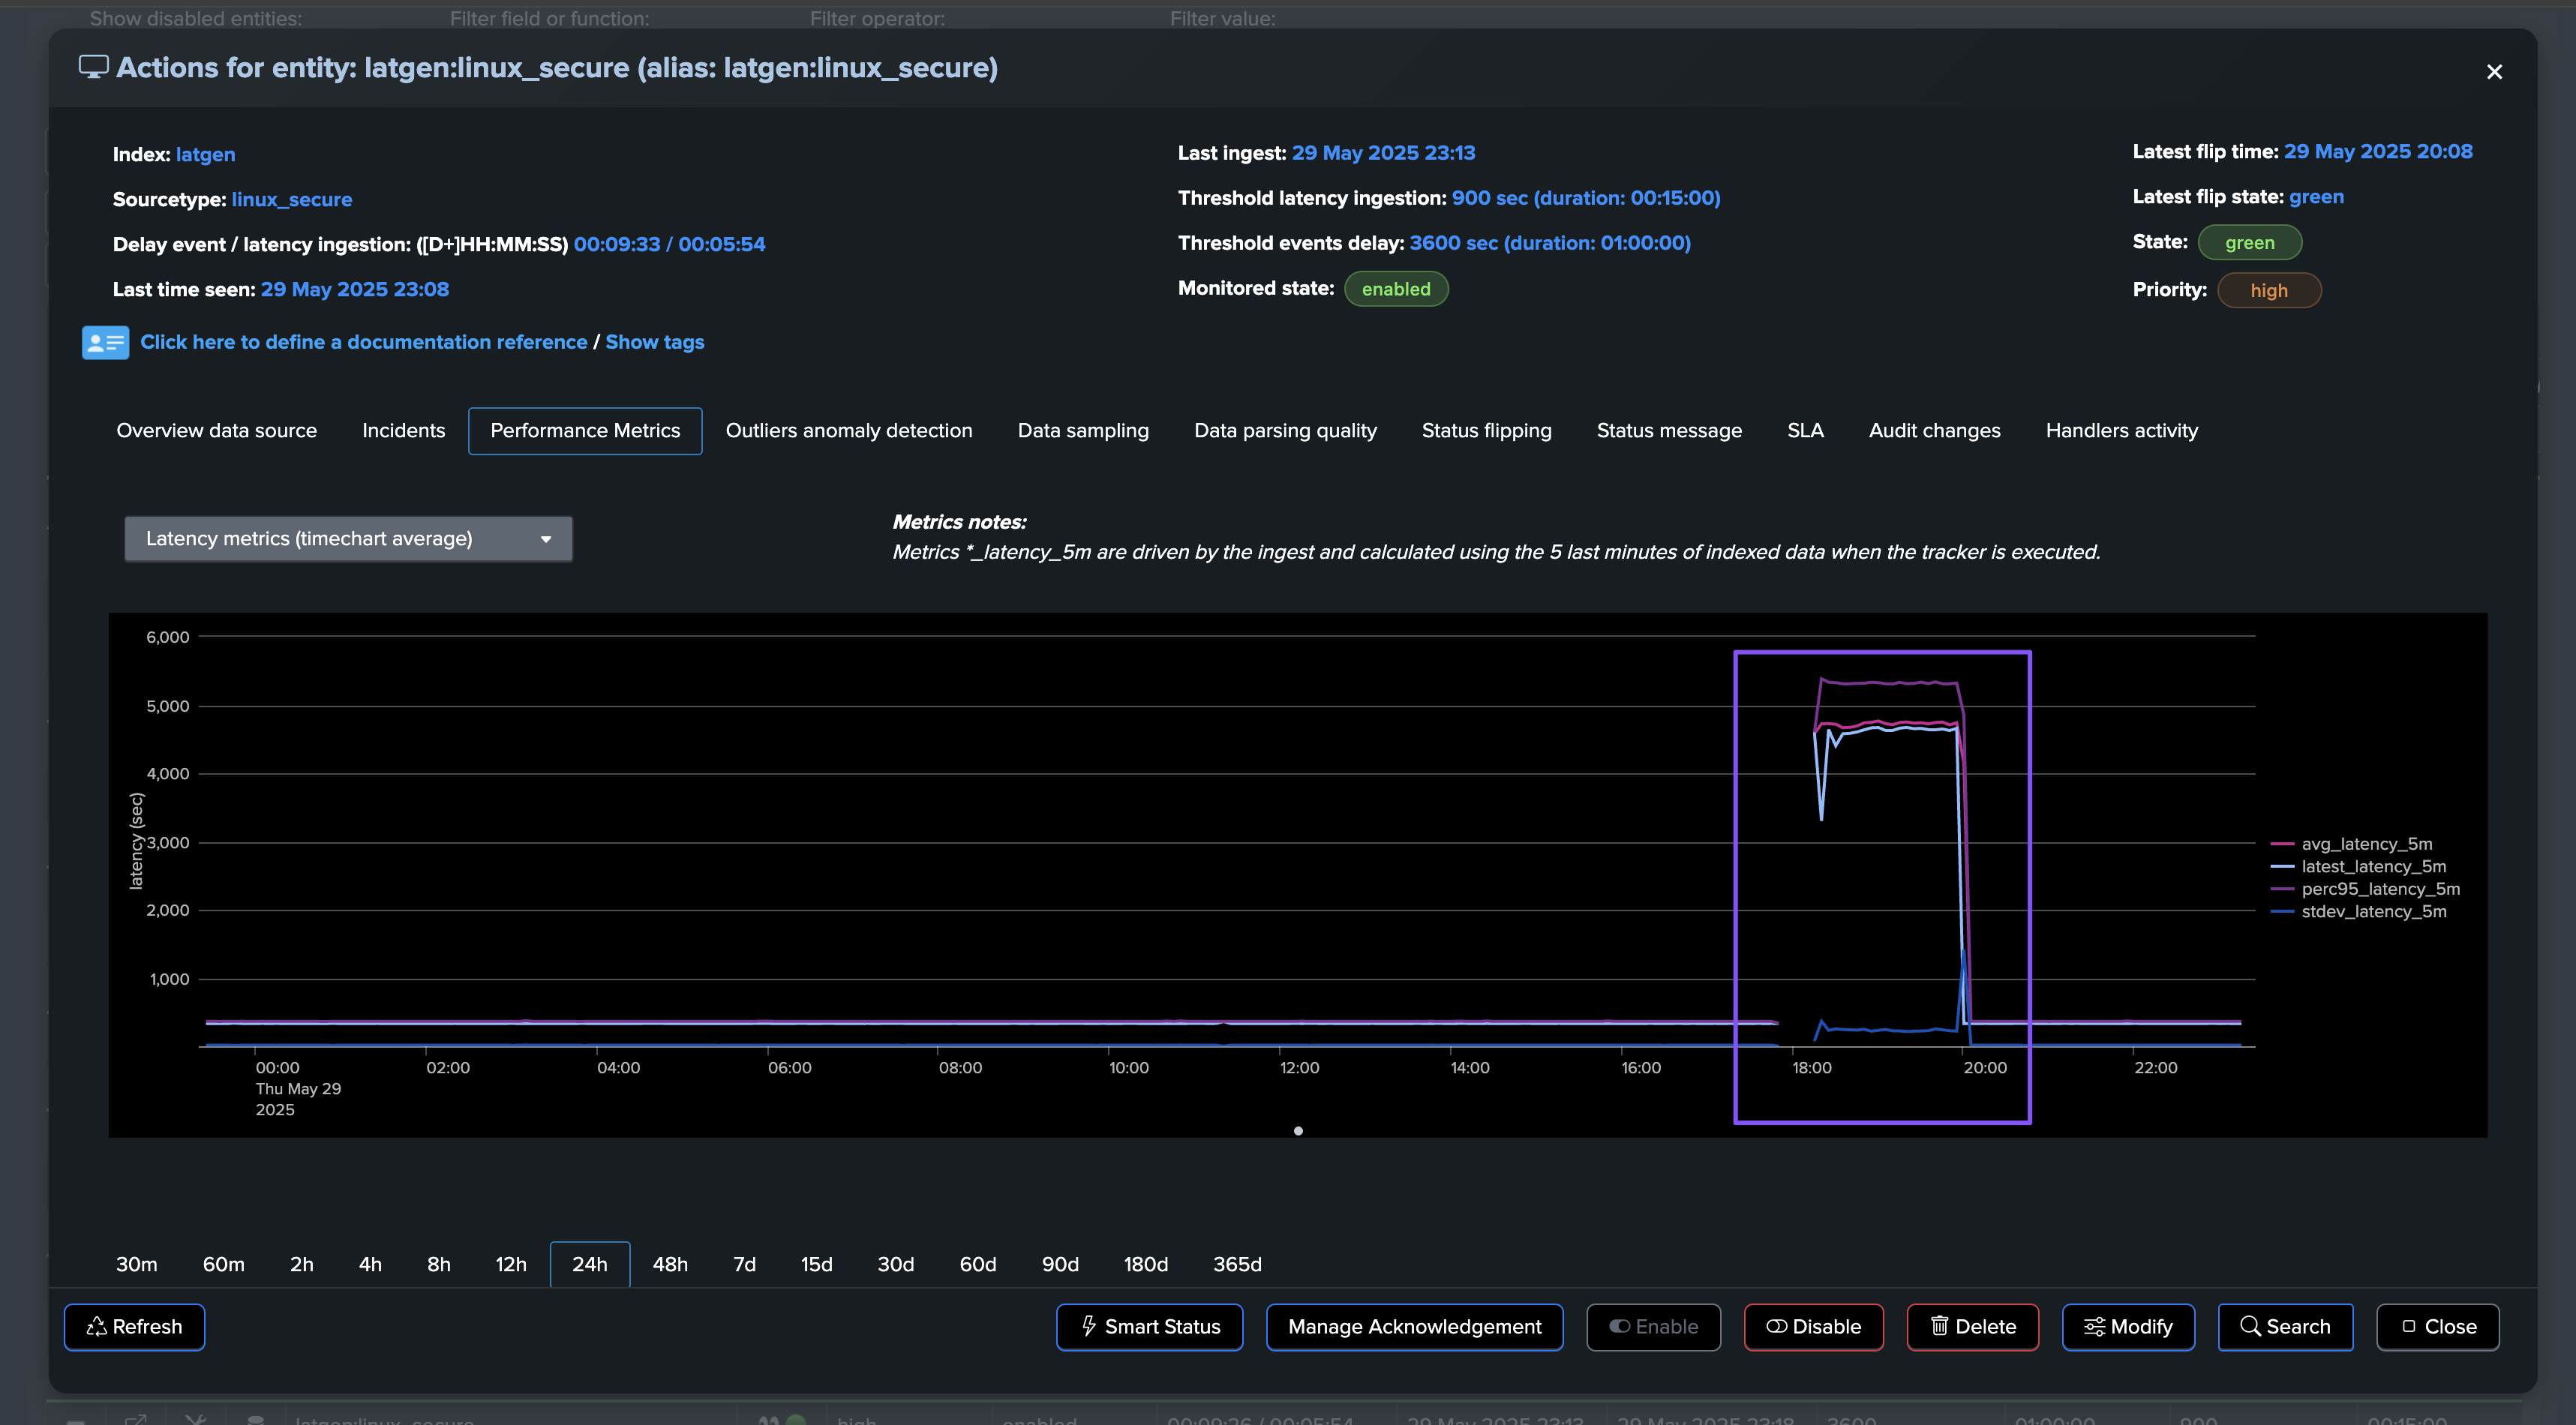
Suddenly, the entity starts experiencing latency issues. We begin receiving events with a significant time gap between their generation and indexing:
Some additional comments about latency:
It is likely that latency will also affect the delay, but this is not necessarily the case.
You can well be receiving a mix of real-time or quasi-real-time events, while at the same time receiving events made available with a large latency.
This can be the case for a variety of reasons, from data feeds catching up situations to simply having collectors suffering from performance issues while others sending to the same context do not.
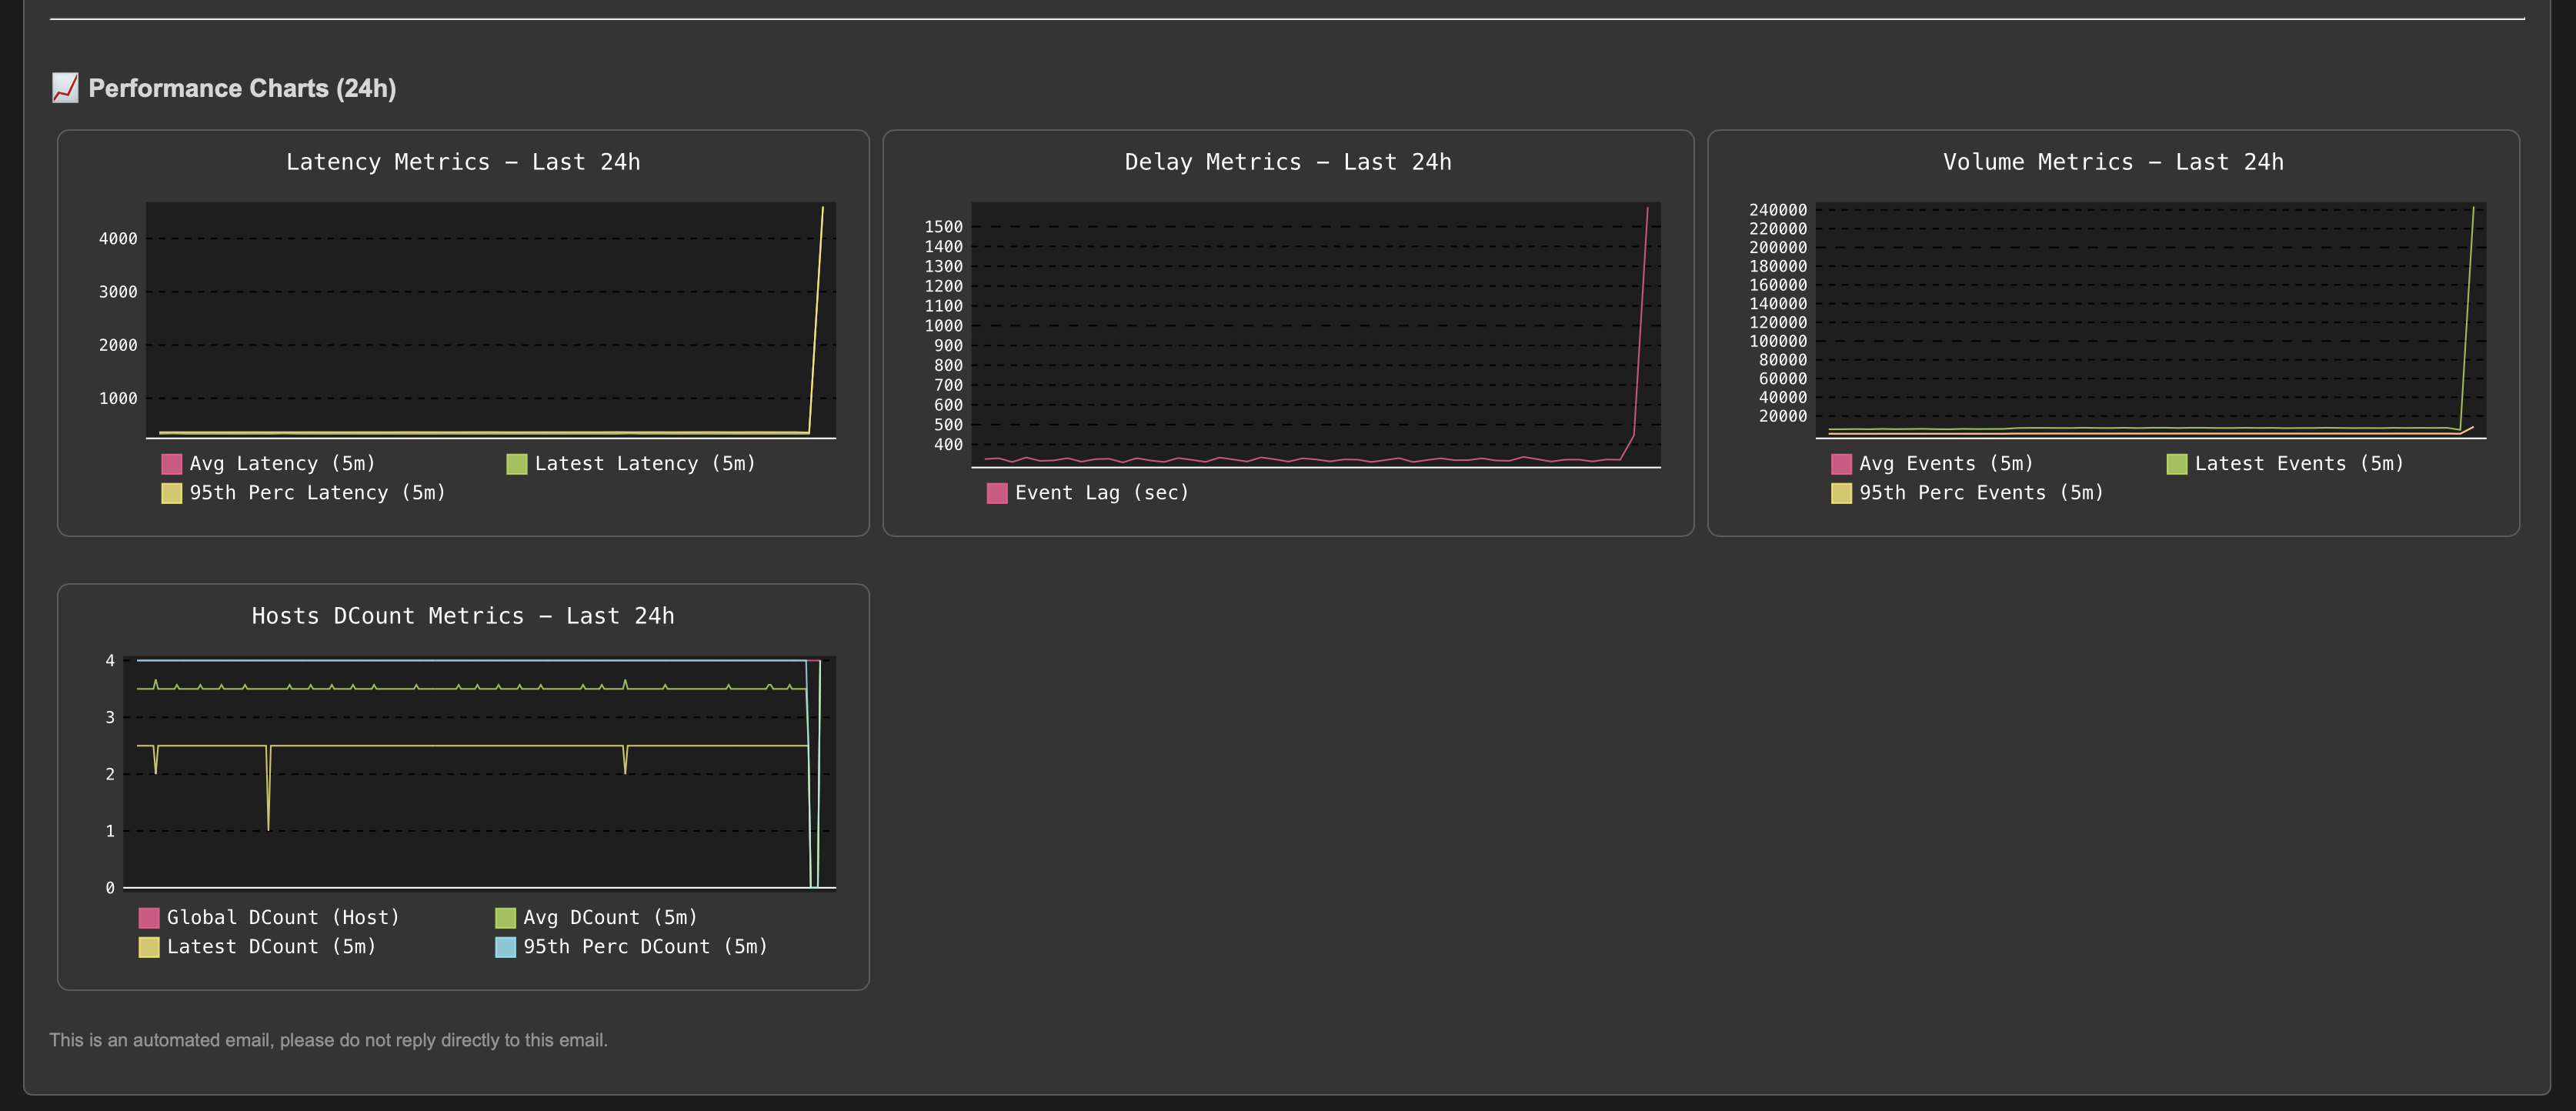
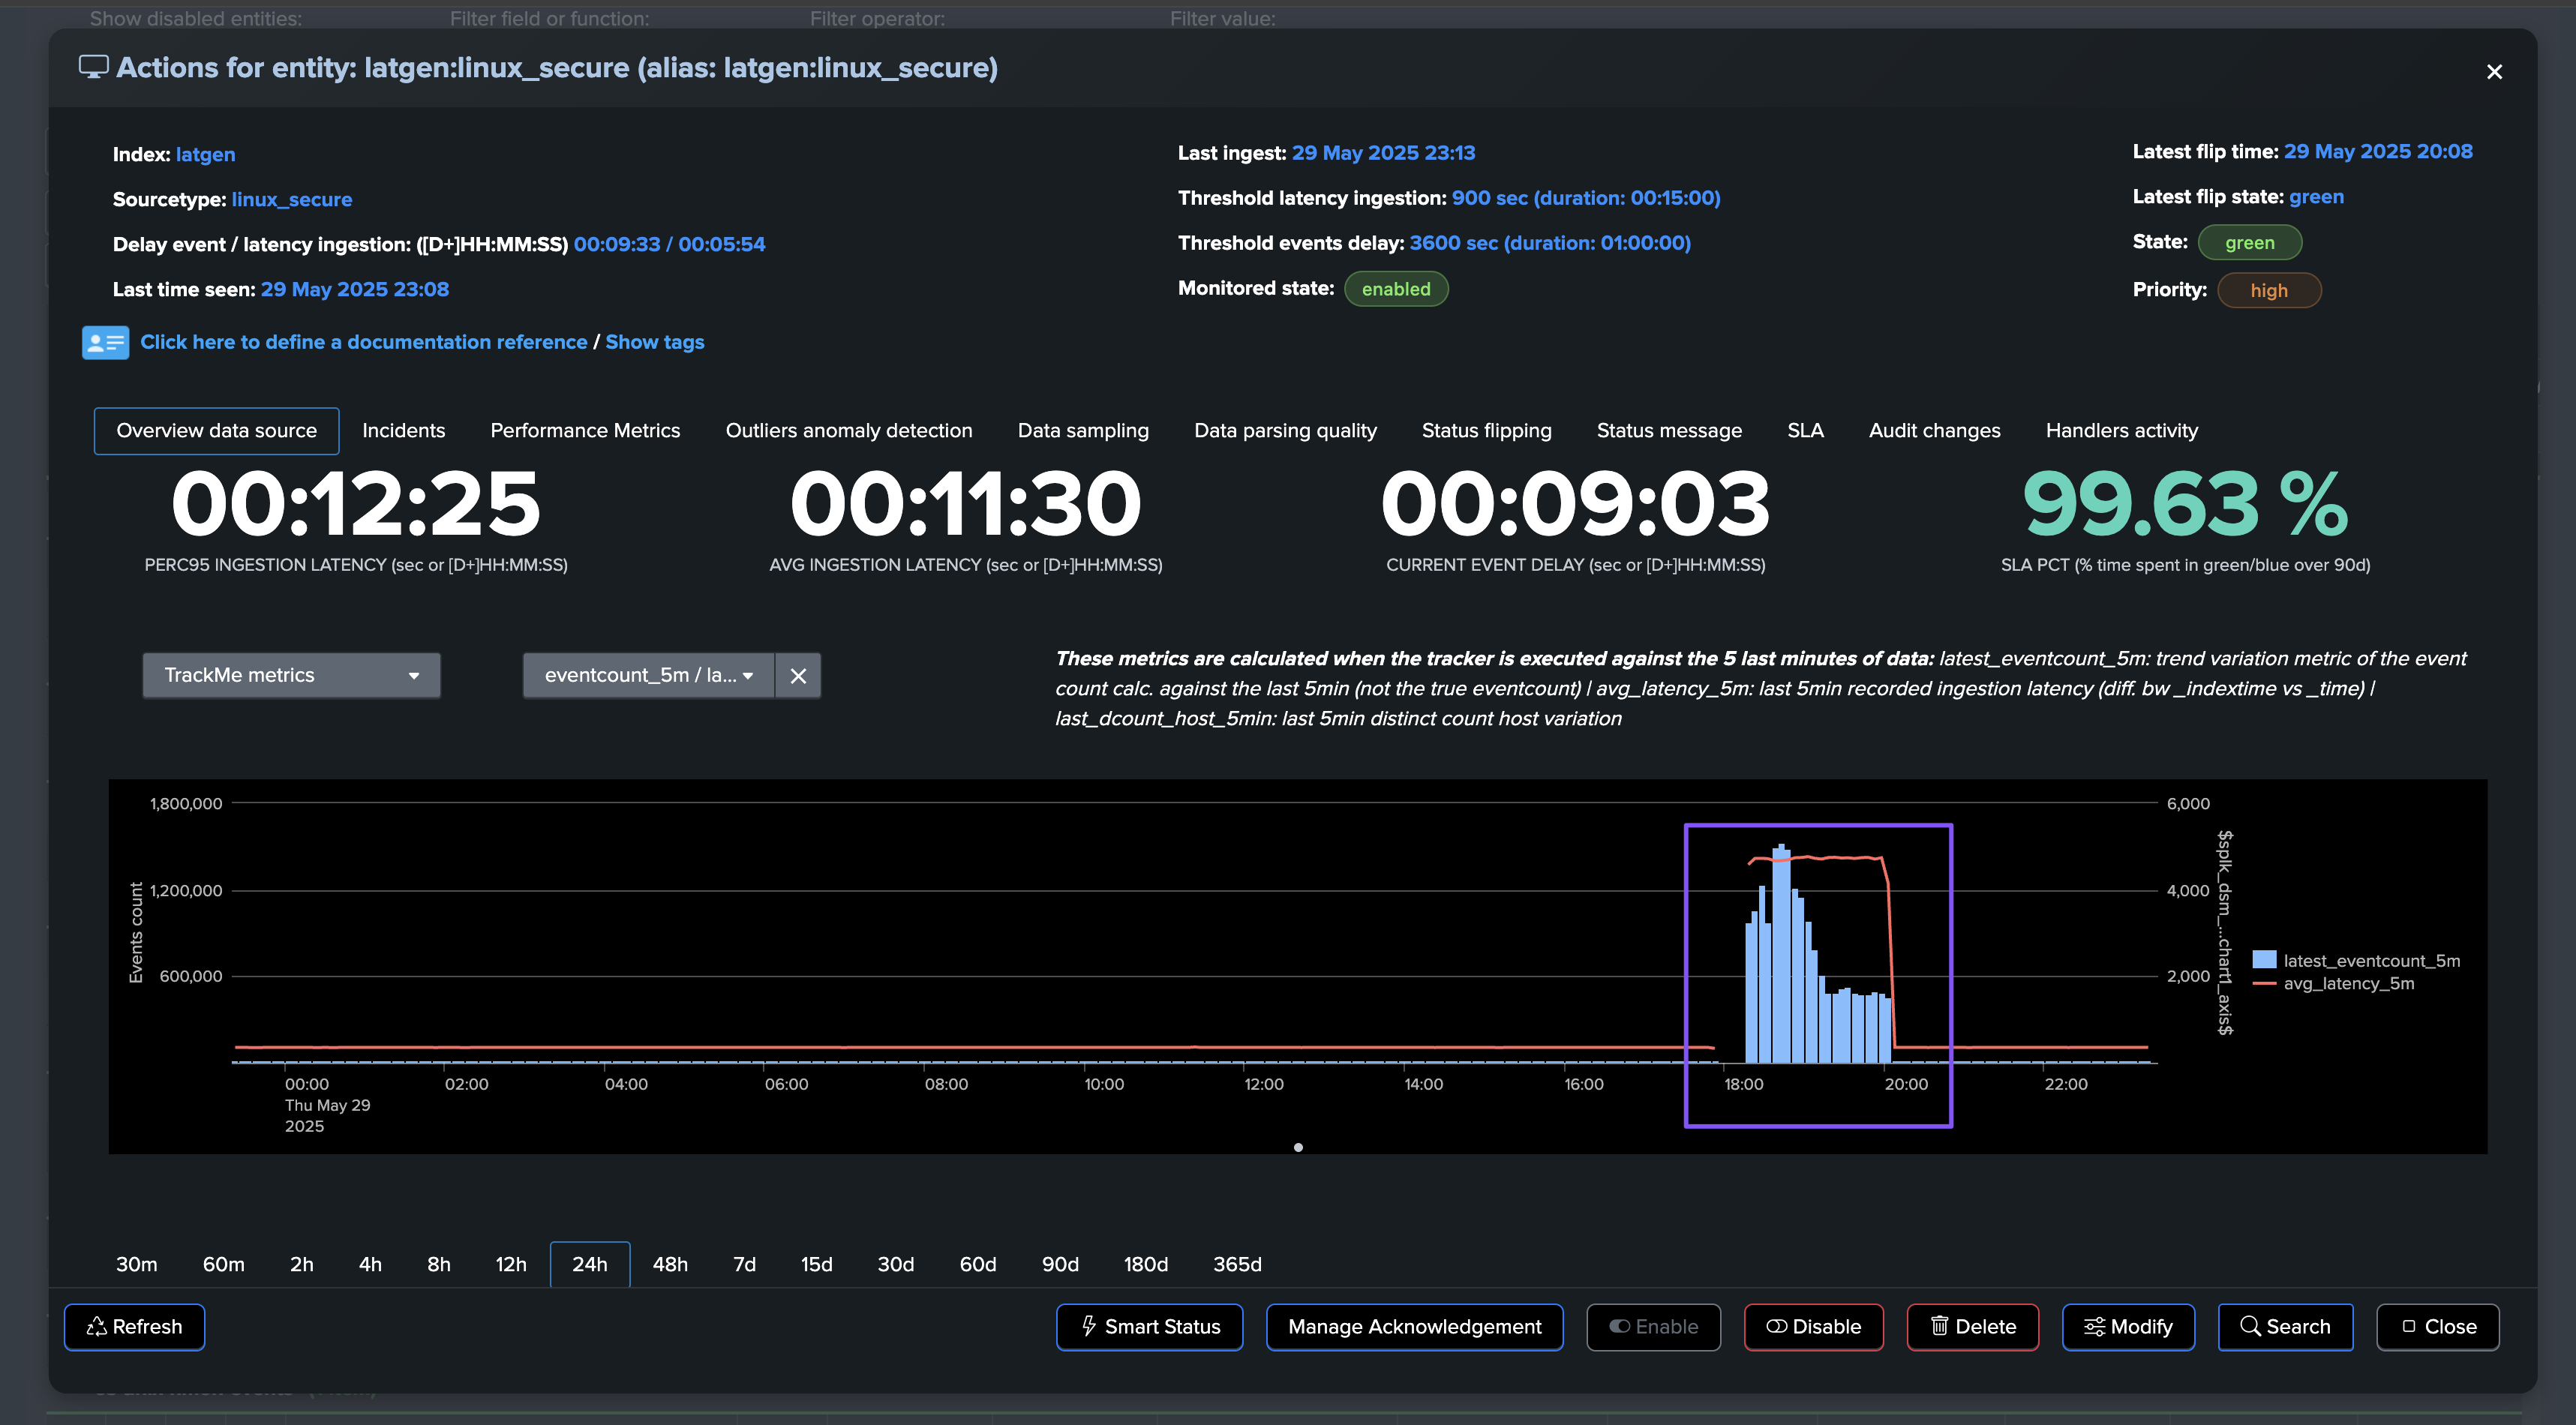
The situation escalates as the entity experiences high latency combined with a dramatic increase in event volume:
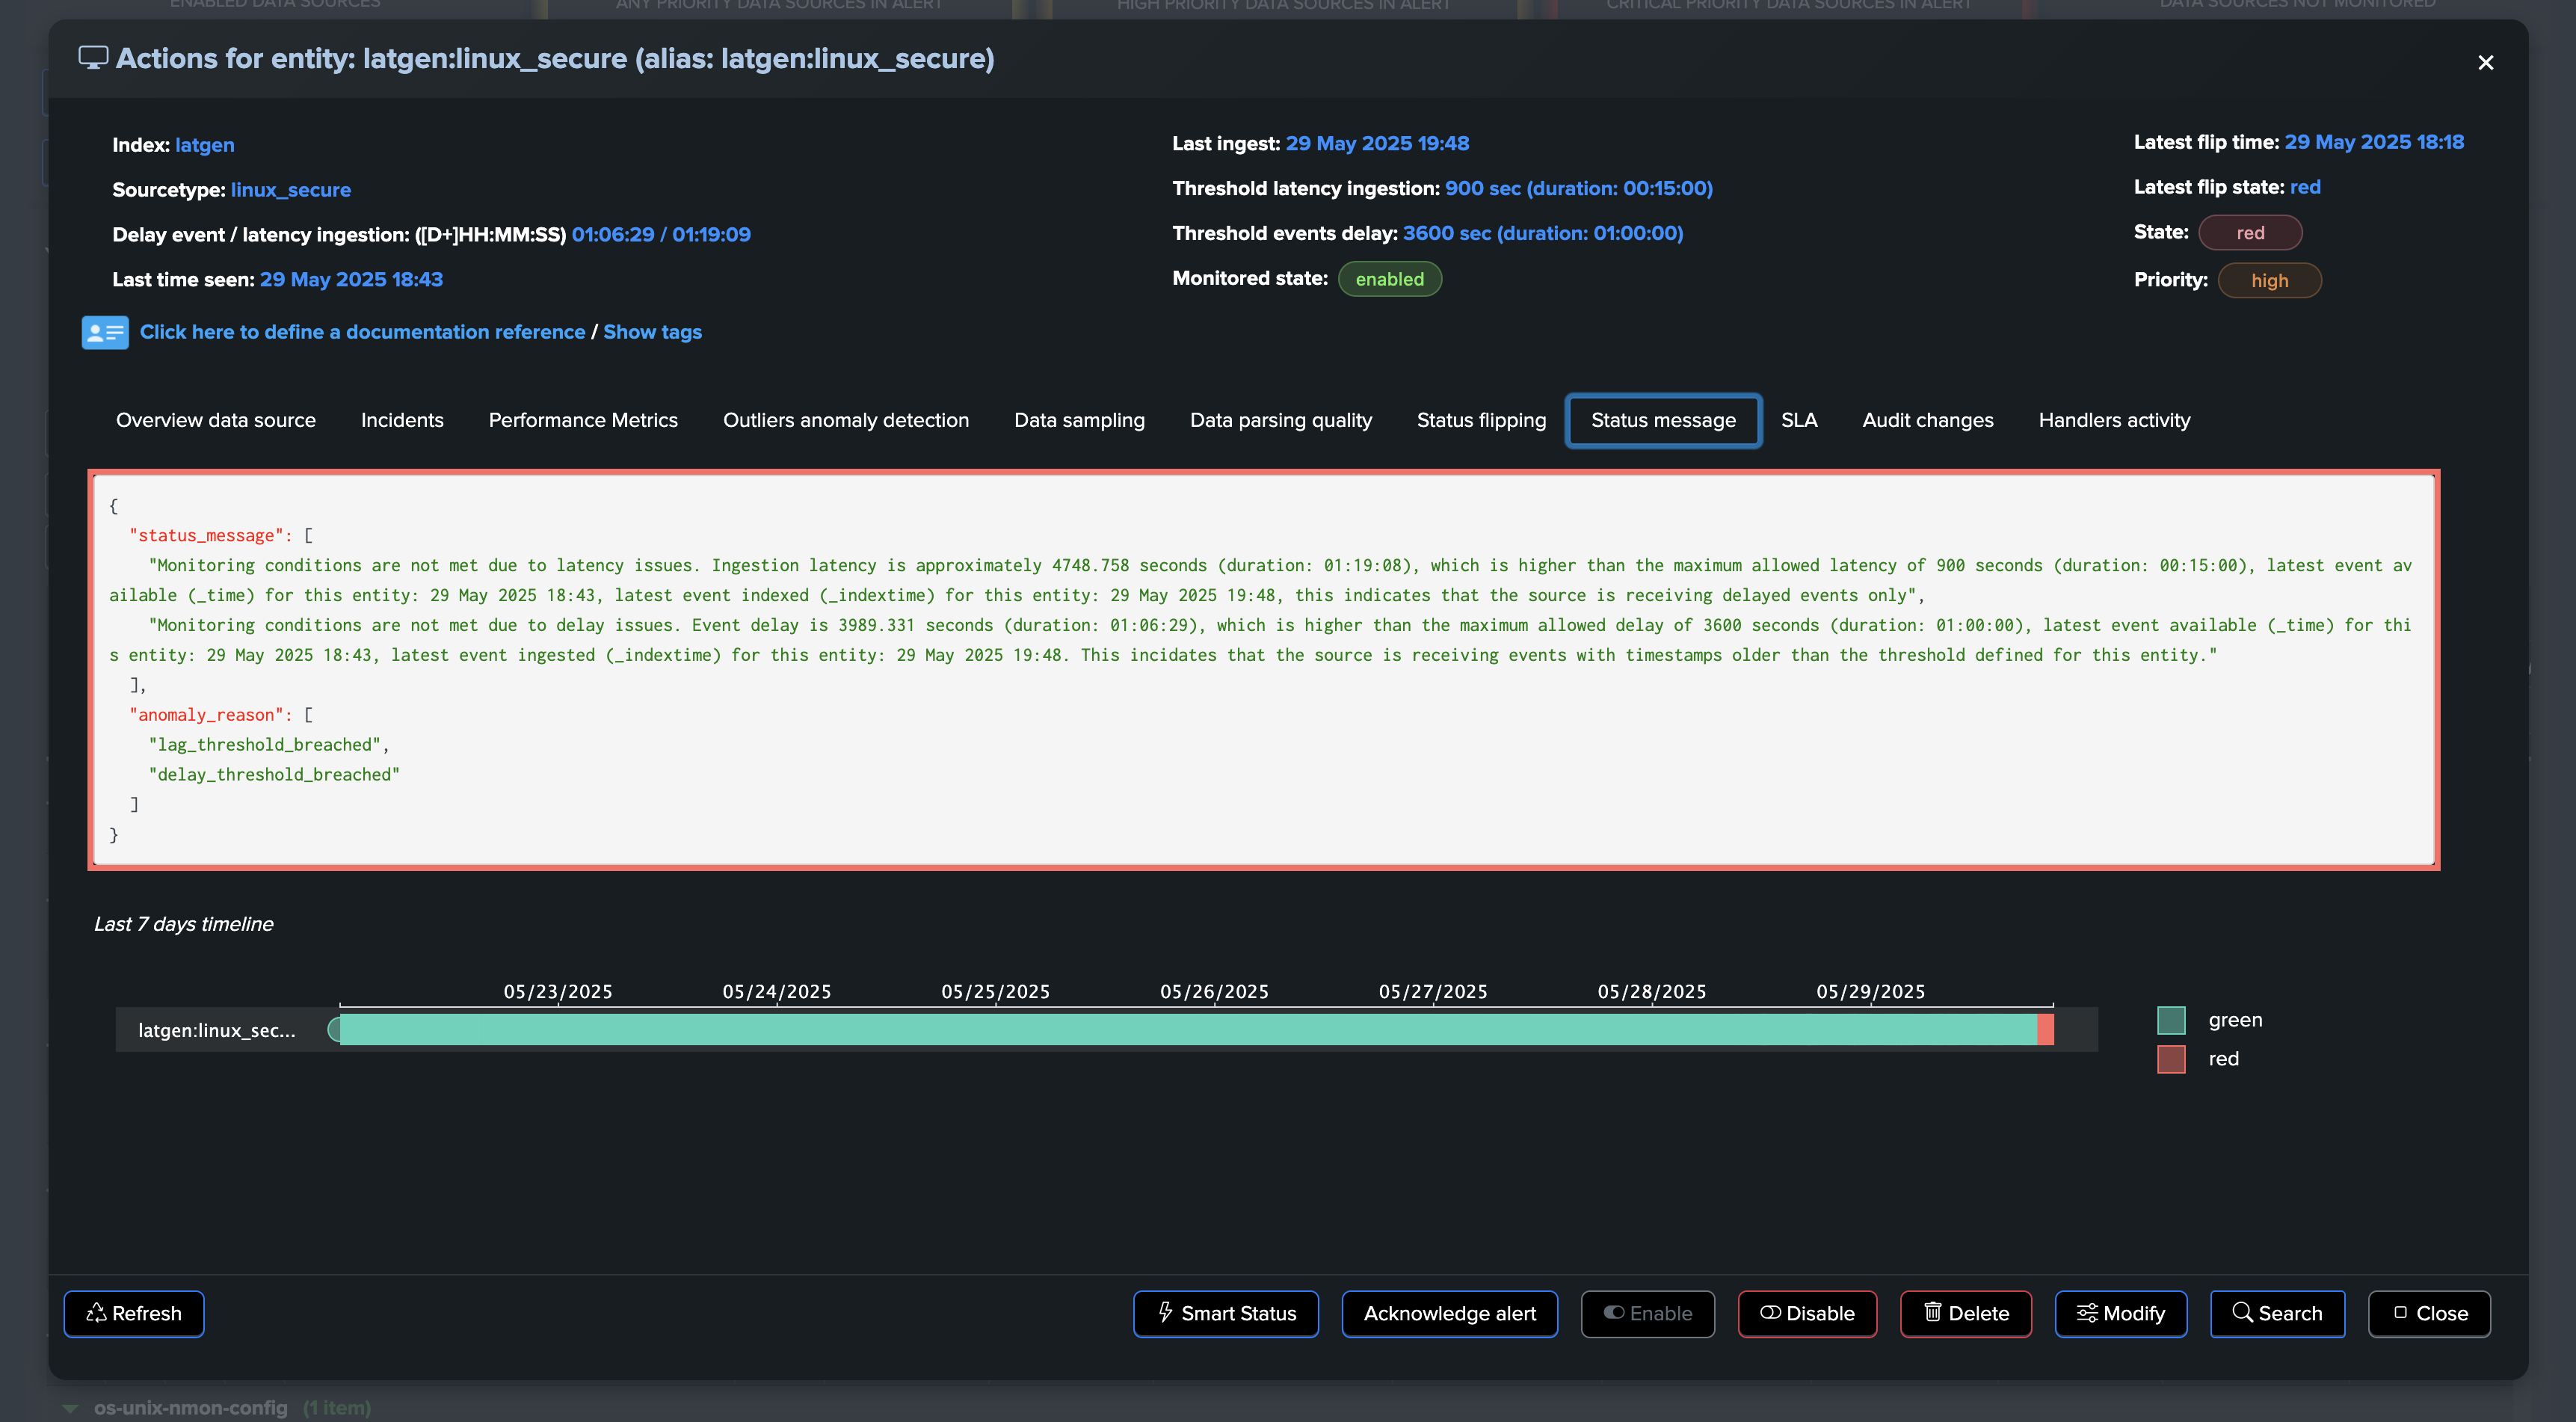
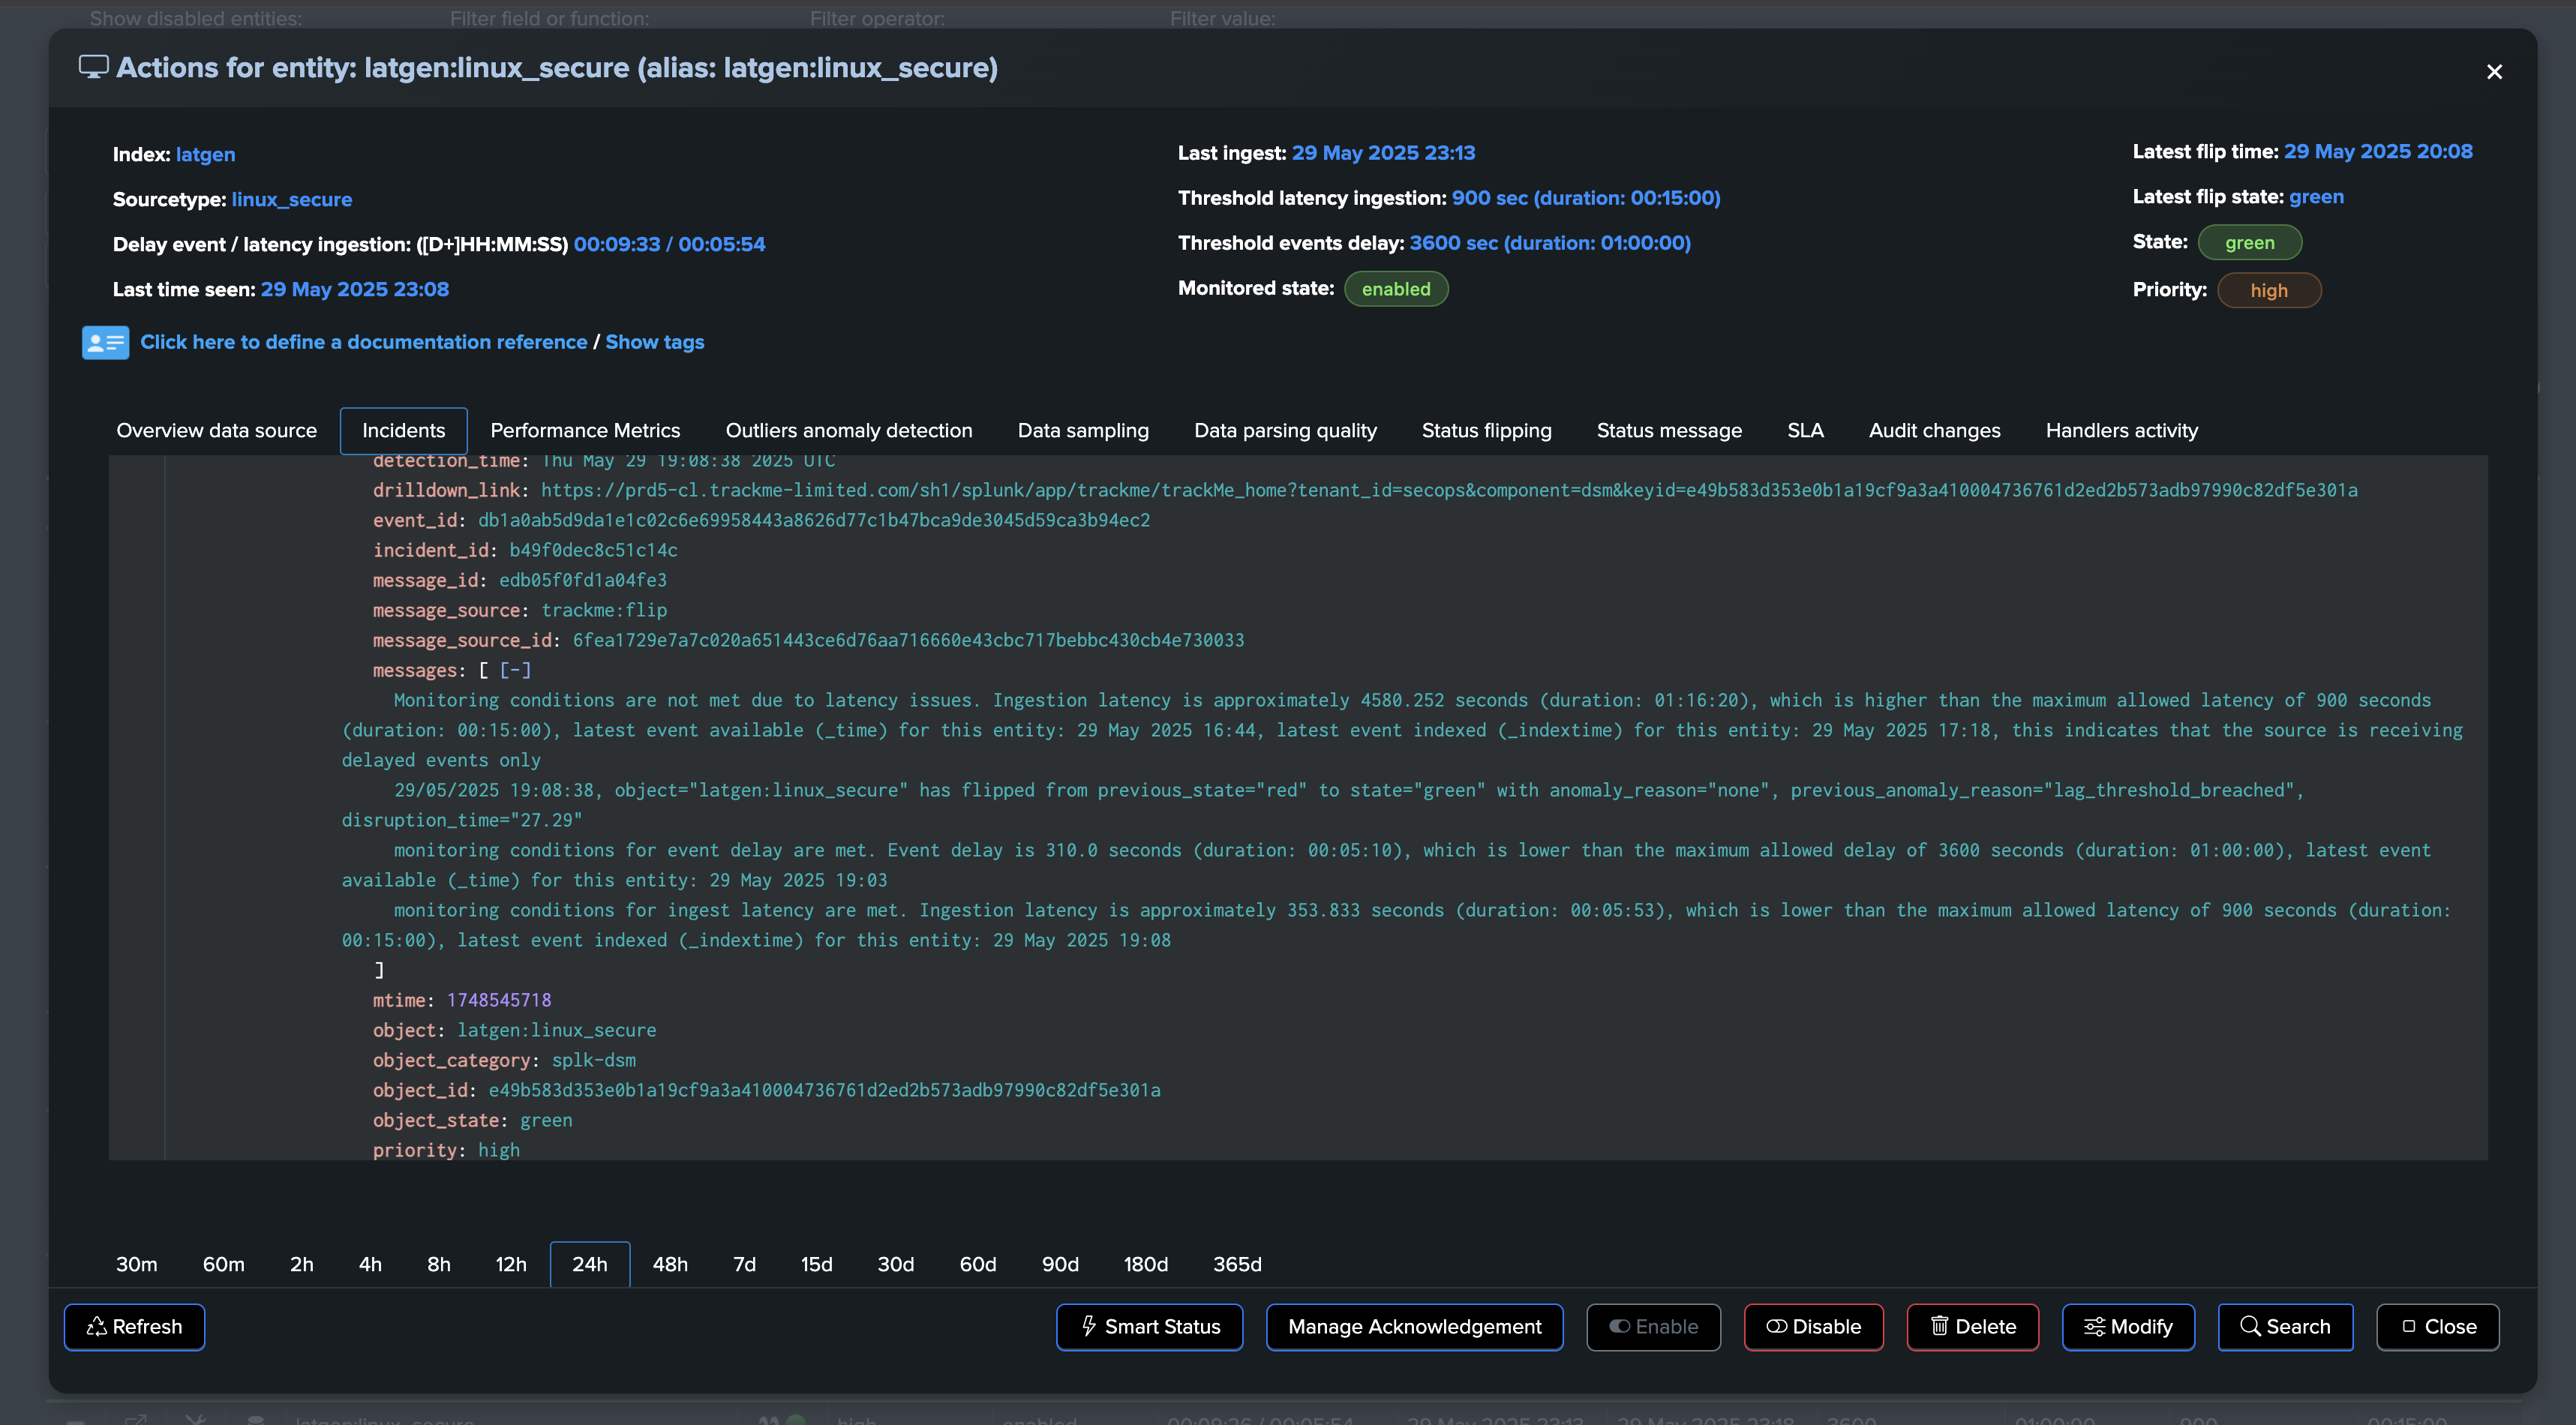
TrackMe immediately responds by opening an incident and sending a notification:
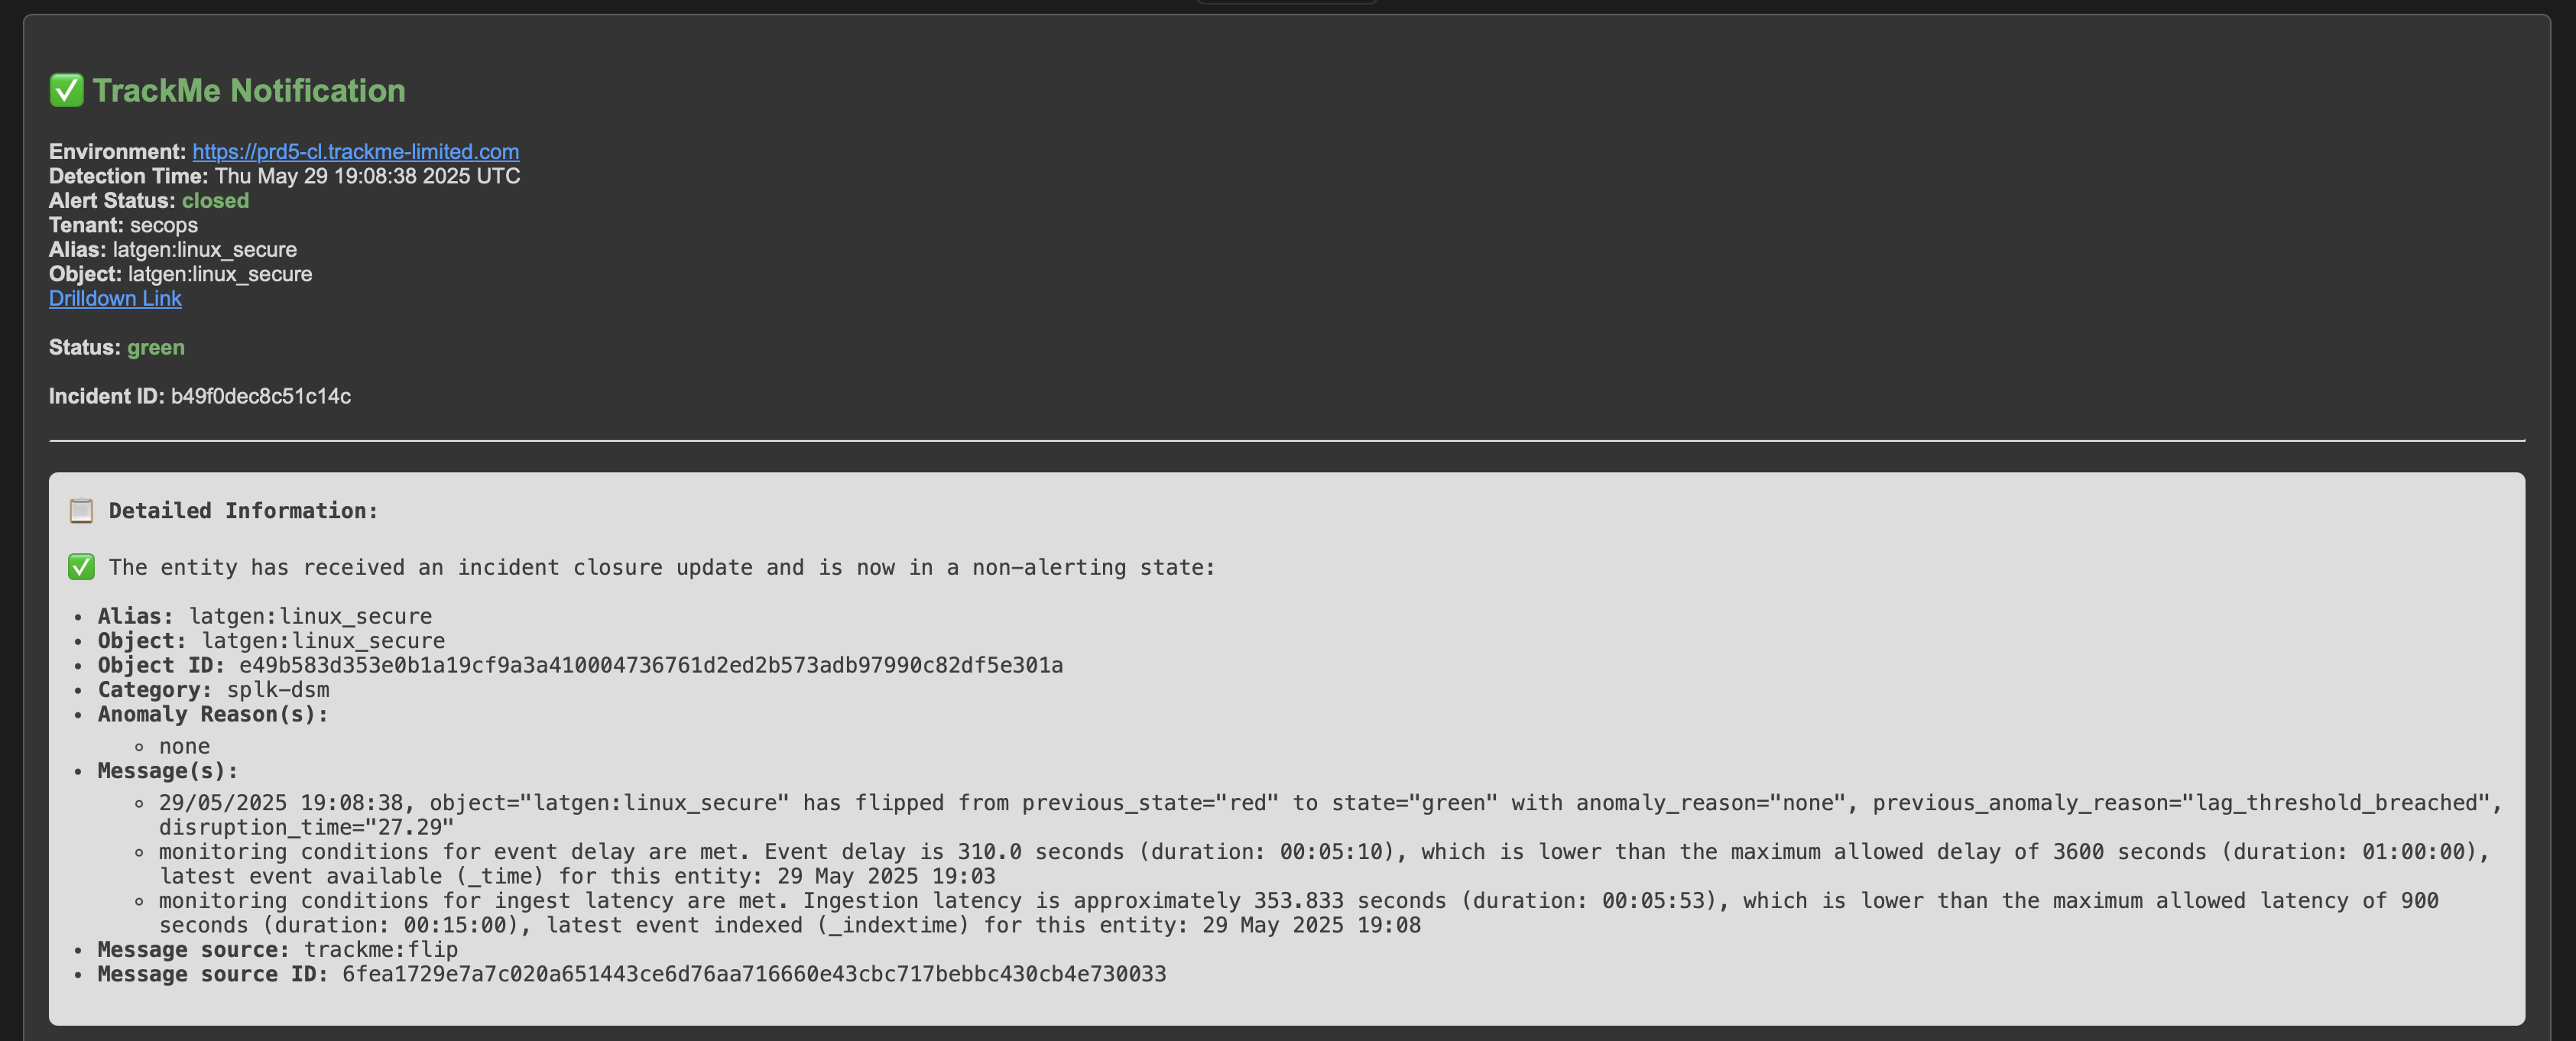
After the issue is resolved, the entity returns to a healthy state and the incident is automatically closed:
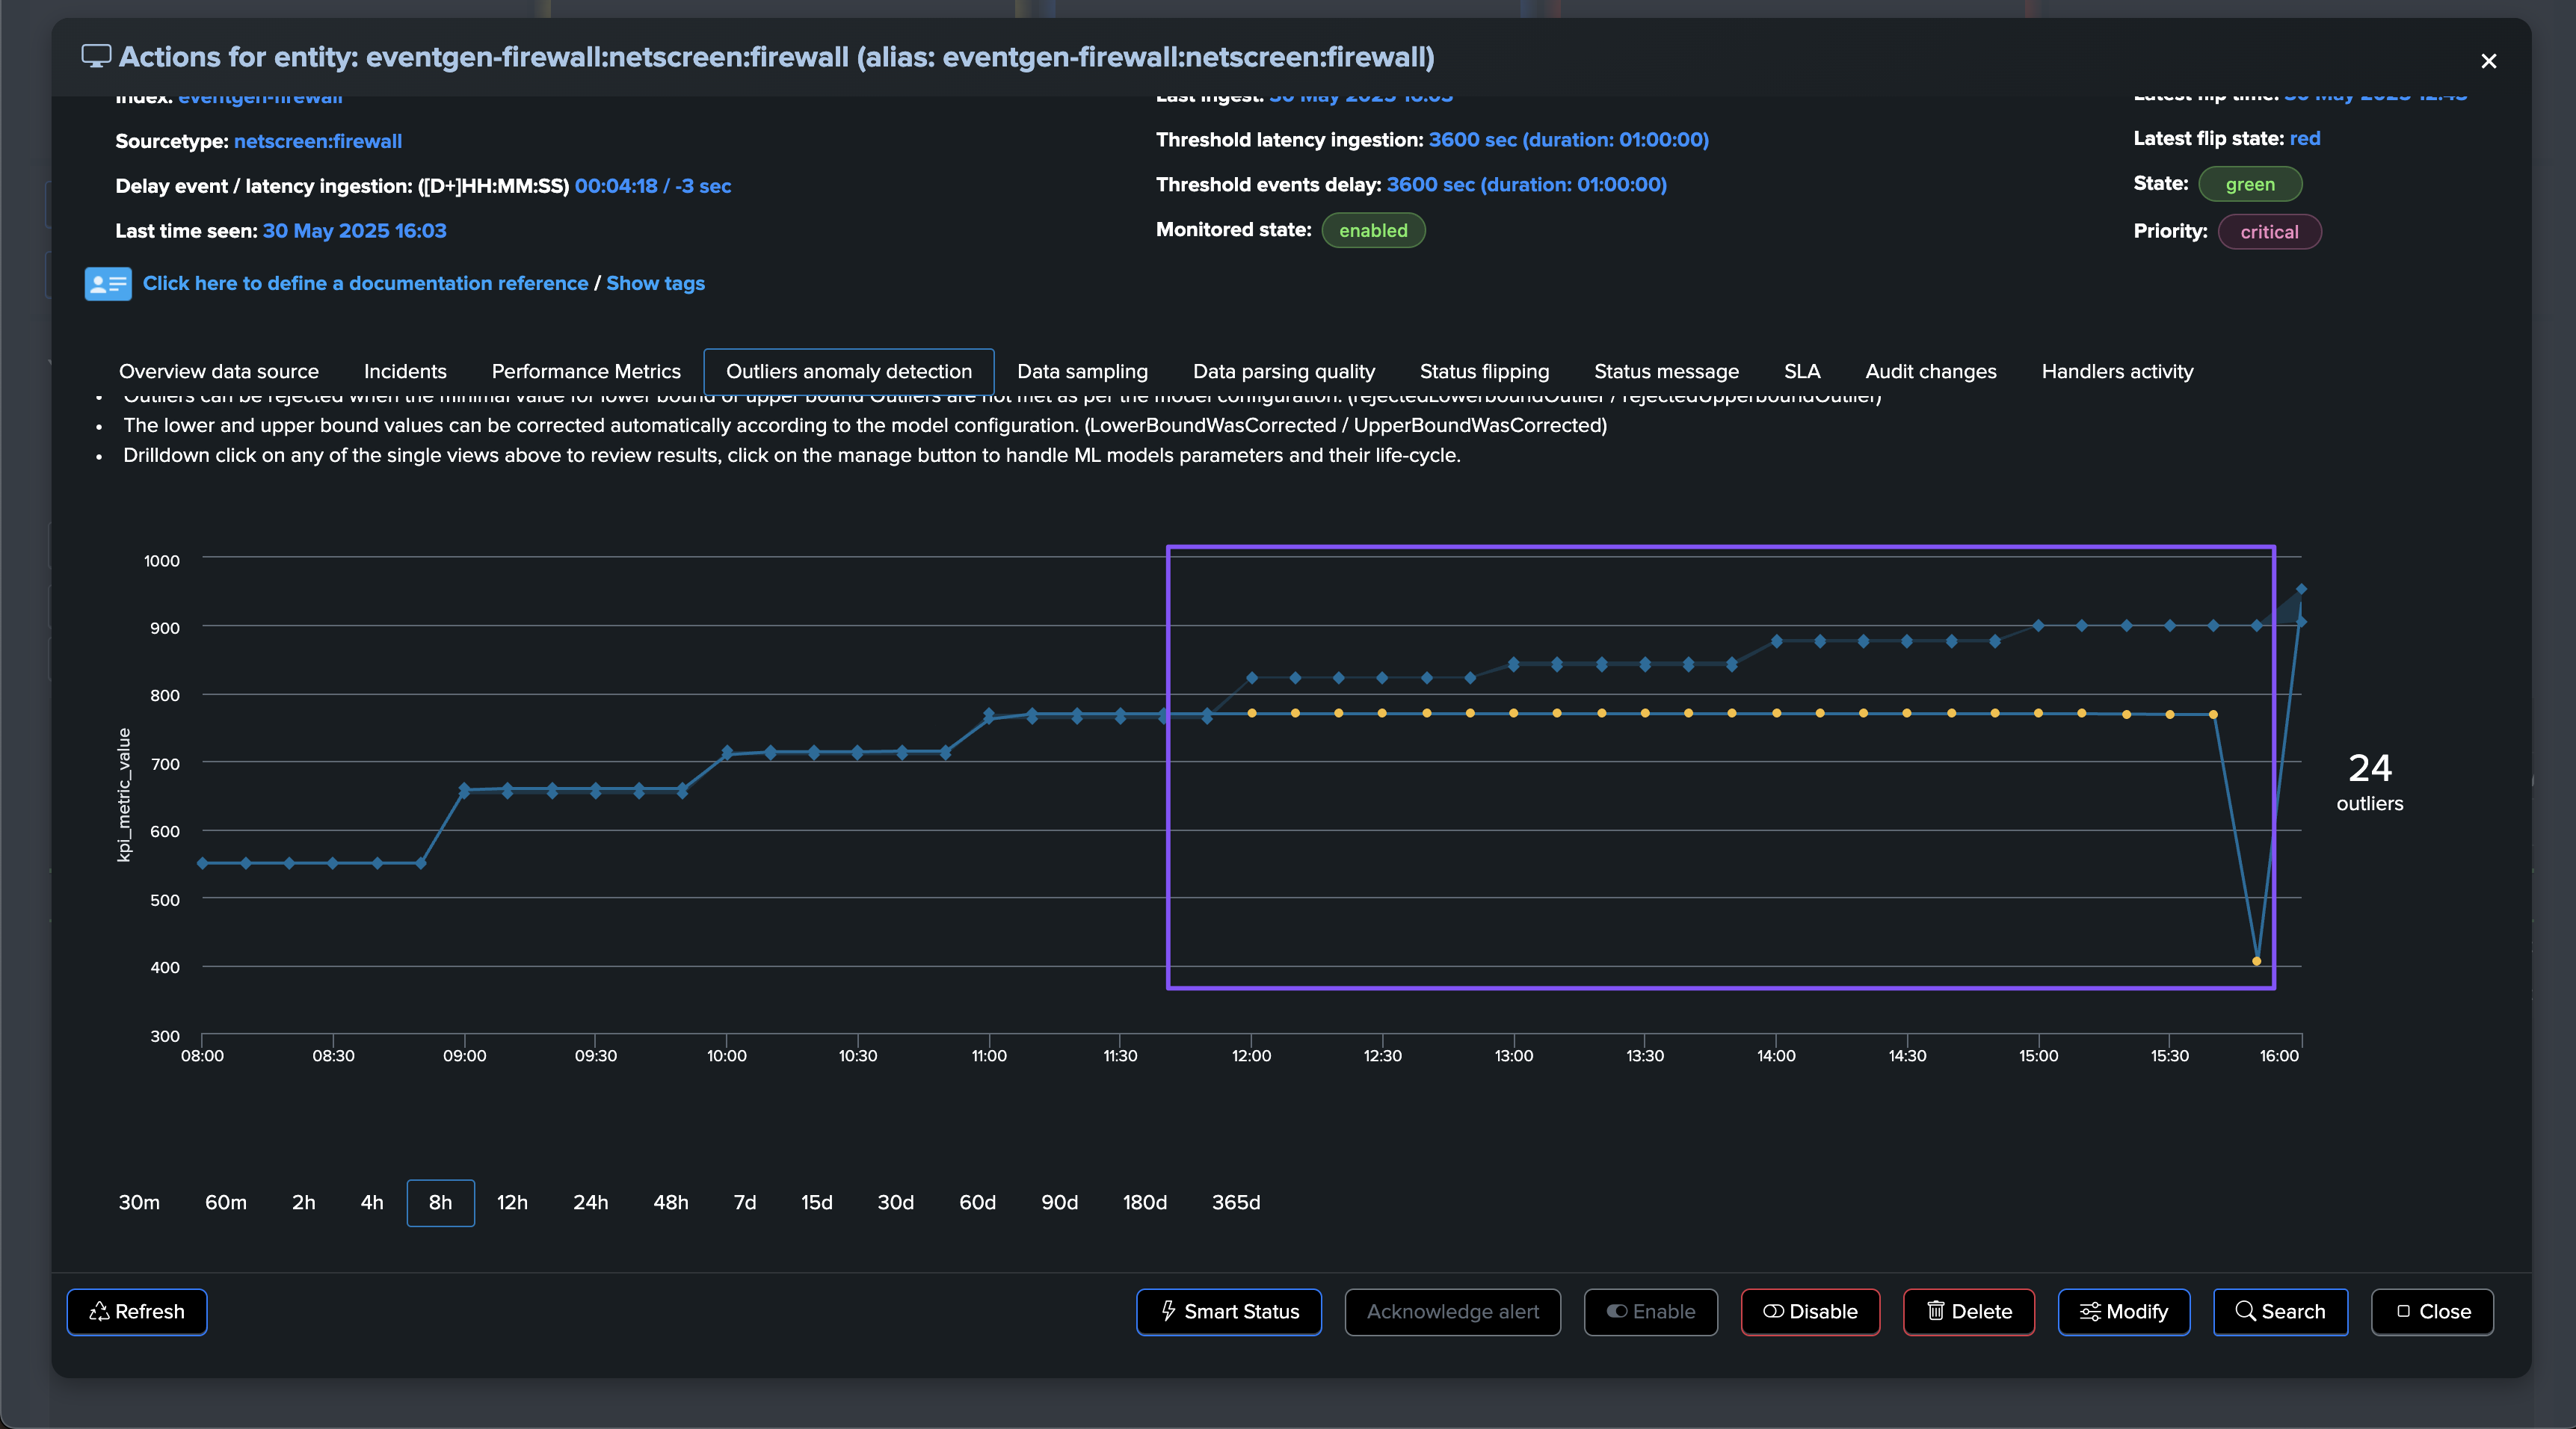
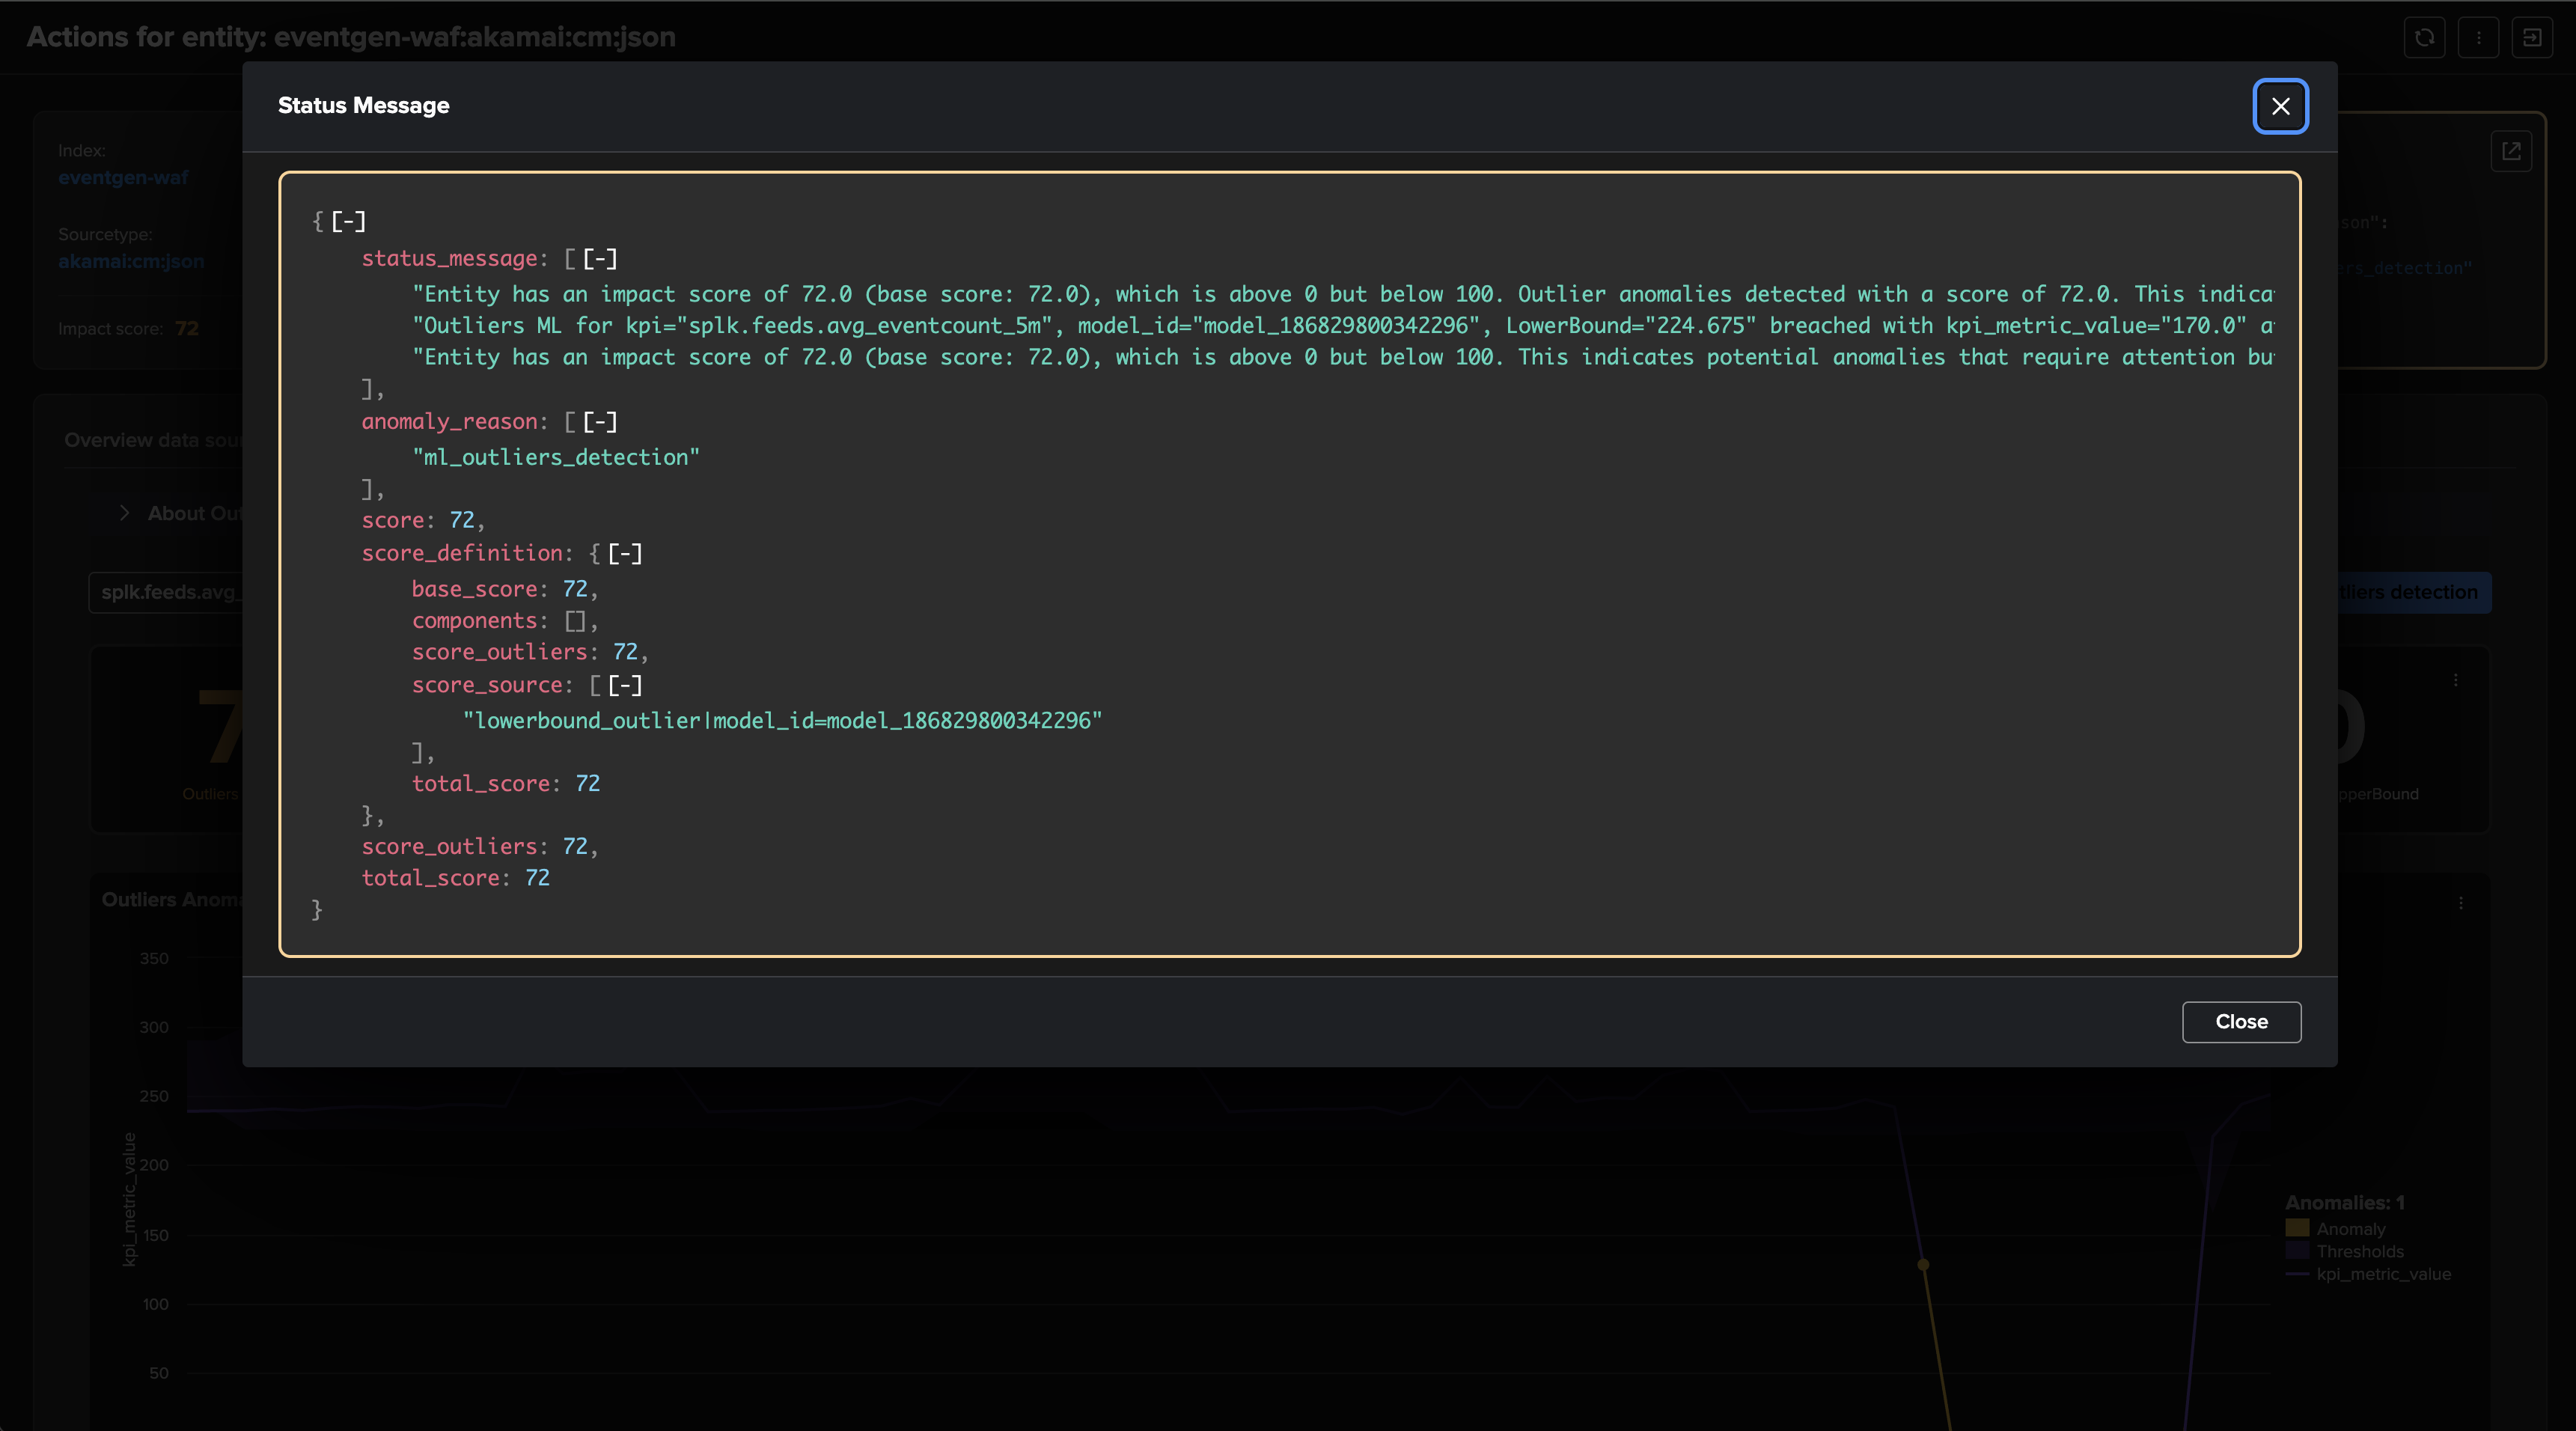
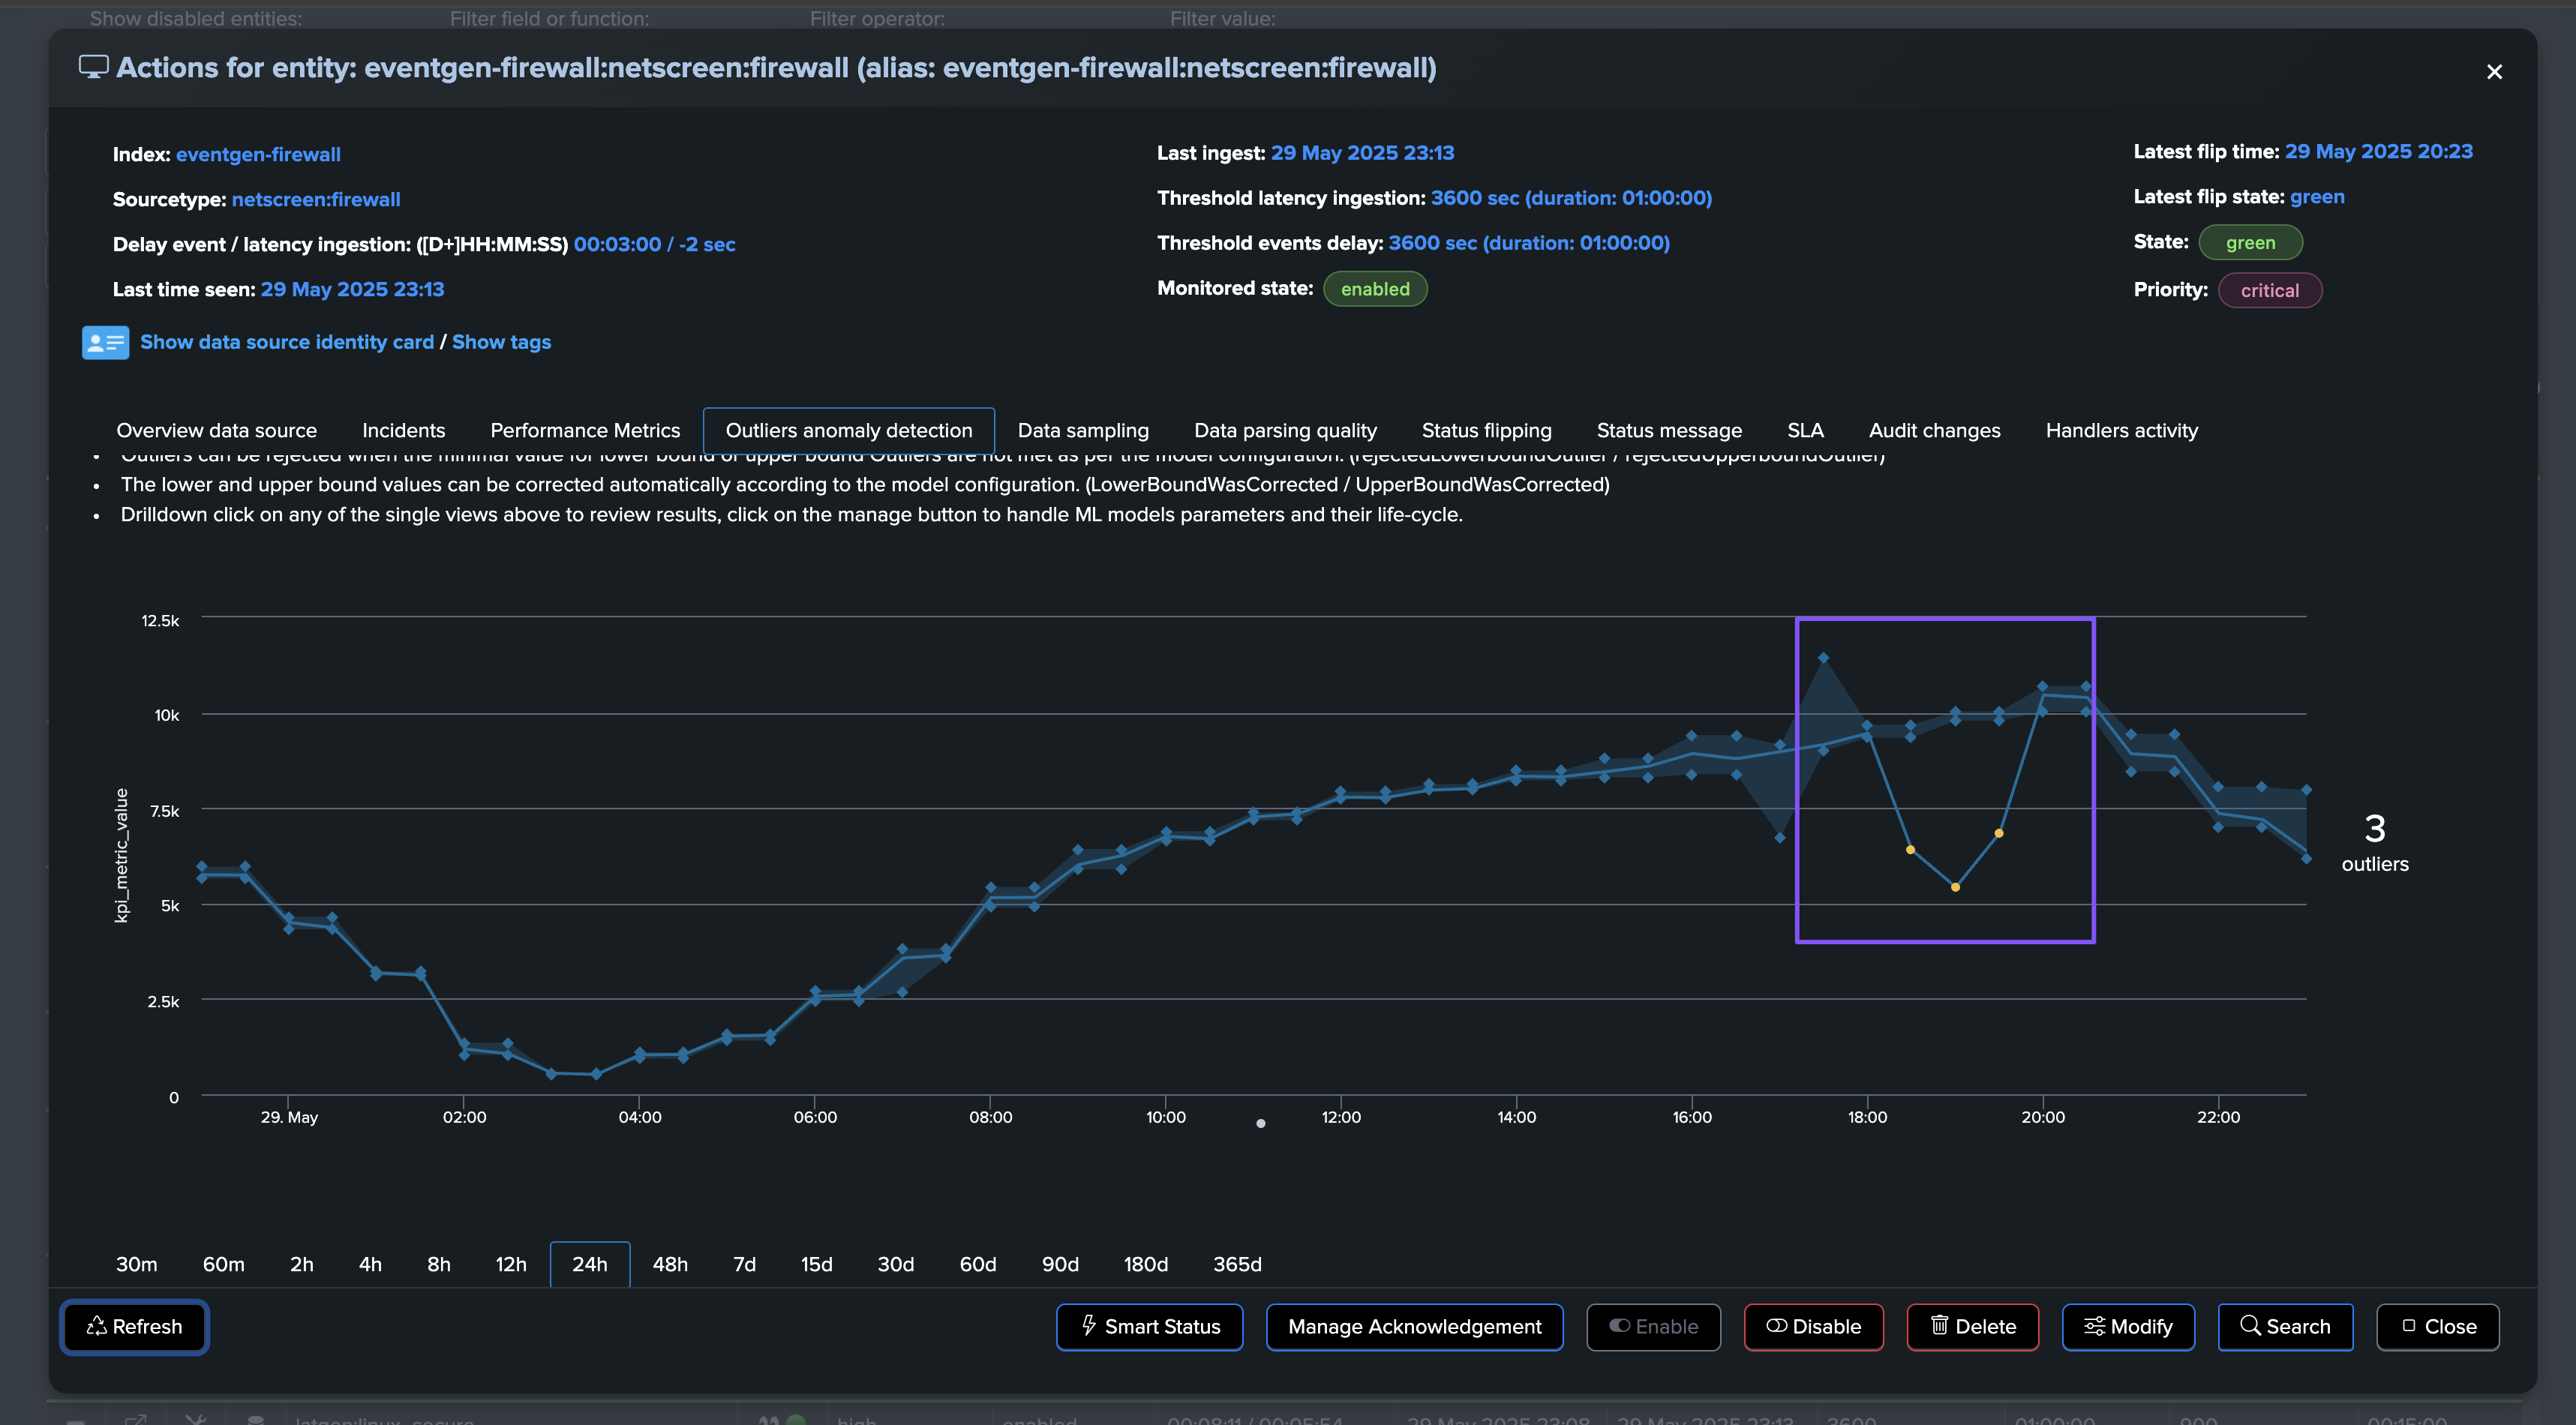
Use Case: Abnormally Low Volume Trend Detection (Outliers Detection)
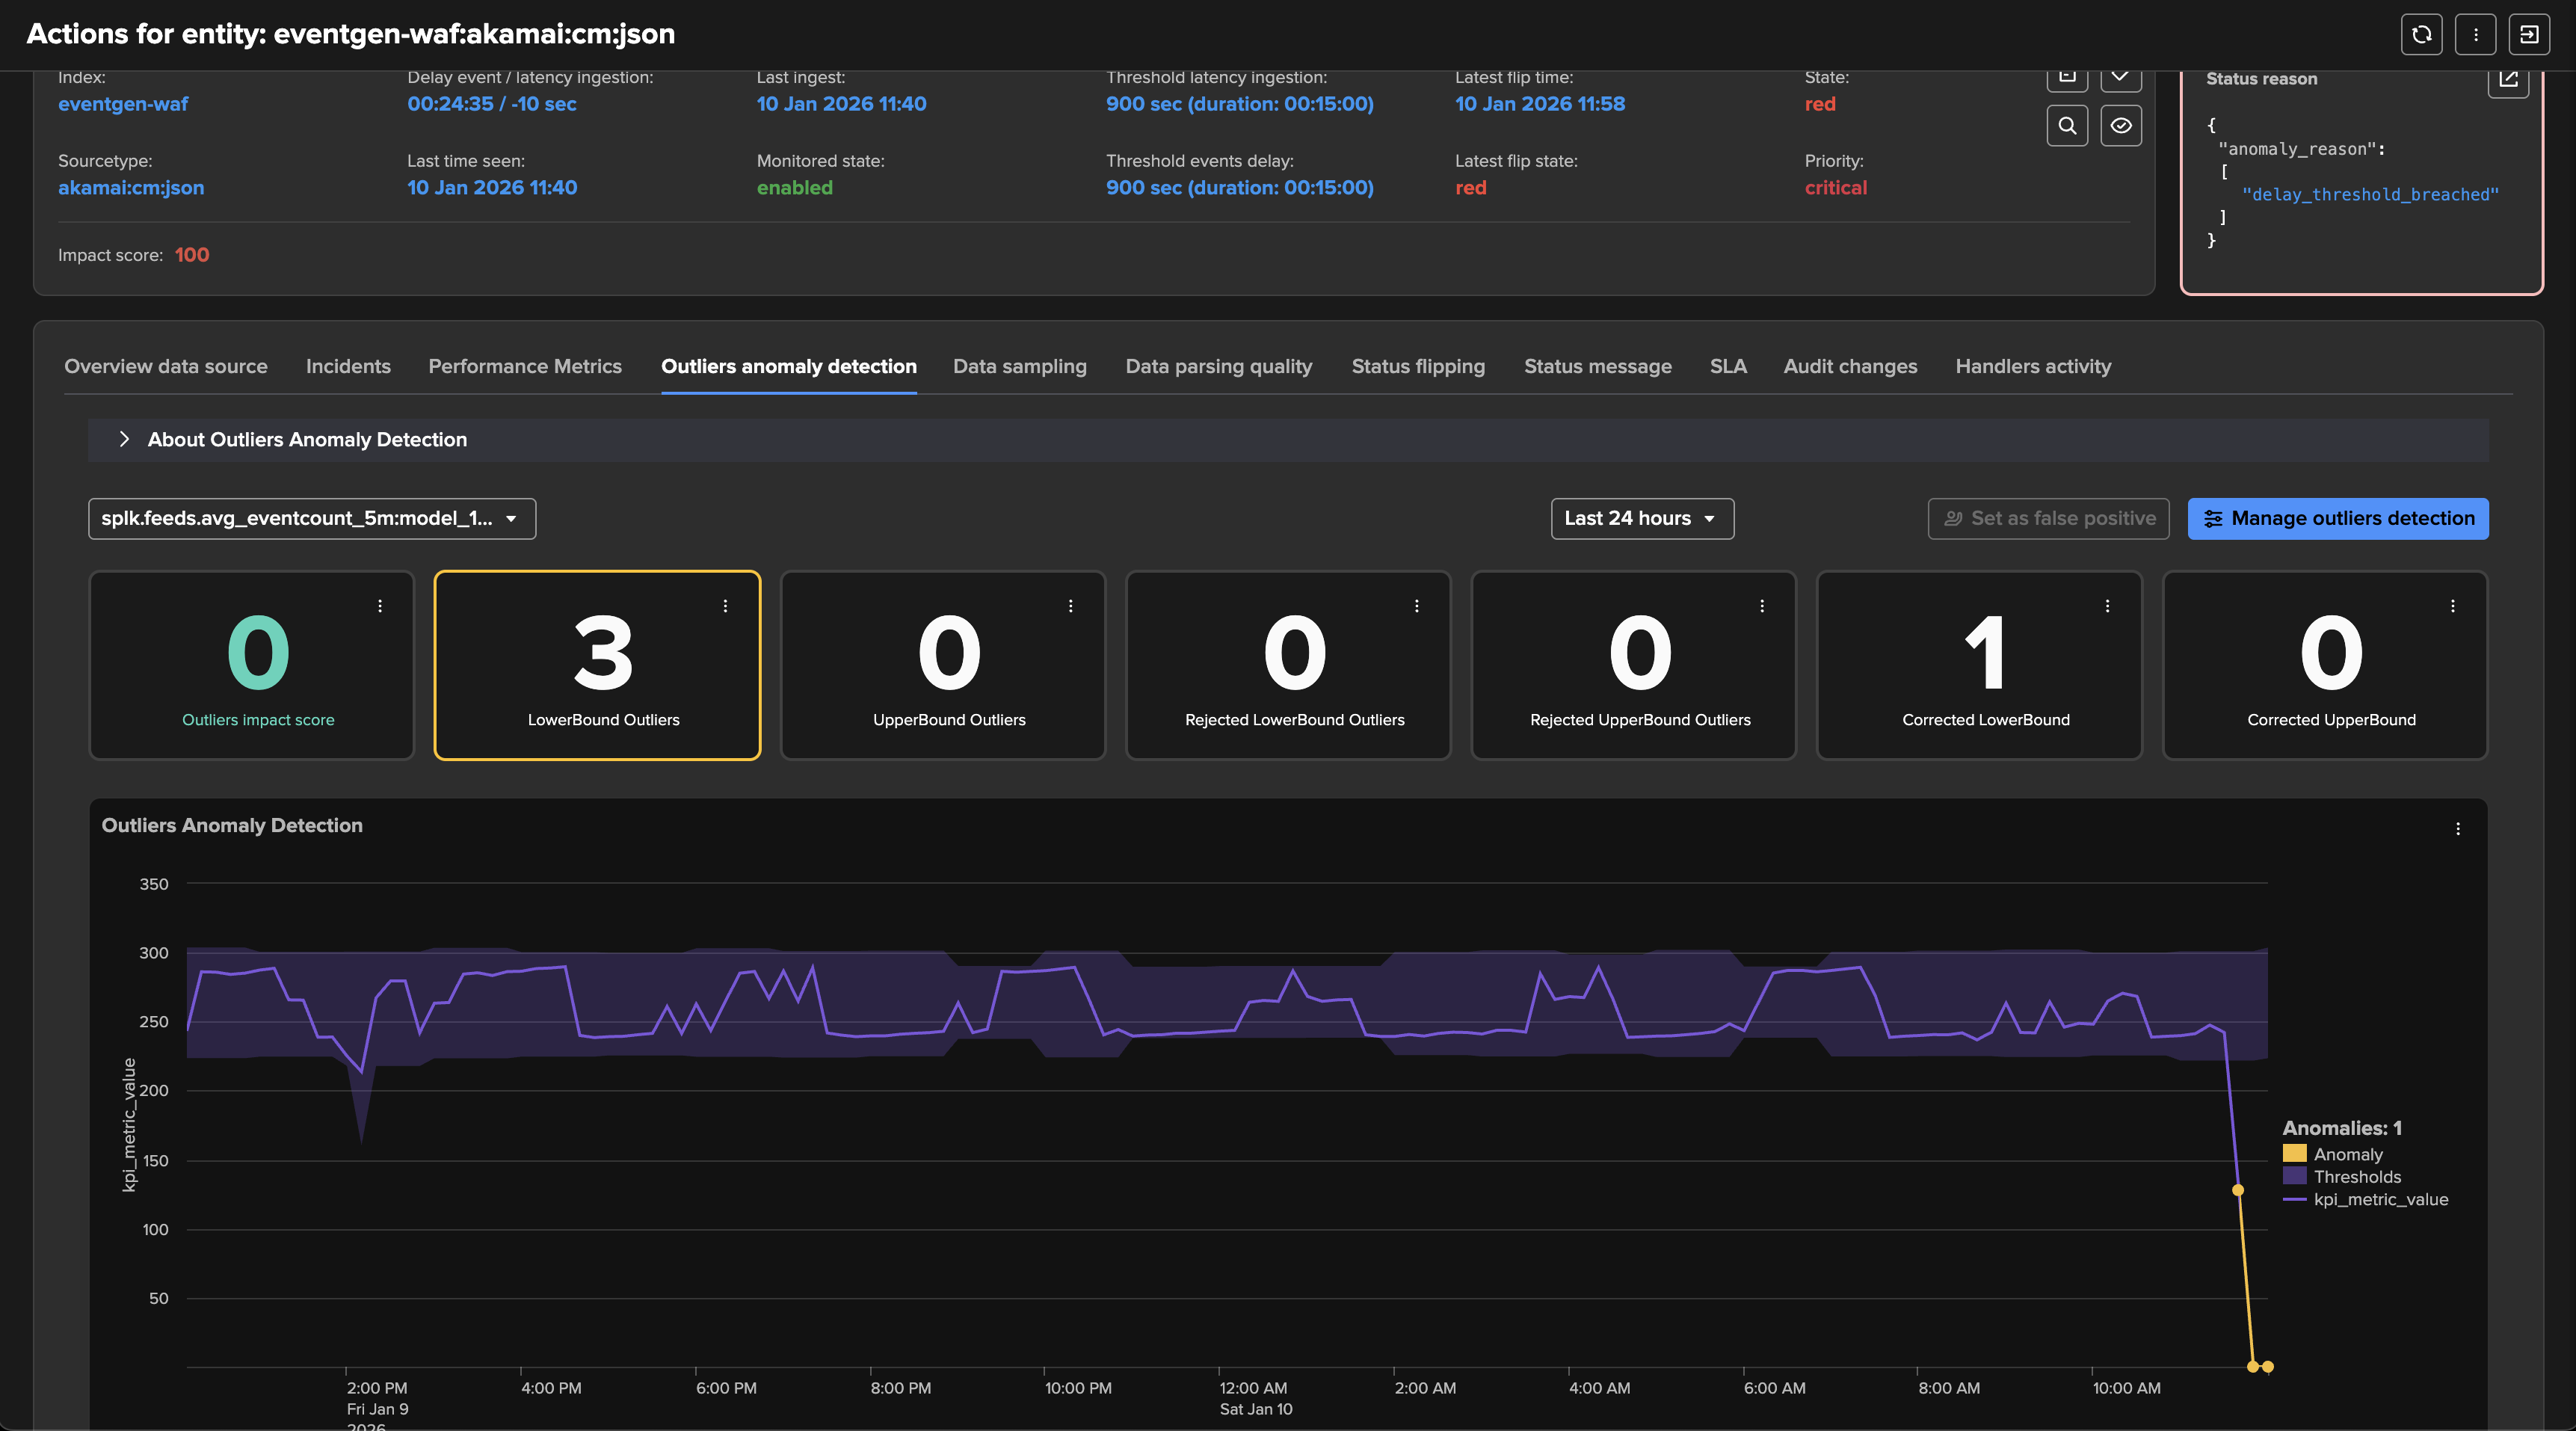
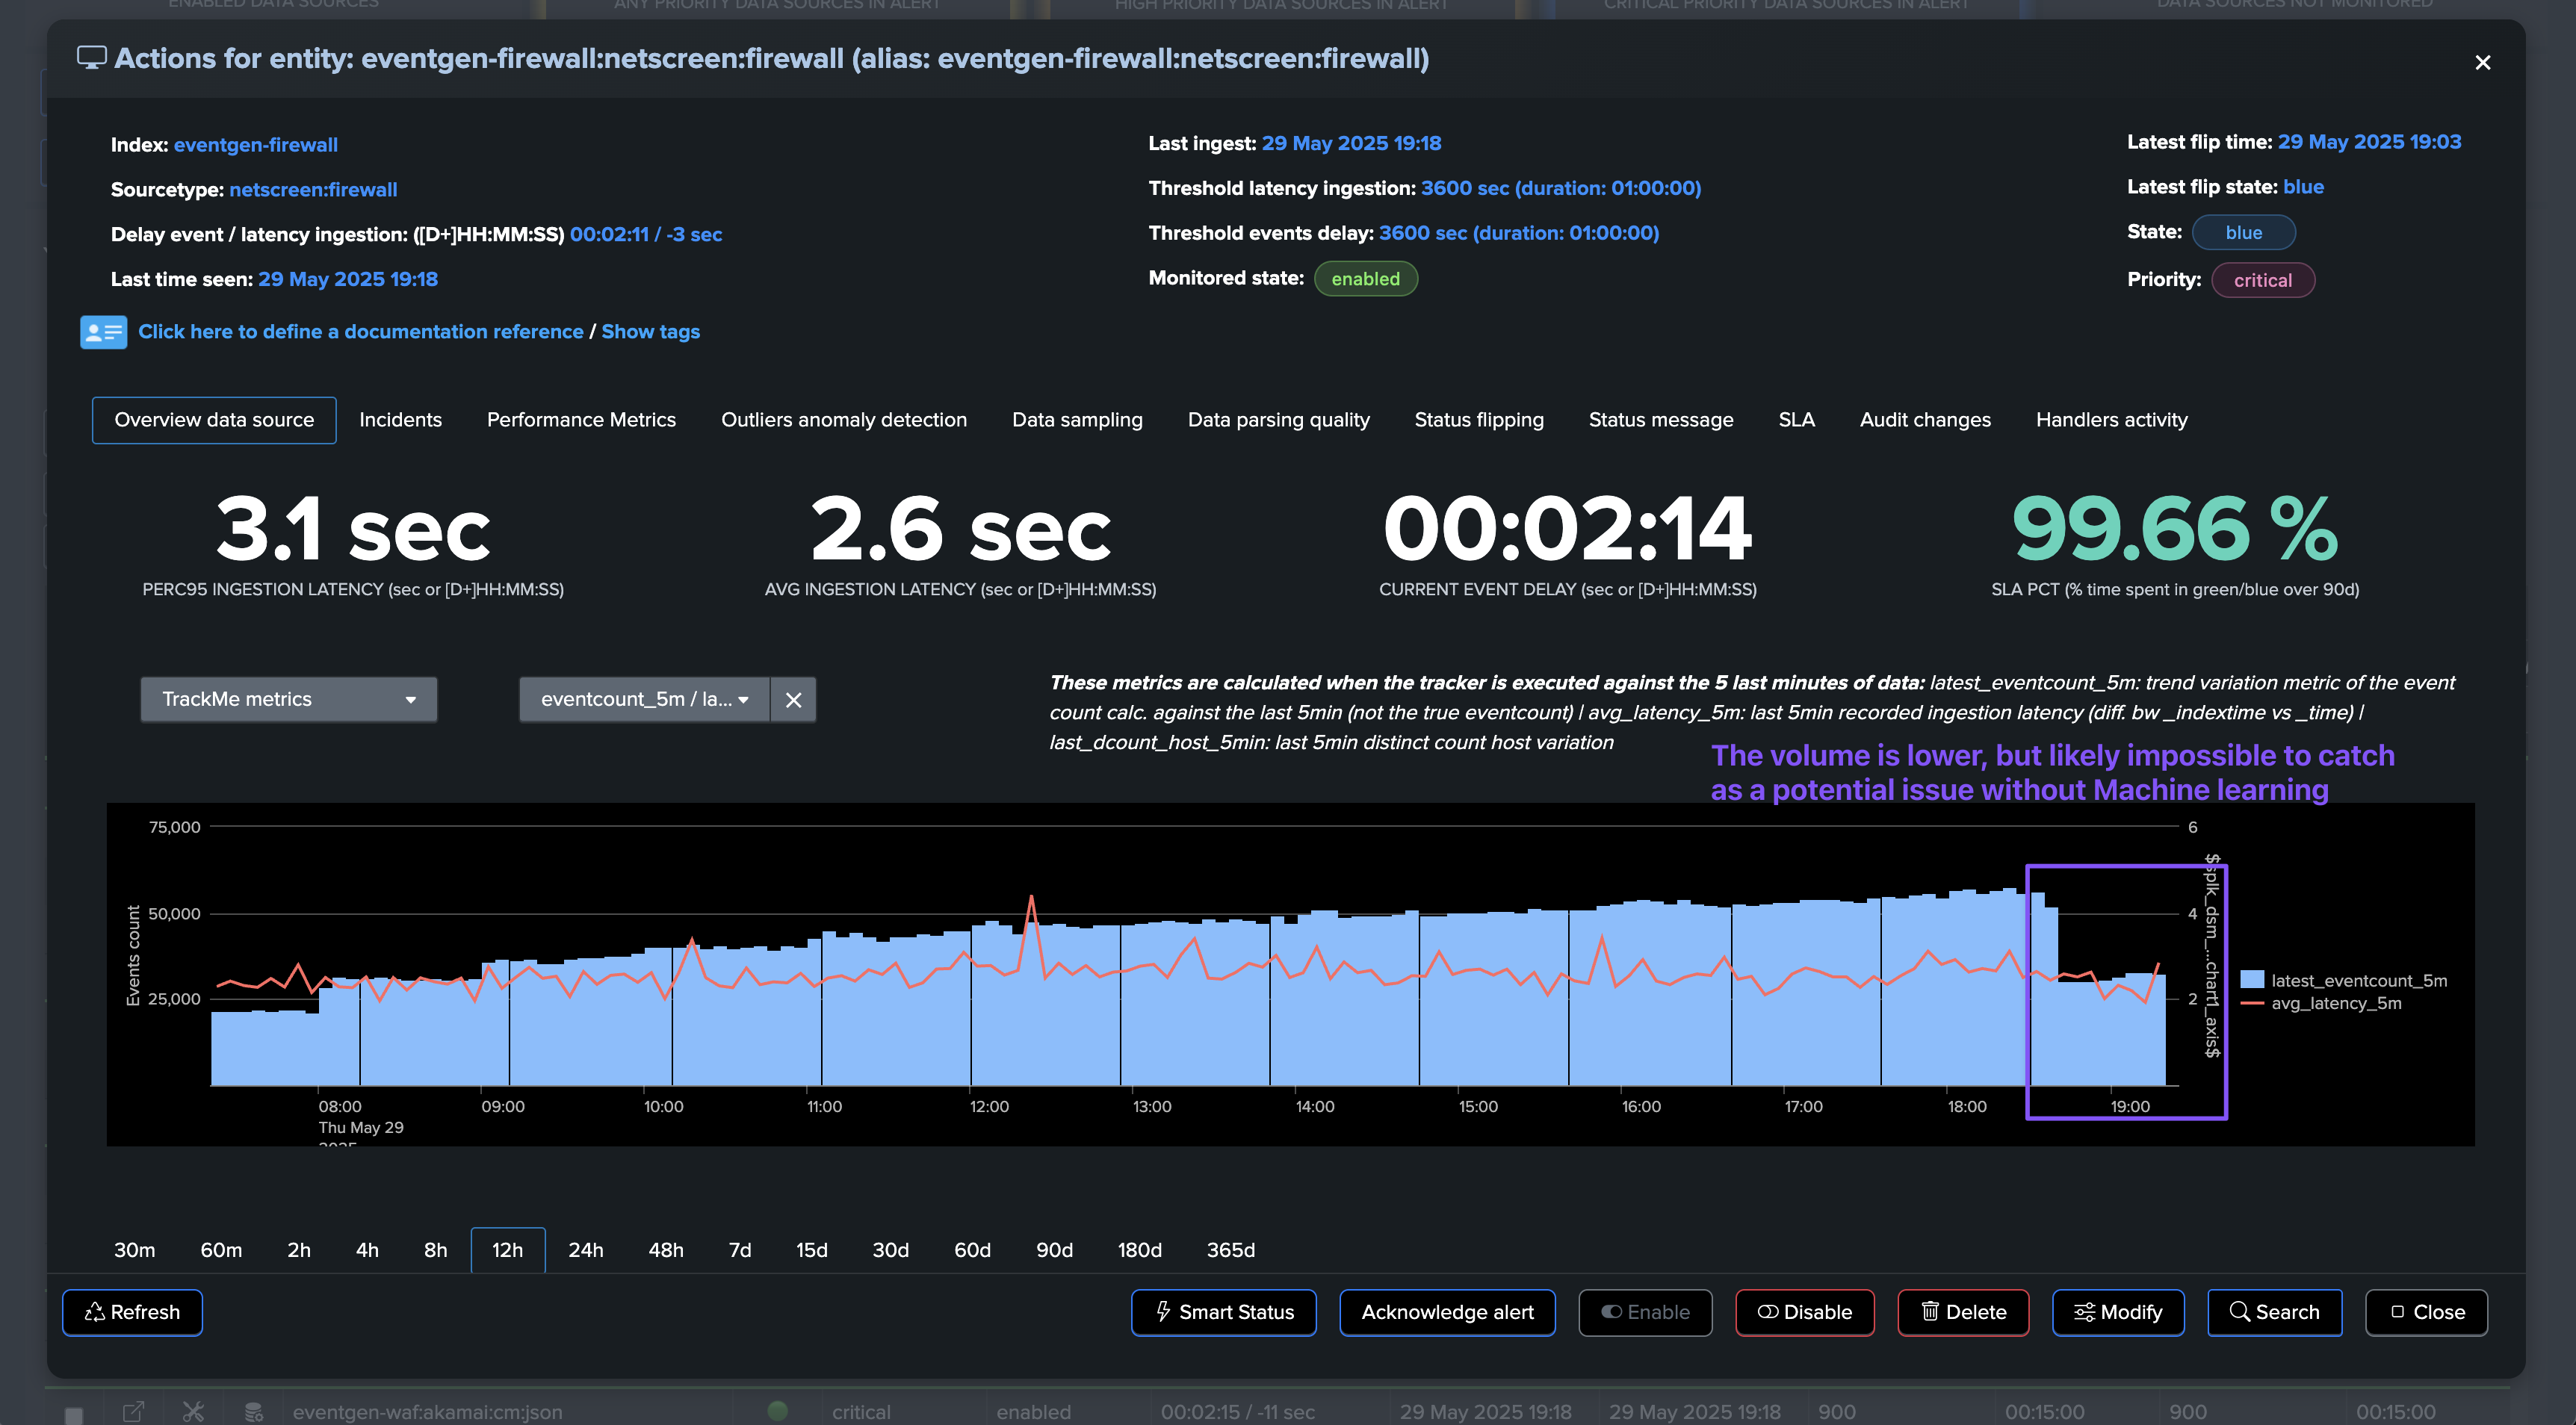
In the following example, our entity is healthy, we have data making it, not suffering from latency, and the volume is stable and expected:
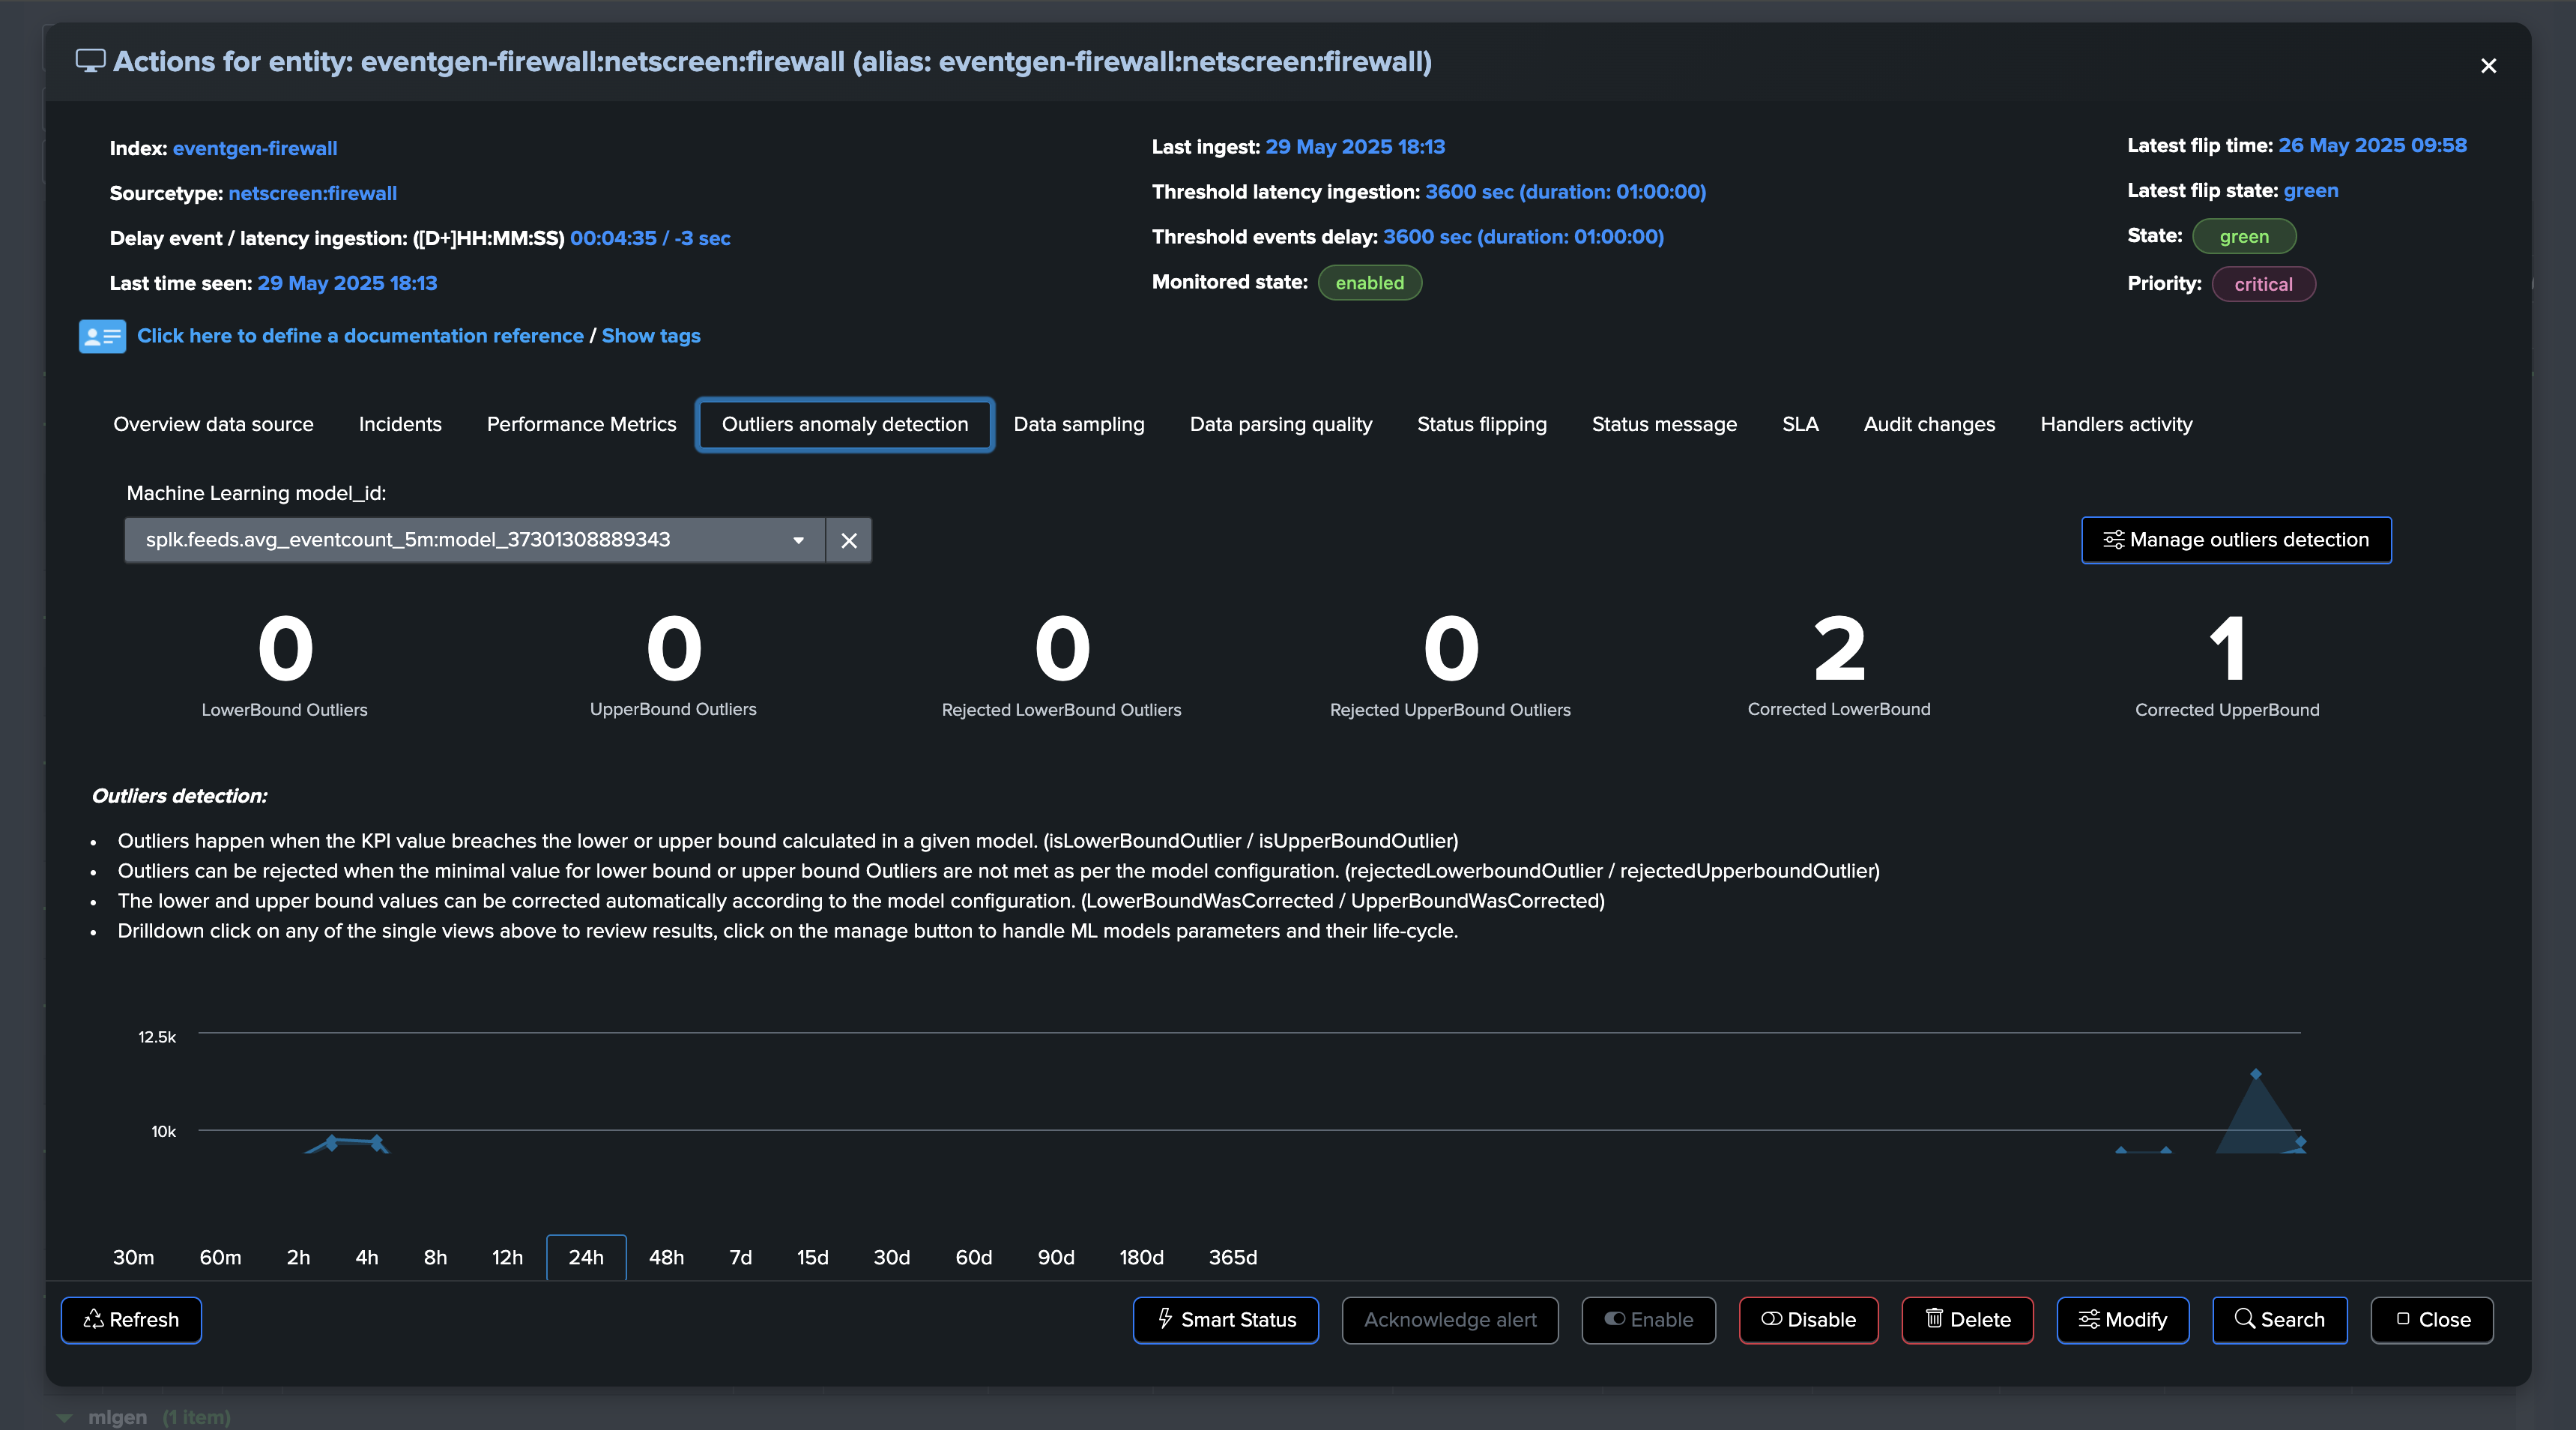
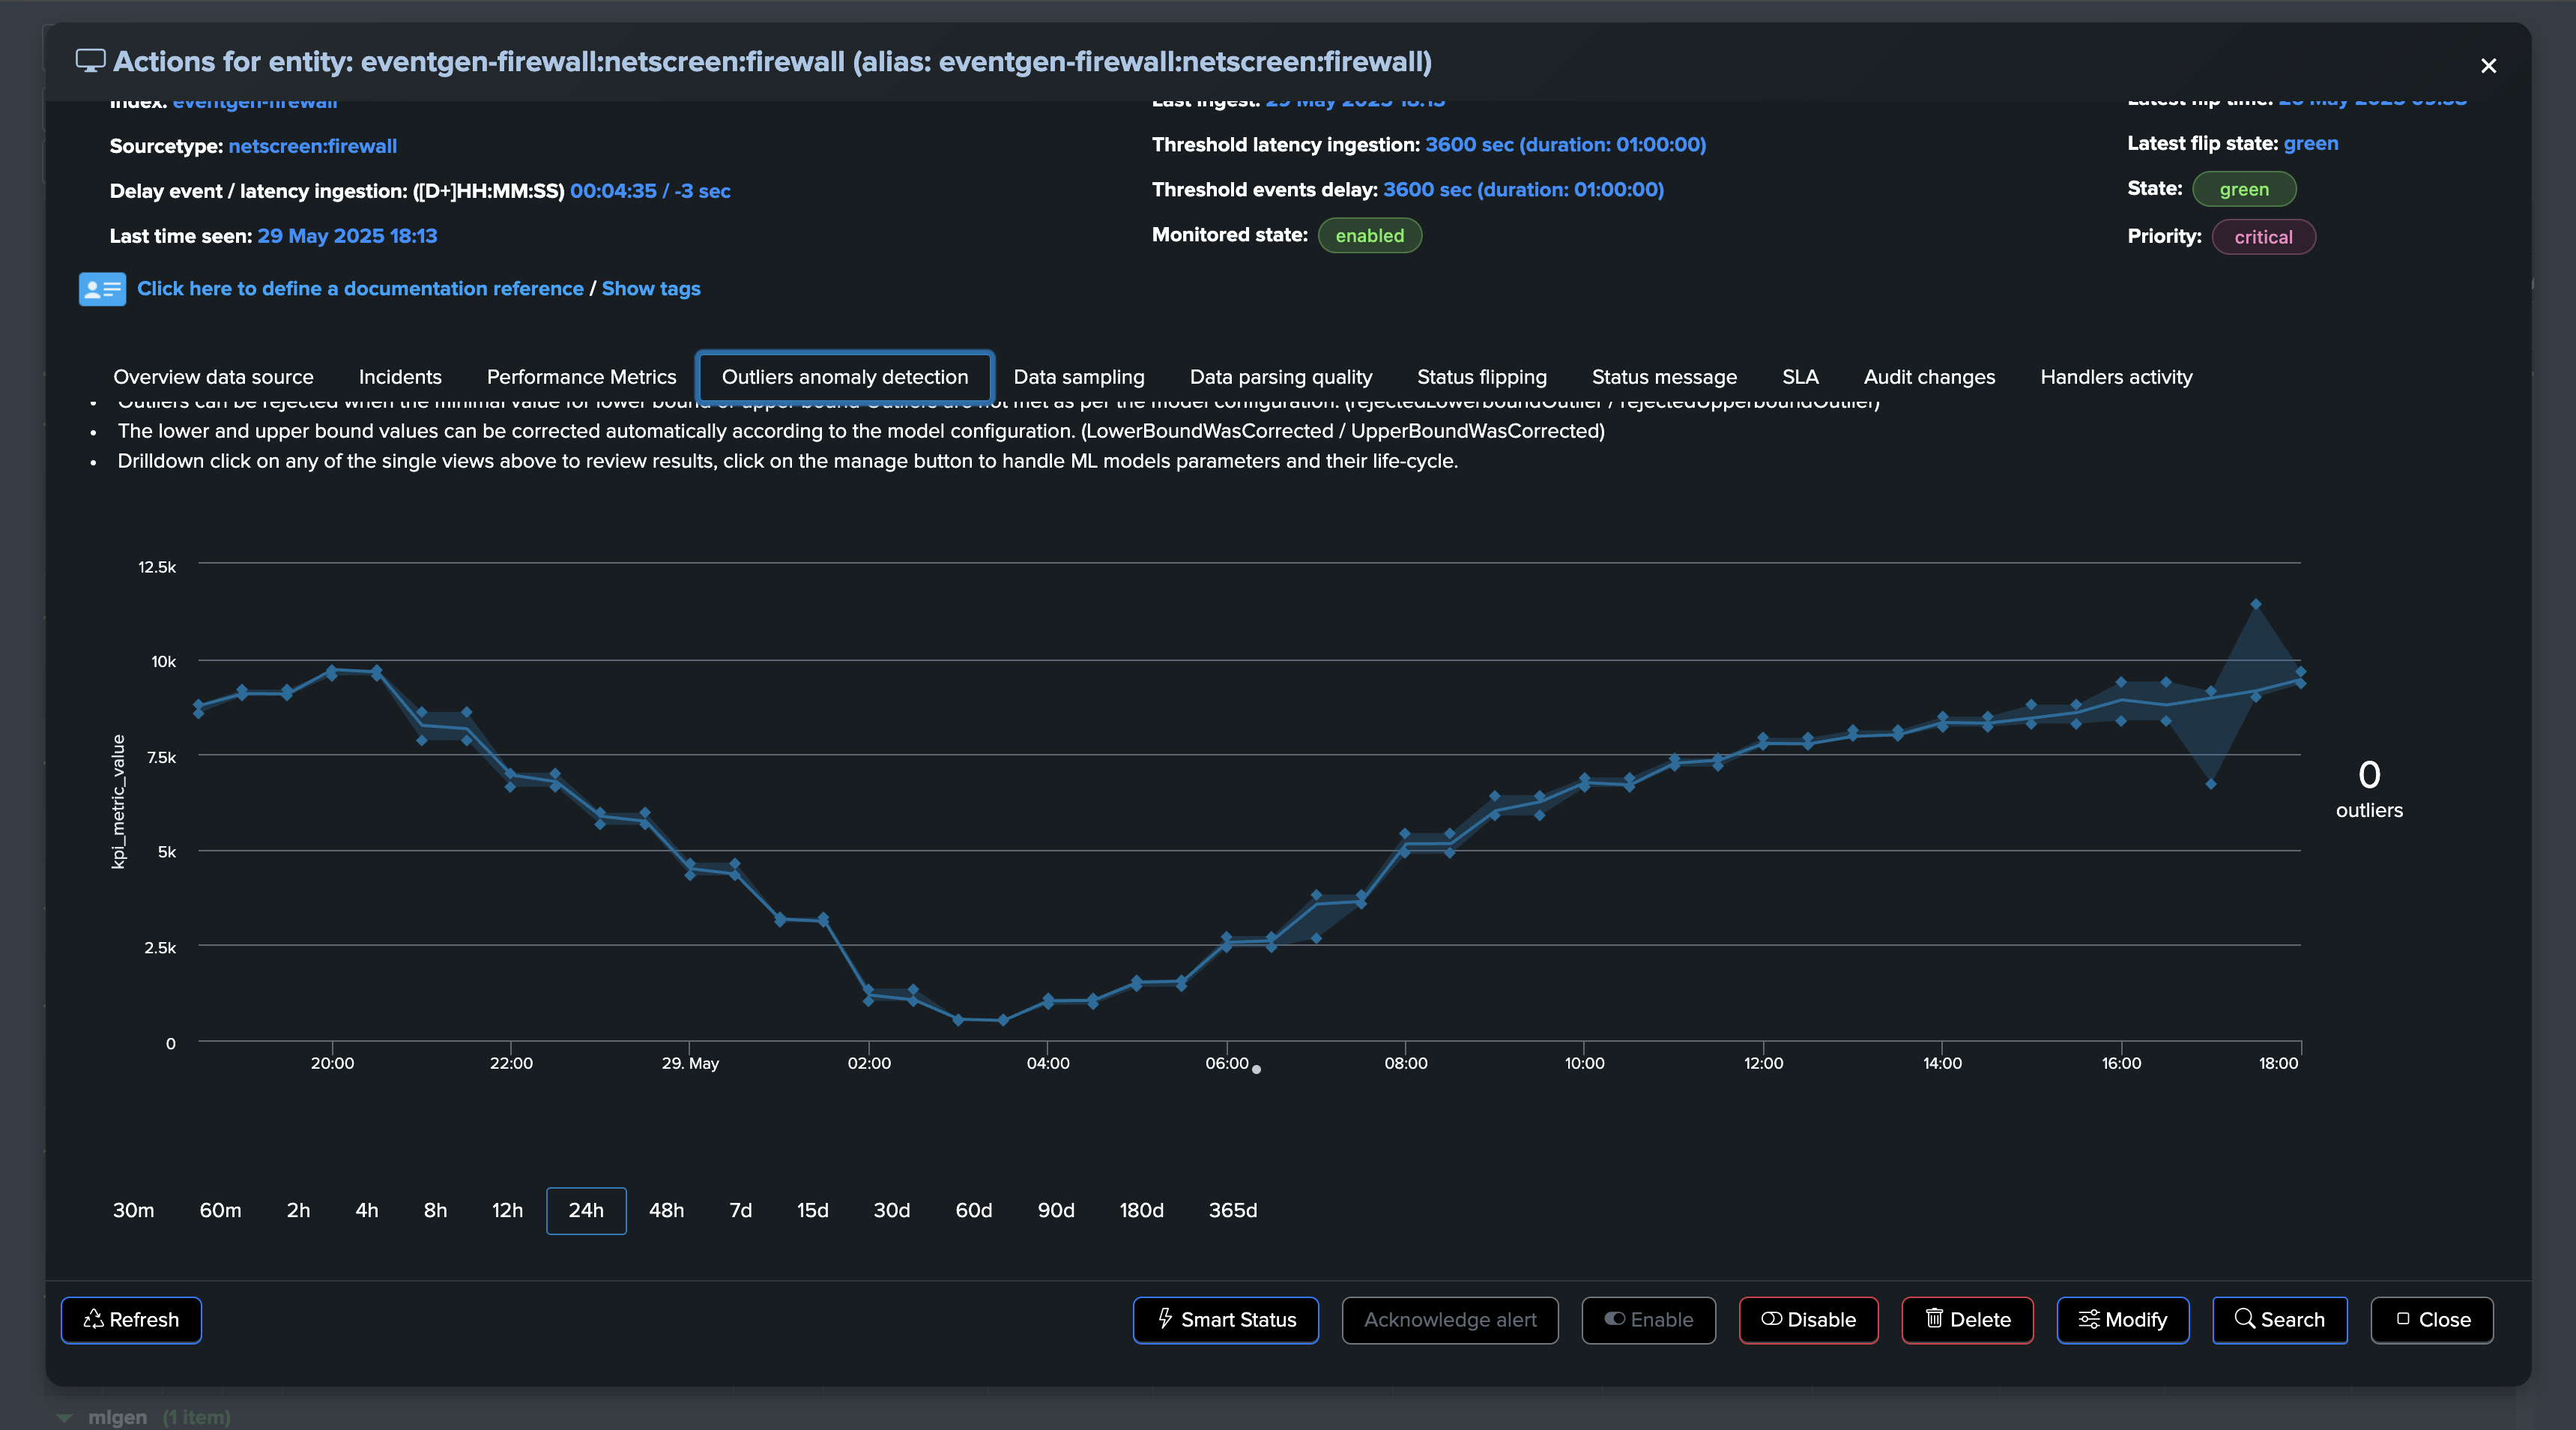
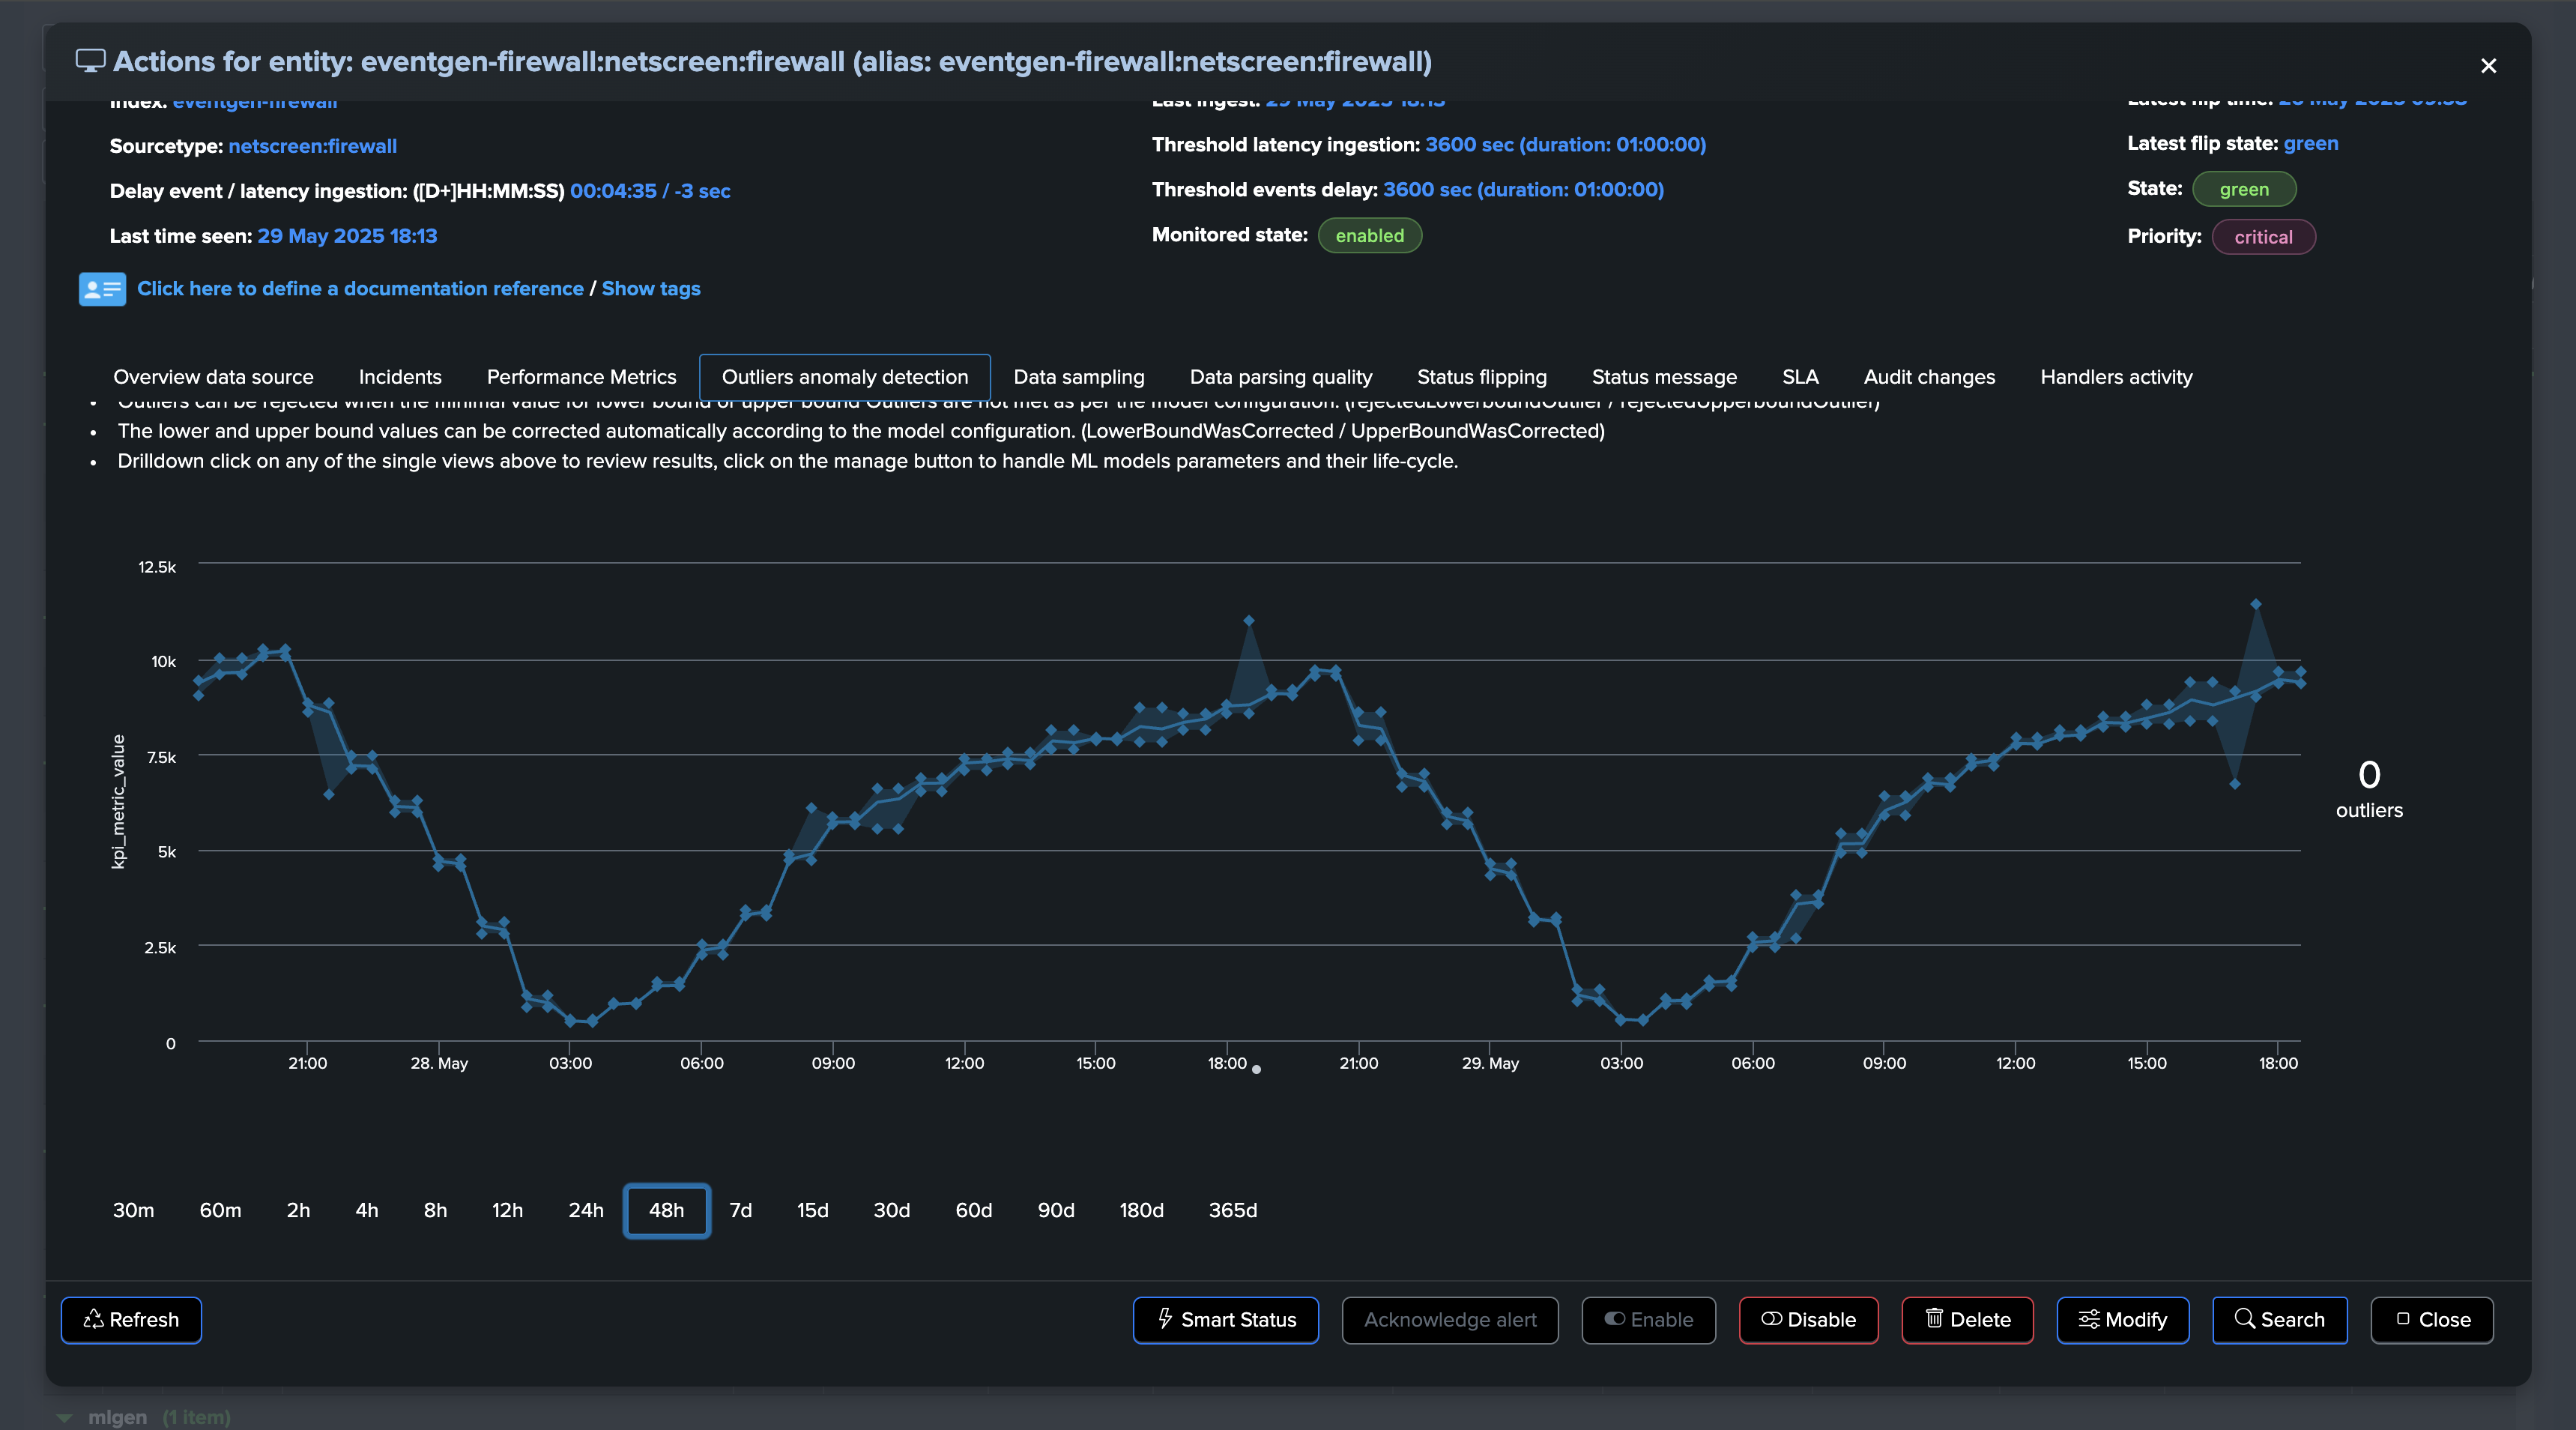
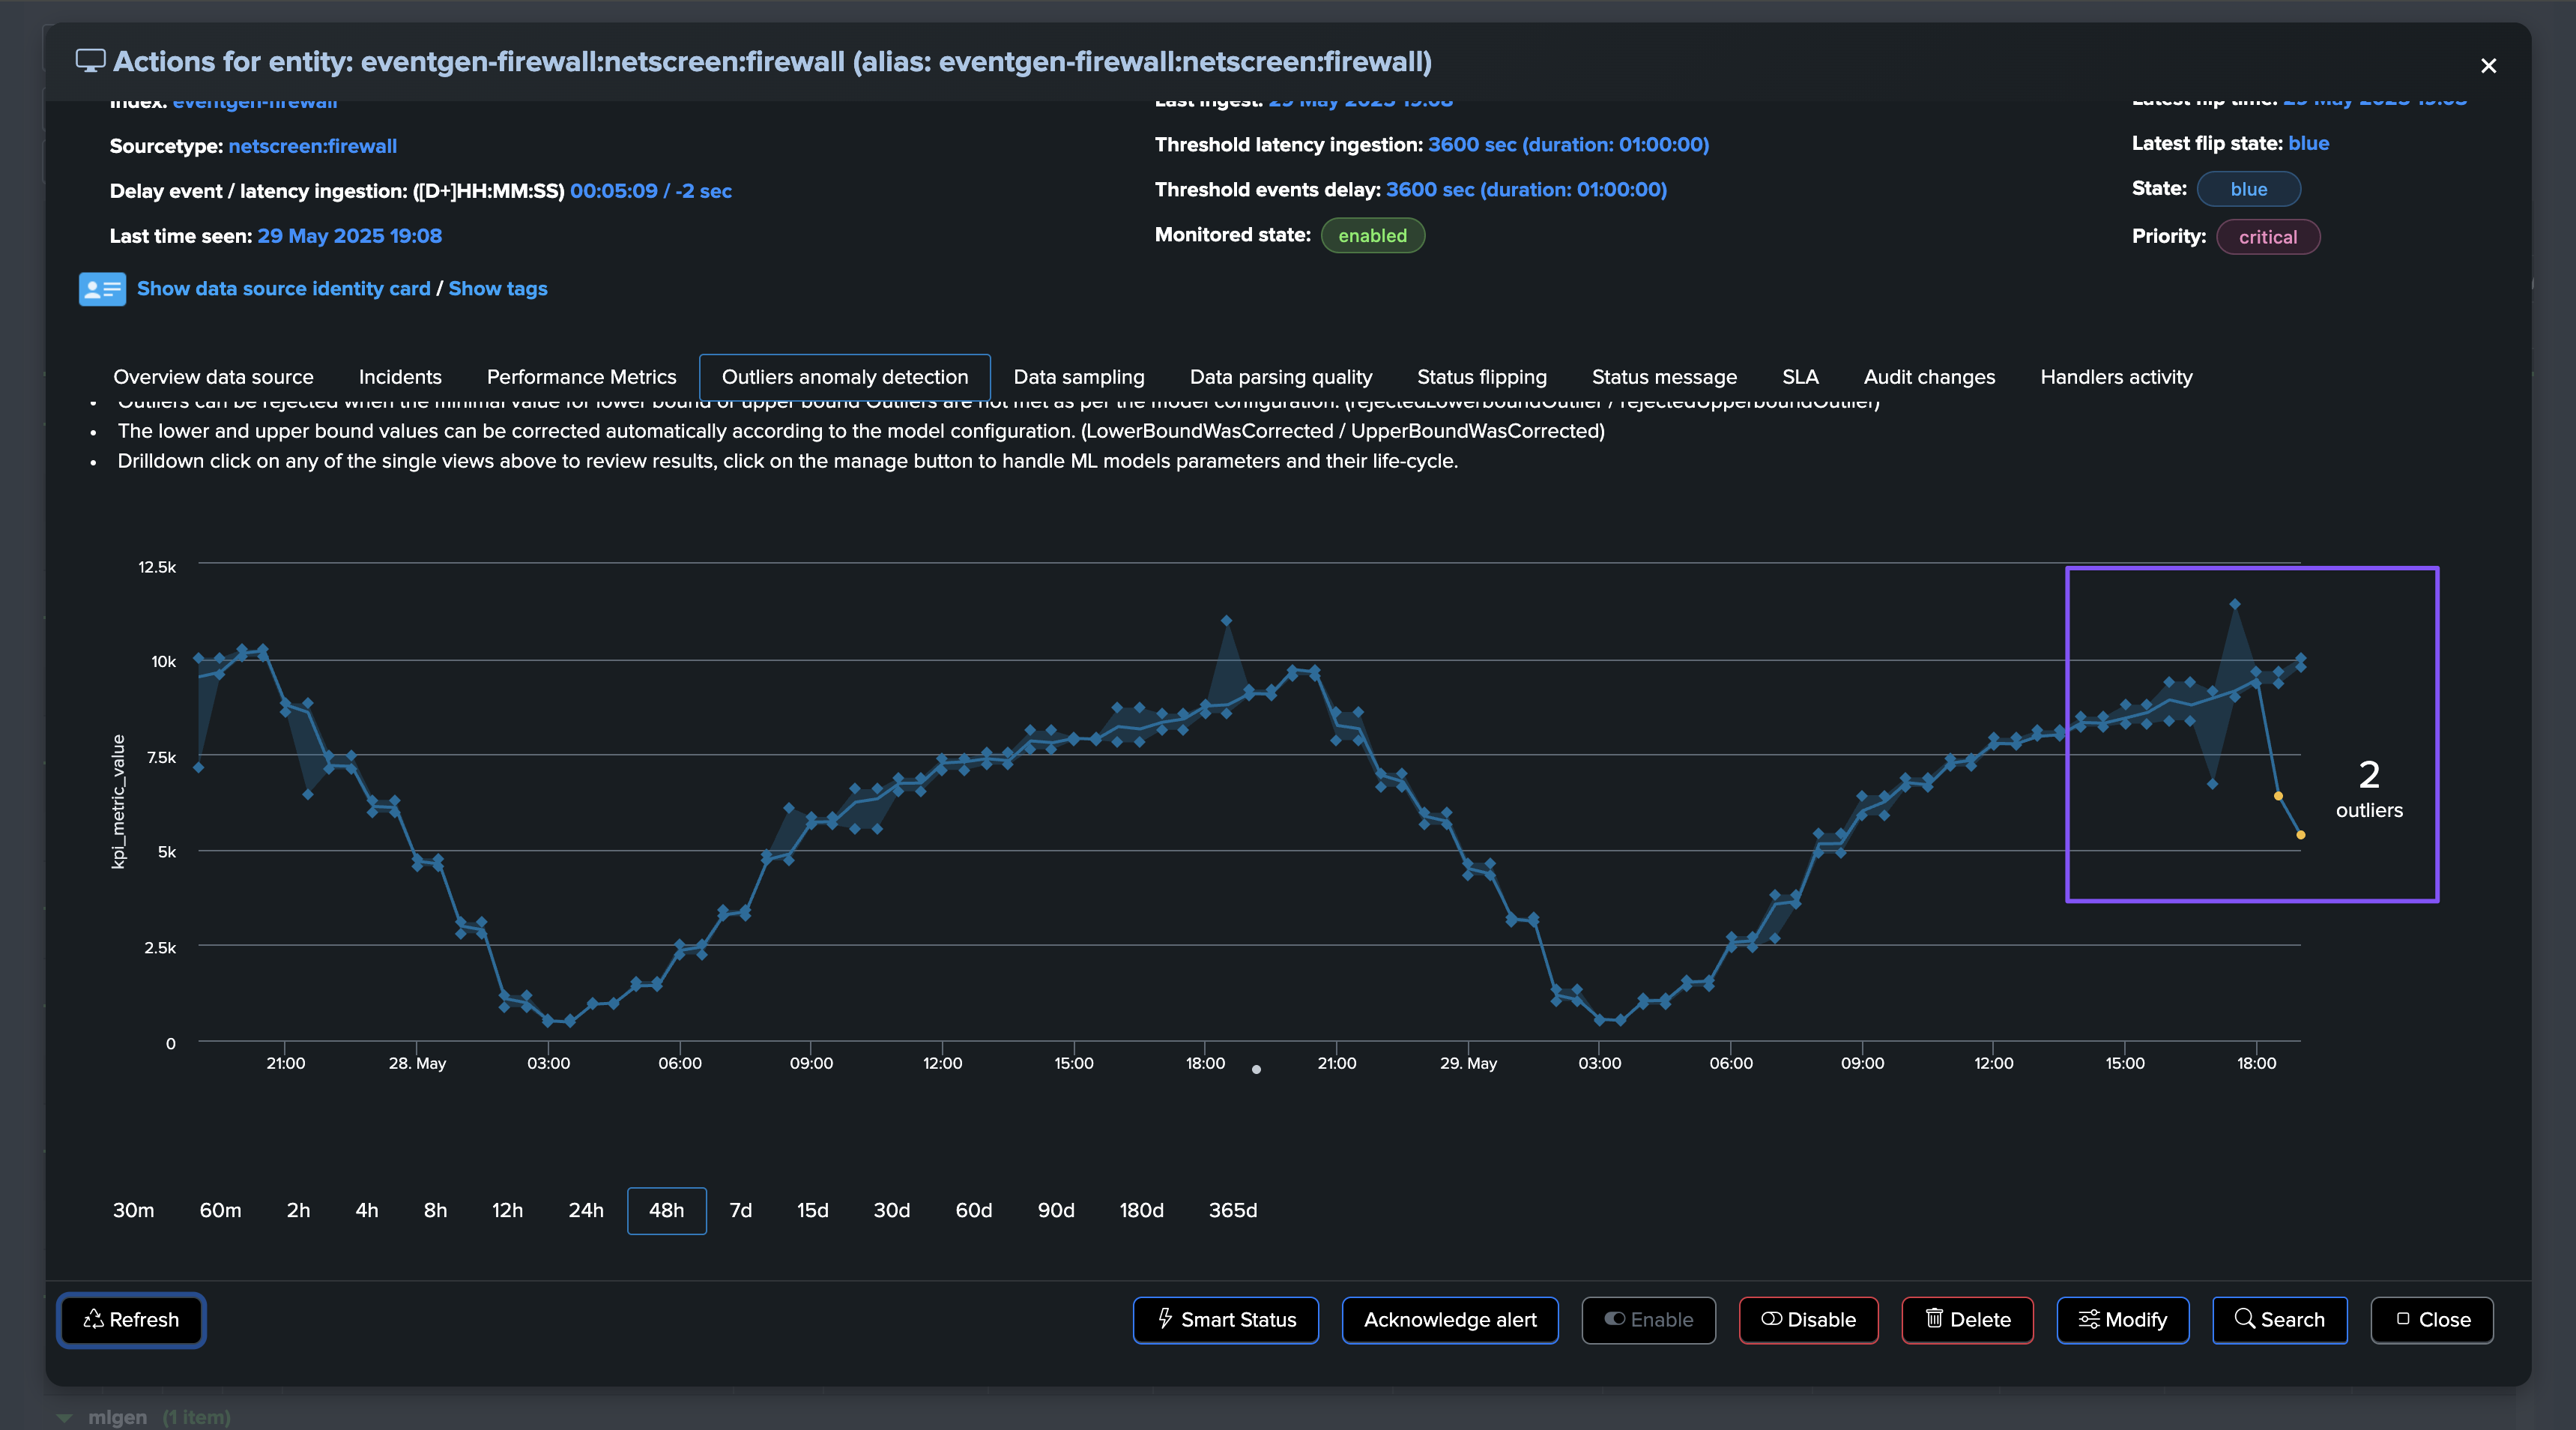
At some point, we start to see issues, we are still receiving events, but in a proportion that is not expected and indicates a potential issue:
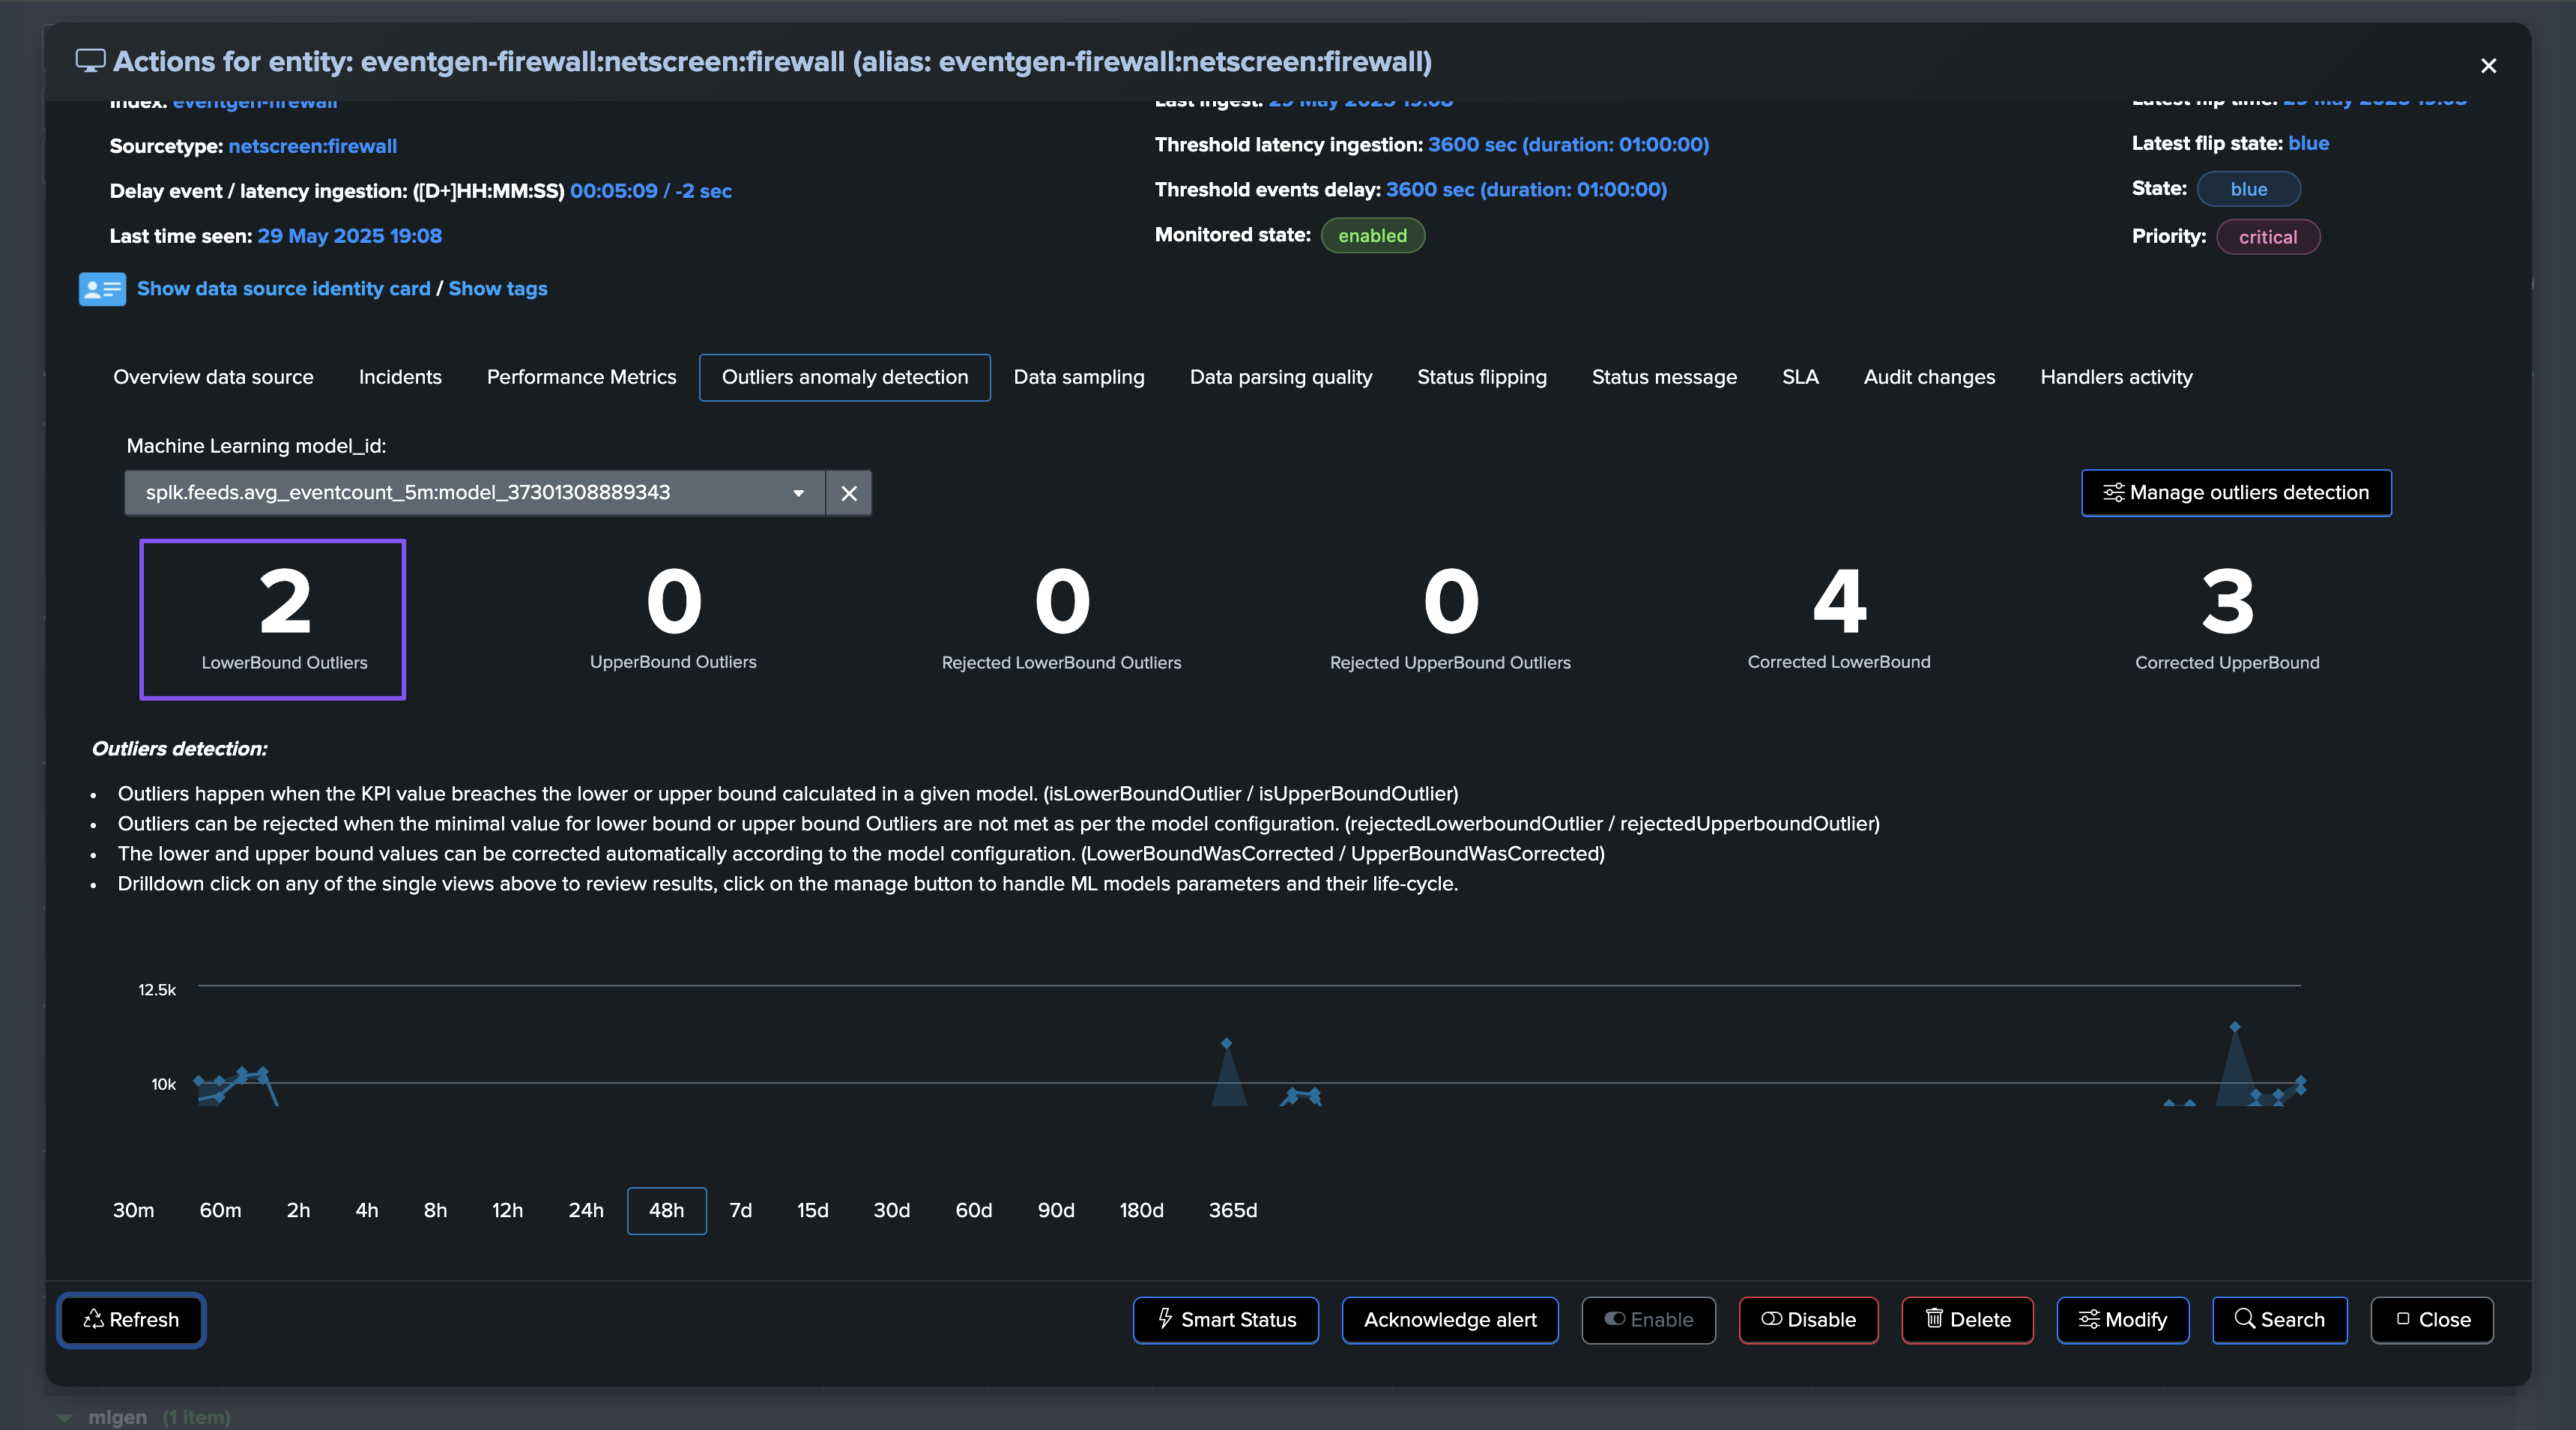
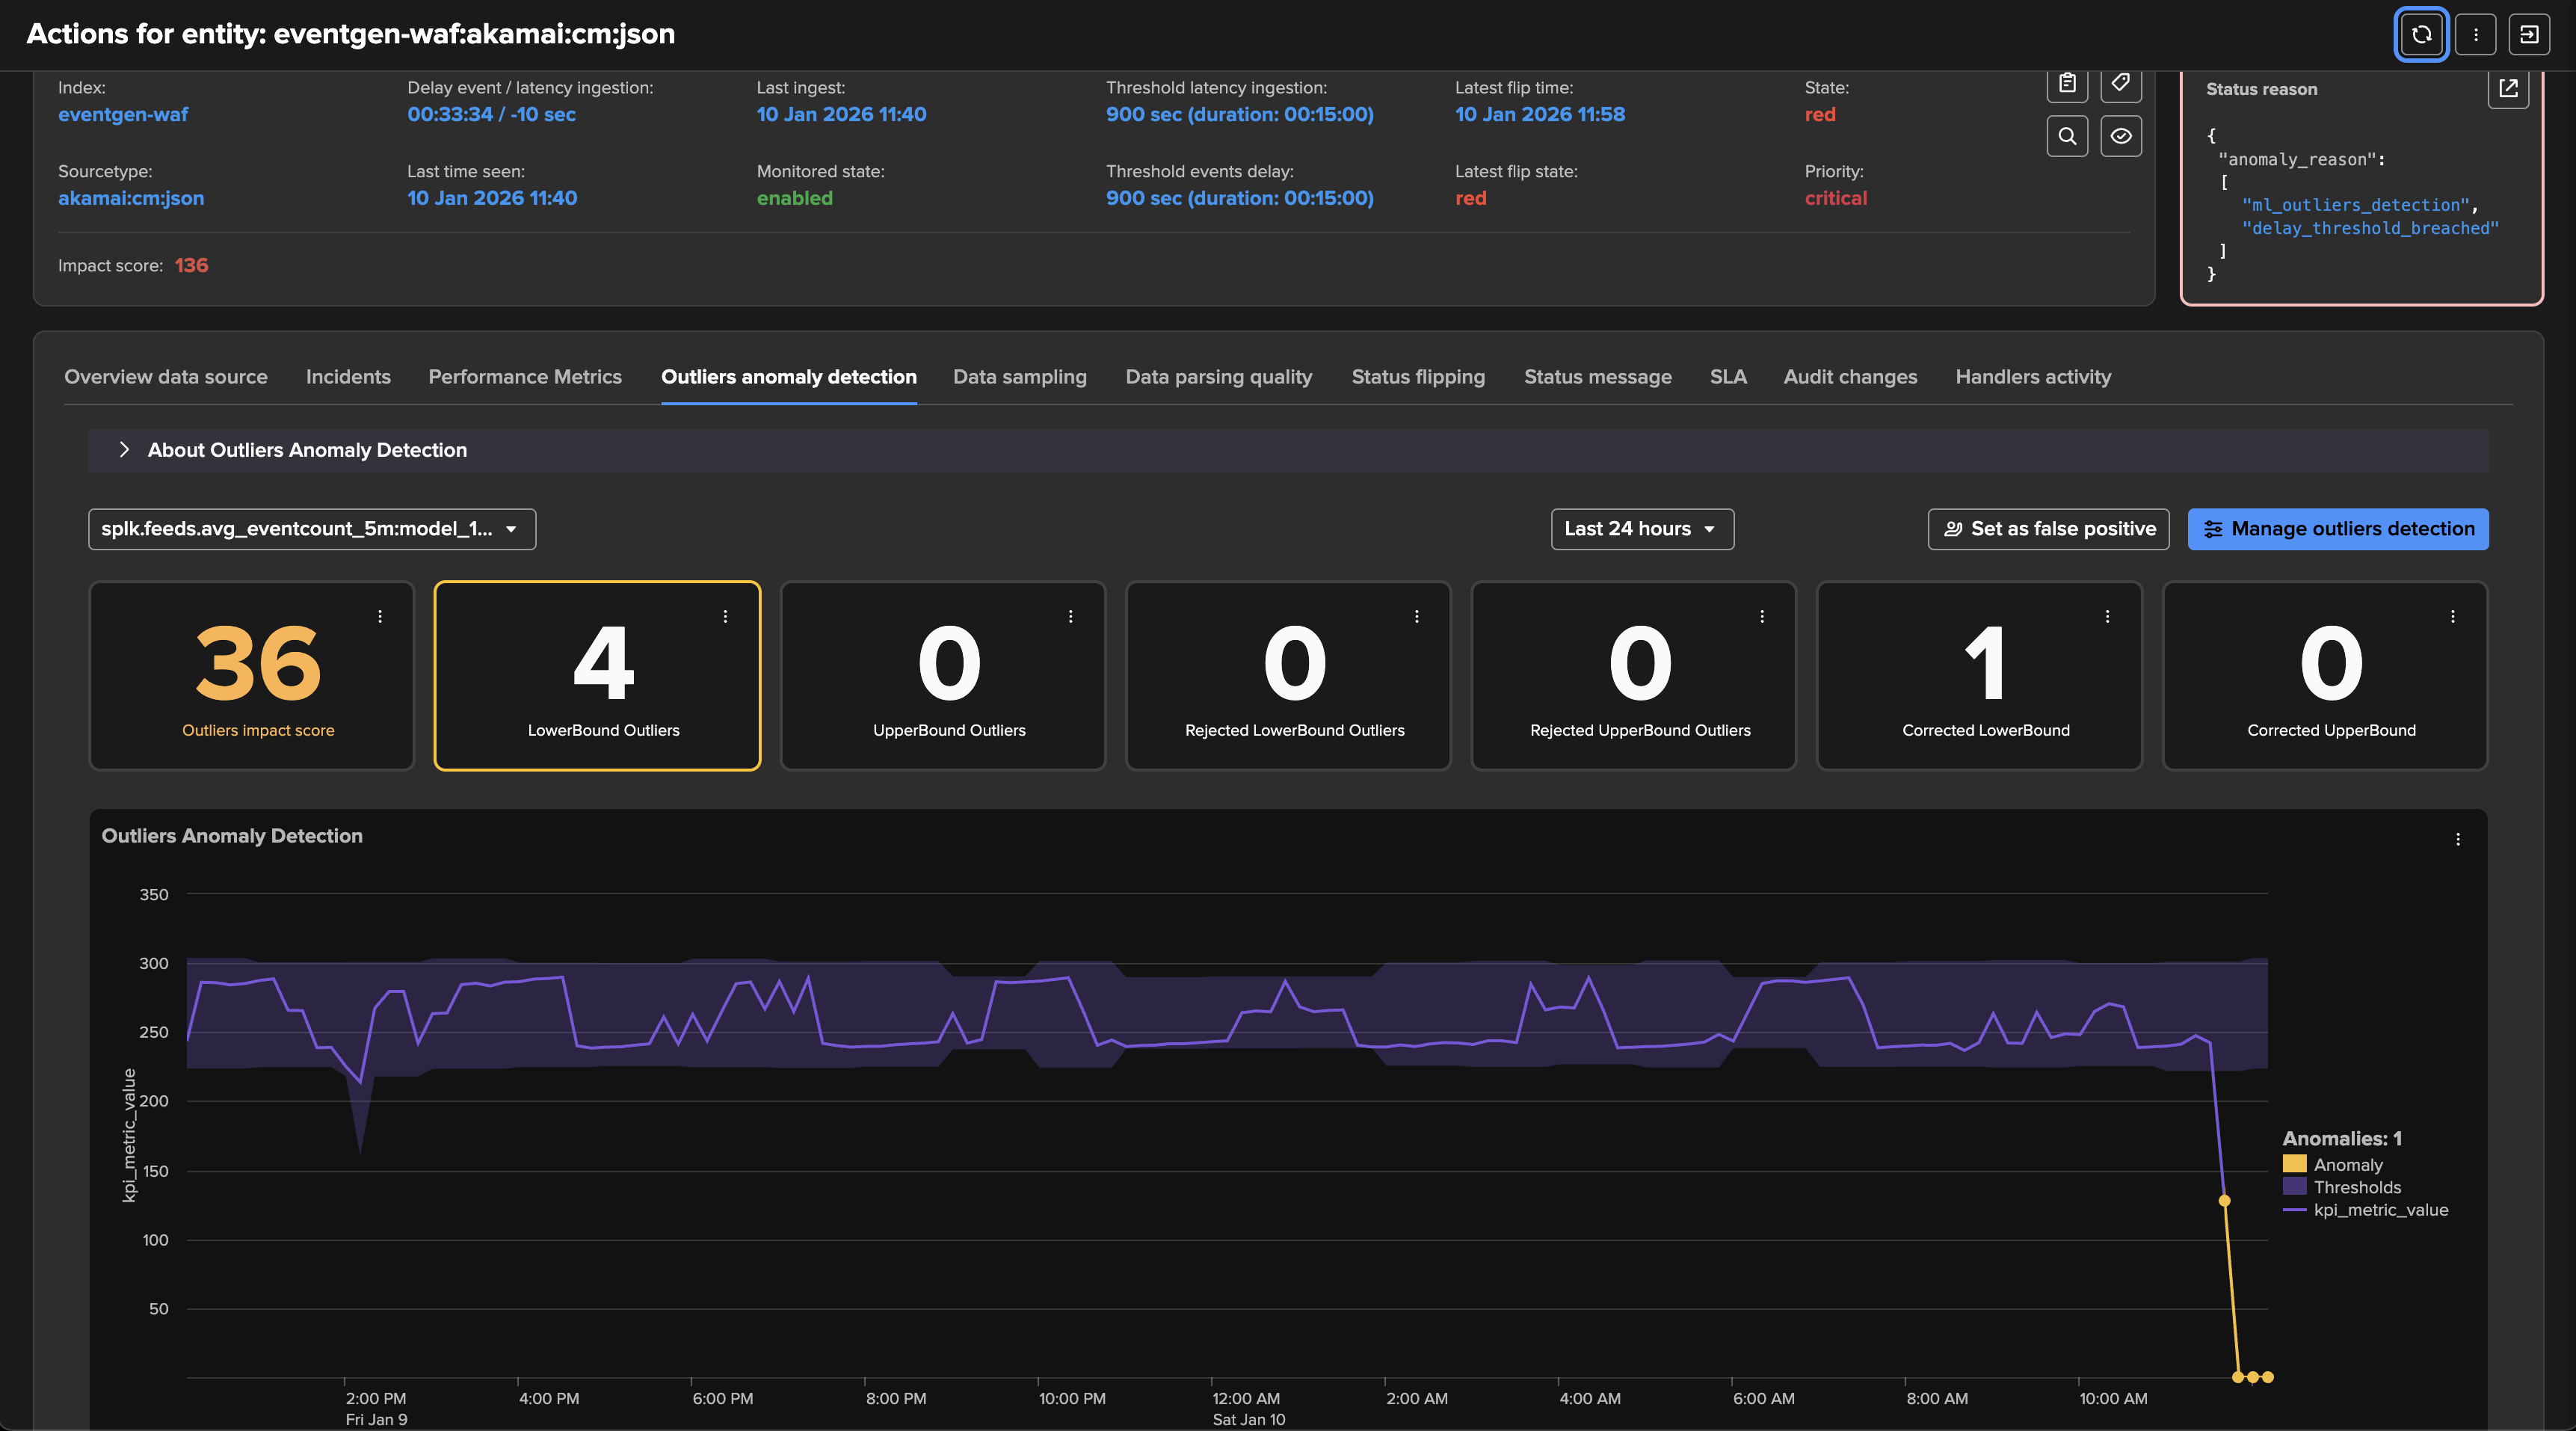
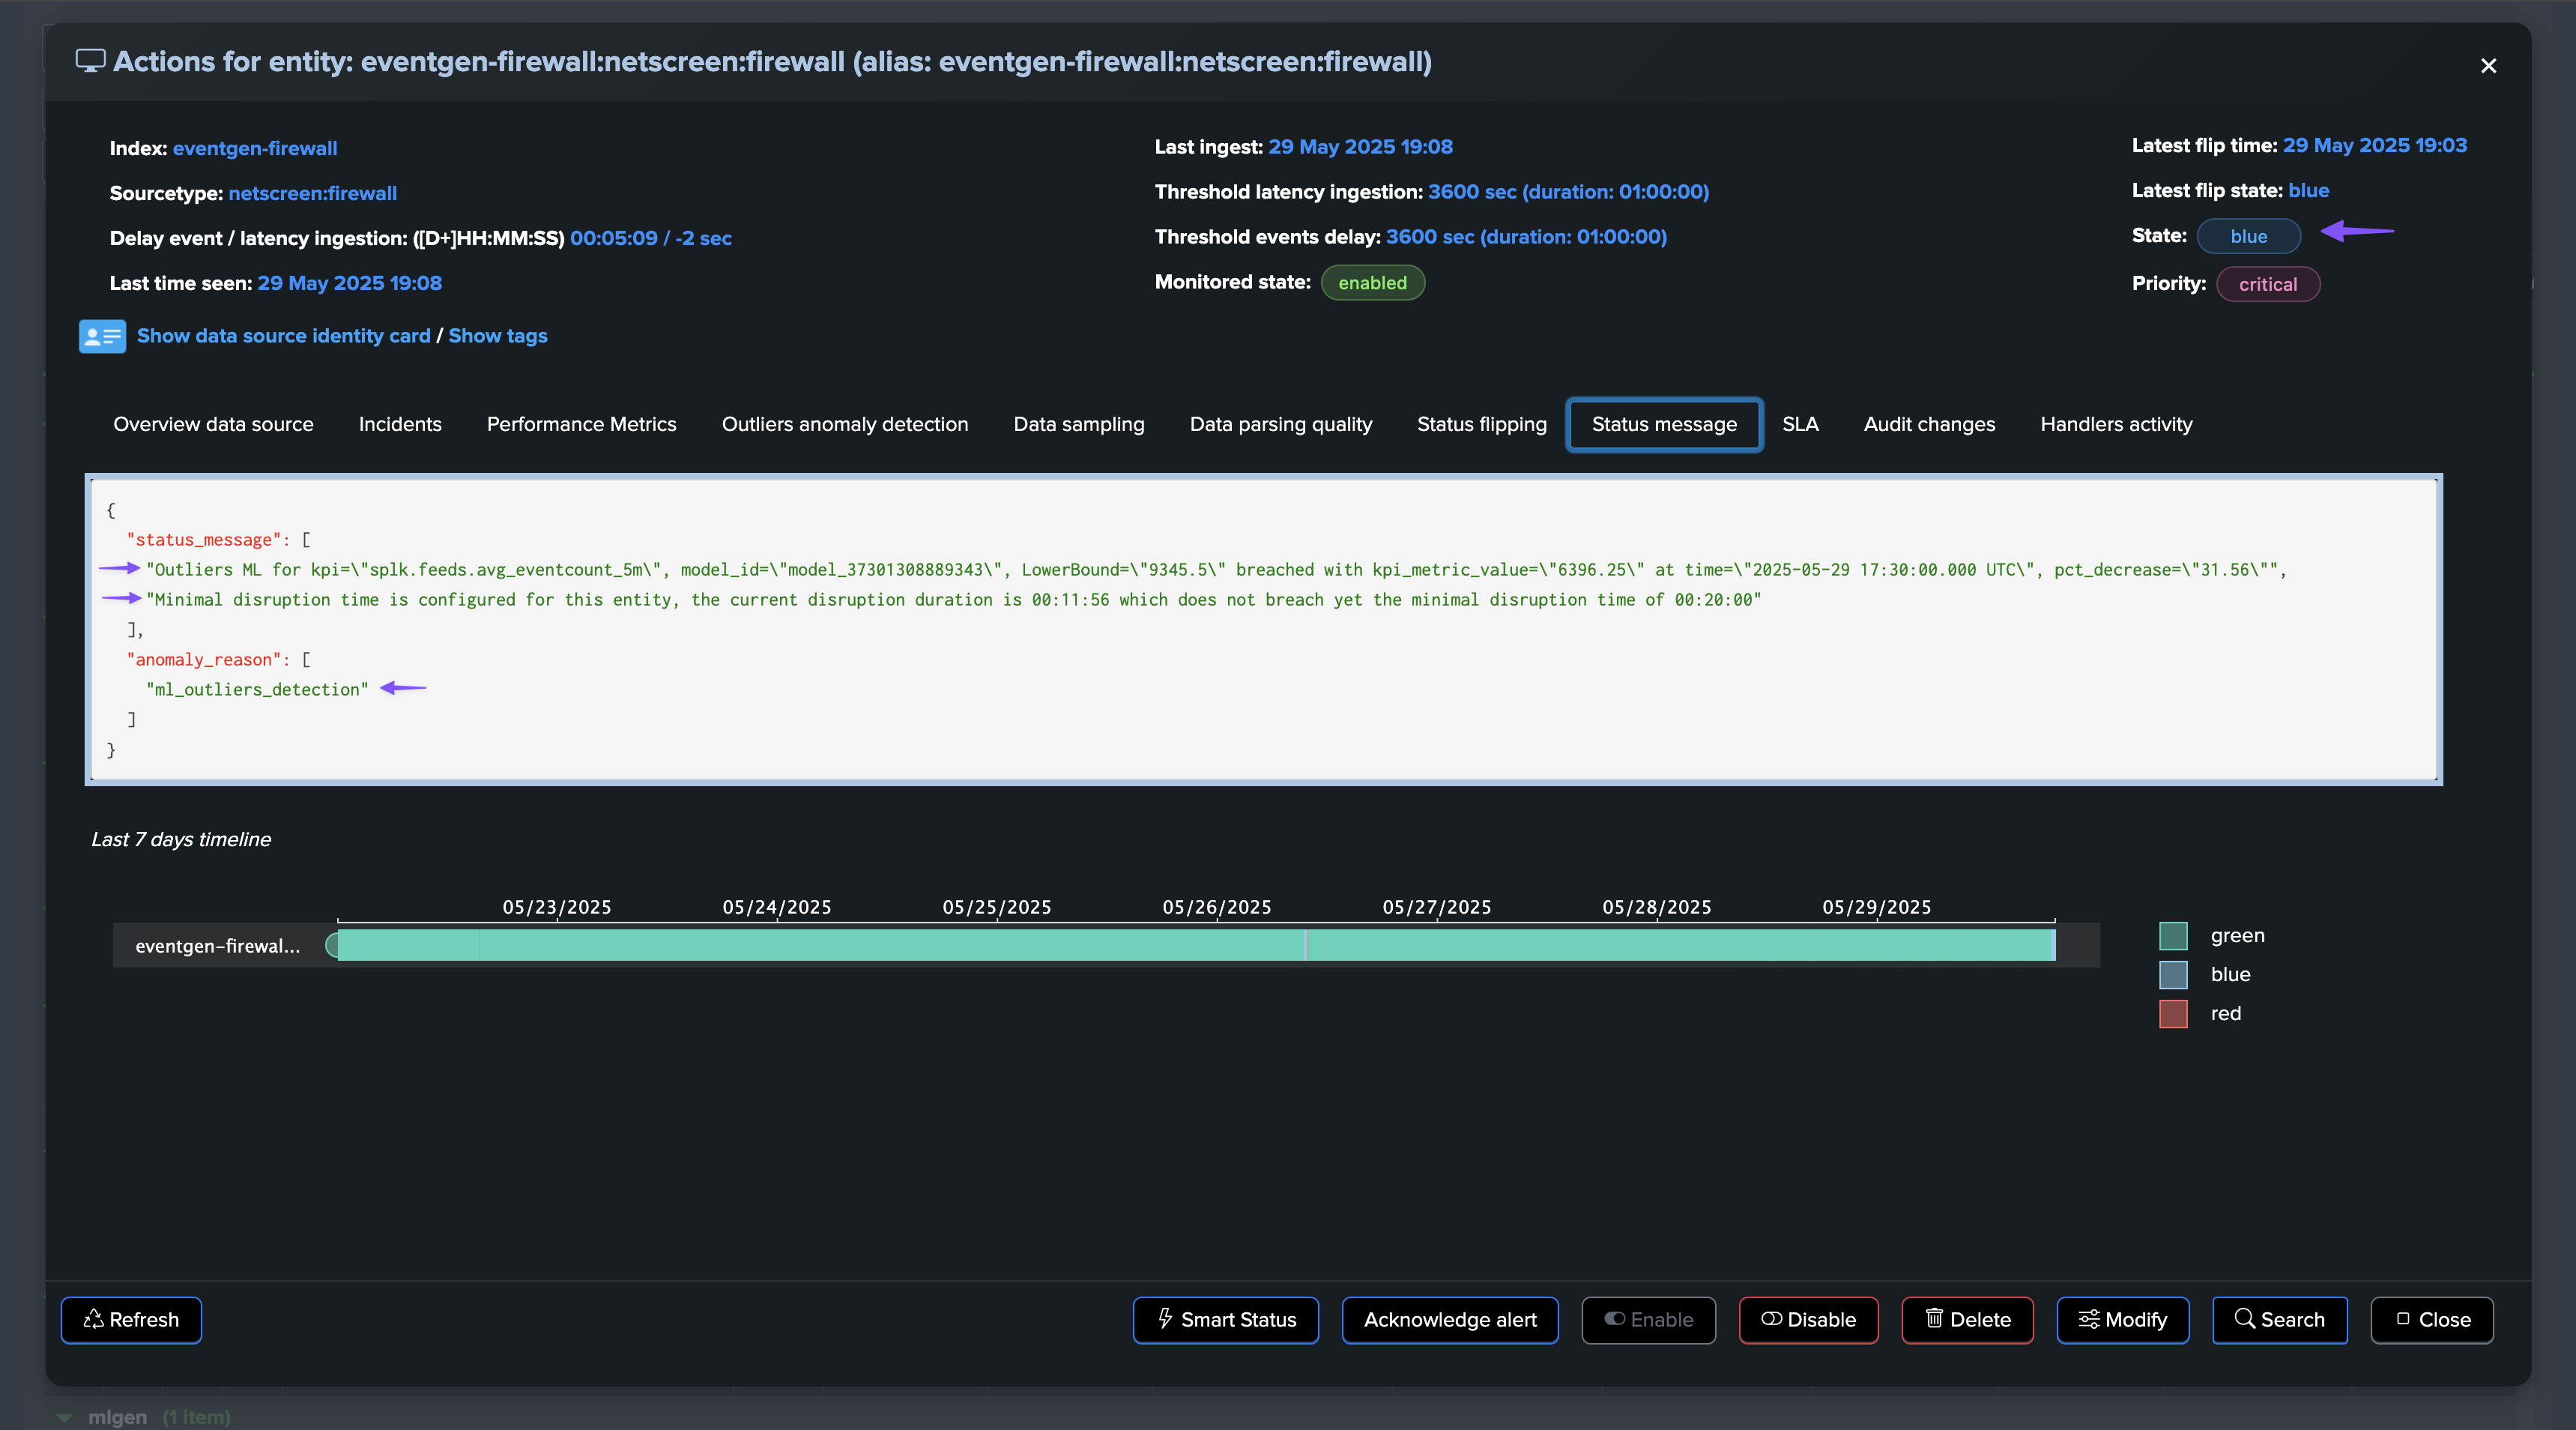
As this entity had a disruption queue configured, once the duration is breached, the entity transitioned to red and is now officially in alert:
A significant amount of events is still making it to Splunk, without looking at this from the lens of Machine Learning and accumulated knowledge, we would have a hard time understanding that an abnormally low volume is happening.
Once the disruption duration is over, the entity is now in alert:

An incident is opened and a notification is sent:
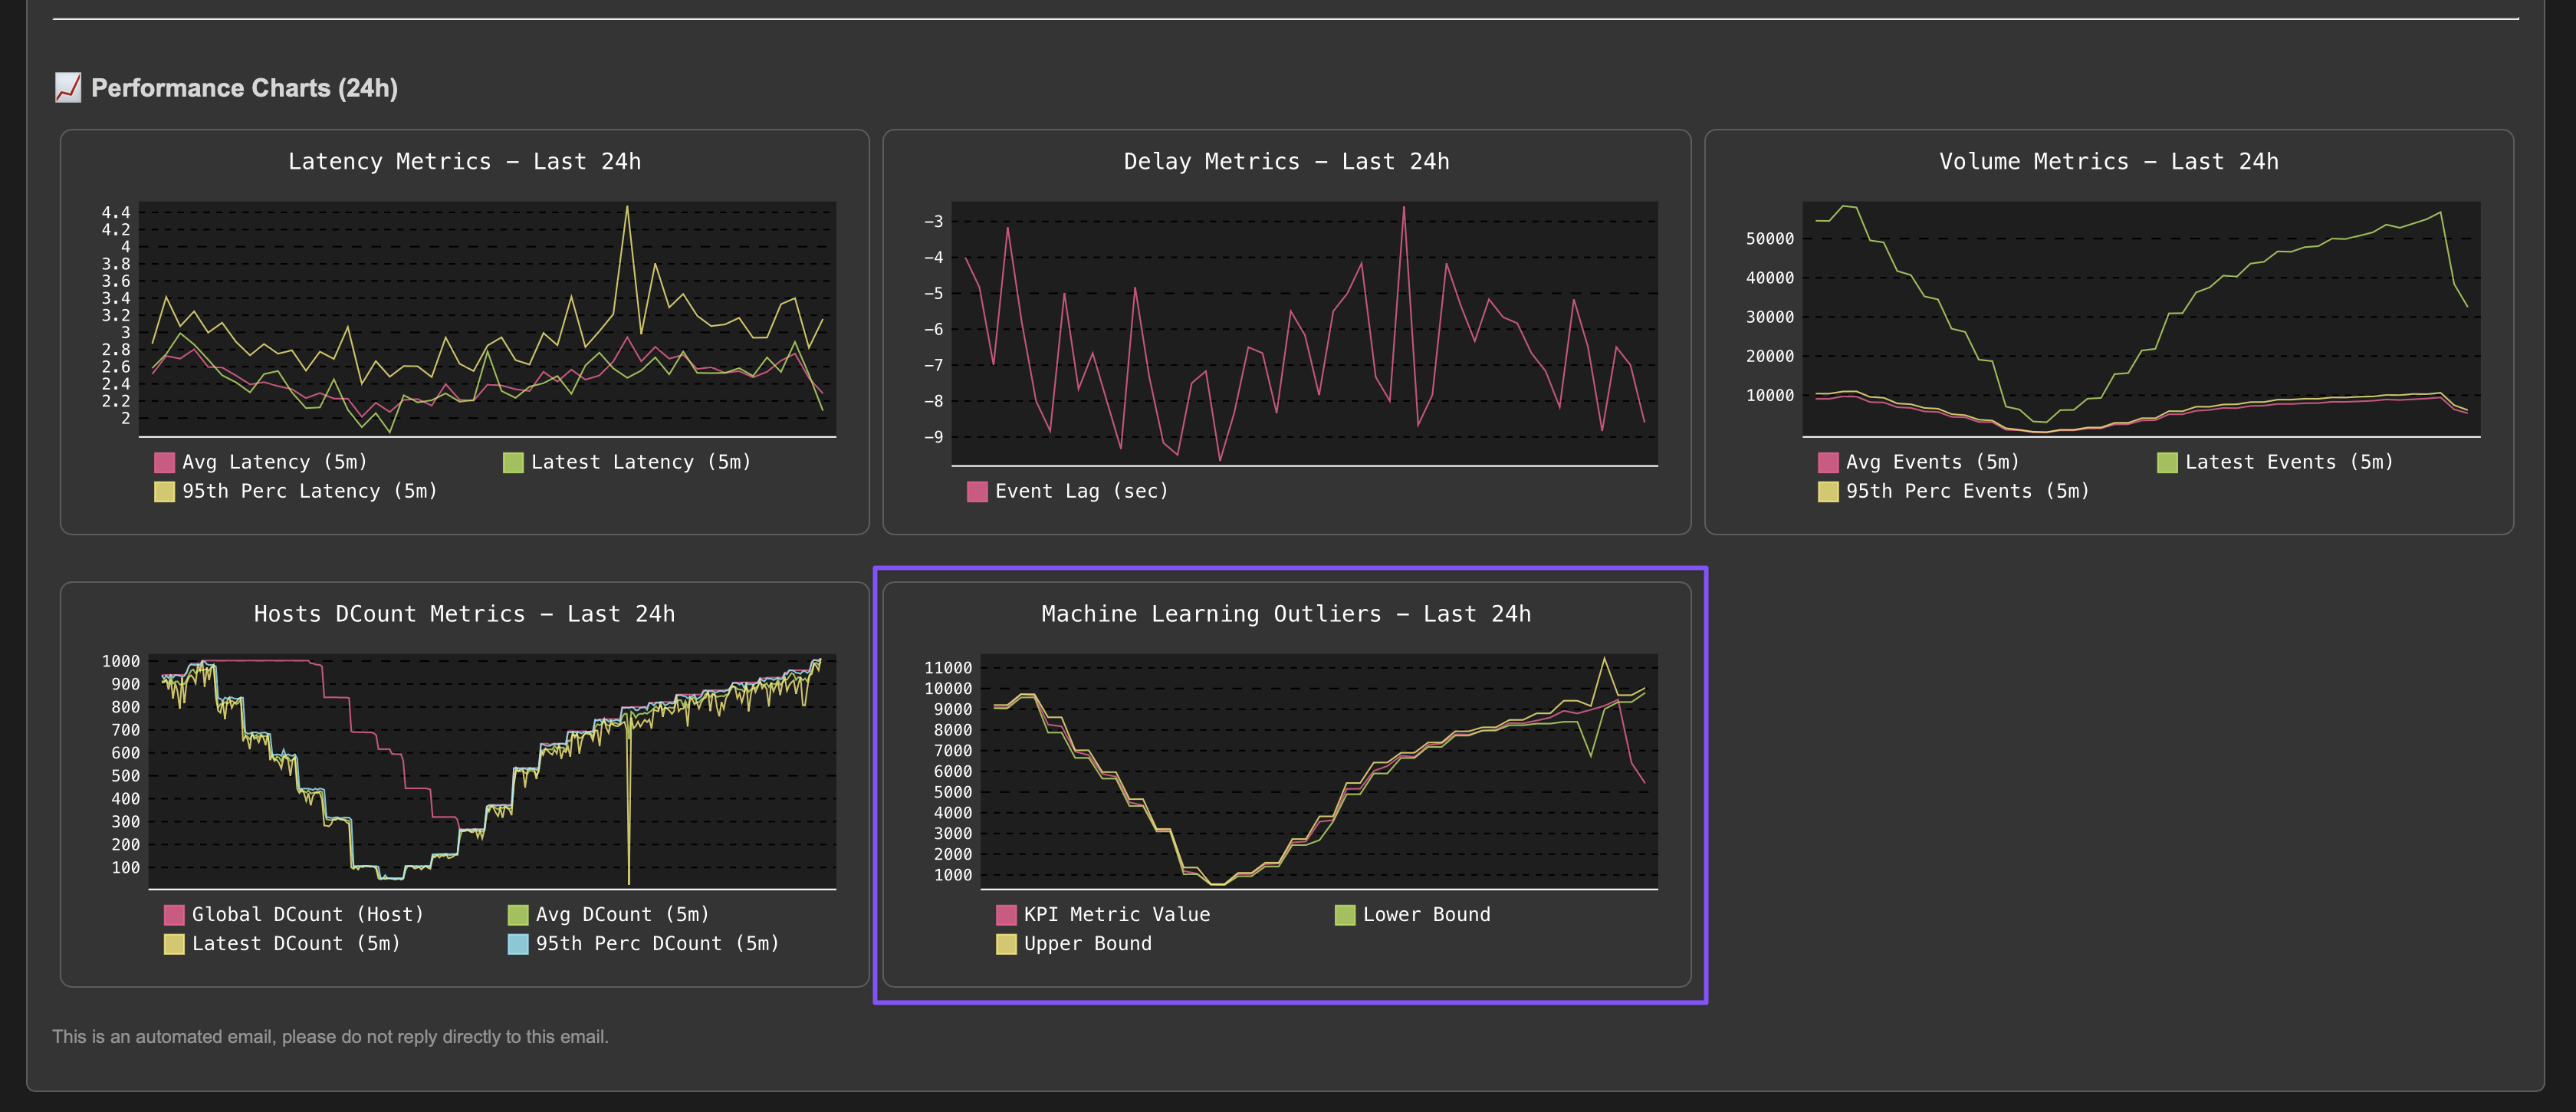
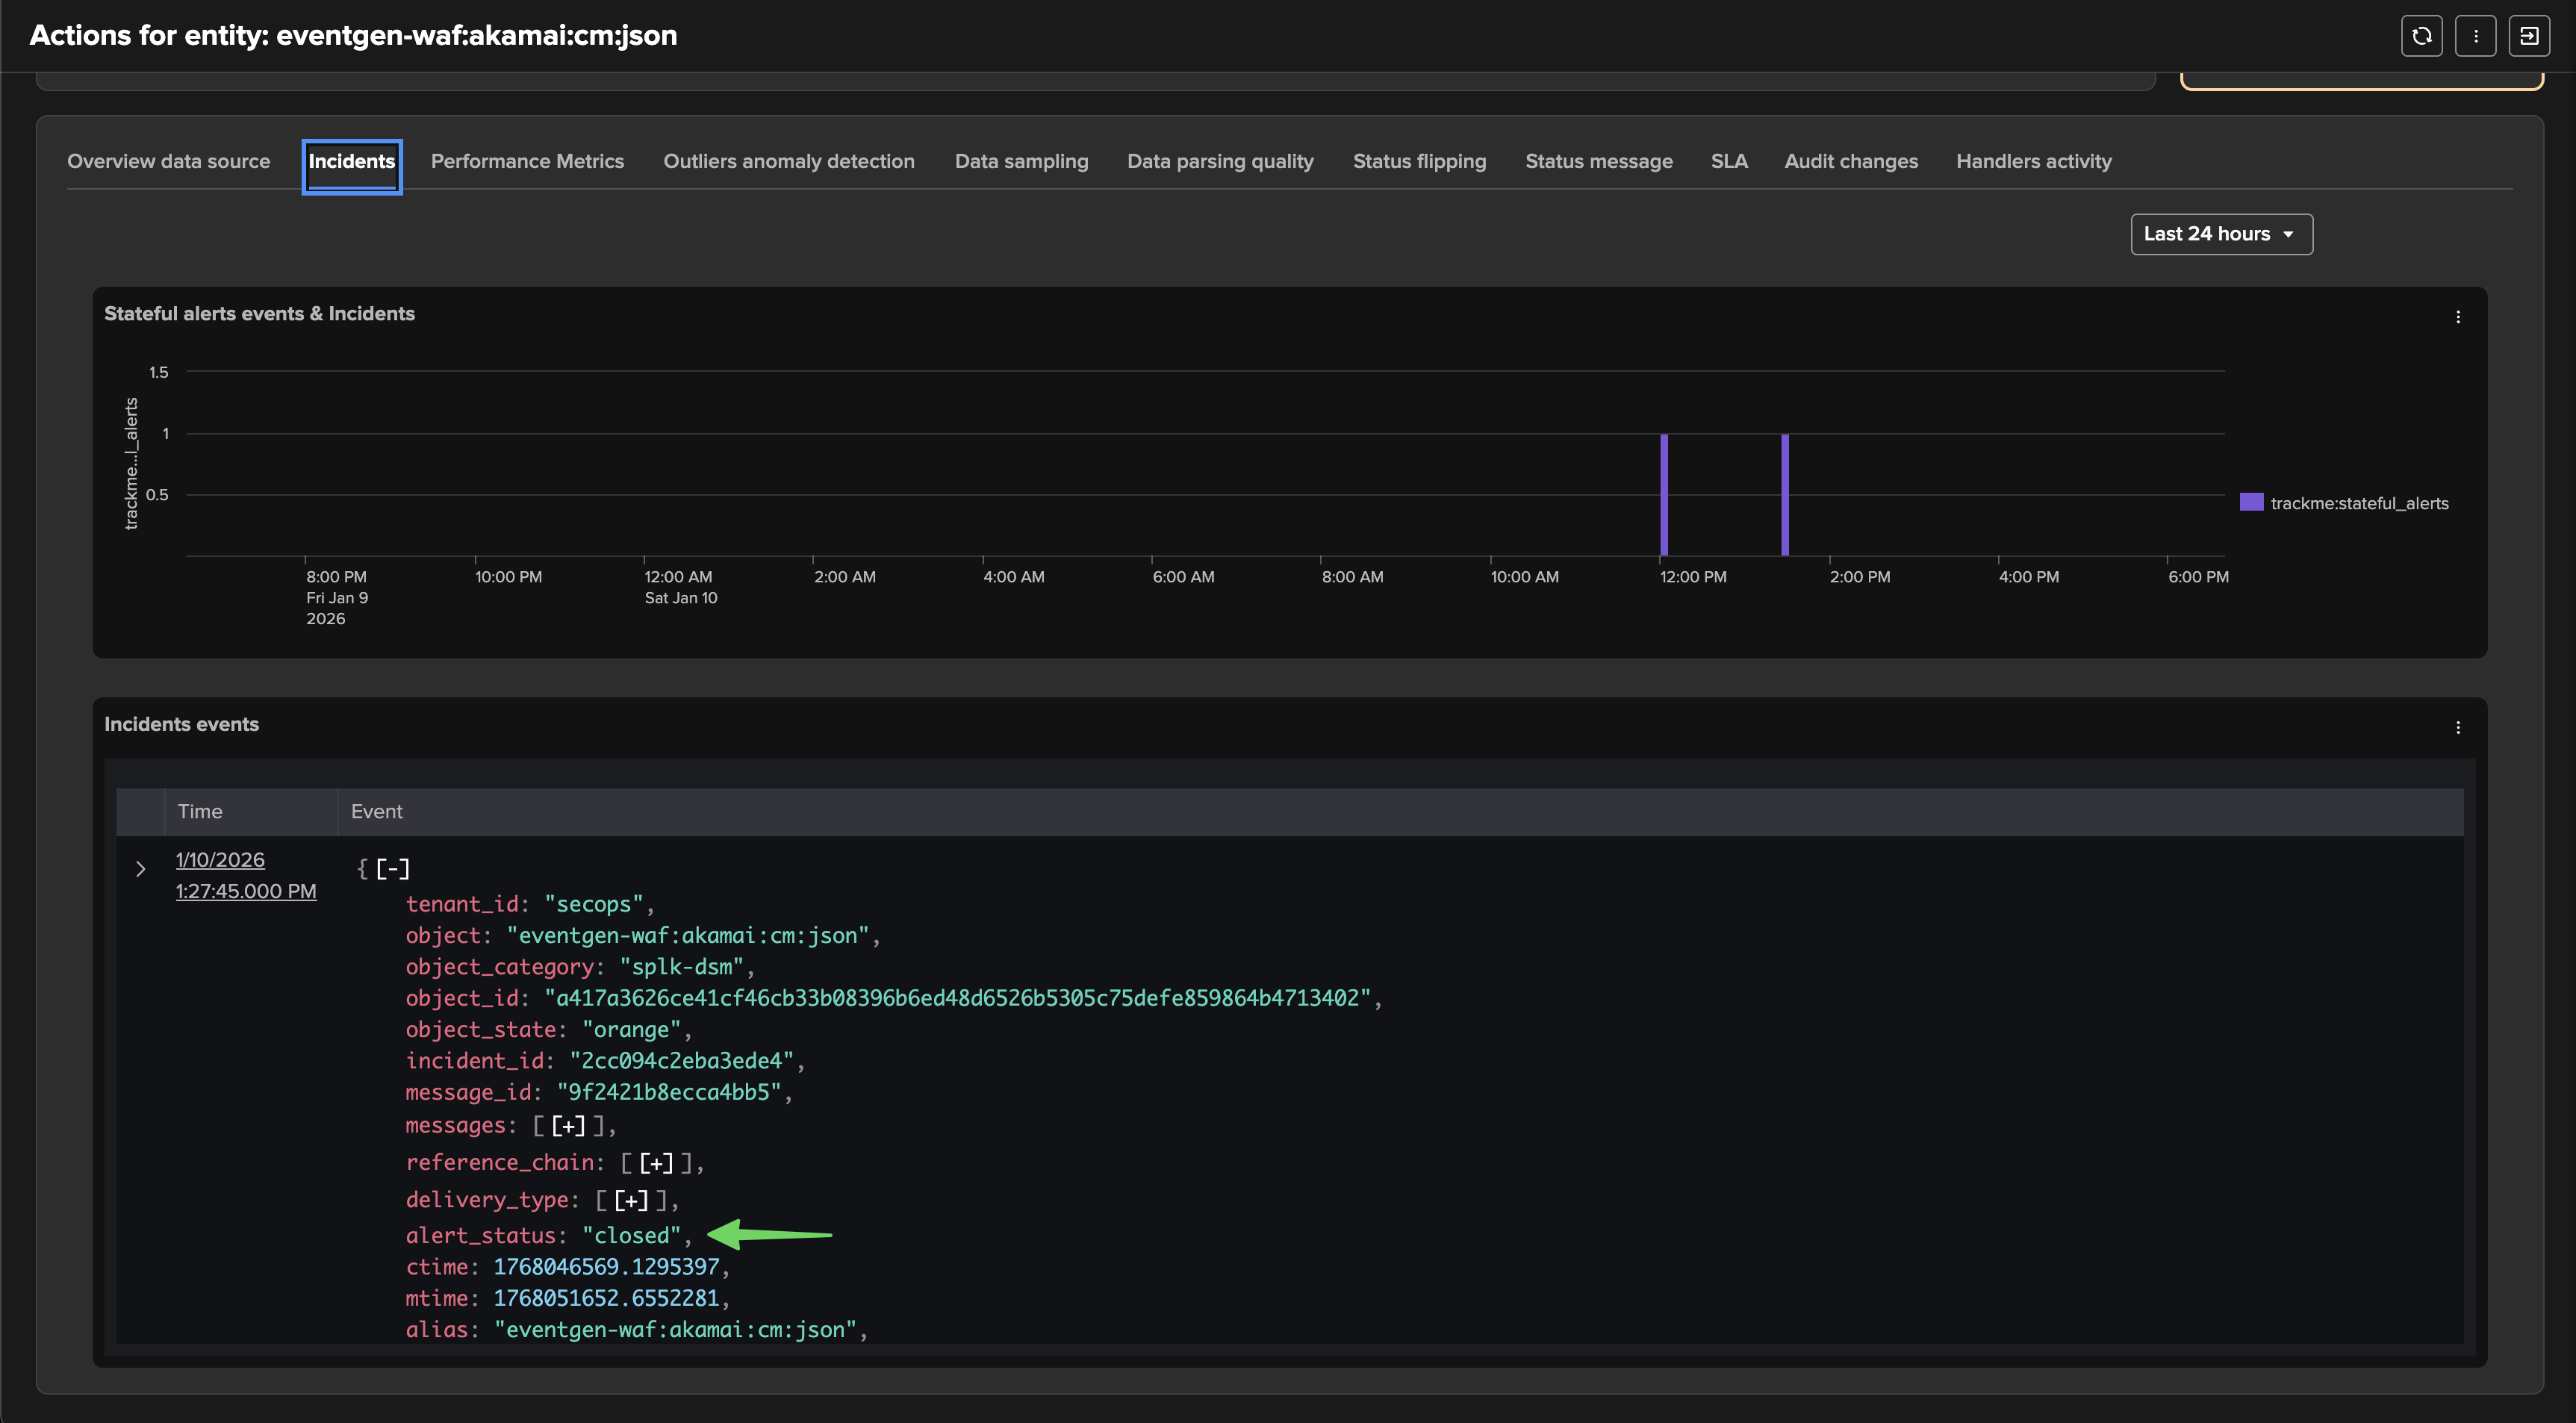
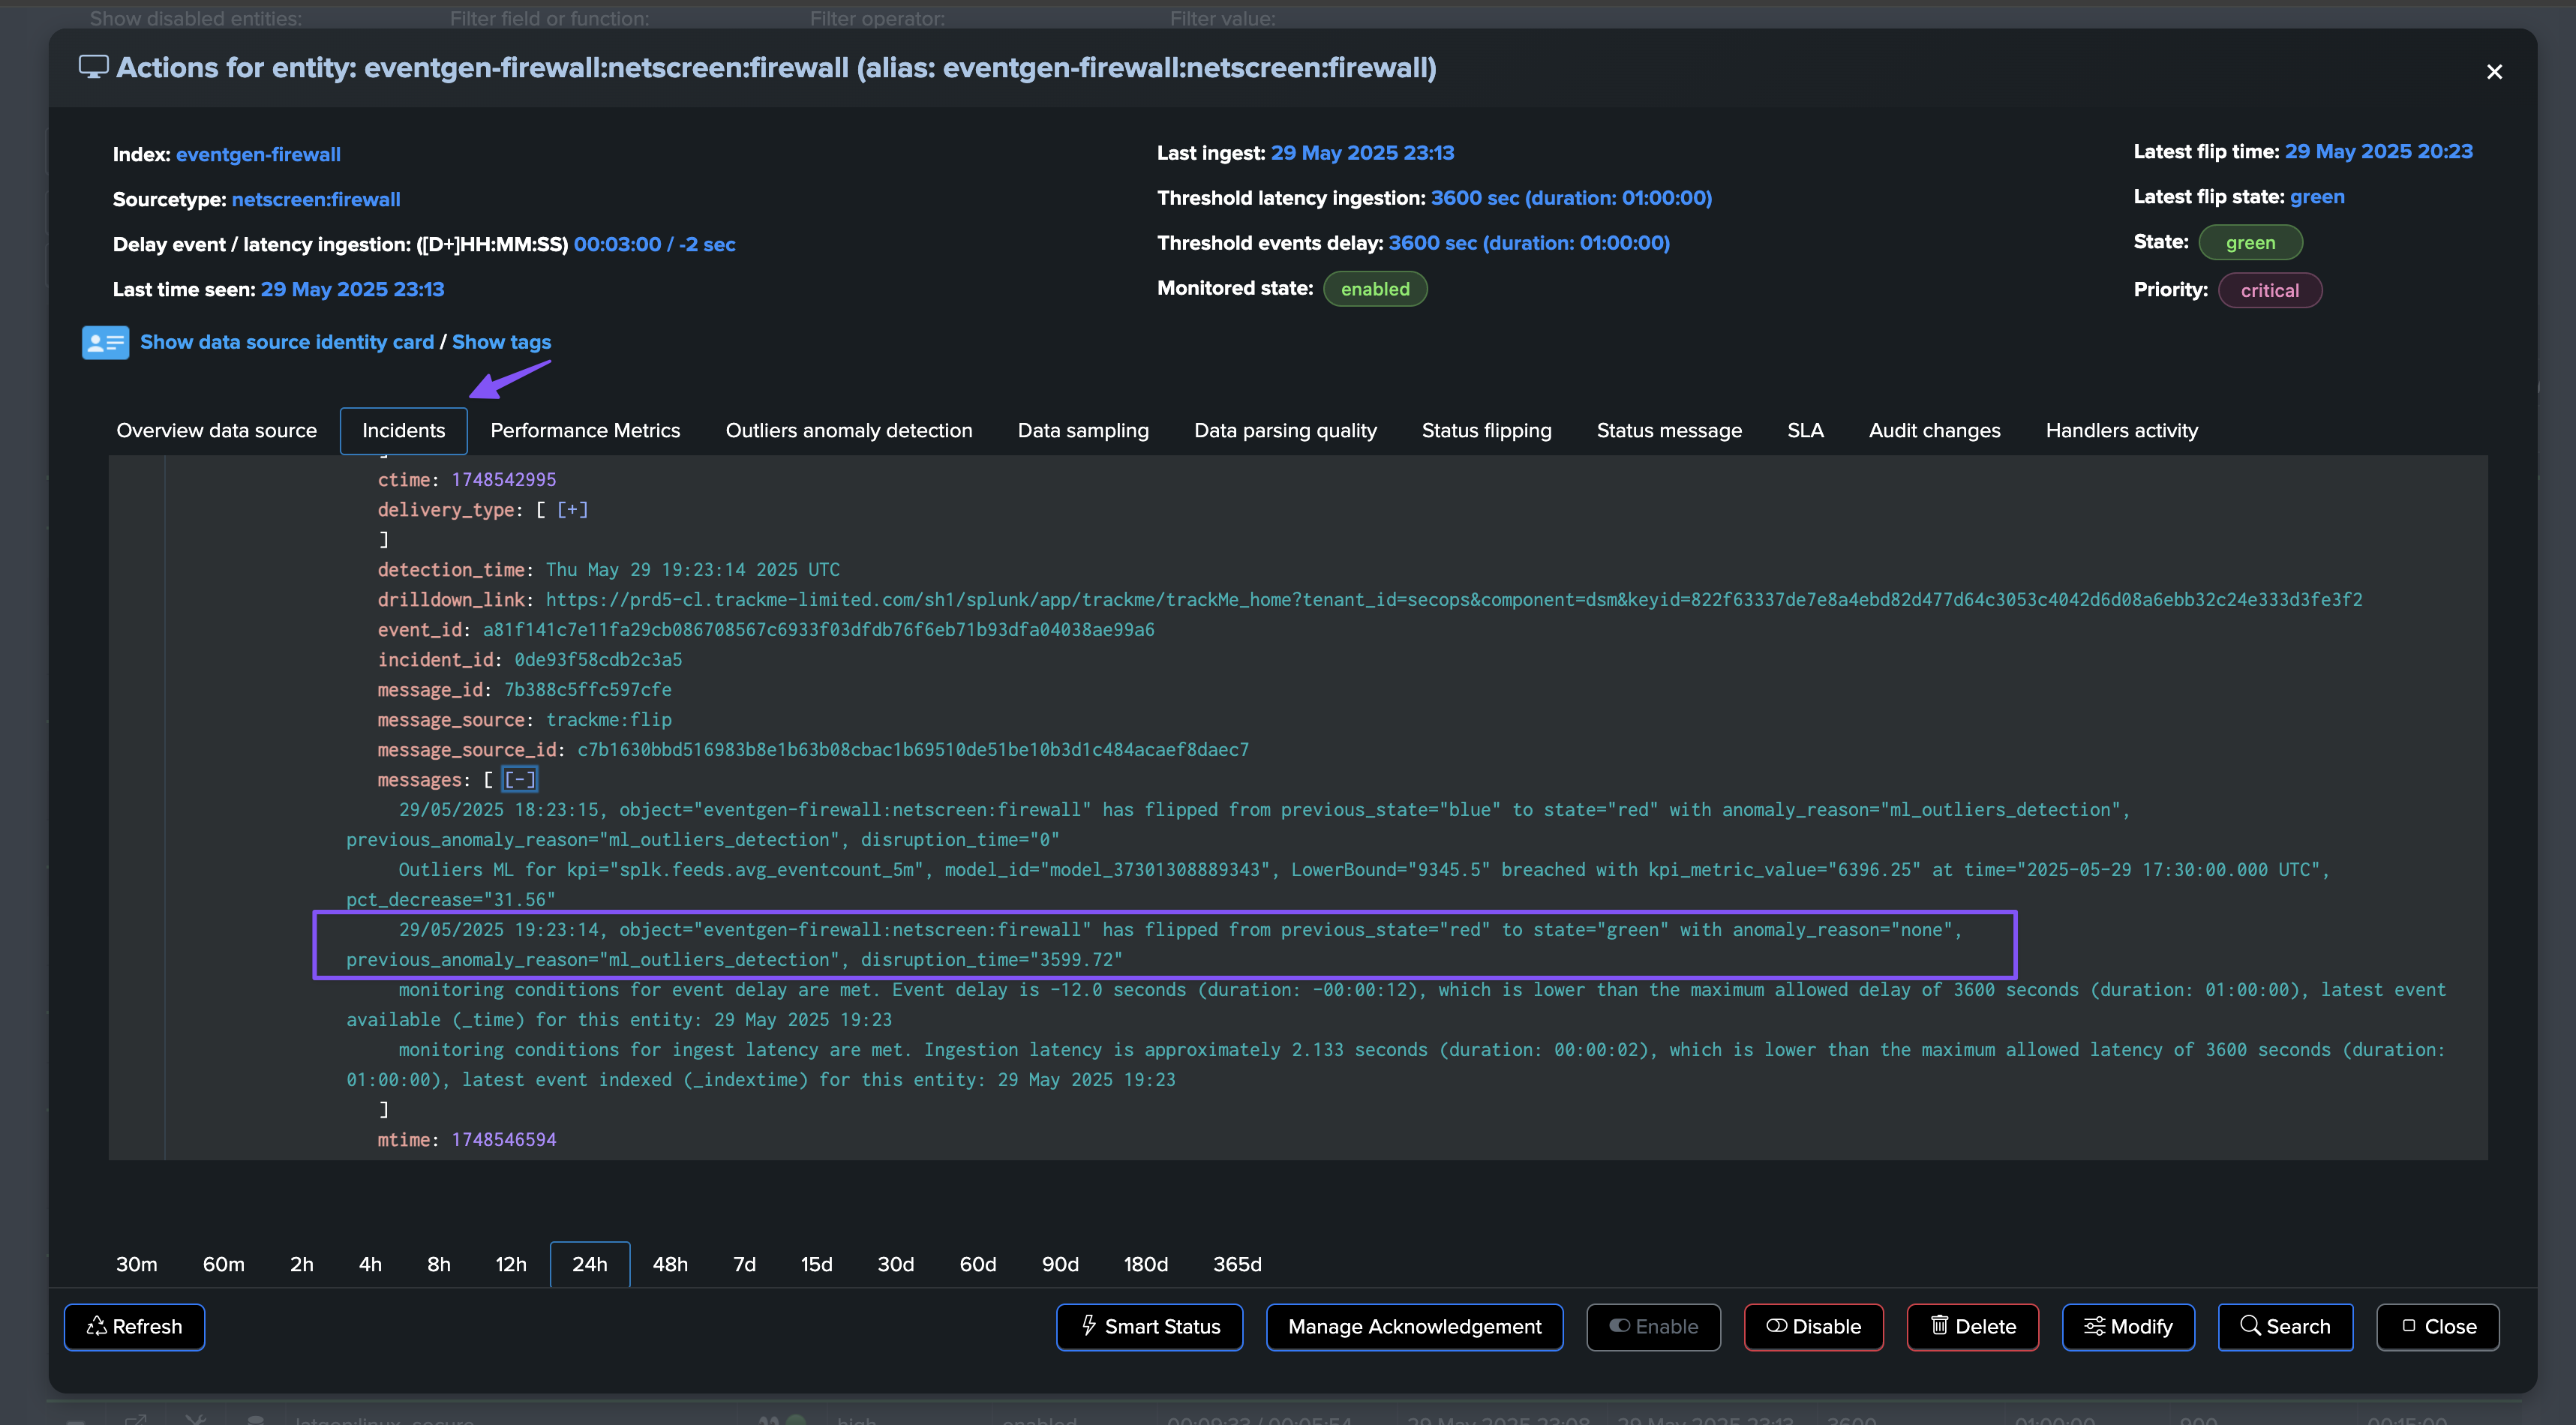
Once the issue is resolved, the entity will return to green after the Outliers anomaly condition is resolved and TrackMe has processed the ML rendering for this entity: (this can take some time depending on your settings and scale)
The incident is closed and a closure notification is sent:

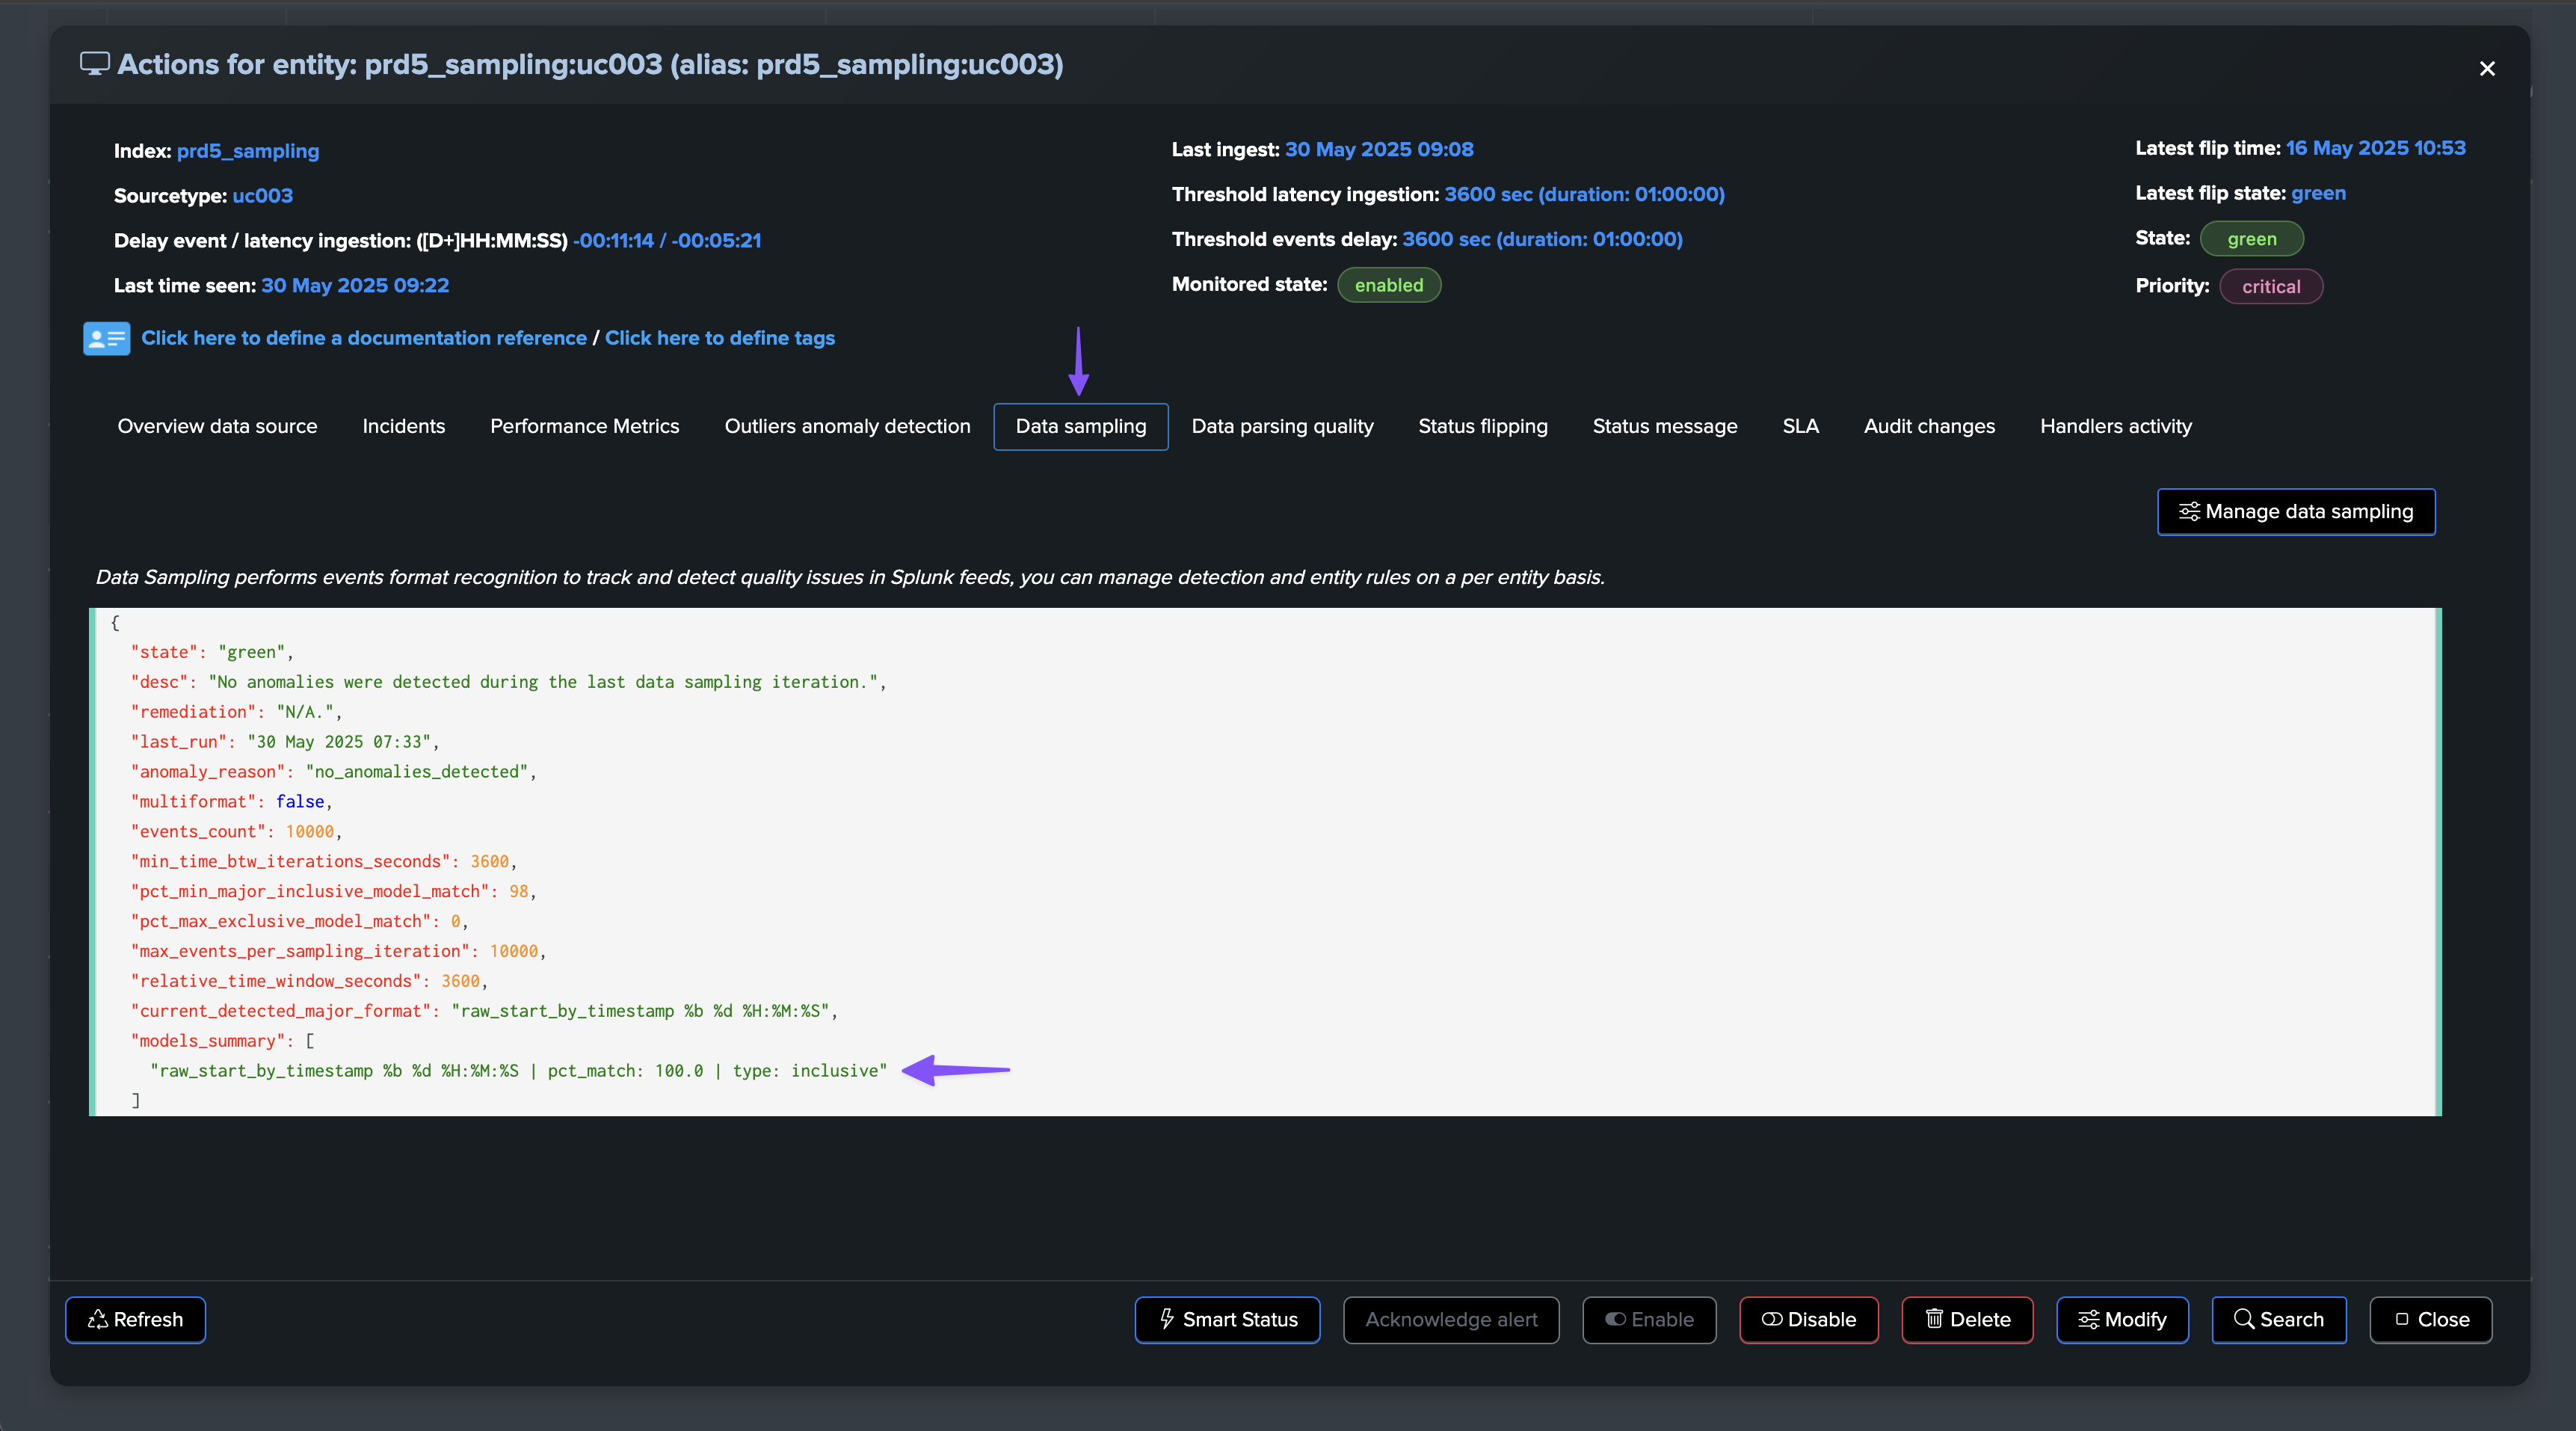
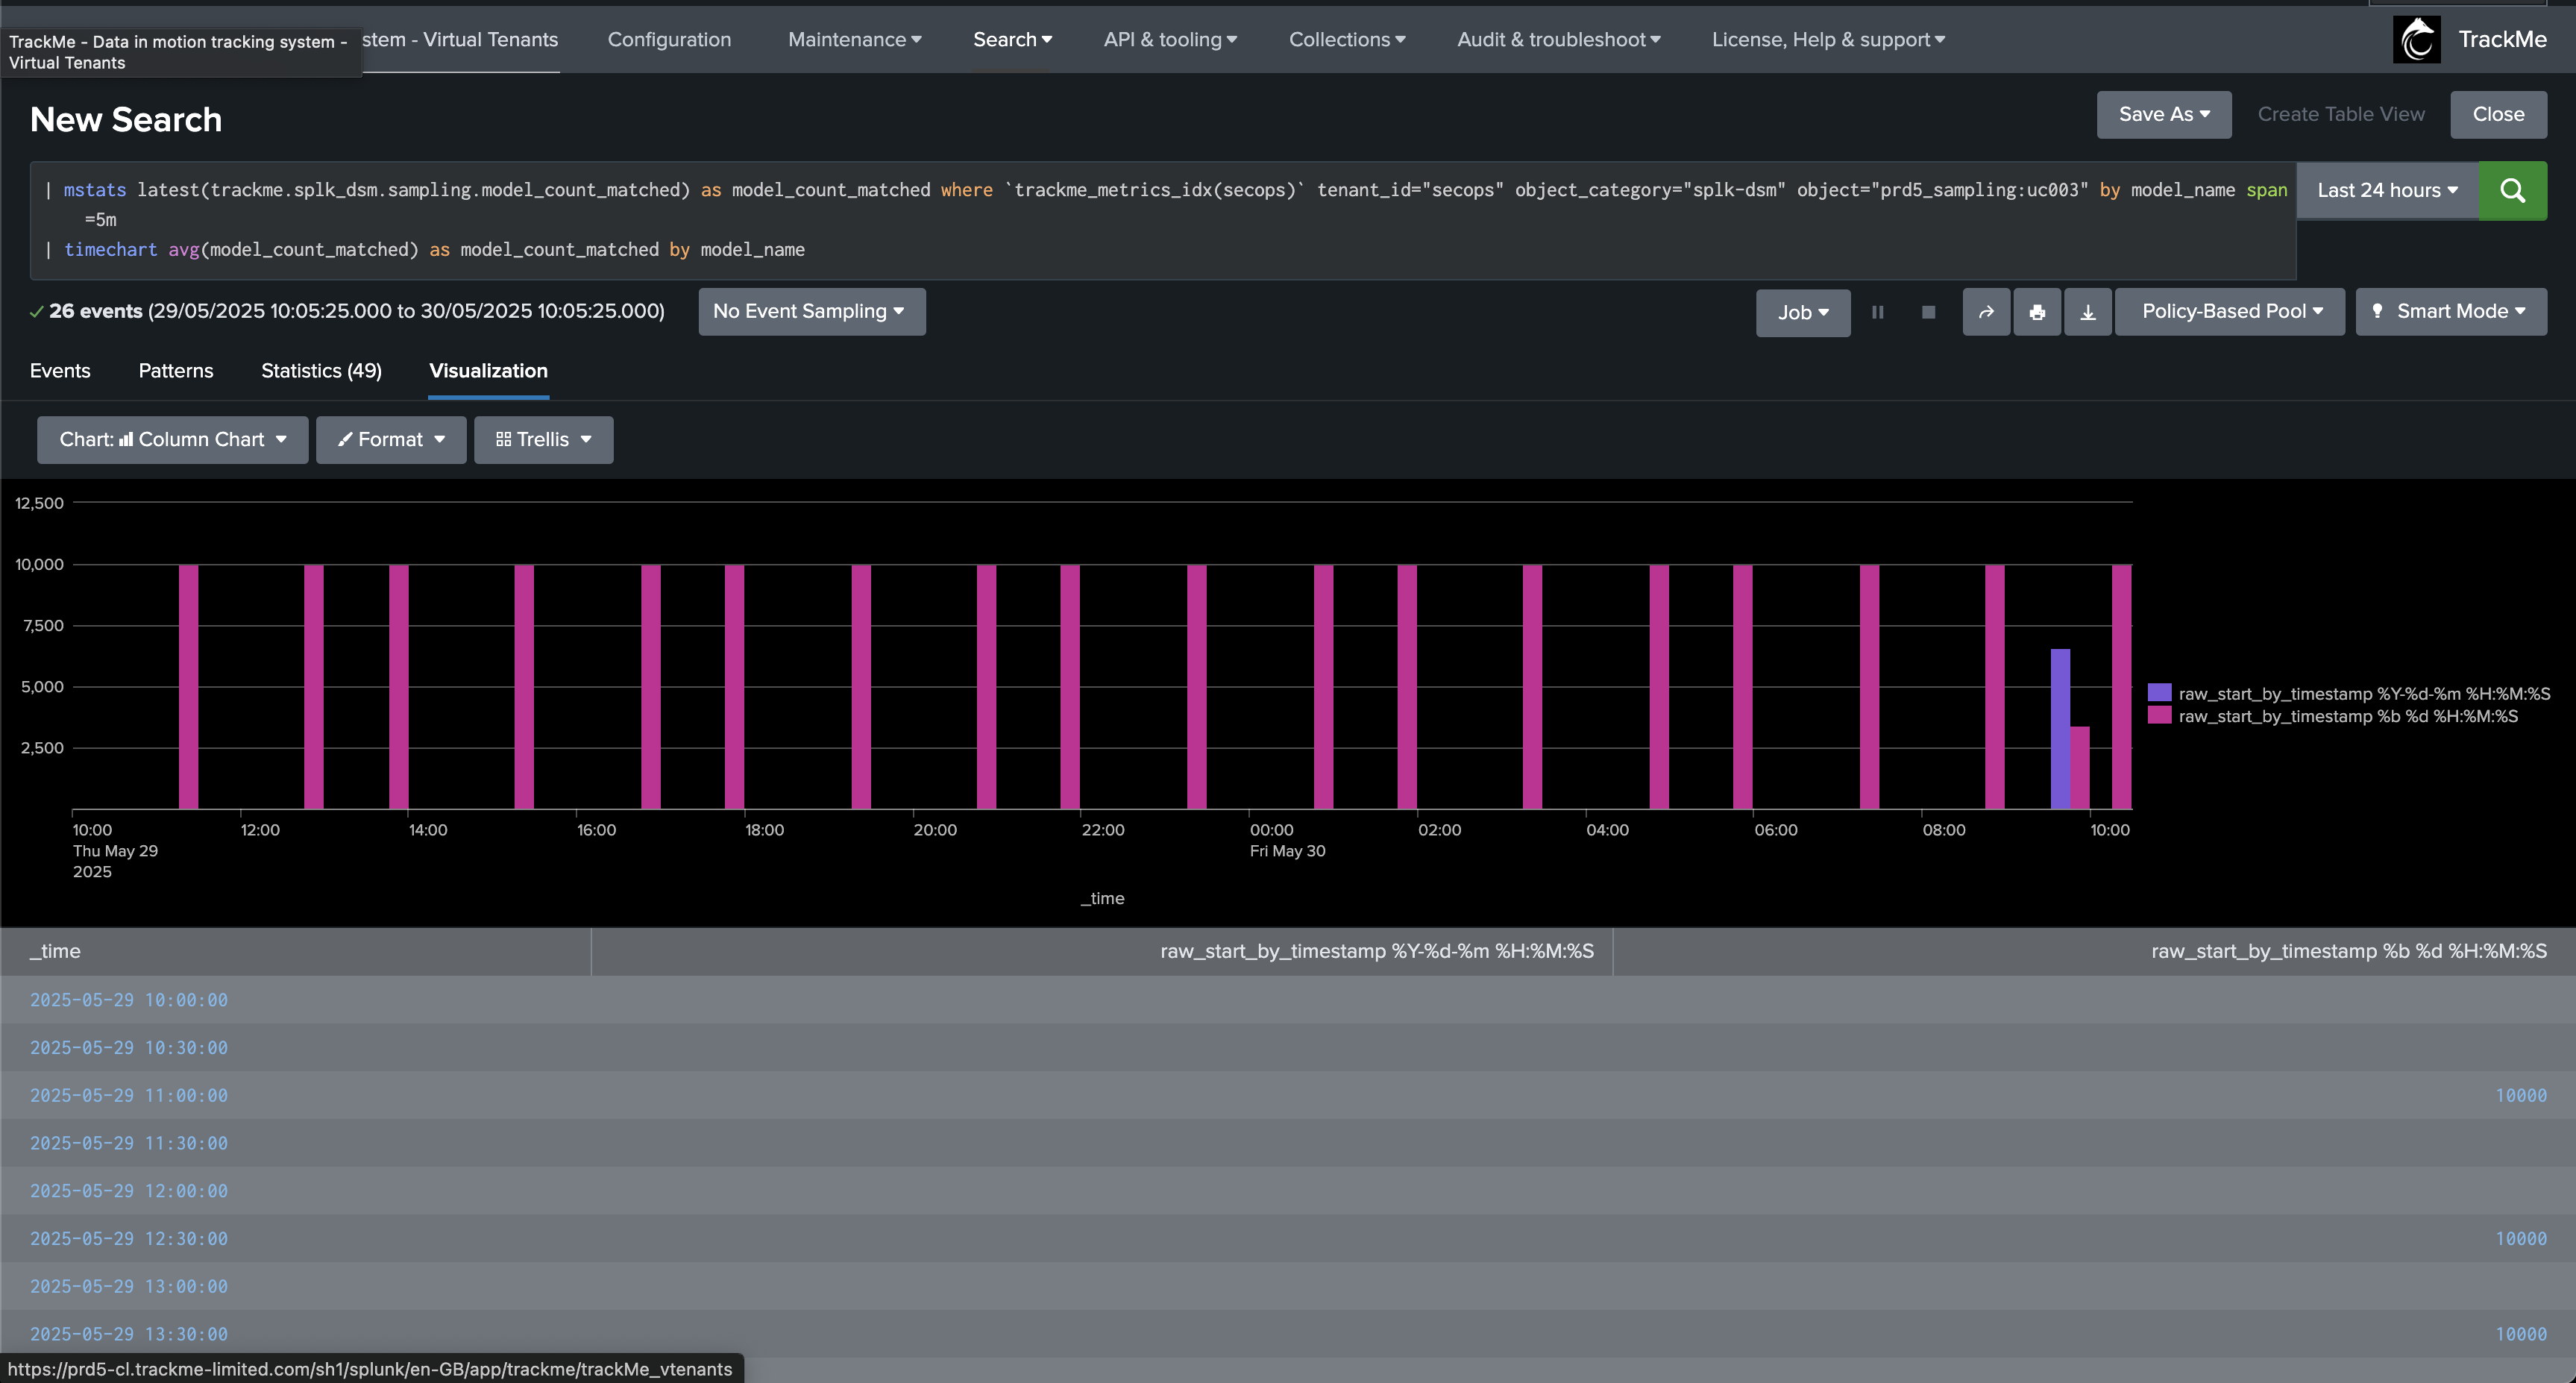
Use Case: Quality Issues Detection (Event Format Recognition)
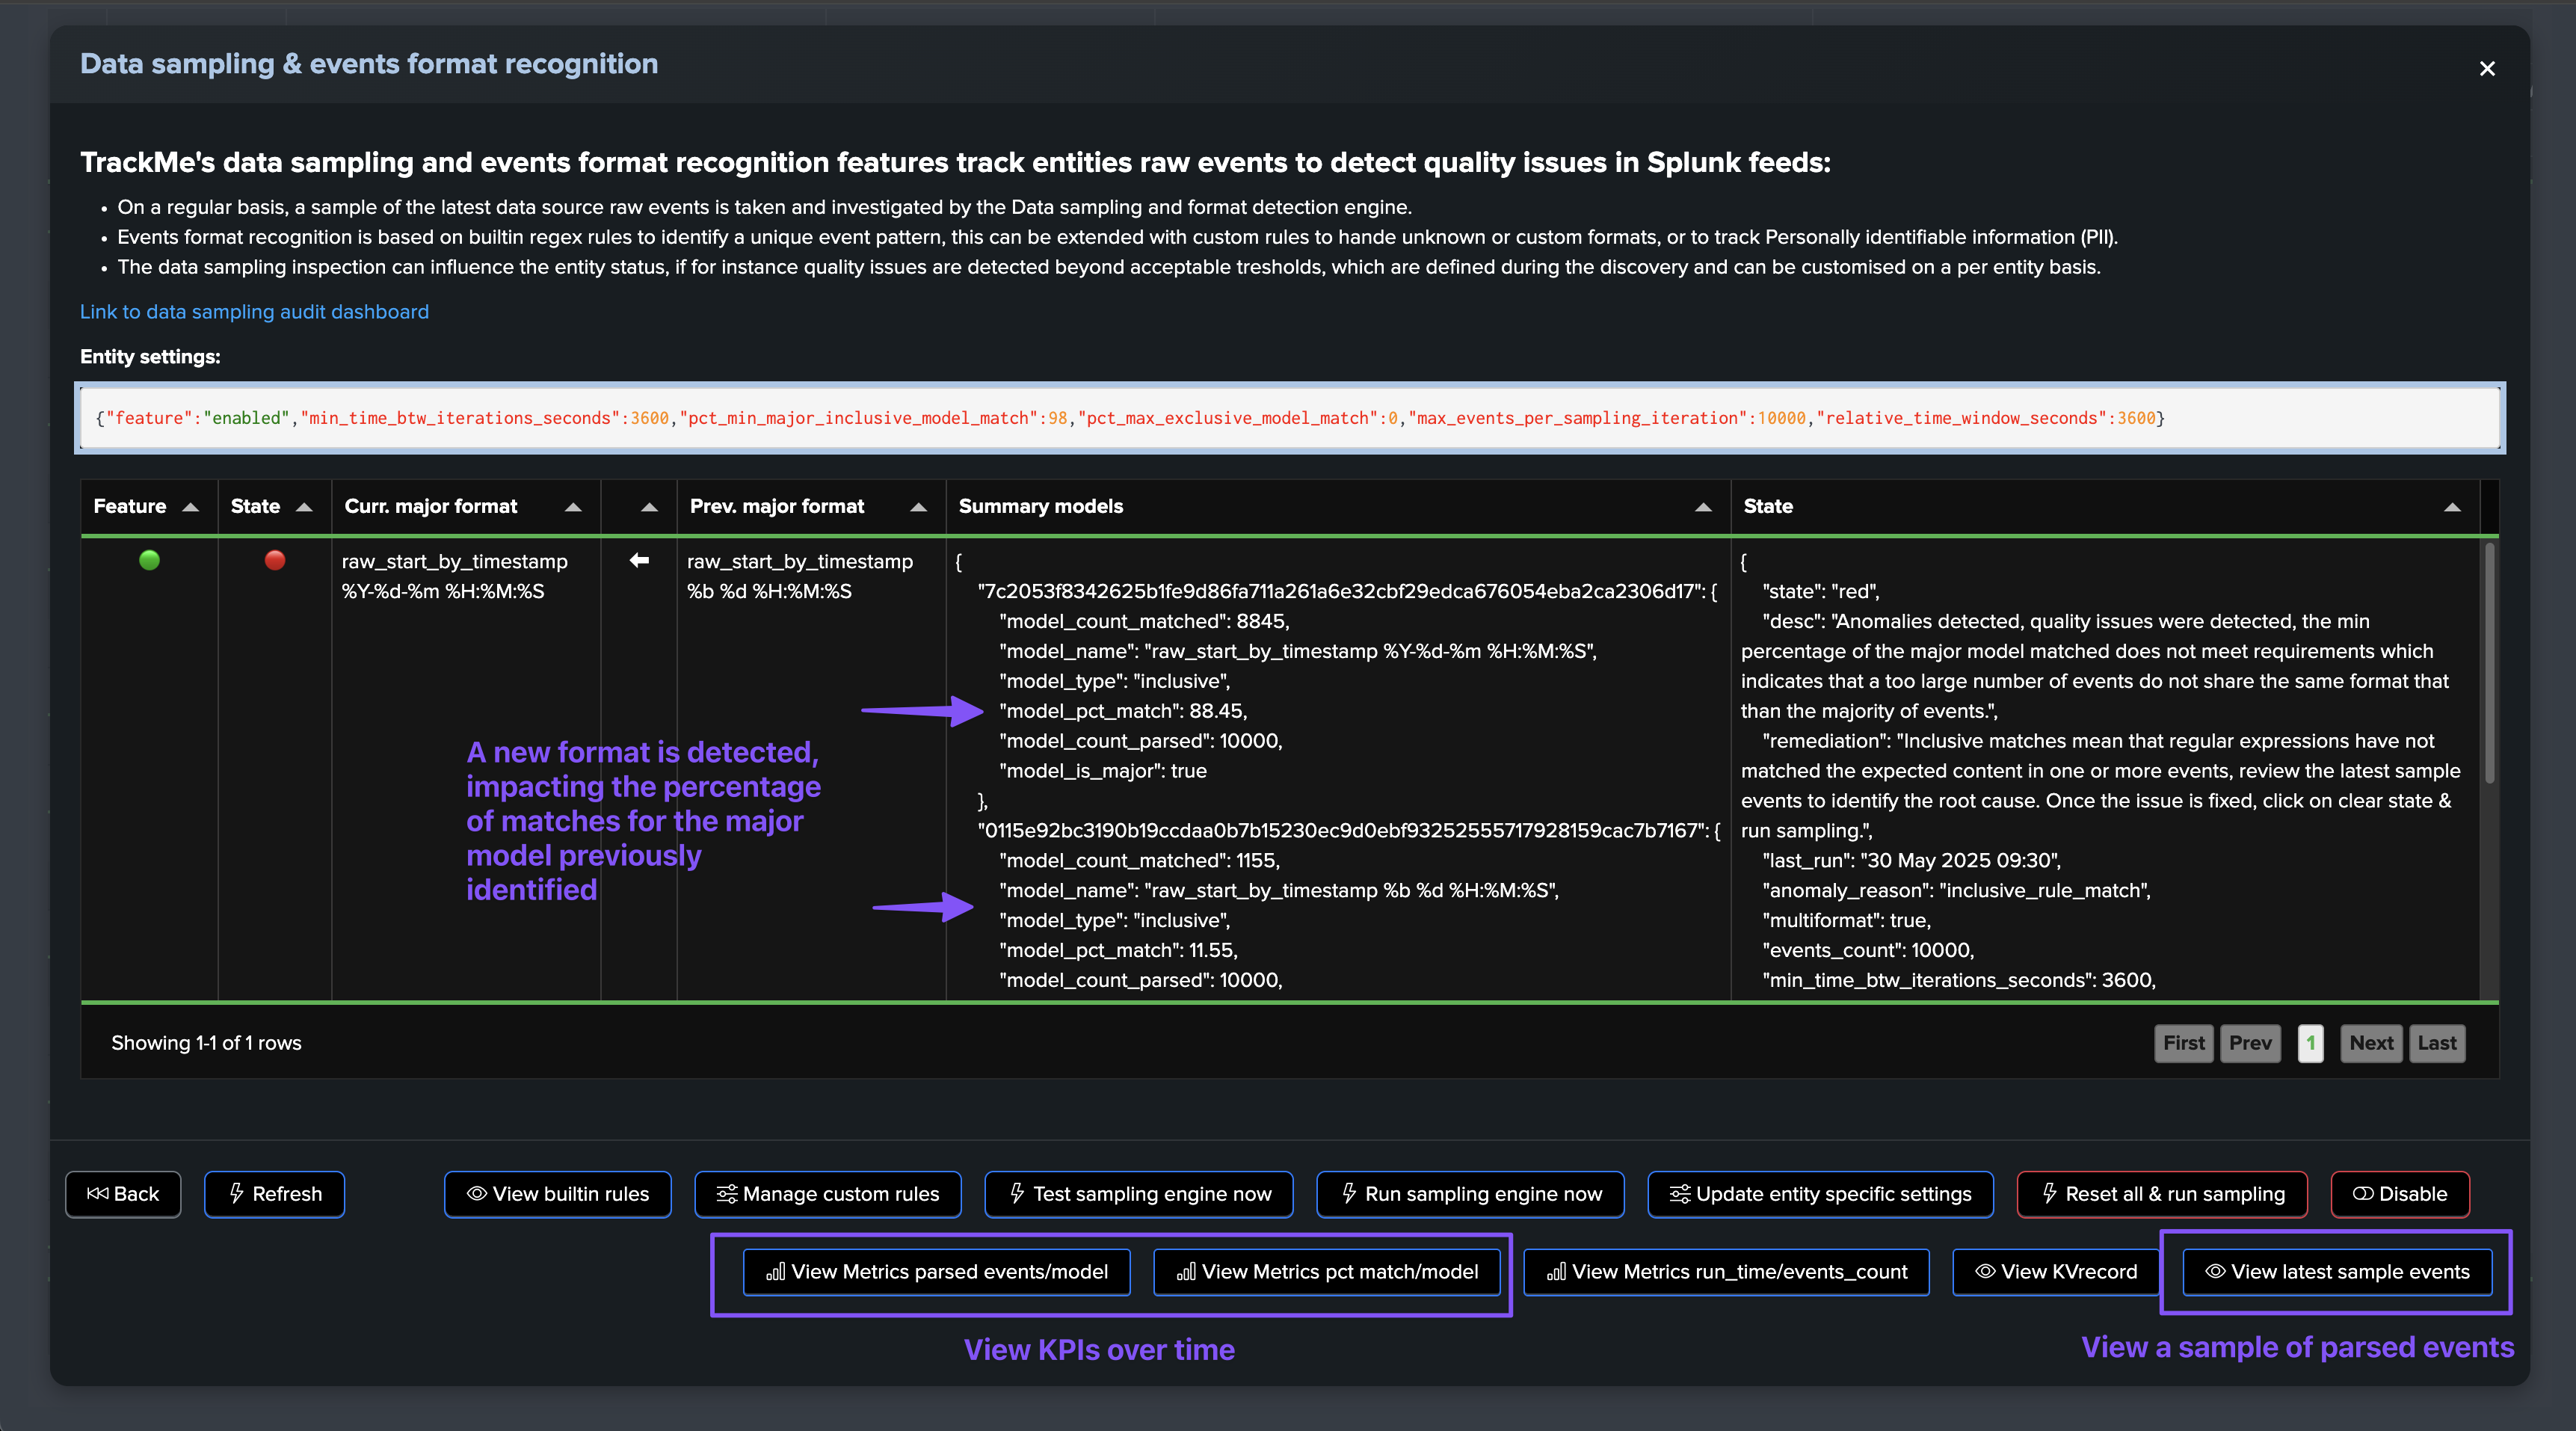
In Data Source monitoring (splk-dsm), TrackMe performs automated event format recognition using the events format recognition engine.
During this process, we will pick samples of events regularly, 10k events by default, which will be processed through the engine to detect the format of events, classified by types.
By default, TrackMe would alert against a lack of quality if it detects that the main format goes below 98% of the events being correctly classified.
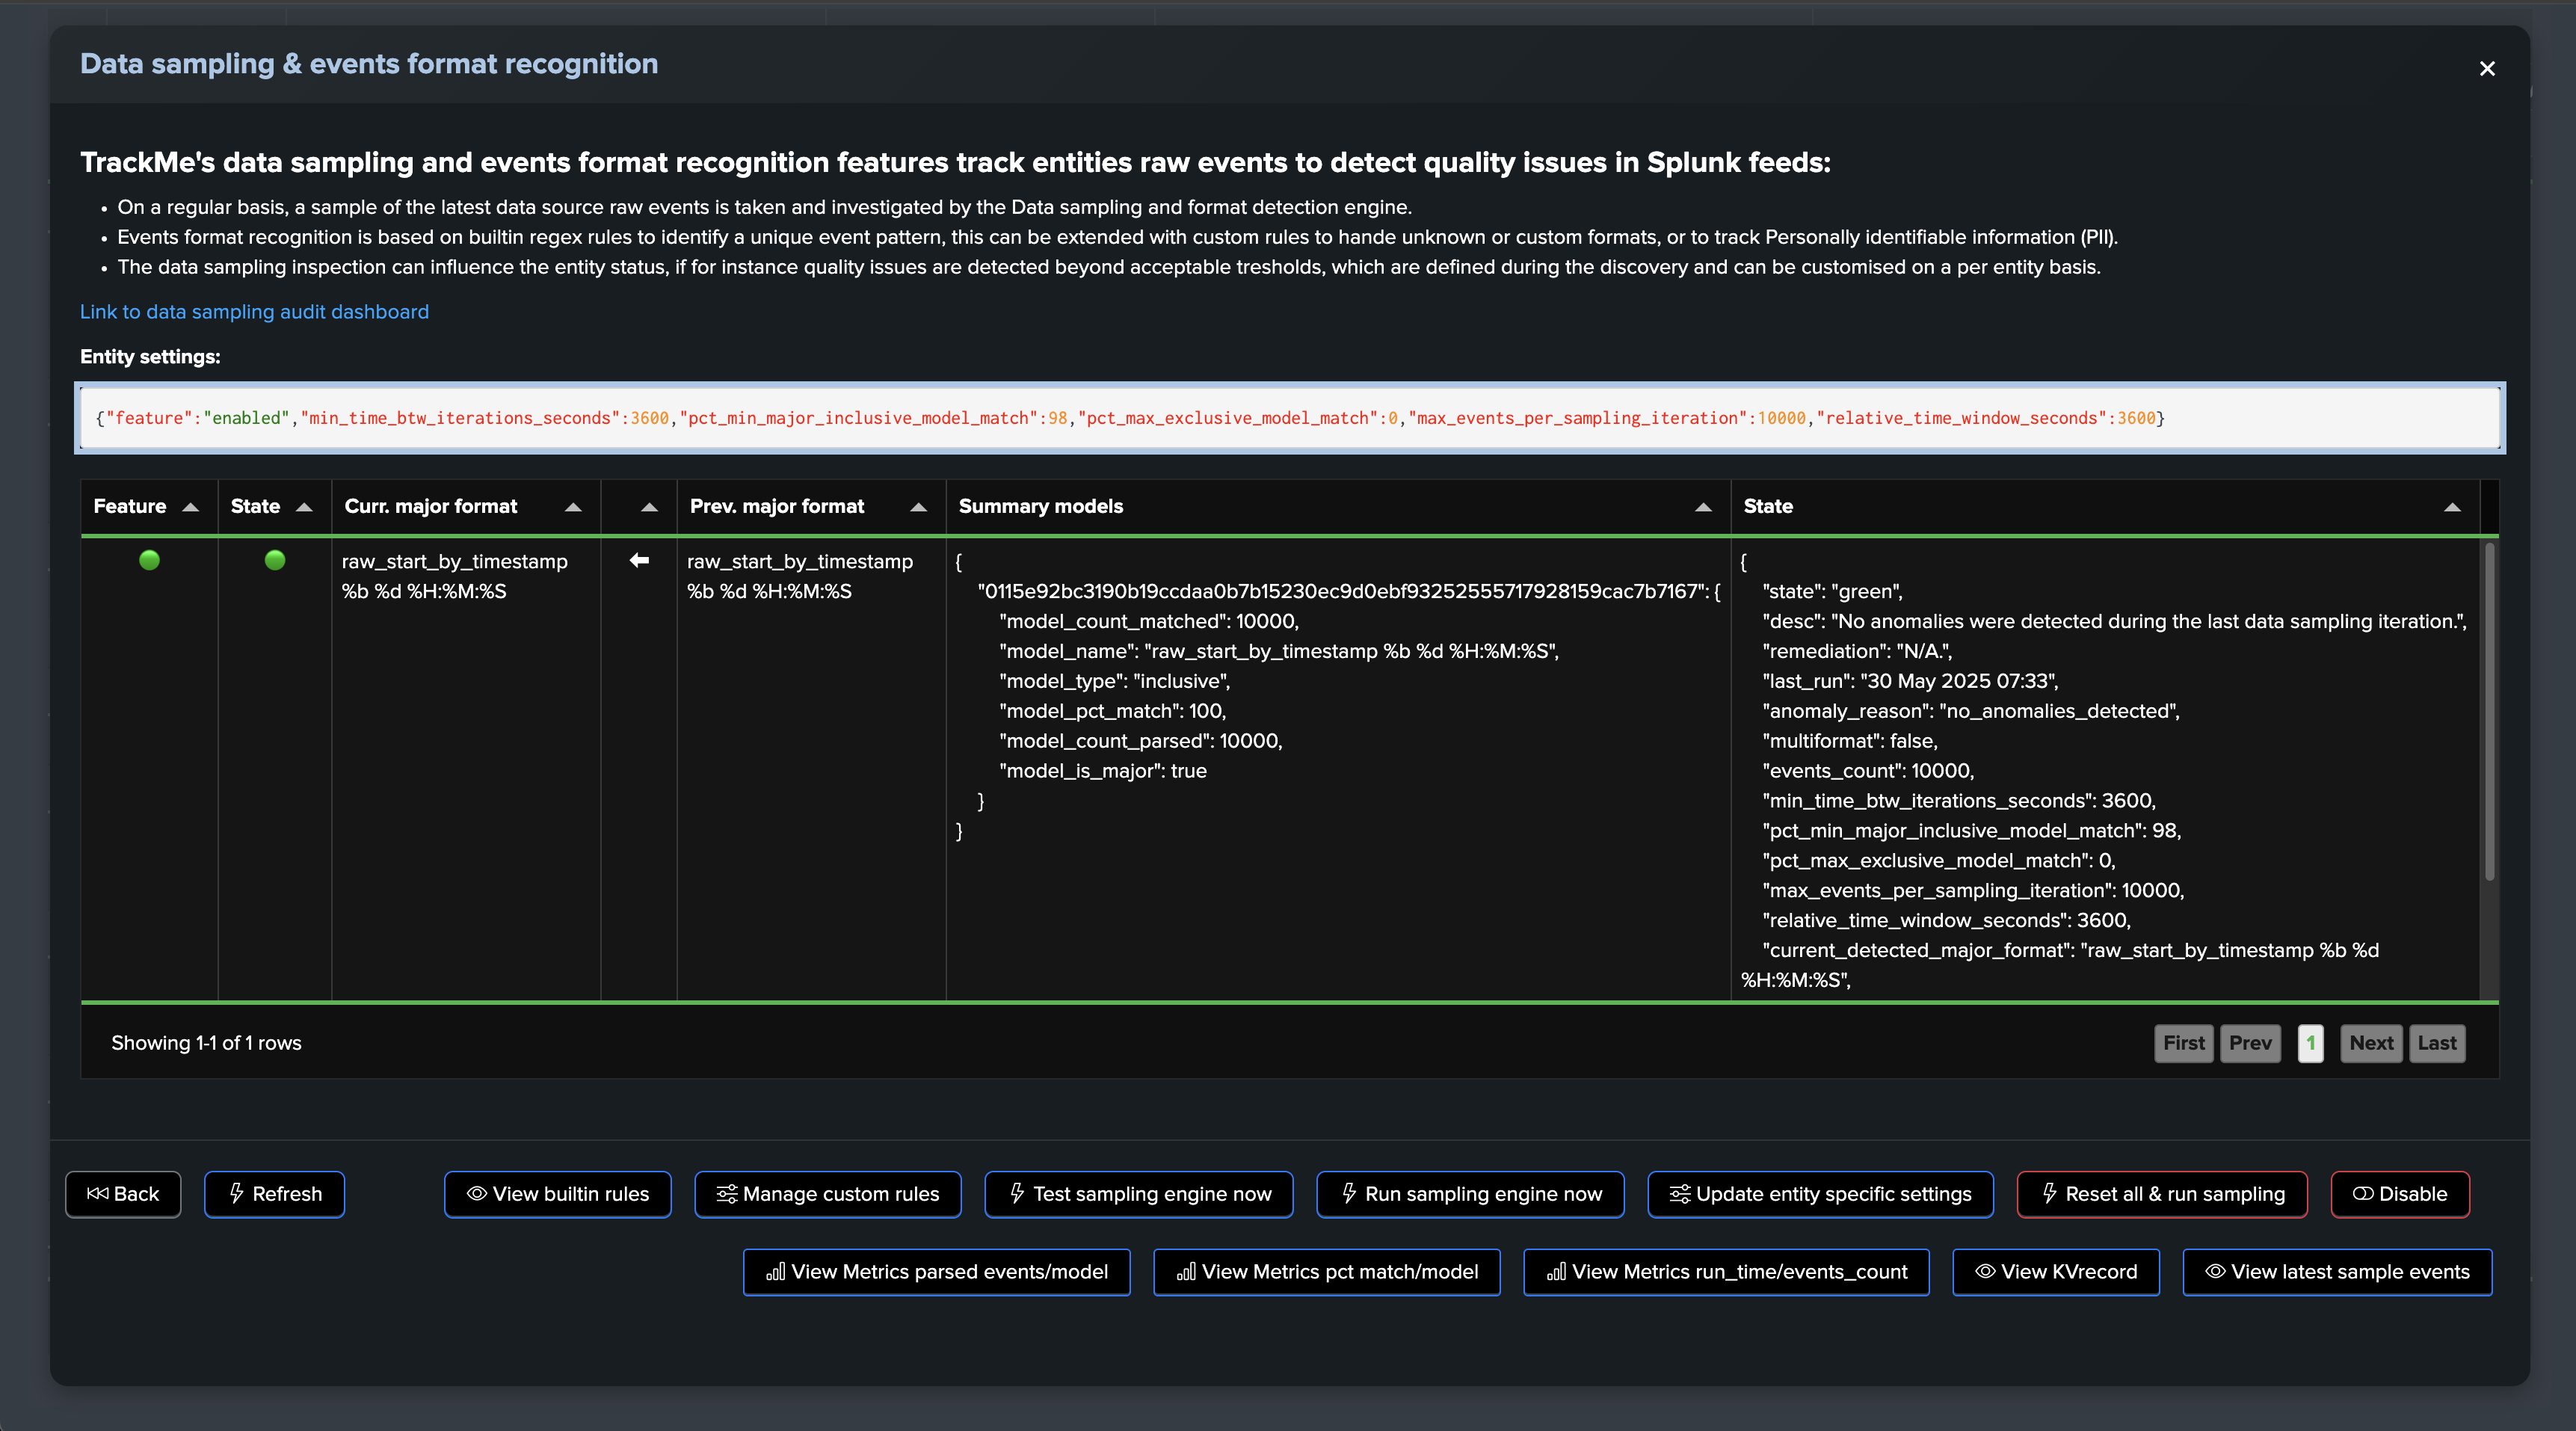
Let’s consider the following entity, the data sampling engine detected a single format and the entity is considered as healthy:
At some point, new sources are being on-boarded within the same sourcetype, however, mistakenly the expected format is not configured properly and events are making it with a different and non-expected structure:
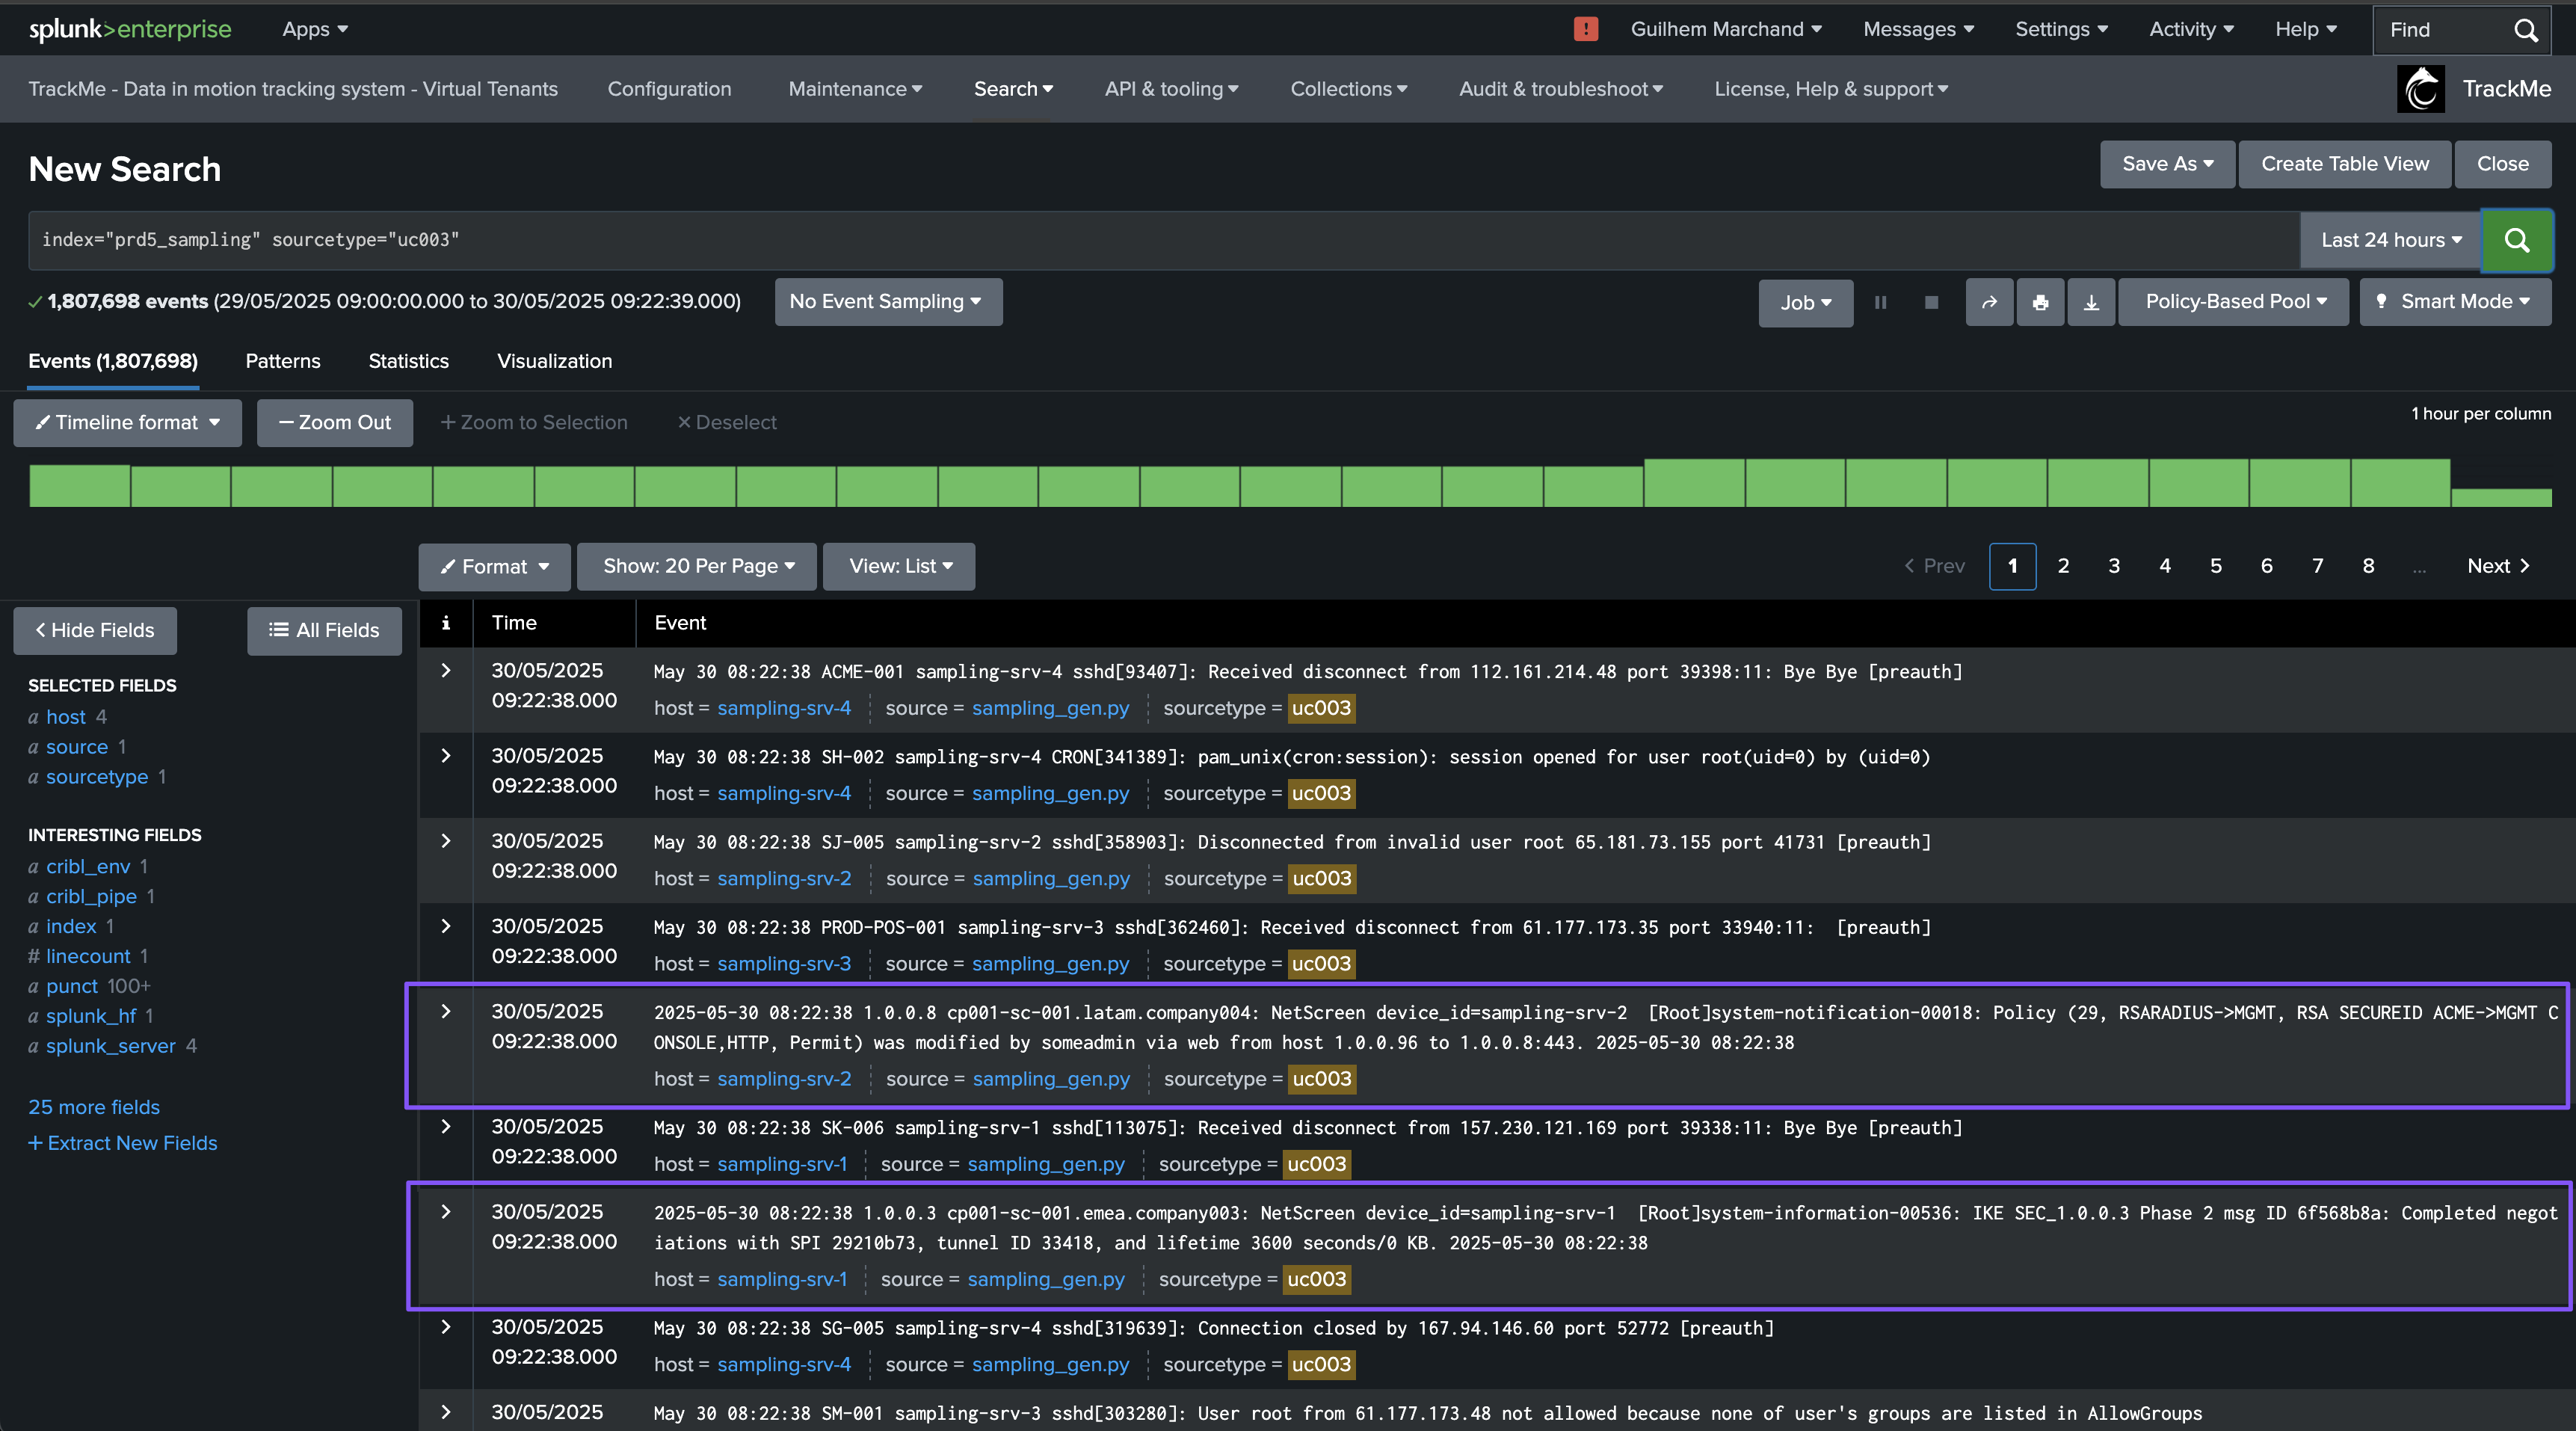
This may or may not be a strong issue, but in most use cases, receiving different types of events within the same sourcetype is not expected and leads to failures at the index time level, for instance, the timestamp extraction, or at search time with failures to extract fields for unstructured events.
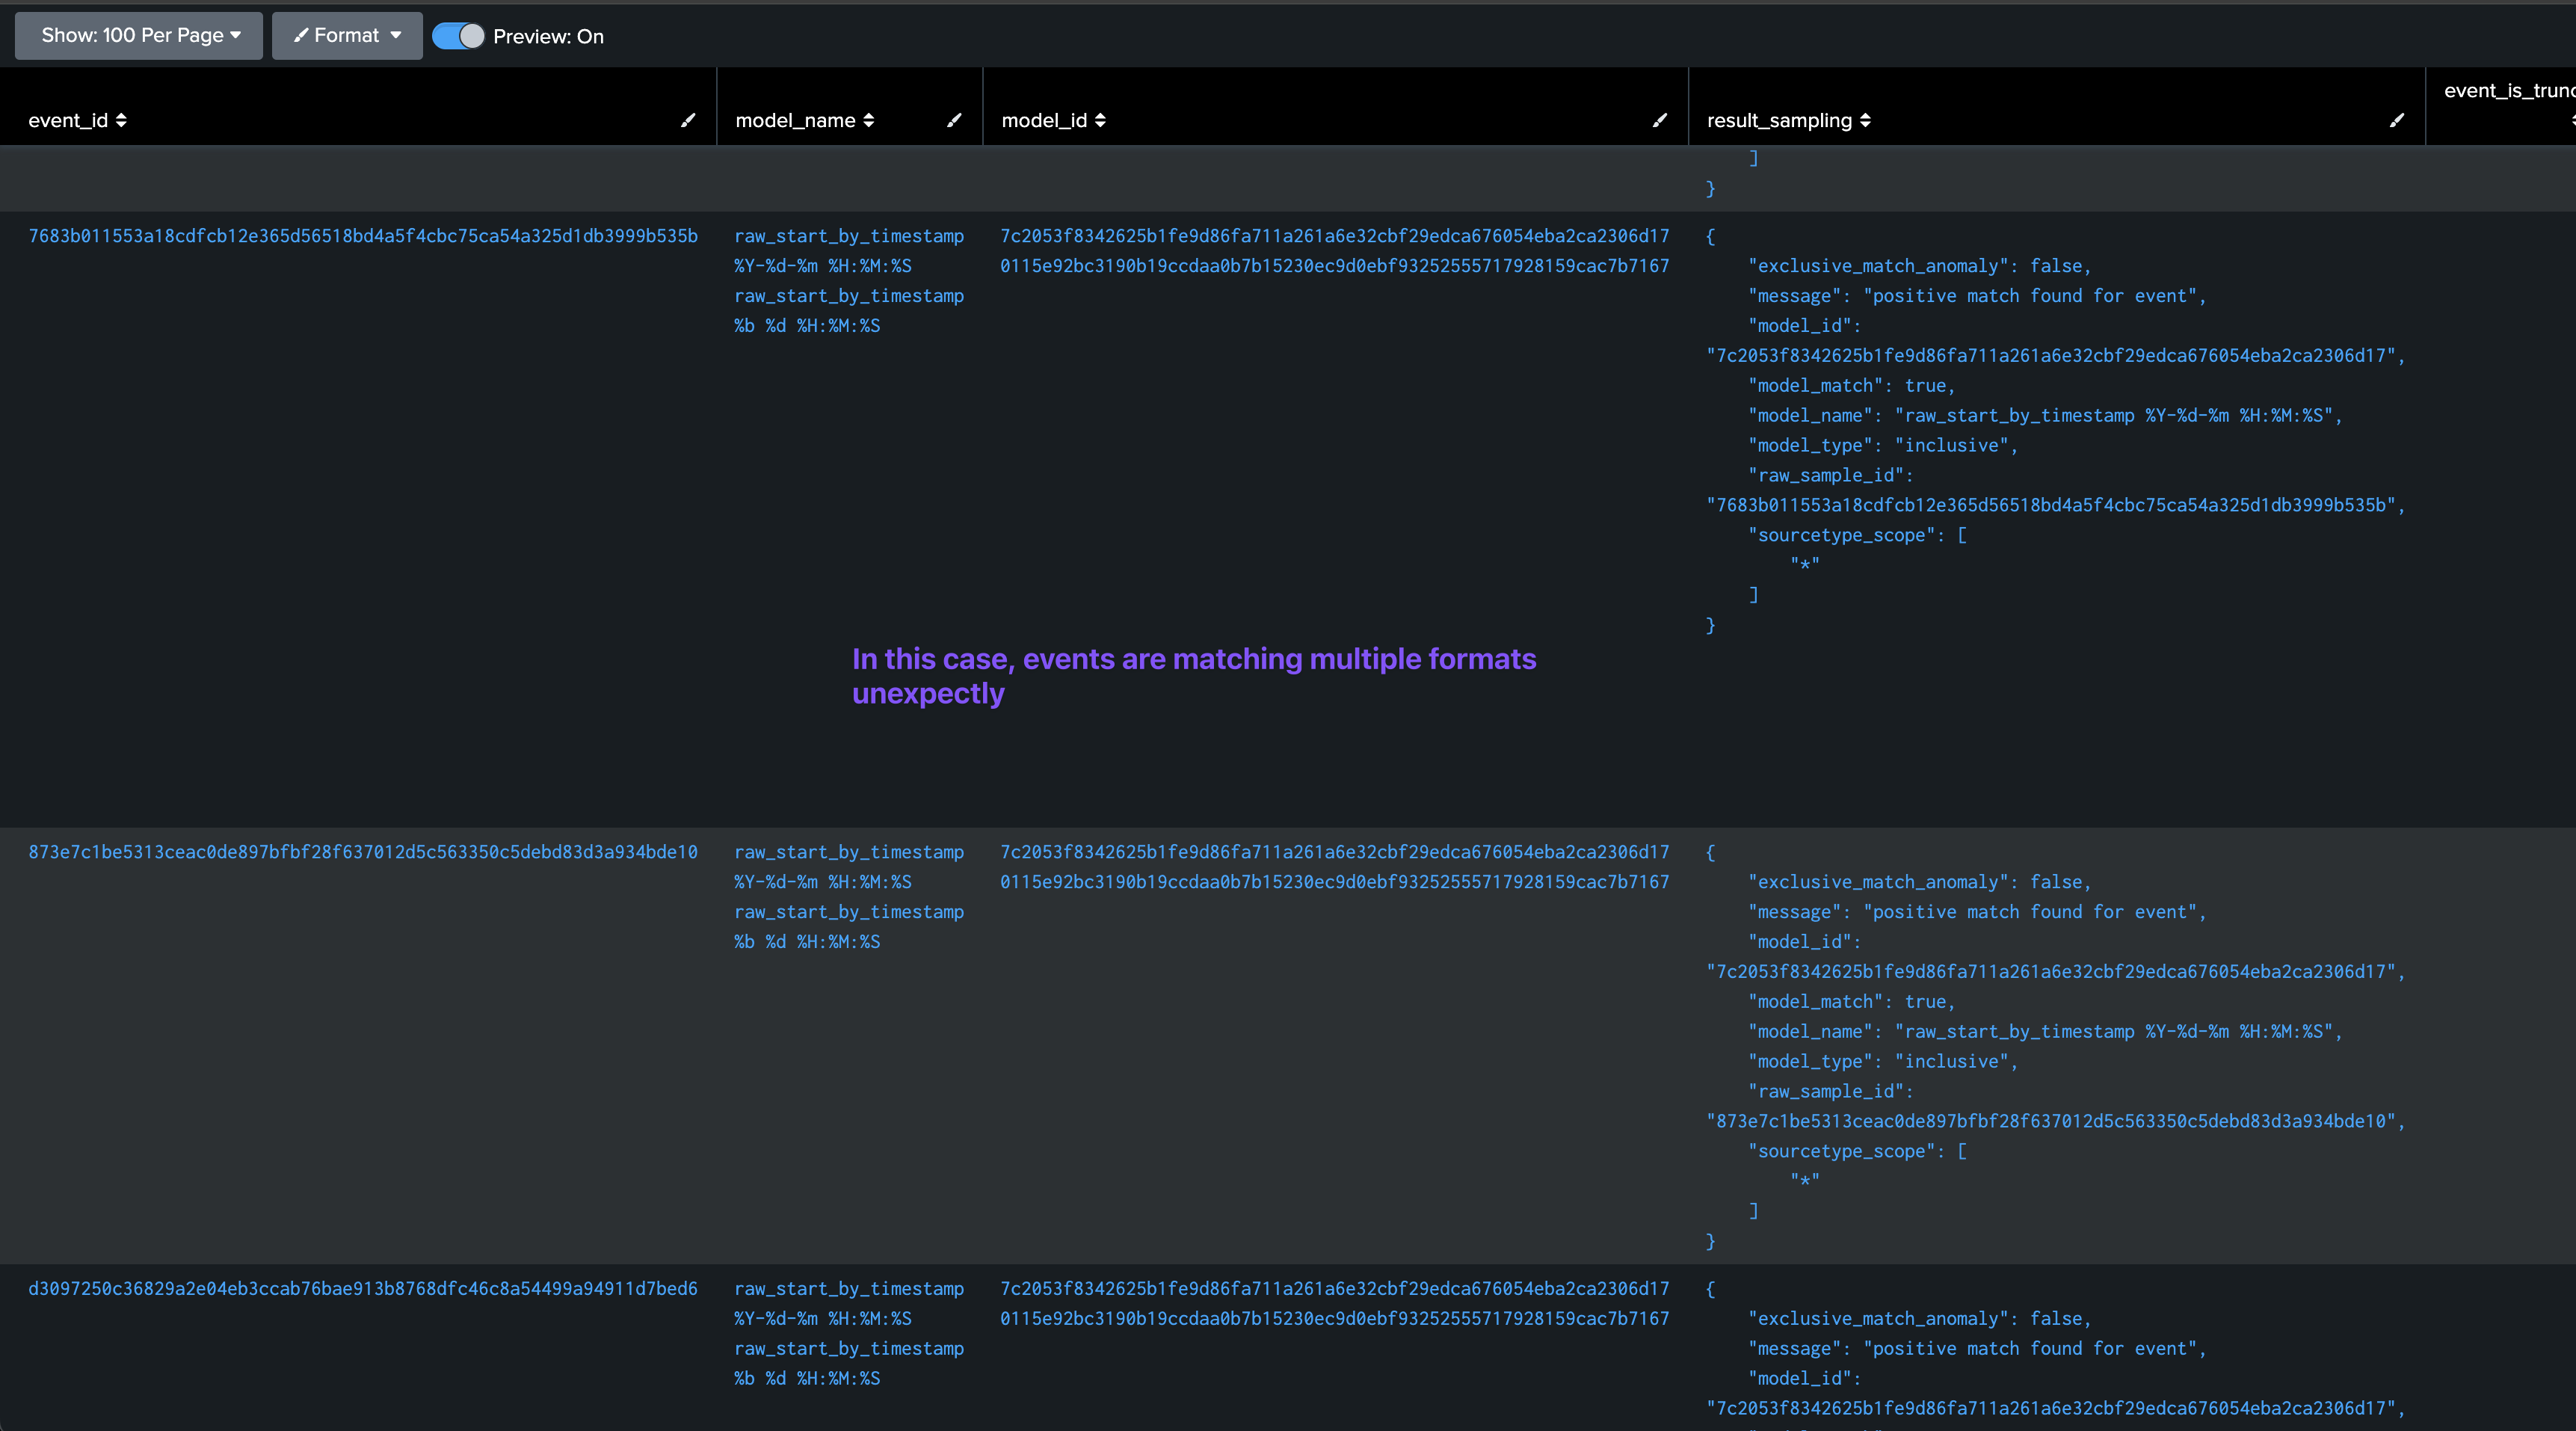
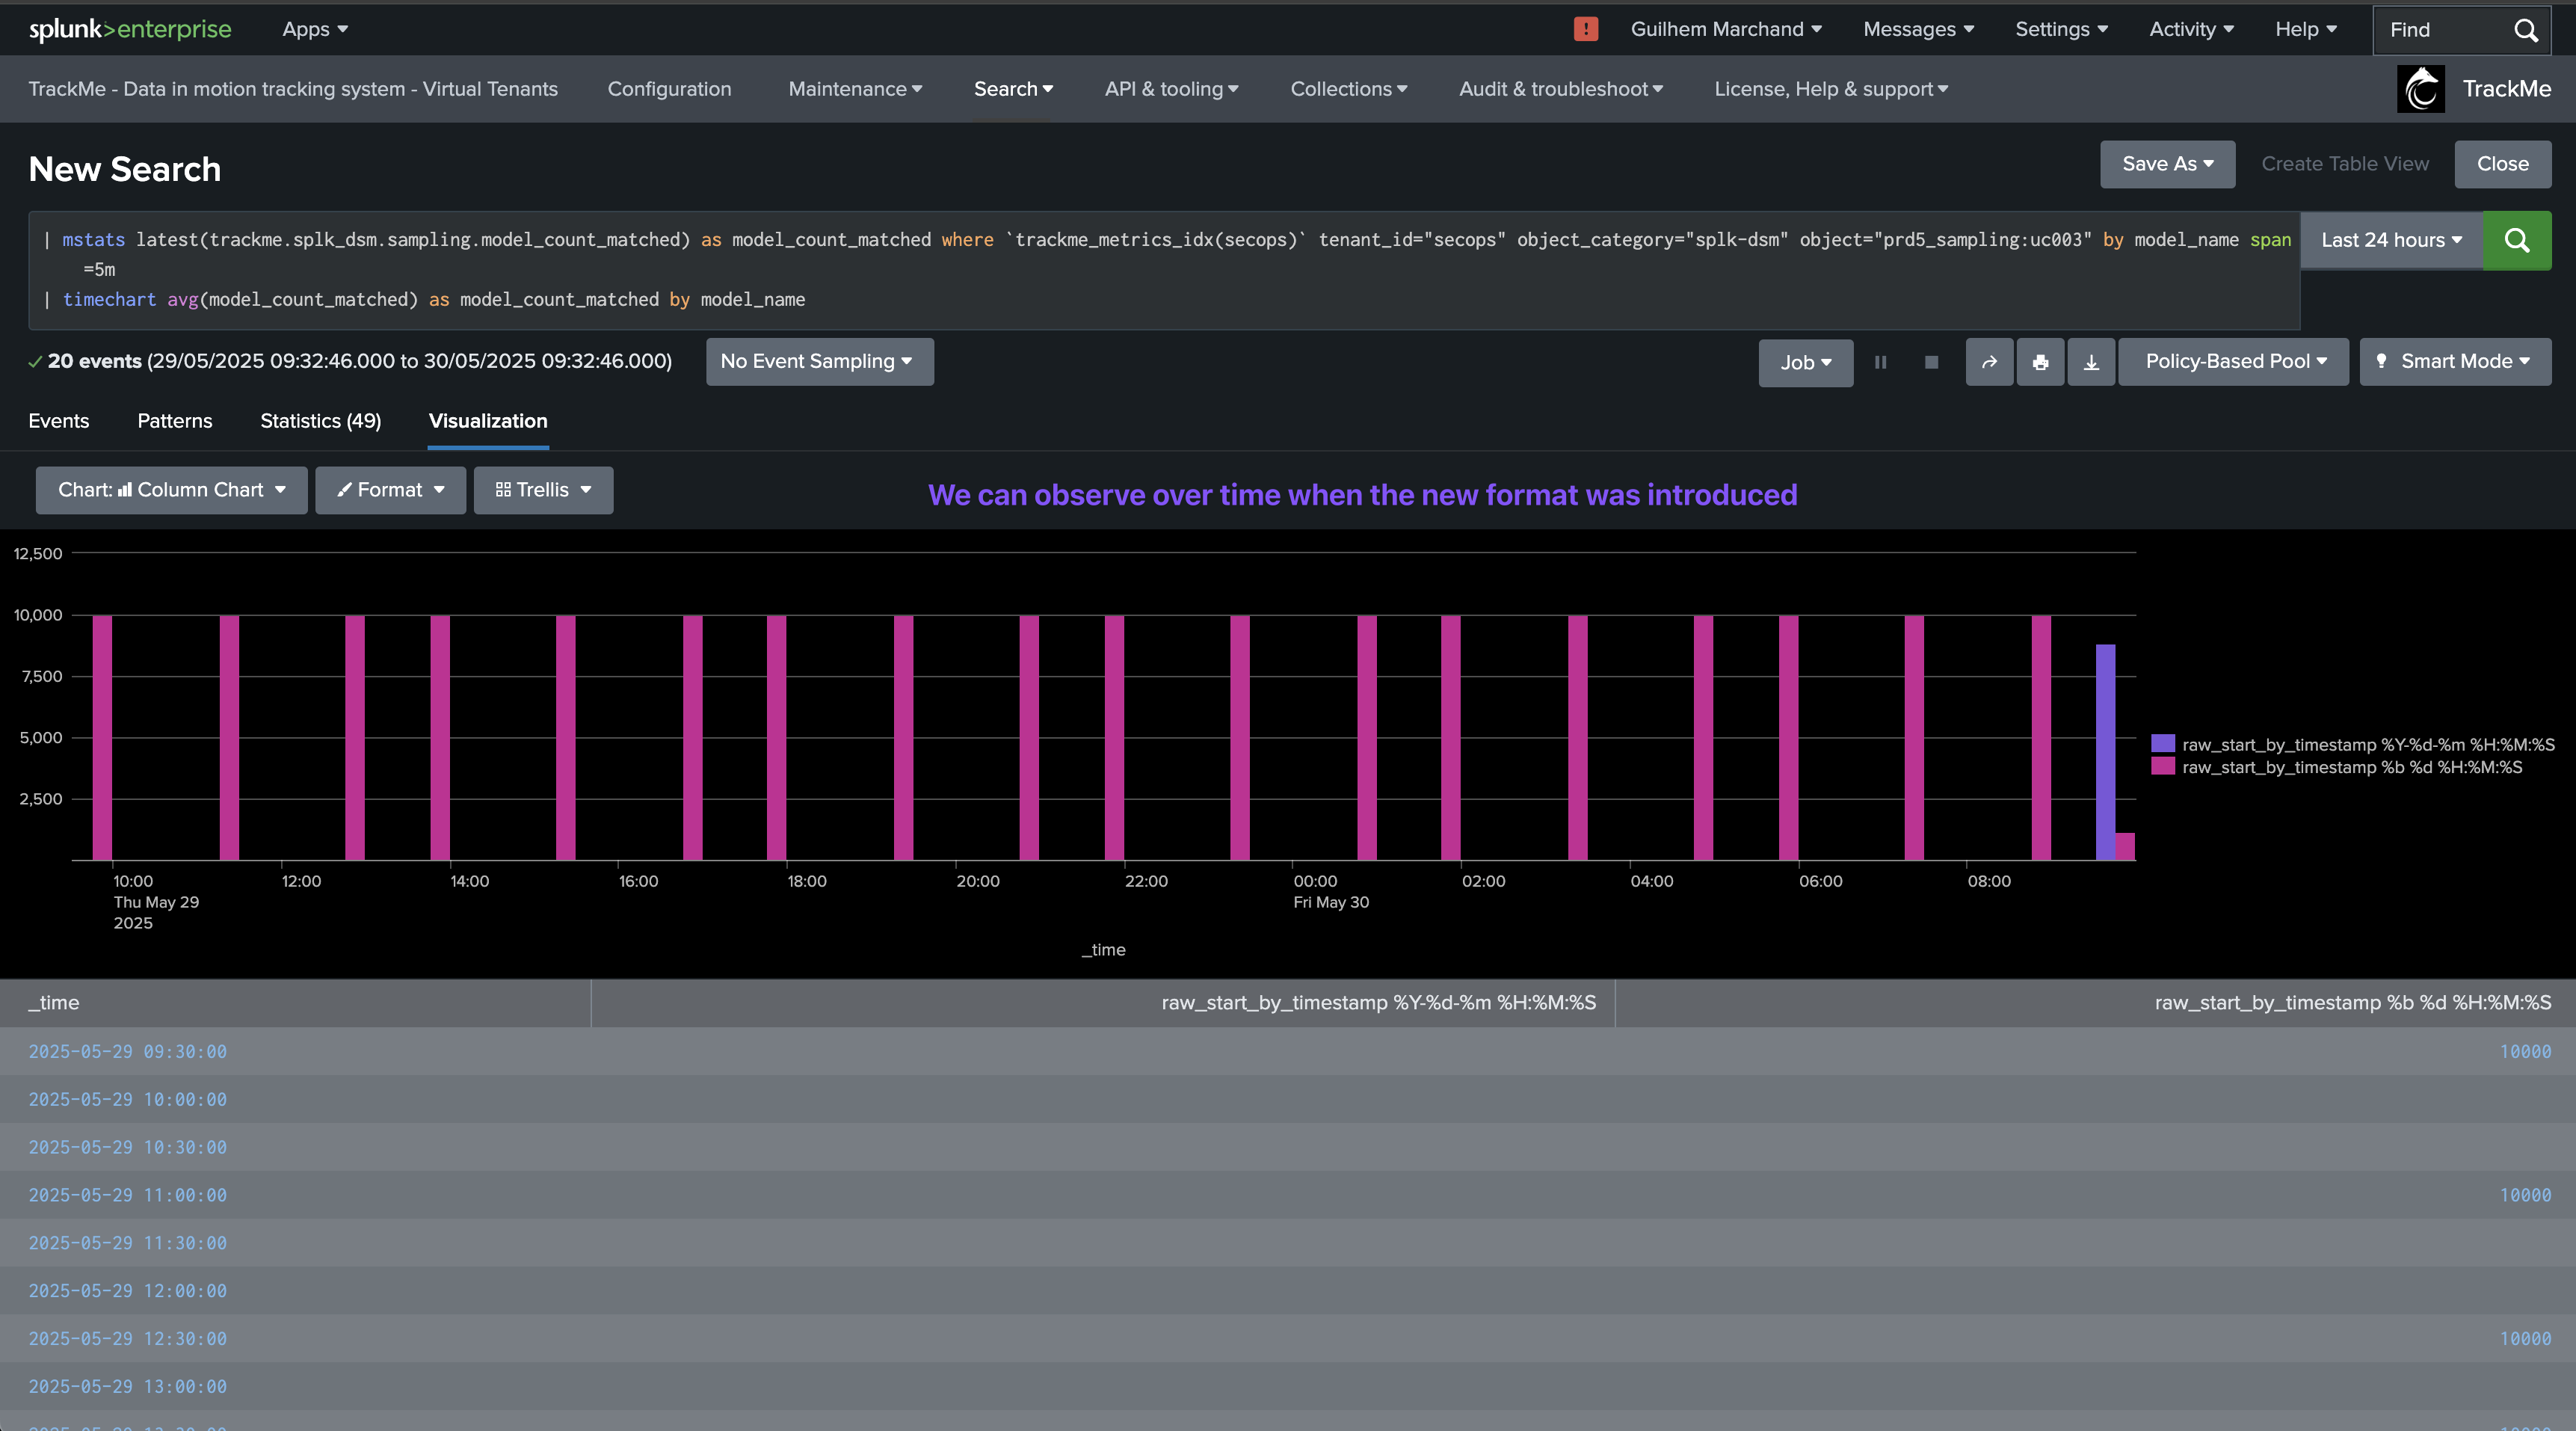
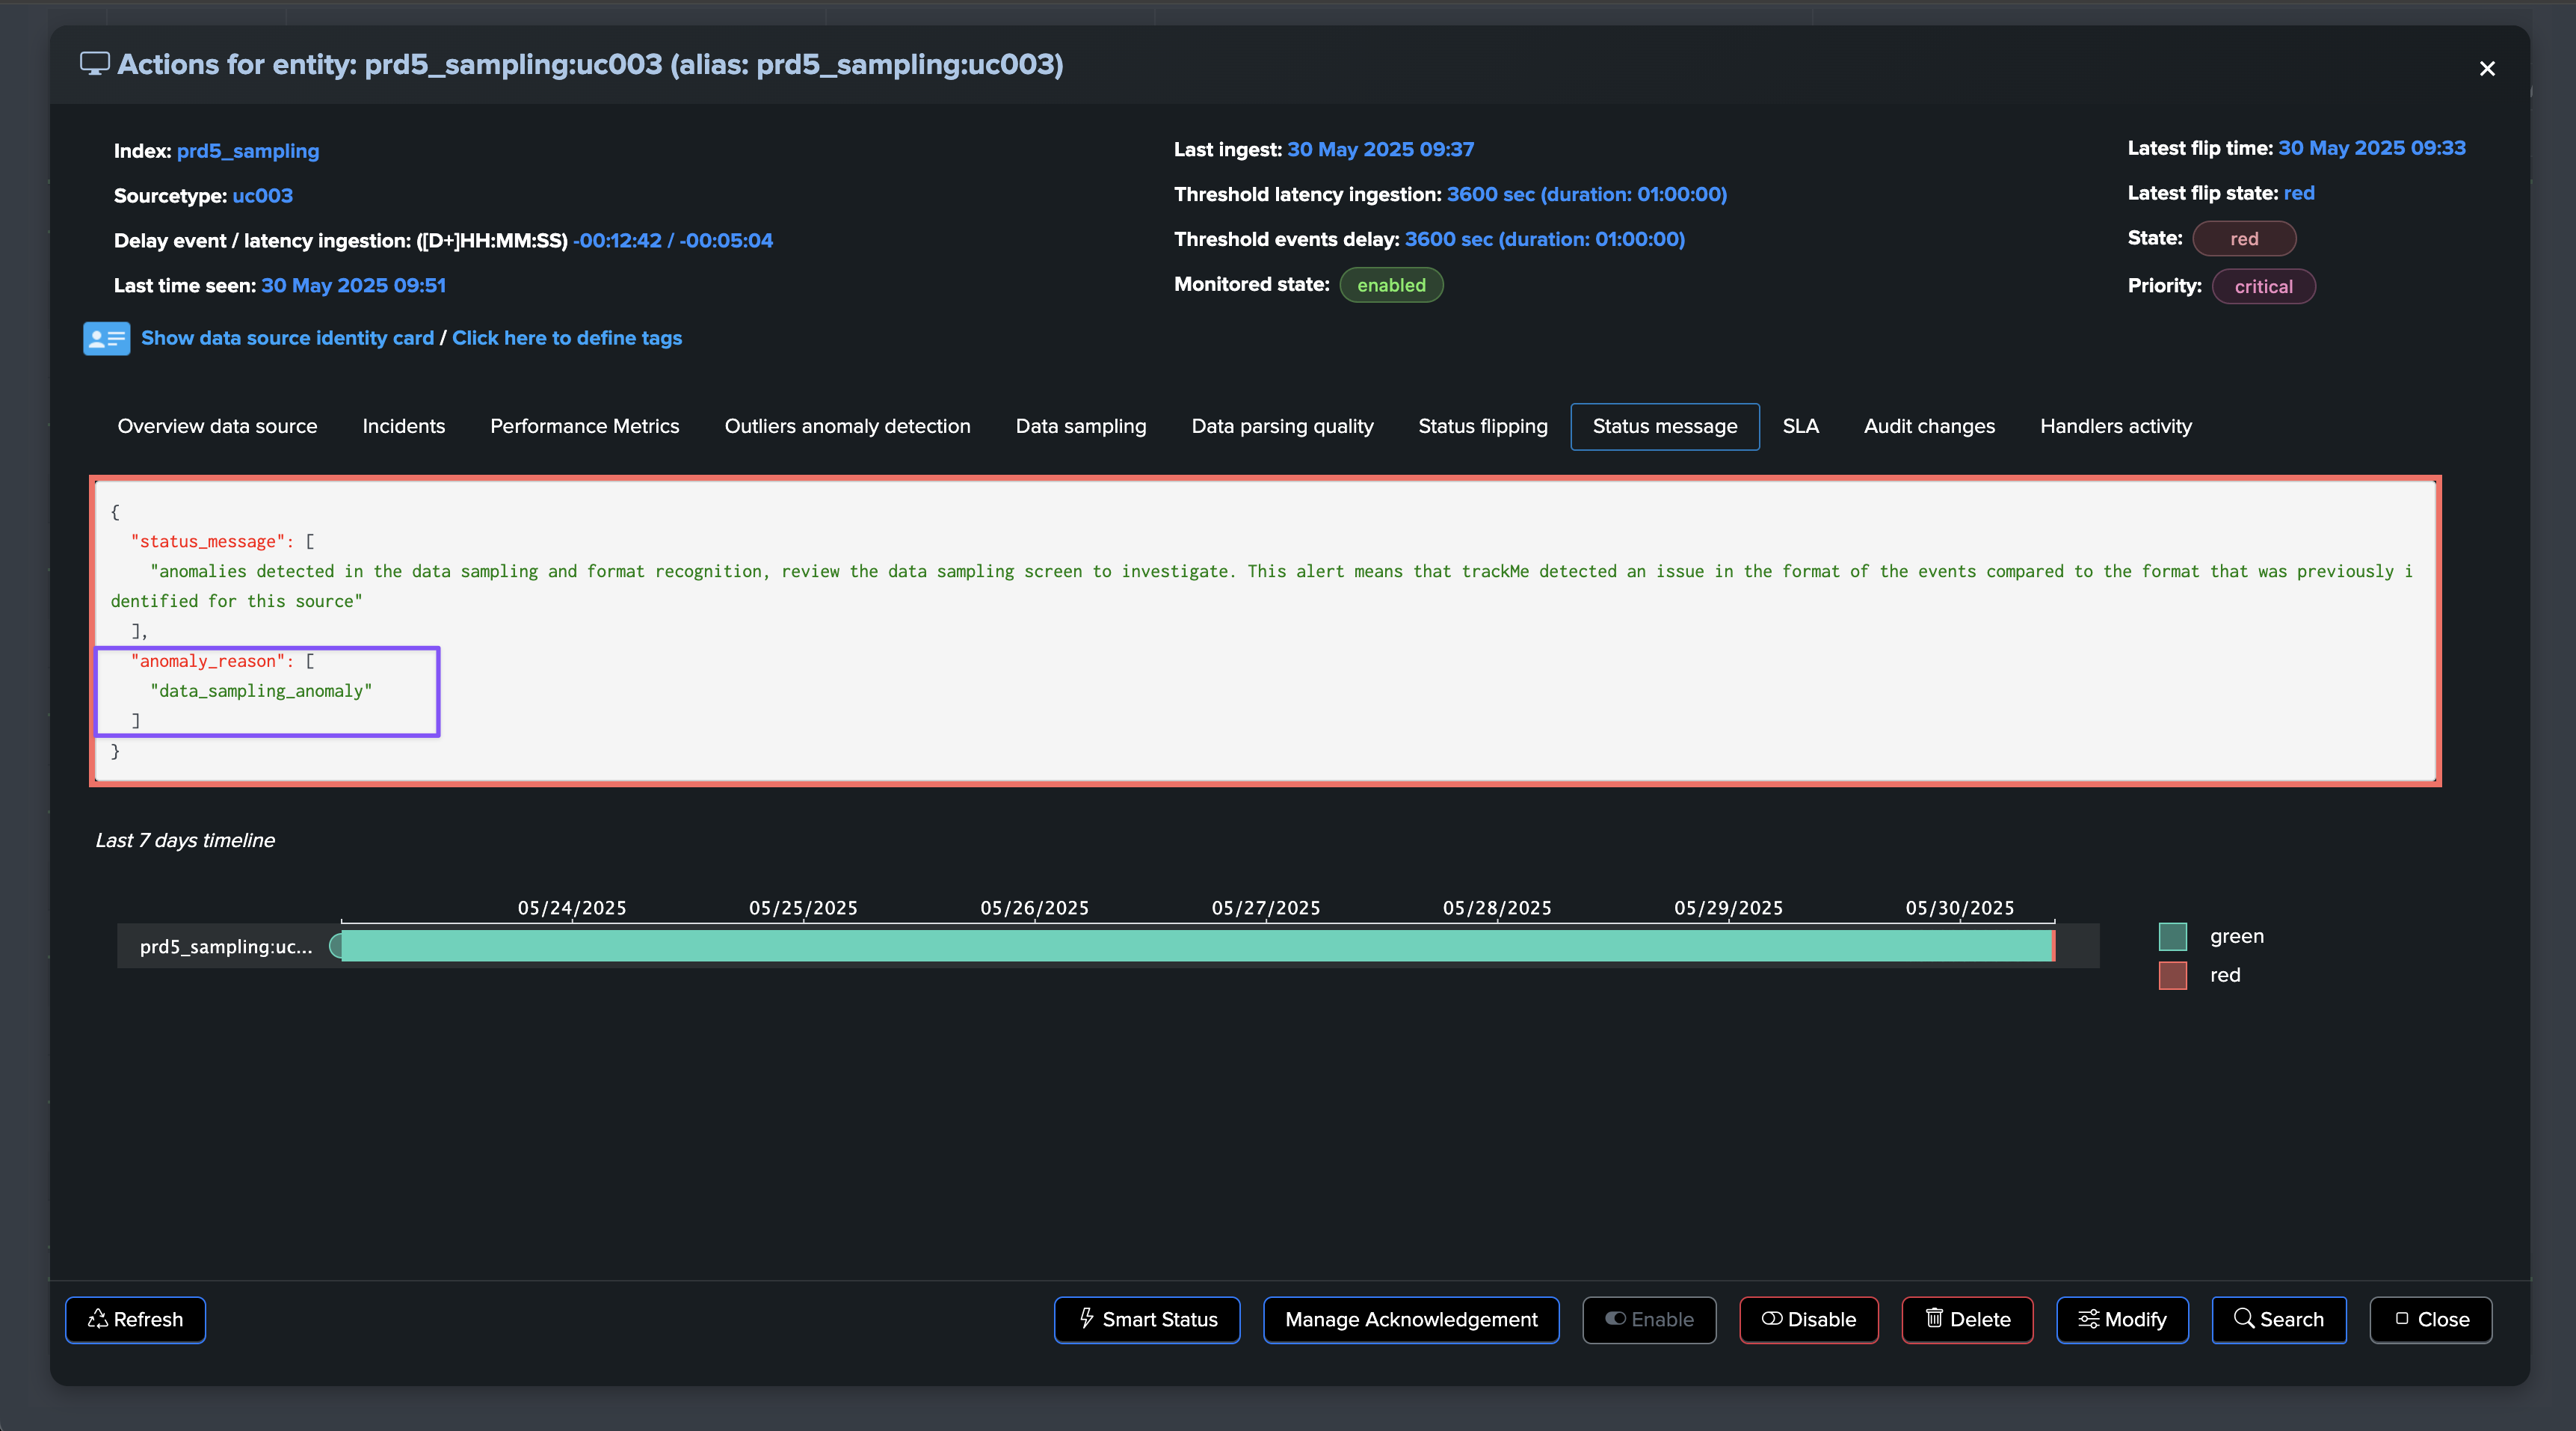
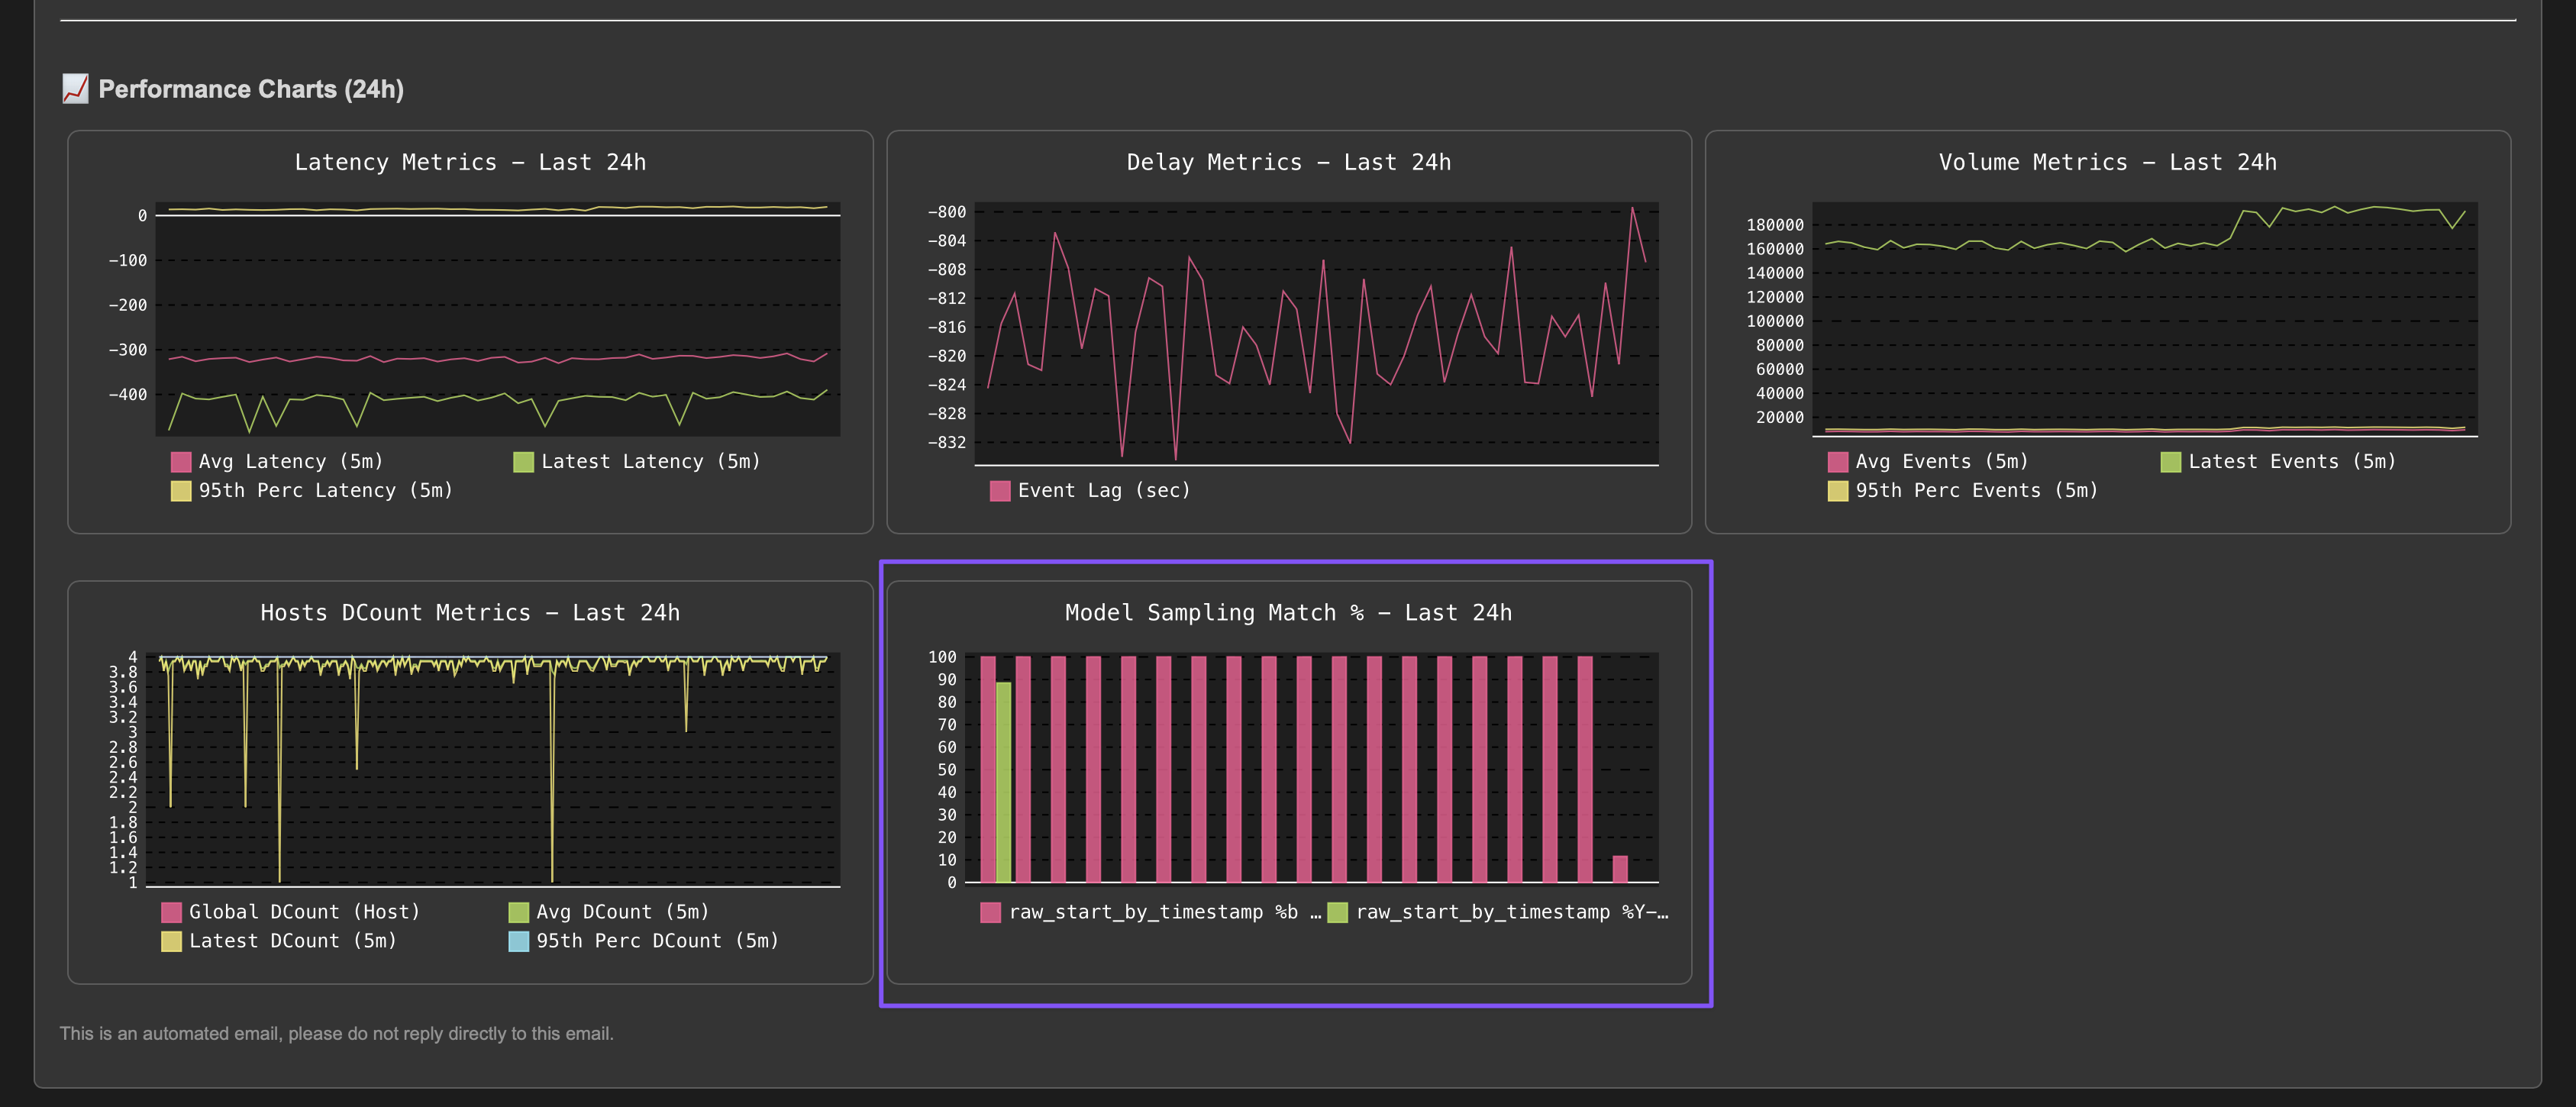
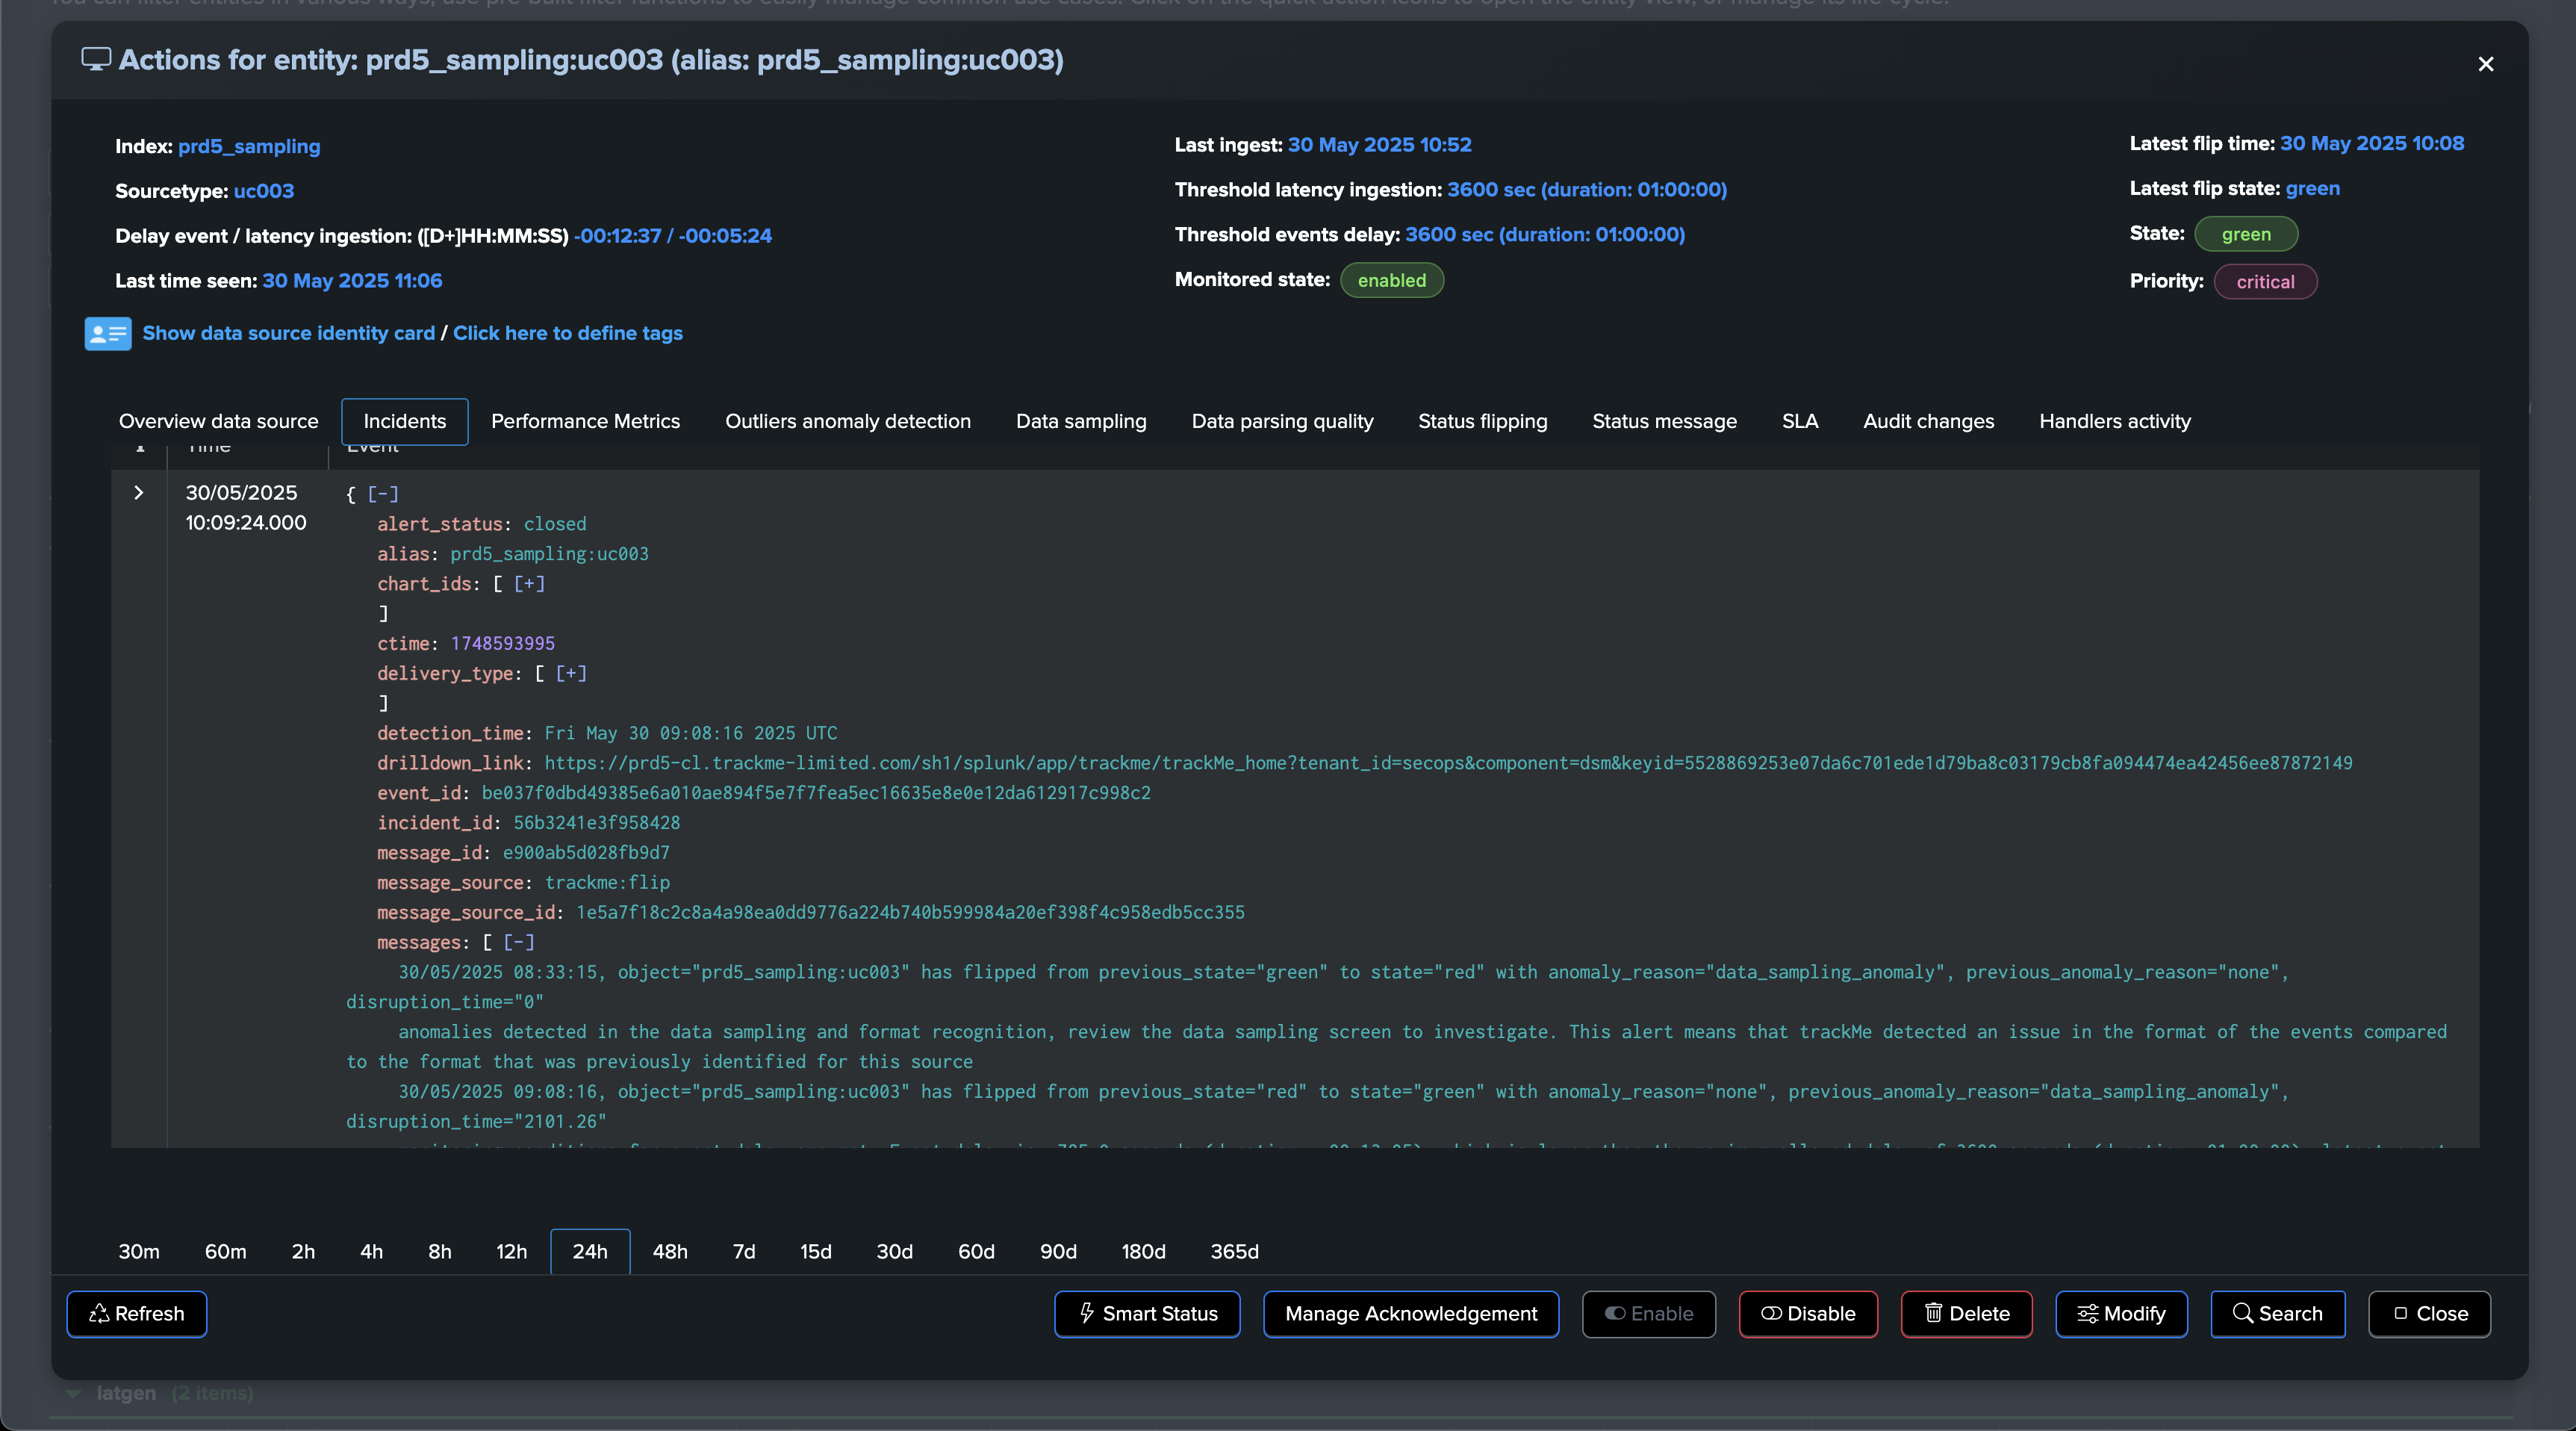
The data sampling engine will detect that the format has changed and that the main format previously detected is not matching the required percentage of events, and that new event formats were introduced, leading to an alert for quality issues:
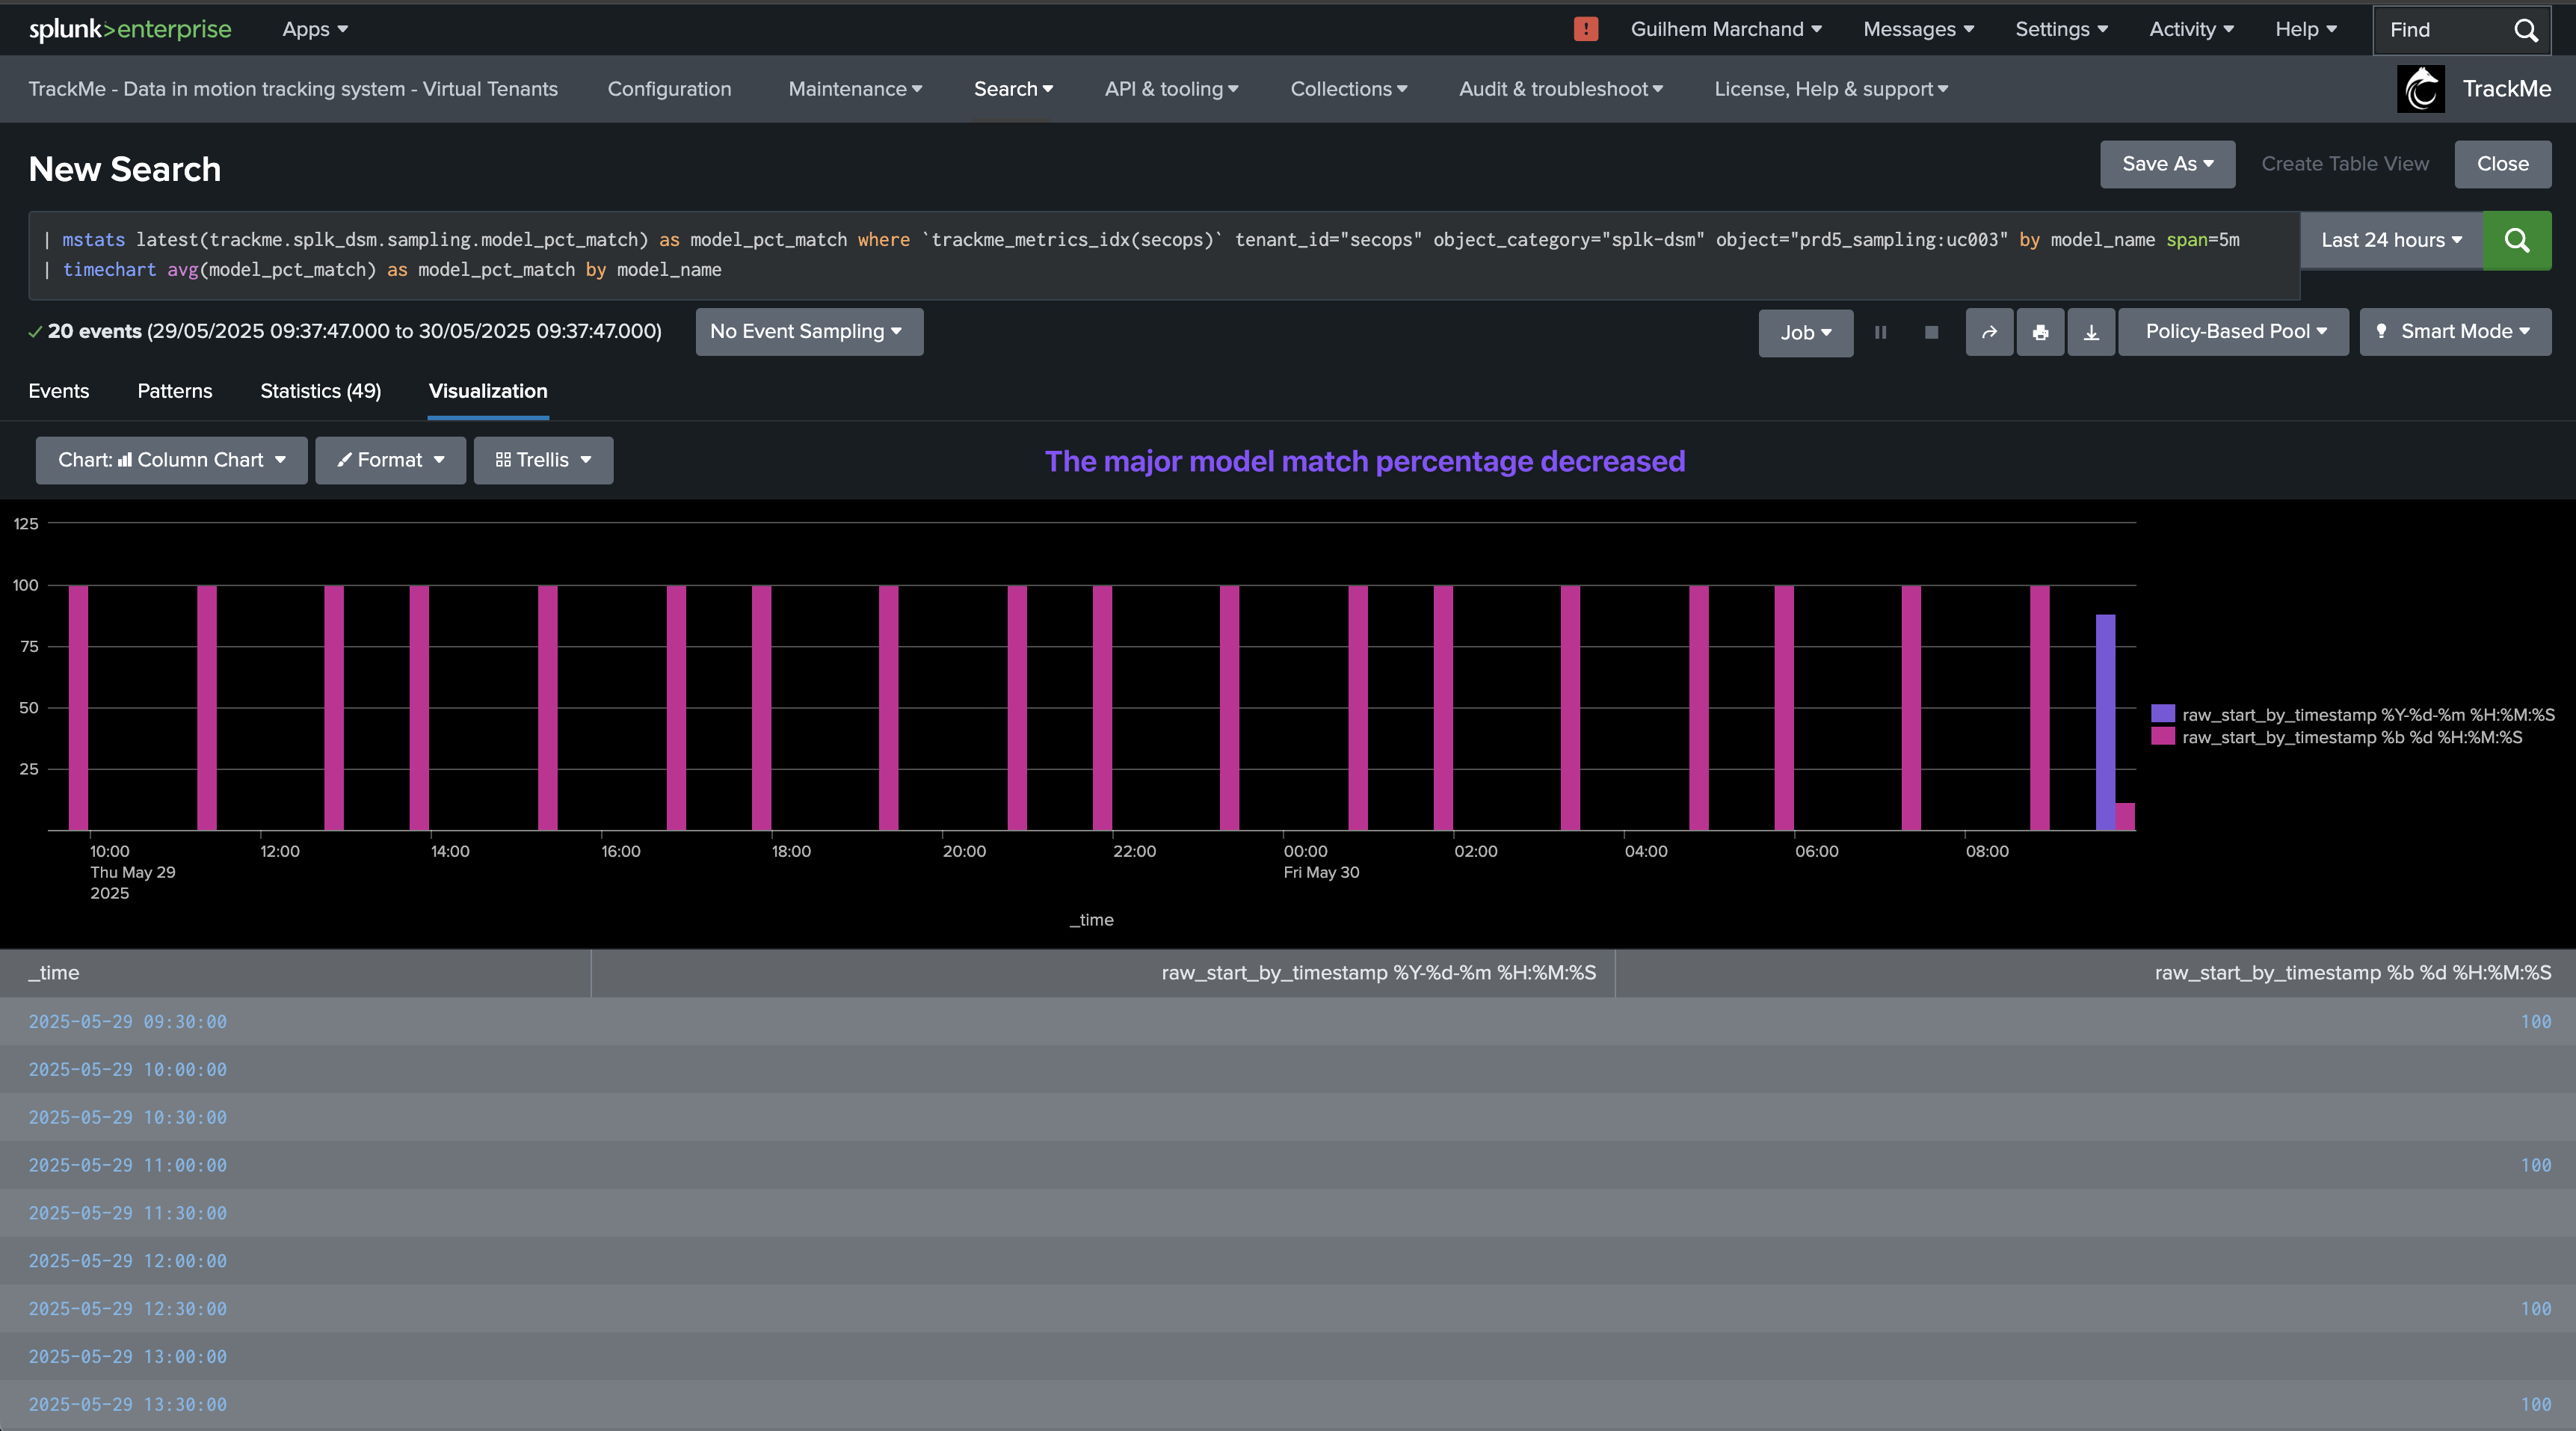
The quality issue detected influences the entity status, and an anomaly_reason=”data_sampling_anomaly” is generated:
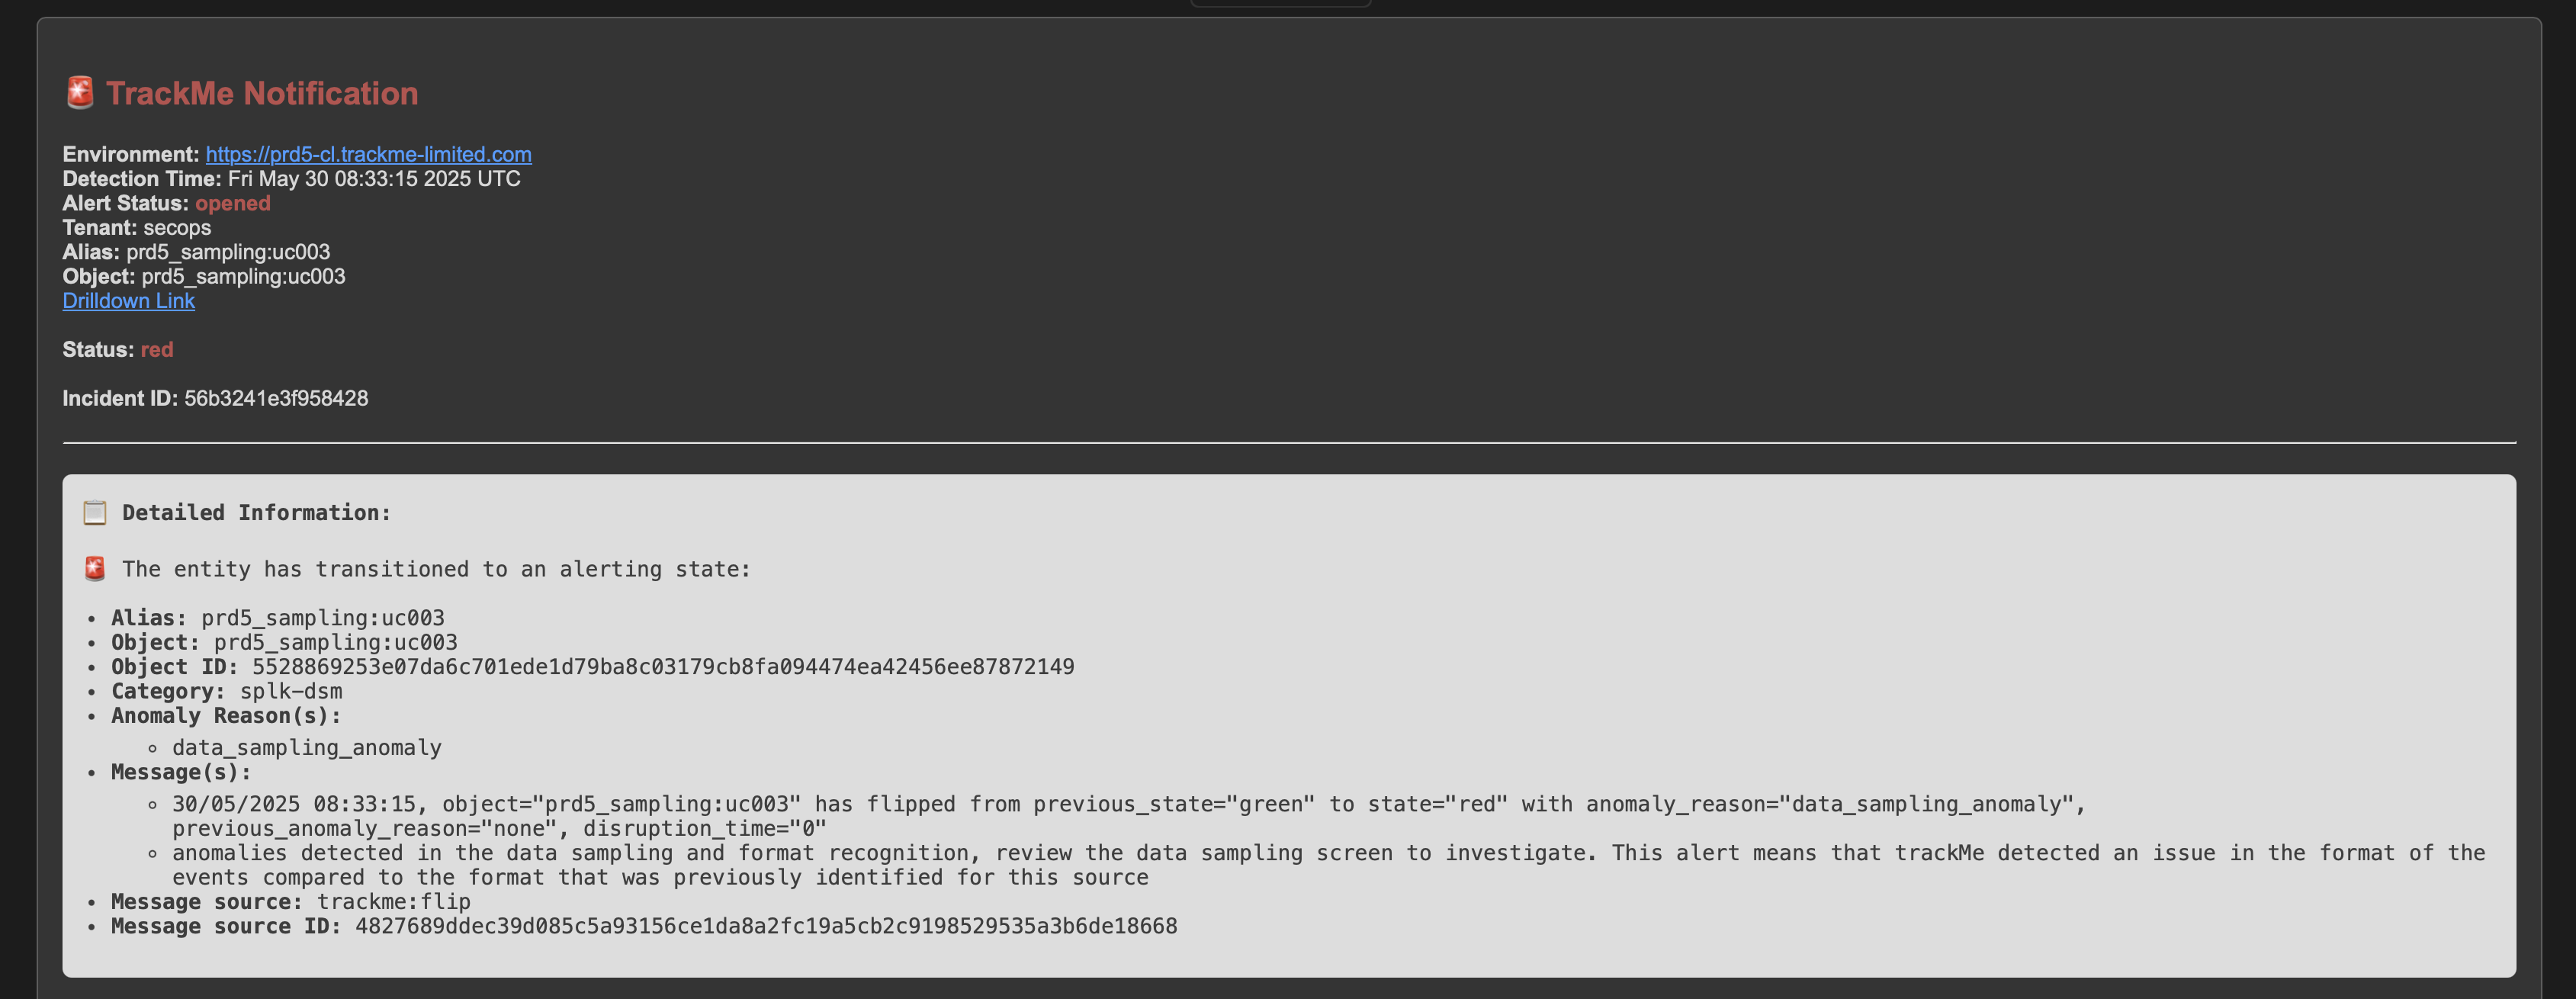
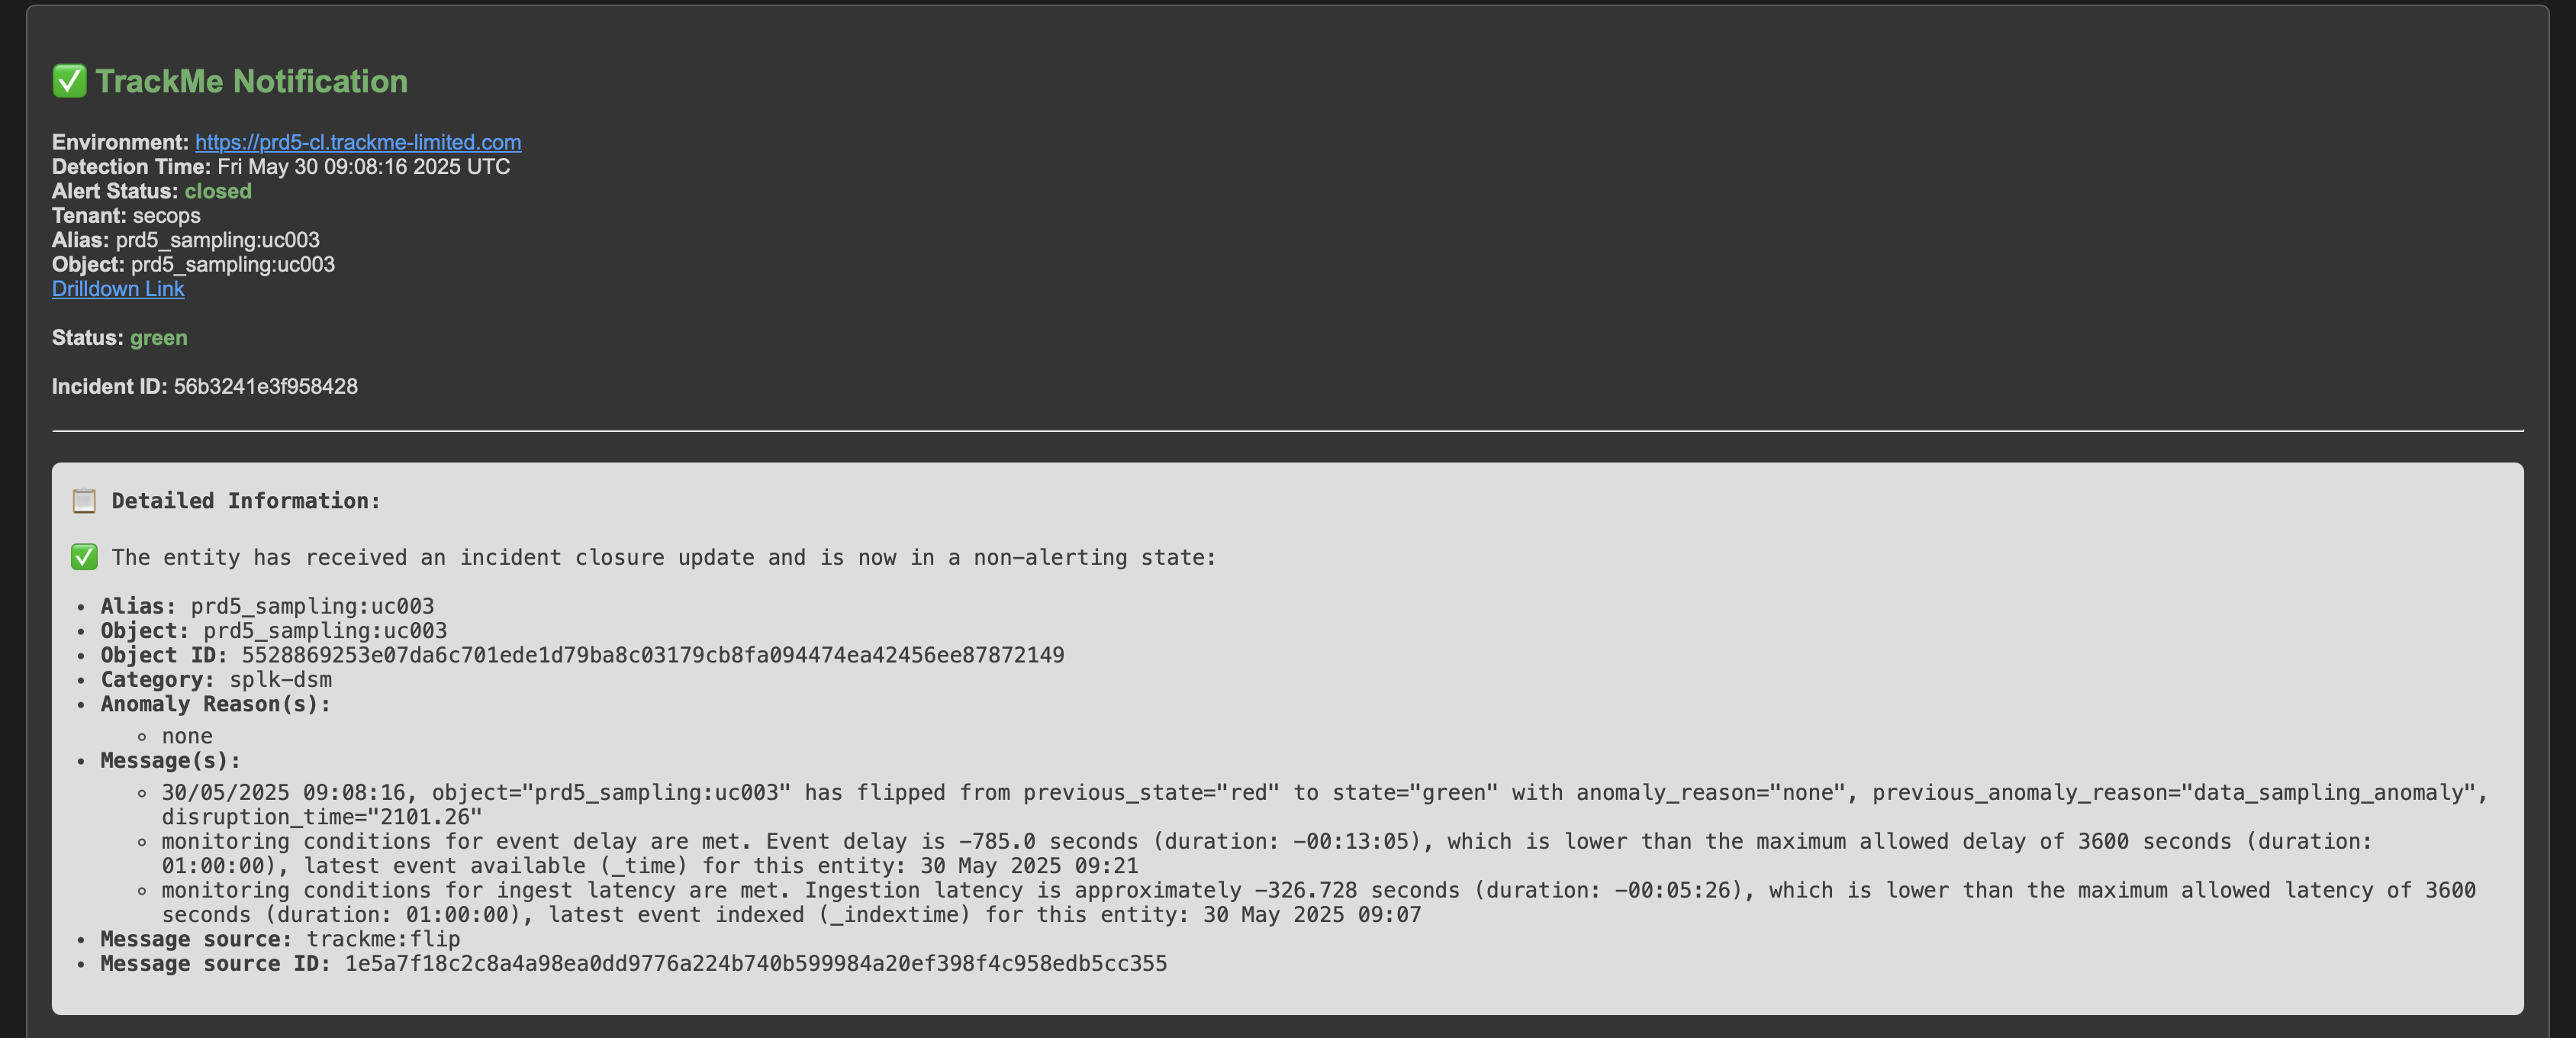
Once the root cause is identified and the issue is fixed, after some time the entity will return to green when the expected format is correctly detected again:
Use Case: Hosts Distinct Count Anomaly
Another use case is to detect anomalies in your feeds based on the amount of distinct hosts making it to Splunk.
This is a valuable use case especially at large scale that allows easily detecting issues, such as the potential loss of intermediate collectors or the potential loss of a major source.
This activity can be performed using a static threshold against one of the distinct hosts metrics, as well as for more advanced use cases using Machine Learning Outliers detection.
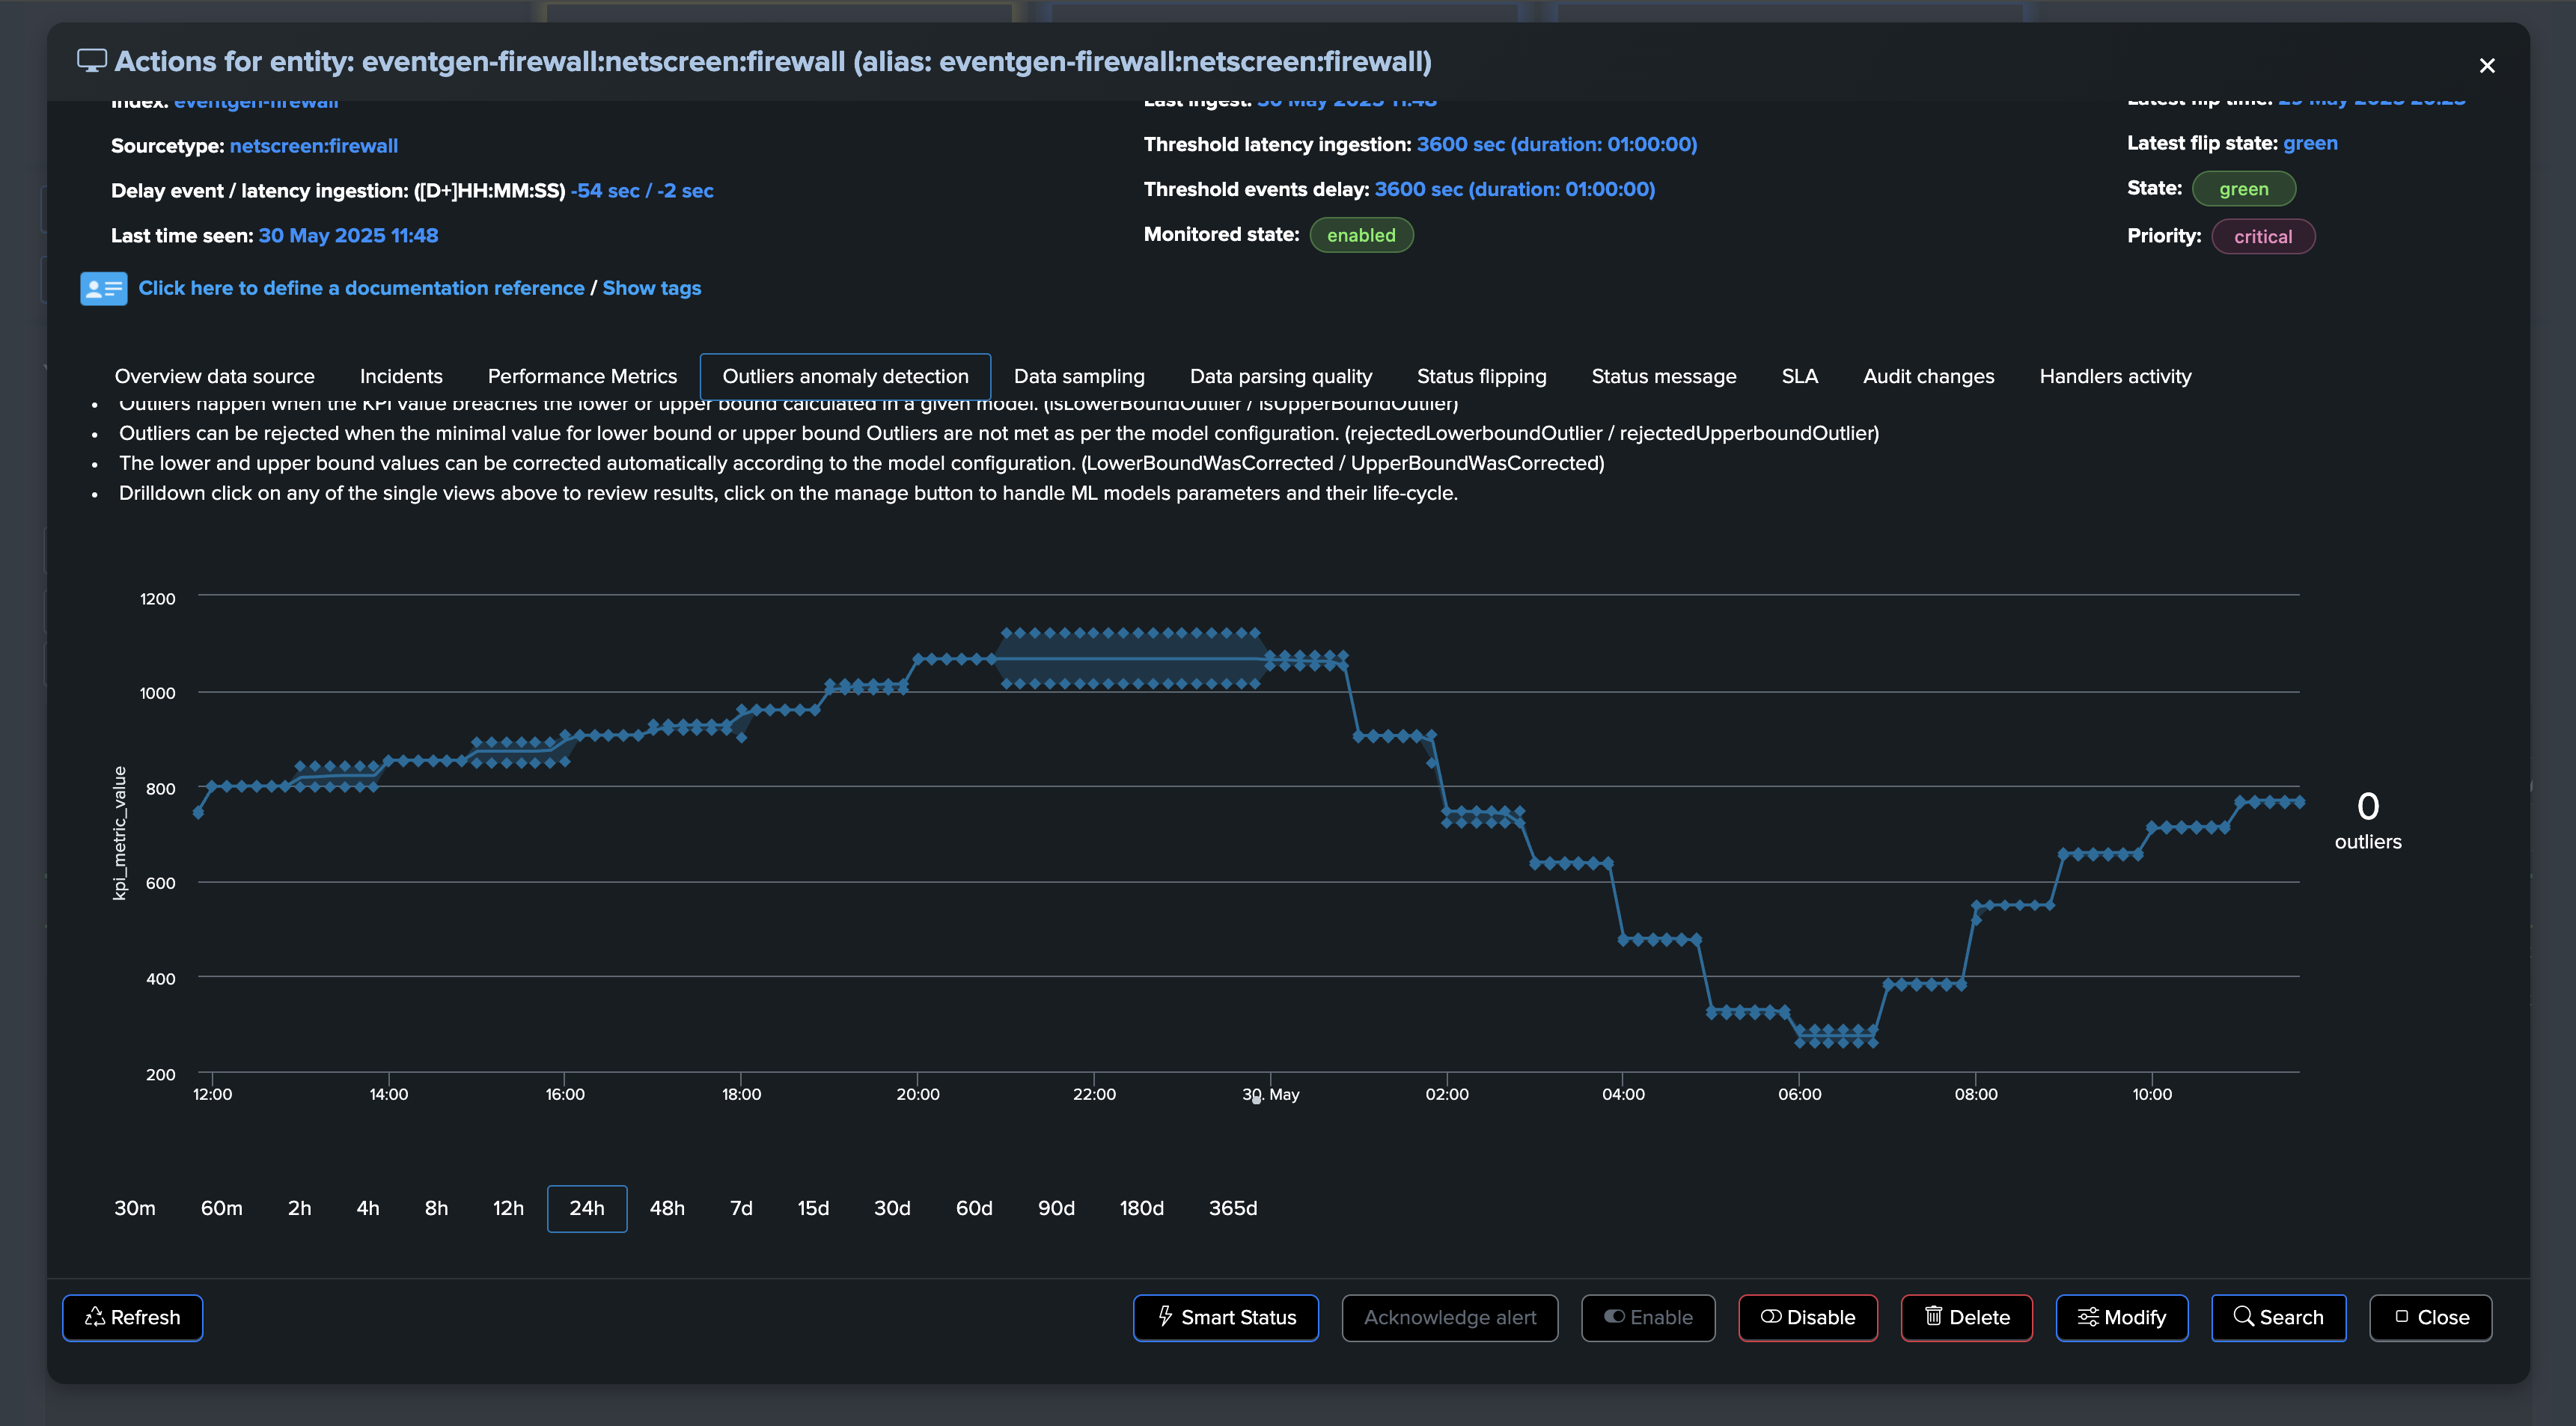
The following example demonstrates the use of a static threshold to detect anomalies in the distinct hosts count, we can observe with the following entity that a certain amount of hosts are systematically available:
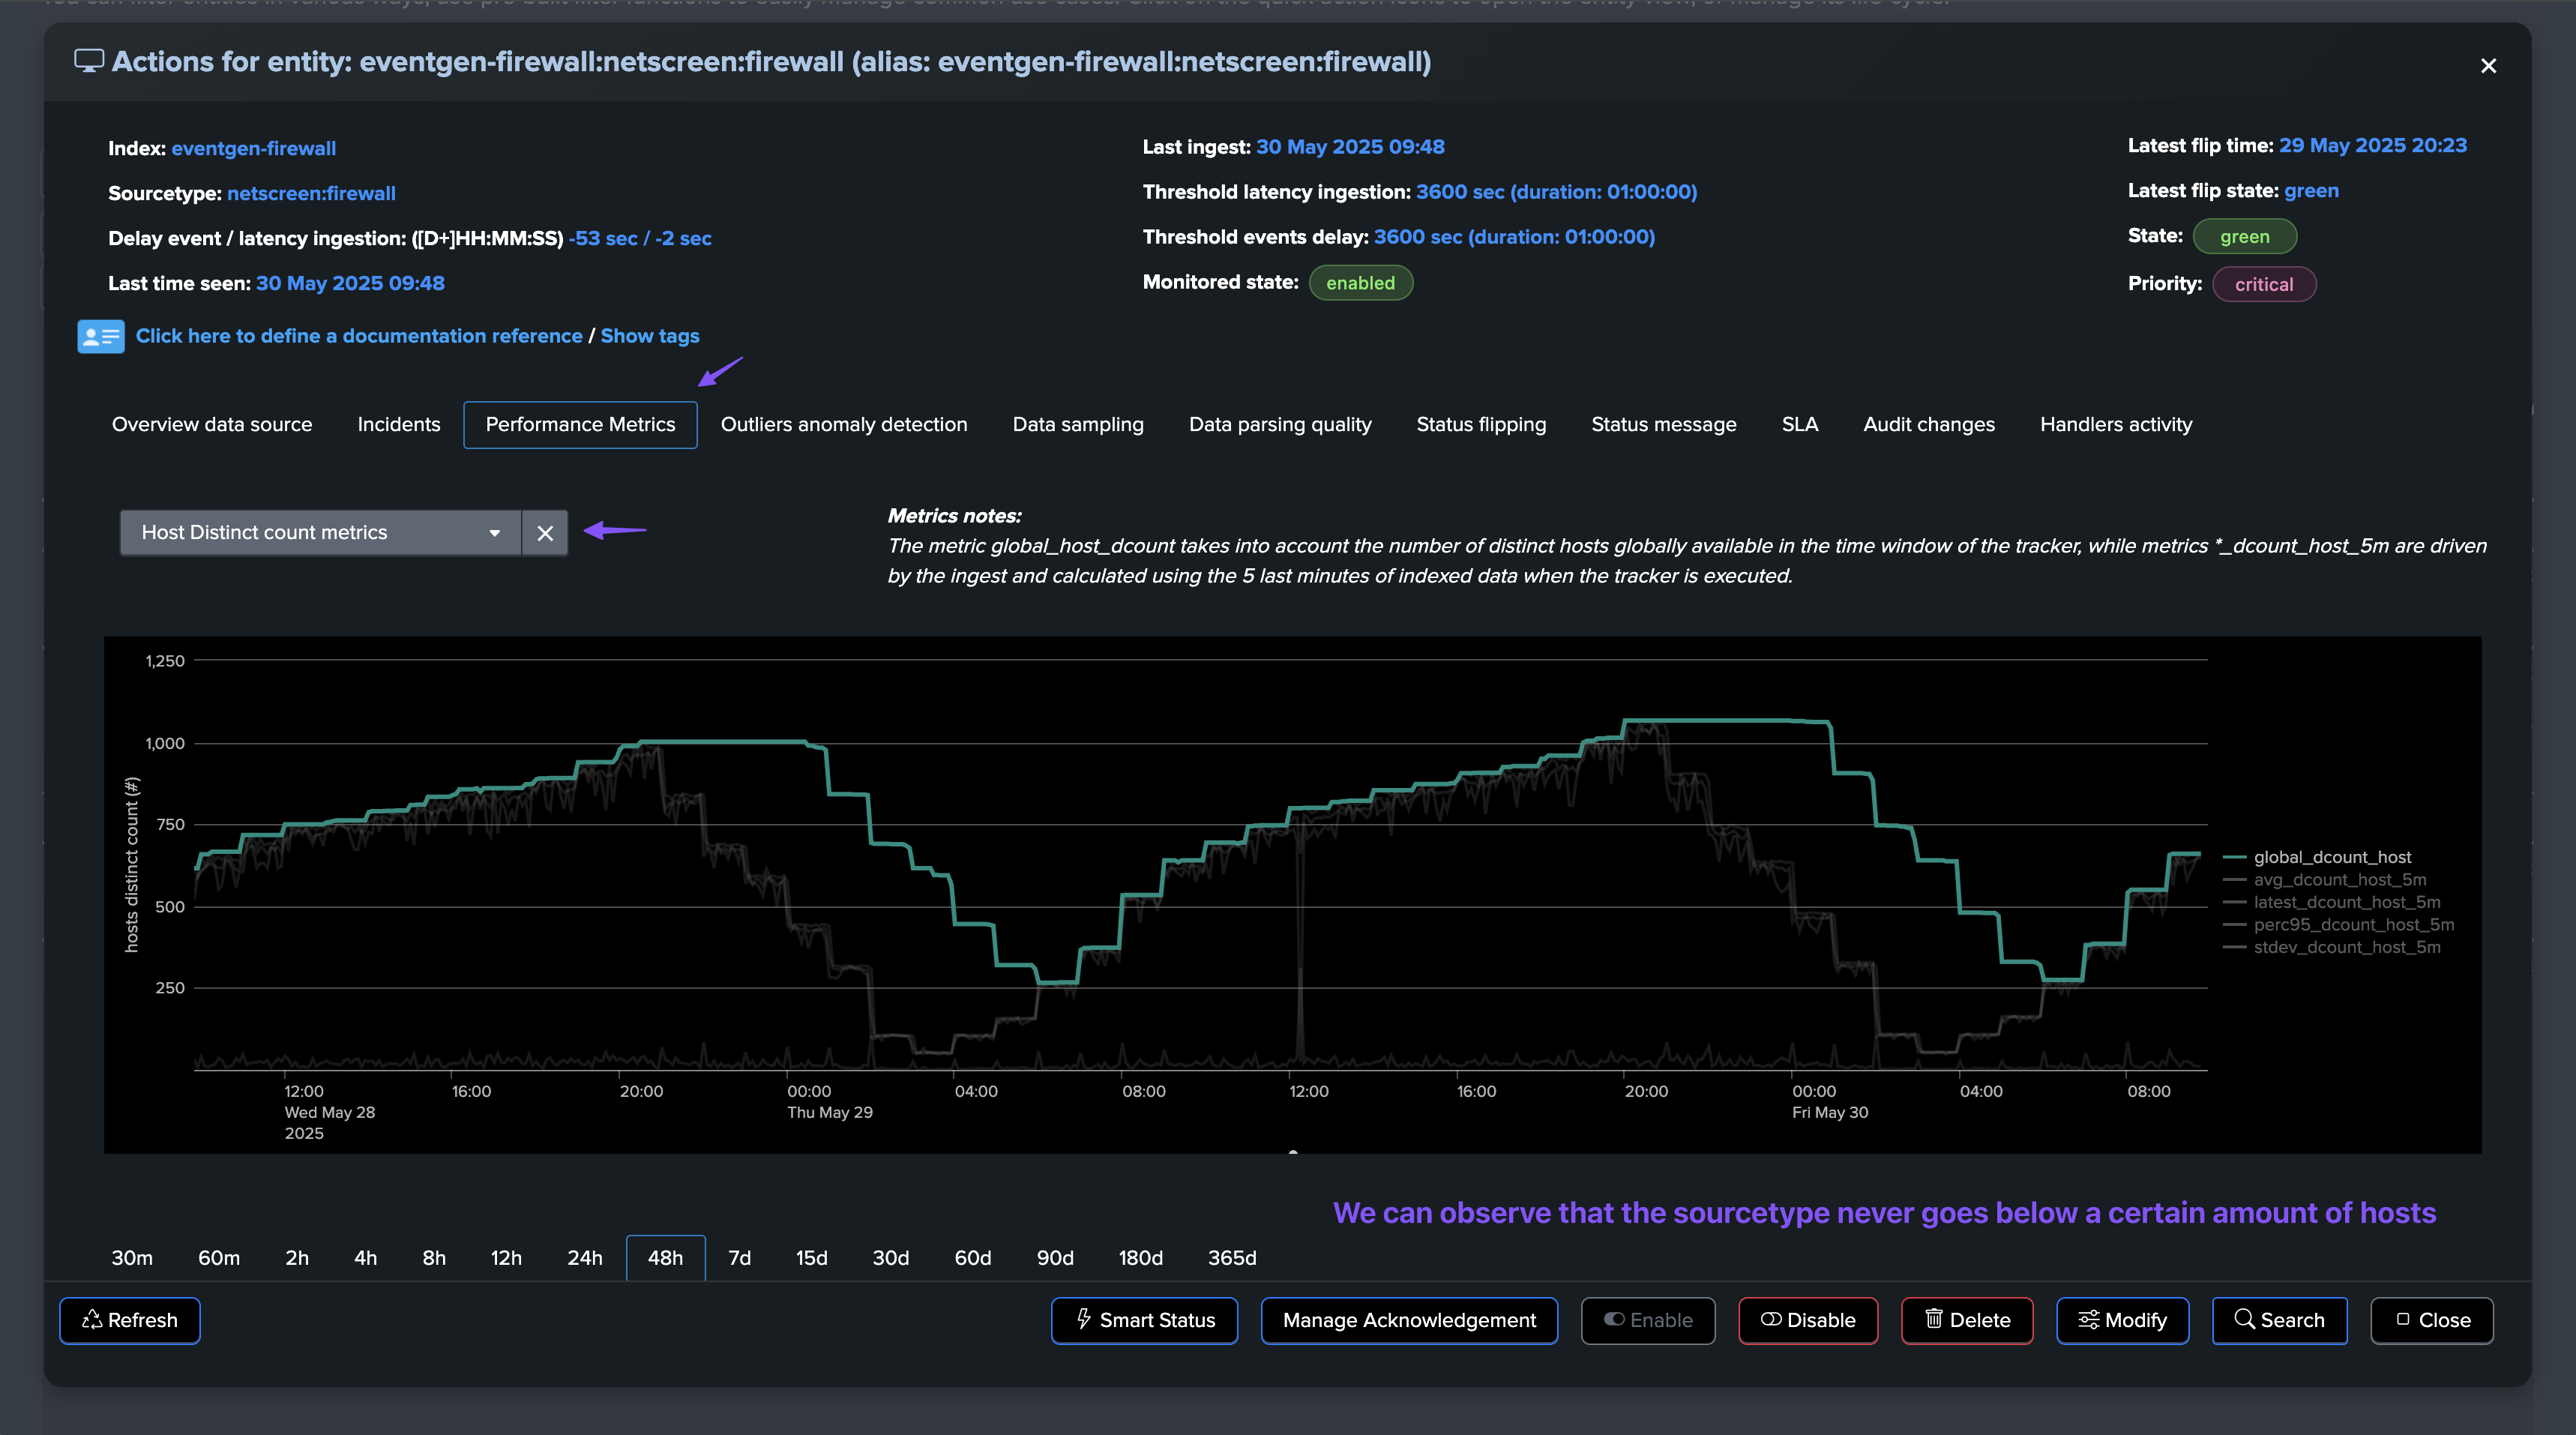
The big picture must be considered:
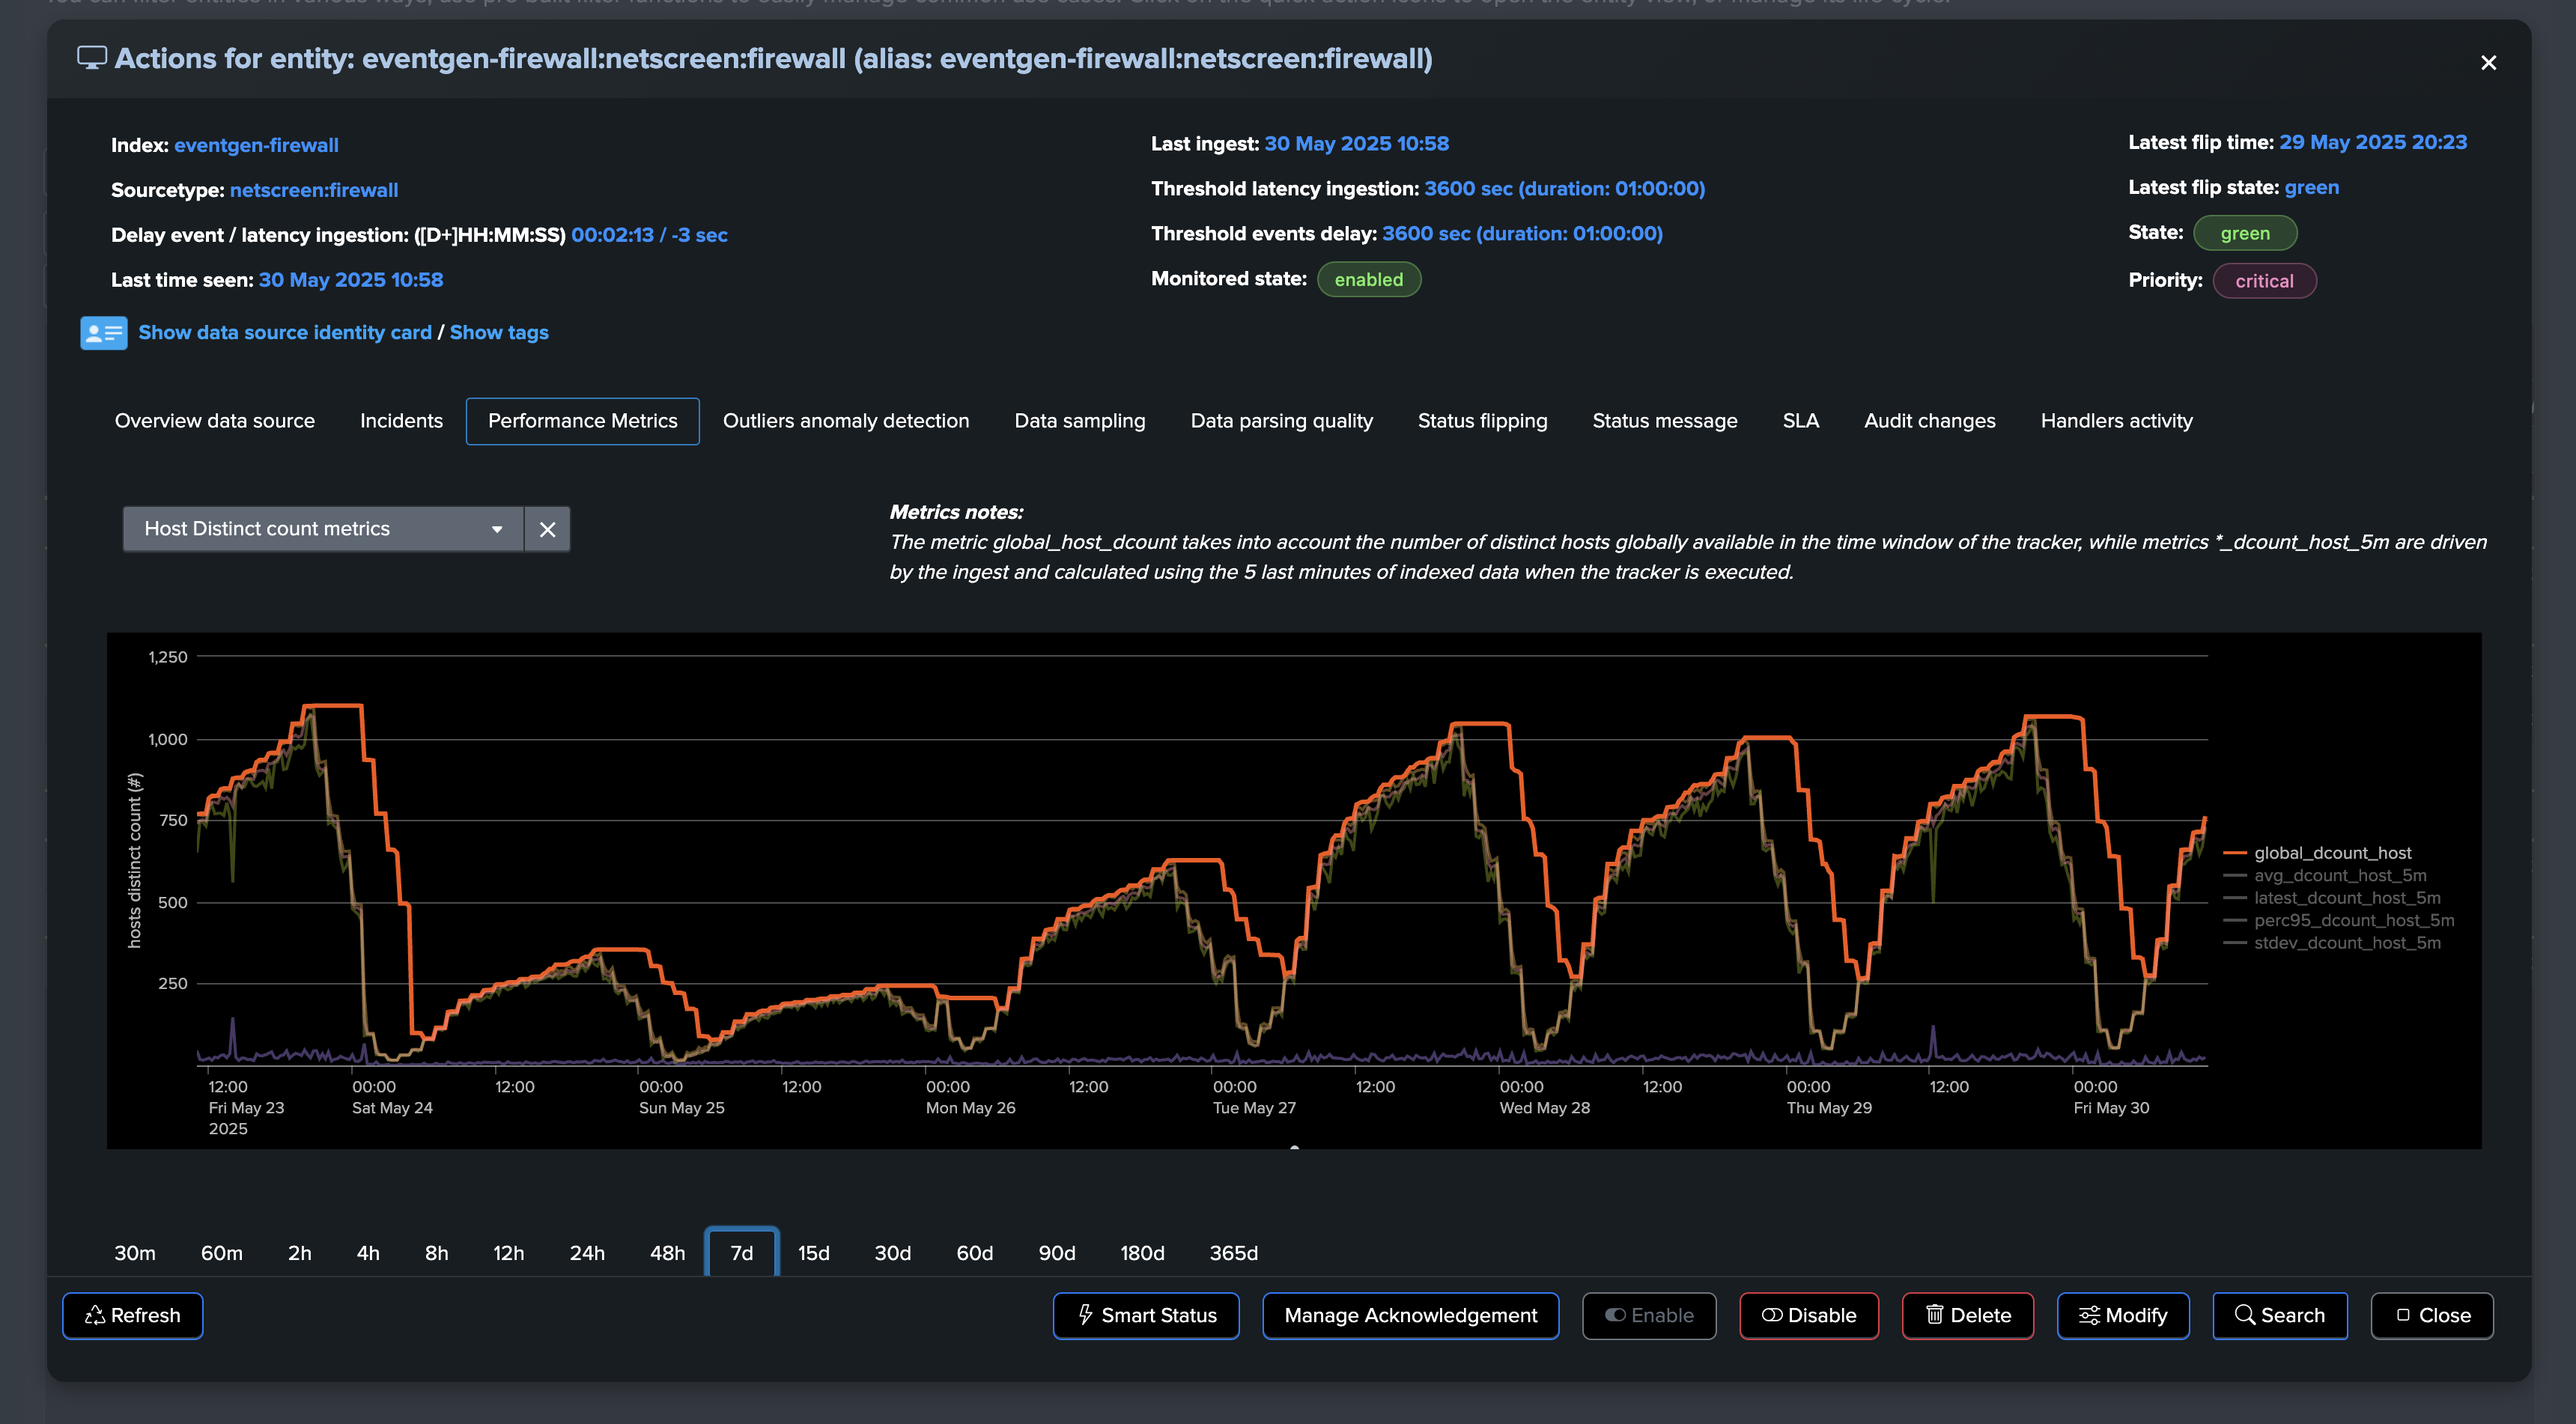
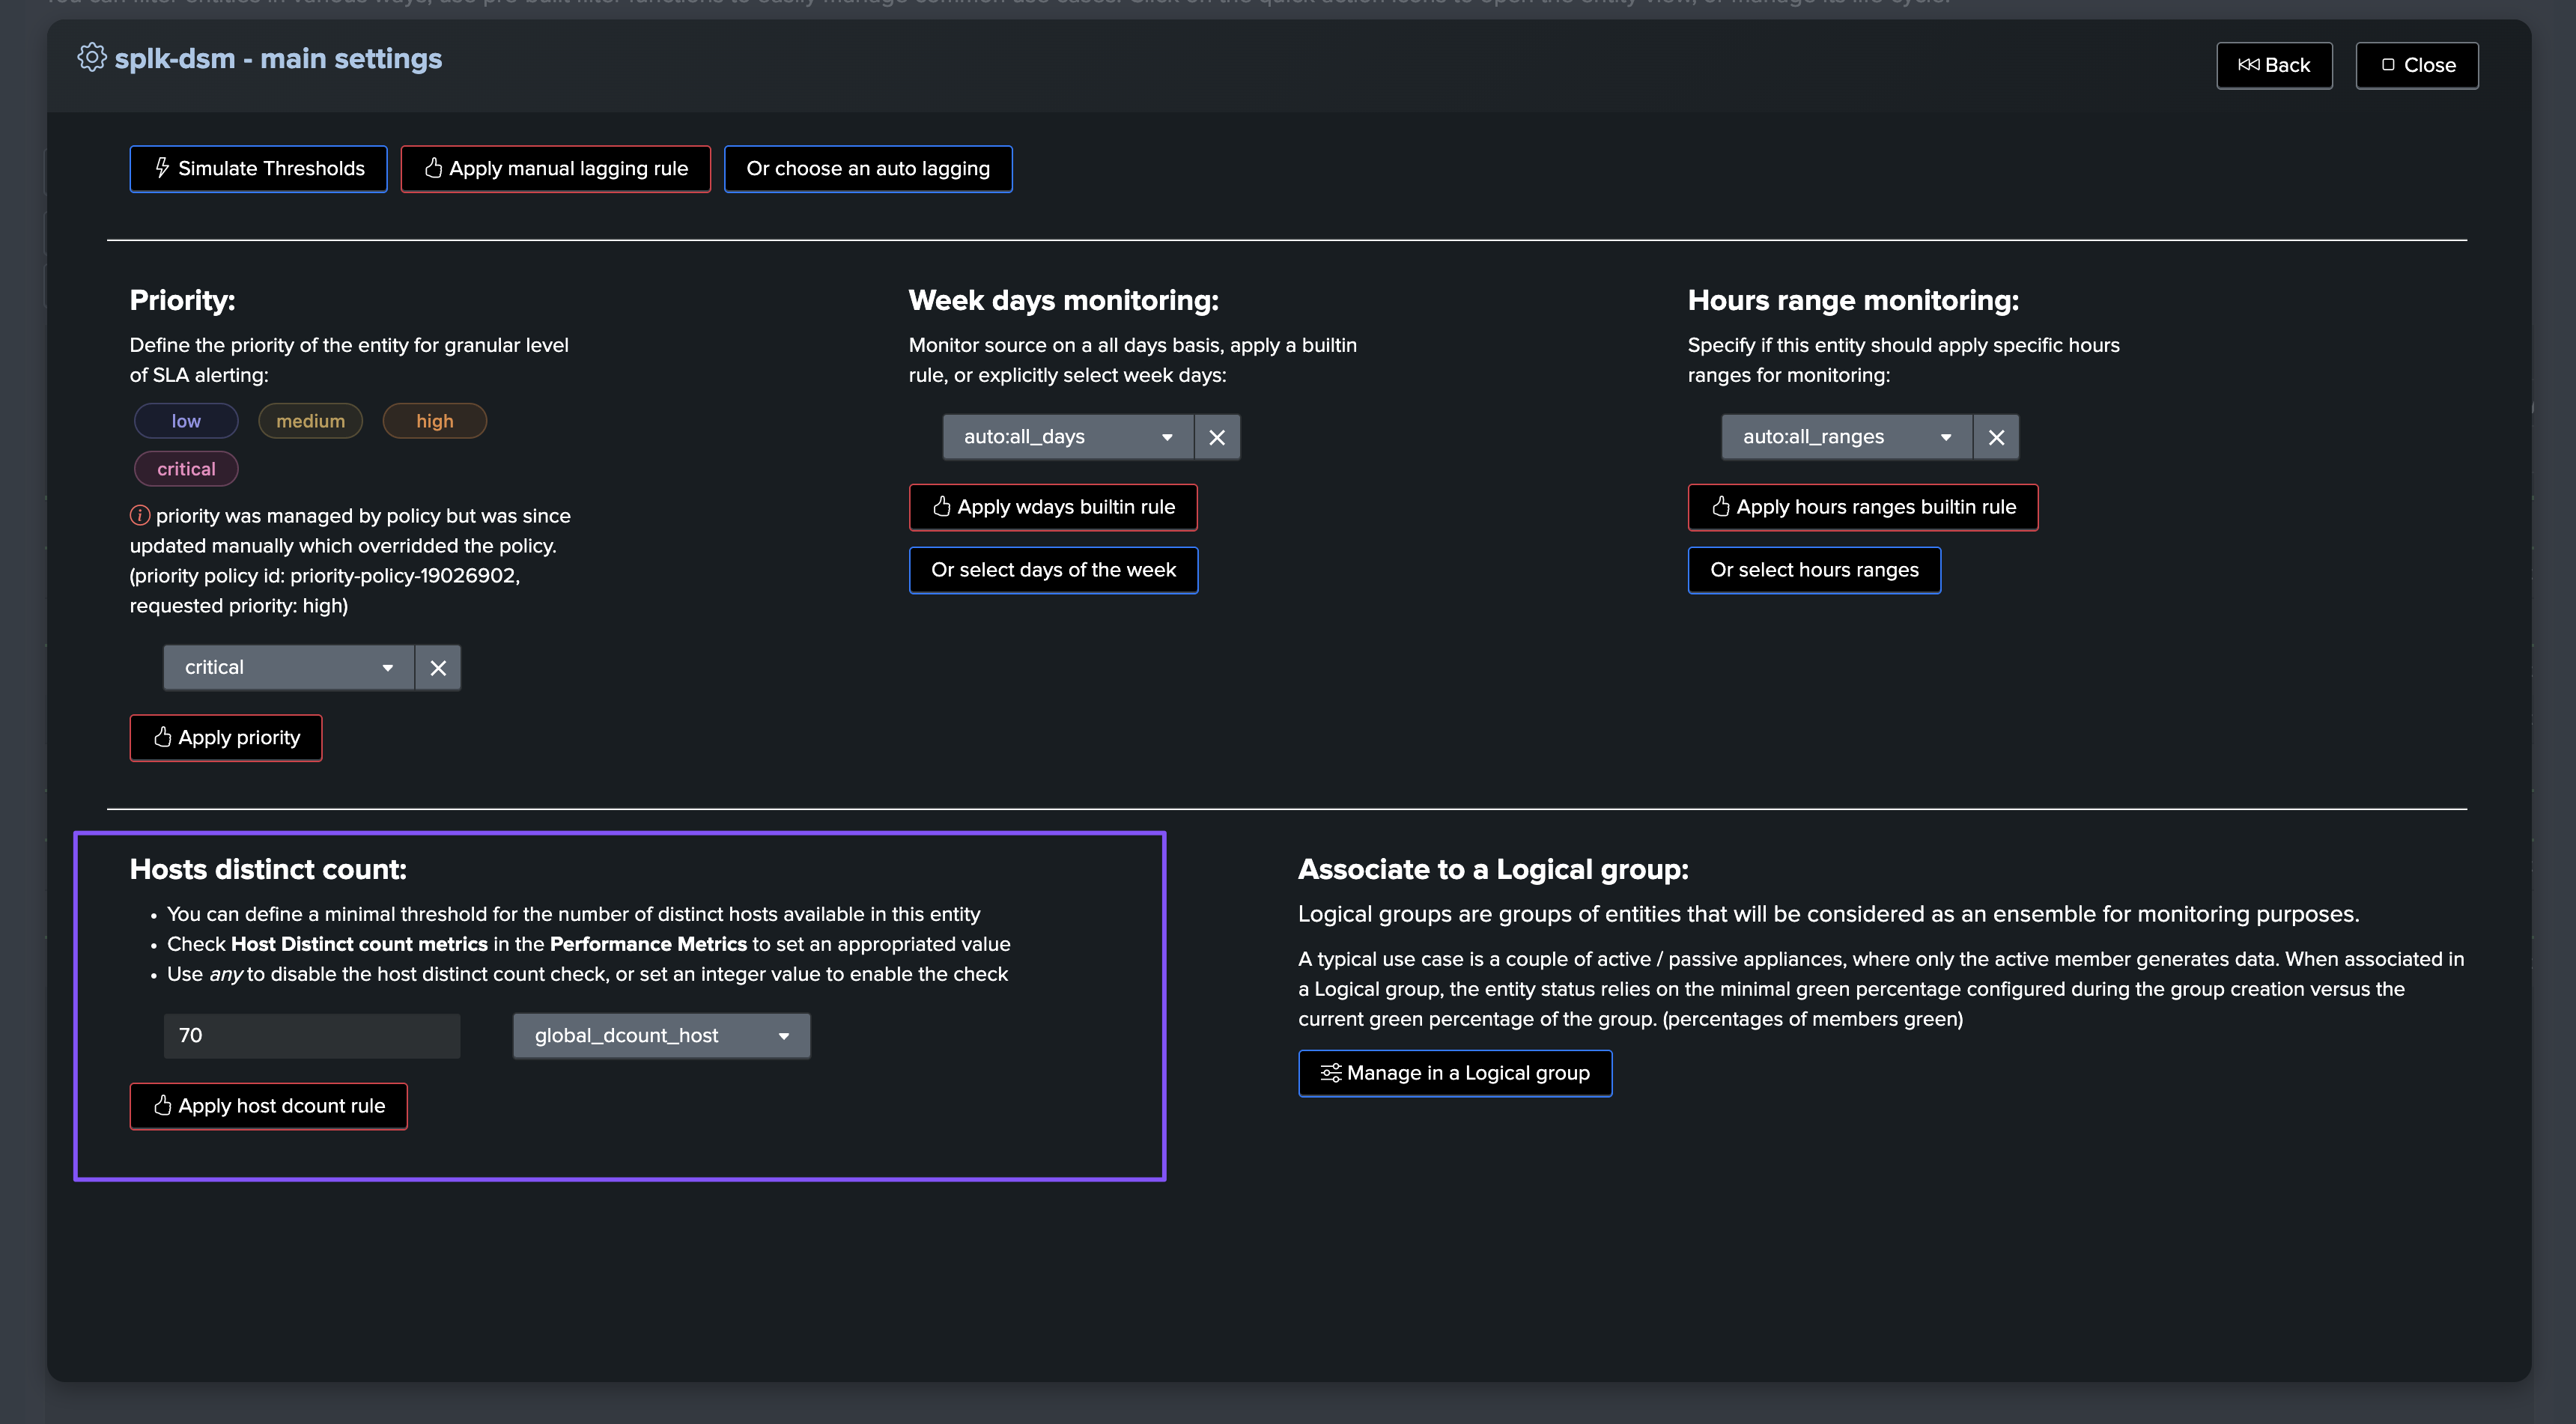
Based on this observation, we can configure a static minimal threshold for this entity, if the amount of distinct hosts goes below this threshold, the entity will be considered as in alert:
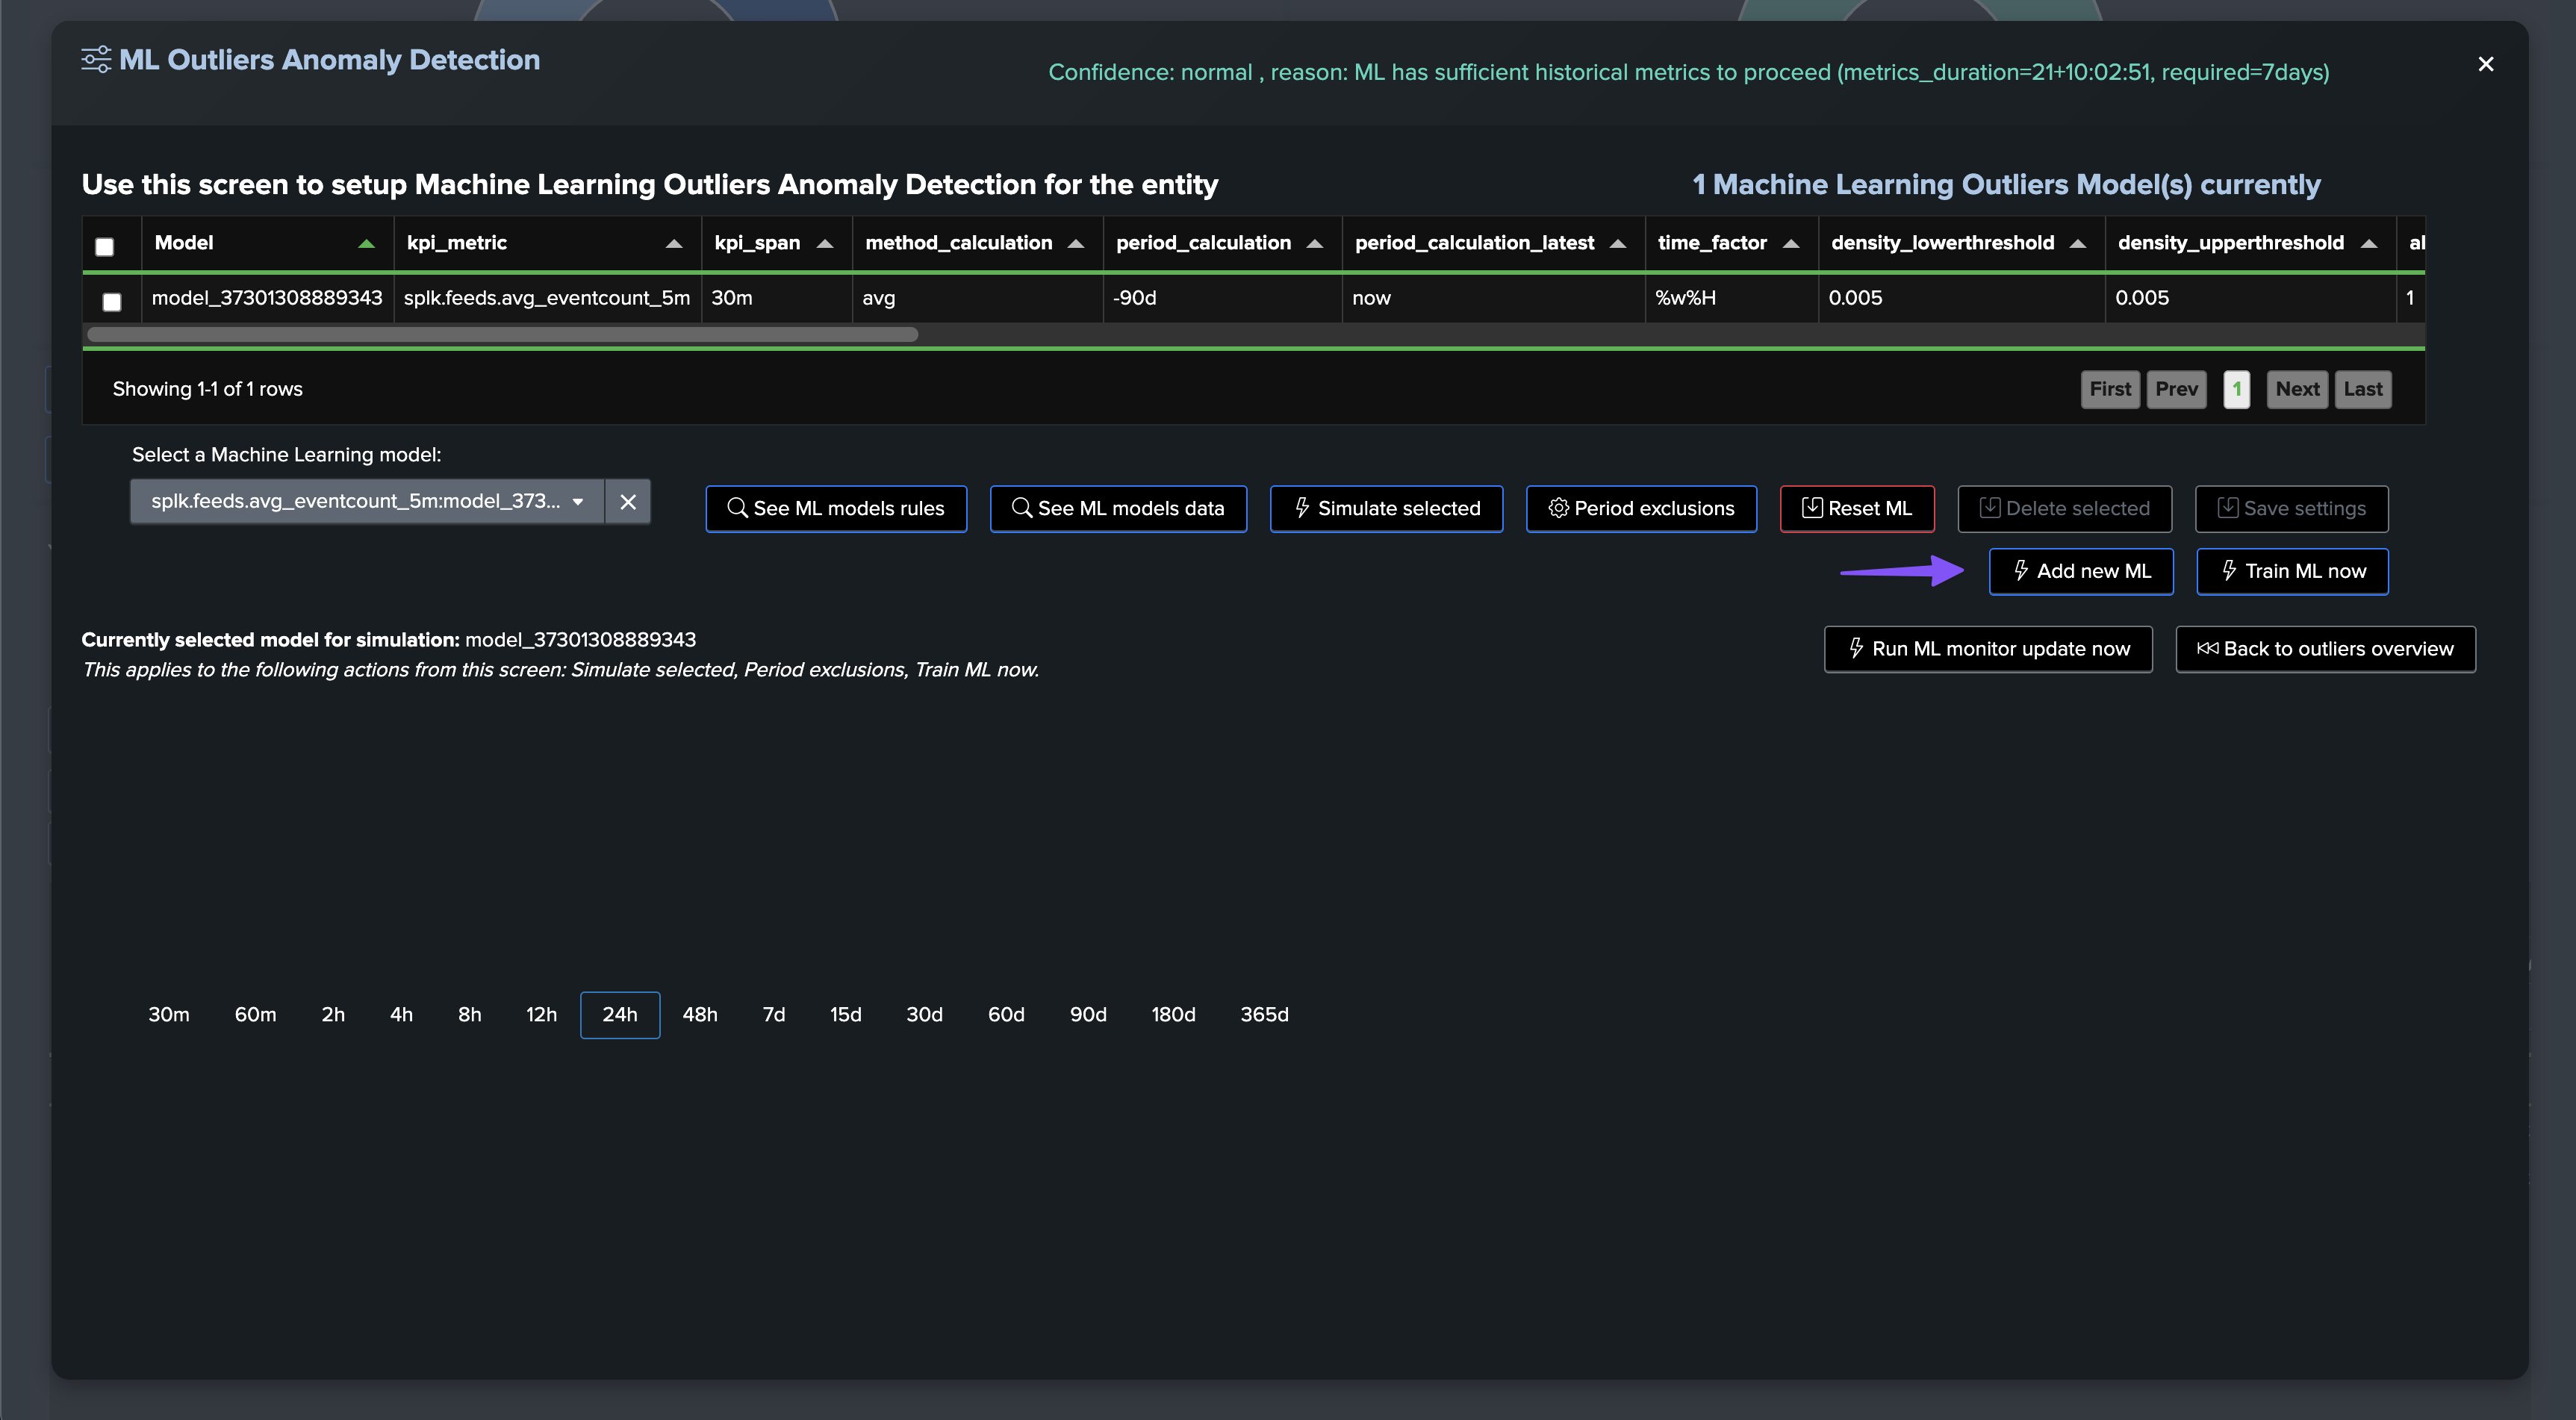
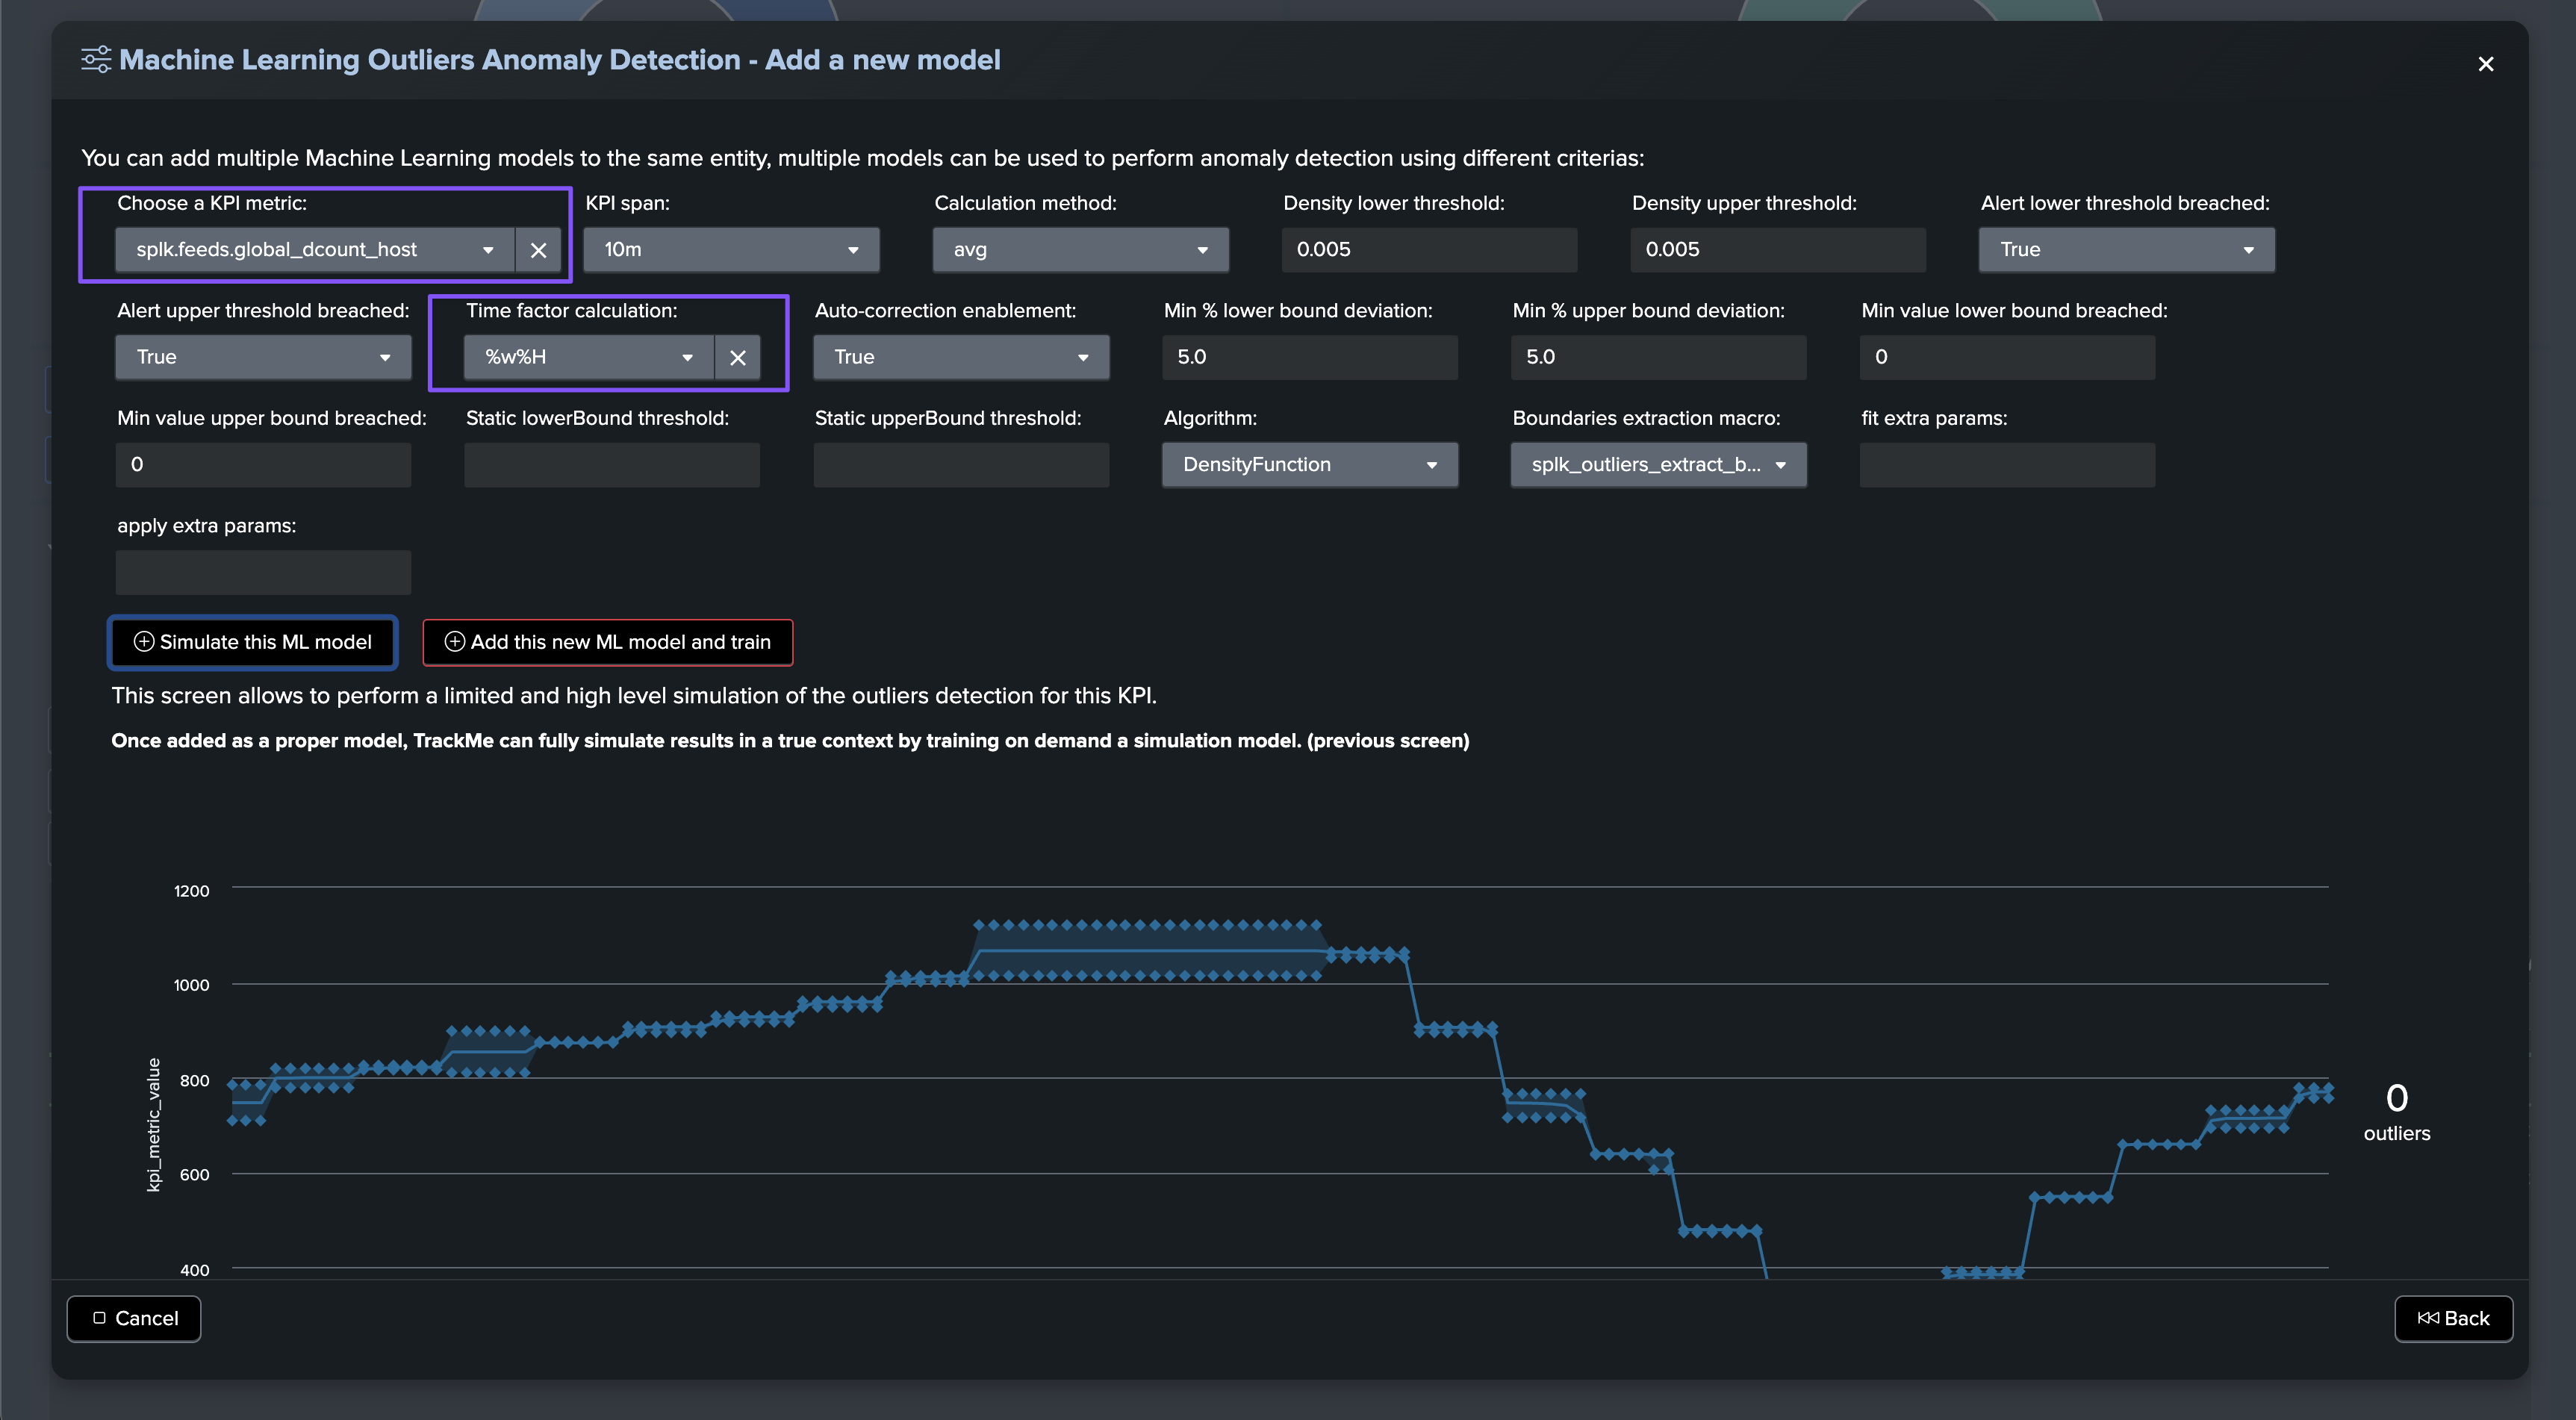
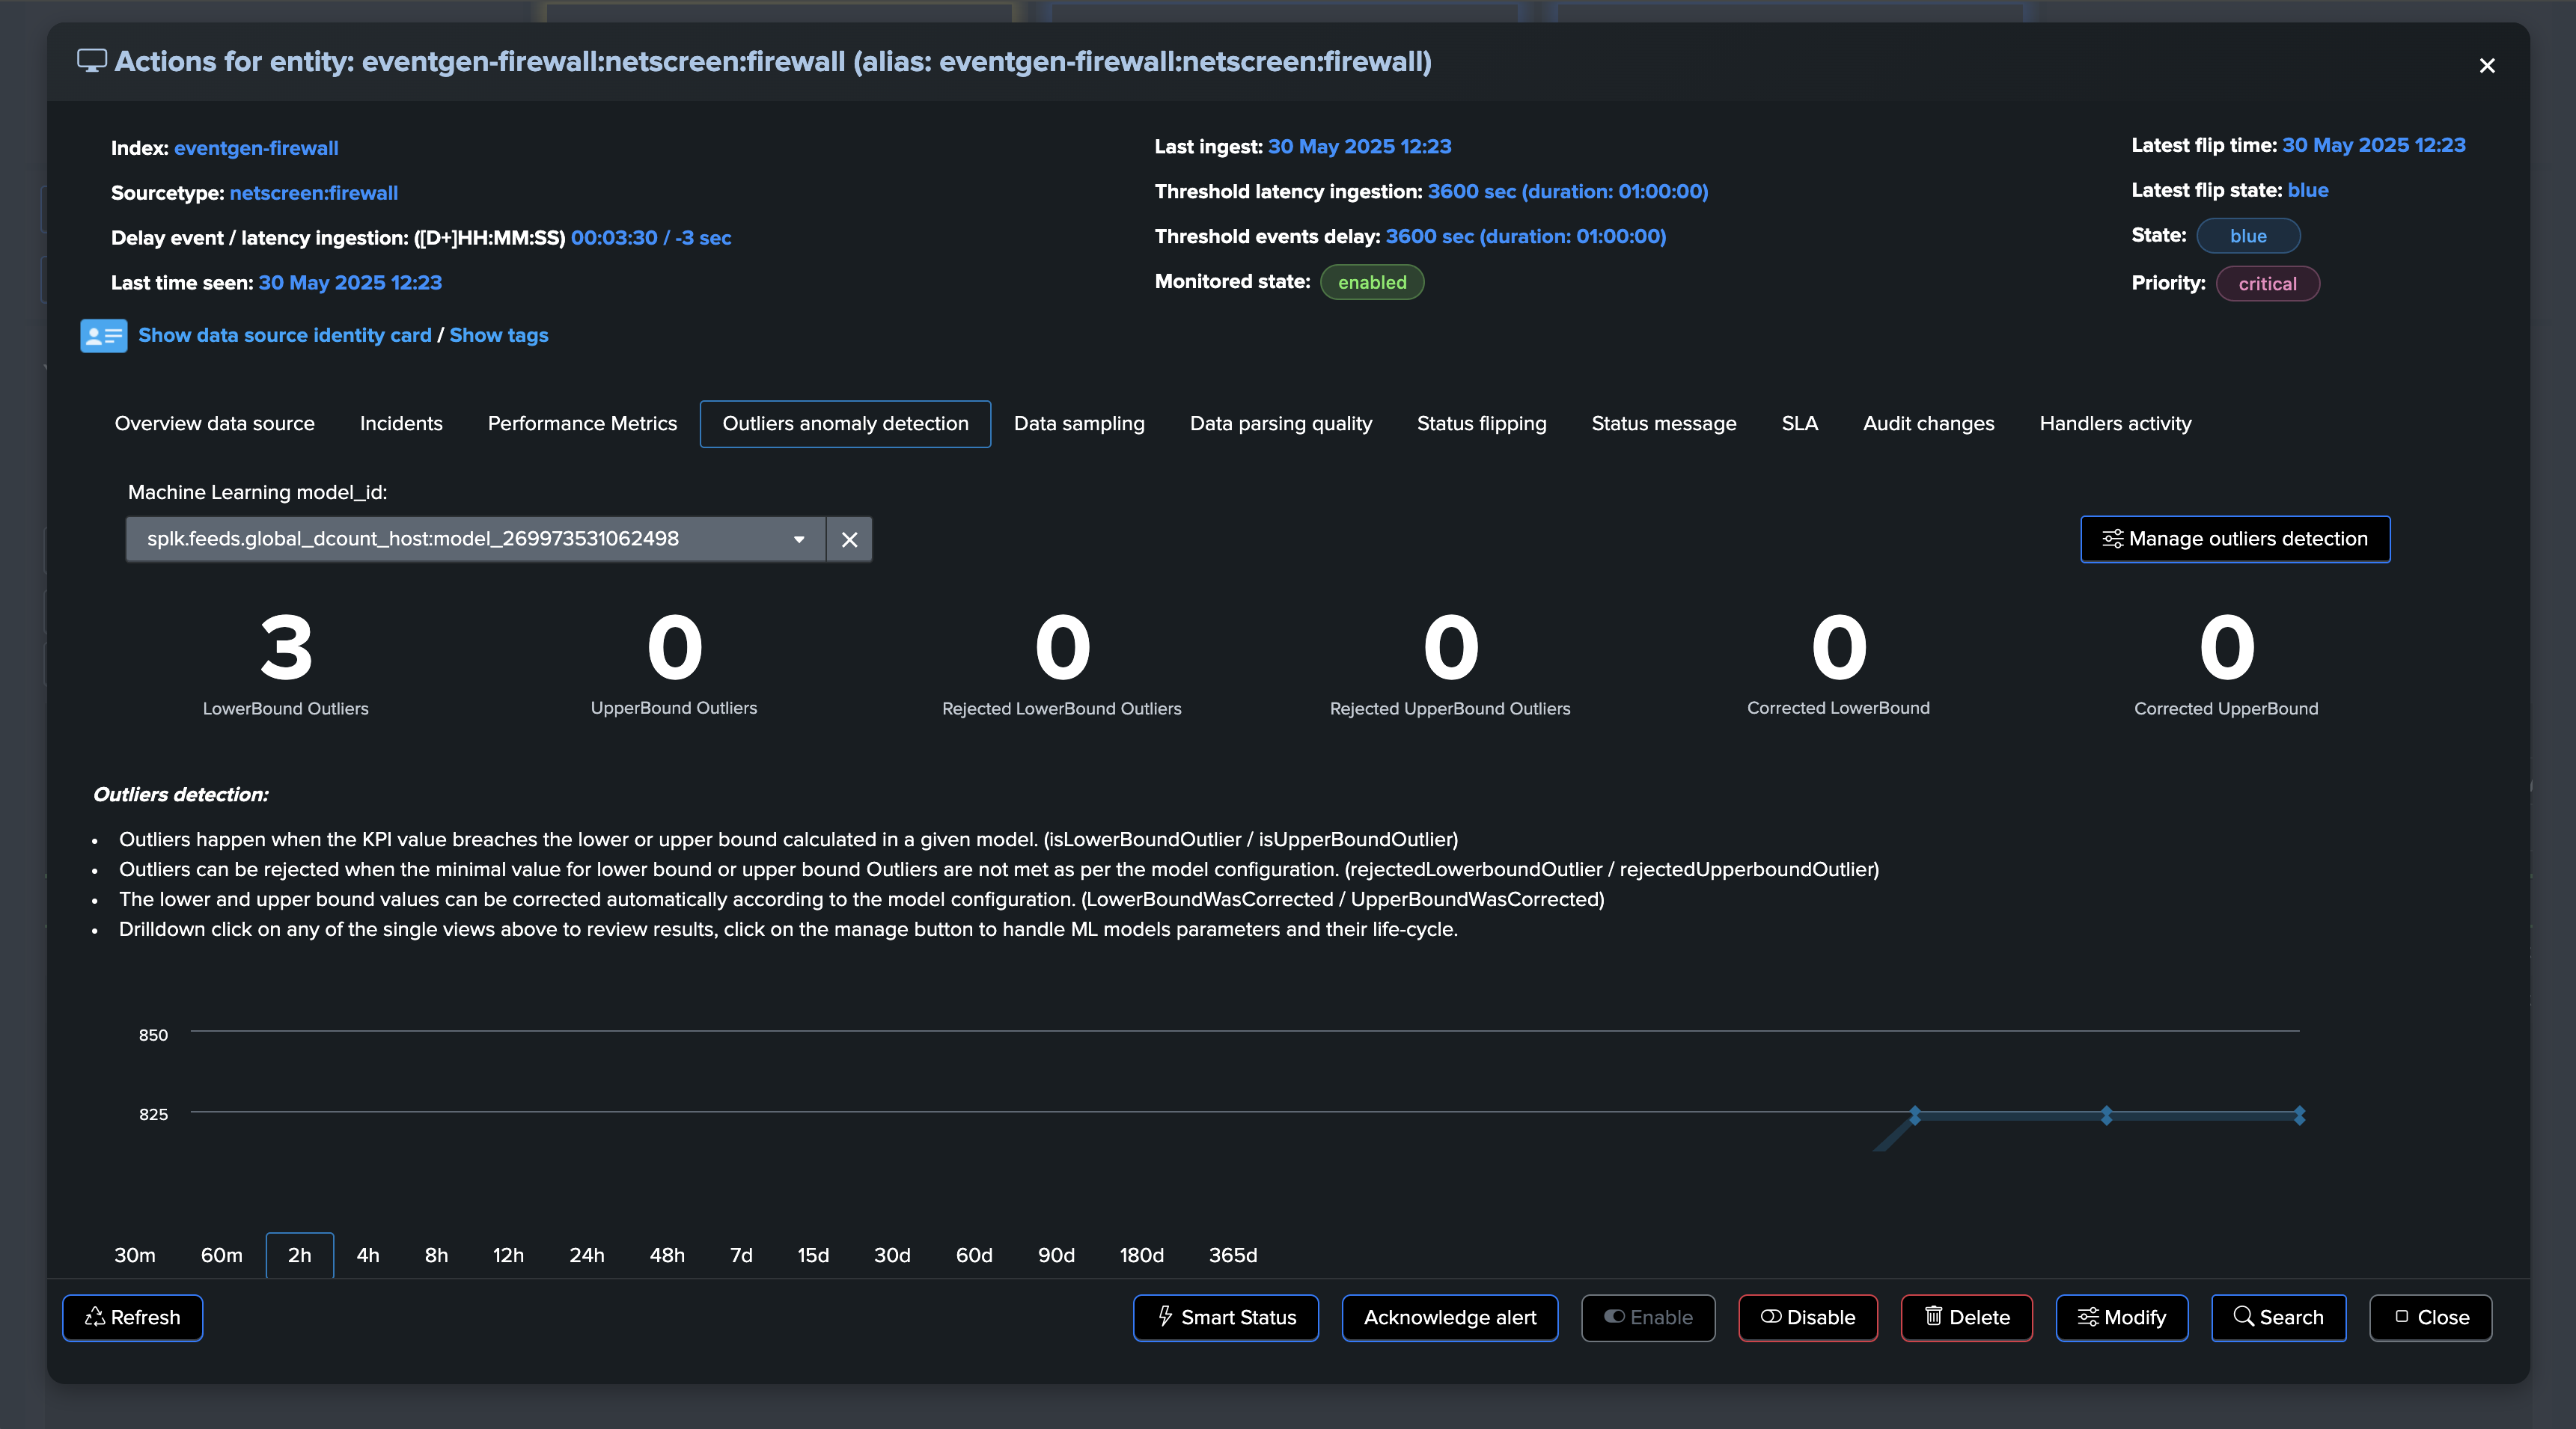
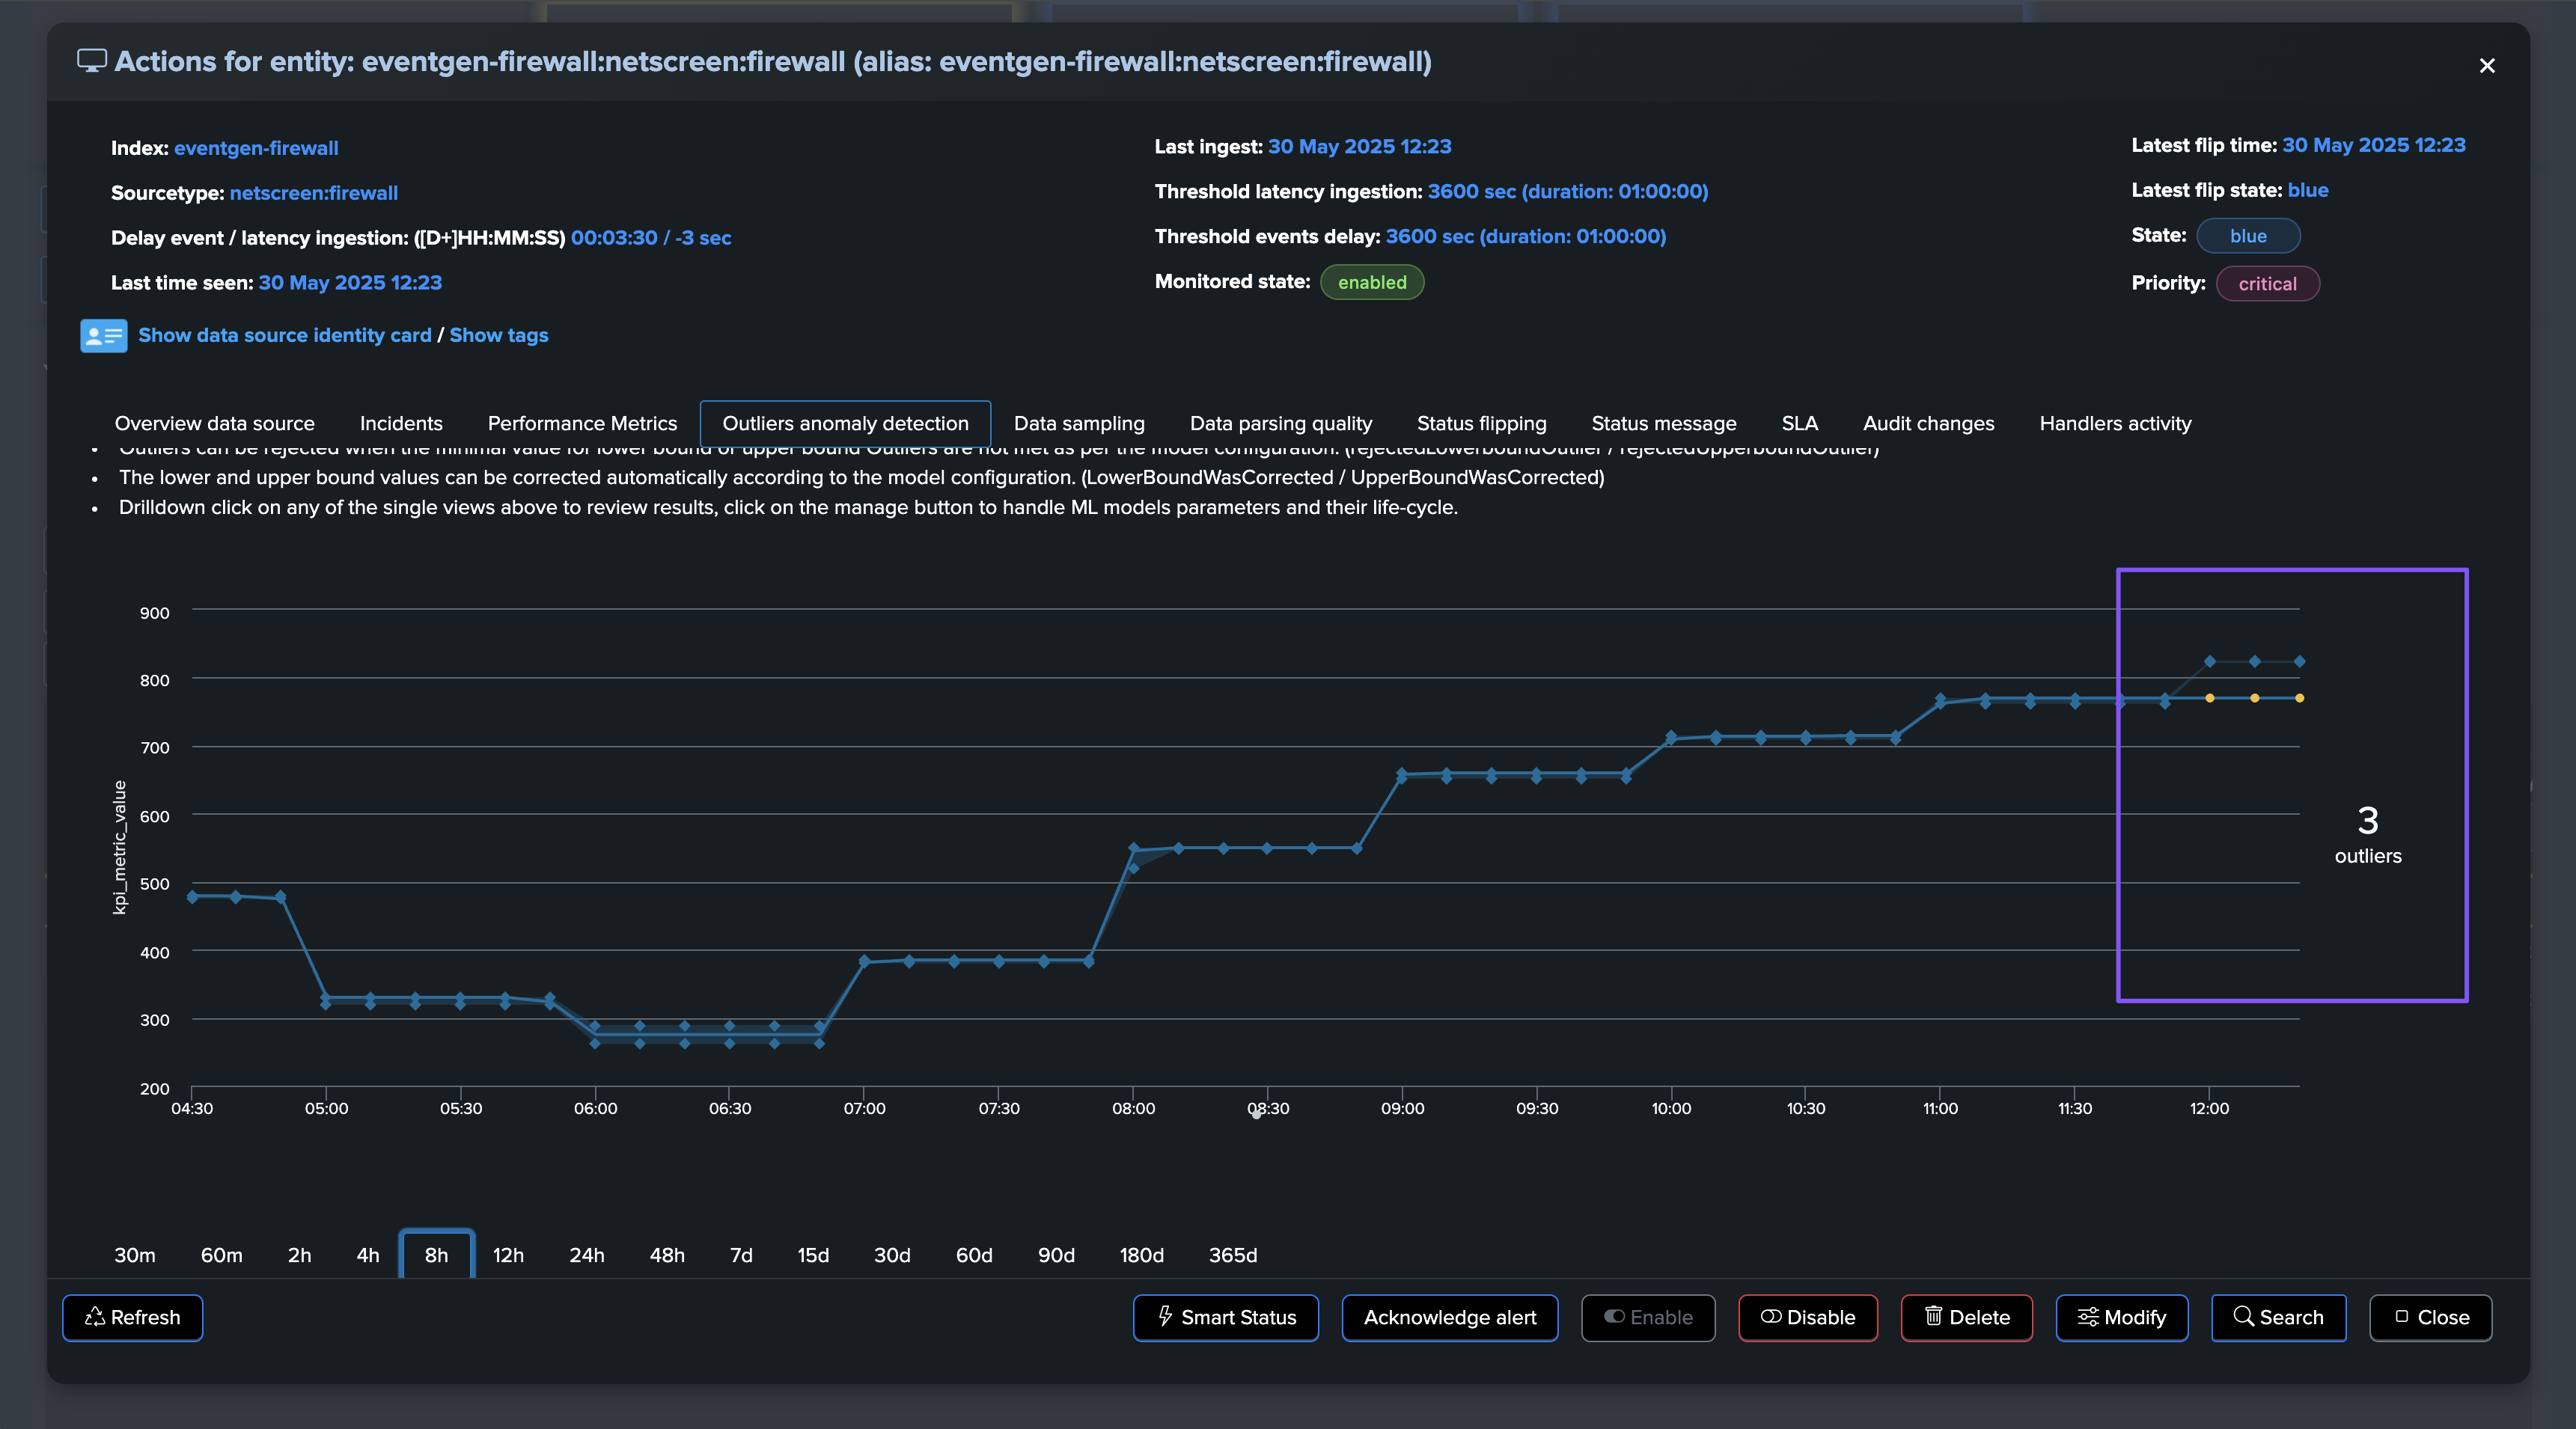
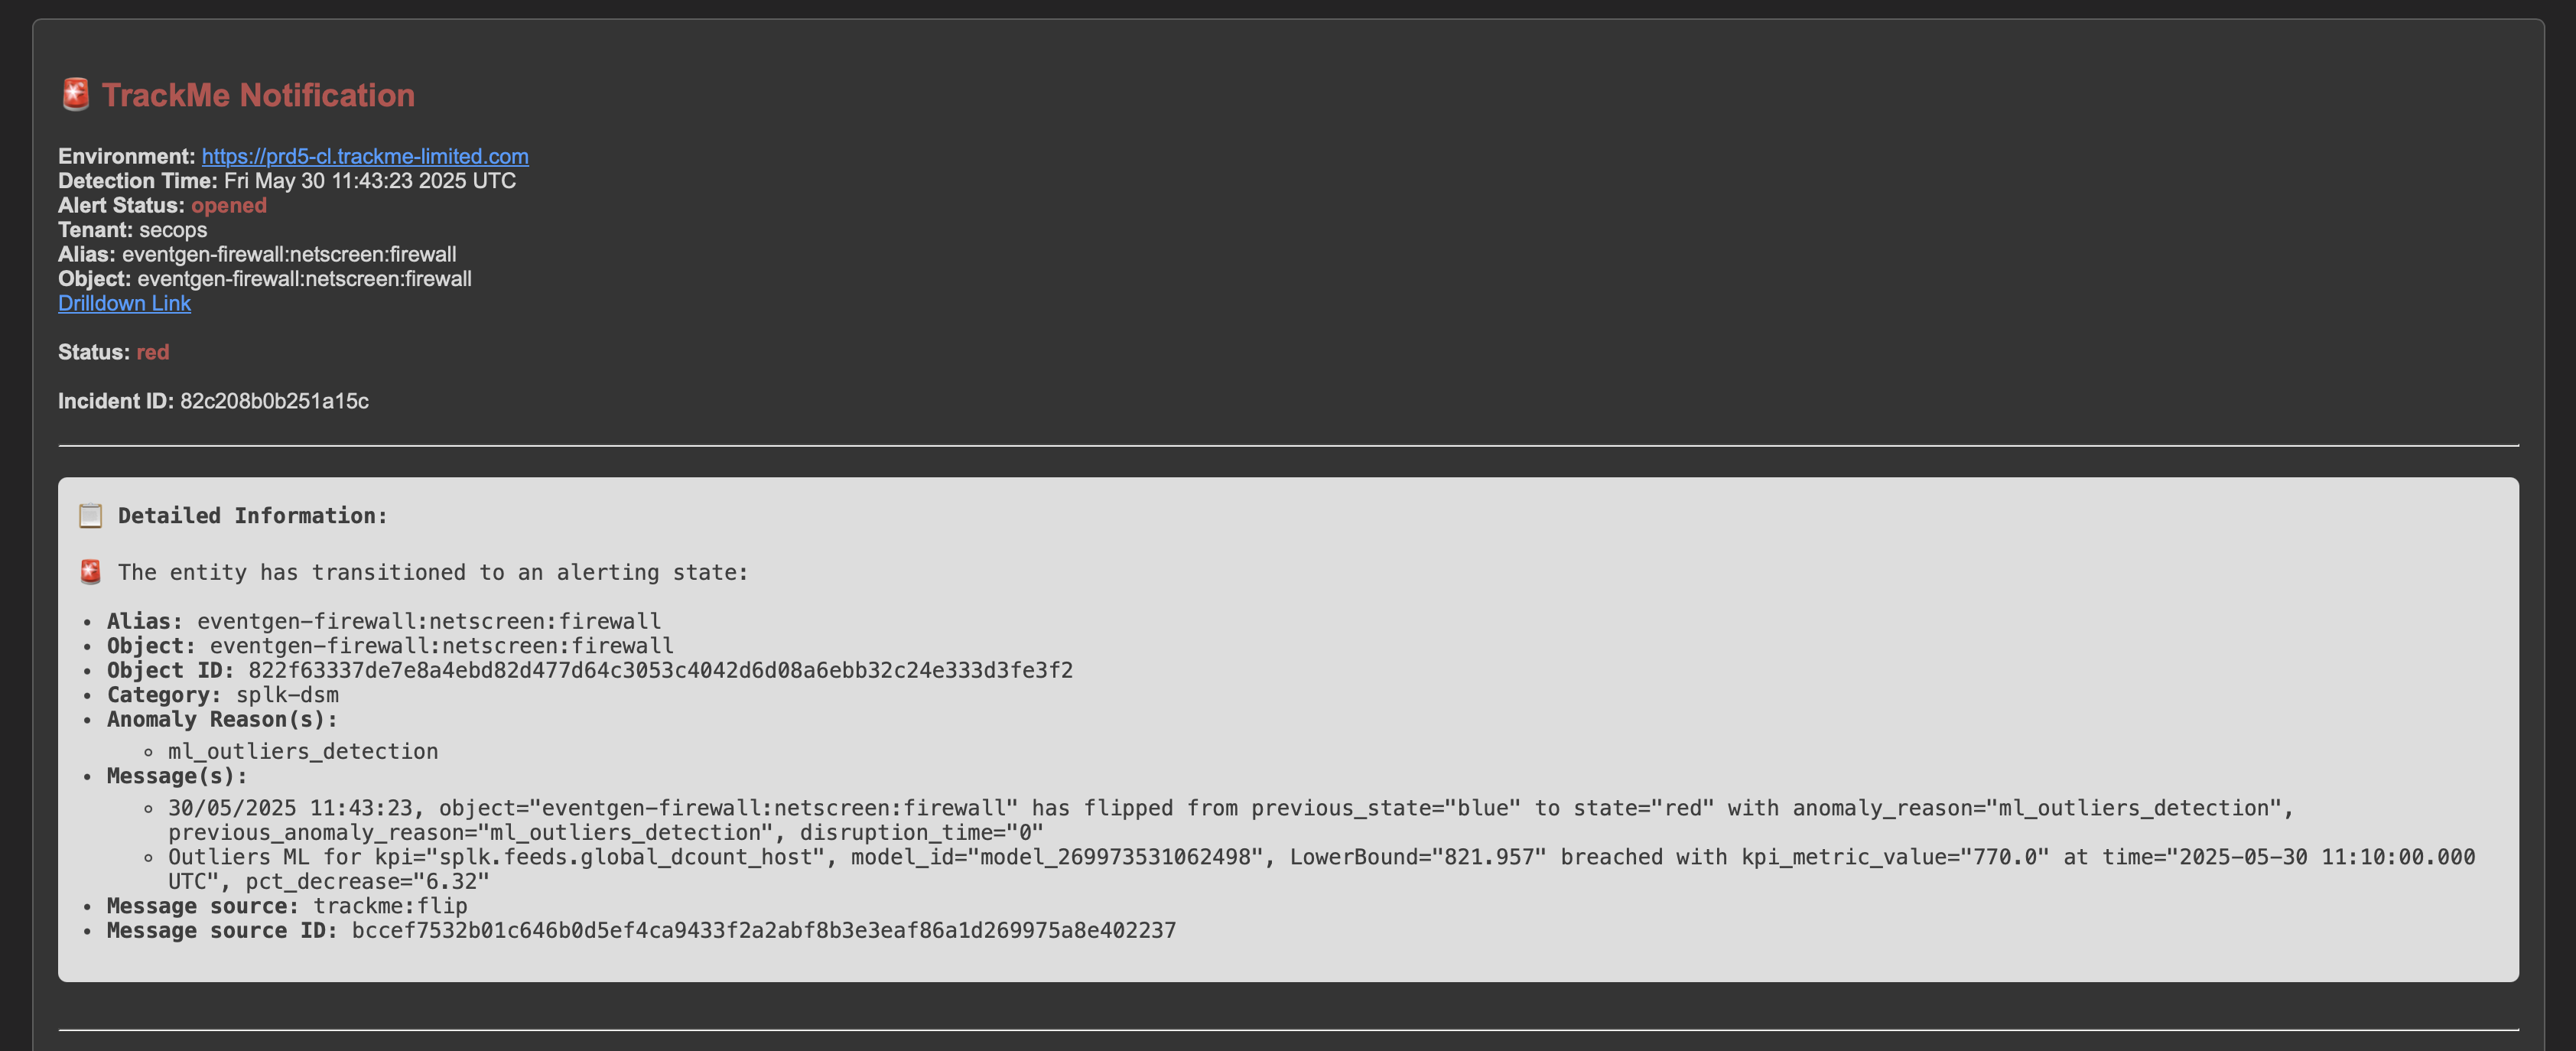
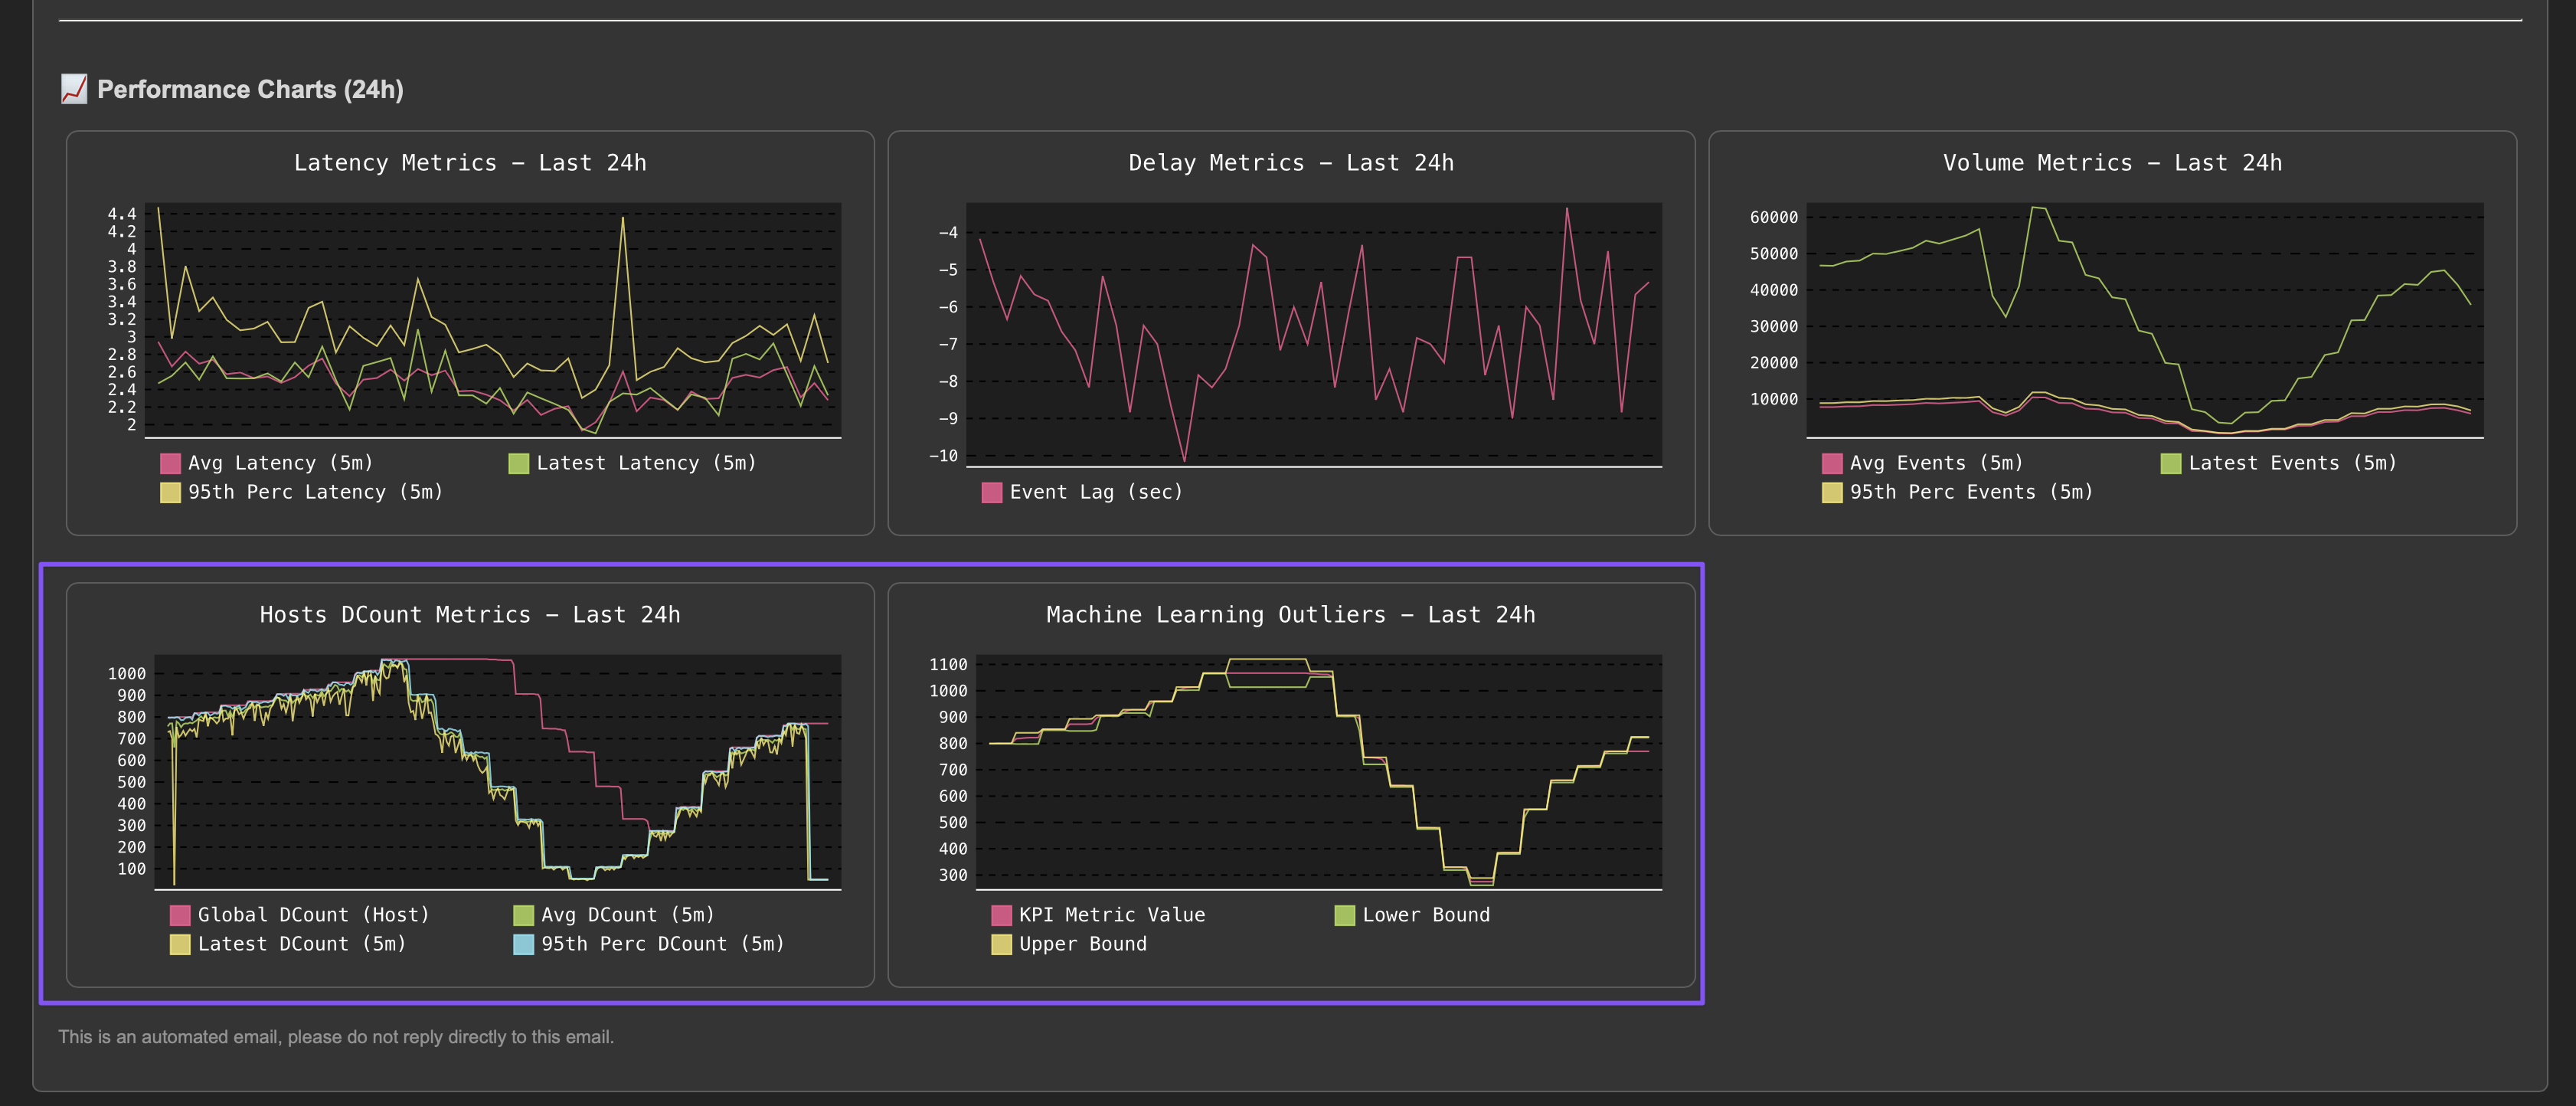
An alternative method or used in conjunction with the static threshold, is to use Machine Learning Outliers detection to detect anomalies in the distinct hosts count while taking into account time patterns:
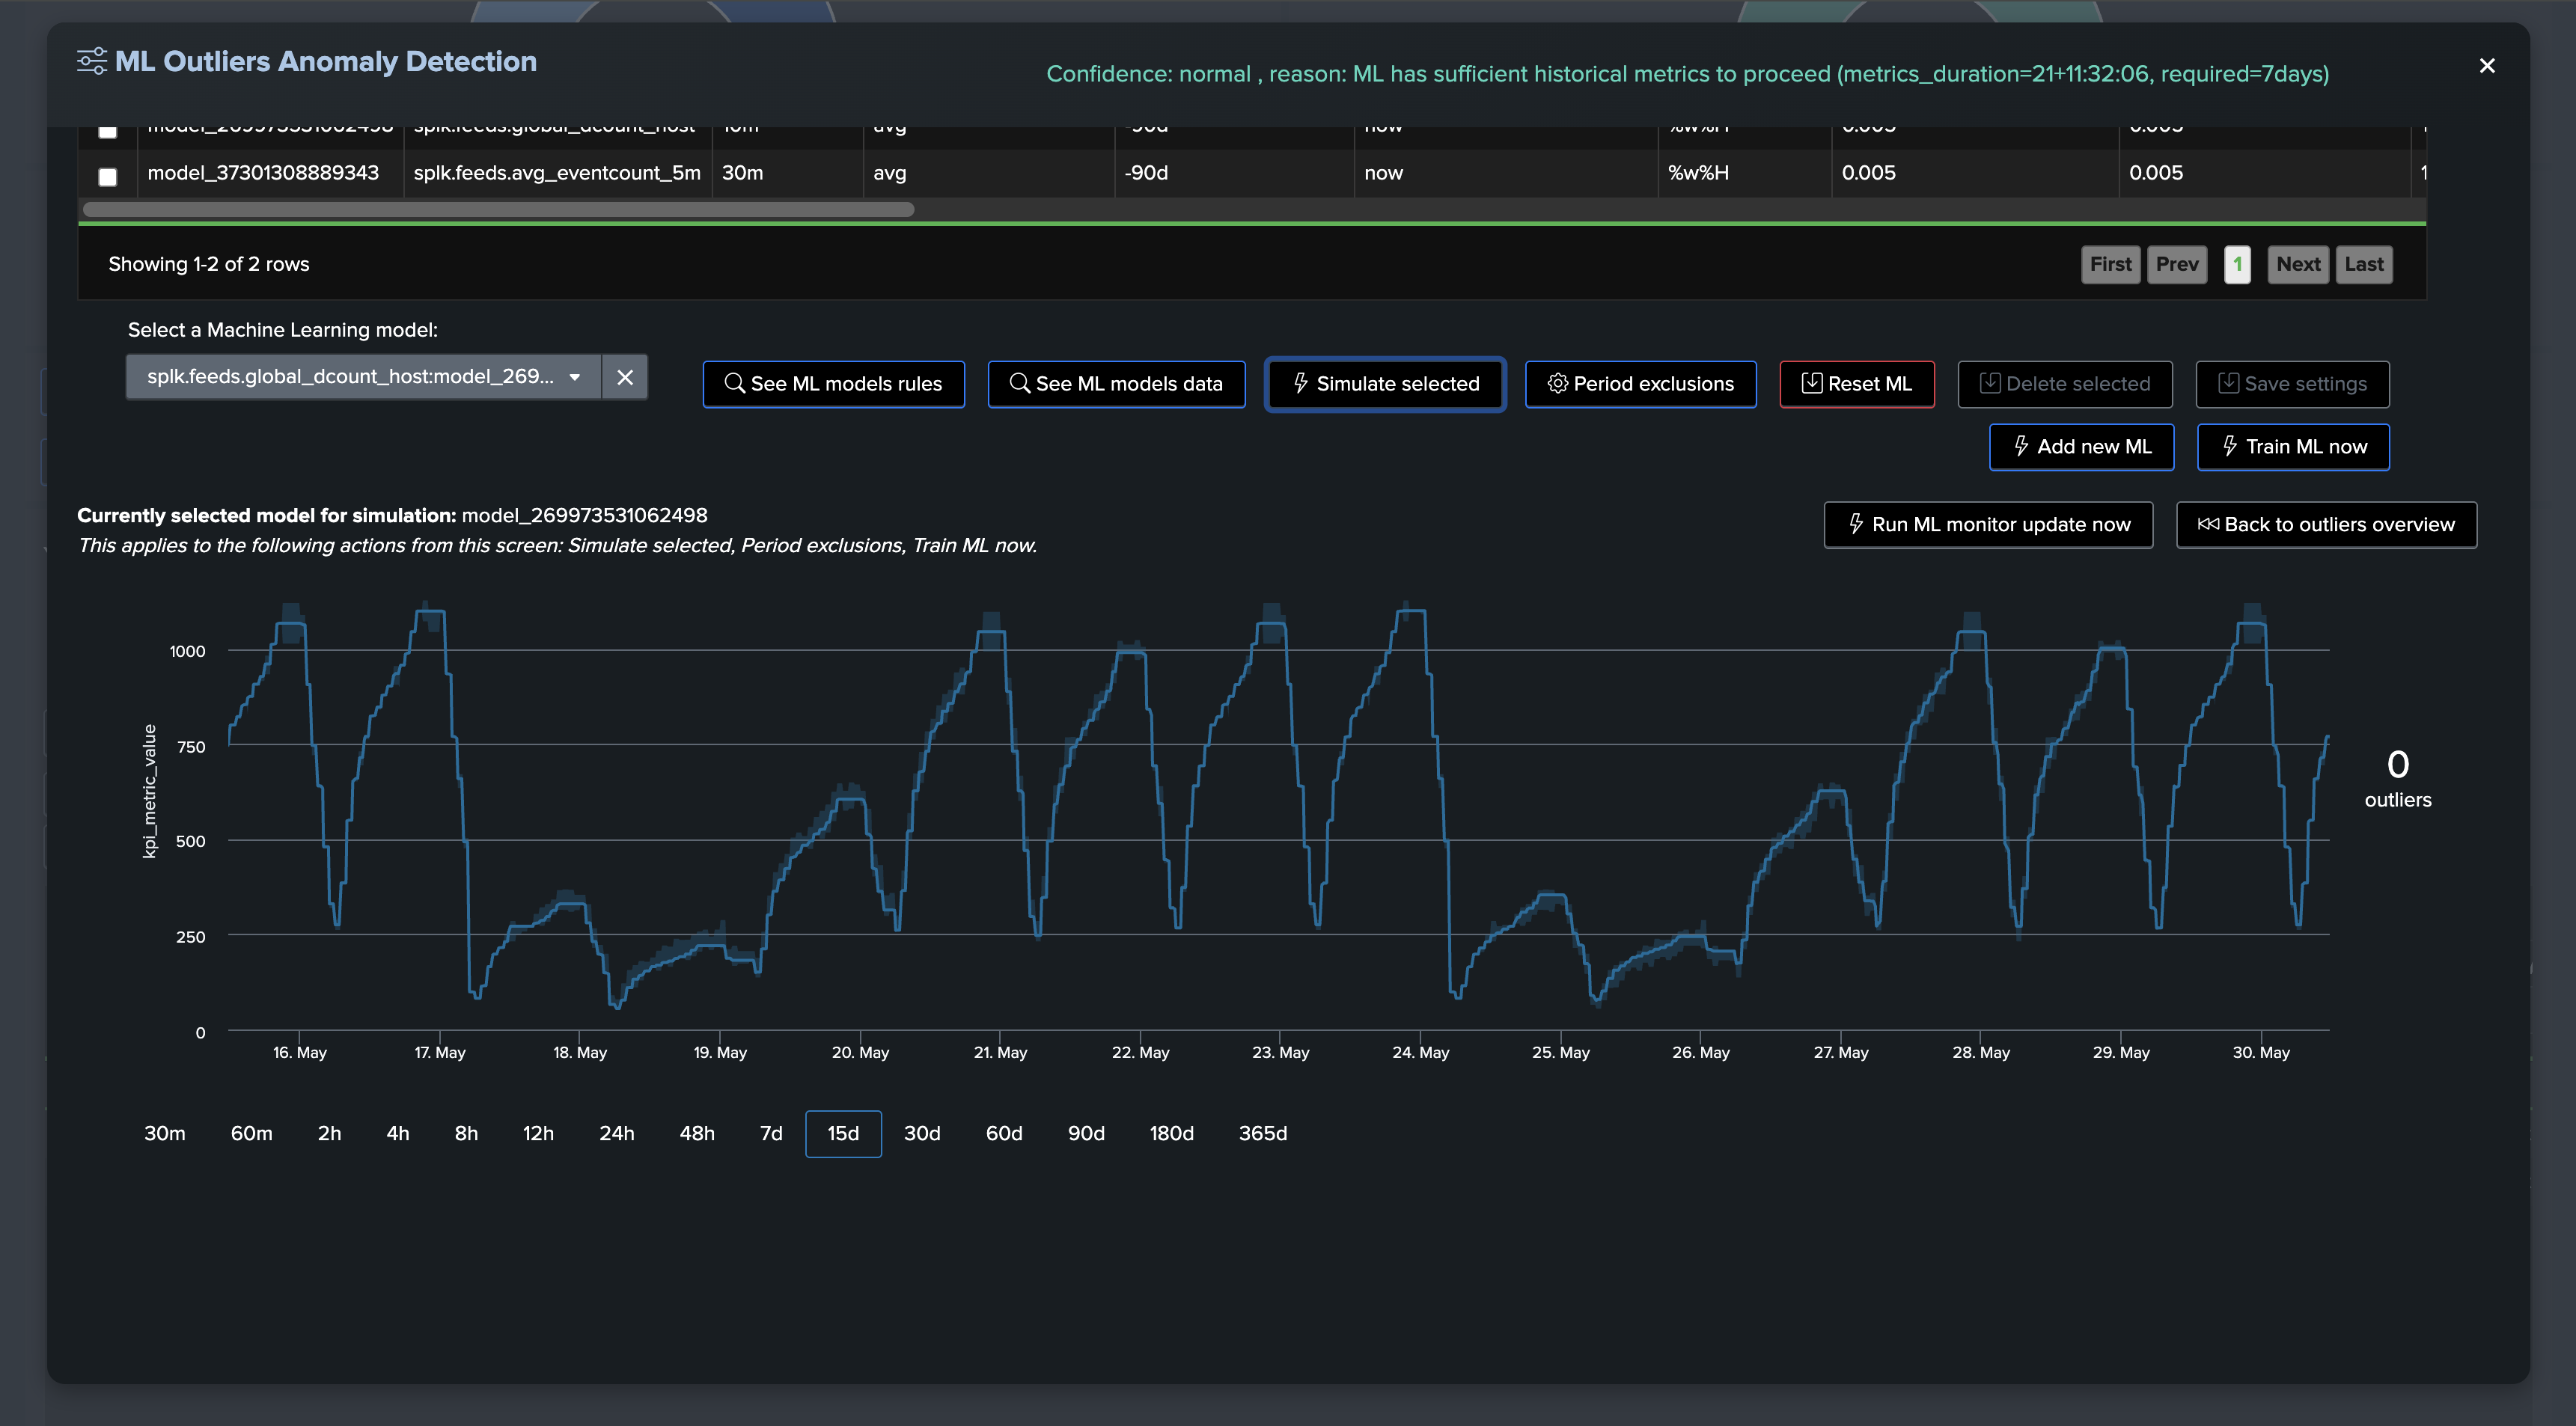
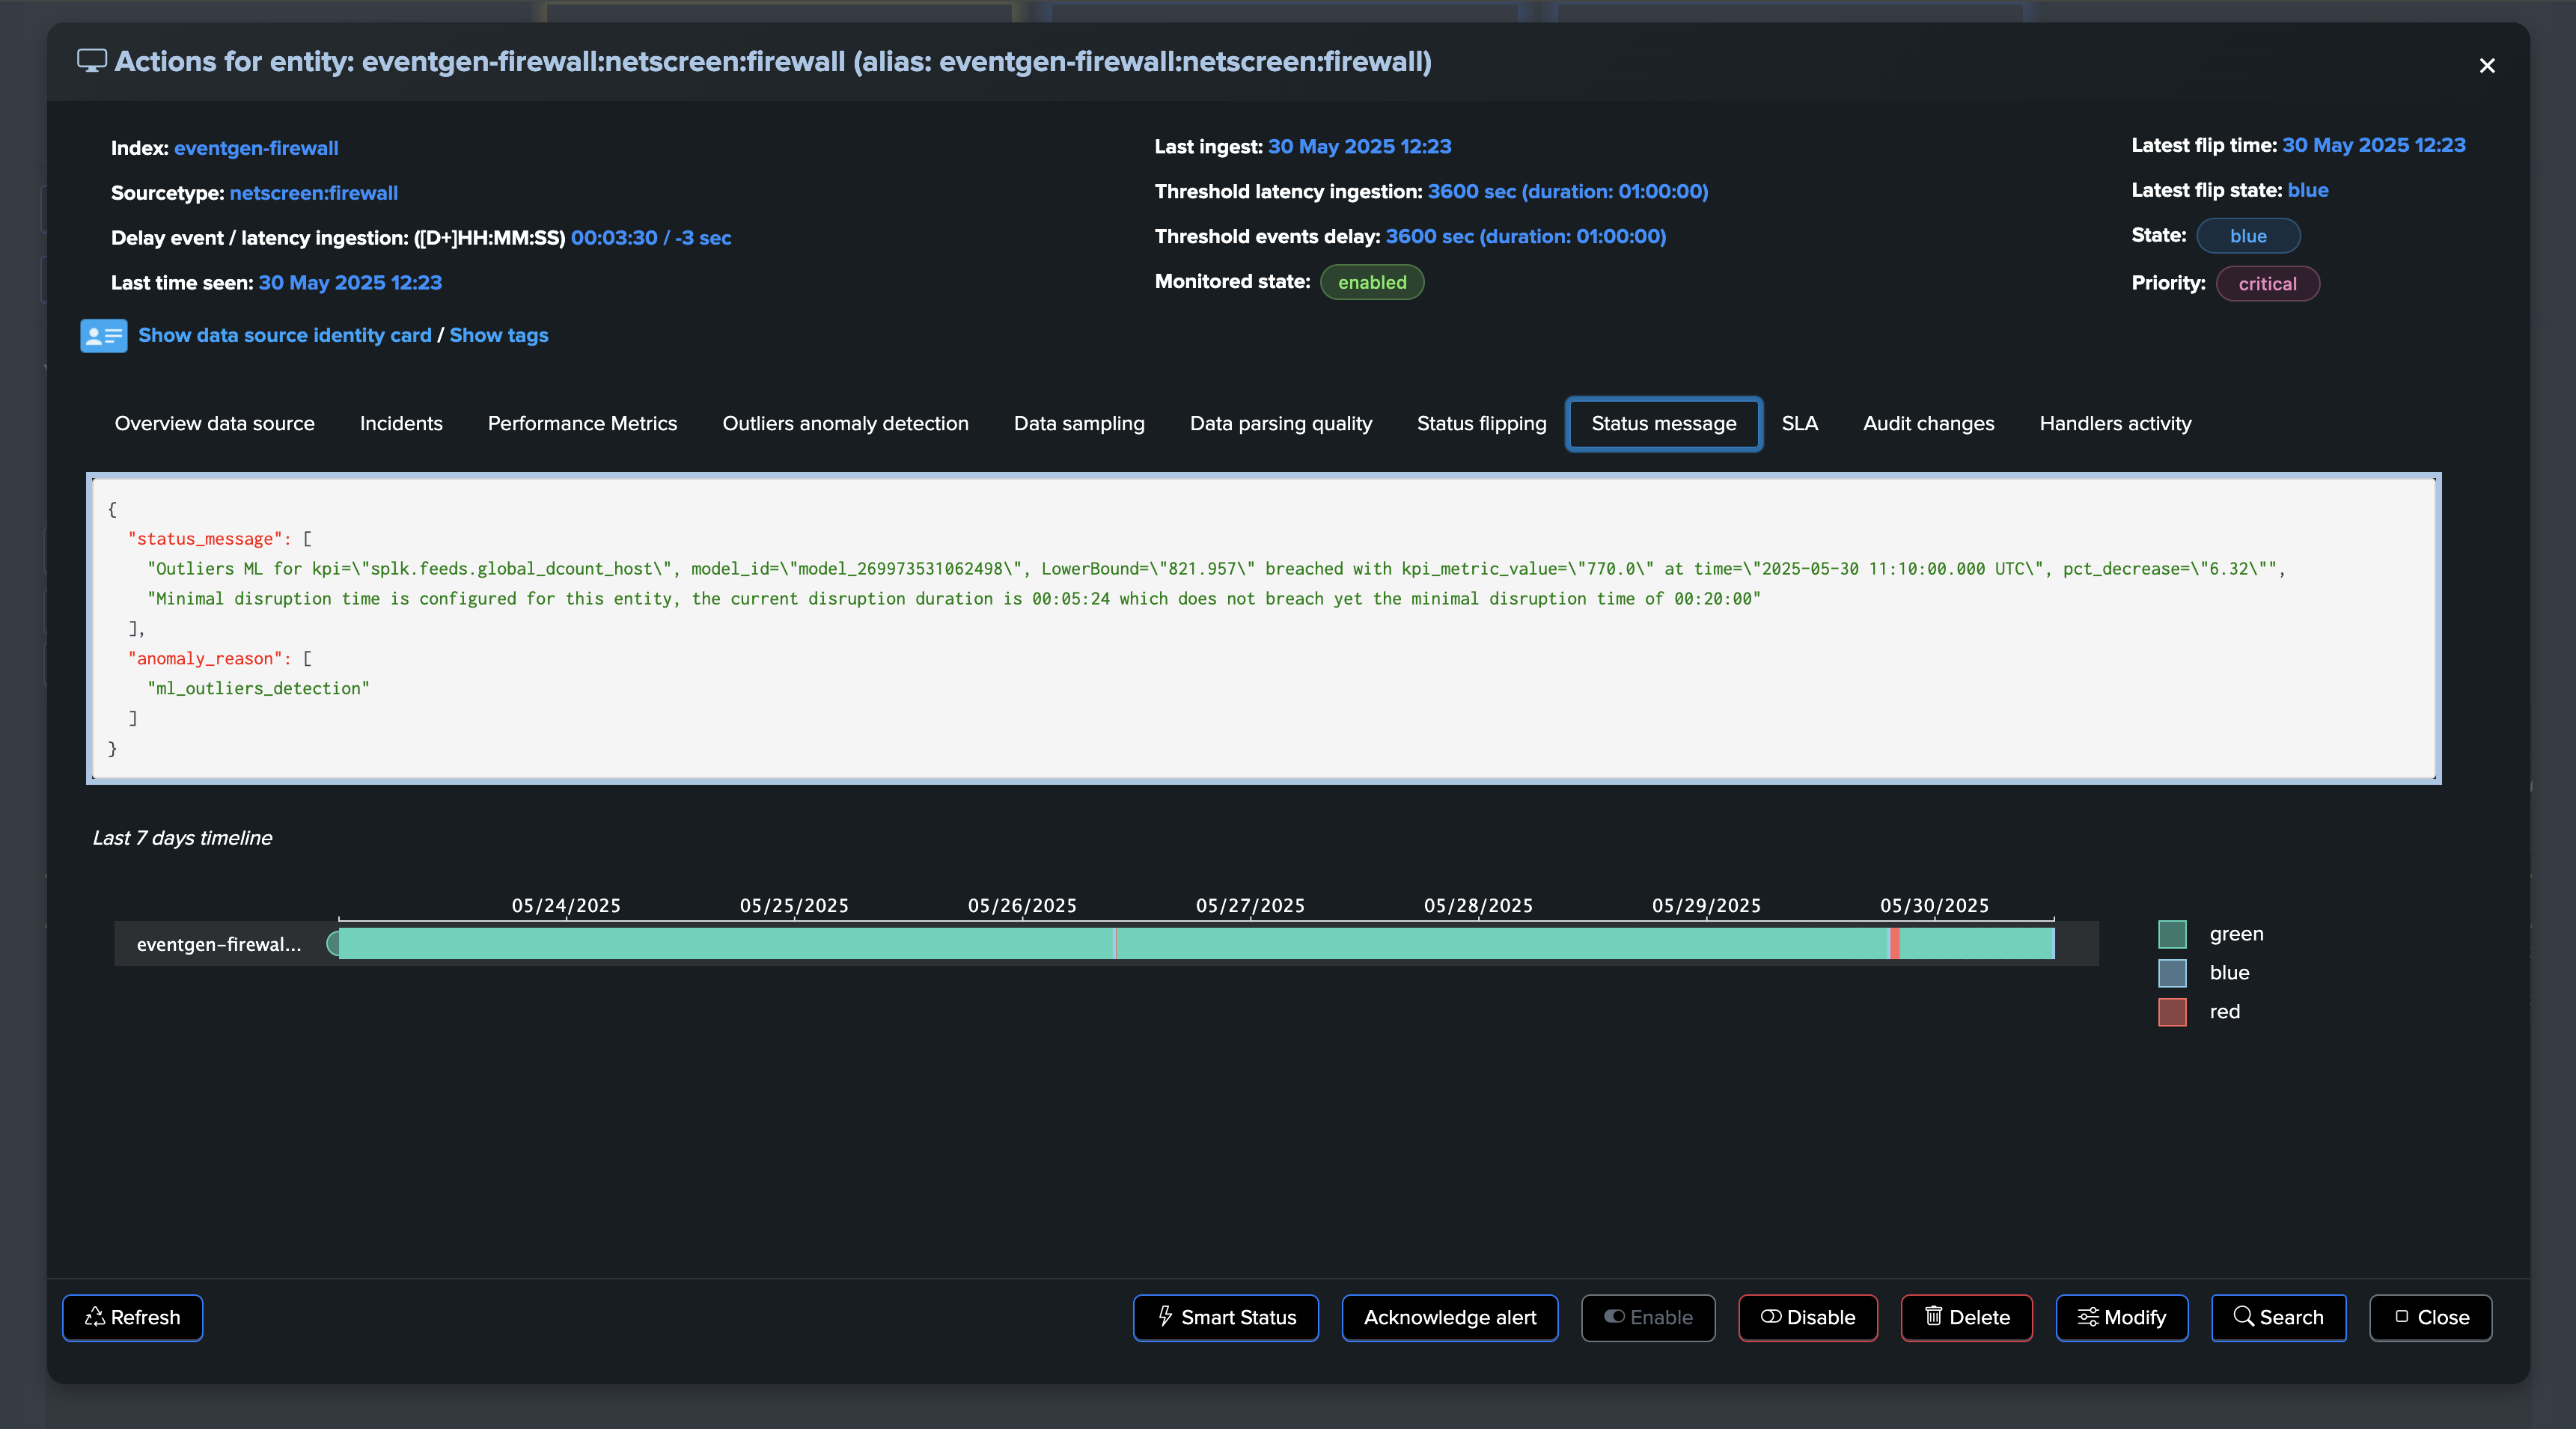
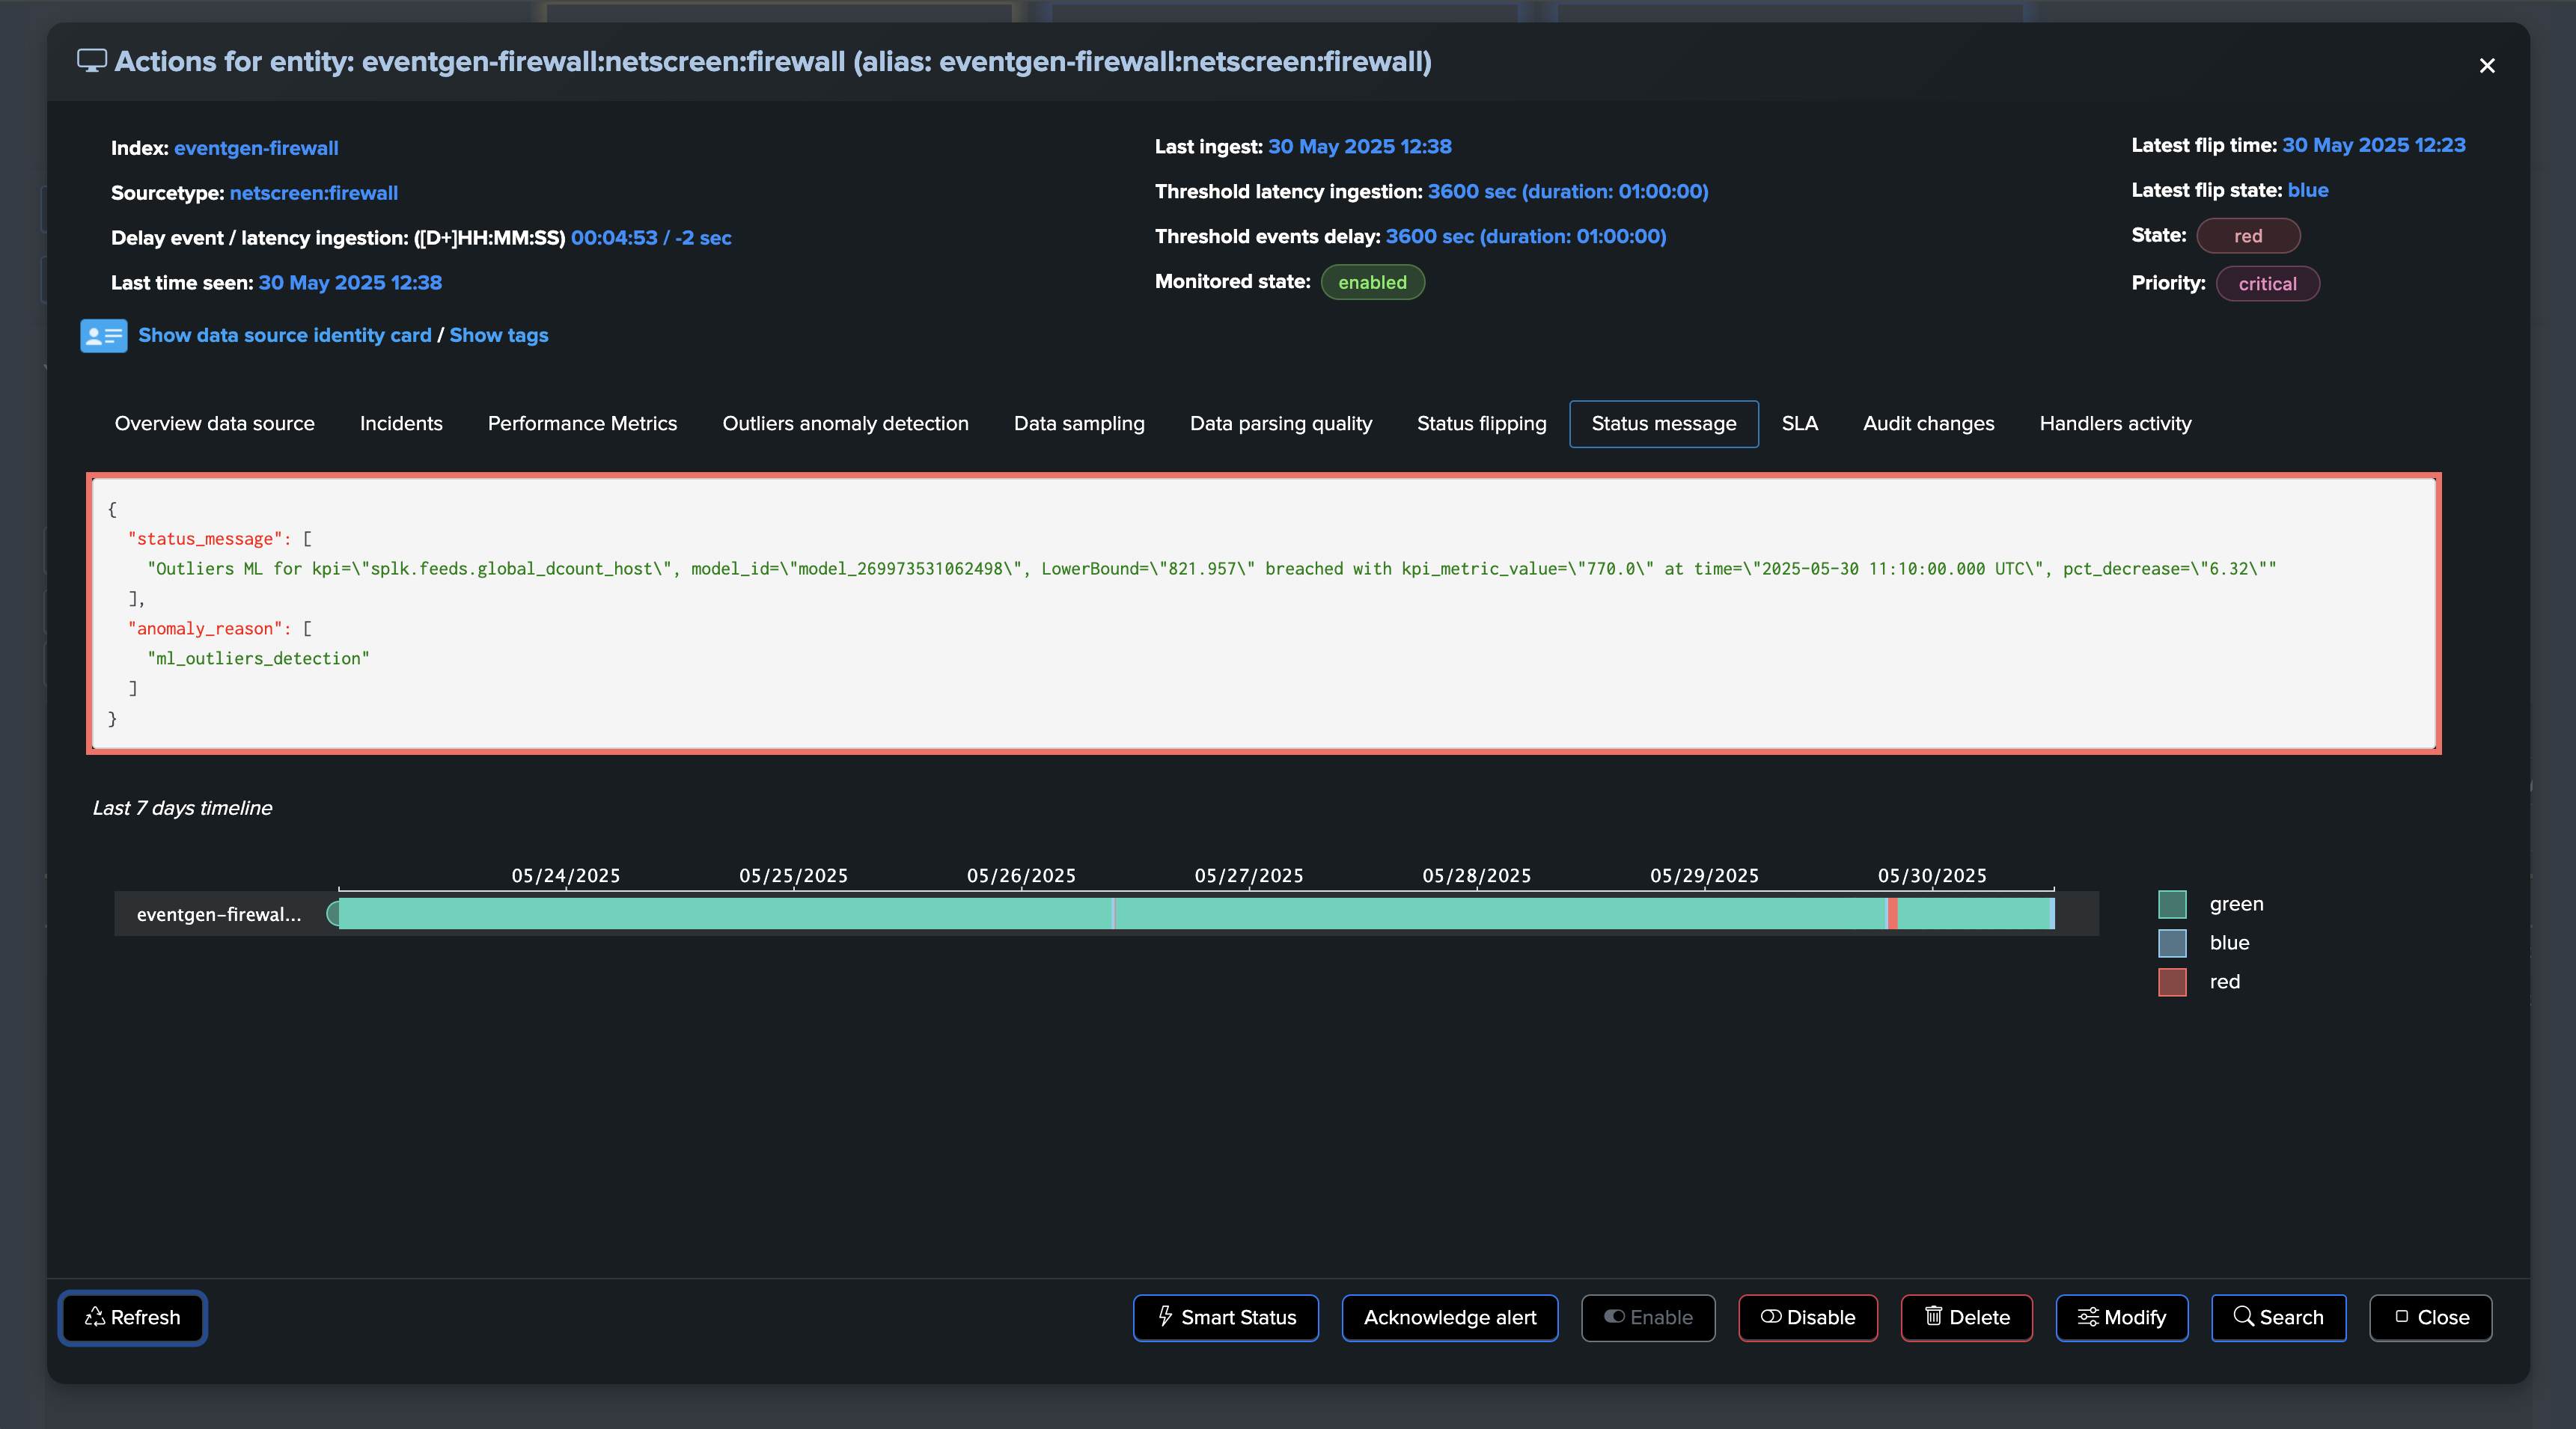
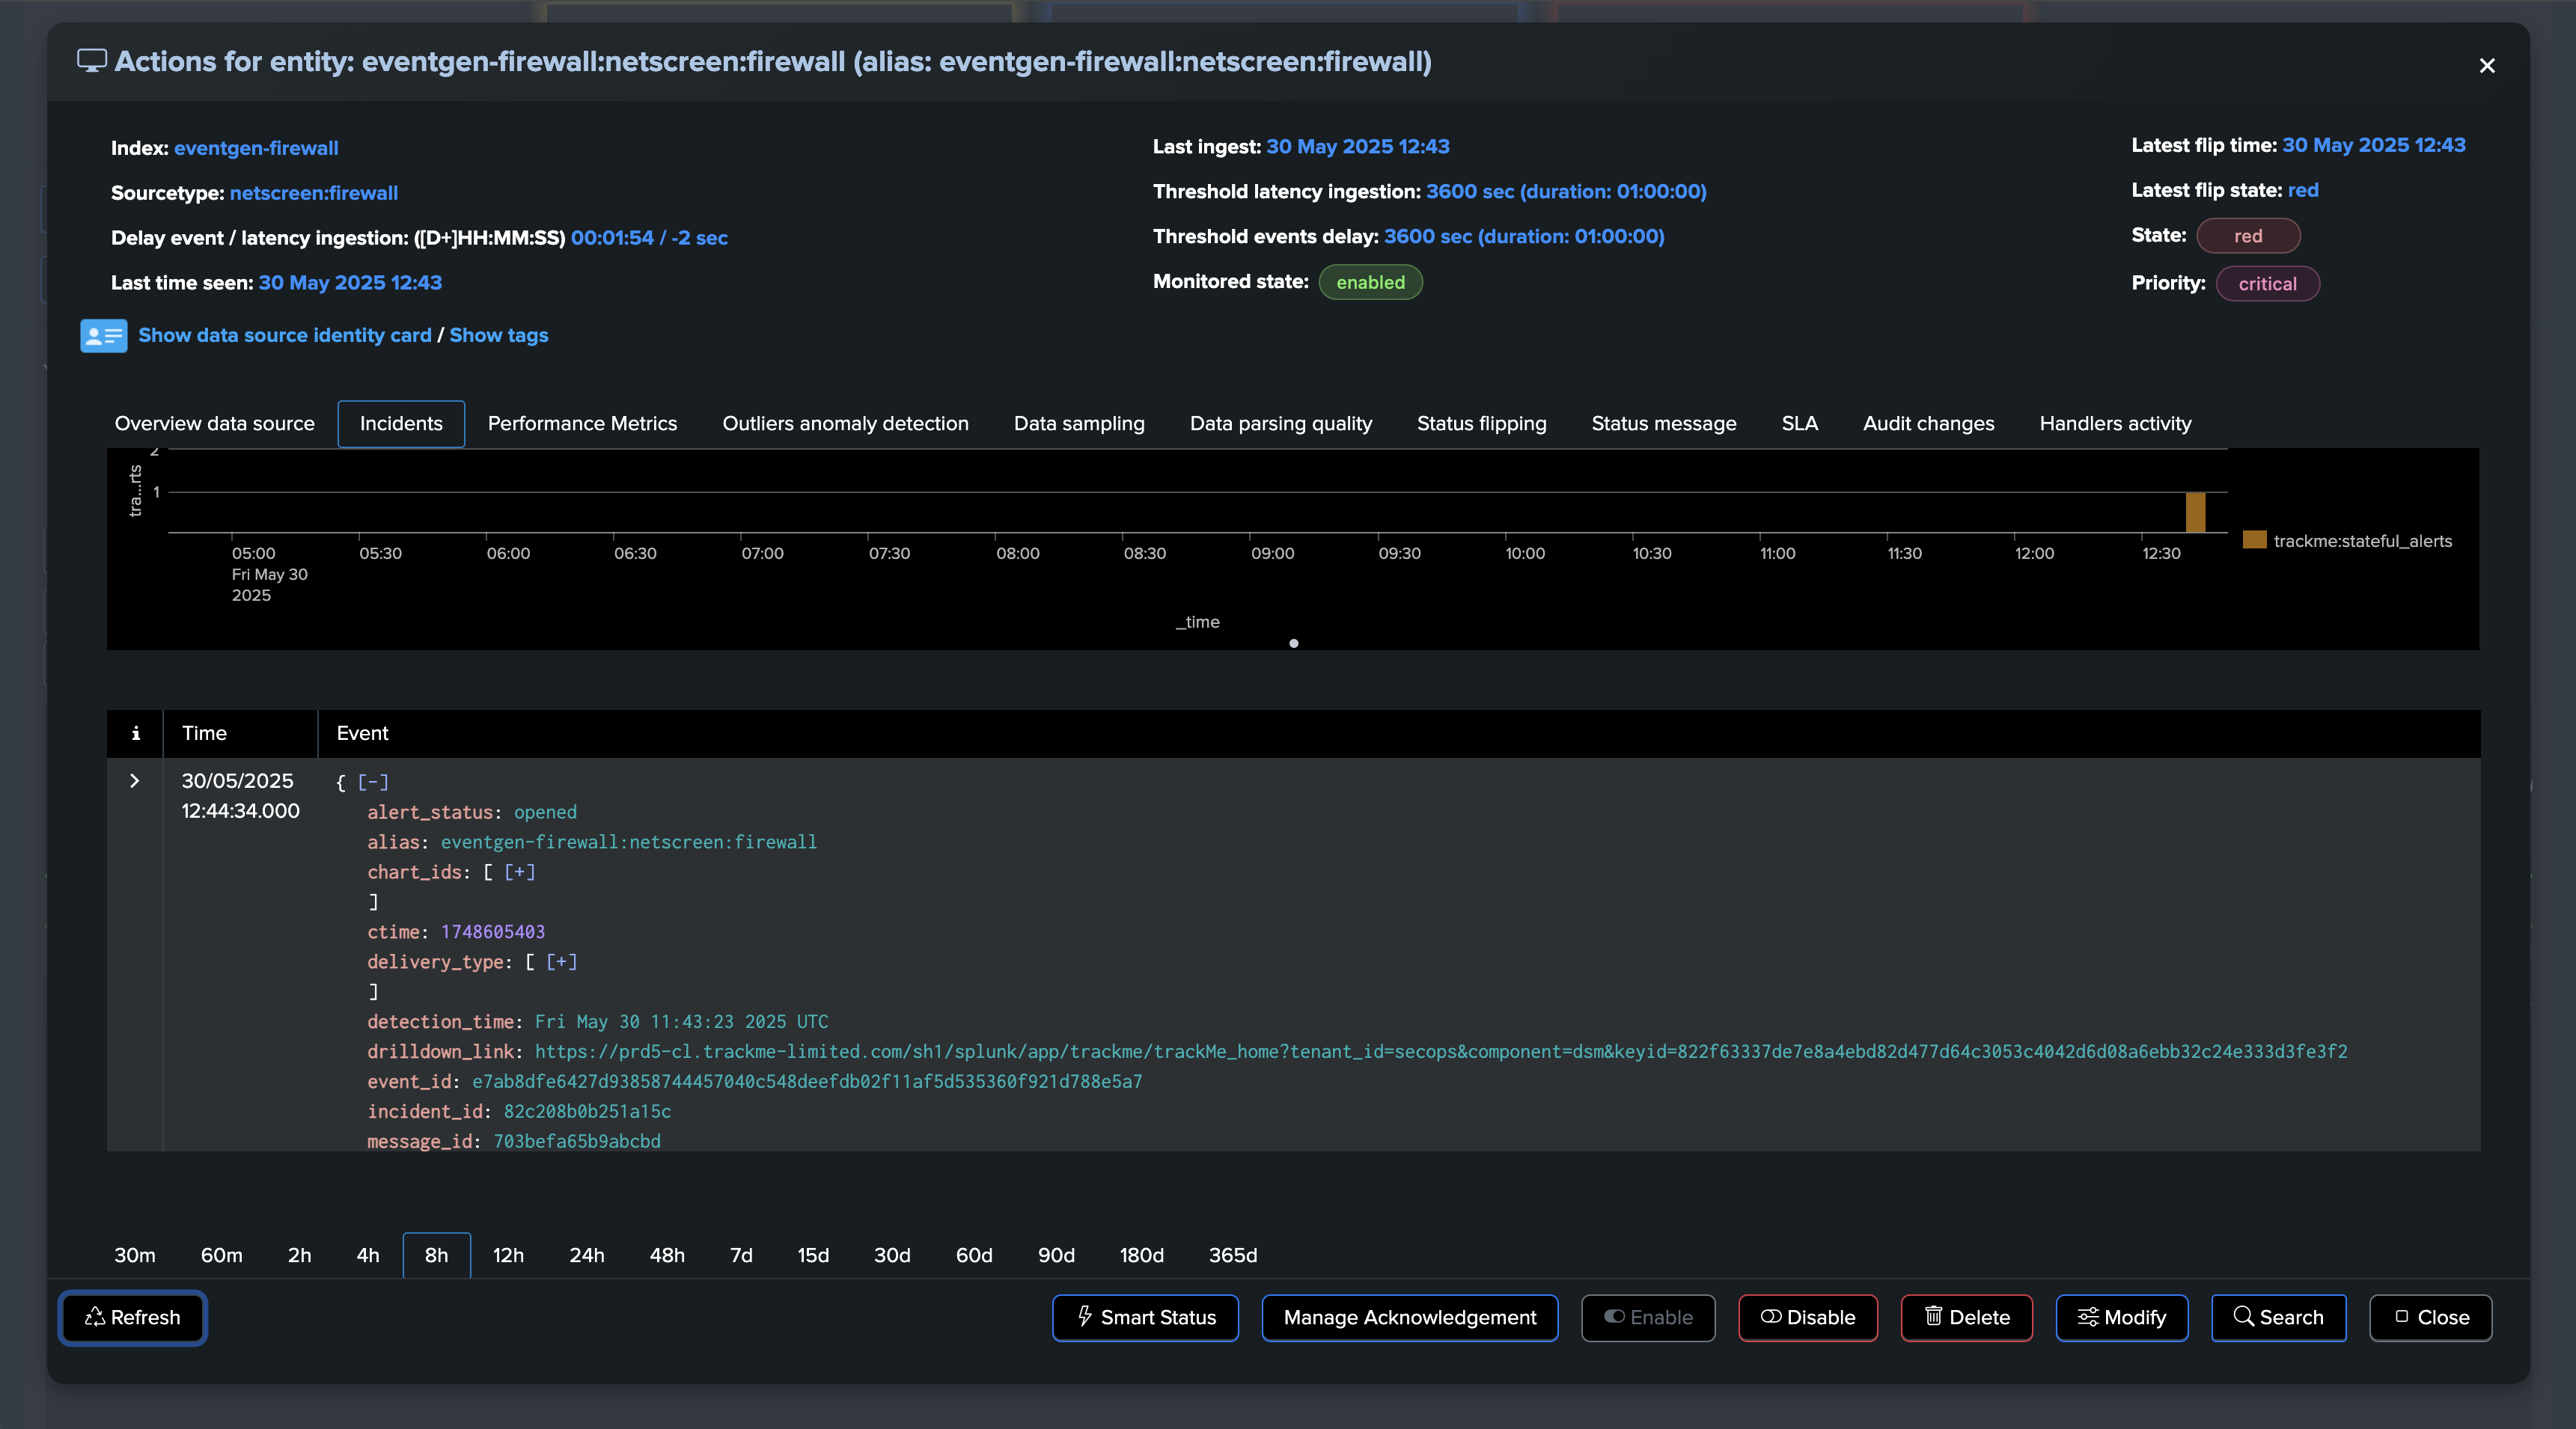
If at some point, the amount of distinct hosts goes below the threshold, the entity will be considered as in anomaly, and an incident will be opened:
Notes:
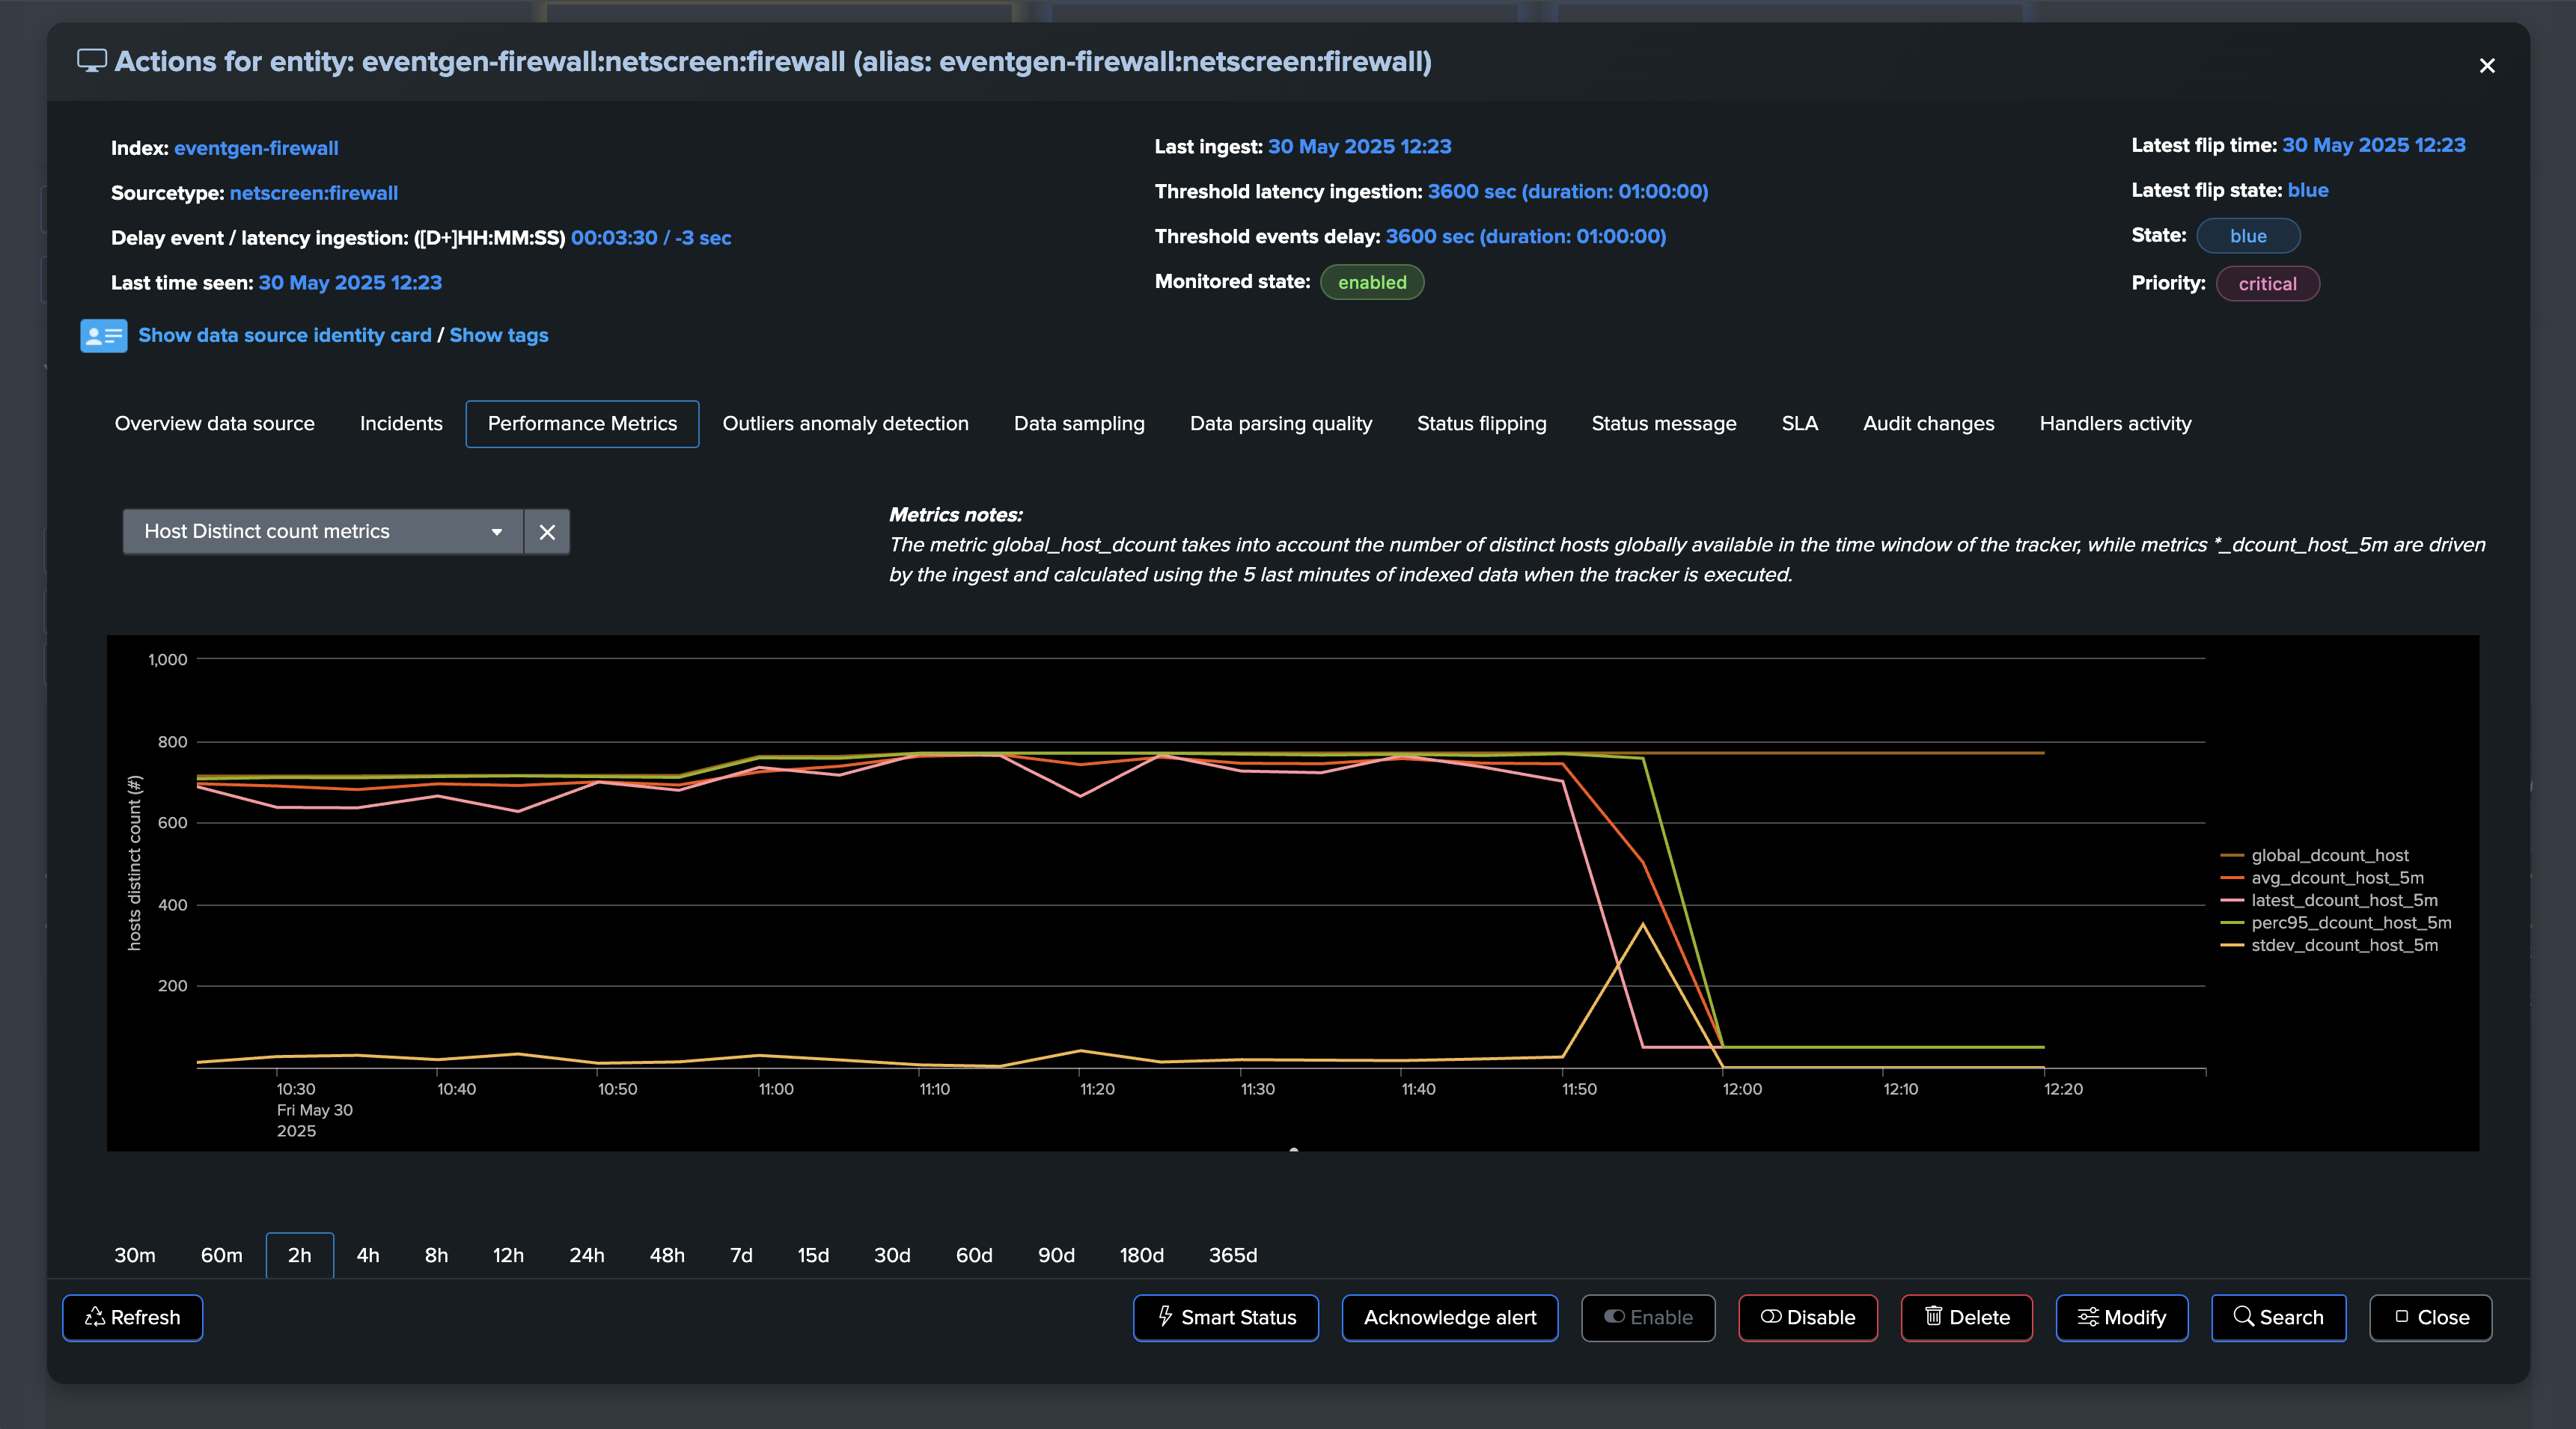
The “global” distinct count KPI measures the number of unique hosts across the entire tracker period. Due to this global aggregation, there may be a delay in detecting anomalies as the system needs to accumulate enough data to establish a clear pattern.
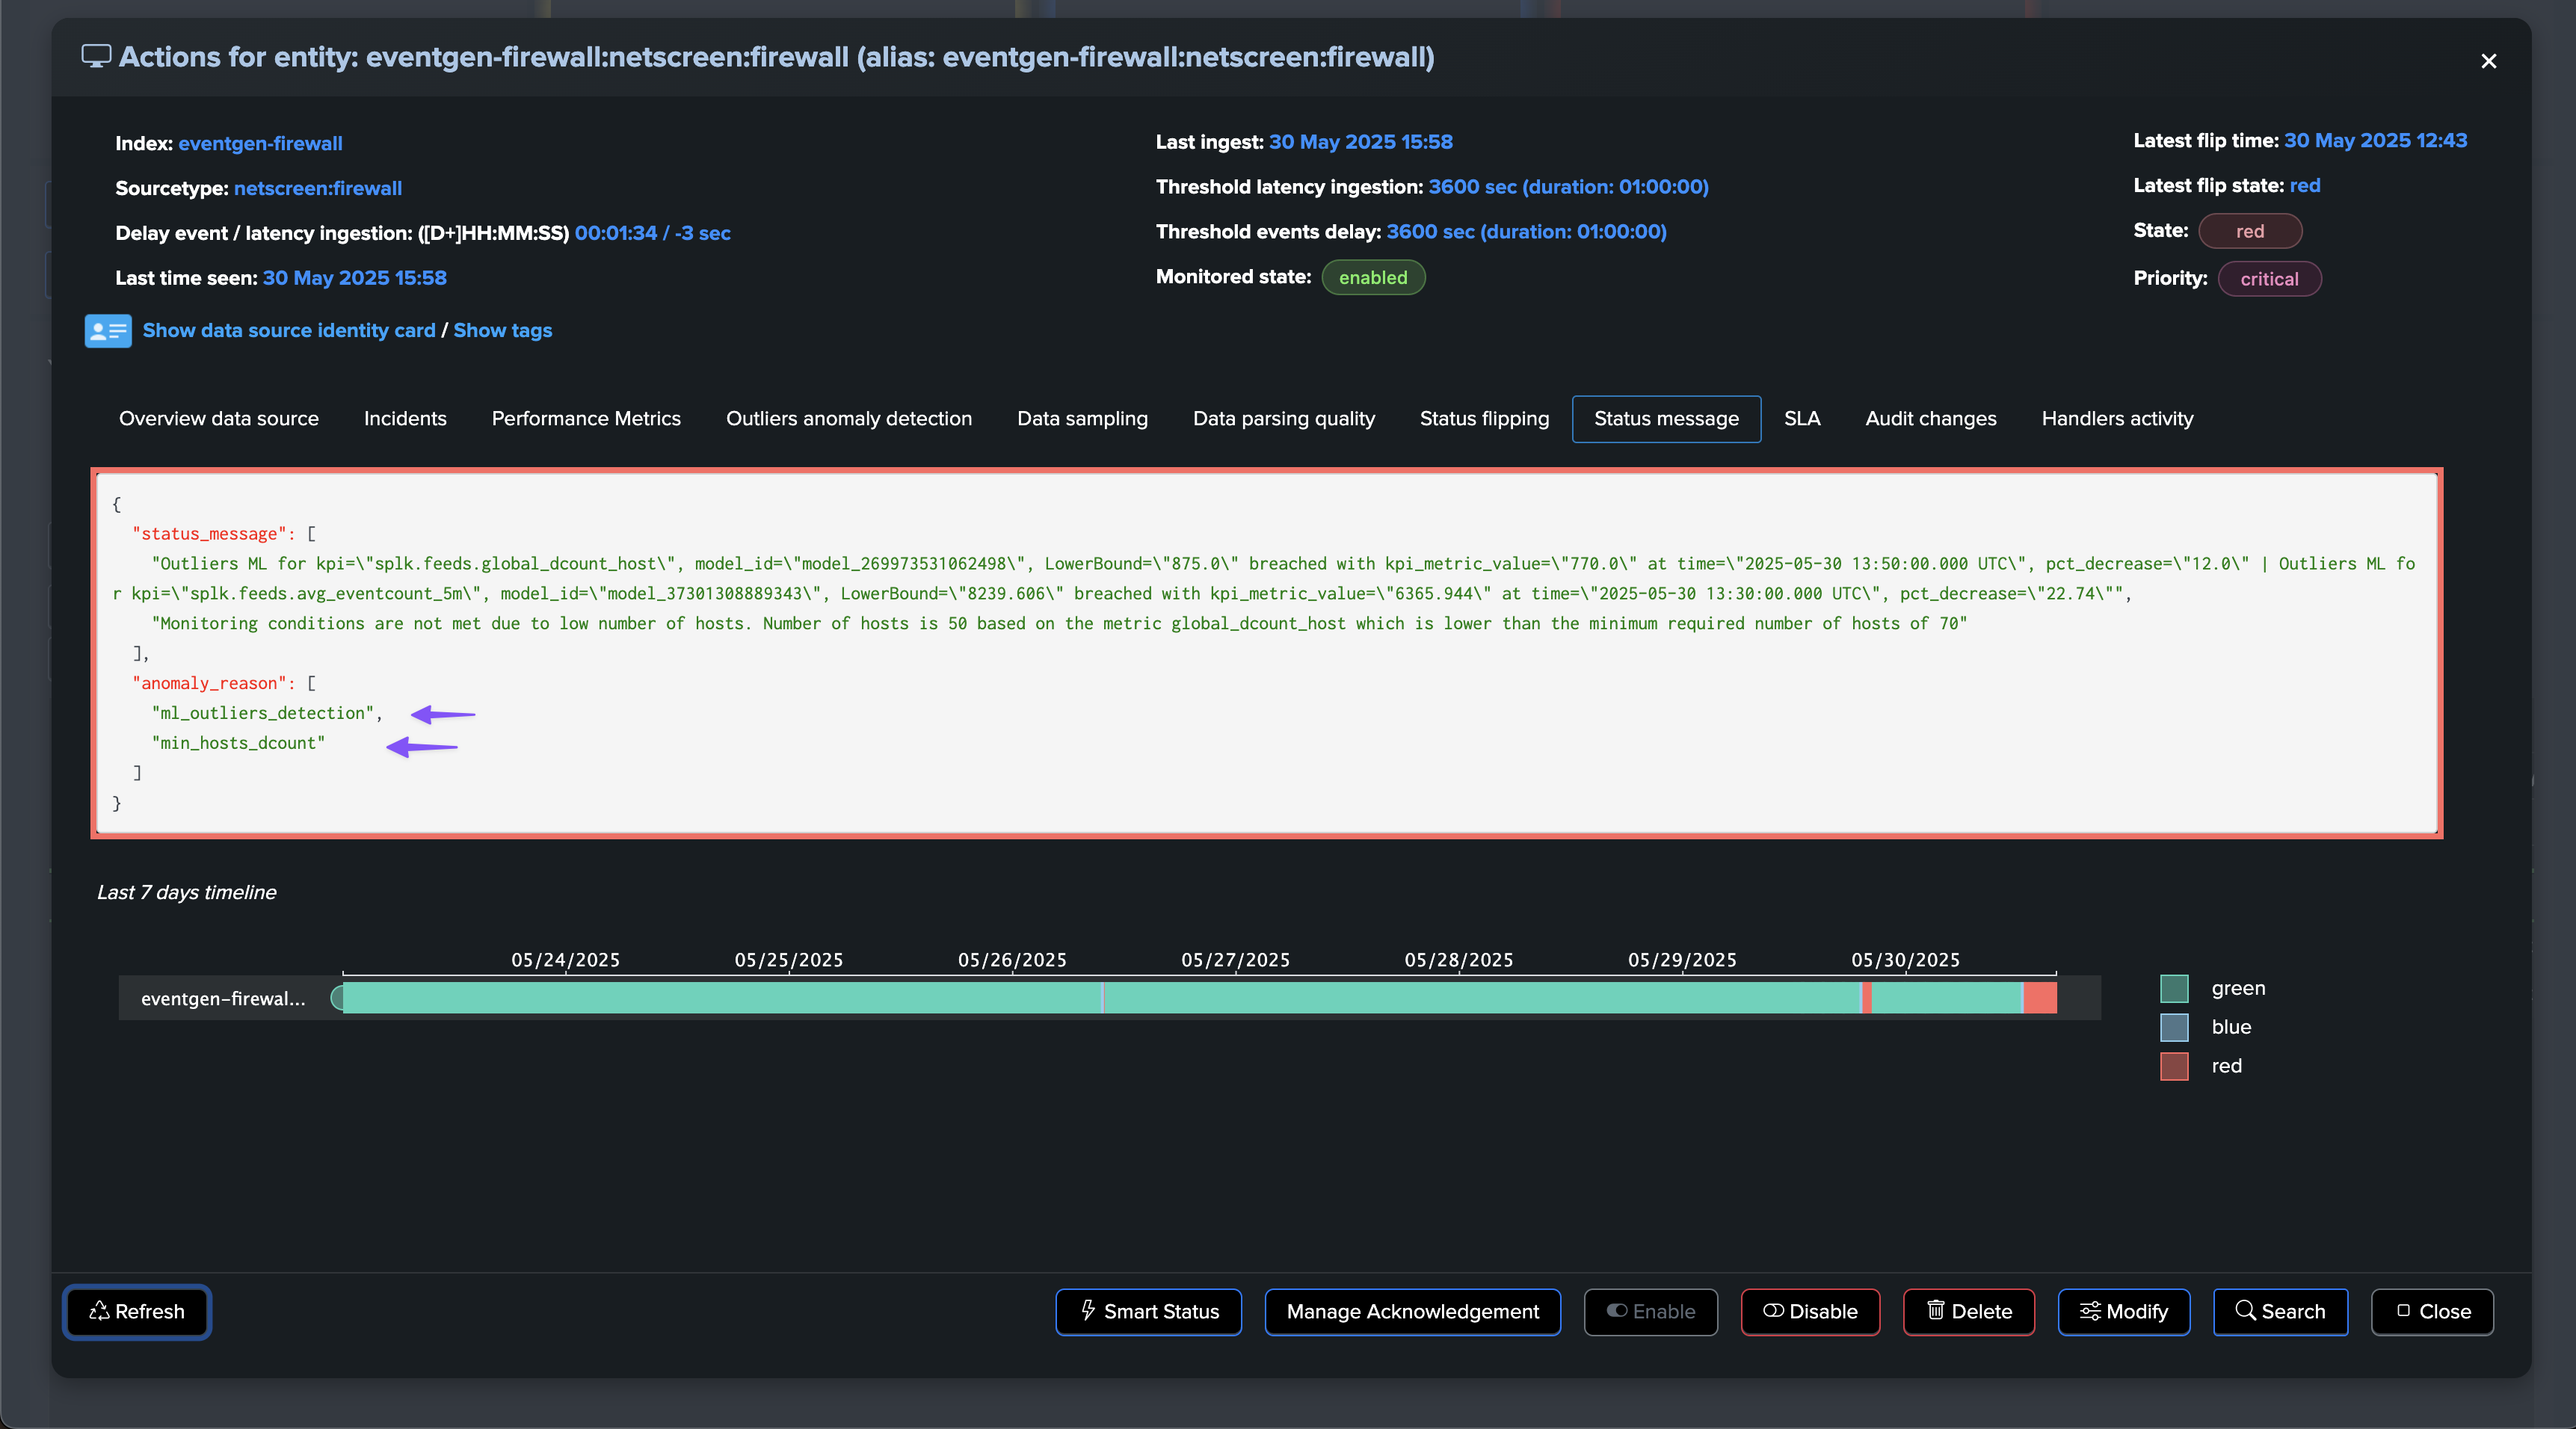
A decrease in the number of distinct hosts often correlates with a decrease in event volume. In such cases, TrackMe’s Machine Learning Outliers detection may trigger alerts for both volume-based and distinct hosts models simultaneously, providing multiple indicators of the same underlying issue.
For the purposes of this demo, we have set both the static threshold and Machine Learning Outliers detection. After some time, both detection methods trigger:
As usual, once the issue is resolved, the entity returns to green after the Outliers anomaly condition is resolved and TrackMe has processed the ML rendering for this entity: