Troubleshooting TrackMe
REST API Endpoints Logging
All TrackMe REST API handlers log events to a unique log file which is automatically indexed in Splunk, available through:
index=_internal sourcetype=trackme:rest_api
Ingest time parsing is carefully handled, so even large events wouldn’t suffer from truncation.
You can rely on the logging level to review specific classes of events:
Review errors:
index=_internal sourcetype=trackme:rest_api log_level=ERROR
Custom Commands Logging
Each custom command backend available in TrackMe logs events to a dedicated log file, which itself ties to a specific sourcetype.
You can review all custom command logs from the following convention:
index=_internal sourcetype=trackme:custom_commands:*
Similarly, you can review any errors such as:
index=_internal sourcetype=trackme:custom_commands:* log_level=ERROR
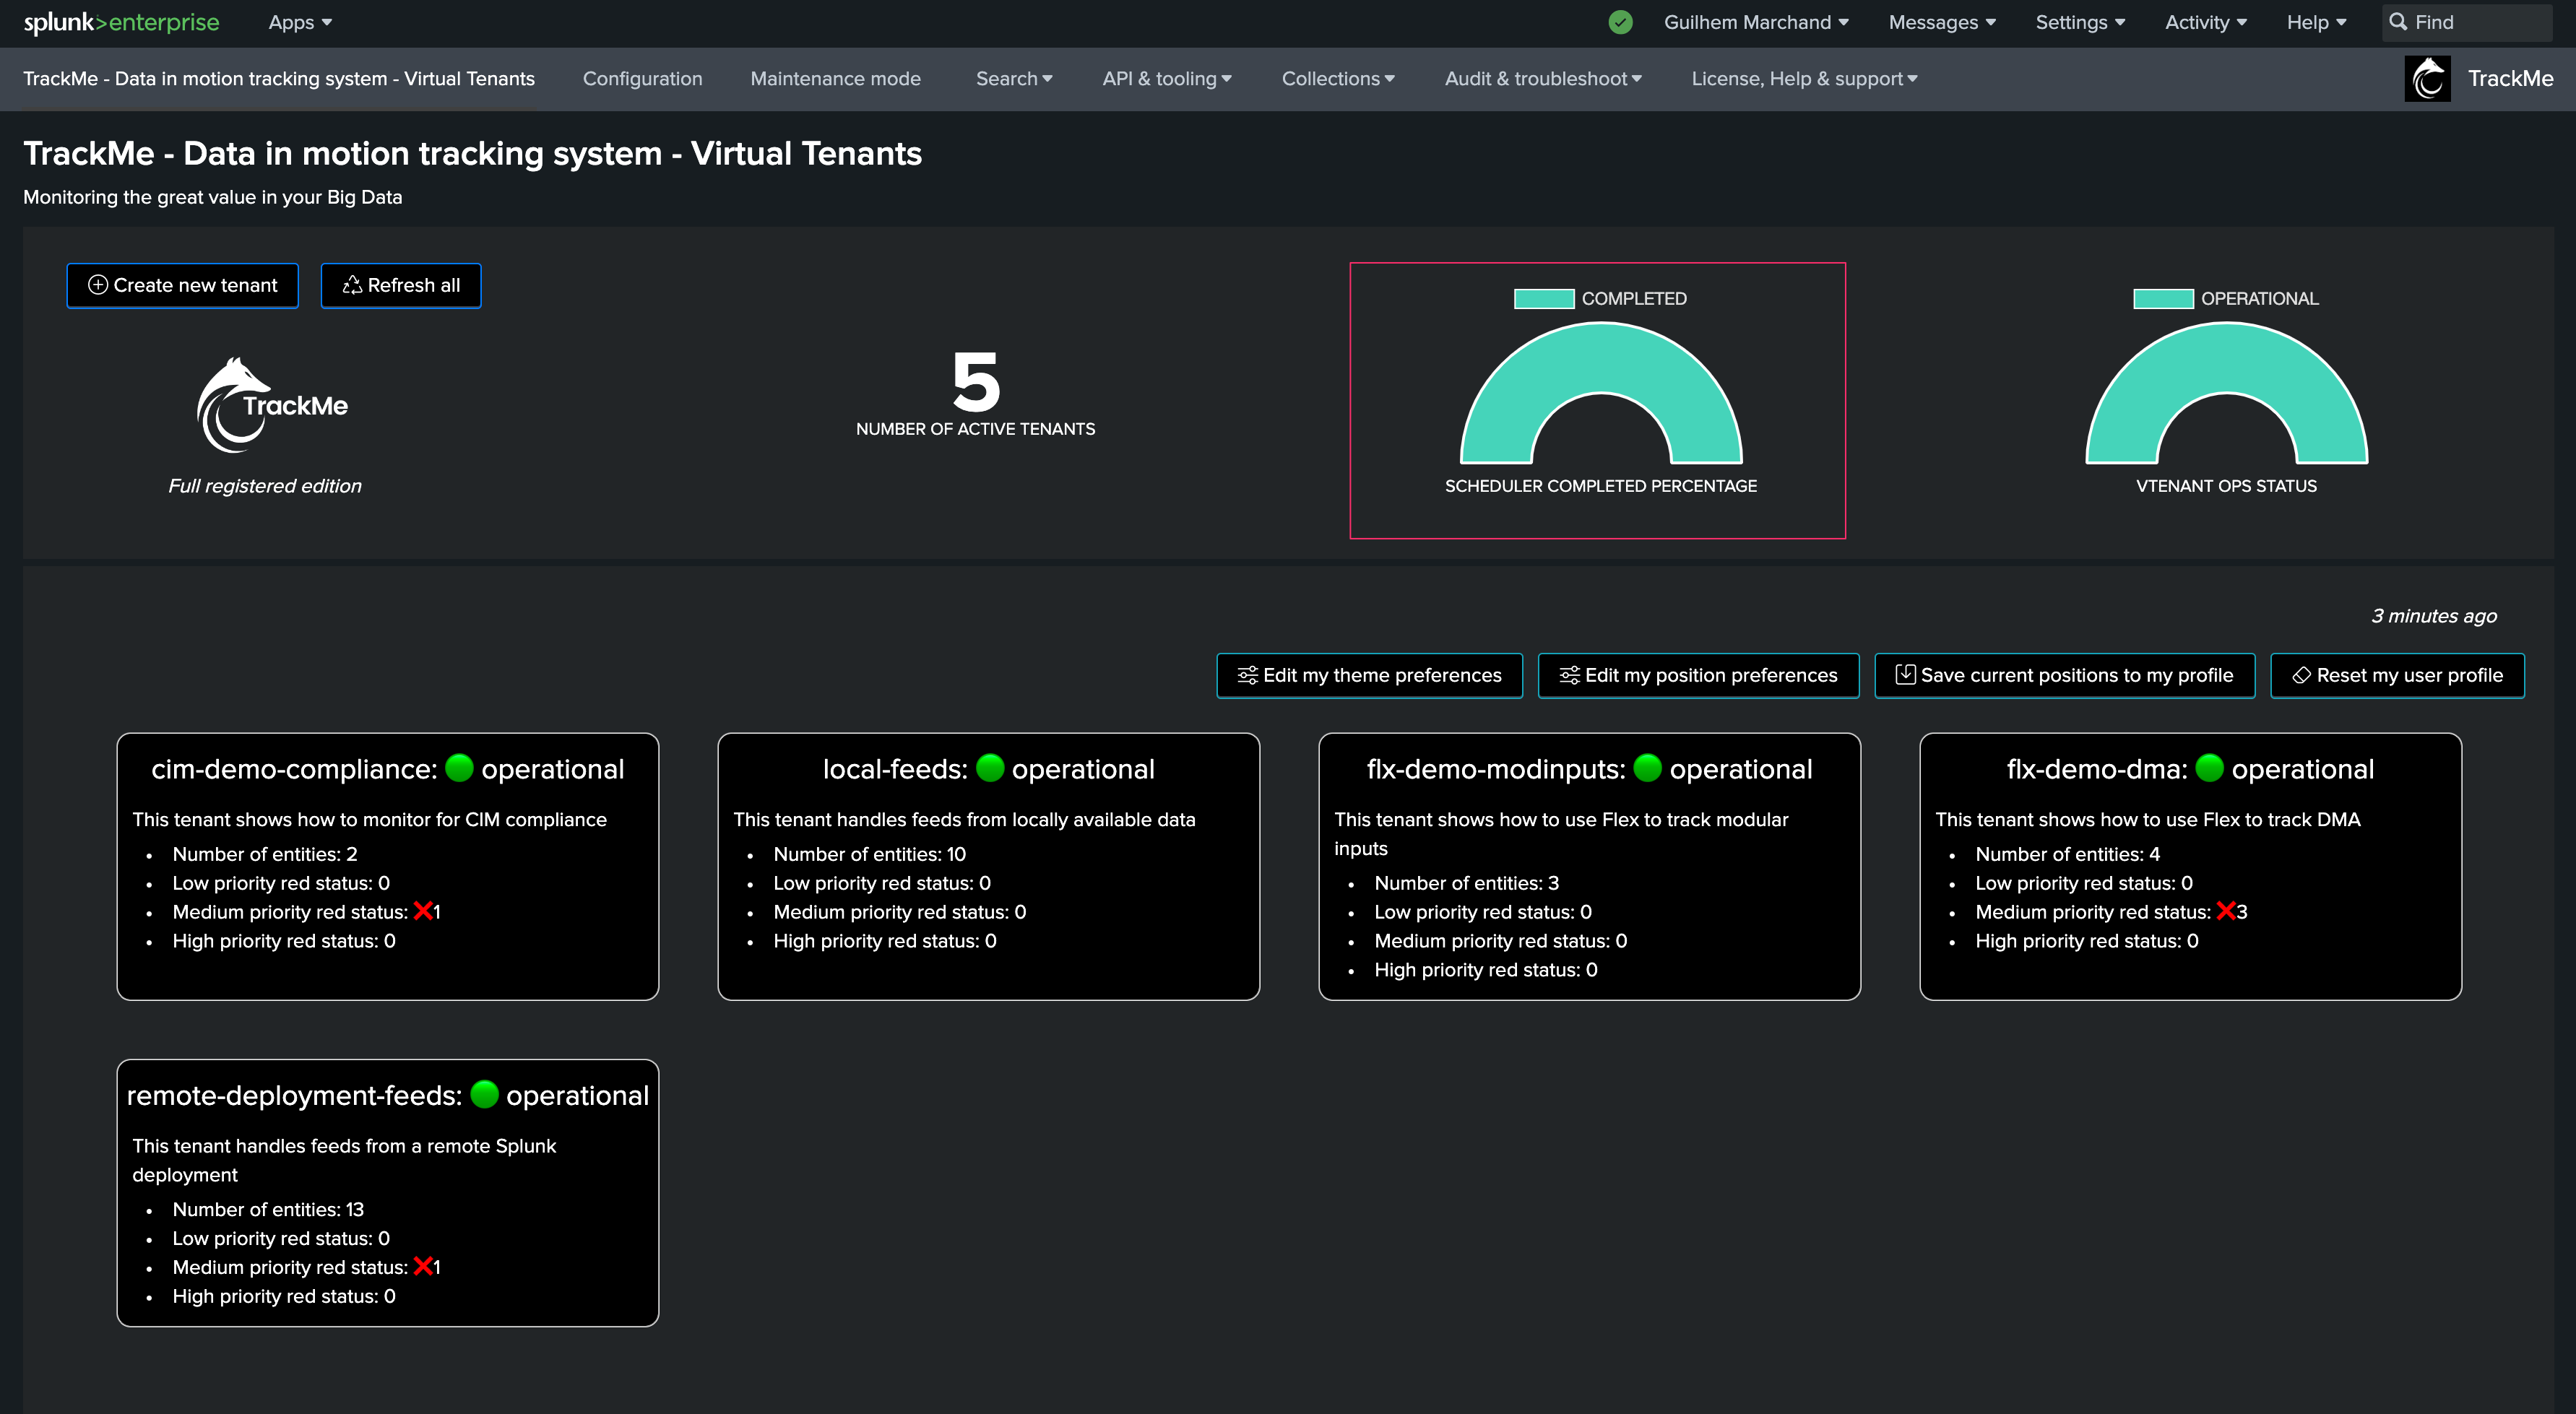
The navigation bar provides pre-classified shortcuts per TrackMe component:
Alert Actions Logging
TrackMe provides multiple alert actions, such as the Notable alert action. Each alert action logs events to its dedicated log file.
You can review all modular alert actions logs from the following convention:
index=_internal sourcetype=modular_alerts:trackme_*
TrackMe Health Events
TrackMe produces and indexes health events for the purpose of tracking its tracker healthy status. You can review these events via the sourcetype trackme:health:
Assuming your TrackMe audit index(es) all start with trackme_audit*:
index=trackme_audit* sourcetype=trackme:state
Health events are indexed events generated from the live statuses from the following REST endpoint:
| trackme mode=post url=/services/trackme/v2/configuration/get_tenant_ops_status body="{'mode': 'raw'}" | trackmeopsstatusexpand
TrackMe Health Tracker
TrackMe has an important tracker that is automatically created on a per Virtual Tenant basis. Notably, this tracker is responsible for triggering upgrade procedures as needed, called schema upgrade.
Hint
TrackMe 2.1.0 improvements:
Since TrackMe 2.1.0, the logging format was massively improved regarding this very specific component, so you can track easily the execution of every single task, its run time and so forth.
Access the logs:
index=_internal sourcetype=trackme:custom_commands:trackmetrackerhealth task="schema_upgrade"
You can track the run time of every task handled by the Health tracker using the following search example:
index=_internal sourcetype=trackme:custom_commands:trackmetrackerhealth instance_id=* task_instance_id=* task=* run_time=* tenant_id=*
| table _time tenant_id instance_id task task_instance_id run_time _raw
| sort 0 - _time
Audit Dashboards
Several dashboards are provided for the purposes of troubleshooting and auditing TrackMe features and behaviors:
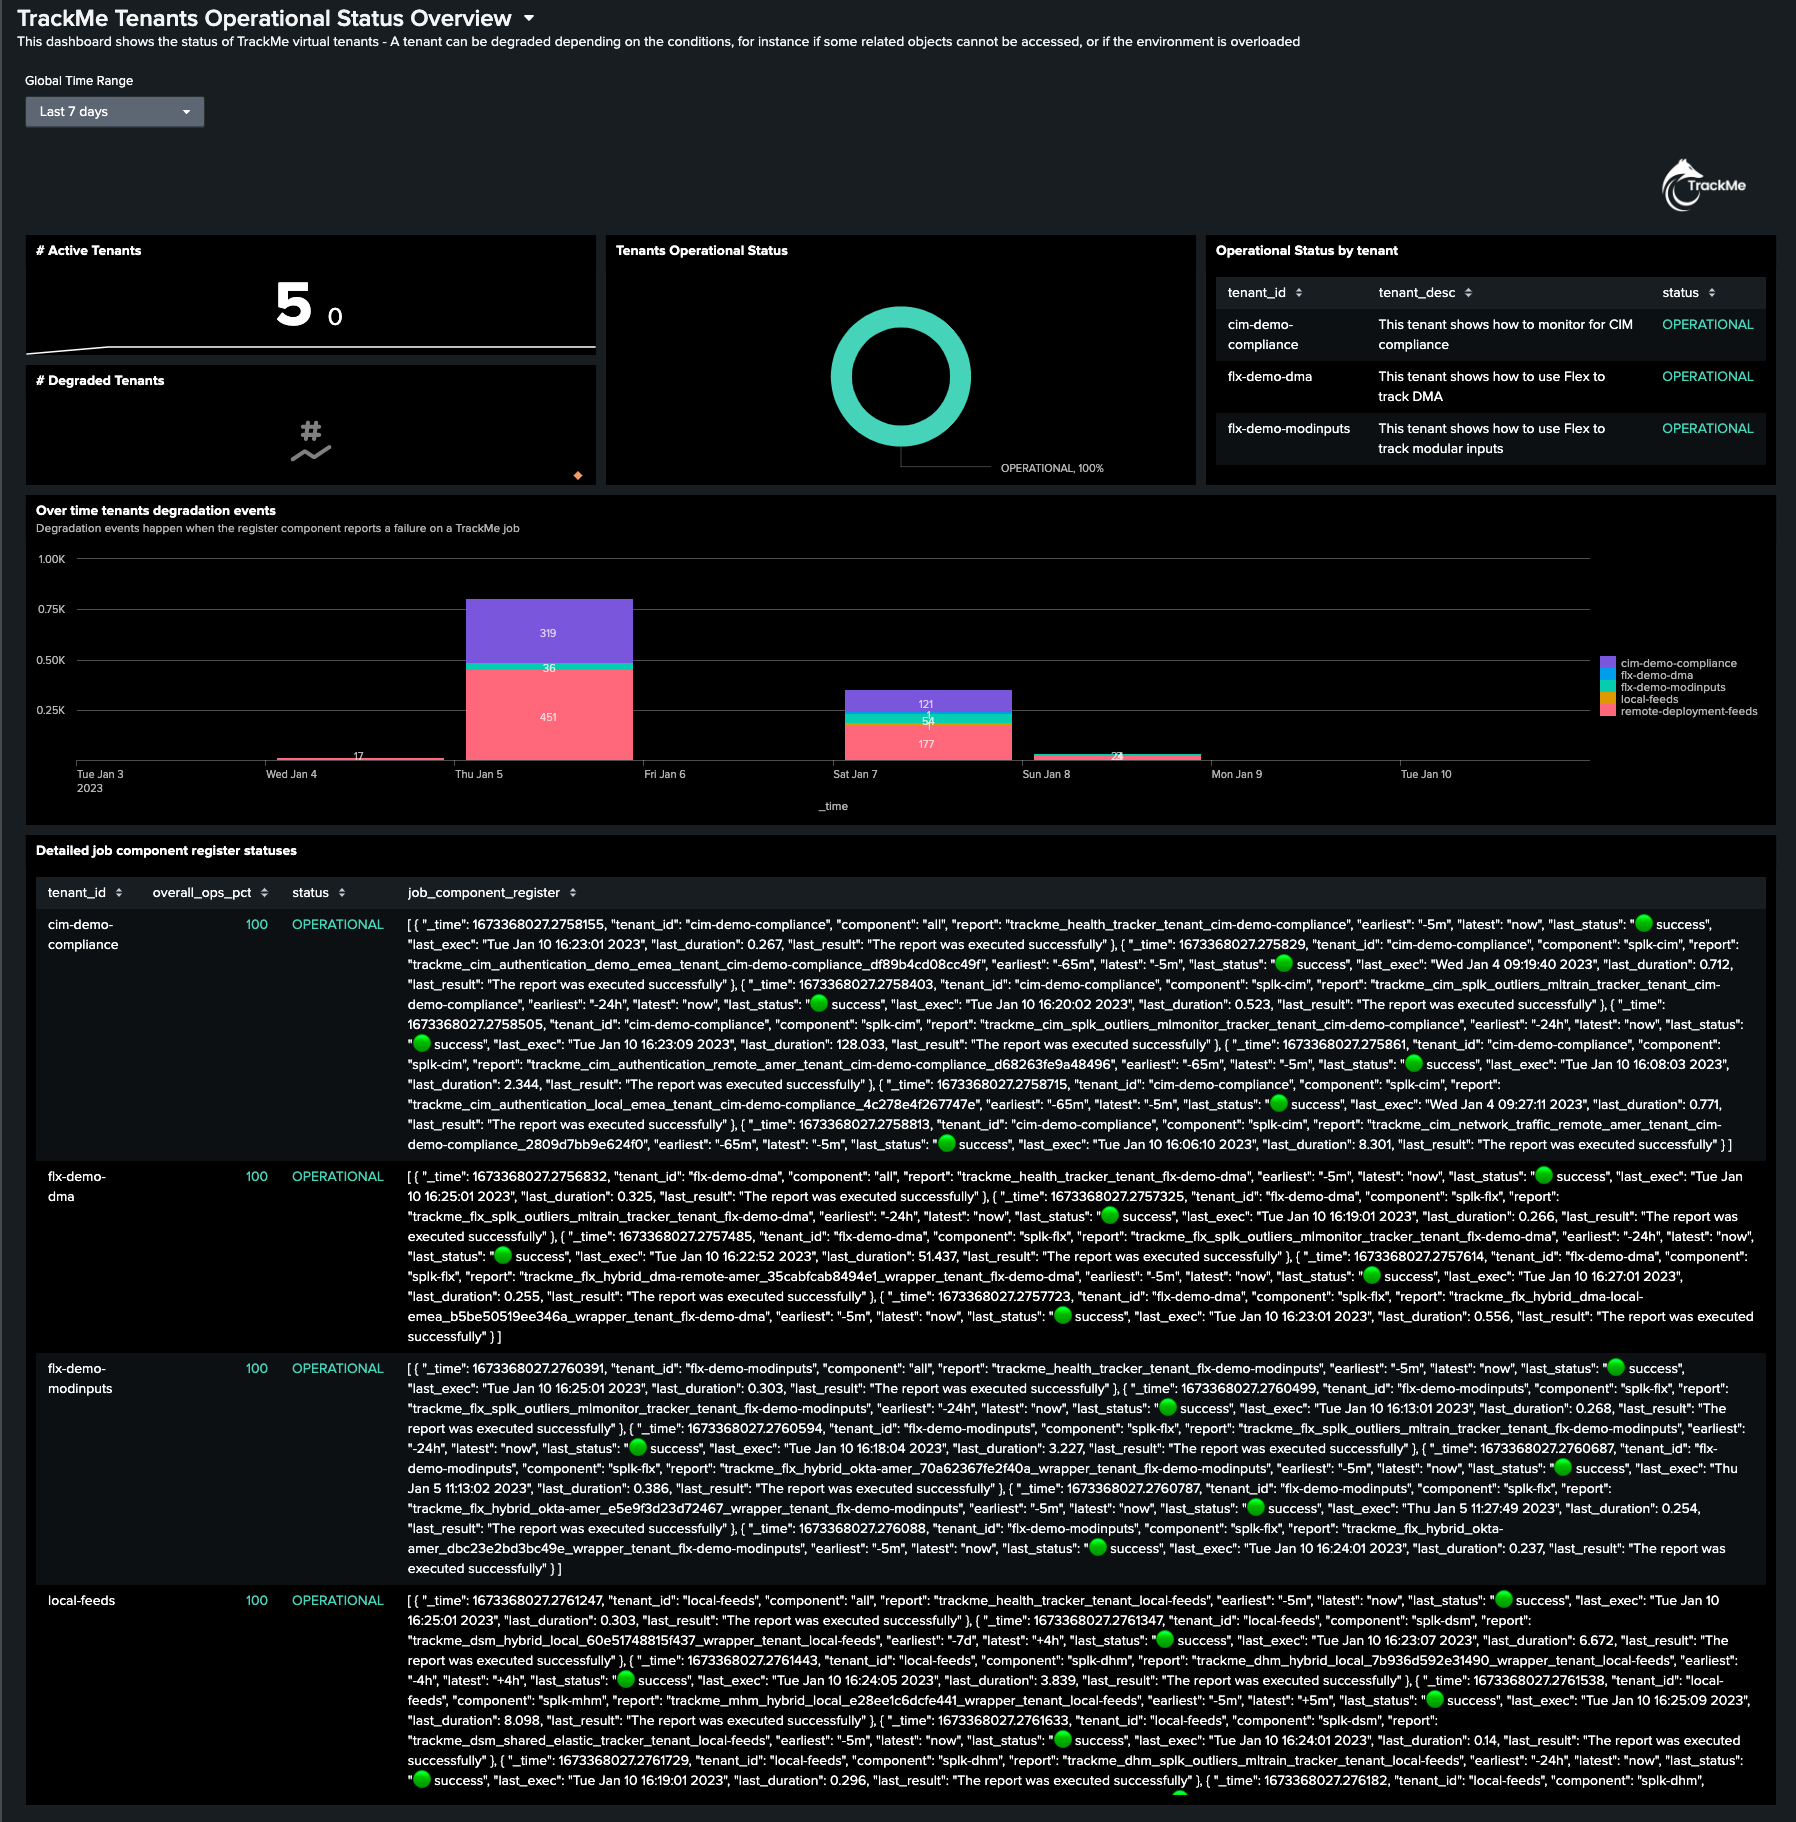
Audit - Operational Statuses
This dashboard provides a summary review of the Virtual Tenants operation statuses, which relies on the components register and the Health events:
Audit - Trackers Performance Deep Dive
This dashboard provides a comprehensive review of the Trackers run time performance. This Key Performance Indicator is generated and logged when a tracker is executed:
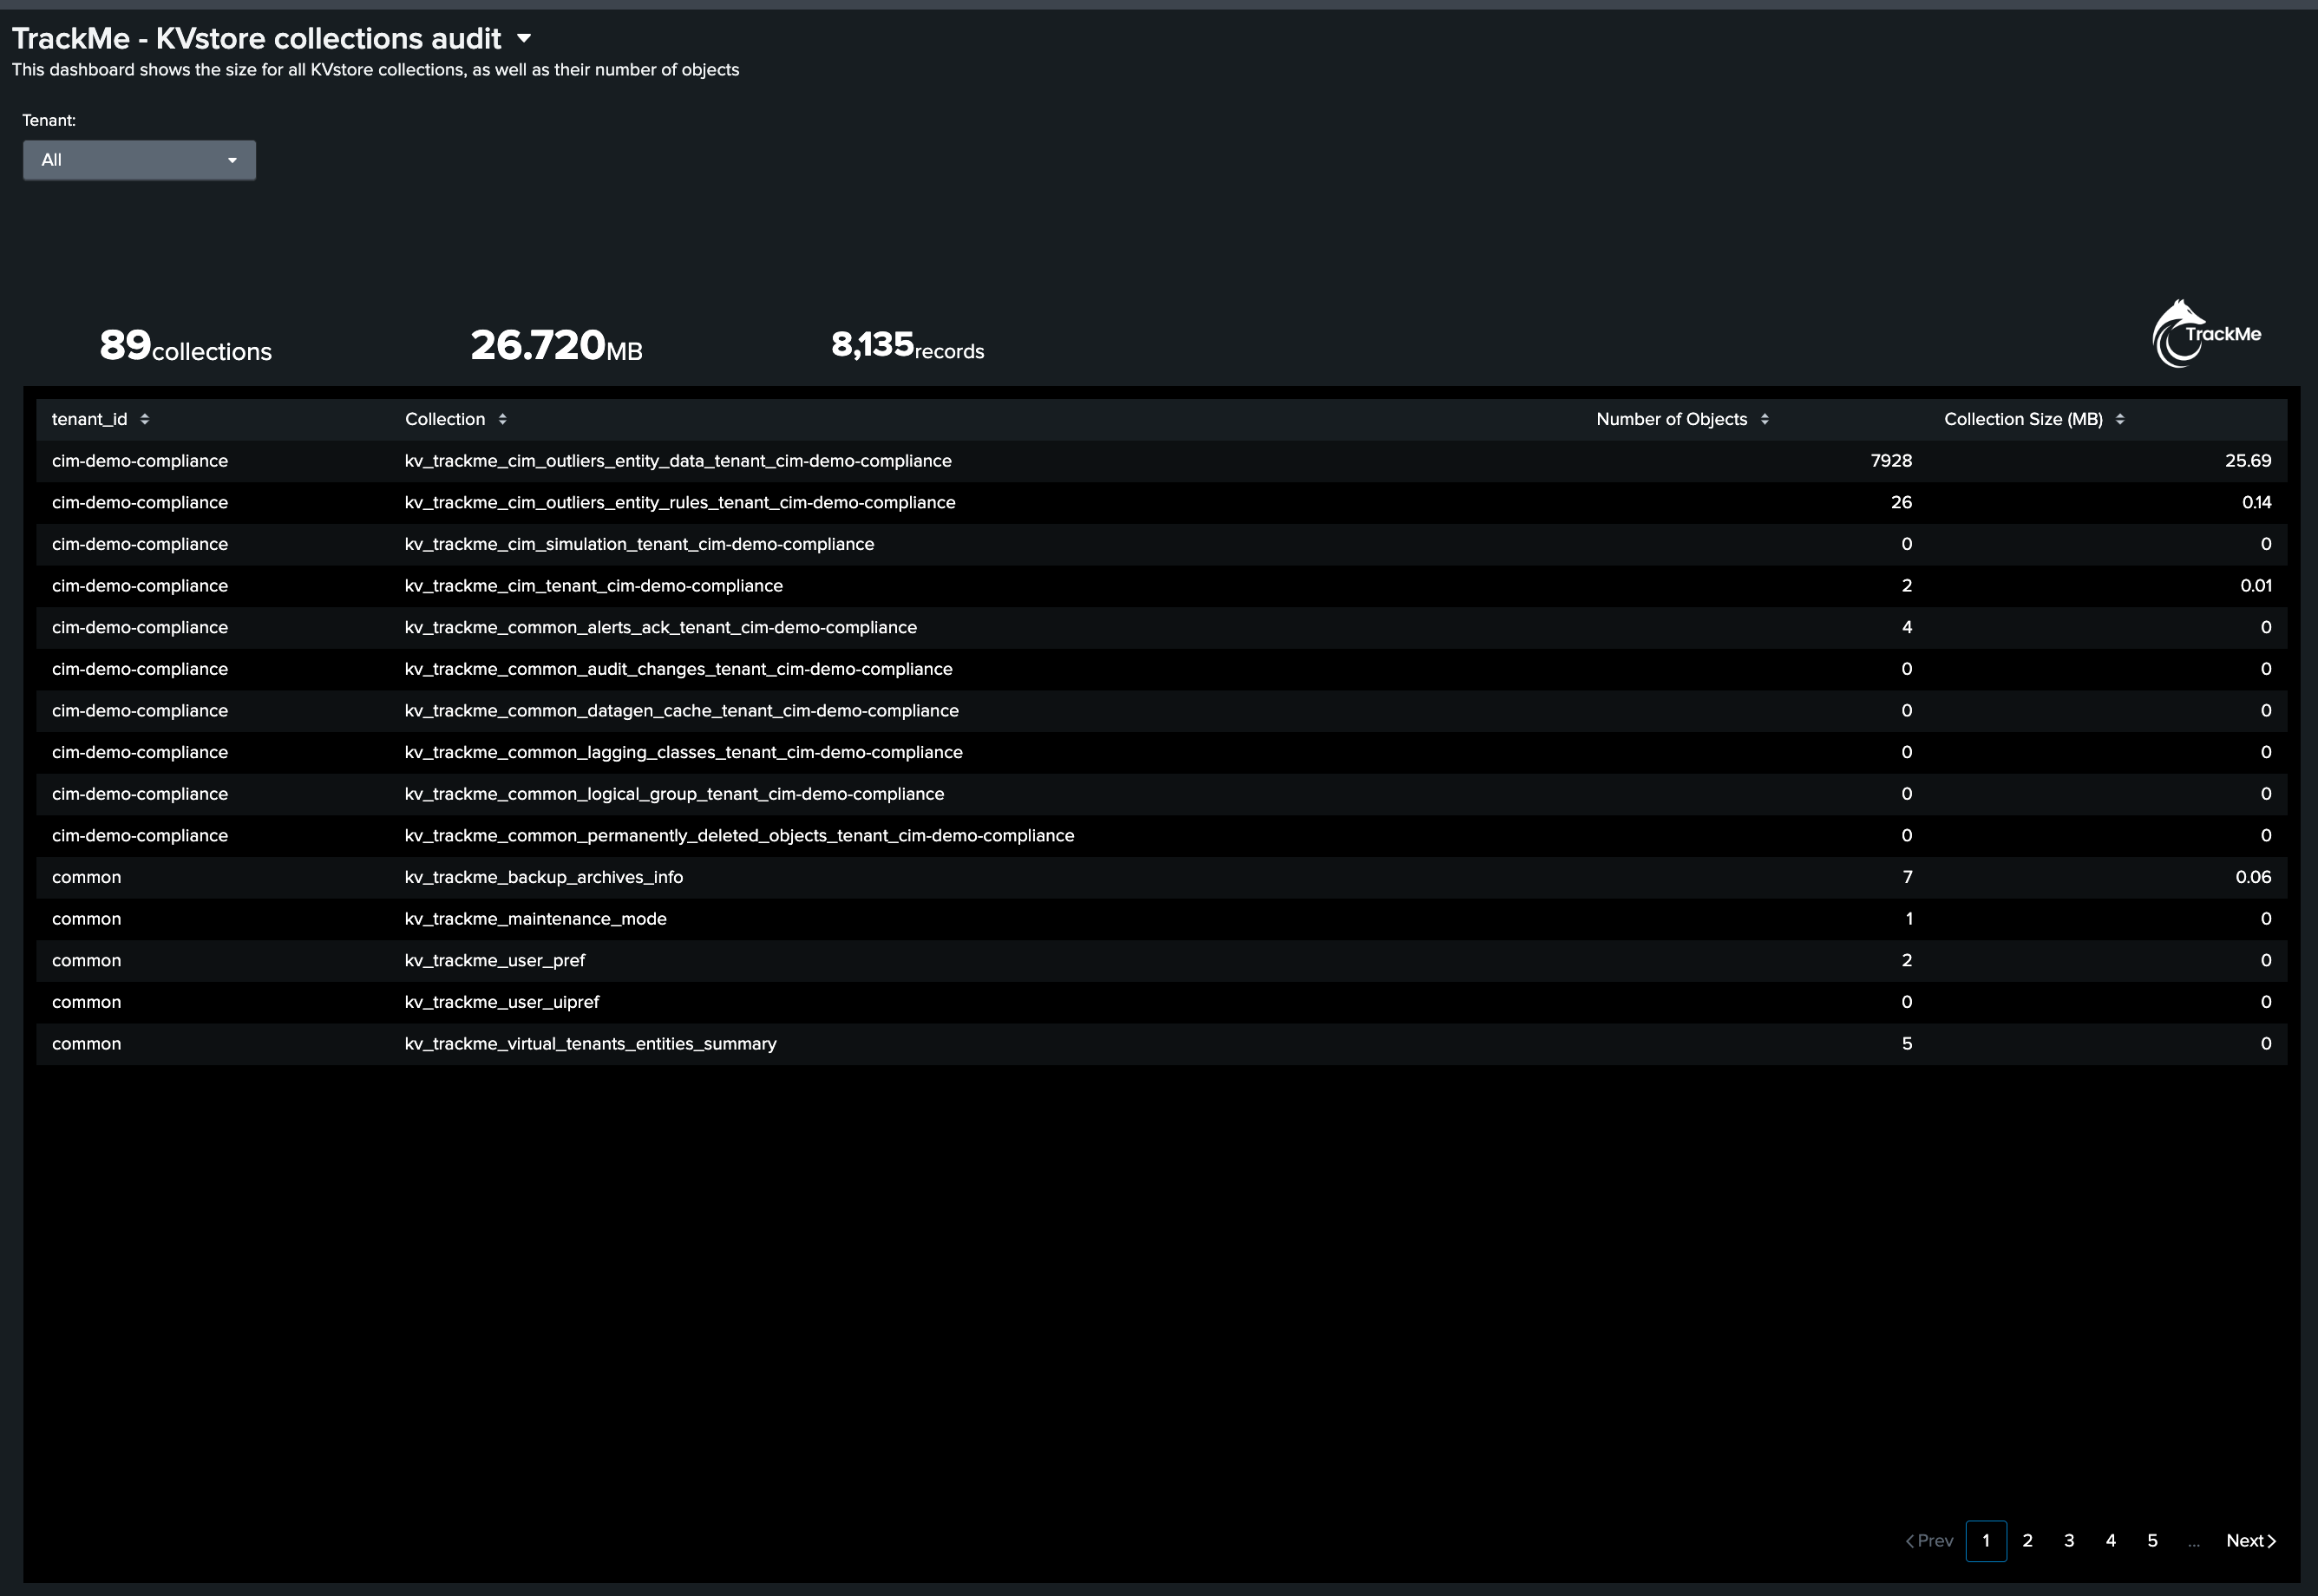
Audit - KVstore Collections
This dashboard provides a summary overview of the KVstore collections classified per tenant. This allows you to review the global size of the KVstore collections as well as the details per KVstore:
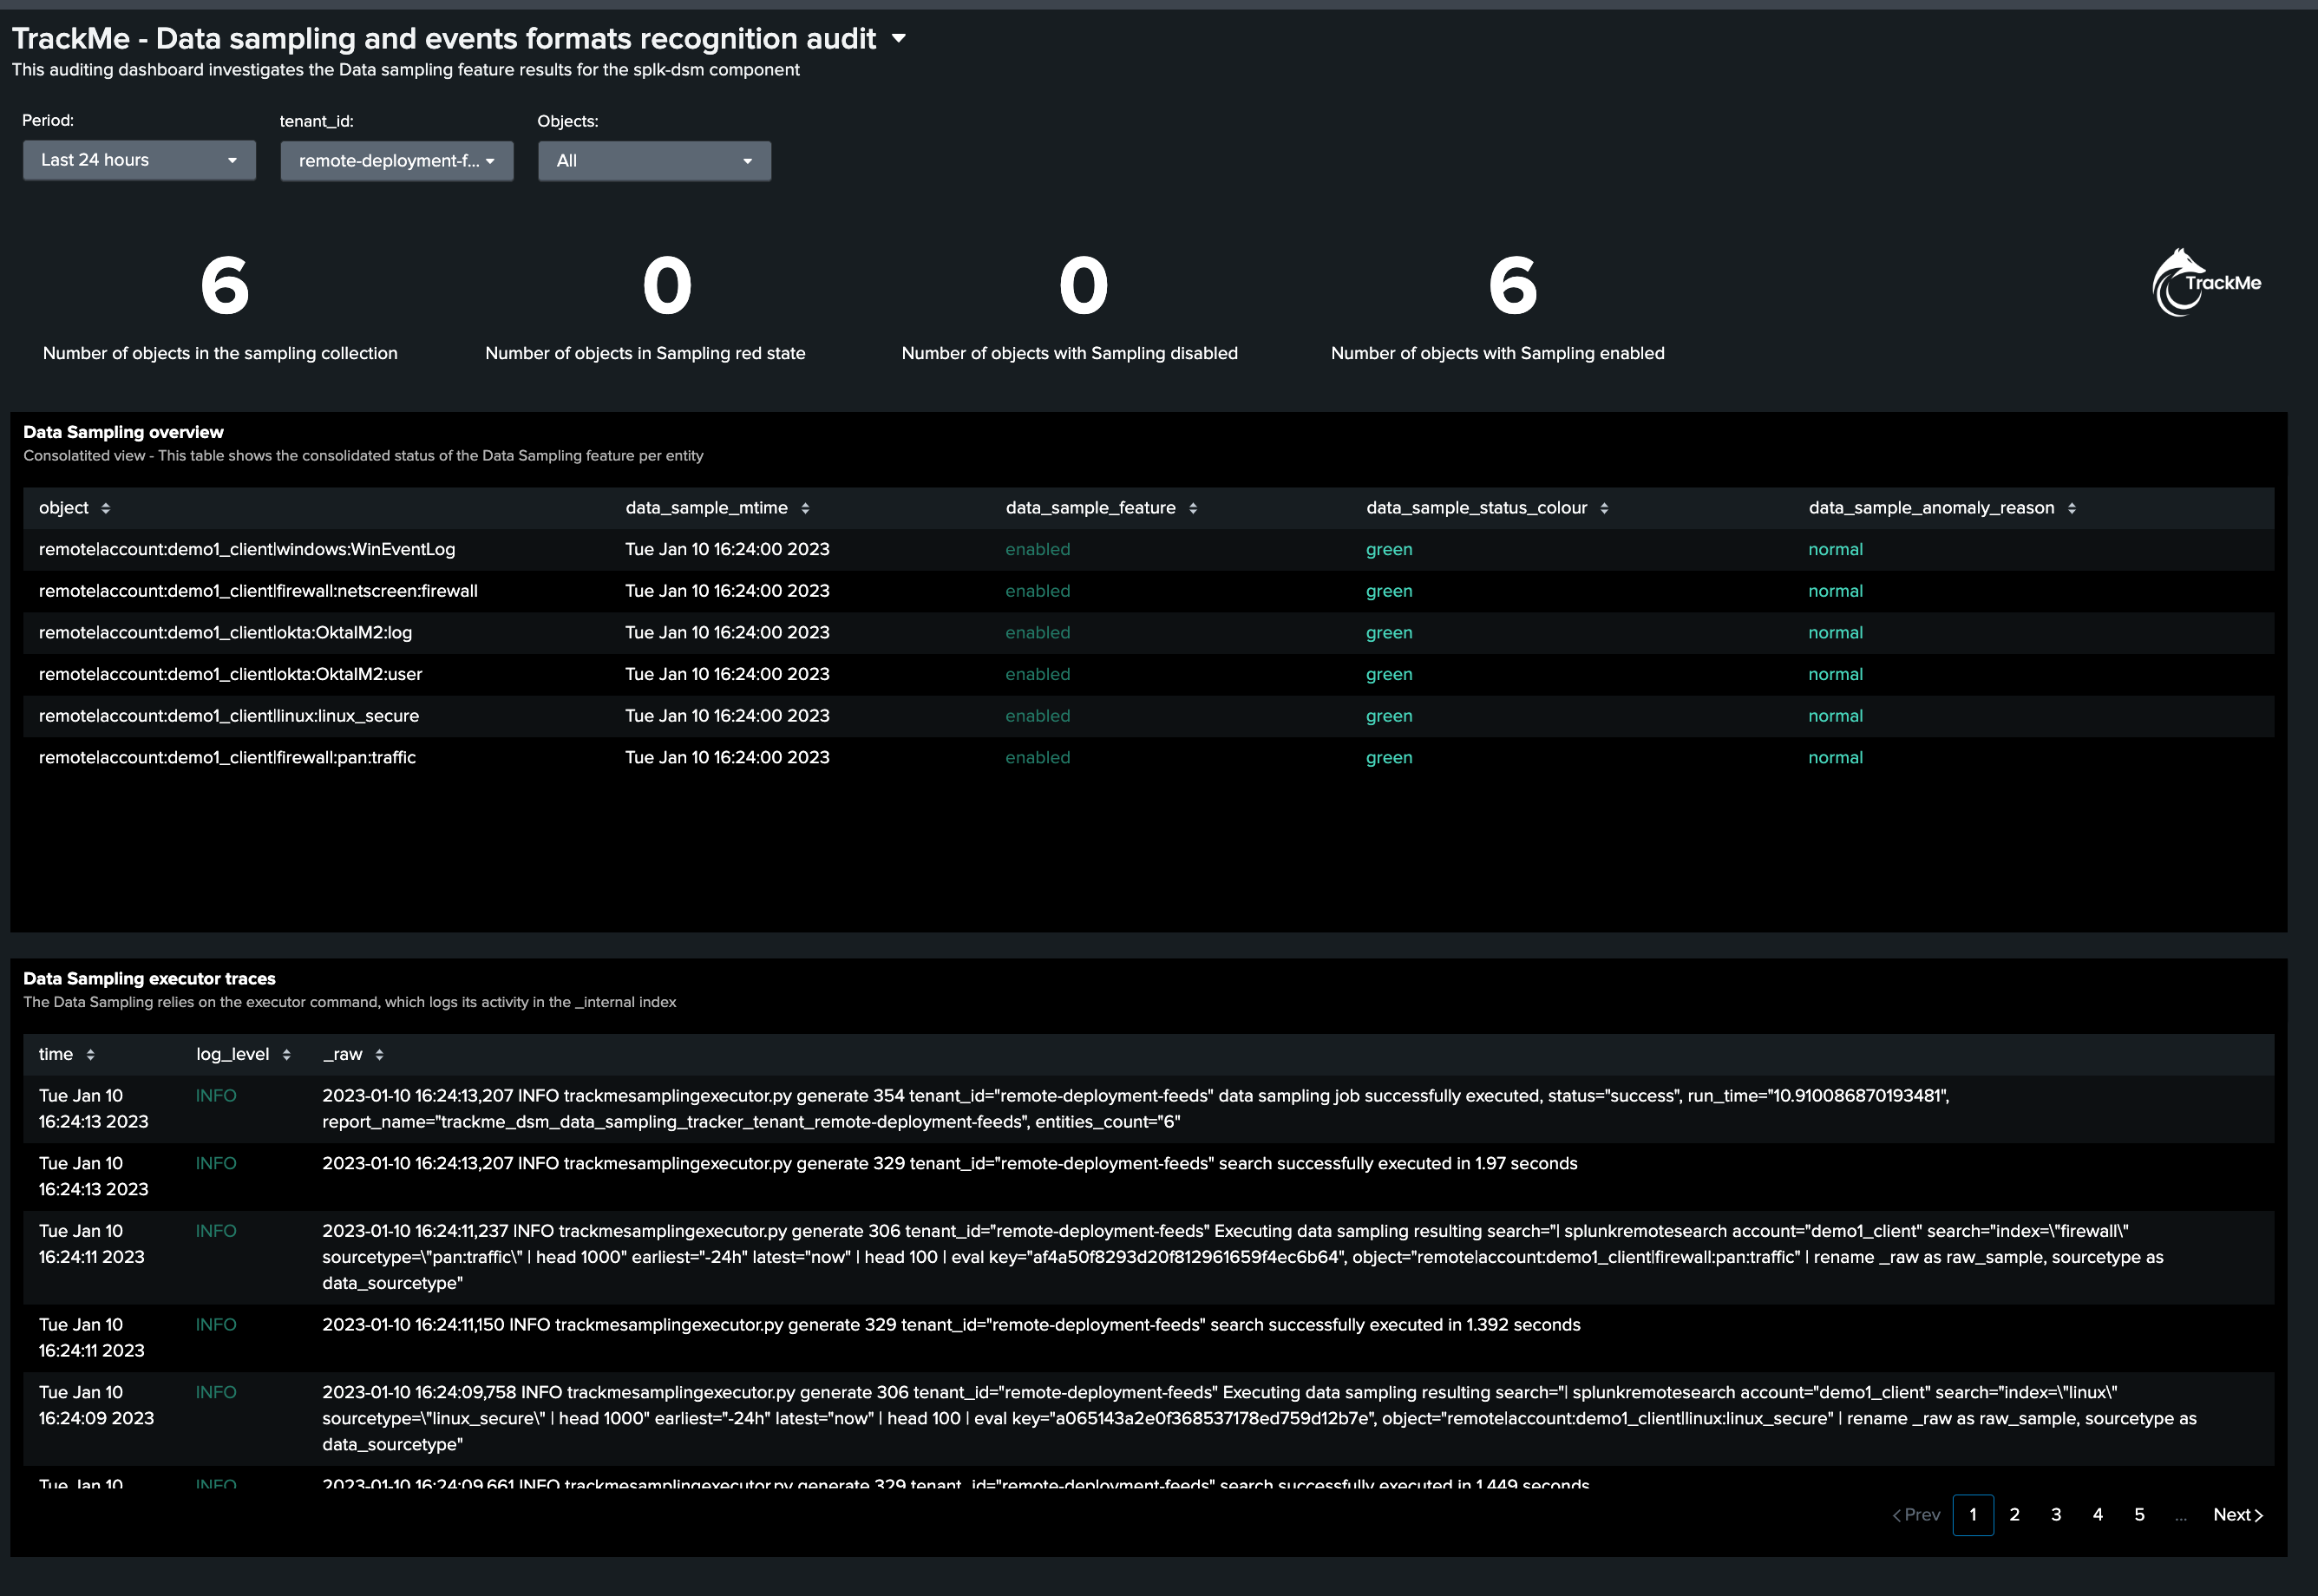
Audit - Data Sampling
This dashboard is investigating the status of the Data sampling feature for the splk-dsm component (part of splk-feeds):
