Tracking Splunk Cloud SVC consumption in TrackMe
Monitoring the Splunk Cloud SVC consumption using TrackMe
This white paper aims at providing a detailed guide on how to monitor the Splunk Cloud SVC consumption using TrackMe.
The Splunk Cloud SVC consumption is a key metric to monitor in order to ensure the Splunk Cloud service is used efficiently and effectively.
Introduction about Splunk Cloud SVC
Whenever you are a Cloud customer paying by the volume, or by the capacity allocated to your environment (stack), SVC consumption is the key indicator in Splunk Cloud which allows you to understand the costs associated with anything that consumes computes in Splunk:
Essentially:
Indexing related activities
Users’ ad-hoc searches
Users and applications scheduled searches
DataModel acceleration (DMA)
In TrackMe, you can leverage this key performance indicator to monitor the consumption of your Splunk Cloud environment, and detect abnormal trends.
To do so, we can leverage two components in TrackMe:
TrackMe Flex Objects trackers, which can monitor SVC consumptions based on different patterns, and notably leverage Machine Learning to detect abnormal trends.
TrackMe Workload, which can monitor the consumption of SVC at the levels of scheduled searches.
Splunk generates SVC consumption metrics in the summary index:
Global SVC consumption:
index=summary source=splunk-svc
Detailed SVC consumption per consumer:
index=summary source=splunk-svc-consumer
TrackMe leverages these indicators and stores these as metrics into the TrackMe metric indexes, and can leverage basic logics or more advanced logics using Machine Learning Outliers detection.
TrackMe Flex trackers for Splunk Cloud SVC consumption
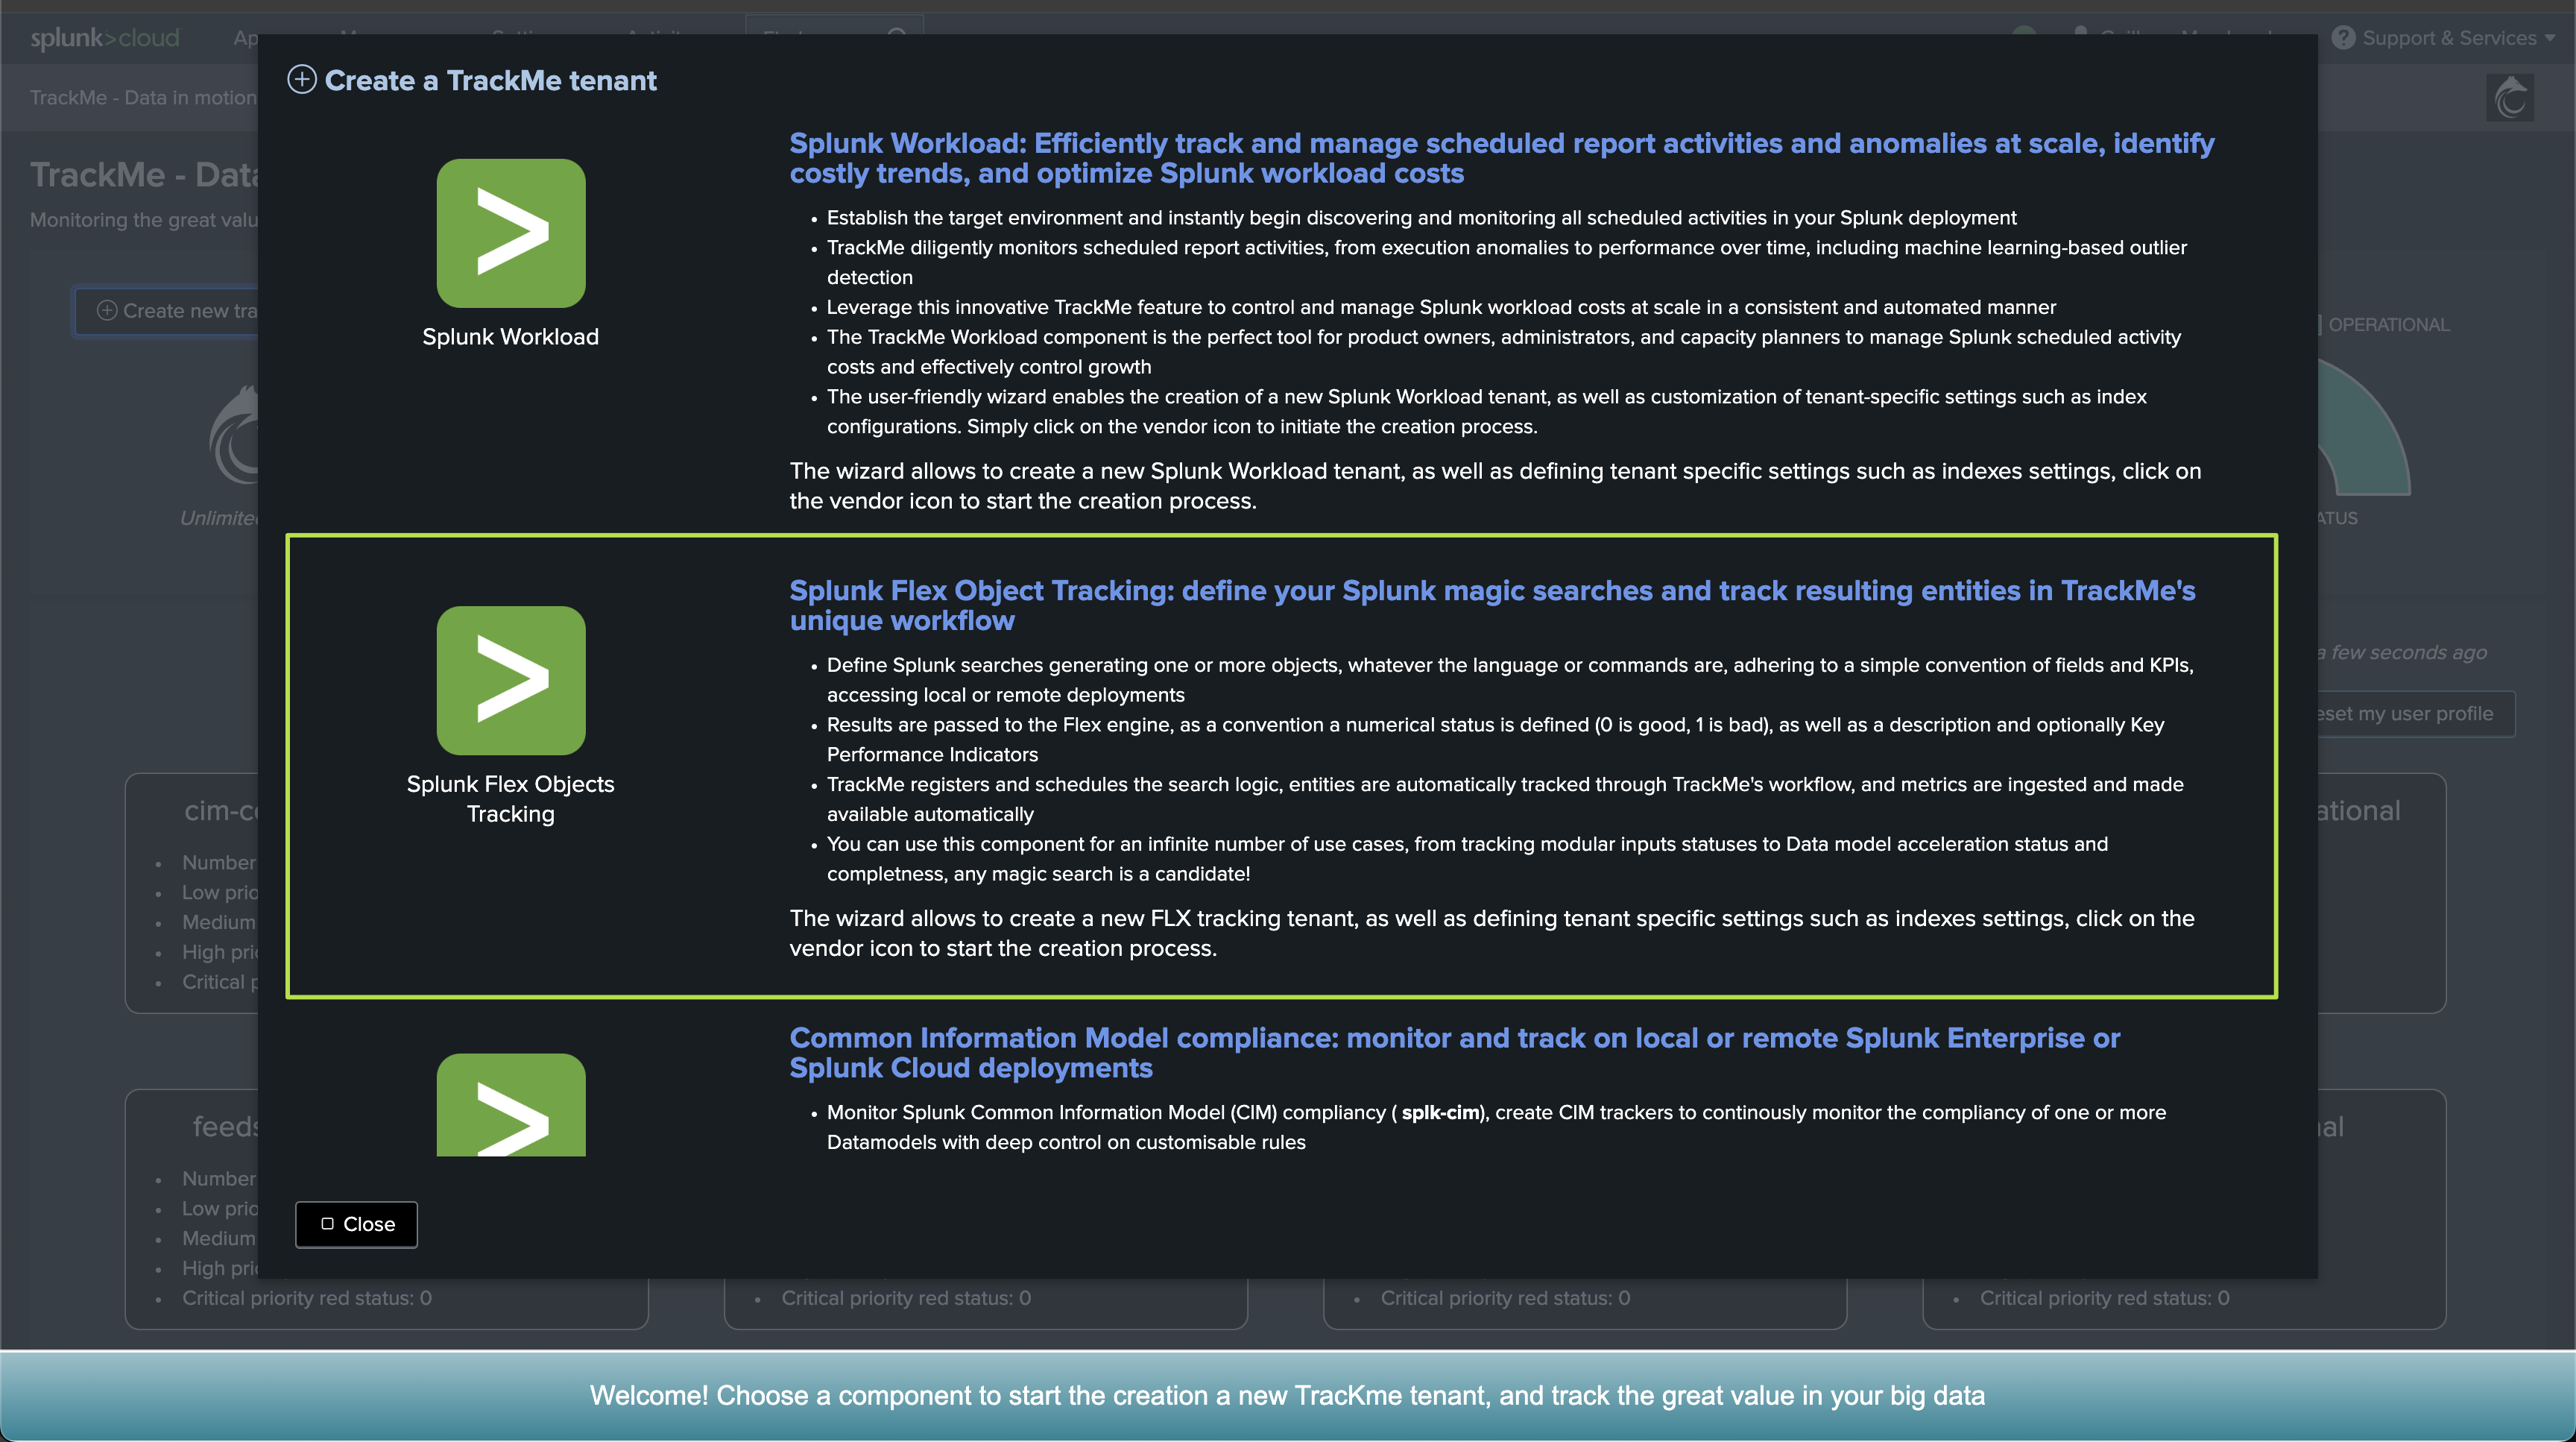
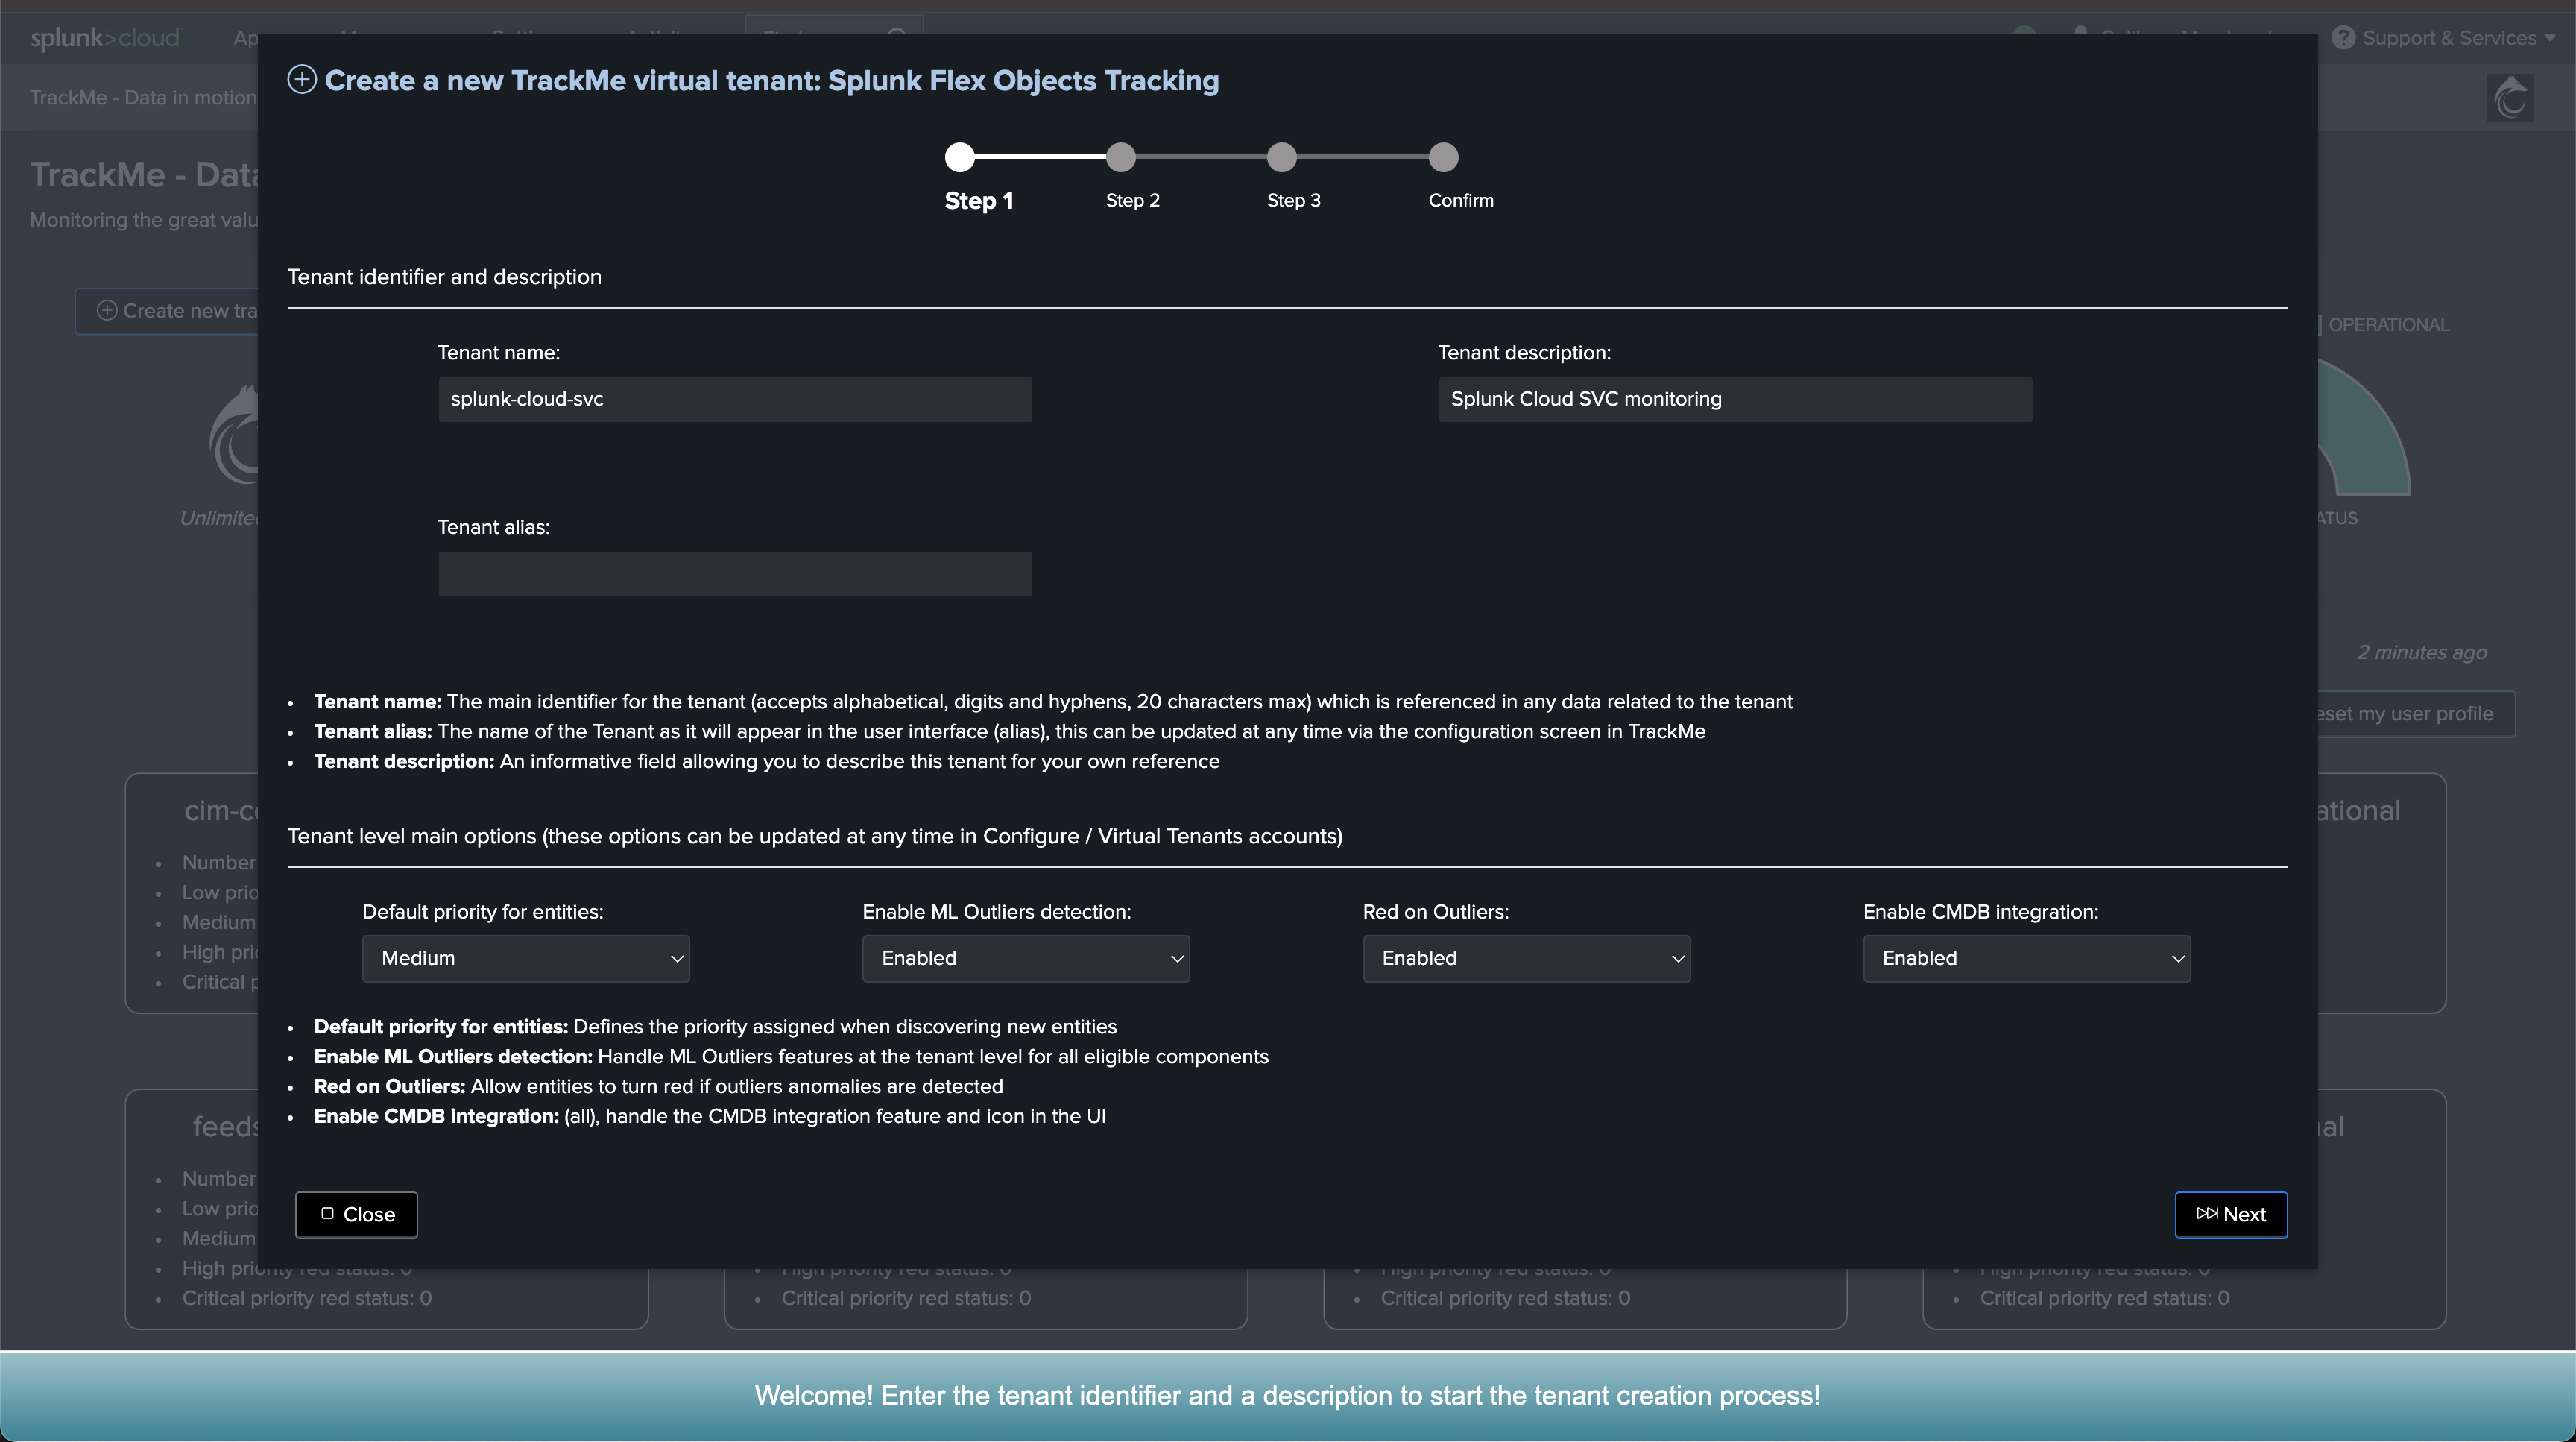
We will start by creating a dedicated Virtual Tenant for the purposes of tracking Splunk Cloud SVC consumption, we can use the UI and create a new Flex Object enabled tenant:
Or we can use the trackme custom command:
| trackme url="/services/trackme/v2/vtenants/admin/add_tenant" mode="post" body="{'tenant_alias':'splunk-cloud-svc','tenant_desc':'Splunk Cloud SVC monitoring','tenant_name':'splunk-cloud-svc','tenant_roles_admin':['trackme_admin'],'tenant_roles_power':['trackme_power'],'tenant_roles_user':['trackme_user'],'tenant_owner':'nobody','tenant_idx_settings':'{\'trackme_summary_idx\': \'trackme_summary\', \'trackme_audit_idx\': \'trackme_audit\', \'trackme_notable_idx\': \'trackme_notable\', \'trackme_metric_idx\': \'trackme_metrics\'}','tenant_outliers_set_state':'1','tenant_mloutliers':'1','tenant_cmdb_lookup':'1','tenant_default_priority':'medium','tenant_flx_enabled':1}"
Once the Virtual Tenant is created, we can leverage the TrackMe Flex object library and rely on the two out of the box Flex Object use cases to monitoring SVC:
Hint
TrackMe version 2.0.99
These two use cases were last updated in TrackMe 2.0.99, make sure you are using this version or later.
TrackMe stack global SVC consumption
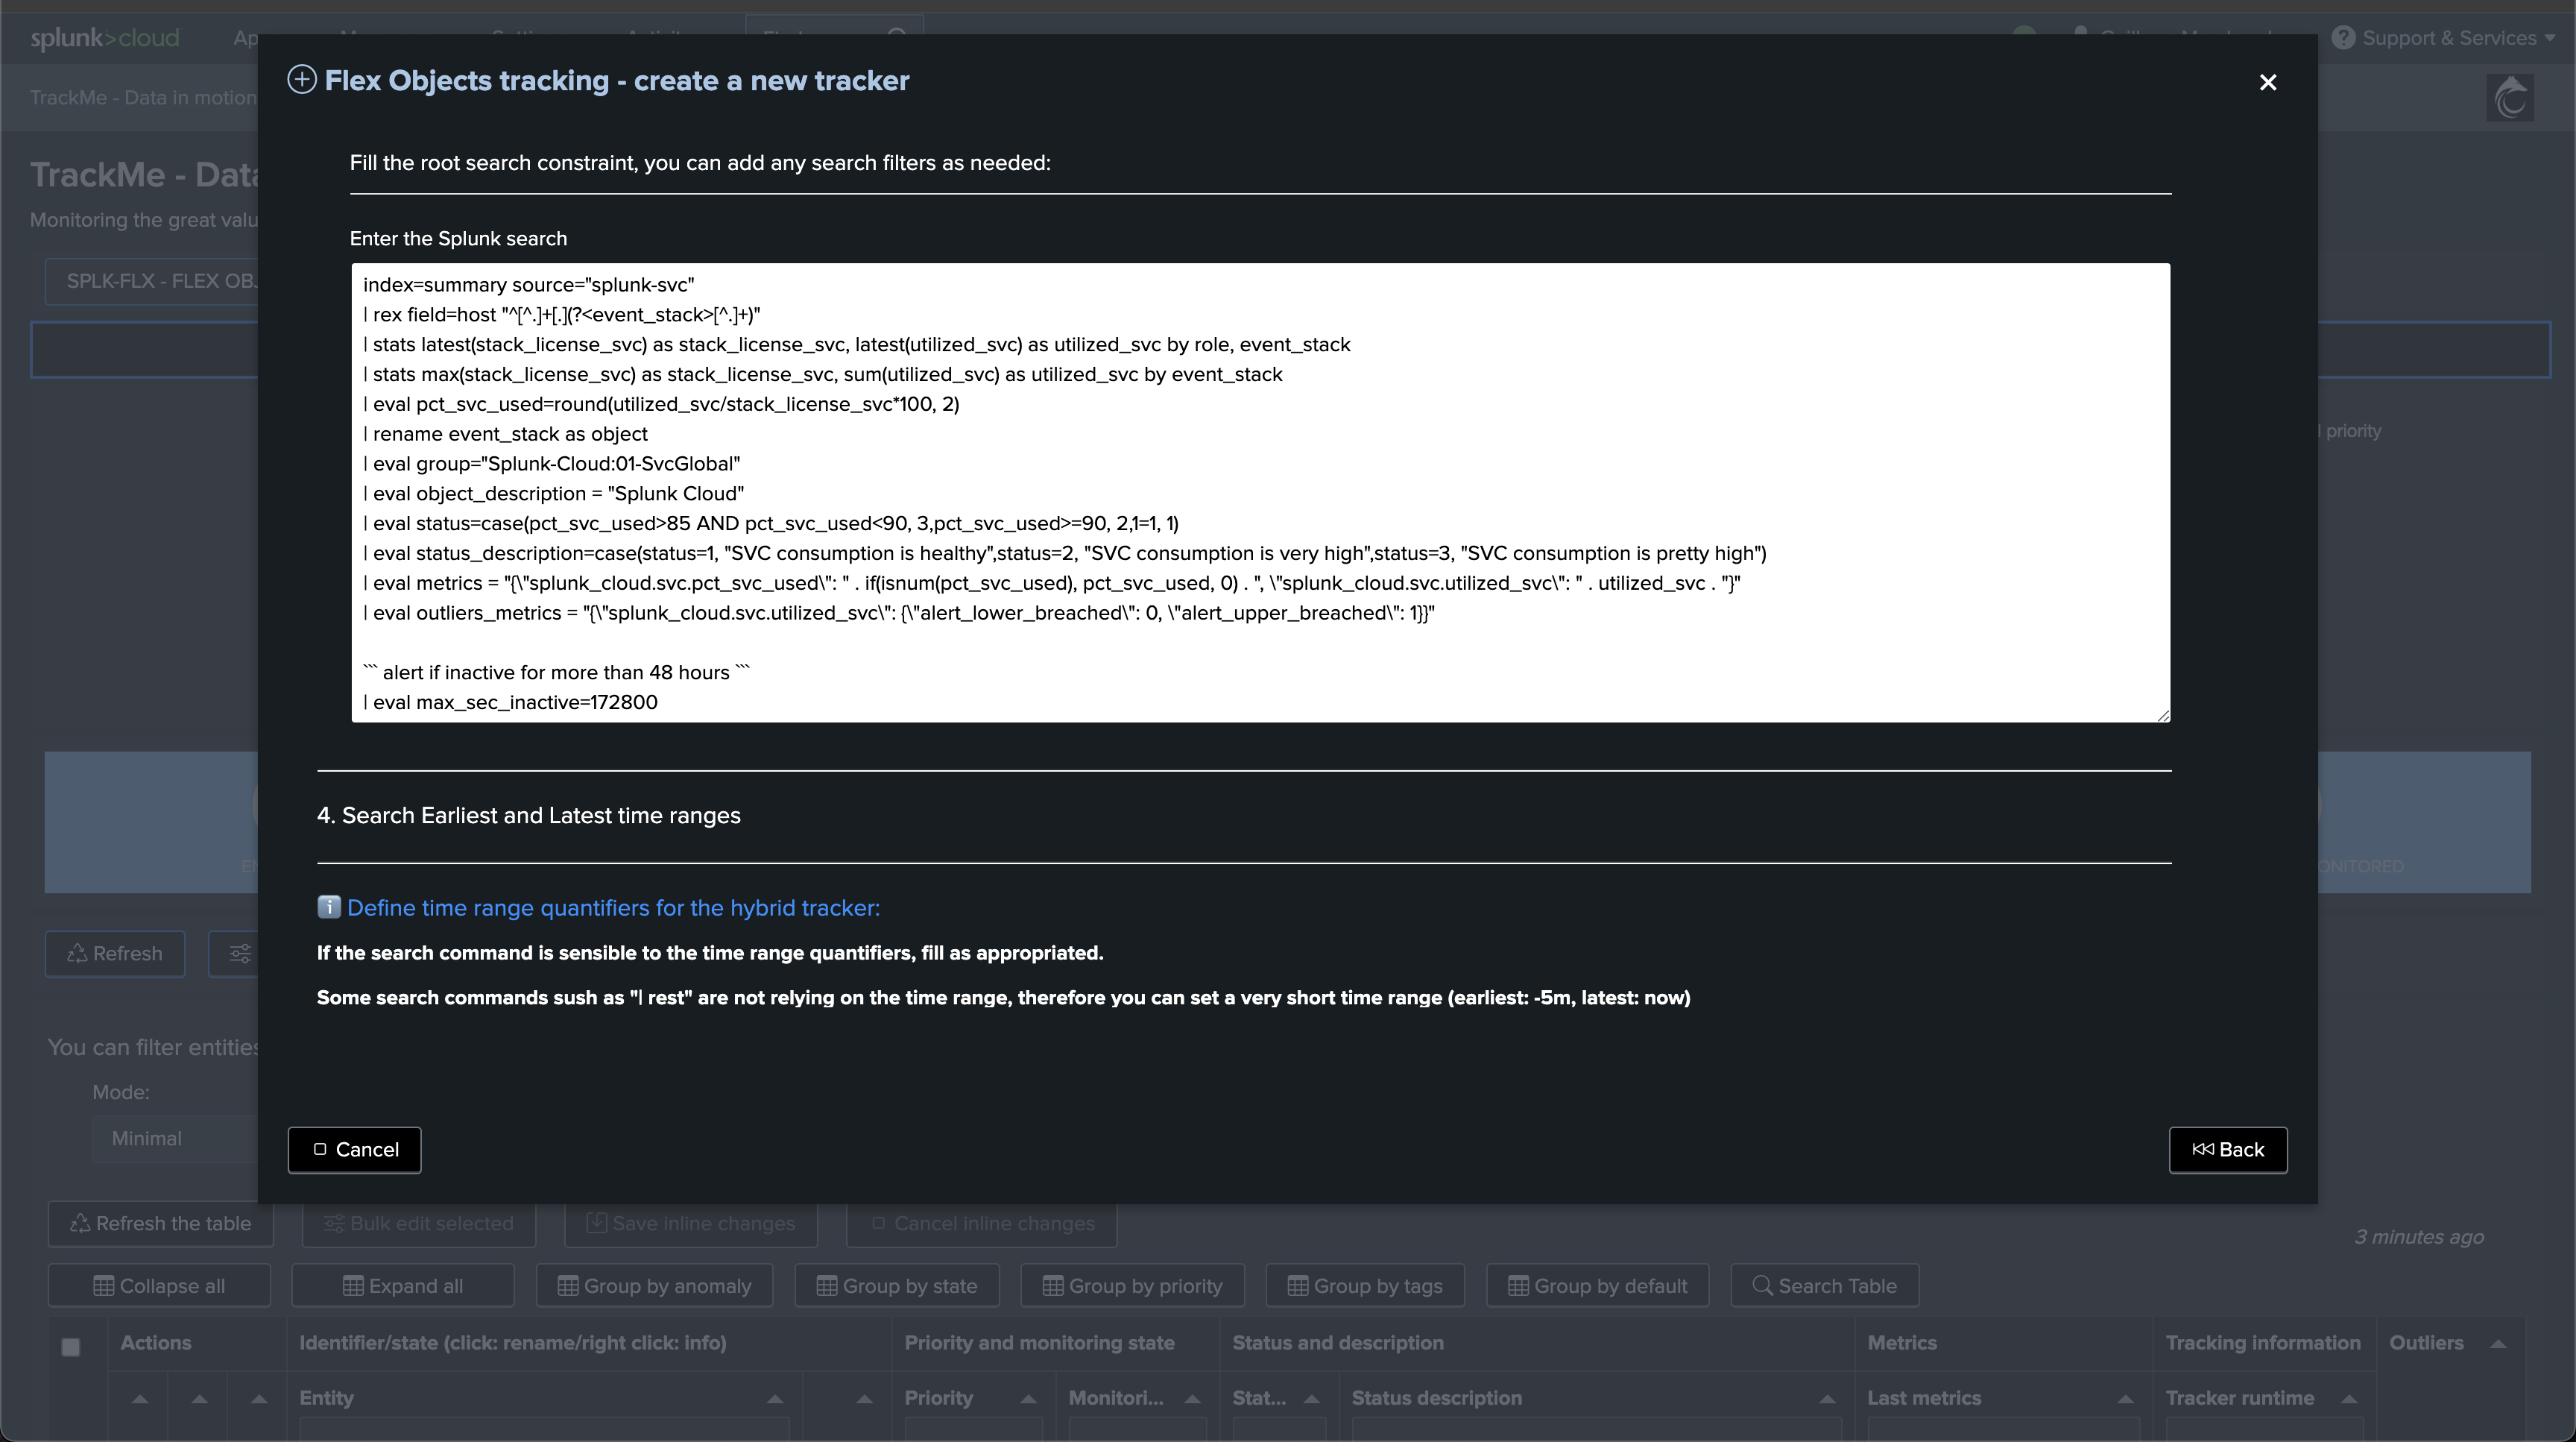
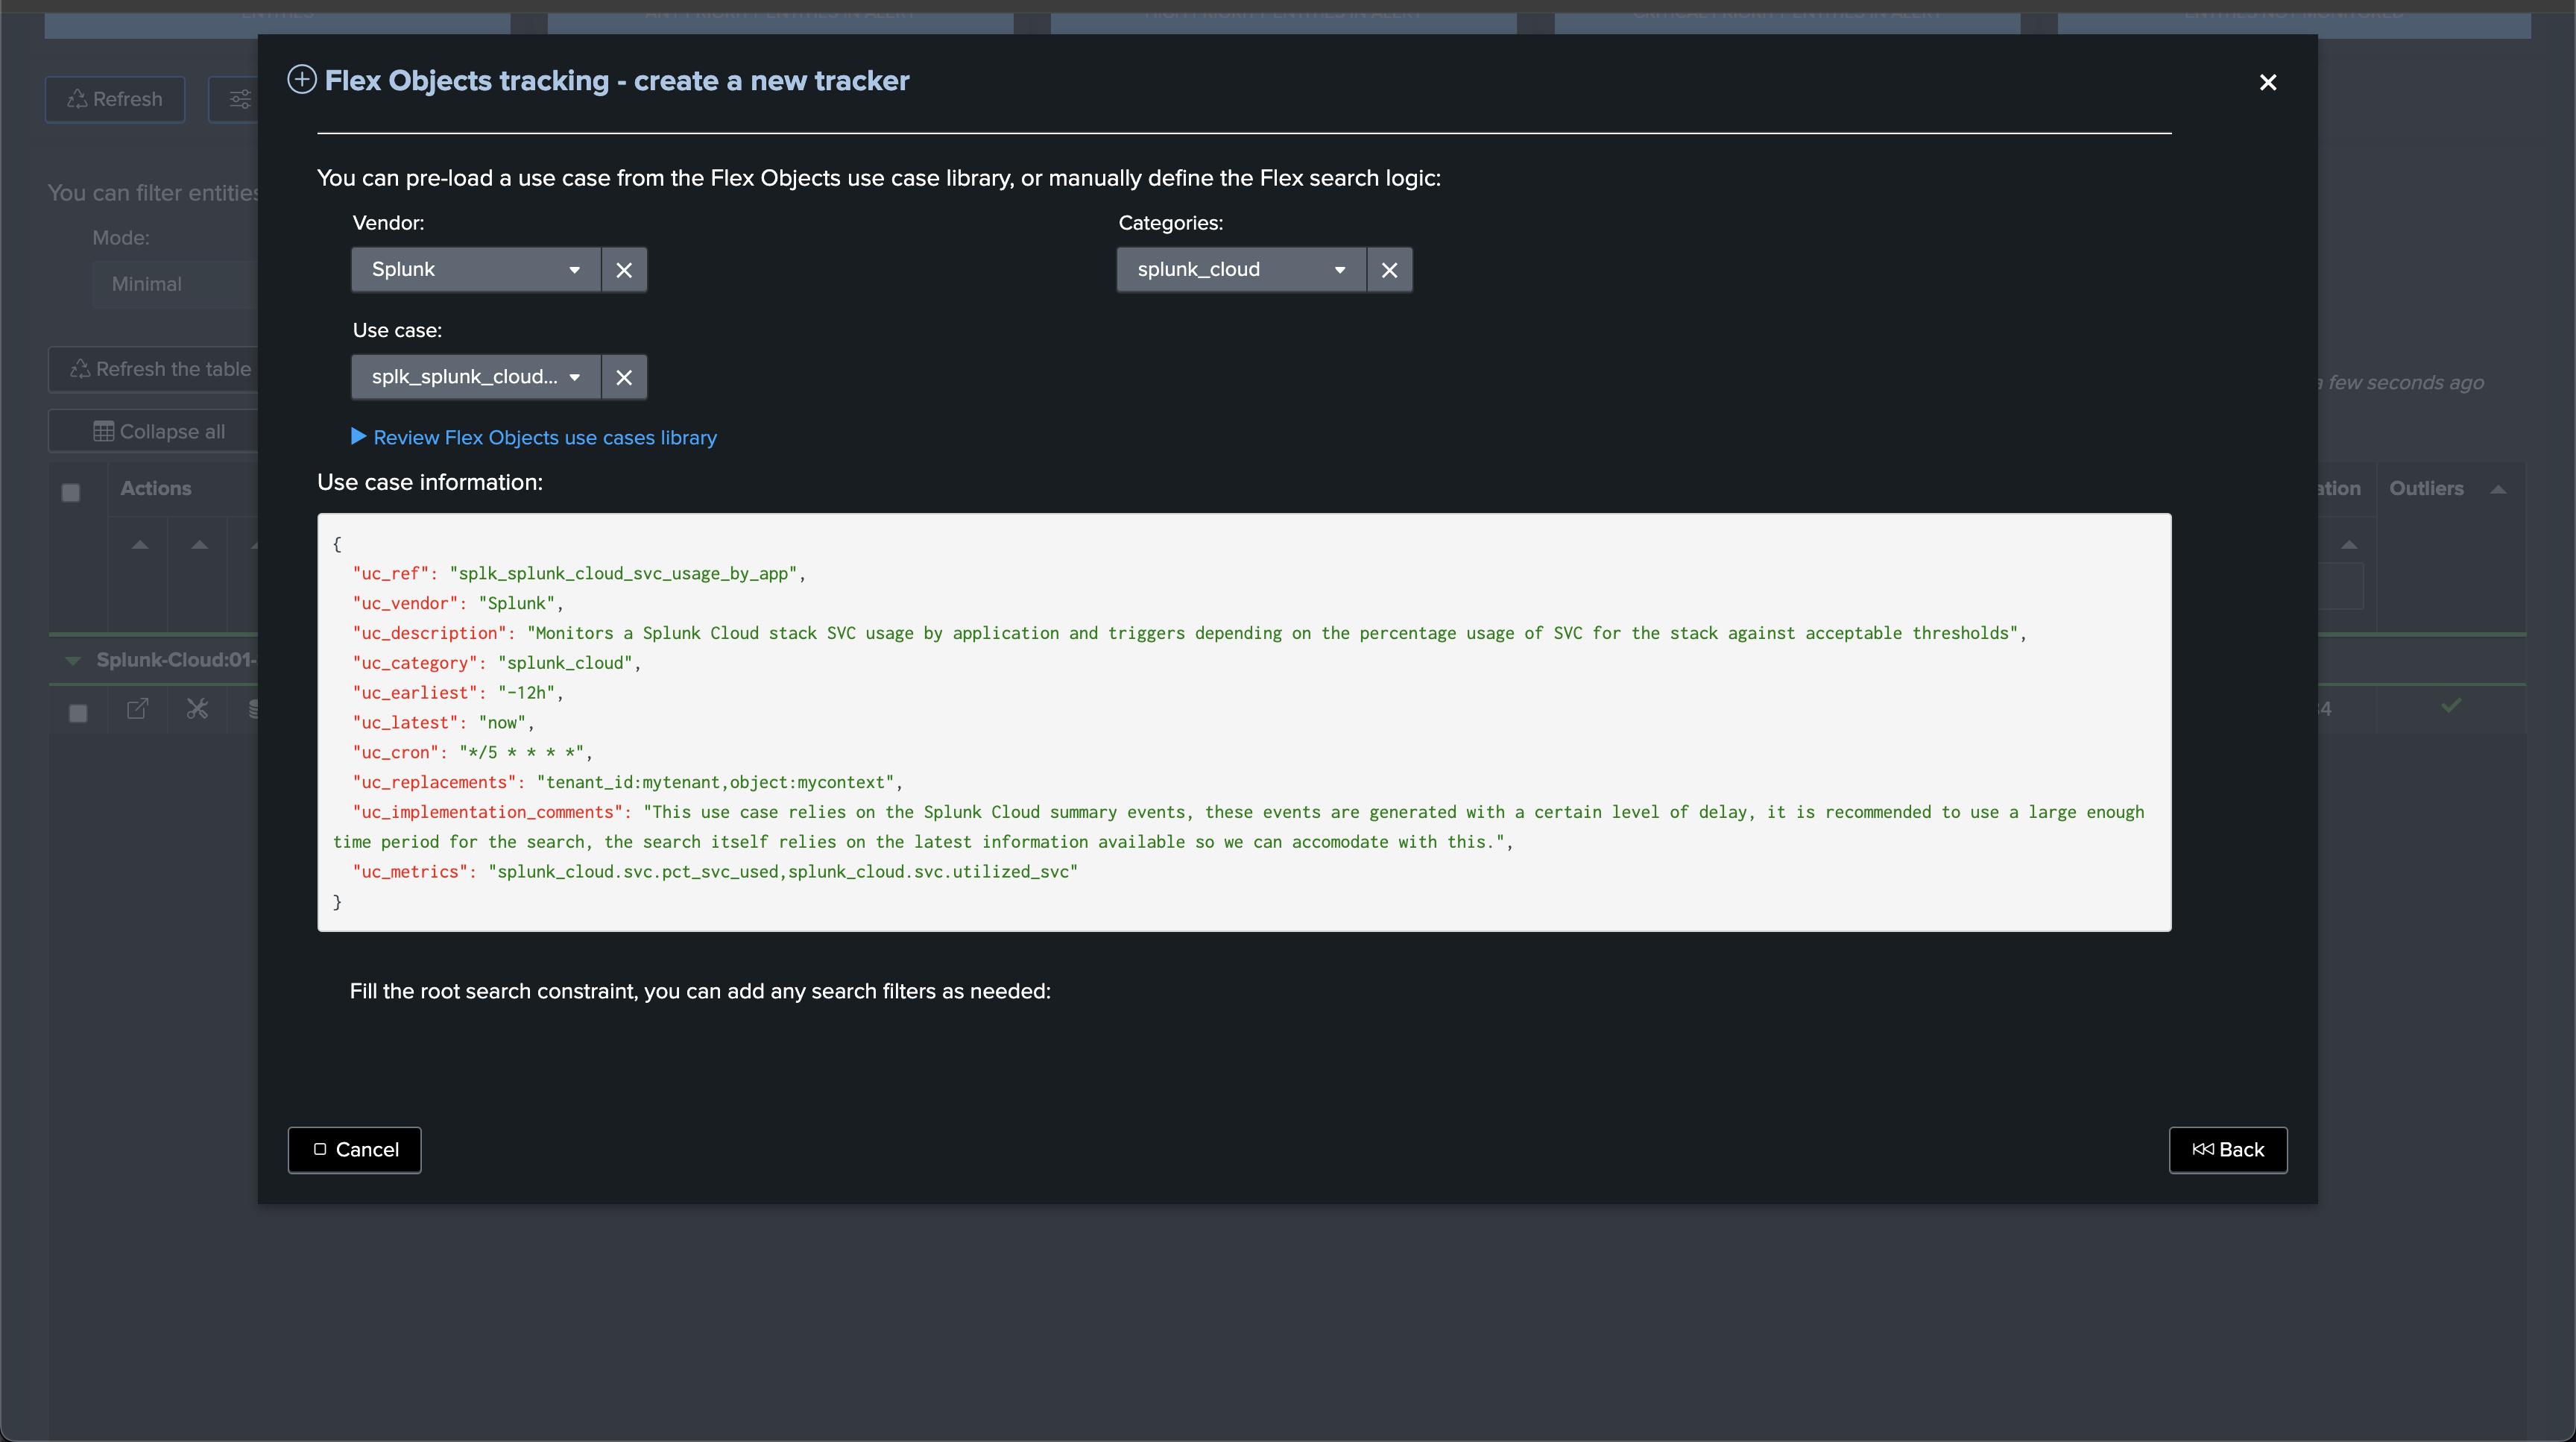
Once in the TrackMe UI, create a new Flex Object tracker and select the following use case template:
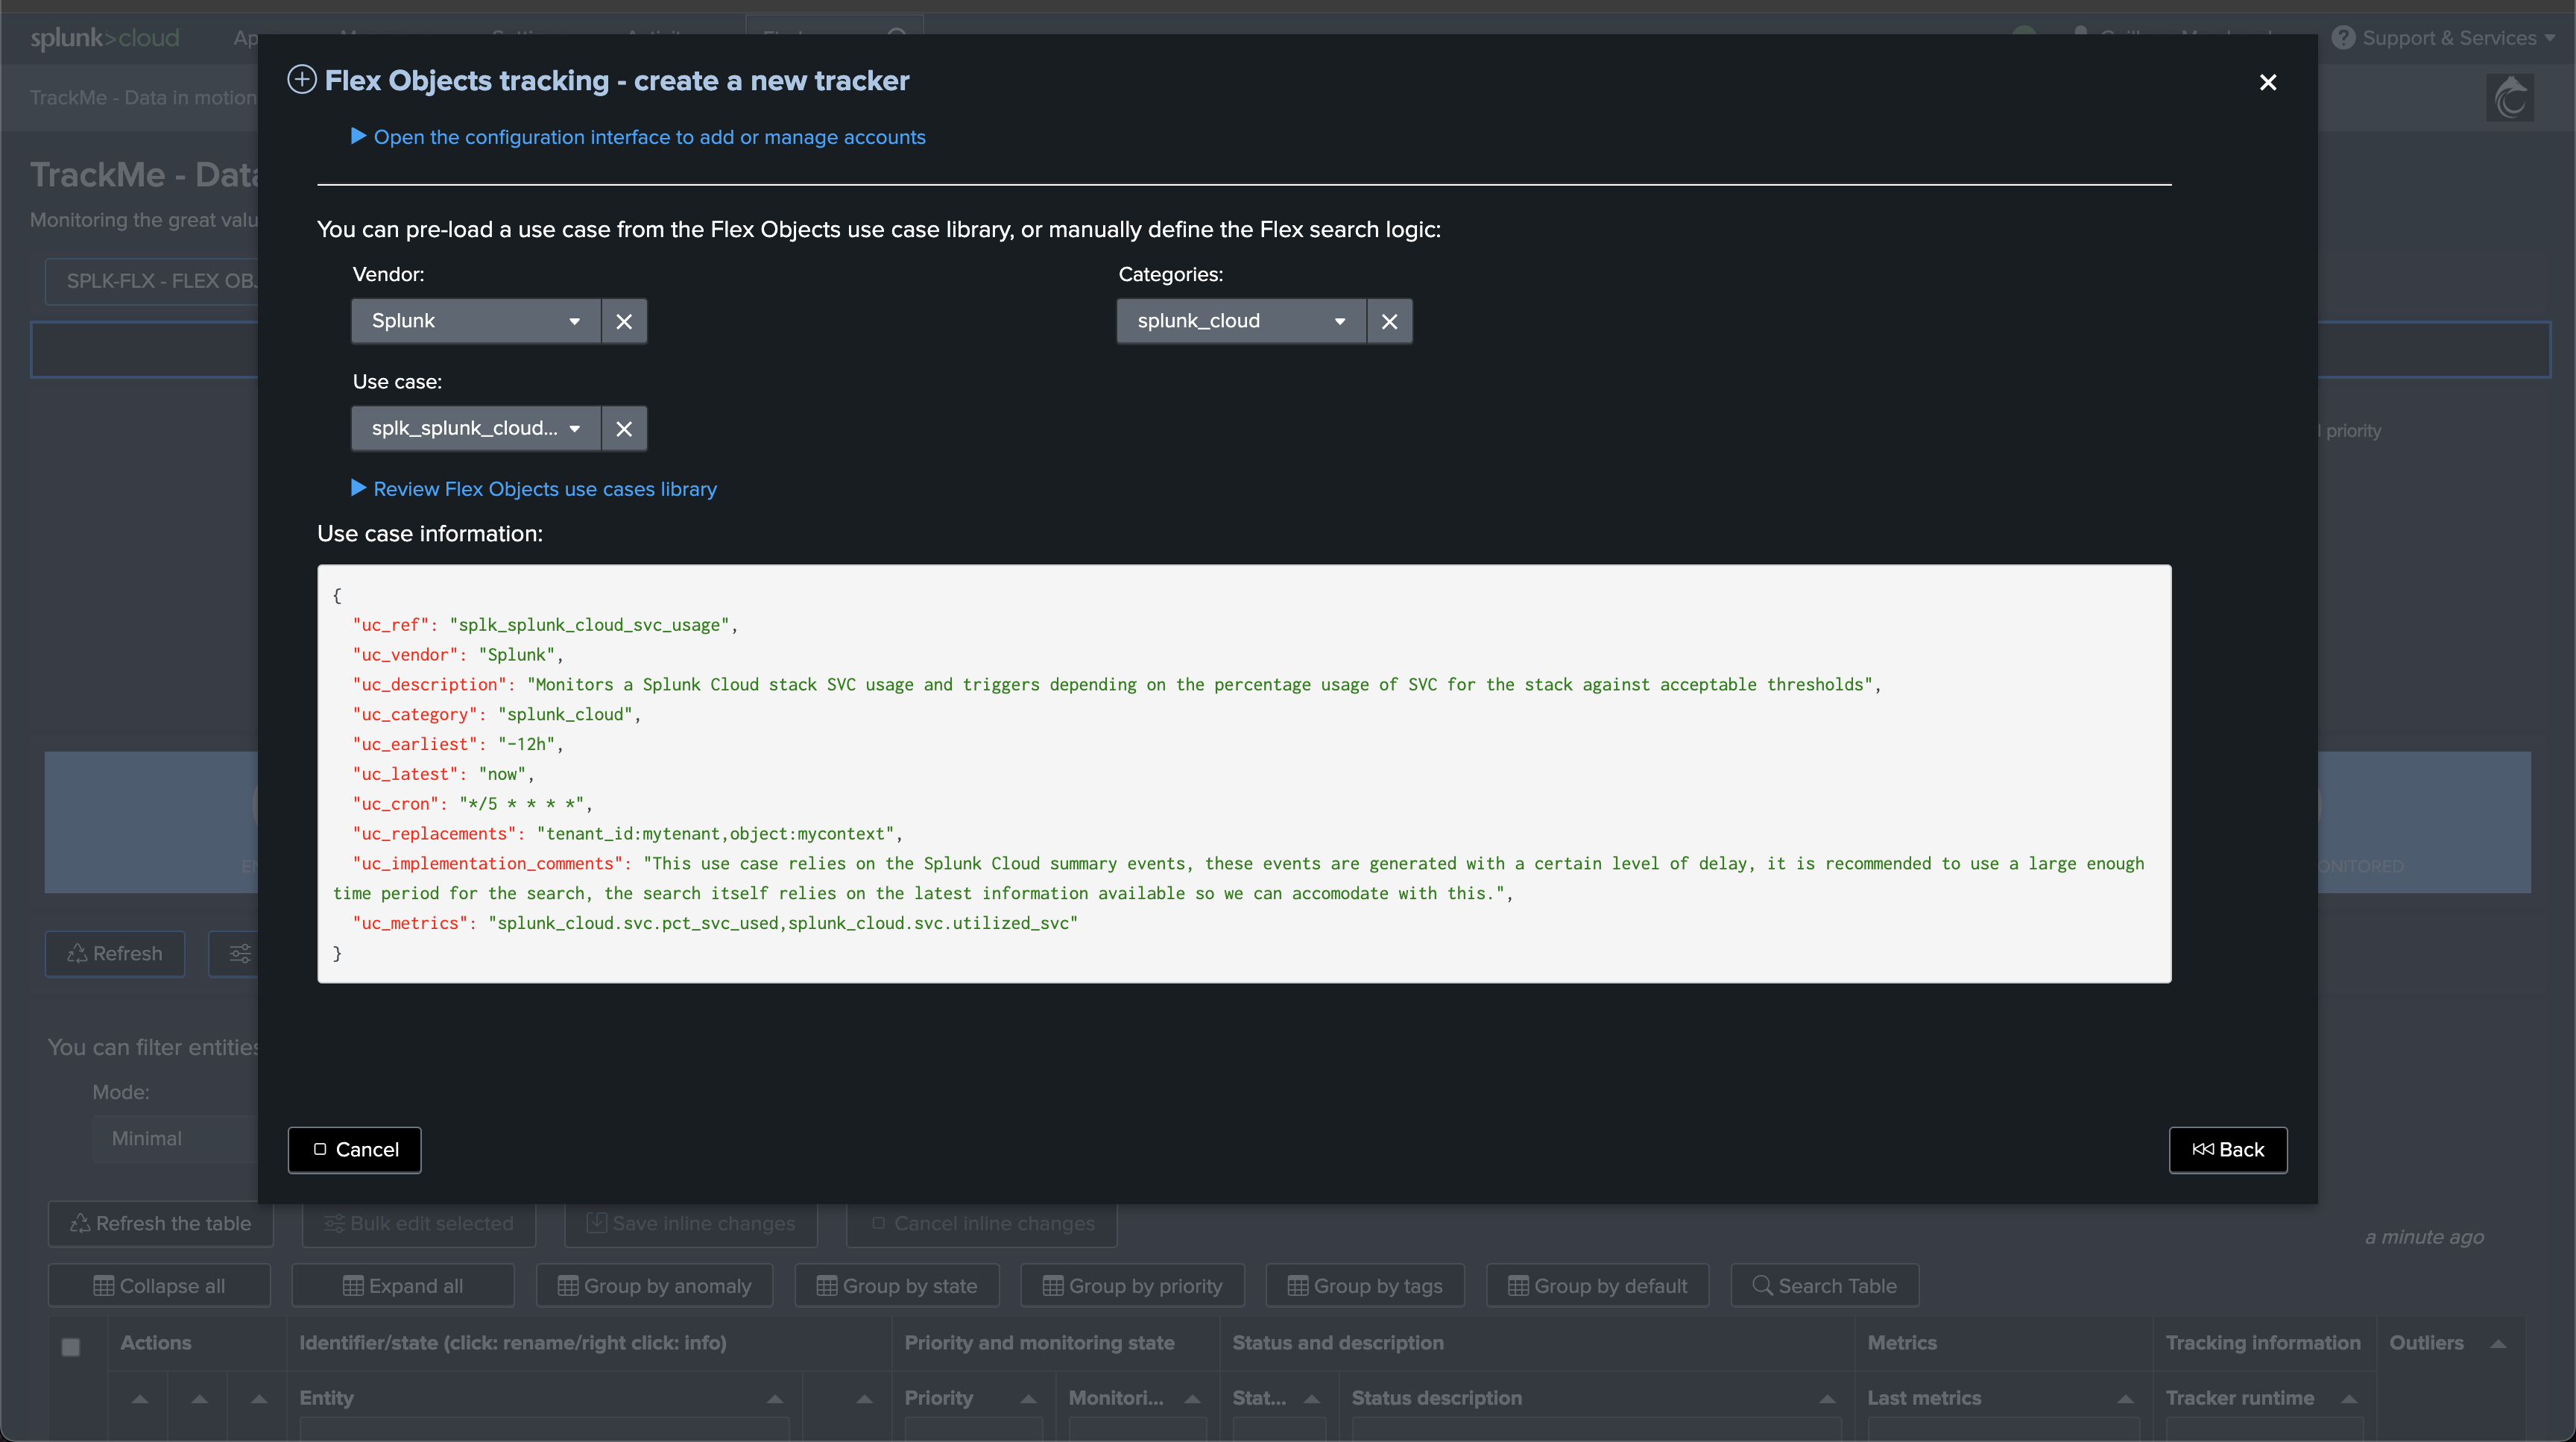
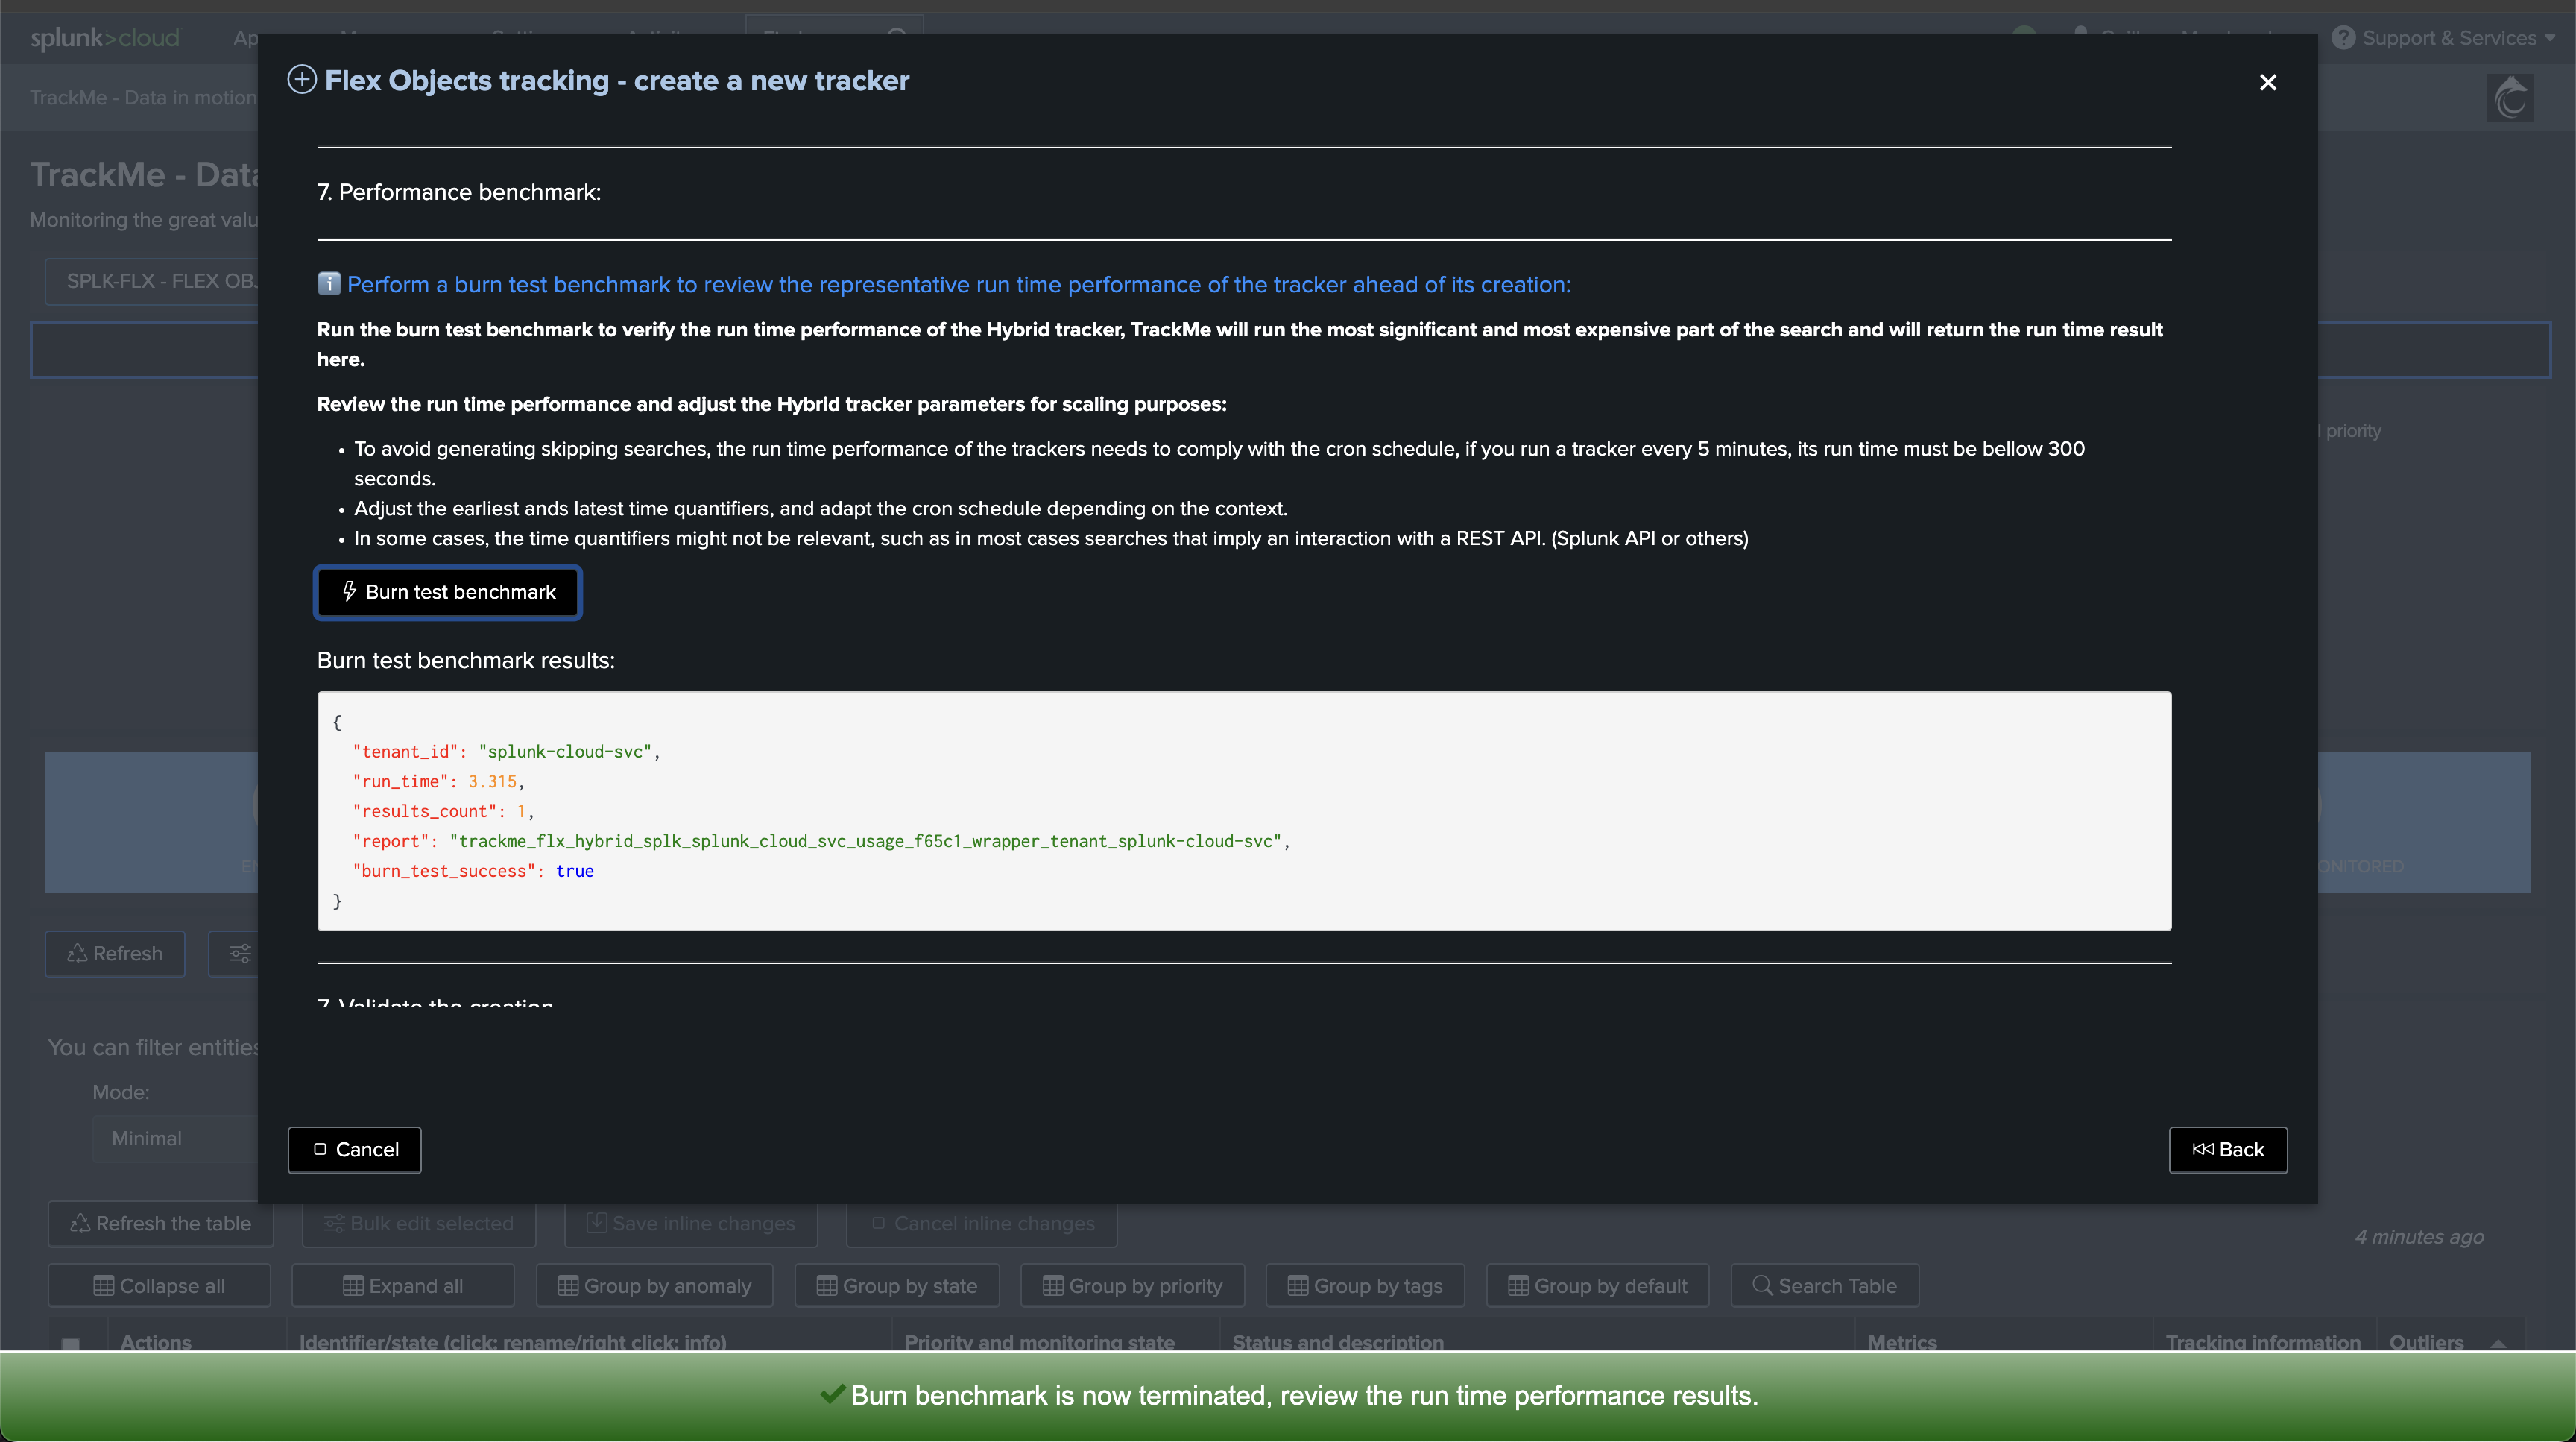
Scroll down and execute the tracker. You can also customize the tracker if you wish to do so, although this is not mandatory and the use case will work out of the box:
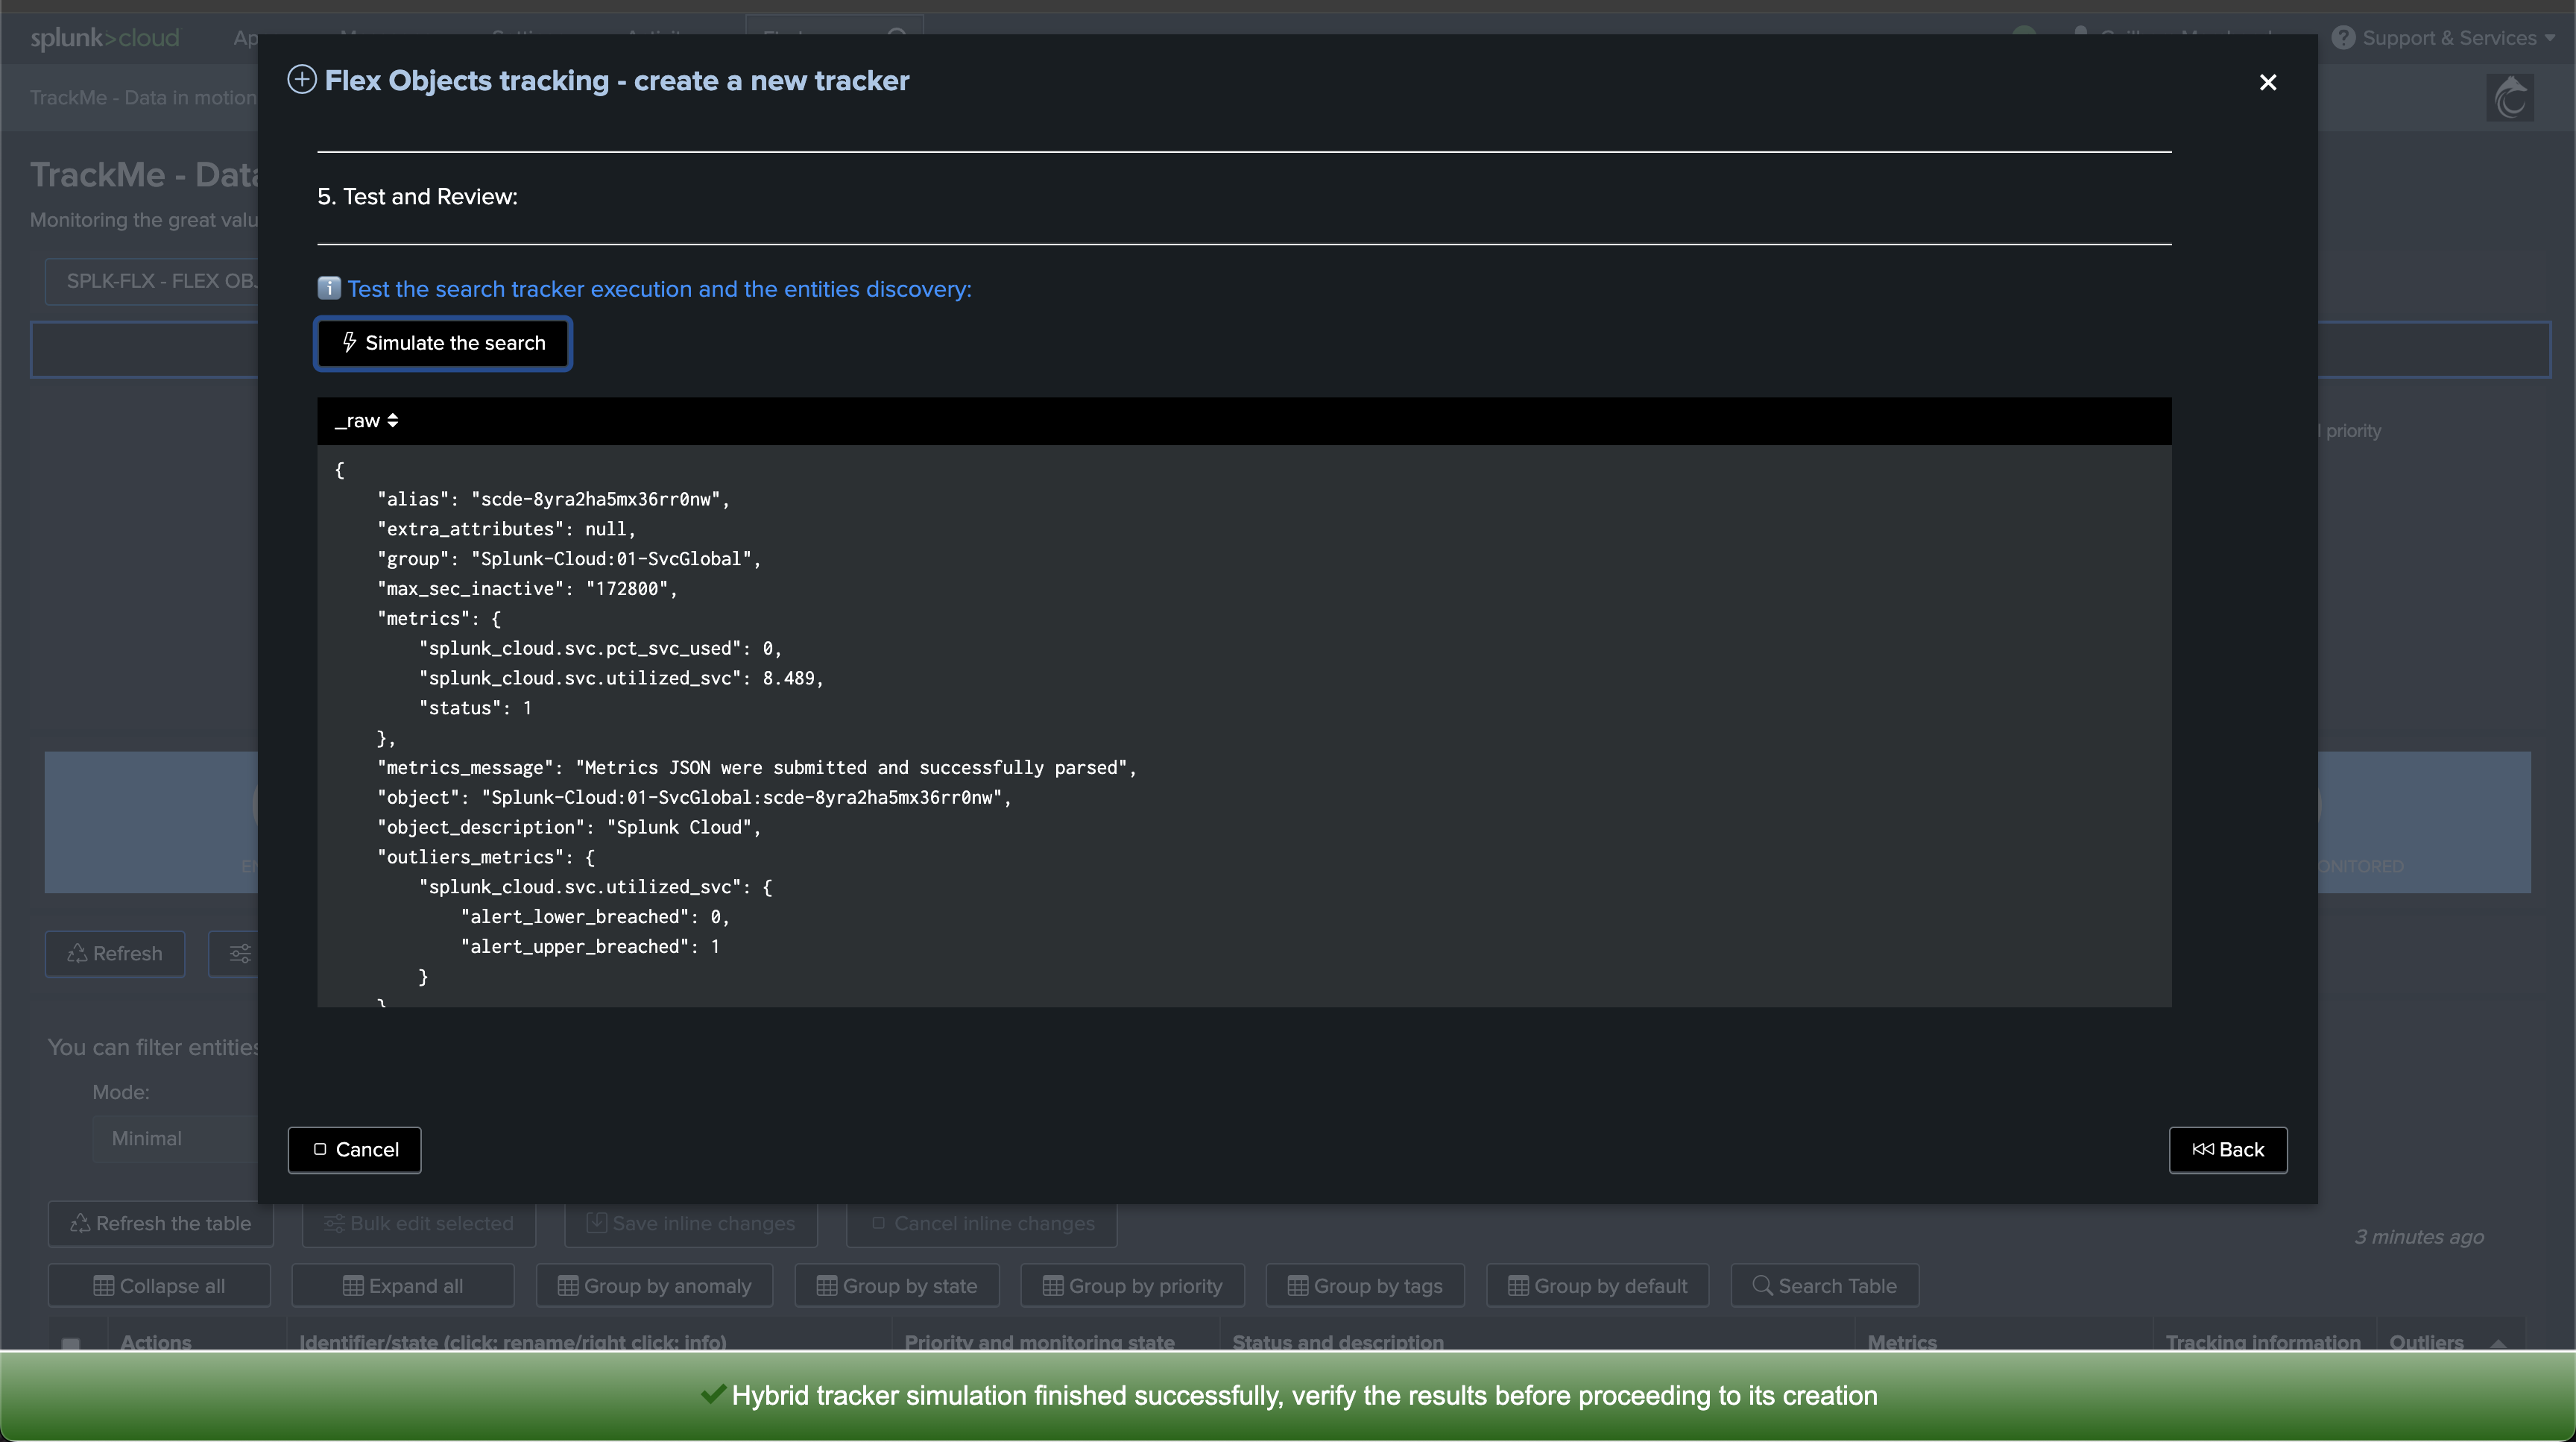
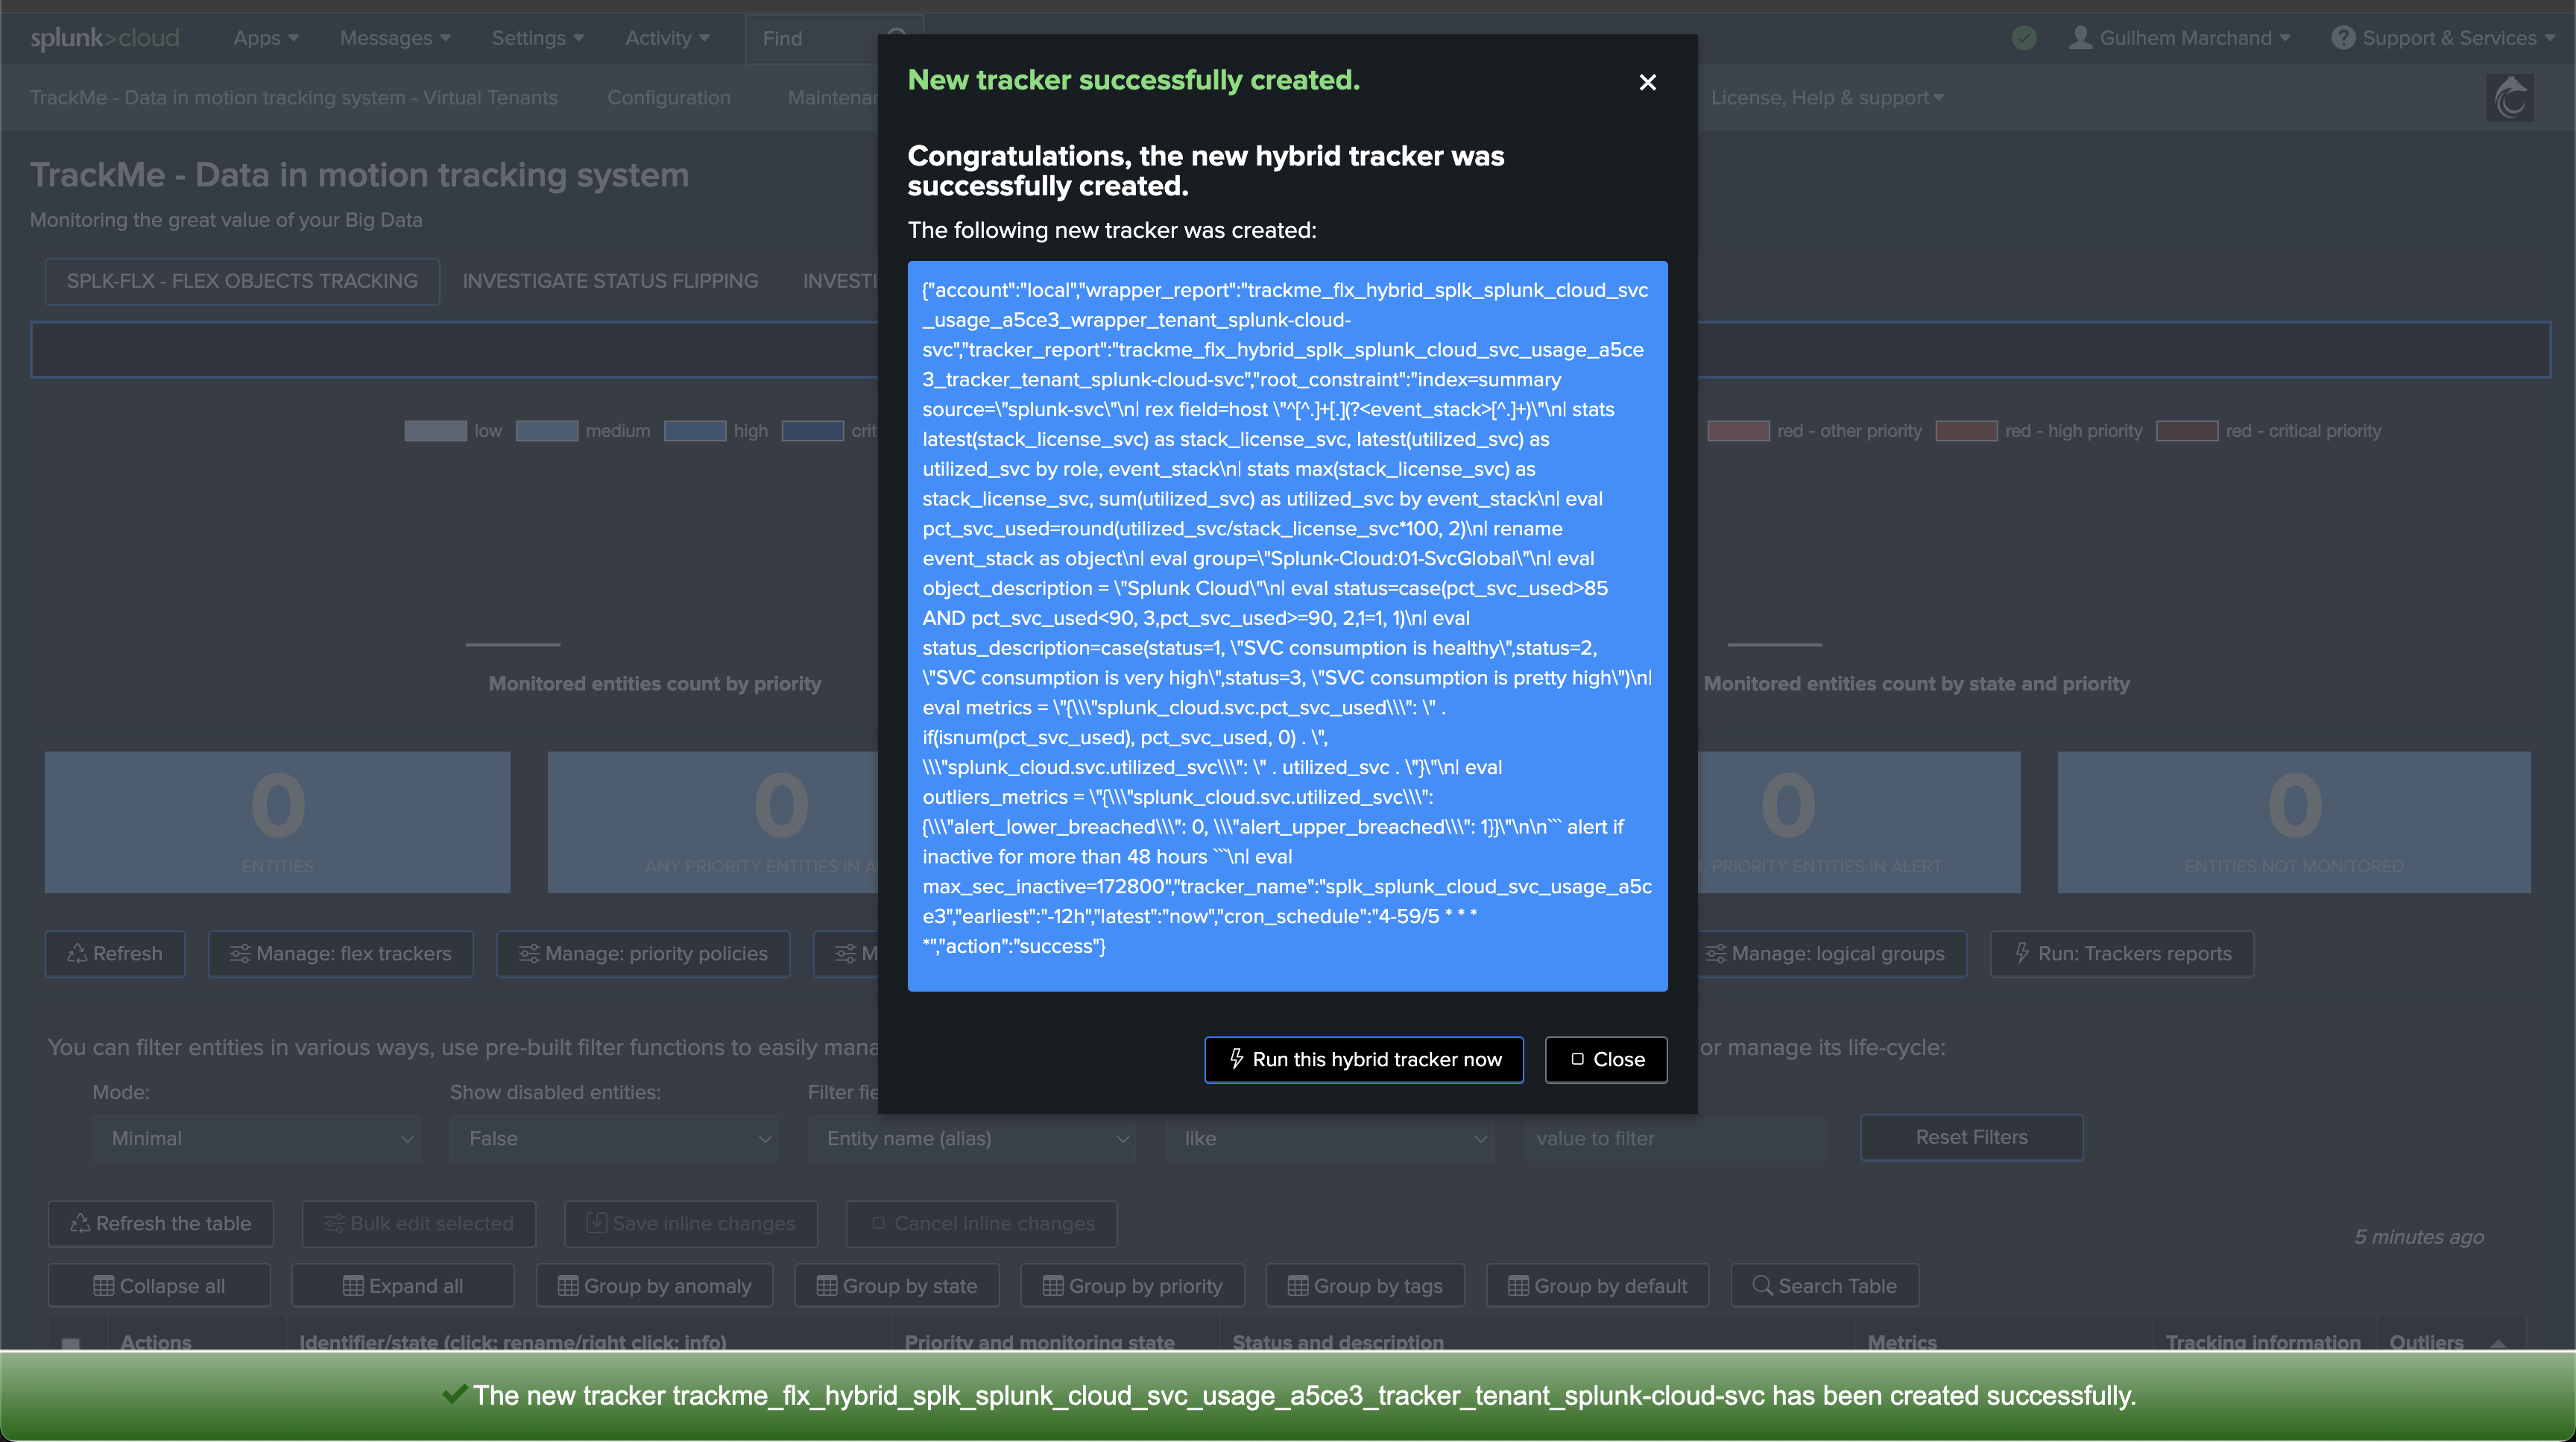
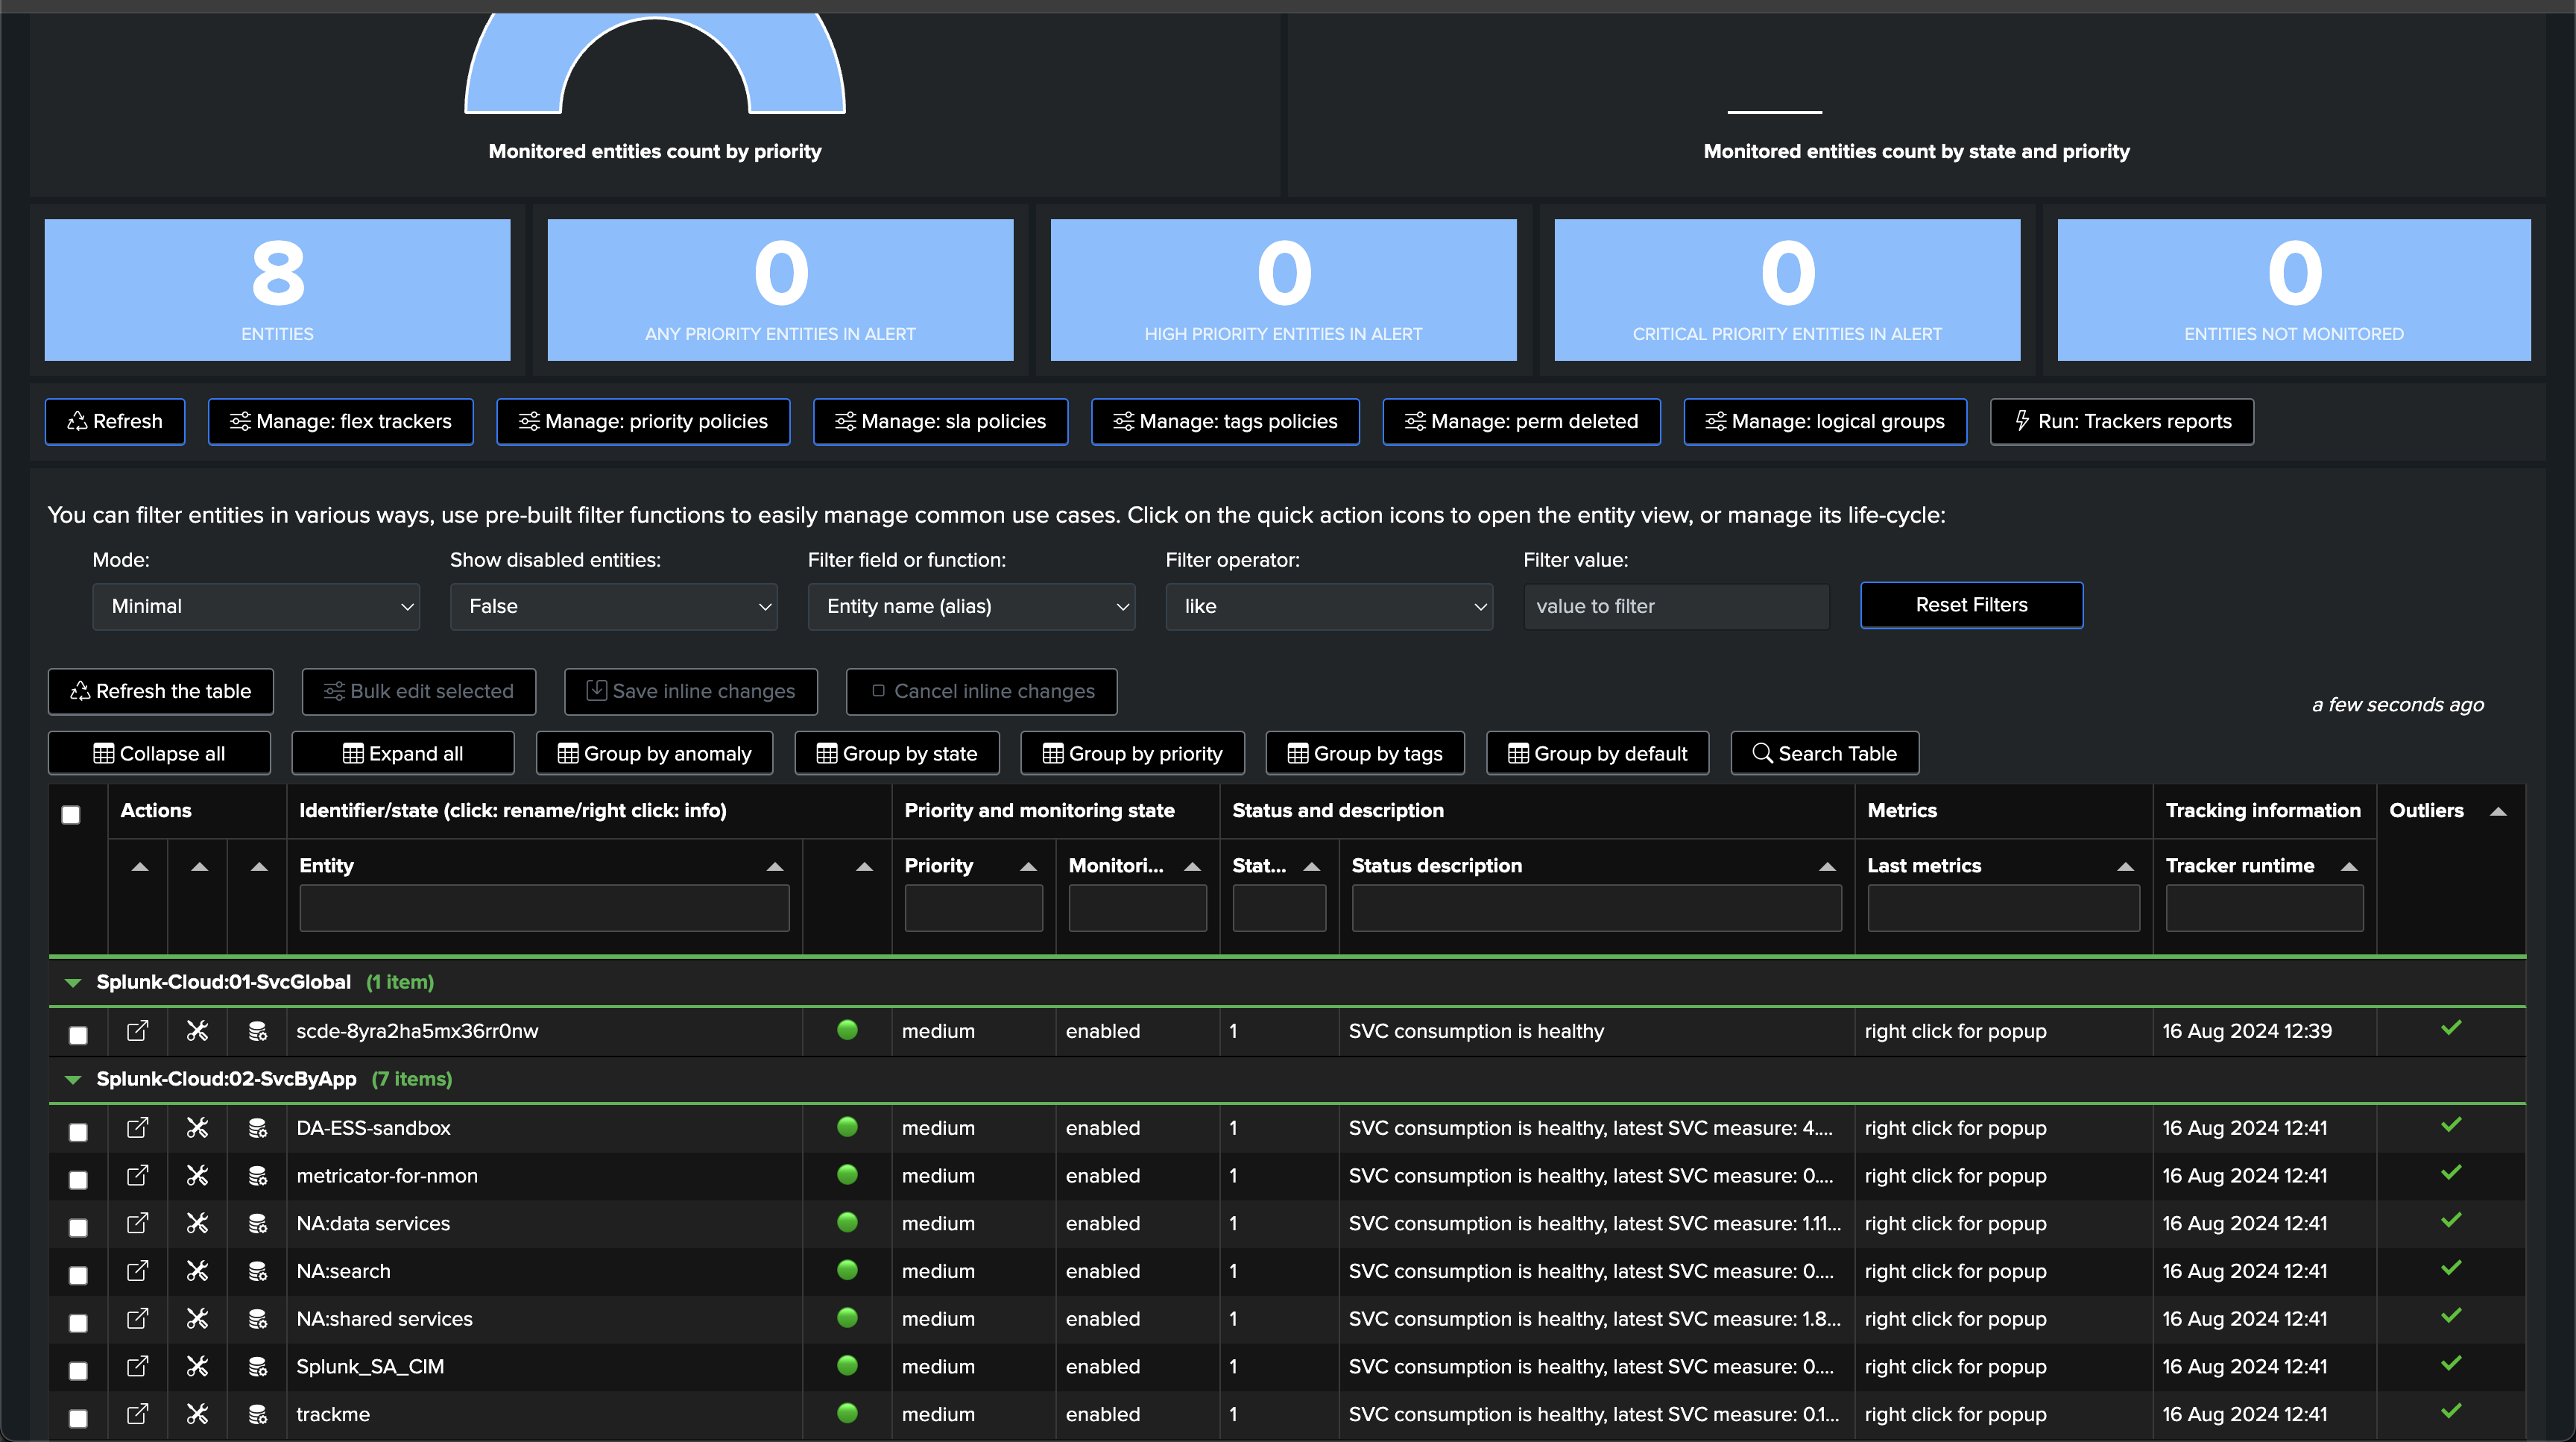
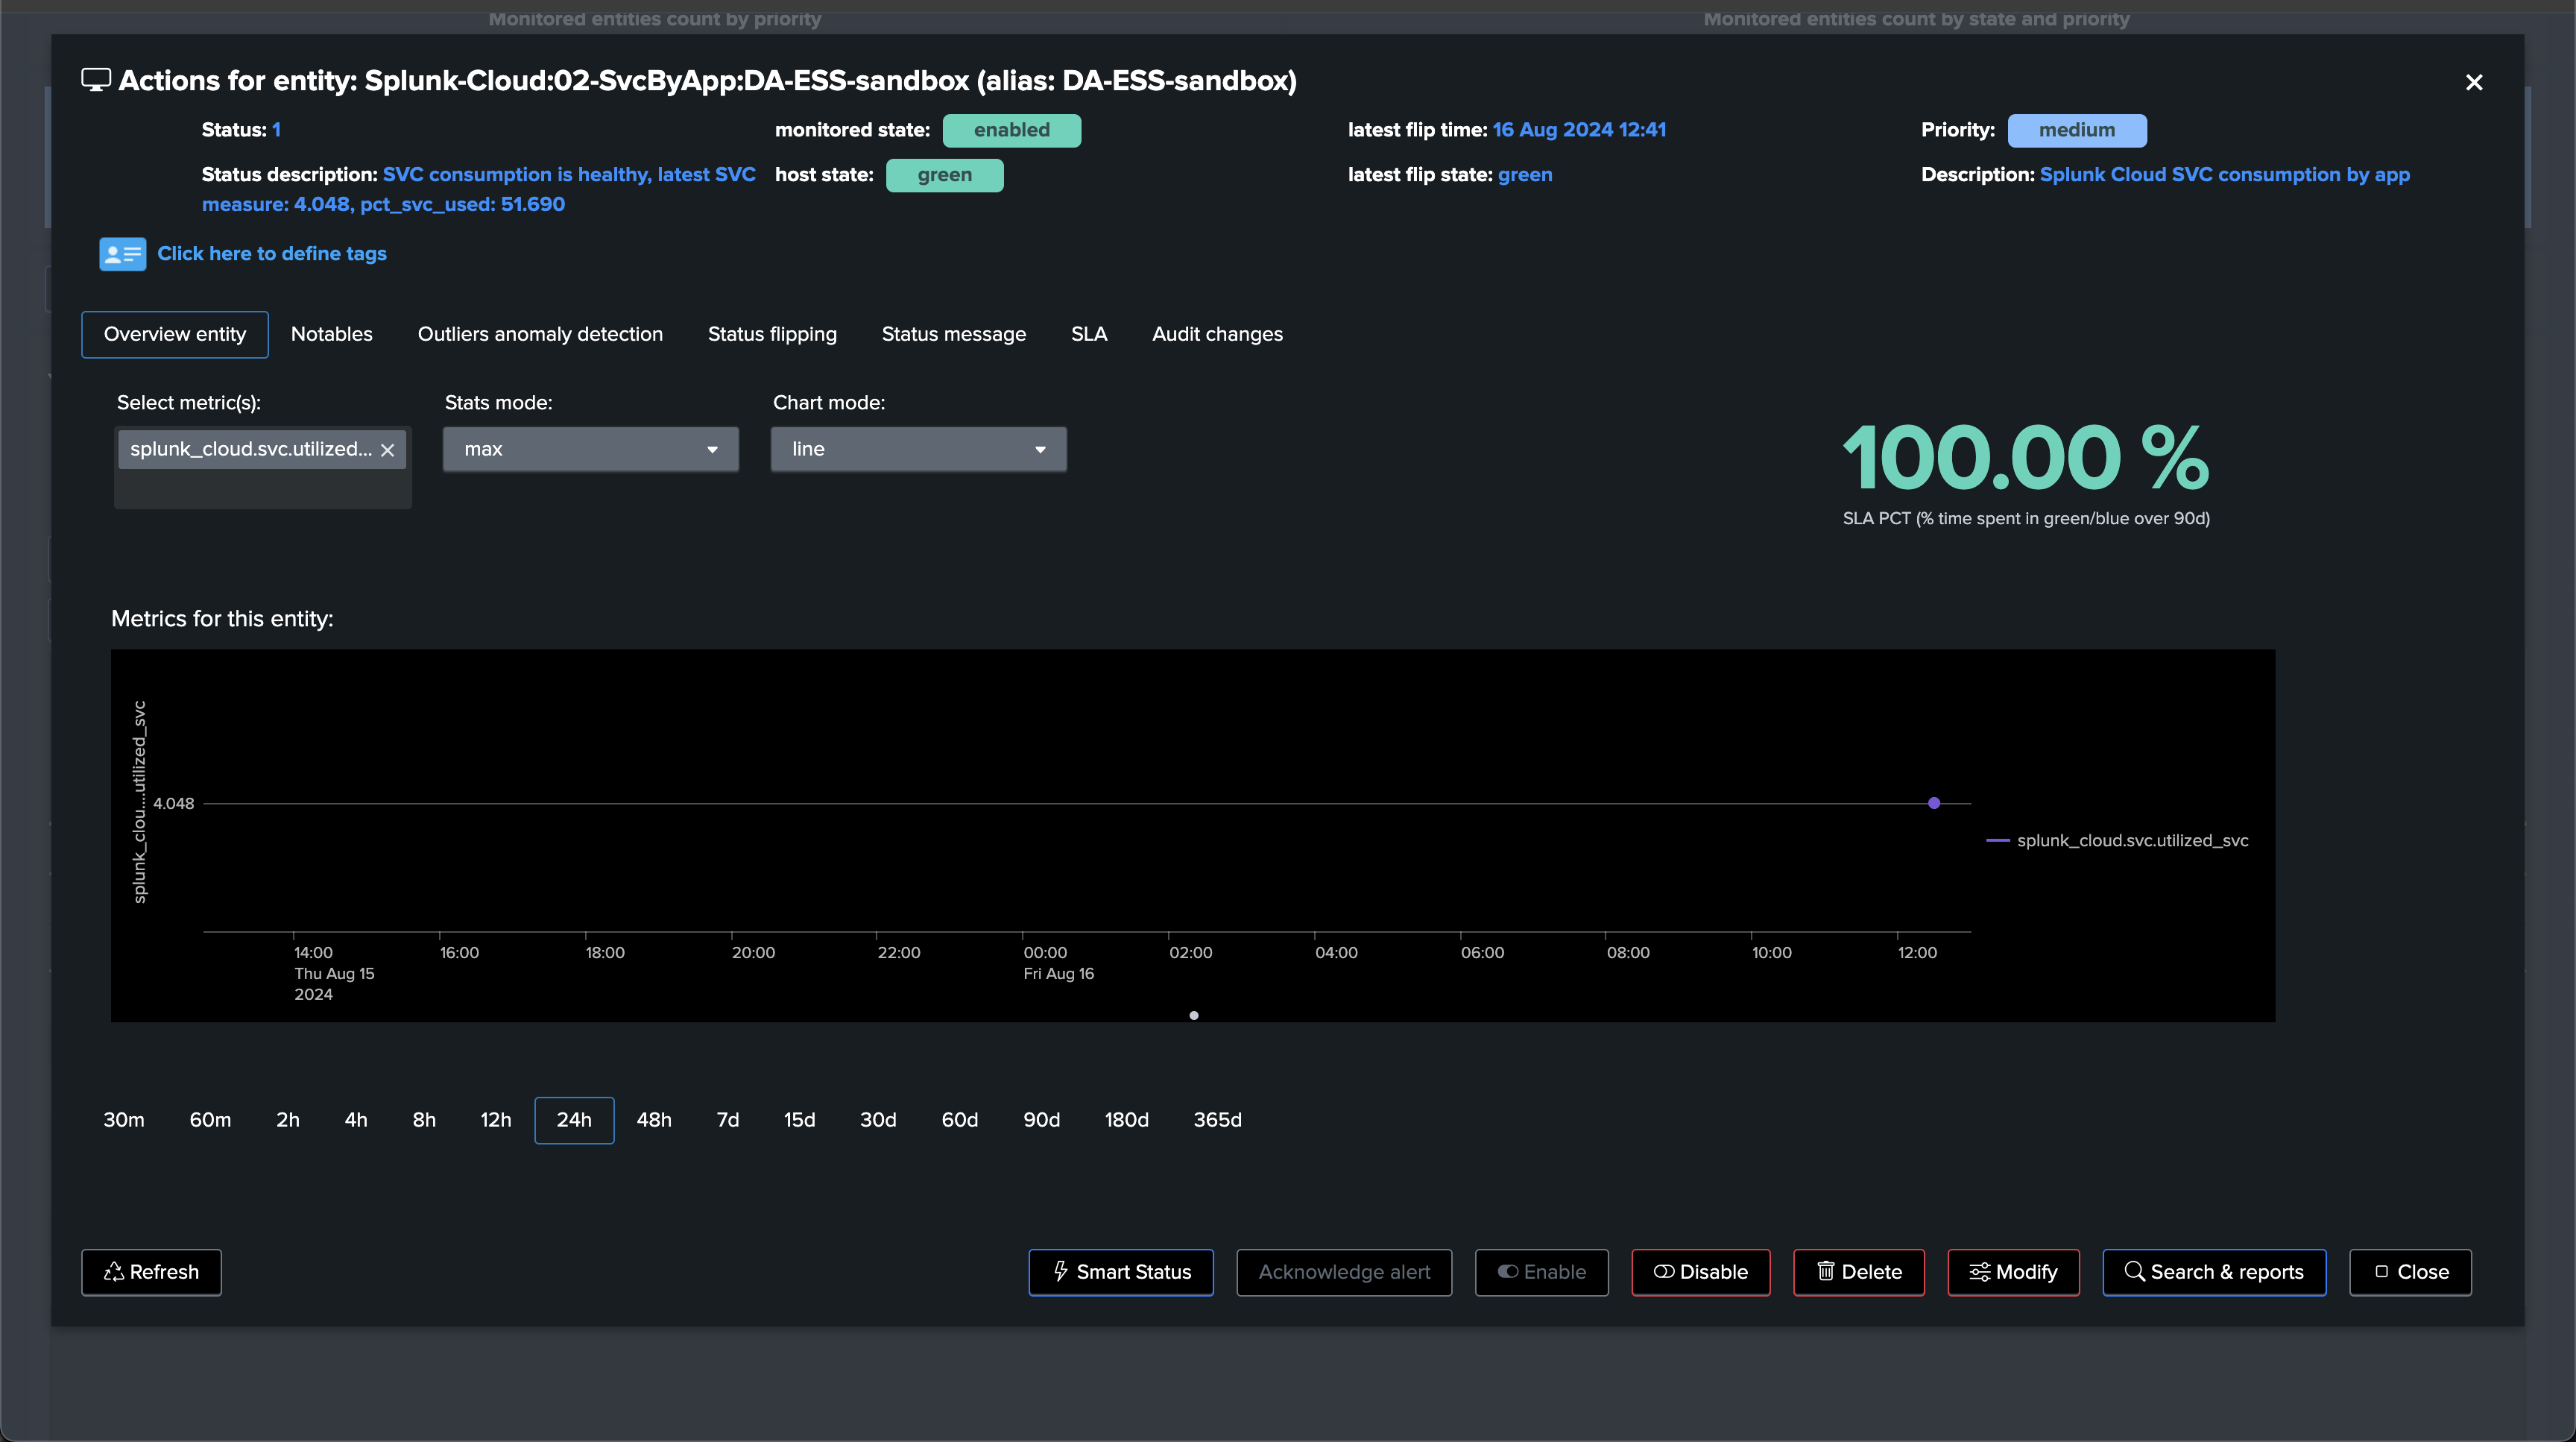
Once executed, you will see one TrackMe entity, which corresponds to the Splunk Cloud stack name:
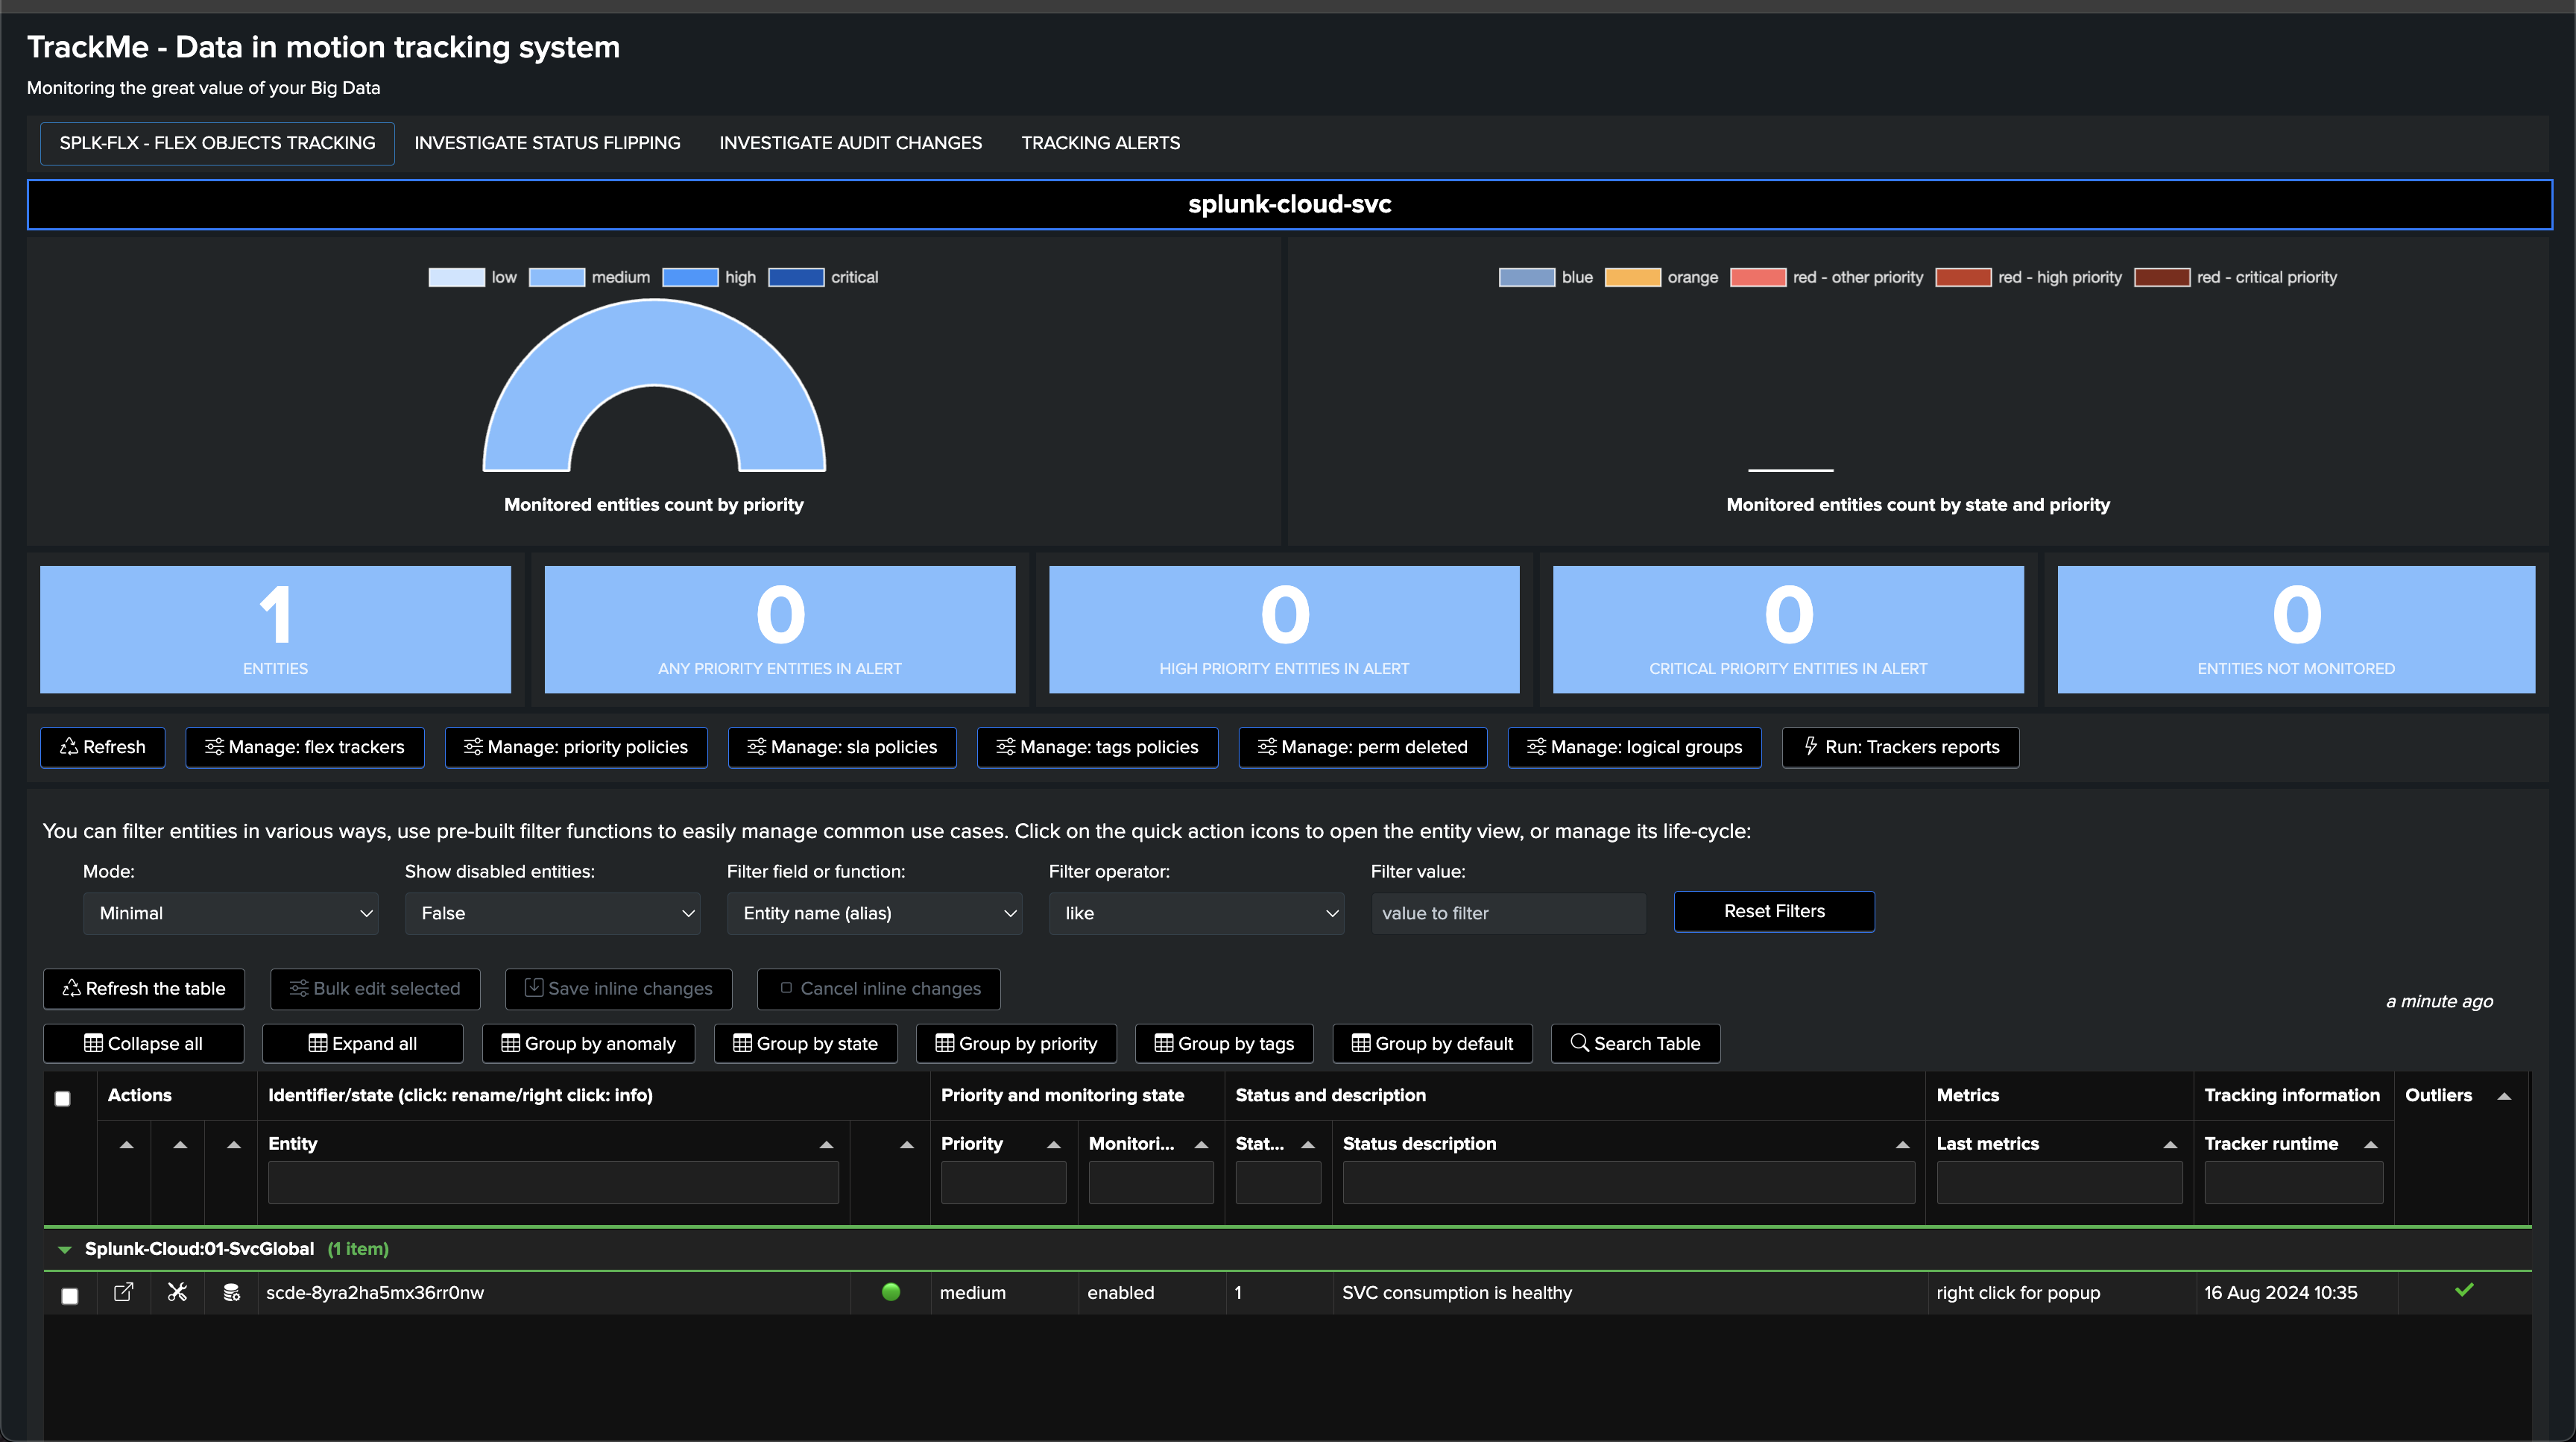
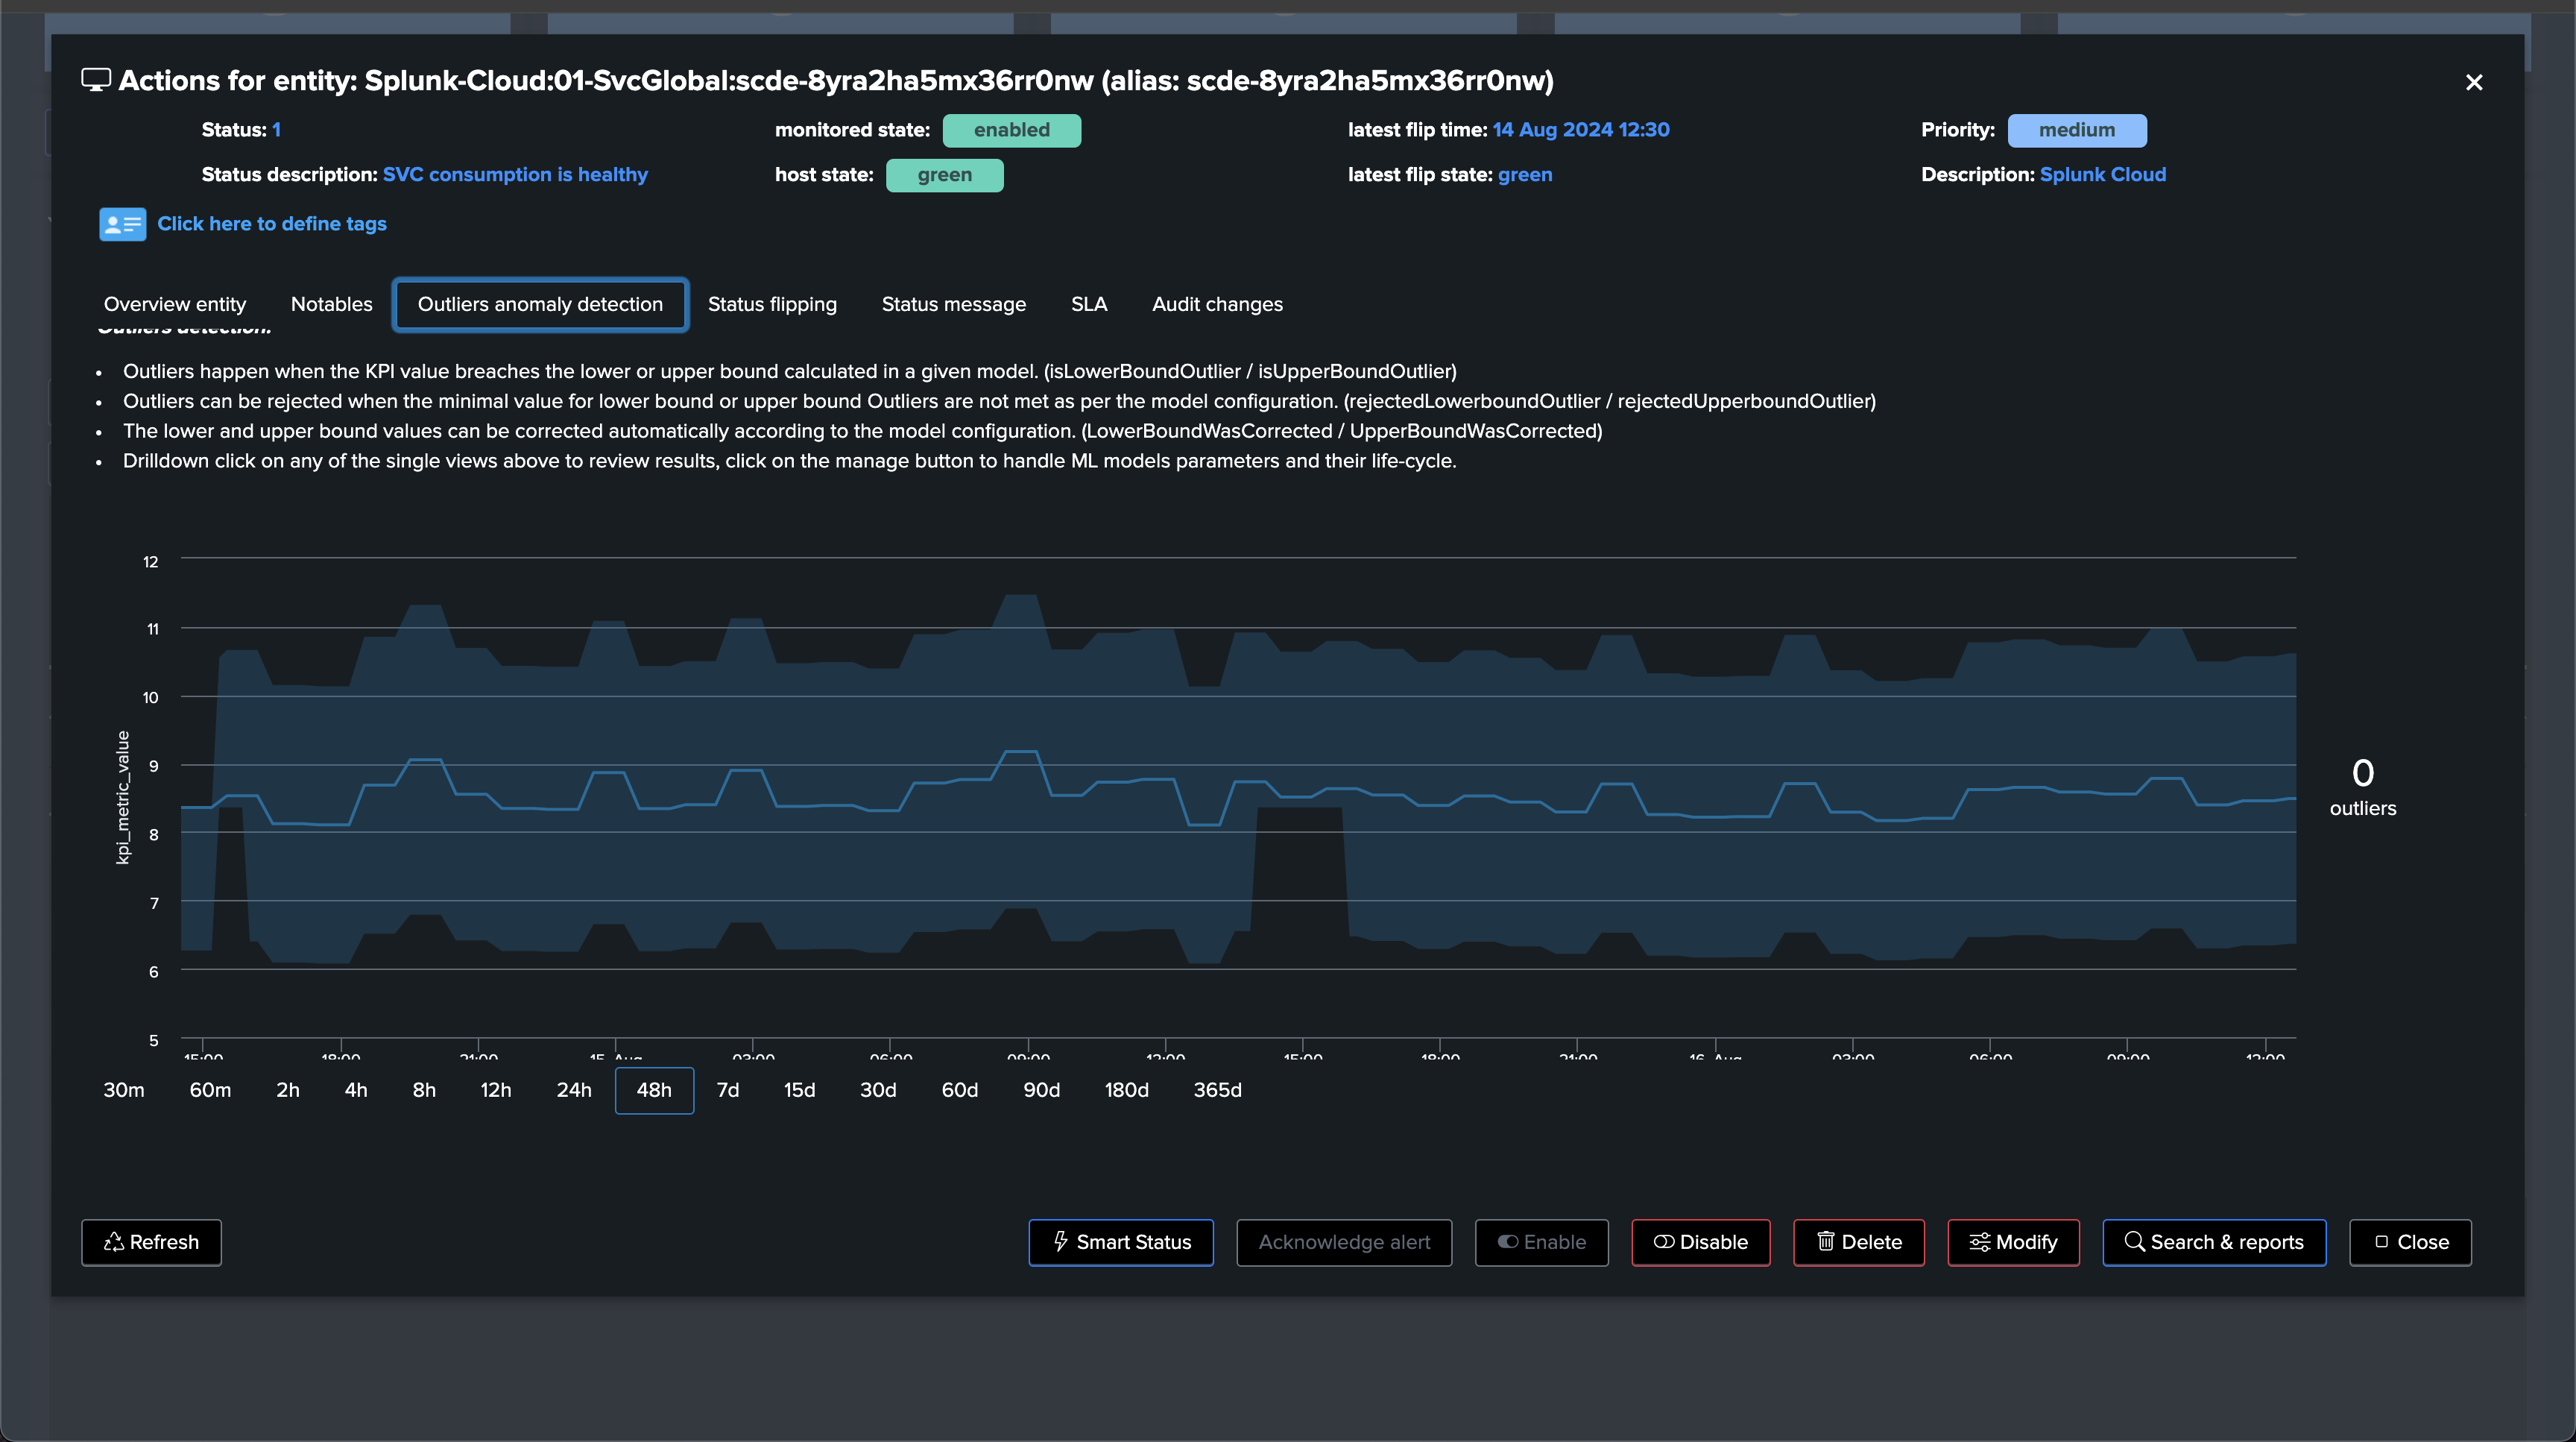
If you open the entity, you will see two SVC kpis:
splunk_cloud.svc.pct_svc_used: the percentage of SVC used in the stacksplunk_cloud.svc.utilized_svc: the amount of SVC used in the stack
Example:
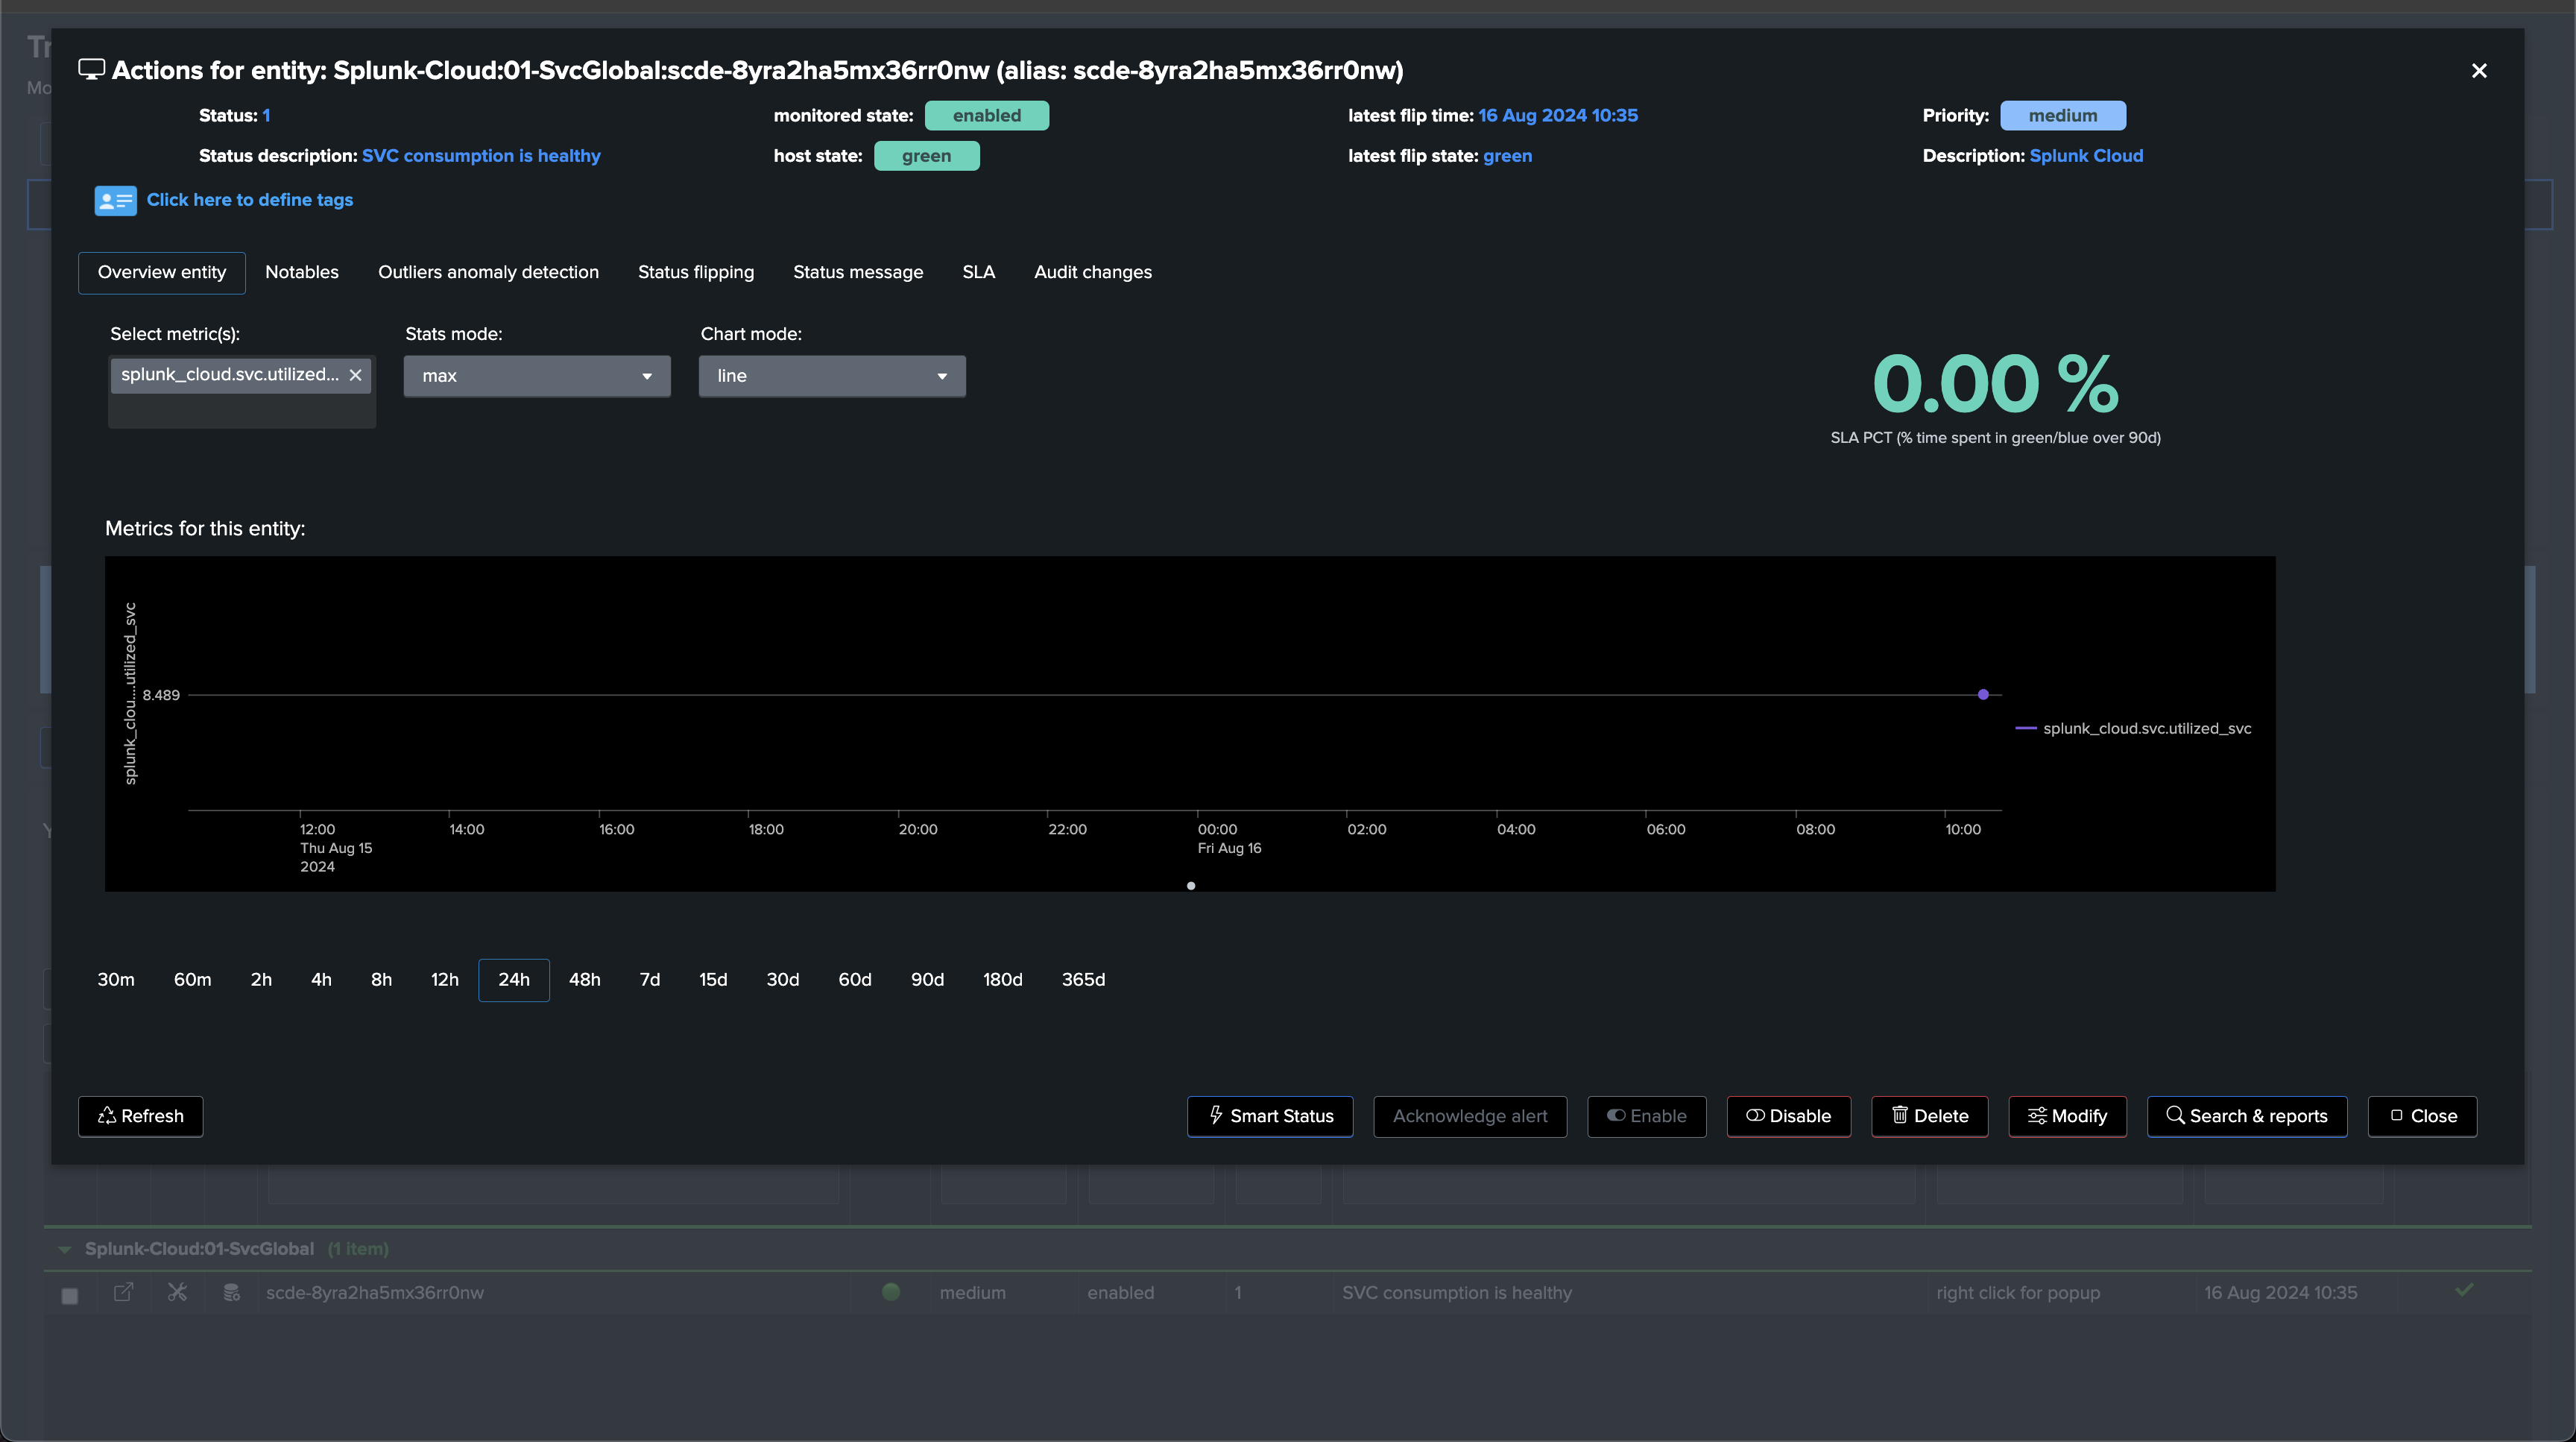
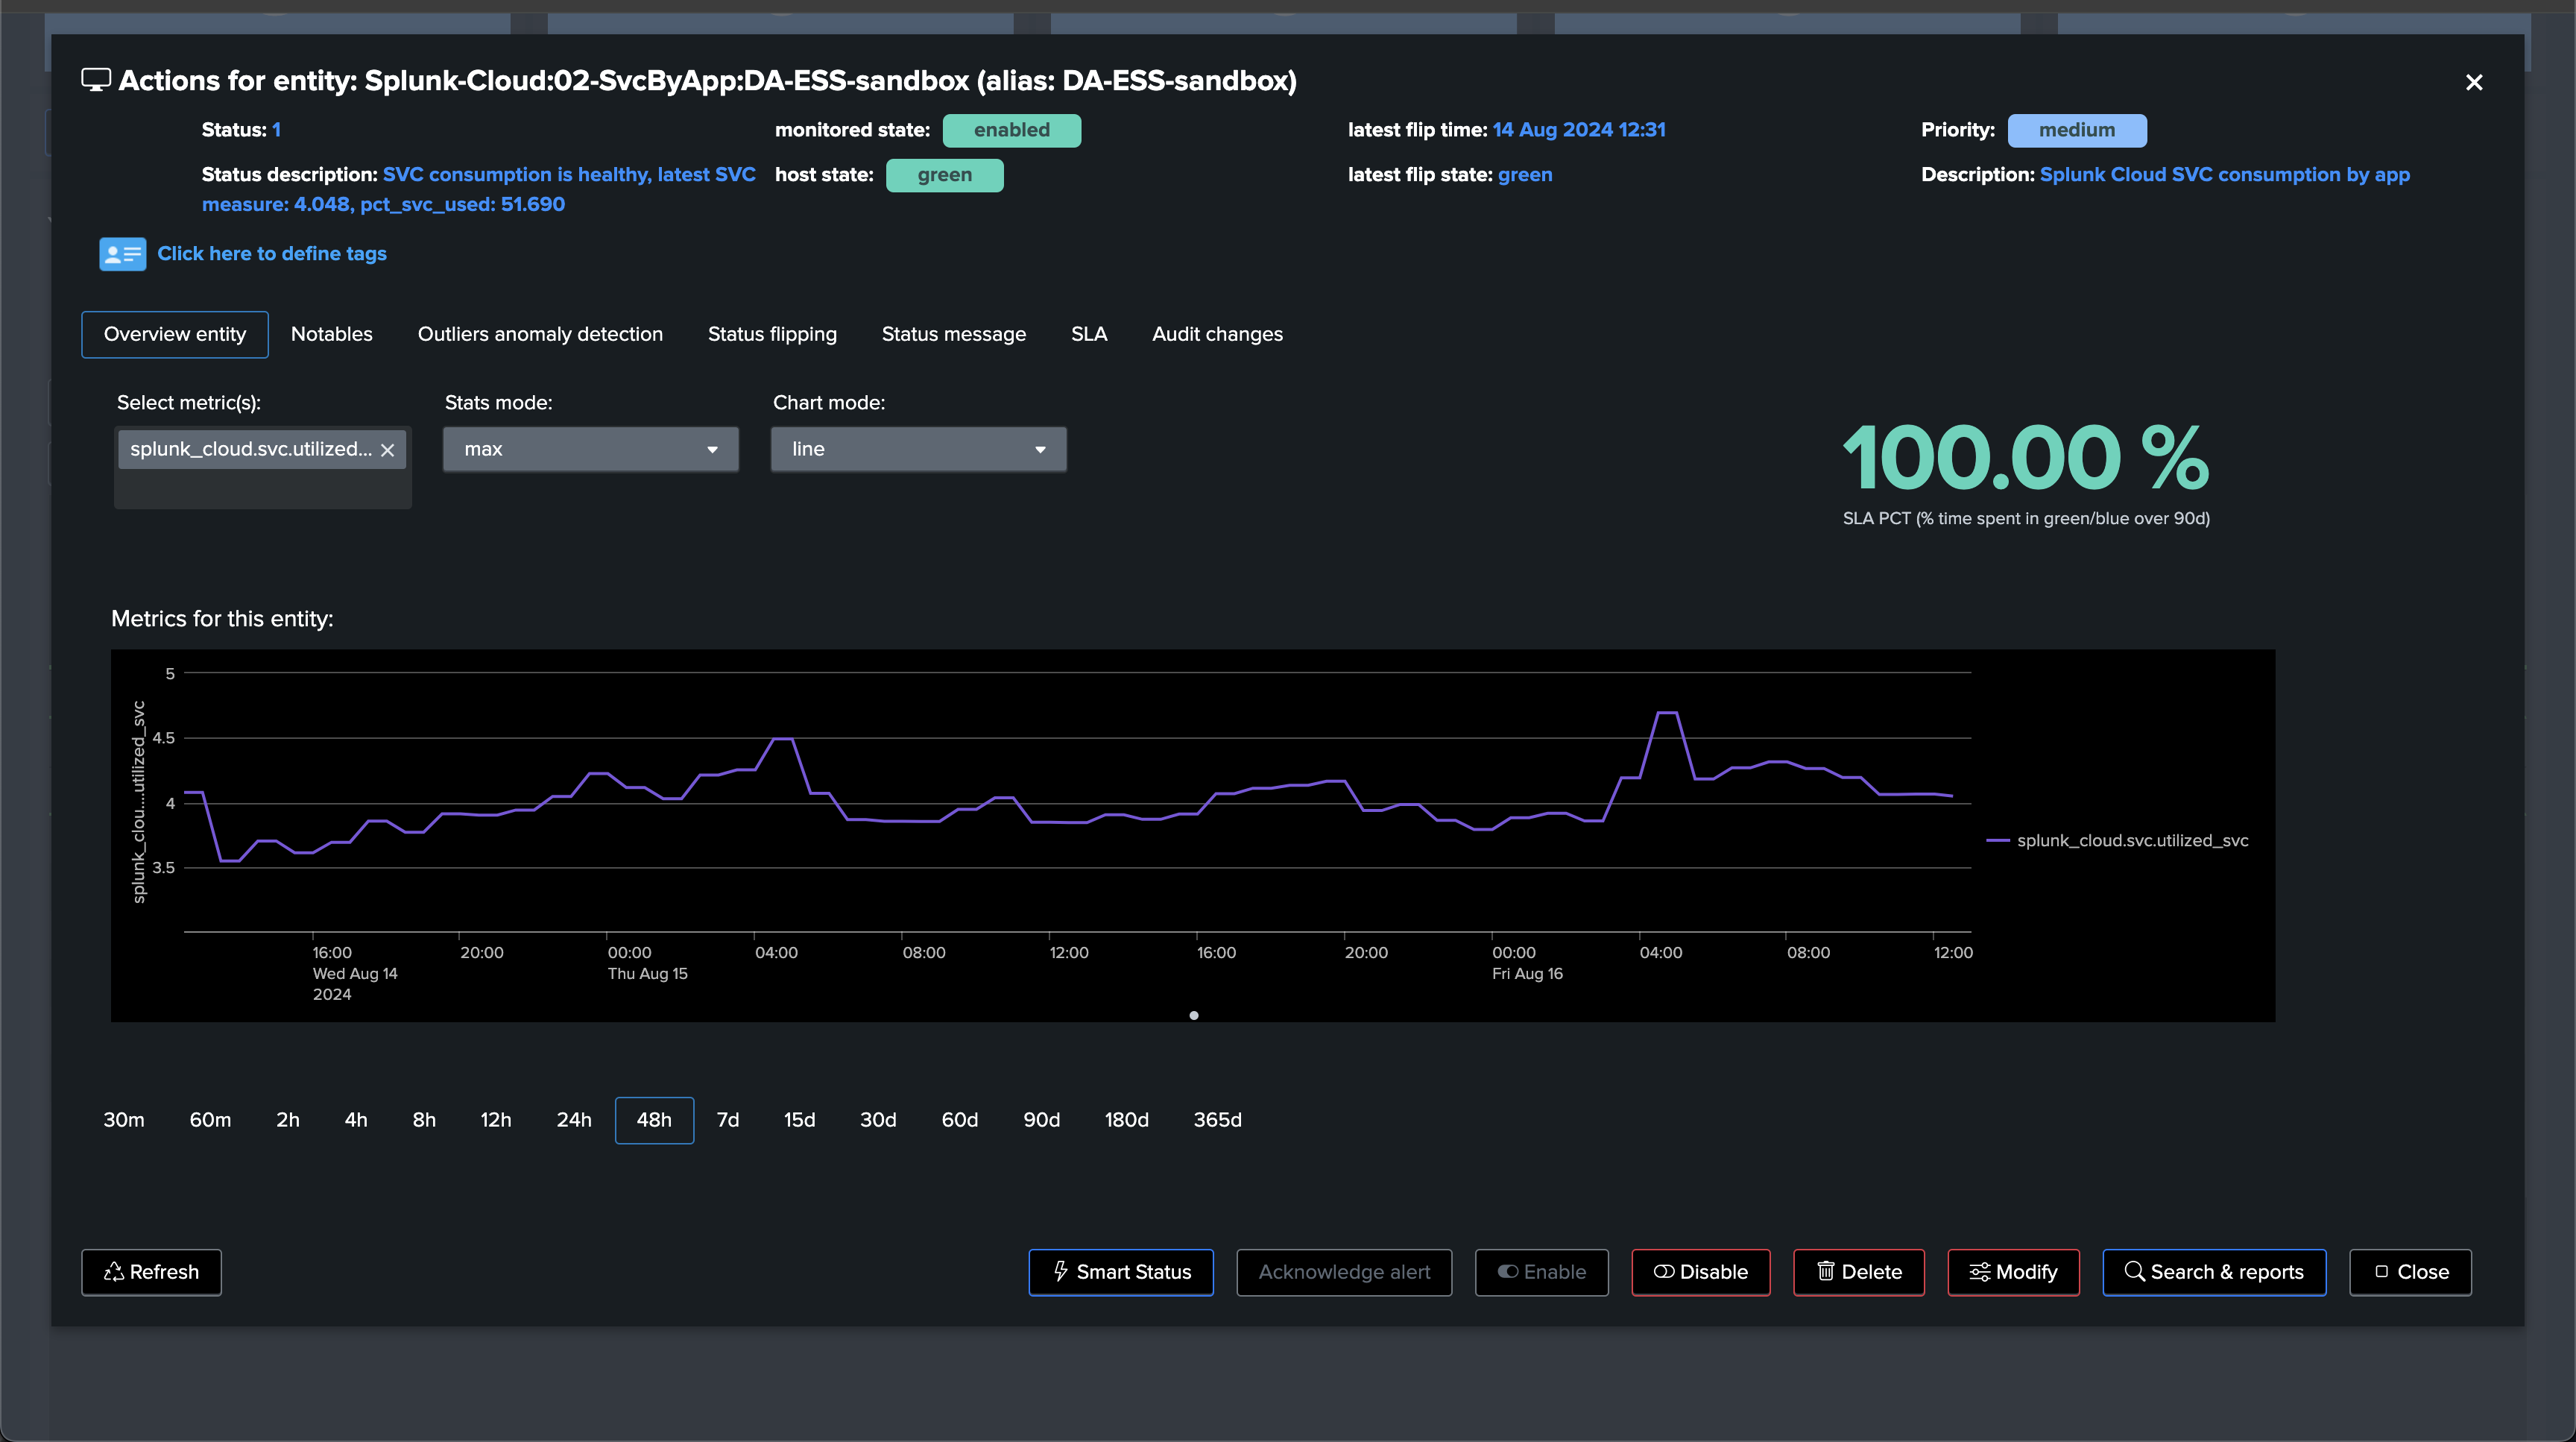
After some time, this will be look like:
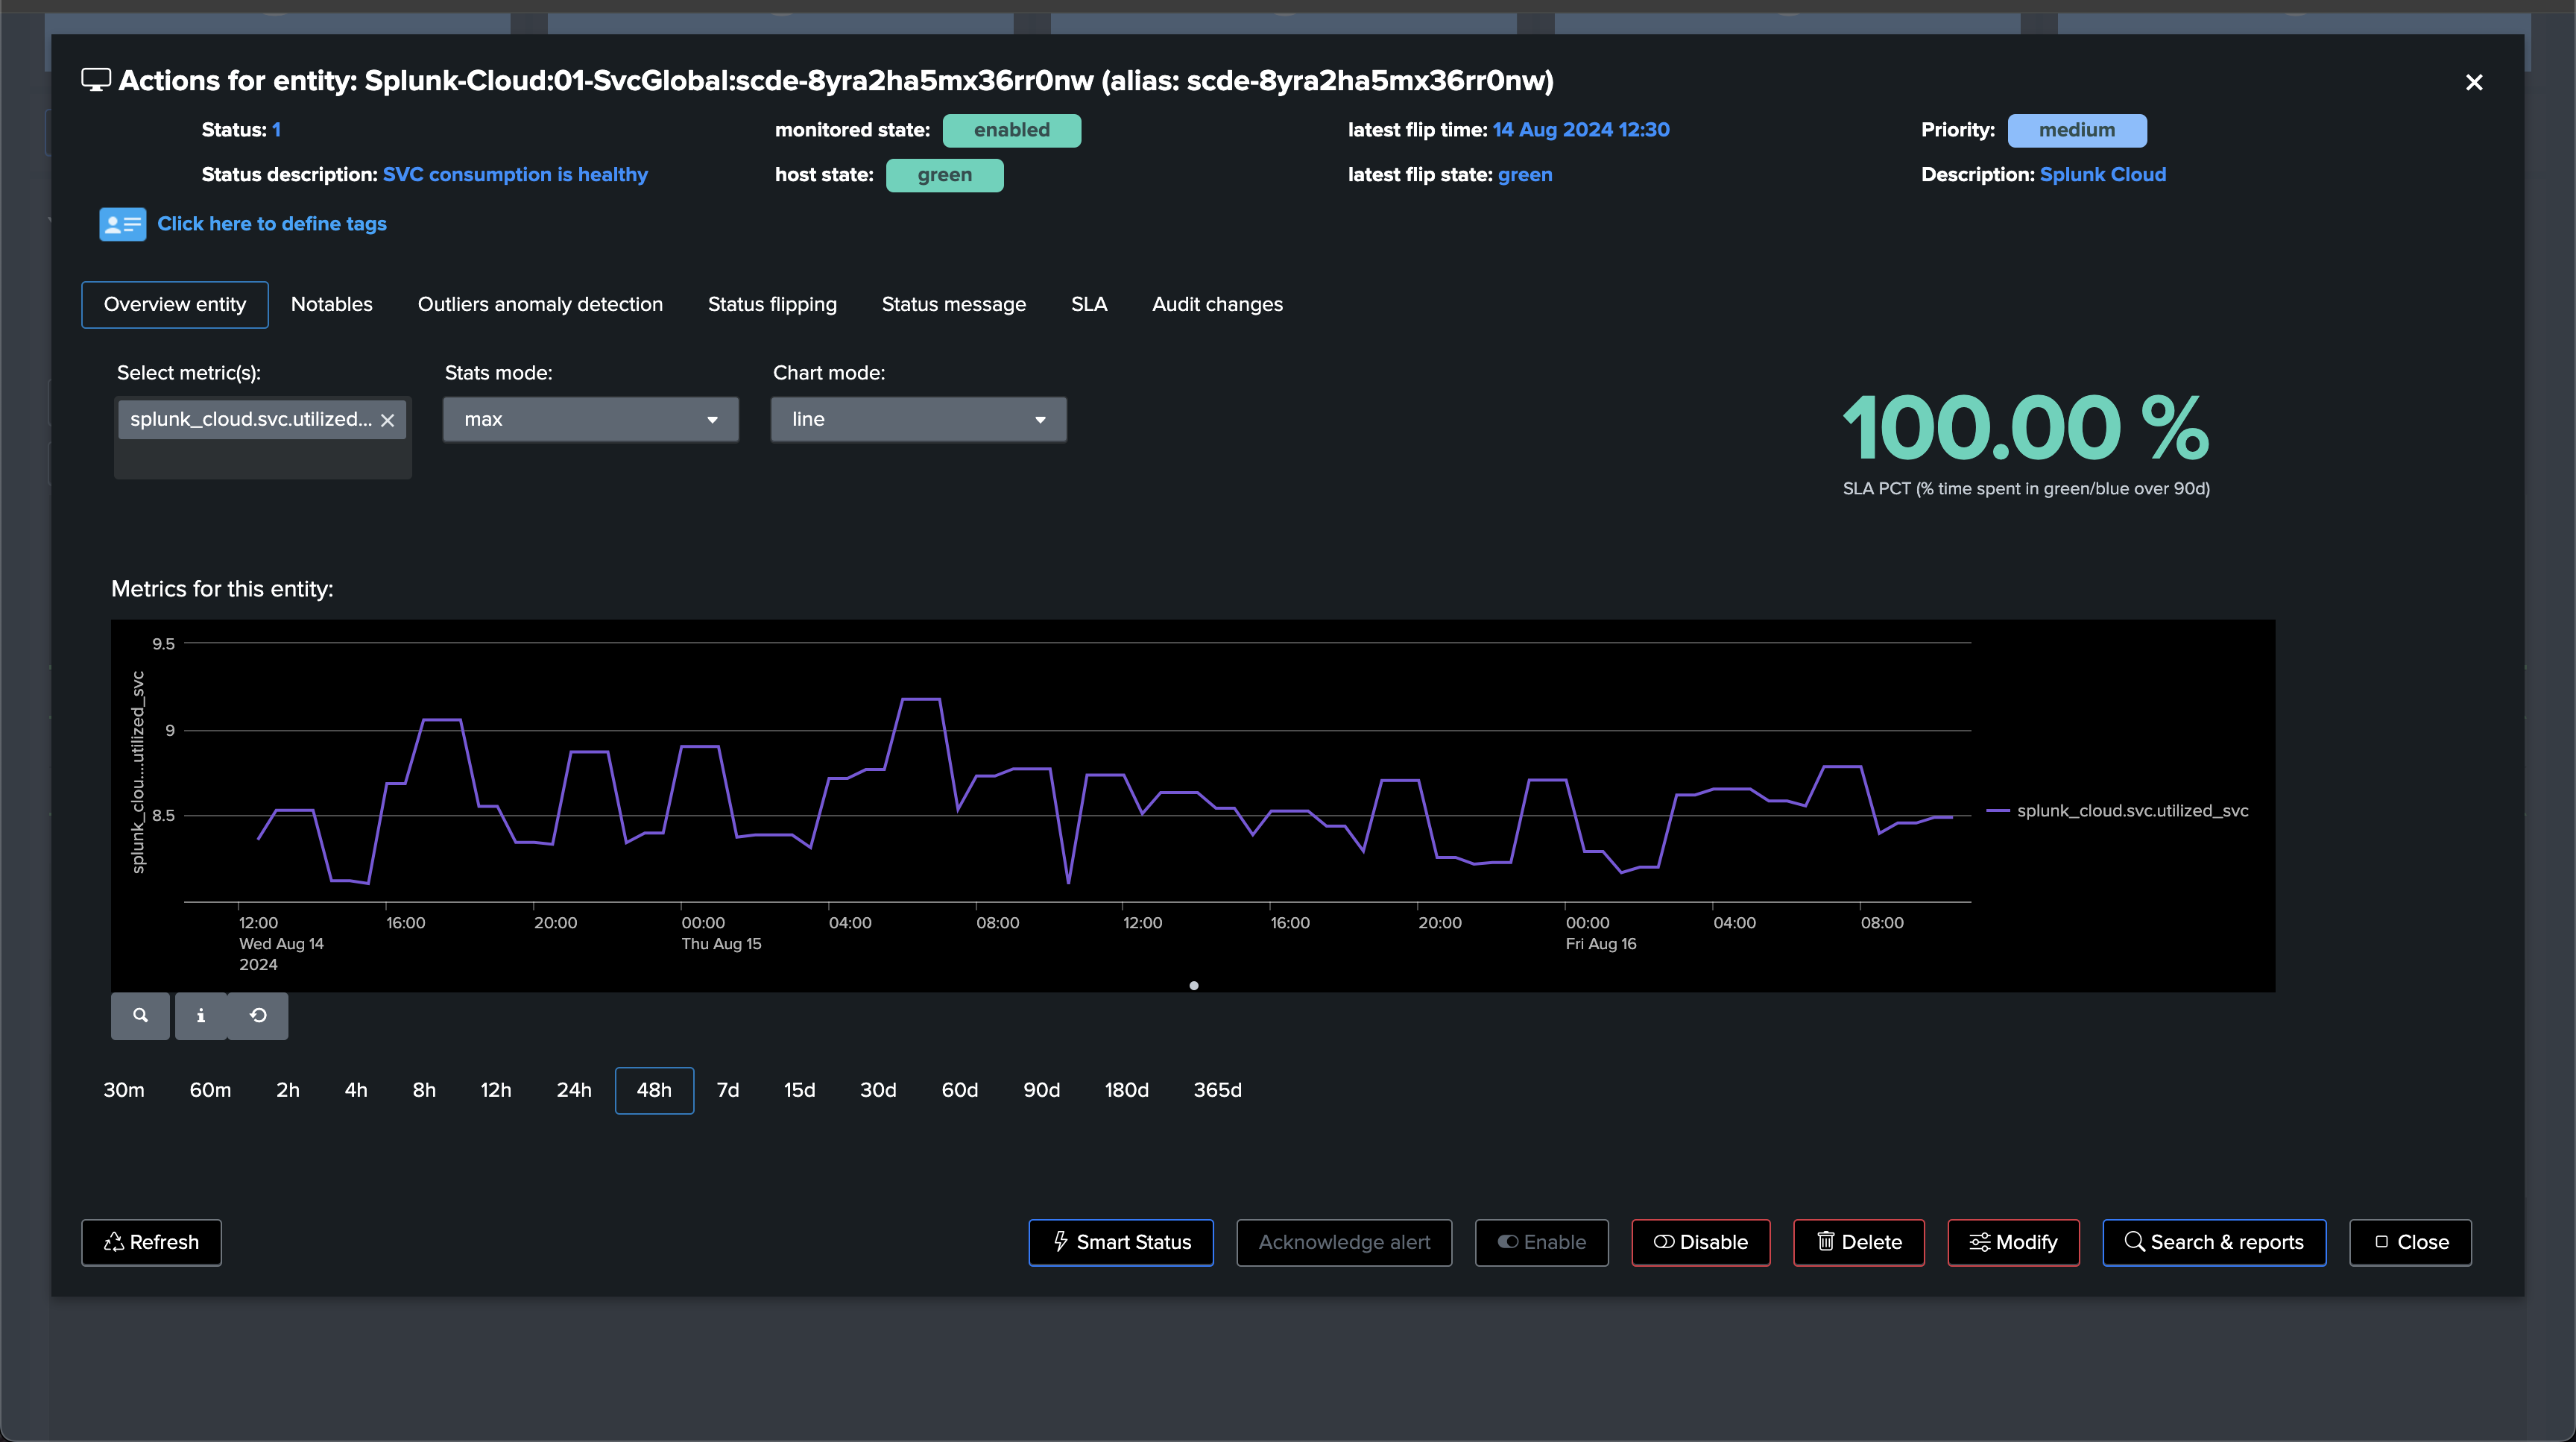
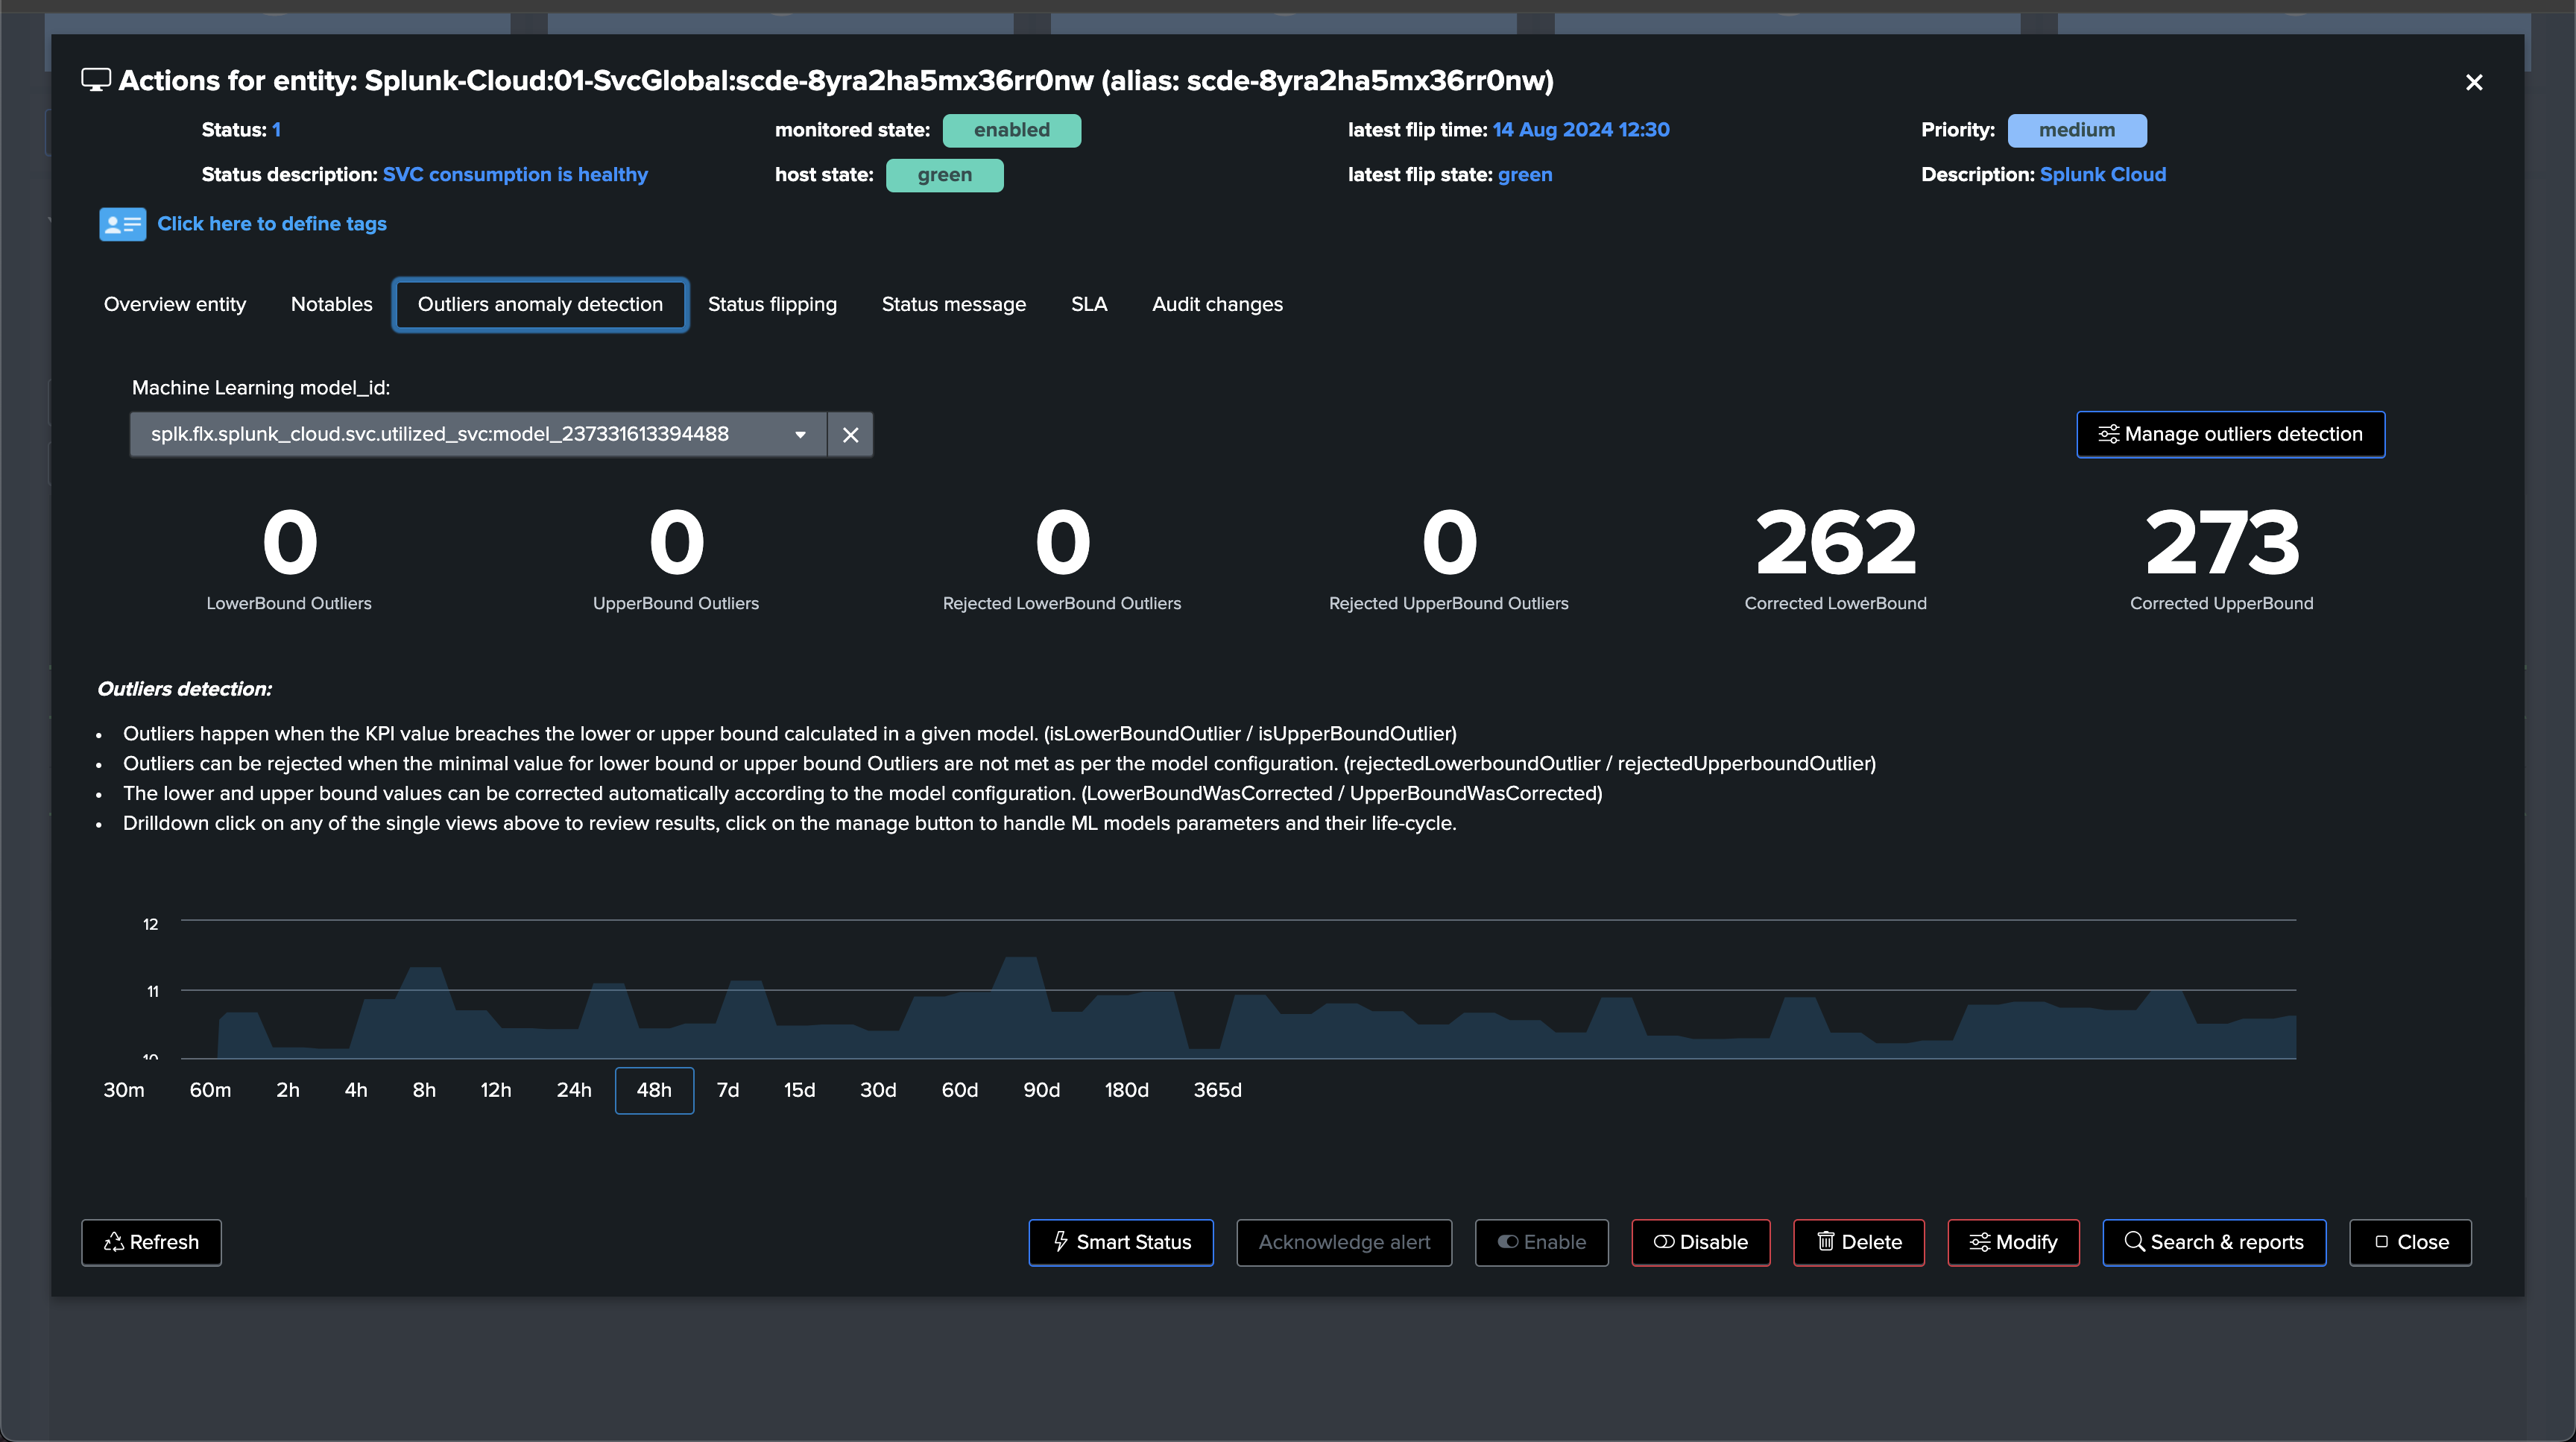
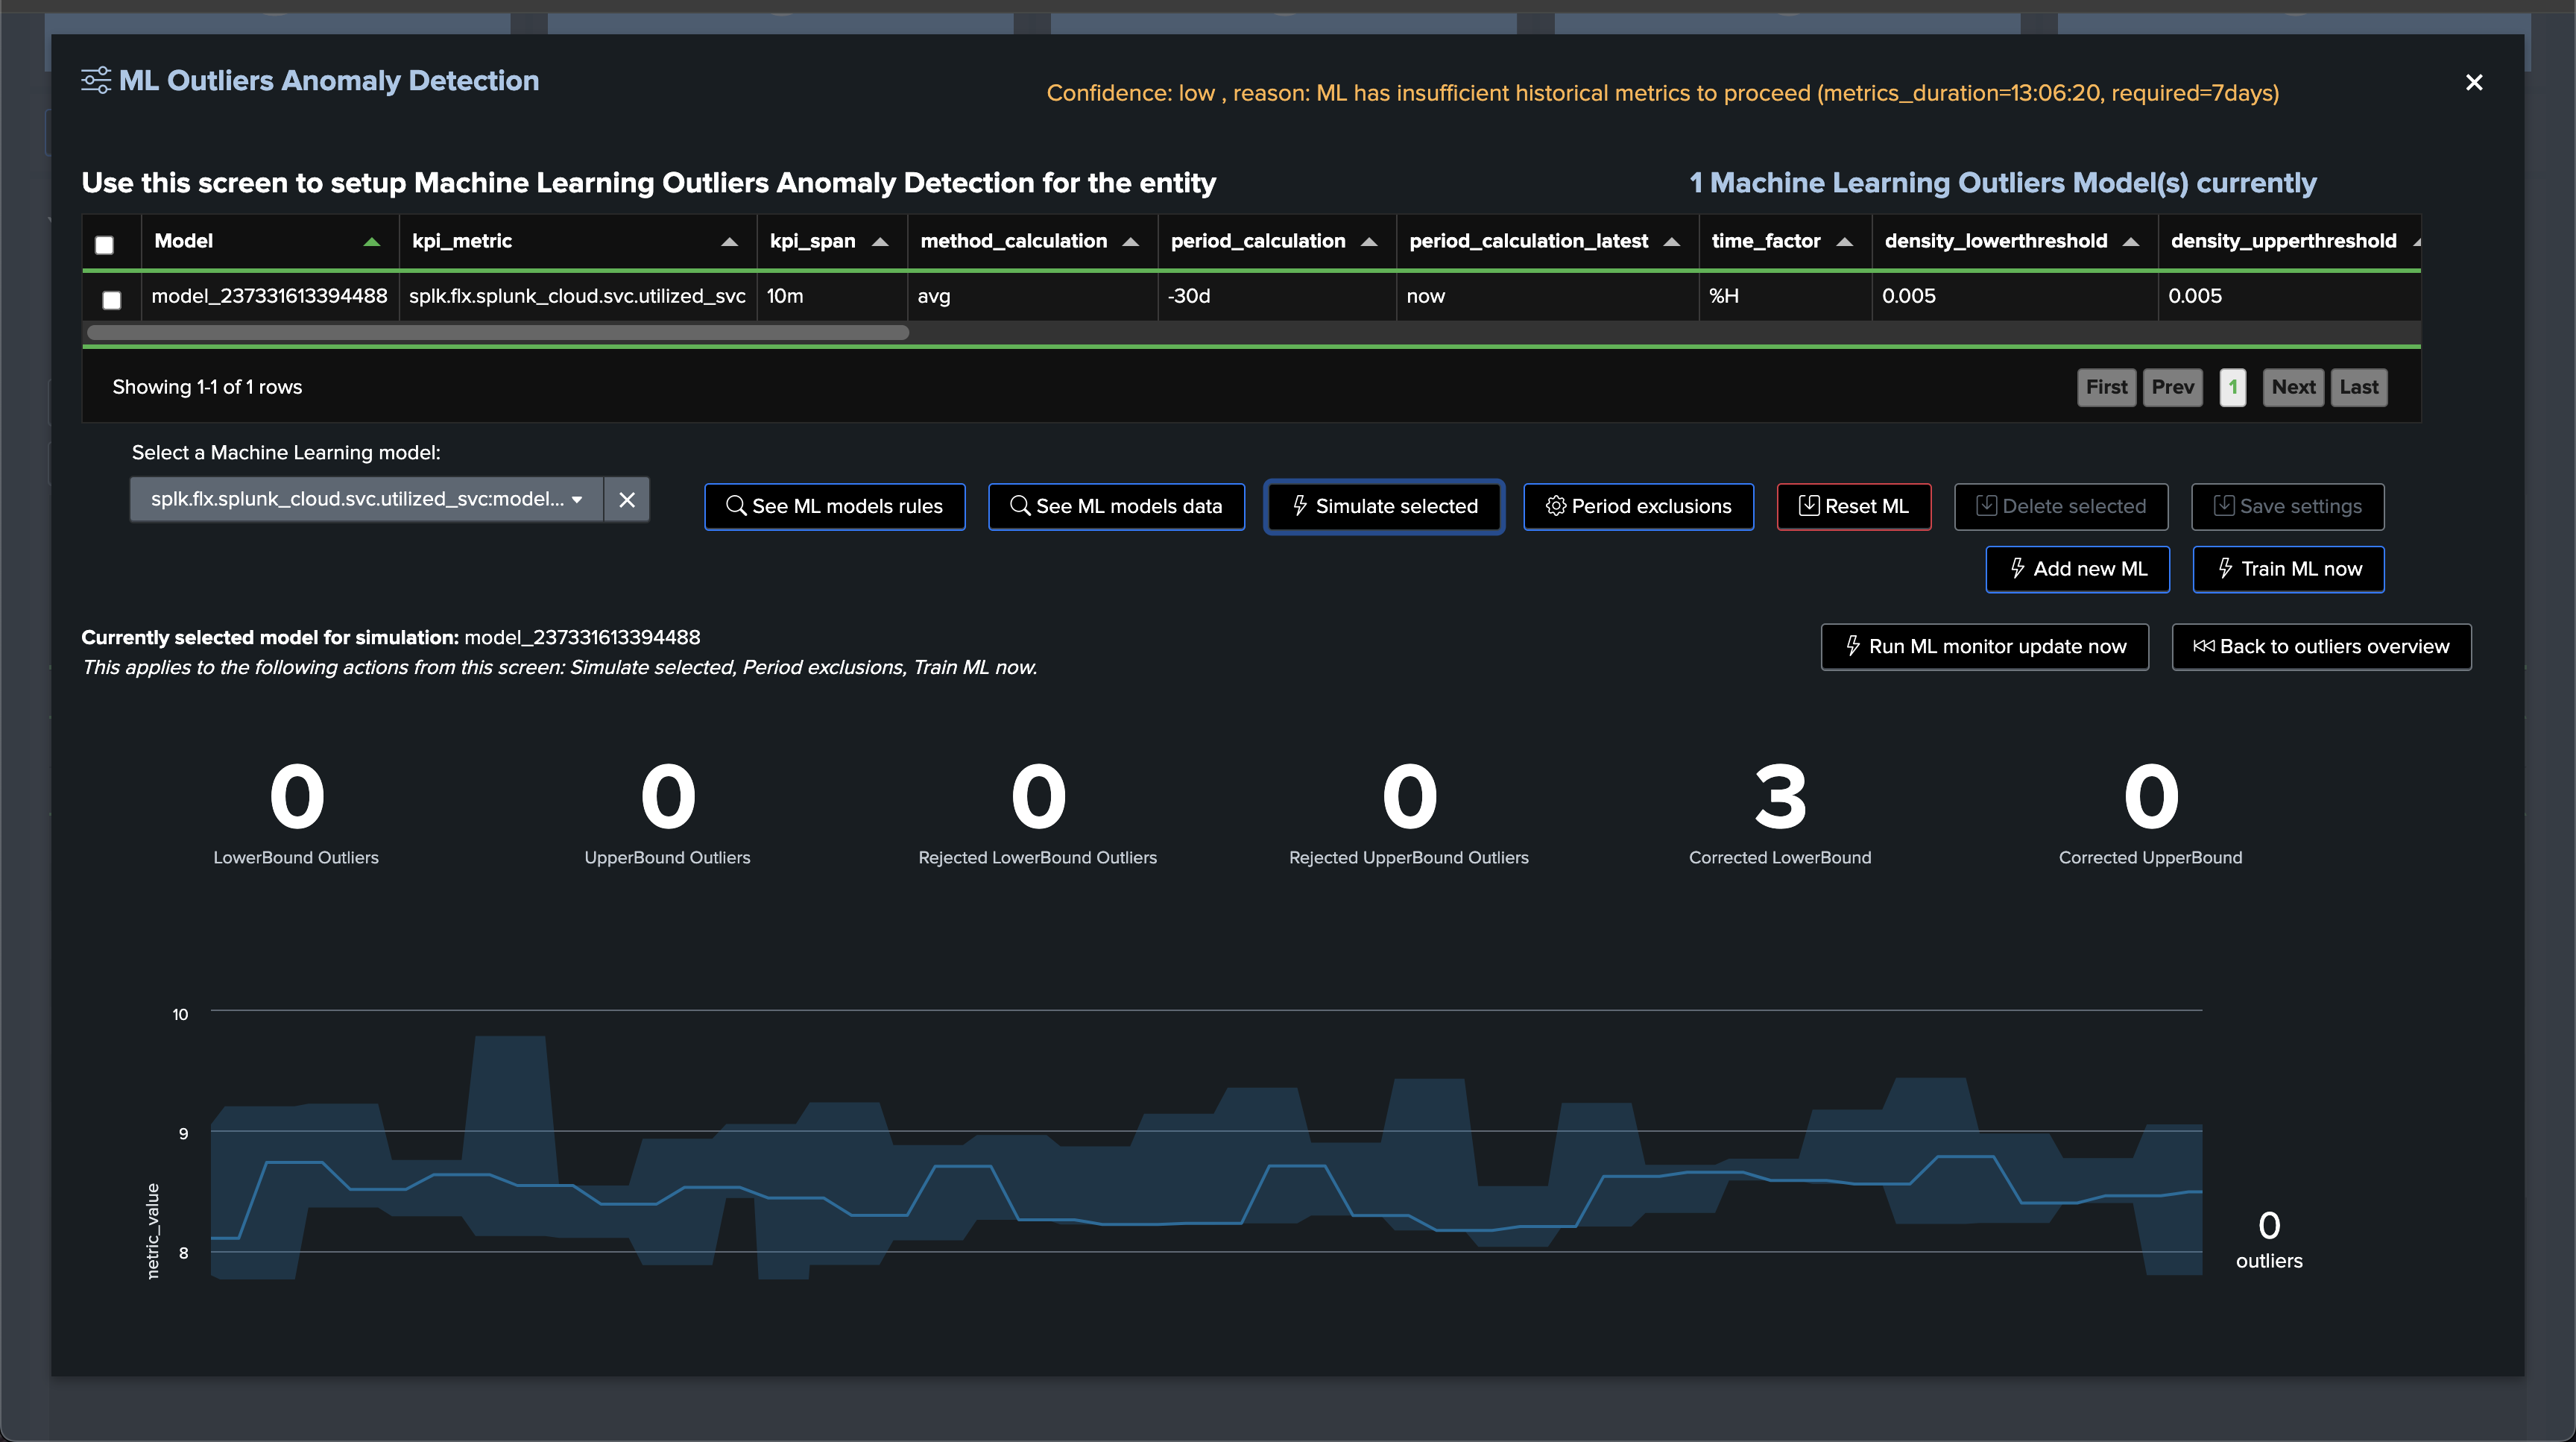
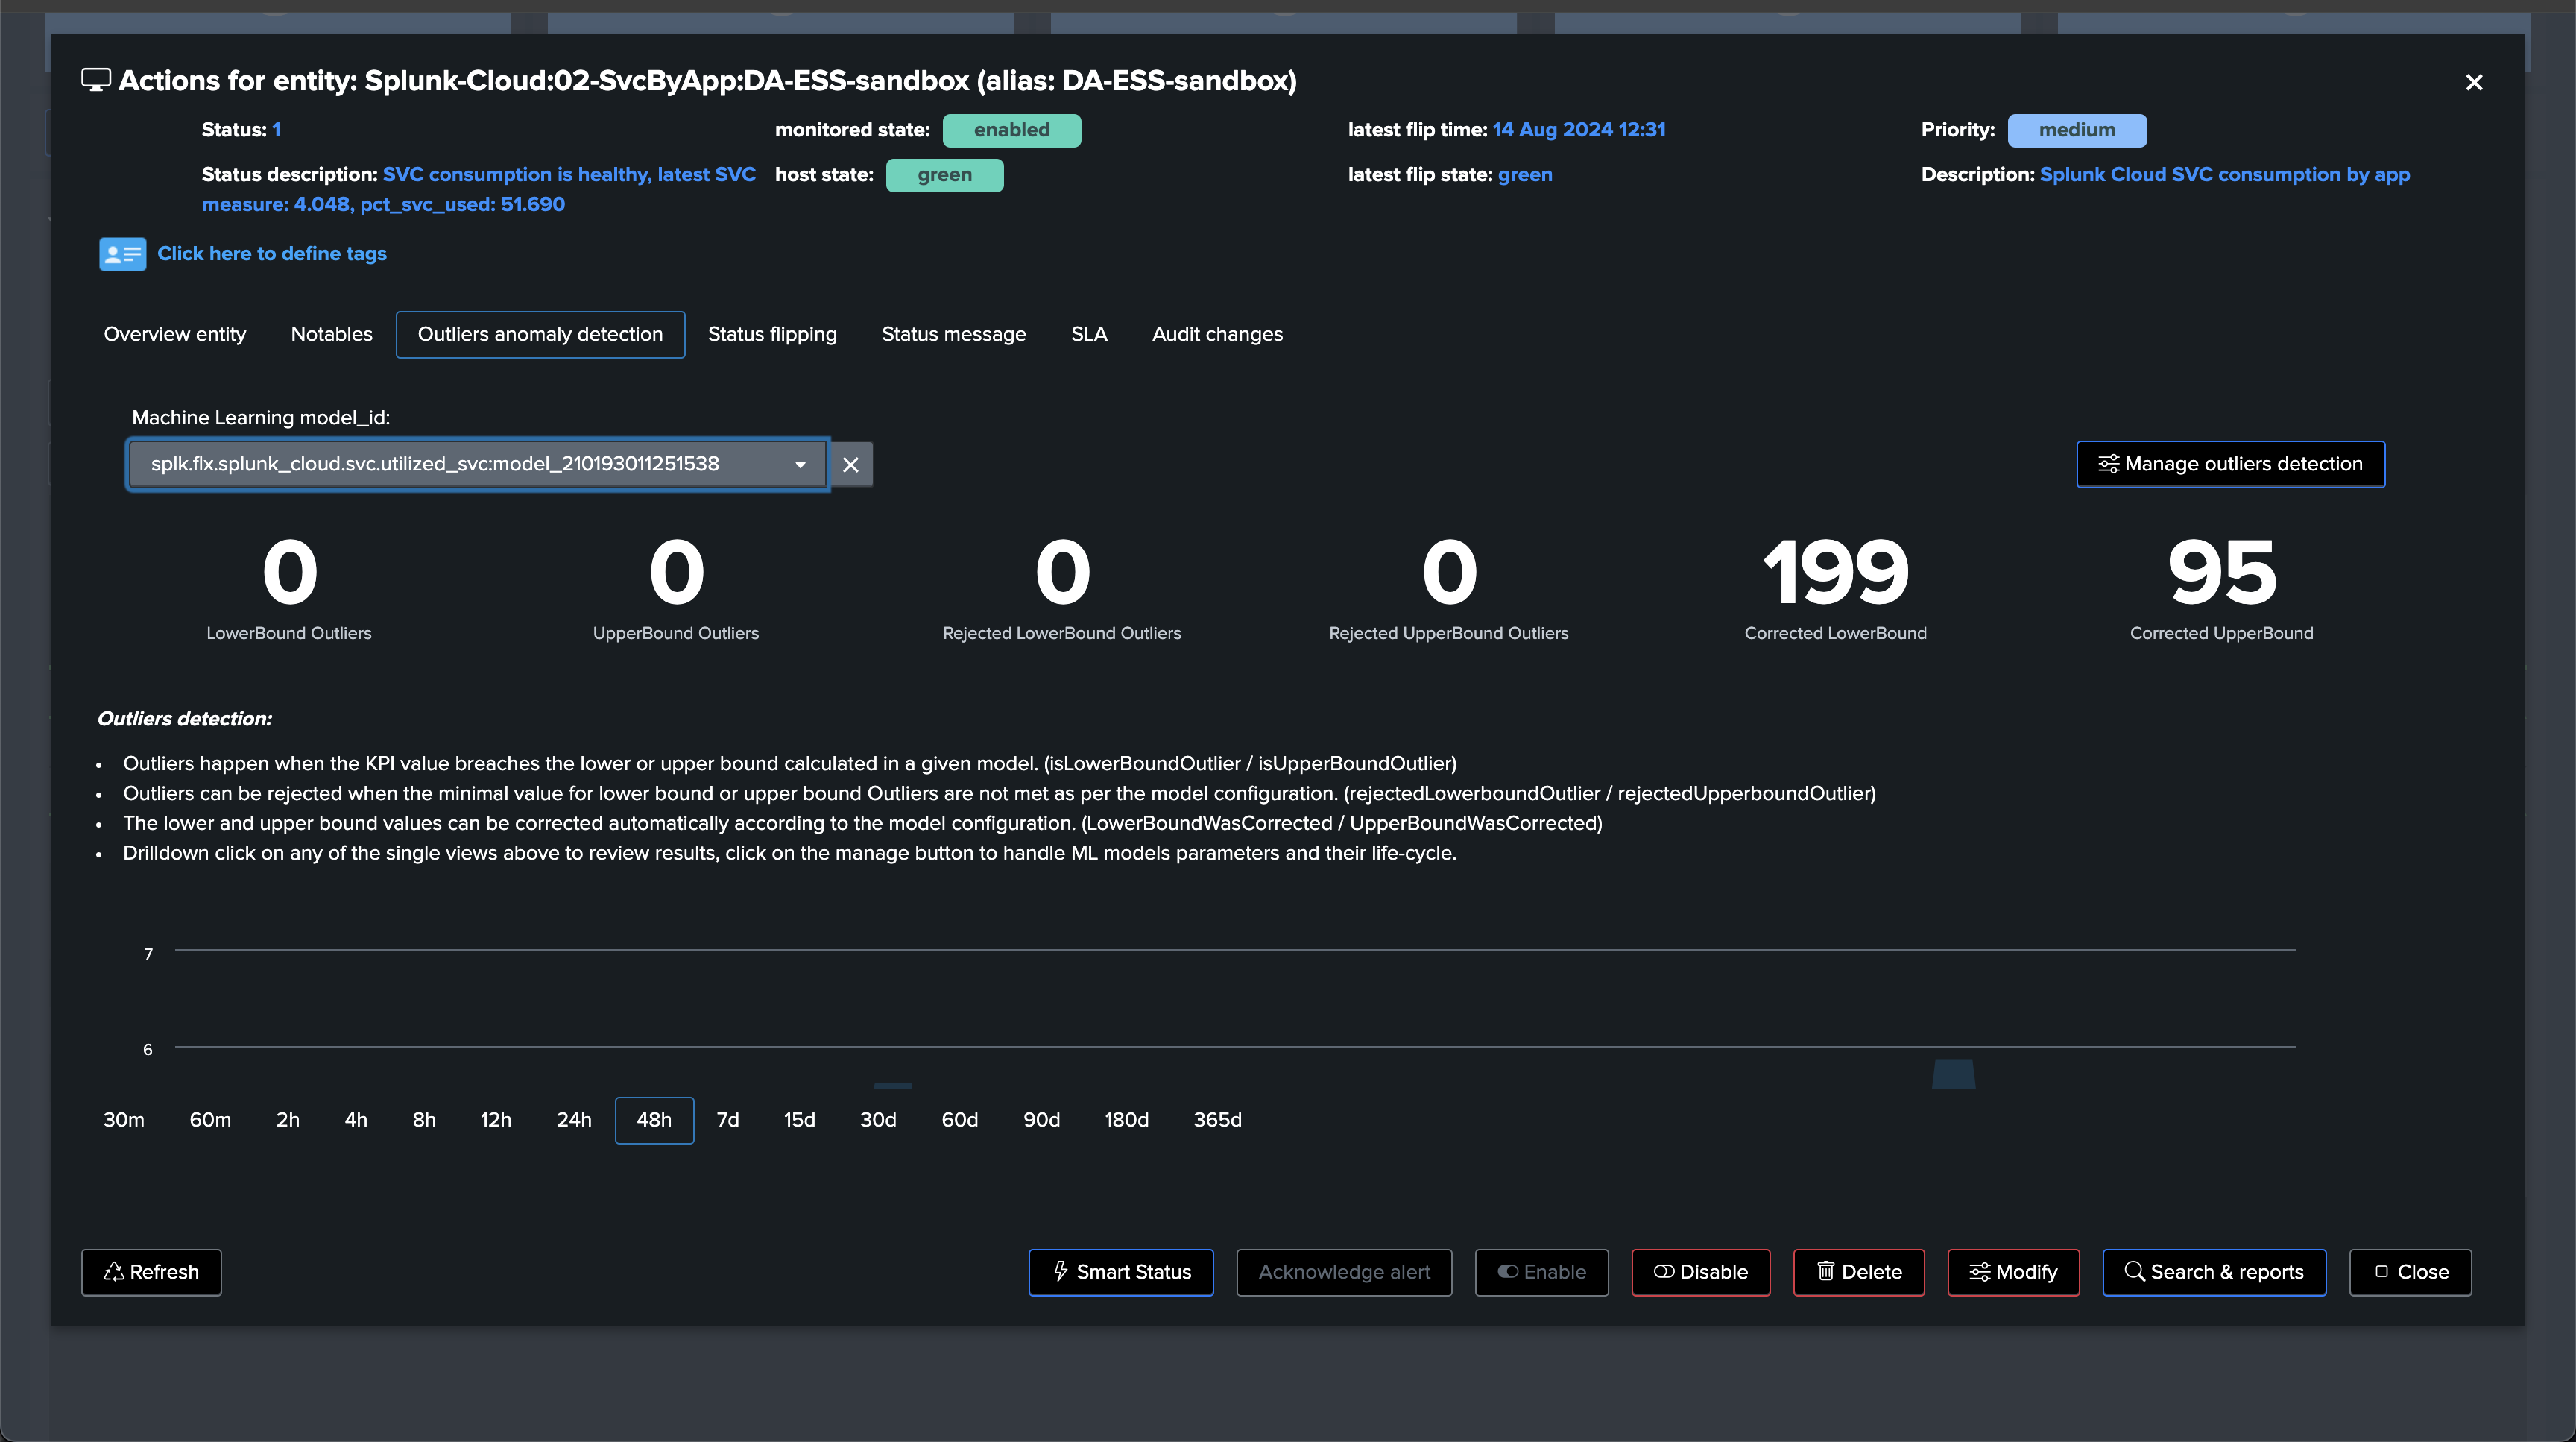
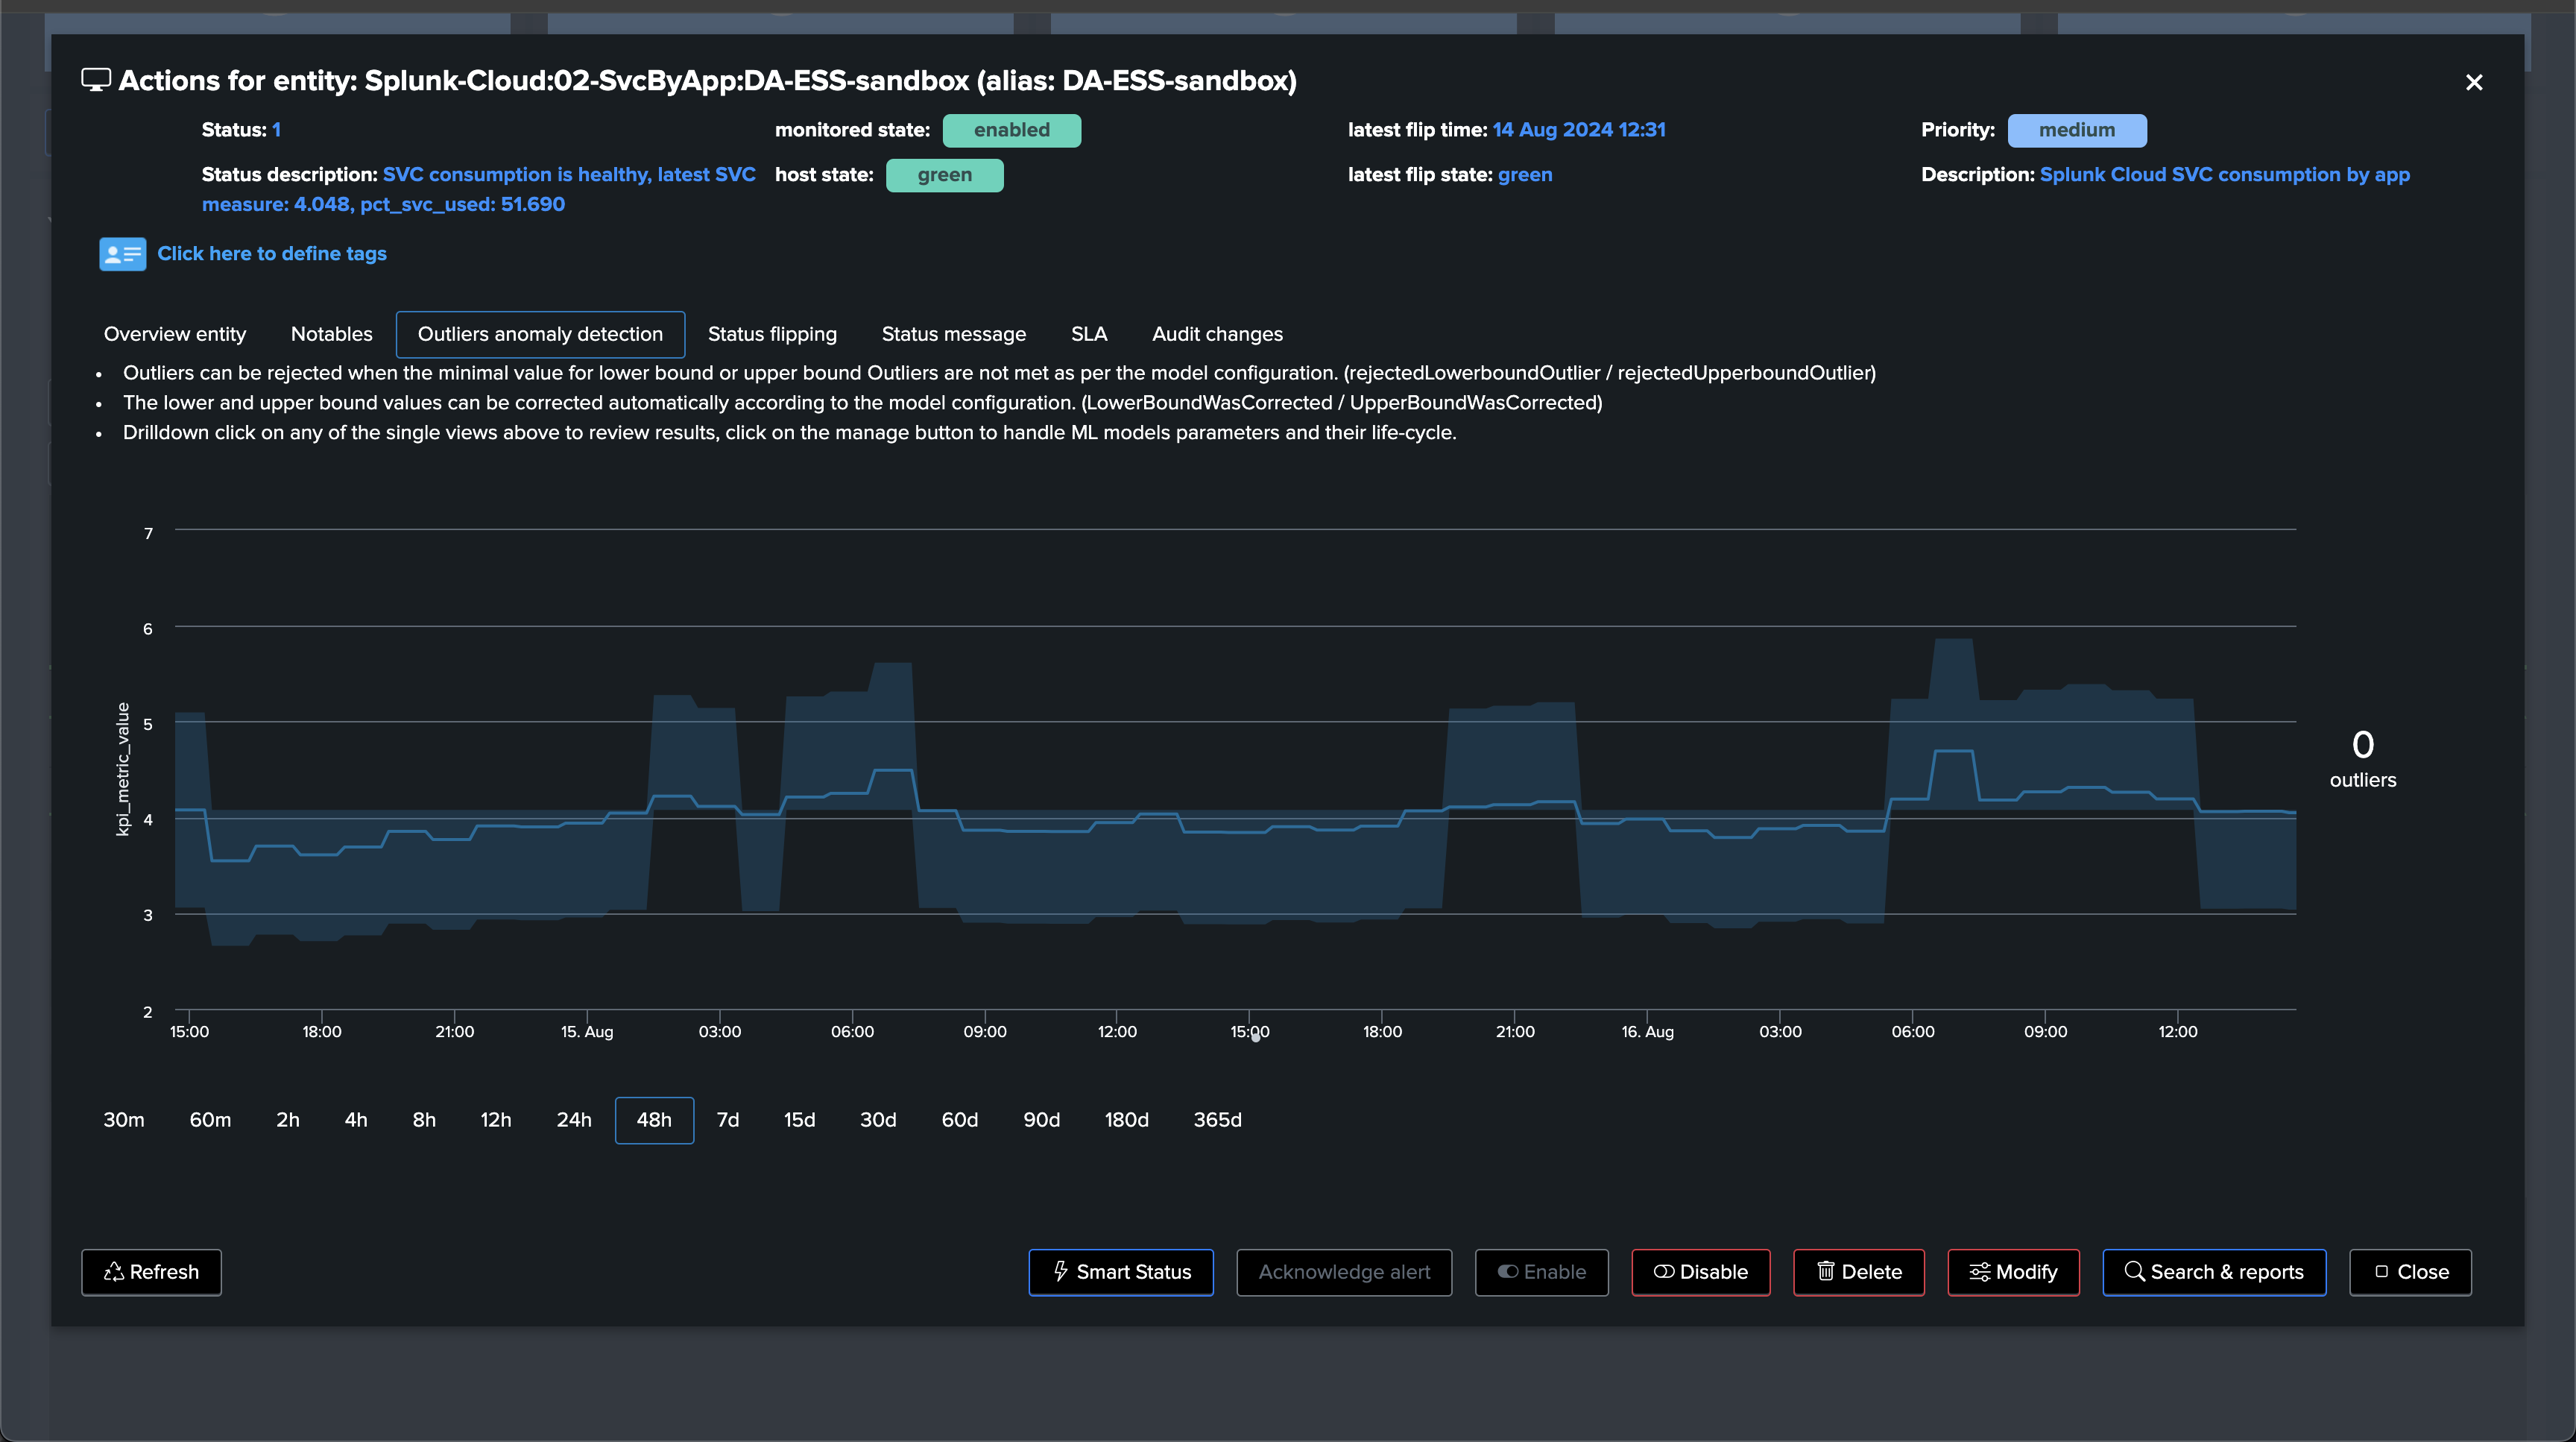
Looking at Outliers anomaly detection, the use case automatically created a model for SVC consumption based on the SVC units, it would eventually trigger an outlier alert if an increasing abnormal trend is detected:
TrackMe stack app consumer SVC consumption
Similarly, we can now leverage the second out of the box Flex Object use case to monitor the SVC consumption at the app level:
Once created and executed, this use case tracks the SVC consumption by the app consumer as registered by the SVC consumption KPIS:
The same SVC KPI is leveraged per consumer:
After some time, once we have started to collect enough historical knowledge:
Anomaly Outliers detection:
From this stage, if a consumer starts to abnormally consume SVC, TrackMe’s Outlier detection will eventually trigger an alert.
Accessing TrackMe’s metrics and building your own dashboards and reports
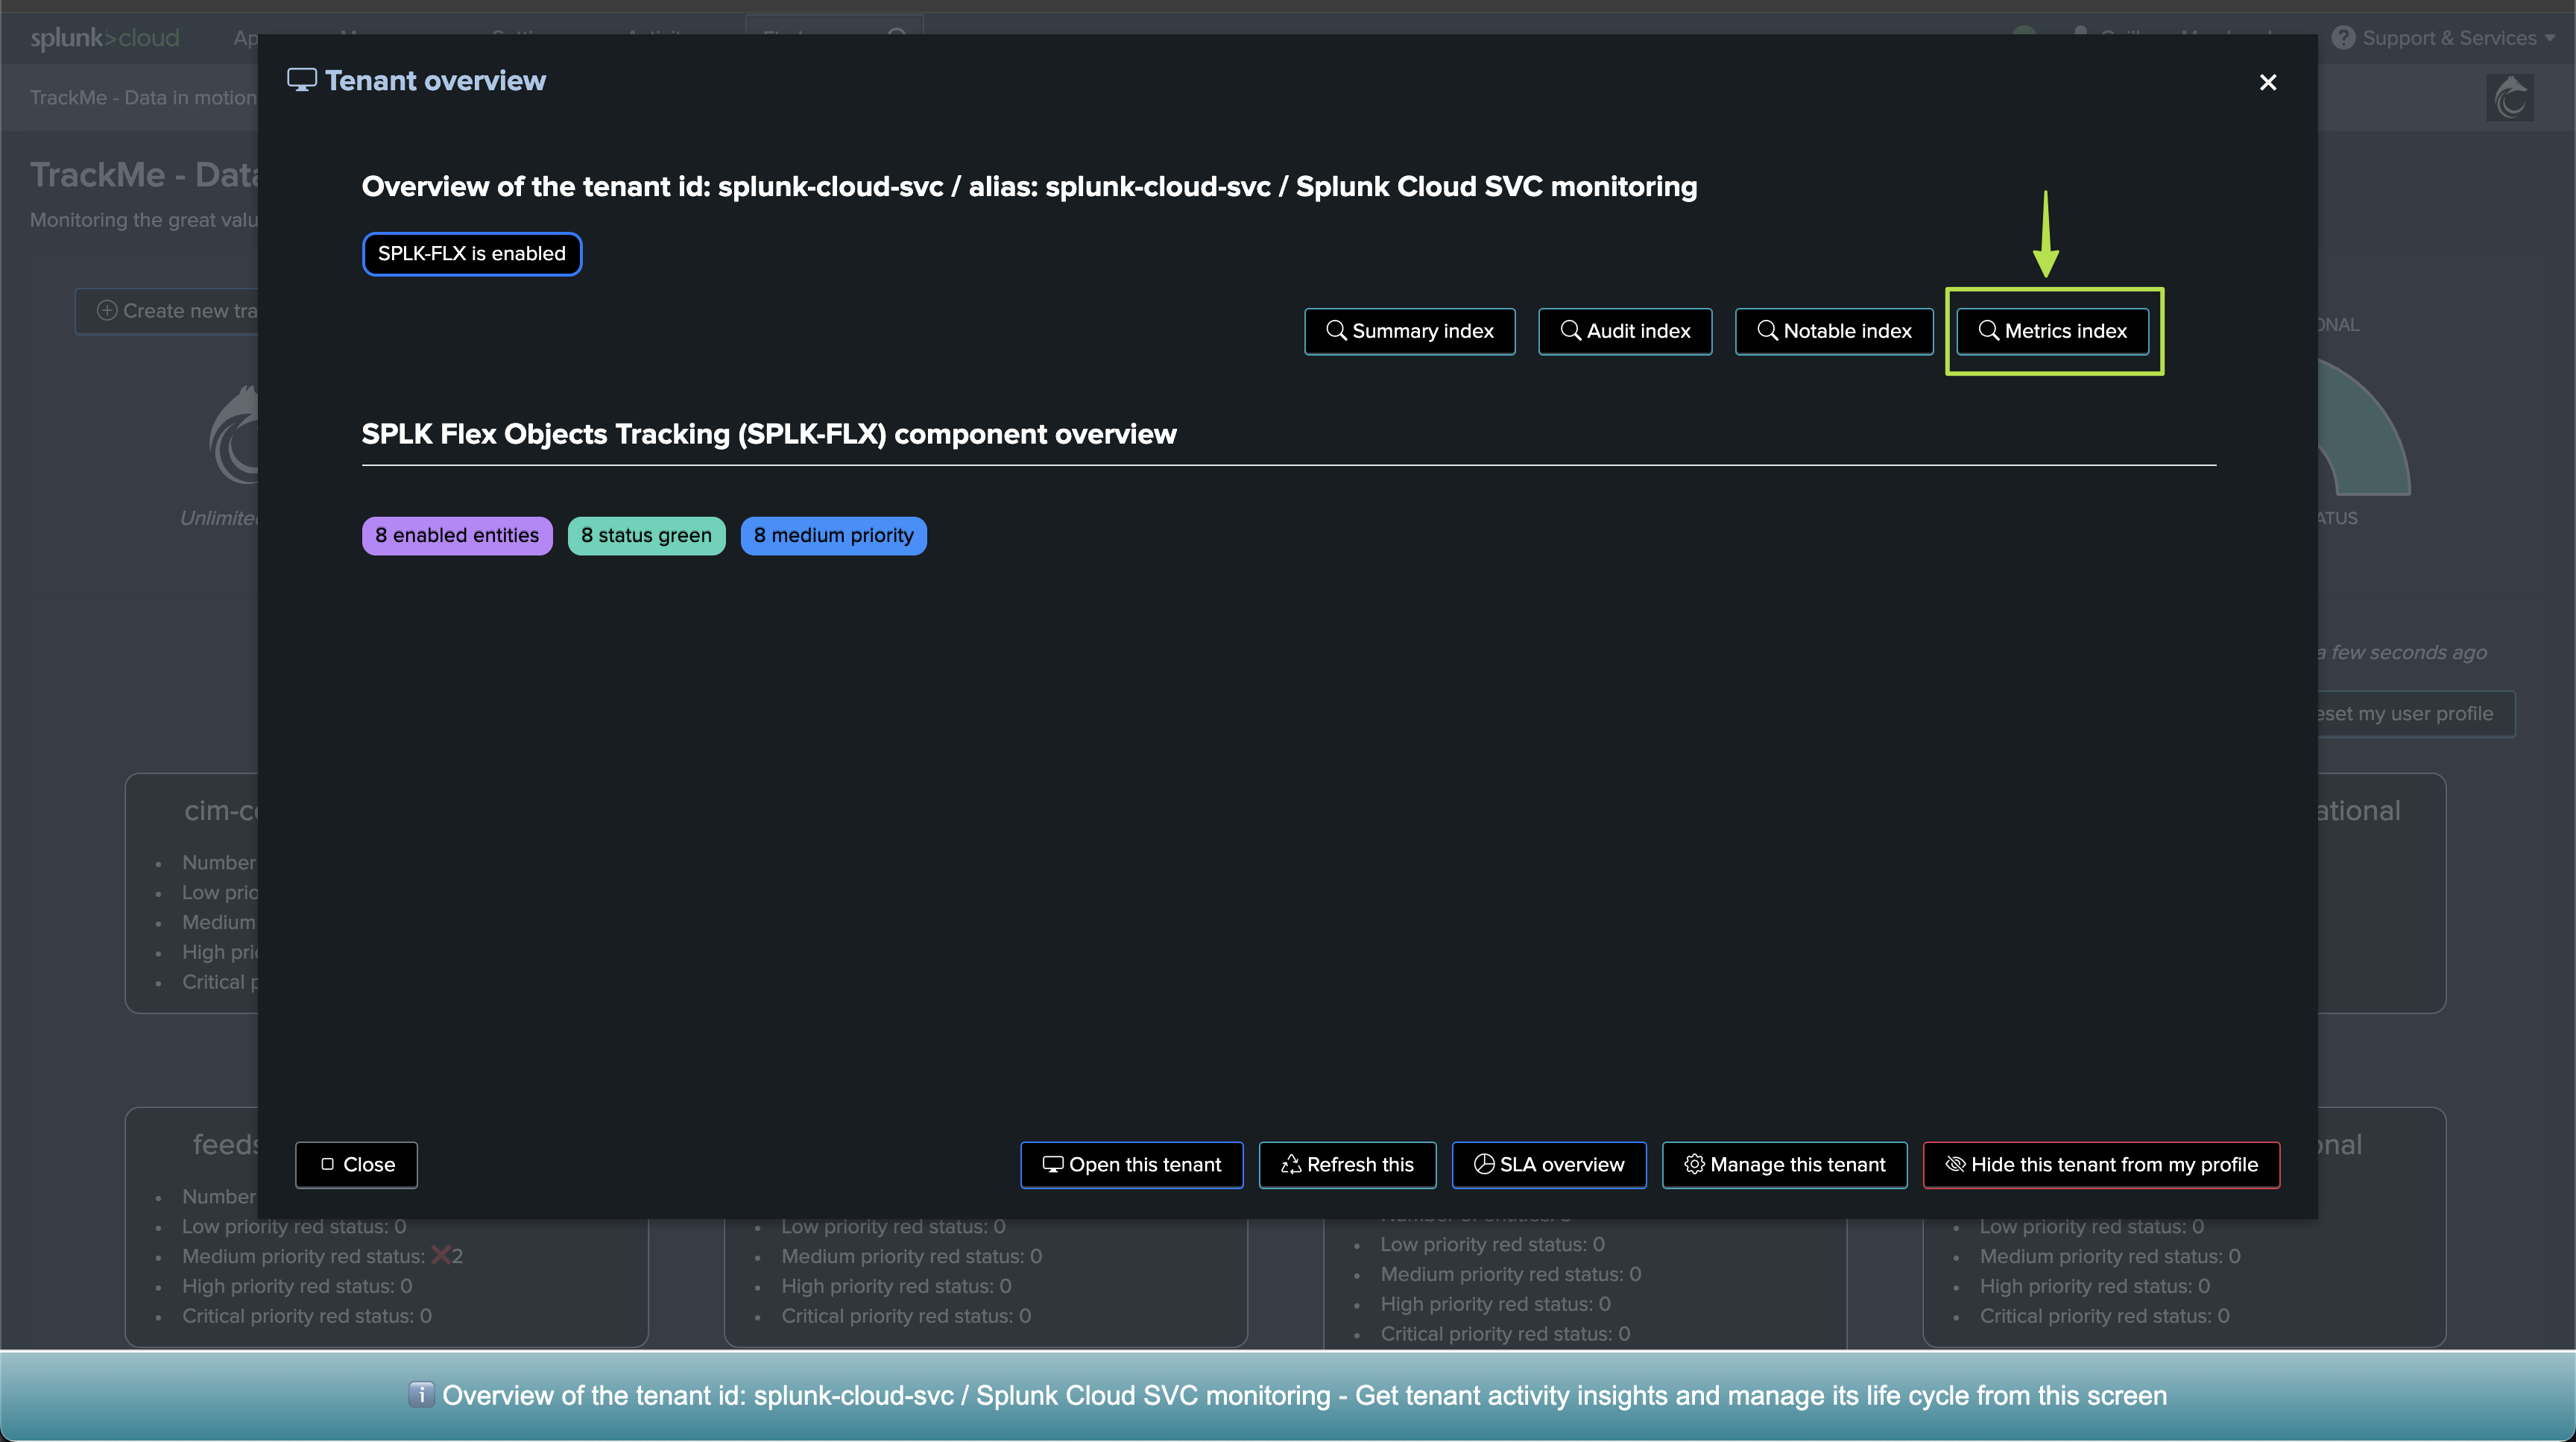
You can easily access to the metrics collected for a given TrackMe Virtual Tenant from the Virtual Tenant home UI:
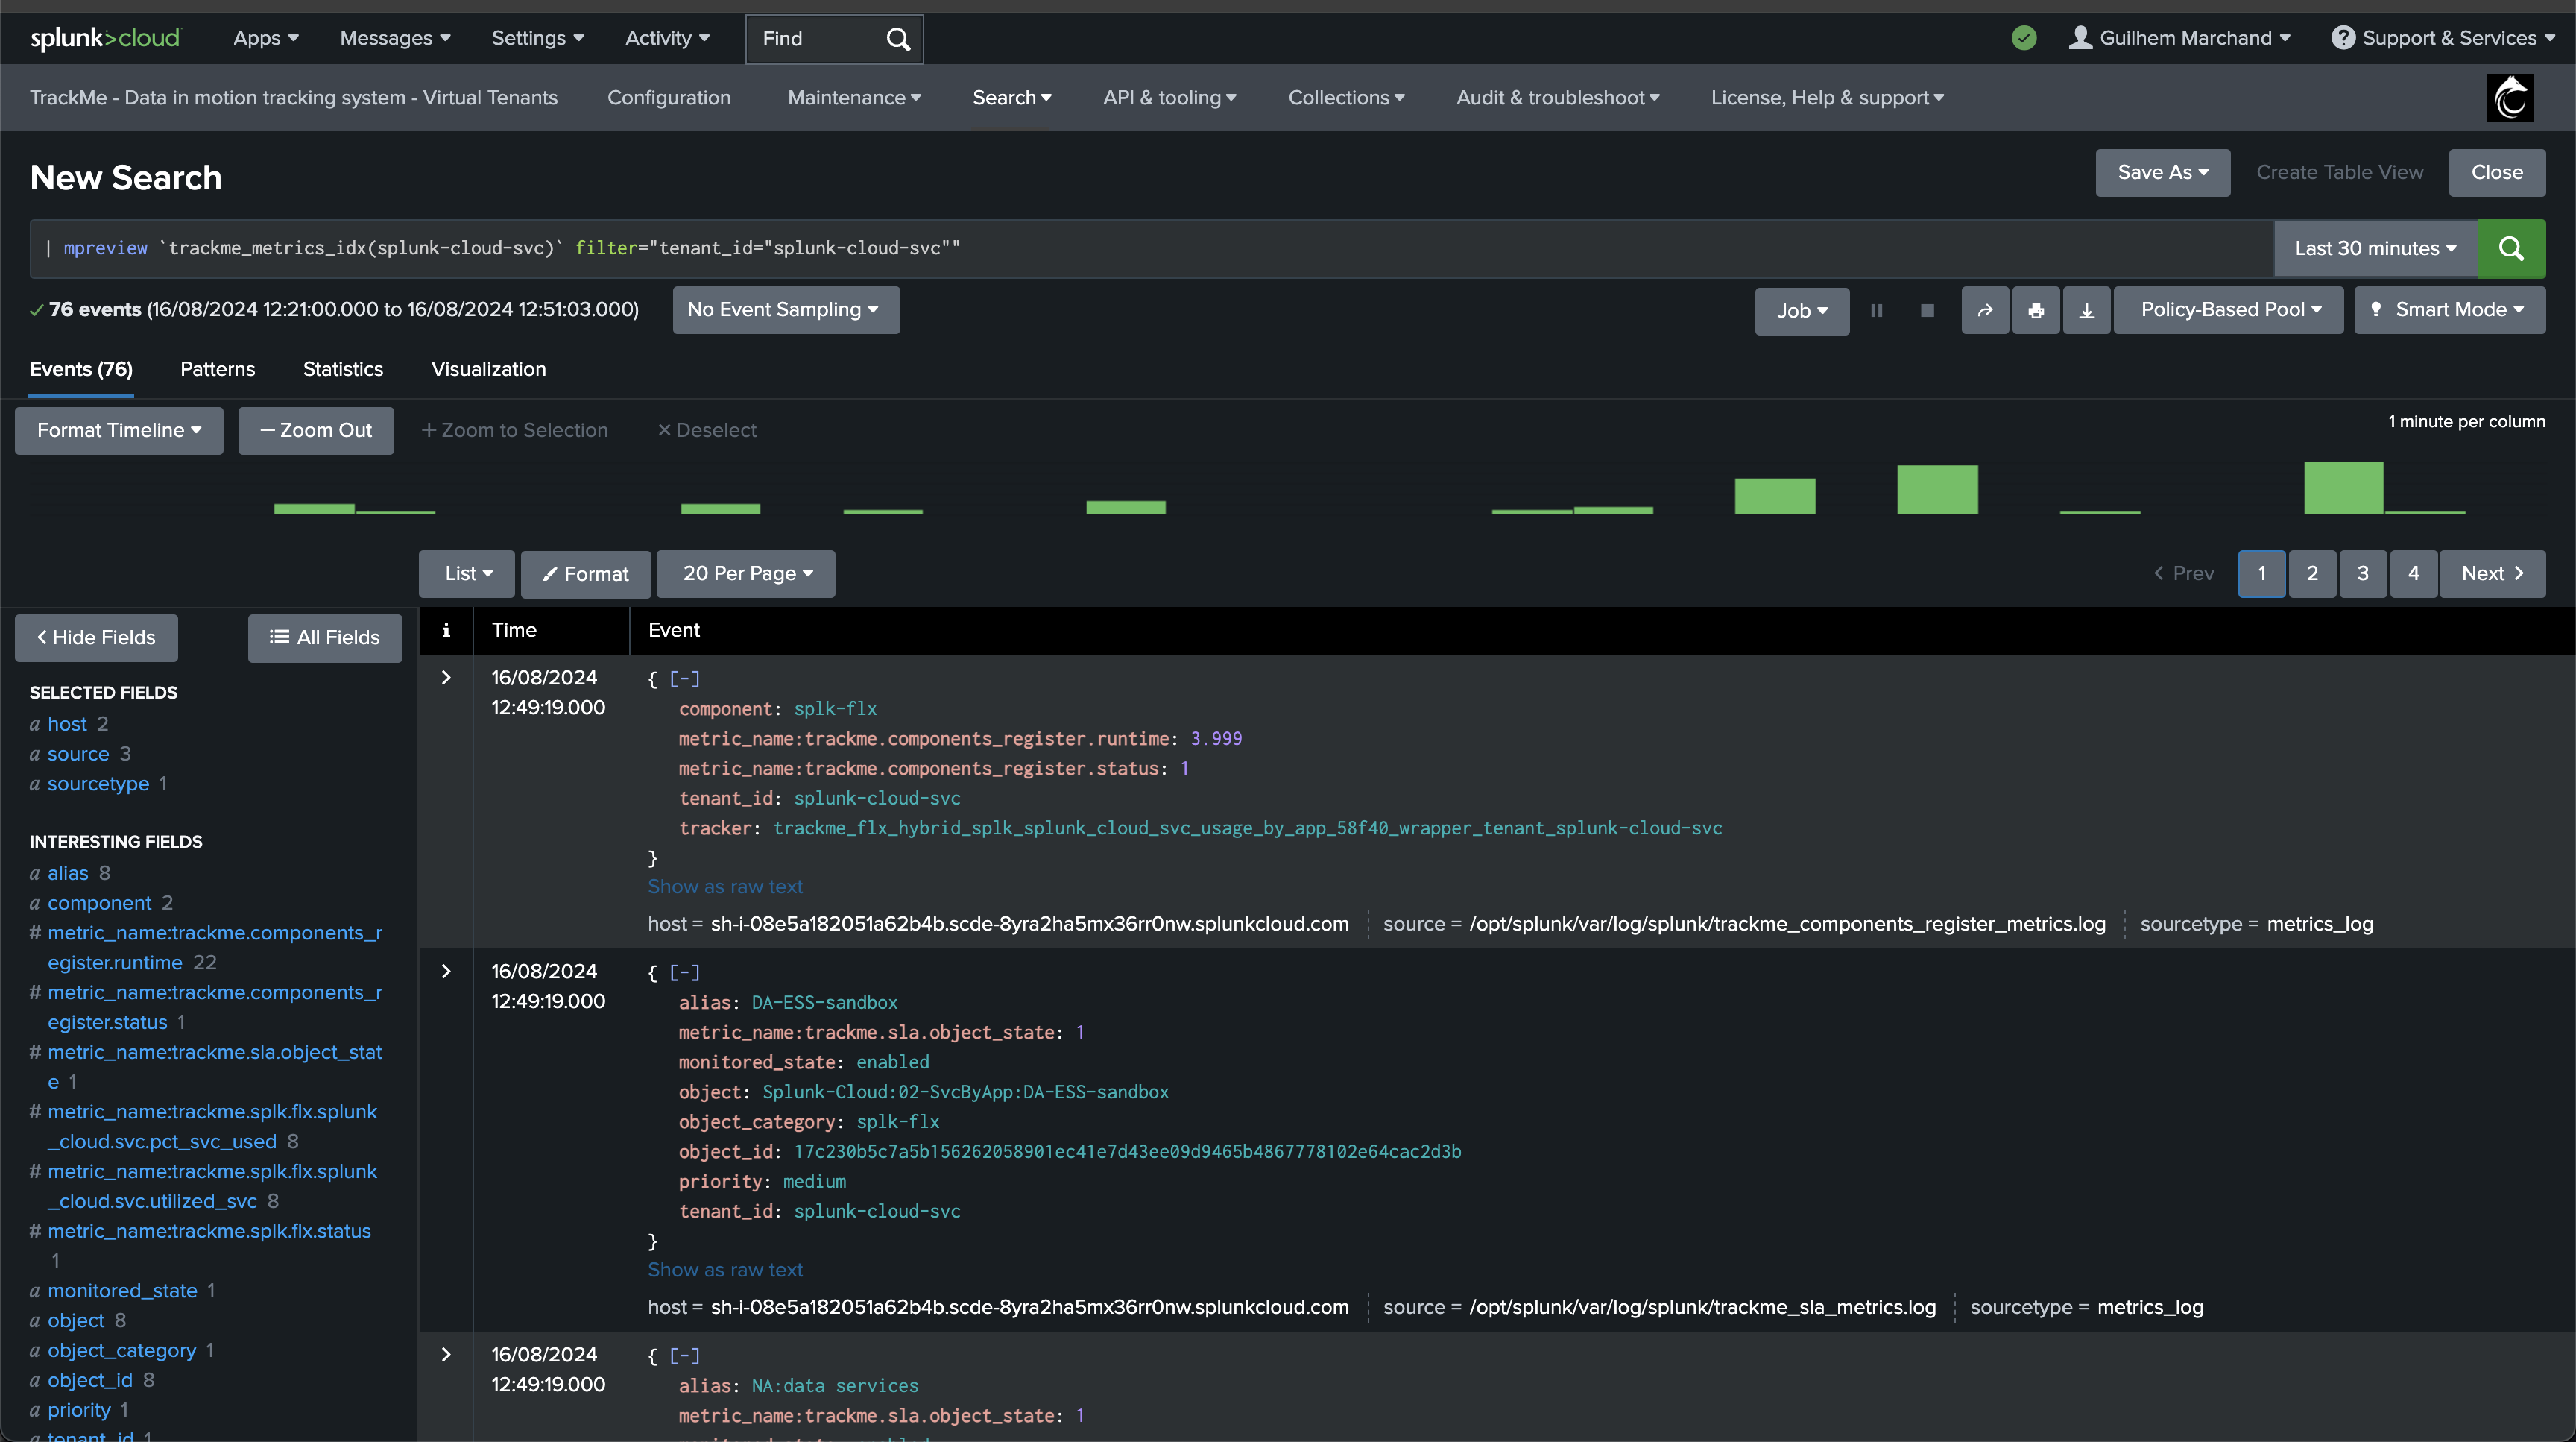
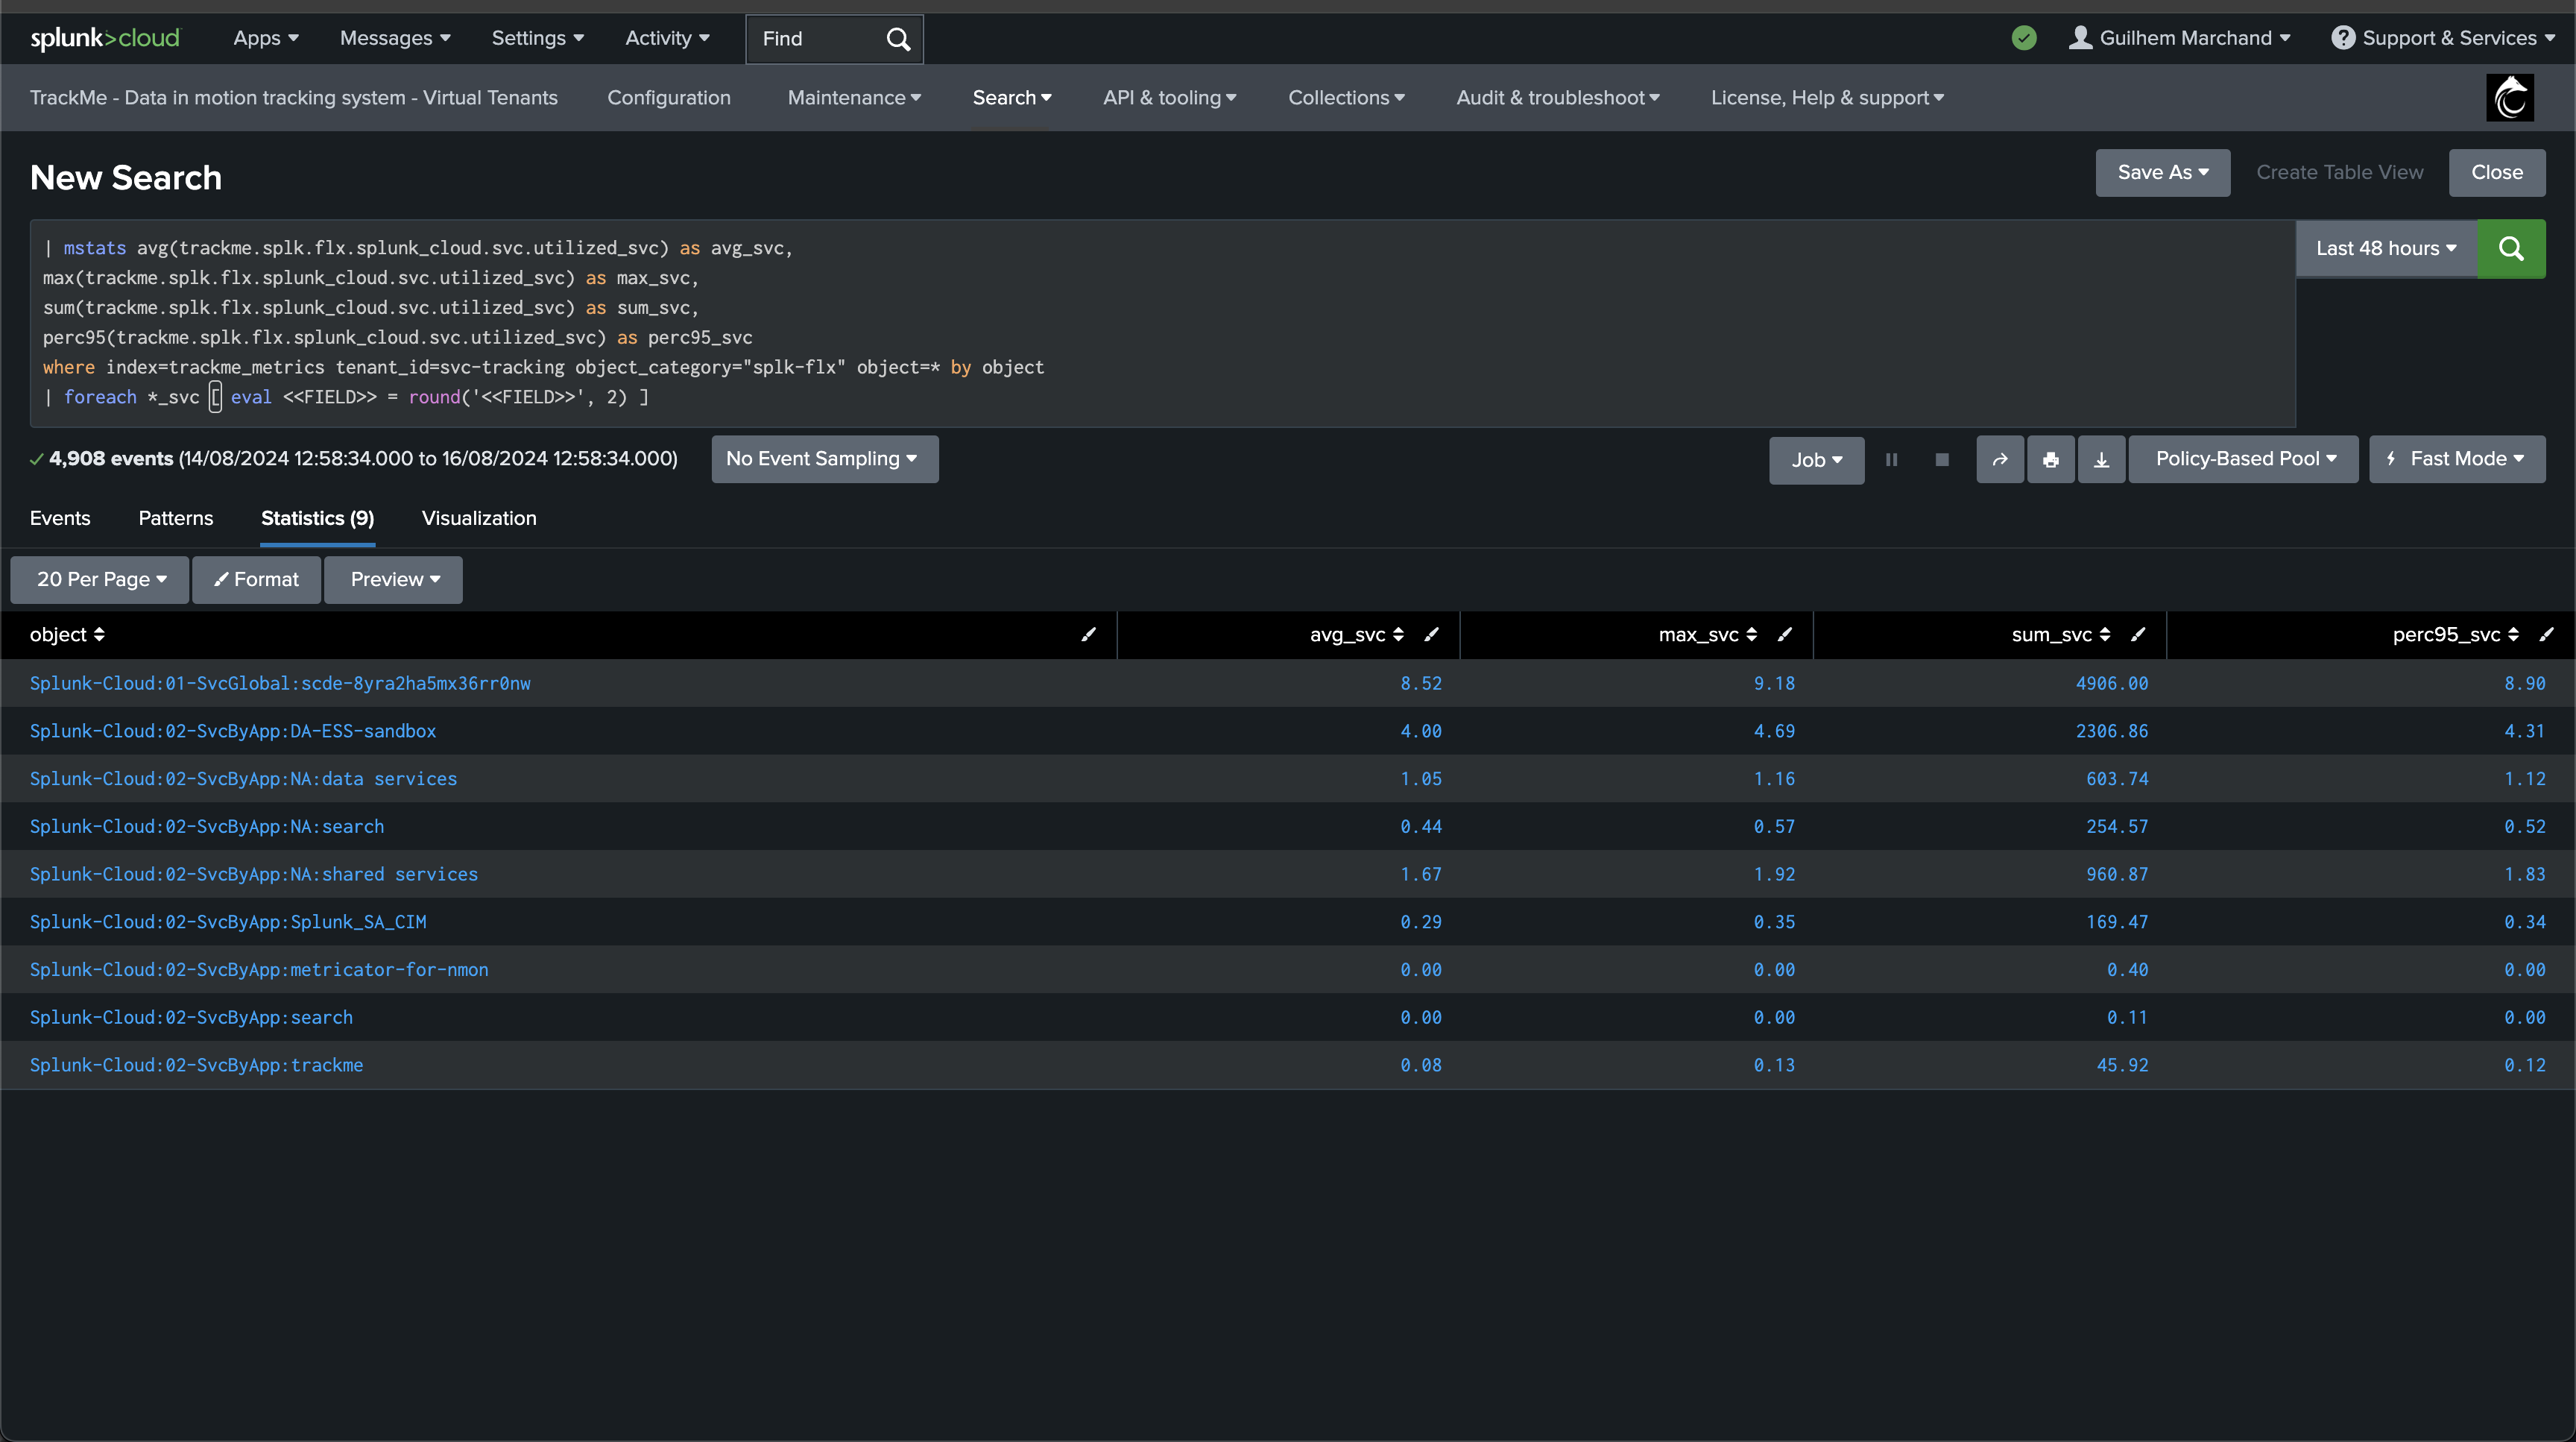
Query example:
| mstats avg(trackme.splk.flx.splunk_cloud.svc.utilized_svc) as avg_svc,
max(trackme.splk.flx.splunk_cloud.svc.utilized_svc) as max_svc,
sum(trackme.splk.flx.splunk_cloud.svc.utilized_svc) as sum_svc,
perc95(trackme.splk.flx.splunk_cloud.svc.utilized_svc) as perc95_svc
where index=trackme_metrics tenant_id=svc-tracking object_category="splk-flx" object=* by object
| foreach *_svc [ eval <<FIELD>> = round('<<FIELD>>', 2) ]
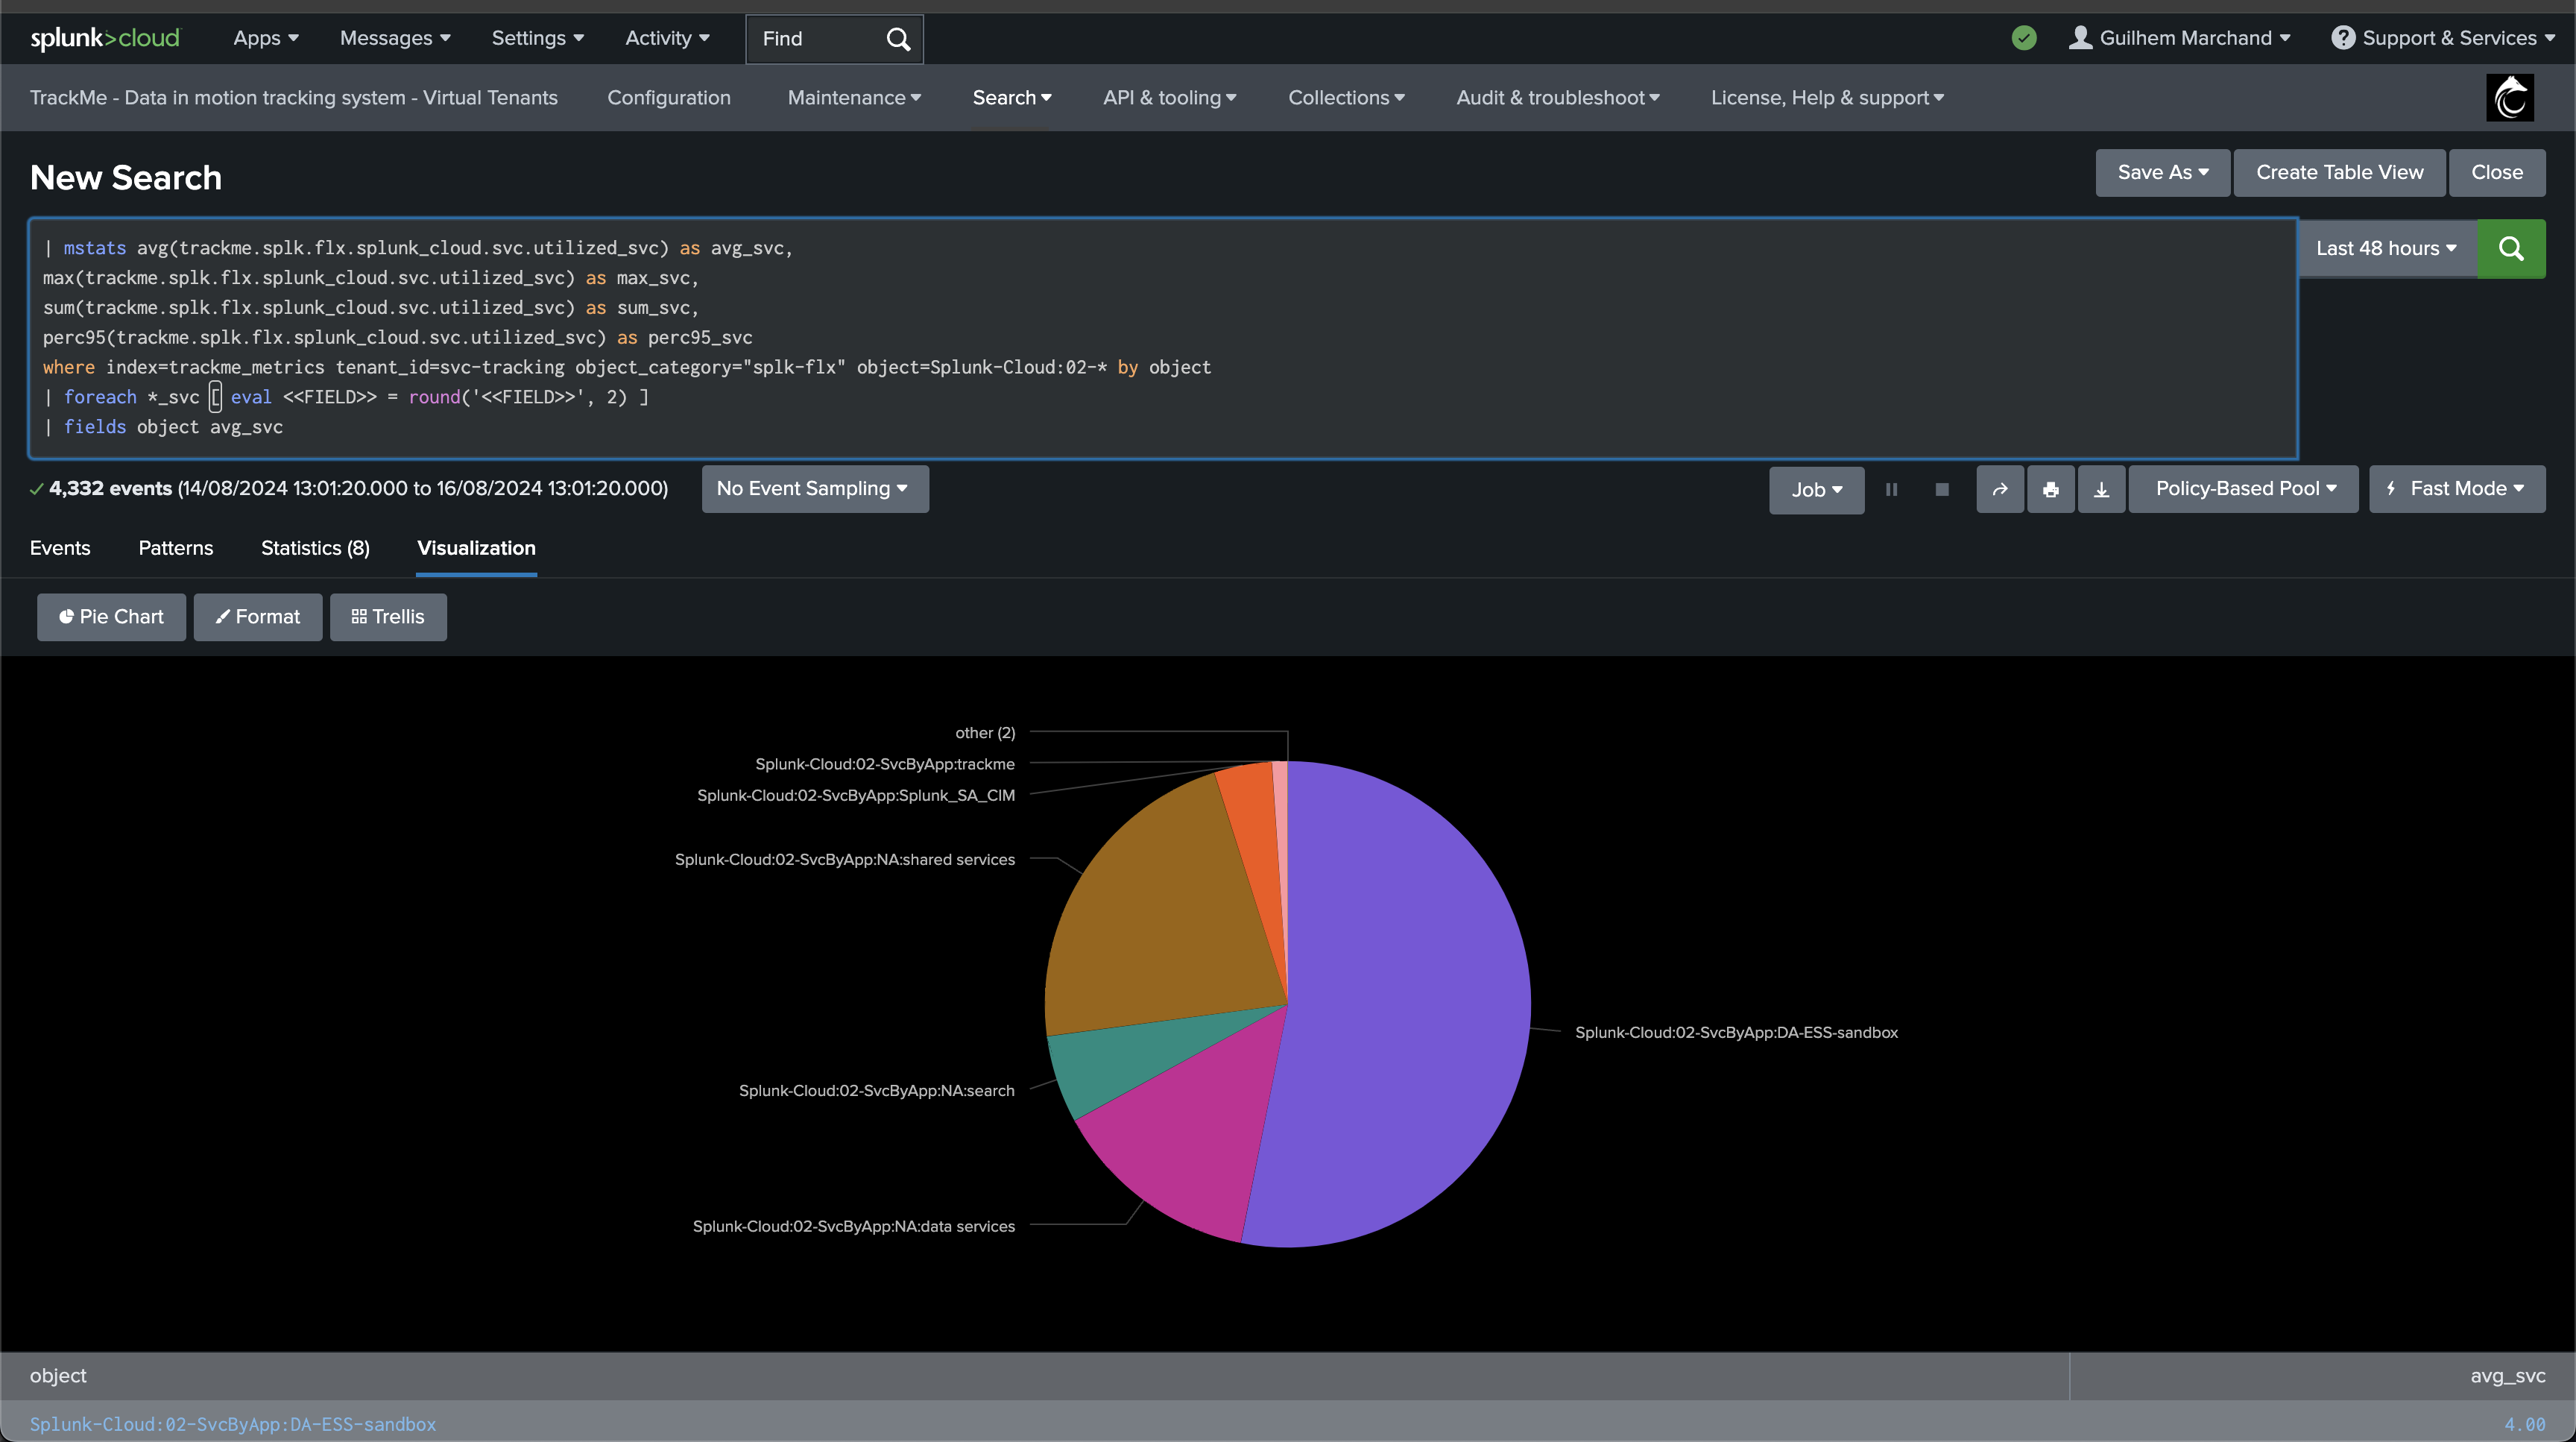
Building a dashboard based on the above, the following would easily show the bigger SVC consumers:
| mstats avg(trackme.splk.flx.splunk_cloud.svc.utilized_svc) as avg_svc,
max(trackme.splk.flx.splunk_cloud.svc.utilized_svc) as max_svc,
sum(trackme.splk.flx.splunk_cloud.svc.utilized_svc) as sum_svc,
perc95(trackme.splk.flx.splunk_cloud.svc.utilized_svc) as perc95_svc
where index=trackme_metrics tenant_id=svc-tracking object_category="splk-flx" object=Splunk-Cloud:02-* by object
| foreach *_svc [ eval <<FIELD>> = round('<<FIELD>>', 2) ]
| fields object avg_svc
TrackMe Workload component and Splunk Cloud SVC consumption
TrackMe’s licensed customers can leverage the Workload component, which can also track SVC consumption on a per Splunk scheduled basis.
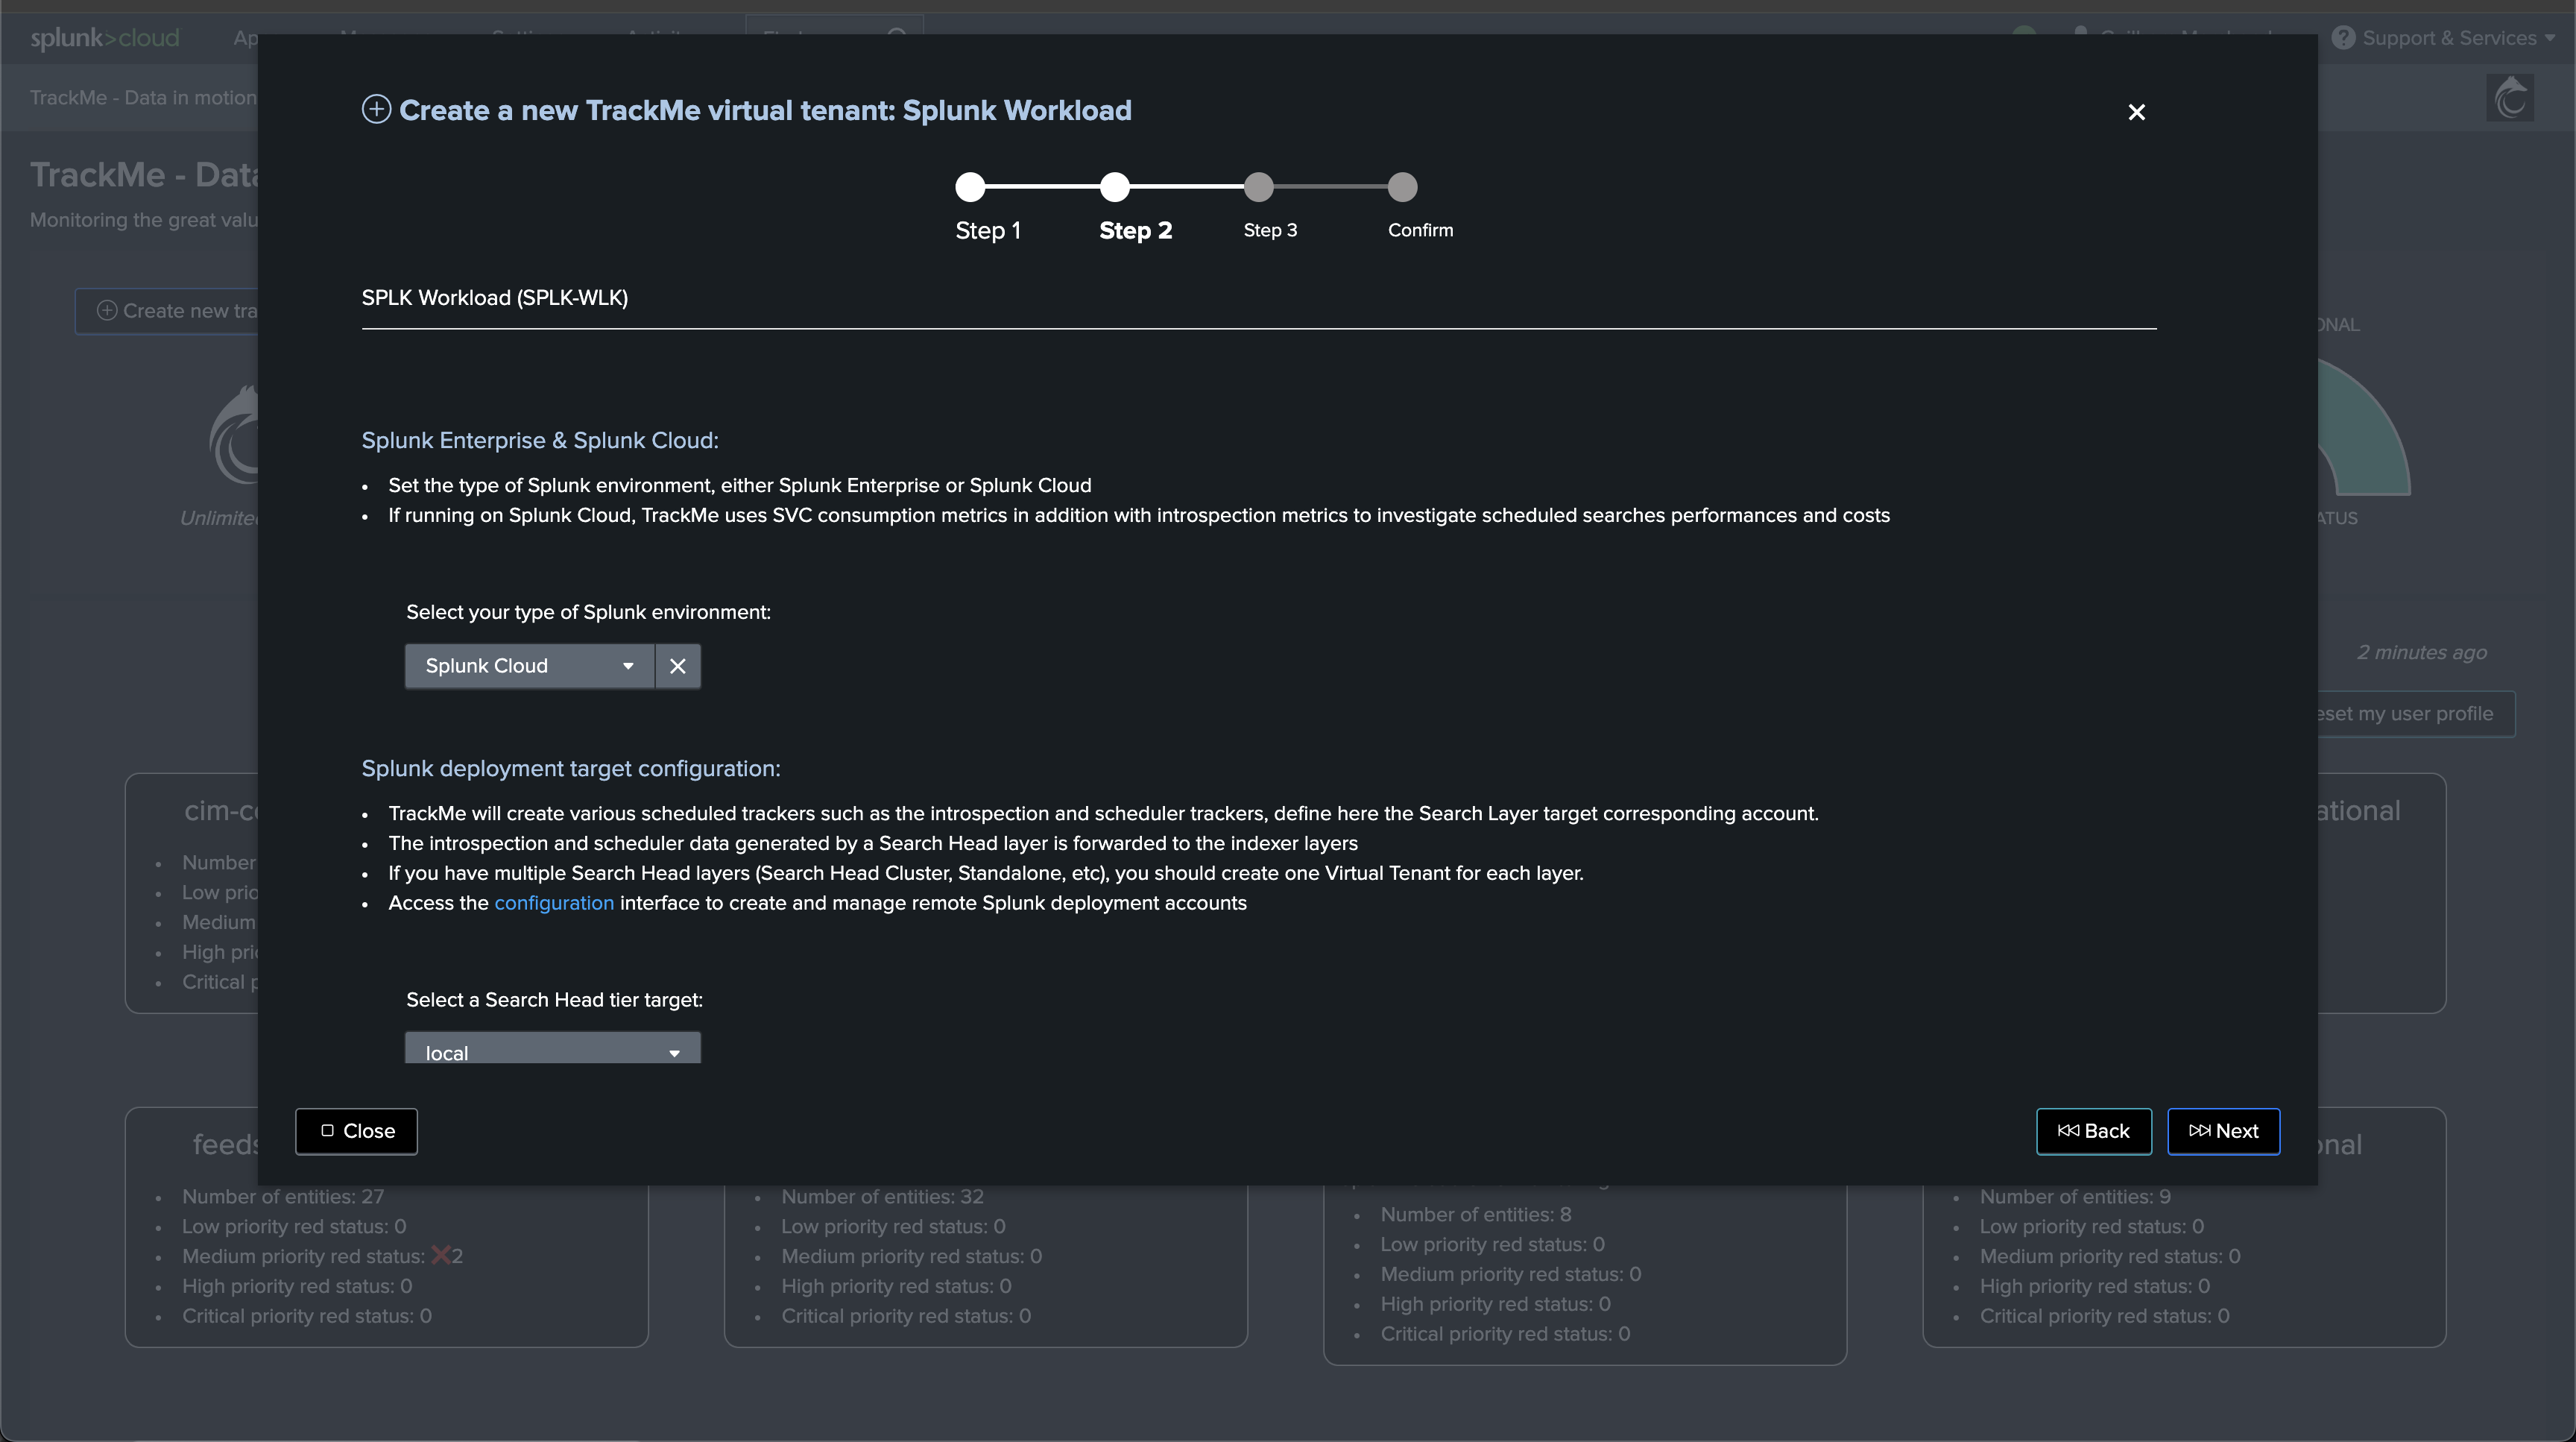
When you create the Workload Virtual Tenant, ensure to select “Splunk Cloud” as the type of Splunk environment:
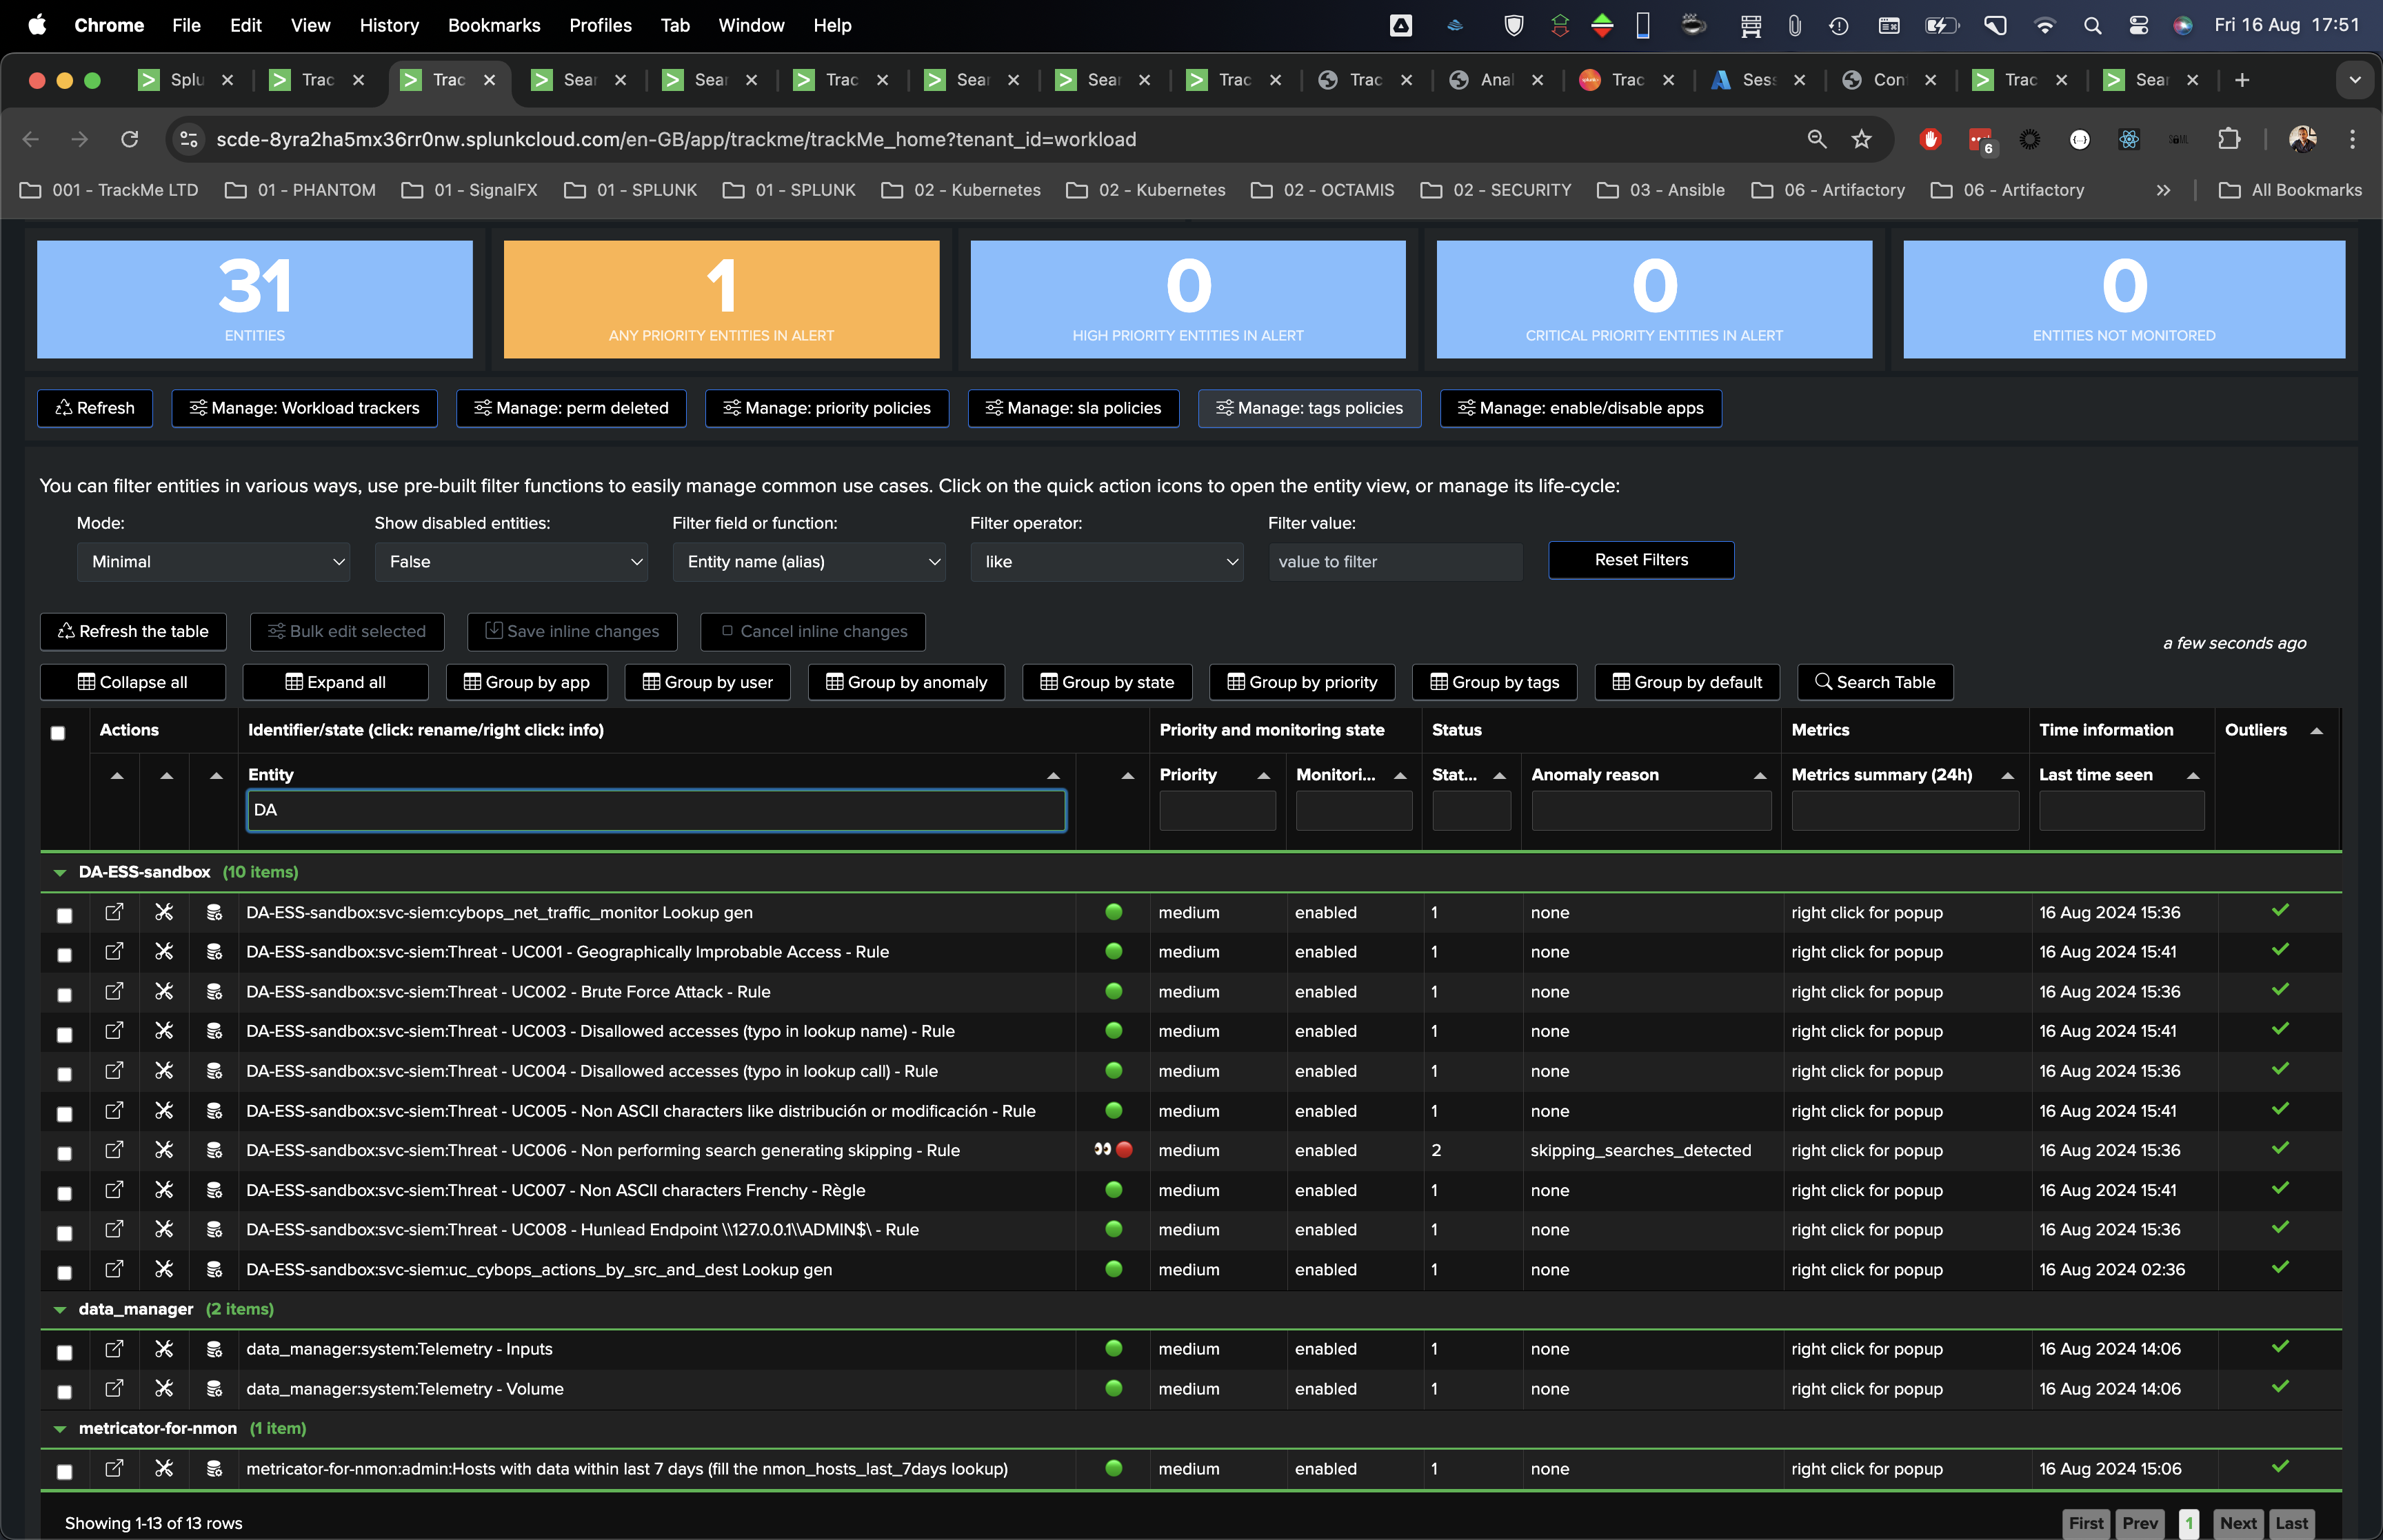
Once configured, the Workload component tracks various aspects of the health of Splunk scheduled, between other KPIs, the Workload component also tracks SVC usage:
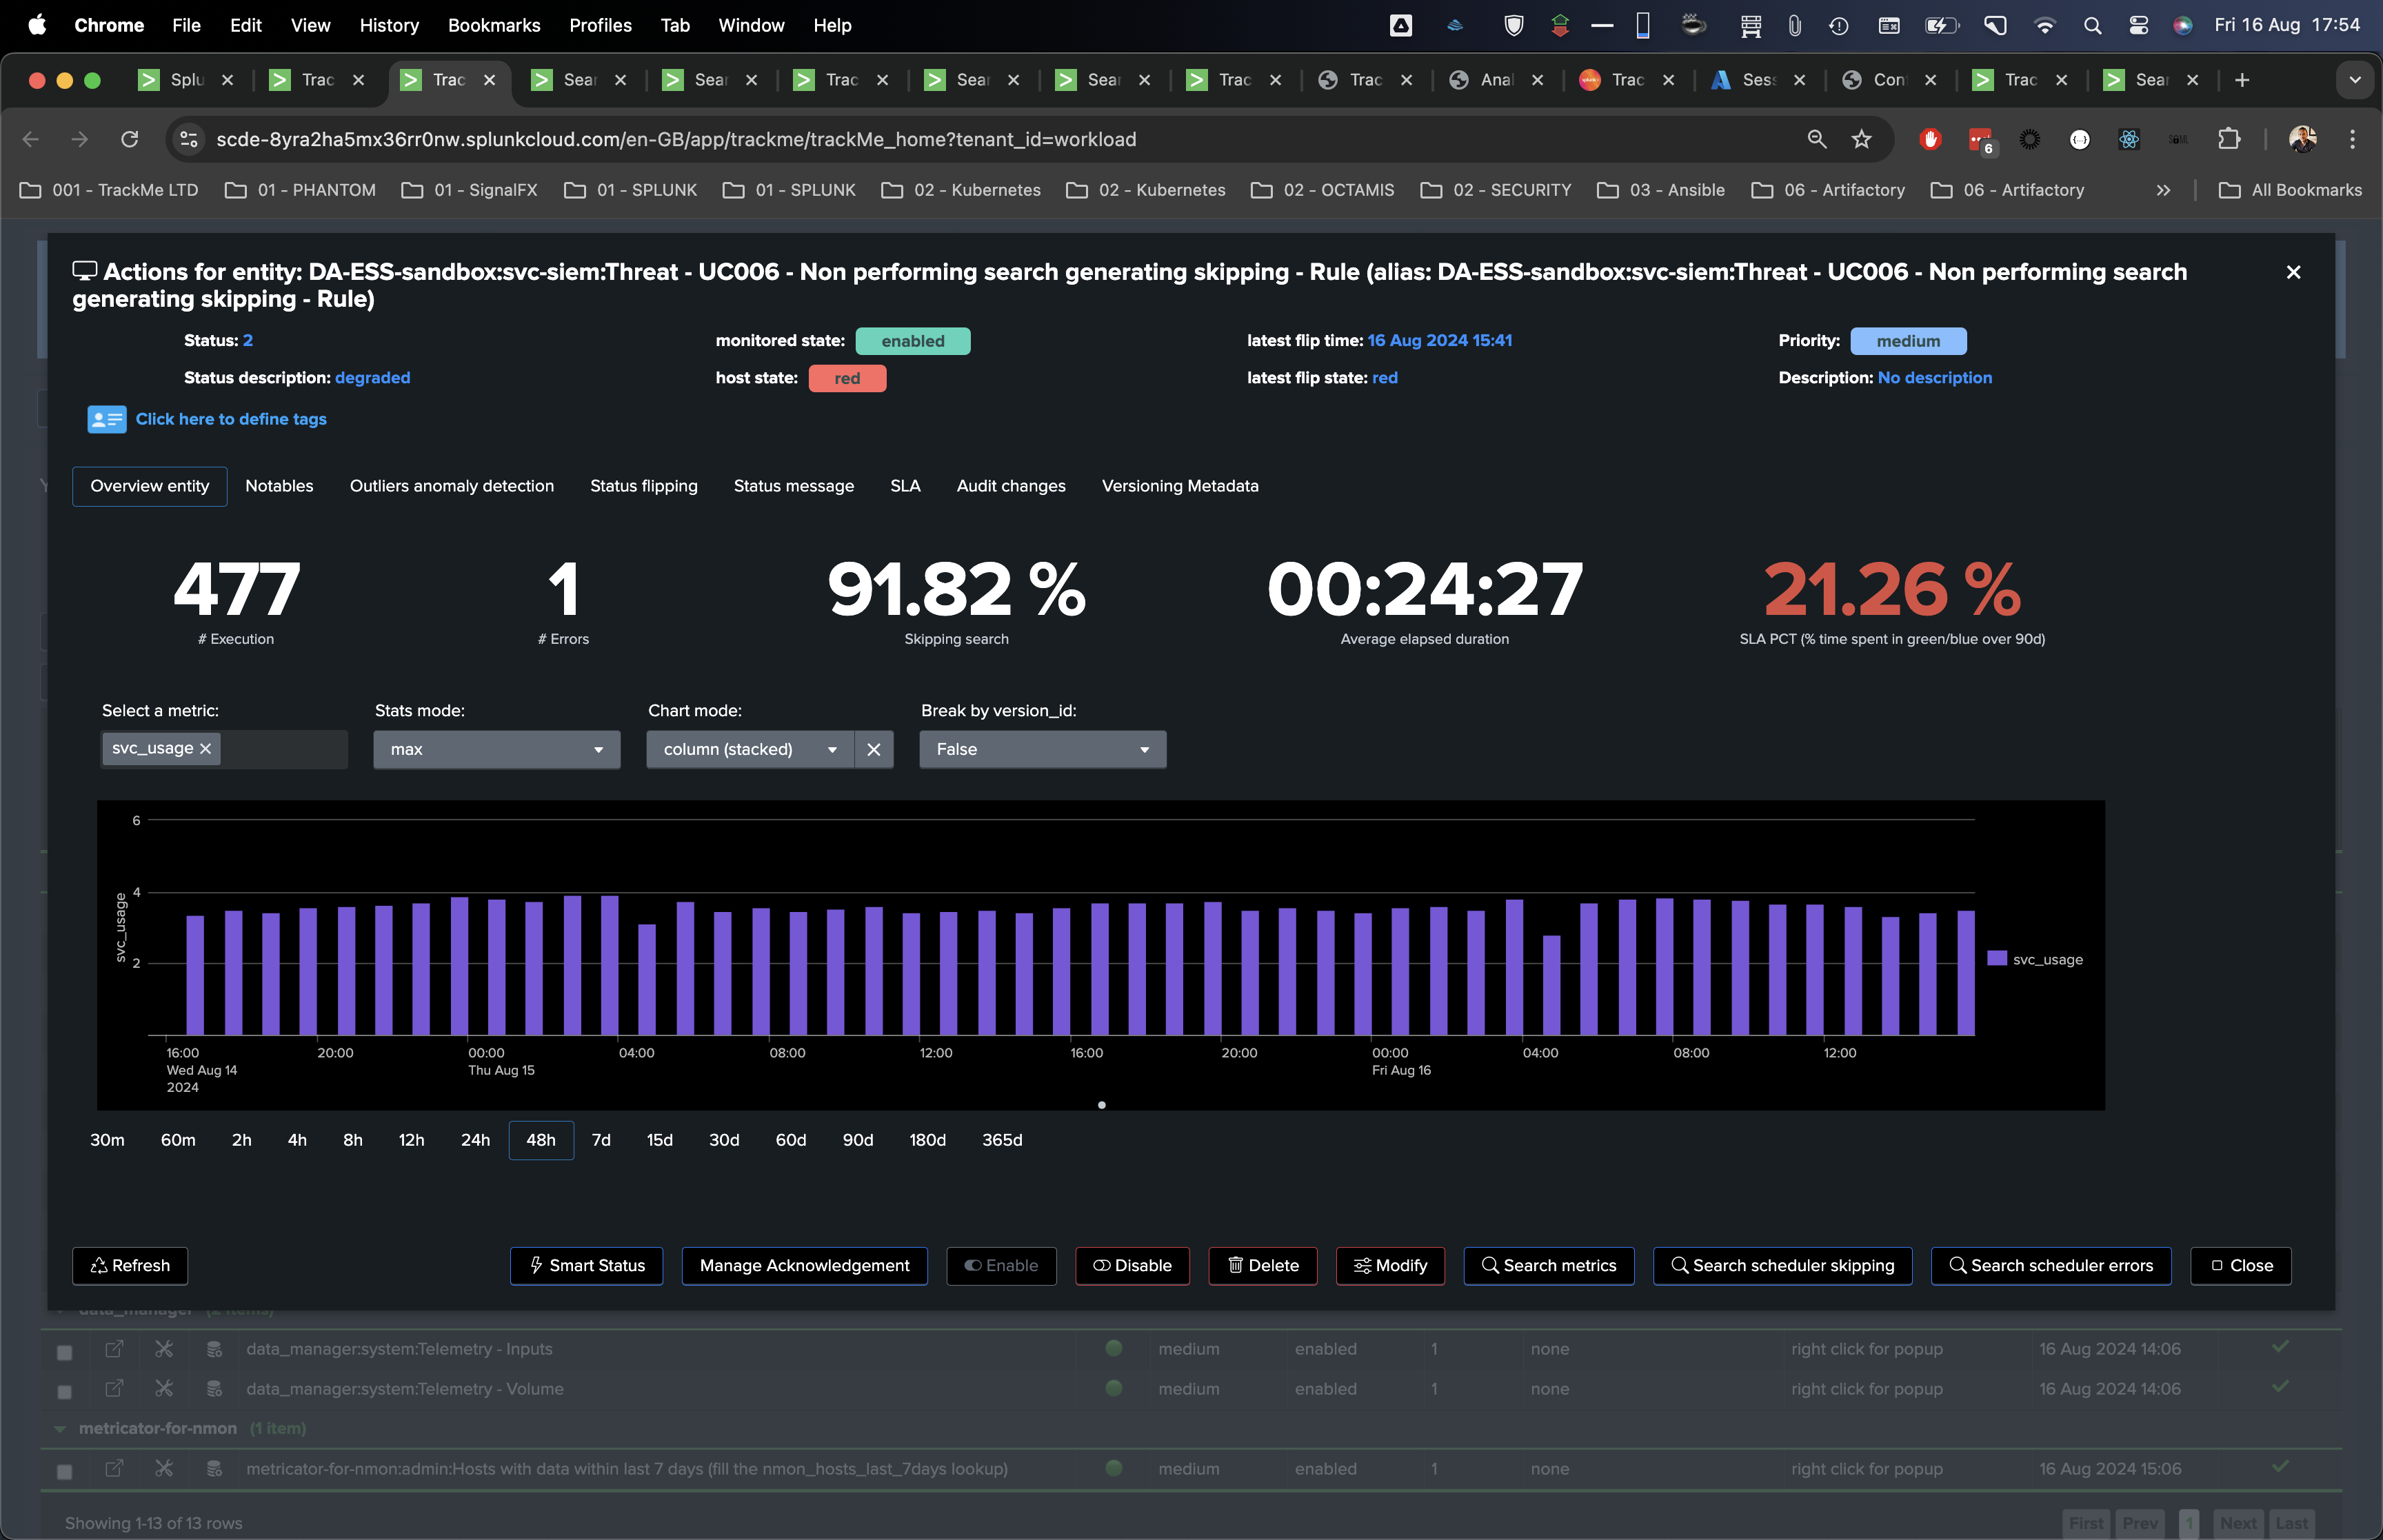
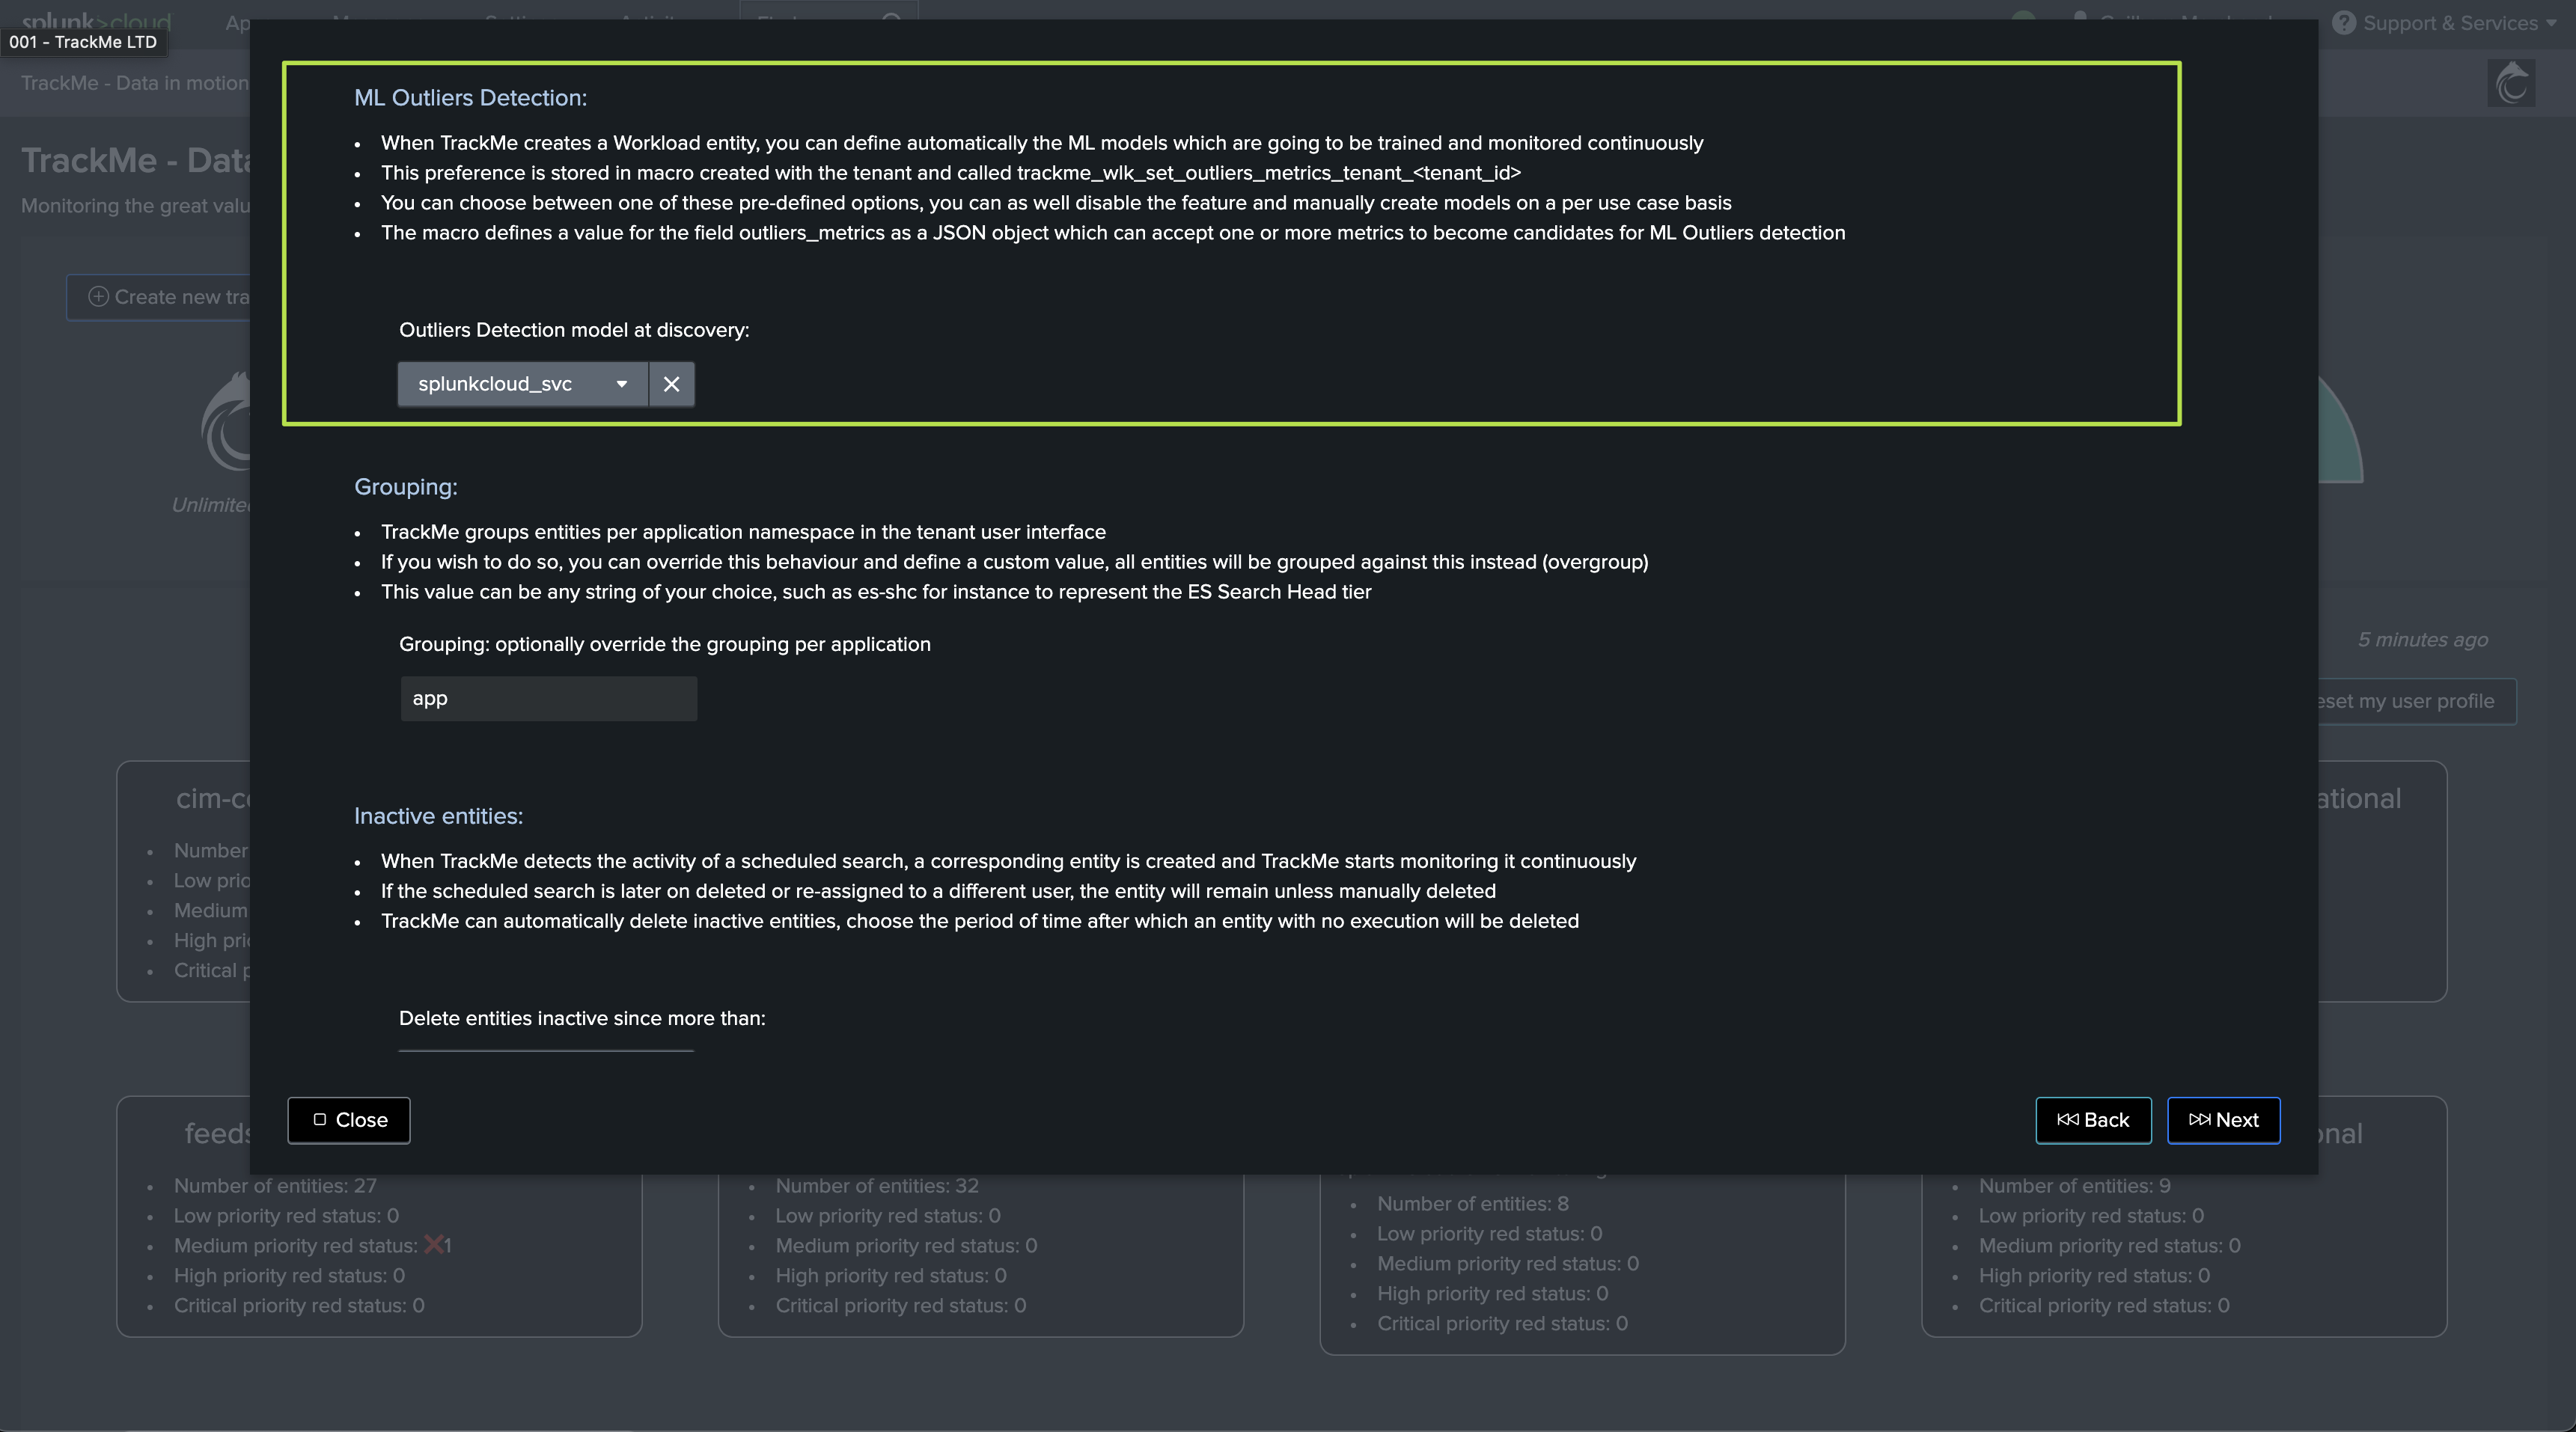
We can for instance add an Outlier models against the SVC consumption:
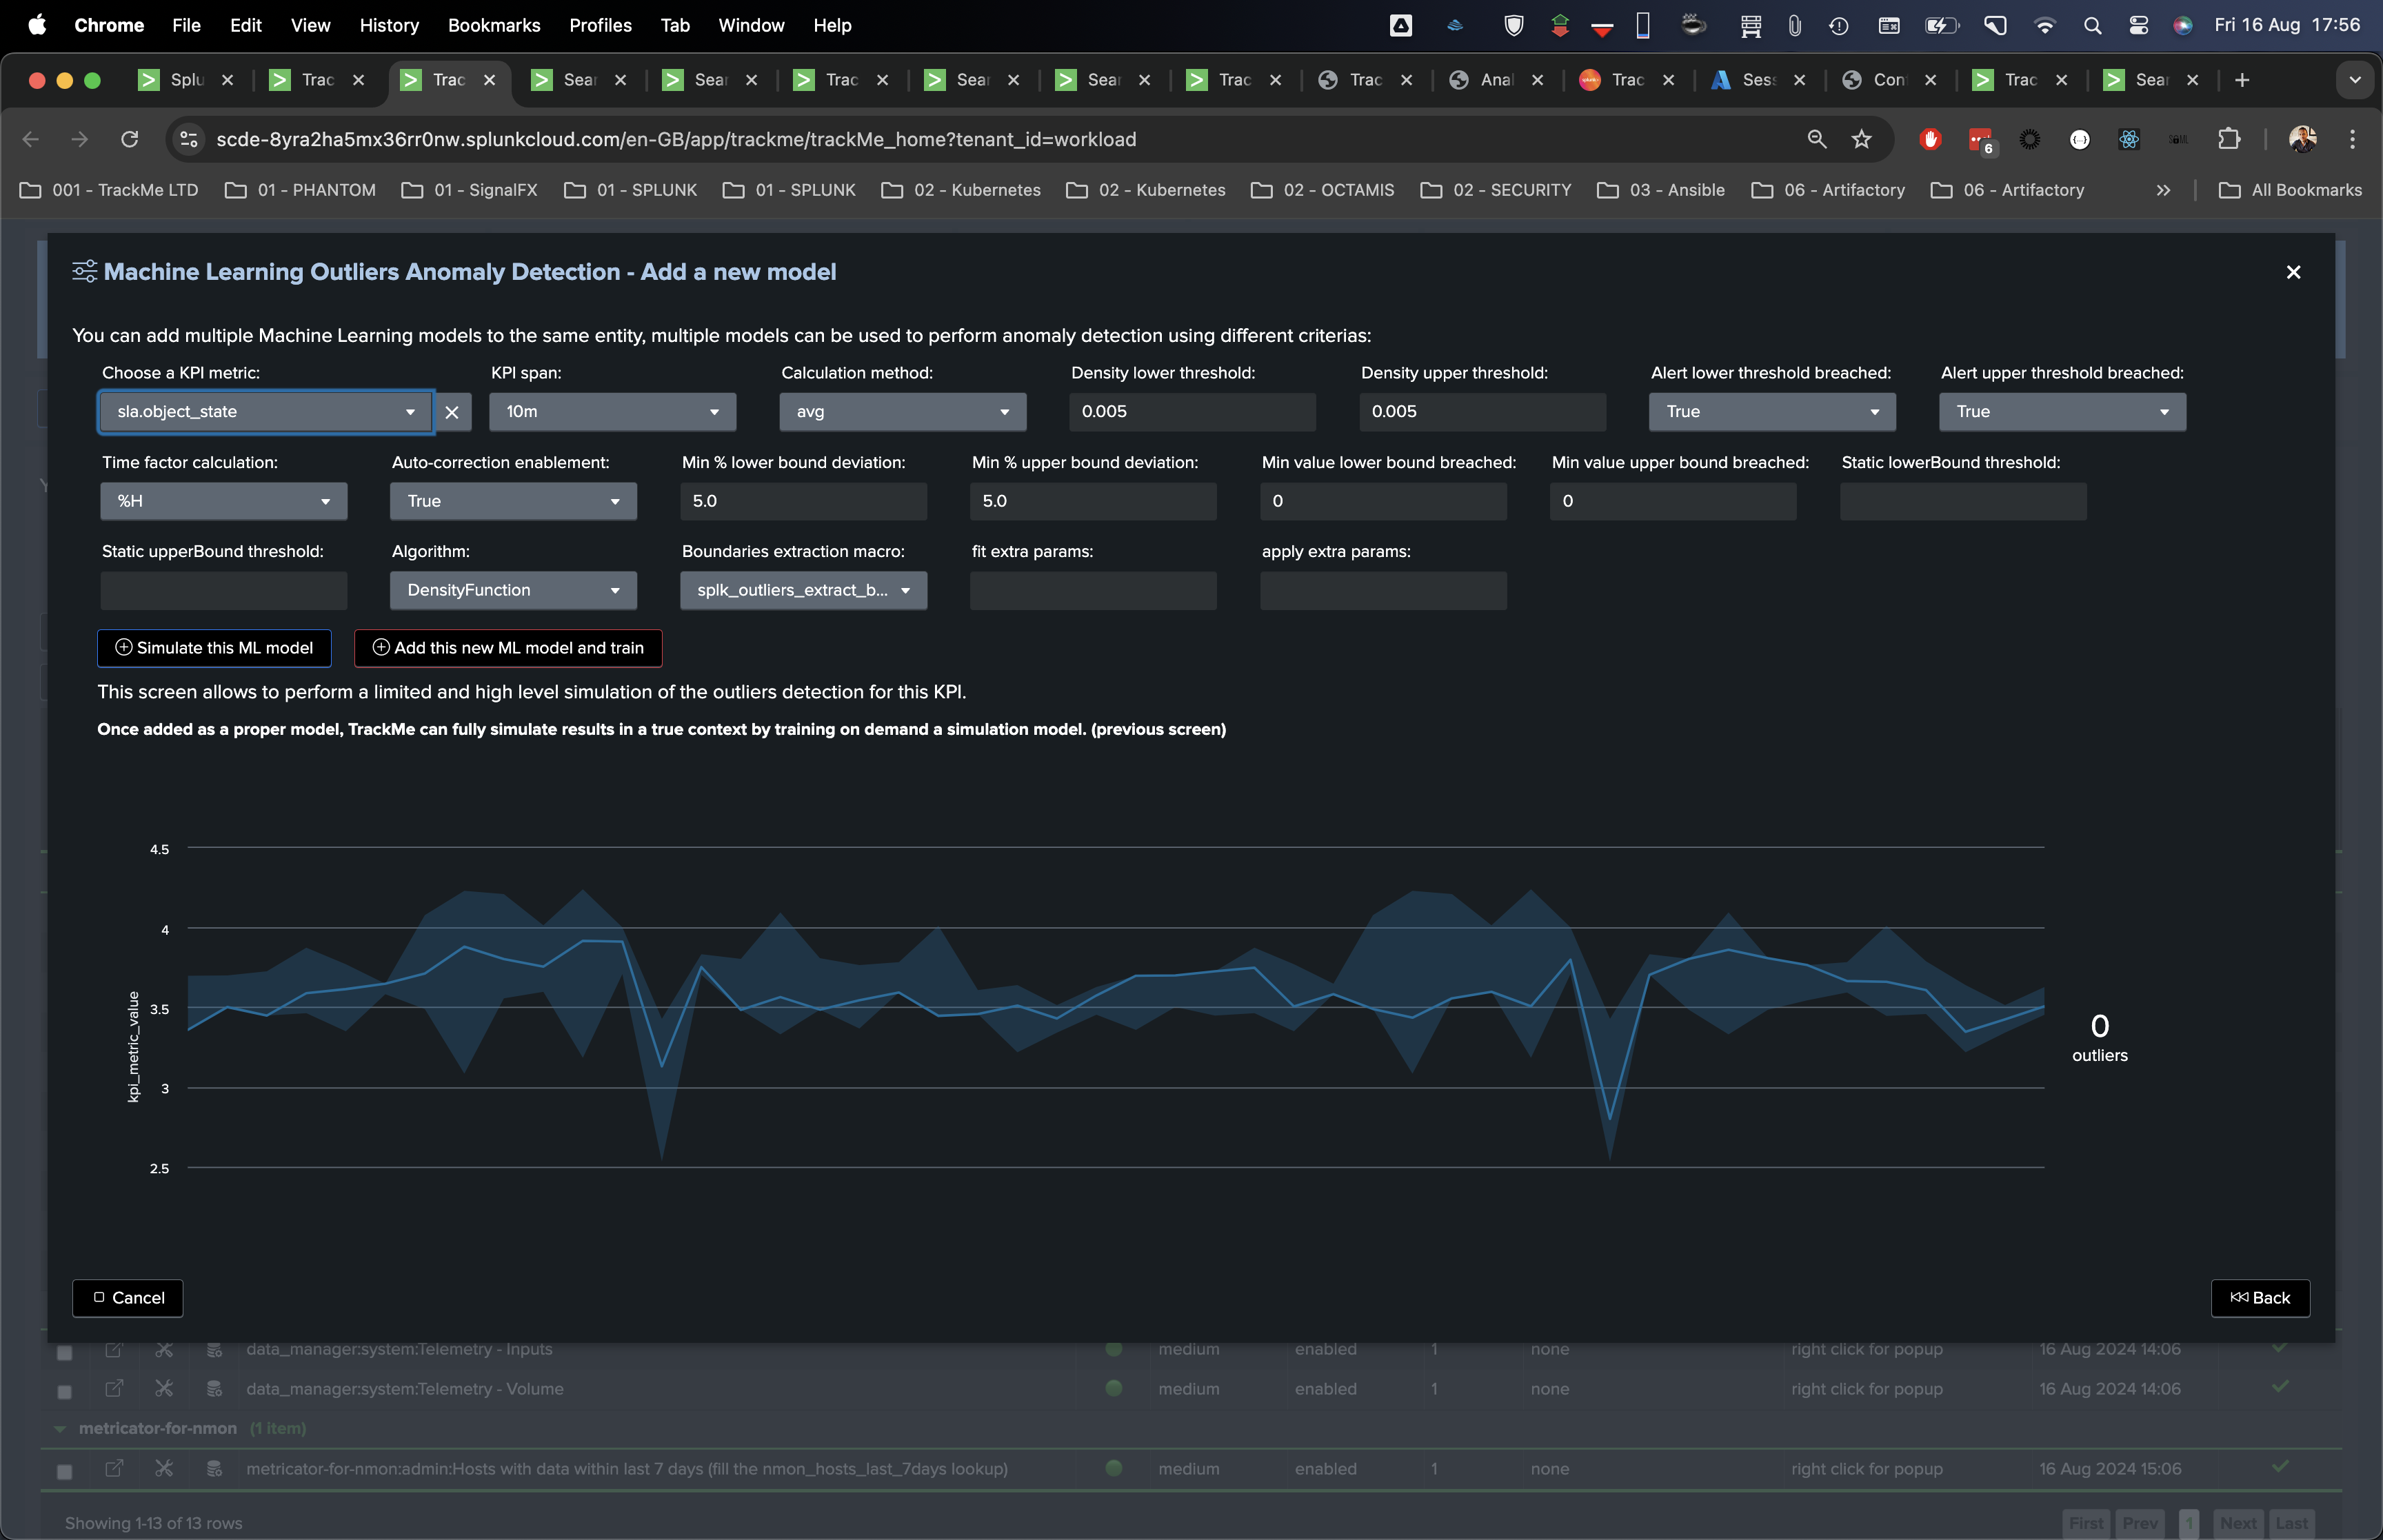
Note that by default, the Workload component would enable ML against the elapsed run time KPI, you can for instance while creating the tenant, or at a later stage, use SVC consumption instead.
Accessing metrics from the Workload component
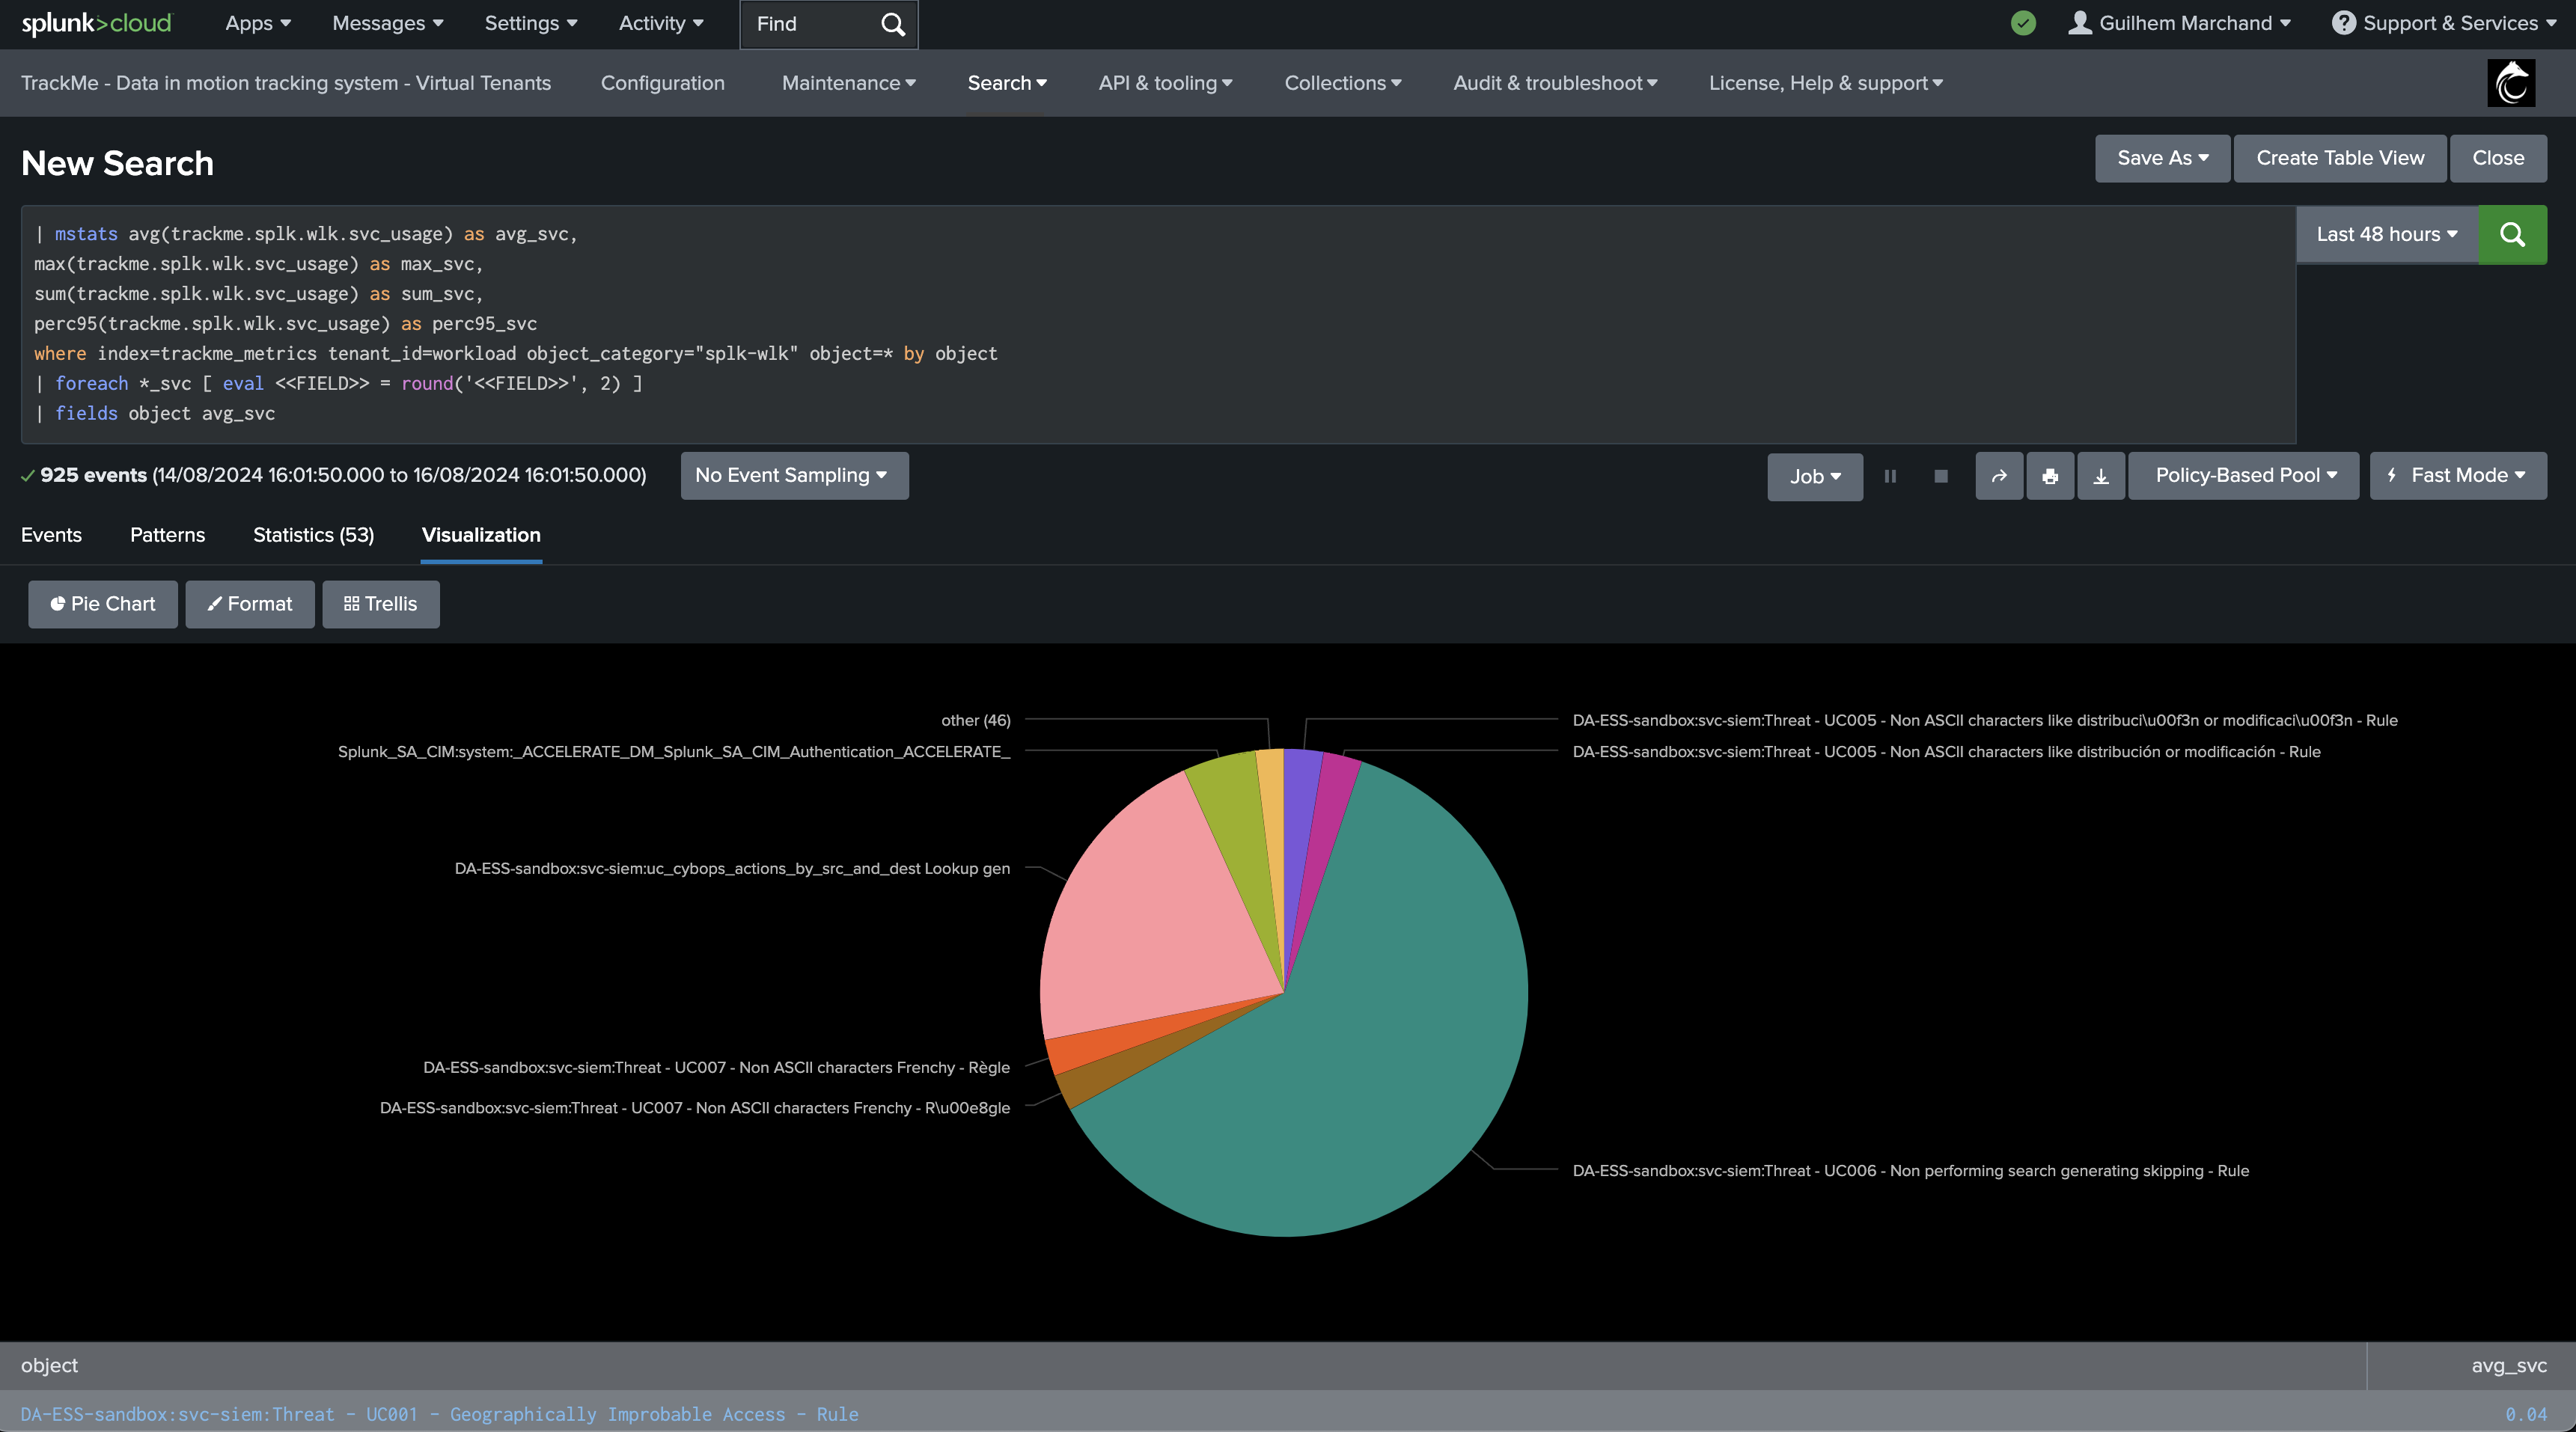
The following search query can be used to access the SVC consumption metrics collected by the Workload component:
You need to replace the tenant_id name with the one you have created.
| mstats avg(trackme.splk.wlk.svc_usage) as avg_svc,
max(trackme.splk.wlk.svc_usage) as max_svc,
sum(trackme.splk.wlk.svc_usage) as sum_svc,
perc95(trackme.splk.wlk.svc_usage) as perc95_svc
where index=trackme_metrics tenant_id=workload object_category="splk-wlk" object=* by object
| foreach *_svc [ eval <<FIELD>> = round('<<FIELD>>', 2) ]
Based on the previous example, you can easily build very interesting dashboards on top of this:
TrackMe out of the box SVC consumption dashboard
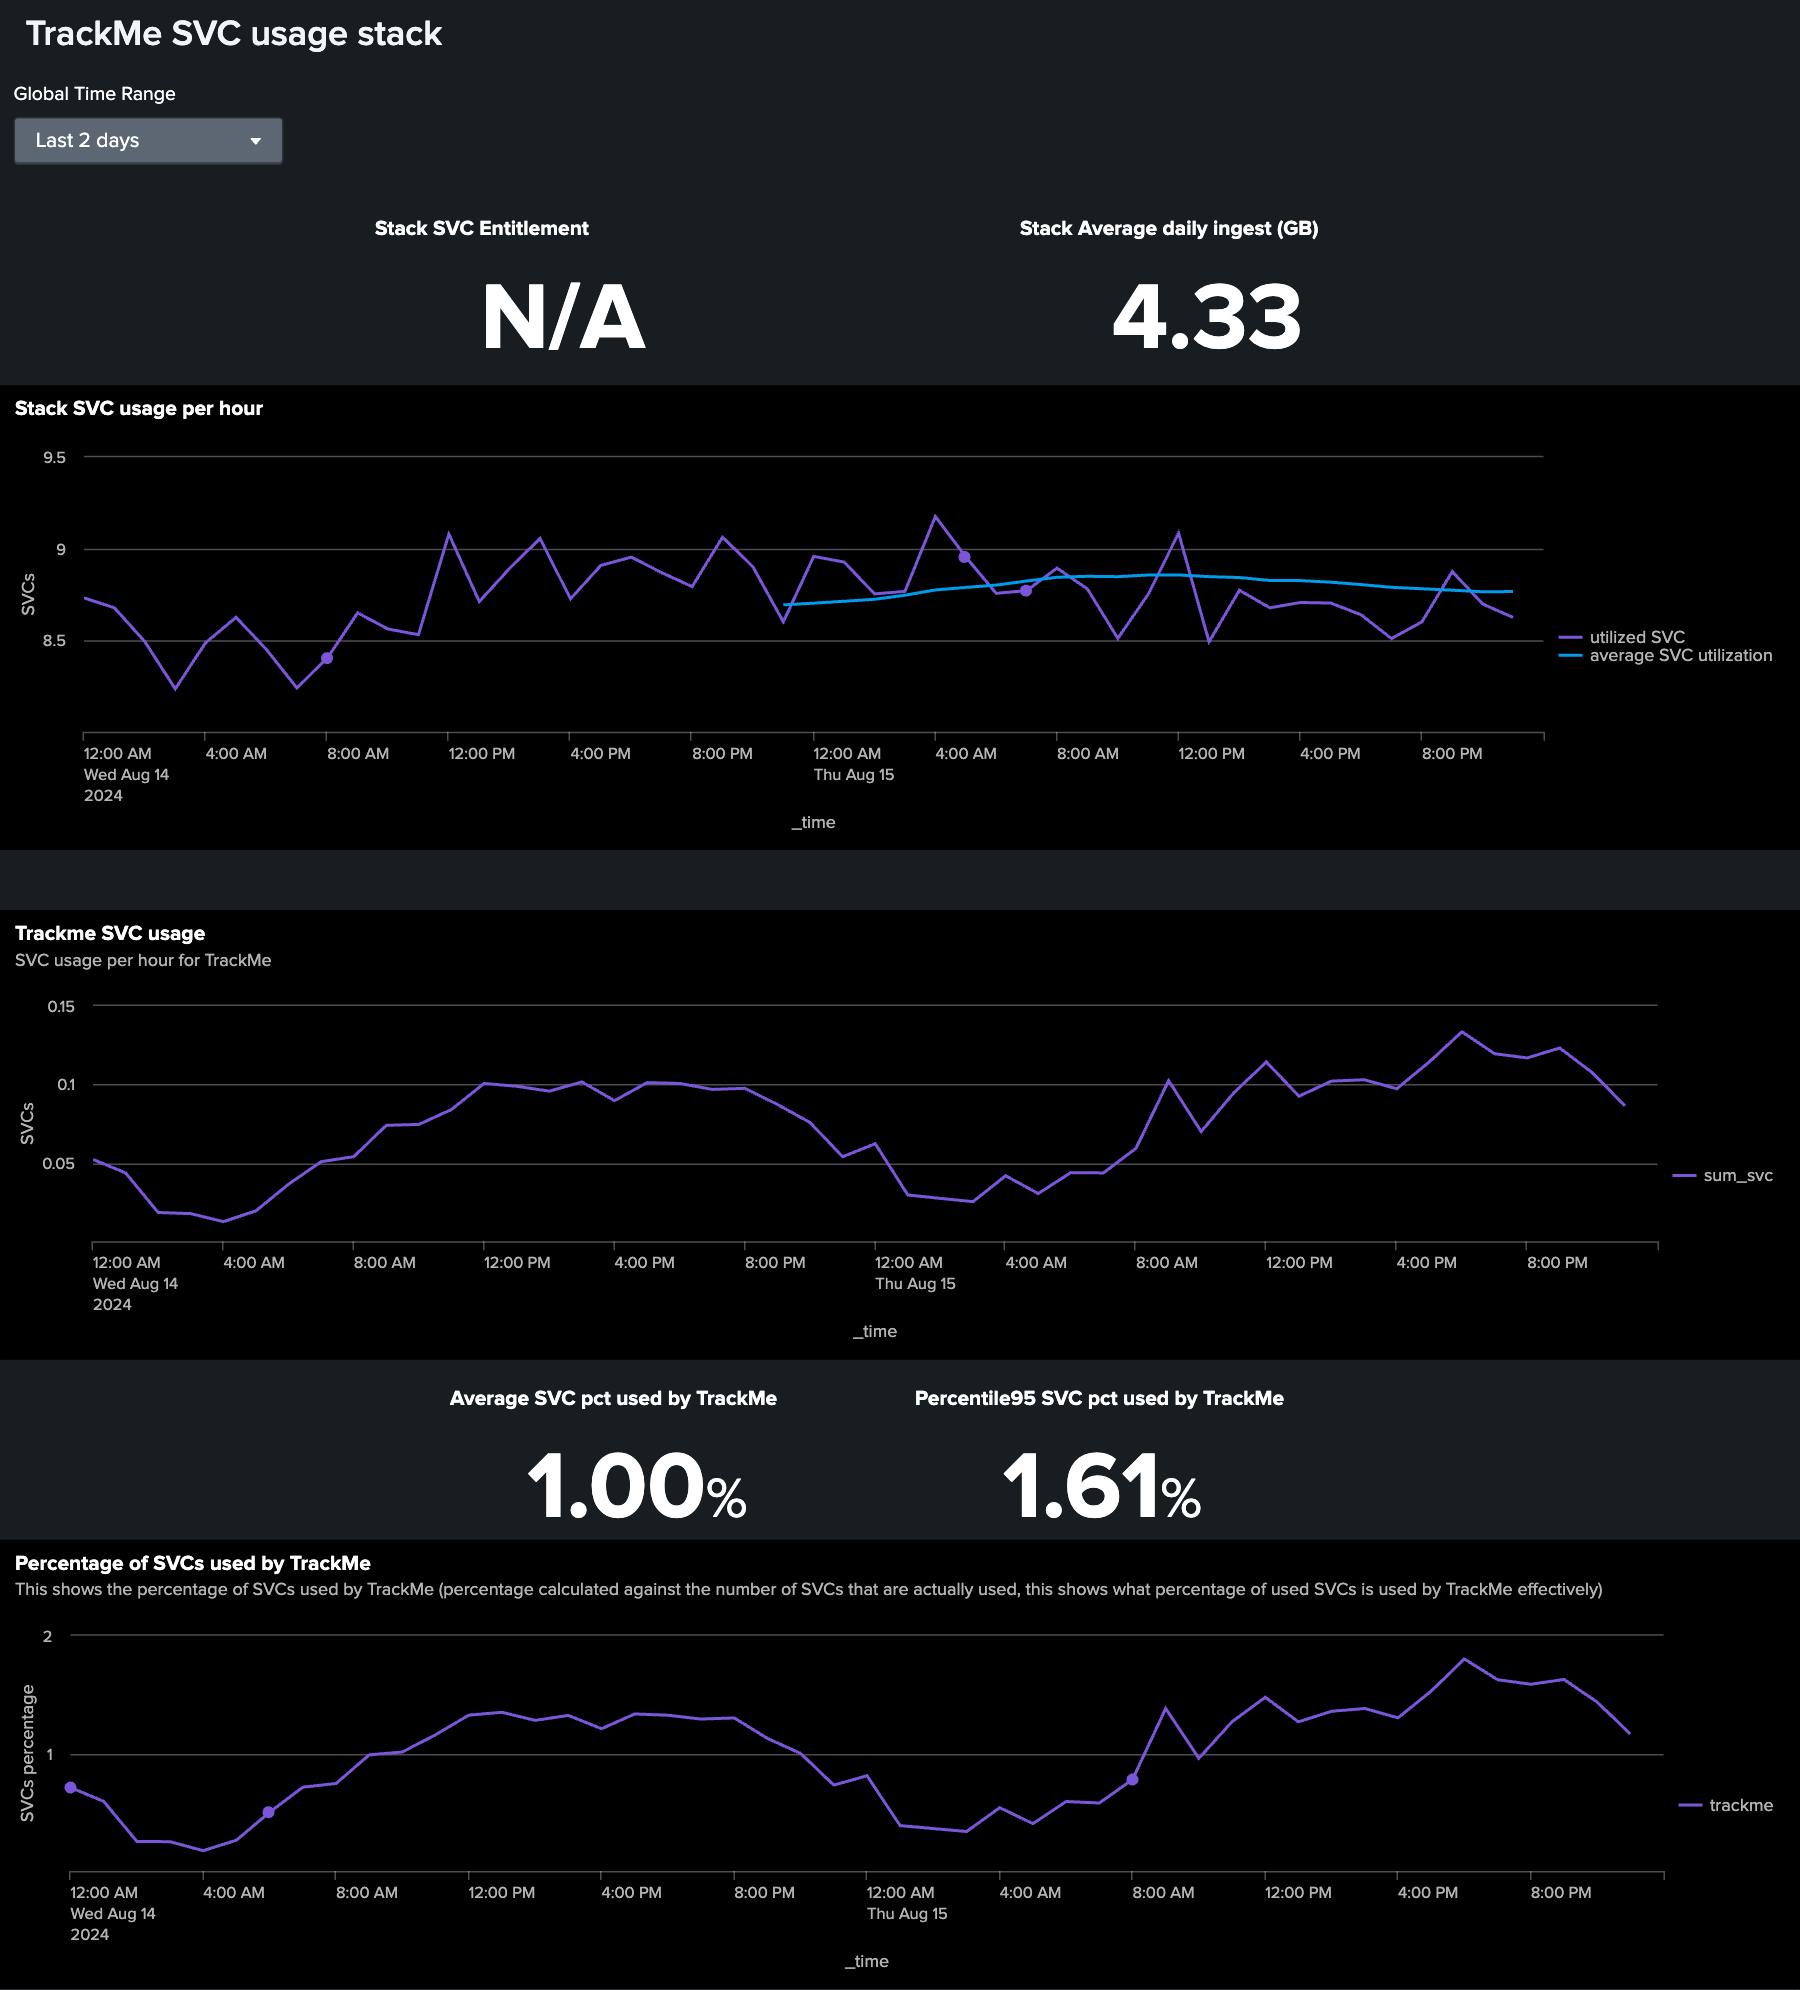
While not directly related to the SVC consumption TrackMe tracks through the components explained above, it is worth mentioning that TrackMe also comes with an out of the box dashboard which is designed to audit the SVC usage that is related to TrackMe itself.
You can find this dashboard in the menu “Audit & Troubleshoot” / “TrackMe SVC usage stack”:
Note: the stack SVC entitlement comes as N/A because it is a dev Cloud stack which doesn’t come with a normal limit, unlike a proper Cloud stack.