Pushing Expected Sources to TrackMe (Tracking Expected Sources or Hosts in splk-dsm/splk-dhm)
About Pushing Expected Sources
This guide explains how to push expected sources or hosts to TrackMe Data Sources Monitoring (splk-dsm) or Data Hosts Monitoring (splk-dhm).
This can be useful if you want to manually insert entities into TrackMe that have not yet been discovered, based on a CMDB or similar knowledge base.
When pushing expected sources, these entities will be added as if they were discovered by TrackMe under normal circumstances.
If these entities are not yet sending data to Splunk, or are not covered by the scope of your trackers, they will appear as red in TrackMe.
As soon as these entities start sending data to Splunk or are covered by the scope of your trackers, they will be updated in TrackMe accordingly.
This guide requires TrackMe 2.1.18 or higher.
Pushing Expected Data Sources to TrackMe Data Sources Monitoring (splk-dsm)
In this example, we push expected sources based on a Splunk lookup table containing the list of expected sources:
Suppose we have a Splunk lookup table containing the list of expected sources, based on a list of indexes and sourcetypes:
| inputlookup ds_expected.csv
| fields index, sourcetype
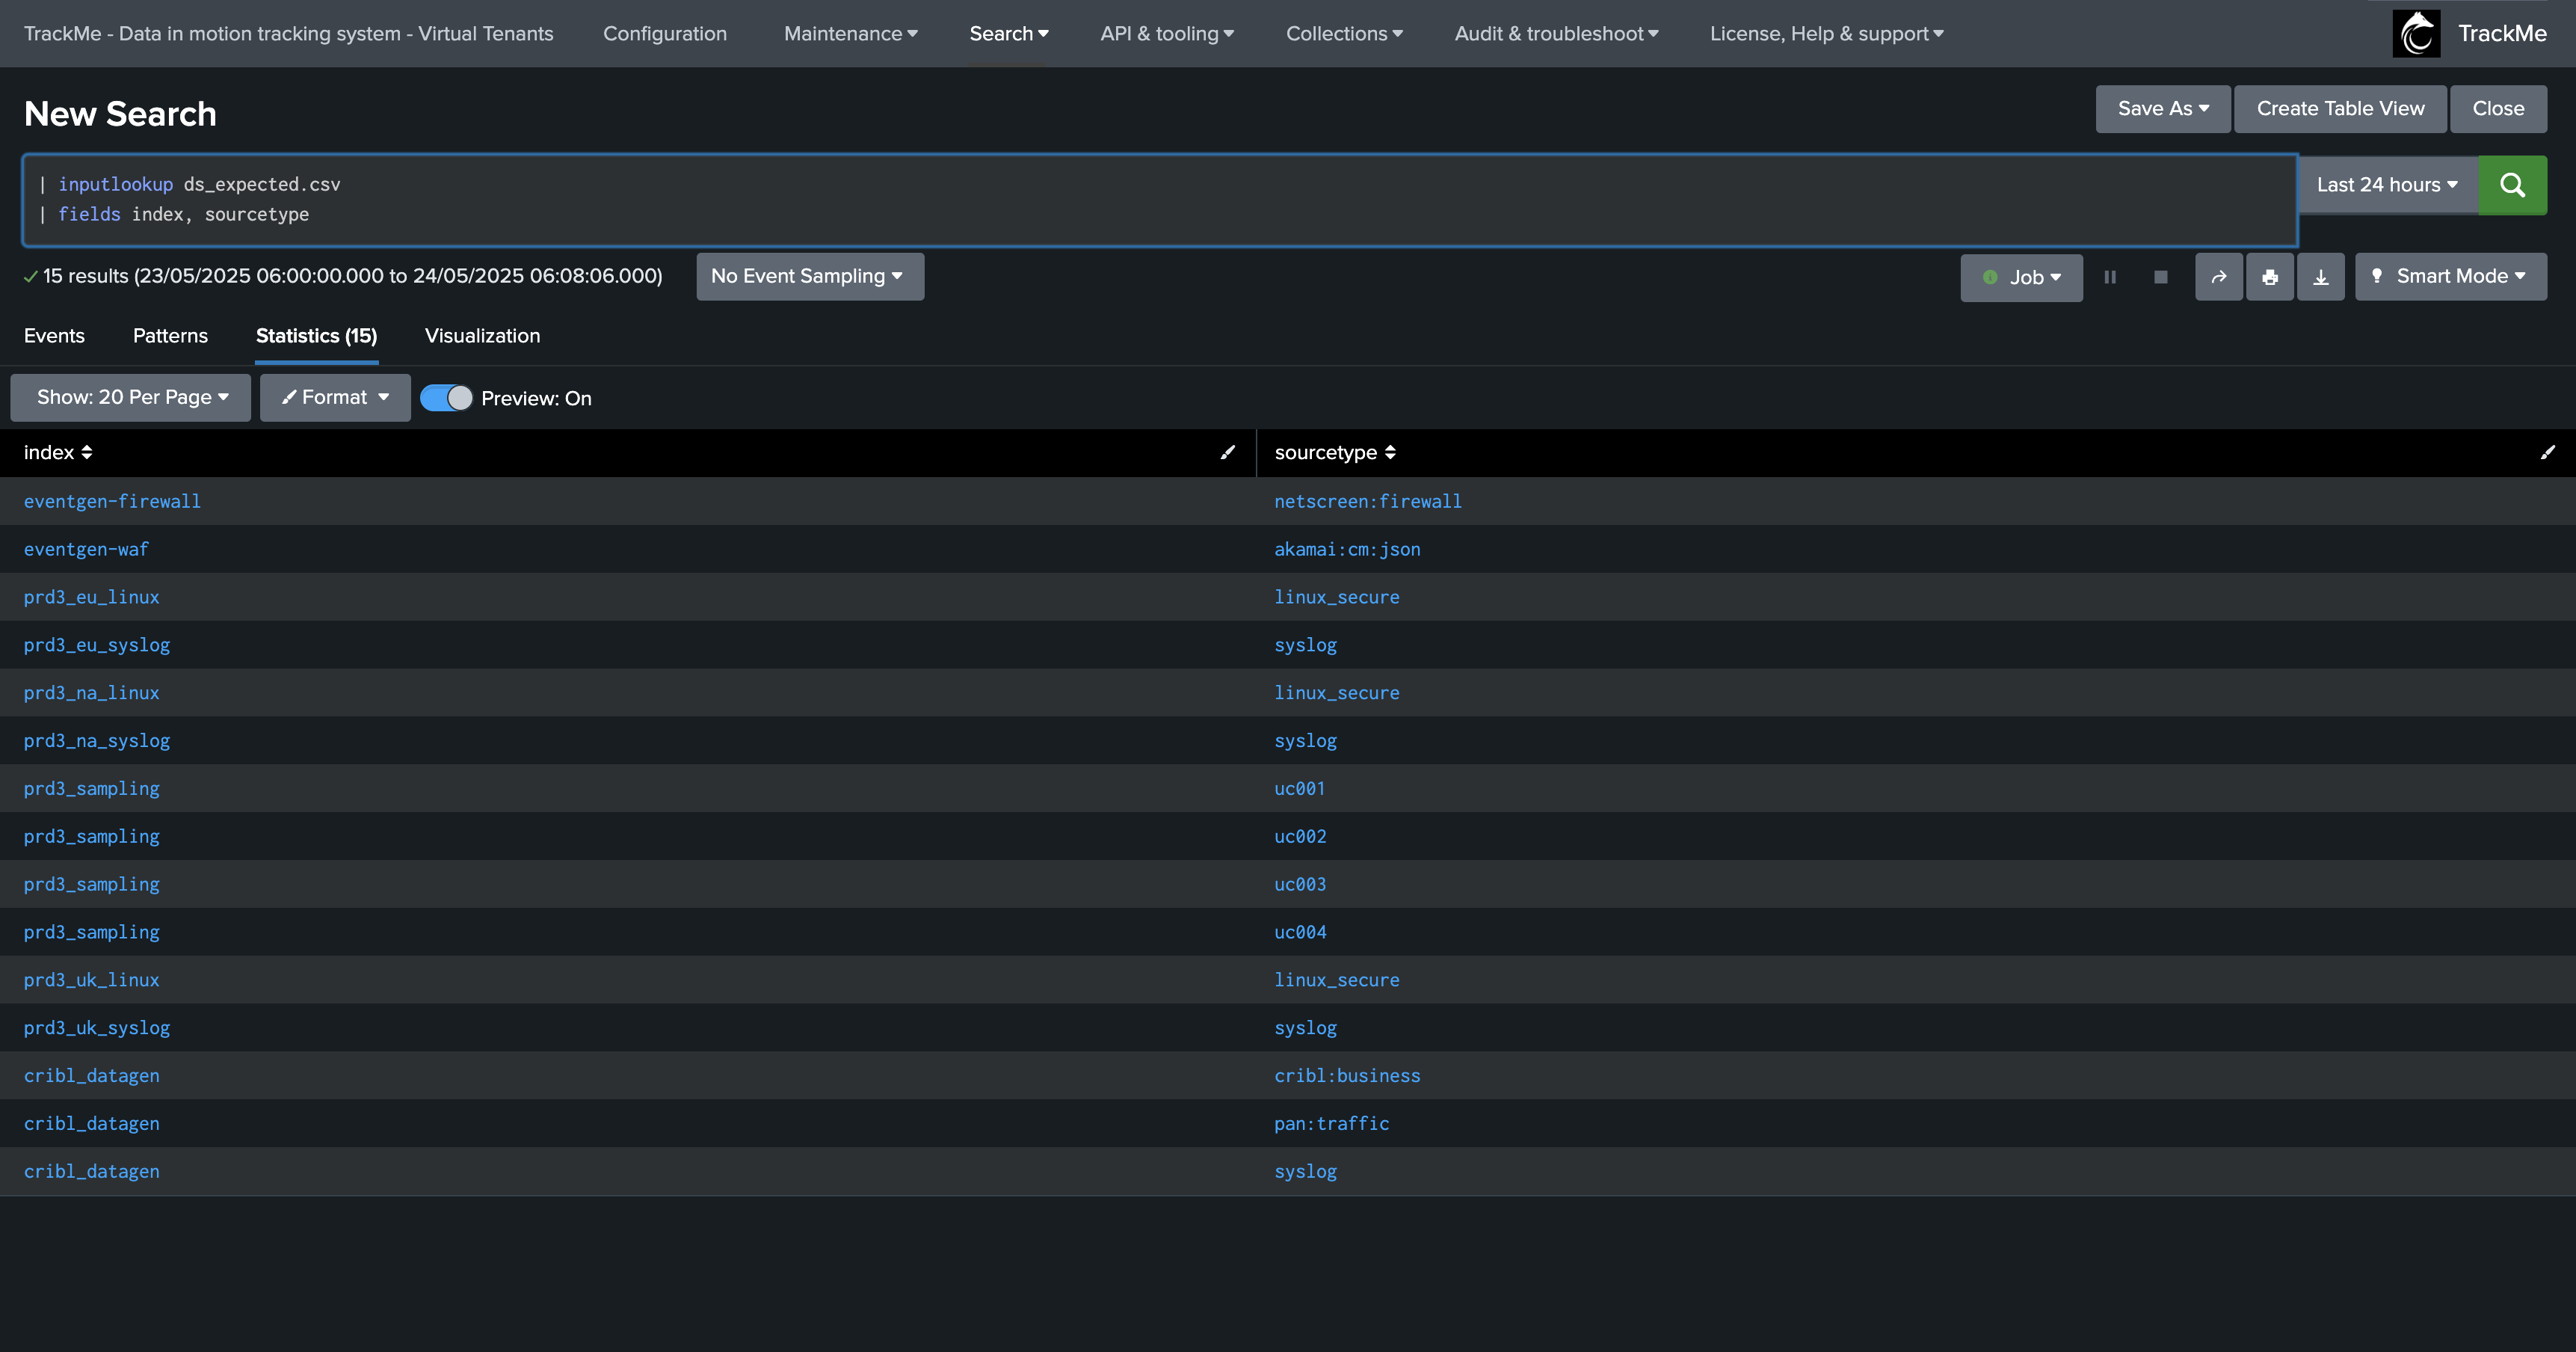
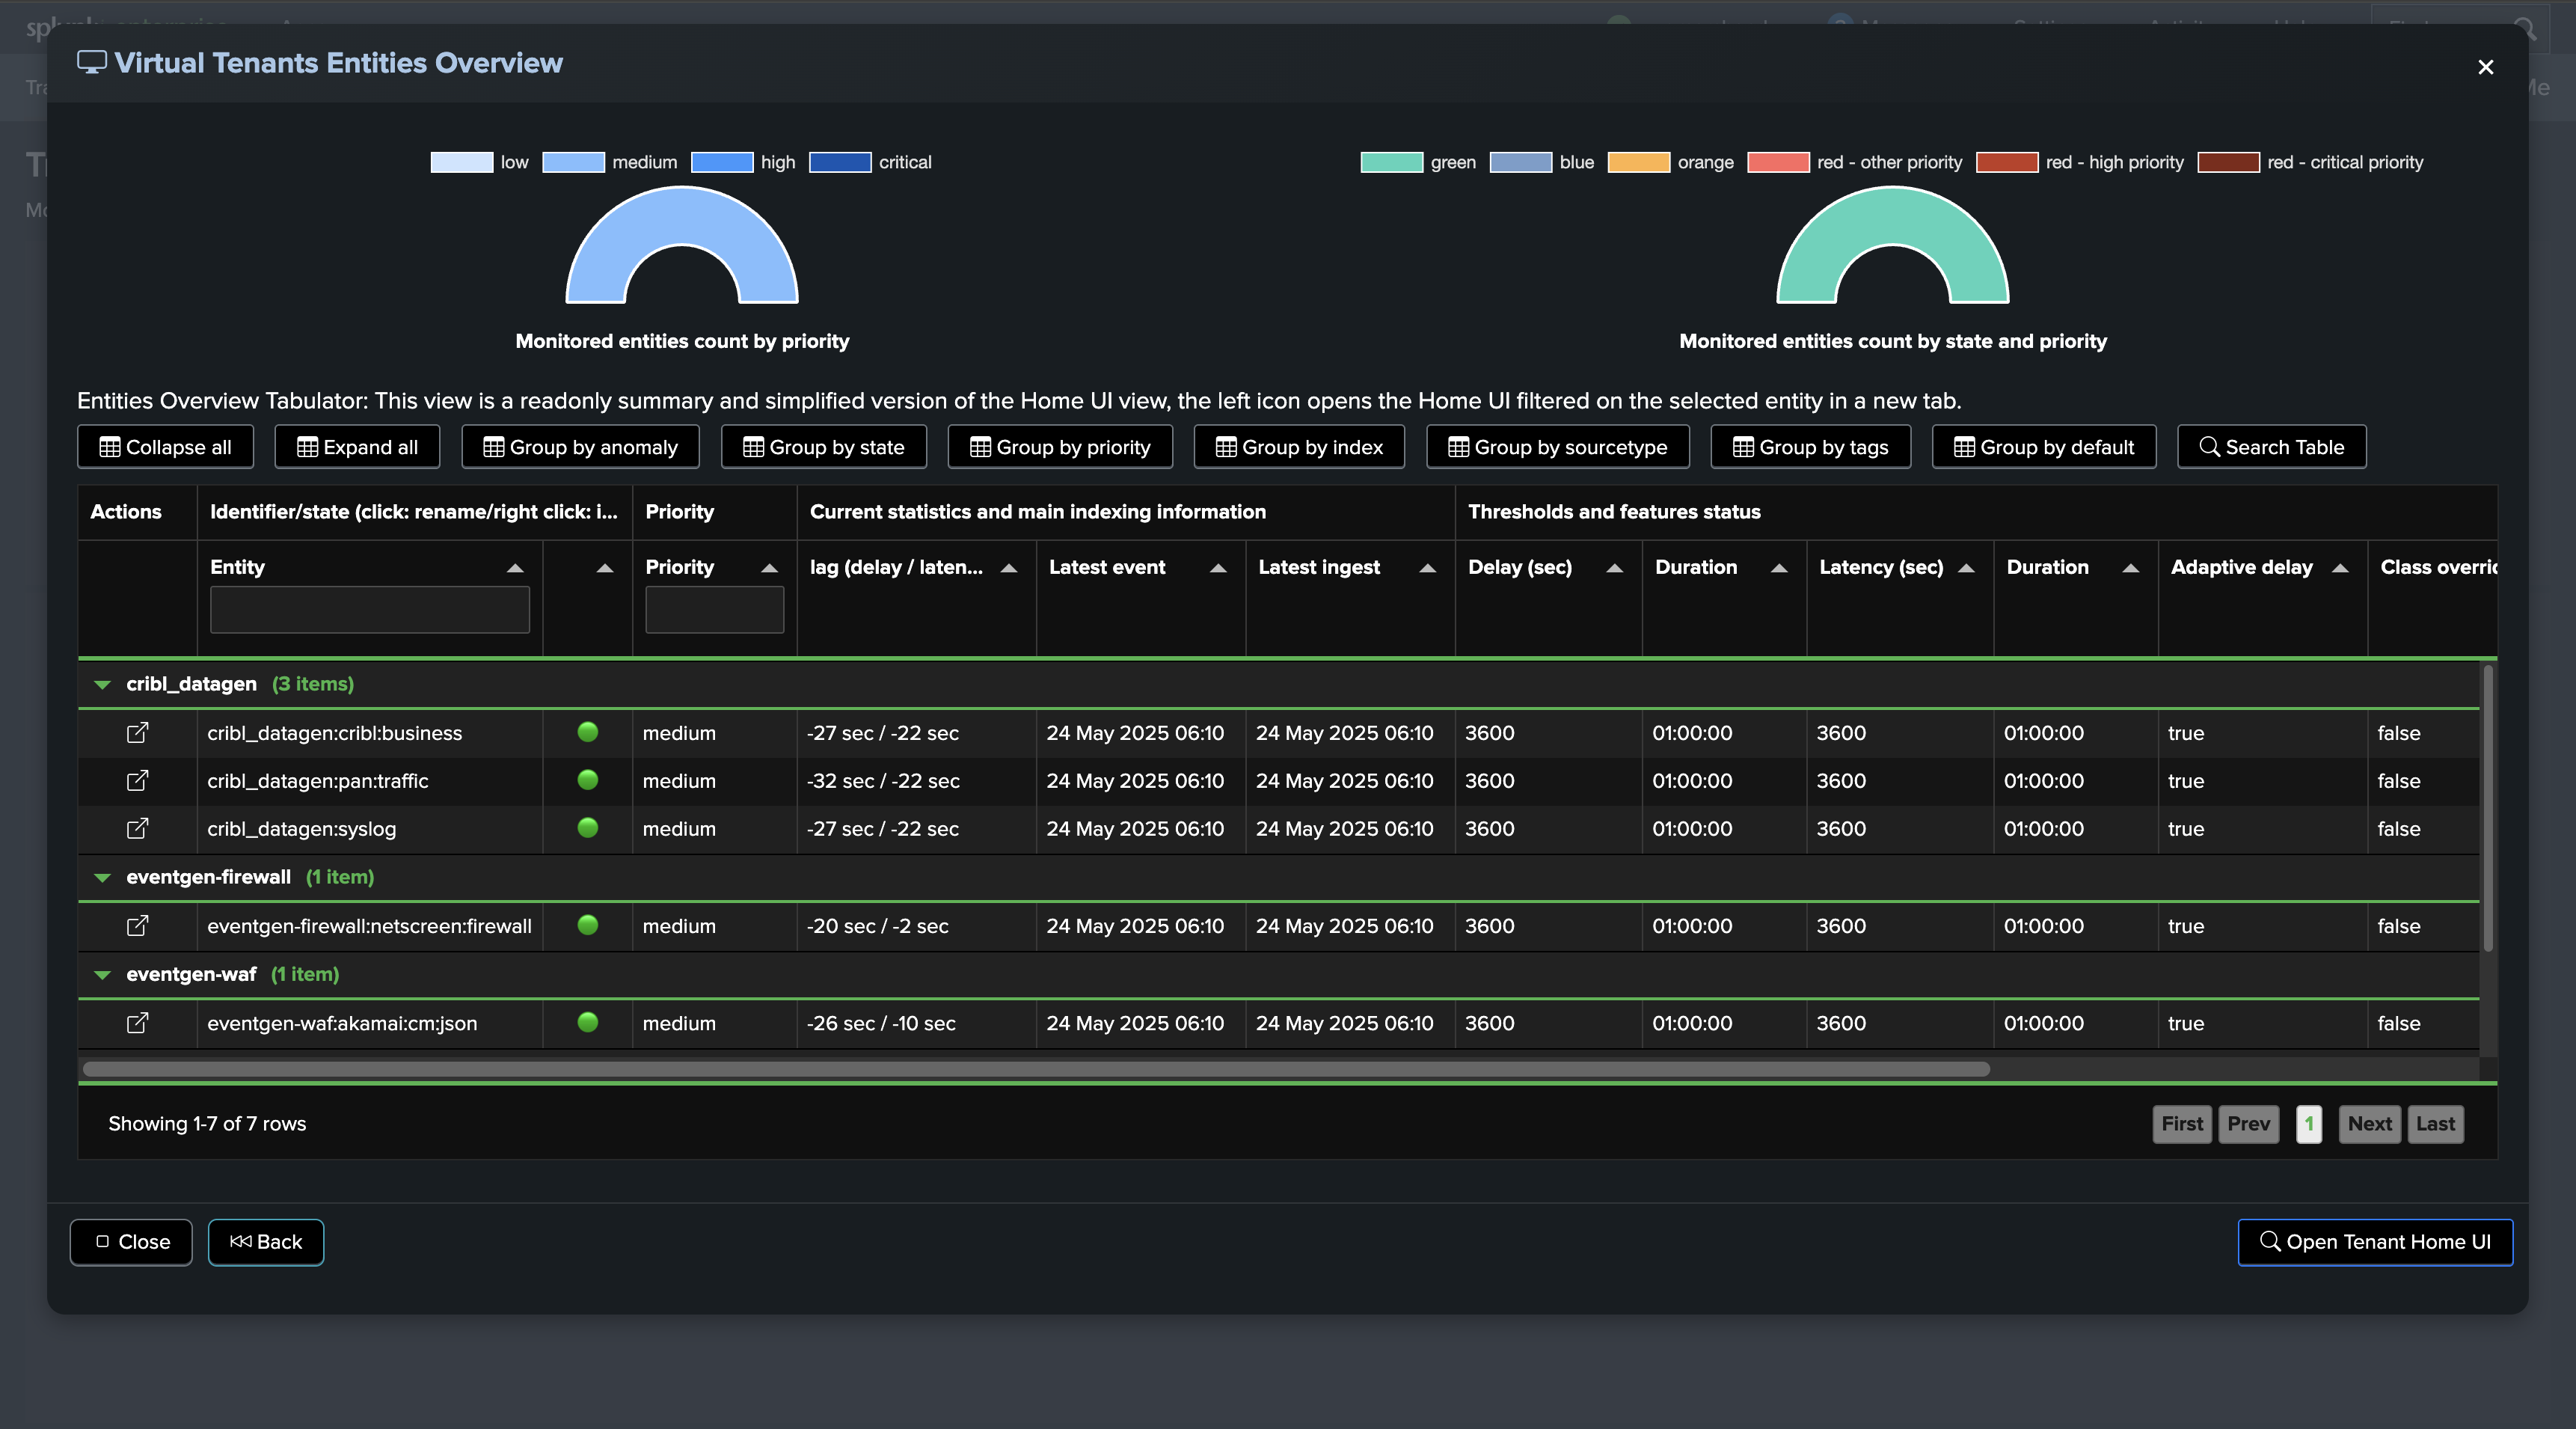
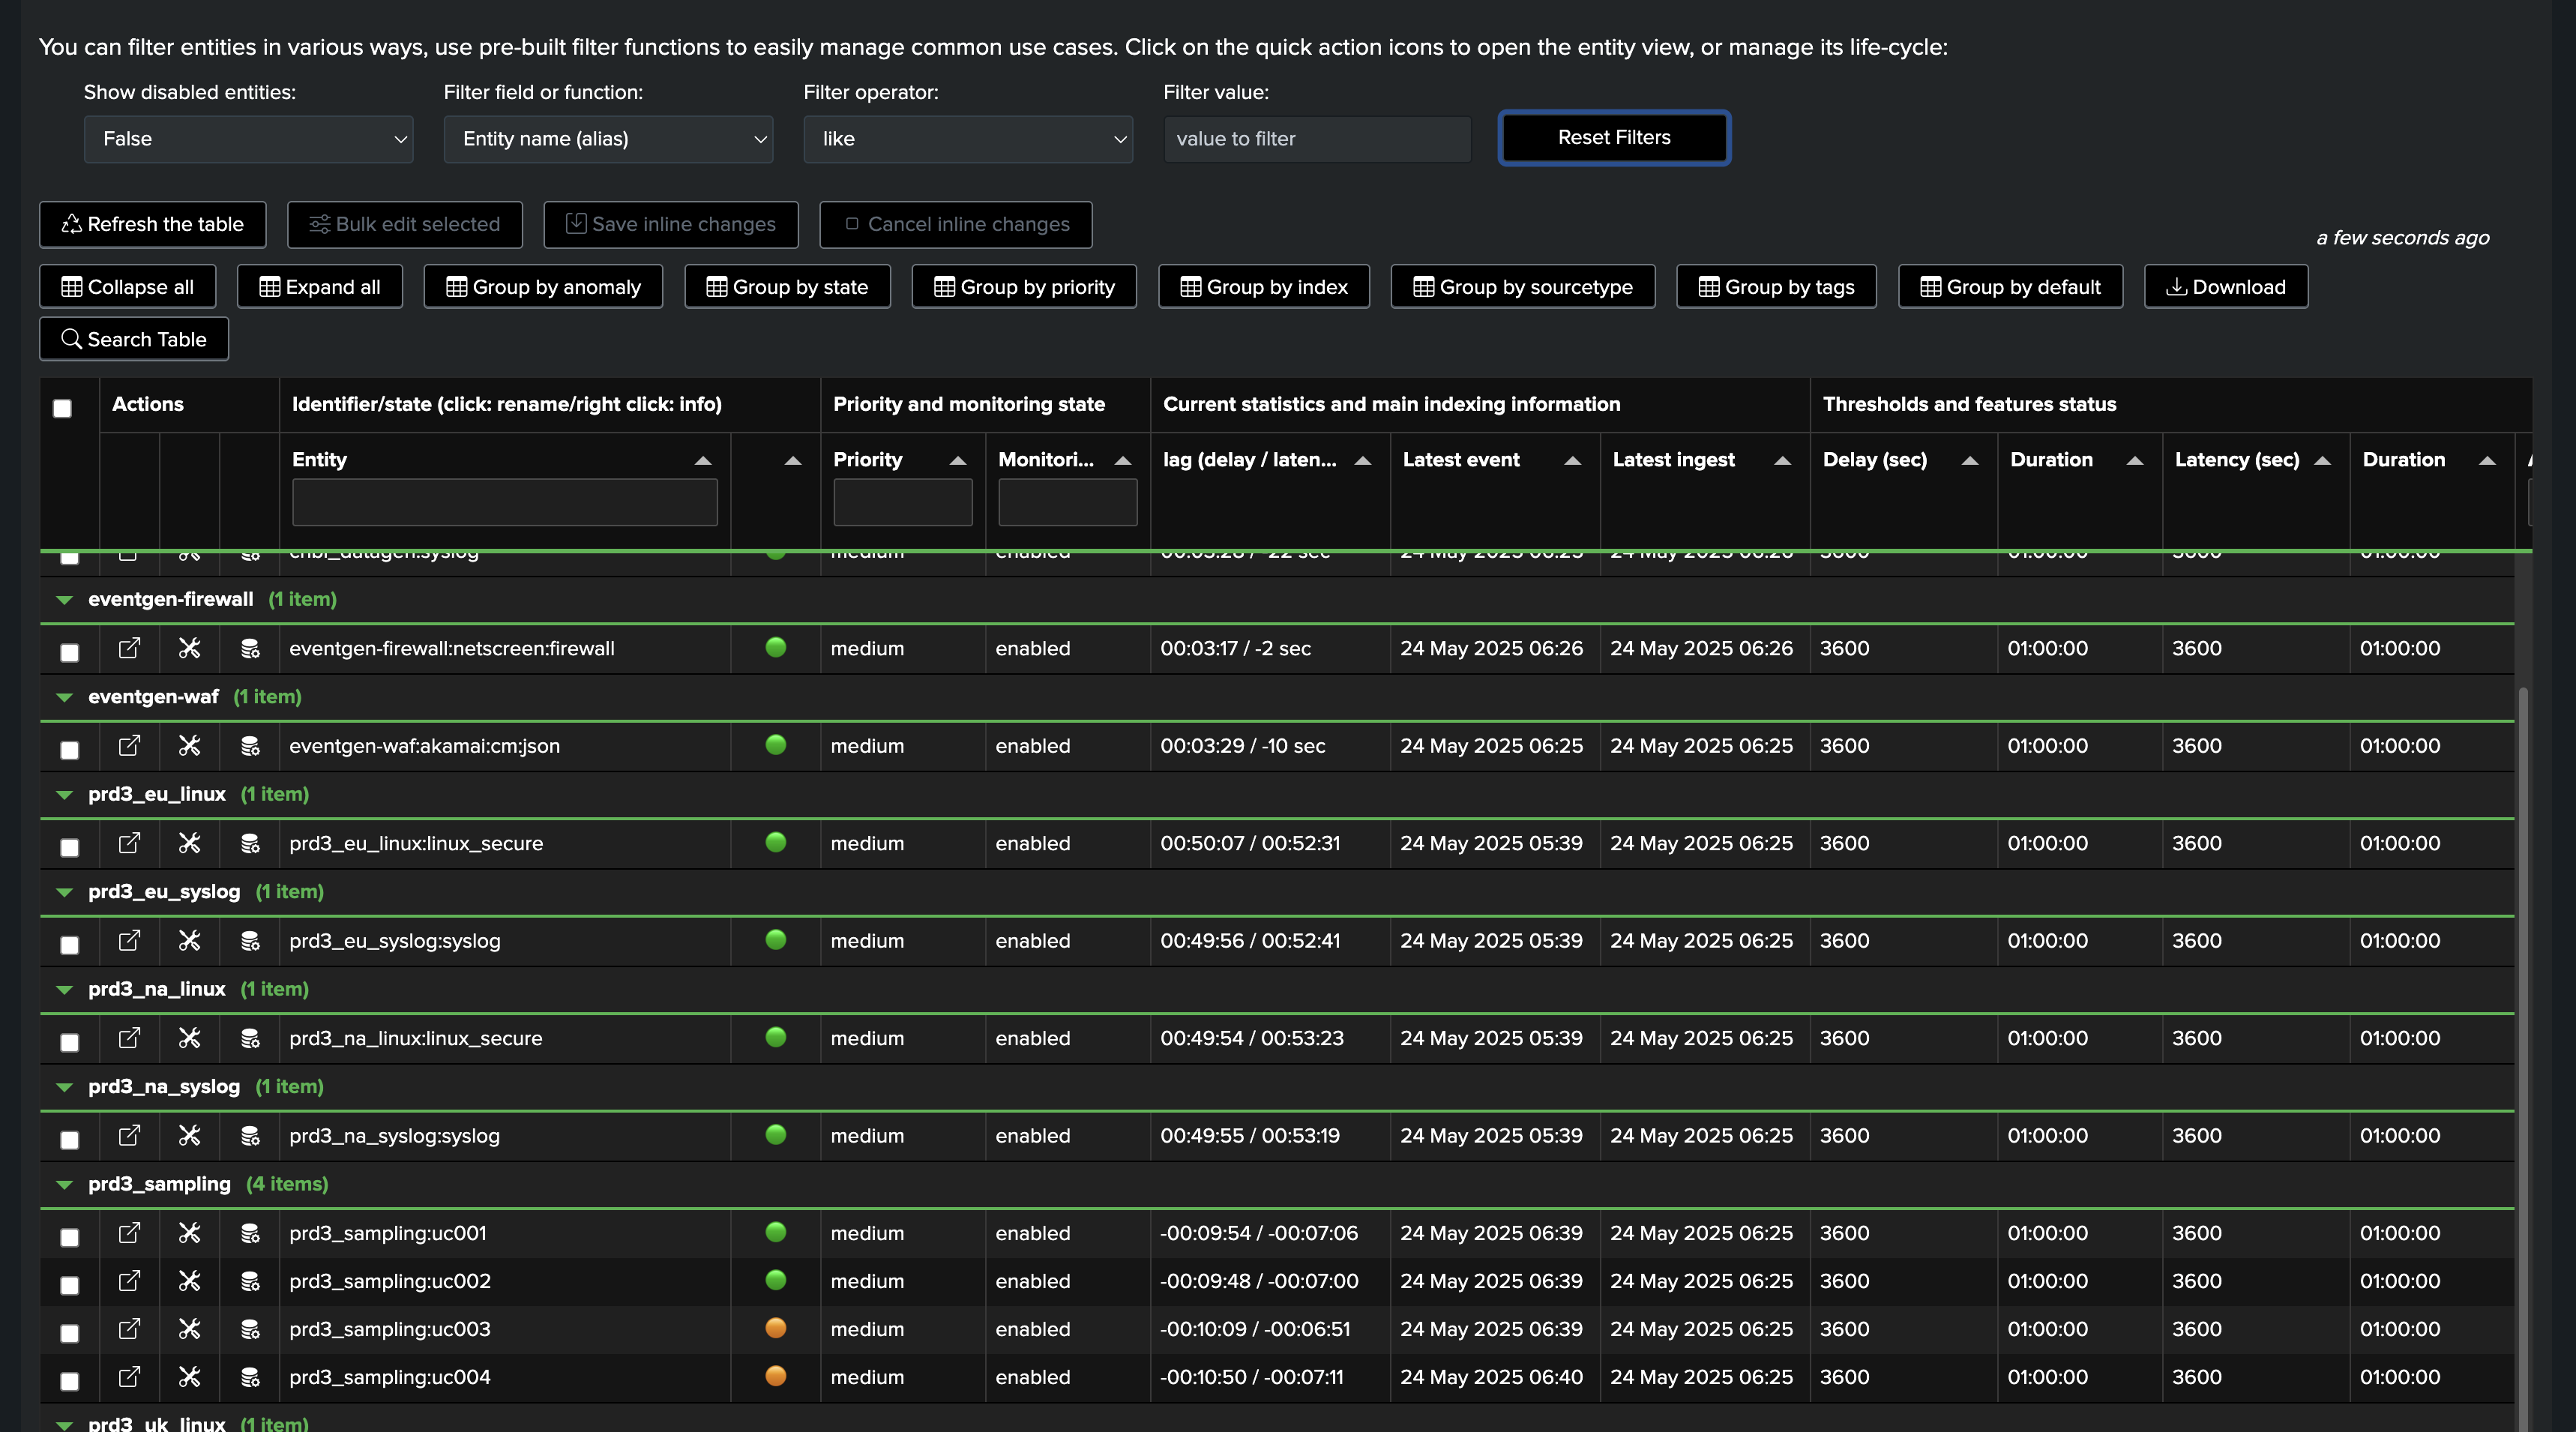
We have a Virtual Tenant called secops that is active and already contains a number of entities, some of which might already be part of the expected sources, but some might not:
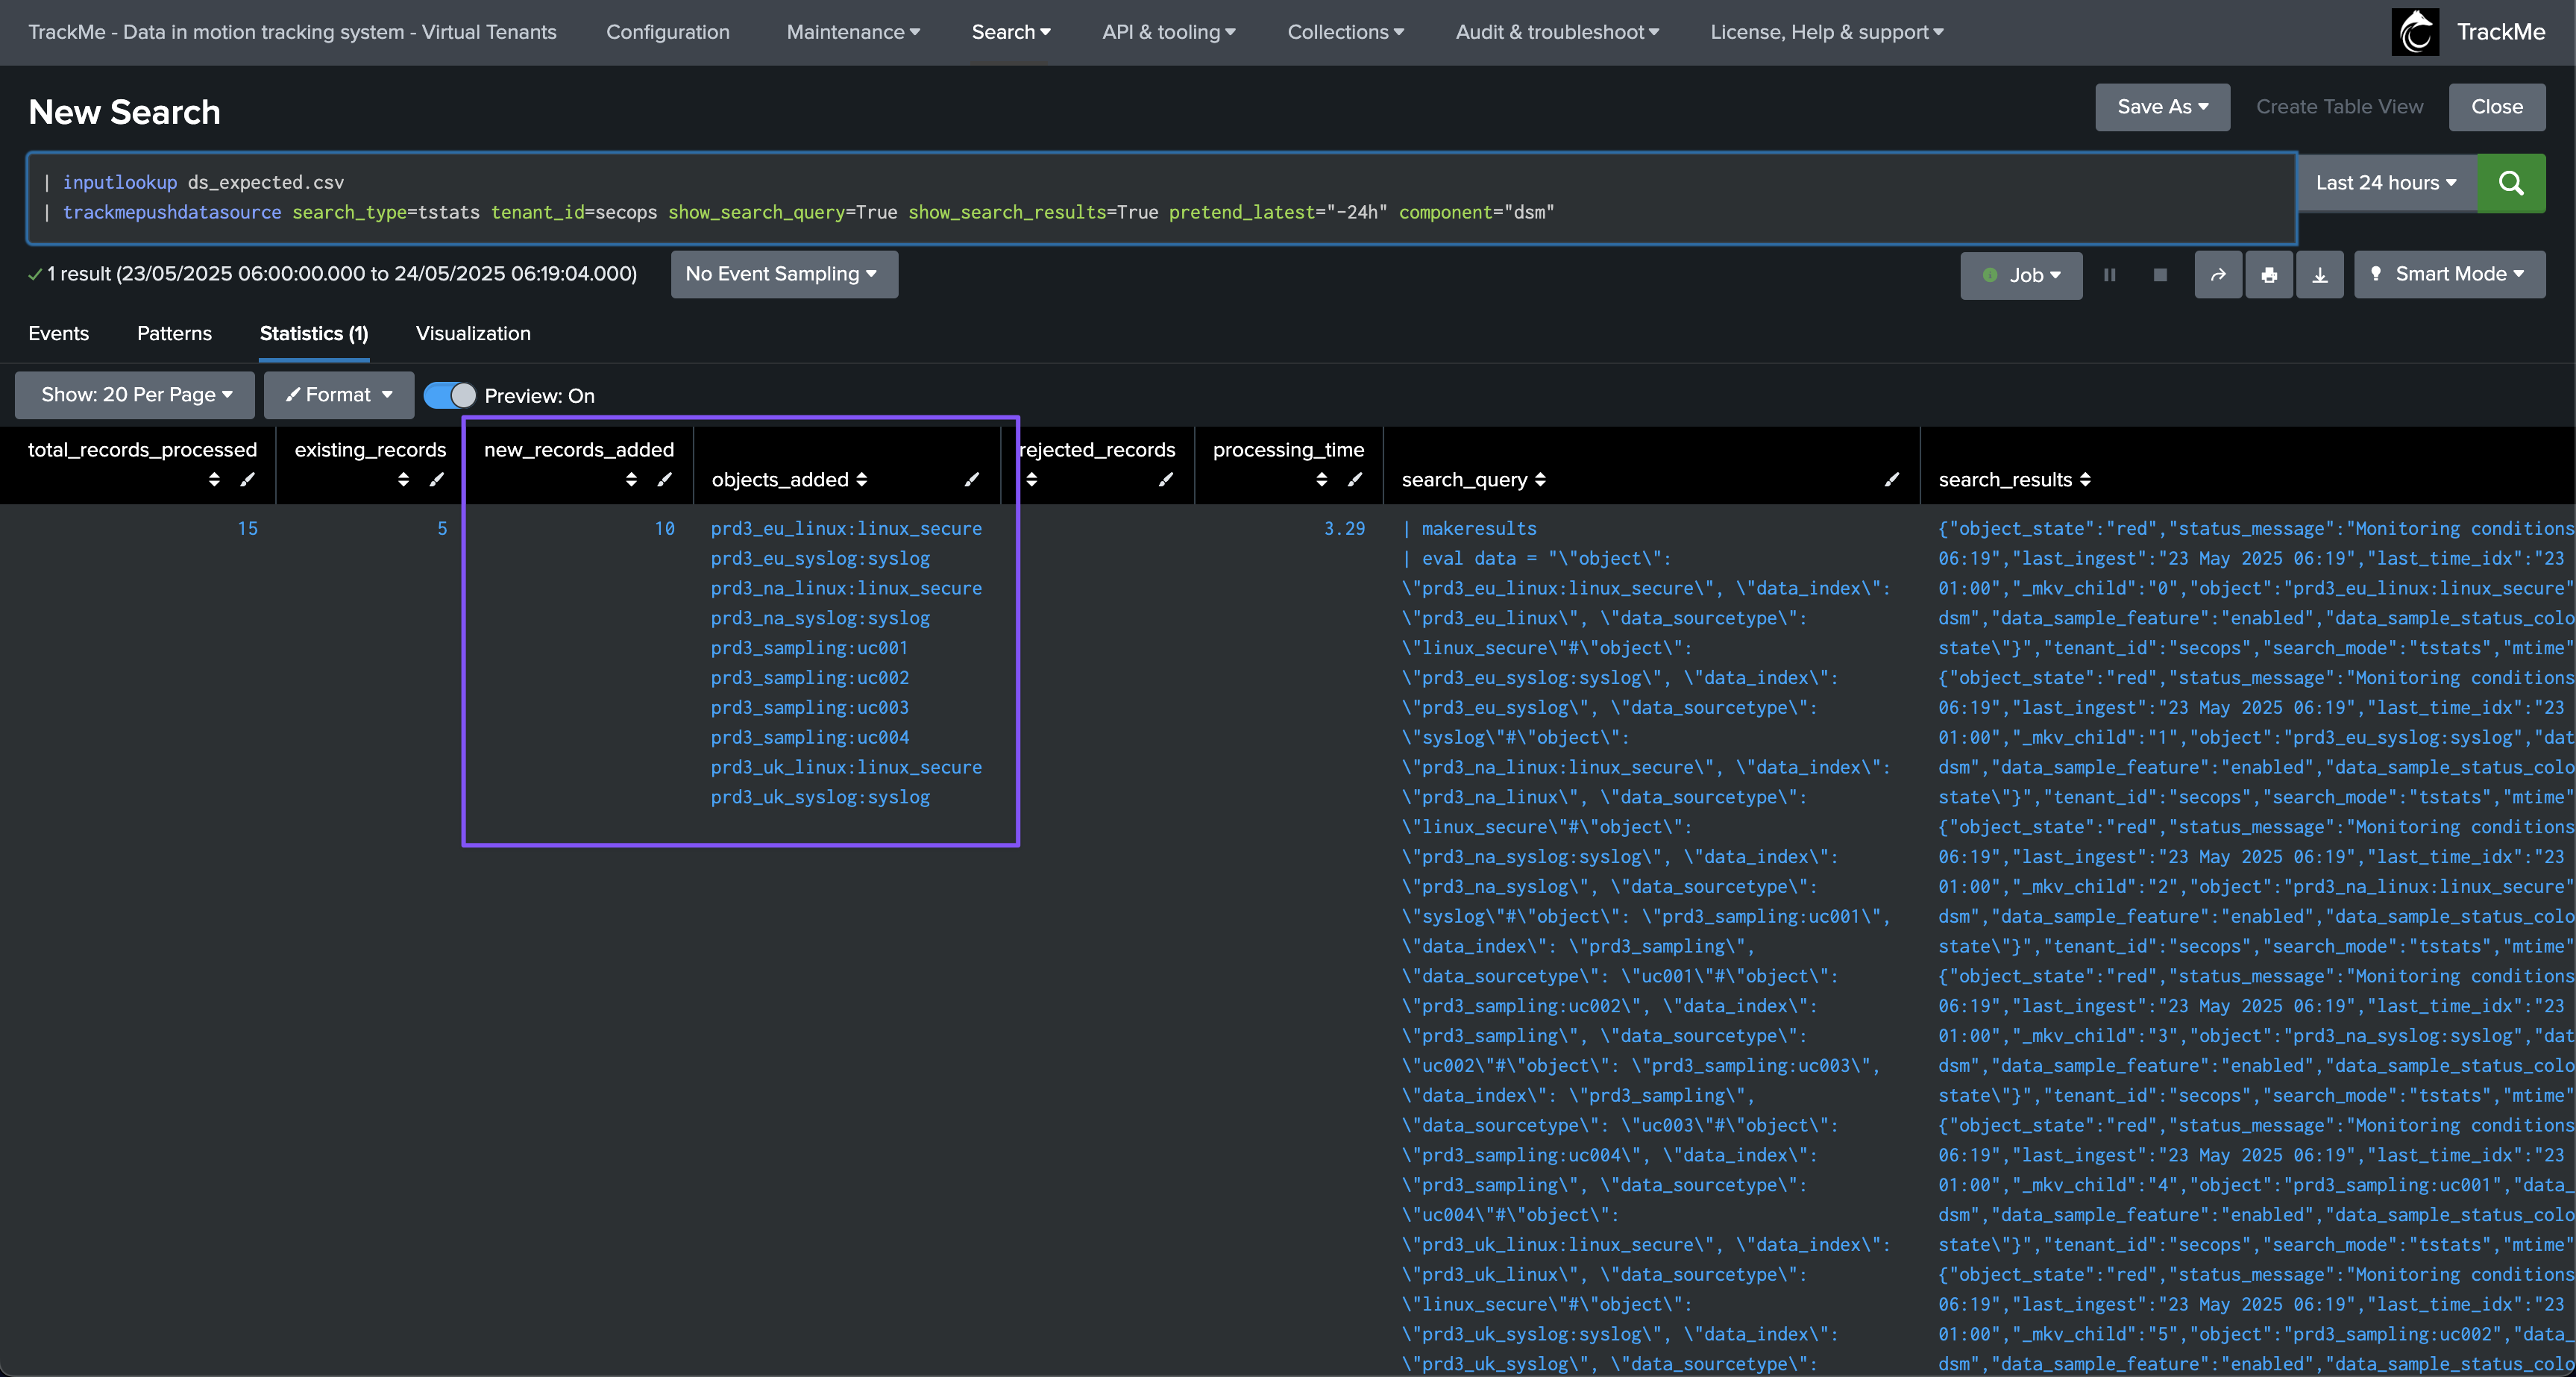
To push expected sources to TrackMe from the lookup file, we will call the streaming command trackmepushdatasource, which will:
Parse the records resulting from the
inputlookupcommandFor each pair of index and sourcetype, form the expected entity name in TrackMe (by default,
<index>:<sourcetype>)Verify if this entity already exists in TrackMe
Add to a search logic that will push entities as they are expected by the discovery process
Finally, execute the search logic, which pushes entities as needed and expected
We will call the following command:
Replace the tenant name, in our case called secops
| inputlookup ds_expected.csv
| trackmepushdatasource search_type=tstats tenant_id=secops show_search_query=True show_search_results=True pretend_latest="-24h" component="dsm"
Depending on the results, the command returns the list of added entities, rejected records (if any), and other useful information:
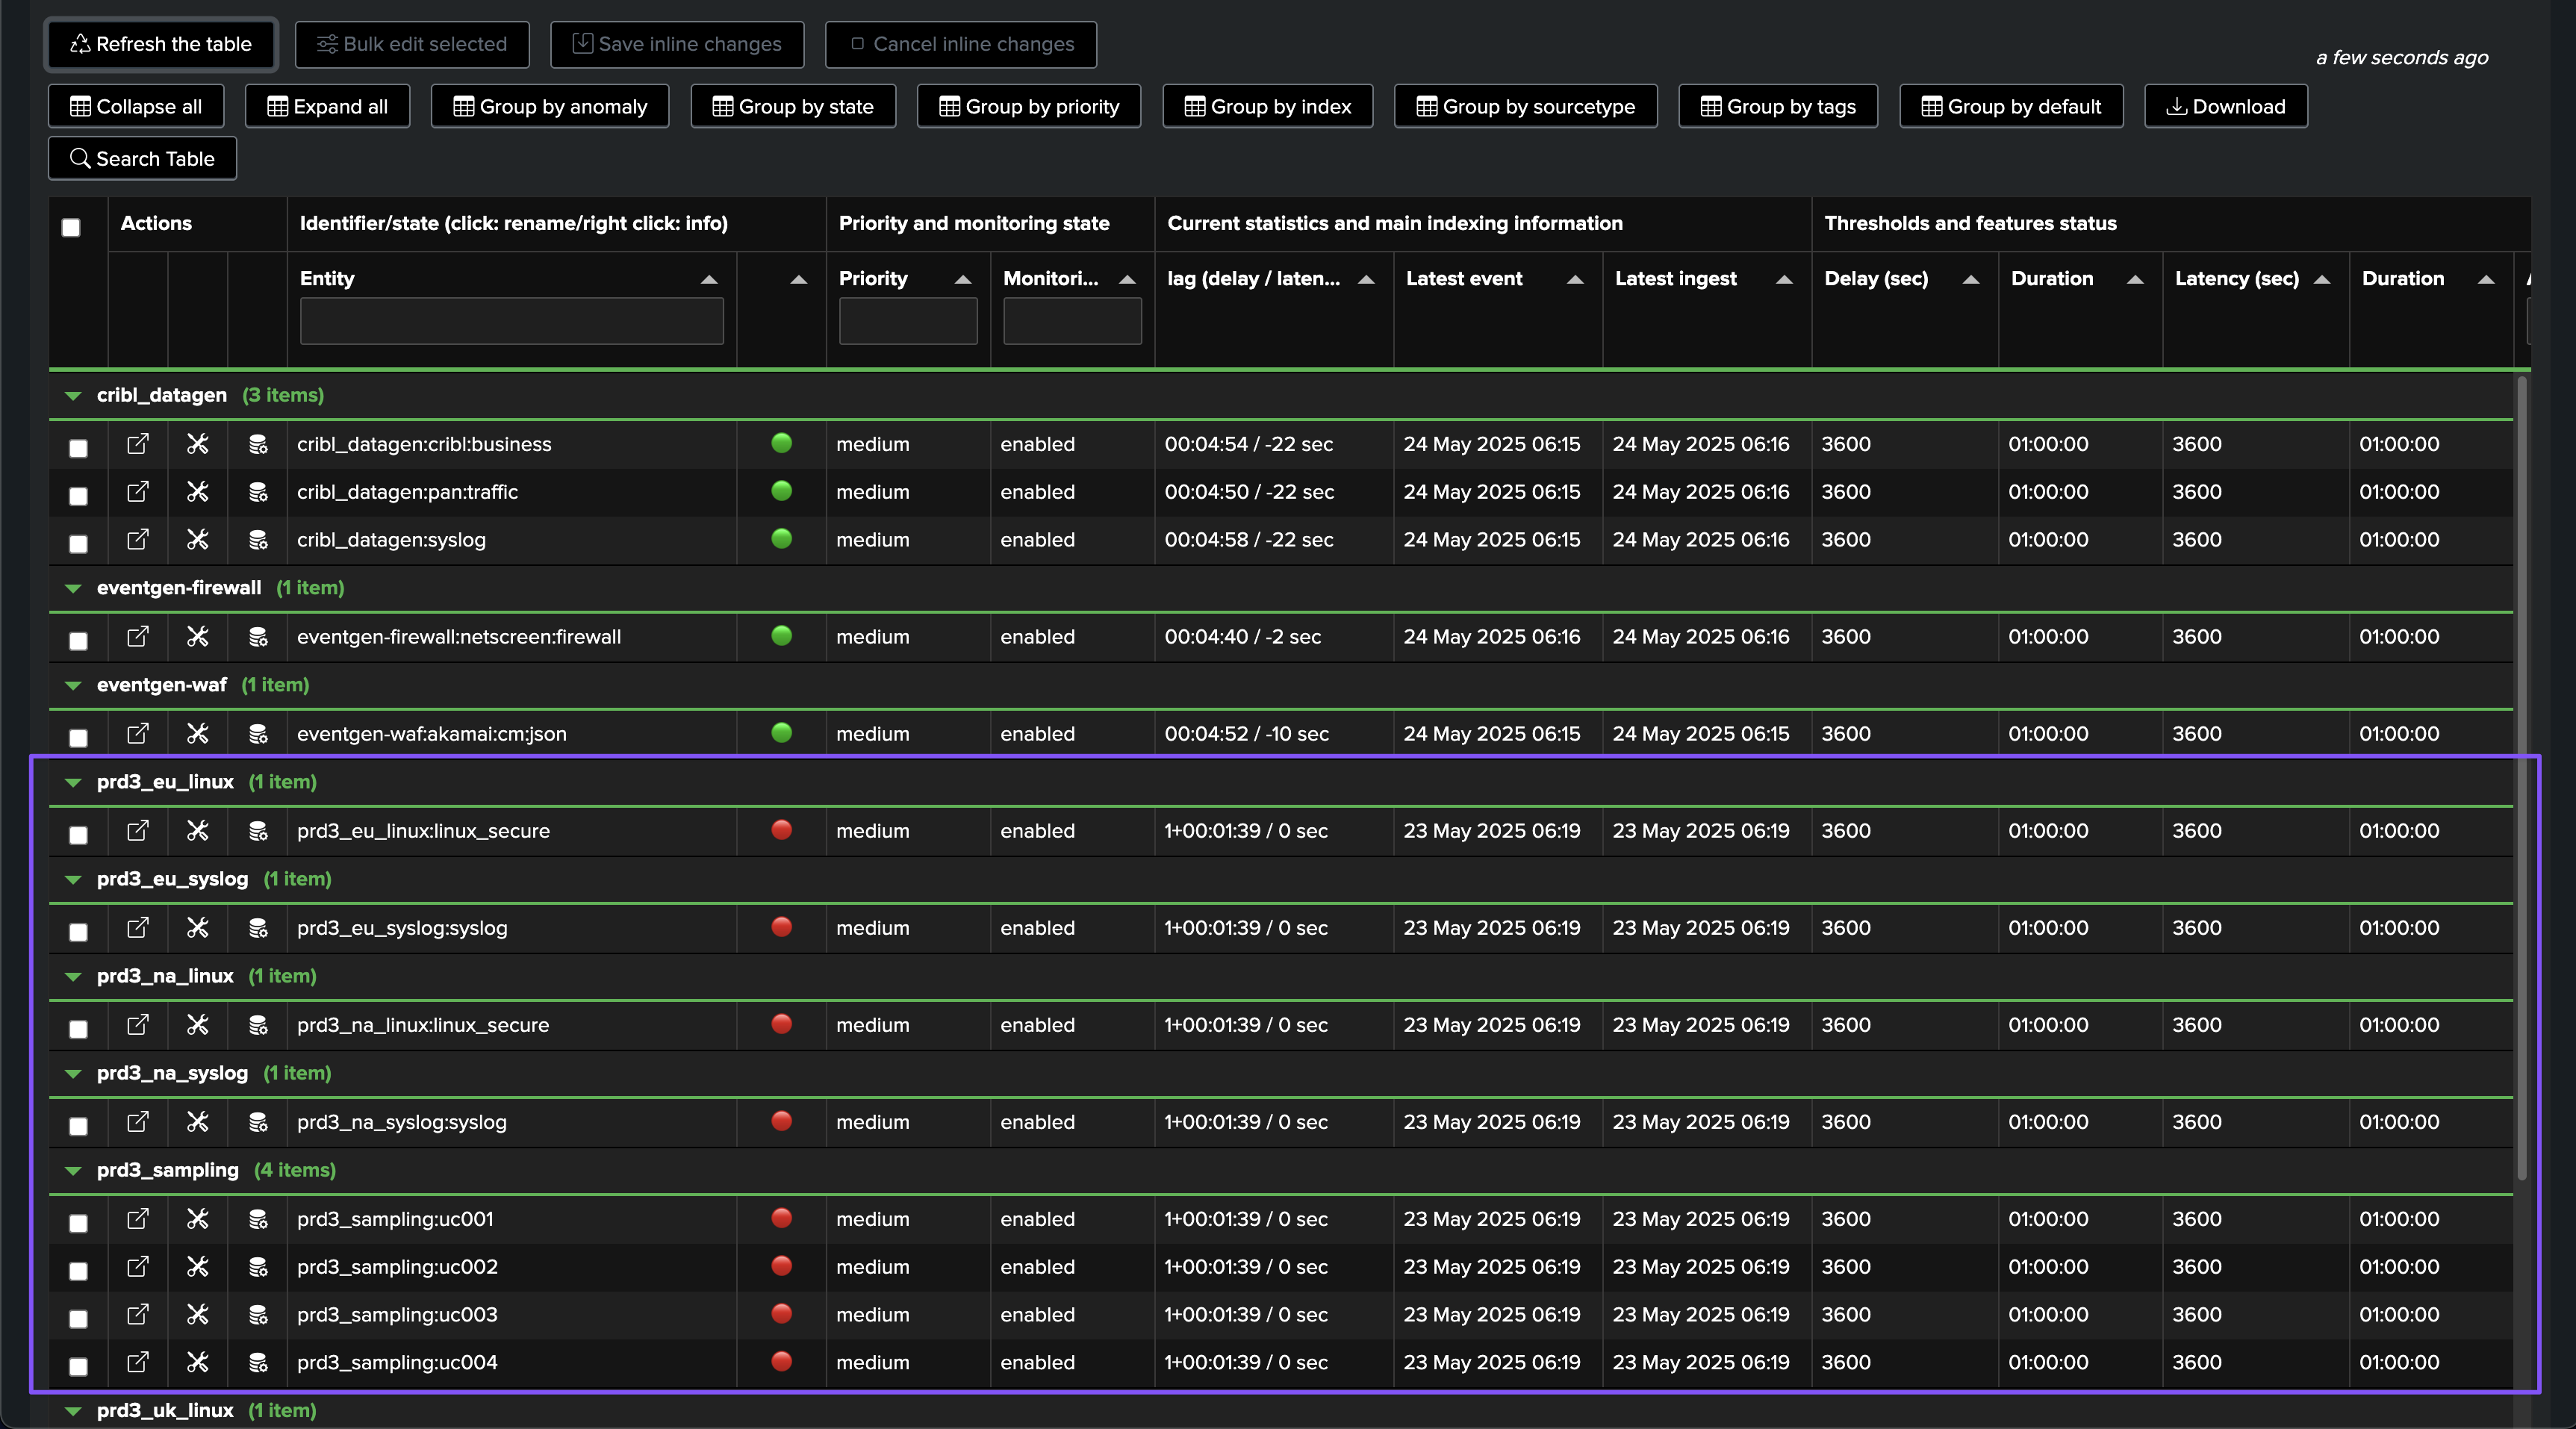
In TrackMe, these entities are now visible and in a red state:
As soon as trackers are executed, and if these sources are active and within the scope of the trackers, these entities will appear as green in TrackMe, assuming their status is healthy:
Give it some time; it may take a while before the entities are updated in TrackMe, depending on the conditions.
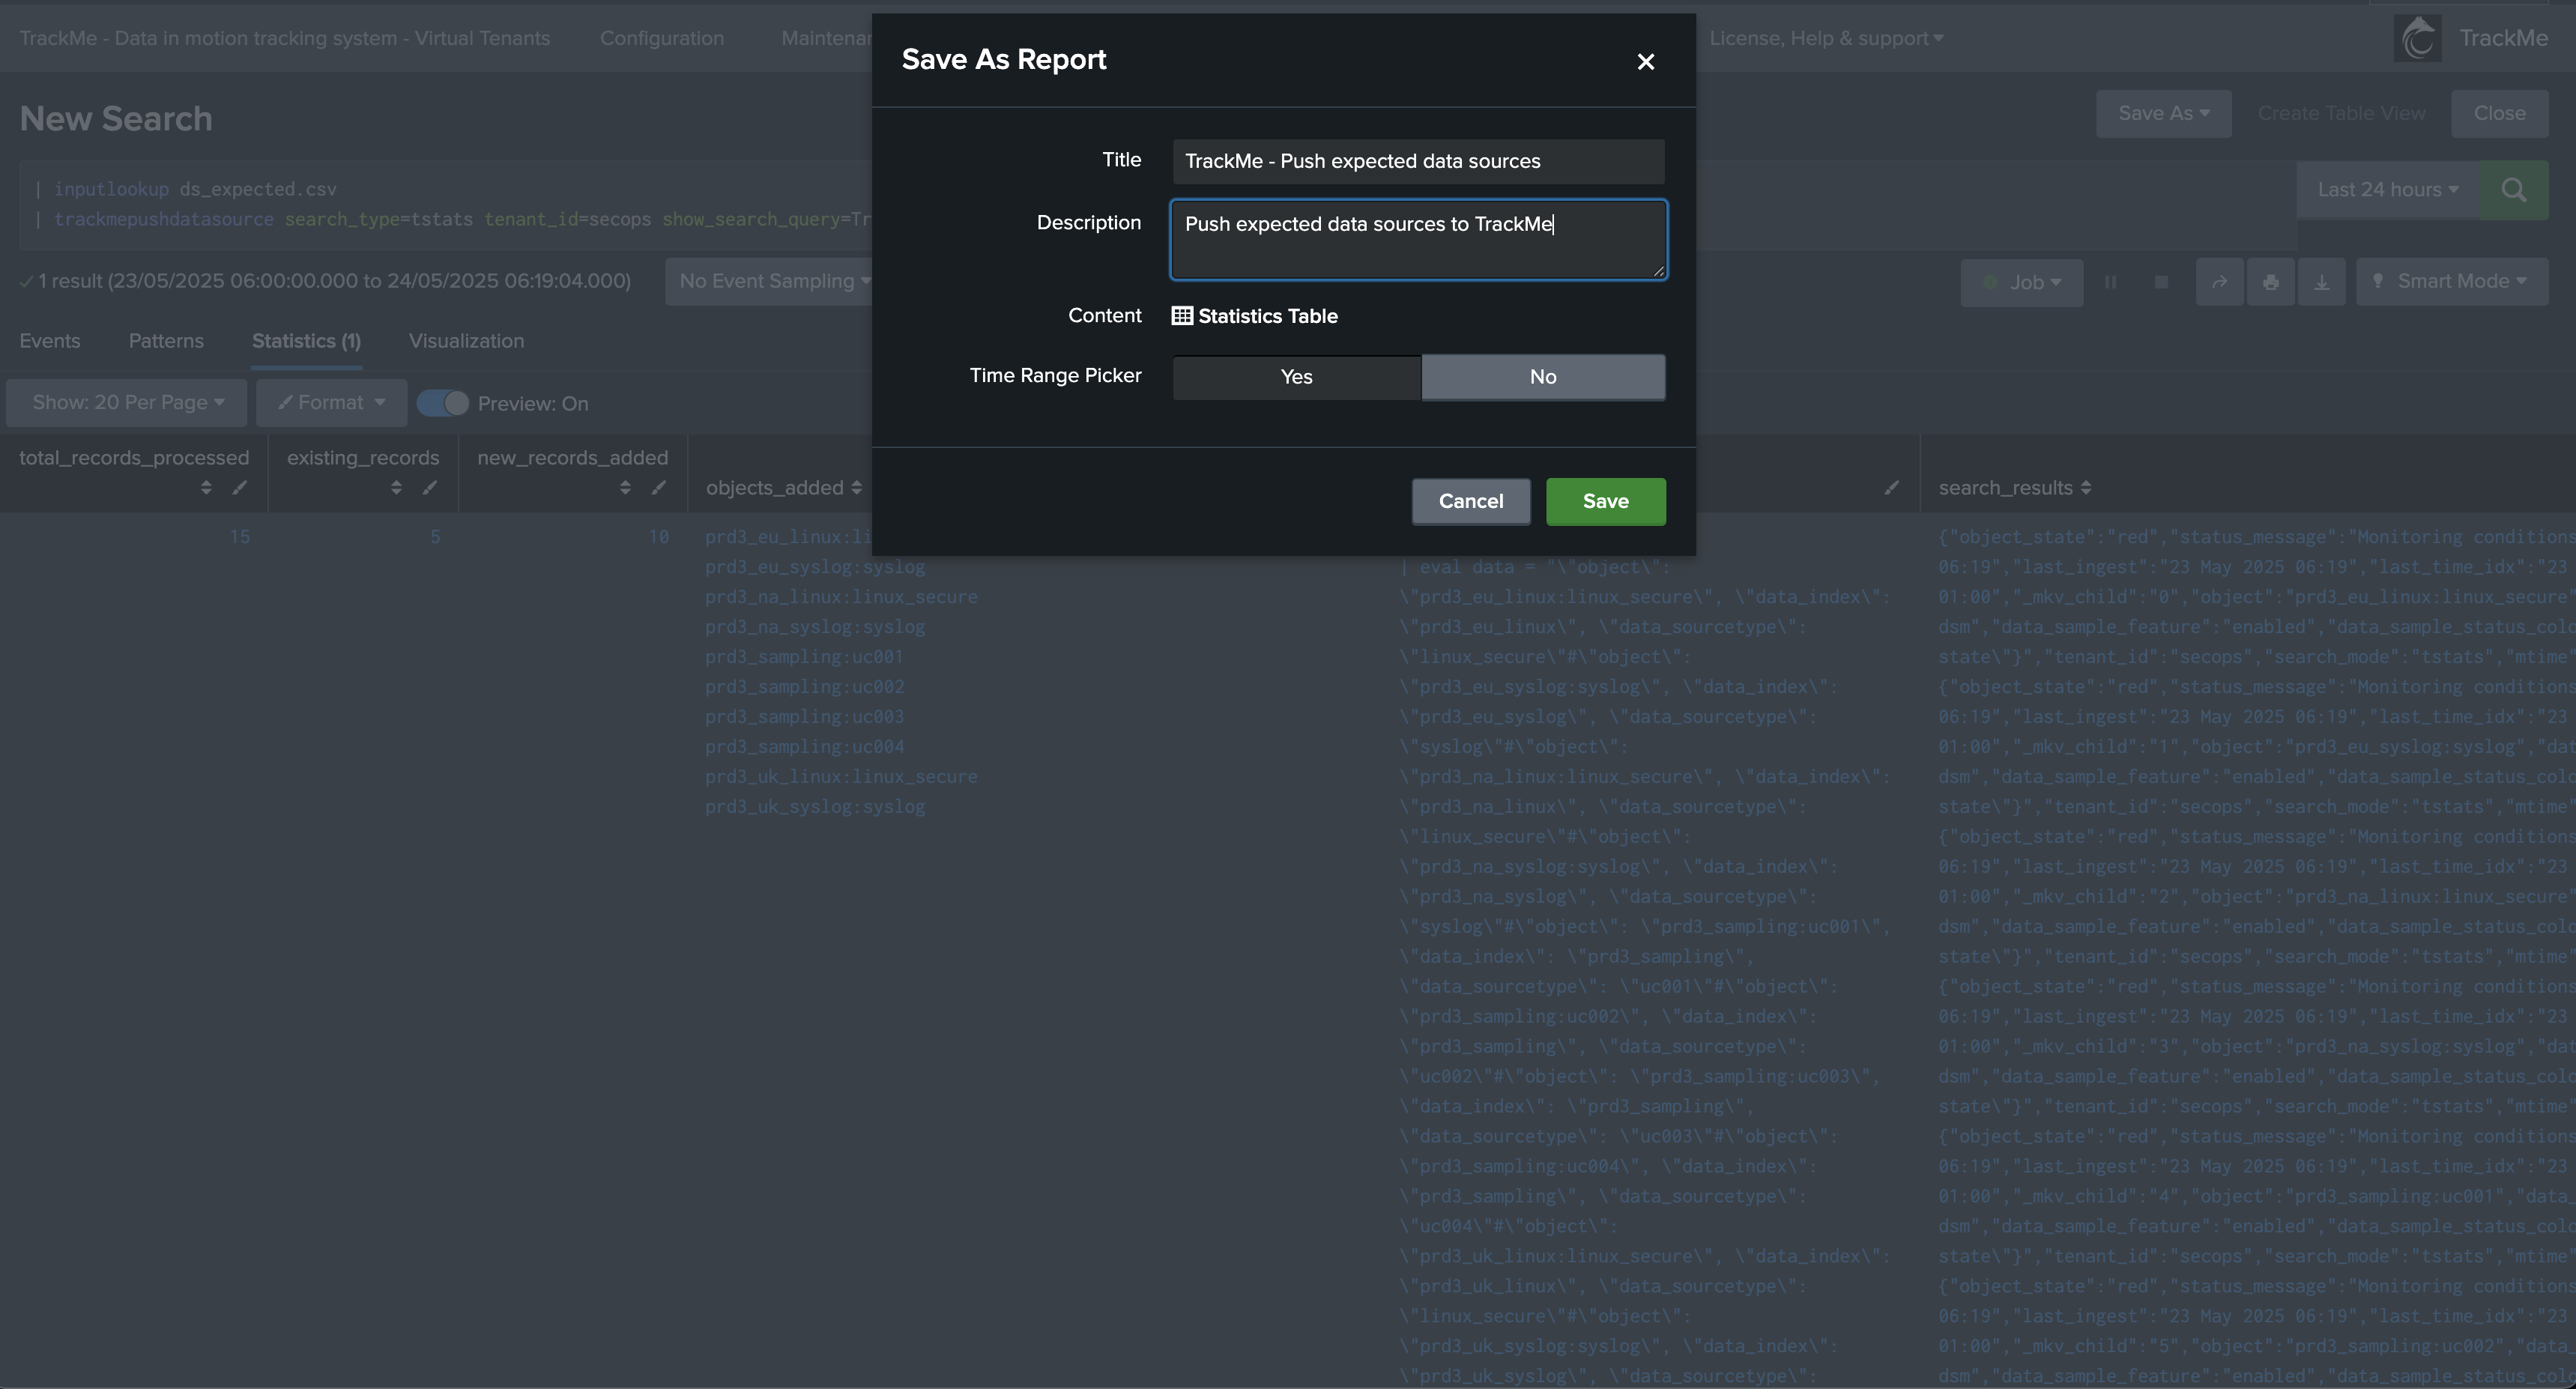
Finally, save this as a report and schedule it according to your preferences, for instance, once per day:
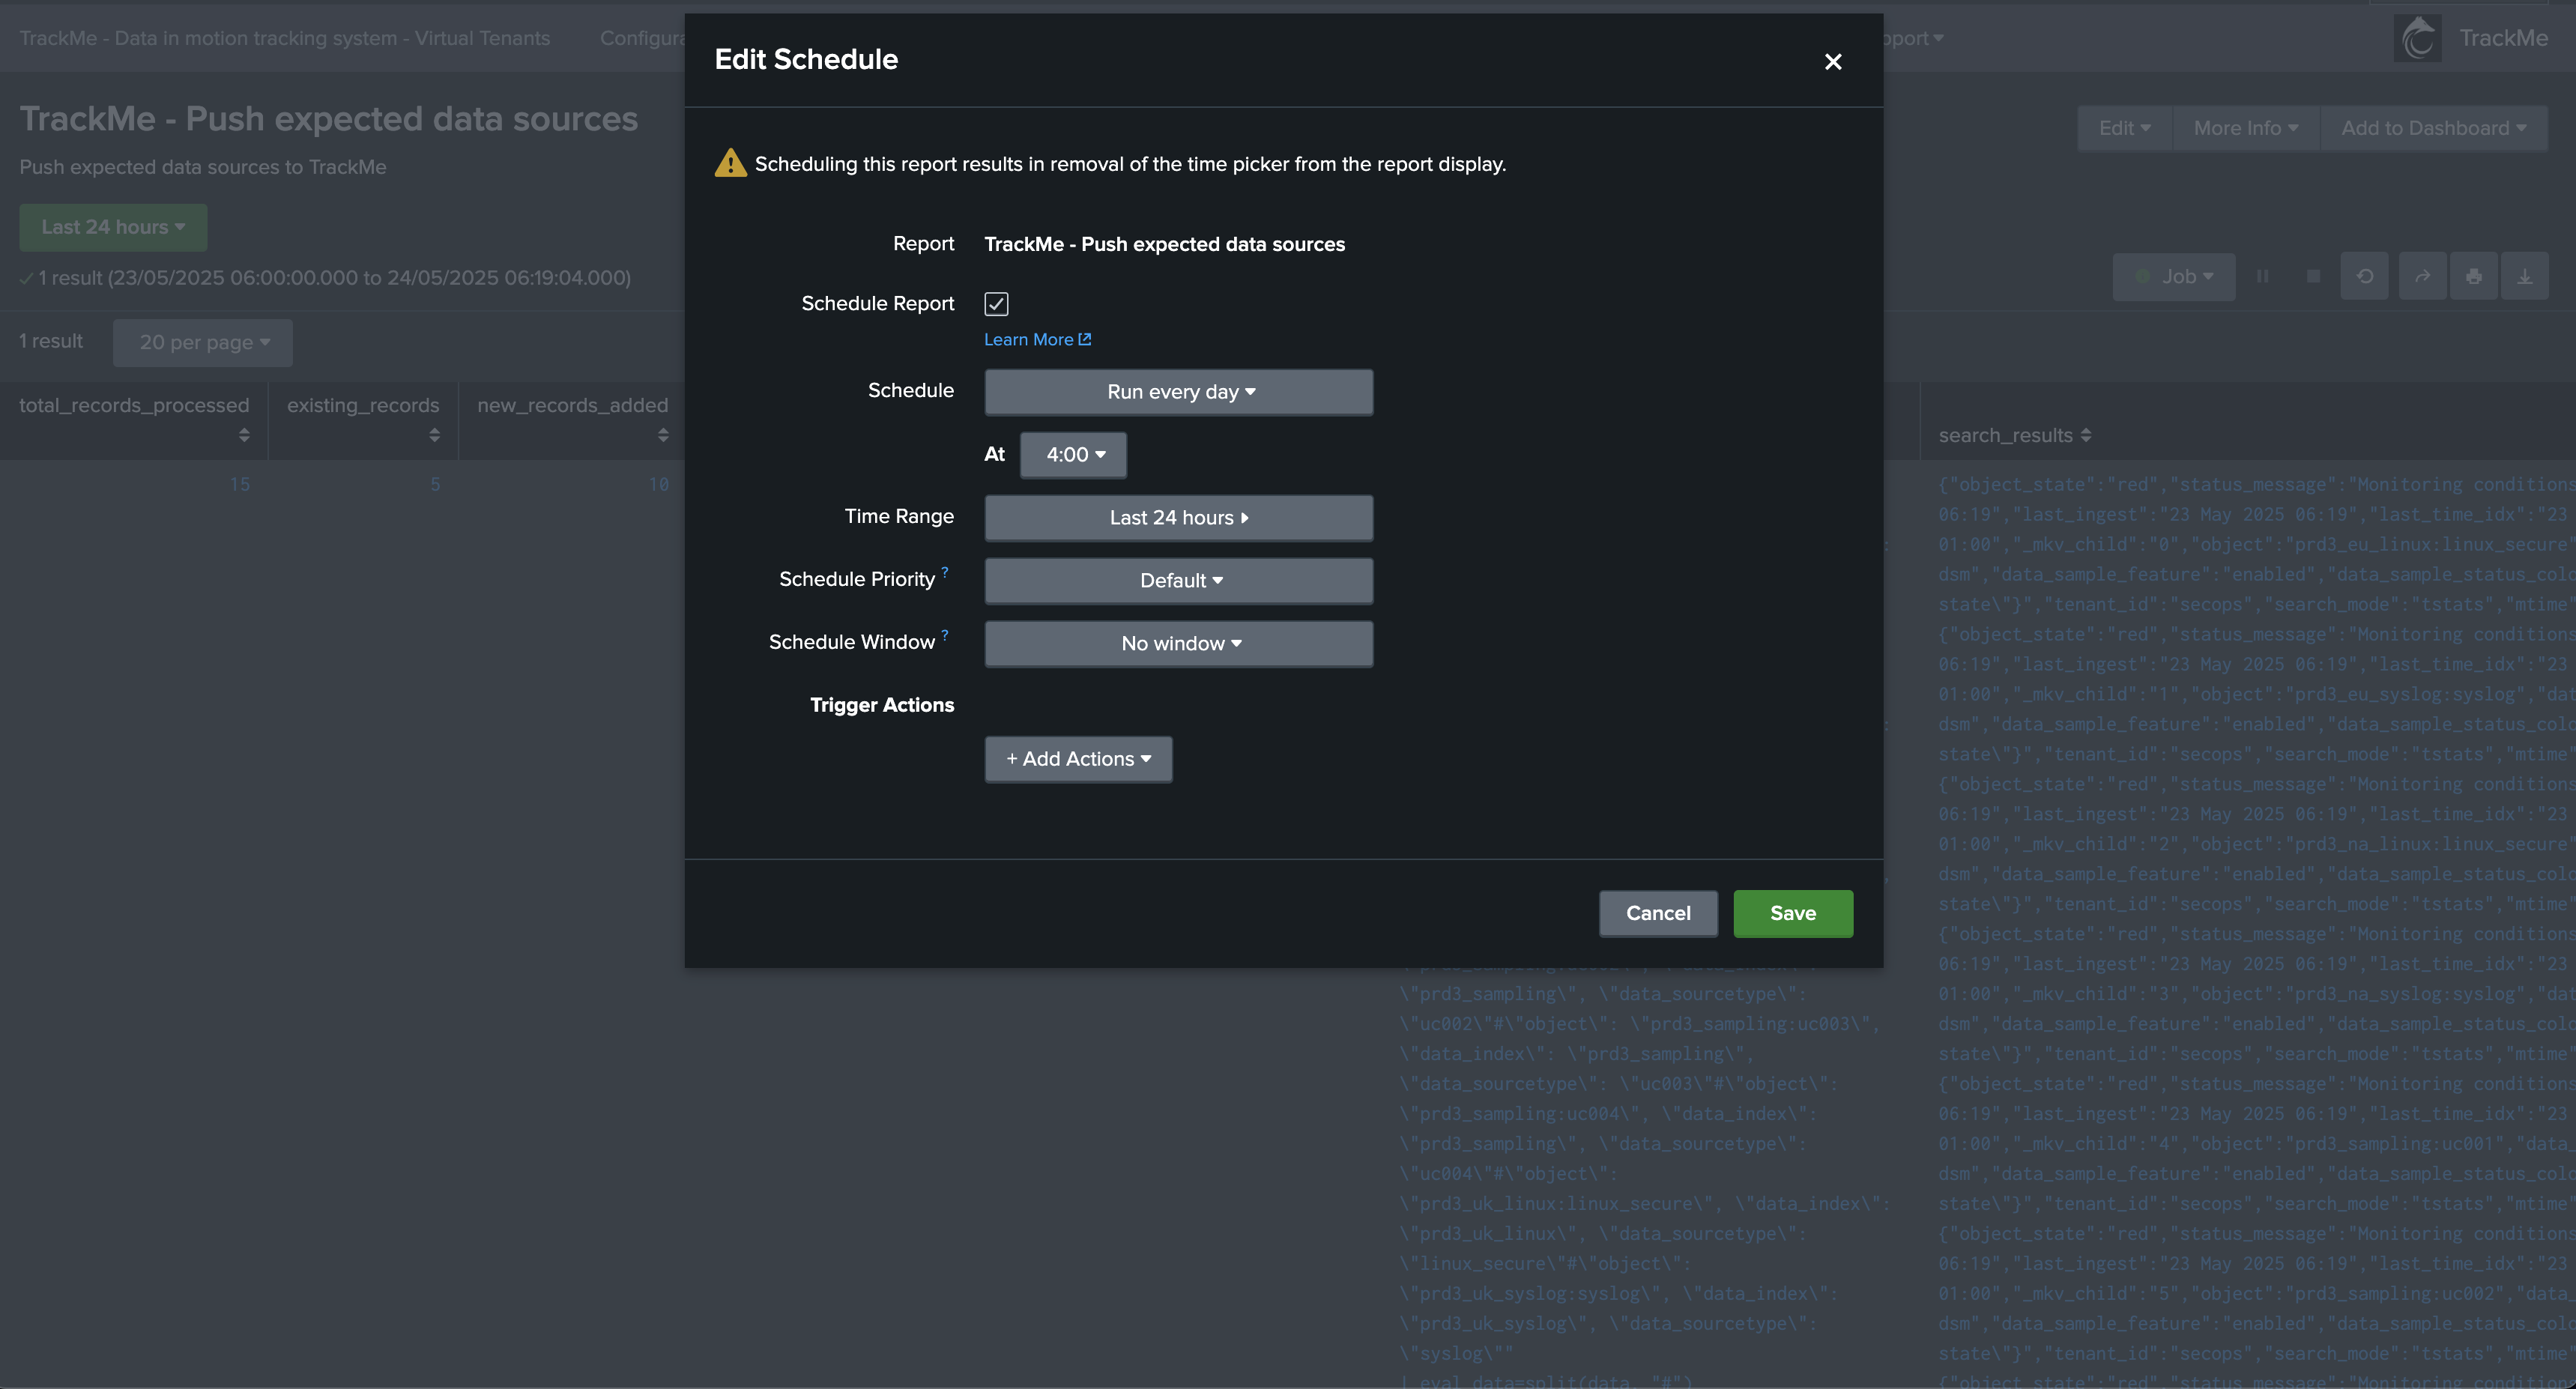
You’re done! Any new source added to the lookup table will be pushed to TrackMe as expected.
Pushing Expected Hosts to TrackMe Data Hosts Monitoring (splk-dhm)
The process for pushing expected hosts is very similar, with the difference that typically you will only push the name of the host as it is expected to appear in Splunk.
In our example, we have a Splunk lookup table containing the list of expected hosts, based on a list of hostnames:
| inputlookup dh_expected.csv
| fields host
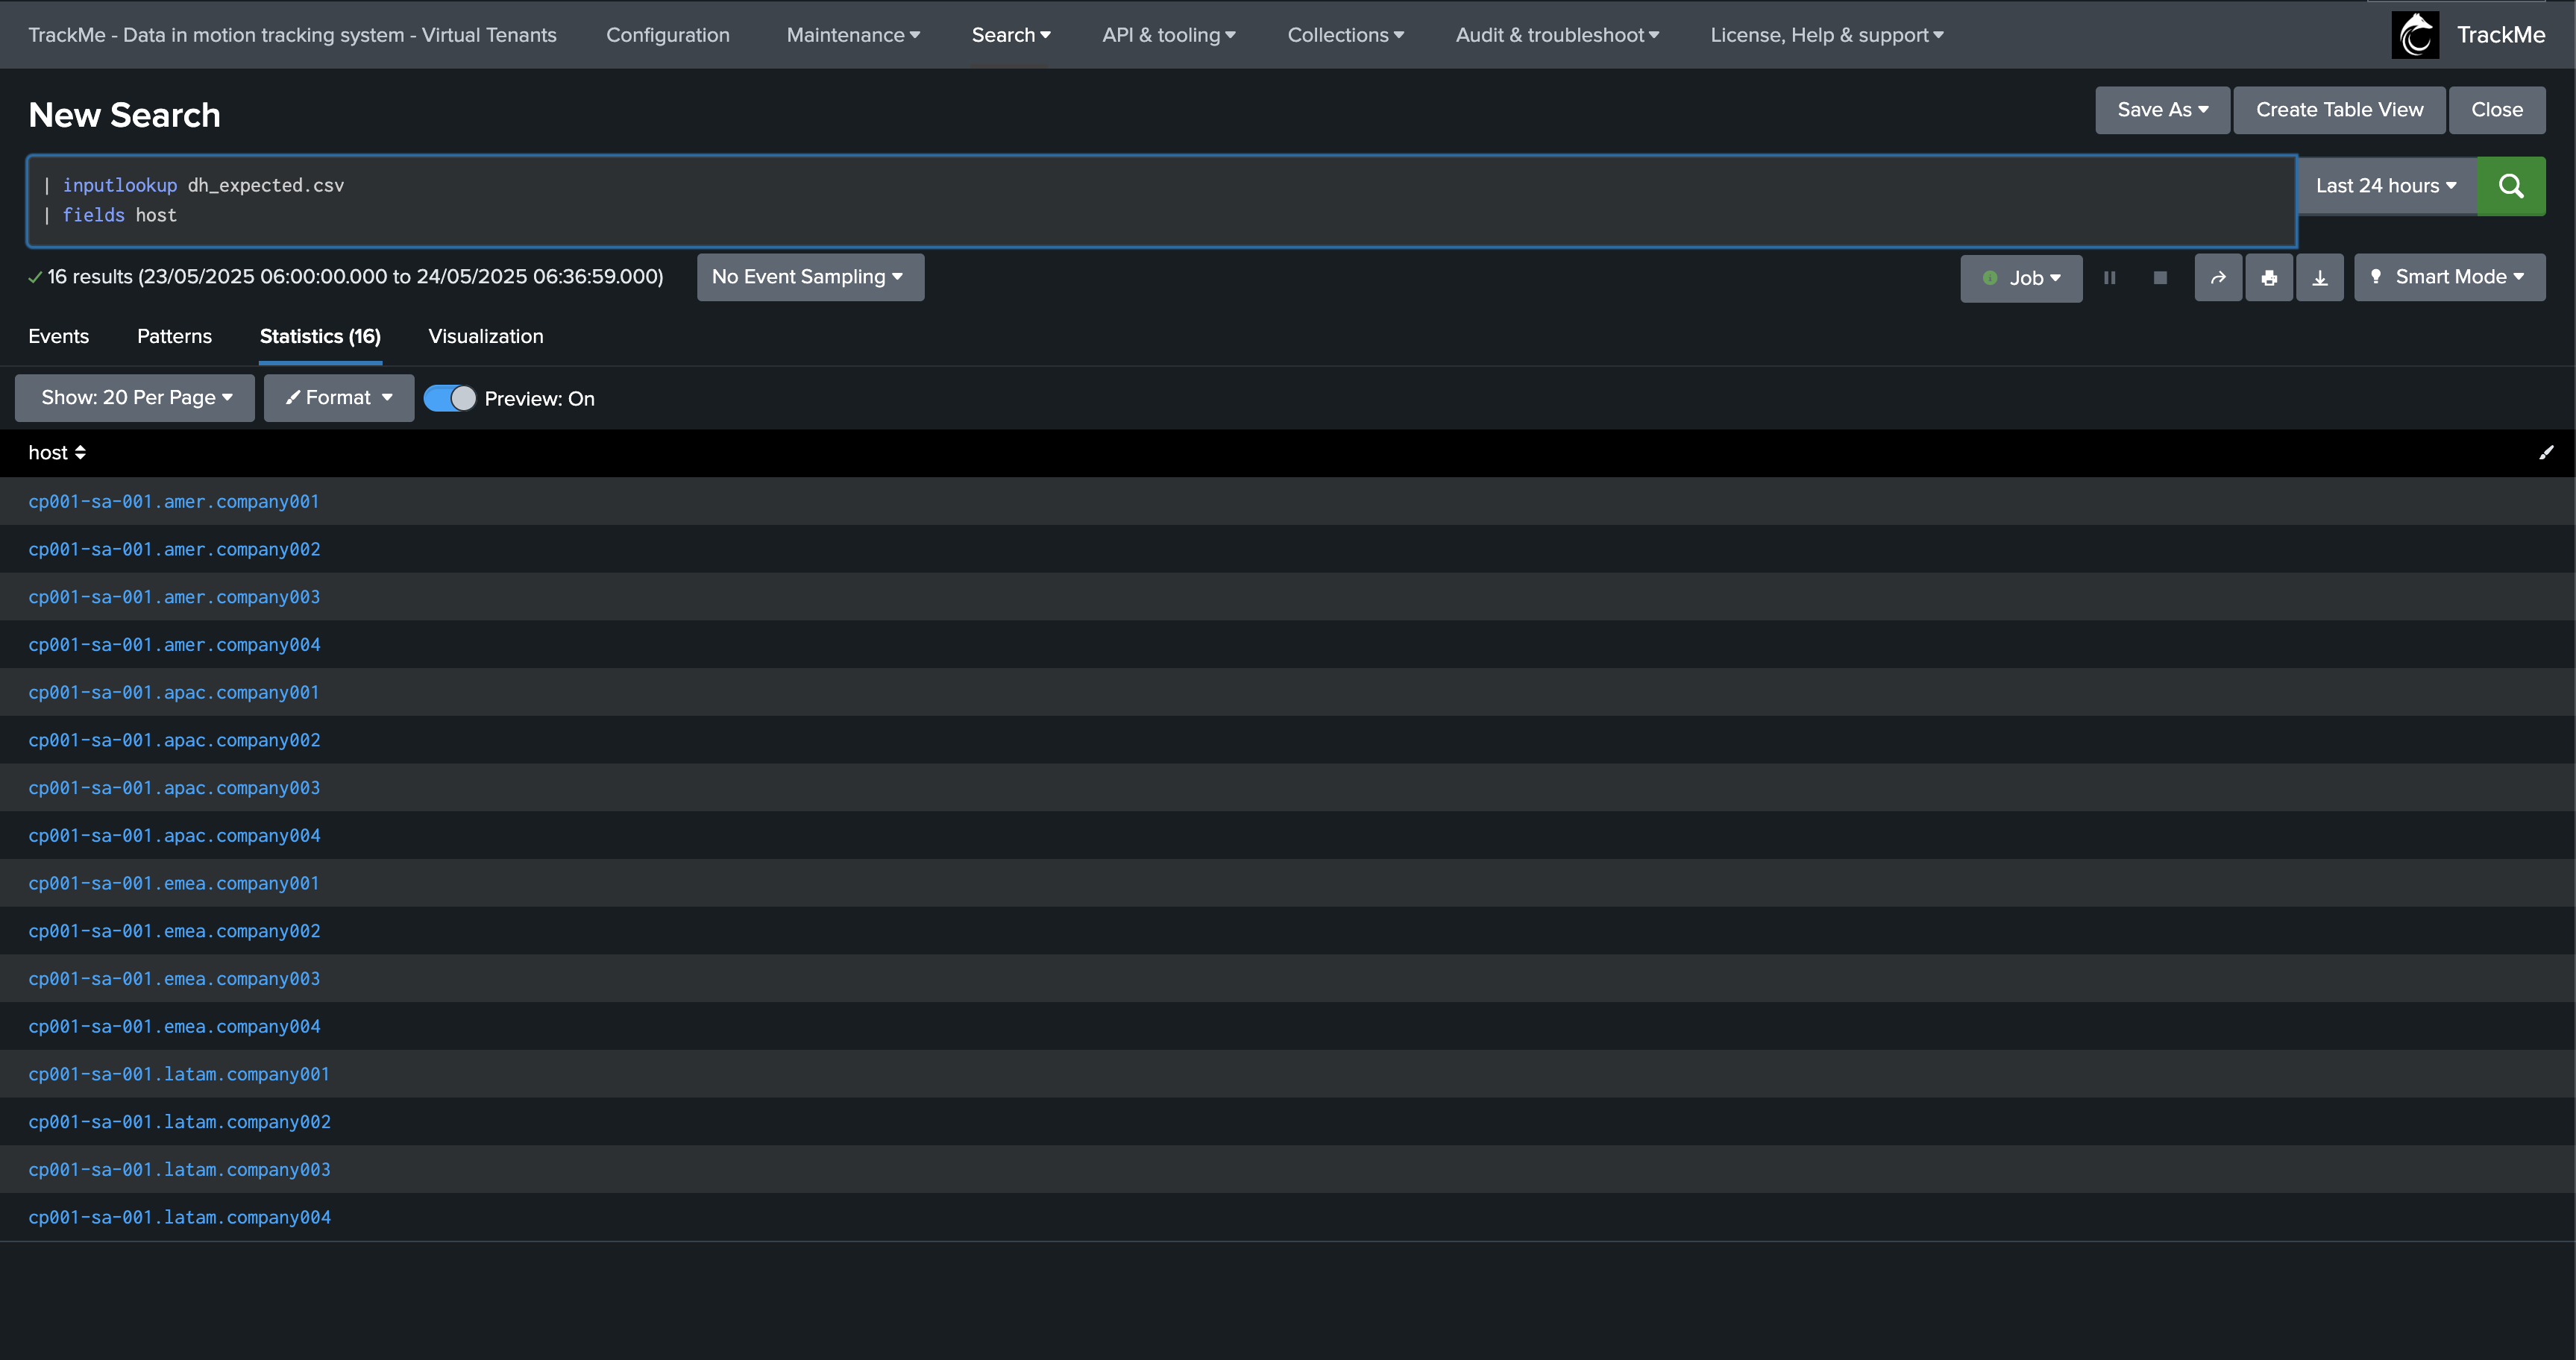
We have a Virtual Tenant called endpoints that is active and already contains a number of entities, some of which might already be part of the expected sources, but some might not:
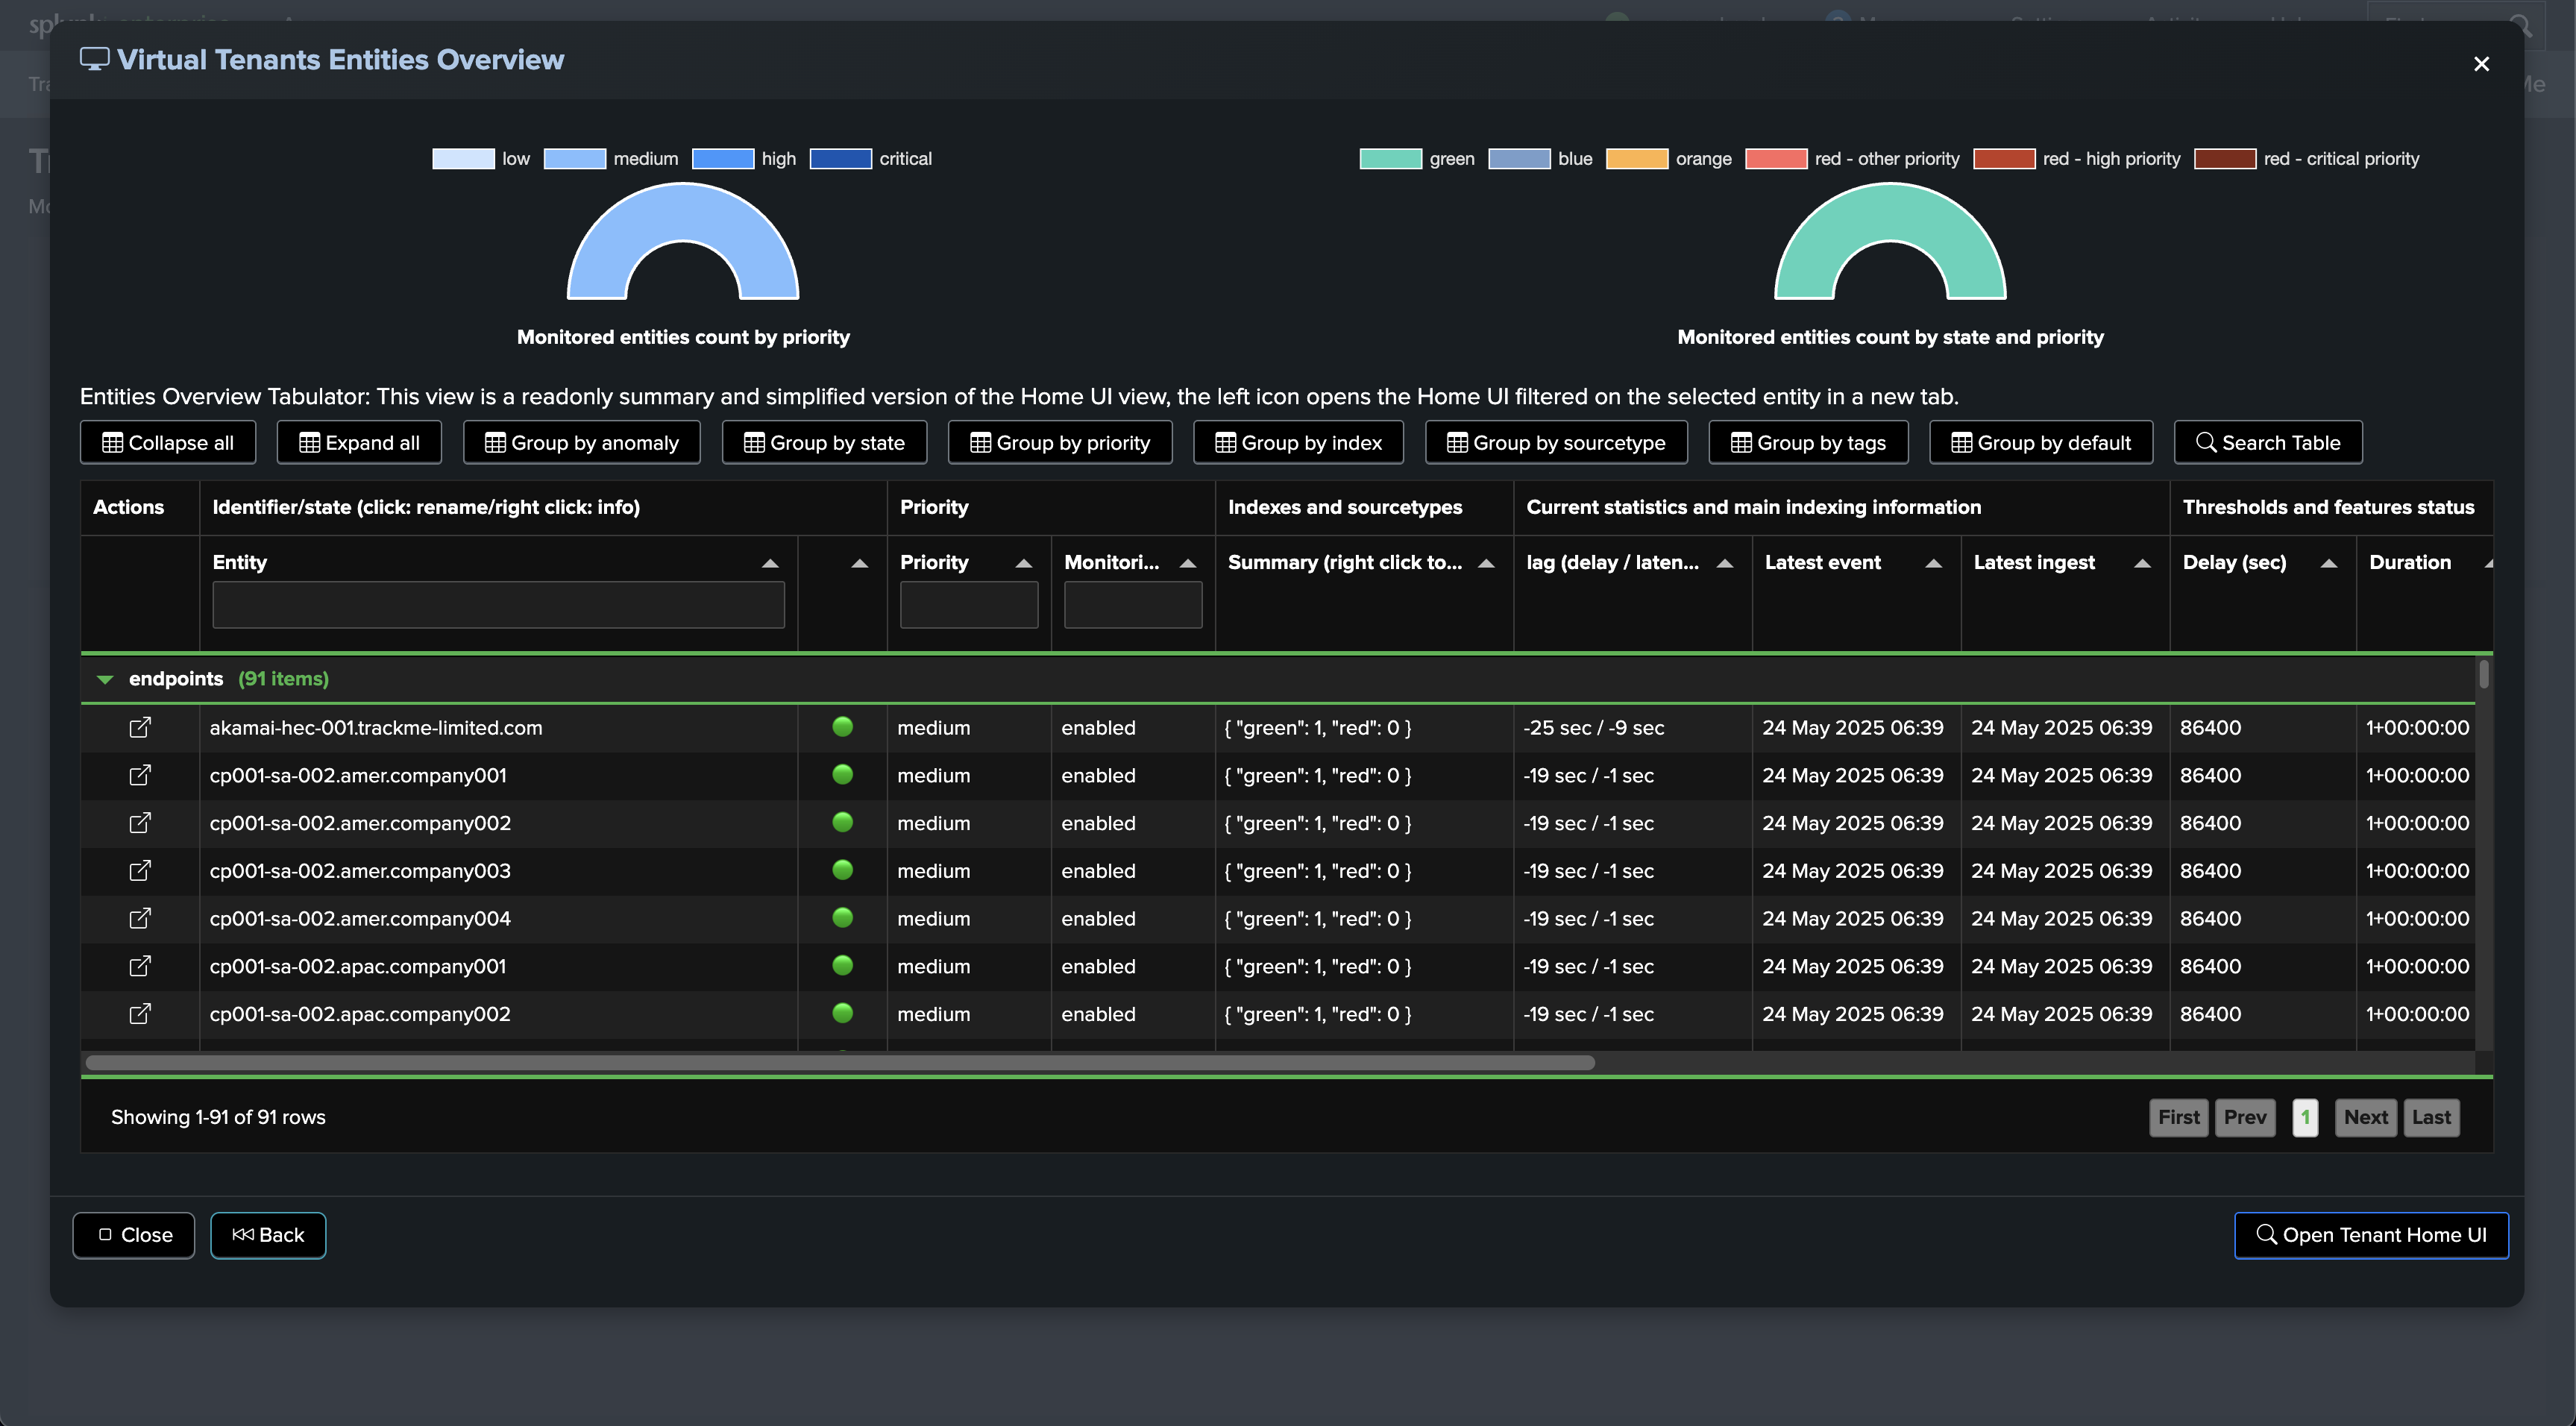
To push expected hosts to TrackMe from the lookup file, we will call the streaming command trackmepushdatasource, which will:
Parse the records resulting from the
inputlookupcommandFor each host, form the expected entity name in TrackMe (by default,
key:host|<host>)Verify if this entity already exists in TrackMe
Add to a search logic that will push entities as they are expected by the discovery process
Finally, execute the search logic, which pushes entities as needed and expected
We will call the following command:
Replace the tenant name, in our case called endpoints
| inputlookup dh_expected.csv
| trackmepushdatasource search_type=tstats tenant_id=endpoints show_search_query=True show_search_results=True pretend_latest="-24h" component="dhm"
Depending on the results, the command returns the list of added entities, rejected records (if any), and other useful information:
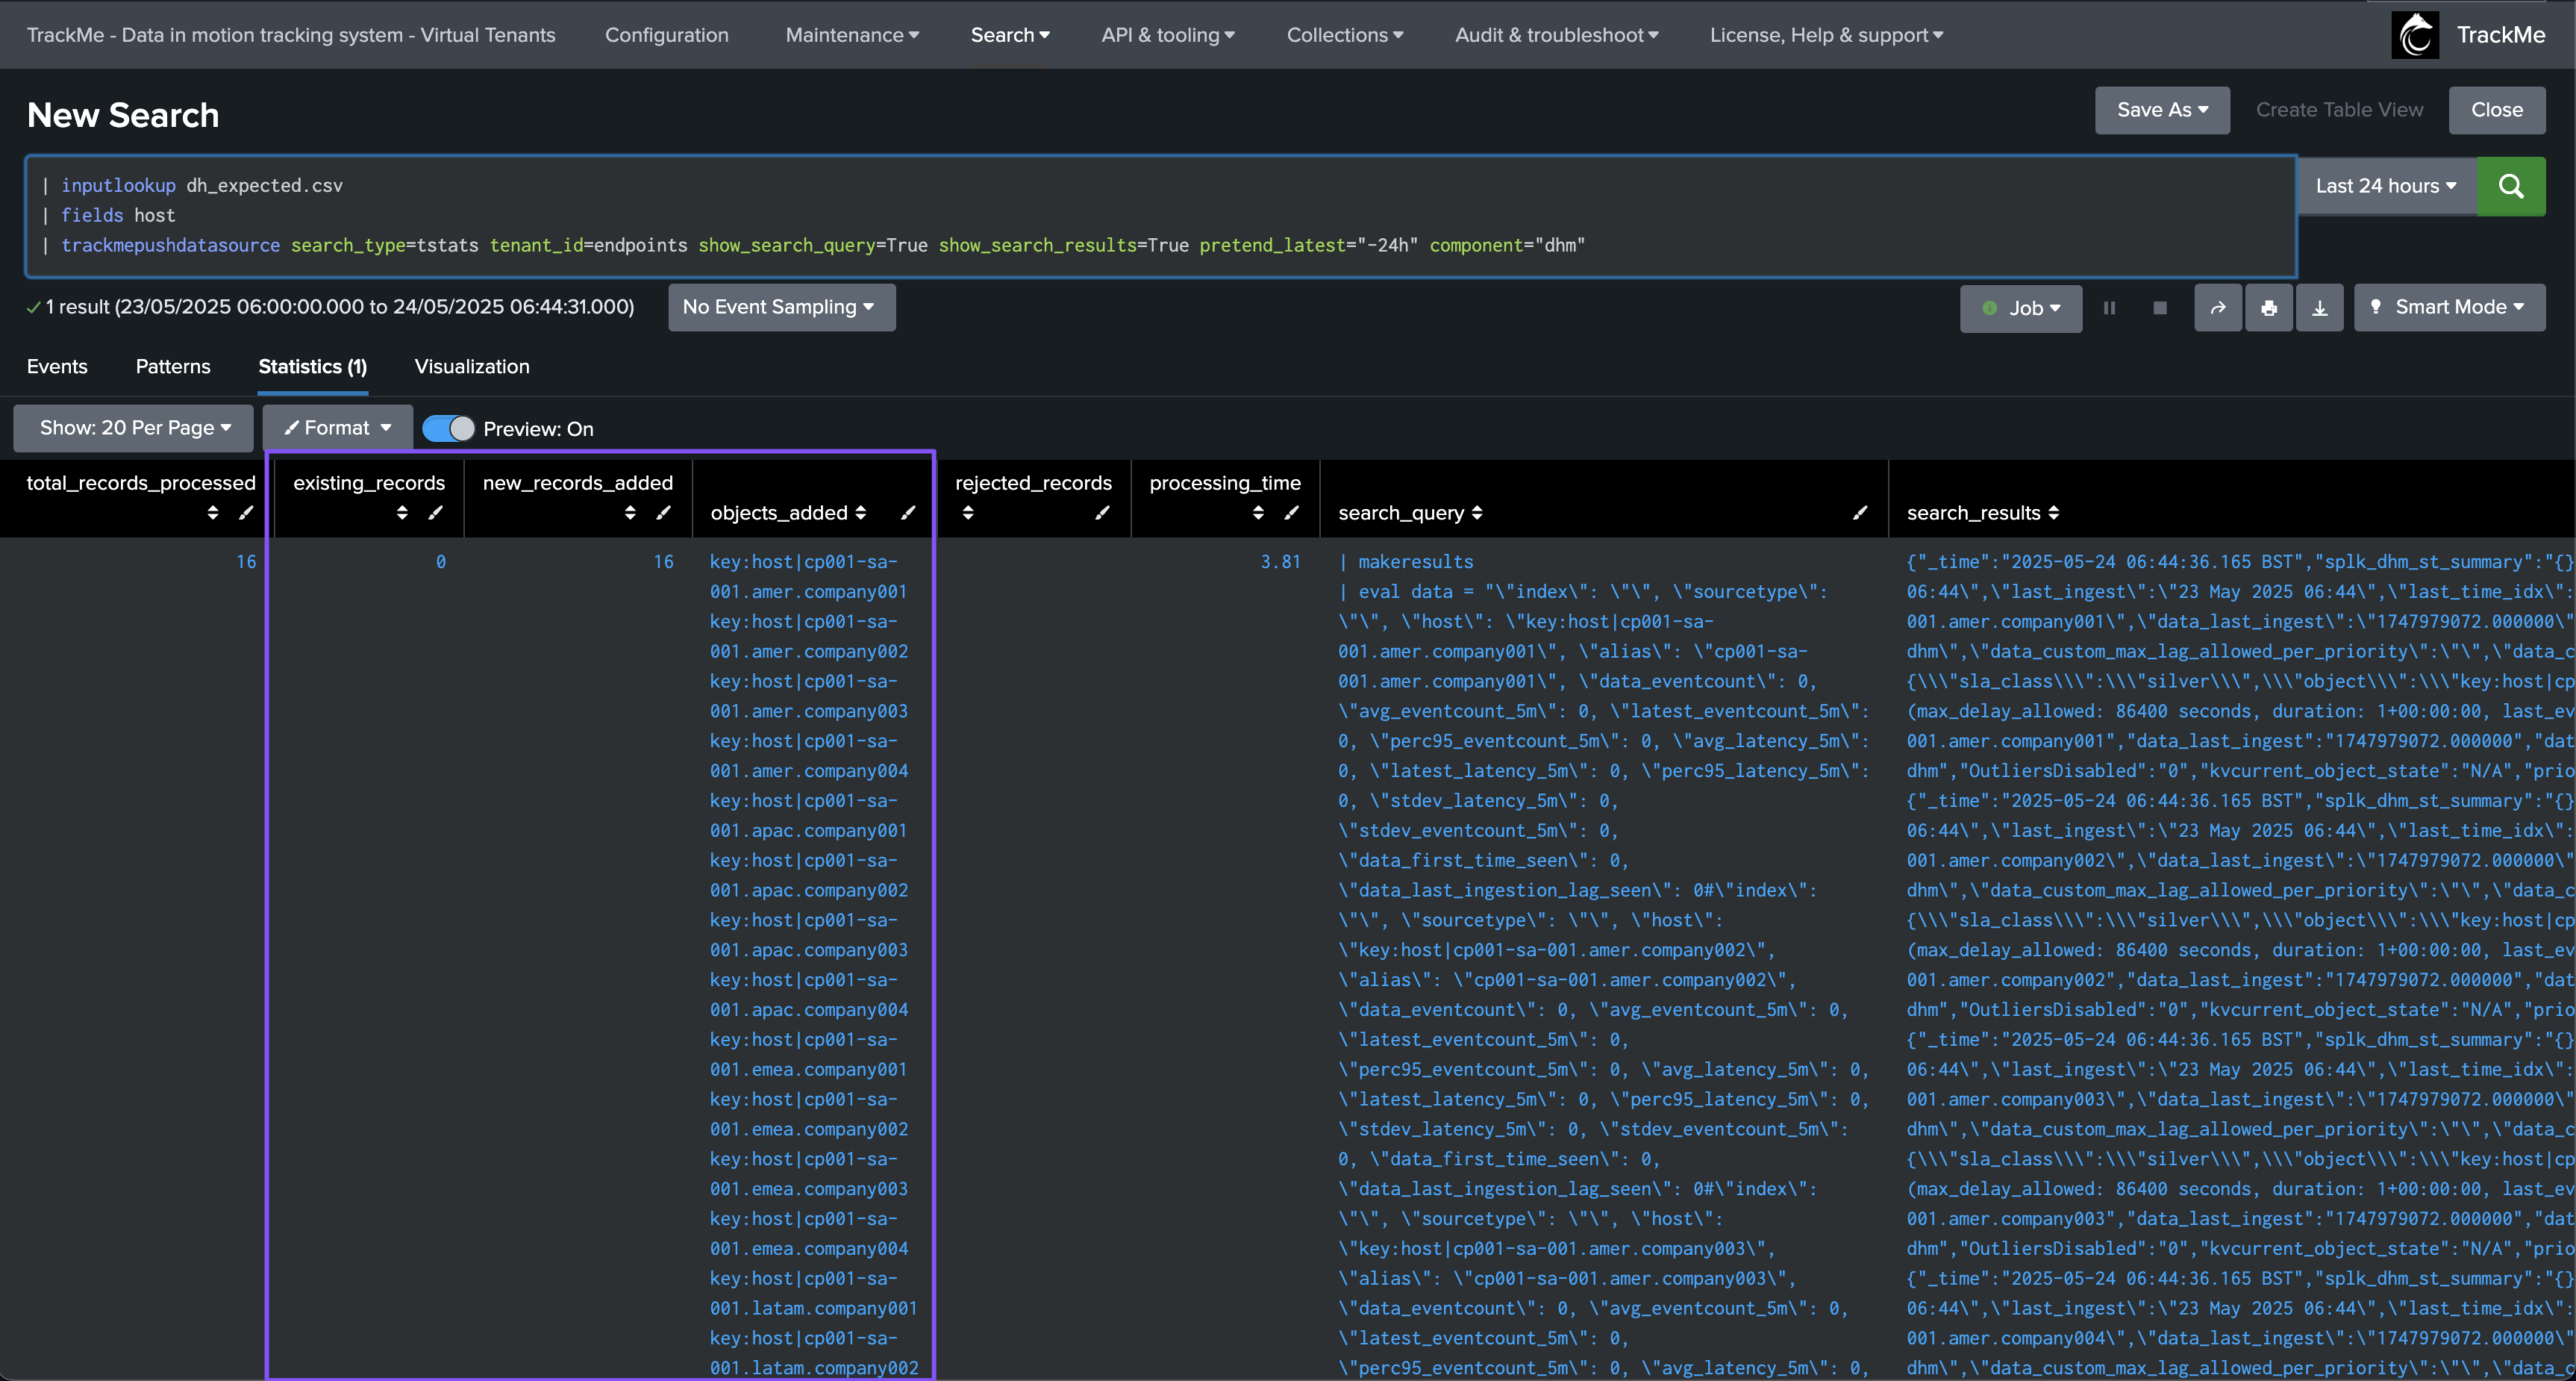
In TrackMe, these entities are now visible and in a red state. Note that for dhm, the list of indexes and sourcetypes will appear as an empty list for now:
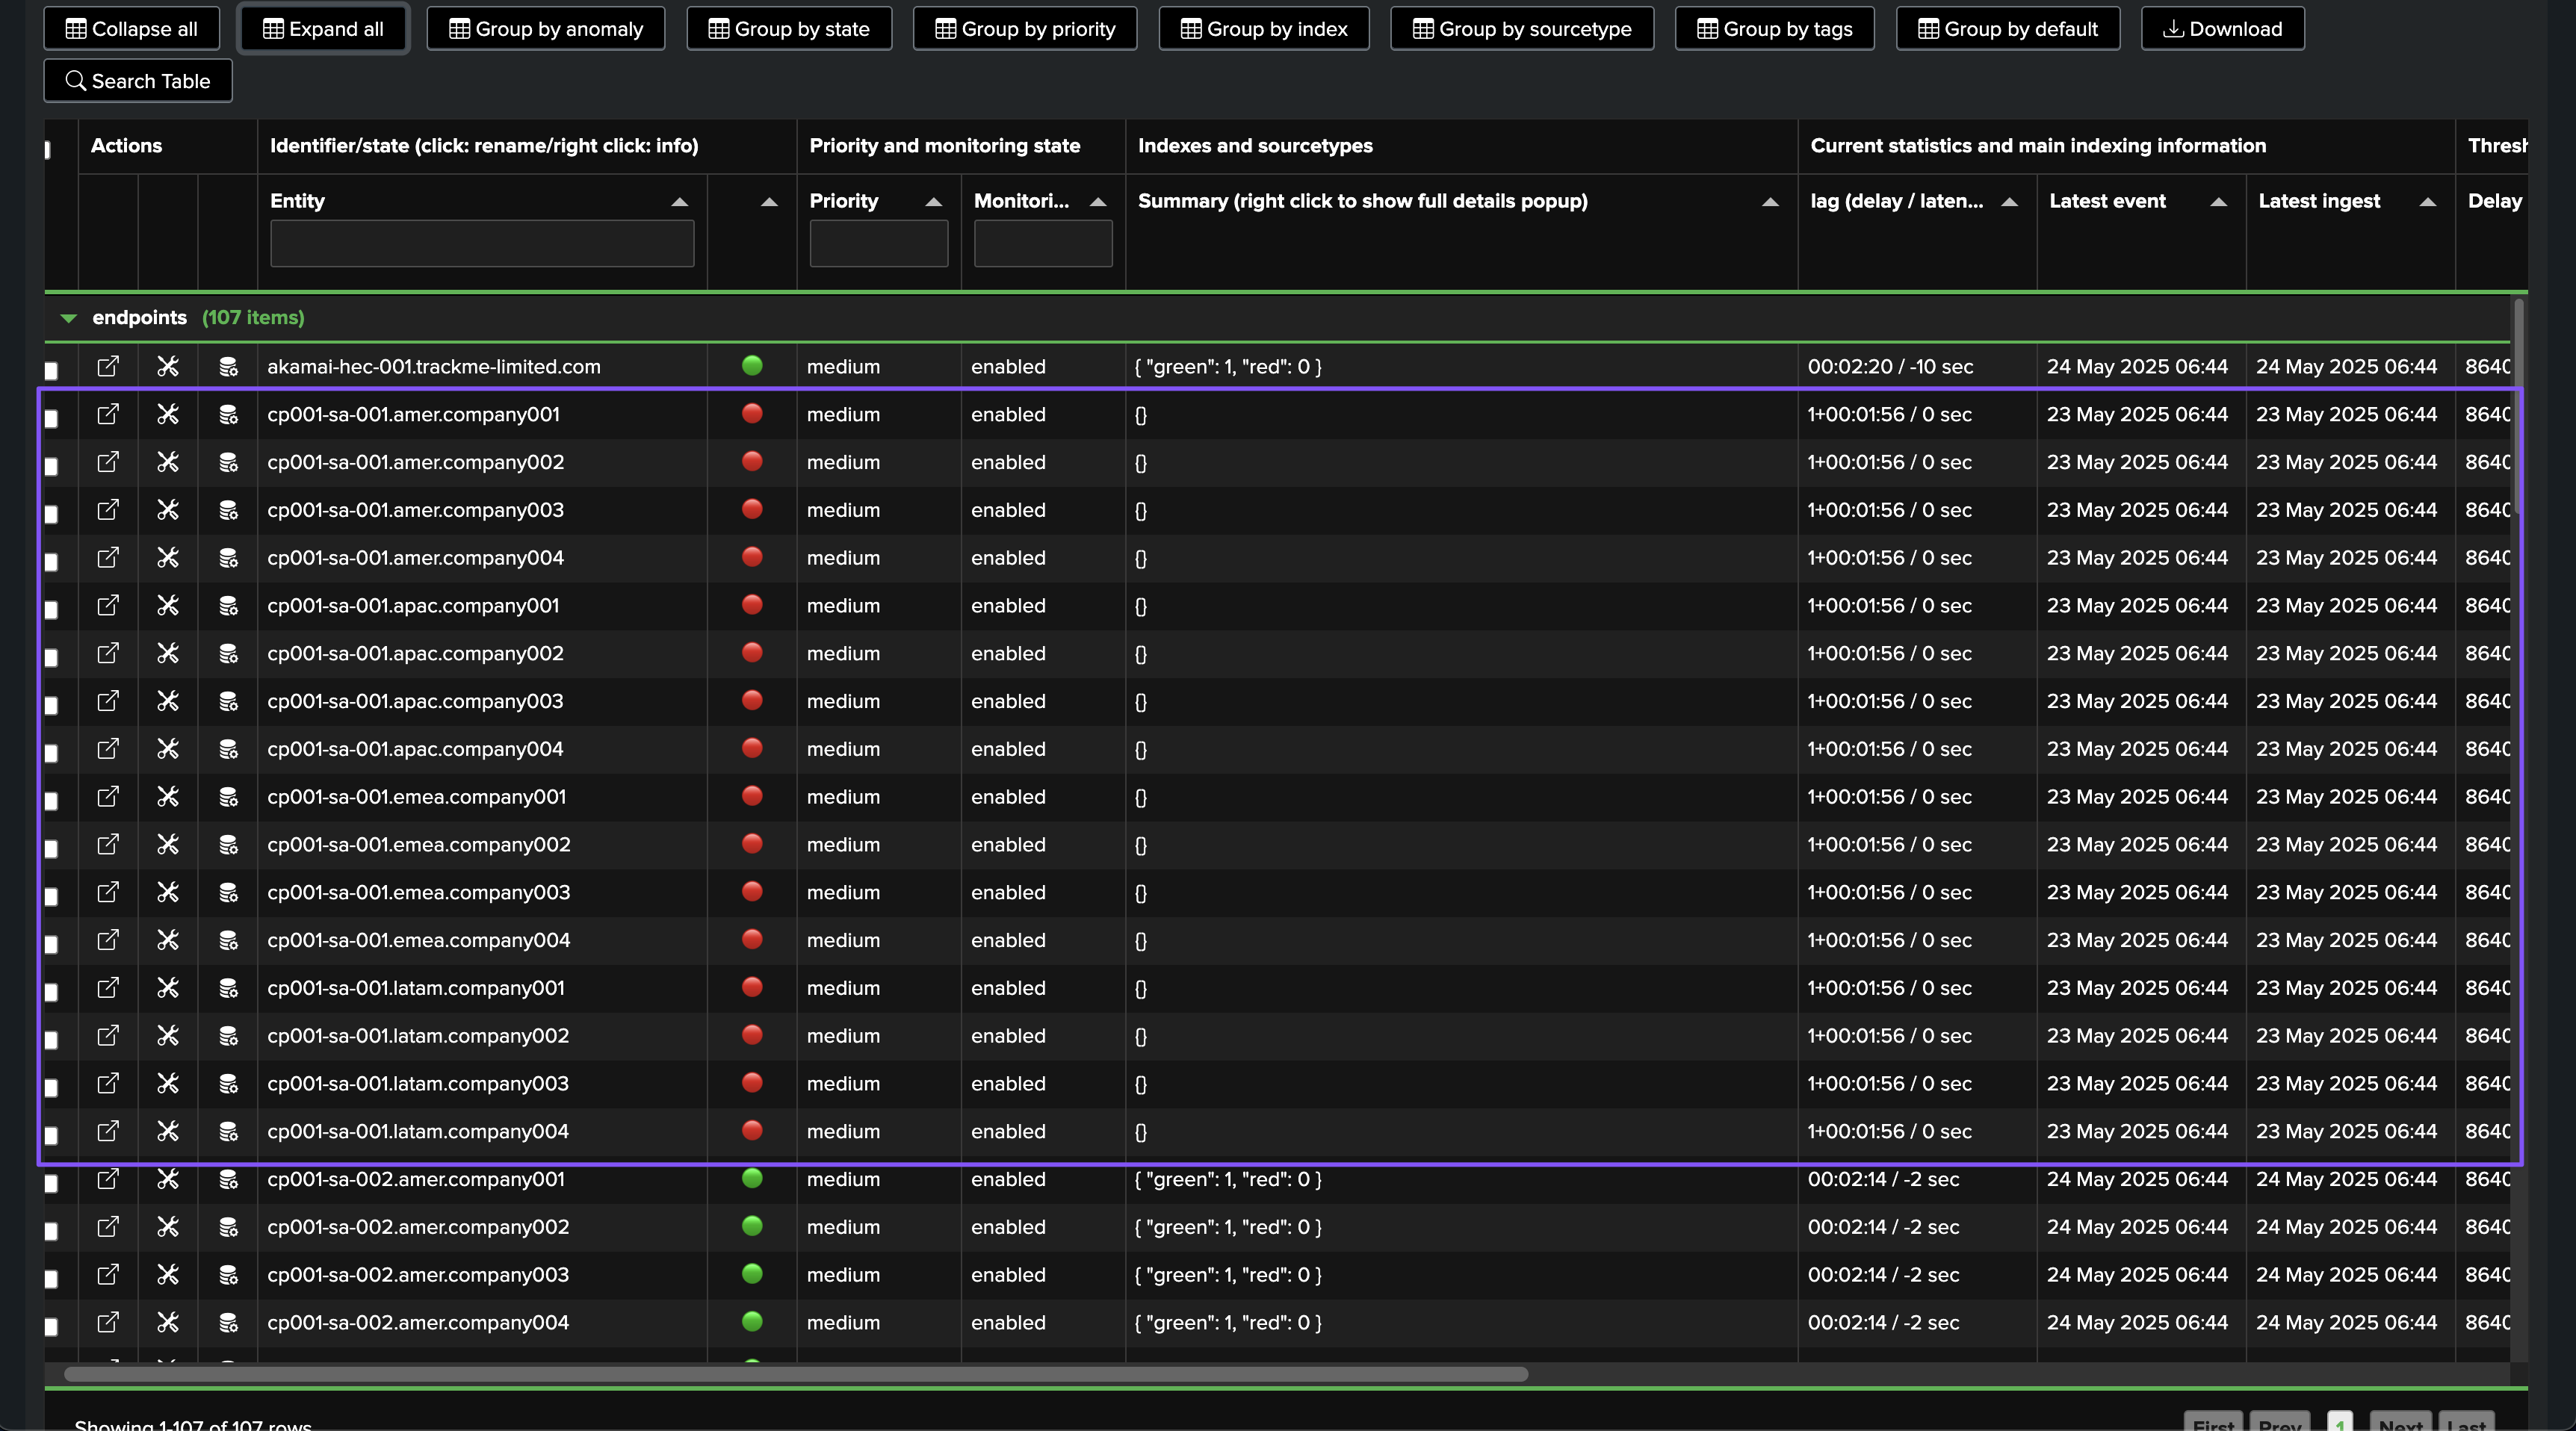
As soon as trackers are executed, and if these sources are active and within the scope of the trackers, these entities will appear as green in TrackMe, assuming their status is healthy:
Give it some time; it may take a while before the entities are updated in TrackMe, depending on the conditions.
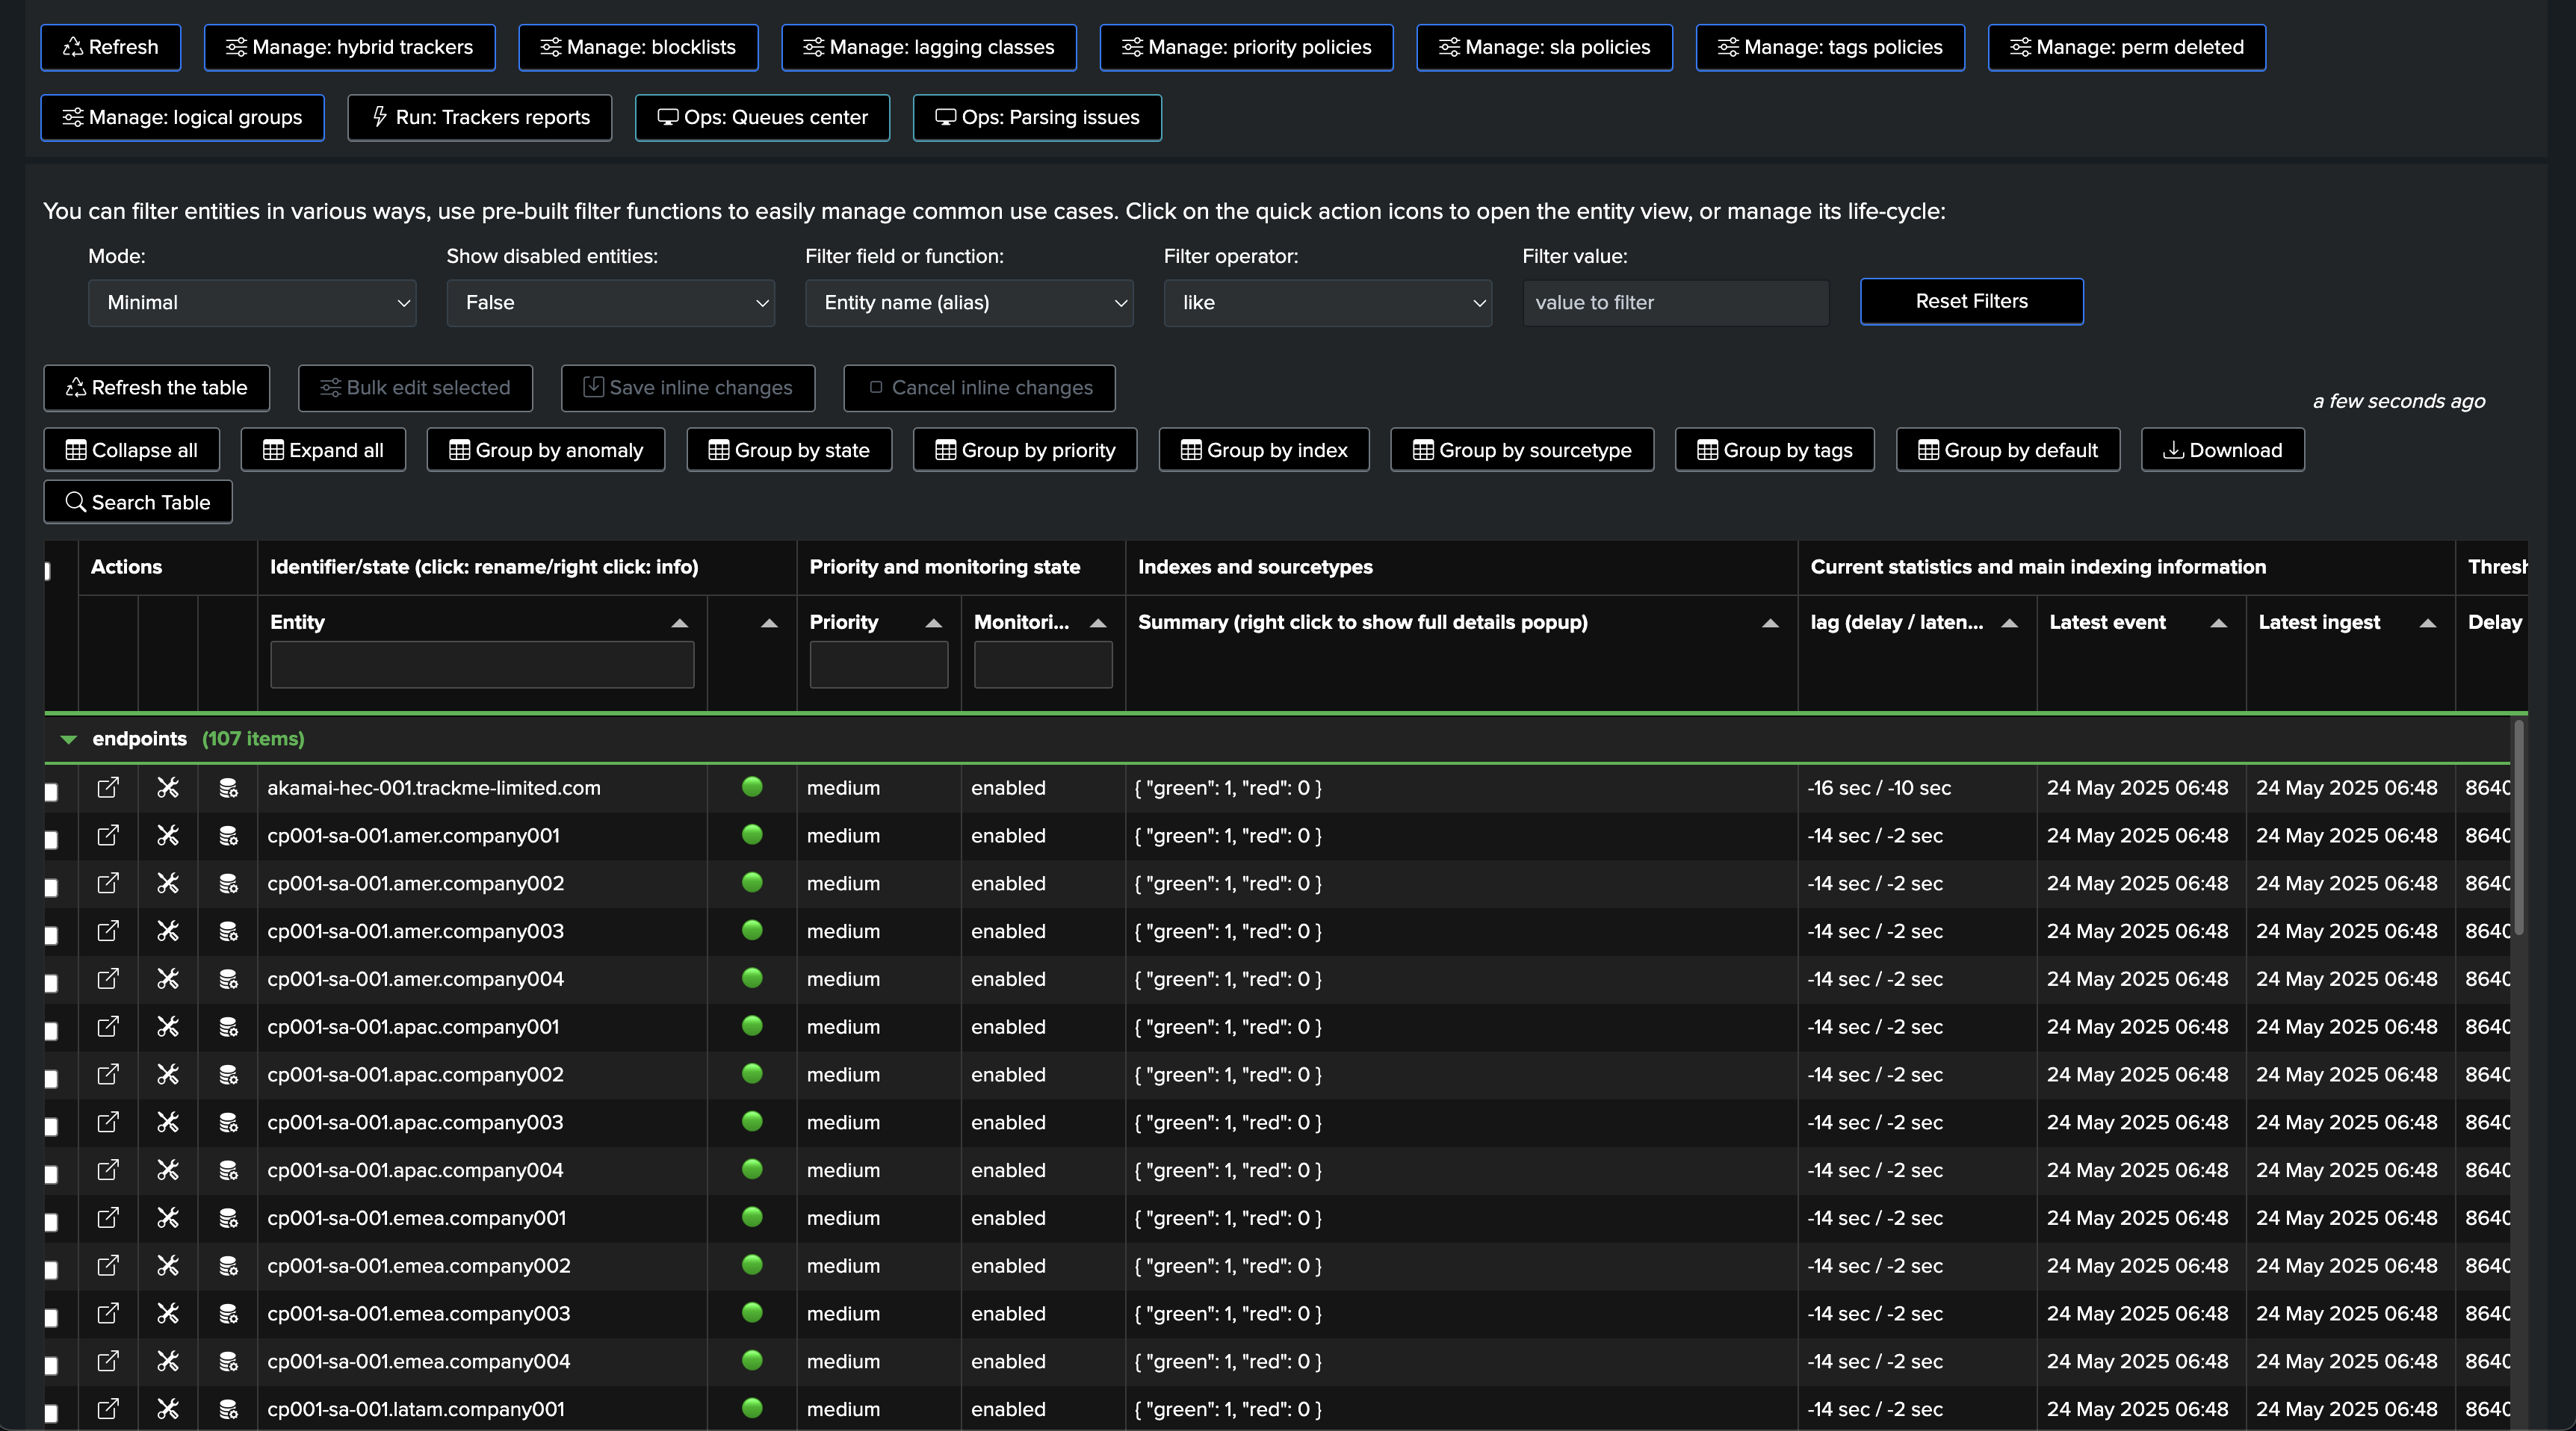
Finally, save this as a report and schedule it according to your preferences, for instance, once per day:
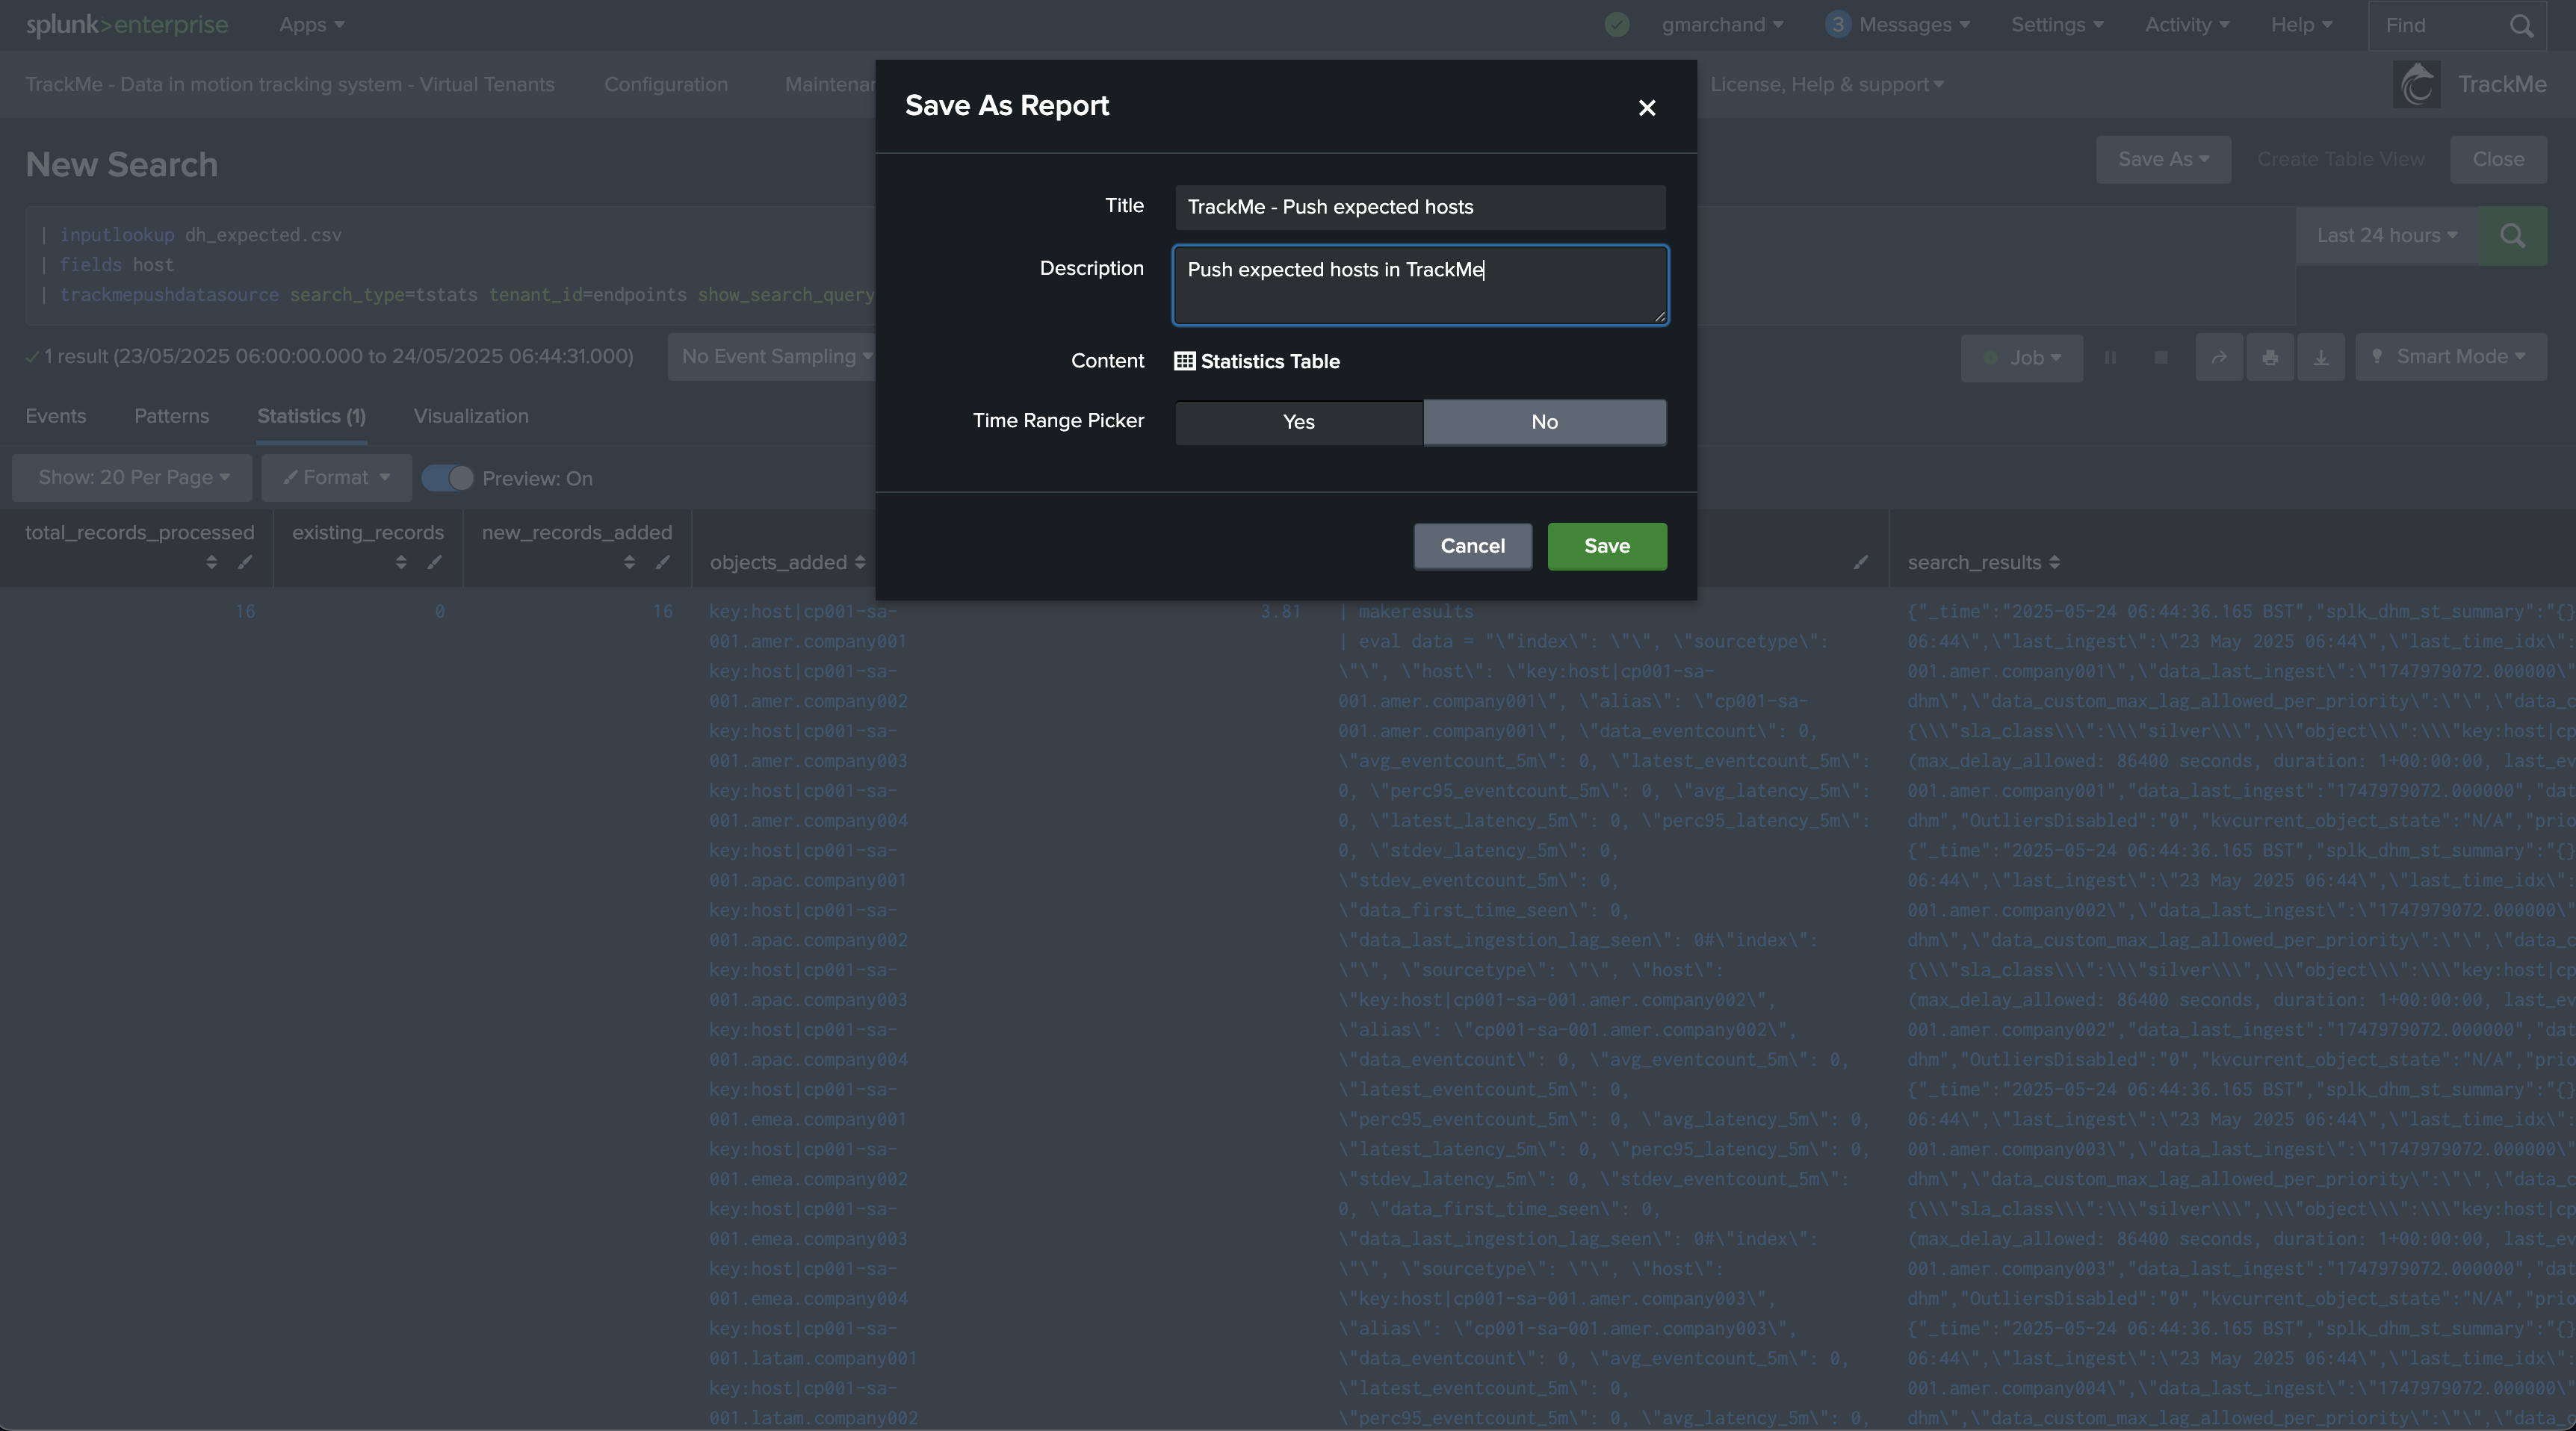
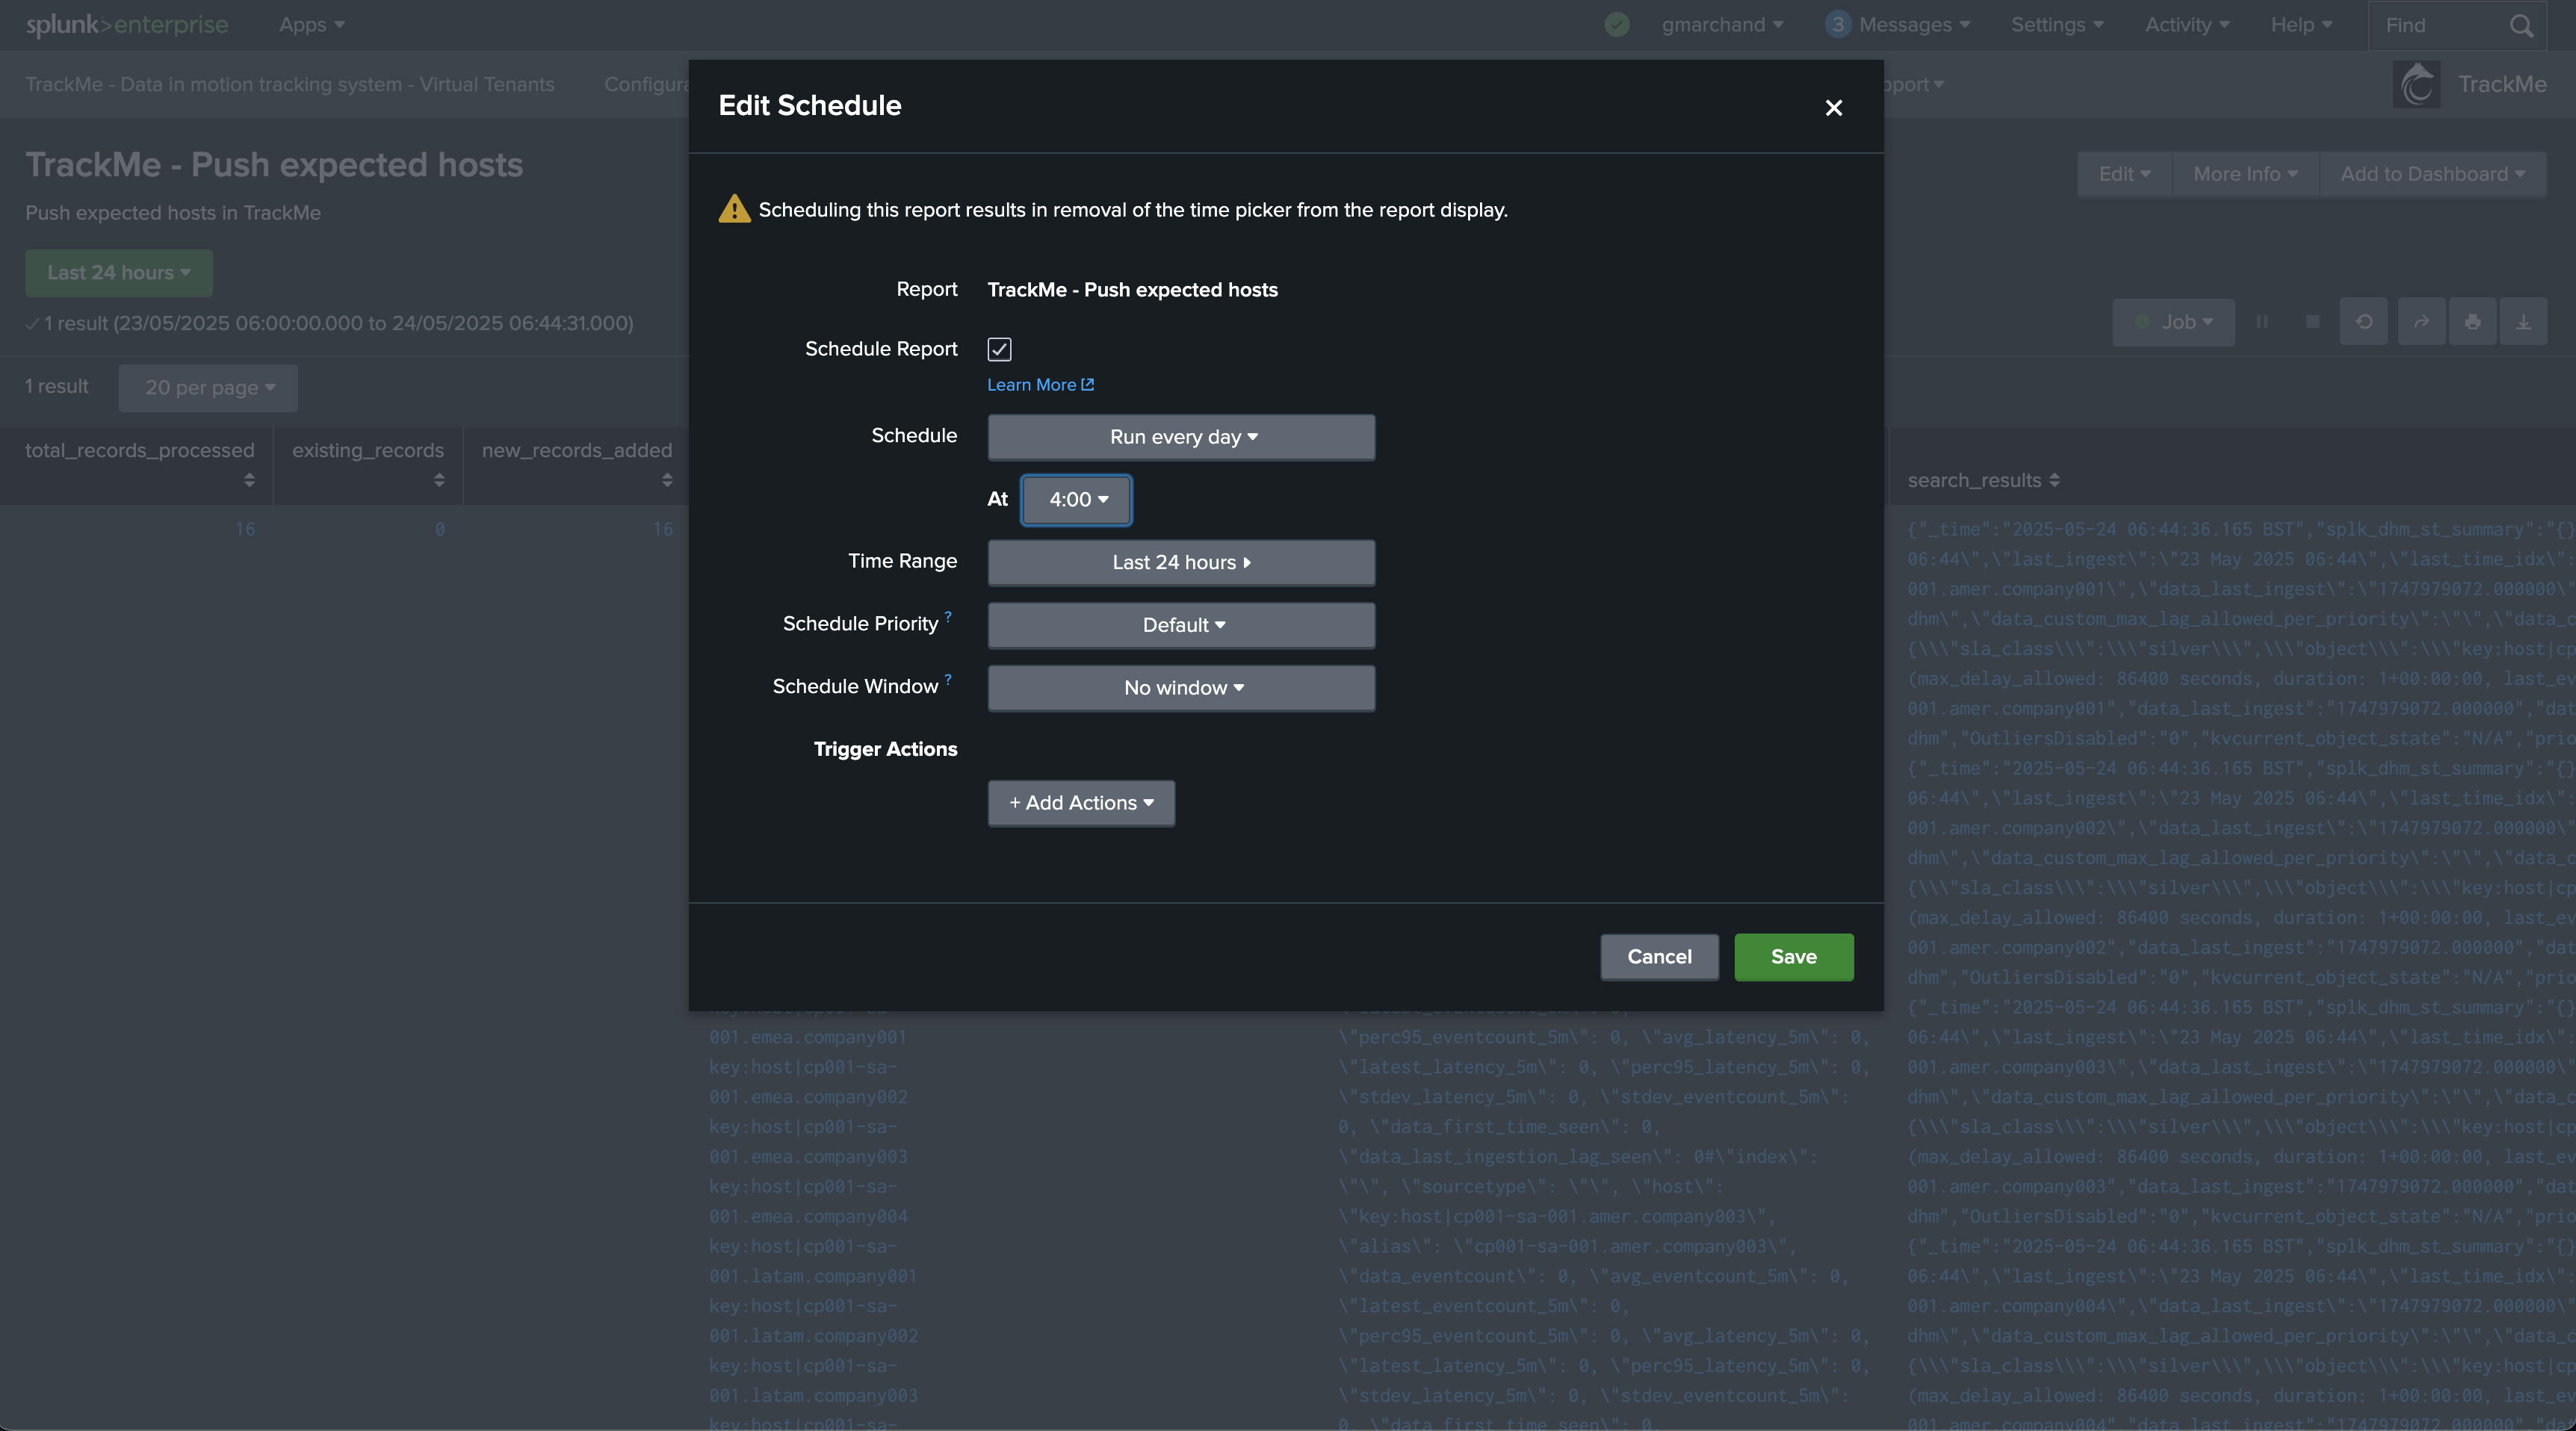
You’re done! Any new host added to the lookup table will be pushed to TrackMe as expected.
Troubleshooting the Command trackmepushdatasource
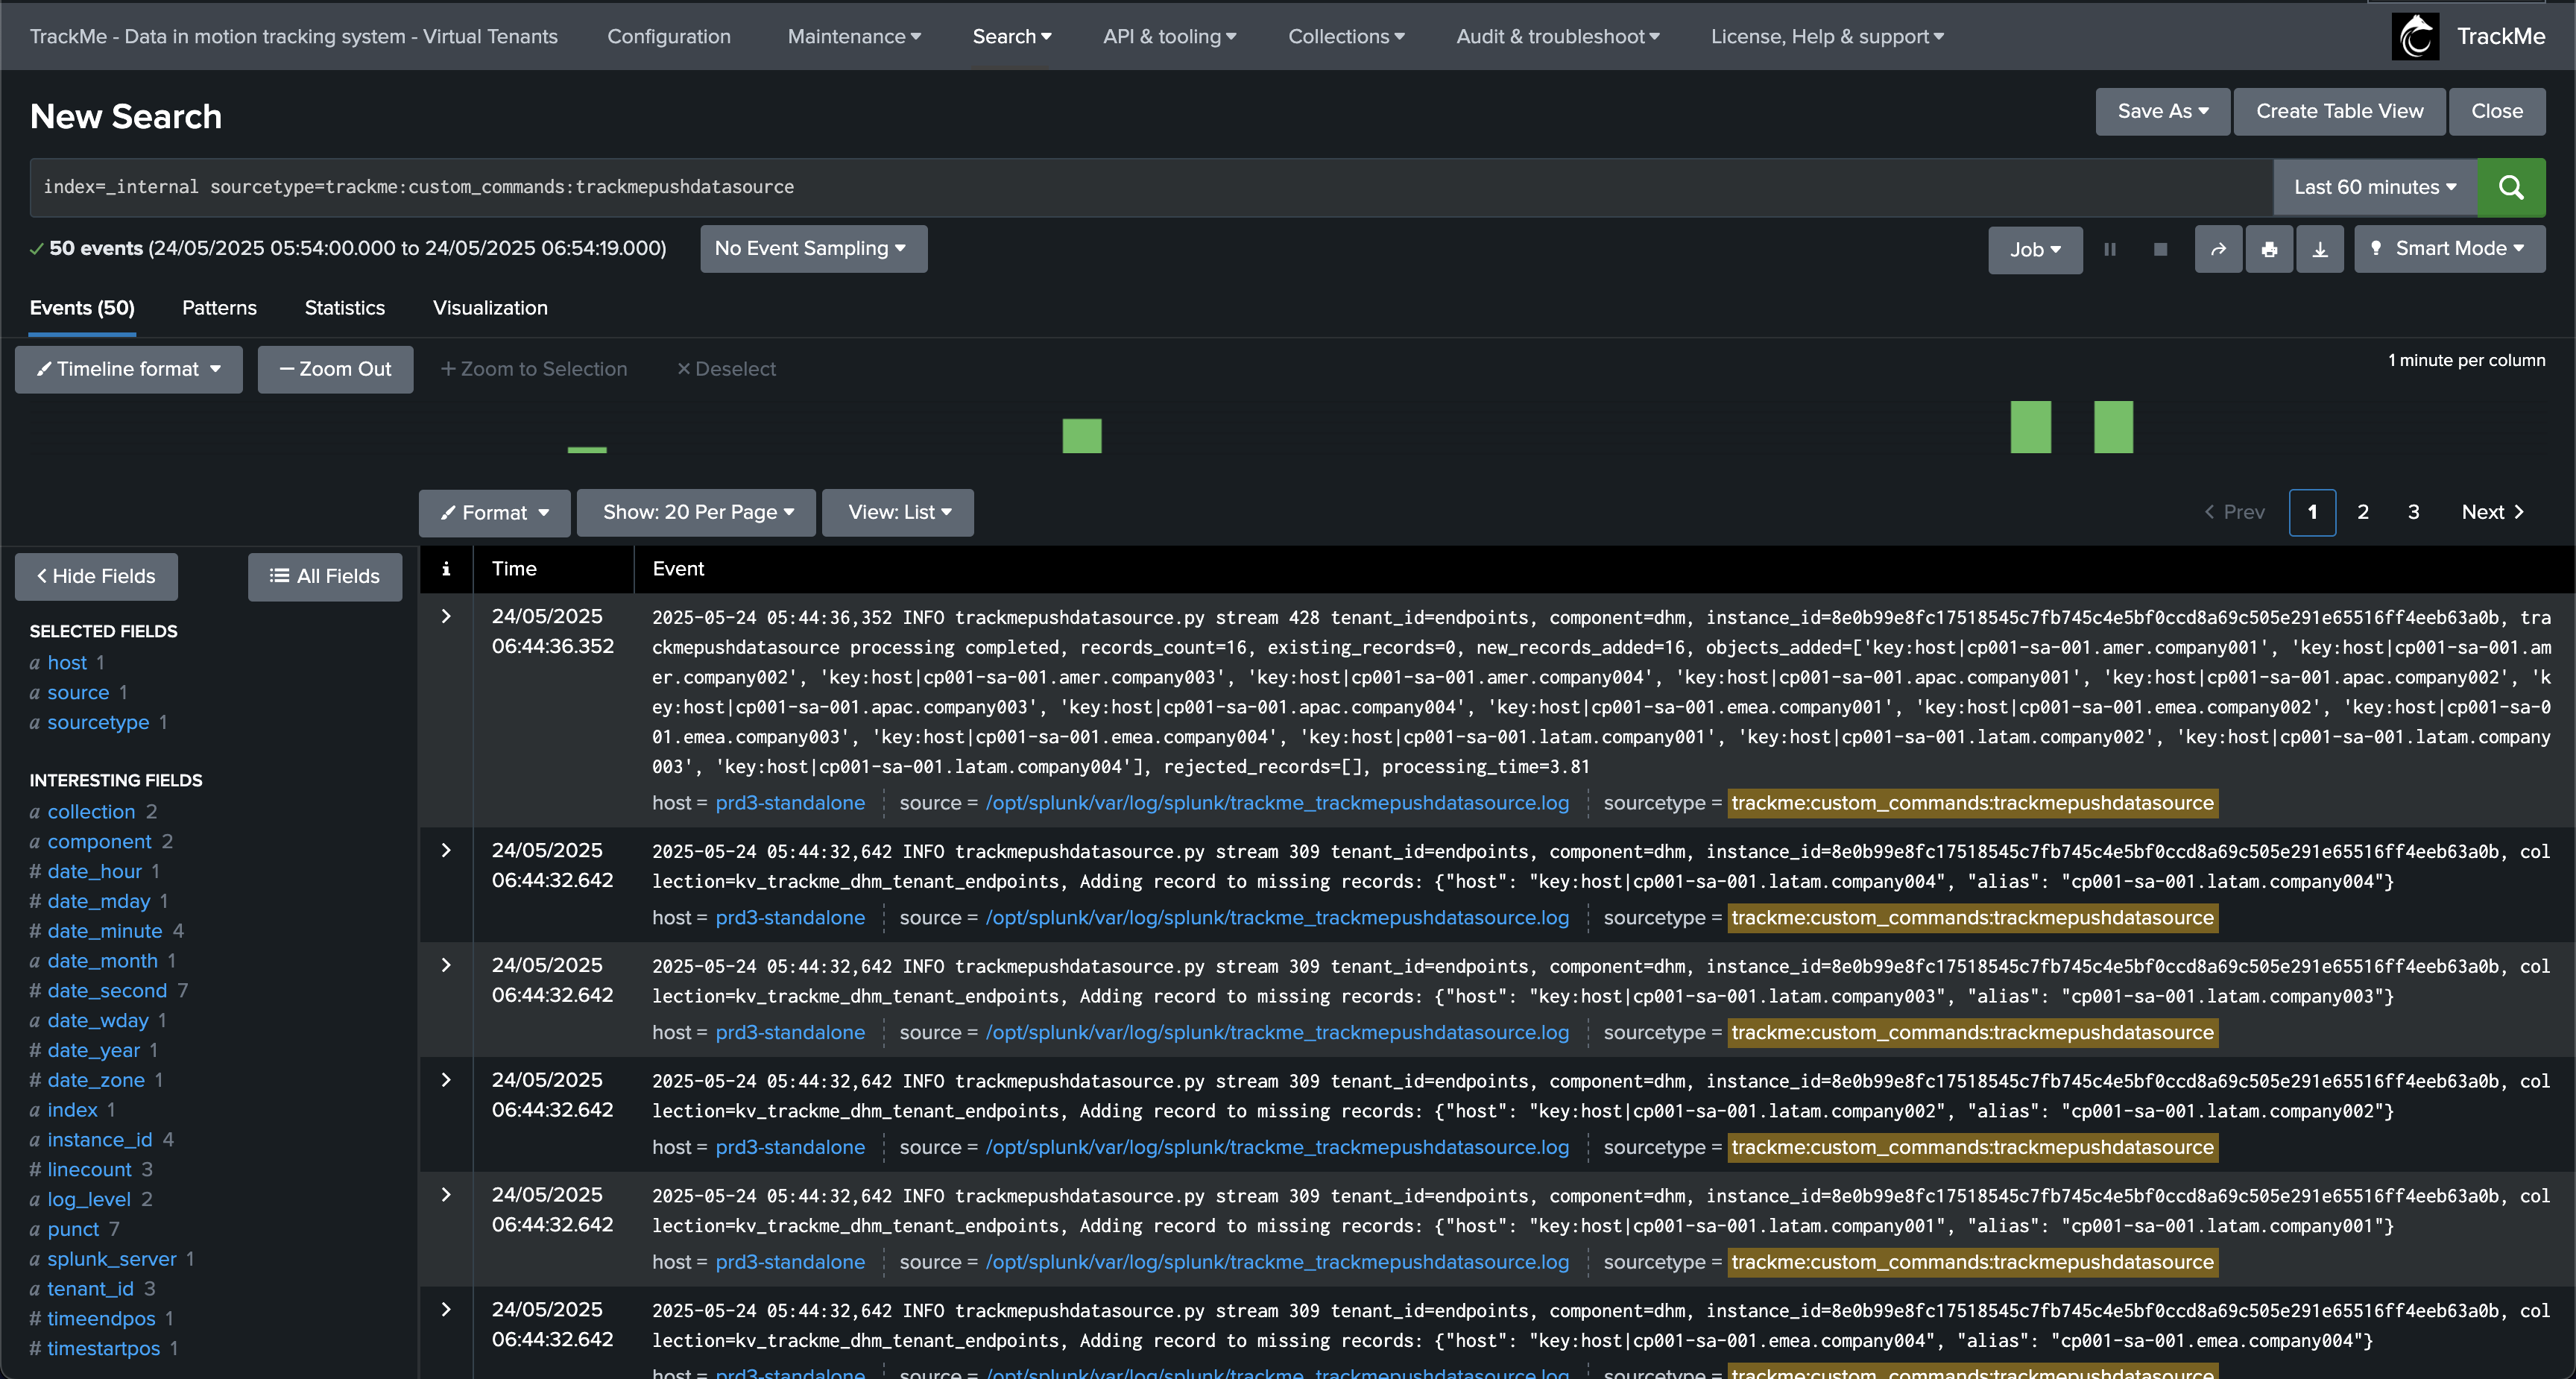
If you encounter issues with the command trackmepushdatasource, you can use the following search to access the logs:
index=_internal sourcetype=trackme:custom_commands:trackmepushdatasource
Annexes for Pushing Expected Sources
Annex A: Command trackmepushdatasource Arguments
The following table describes all available arguments for the trackmepushdatasource command:
Argument |
Required |
Default |
Description |
|---|---|---|---|
tenant_id |
Yes |
None |
The tenant identifier |
component |
Yes |
None |
The component to use (dsm or dhm) |
search_type |
Yes |
None |
The type of search to perform (tstats or raw) |
show_search_query |
No |
False |
If true, includes the search query in the summary output |
show_search_results |
No |
False |
If true, includes the search results in the summary output |
pretend_latest |
No |
-24h |
Relative time value in Splunk format for data_last_time_seen |
Annex B: Controlling the Expected Sources Break by Logic for splk-dsm
For expected data sources, if the TrackMe tracker logic includes a specific break by logic, you can submit the value for the object accordingly, which the command will handle automatically.
Example: We use an additional break by logic with an indexed field called cribl_env:
| inputlookup ds_expected.csv
| fields index, sourcetype, cribl_env
| eval object = index . ":" . sourcetype . ":" . "|key:cribl_env|" . cribl_env
| trackmepushdatasource search_type=tstats tenant_id=secops show_search_query=True show_search_results=True pretend_latest="-24h" component="dsm"
Annex C: Controlling the Expected Host Metadata for splk-dhm
For expected hosts, you can control the metadata for the host by submitting the host value with the expected metadata key for the object accordingly, which the command will handle automatically.
Example: We use a custom host metadata called forwarder instead of the default host metadata:
| inputlookup dh_expected.csv
| fields host
| eval host = "key:forwarder|" . host
| trackmepushdatasource search_type=tstats tenant_id=endpoints show_search_query=True show_search_results=True pretend_latest="-24h" component="dhm"