Volume outliers on the Splunk license usage with Volume Outliers (VOL)
About this white paper
This white paper walks through the Volume Outliers (VOL) component introduced in TrackMe 2.4.18: the detection of abnormal drops and spikes of the licensed volume of every Splunk index, the detection of silent indexes, and the analytics of the license consumption — trend, month projection, top consumers, pools — that come with it.
Updated for 2.4.19: the Global license usage tab became a multi-tab view — named scopes, working days and holidays, days over quota, opt-in costs and a monthly chargeback per cost centre, with an AI Assistant that can configure it for you — and the backfill accepts any depth up to 400 days.
Volume detection has always been part of TrackMe, per feed and per index. VOL is its standardised, first-class form at scale, and supersedes the earlier recipes.
It is a tutorial on a live deployment: a Splunk Enterprise environment already monitored by two typical TrackMe tenants (a feeds tenant and a hosts tenant), to which we add a Volume Outliers tenant in a few clicks and follow it from its creation to its first detections.
It supersedes the volume-outliers recipes of the earlier white papers — detecting abnormal events count drops with the splk-dsm models and the Flex Objects license usage per index templates — which remain valid references for custom needs (per-feed event counts, custom KPIs) and are cross-referenced where relevant.
VOL is available on the Foundation, Enterprise and Unlimited editions.
Product guide references: VOL — Volume Outliers, Volume Outliers — in depth, Outlier detection.
The problem: volume deviations nobody sees coming
The volume of data a Splunk index receives is one of the most telling signals of a platform, and one of the least monitored:
A drop is, more often than not, a broken pipeline: a forwarder stopped, a syslog relay lost a route, a modular input silently stopped, a parsing change discards half of the events. The feed is still arriving — a freshness check is green — but half of what should be there is missing, and so are the detections and dashboards built on it.
A spike is a cost and a risk: a debug logging level left on, a runaway application, a new source pointed at the wrong index, a duplicate forwarder. Discovered at month end, it is a license overage; discovered within the hour, it is a ticket.
A silent index — one that stops consuming license altogether — is the drop nobody correlates: the index still exists, dashboards still run over it, and nobody notices that its last event is a week old.
TrackMe has offered volume outlier detection since its first versions (the splk-dsm
eventcount models), and, for licensed customers, the more efficient index-level recipe
built on Flex Objects over the licensing logs. Both work; both demand design (which
sourcetypes to exclude, which templates to deploy, how to backfill) before they deliver. The
requirement was clear: out of the box, reliable, cheap to run, and available to every
customer.
Why the license usage log
The Splunk license manager writes, every minute, one Usage event per index (and per
pool, host and source) into license_usage.log — the volume it counts against your
license. As a source for volume monitoring it is close to ideal:
Authoritative — it is the volume you pay for, measured by Splunk itself, not an approximation derived from event counts.
One source for the whole deployment — every index of every indexer, in one log, on the license manager; no per-index or per-sourcetype scan, whatever the number of indexes.
Cheap to read — a few kilobytes per minute; reading only the new events every five minutes costs a fraction of one
tstatsover the platform.The same everywhere — Splunk Enterprise or Splunk Cloud, and on a remote deployment through a TrackMe remote account: the format and the semantics do not change.
Volume Outliers builds on it with a purpose-built, incremental collector — described in the in-depth reference — and turns every index into a first-class TrackMe entity.
What VOL delivers
Capability |
What you get |
|---|---|
Detection |
One ML model per index on its rolling 24-hour licensed volume, with a detection direction per index — drops, spikes, or both. Inactivity detection with a tenant policy (by day of week and hour of day) and per-index overrides. |
Day one |
The history is backfilled at creation (30 days by default), so the models are trained and the cost trend is complete immediately. |
Analytics |
Per index: the daily licensed volume per license day, the 30-day trend, the month to date and the month projection. For the environment: the Global license usage (VOL) tab — key figures, insights, top consumers, movers, pools and quotas. |
Operations |
Priority, tags, labels, SLA, logical groups, acknowledgments, notes, maintenance, stateful alerting with rich emails, the AI Assistant and the AI ML Advisor: every index is a regular TrackMe entity. |
Cost |
One bounded search every five minutes per tenant, reading only the new license usage events; a compact metrics footprint (about 216 KB per index per day). |
The environment of this tutorial
Our deployment is a typical Foundation setup: one Splunk Enterprise environment,
monitored by two TrackMe tenants — Data sources for SecOps (splk-dsm, the feeds by index
and sourcetype) and SecOps Hosts tracking (splk-dhm, the endpoints). We add a third
tenant for the license volume. The environment has around forty indexes in one license
pool; the license usage log is the standard index=_internal source="*/license_usage.log".
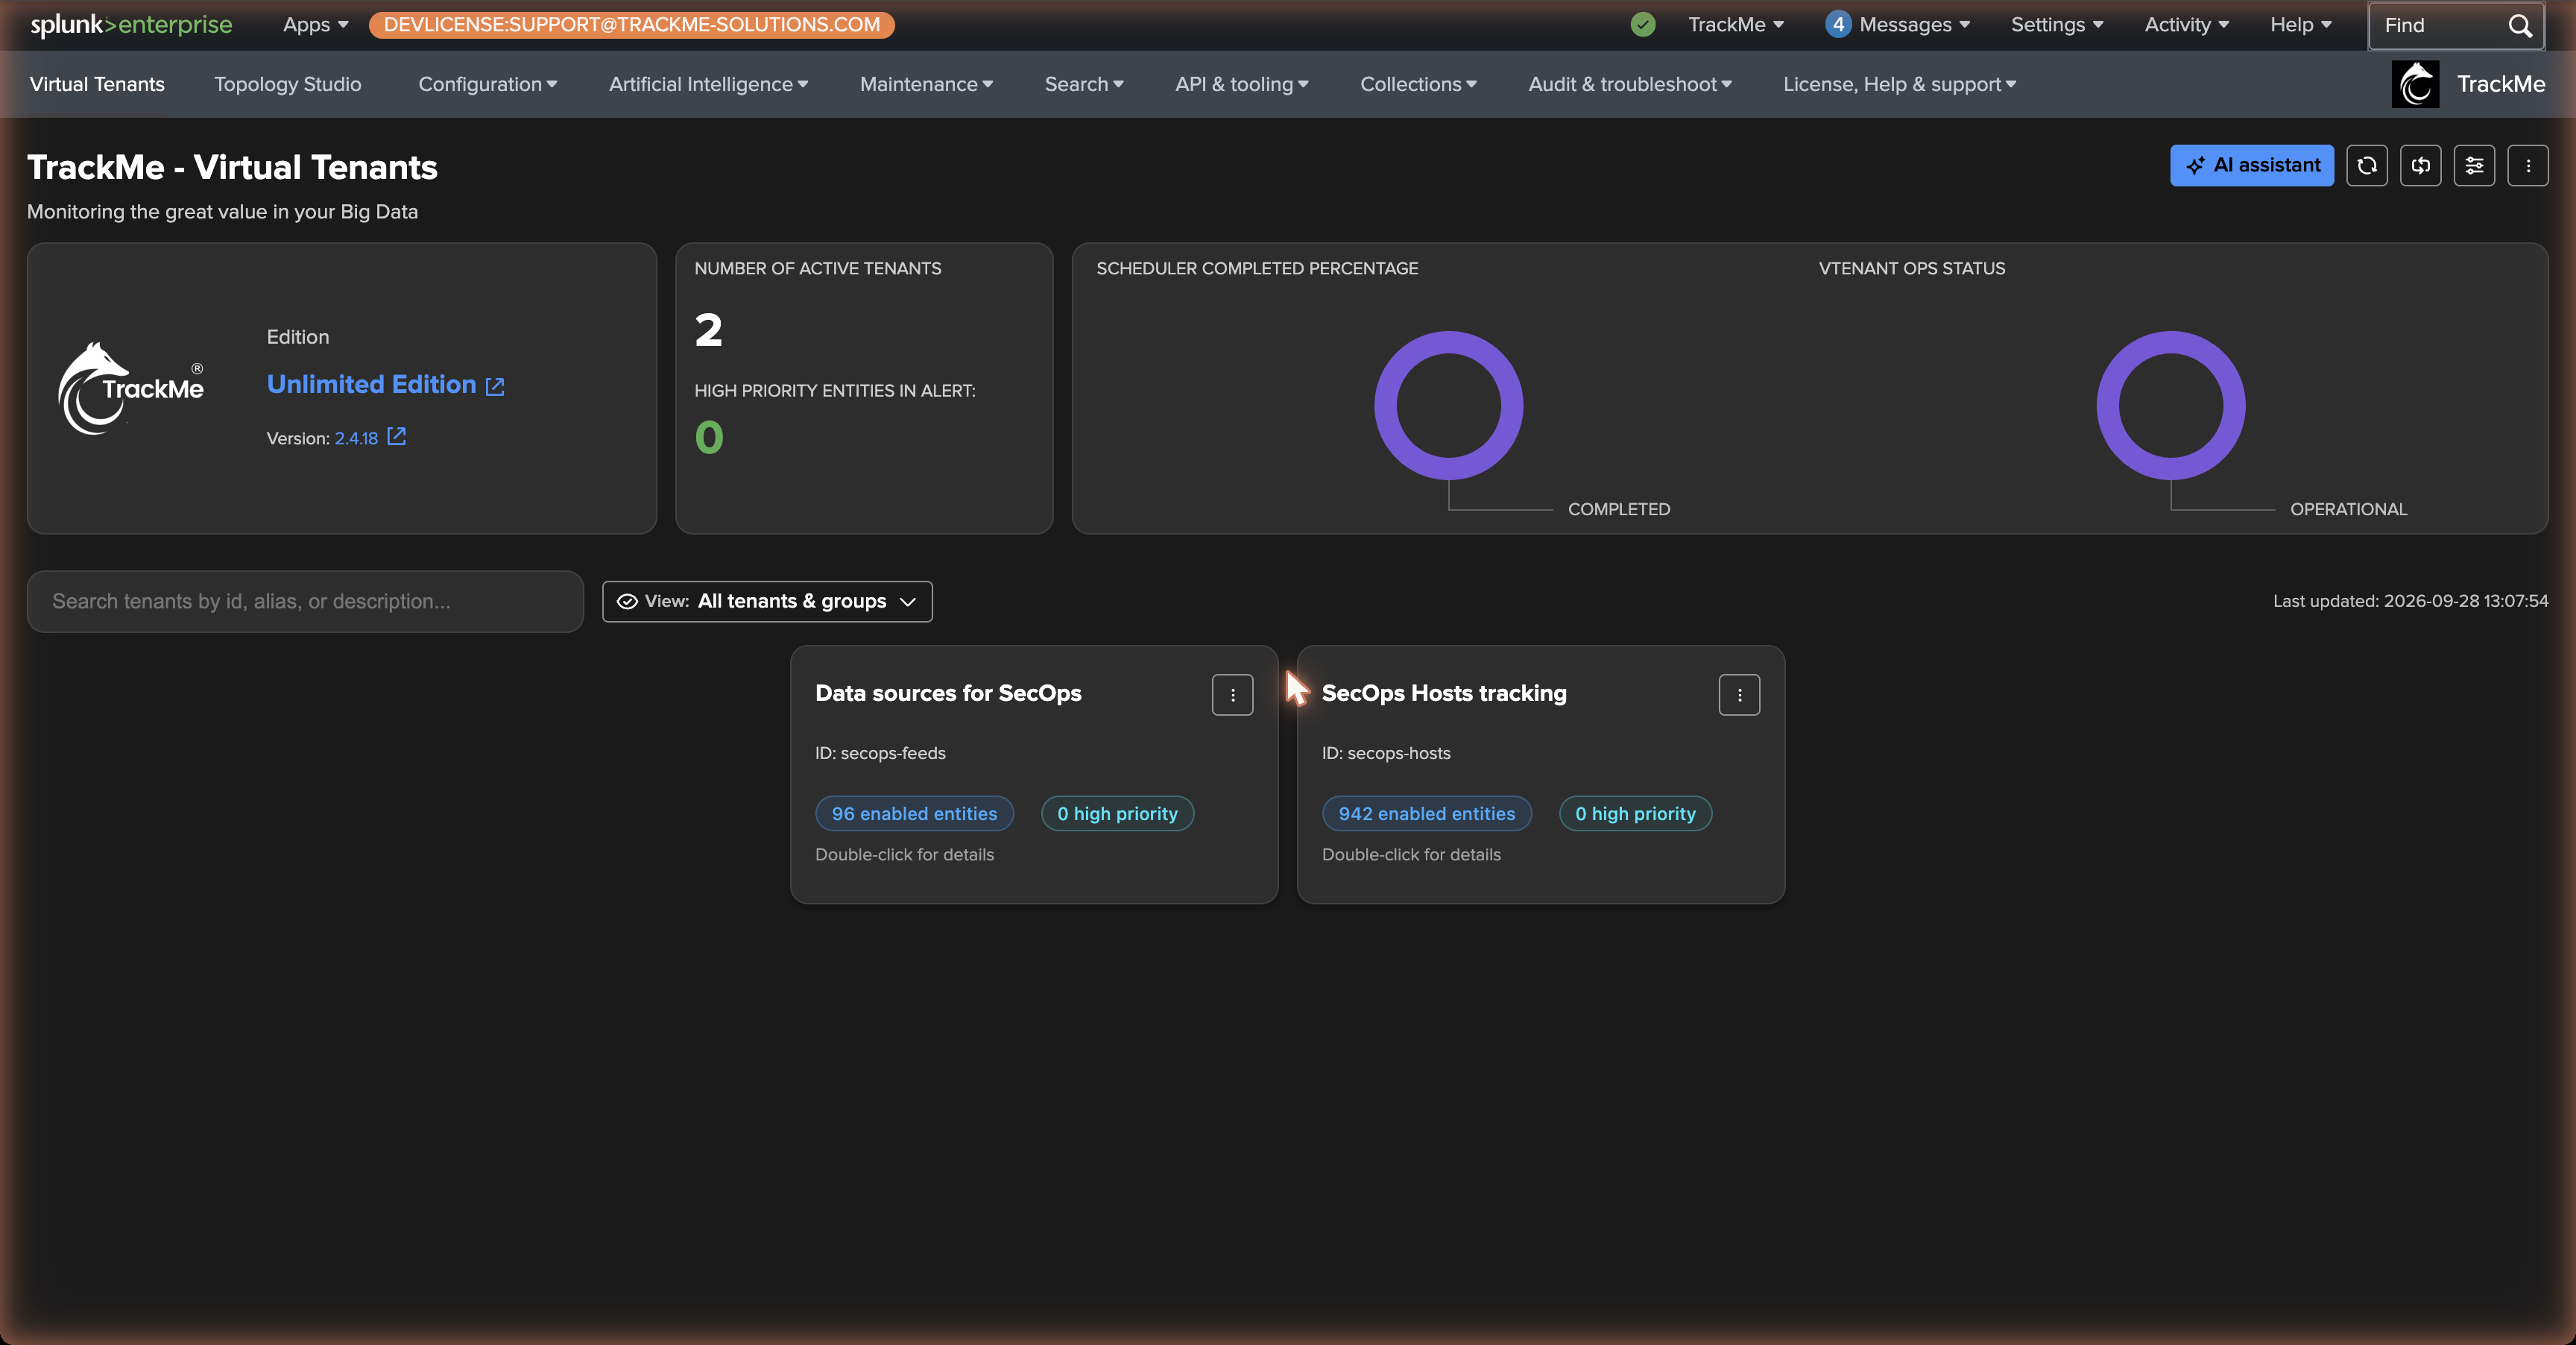
Step 1 — Create the Volume Outliers tenant
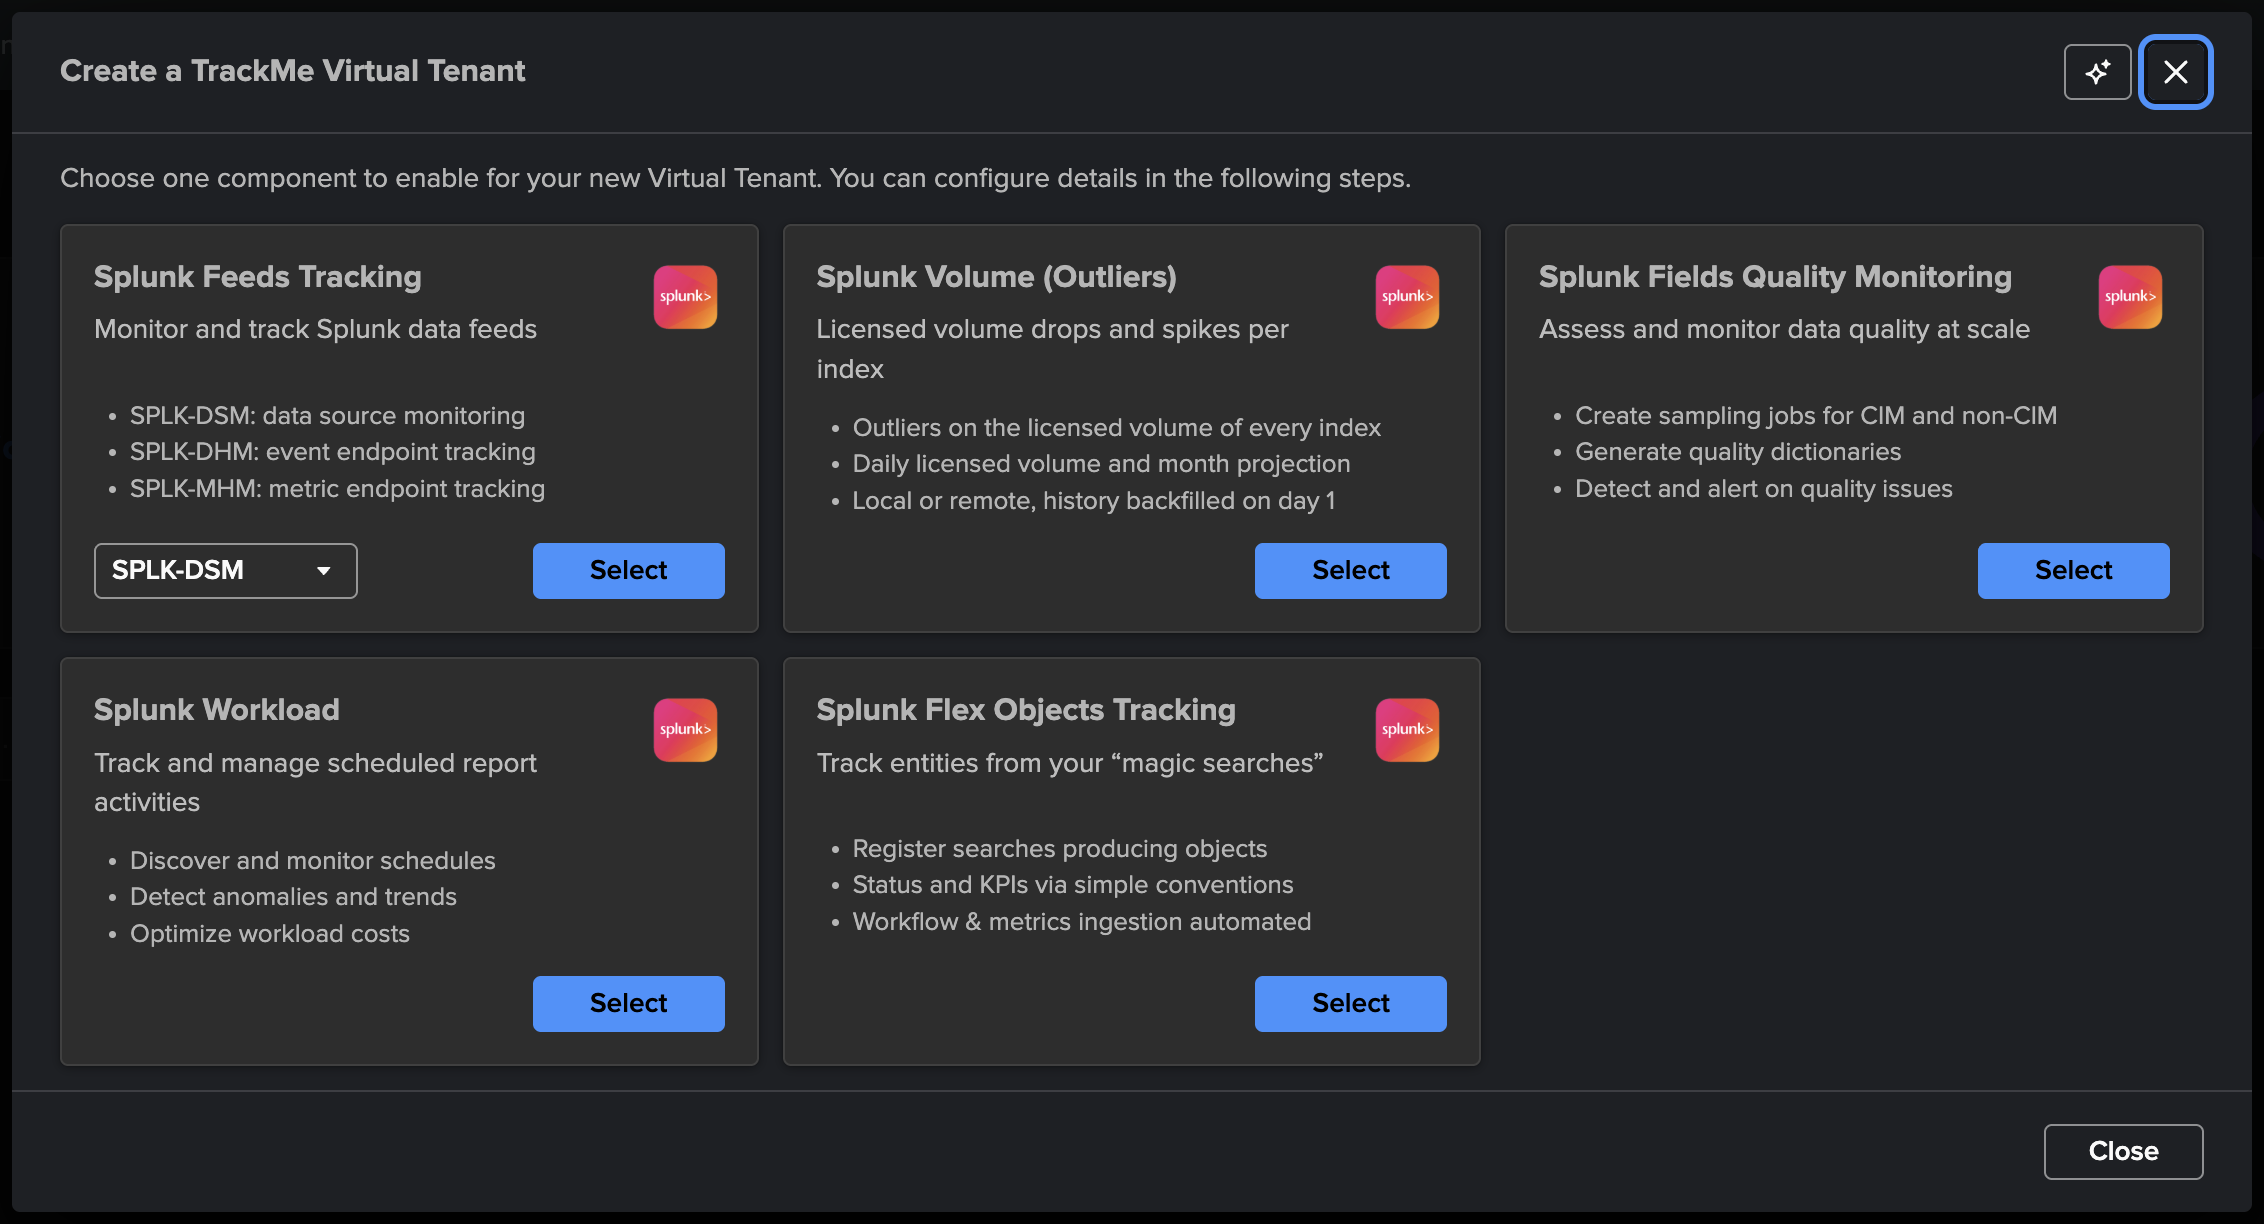
From the Virtual Tenants page, Actions → Create a tracking tenant opens the component chooser. The Splunk Volume (Outliers) card is second, right after Splunk Feeds Tracking:
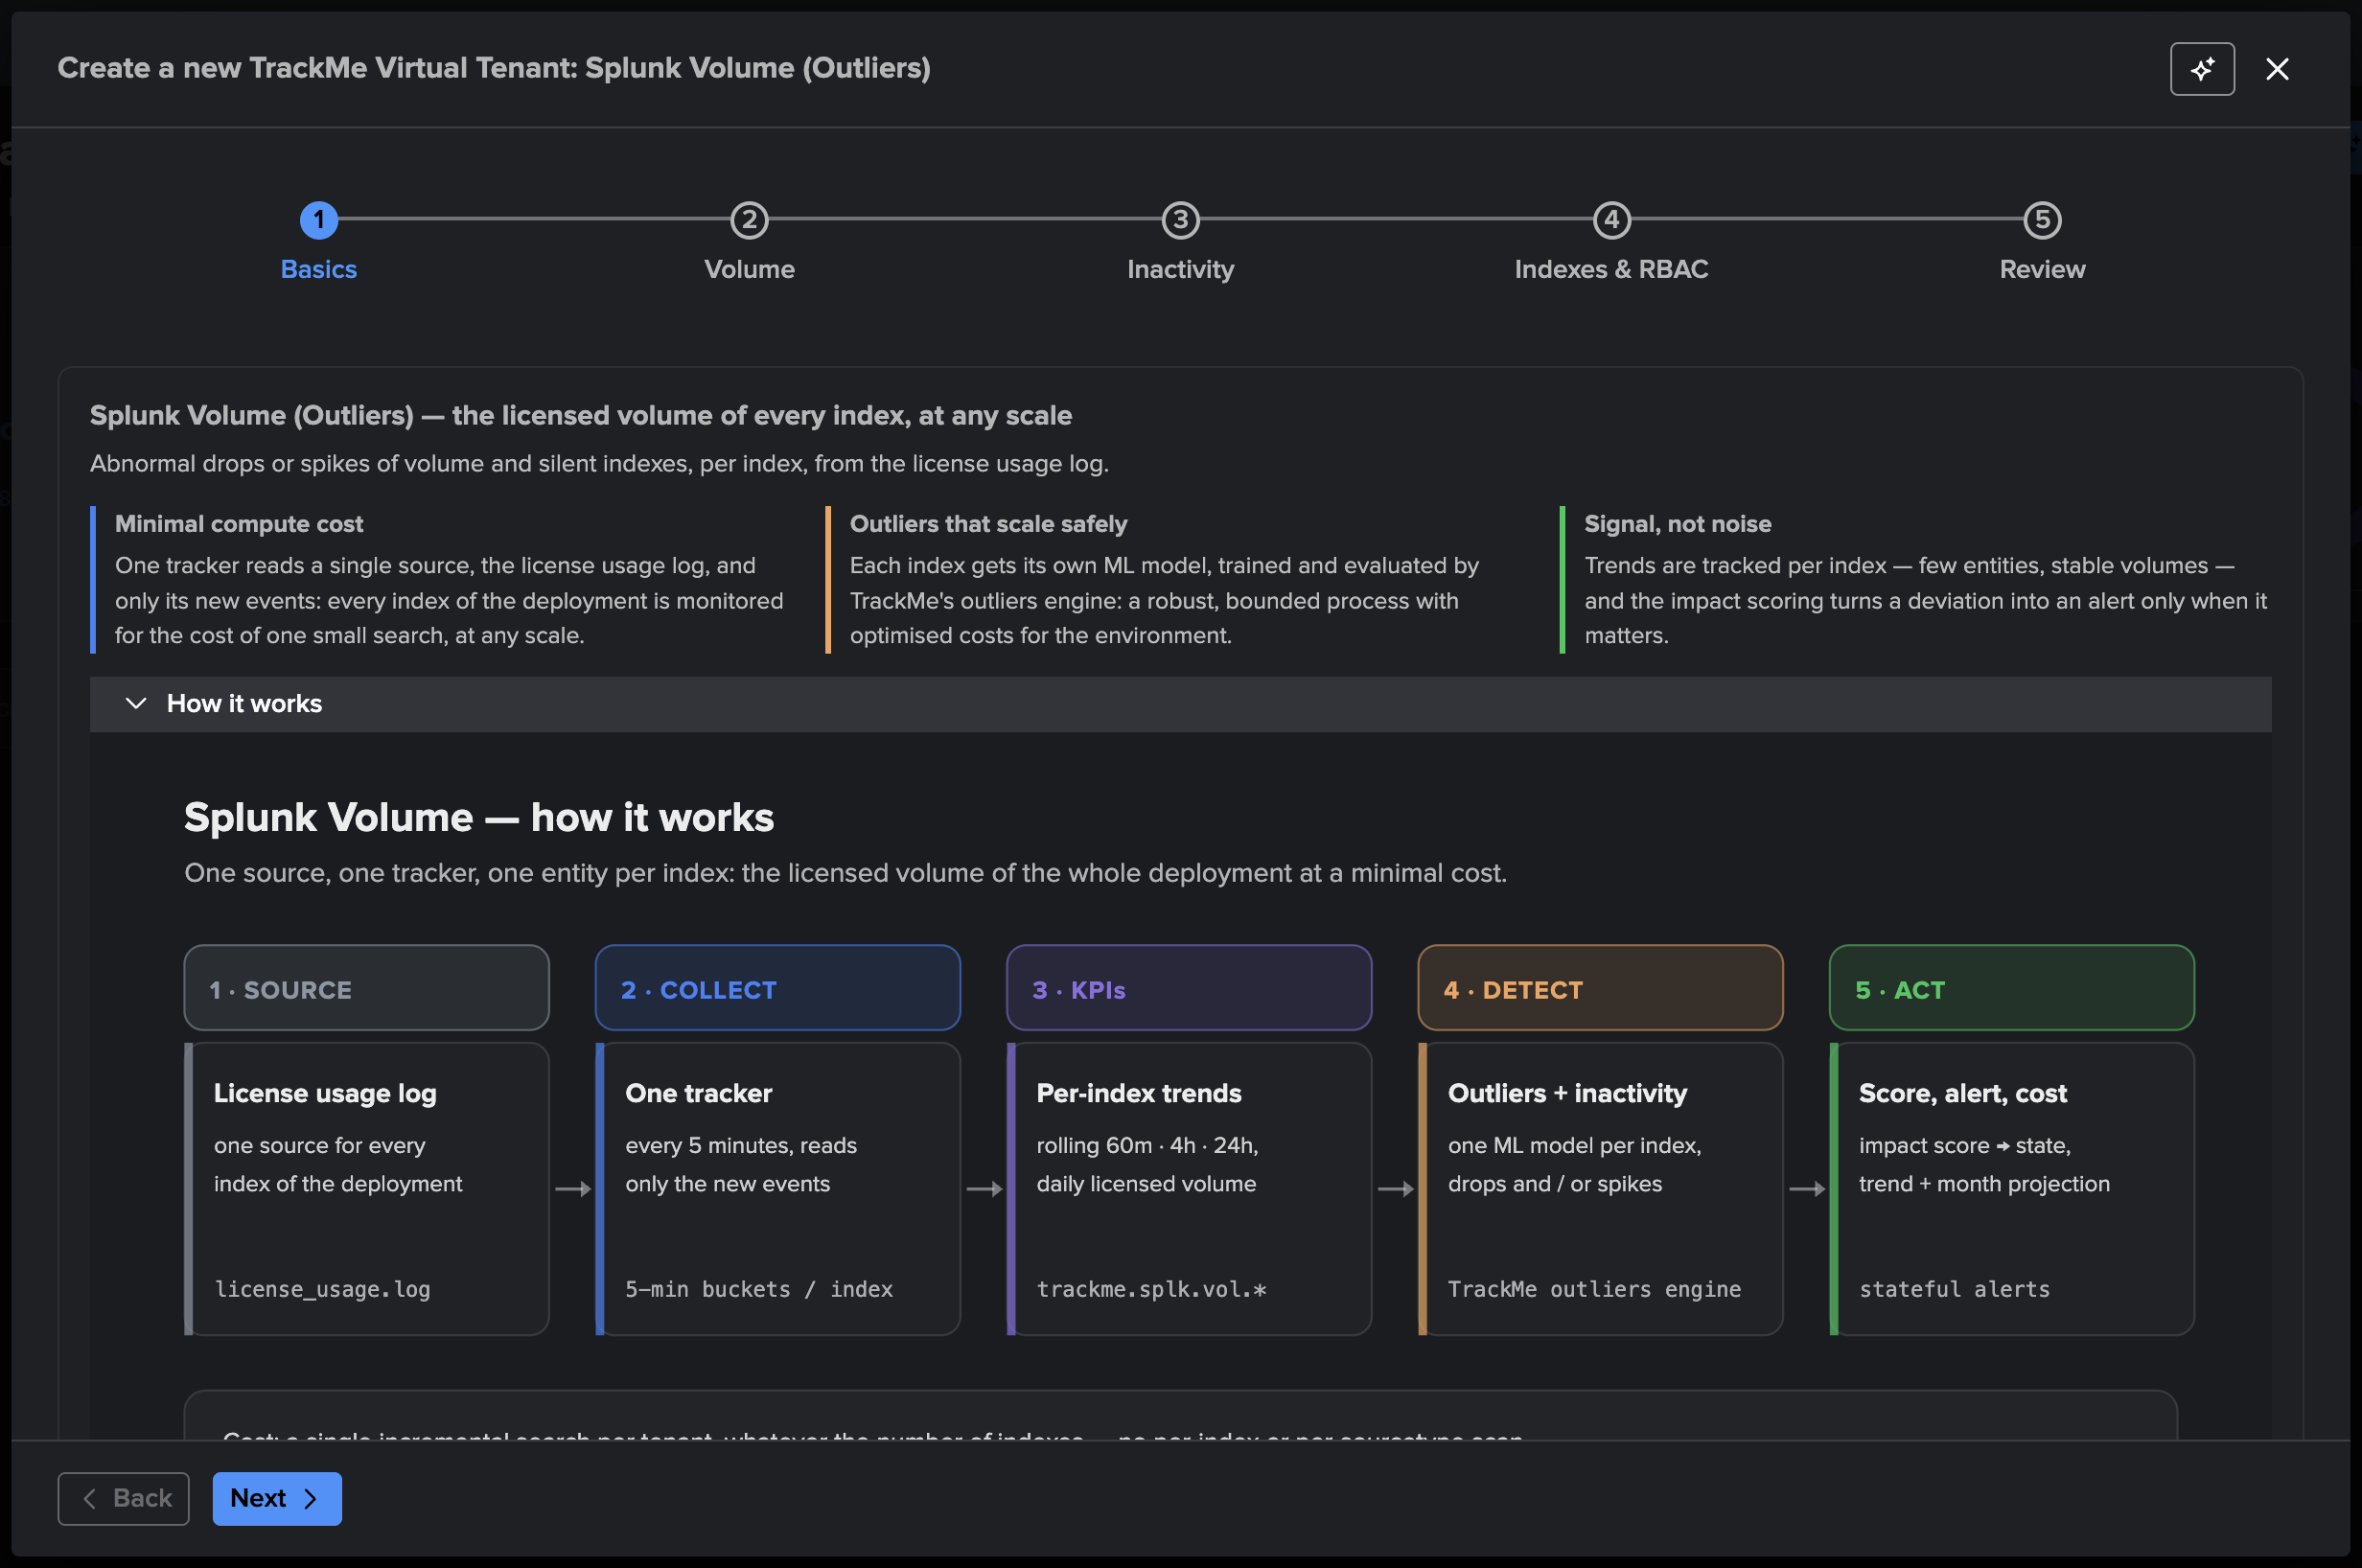
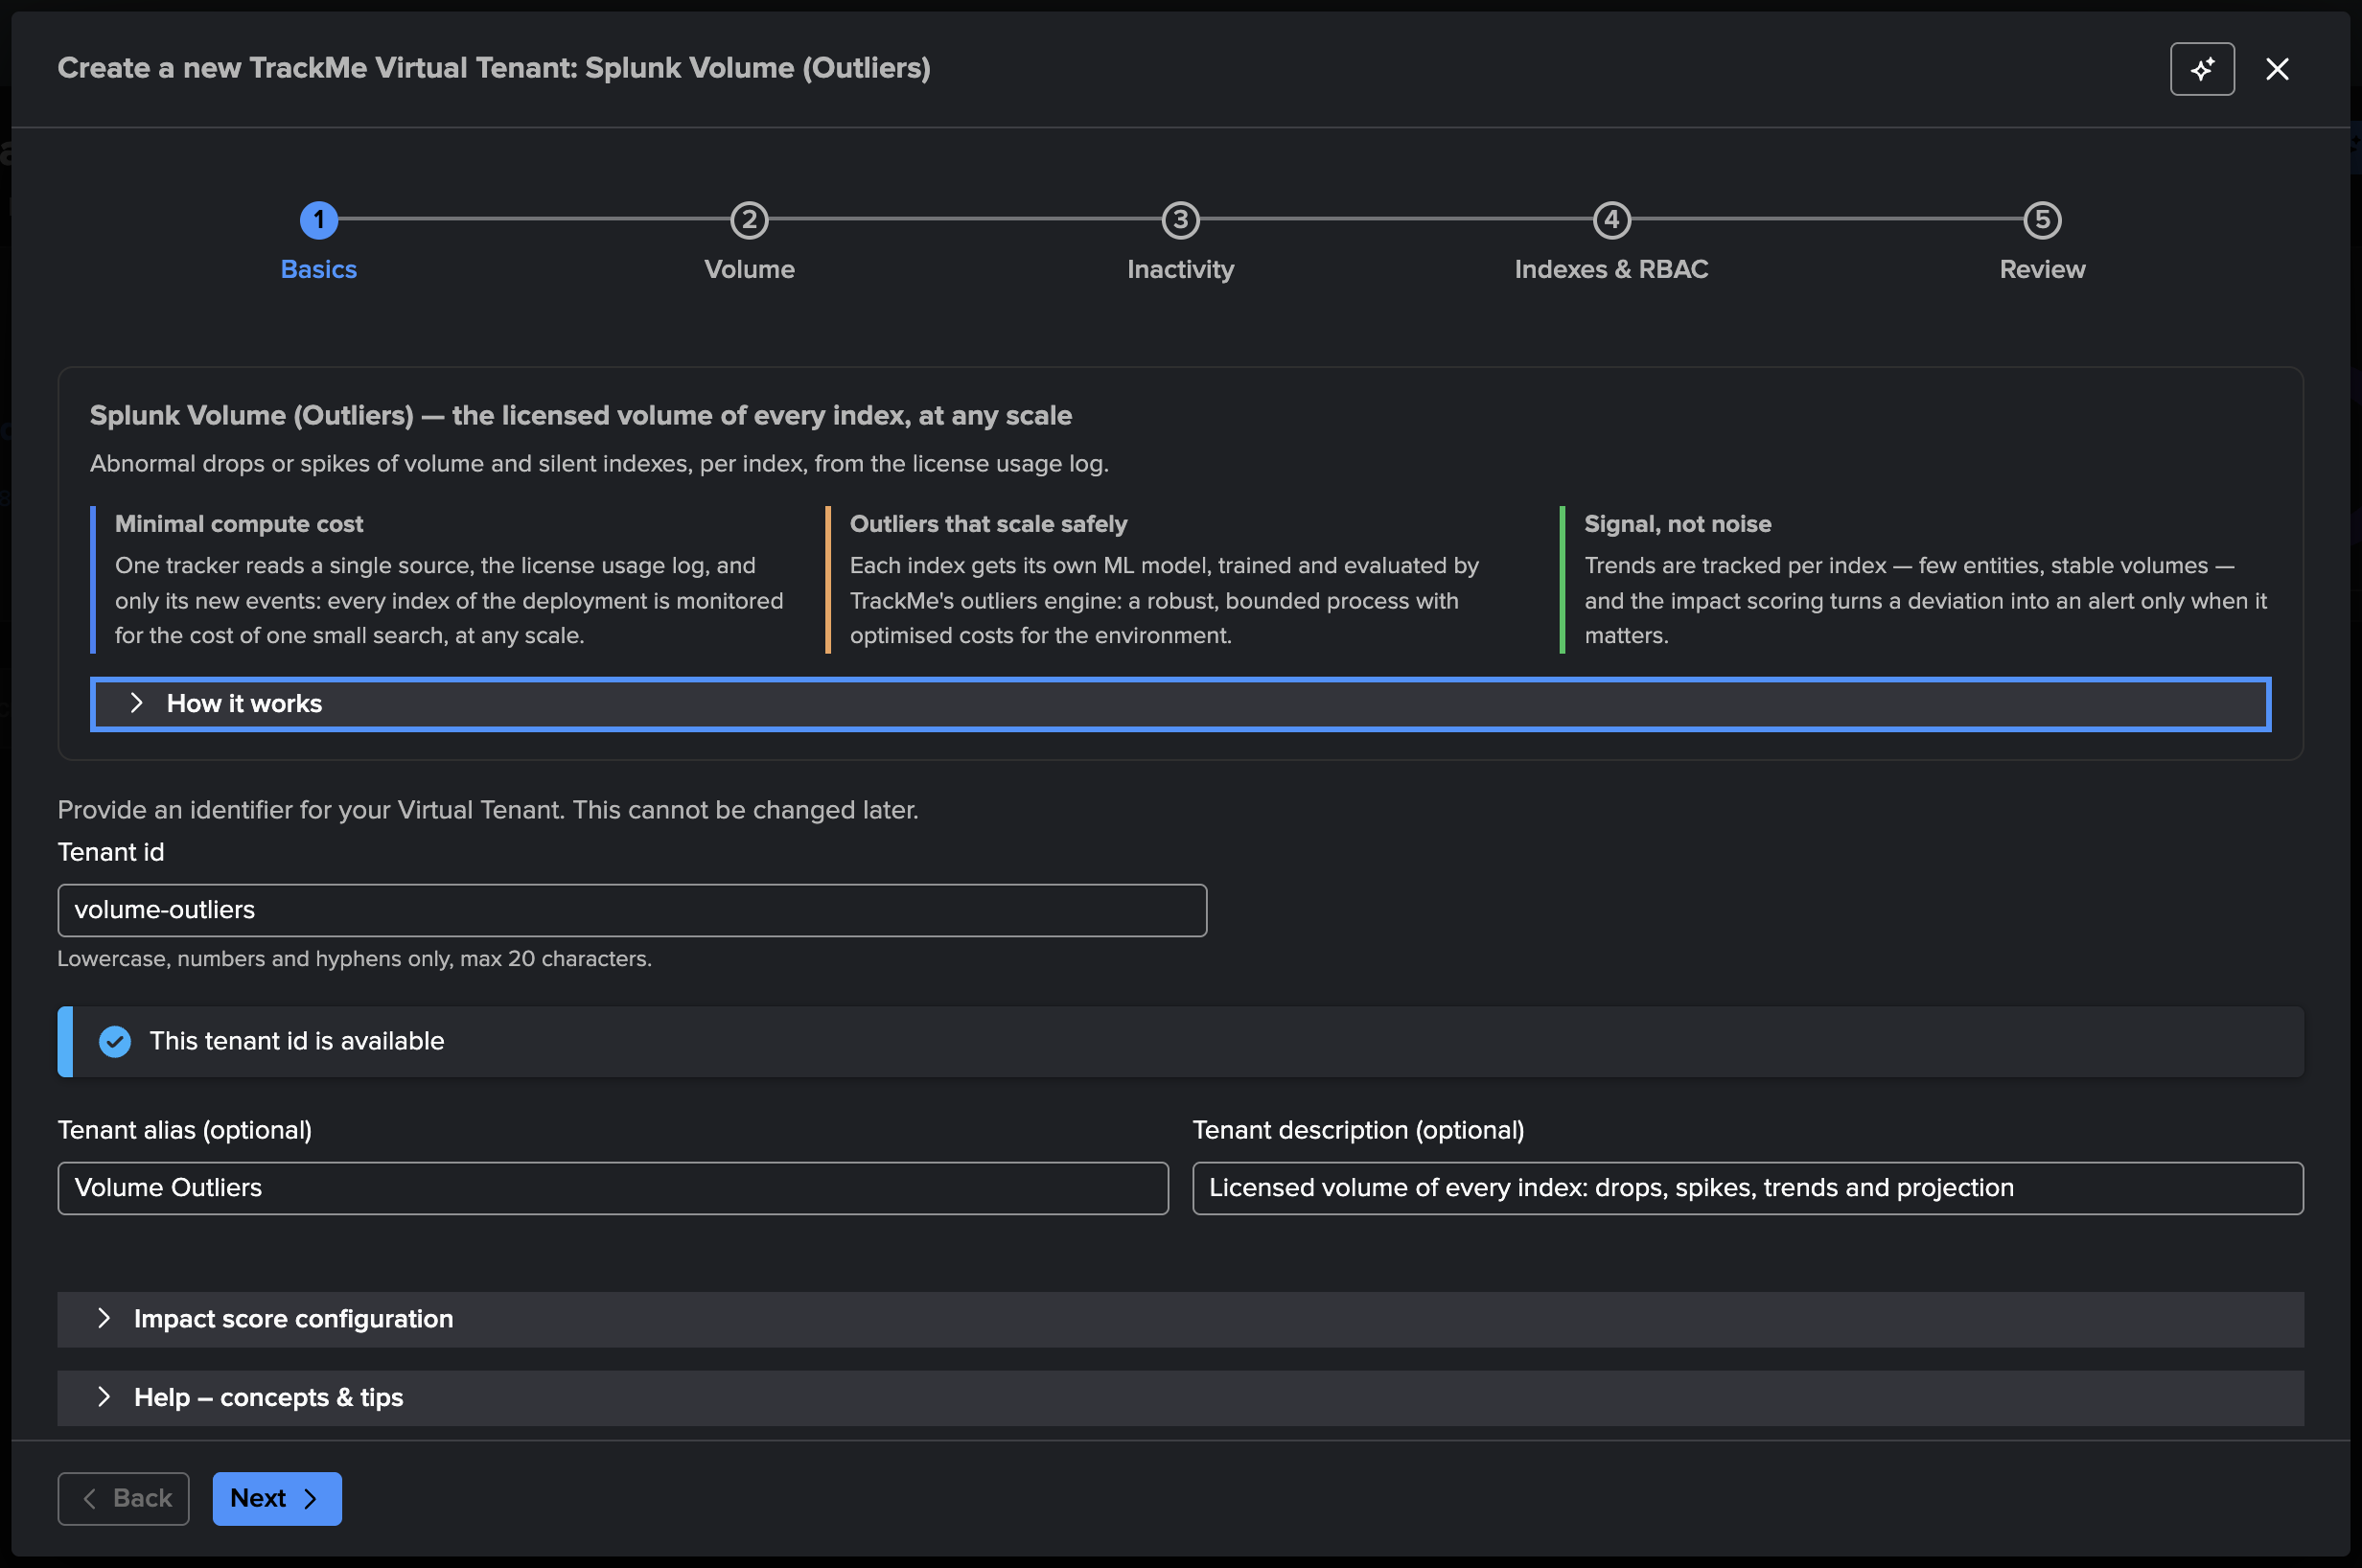
The Basics step introduces the component — one tracker, one entity per index, outliers
that scale safely — and asks for the tenant identity. We call the tenant
volume-outliers:
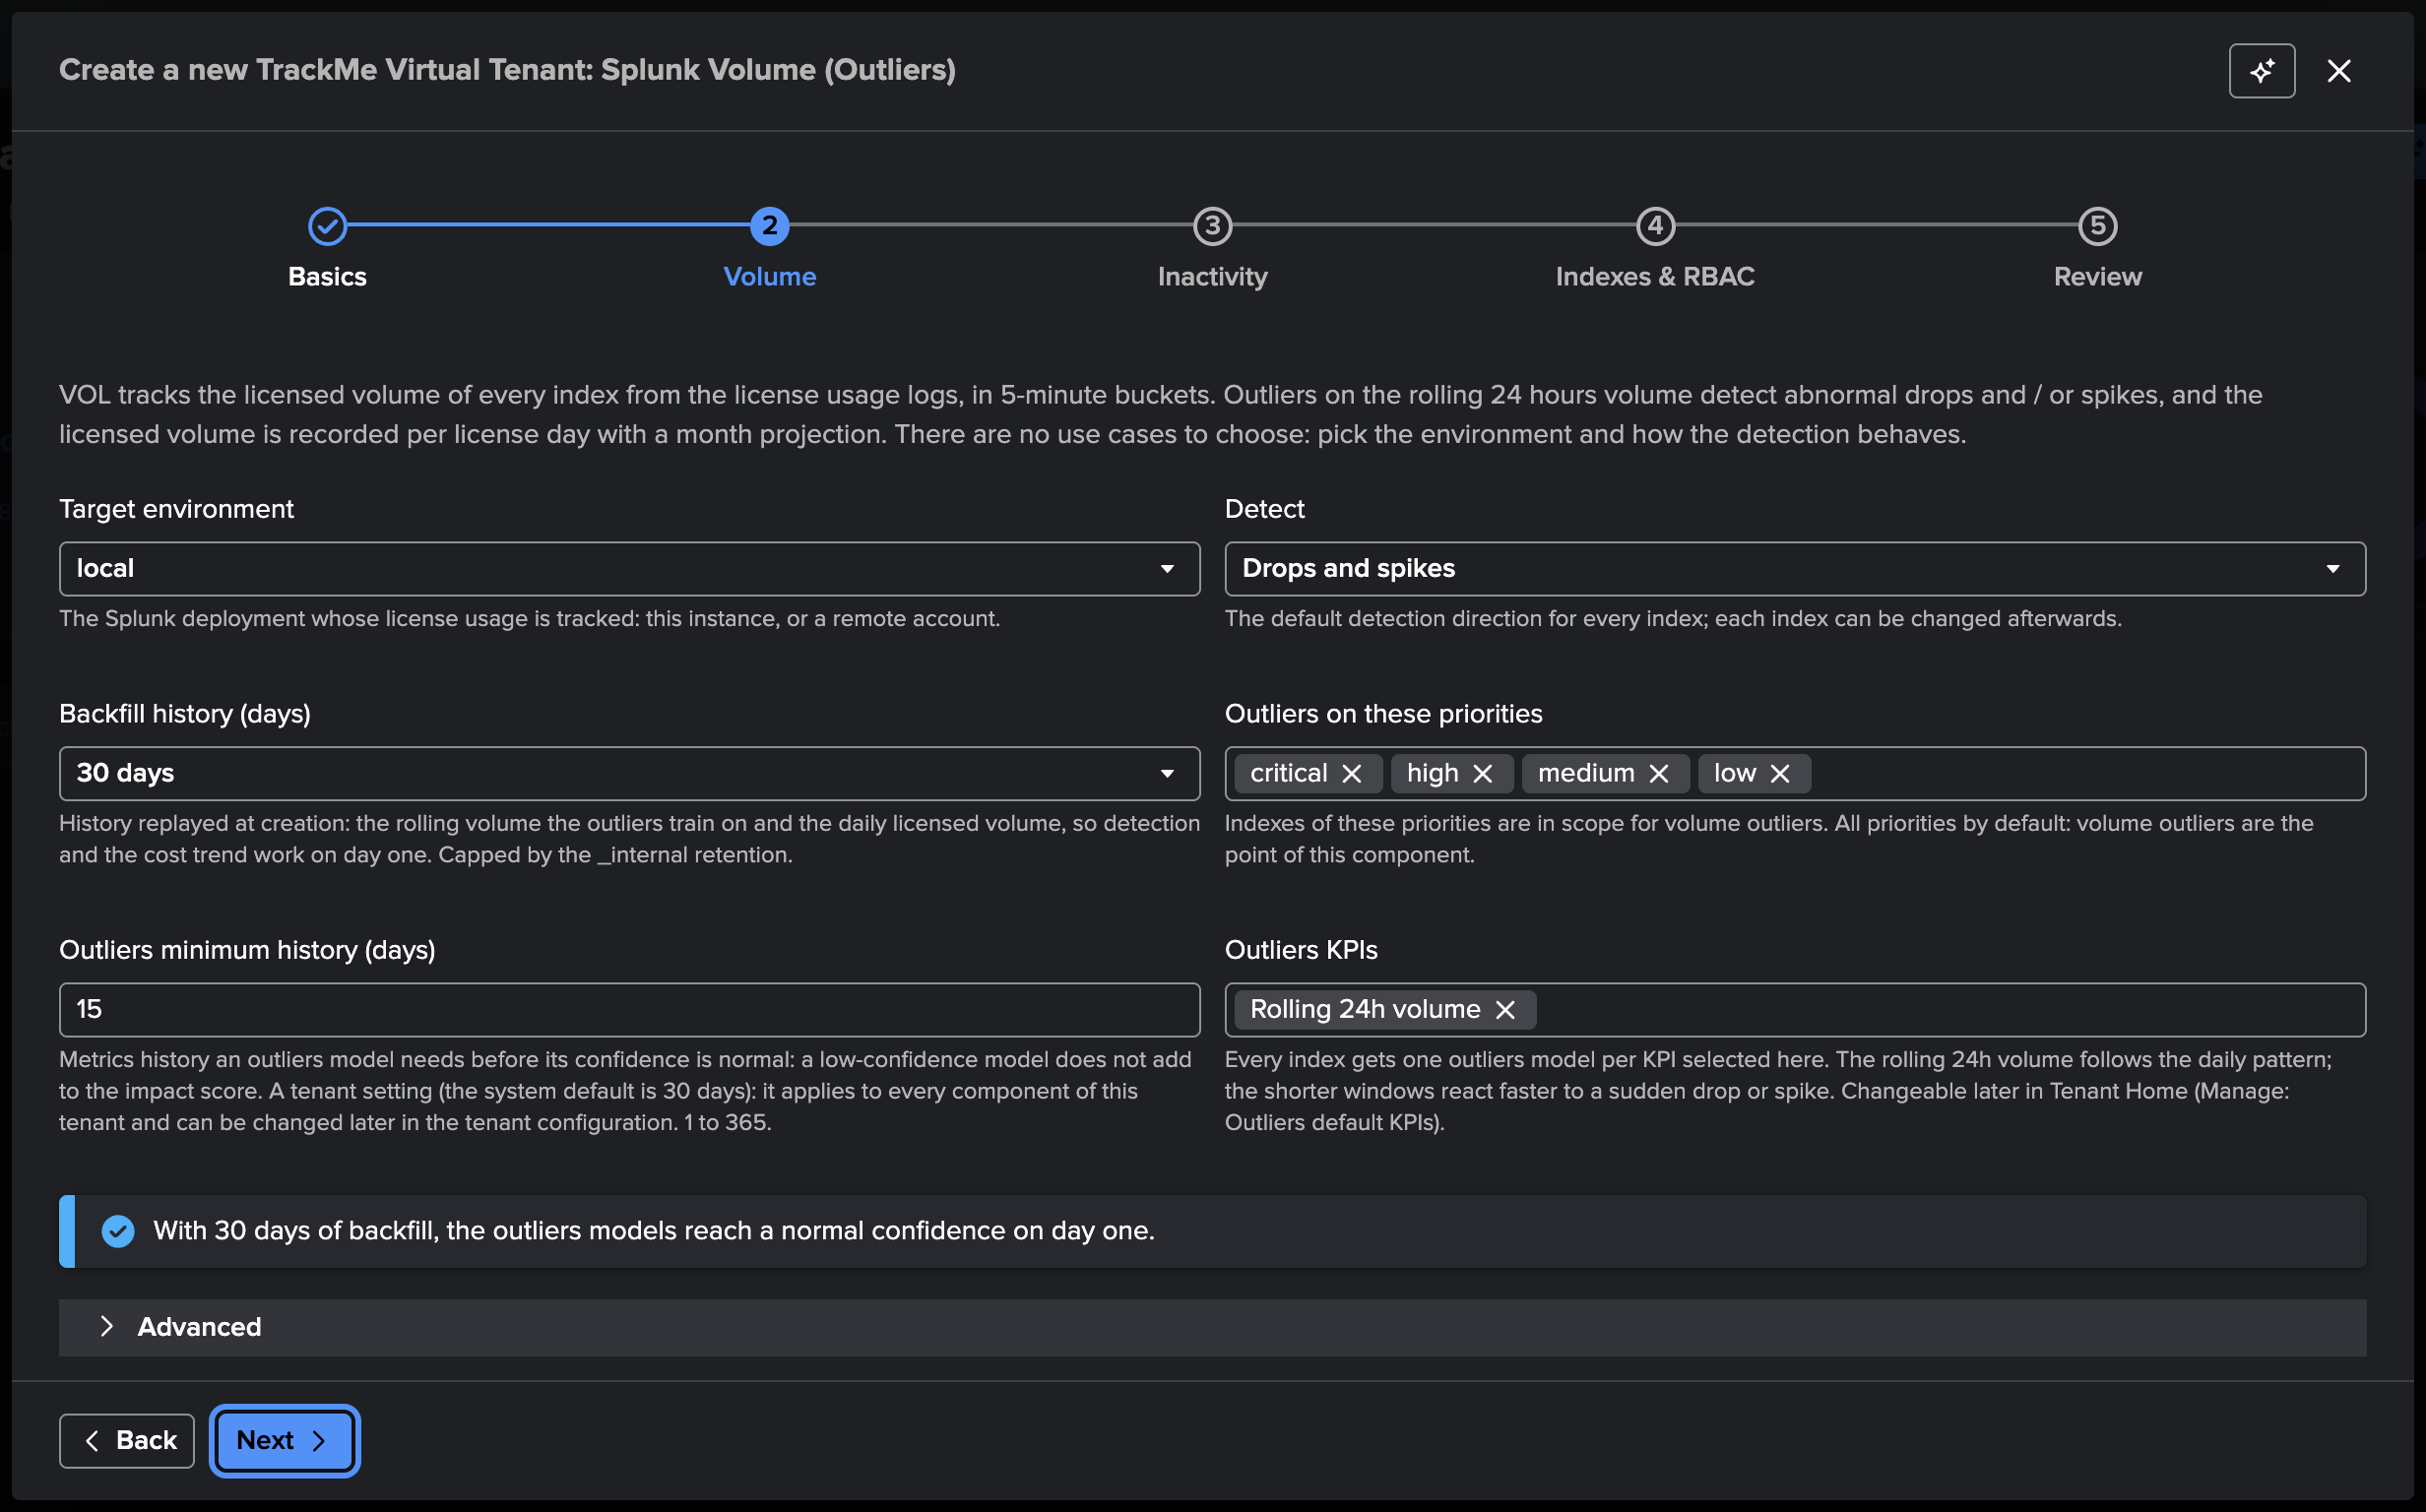
The Volume step is where the component is configured, and its defaults are the recommended values:
Target environment:
local— the license usage of this Splunk deployment. A remote account would collect another deployment’s license usage from here.Detect: Drops and spikes — the default direction of every new index; we will change it per index later.
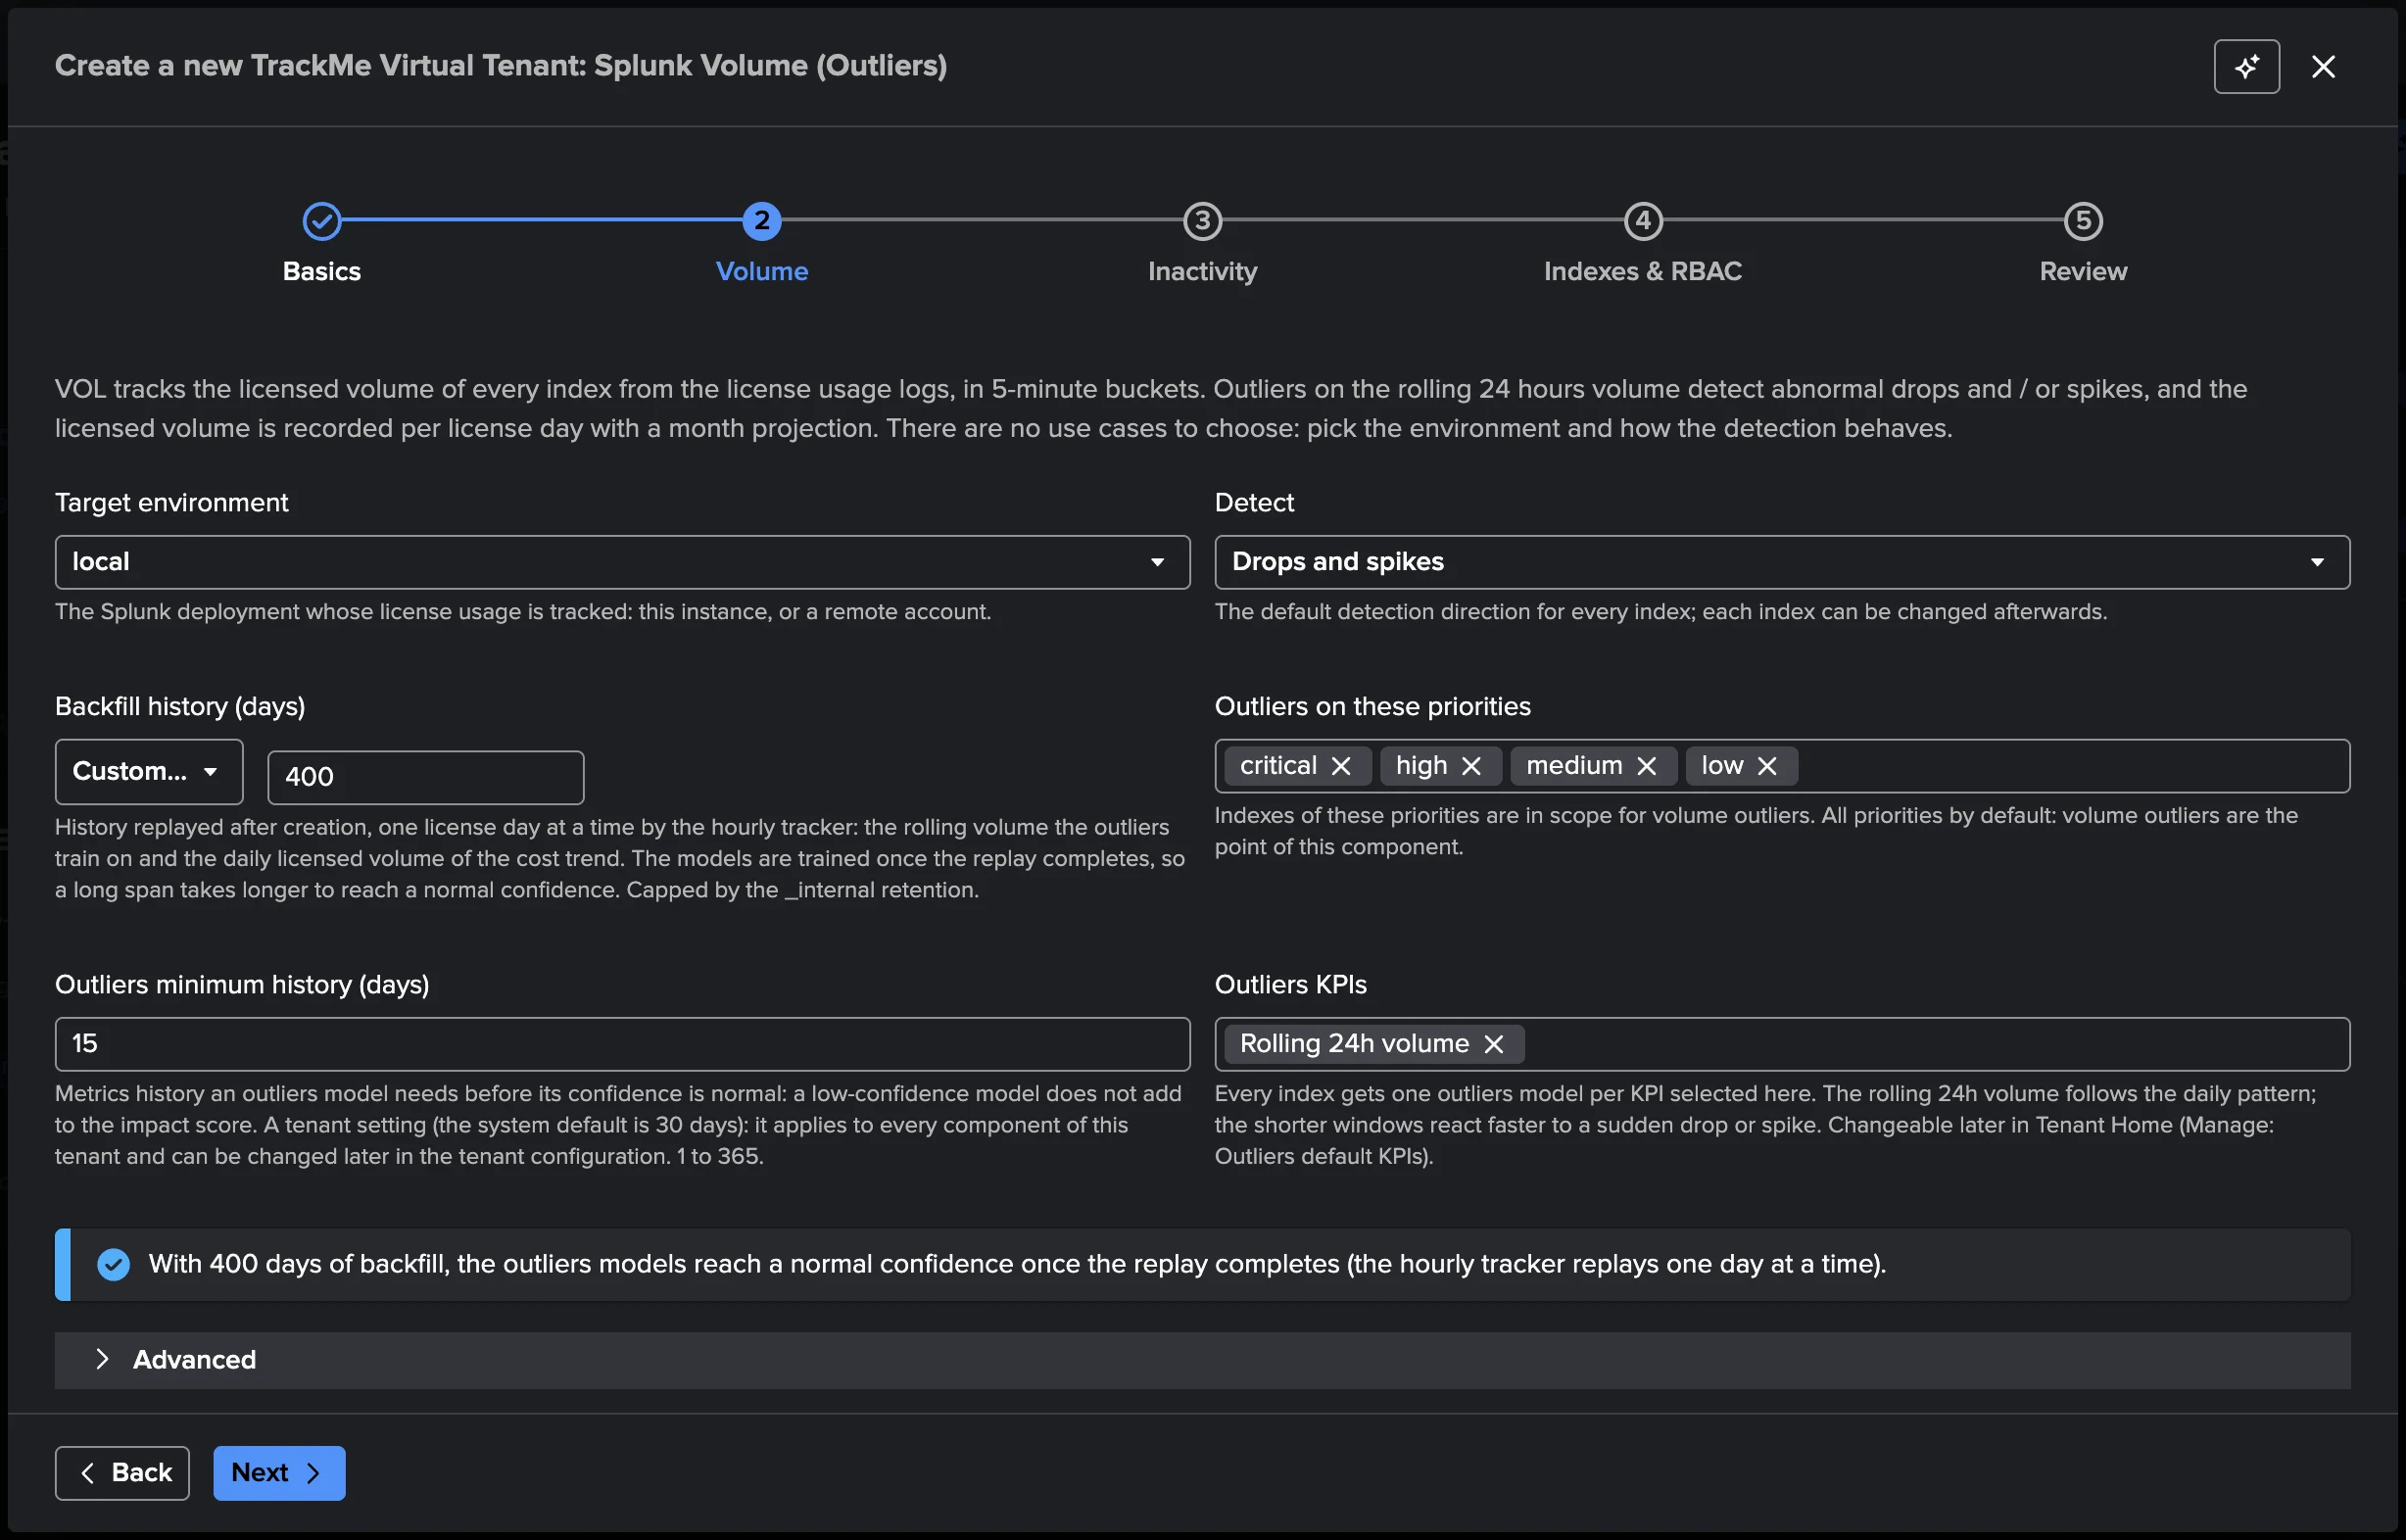
Backfill history: 30 days — the history replayed at creation. The list offers 7 to 90 days, and Custom… any number of days up to 400, within the retention of the license usage log.
Outliers on these priorities: every priority.
Outliers minimum history: 15 days — the history a model needs before its confidence is normal; the notice confirms that 30 days of backfill cover it, so the models reach normal confidence as soon as the backfill completes.
Outliers KPIs: the rolling 24h volume — one model per index.
Note
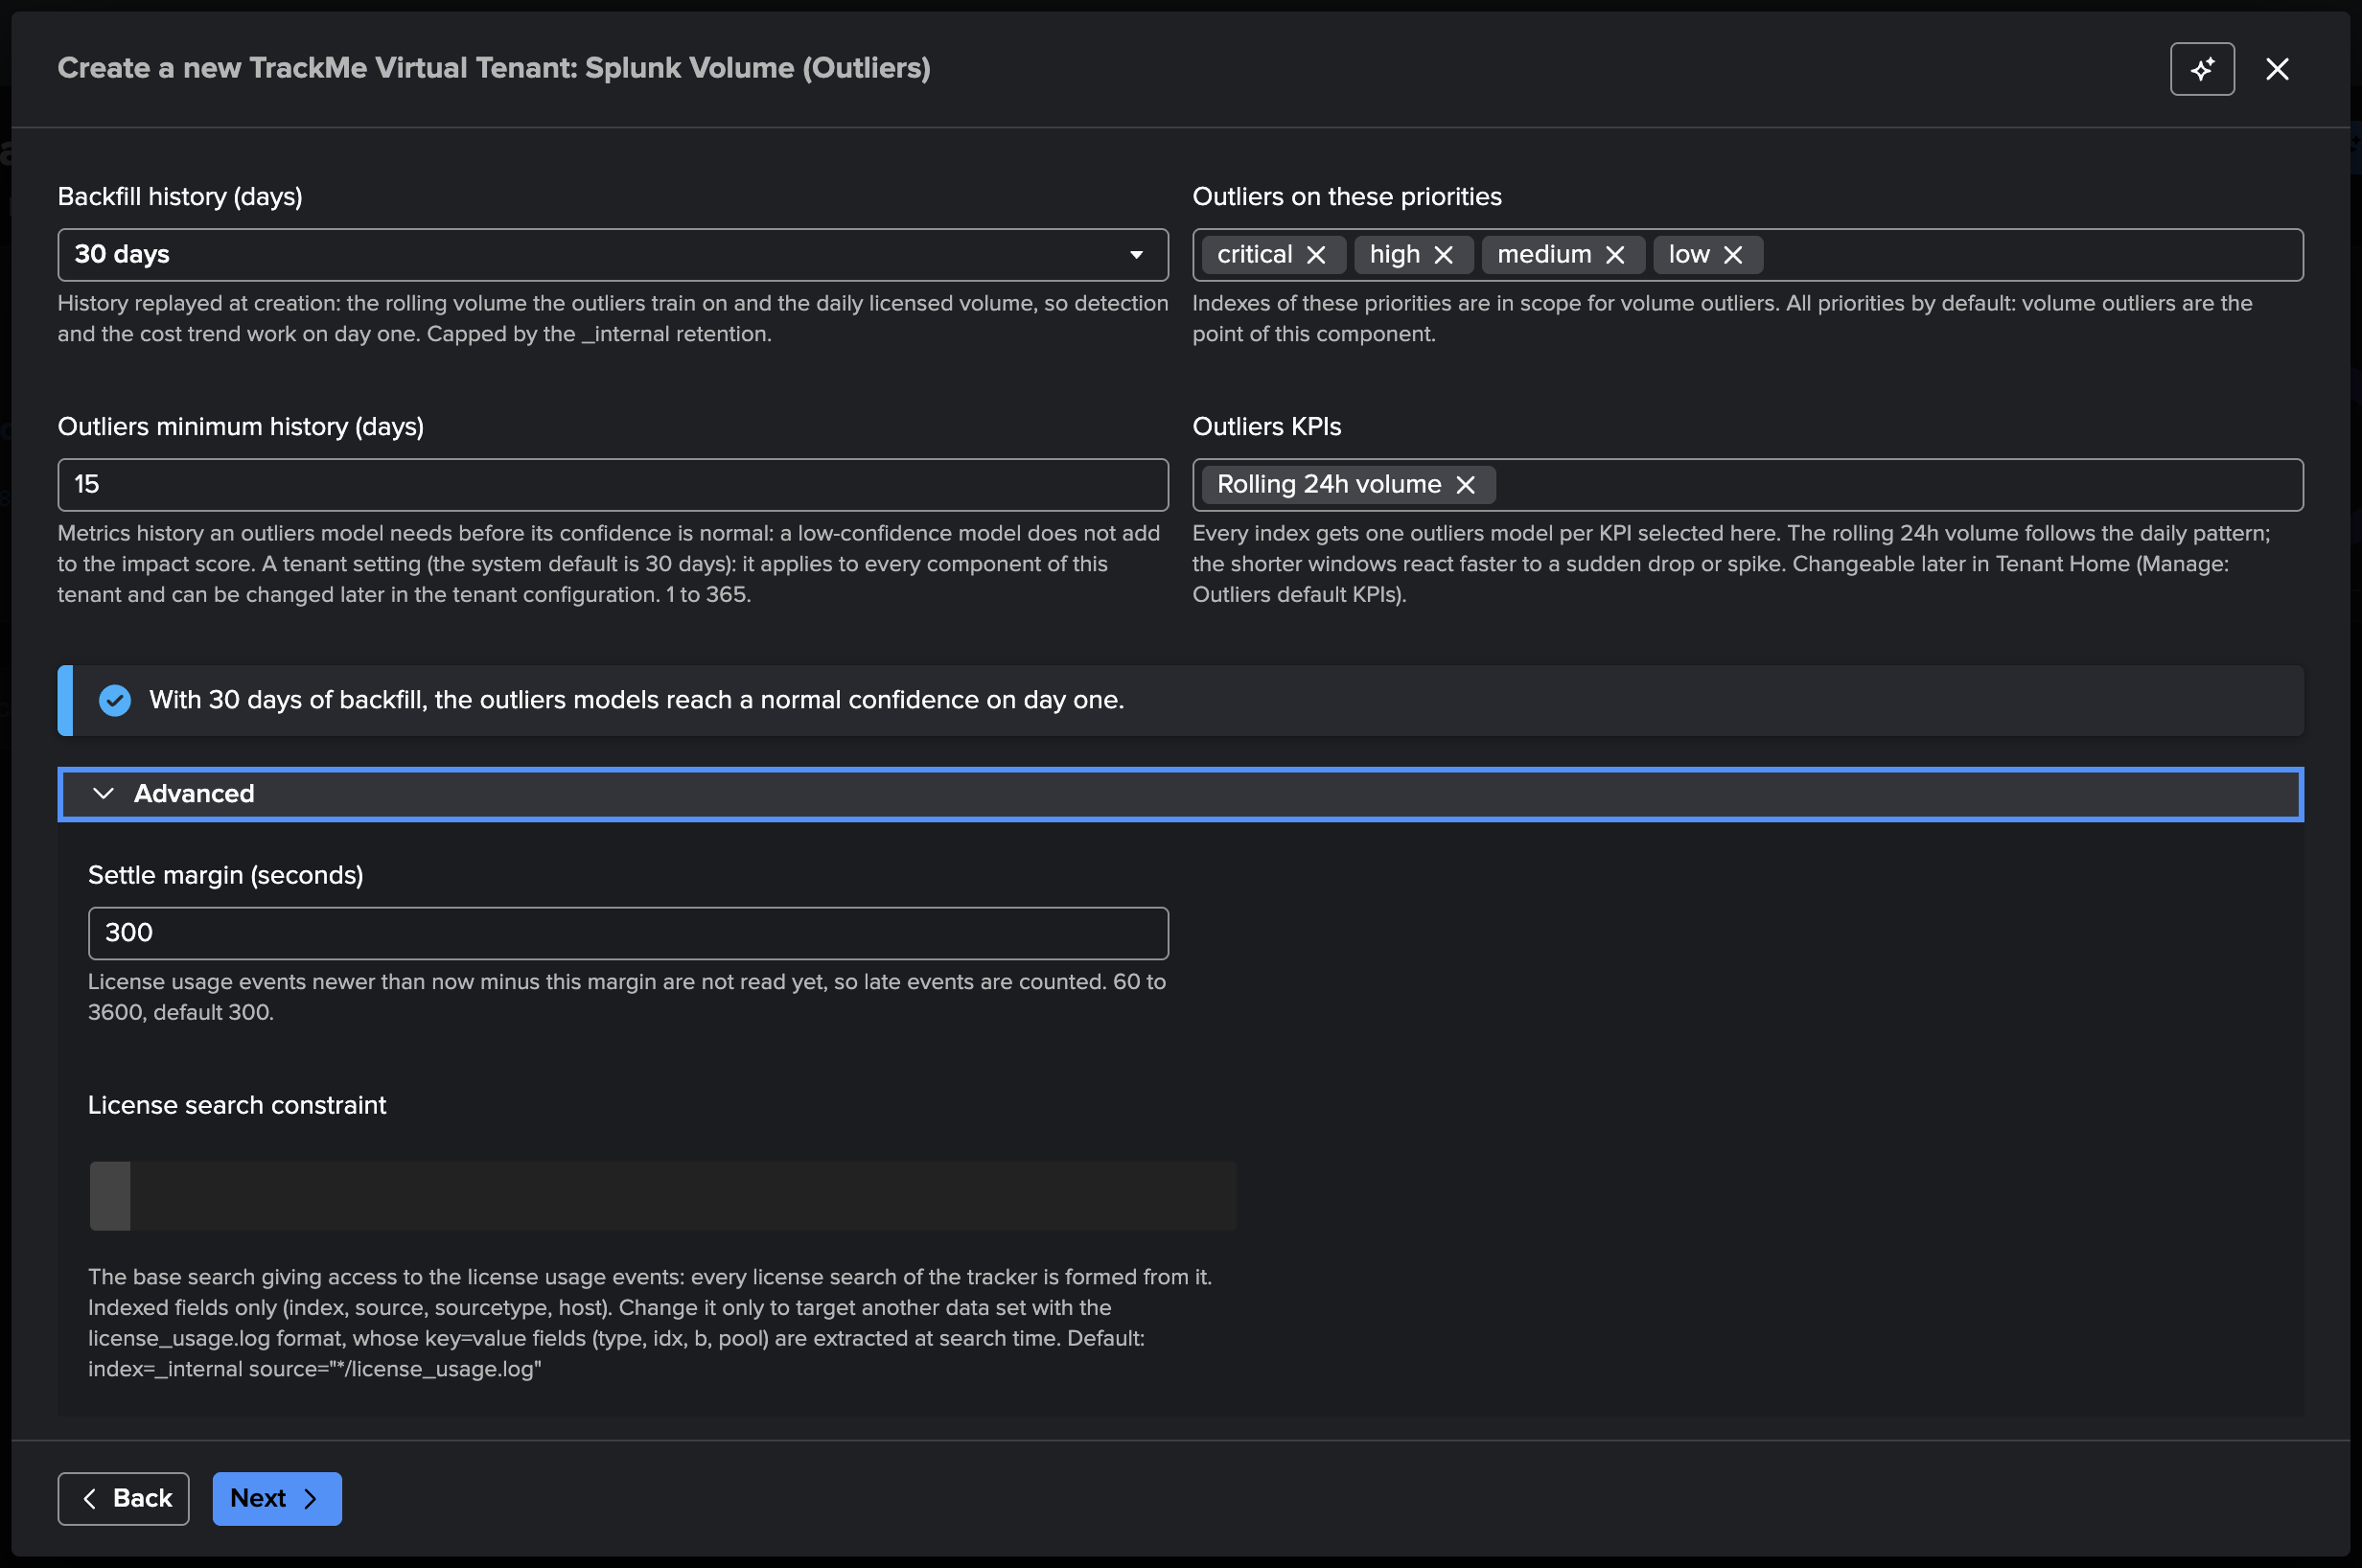
Advanced: the license search constraint. Every license search of the tenant is formed
from one constraint, index=_internal source="*/license_usage.log" by default. It can
be changed here (and later in Configure tenant) to point the tenant at another data set
holding events in the license_usage.log format — a copy forwarded to a dedicated index,
for instance. It stays a plain base search naming an index; the wizard validates it as you
type. Leave it at its default unless you have such a setup — see
The license search constraint (advanced).
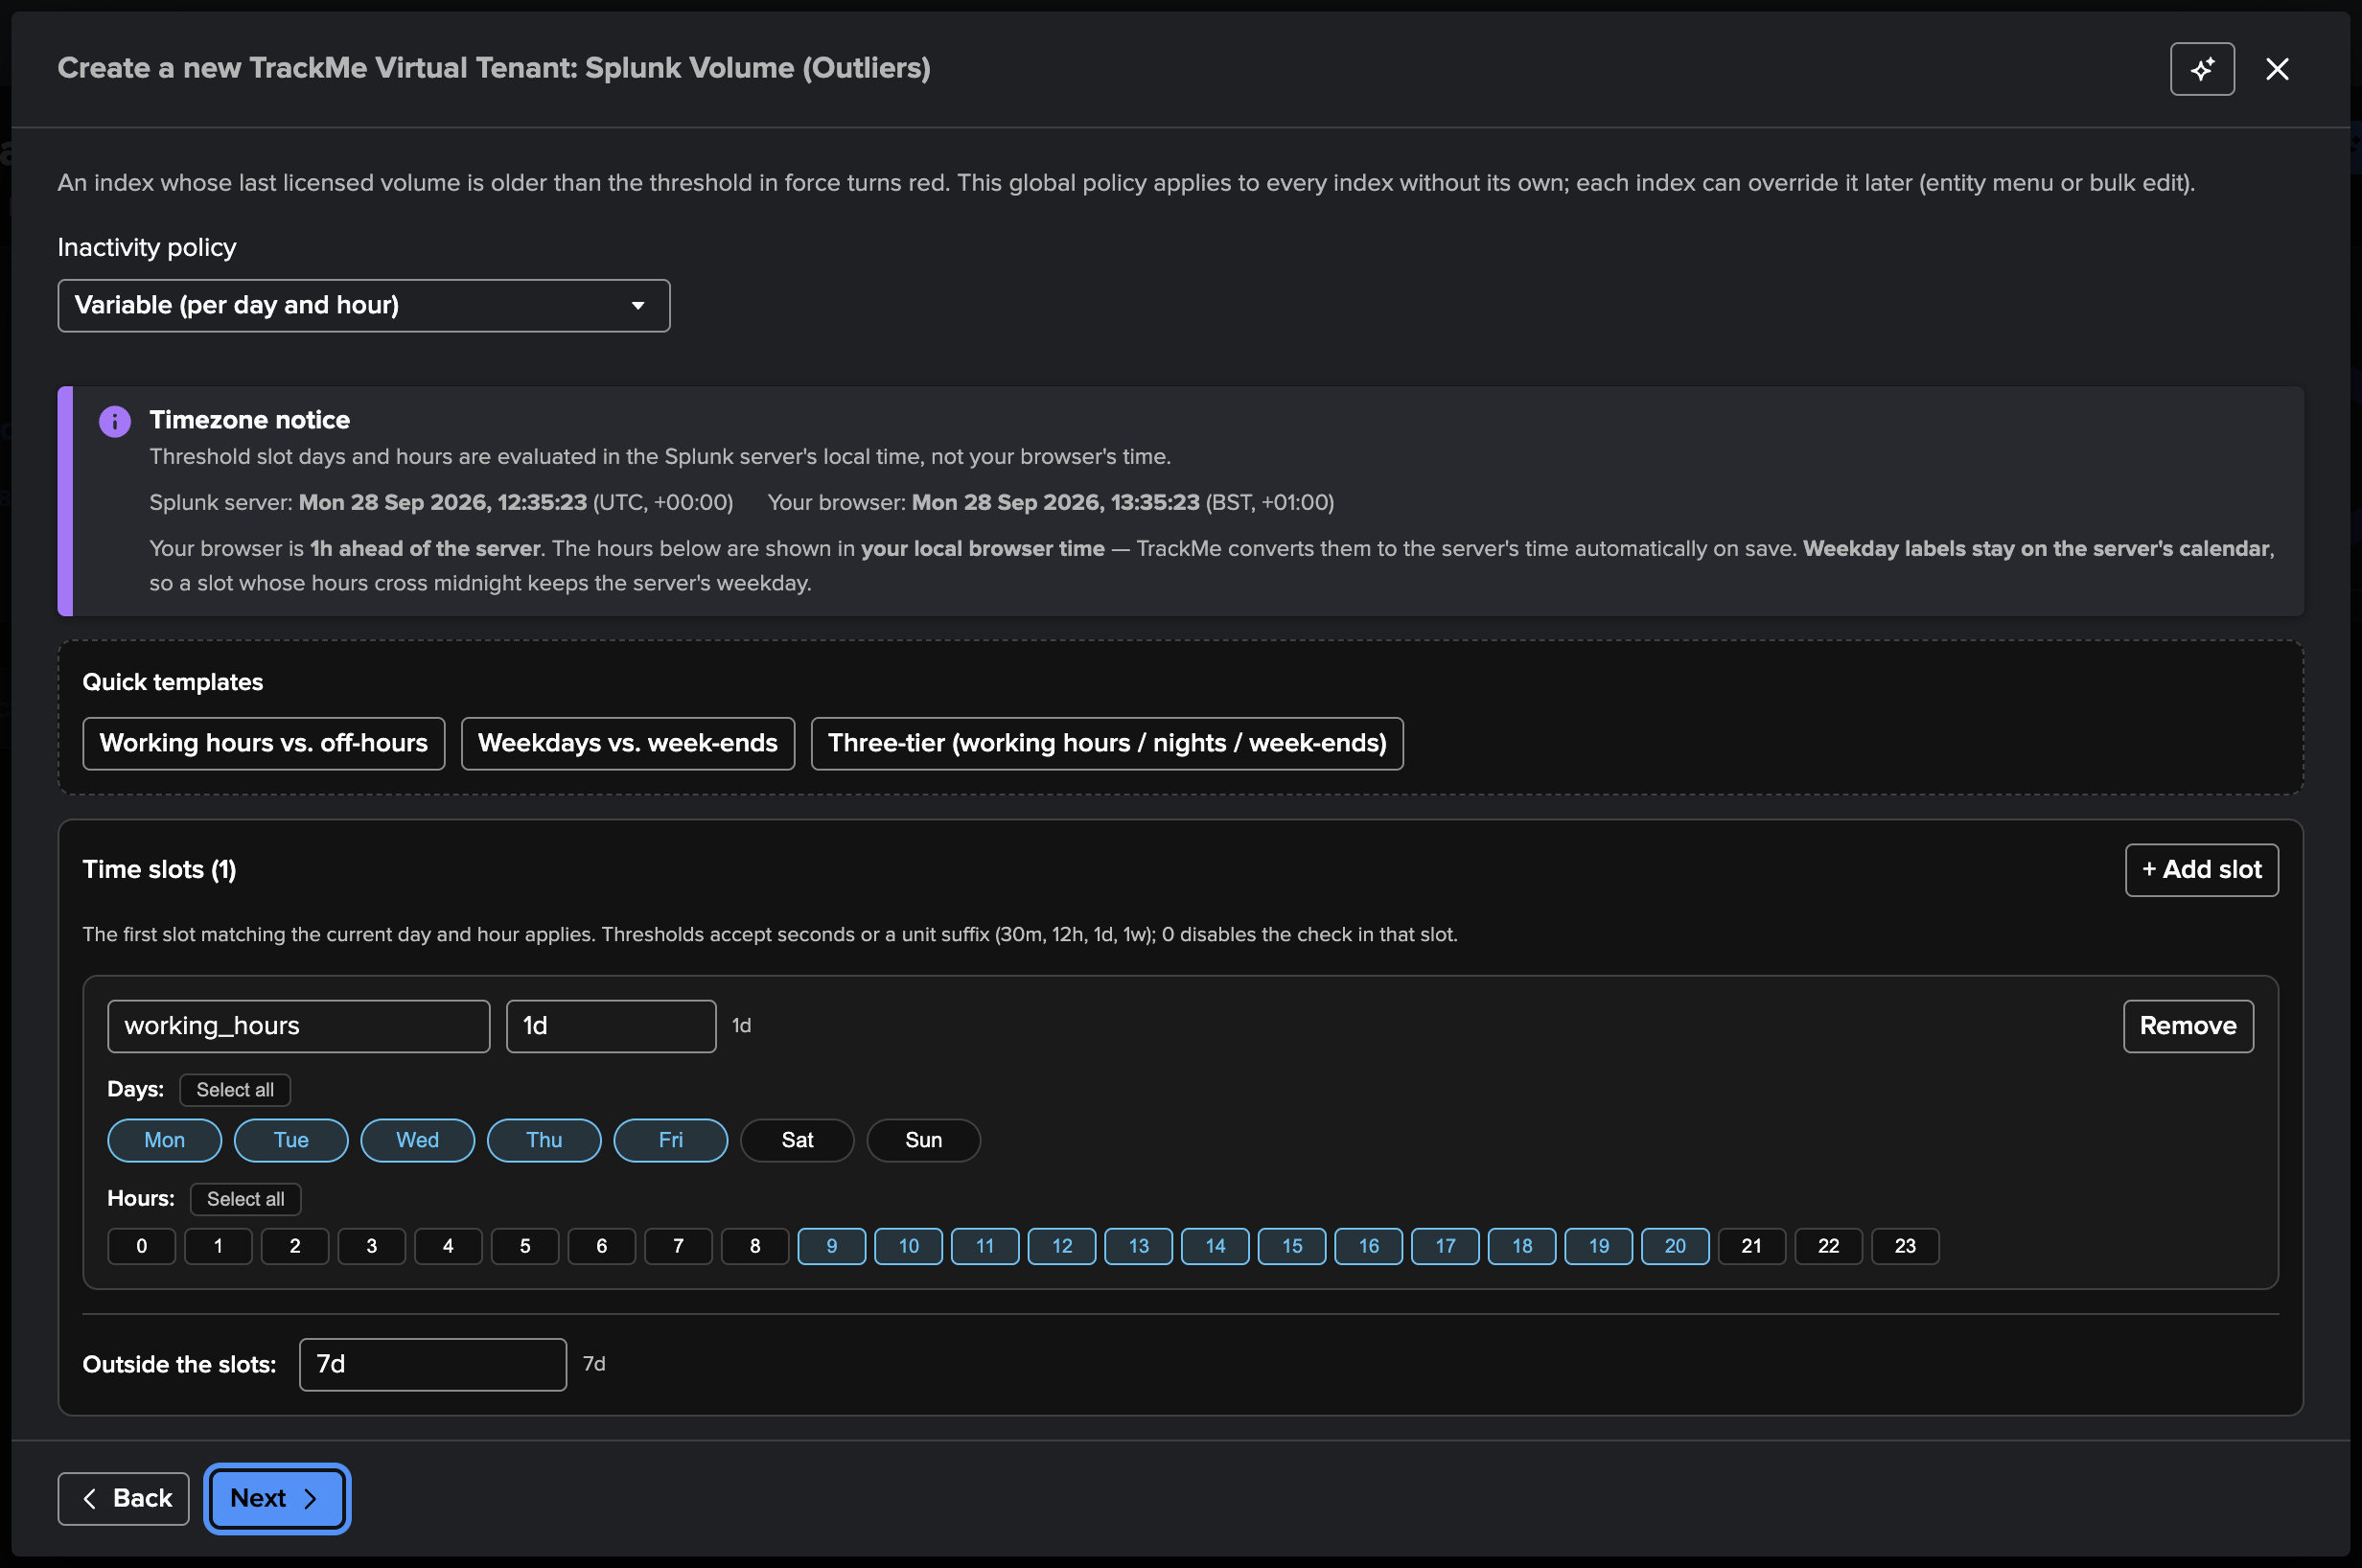
The Inactivity step sets after how long without licensed volume an index turns red. The default policy is variable: 1 day during working hours (Monday to Friday, 08:00–19:59 in the server’s time zone) and 7 days for nights and week-ends — a business-hours feed that stops on a Tuesday morning is red the next day, a Friday-evening stop waits for Monday. Quick templates give a static threshold or other common shapes; each index can override it later:
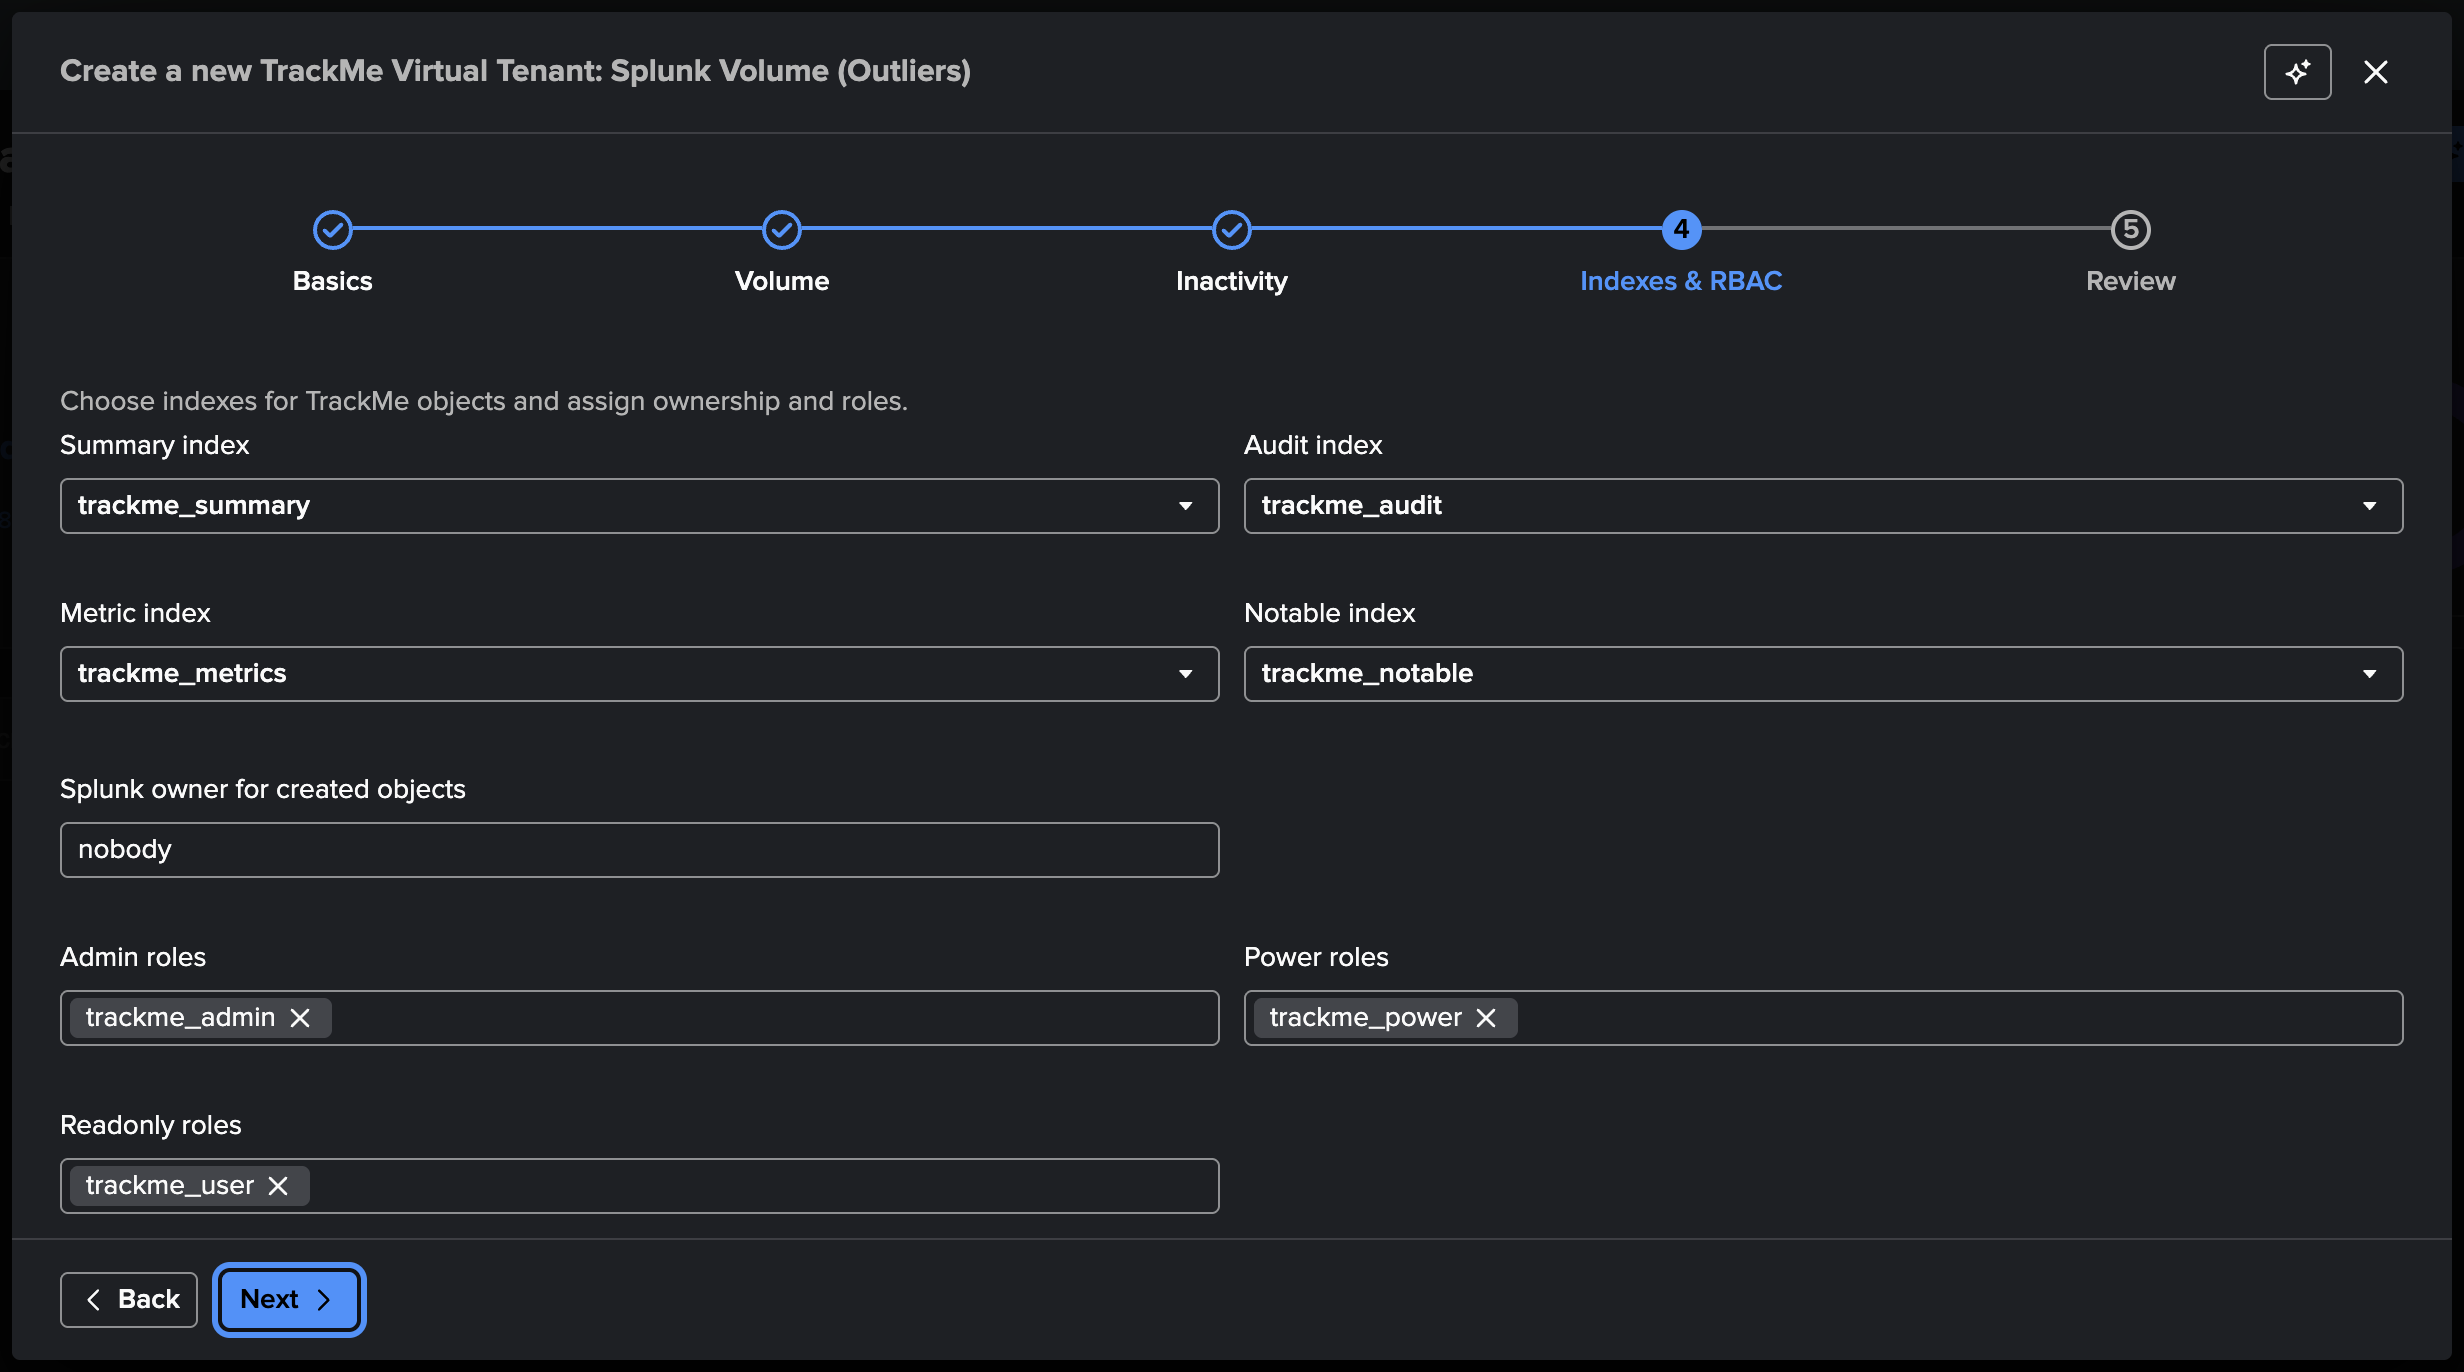
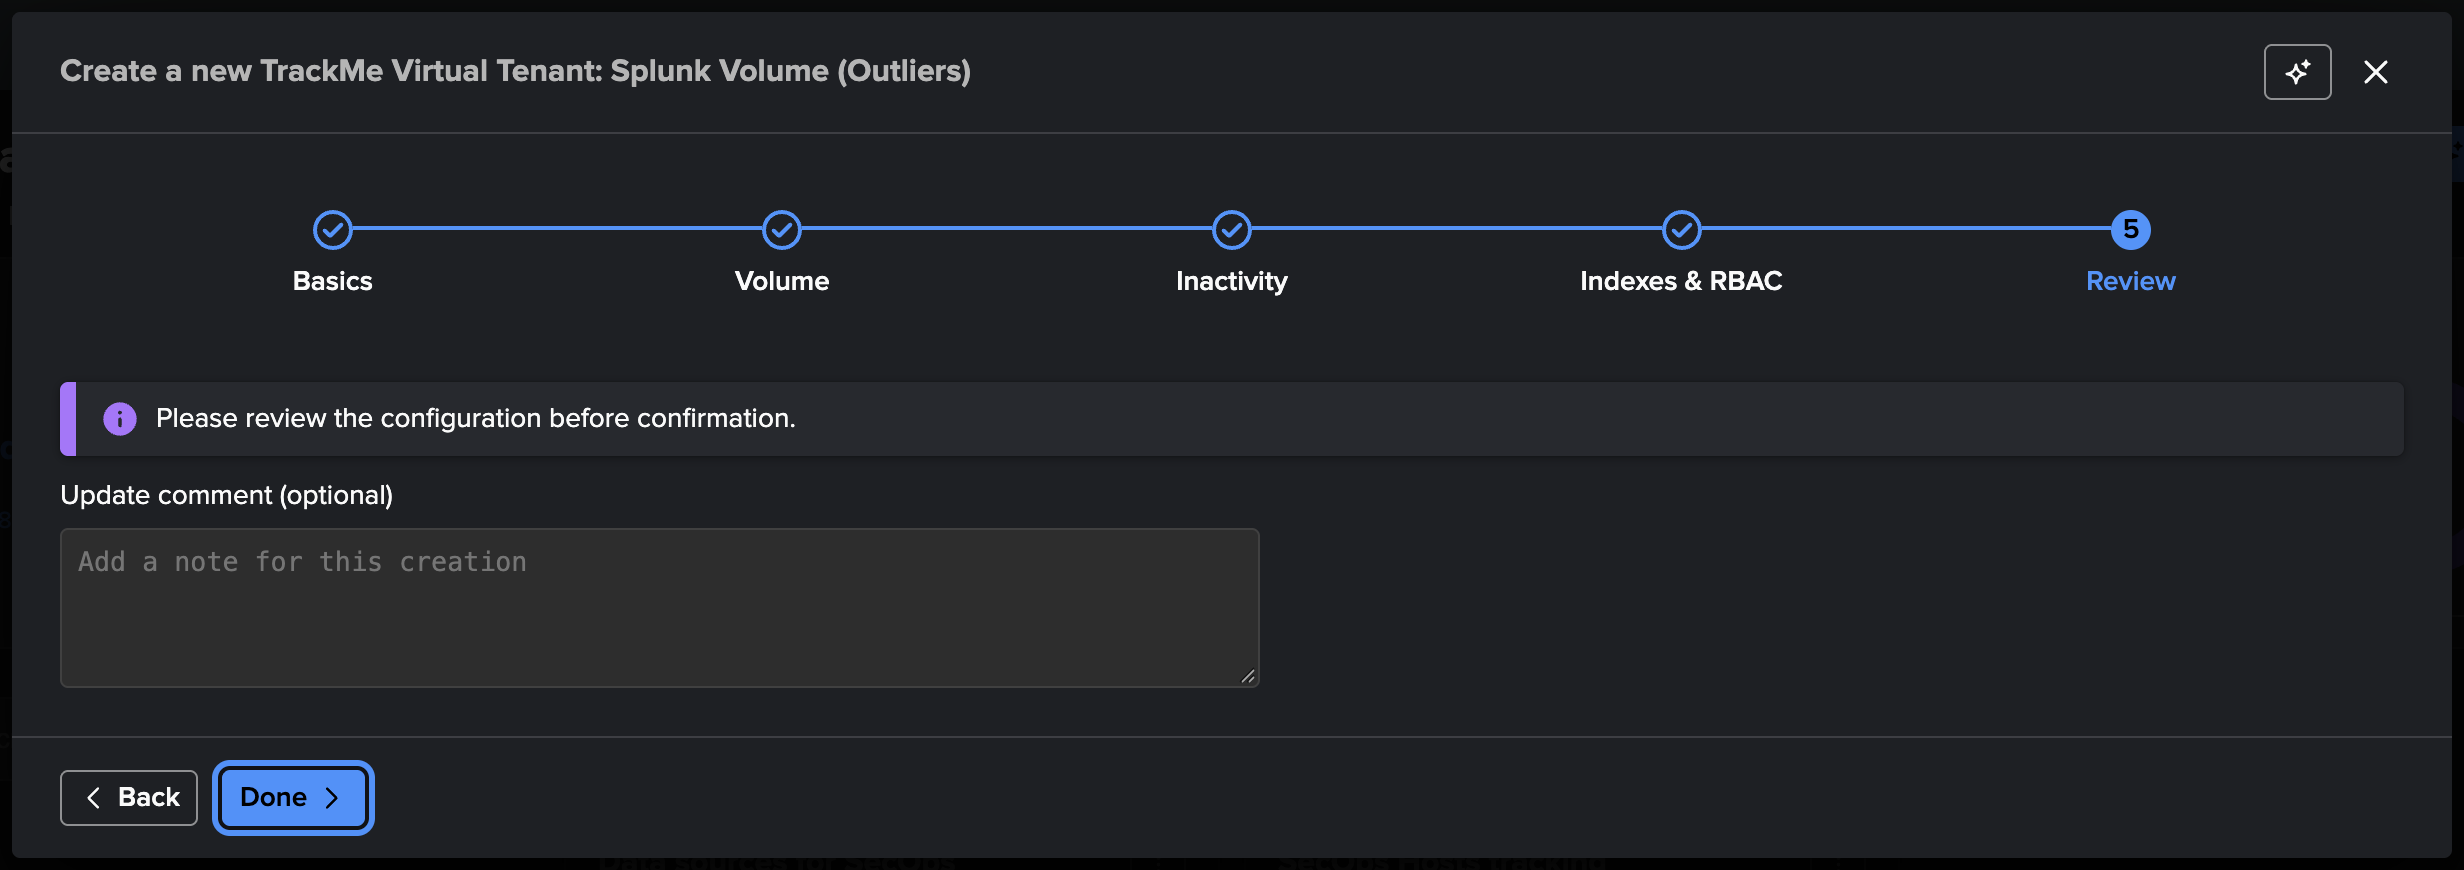
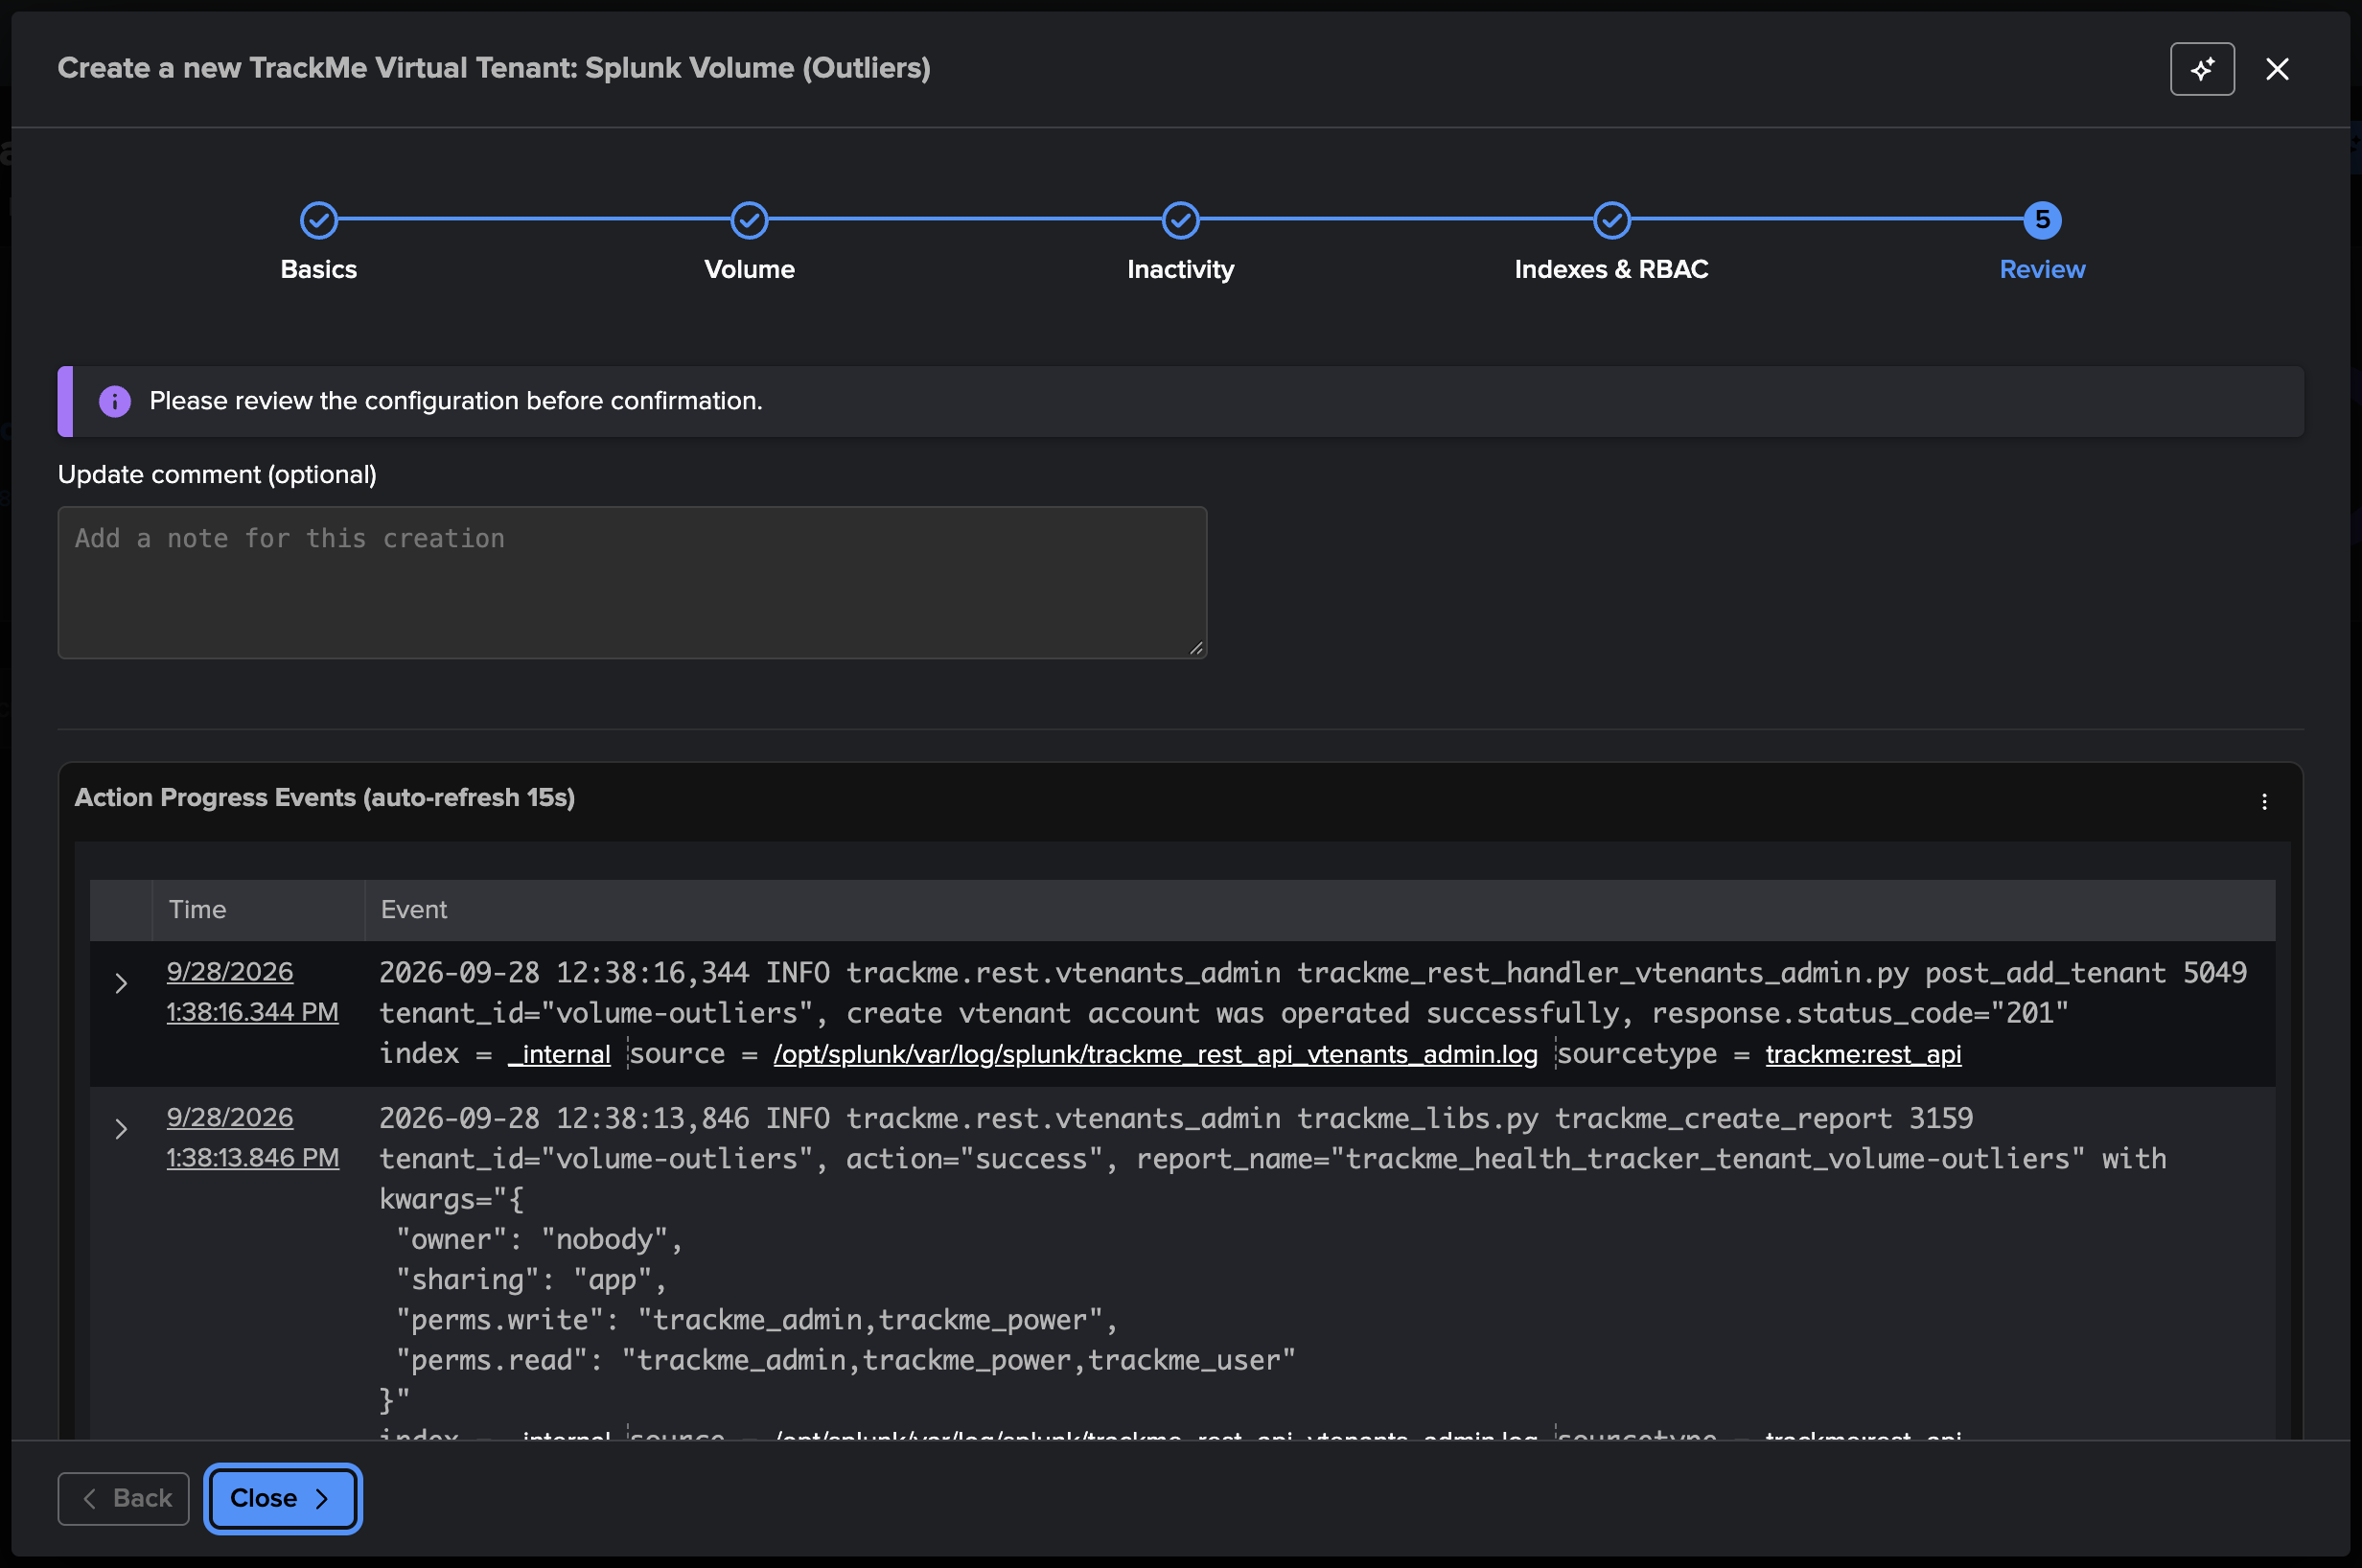
Indexes & RBAC and Review are the steps every tenant ends with:
Step 2 — Day one: the first collection and the backfill
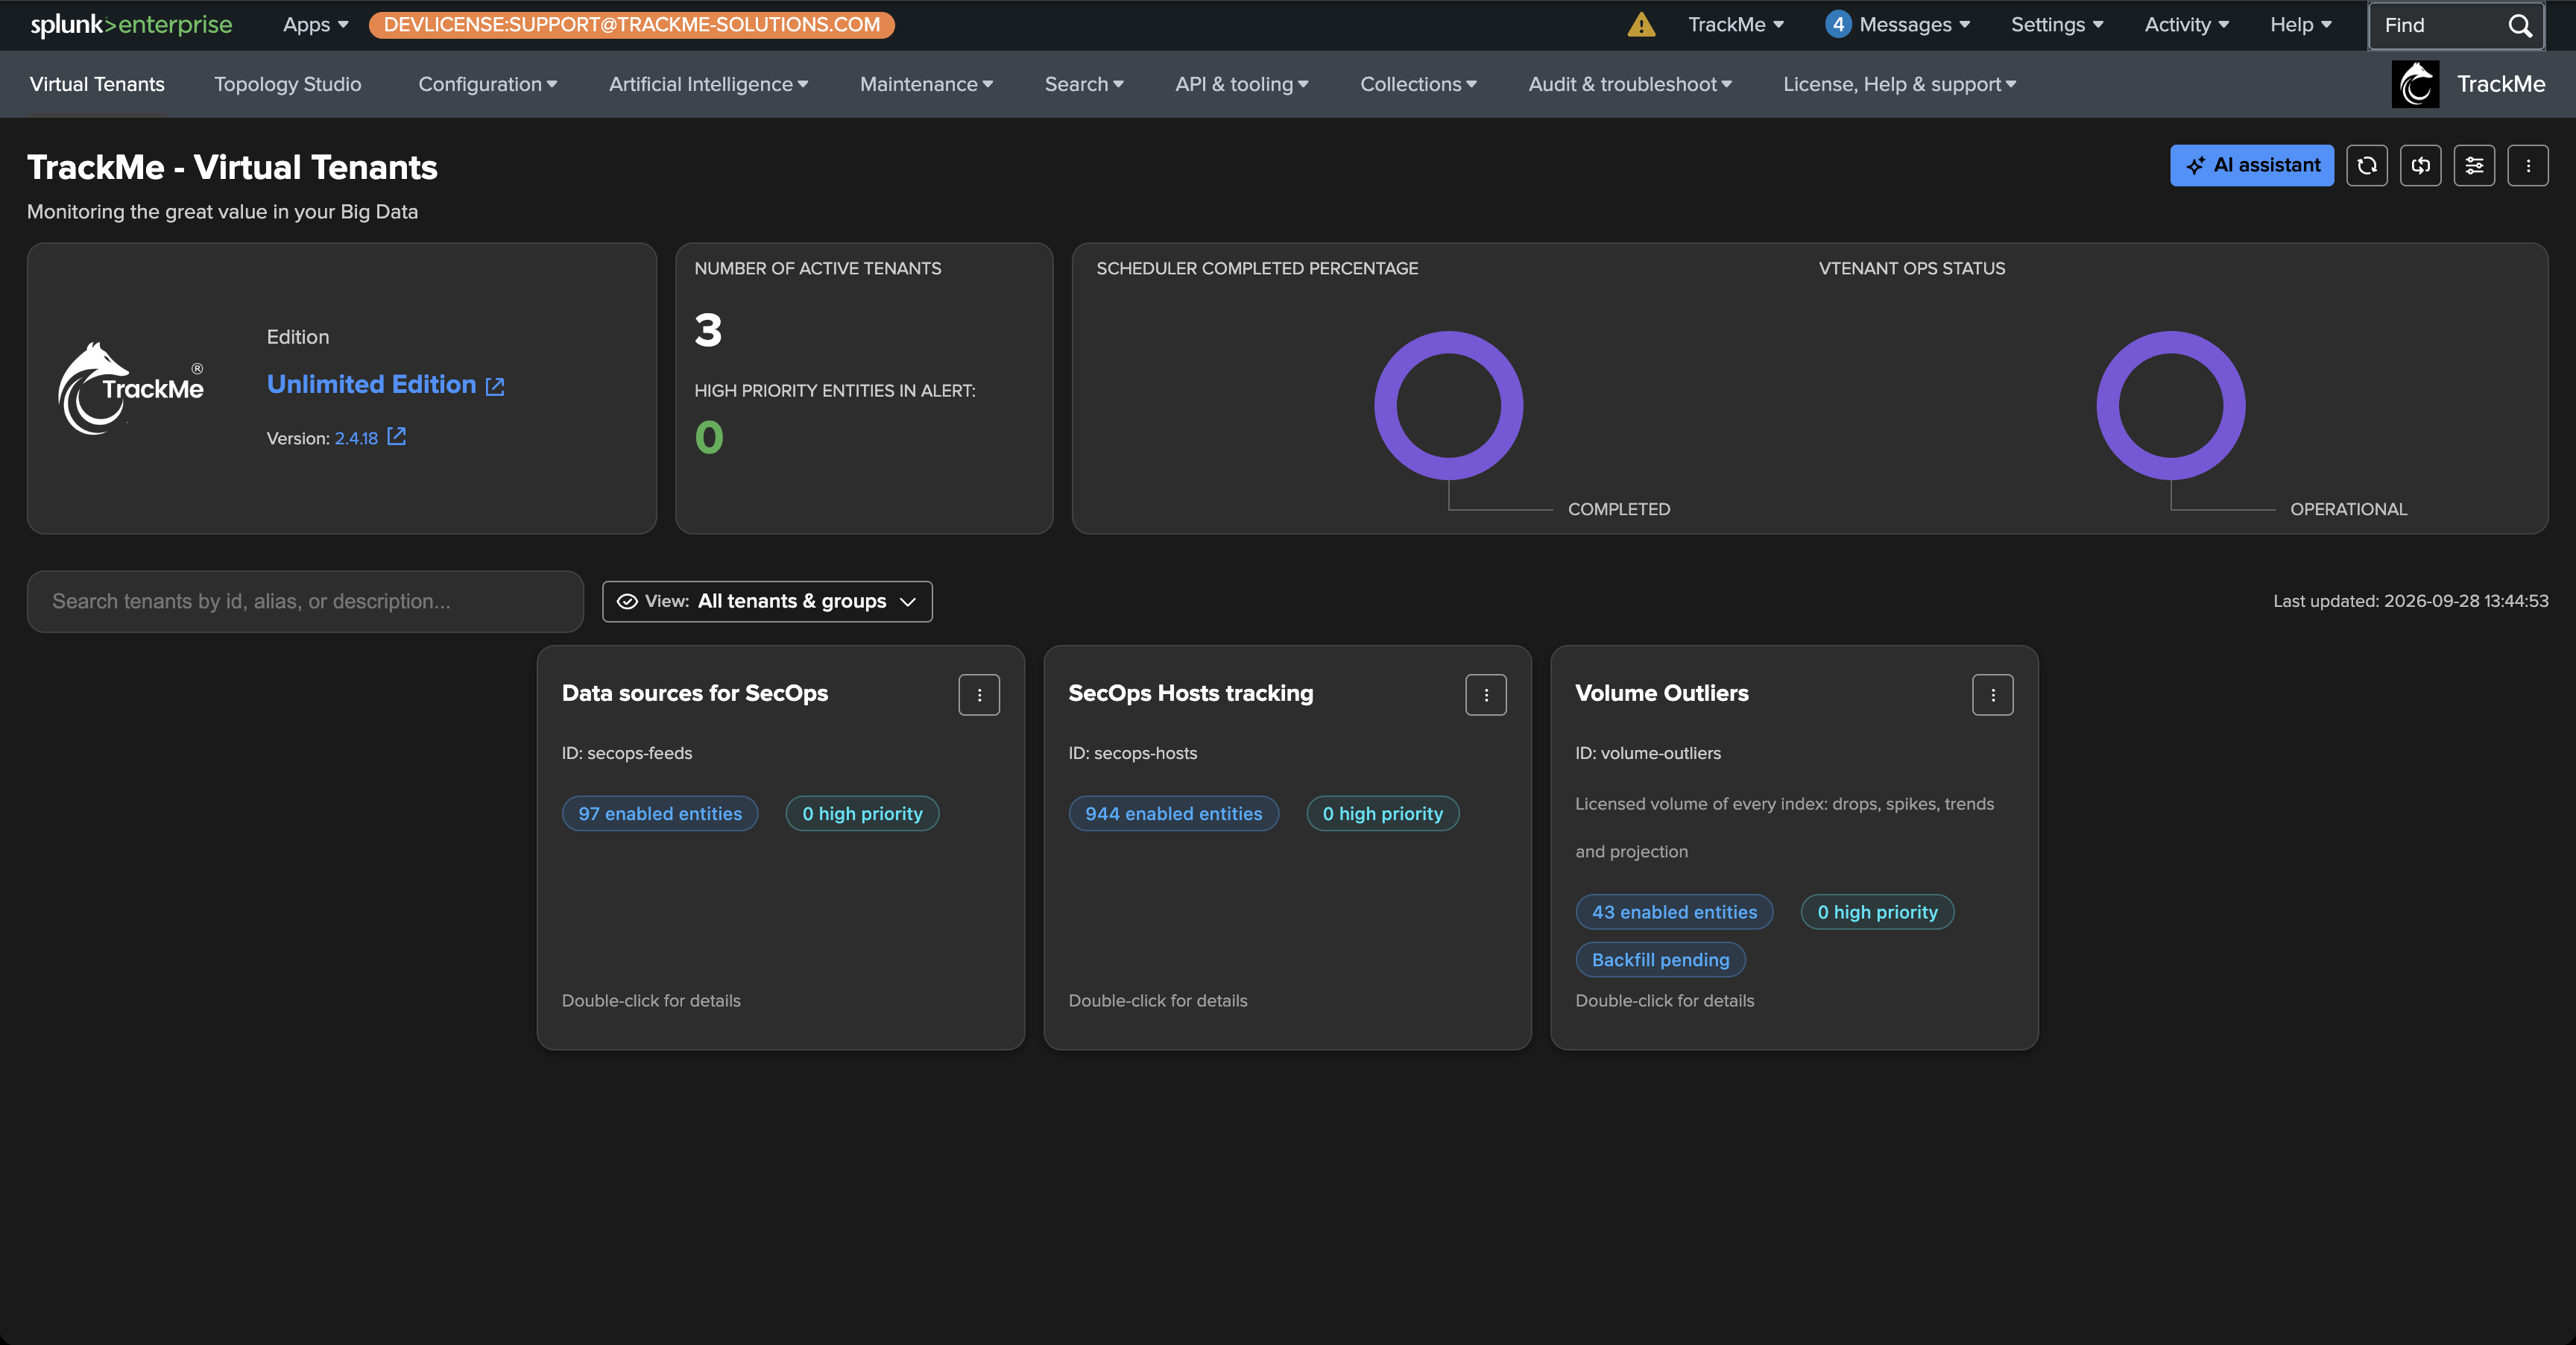
The creation runs the first collection at once: the tracker seeds the last 24 hours of the license usage log, one entity per index appears, and the rolling volumes are already there. The backfill job plans itself at its first hourly run — until then the tenant card reads Backfill pending, and so does the vignette in the Tenant Home header:
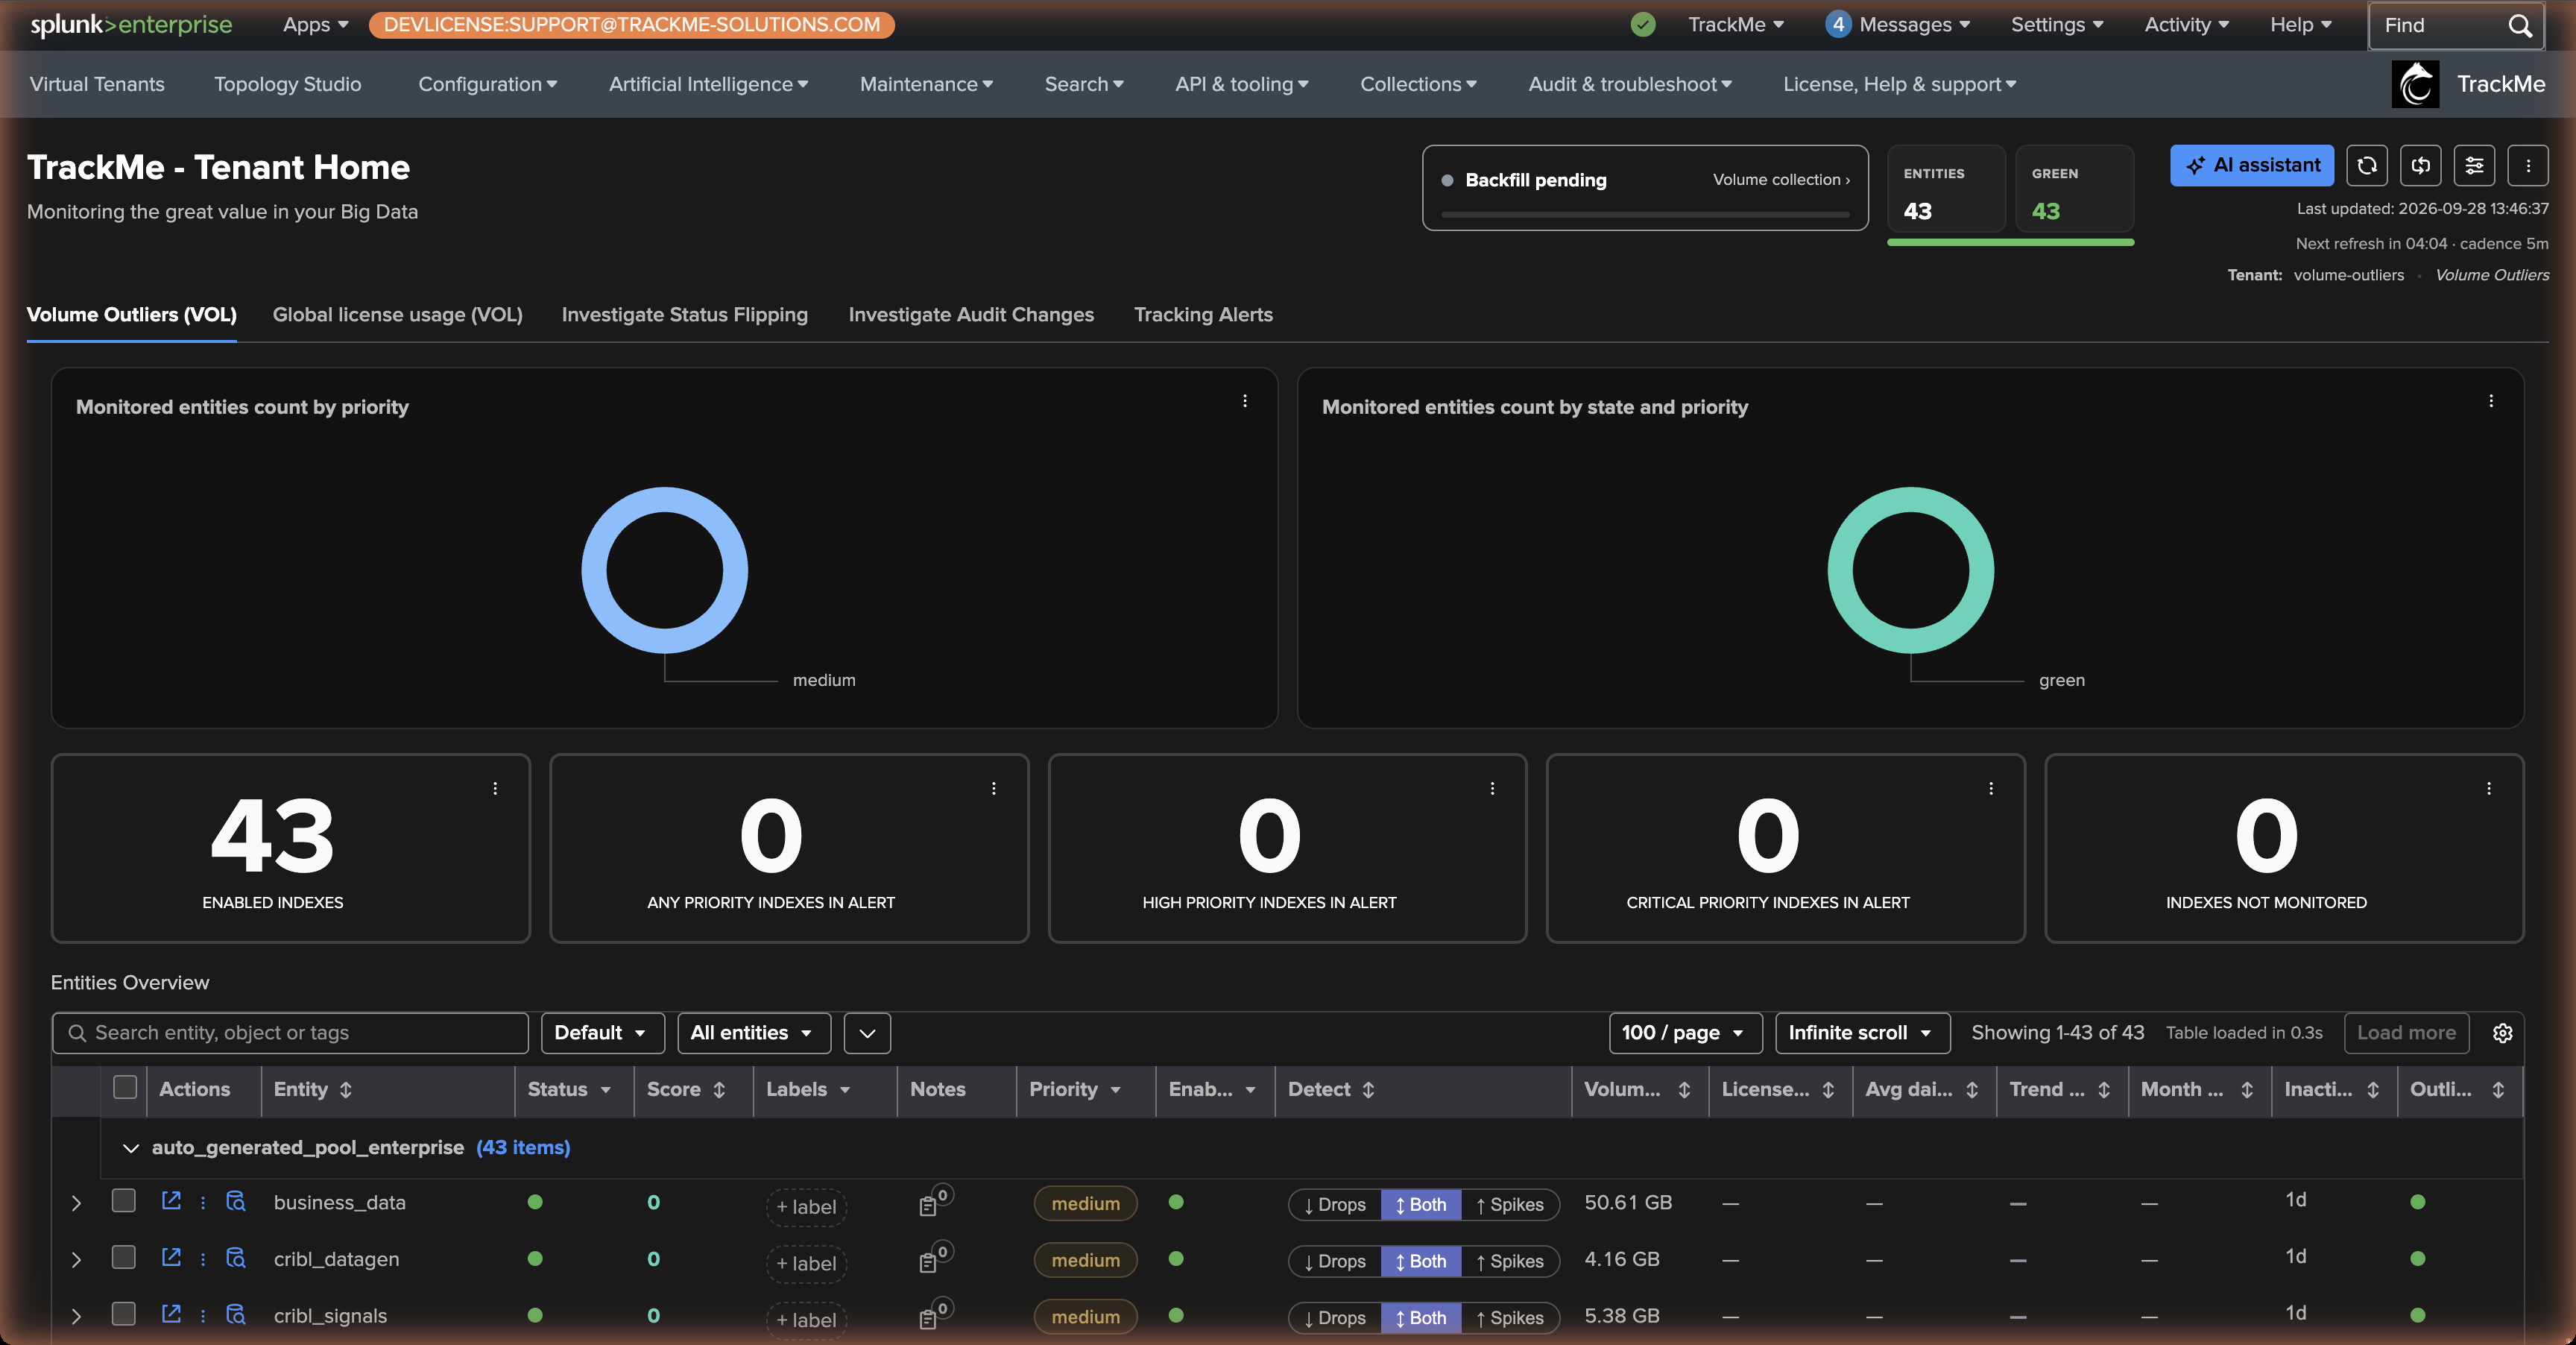
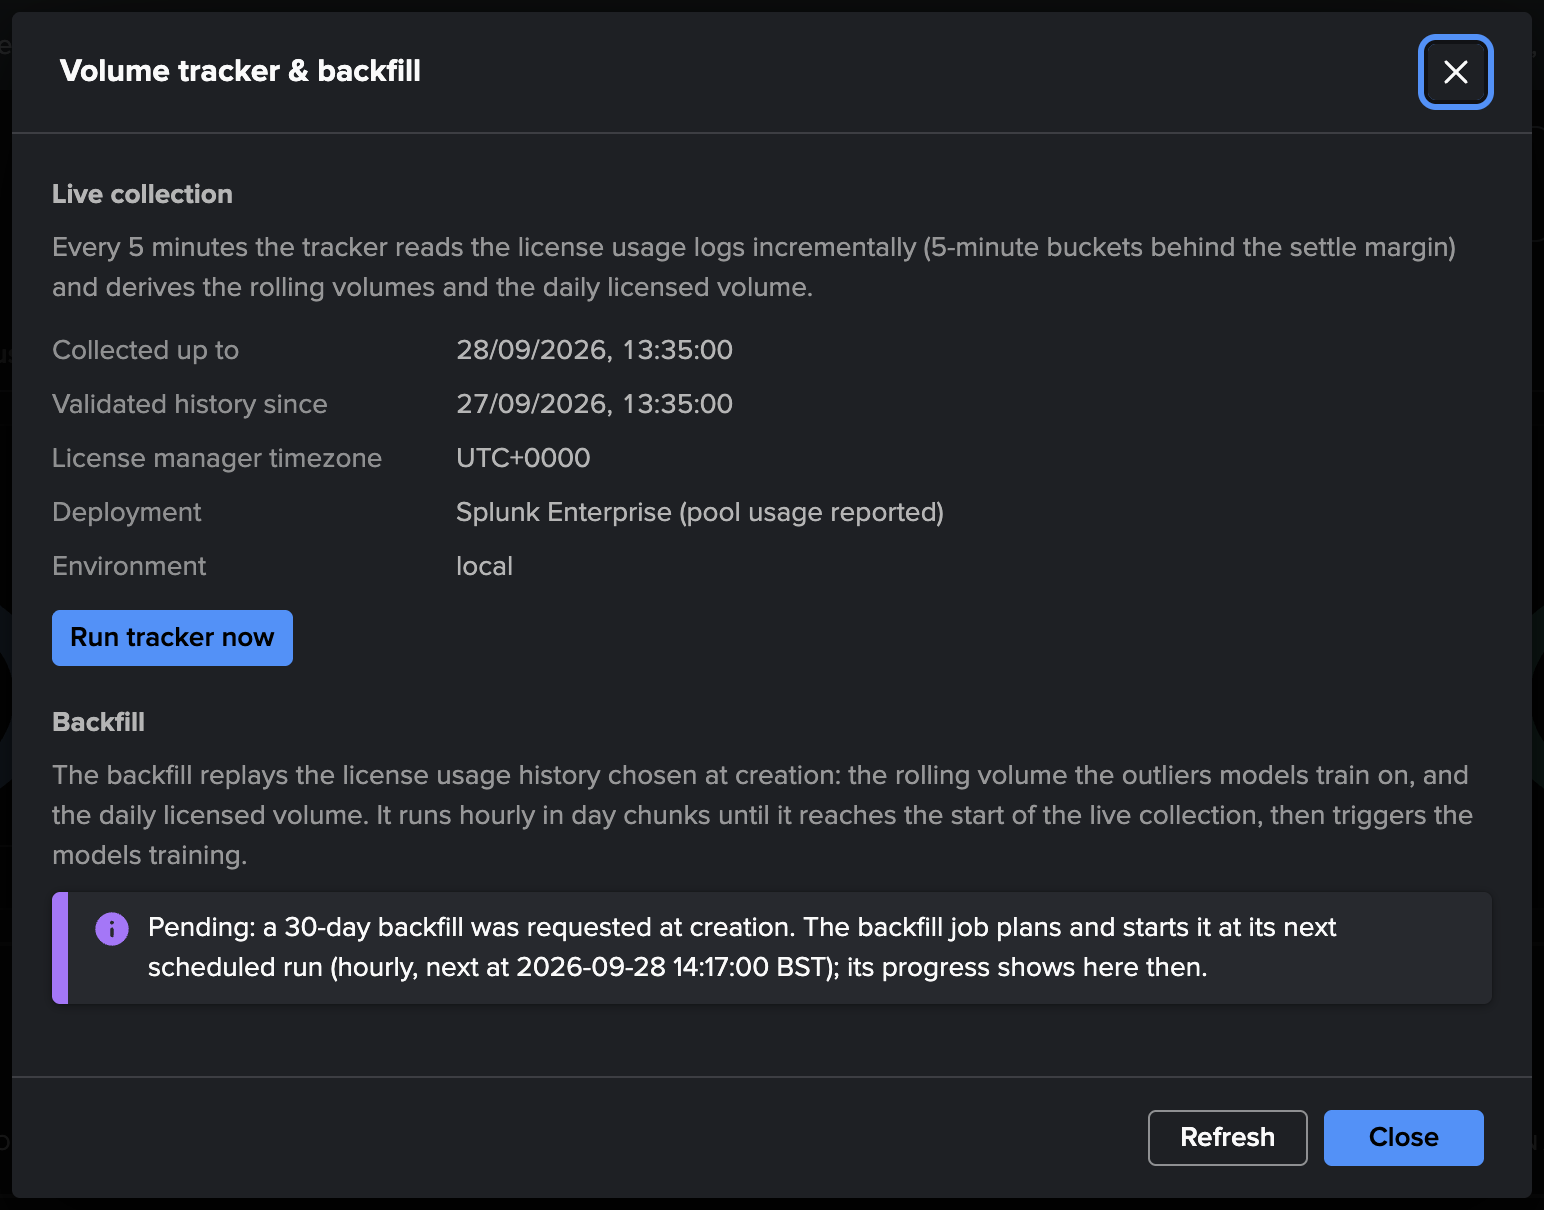
Clicking the vignette (or Manage: volume collection in the Tenant Home menu) opens the collection screen: the live cursor, the validated history, the license manager’s UTC offset, the deployment type, and the backfill with its progress and controls. At its first hourly run the backfill job plans the 30 days and replays them day by day; on a large deployment this spans several hourly slots and the card shows the percentage — on our environment the whole month replayed in under two minutes, 28 day-chunks and about 350,000 metric points, and the screen already reports it complete:
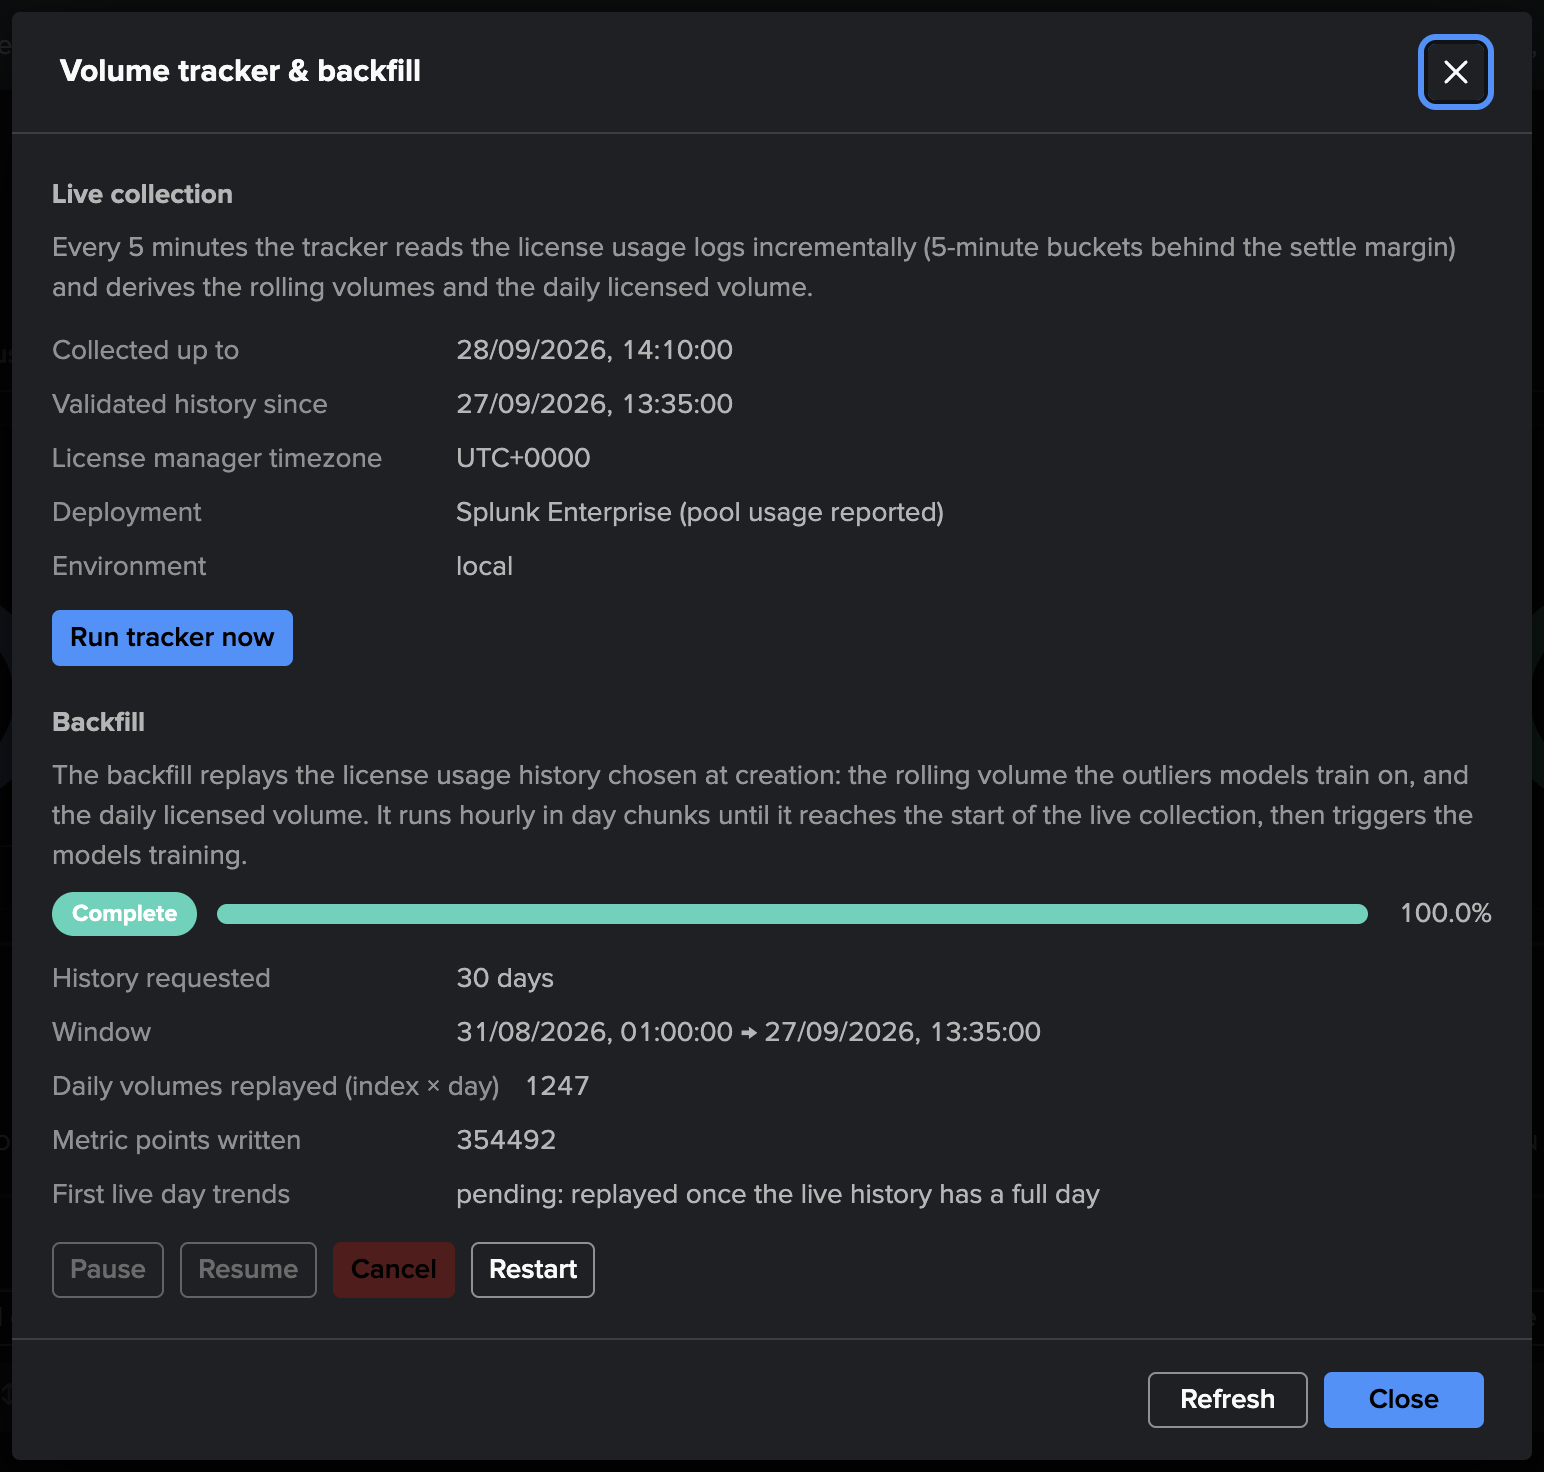
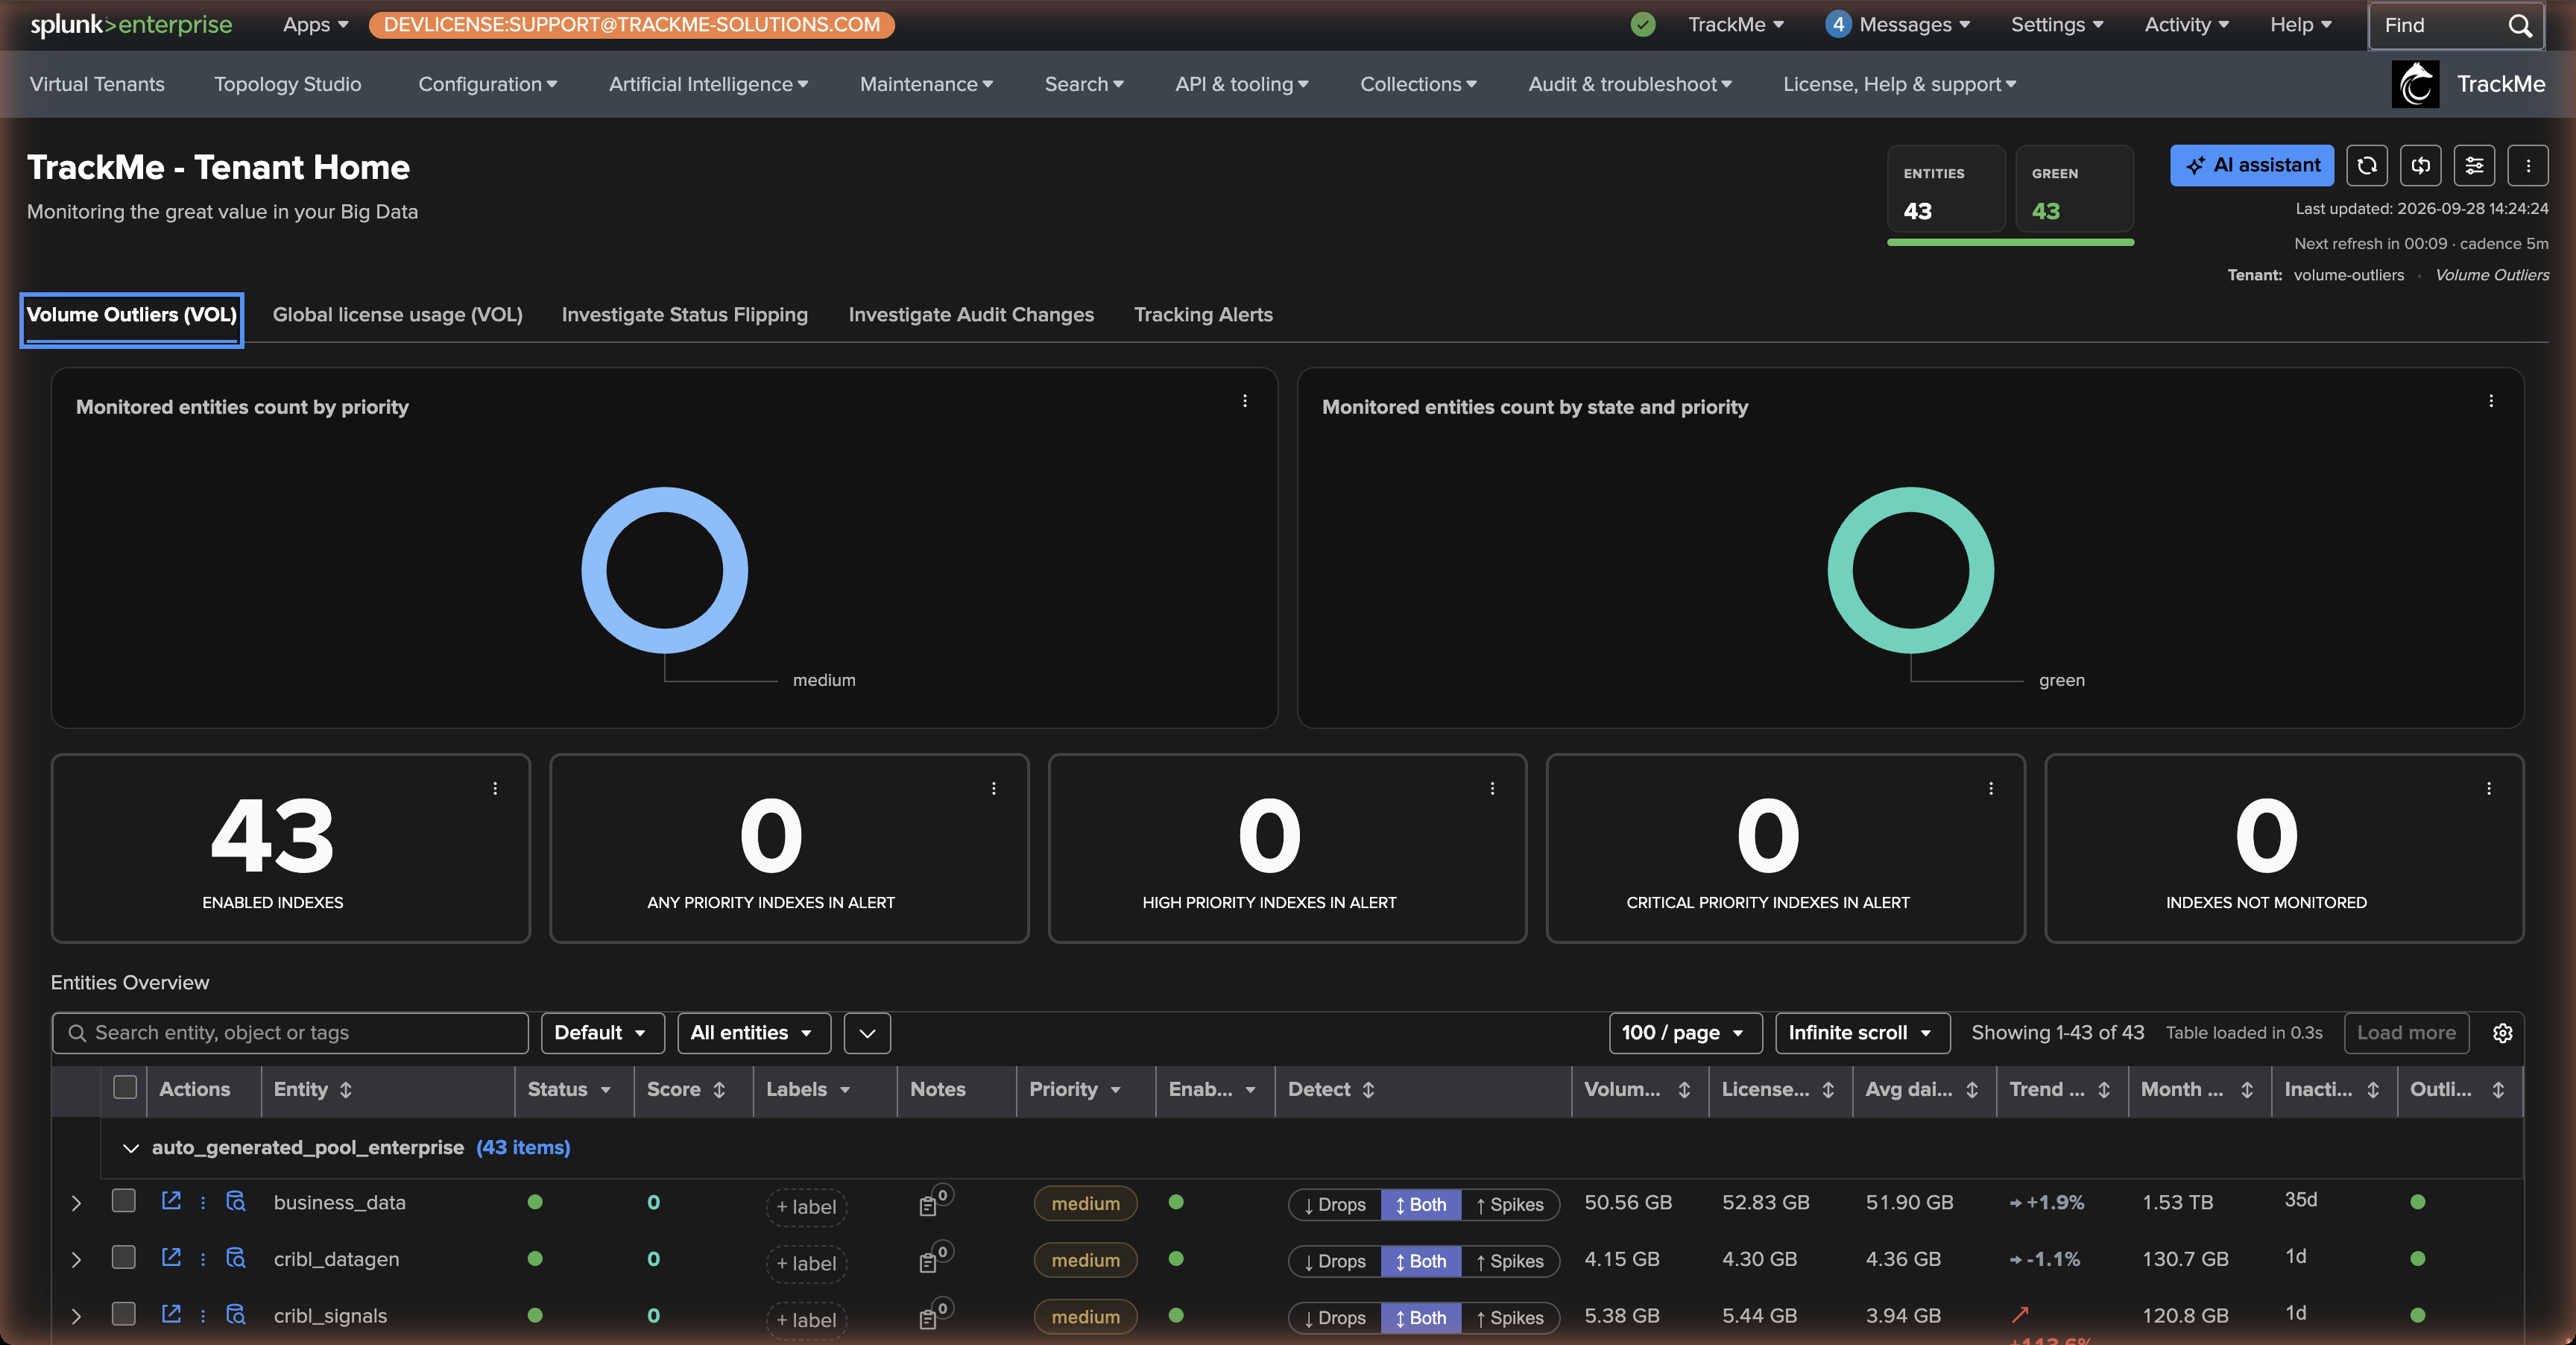
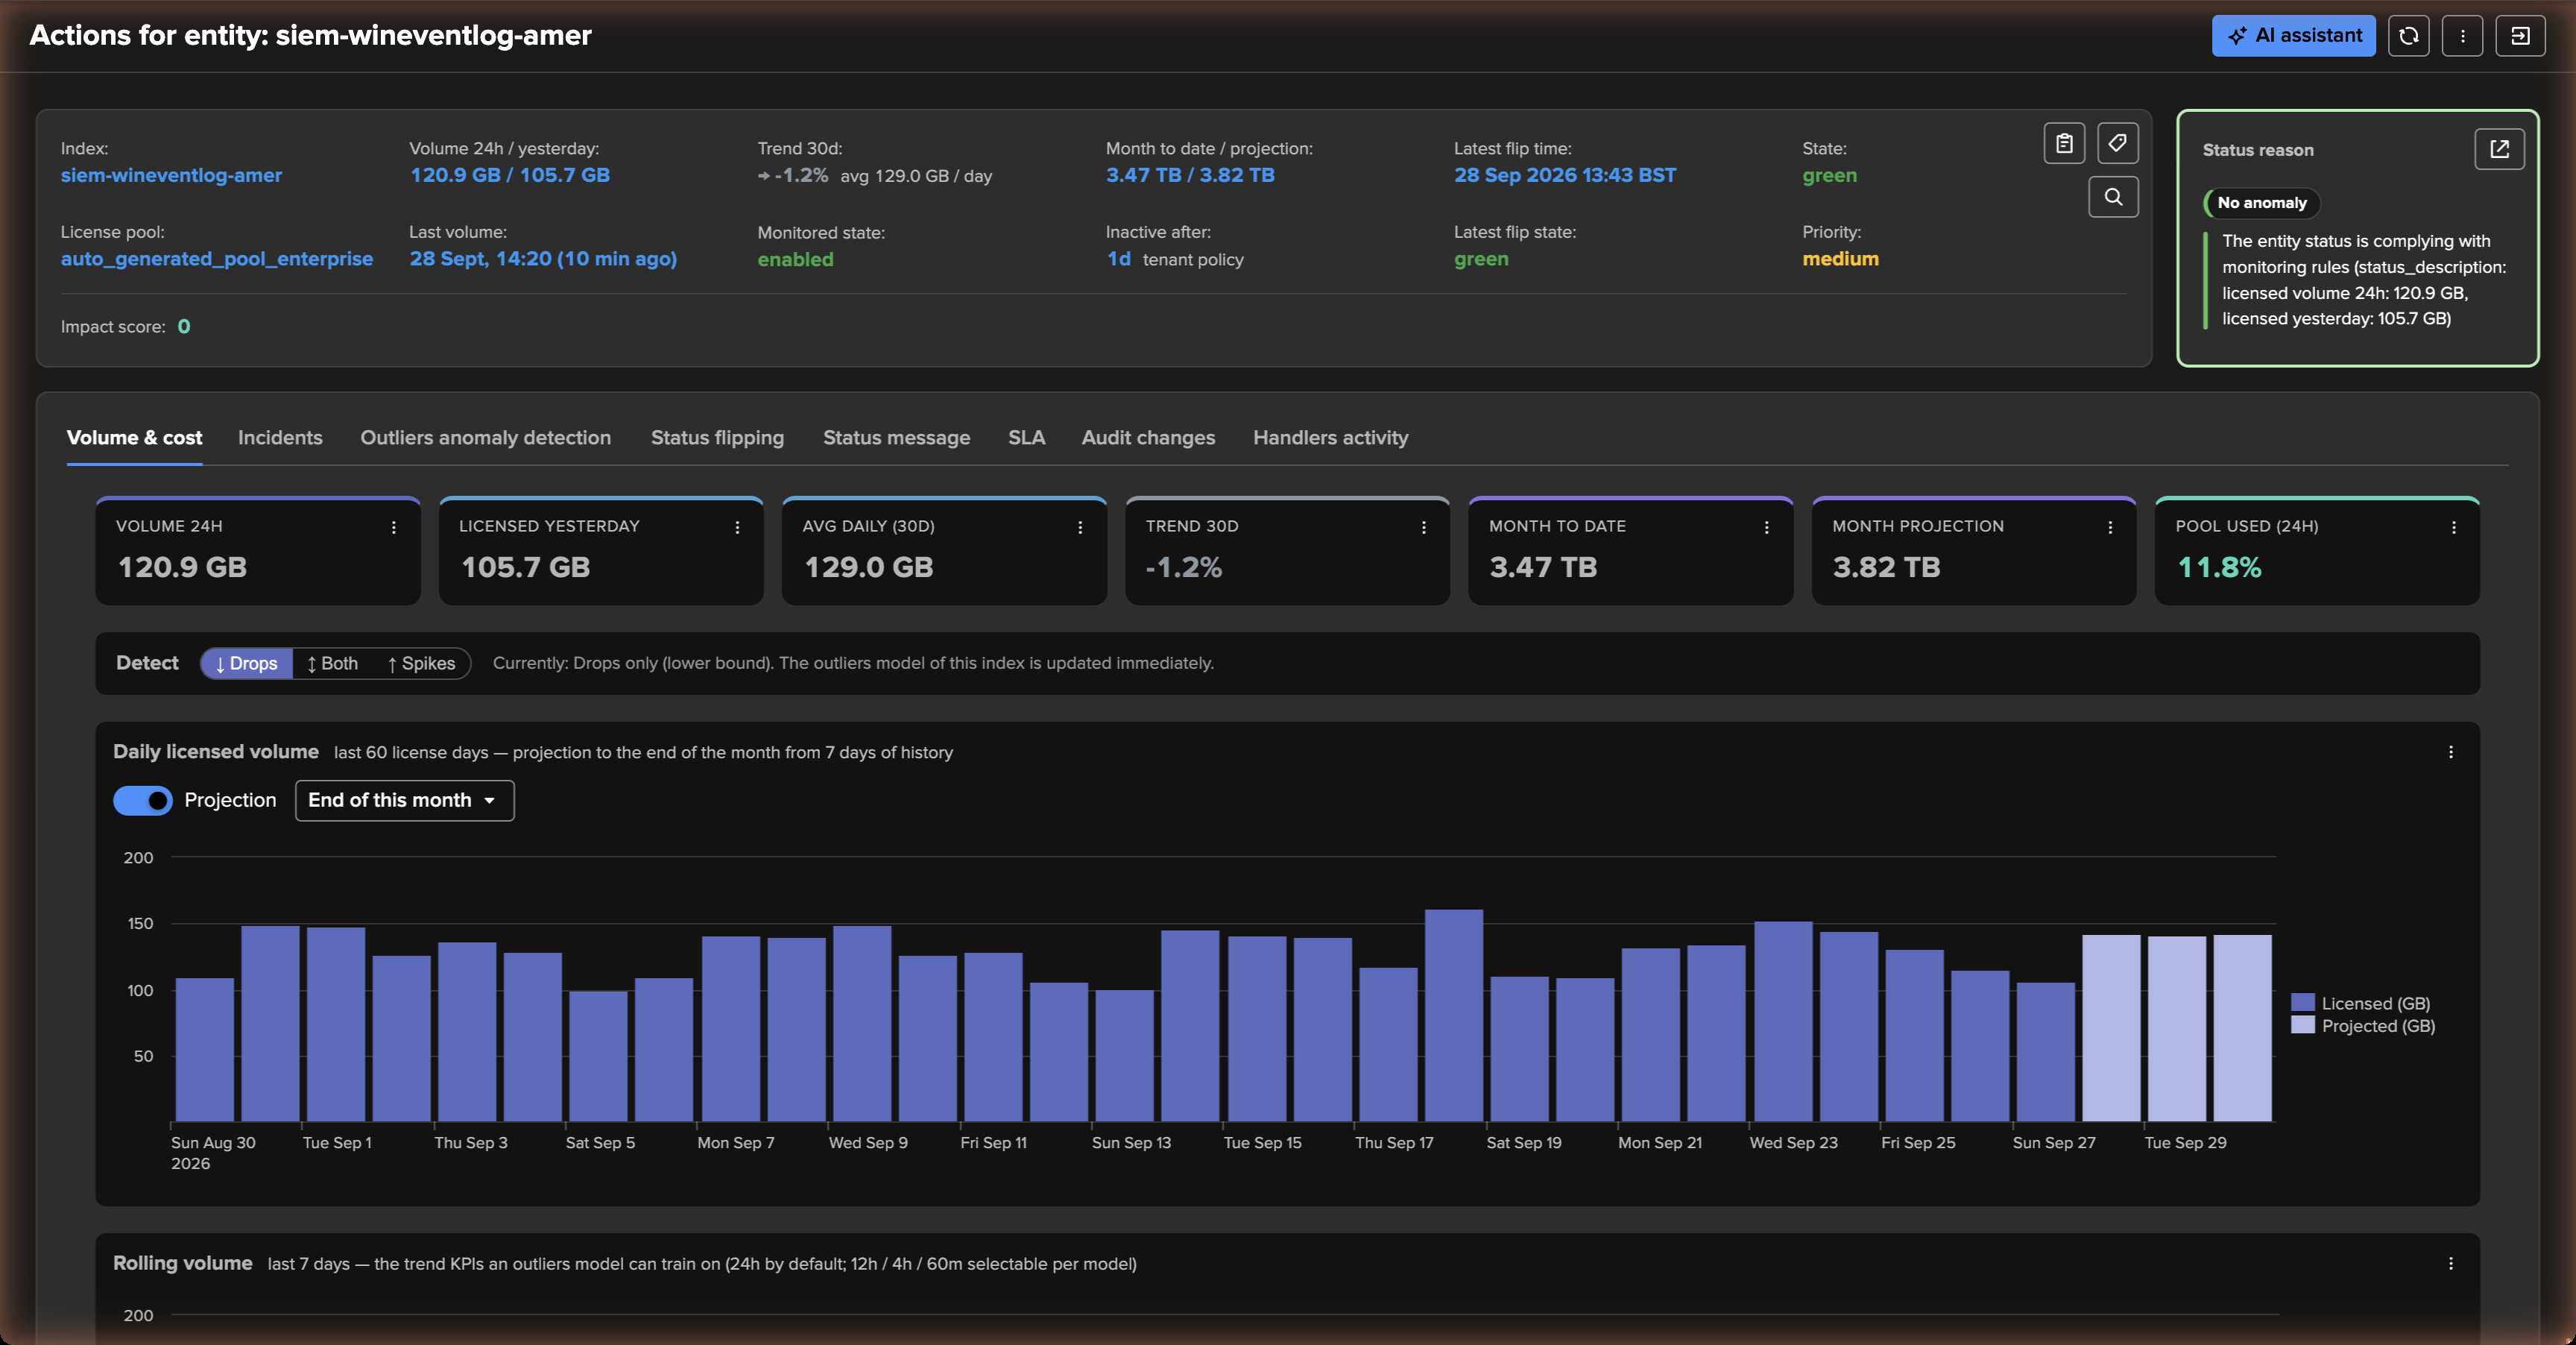
When the backfill completes, its days are merged into every index and every VOL model is trained. The Volume & cost tab of any index now shows a full month of daily licensed volume, the 30-day trend and the month projection, and the outliers chart of the index’s model with its learned bounds:
Hint
Nothing was written twice. The live collection and the backfill never overlap: the backfill ends where the live collection started, the first backfilled day is aligned on a license-day start, and every complete license day emits exactly one daily point. The rolling KPIs are emitted only once their whole window lies inside validated history, so no ramp-up ever reaches the series the models train on.
Step 3 — Reading an index
The entity modal of an index opens on Volume & cost:
Key figures — the rolling 24-hour volume, licensed yesterday, the last volume seen, the 30-day trend and daily average, the month to date and the month projection, the inactivity threshold in force and where it comes from.
Detect — the direction toggle of this index.
Daily licensed volume — one bar per license day (the day rolls at the license manager’s midnight), with the projection to the end of this month or of next month, scaled to the collector’s figure so the chart and the tile agree. Open in Search gives the SPL, projection included.
Rolling volume — the four trends (60 min, 4 h, 12 h, 24 h) together over the last week.
Outliers — one chart per model: the KPI, the learned bounds, the anomalies, the confidence.
Hourly profile — the volume per hour, the shape a spike or a drop deviates from.
Then the standard tabs — Outliers anomaly detection, Incidents, Status flipping, Status message, SLA — as for any entity.
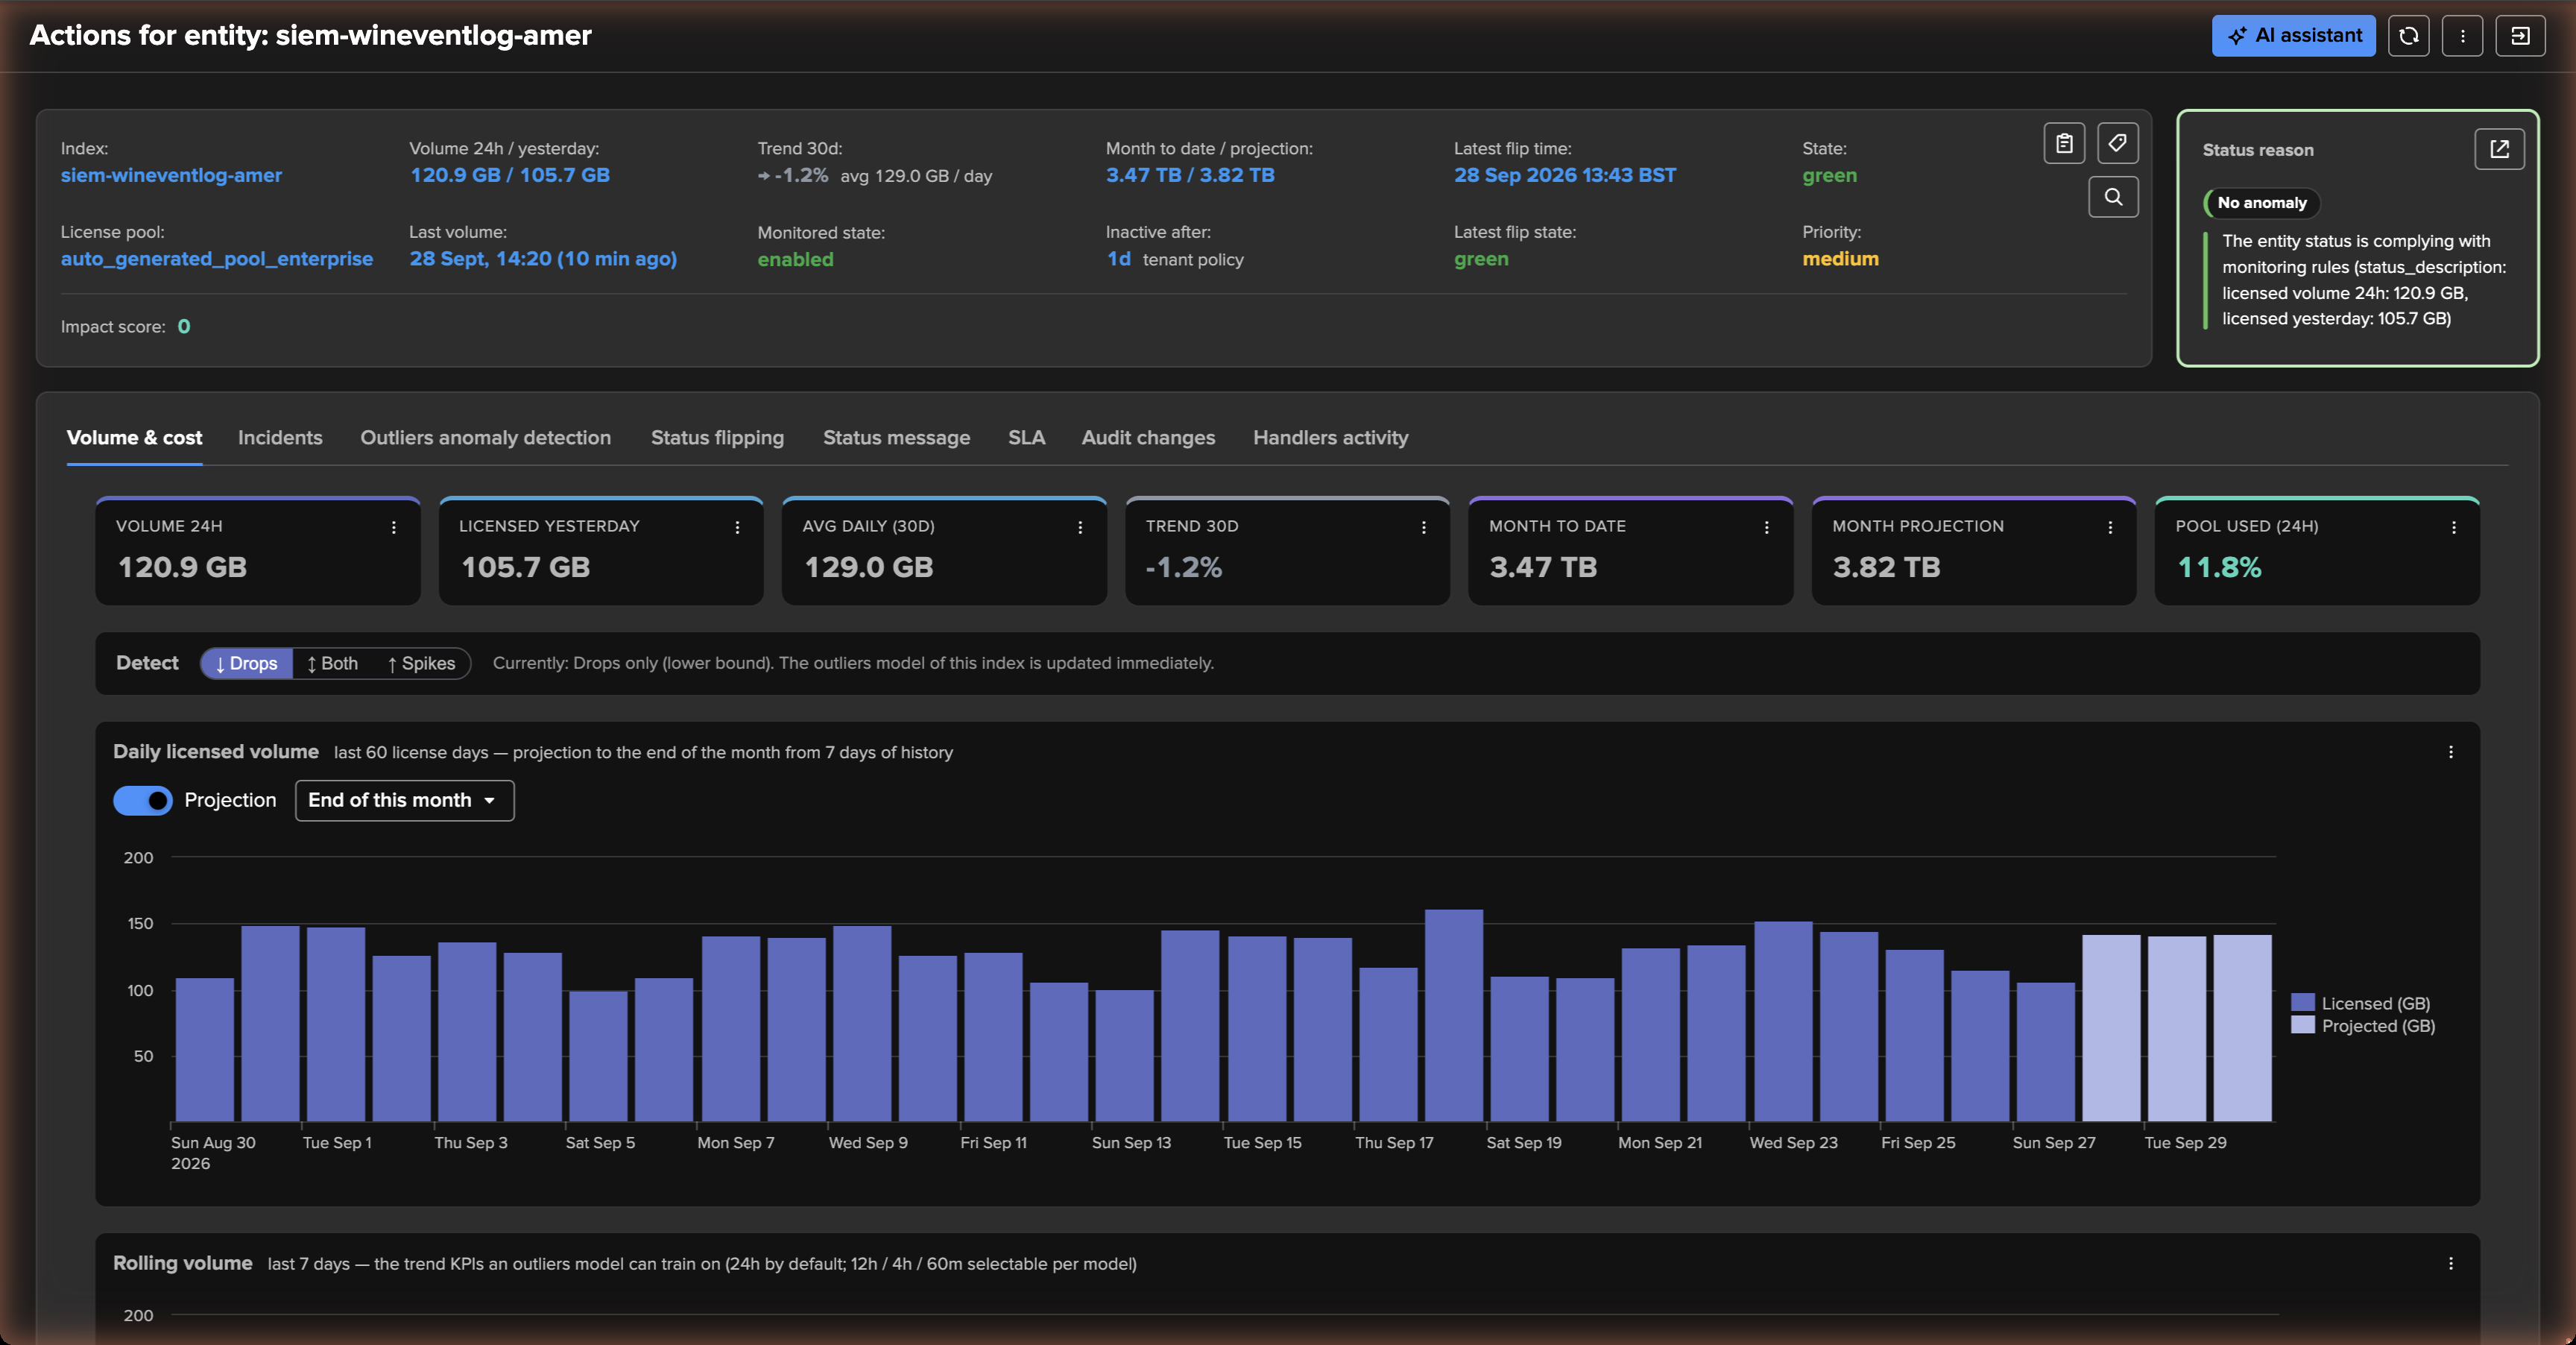
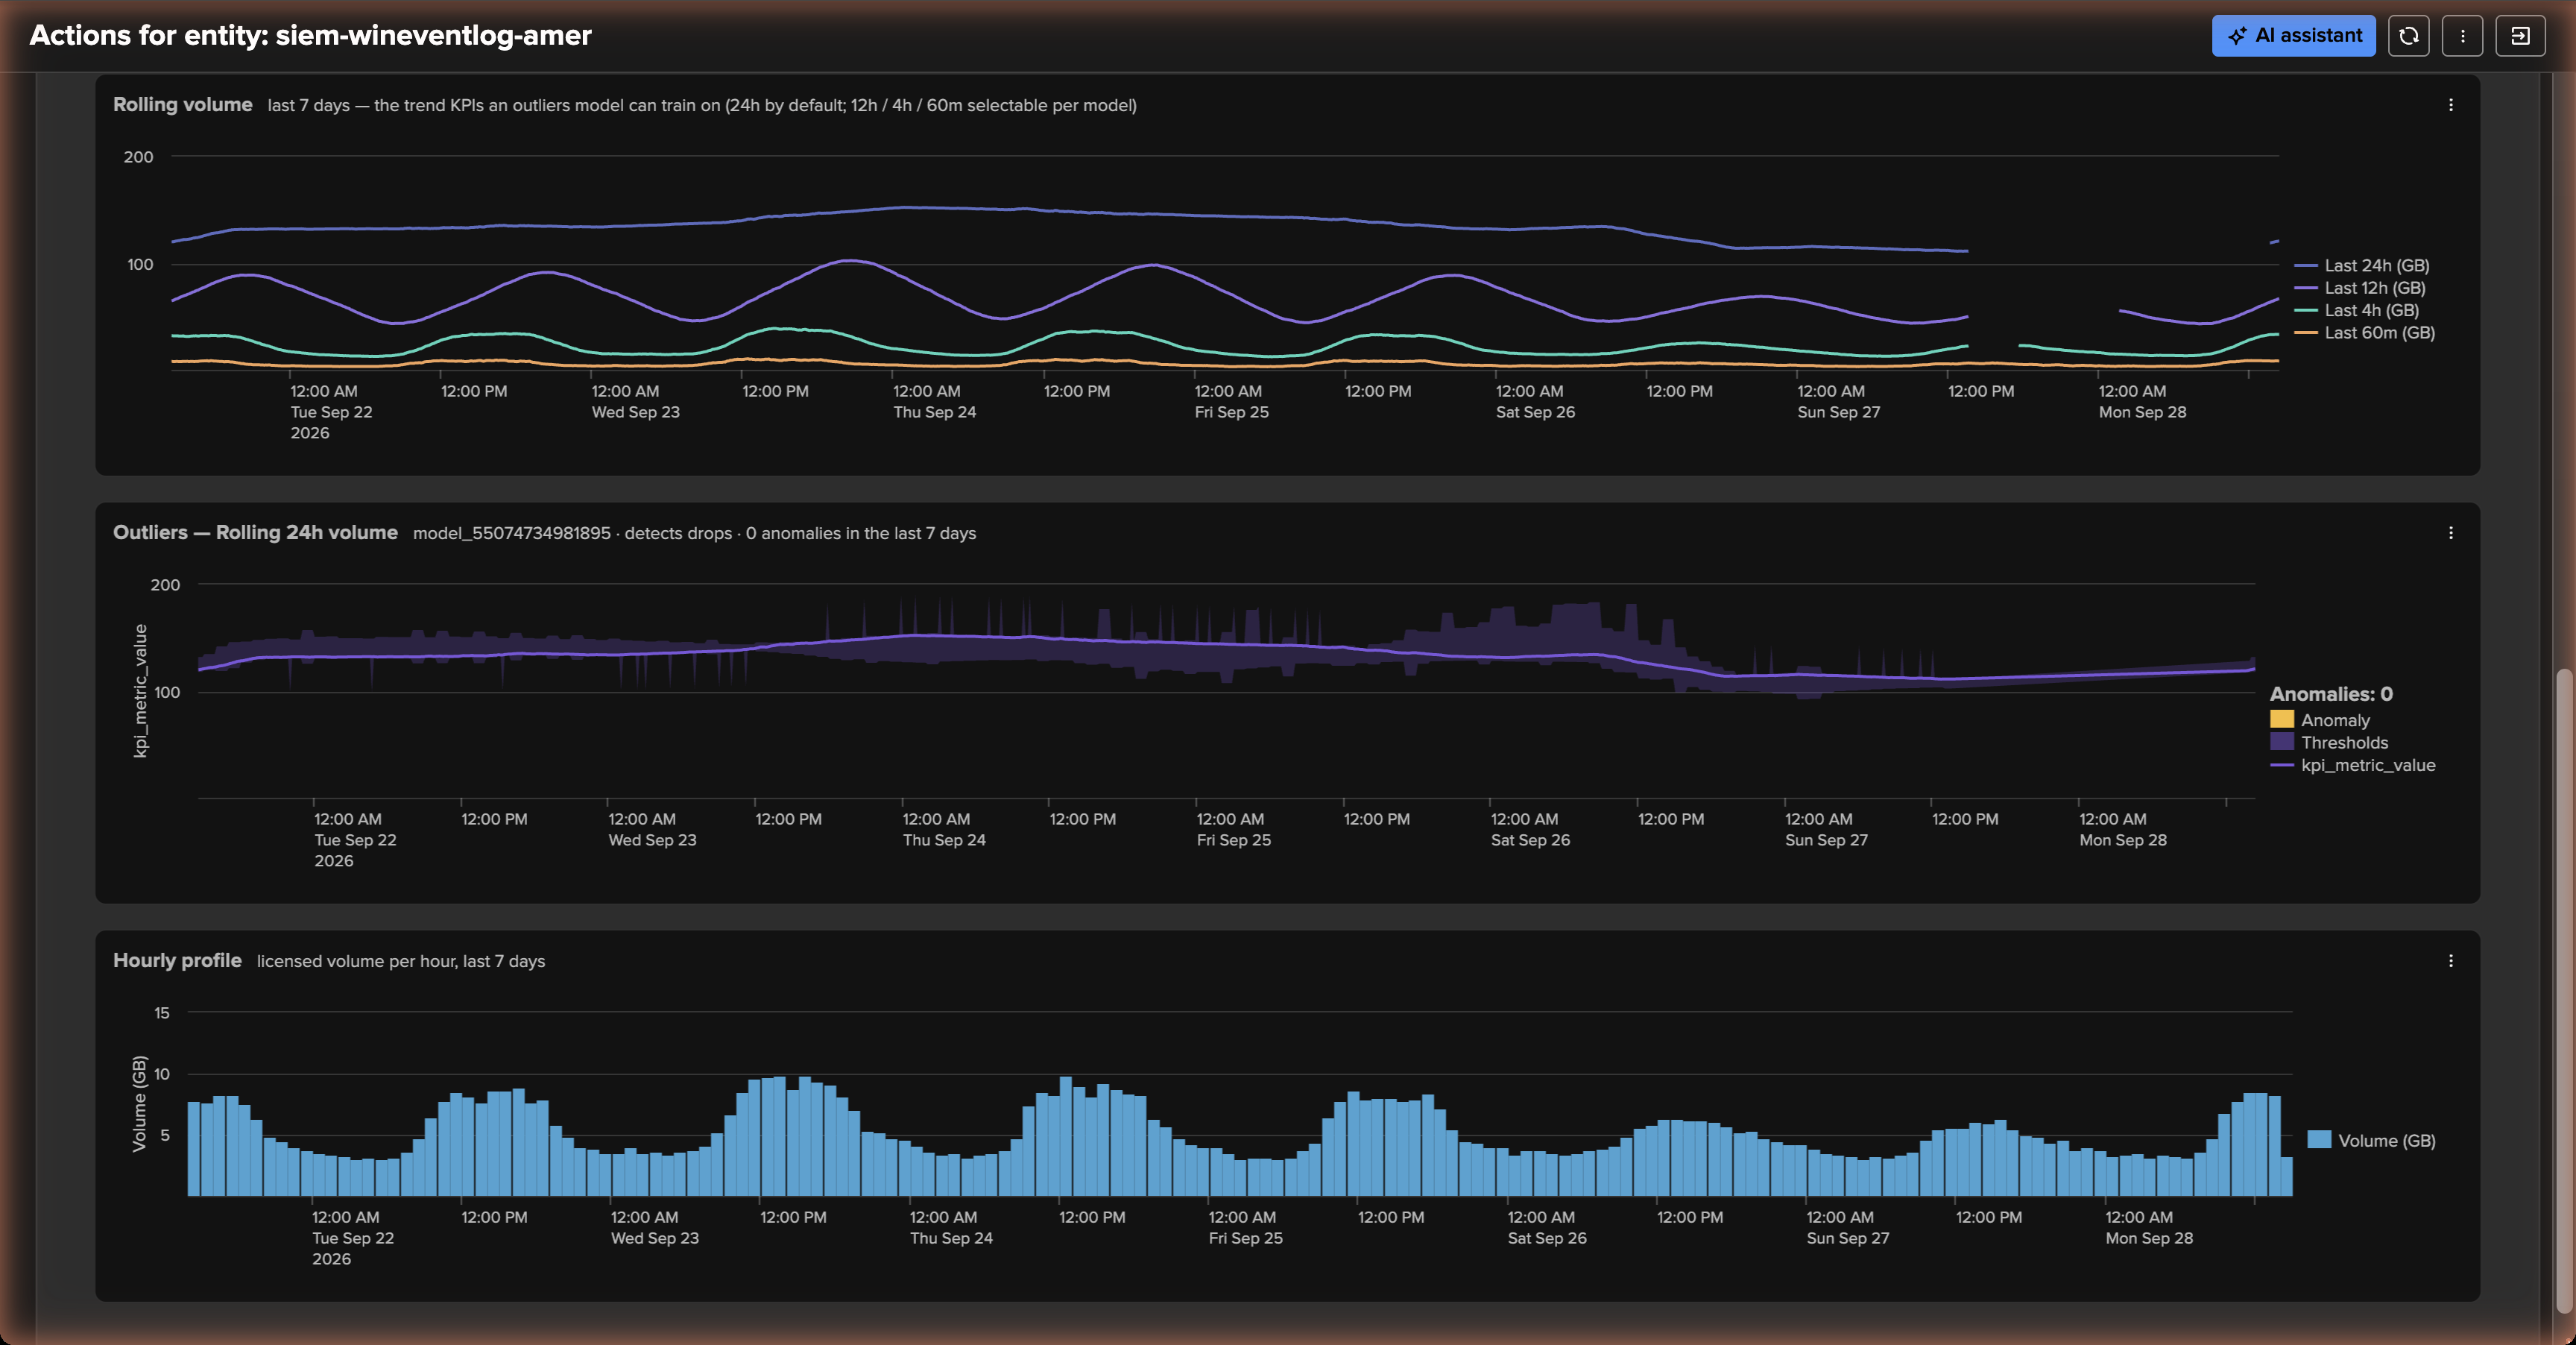
Every chart draws its volumes in one unit — MB, GB or TB — picked from its largest value, so
a small index is not a flat line of 0.00 GB and a large one does not read in millions of
MB.
Step 4 — Choosing what to detect, per index
Not every index deserves both directions. A security index is a drop concern — a spike is welcome data; a development or metrics index is a spike concern — a drop costs nothing. The Detect toggle of the VOL table switches an index between drops, both and spikes with one click, and the bulk edit action Detection direction applies a choice to a selection:
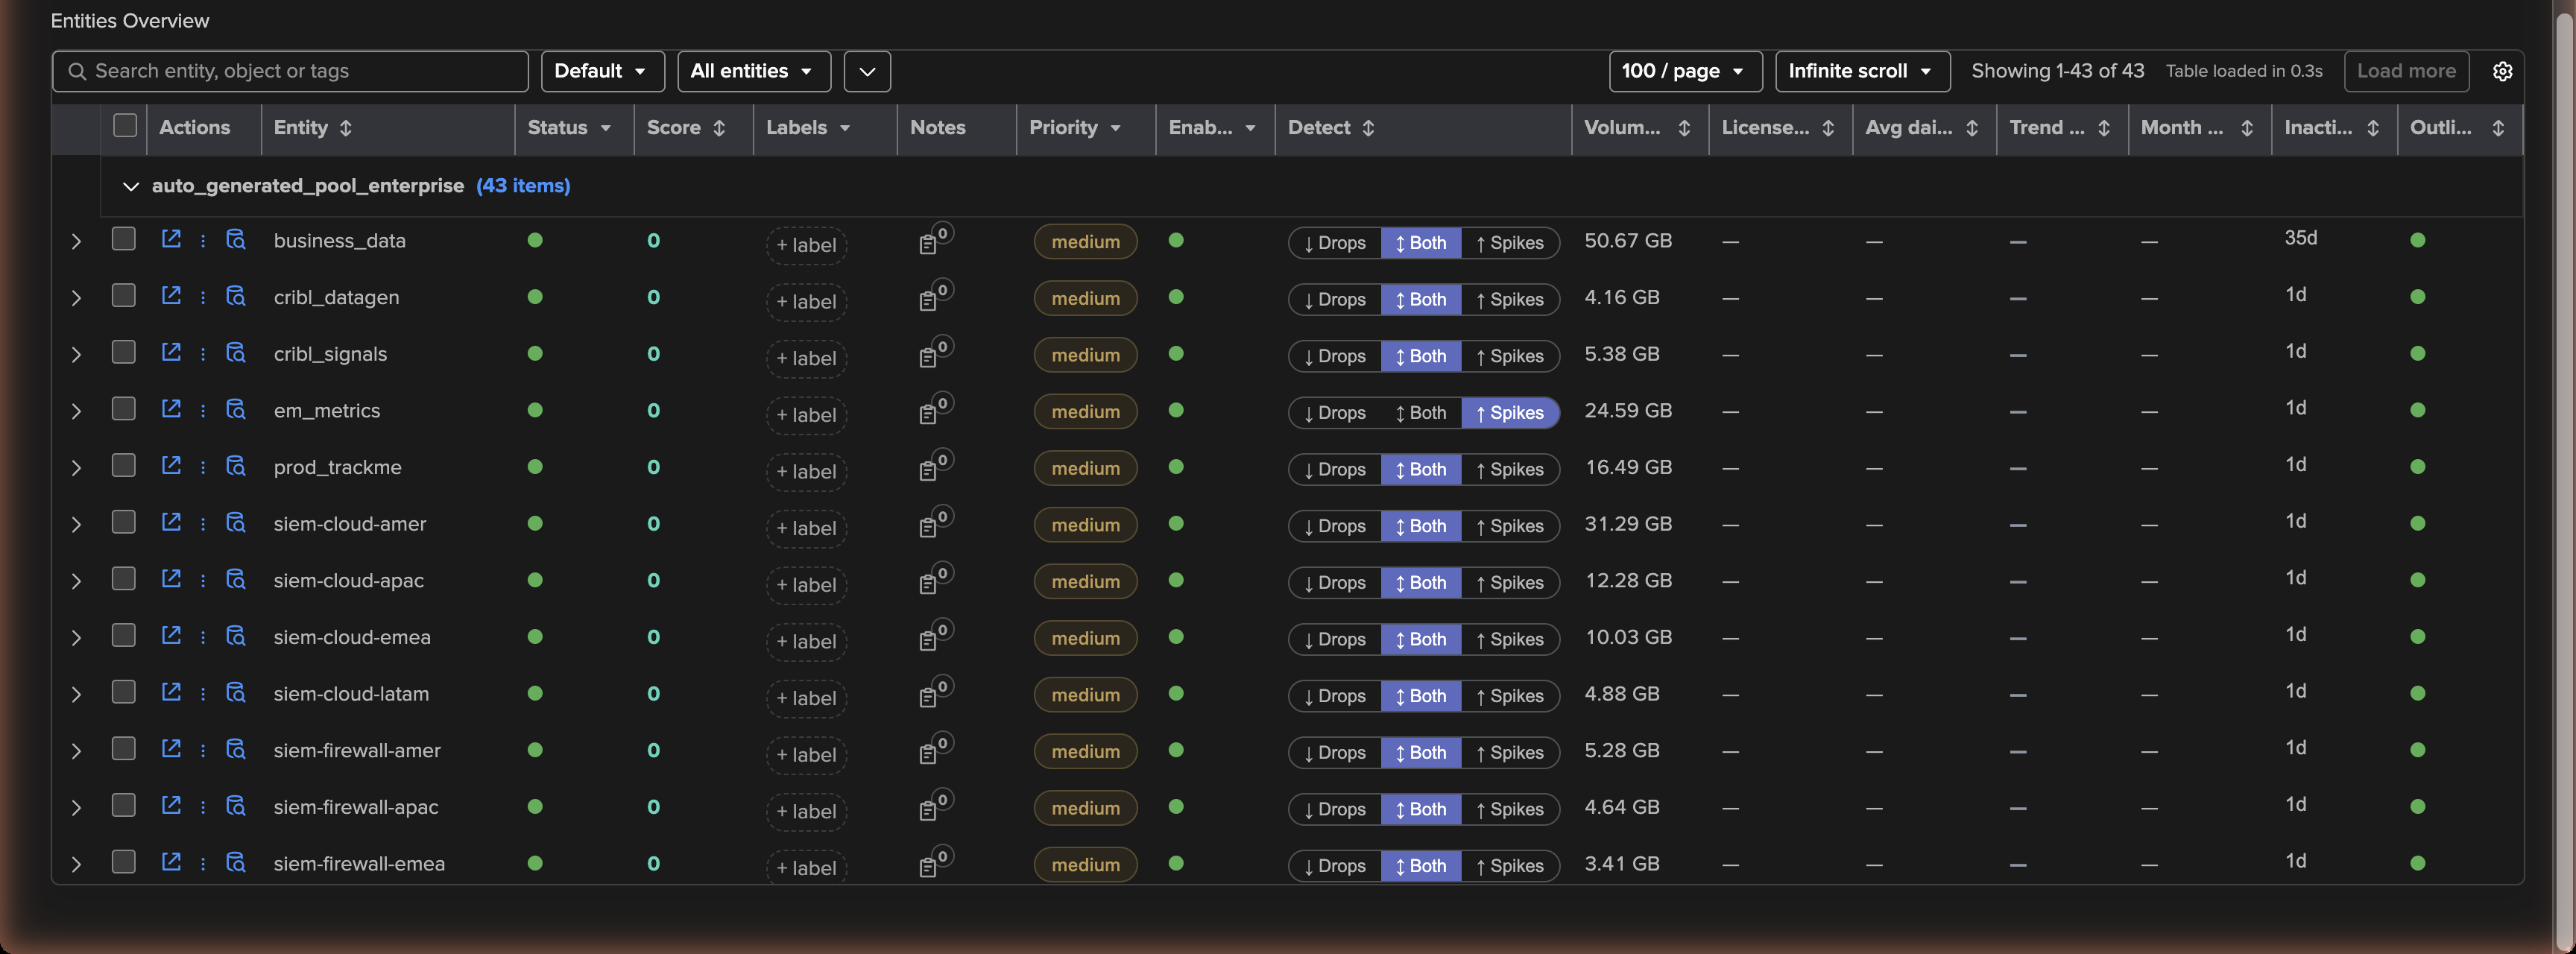
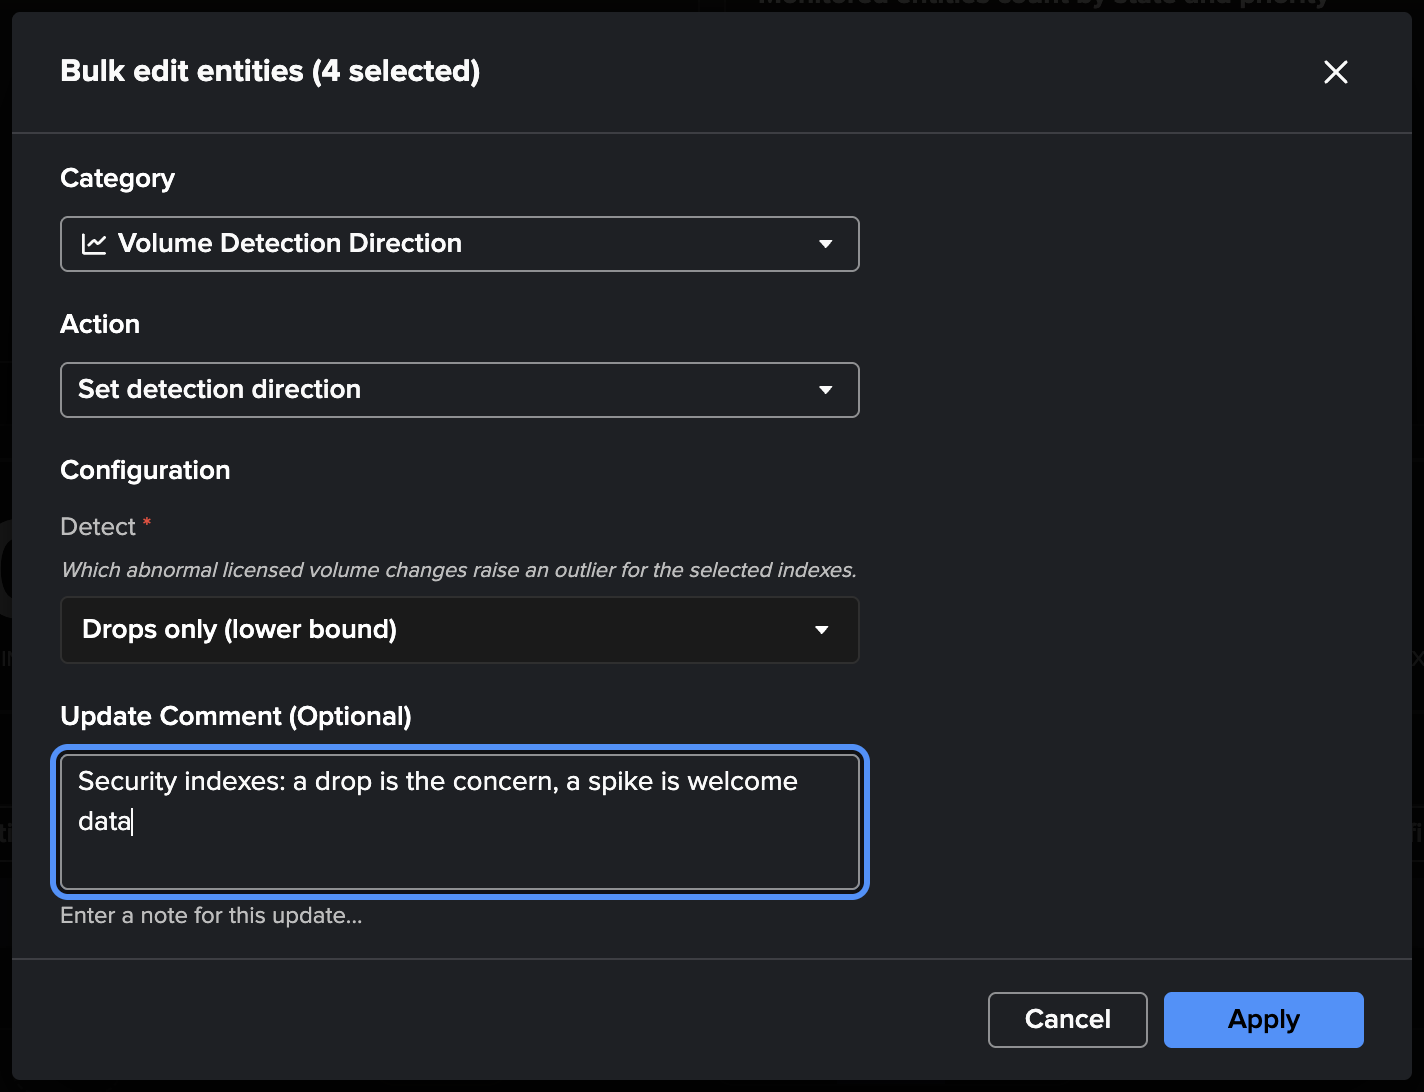
The direction is stored on the index’s model (the lower bound for drops, the upper bound for spikes); the tenant default applies to every new index. Under the hood the models are the standard TrackMe outliers models — the Outliers anomaly detection tab manages them (simulation, retraining, false positives), and the AI ML Advisor reviews them like any other.
Step 5 — Inactivity: the silent index
An index that stops consuming license does not produce a drop for long: after 24 hours its rolling volume is 0 and stays there — a lower-bound outlier the first day, then a flat line the model accepts. Inactivity is the second detection: the index turns red once its last licensed volume is older than the threshold in force.
The tenant policy set in the wizard (1 day in working hours, 7 days otherwise) applies live to every index. Manage: Global inactivity threshold in the Tenant Home menu edits it — the slots on a day / hour grid, drawn in the server’s time zone — and an index gets its own override from its menu (Modify → Inactivity threshold) or from the bulk edit category Inactivity Threshold: a monthly batch index, for instance, gets a static 35-day threshold.
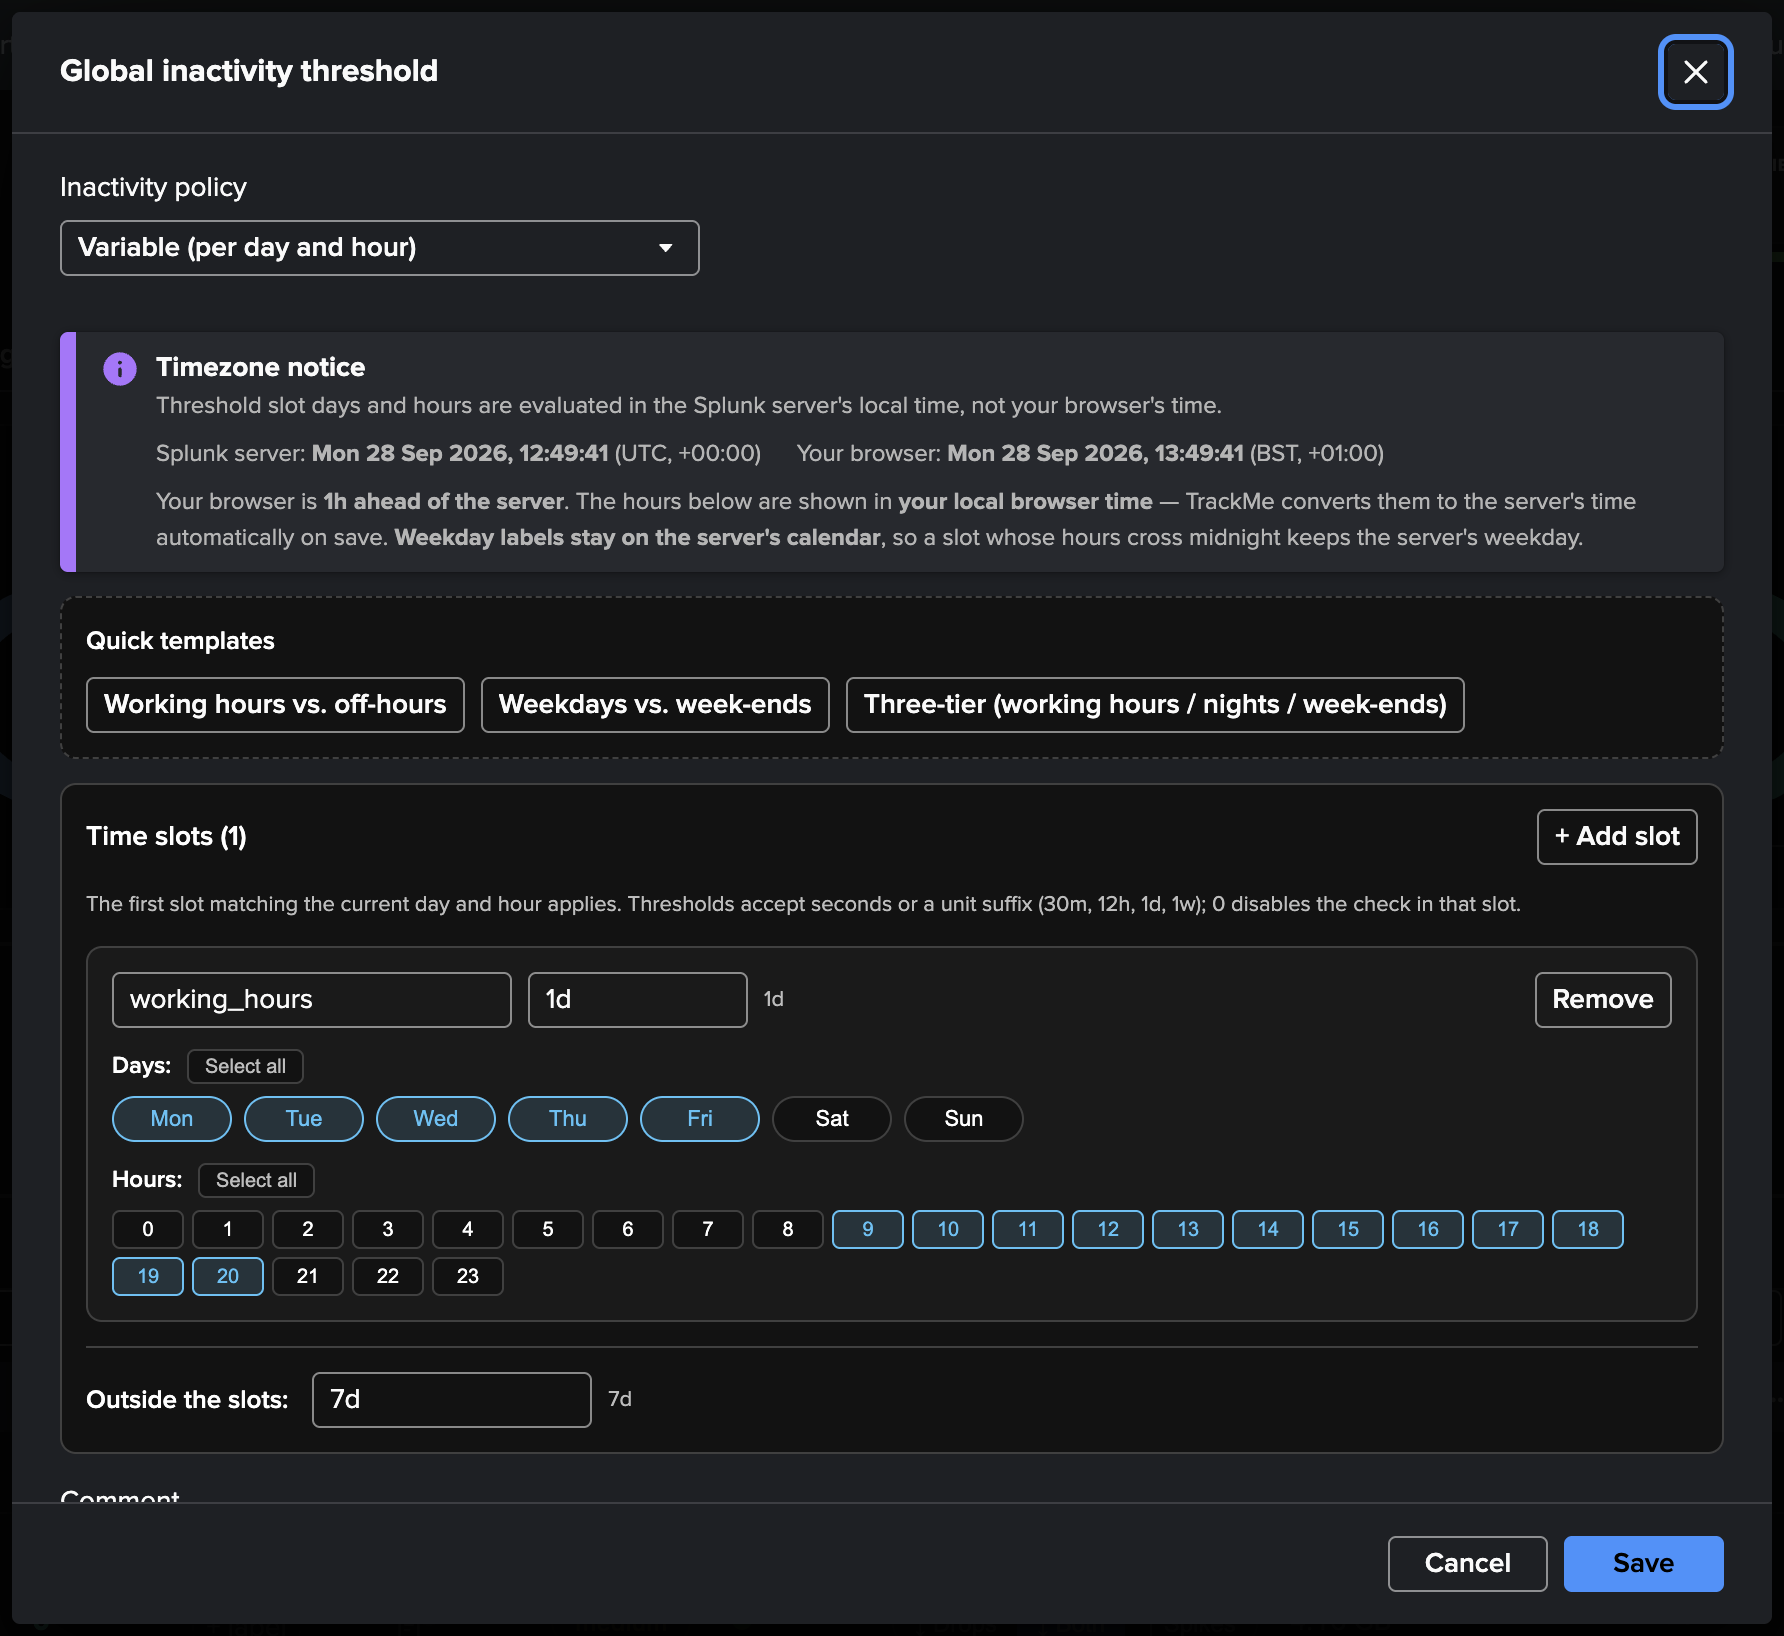
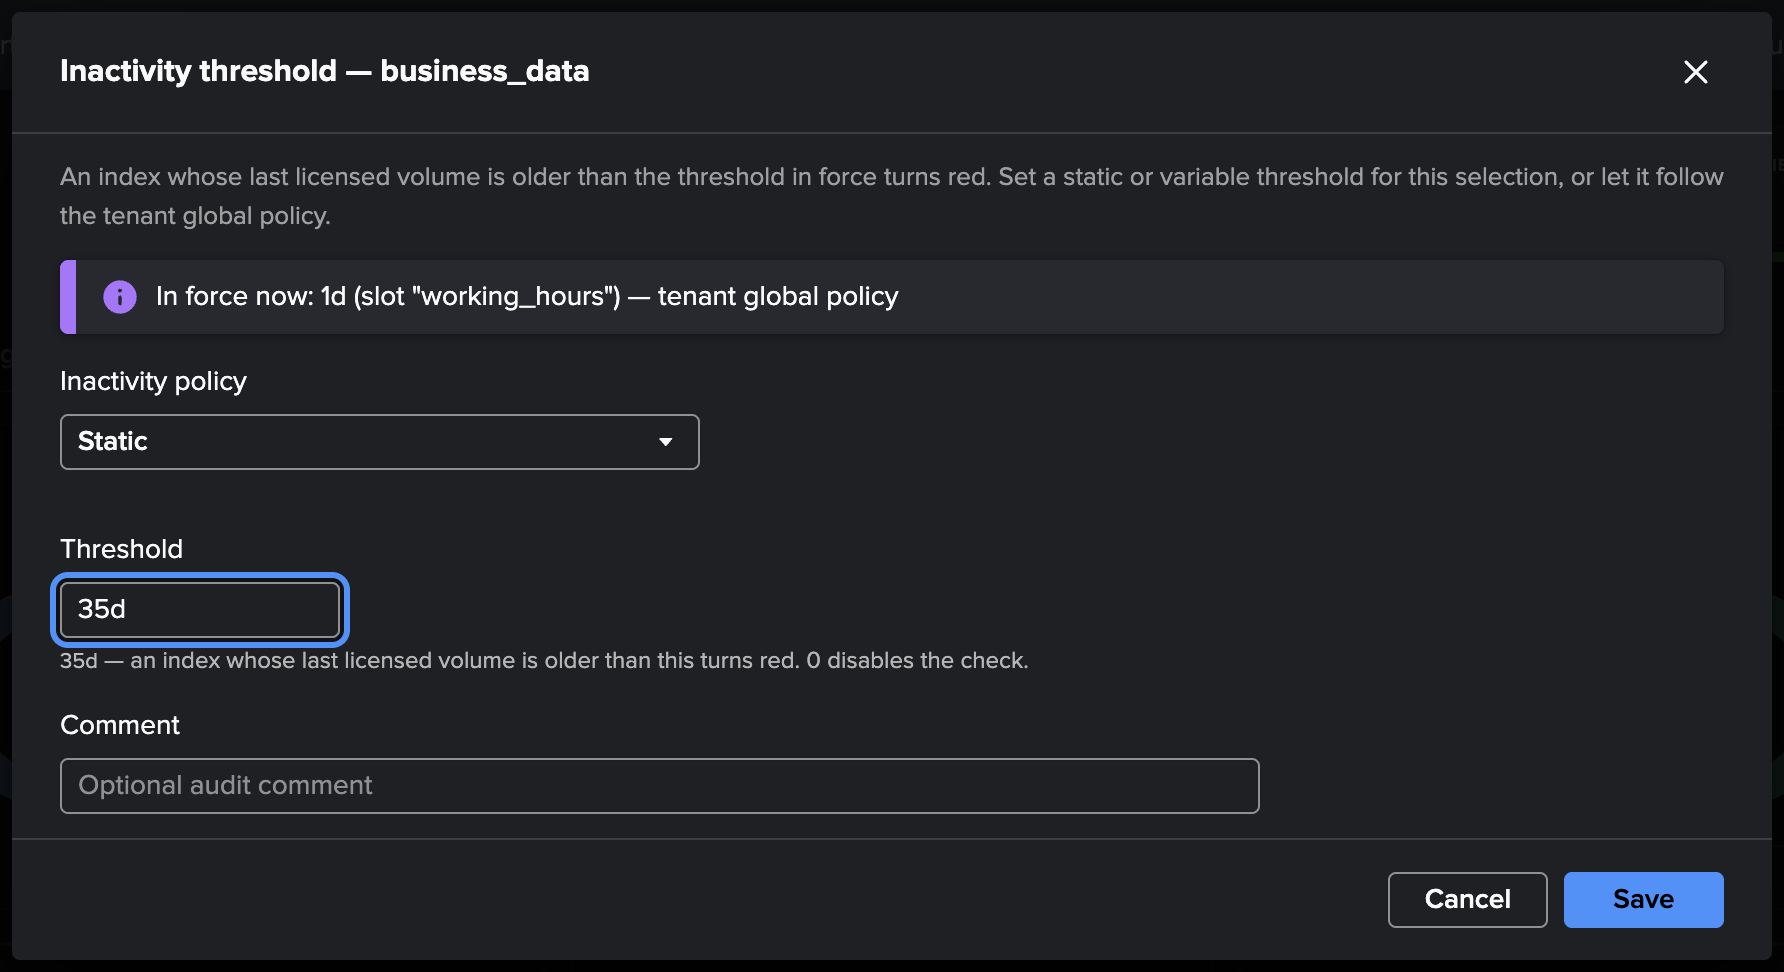
The table’s Inactivity column shows the threshold in force per index (the slot and the source in its tooltip), and the red status message names the slot — silent for 1d 4h, threshold 1d (working_hours), set for this index.
Step 6 — Global license usage
The Global license usage (VOL) tab, next to the component tab, is the environment view — the dashboard that every Splunk administrator builds by hand at some point, computed here from what the tenant already collected (no extra search on the license usage log):
the key figures: licensed yesterday, daily average, peak day, the trend of the environment, month to date and the month projection, the share of the top 5 consumers, and on Splunk Enterprise the quota used yesterday;
the insights, in plain words — the trend, days over quota, the largest increase and decrease, indexes that stopped consuming, new consumers, the concentration, the weekly pattern;
Top consumers per day: the stacked daily volume of the top consumers, the slider from 5 to 100, the rest as All others, with the daily quota line on Splunk Enterprise;
The whole environment per day, with the same projection controls as the entity chart and the quota line;
the consumers table, the week-over-week movers, and the pool cards with their usage meters, days over quota and headroom.
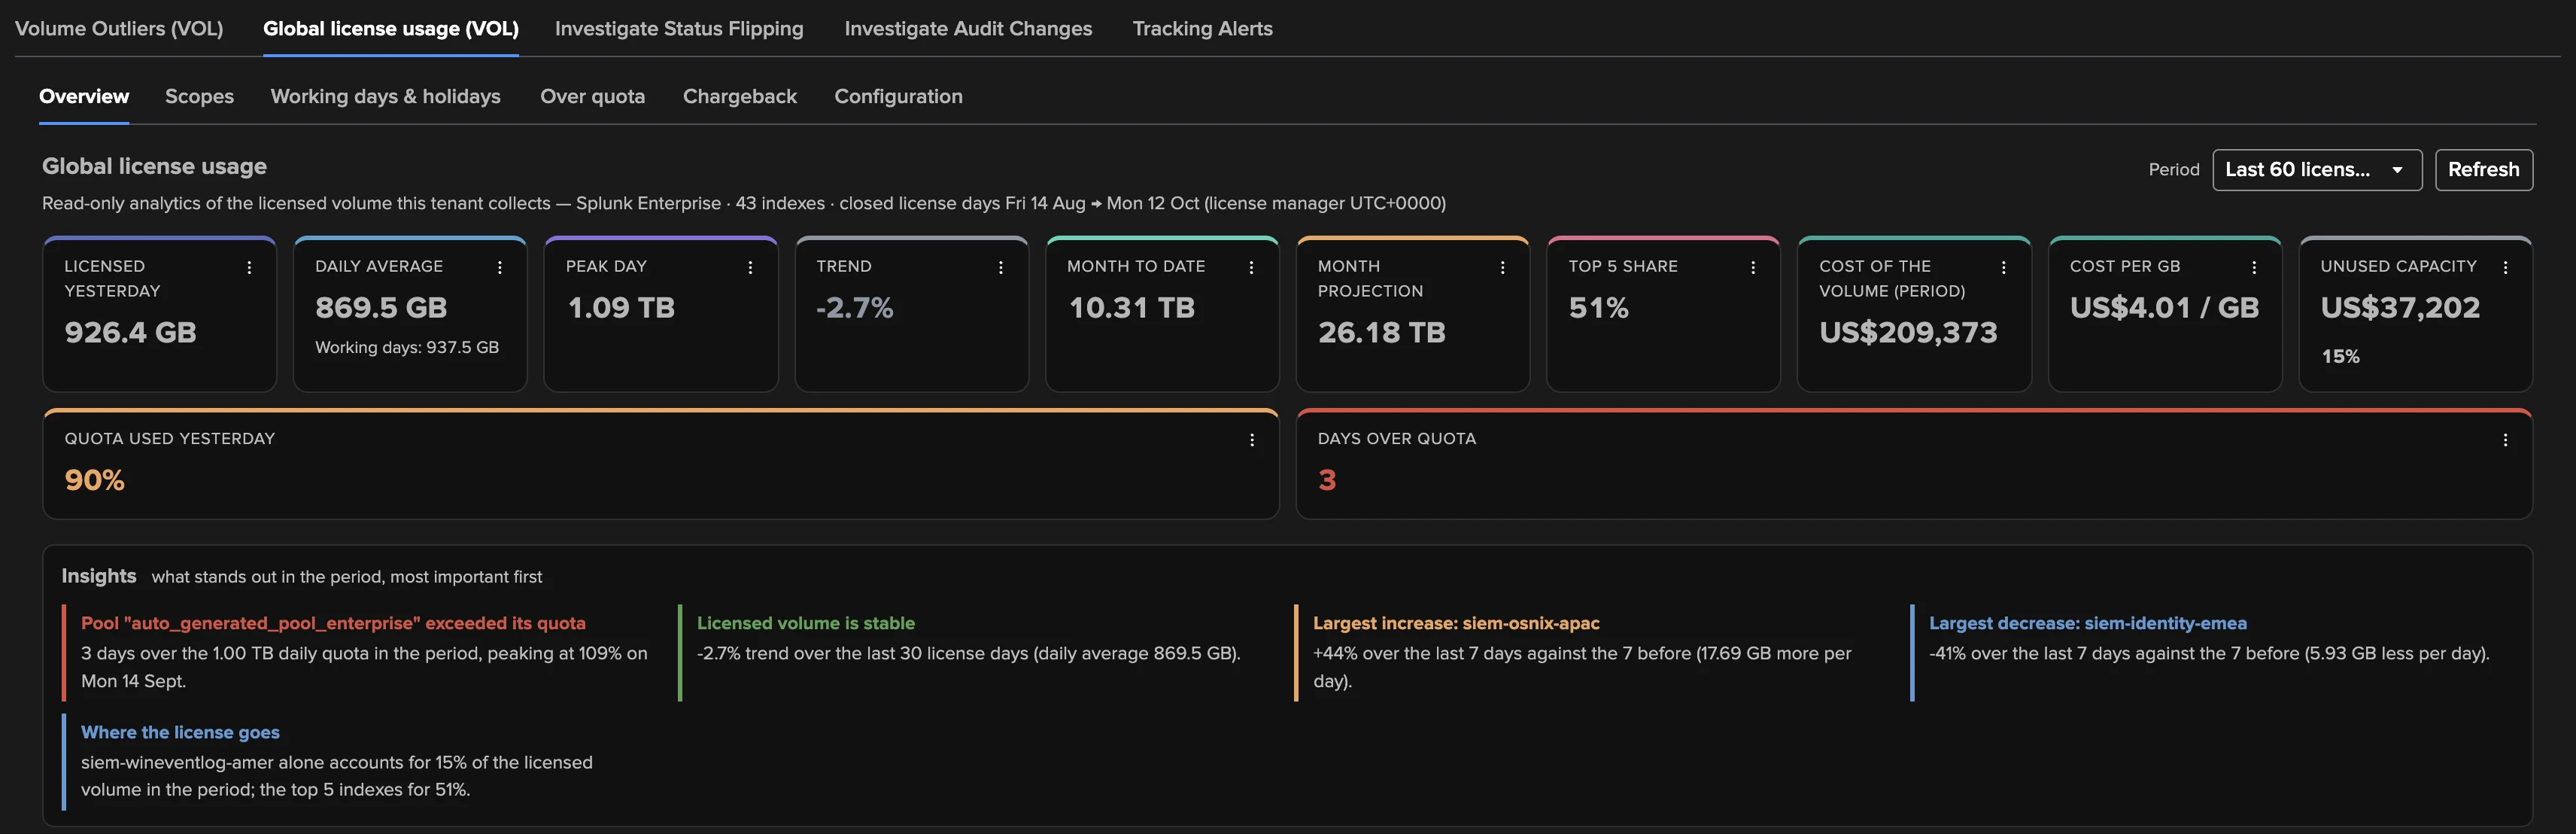
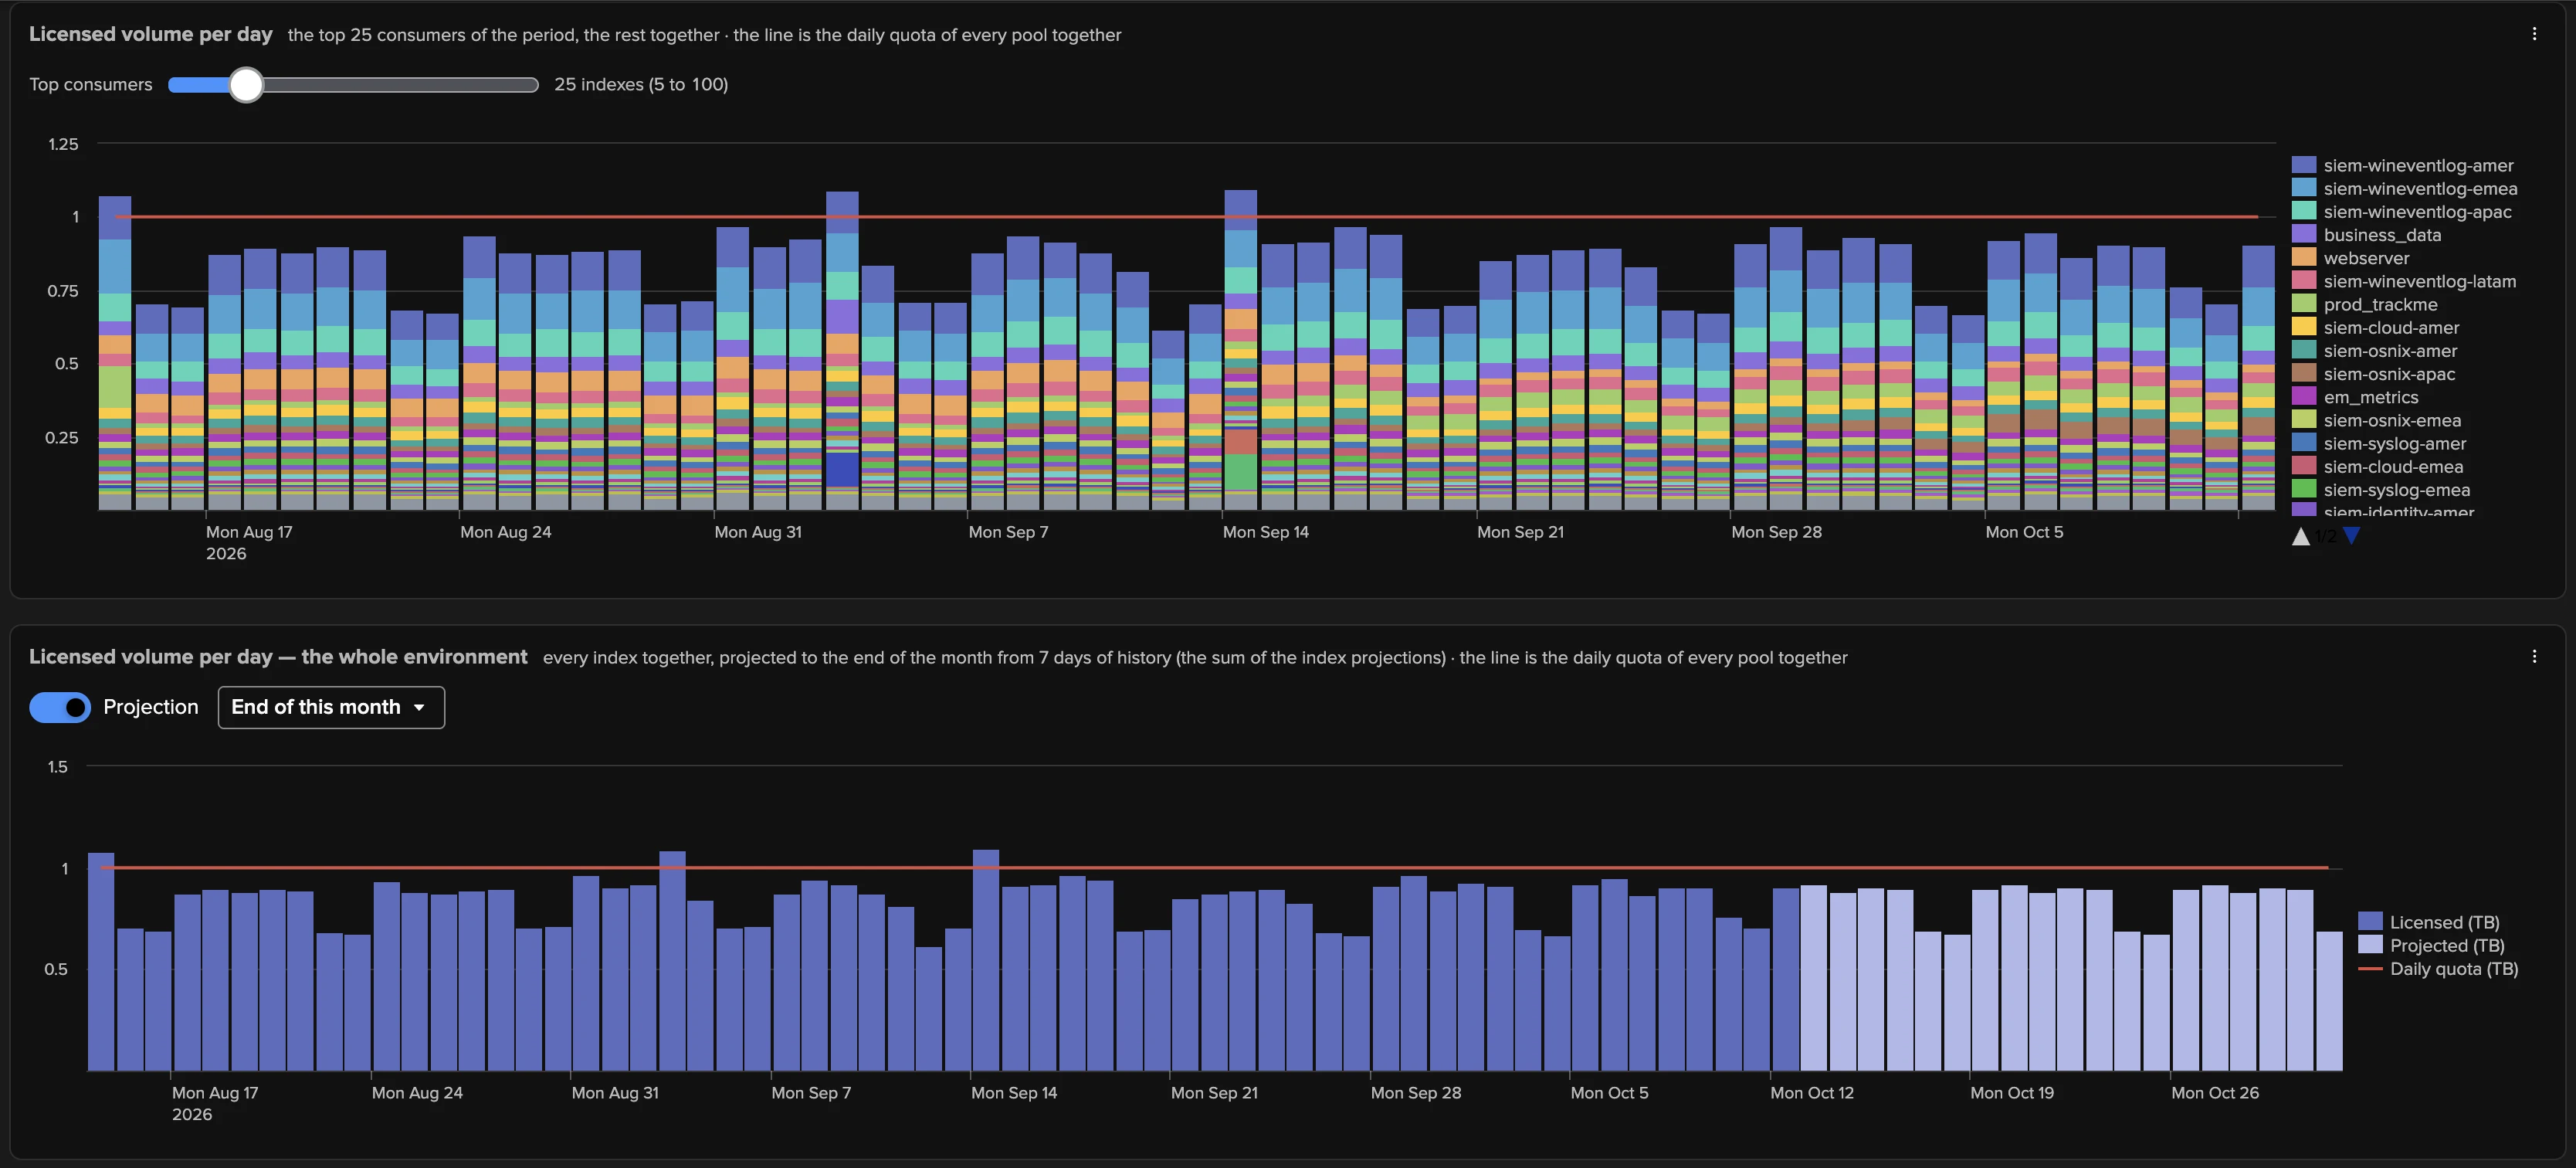
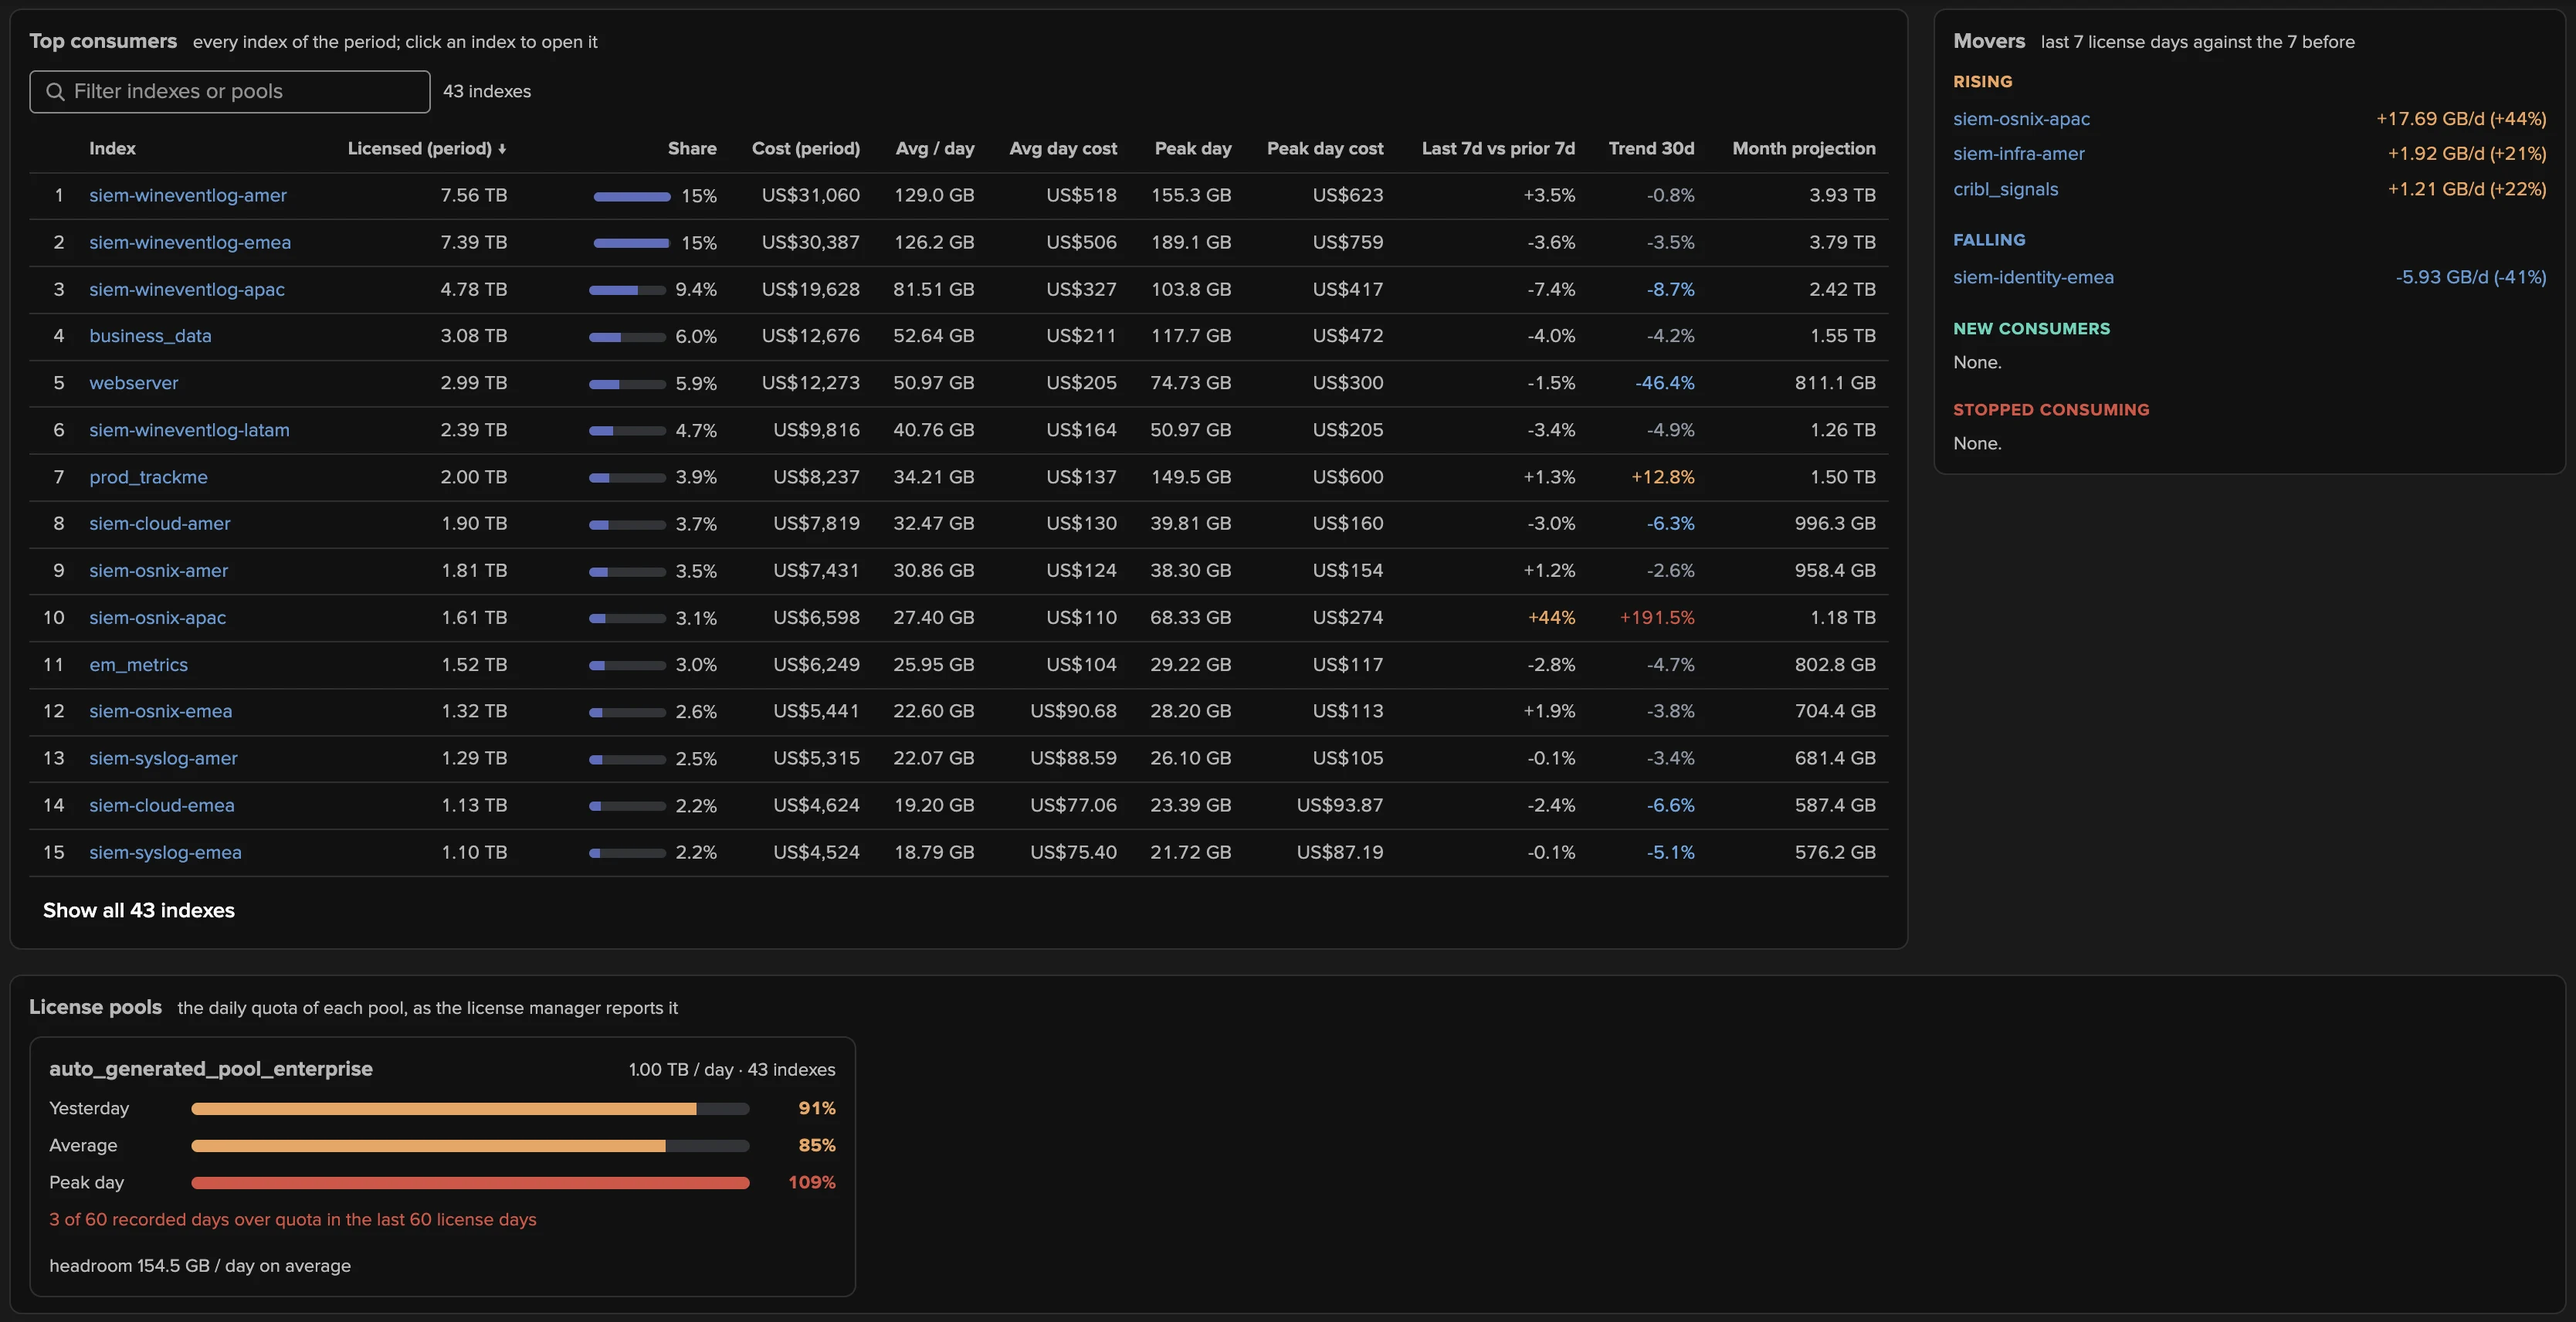
On Splunk Cloud, where a pool has no limit, the quota line and the pool meters are not drawn and the view says so, until you configure a daily quota per pool (below).
From volume to cost
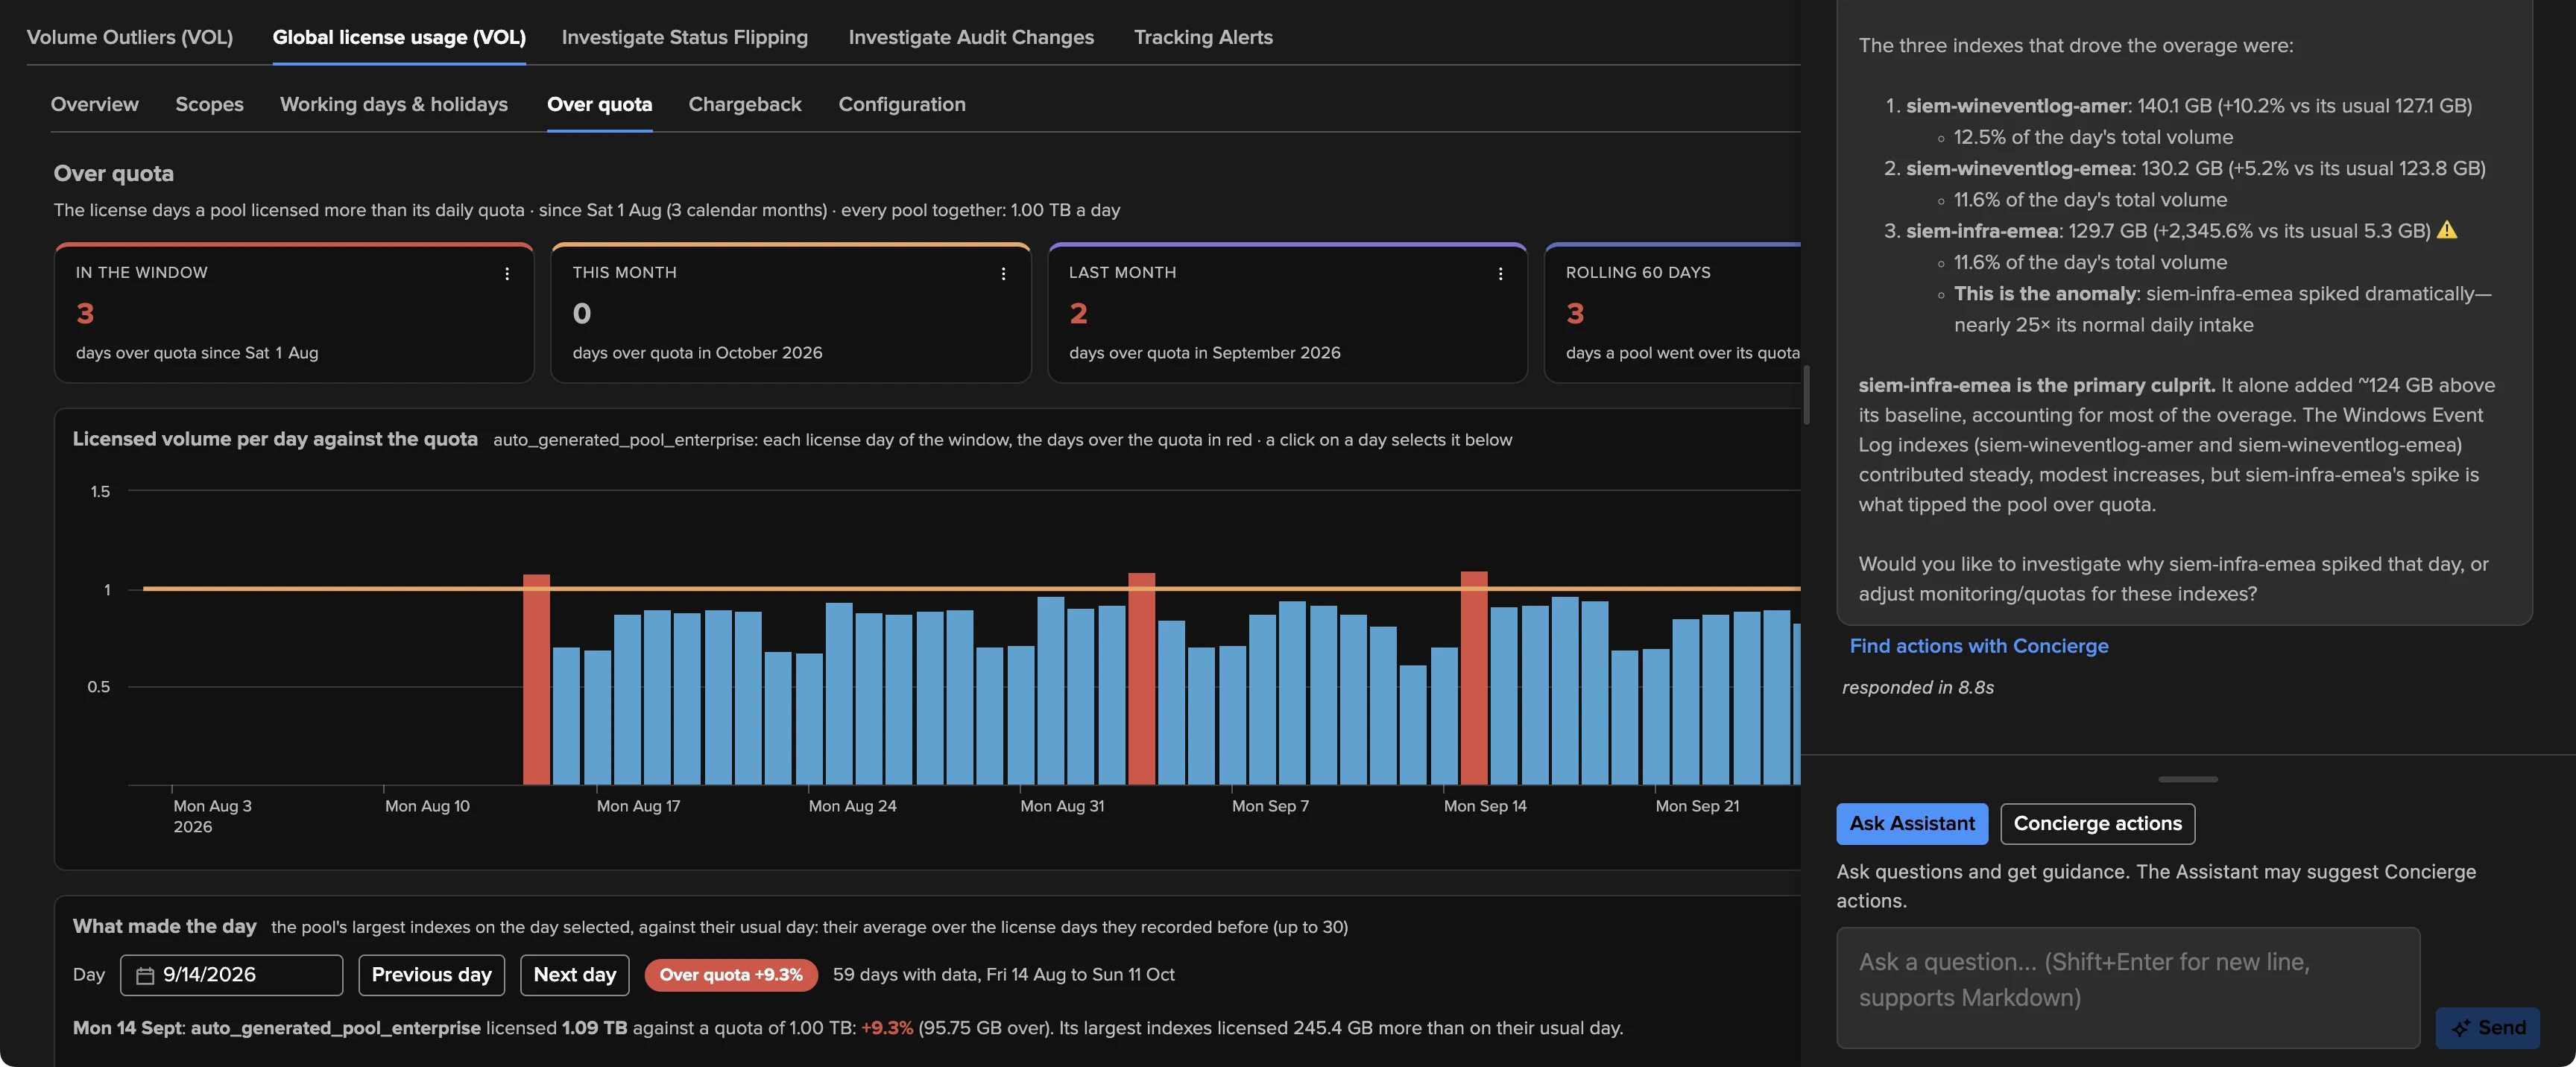
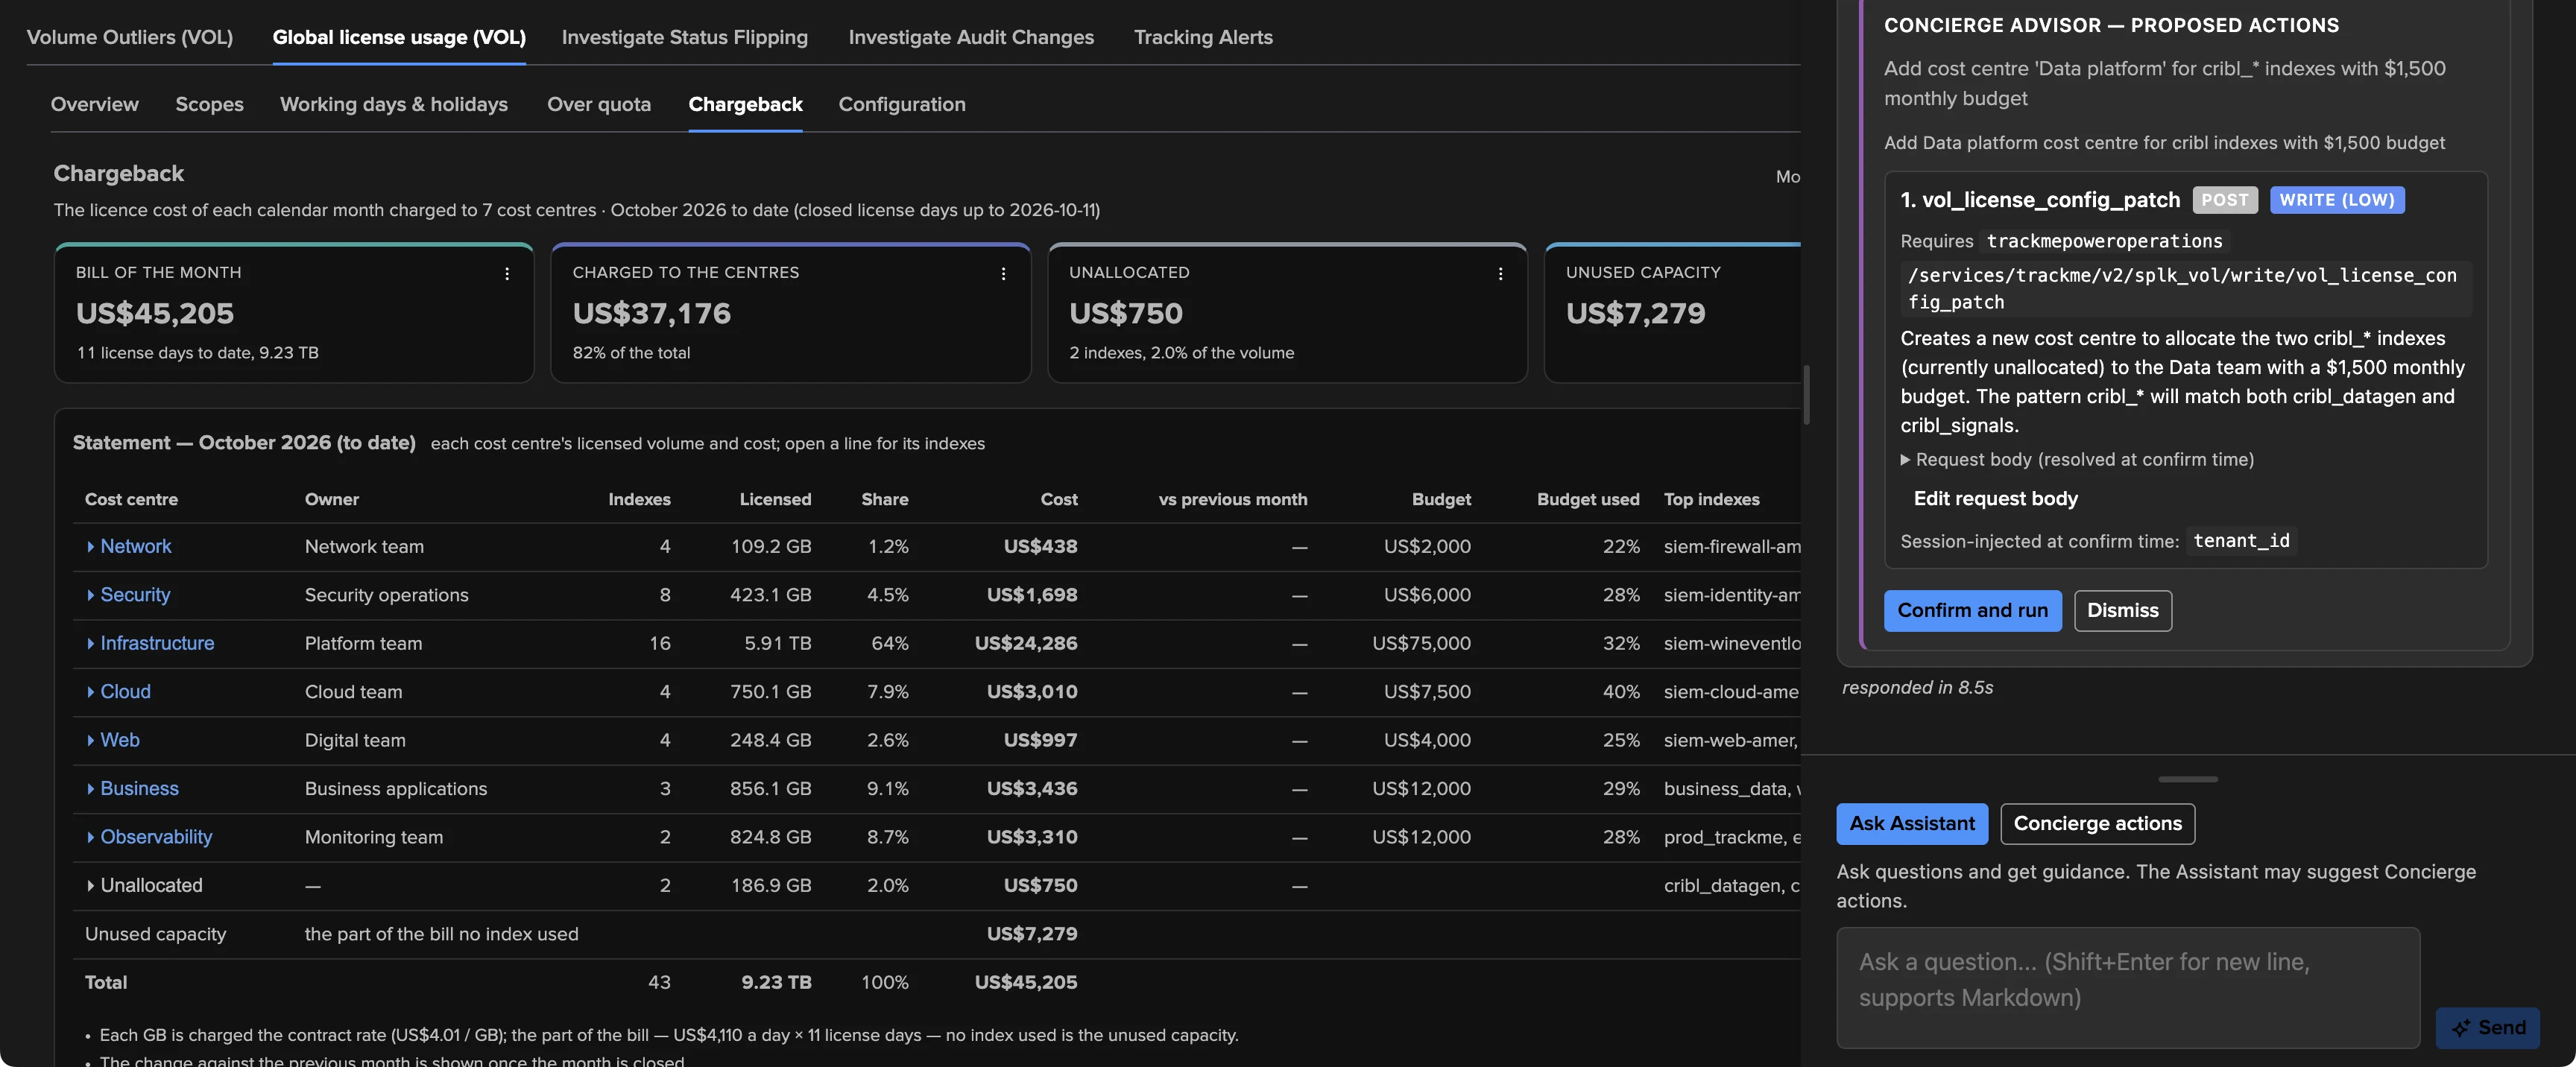
The overview is one of six sub-tabs. The others turn the same figures into answers for the people who own the license and its budget; everything is opt-in, set once in the Configuration sub-tab (power or admin role on the tenant), or by asking the AI Assistant:
Scopes — name a set of indexes (a team, a use case, the data of Enterprise Security, from index patterns or from the CIM datamodel macros) and get its share of the license, its daily average and peak, its trend and its month projection on its own tab.
Working days & holidays — the working-day, weekend and holiday averages, with the holidays of the tenant’s Bank Holidays calendars: a quiet Easter Monday no longer drags the daily average down.
Over quota — the days a pool went over its daily quota, per day, per month and over a rolling 60 days, and What made the day: the pool’s largest indexes on the day you pick, against their usual day. On Splunk Cloud, a daily quota per pool gives the stack the volume it was sized for.
Chargeback — with a price (annual licence cost or cost per GB, with its history) and a list of cost centres, a monthly statement of who pays for what over 13 calendar months, with budgets, the unallocated volume, the unused capacity and a CSV export.
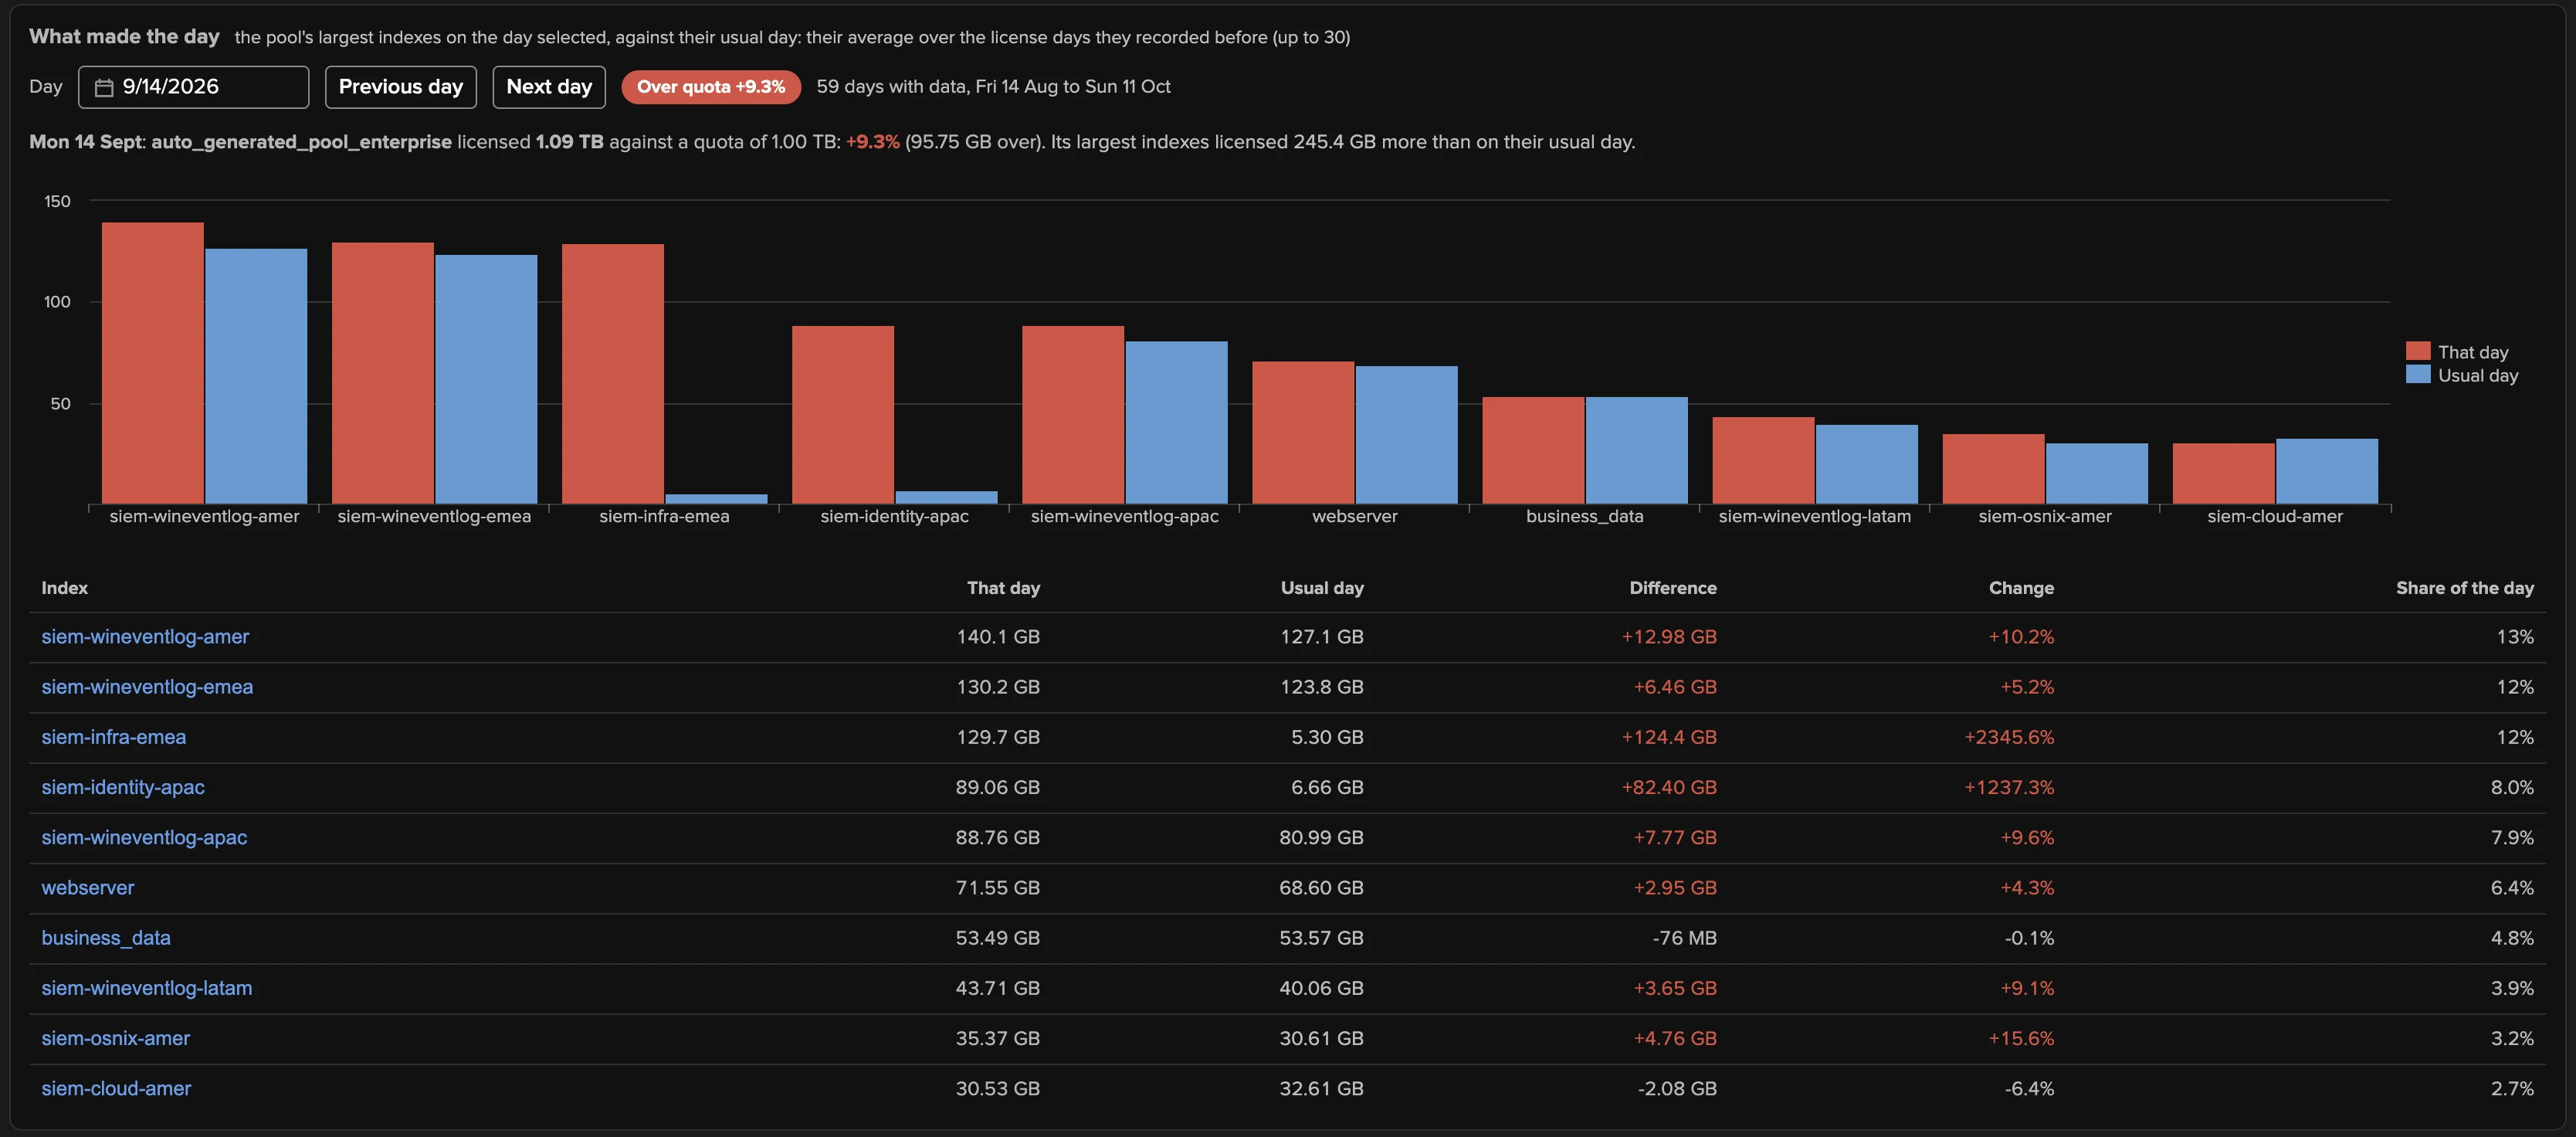
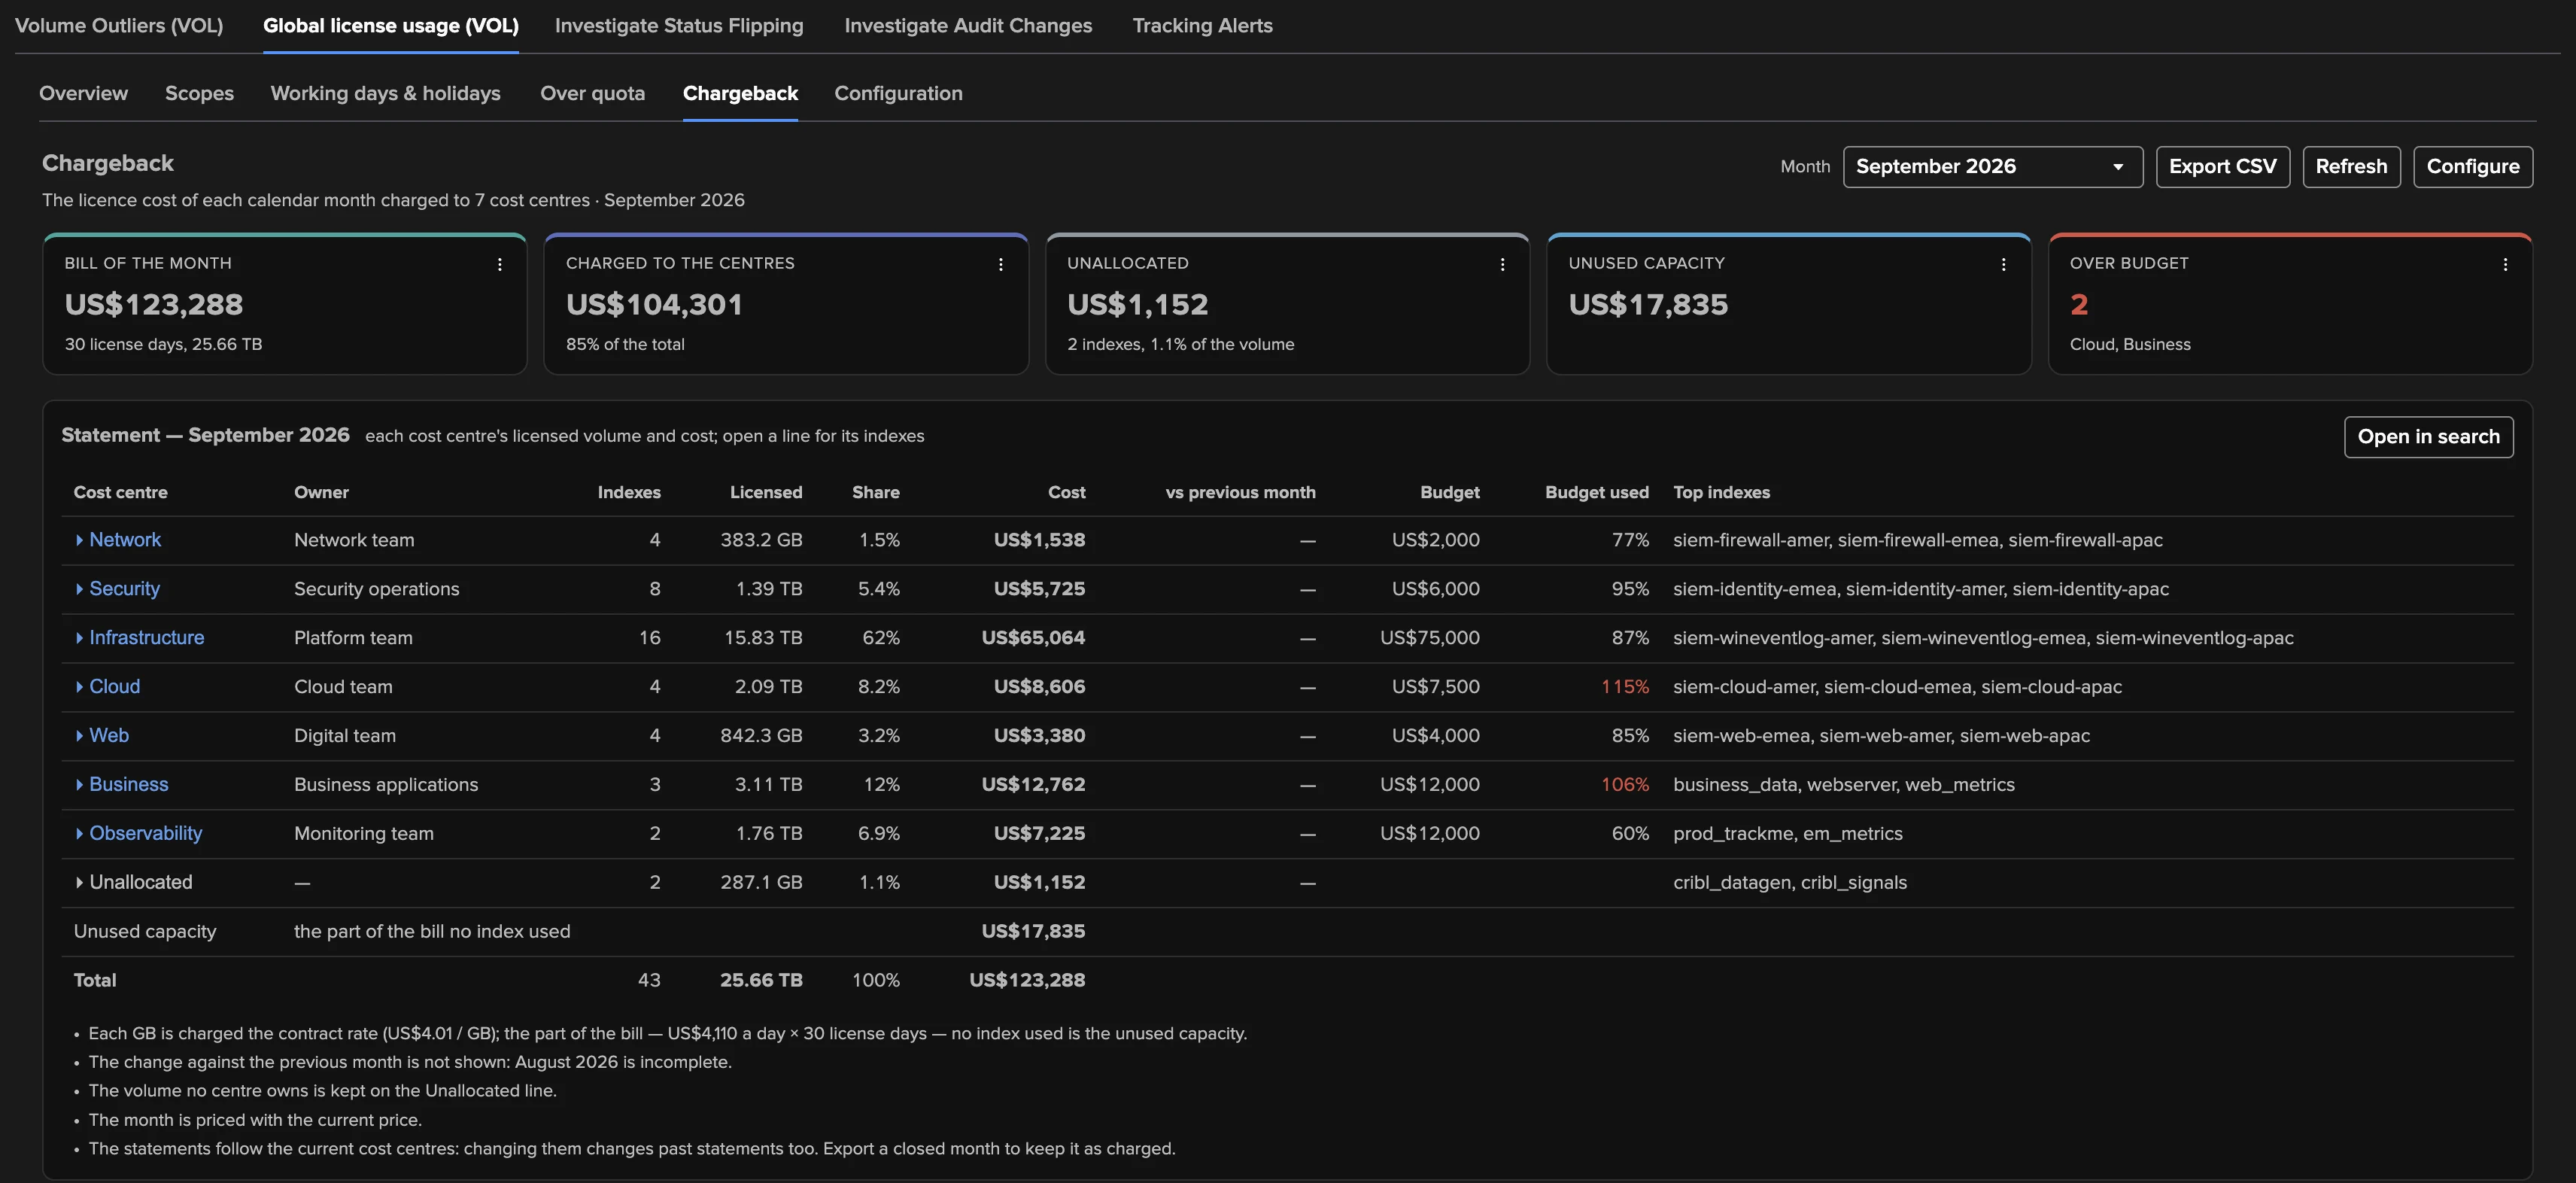
While the tab is open, the Tenant Home AI Assistant knows the sub-tab and the figures on screen: ask it why yesterday went over quota, or to create a cost centre for the security indexes, and it proposes the change for you to approve. The full reference is in Global license usage (VOL).
Step 7 — Alerting
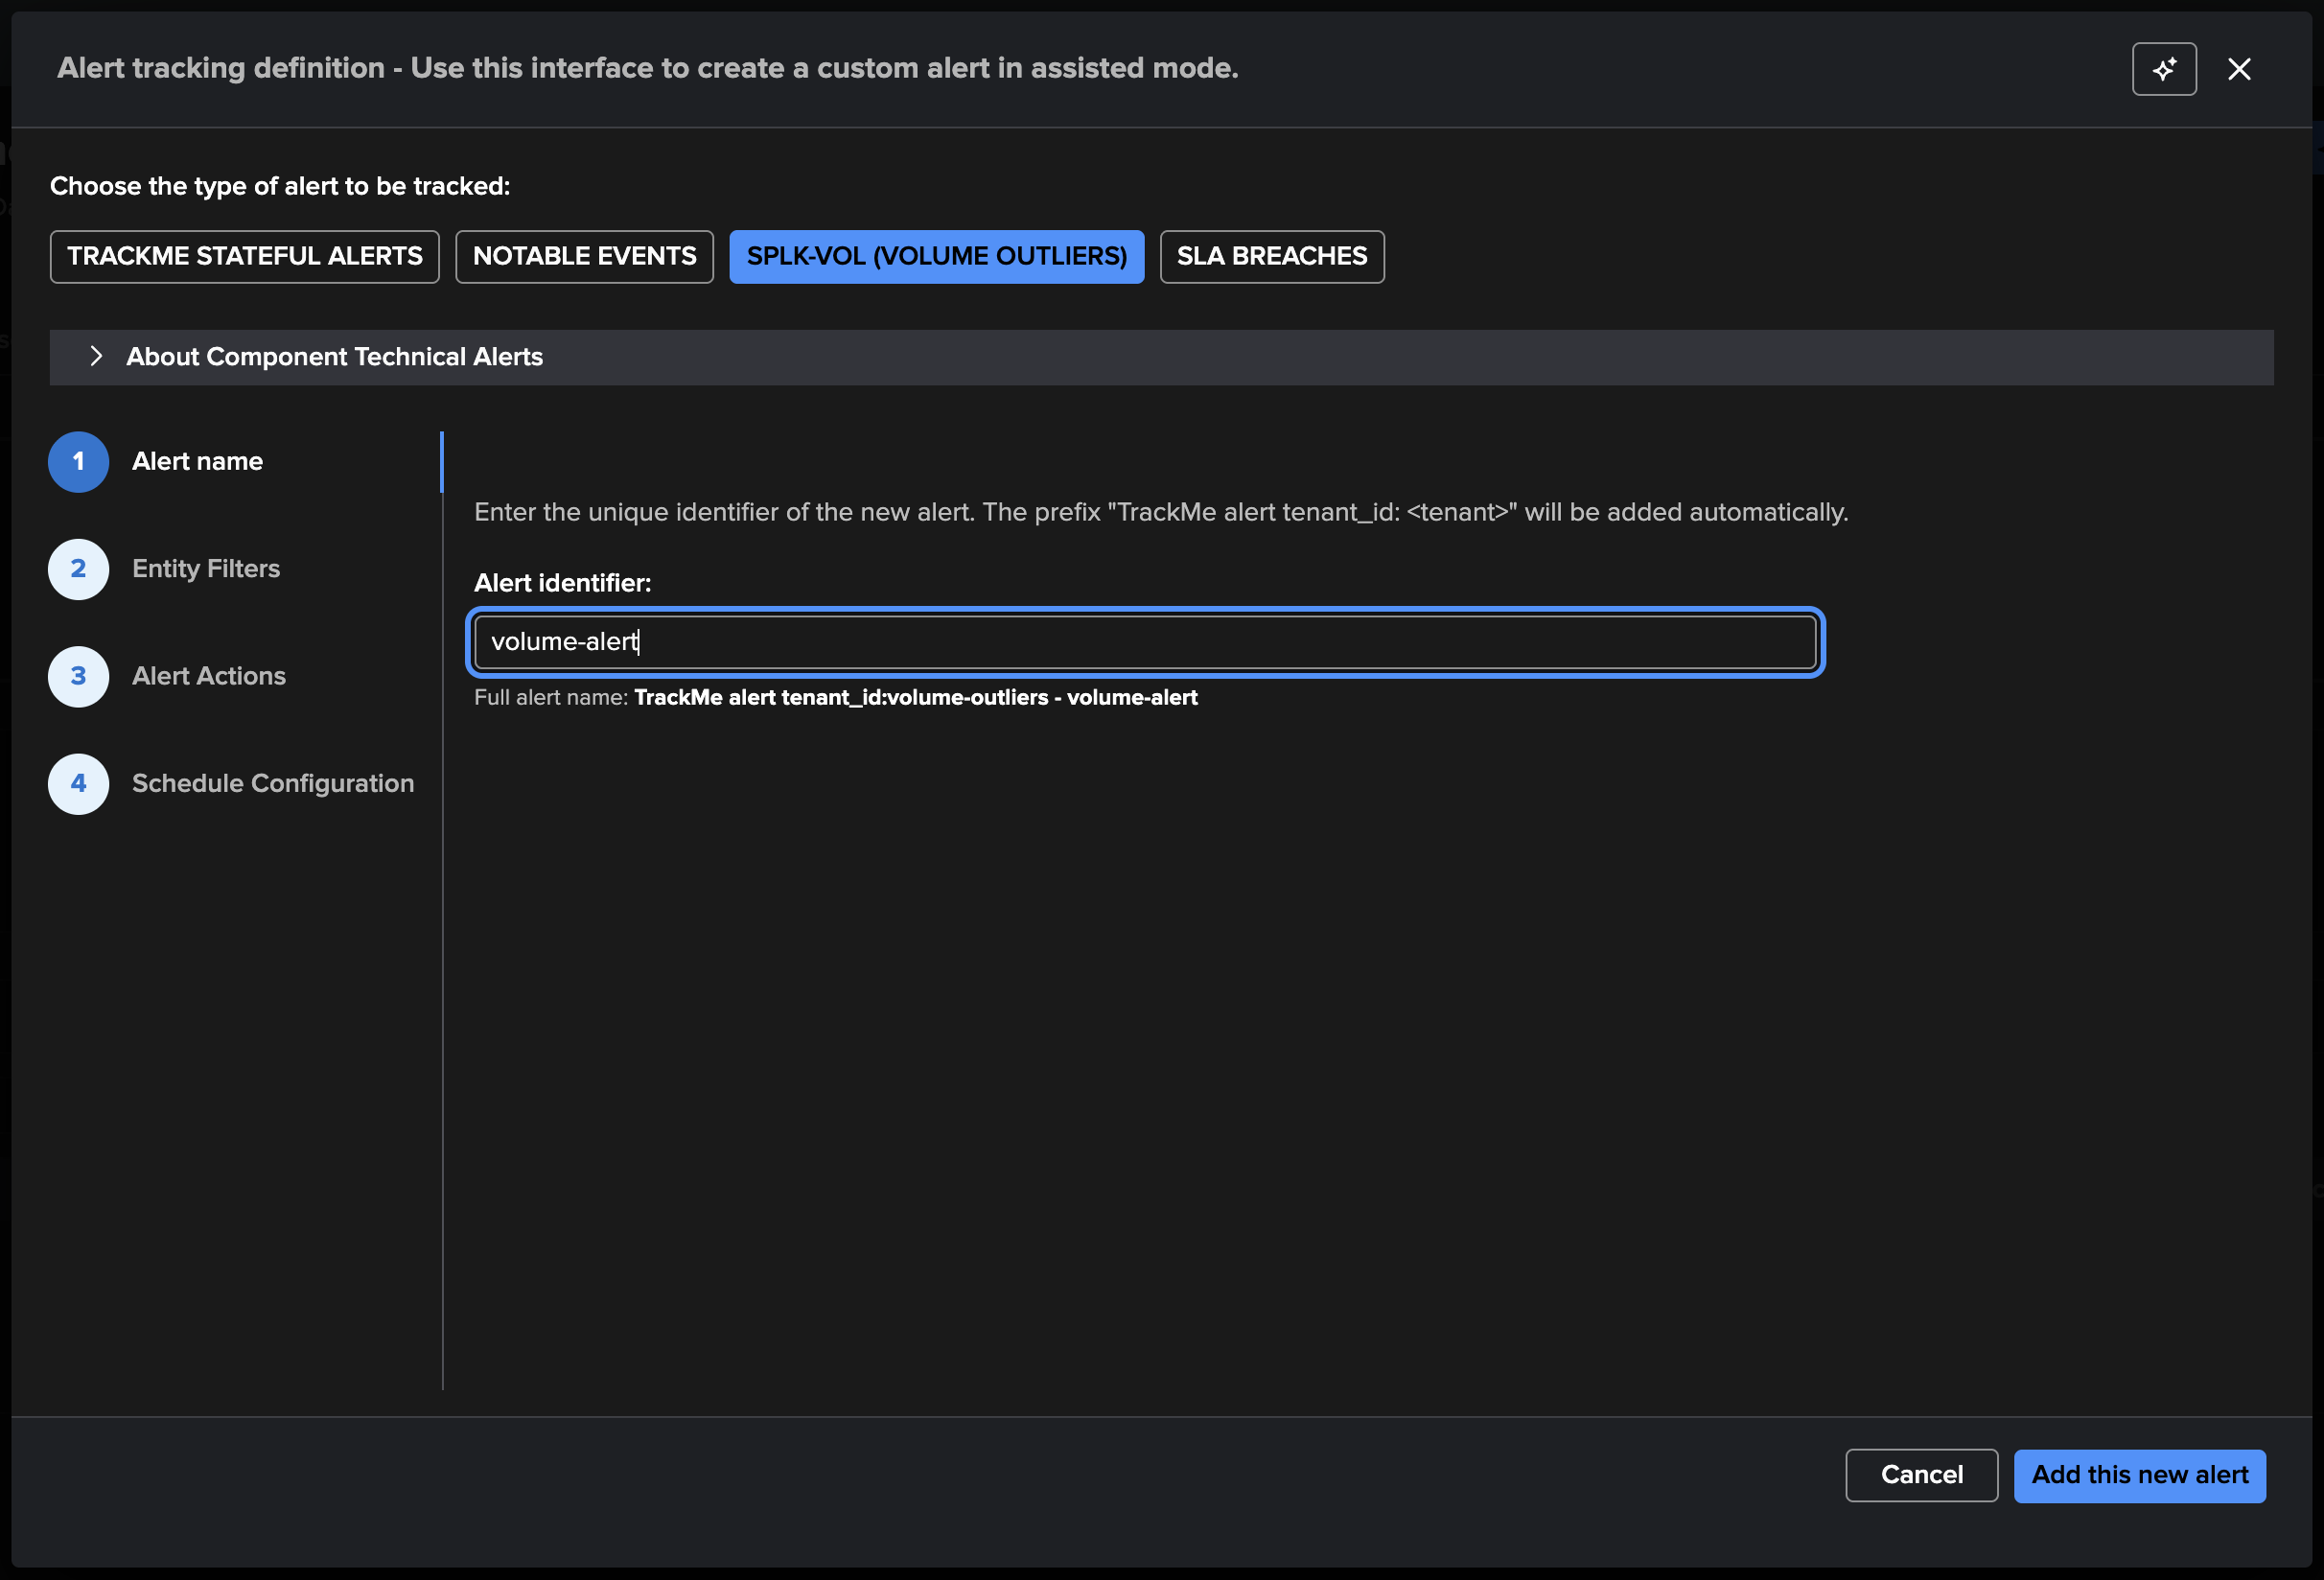
A Volume Outliers tenant alerts like any other: from the Tracking Alerts tab, create an
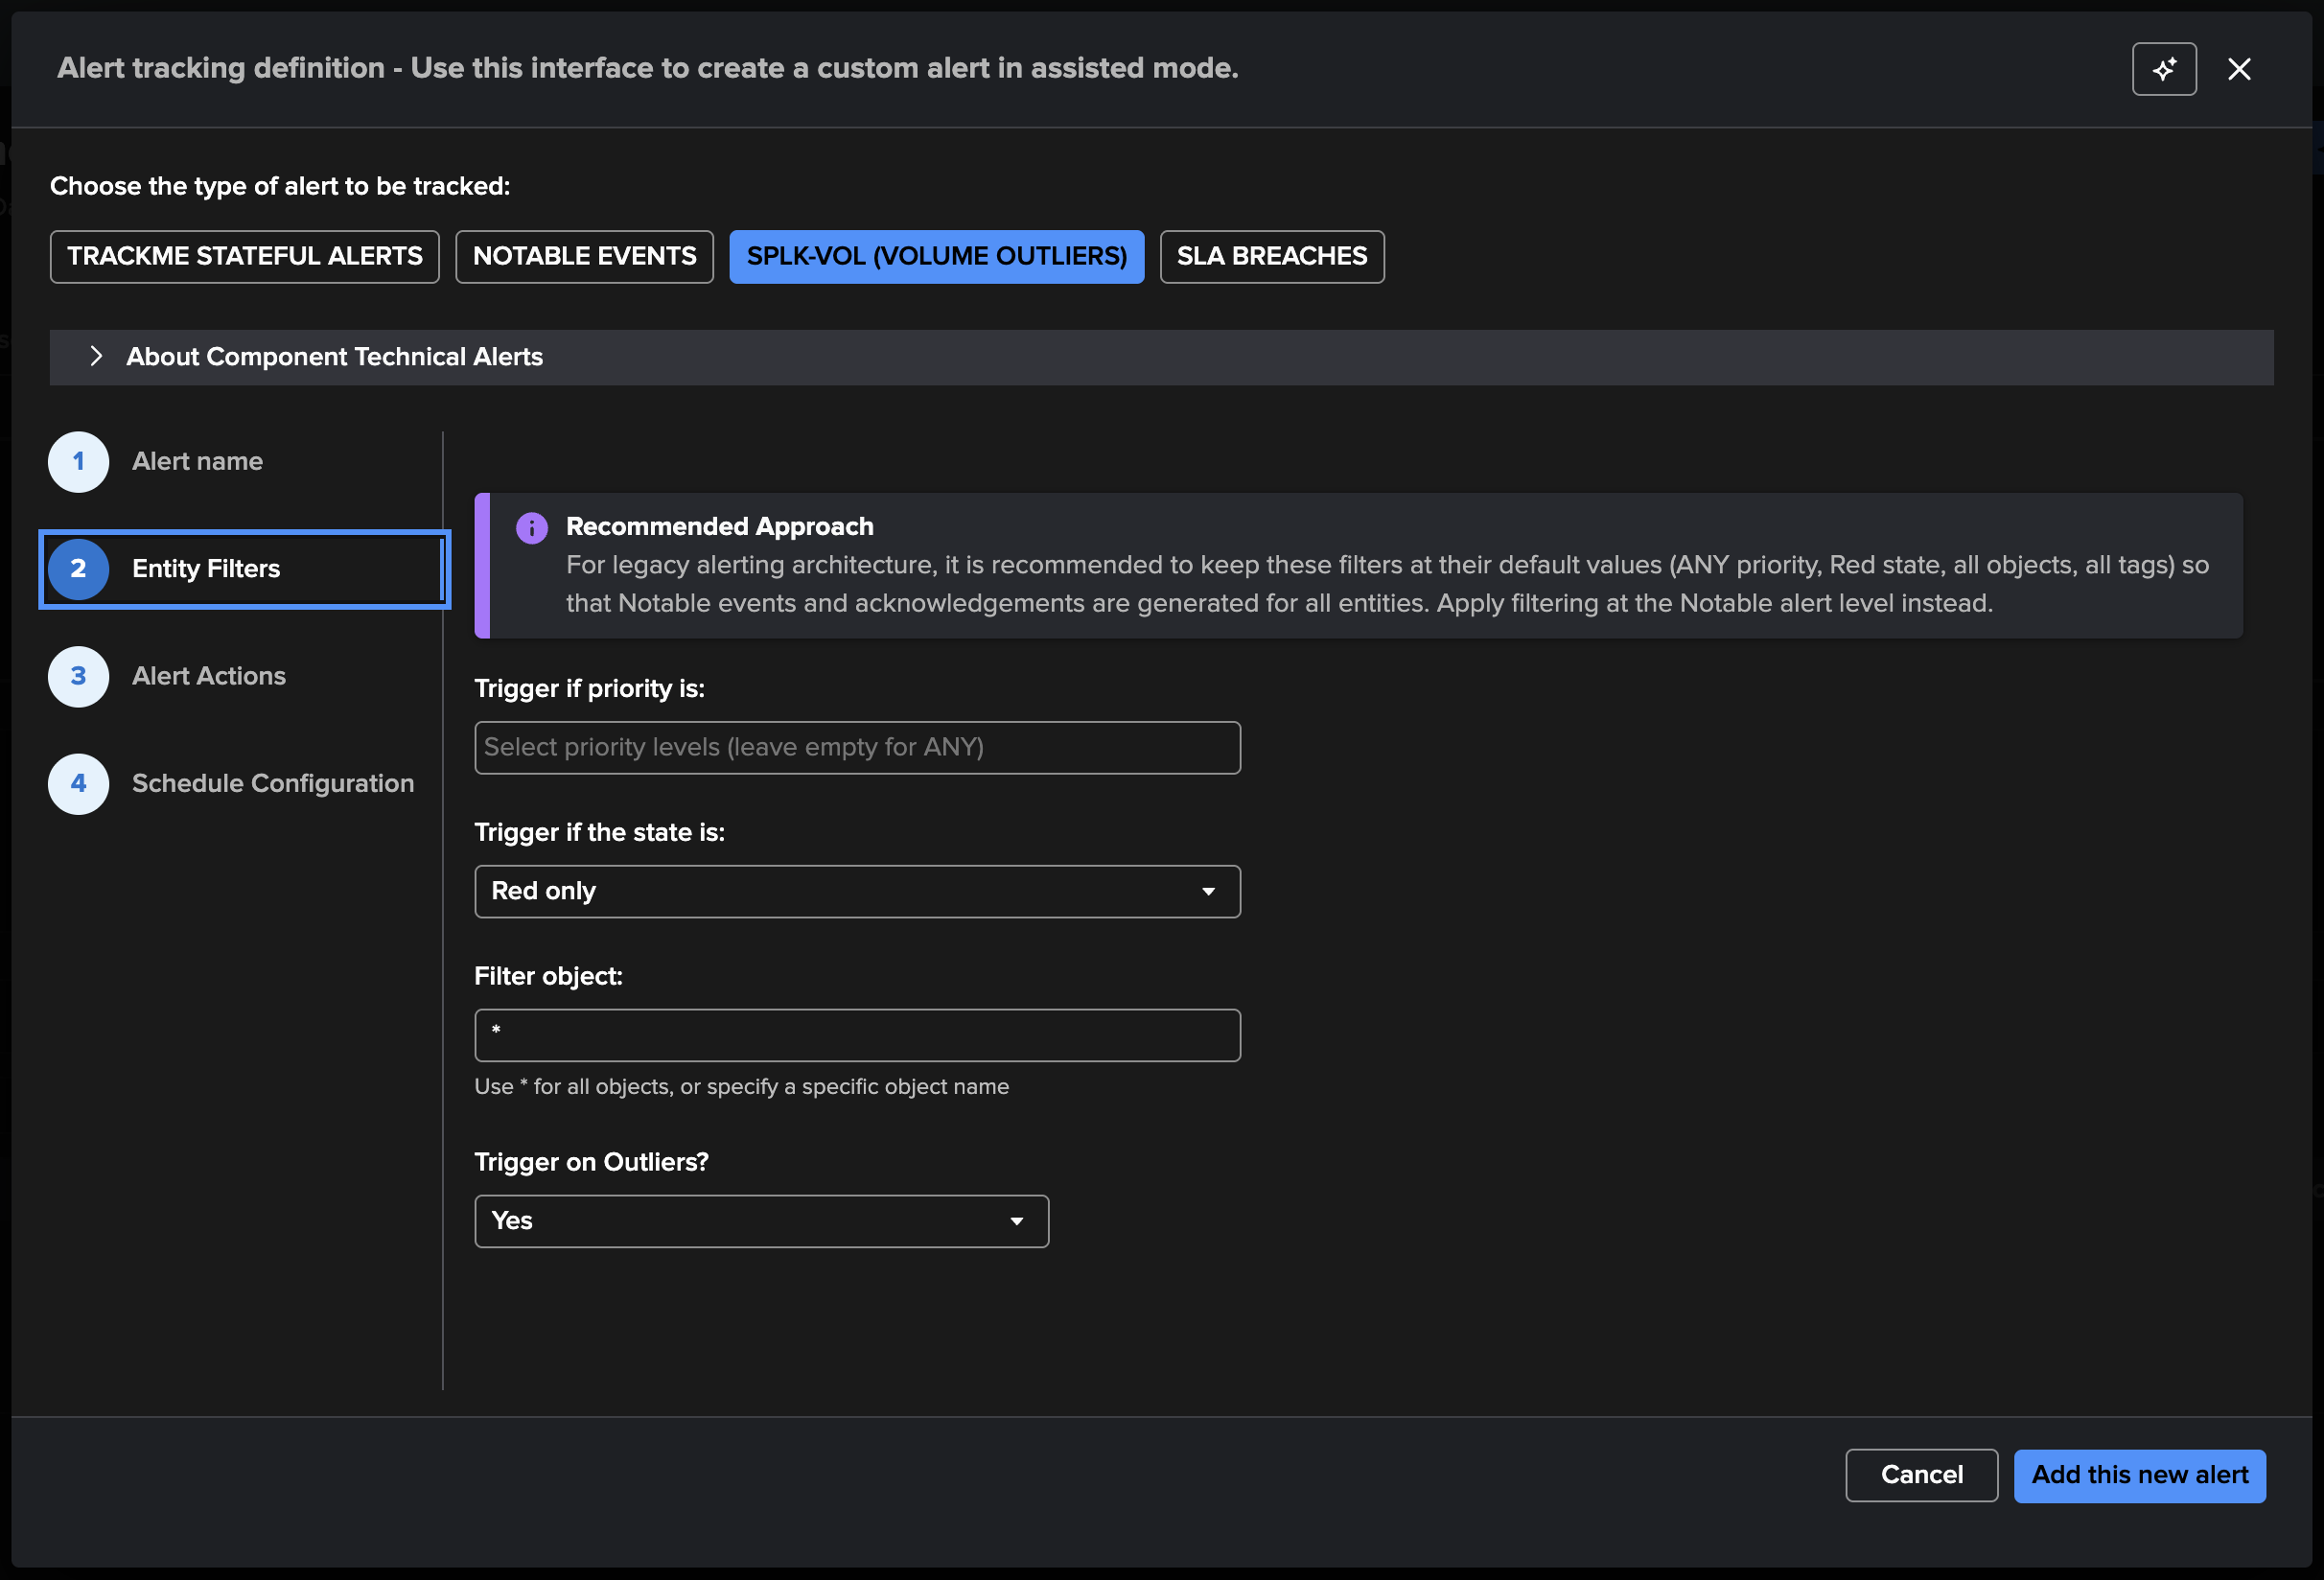
alert of type SPLK-VOL. The entity filters keep Trigger on Outliers on — the outliers
are the state of this component — and the same alert covers an index turning red for
inactivity. Keep the recommended pattern: the component alert generates the Notable
events (with auto-acknowledgment), and a Notable alert forwards them to your ticketing
or messaging tool; or send stateful alert emails directly, with the rolling volume
charts, the outliers chart and the daily licensed volume of the index embedded:
For the notifications themselves, a TrackMe stateful alert with the Emails and Ingest delivery mode: the email delivery account, the environment name stamped in the email header, the recipients, and the charts and AI status report options — the emails of a Volume Outliers entity embed its rolling volume, its outliers chart and its daily licensed volume:
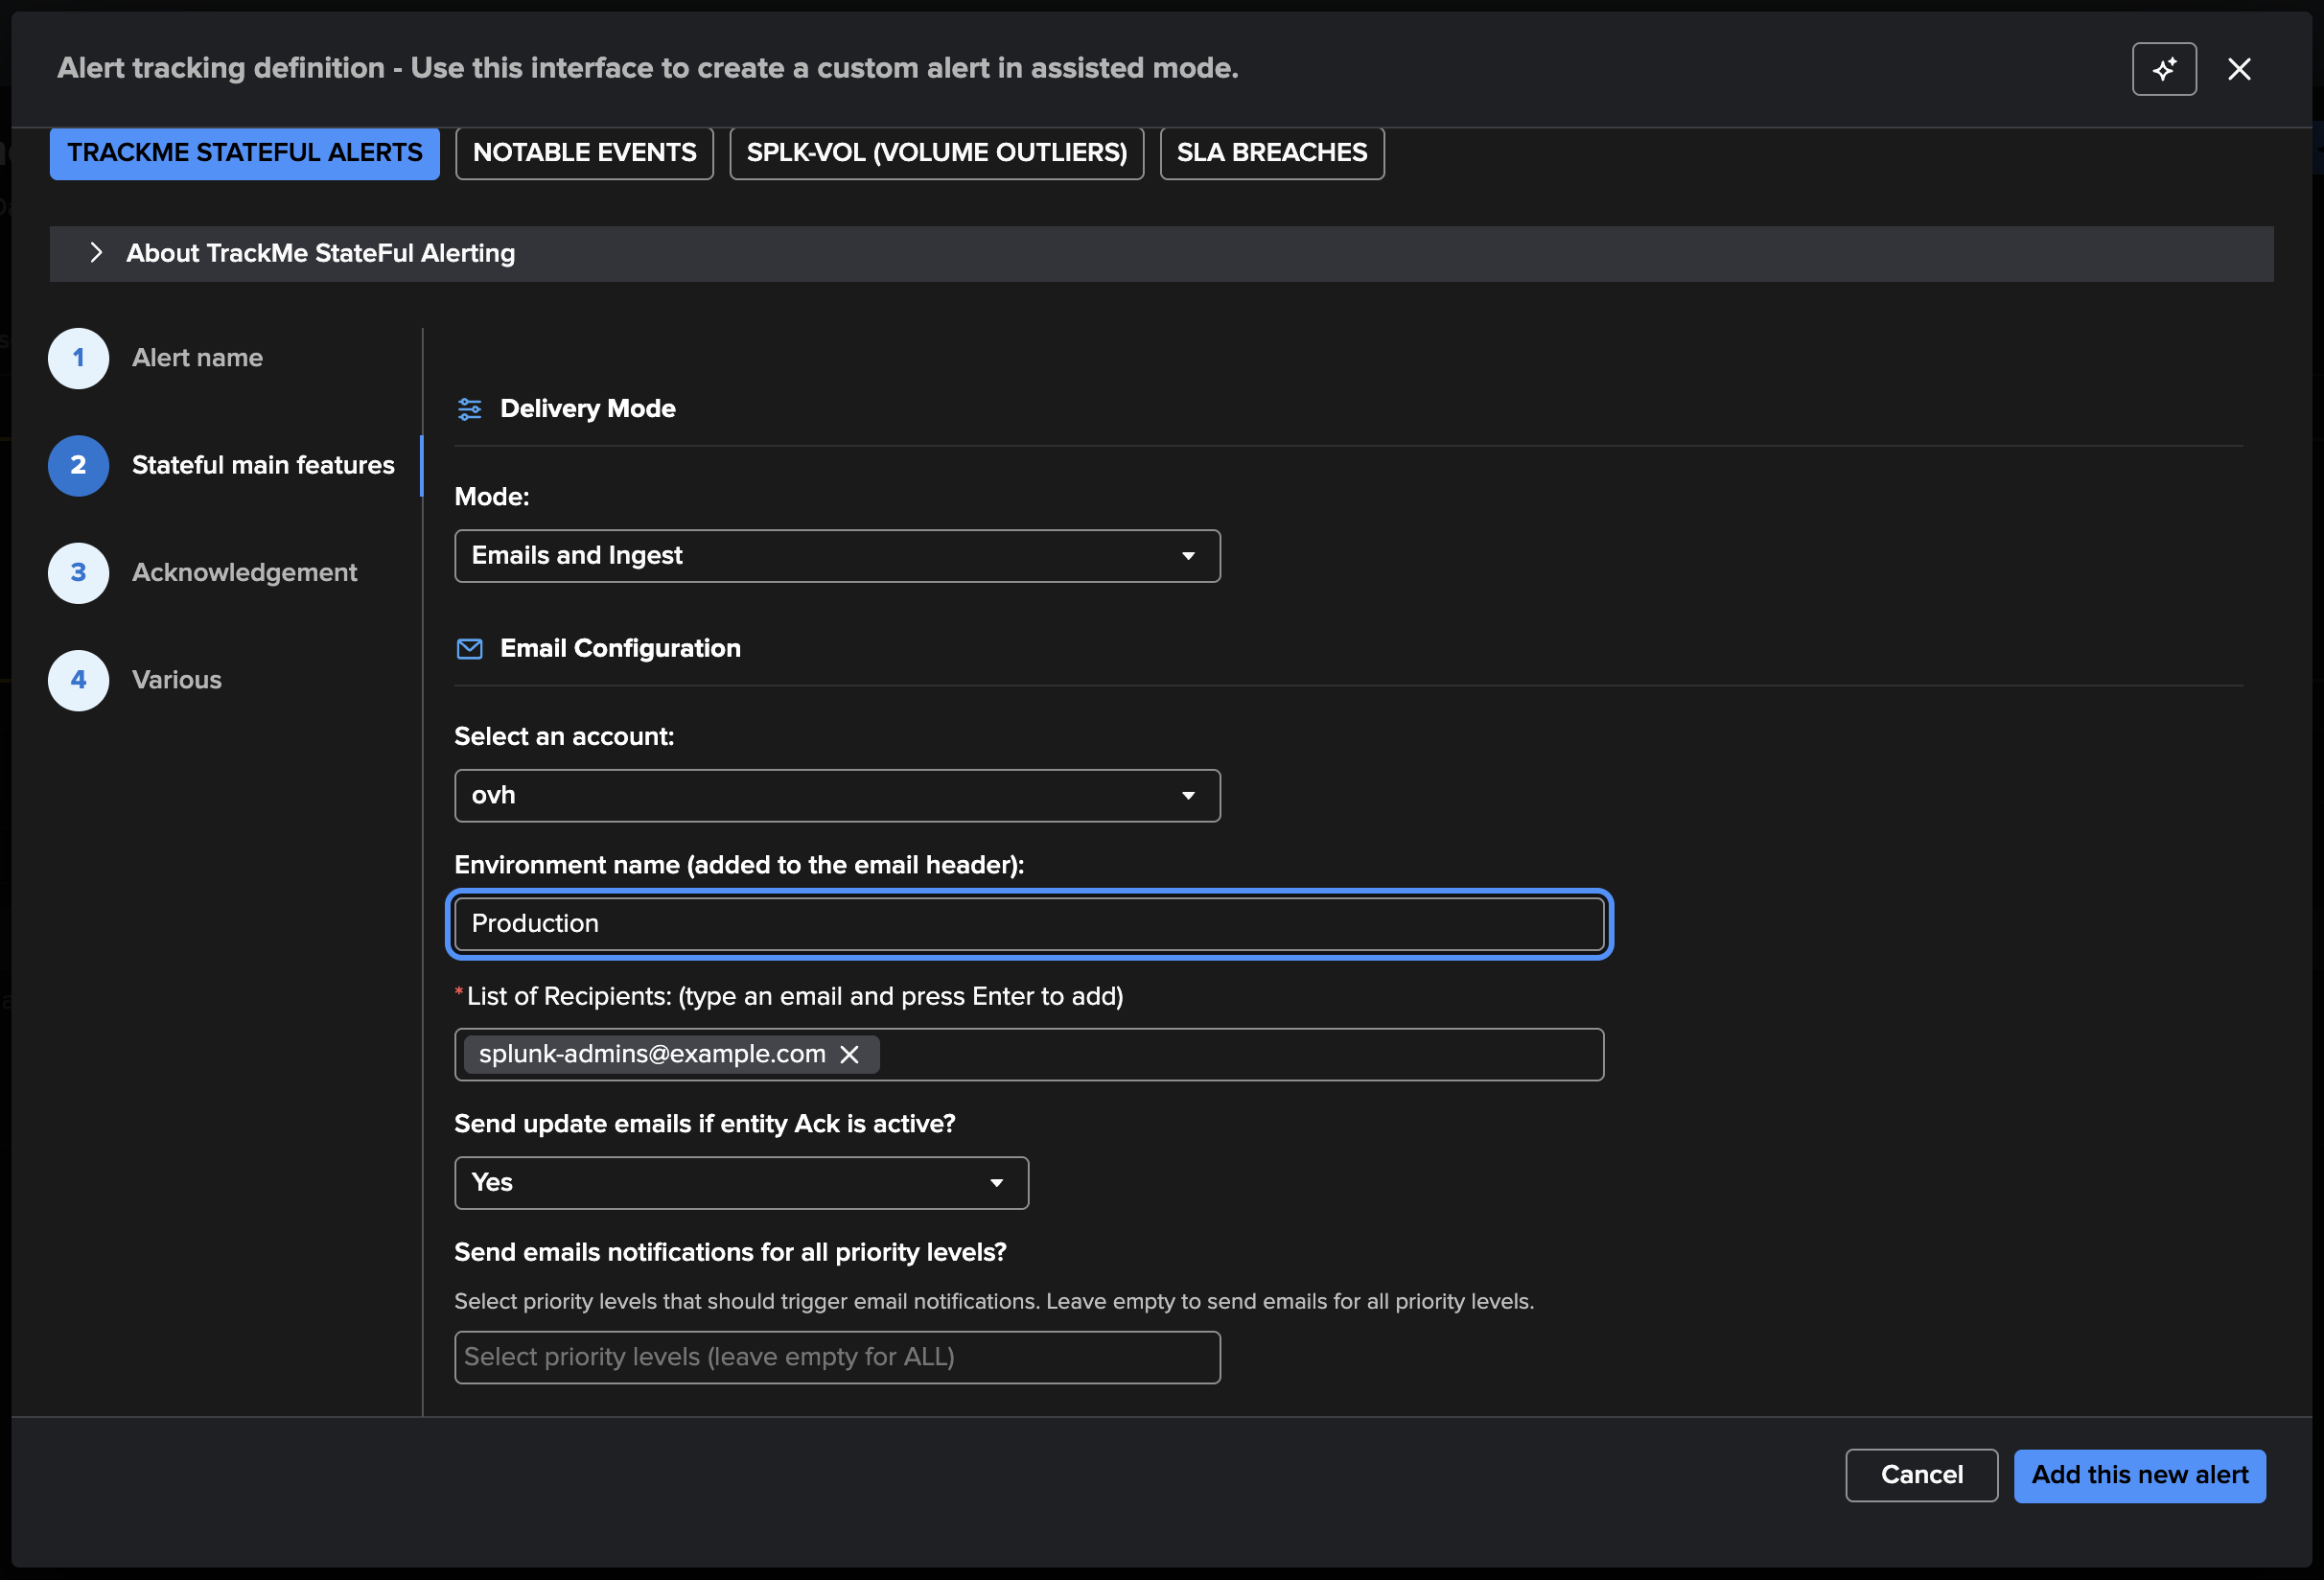
See Alerting — in depth for the alert types and the notification anatomy, and SLA alerting for a two-tier design.
Operating the tenant
Manage: volume collection — the live cursor and validated history, the license manager’s offset and the deployment type, run the tracker now, and the backfill with pause / resume / cancel / restart (a restart only extends the history backward; it never rewrites what was written).
Manage: Outliers default KPIs — the rolling KPIs a new index gets a model on, with an opt-in apply to the existing indexes (adds the models of newly selected KPIs, removes the models of deselected ones).
Manage: ML Outliers scope — on a VOL tenant it edits the VOL pair: the priorities and the filter expression (
object,priority,tags,labels,pool).Configure tenant — every
vol_*option; changing the target environment or the license search constraint re-seeds the collection from the new source and cancels an open backfill plan (restart it once the live collection runs on the new source).Time zones — the daily volumes follow the license manager’s license day, and the inactivity slots follow splunkd’s system time zone: your Splunk user’s time zone changes where a bar is drawn, never what it measures.
Cost and scale
Collection: one bounded search per tenant every five minutes reading only the new
Usageevents — on a large distributed deployment, about 76 thousand events per run where the previous Flex recipe read about 4.4 million (three appended scans over 24 h, 4 h and 60 min every five minutes).Metrics: 288 buckets × 5 measures per index per day, about 216 KB per index per day of metric-index licensing; the backfill writes the same series over the requested depth (the wizard shows the estimate).
ML: one model per index by default, trained and monitored on the standard schedules; the VOL scope (priorities, filter expression) limits the models where needed.
State: the rolling values come from the buckets TrackMe holds, not from
mstatsover its own series — a blocked metrics pipeline never reads as a drop.
VOL against the earlier recipes
VOL (2.4.18) |
Flex — license usage templates |
splk-dsm volume models |
|
|---|---|---|---|
Granularity |
One entity per index |
One entity per index |
One entity per index × sourcetype (× break-by) |
Source |
License usage log, incremental 5-minute buckets |
License usage log, three rolling scans every 5 minutes |
Event counts of each feed |
Setup |
One tenant, a few clicks, no template |
A Flex tenant + the templates per deployment type |
Part of the feeds tenant; exclusions to design |
History |
Backfilled at creation |
Accumulates from the deployment |
Accumulates from the discovery |
Direction per entity |
Drops / spikes / both, one click |
Model bounds, per model |
Model bounds, per model |
Silent index |
Inactivity policy (by day and hour) |
Not covered |
Feed inactivity (delay) |
Analytics |
Daily volume, trend, projection, Global license usage: scopes, working days, days over quota, costs and chargeback |
The template’s KPIs |
Event counts |
Edition |
Foundation, Enterprise, Unlimited |
Enterprise, Unlimited |
All |
The Flex templates remain in the library for custom needs — a different grain, custom KPIs, a source other than the license usage log — and the splk-dsm models remain the right tool for per-feed event-count behaviour: a sourcetype dropping inside an index whose total volume holds. The two are complementary to VOL, not replaced by it.
See also
VOL — Volume Outliers and Volume Outliers — in depth — the product guide.
Use TrackMe to detect abnormal events count drop in Splunk feeds — the earlier recipes, per feed and with Flex.
Analyse log messages logging level to detect behaviour anomalies using TrackMe’s Flex Object and Machine Learning Anomaly Detection — behavioural detection on log levels.
Outlier detection and Outlier detection — in depth — the outliers engine.
AI ML Advisor — the AI ML Advisor, which reviews VOL models like any other.