Volume Outliers
Licensed volume per index as entities: rolling volume, daily licensed volume and month projection, ML outliers on drops and spikes, and the ML Advisor.
about 30 minutes · 37 slides. Each slide is followed by a description of what it shows — read top to bottom, this page is the walkthrough.
Overview
Volume Outliers (VOL) is the seventh TrackMe component, introduced in 2.4.18: the standardised, first-class form of the volume detection TrackMe has always offered. One tenant watches every index of a deployment for abnormal drops, spikes and silence, backfills its history at creation, and adds a cost trend, a month projection and the whole environment’s license usage. Parts 1 to 3 were captured on TrackMe 2.4.18, from an empty tenant on a Splunk Enterprise deployment with 43 indexes in one license pool; the license usage view of Part 4 on TrackMe 2.4.19.
The path runs from the tenant creation and the backfill, through reading the results and tuning the detection, to the global license usage view from scopes to chargeback, alerting, the AI Assistant and an AI ML Advisor review of a volume model.
Why volume needs its own signal
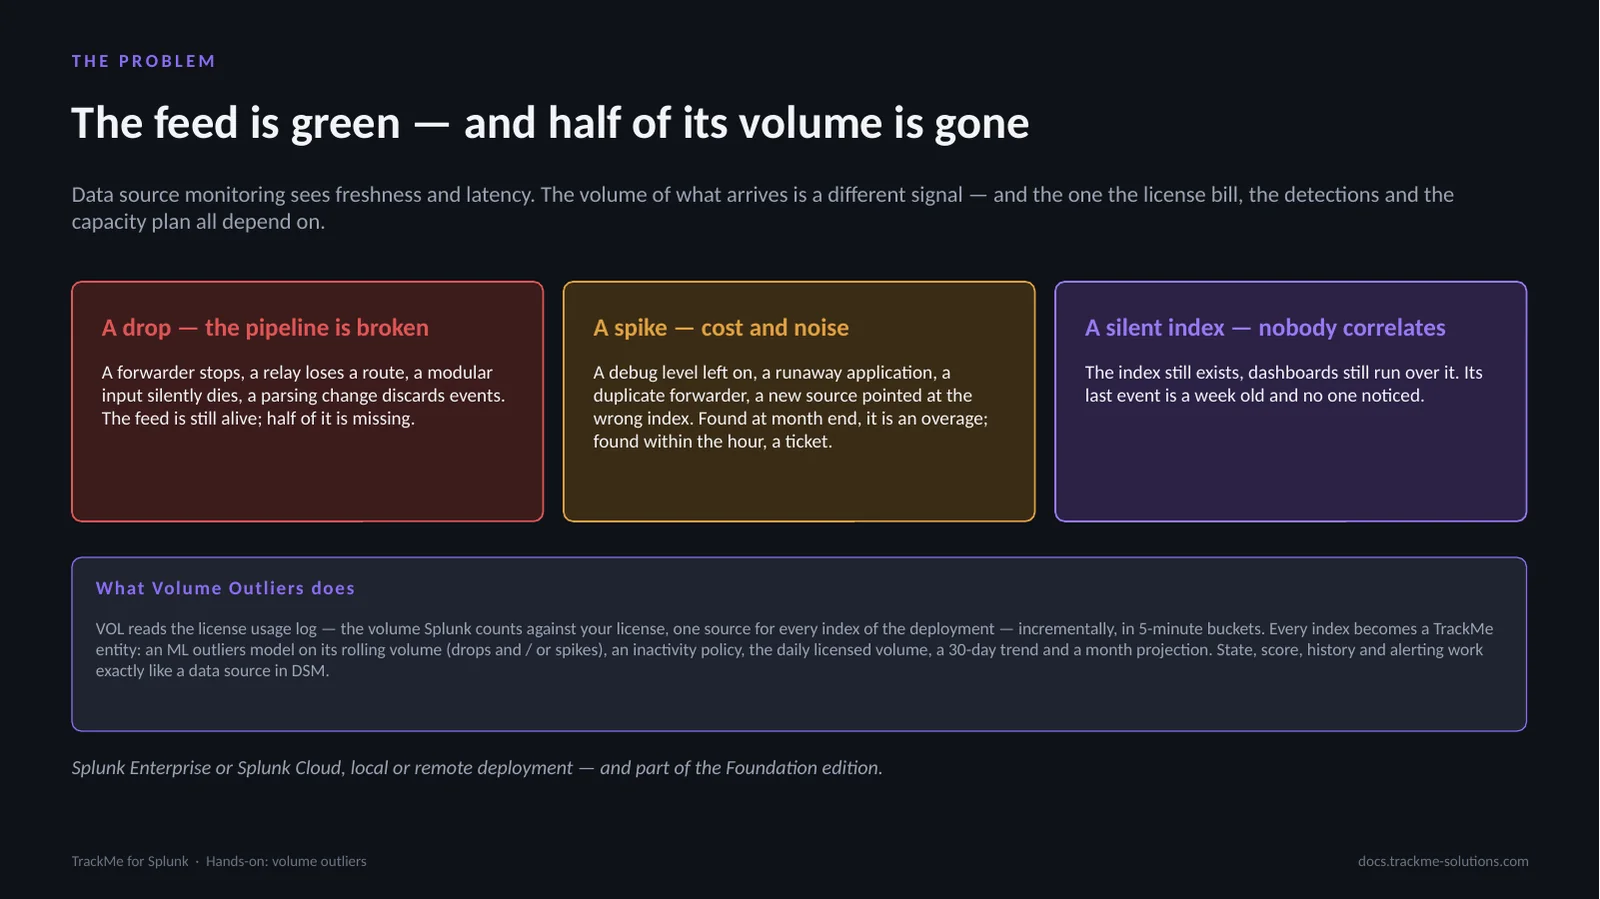
Availability monitoring answers whether data arrives on time, not whether the amount is normal. A broken forwarder, a lost route or a parser change leaves the feed green while half of the data is missing; a debug level left on is an overage at month end; a silent index still exists while its last event is a week old.
VOL watches the volume itself, from the license usage log Splunk bills, read incrementally in 5-minute buckets. Every index becomes a TrackMe entity with an ML outliers model on its rolling volume, an inactivity policy, the daily licensed volume, a 30-day trend and a month projection, on Enterprise or Cloud, in the Foundation edition.
Source, tracker, KPIs, detection, action
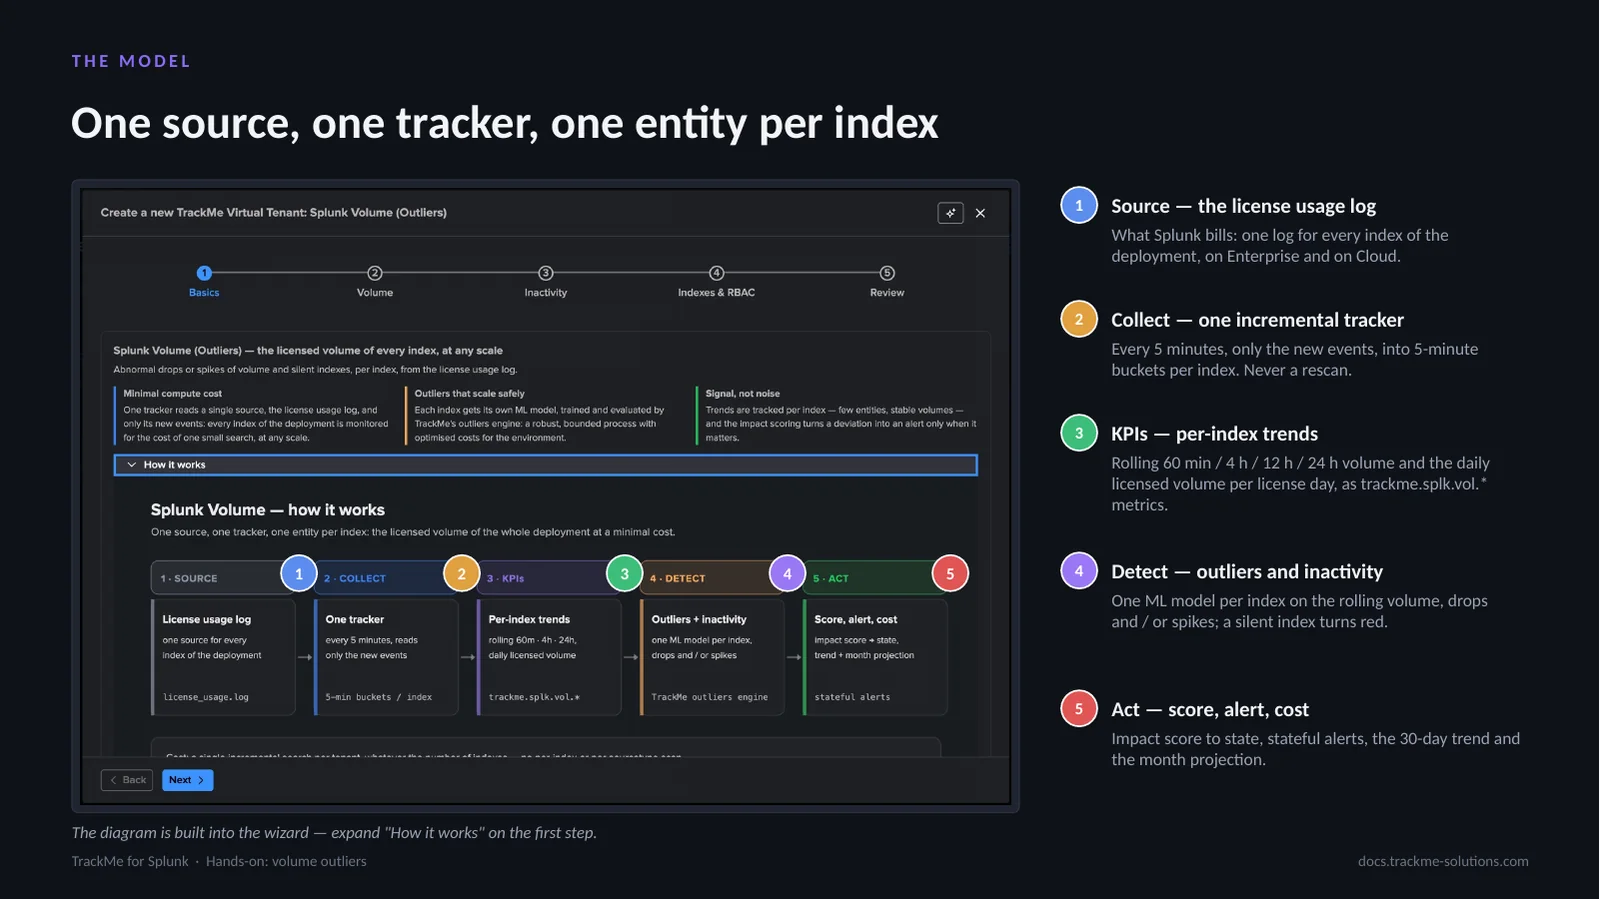
Callouts 1 to 5 follow the pipeline. The source is the license usage log: what Splunk bills, one log for every index, on Enterprise and on Cloud. One incremental tracker collects every 5 minutes, only the new events, into 5-minute buckets per index, never rescanning. The KPIs are per-index trends: rolling 60 min, 4 h, 12 h and 24 h volume and the daily licensed volume, as trackme.splk.vol.* metrics.
Detection runs one ML model per index on the rolling volume, drops and / or spikes, and a silent index turns red. Action is the impact score to state, stateful alerts, the 30-day trend and the month projection. The same diagram sits under How it works in the wizard.
The four parts
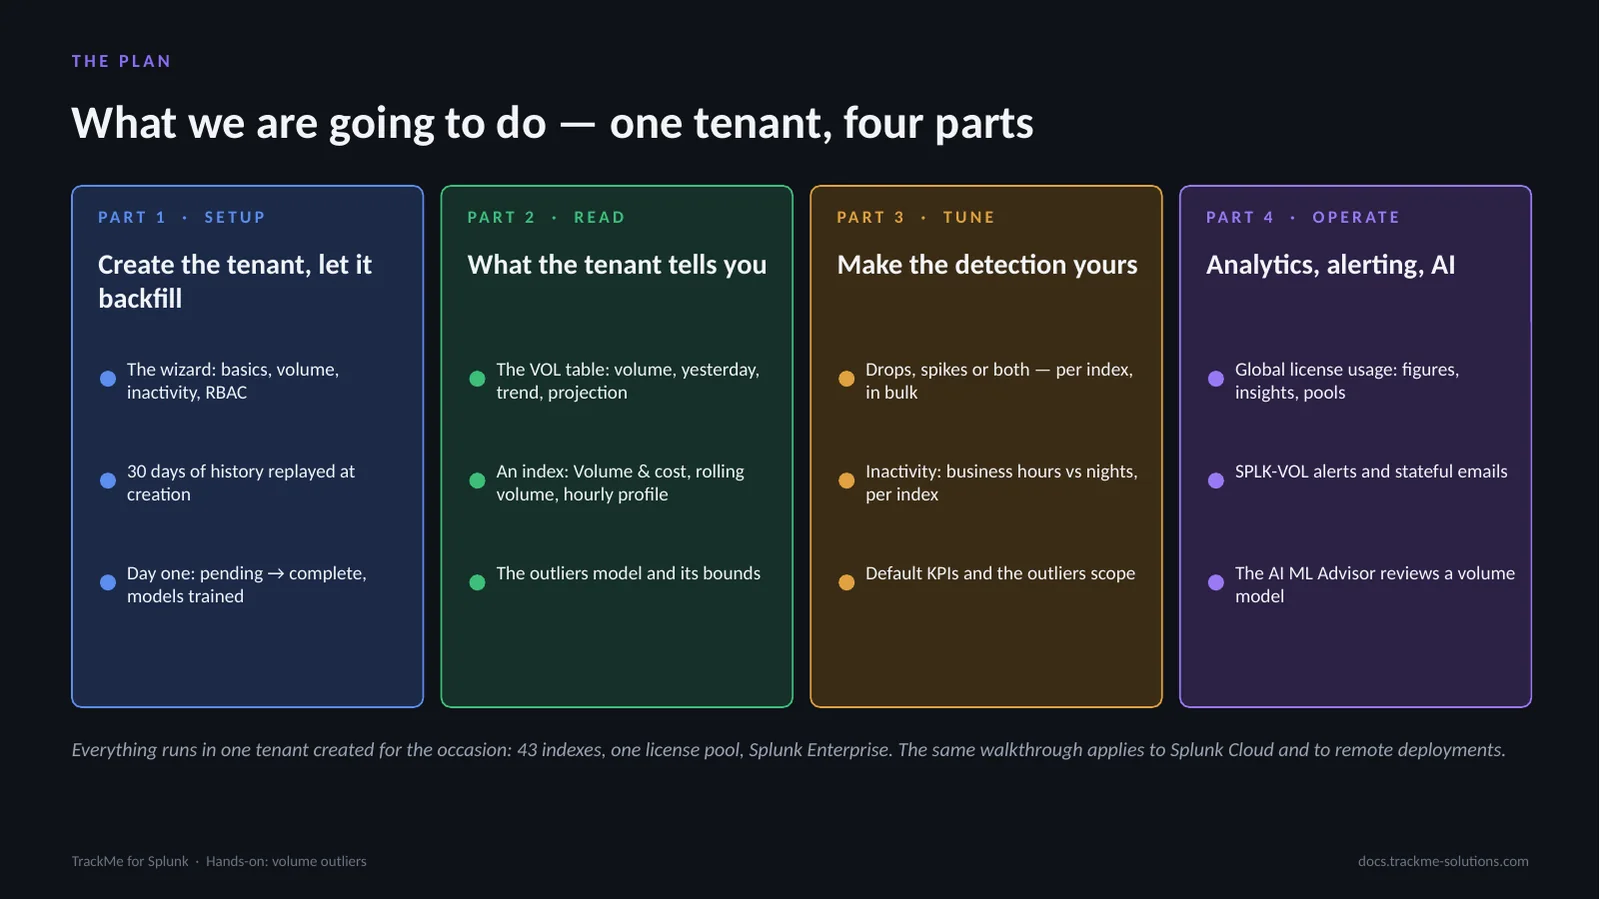
One Virtual Tenant covers the whole deployment. Part 1, Setup, creates the tenant through the wizard (basics, volume, inactivity, RBAC), replays 30 days of history at creation, and follows day one from pending to complete. Part 2, Read, covers the VOL table (volume, yesterday, trend, projection), an index with its Volume & cost tab, rolling volume and hourly profile, and the outliers model with its bounds.
Part 3, Tune, sets drops, spikes or both per index and in bulk, the inactivity policy for business hours versus nights, and the default KPIs and outliers scope. Part 4, Operate, covers the global license usage view (scopes, working days, days over quota, costs and chargeback), SPLK-VOL alerts with stateful emails, the AI Assistant and the AI ML Advisor review of a volume model.
Choosing the Volume tenant type
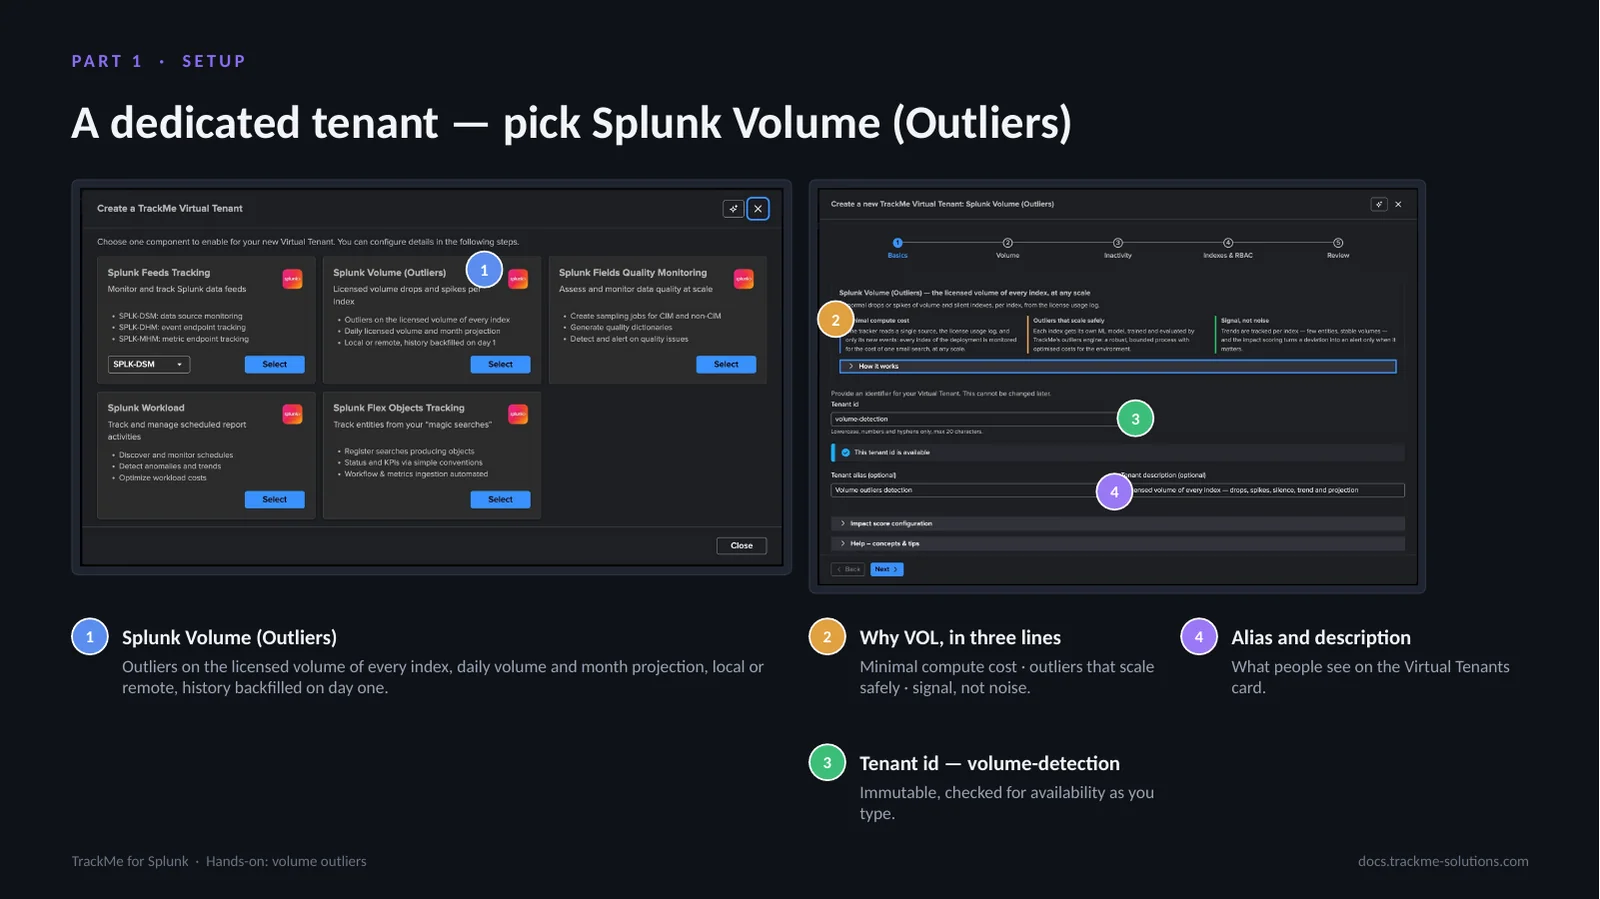
The tenant chooser opens from Virtual Tenants, Actions, Create a tracking tenant, and the Splunk Volume (Outliers) card sits second in it (callout 1). The wizard has five steps: basics, volume, inactivity, indexes & RBAC, review. The first step recalls the three arguments of the component (callout 2), minimal compute cost, outliers that scale safely, signal rather than noise, and what VOL provides: outliers on the licensed volume of every index, daily volume and month projection, local or remote, history backfilled on day one.
The tenant id (callout 3) is immutable, checked for availability as it is typed, twenty characters at most; volume-detection is used here. The alias and description (callout 4) appear on the Virtual Tenants card.
The Volume step and its defaults
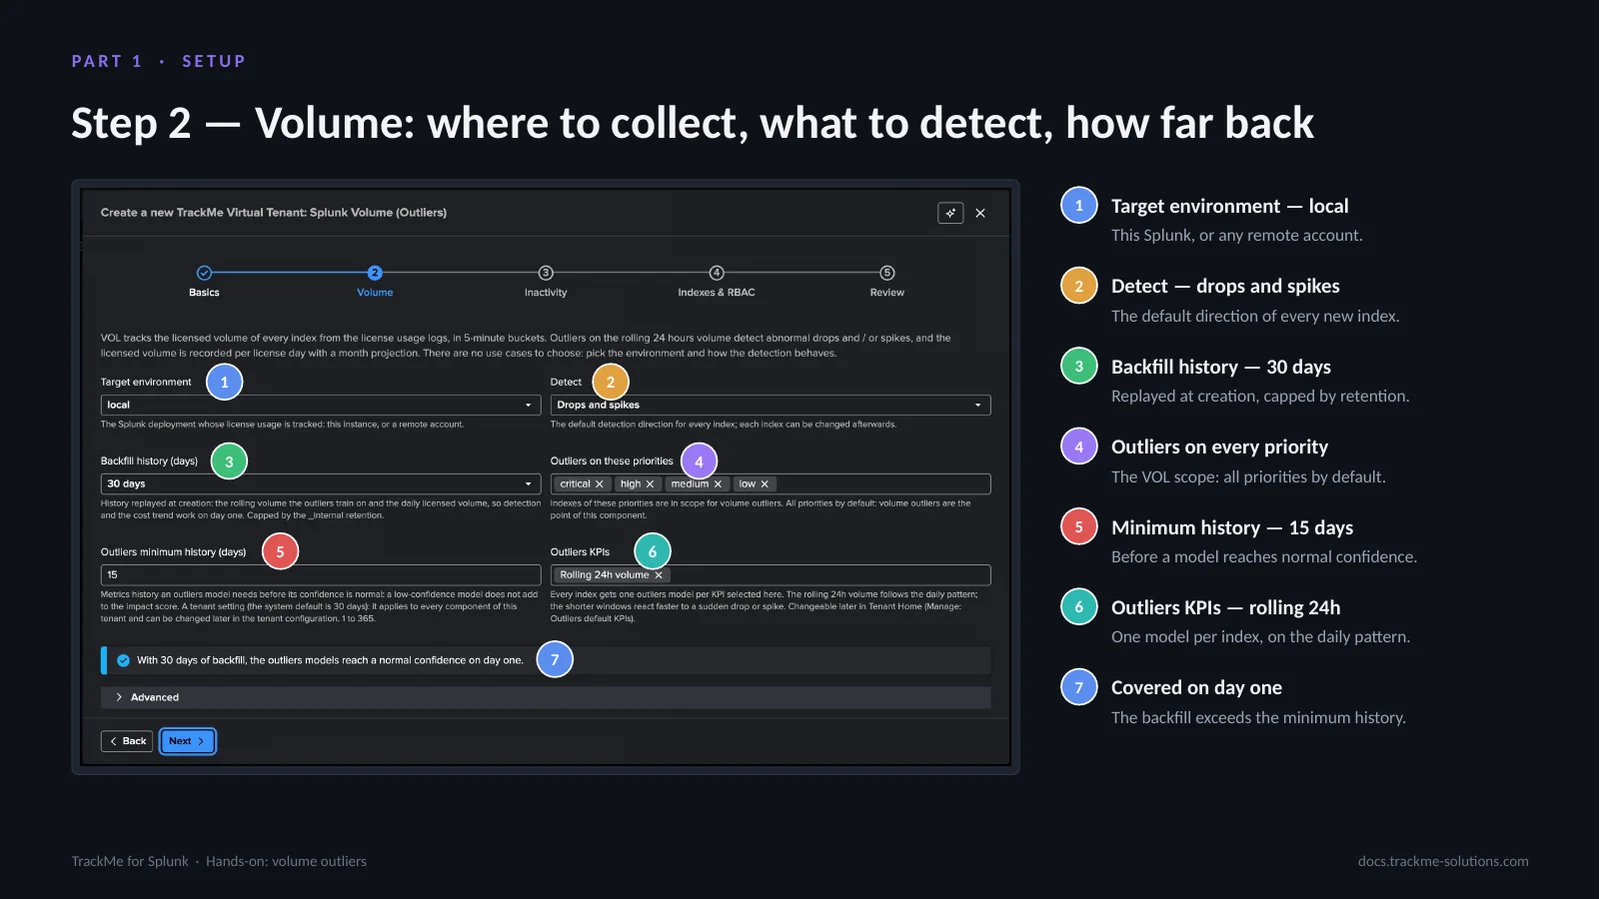
The Volume step is the whole configuration and its defaults are the recommended values. Target environment (callout 1) is this Splunk or any remote account configured in TrackMe. Detect (callout 2) sets the default direction of every new index, drops and spikes, changed per index later. Backfill history (callout 3) is 30 days replayed at creation, capped by the retention of the license usage log.
The outliers scope (callout 4) covers every priority by default, because volume outliers are the point of this component. Minimum history (callout 5) is 15 days before a model reaches normal confidence; the notice (callout 7) confirms the backfill covers it. The default outliers KPI (callout 6) is the rolling 24h volume.
Settle margin and license search constraint
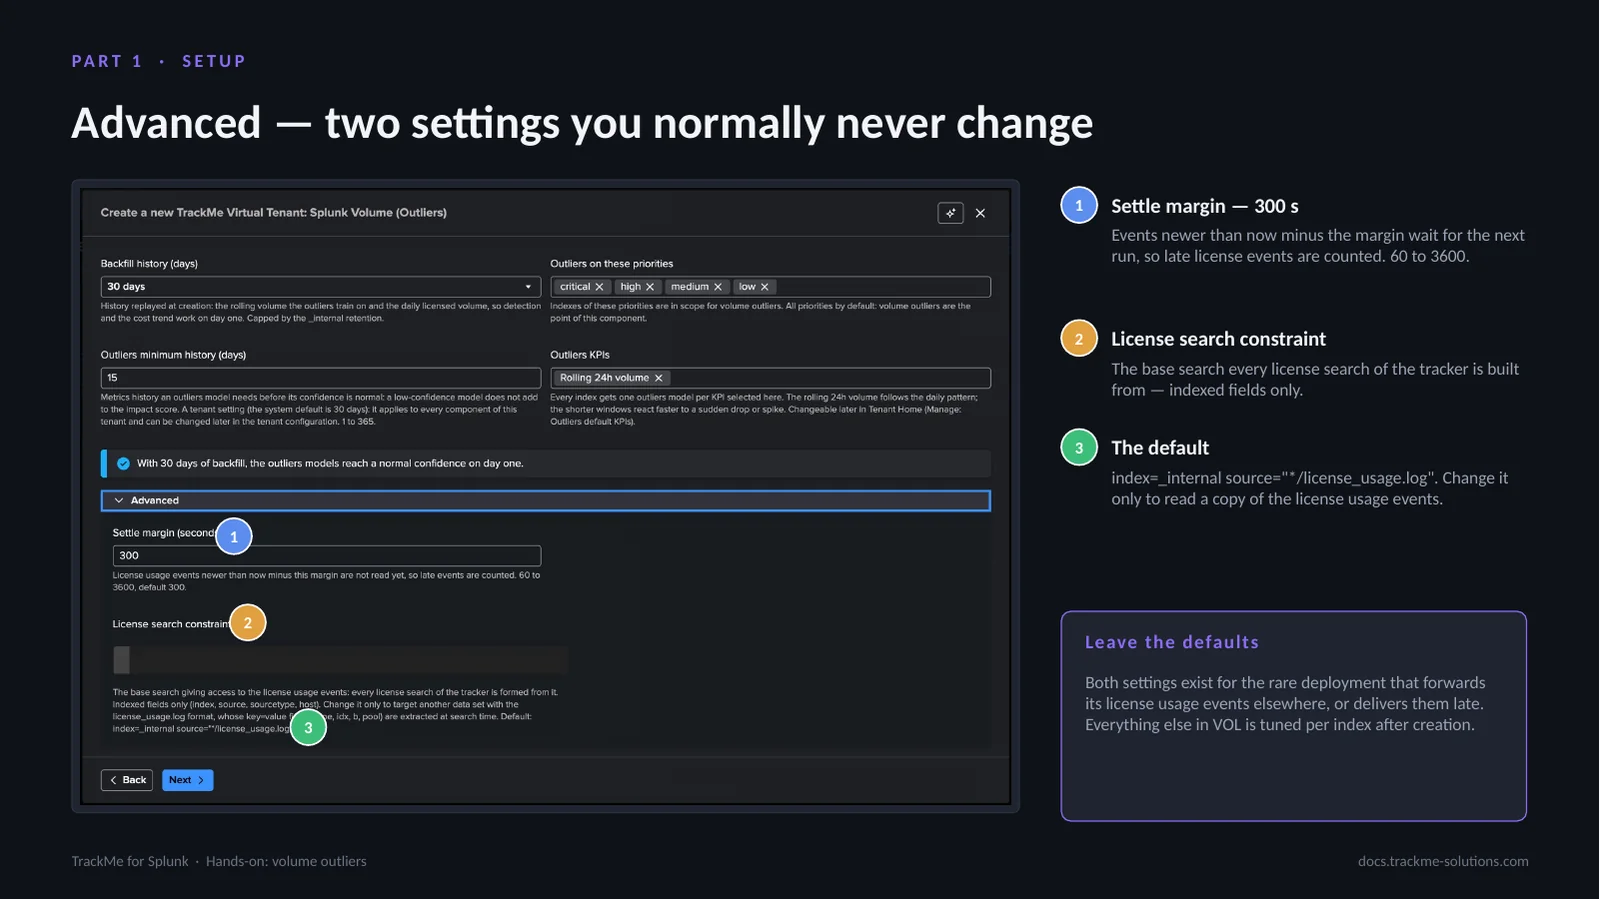
Expanding Advanced reveals two technical settings that normally stay at their defaults. The settle margin (callout 1), 300 s by default and adjustable from 60 to 3600, keeps the tracker behind the newest license events: events newer than now minus the margin wait for the next run, so late license events are still counted in their bucket.
The license search constraint (callout 2) is the base search every license search of the tracker is built from, indexed fields only. The default (callout 3) is index=_internal source=”*/license_usage.log”; it changes only to read a copy of the license usage events. Both exist for the rare deployment that forwards its license usage events elsewhere or delivers them late.
The inactivity policy by day and hour
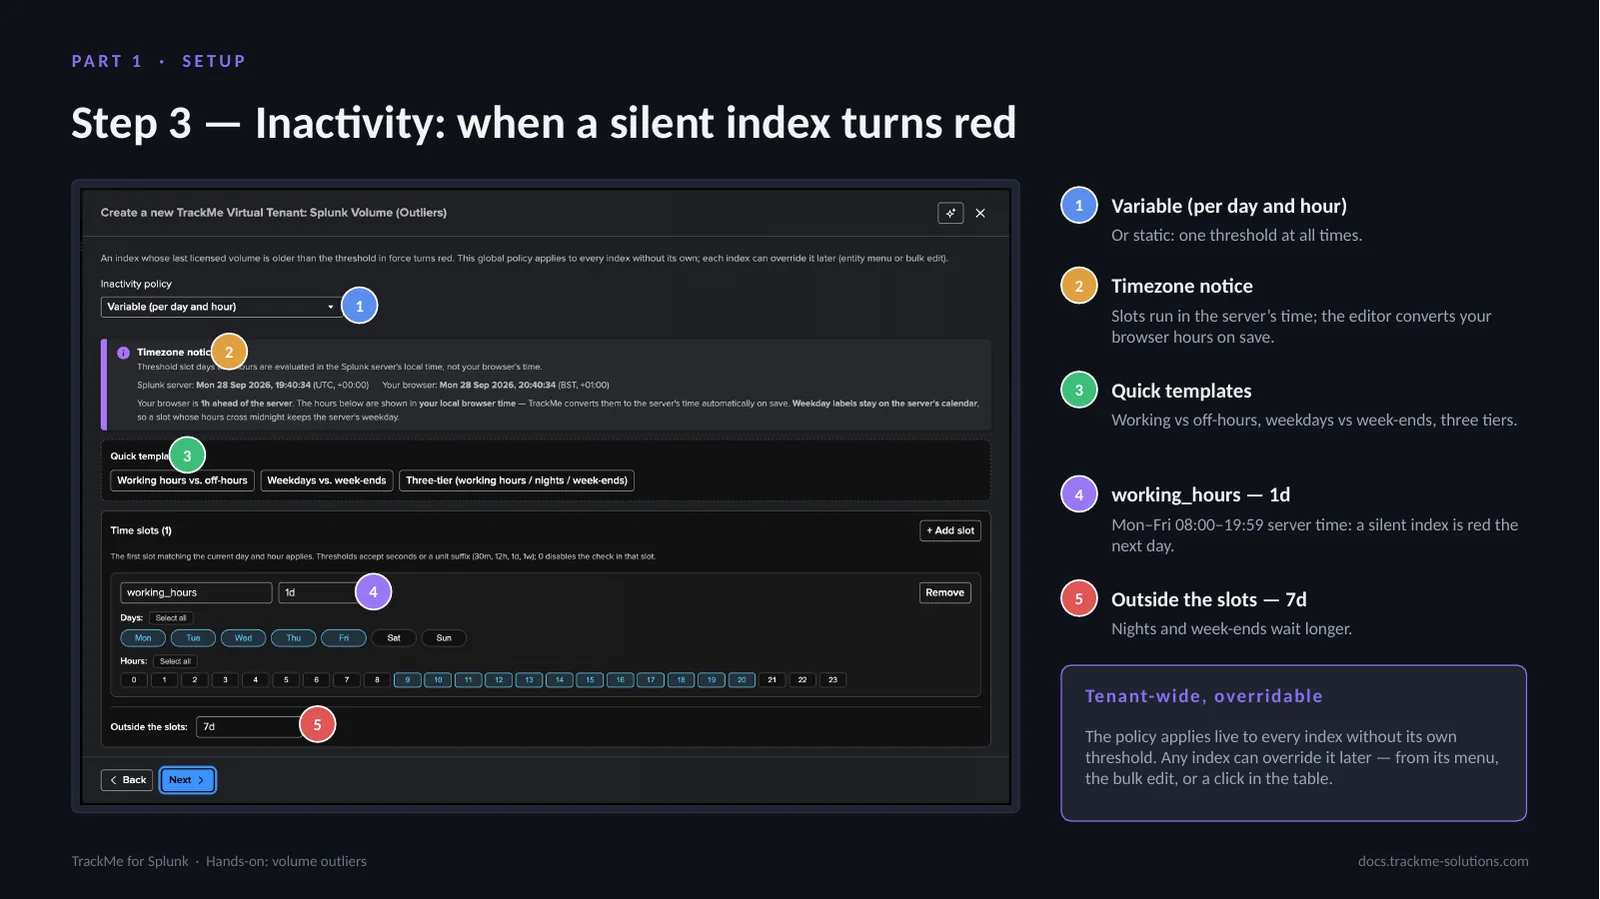
Inactivity is the second detection: after how long without licensed volume an index turns red. The policy is variable by day and hour (callout 1), or static with one threshold. The timezone notice (callout 2) shows the server and browser clocks side by side: slots run in the server’s time and the editor converts browser hours on save. Quick templates (callout 3) cover working versus off-hours, weekdays versus week-ends and three tiers.
The default working_hours slot (callout 4), Monday to Friday 08:00 to 19:59 server time, uses 1d: a silent index is red the next day. Outside the slots (callout 5) the threshold is 7d. The policy applies live to every index without its own threshold.
Indexes, RBAC and creation
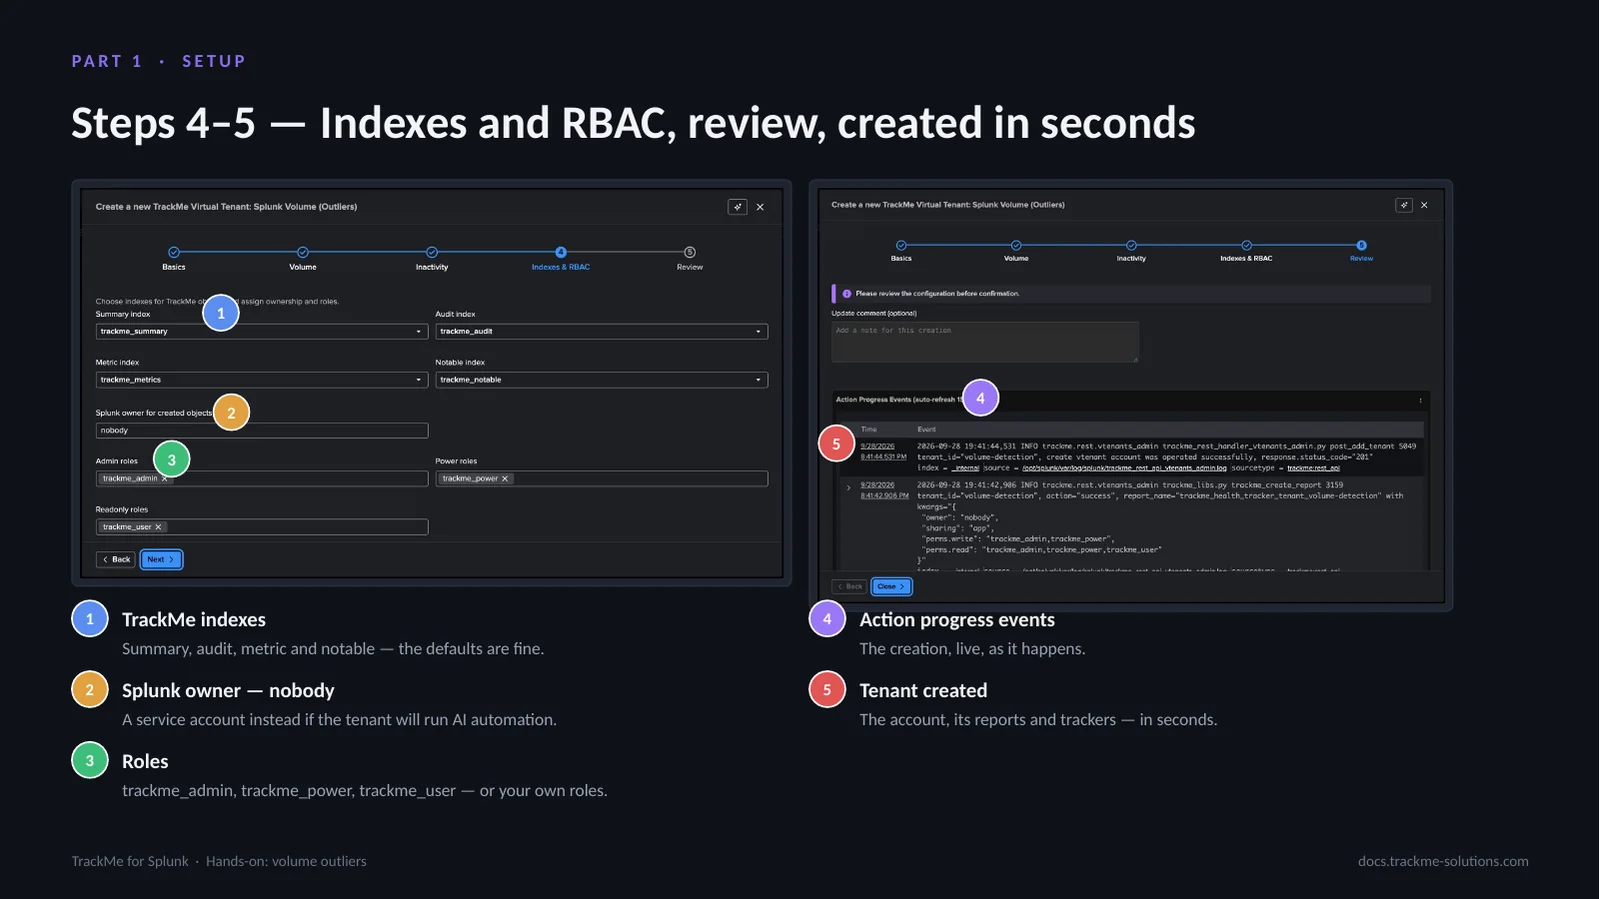
The last two steps are shared by every tenant type. Indexes & RBAC sets the TrackMe indexes (callout 1): summary, audit, metric and notable, where the defaults are fine. The Splunk owner (callout 2) is nobody by default; a service account is the better choice if the tenant will run AI automation. Roles (callout 3) default to trackme_admin, trackme_power and trackme_user, or any custom roles.
The review step is followed by Done, and the action progress events (callout 4) show the creation live as it happens: the tenant account, its reports and its trackers are created in seconds (callout 5), and the first collection runs straight away.
First collection and the pending backfill
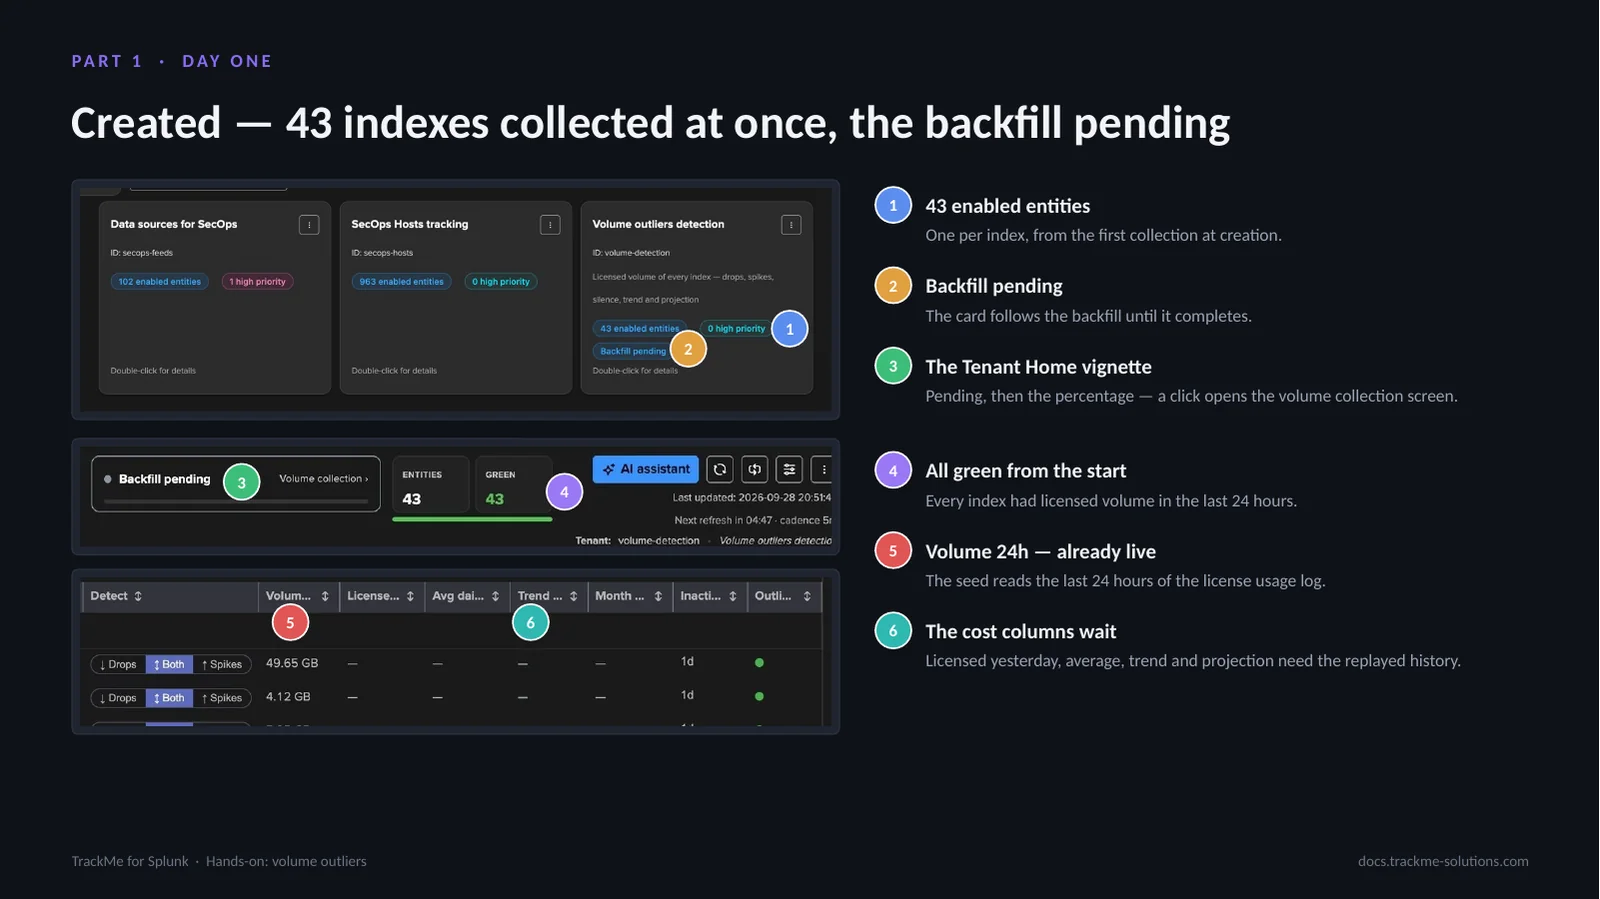
The creation runs the first collection: the tracker seeds the last 24 hours of the license usage log and one entity per index appears, 43 enabled entities here (callout 1), each with its rolling volume. The backfill job plans itself at its first hourly run; until then the Virtual Tenants card reads Backfill pending (callout 2) and follows the backfill until it completes.
The Tenant Home header shows a matching vignette (callout 3): pending, then the percentage; a click opens the volume collection screen. Every index is green from the start (callout 4) because each had licensed volume in the last 24 hours. Volume 24h is already live (callout 5); the cost columns (callout 6) wait for the replayed history.
The volume collection screen
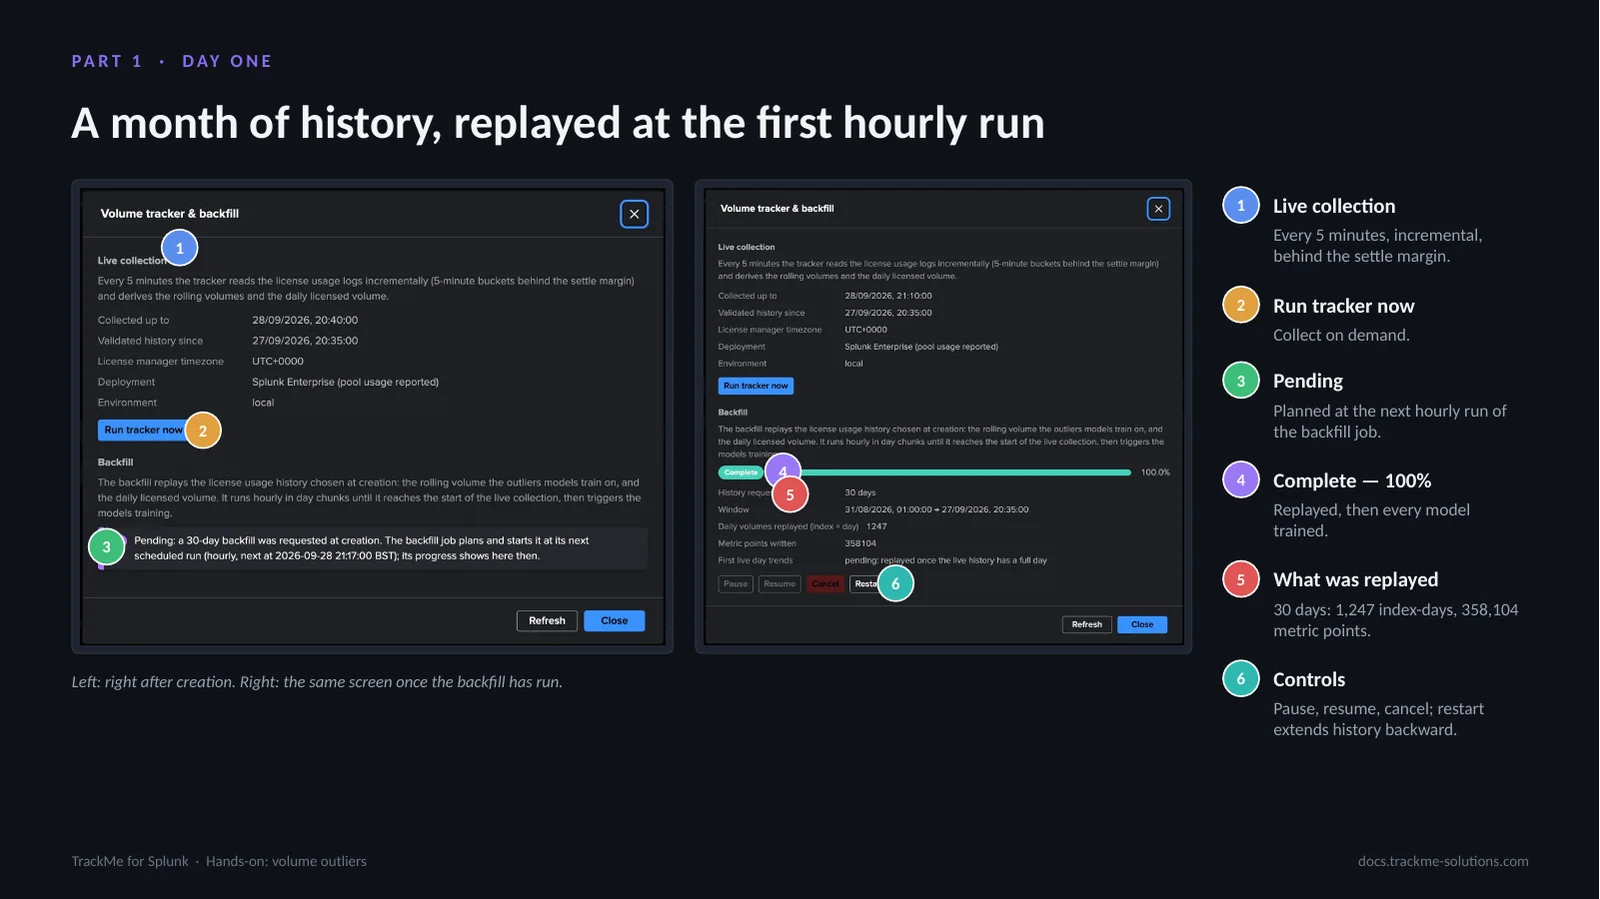
The volume collection screen explains both jobs, shown right after creation on the left and after the backfill on the right. Live collection (callout 1) runs every 5 minutes, incrementally, behind the settle margin; Run tracker now (callout 2) collects on demand. The backfill is Pending (callout 3) until the backfill job plans it at its next hourly run, then Complete at 100% (callout 4): the history is replayed day by day through the same code as the live collection, with historical timestamps.
The replay summary (callout 5) reports 30 days, 1,247 index-days and 358,104 metric points. The controls (callout 6) pause, resume and cancel; a restart extends the history backward. On completion every model is trained.
Tenant Home after the backfill
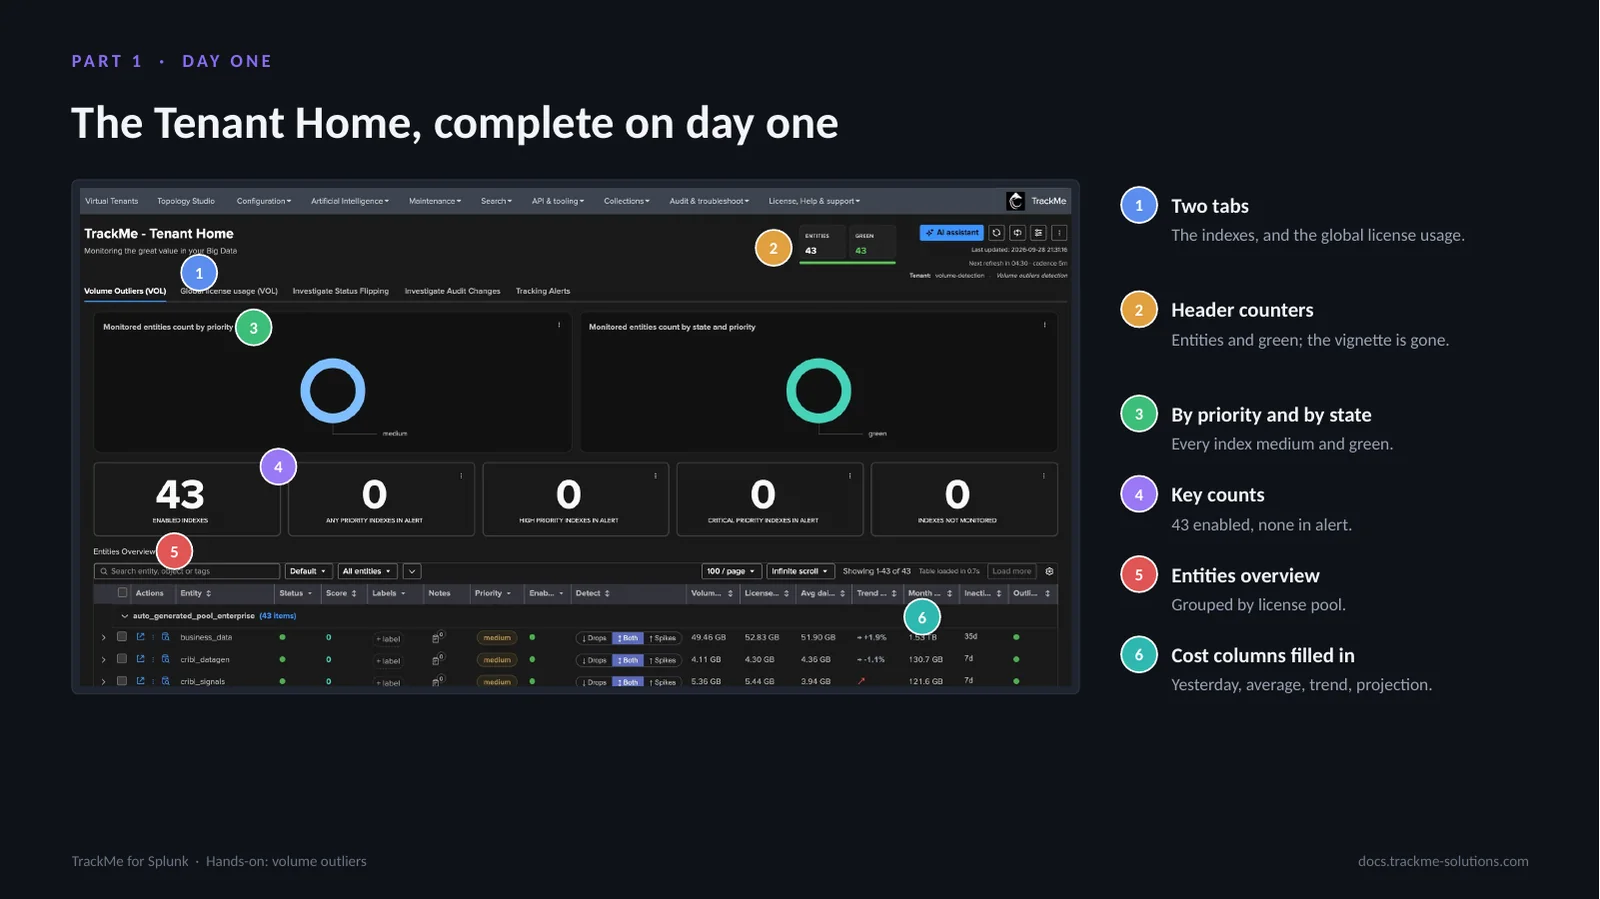
Once the backfill has completed, the Tenant Home is the finished product. Two tabs (callout 1) hold the Volume Outliers indexes and the global license usage. The header counters (callout 2) show the entities and the green count, and the backfill vignette is gone. The charts by priority and by state (callout 3) show every index medium and green, and the key counts (callout 4) read 43 enabled and none in alert.
The entities overview (callout 5) is grouped by license pool, and the cost columns (callout 6), yesterday, average, trend and projection, are now filled from the replayed month.
Part 2 — Read
Part 2 reads what the tenant shows. The VOL table has one row per index with its volume, its trend and its projection. The entity screen of an index has the charts behind the figures: the daily licensed volume, the rolling volume windows and the hourly profile.
Behind each state sits the outliers model that turns a deviation into a state, with its bounds, its direction and its confidence.
Reading the VOL table columns
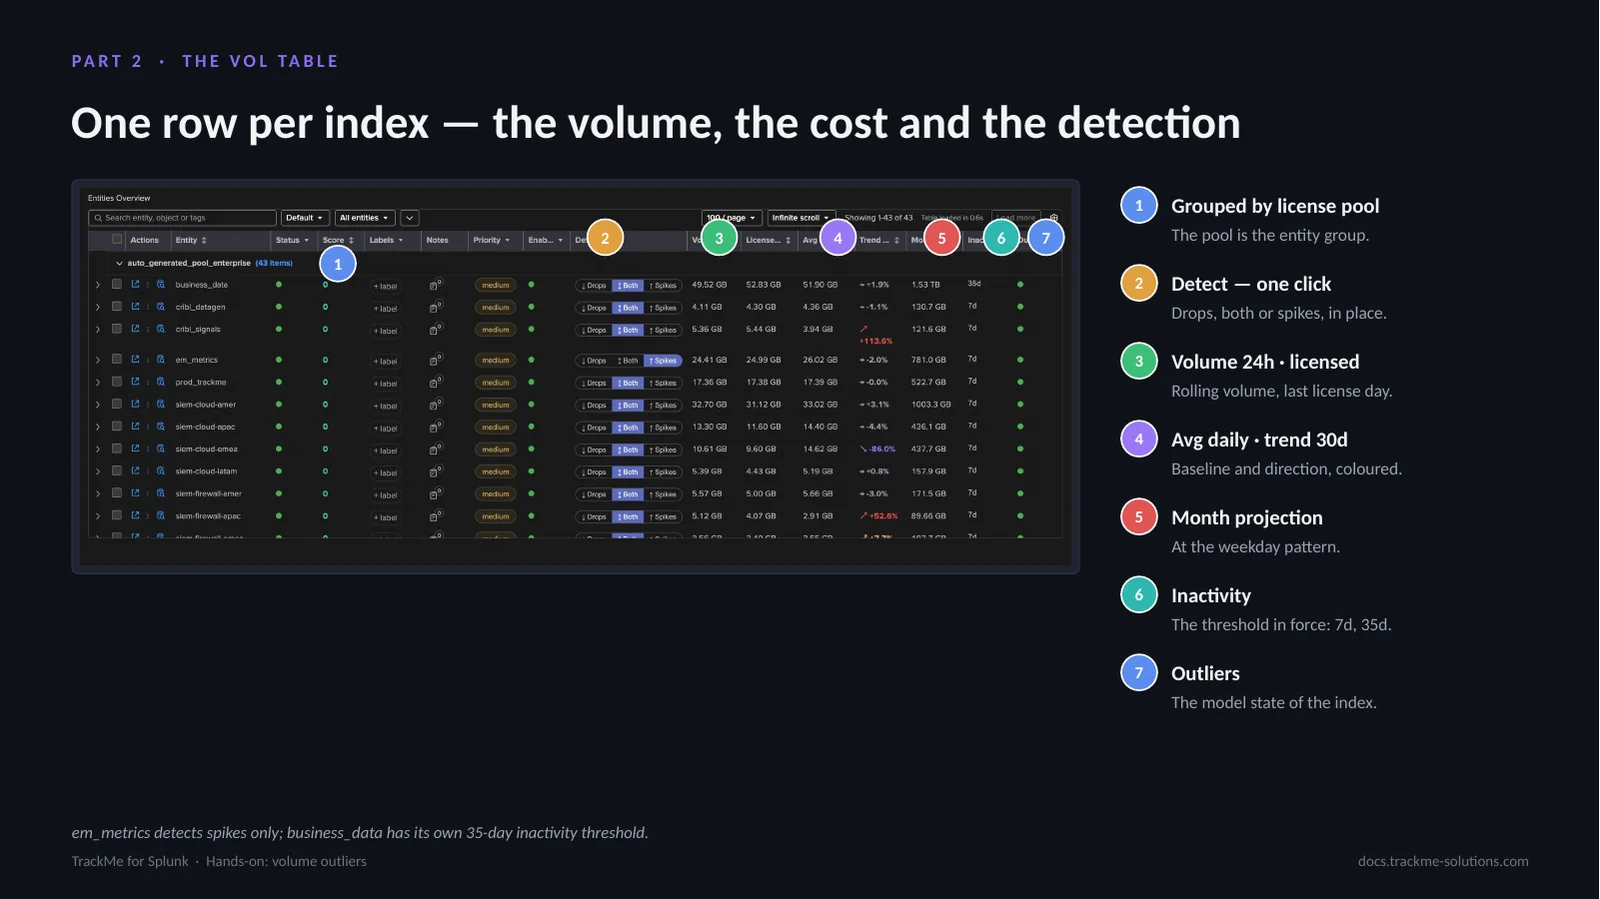
The VOL table shows the volume, the cost and the detection settings of every index in one place. Rows are grouped by license pool (callout 1); Splunk Cloud has no license pool, so rows are not grouped there. Detect (callout 2) switches drops, both or spikes in place. Volume 24h and licensed (callout 3) show the rolling volume and the last license day; Avg daily and trend 30d (callout 4) give the baseline and the direction, red when an index grows fast.
Month projection (callout 5) follows the weekday pattern; Inactivity (callout 6) shows the threshold in force; Outliers (callout 7) shows the model state. Detect and Inactivity are editable in place; the rest is computed every five minutes.
The Volume & cost tab
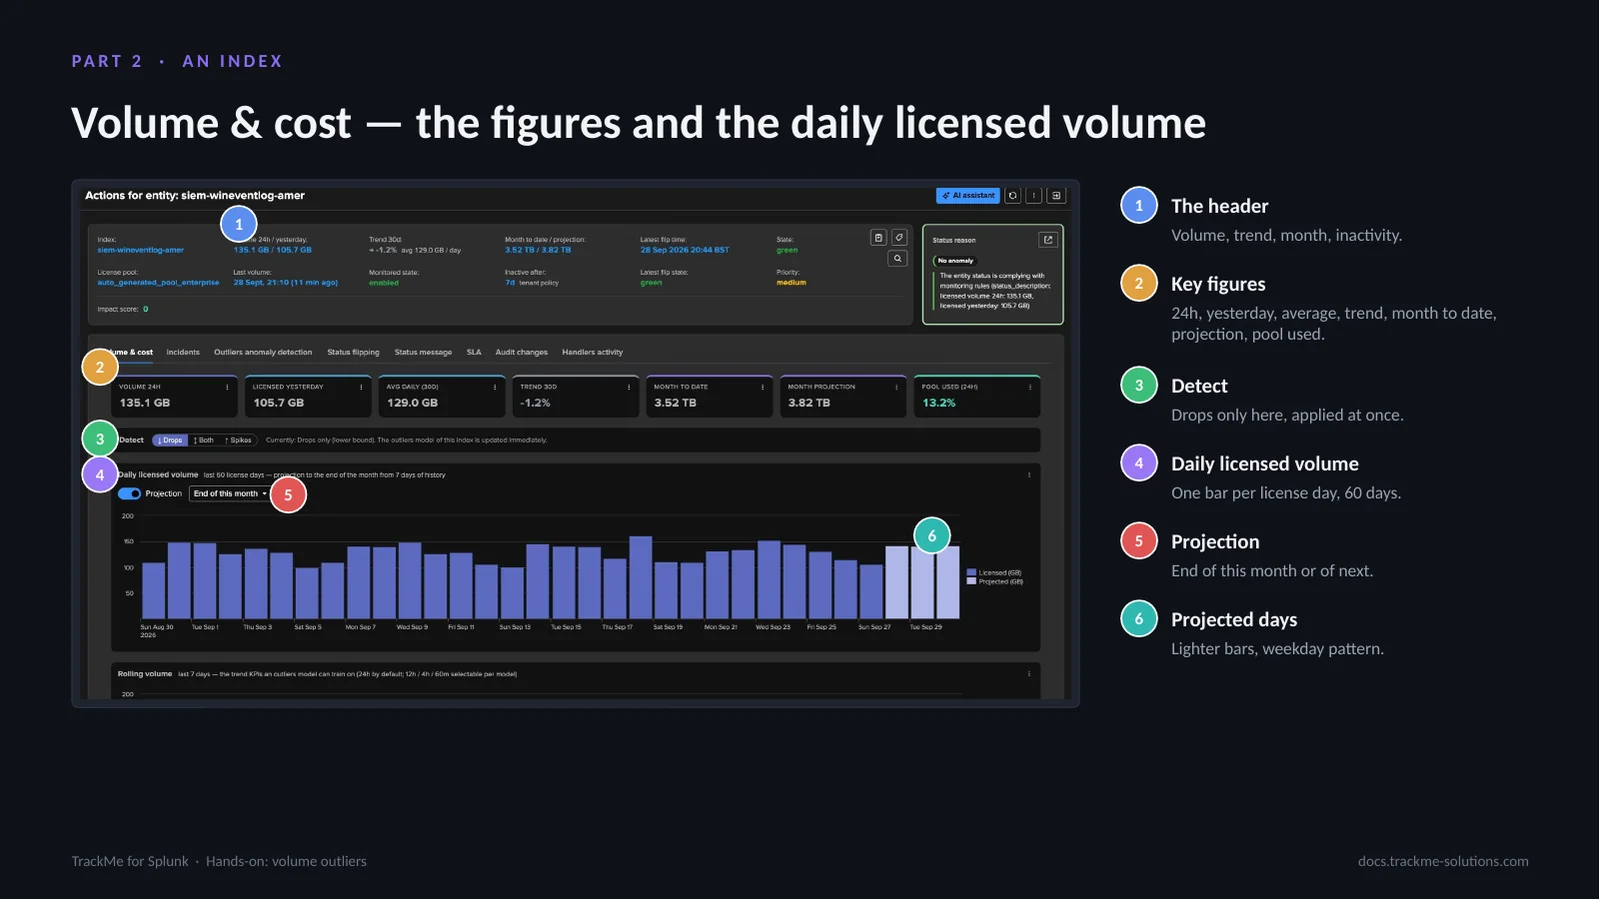
An entity opens on Volume & cost. The header (callout 1) carries the volume, trend, month and inactivity. The key figures (callout 2) are the 24h volume, yesterday, average, trend, month to date, projection and pool used; every tile has an Open in search. Detect (callout 3) is set to drops only here and applies at once.
The daily licensed volume chart (callout 4) shows one bar per license day over 60 days; a day rolls at the license manager’s midnight. The projection control (callout 5) targets the end of this month or of next; the projected days (callout 6) are lighter bars following the weekday pattern. Chart and tile follow the same rule, so they agree.
Rolling volume and hourly profile charts
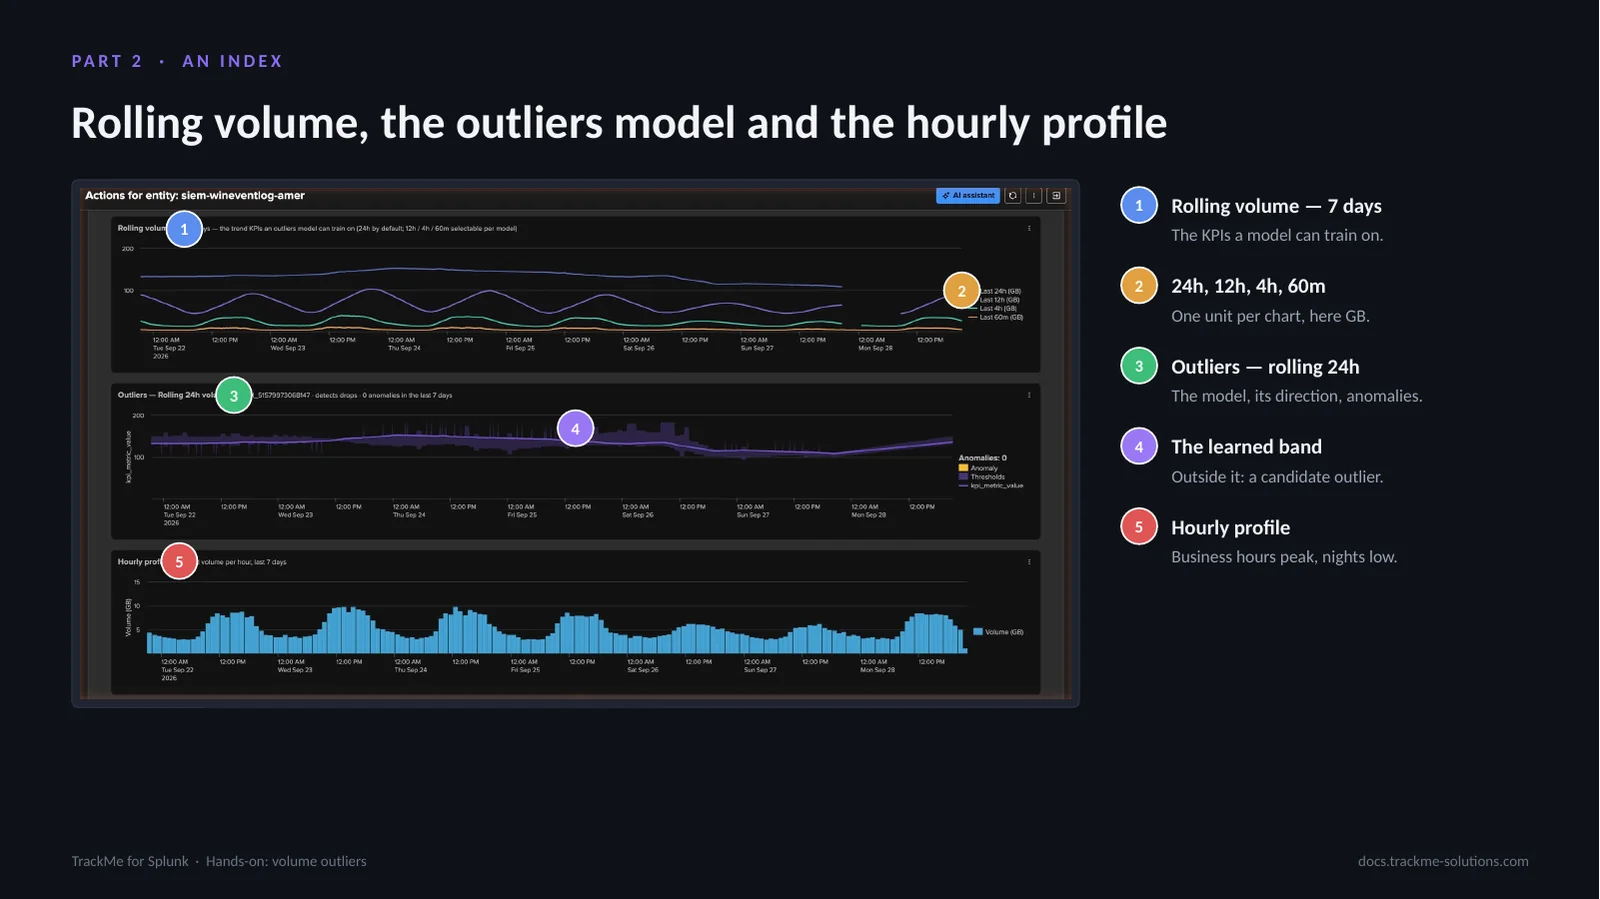
The rolling volume chart over 7 days (callout 1) shows the KPIs a model can train on: 24h, 12h, 4h and 60m (callout 2), one unit per chart, GB here. The rolling 24-hour volume follows the daily pattern and is the proven default KPI; the shorter windows react faster and are noisier.
The outliers chart for the rolling 24h (callout 3) shows the model of the index, its direction and its anomalies: drops only here, with zero anomalies in the last 7 days. The learned band (callout 4) is the range of expected values; a value outside it is a candidate outlier. The hourly profile (callout 5) explains the band: business hours peak, nights and week-ends low.
The outliers model of an index
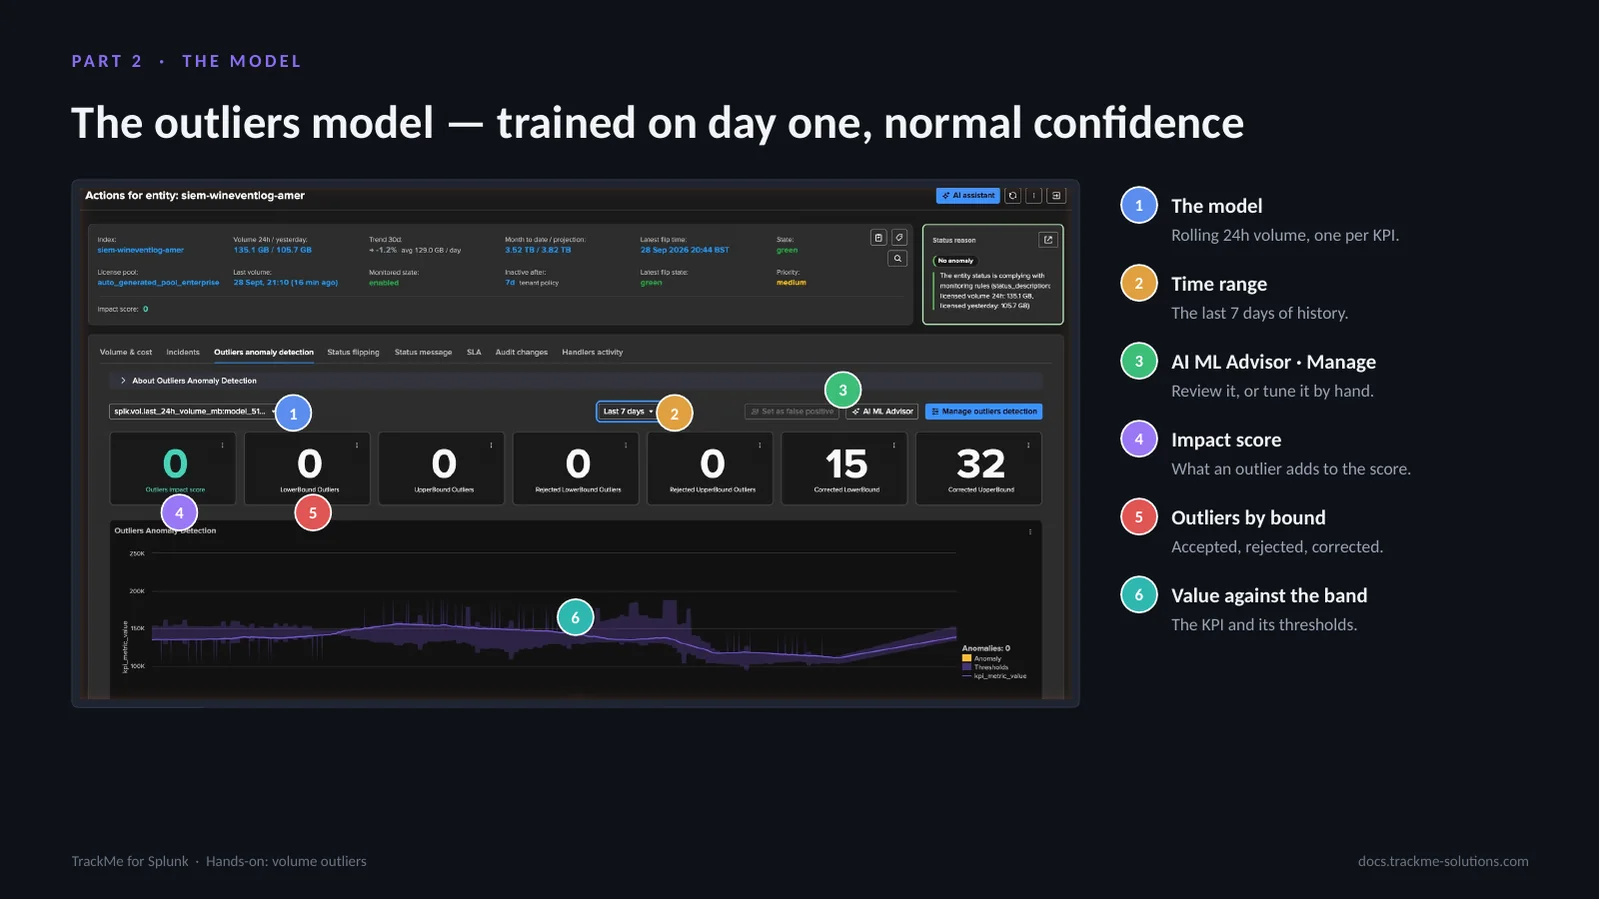
VOL rides TrackMe’s native outliers engine, with the same models, simulation, false-positive handling and AI ML Advisor as every other component. The model (callout 1) is the rolling 24h volume, one per KPI, shown over the last 7 days (callout 2). AI ML Advisor and Manage (callout 3) review the model or tune it by hand. The impact score (callout 4) is what an outlier adds to the score.
Outliers by bound (callout 5) count the accepted, rejected and corrected outliers; the corrected counters show the engine’s guards at work. The value against the band (callout 6) plots the KPI and its thresholds. Because the history was backfilled, the model reached normal confidence on day one.
Part 3 — Tune
Part 3 tunes the detection. The defaults are sensible; these are the settings operators actually use: which direction matters for each index, when silence becomes an incident, which KPIs carry a model, and which indexes are in scope.
Every setting applies live, per index or in bulk.
Setting the detection direction
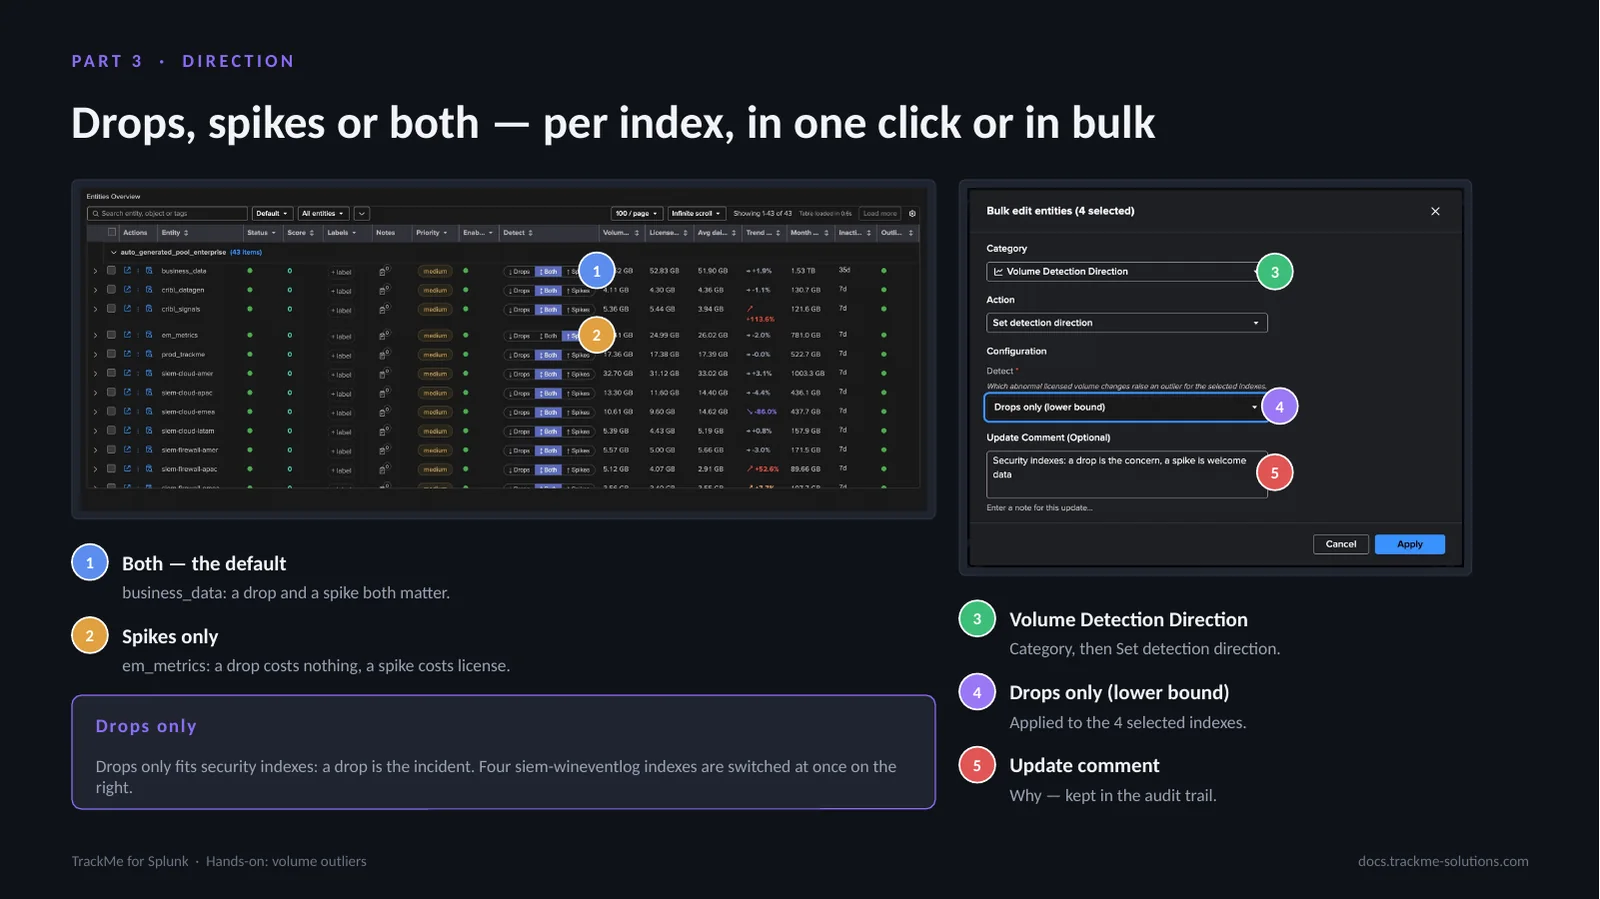
Not every index deserves both directions. Both, the default (callout 1), fits business_data, where a drop and a spike both matter. Spikes only (callout 2) fits em_metrics: a drop costs nothing, a spike costs licence. Drops only fits security indexes, where a drop is the incident.
The Detect toggle switches one index in the table. The bulk edit category Volume Detection Direction (callout 3) applies a choice to a selection: Drops only (lower bound) (callout 4) is applied to the 4 selected siem-wineventlog indexes at once, and the update comment (callout 5) records why in the audit trail. The direction is stored on the index’s outliers model, lower bound for drops and upper bound for spikes, and takes effect immediately.
Tenant inactivity policy and index overrides
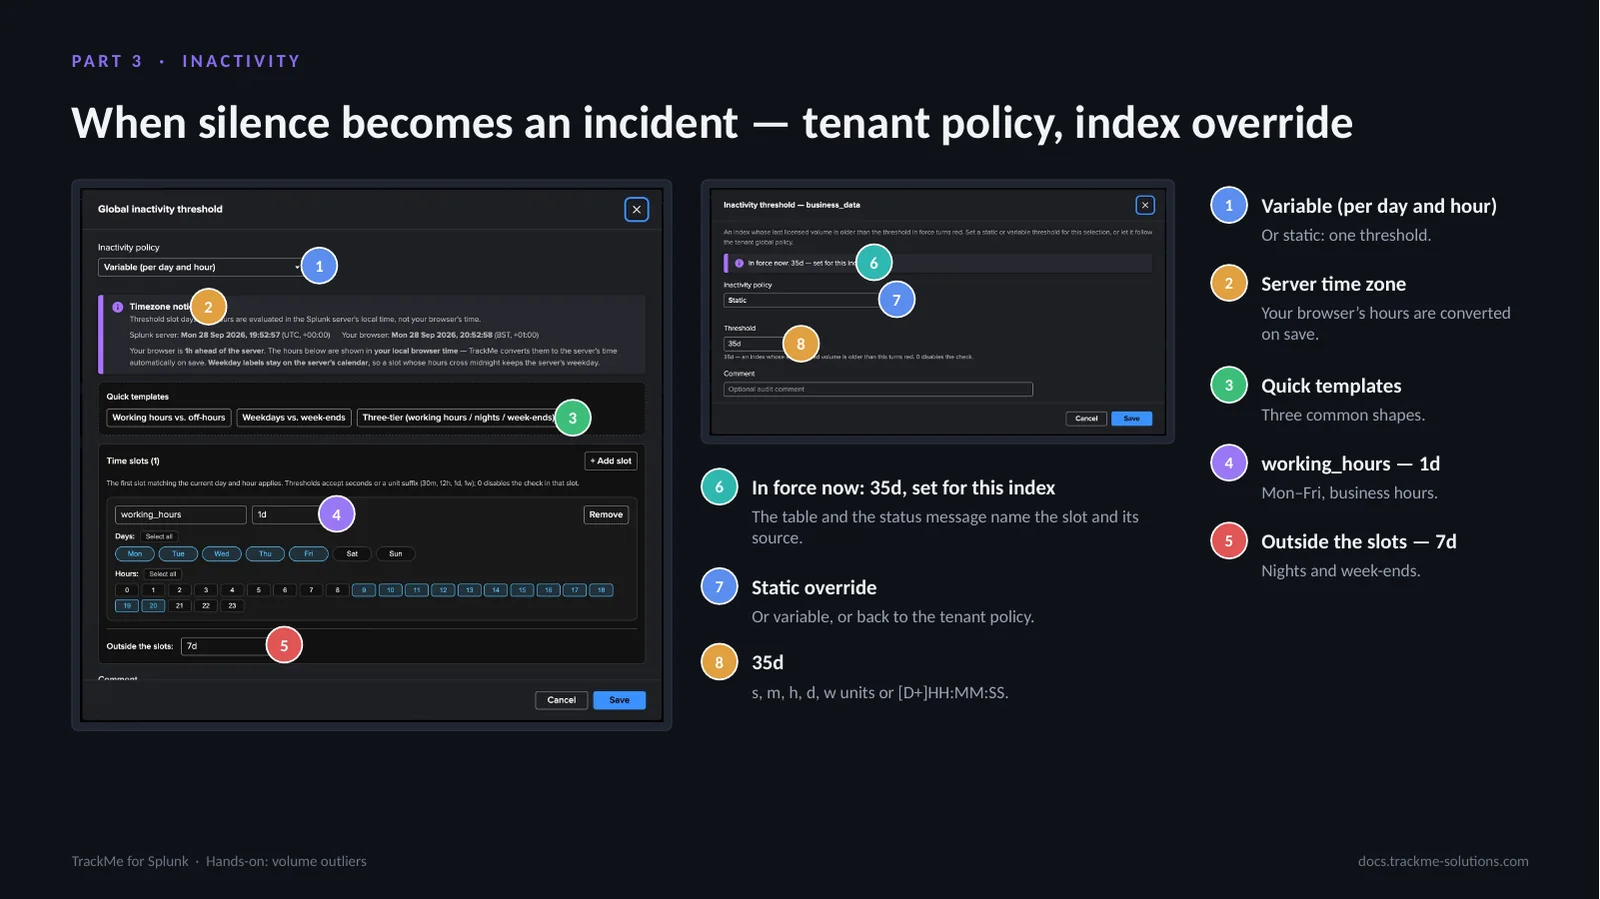
The tenant policy applies live to every index without its own threshold: variable by day and hour (callout 1), 1 day in working_hours (callout 4) and 7 days outside the slots (callout 5). Manage: Global inactivity threshold edits it on a day and hour grid in the server time zone (callout 2), with quick templates (callout 3).
An index gets its own override from its menu, the bulk edit, or the Inactivity column. The value in force (callout 6) reads 35d, set for this index. The override (callout 7) is static or variable, or returns to the tenant policy; the value (callout 8) accepts s, m, h, d, w units. 0 disables the check.
Default KPIs and the outliers scope
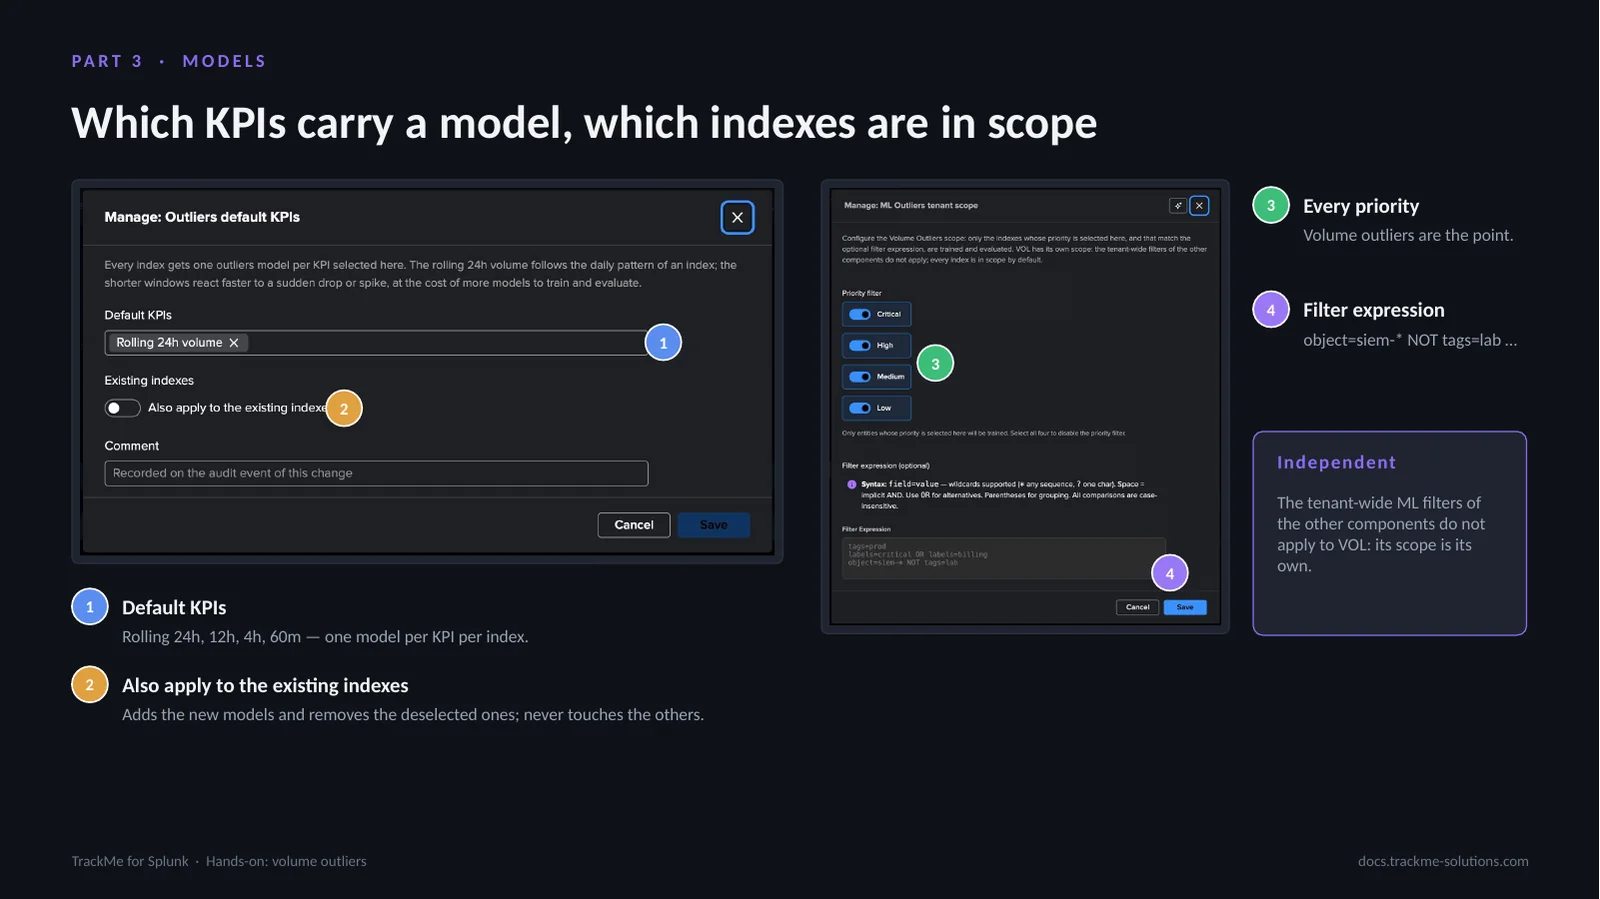
Manage: Outliers default KPIs (callout 1) sets the rolling KPIs every new index gets a model on: rolling 24h, 12h, 4h and 60m, one model per KPI per index, the 24-hour volume by default. The shorter windows react faster, at the cost of more models. Also apply to the existing indexes (callout 2) adds the new models and removes the deselected ones, never touching the others.
Manage: ML Outliers tenant scope sets which indexes are trained and evaluated. Every priority is in scope by default (callout 3), and an optional filter expression (callout 4), such as object=siem-* NOT tags=lab, narrows on object, priority, tags, labels and pool. The other components’ ML filters do not apply to VOL.
Part 4 — Operate
Part 4 covers the global license usage view, alerting, and the AI Advisors. Global license usage (VOL) takes the whole environment’s licence from volume to cost.
It reads what the tenant already collected, with no monitoring, no alerting and no extra search on the license usage log, and answers the questions every Splunk administrator gets asked: who consumes, what a working day costs, which days went over quota, and who pays for what.
Global license usage overview
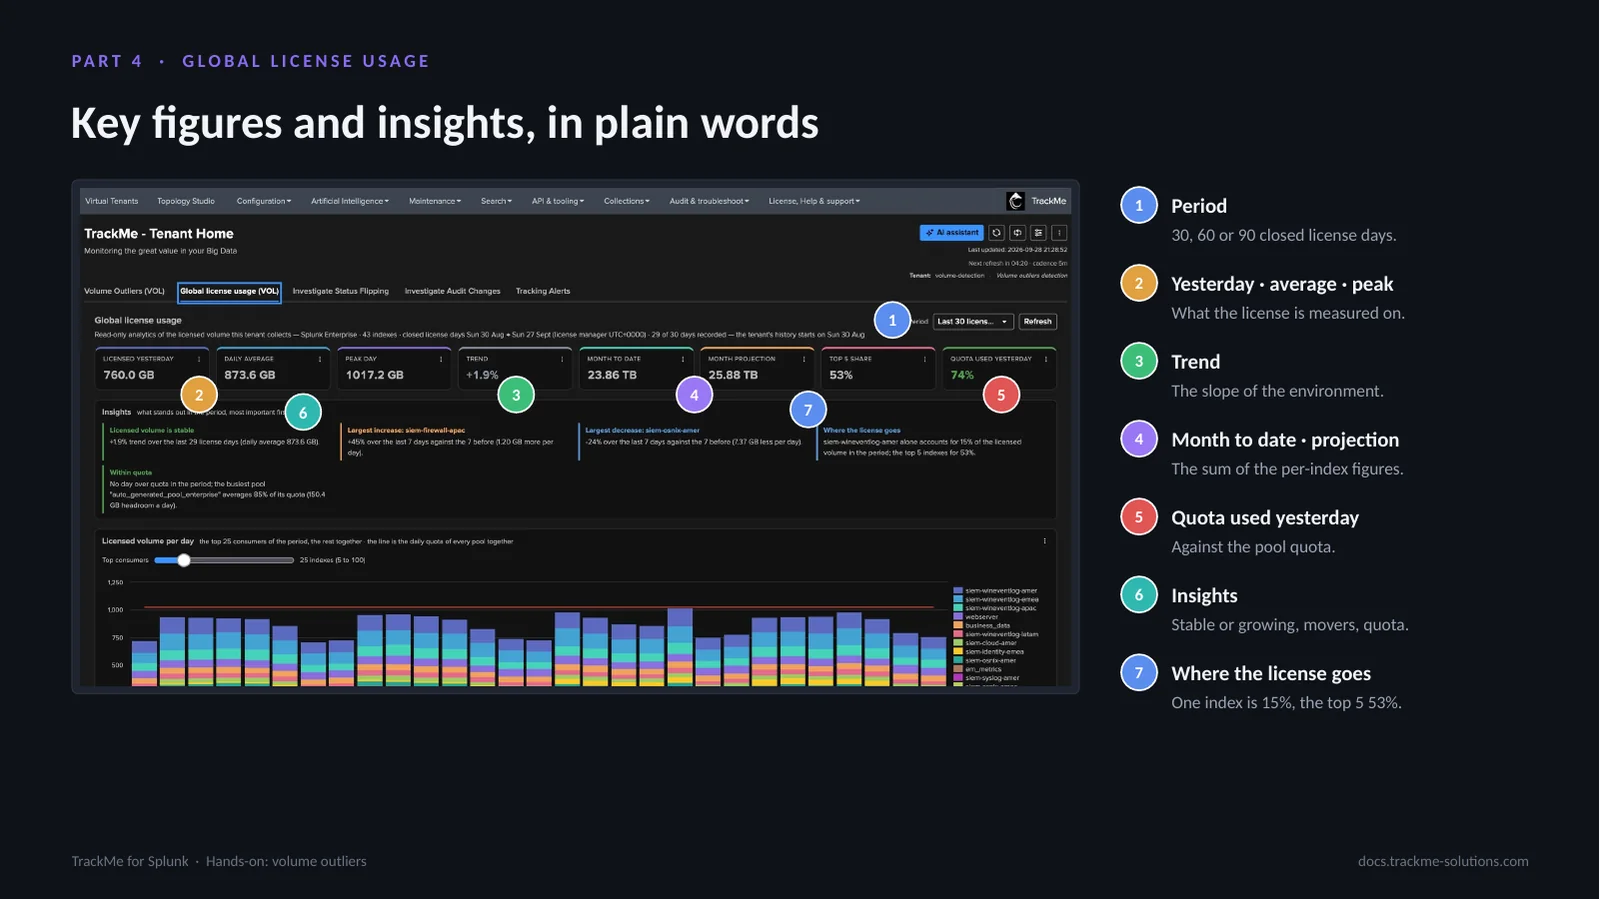
Since 2.4.19 the Global license usage tab has six sub-tabs over one period (callout 1): overview, scopes, working days and holidays, over quota, chargeback and configuration, on 30, 60 or 90 closed license days. It reads the tenant’s own metrics and entity figures, so it adds no search and works the same for a remote deployment.
The daily average carries a working-day average (callout 2); month to date and the projection (callout 3) sum the per-index figures. With costs configured, the cost of the period, the cost per GB and the unused capacity appear (callout 4). The quota used yesterday and the days over quota (callout 5) are measured against the pool quota, and the insights (callout 6) lead with the days over quota.
Daily consumption and month-end projection
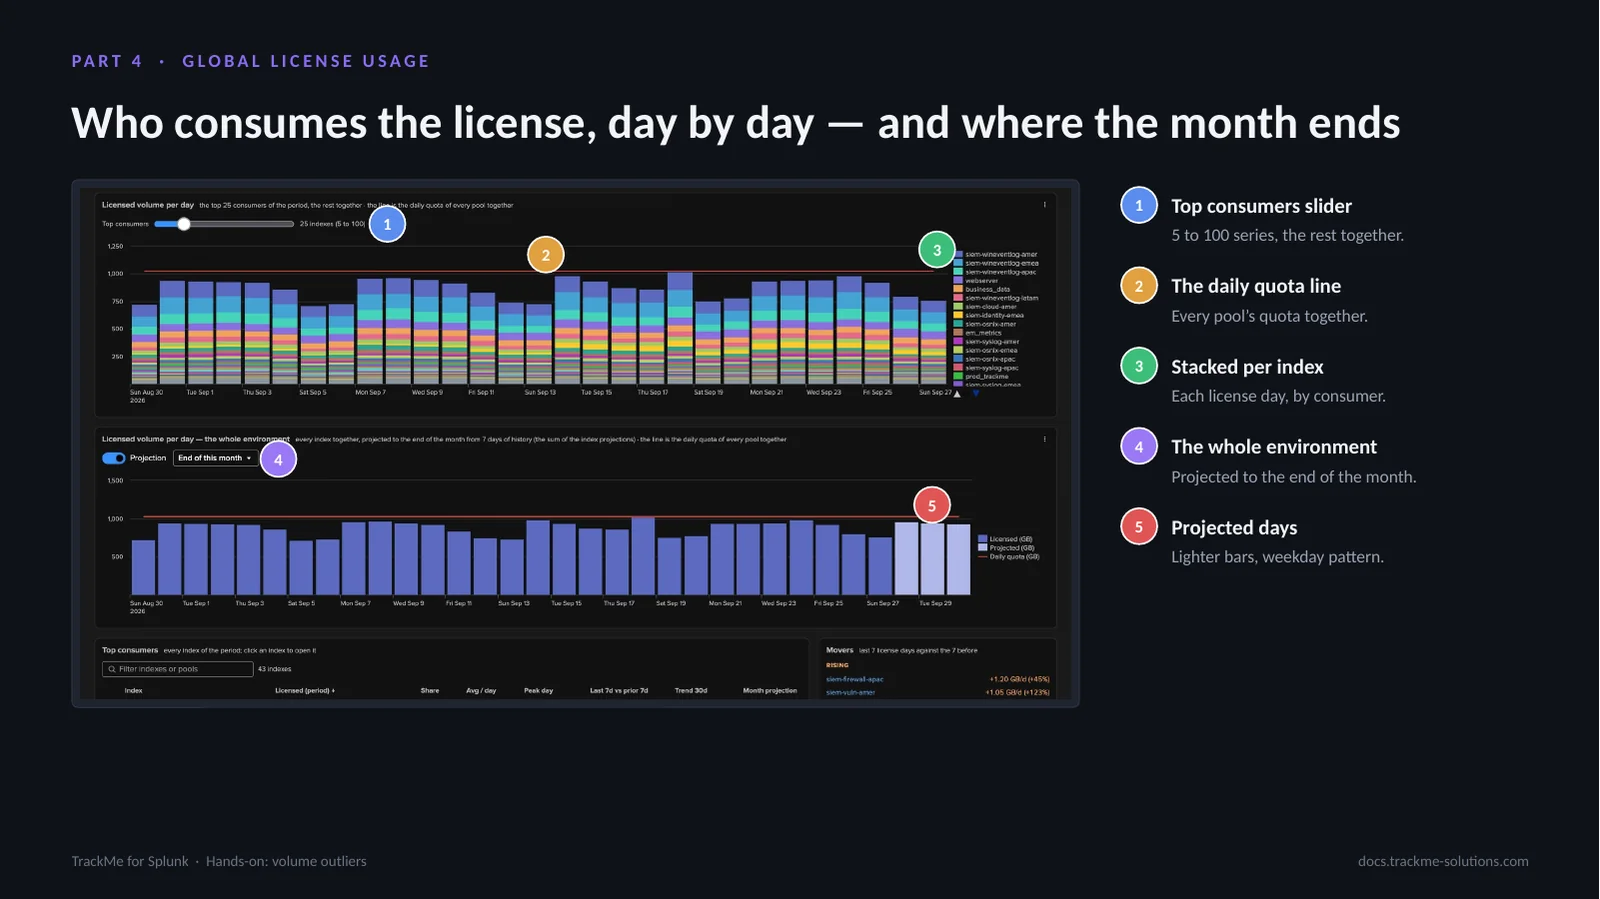
The first chart stacks the daily consumption per index (callout 3), each closed license day by consumer. The top consumers slider (callout 1) selects 5 to 100 series, with the rest grouped together, and the daily quota line (callout 2) shows the day the pool went over its quota at a glance.
The second chart shows the whole environment with the projection switch (callout 4): to the end of this month or of next month, the same rule as the entity chart. The projected days (callout 5) appear as lighter bars following the weekday pattern.
Consumers, costs, movers and pools
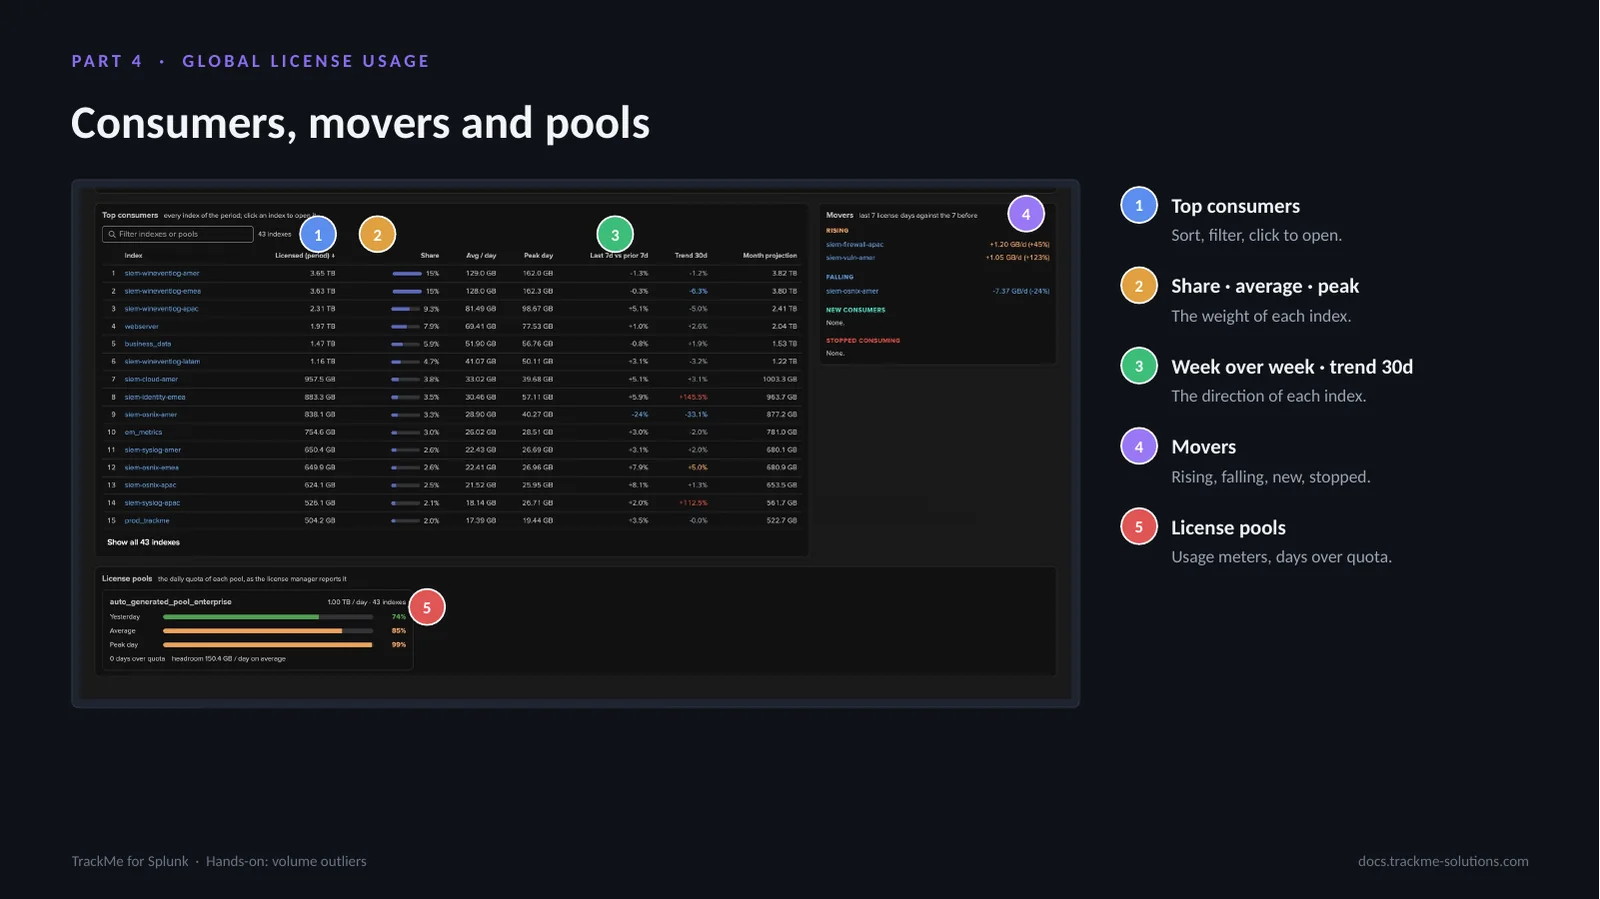
The top consumers table (callout 1) lists every index of the period; it sorts, filters and opens an index on click. With costs on, the cost columns (callout 2) give the cost of the period, of an average day and of a peak day, and the week-over-week and 30-day trend columns (callout 3) give each index’s direction.
The movers card (callout 4) turns the week-over-week comparison into rising, falling, new and stopped indexes: here siem-osnix-apac rose by 44 %. The license pool card (callout 5) gives the capacity view: meters for yesterday, the average and the peak day, the days over quota and the headroom.
Named scopes
A named scope is a set of indexes analysed together: a team, a use case, the data of Enterprise Security. Each enabled scope has its own tab on a second row under Scopes (callout 1). It is defined by index patterns, here siem-firewall-*, siem-identity-* and siem-vuln-*, or follows the CIM datamodel index macros (callout 2).
The key figures give the scope’s share of the licence and its cost for the period (callout 3), and the daily average with the working-day average (callout 4). The daily volume is stacked by index with its own top consumers slider (callout 5), followed by the scope’s projection and its indexes.
Working days and holidays
Weekends and public holidays pull a daily average down, so this sub-tab separates the kinds of day. The holidays come from the Bank Holidays calendars the tenant uses (callout 1), here England and a custom Company closures calendar. The working-day average (callout 2) leaves weekends and holidays out, and the Bank holidays tile (callout 3) names the holidays of the period: the summer bank holiday and a company day.
Working versus non-working (callout 4) compares the two, +27.8 % here. The daily chart colours each day by kind (callout 5), and the average per weekday (callout 6) leaves the holidays out.
Days over quota
Over quota lists the license days a pool licensed more than its daily quota. The window (callout 1) covers 3, 6 or 12 calendar months. The tiles count the days over quota in the window, this month and last month (callout 2), over a rolling 60 days (callout 3), and give the worst day (callout 4): 109 % of the quota on 14 September.
The chart (callout 5) draws each license day against the quota line, red when over and blue when within. These are days over the quota in force, not Splunk license warnings: the view states Splunk’s own rule for context.
What made the day
For any day picked with the date selector (callout 1) or the previous and next buttons (callout 2), a badge says whether the pool was over or within its quota (callout 3), and one sentence gives the day (callout 4): 1.09 TB licensed against 1.00 TB.
The chart compares the pool’s ten largest indexes that day with their usual day, their average over the license days they recorded before (callout 5). The change column (callout 6) shows what made the day: siem-infra-emea licensed about 25 times its usual volume, and siem-identity-apac more than 13 times.
Chargeback statement
With a price and cost centres configured, the chargeback gives a monthly statement of who pays for what. The statement month (callout 1) is one of the last 13 calendar months, and Export CSV (callout 2) keeps a closed month as it was charged. The bill of the month (callout 3) covers the calendar days of the month.
Indexes no centre matches stay on the Unallocated line (callout 4), kept small here. Over budget (callout 5) names the centres past their monthly budget, Cloud and Business in September, and the budget used column (callout 6) gives each centre’s position. An index belongs to the first centre that matches it, so every GB is charged once.
Configuring the license view
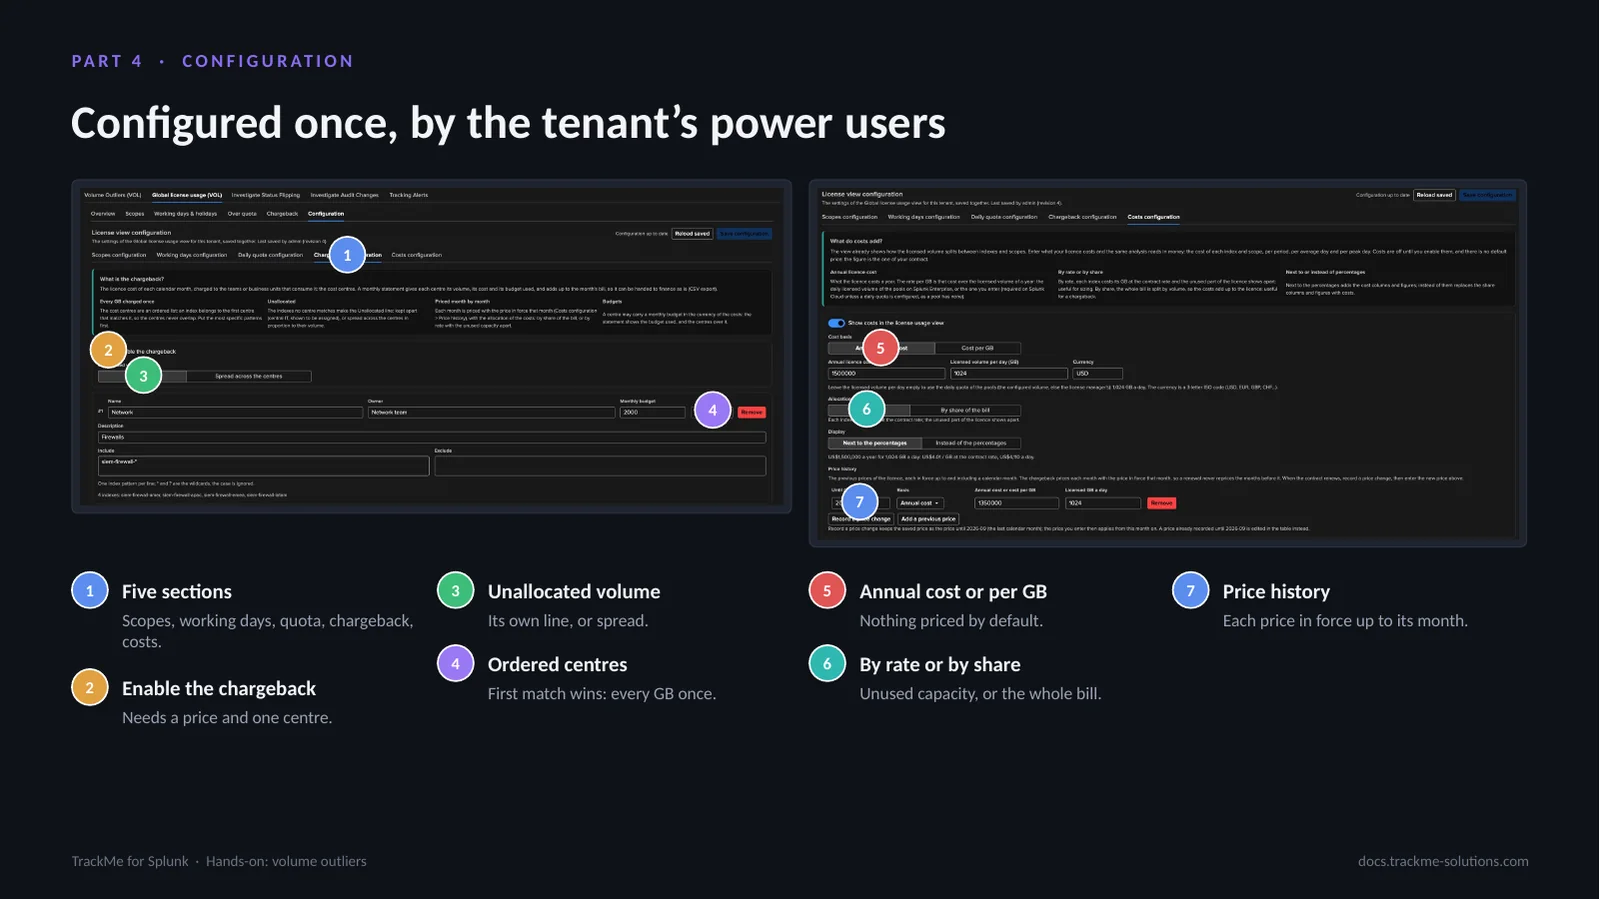
Everything beyond the overview is opt-in, configured by a power or admin role on the tenant in five sections saved together (callout 1). The chargeback is enabled once a price and a cost centre exist (callout 2); unallocated volume stays on its own line or is spread across the centres (callout 3); the cost centres are ordered (callout 4), each with an owner, a monthly budget and index patterns.
The costs section takes an annual licence cost or a cost per GB (callout 5), with nothing priced by default, an allocation by rate or by share of the bill (callout 6), and a price history (callout 7) so a renewal never reprices past months.
The AI Assistant on the license view
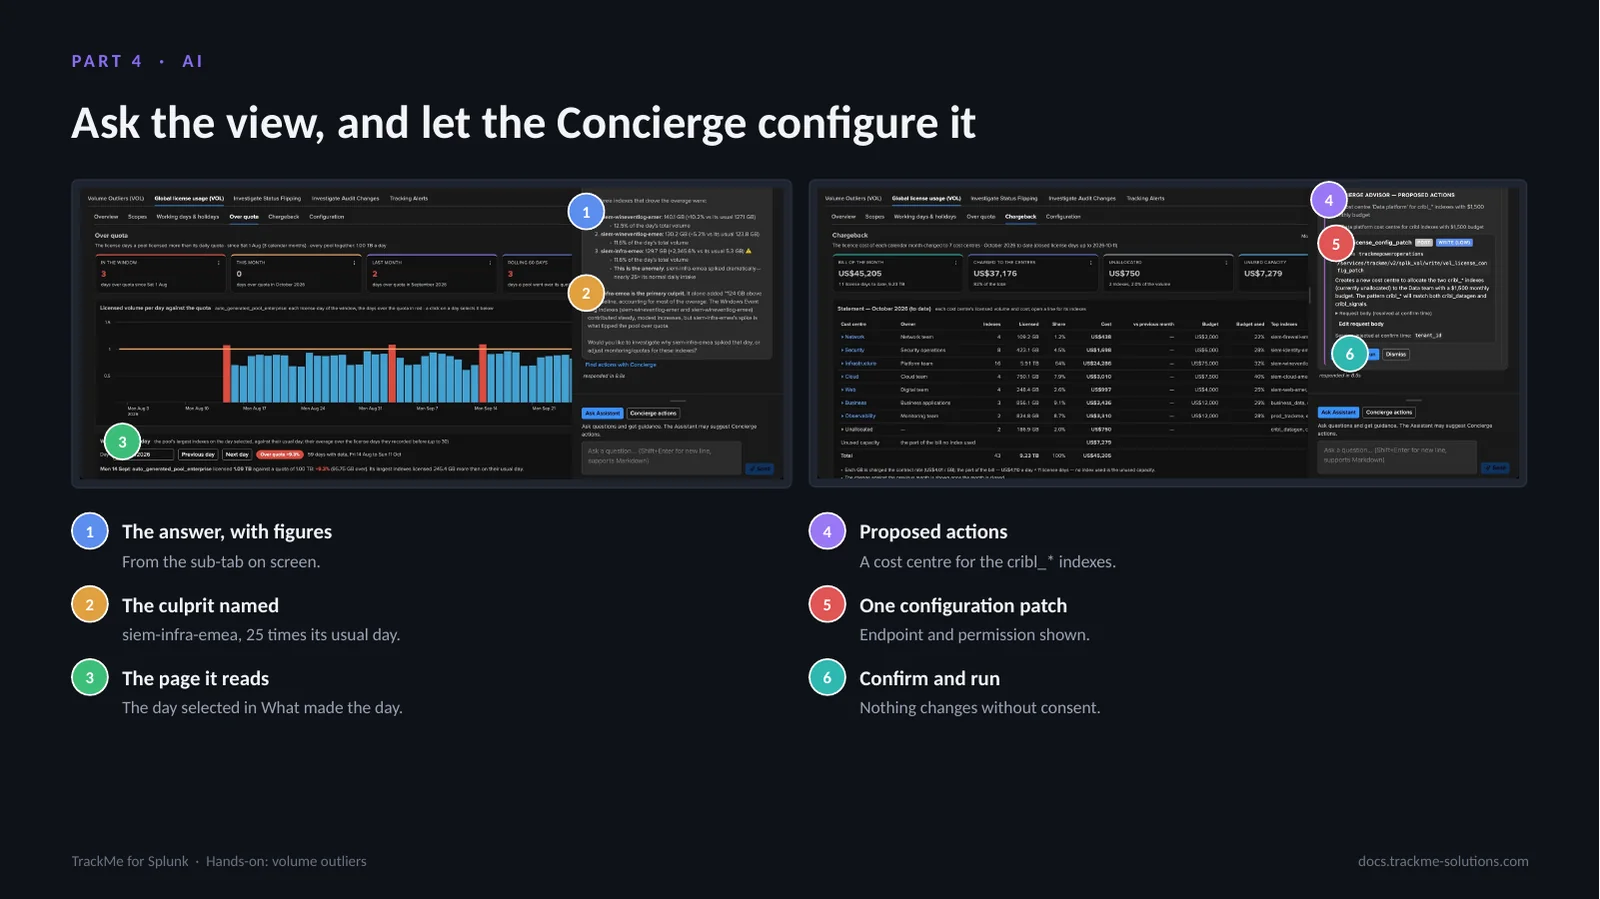
While the license view is open, the Tenant Home AI Assistant works on it. Asked what made the pool go over its quota on 14 September, it answers with the figures of the sub-tab on screen (callout 1) and names the culprit (callout 2), siem-infra-emea, from the day selected in What made the day (callout 3).
Asked to add a cost centre for the cribl_* indexes, it proposes the change through the Concierge (callout 4): one configuration patch with its endpoint and permission (callout 5), applied only on Confirm and run (callout 6), audited, and reloaded by the view.
Configuring alerting for red indexes
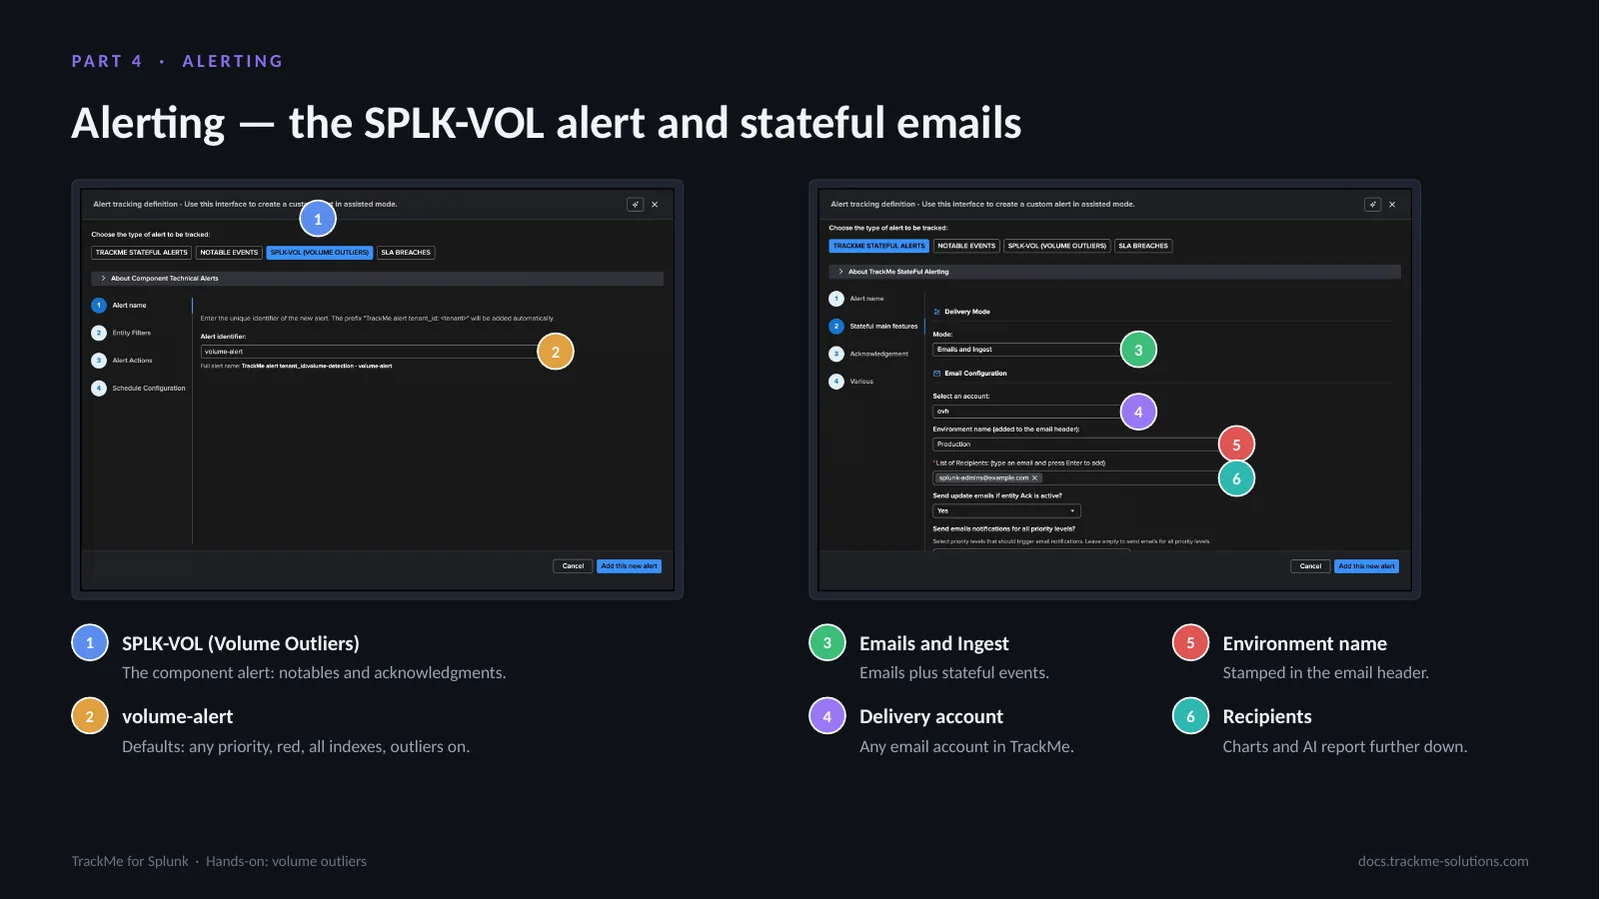
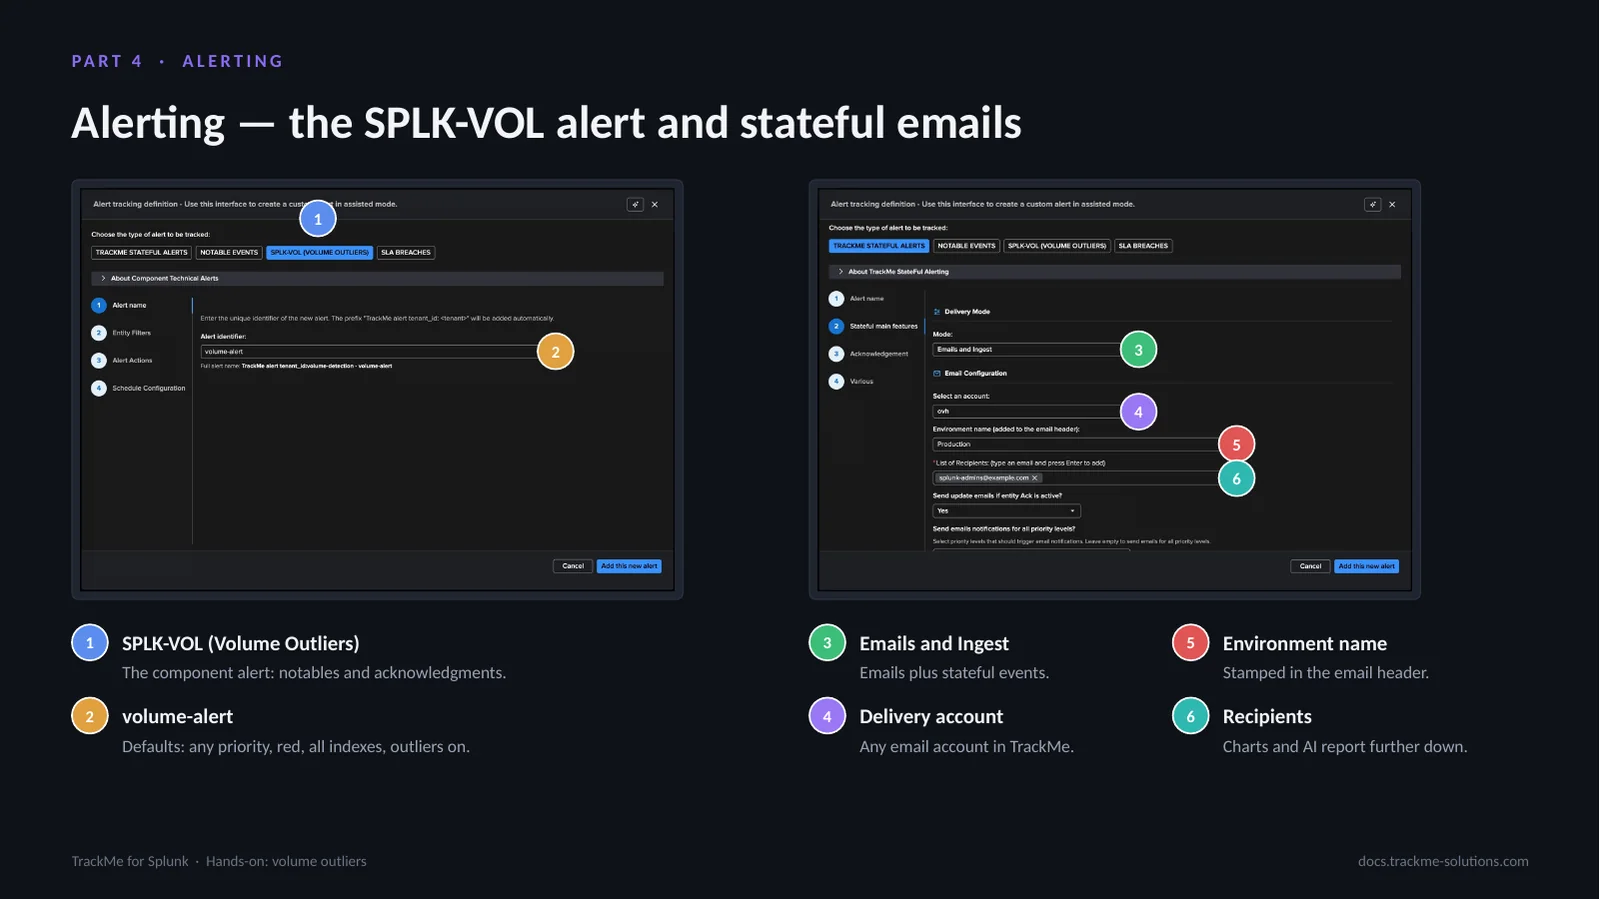
Volume Outliers alerts like any TrackMe component. The SPLK-VOL (Volume Outliers) alert type (callout 1) generates the notable events and acknowledgments for red indexes; its defaults (callout 2) are any priority, red, all indexes, outliers on. The outliers trigger stays on because the outliers are the state of this component; the same alert covers inactivity.
A TrackMe stateful alert, volume-alert here, sends the opened, updated and closed emails. Emails and Ingest (callout 3) delivers emails plus stateful events; the delivery account (callout 4) is any email account in TrackMe; the environment name (callout 5) is stamped in the email header; the recipients (callout 6) sit further down with the charts and the optional AI status report.
Launching the AI ML Advisor
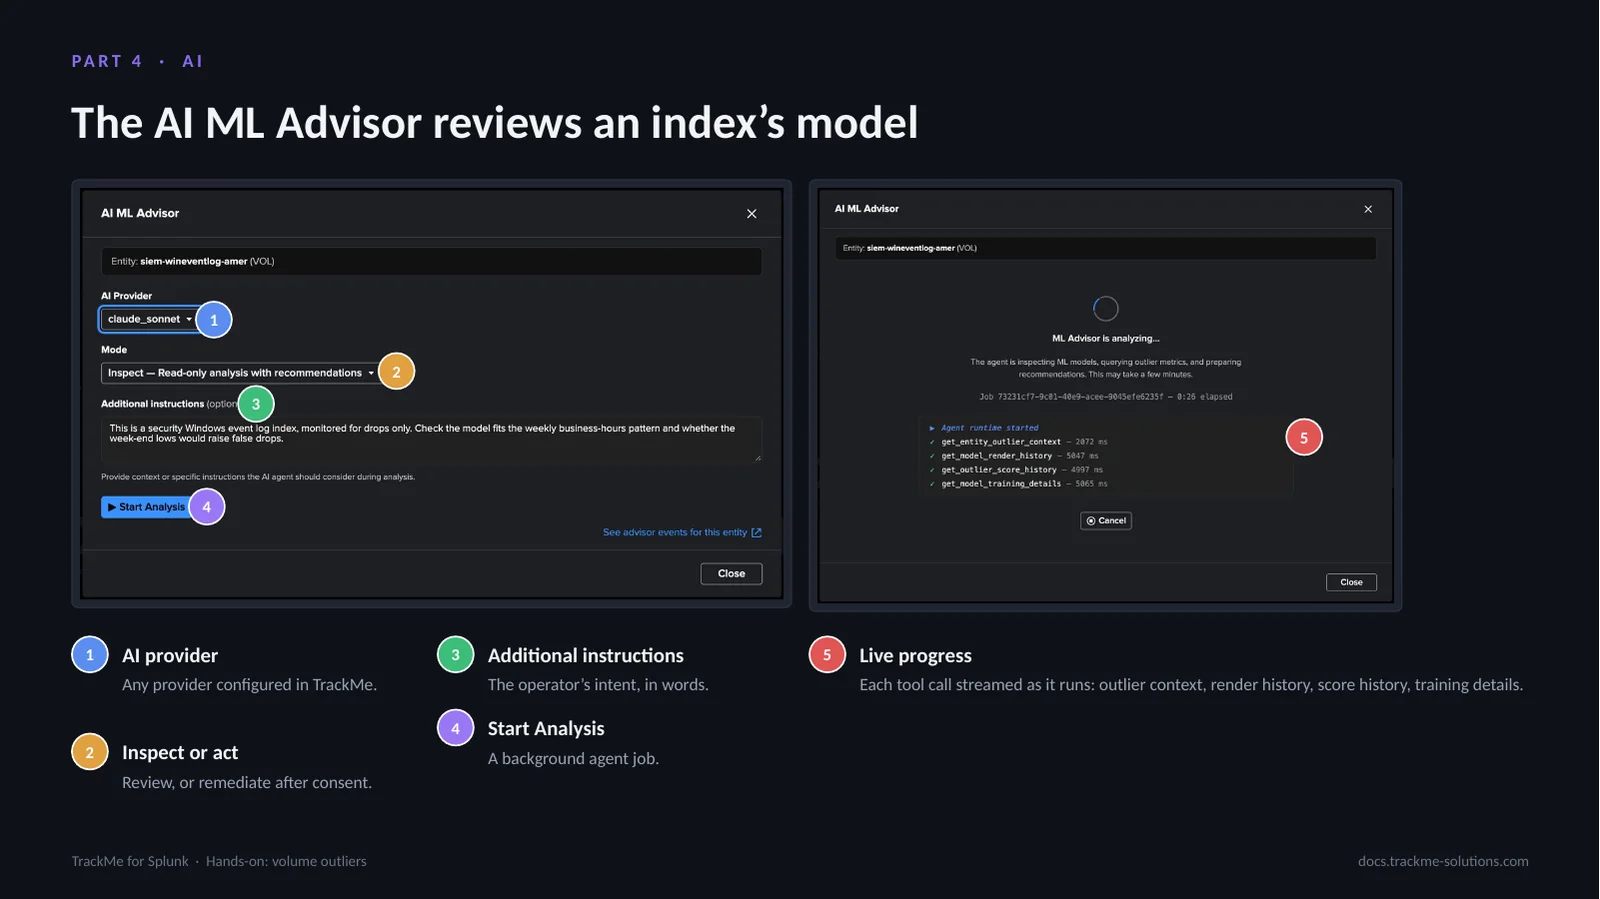
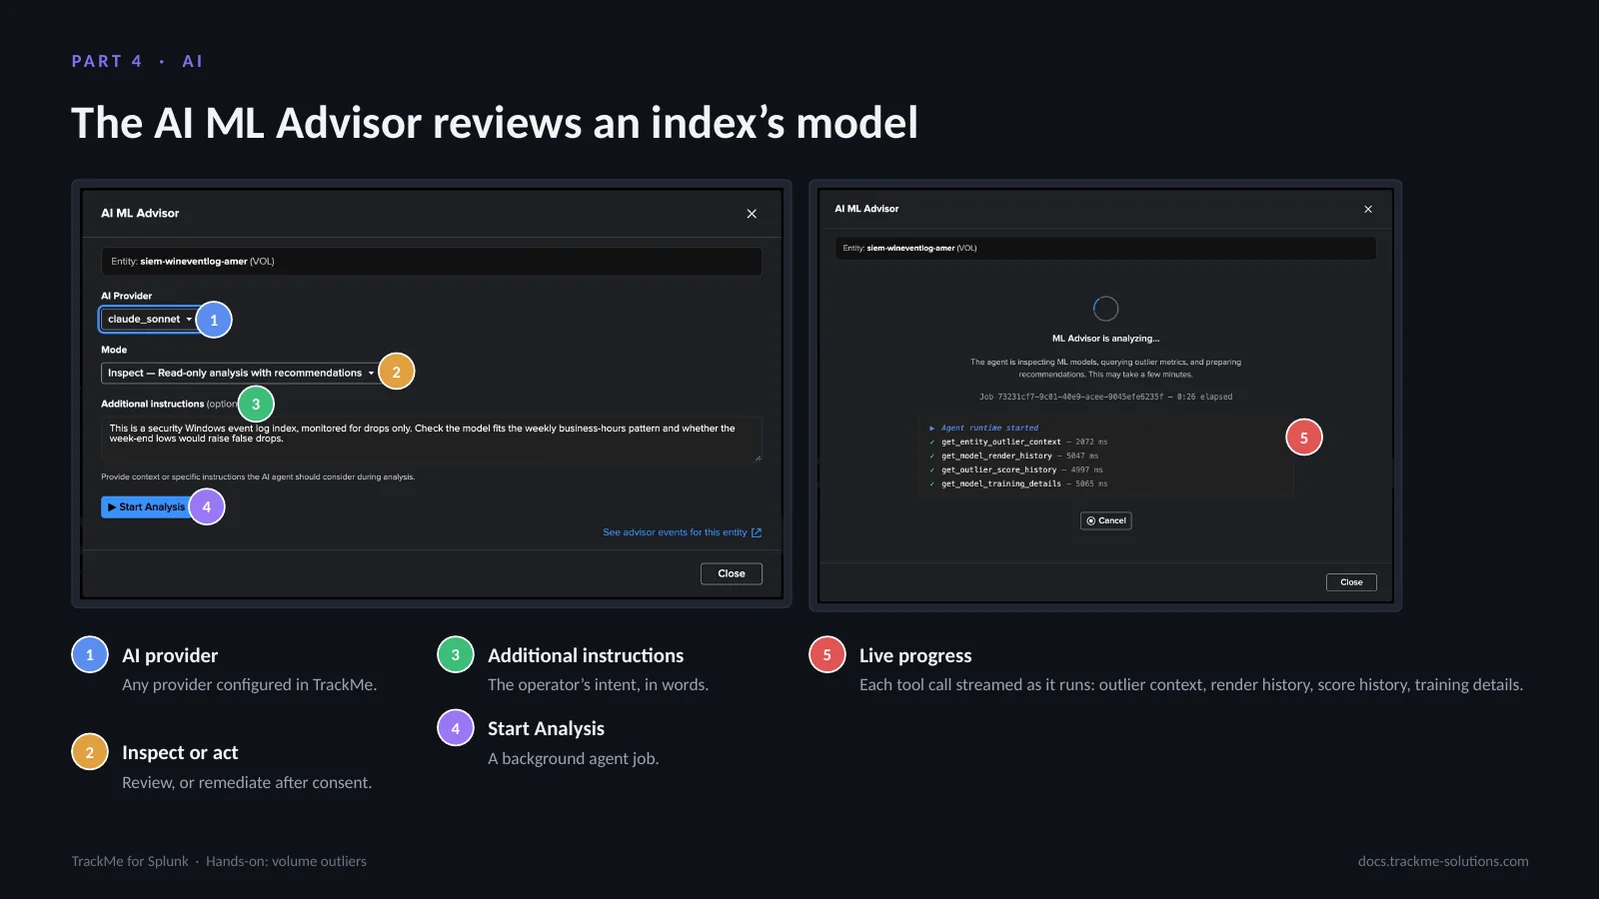
From the Outliers tab of an index, the AI ML Advisor runs as a background agent job with read tools: the entity, its model rules, the outlier and score history, the training details. The AI provider (callout 1) is any provider configured in TrackMe. Inspect or act (callout 2) chooses between a review that changes nothing and a remediation applied after consent.
Additional instructions (callout 3) carry the operator’s intent in words: this security index is monitored for drops only; does the model fit the weekly business-hours pattern, and would the week-end lows raise false drops? Start Analysis (callout 4) launches the job, and the live progress feed (callout 5) streams each tool call as it runs.
Reading the advisor verdict
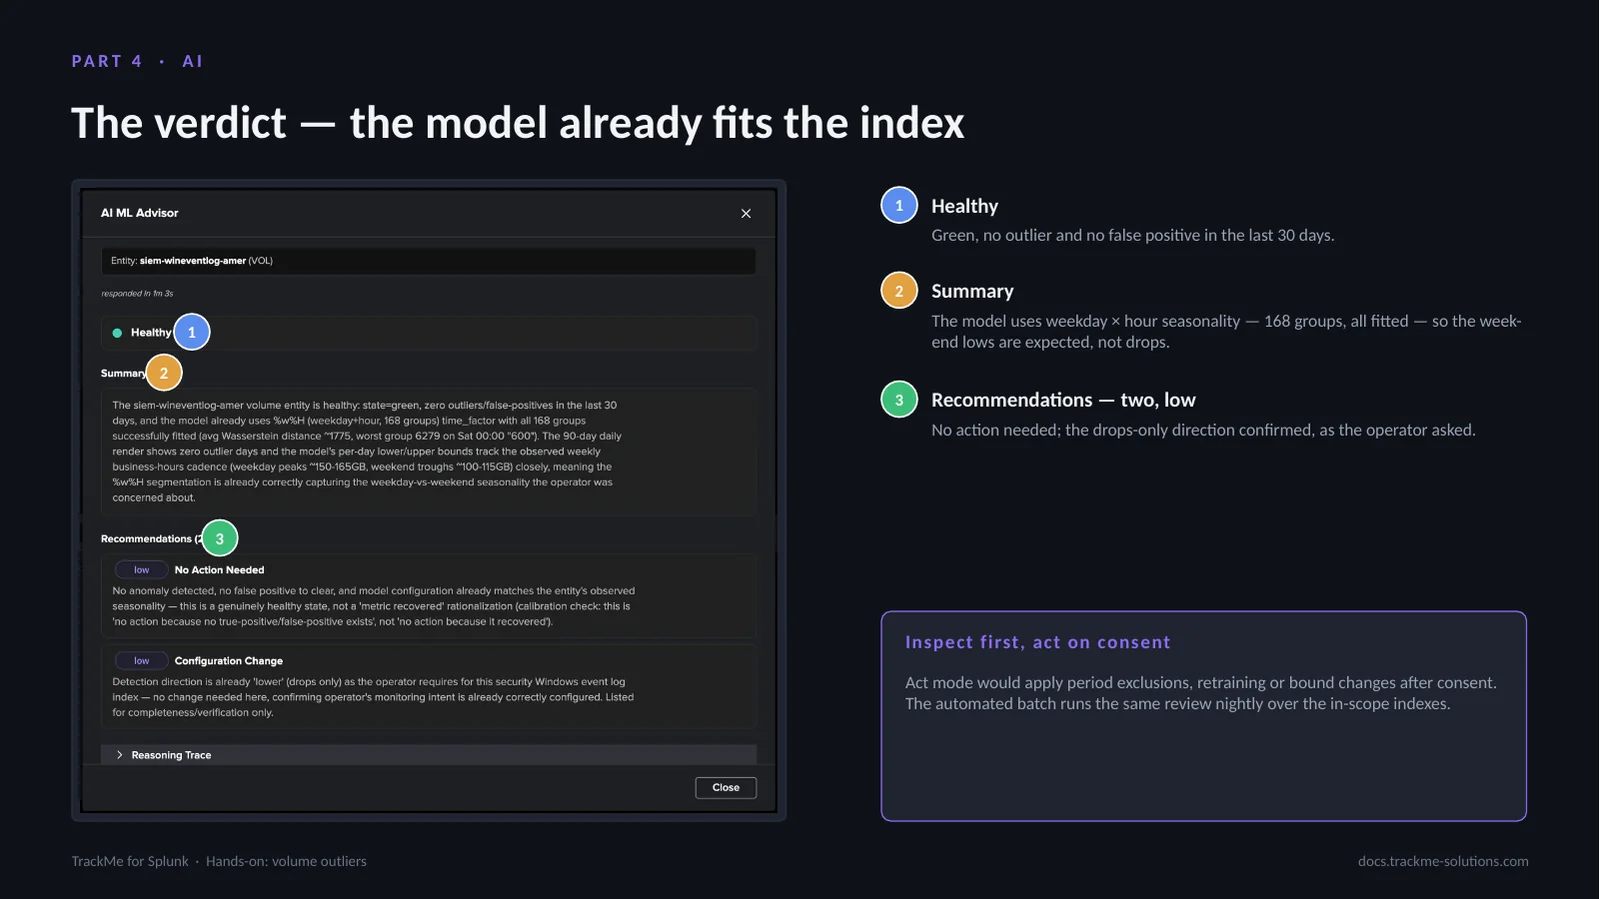
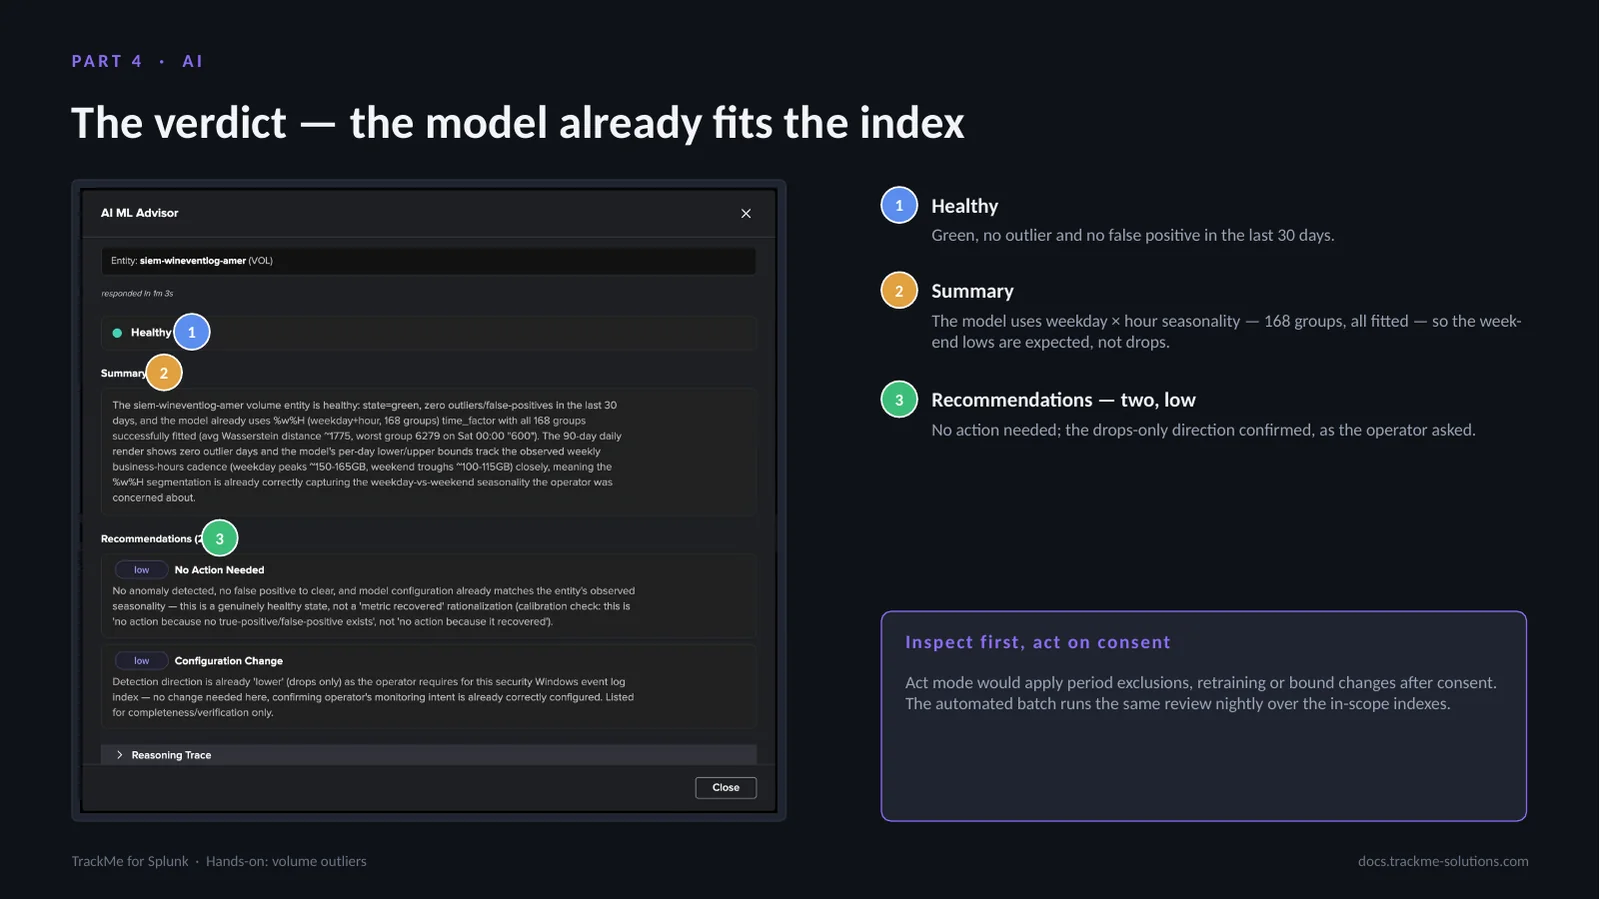
The verdict is Healthy (callout 1): green, with no outlier and no false positive in the last 30 days. The summary (callout 2) answers with evidence from the model itself: it uses weekday × hour seasonality, 168 groups, all fitted, so the week-end lows are expected rather than drops, and its bounds track the weekday peaks and the week-end troughs. The two recommendations (callout 3) are low: no action needed, the drops-only direction confirmed.
The advisor explains why nothing changes rather than rationalising a recovered metric; the reasoning trace shows every step. Act mode would apply period exclusions, retraining or bound changes after consent. The automated batch runs the same review nightly over the in-scope indexes.
Running cost of the component
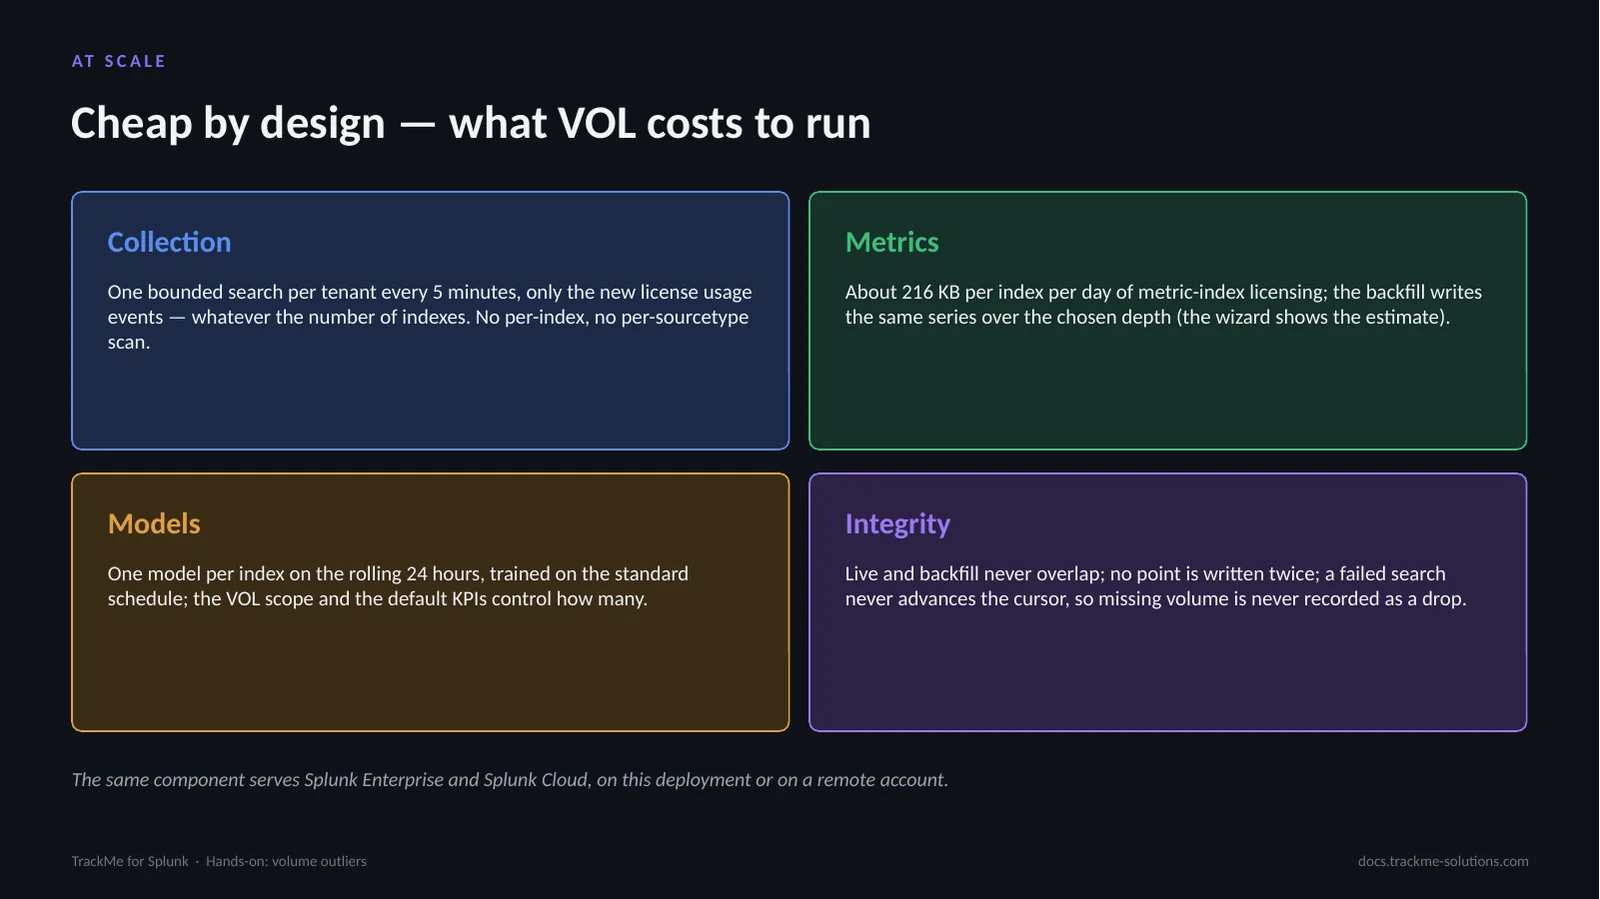
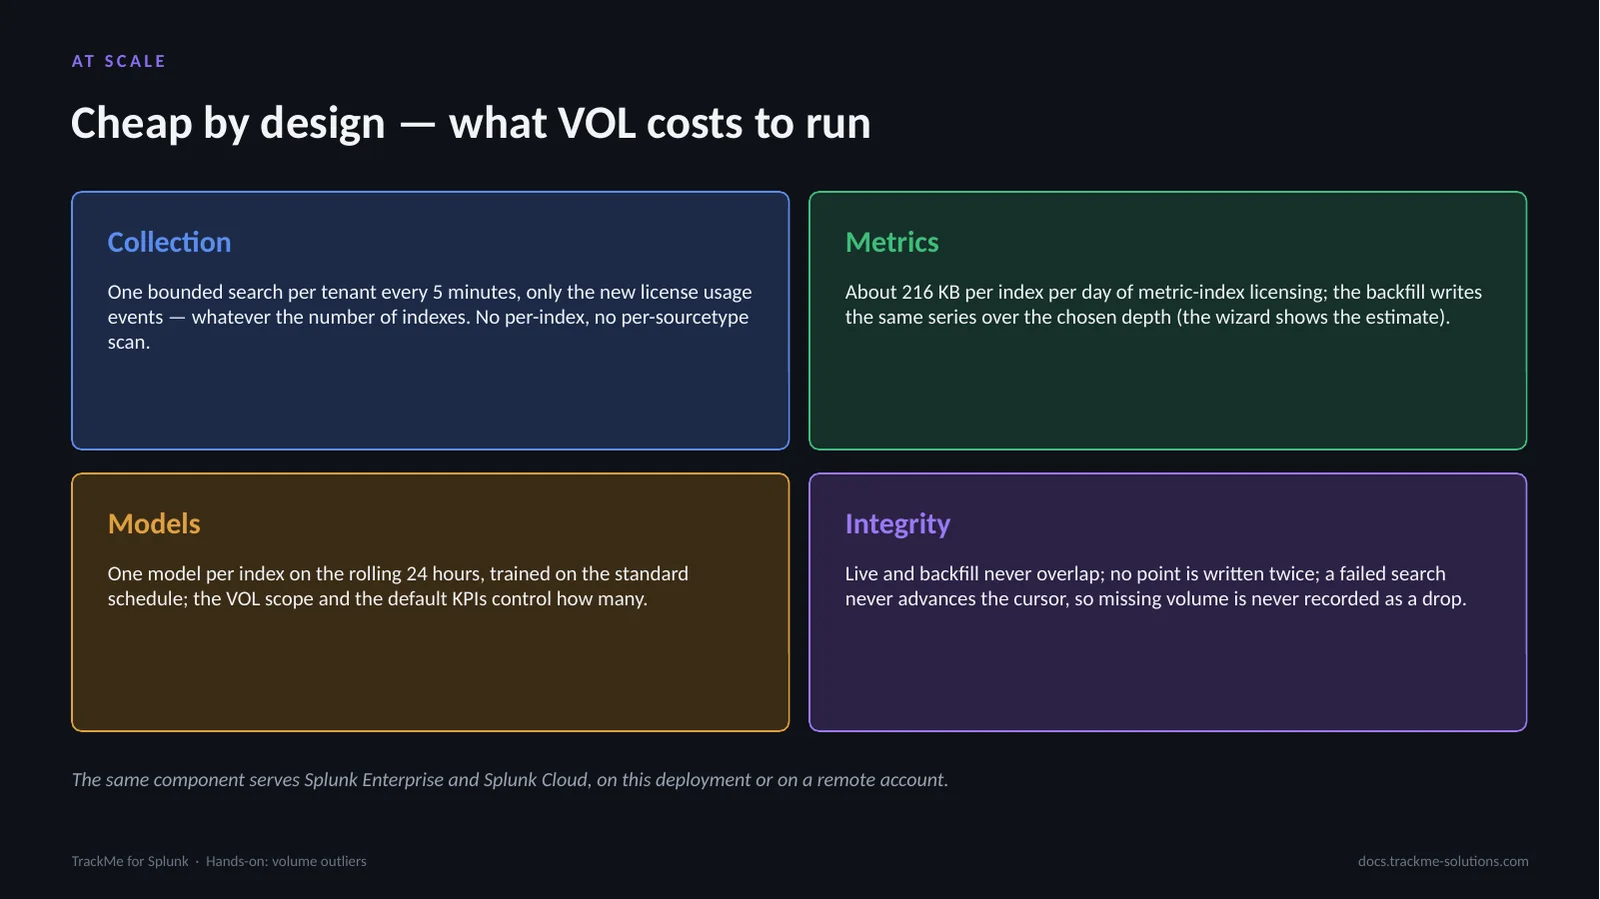
Collection is one bounded search per tenant every 5 minutes, reading only the new license usage events, whatever the number of indexes: no per-index and no per-sourcetype scan. Metrics cost about 216 KB per index per day of metric-index licensing; the backfill writes the same series over the chosen depth, and the wizard shows the estimate.
Models are one per index on the rolling 24 hours; the VOL scope and the default KPIs control how many. Live and backfill never overlap, no point is written twice, and a failed search never advances the cursor, so missing volume is never recorded as a drop. The rolling values come from the buckets TrackMe holds, not from its own metrics.
Where we are
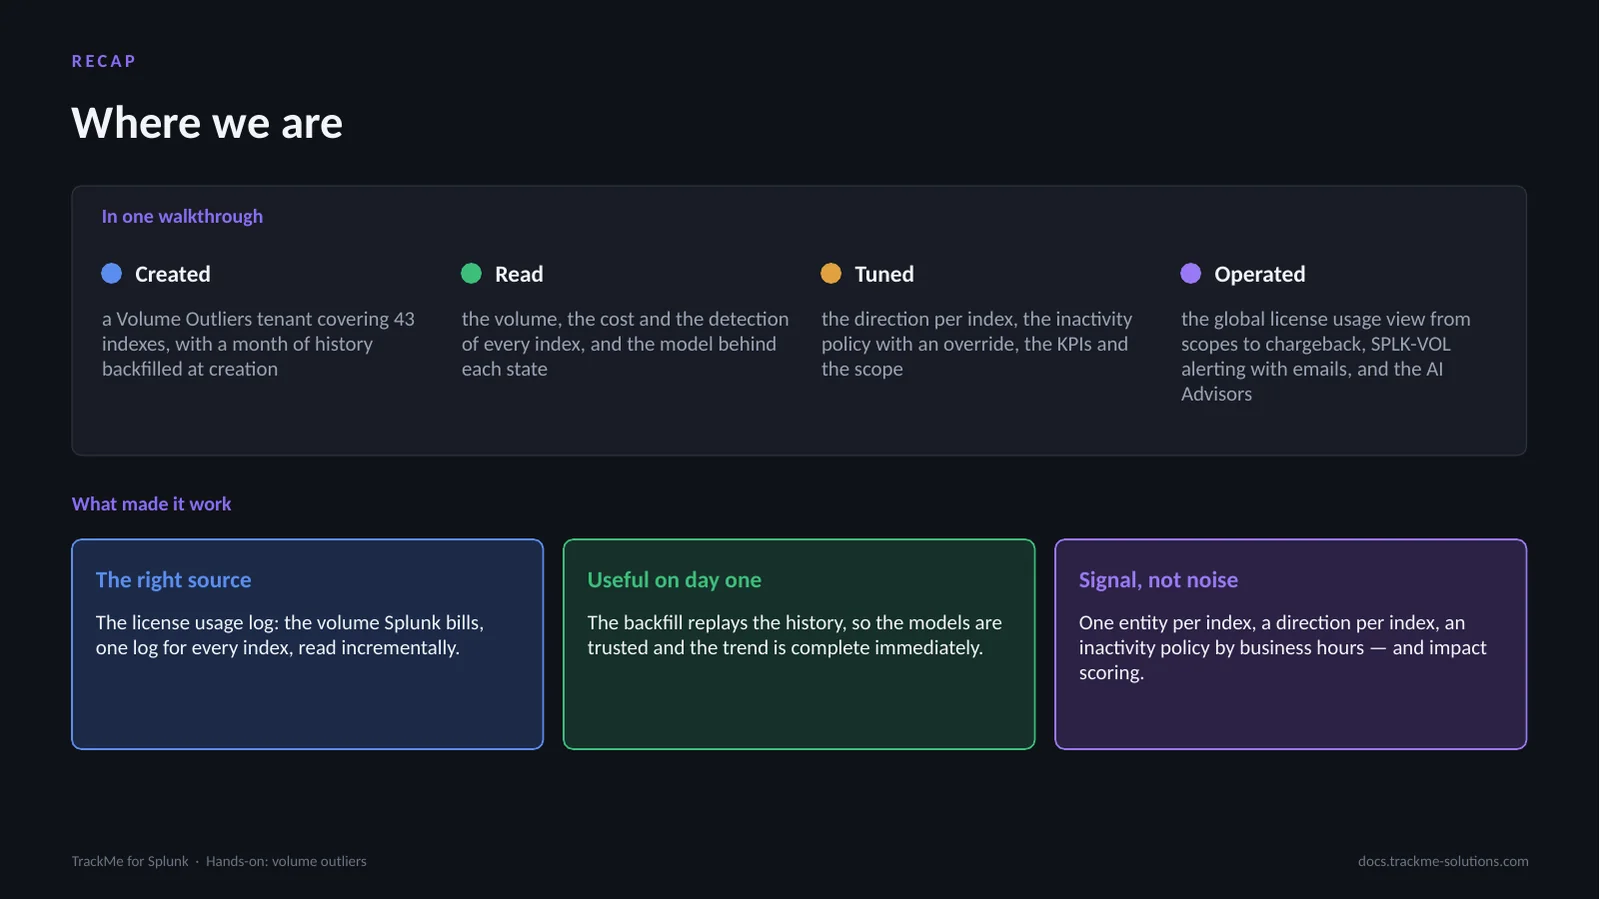
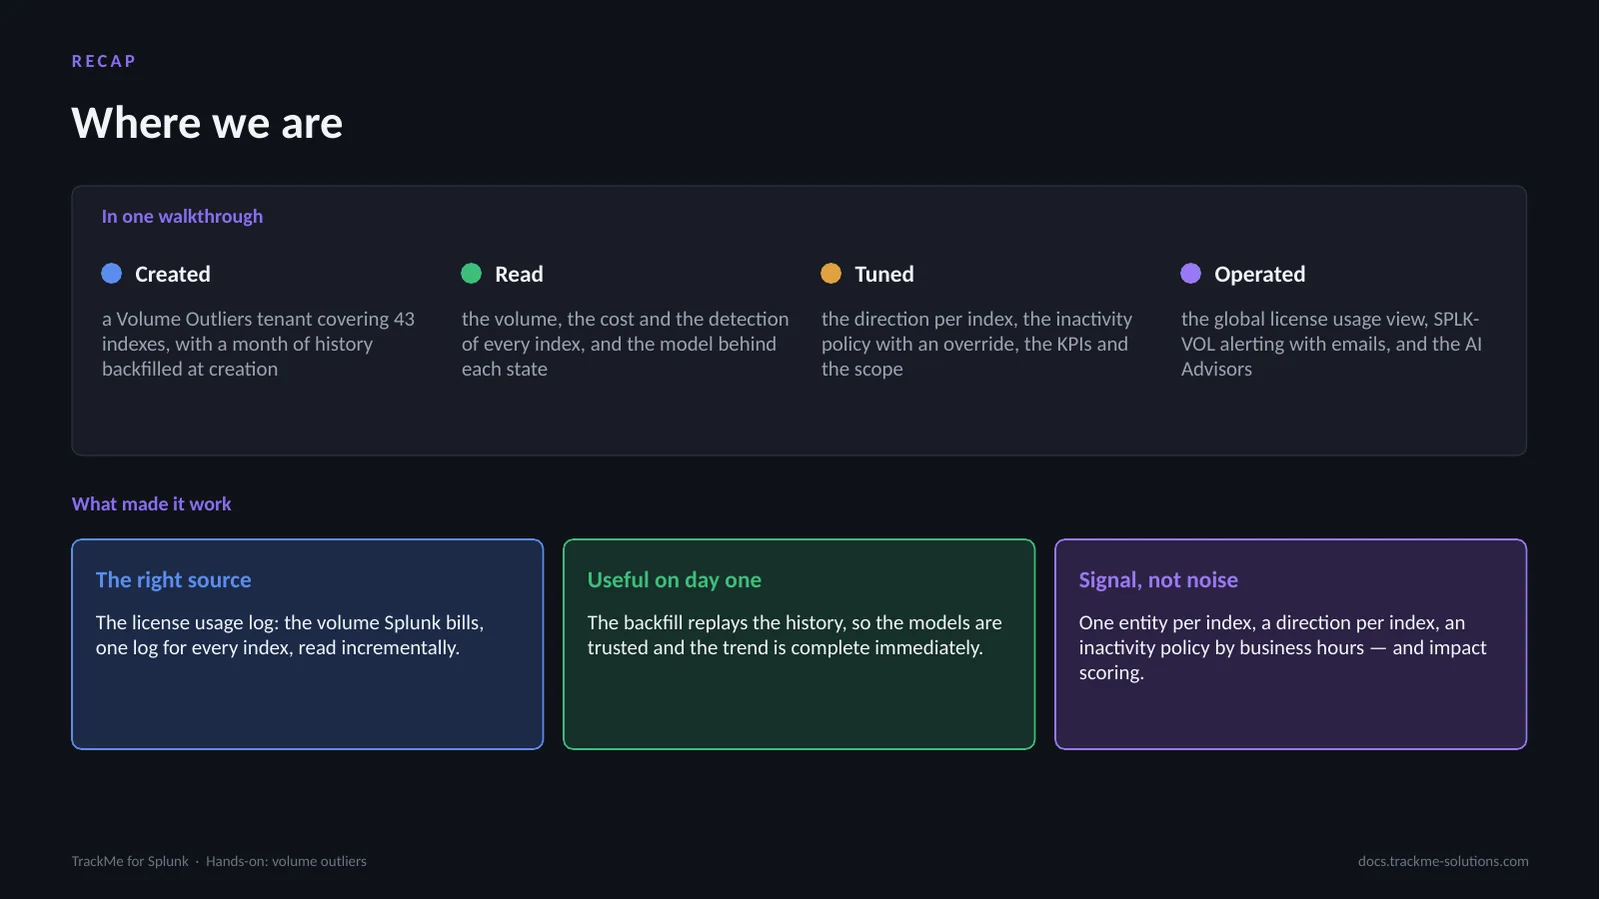
A Volume Outliers tenant covering 43 indexes was created with a month of history backfilled at creation; the volume, the cost and the detection of every index were read, with the model behind each state; the direction per index, the inactivity policy, the KPIs and the scope were tuned; and the global license usage view, from scopes and working days to days over quota and chargeback, SPLK-VOL alerting, the AI Assistant and the AI Advisors were put to use.
Three things make it work. The right source: the license usage log is the volume Splunk bills, read incrementally. Useful on day one: the backfill replays the history, so the models are trusted immediately. Signal, not noise: one entity per index, a direction per index, an inactivity policy by business hours, and impact scoring.