Consuming TrackMe data from your own dashboards
A frequent question from teams that run TrackMe: “I want to show TrackMe’s entity status counts — total, red, orange, green — on my own department dashboard, or pull the entity table into another system. How do I get at that data?”
Everything the TrackMe UI displays comes from its REST API, and TrackMe ships SPL wrappers around that API. This page walks through the options, from the quickest way to get the headline counts to bulk access to every entity record, and the sharing-level prerequisite you need in place first when your dashboard lives outside the TrackMe app.
Prerequisite: sharing level and permissions
TrackMe’s custom commands (trackmegetcoll, trackme …) and the per-tenant KV-store
collections and lookup definitions it creates are Splunk knowledge objects. By default,
TrackMe shares them at the application level only: a search that runs in the context of
another app (a dashboard in your own app, for instance) cannot see them, and the command
reports as unknown even though the user is otherwise entitled to use it.
Important
Granting permissions on the individual command is not enough. The visibility of the objects is governed by the sharing level of the TrackMe application, and by the sharing level TrackMe applies to the knowledge objects it creates for each tenant.
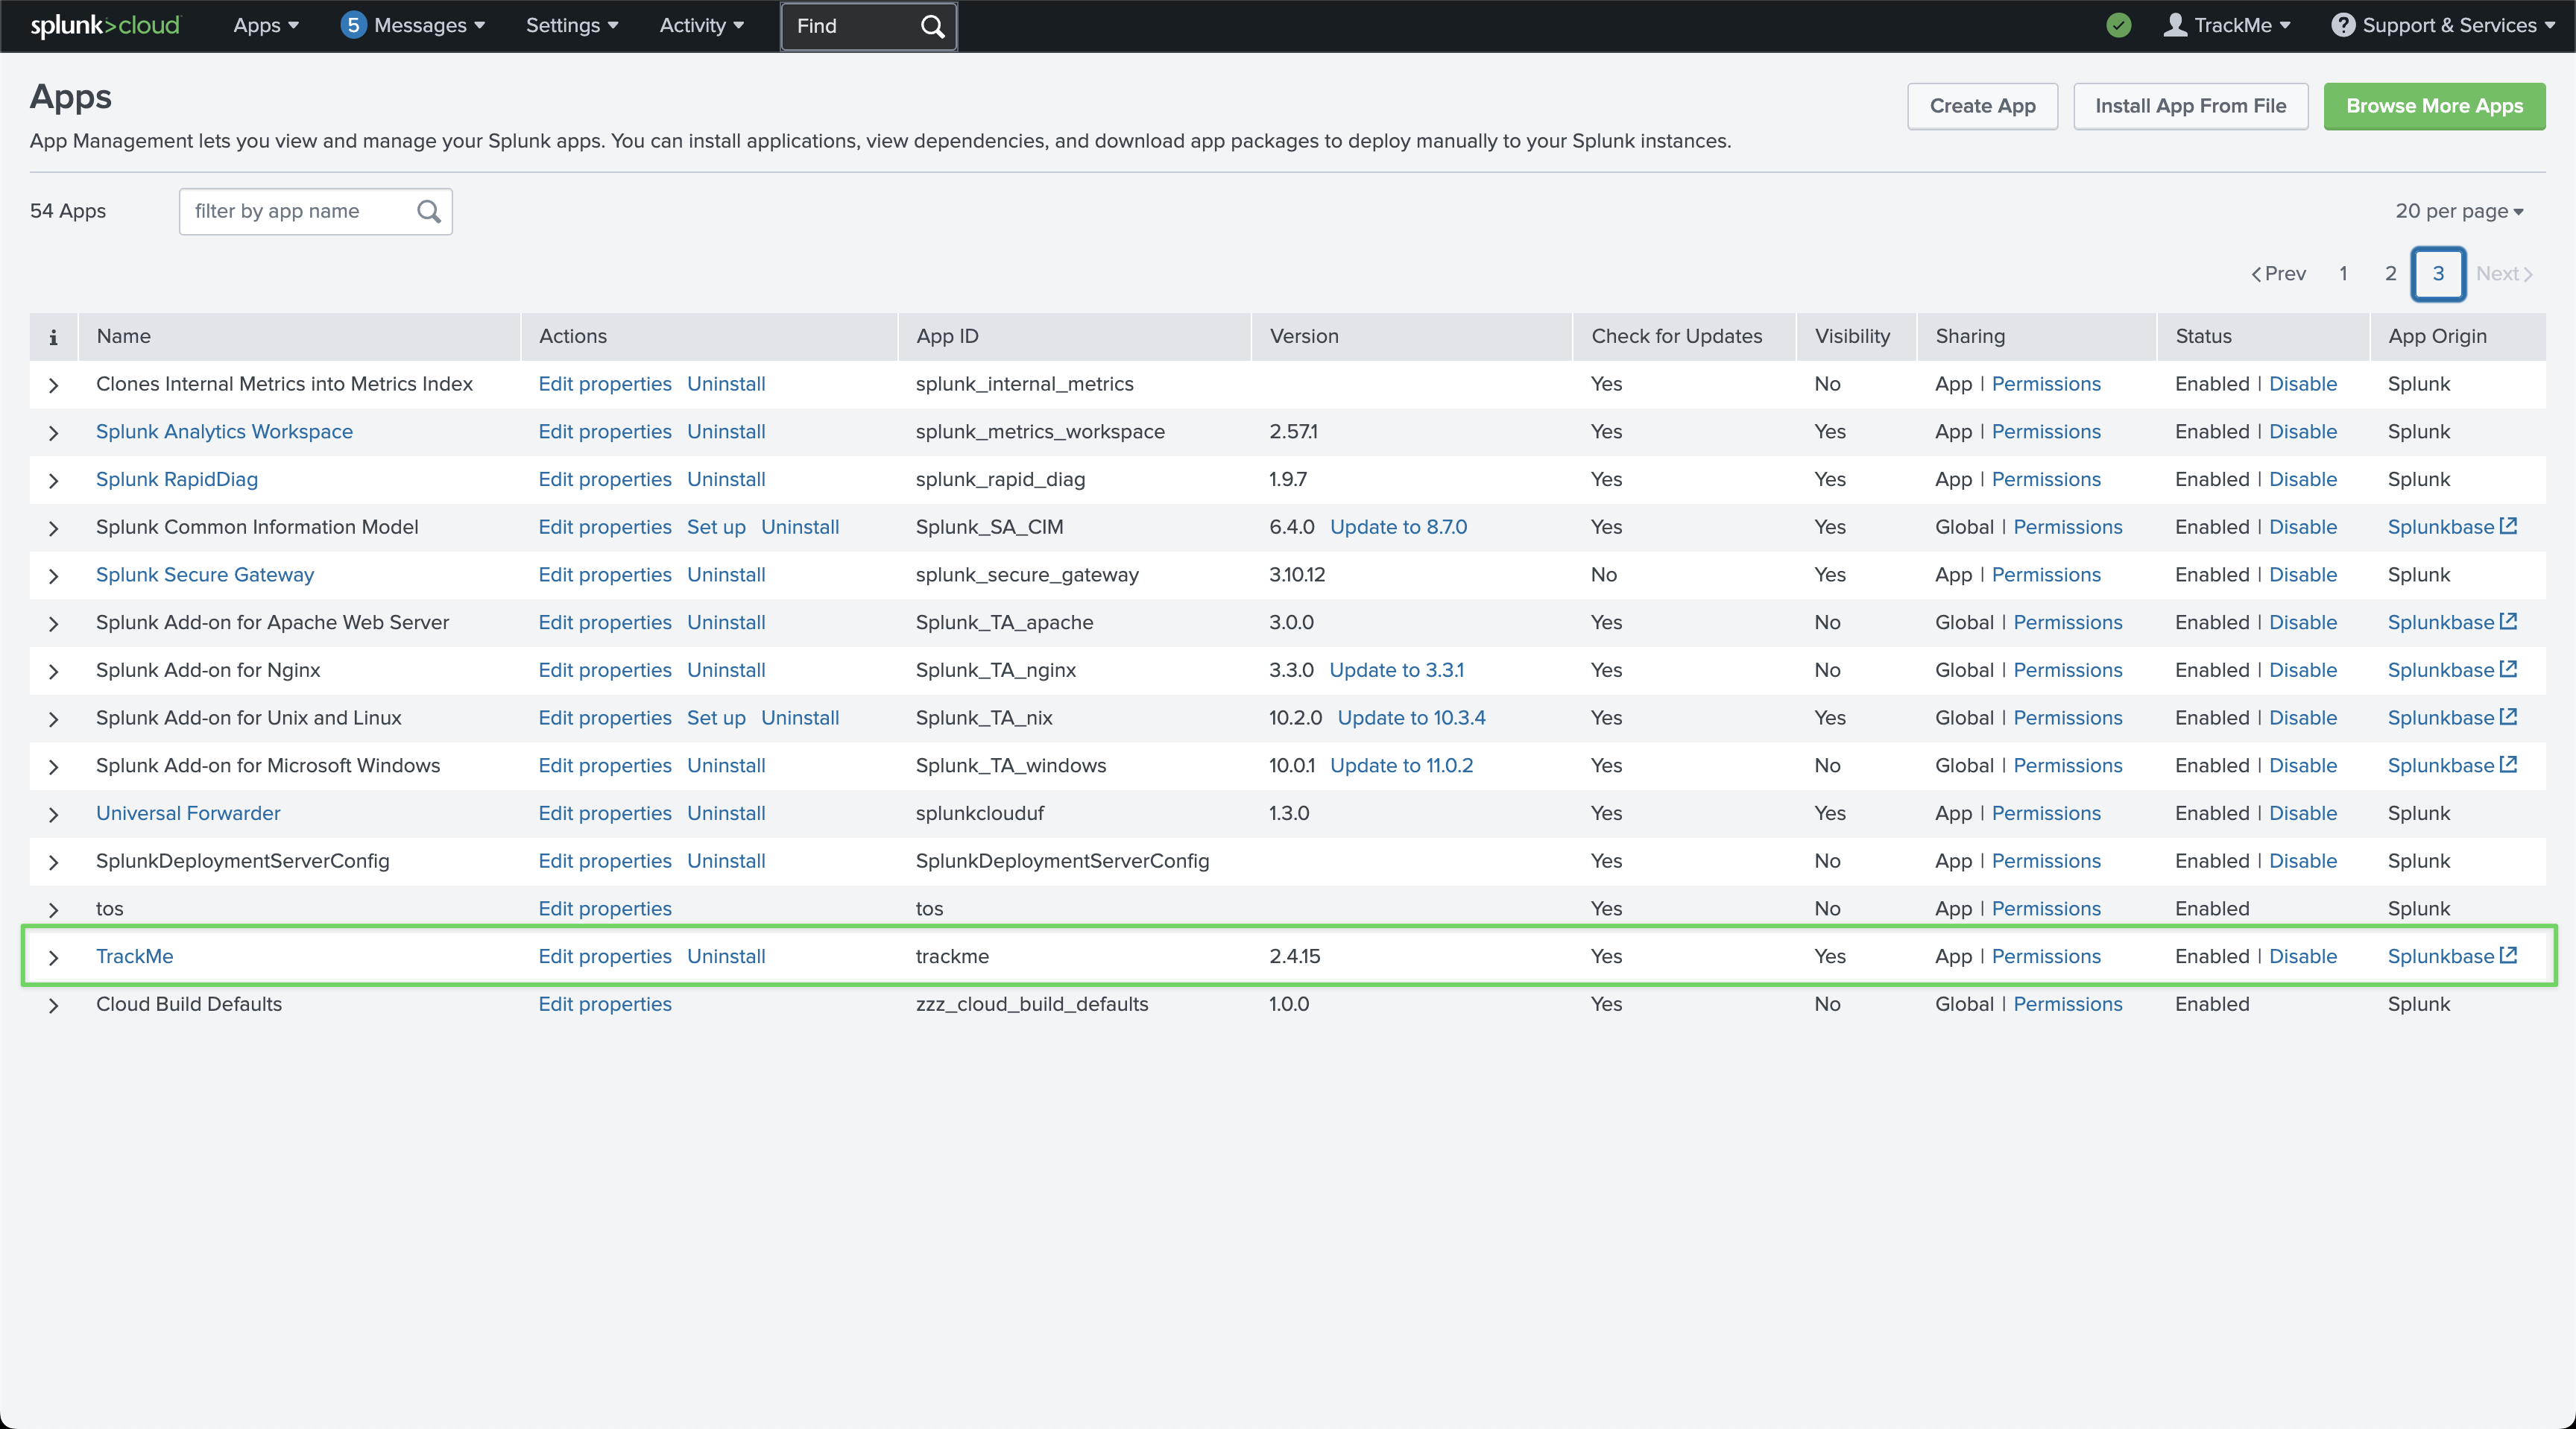
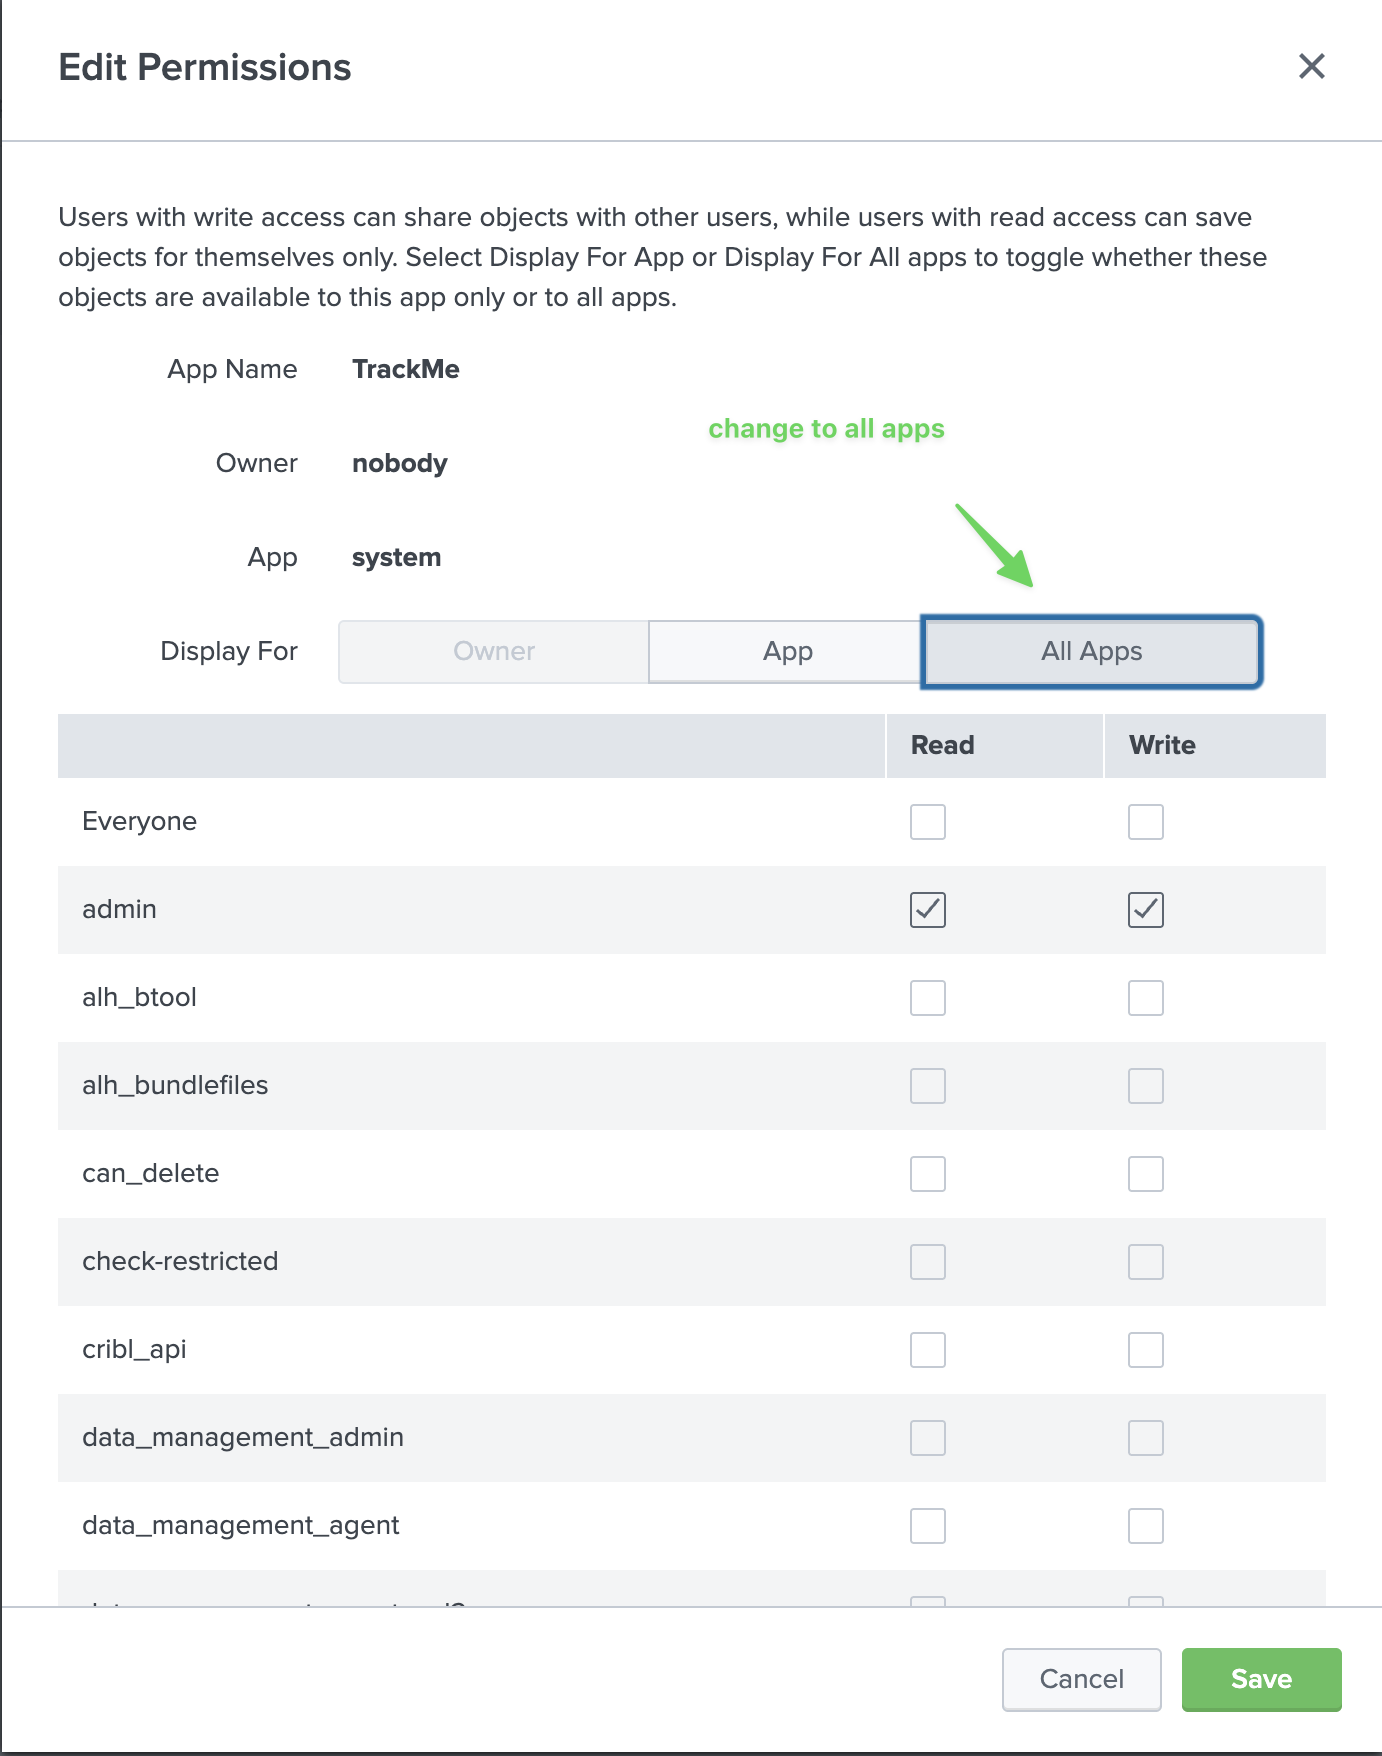
Step 1 — share the TrackMe application globally
In Splunk Web, open Apps → Manage Apps, locate TrackMe and click Permissions:
Set Display For to All Apps and save:
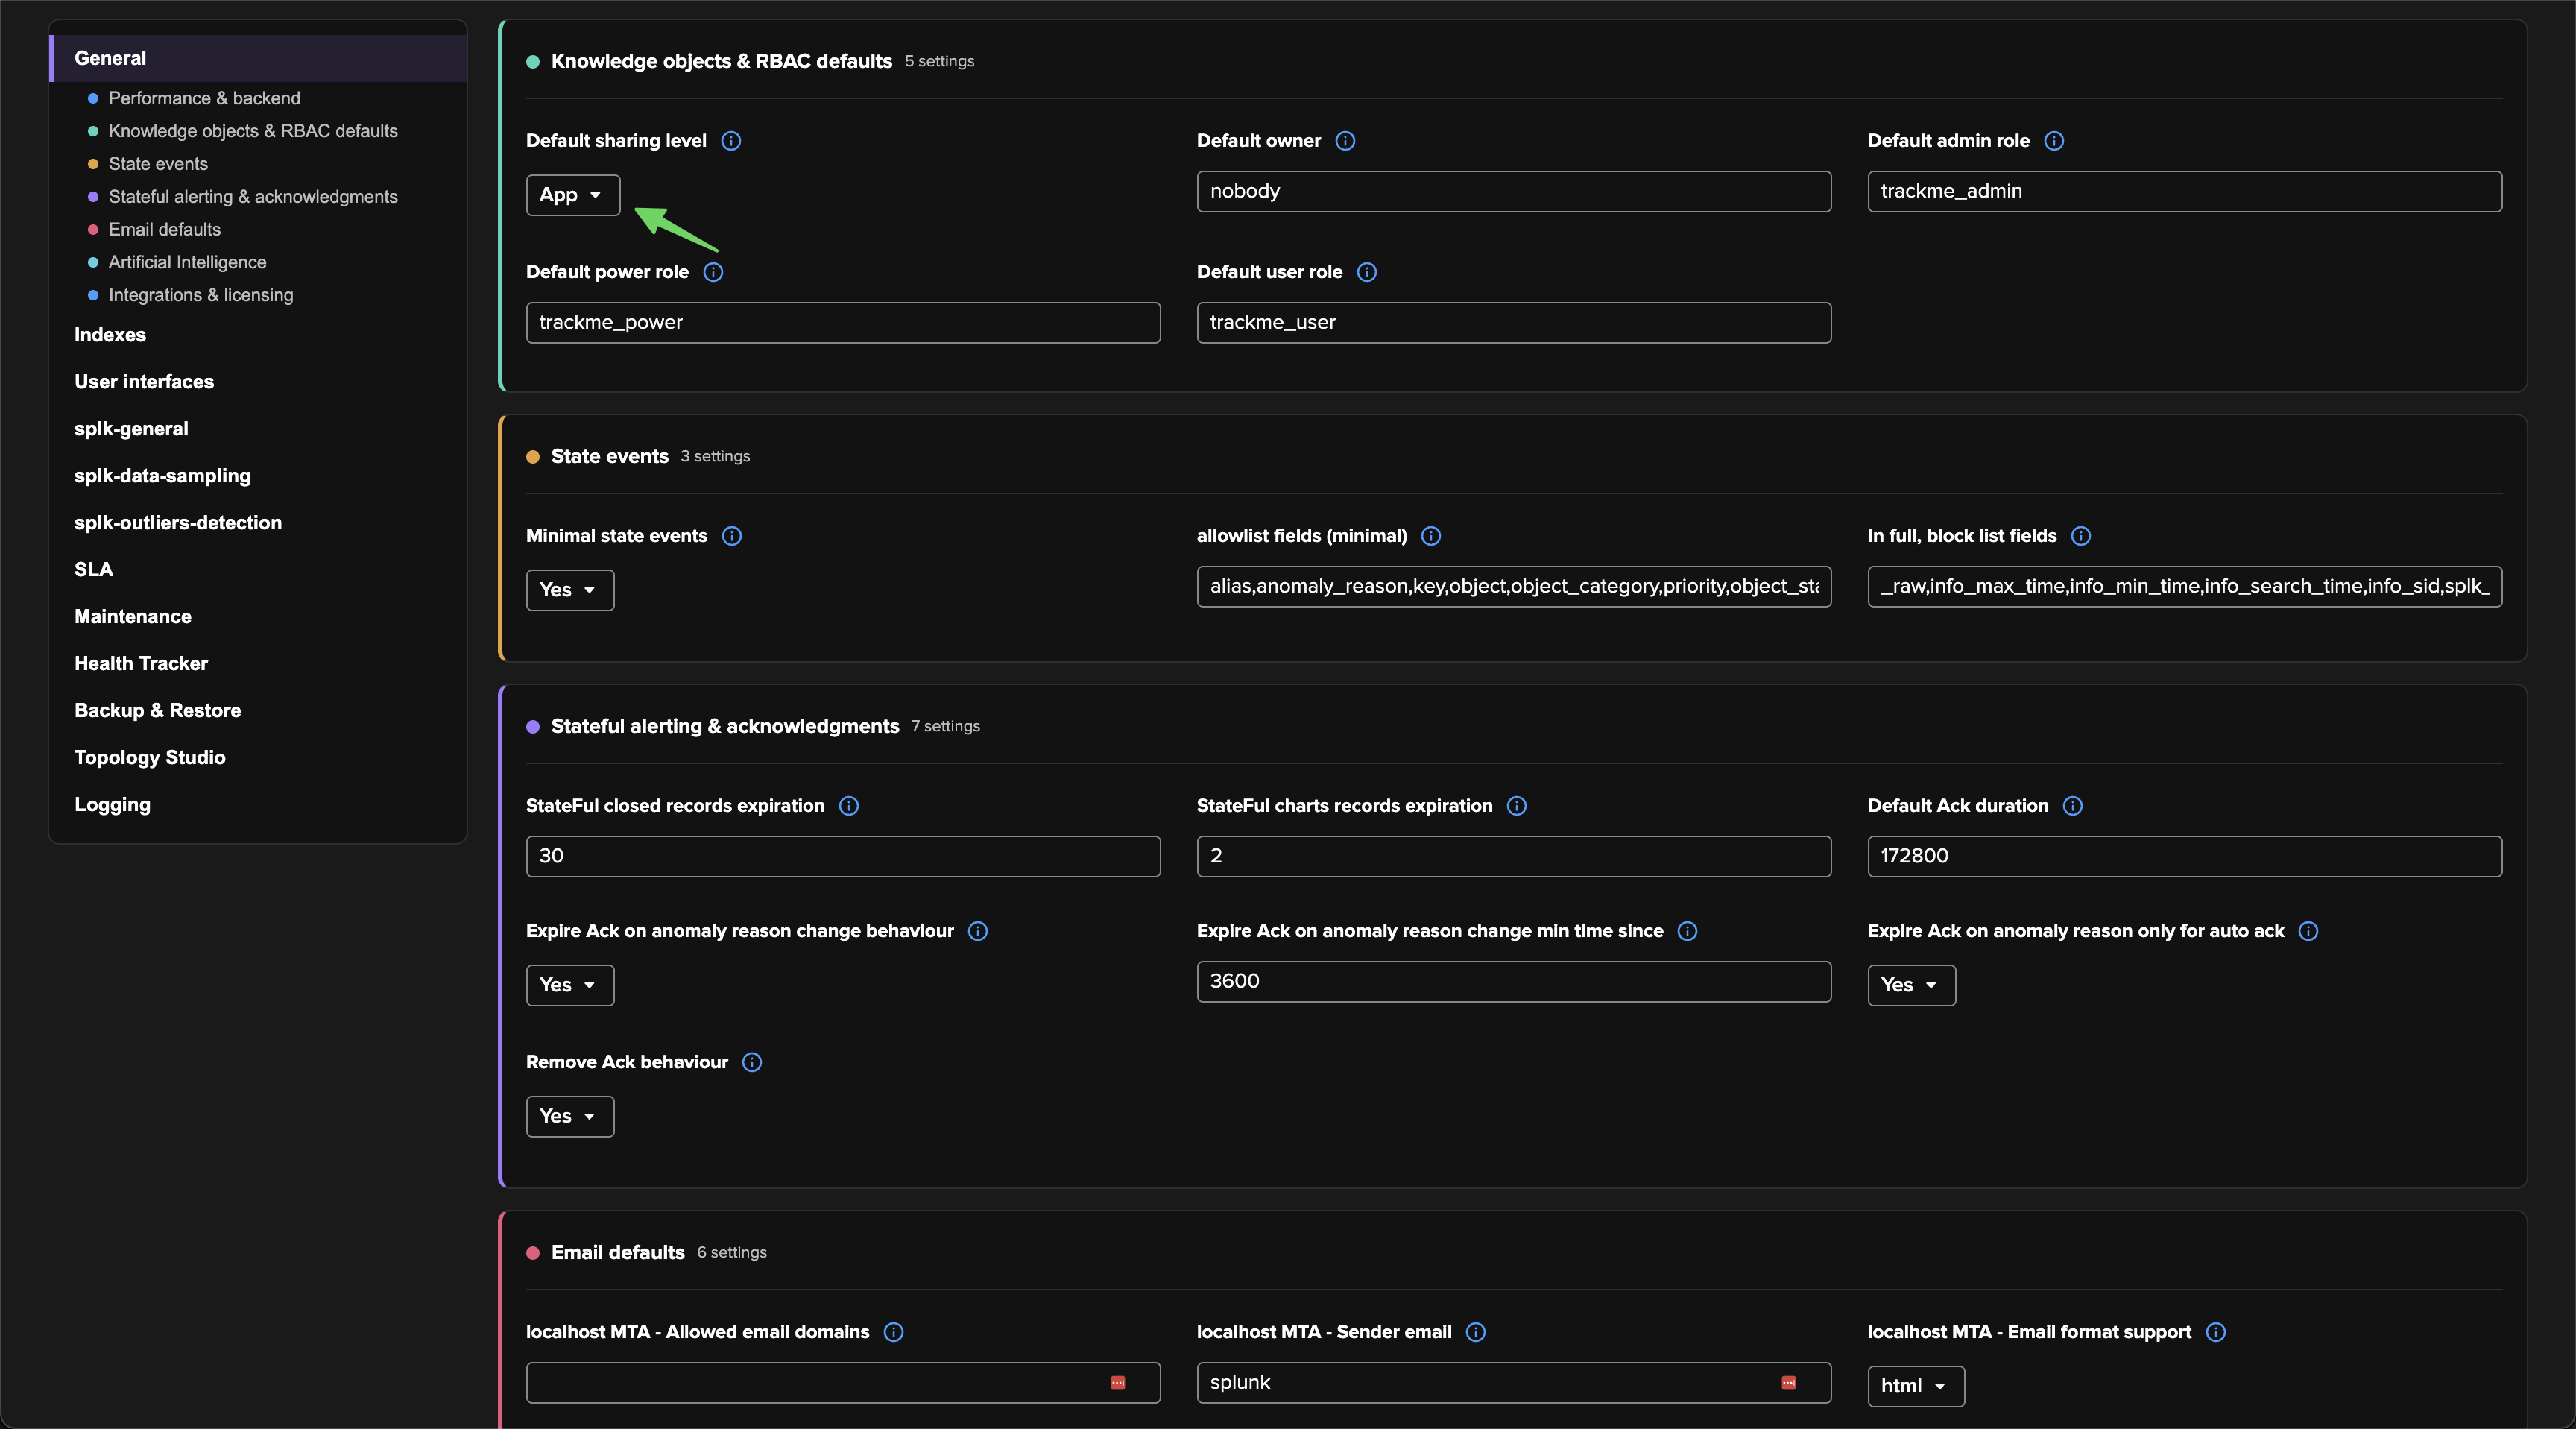
Step 2 — set TrackMe’s default sharing level to global
Sharing the app exports the objects that exist today. TrackMe also creates knowledge objects on an ongoing basis (a new tenant creates its own collections, lookup definitions and scheduled searches), so tell it to create future objects at the global level too. Open Configuration → System settings → General, then in the Knowledge objects & RBAC defaults group set Default sharing level to Global:
Step 3 — check the user’s access
Whichever access path you use, the user running the search needs the TrackMe user
capability (trackmeuseroperations, typically through the trackme_user role) and
must be a member of one of the roles granted on the Virtual Tenant. Tenant RBAC is
enforced by the API on every read, so a user who cannot open the tenant in the UI gets no
data from SPL or REST either. See Roles & access control.
Option 1 — the headline counts, without any SPL processing
If all you need are the summary figures shown at the top of a tenant — total entities, and
how many are red, orange, green, or in alert by priority — do not recompute them yourself.
The decision maker precomputes these counts for every component of every tenant, and the
cached_stats endpoint returns them in a single, very cheap read:
| trackme mode=get url="/services/trackme/v2/component/cached_stats?tenant_id=<tenant_id>"
Add &component=dsm (or dhm, mhm, flx, fqm, wlk) to restrict the
response to one component. The result is a JSON document with one block per component:
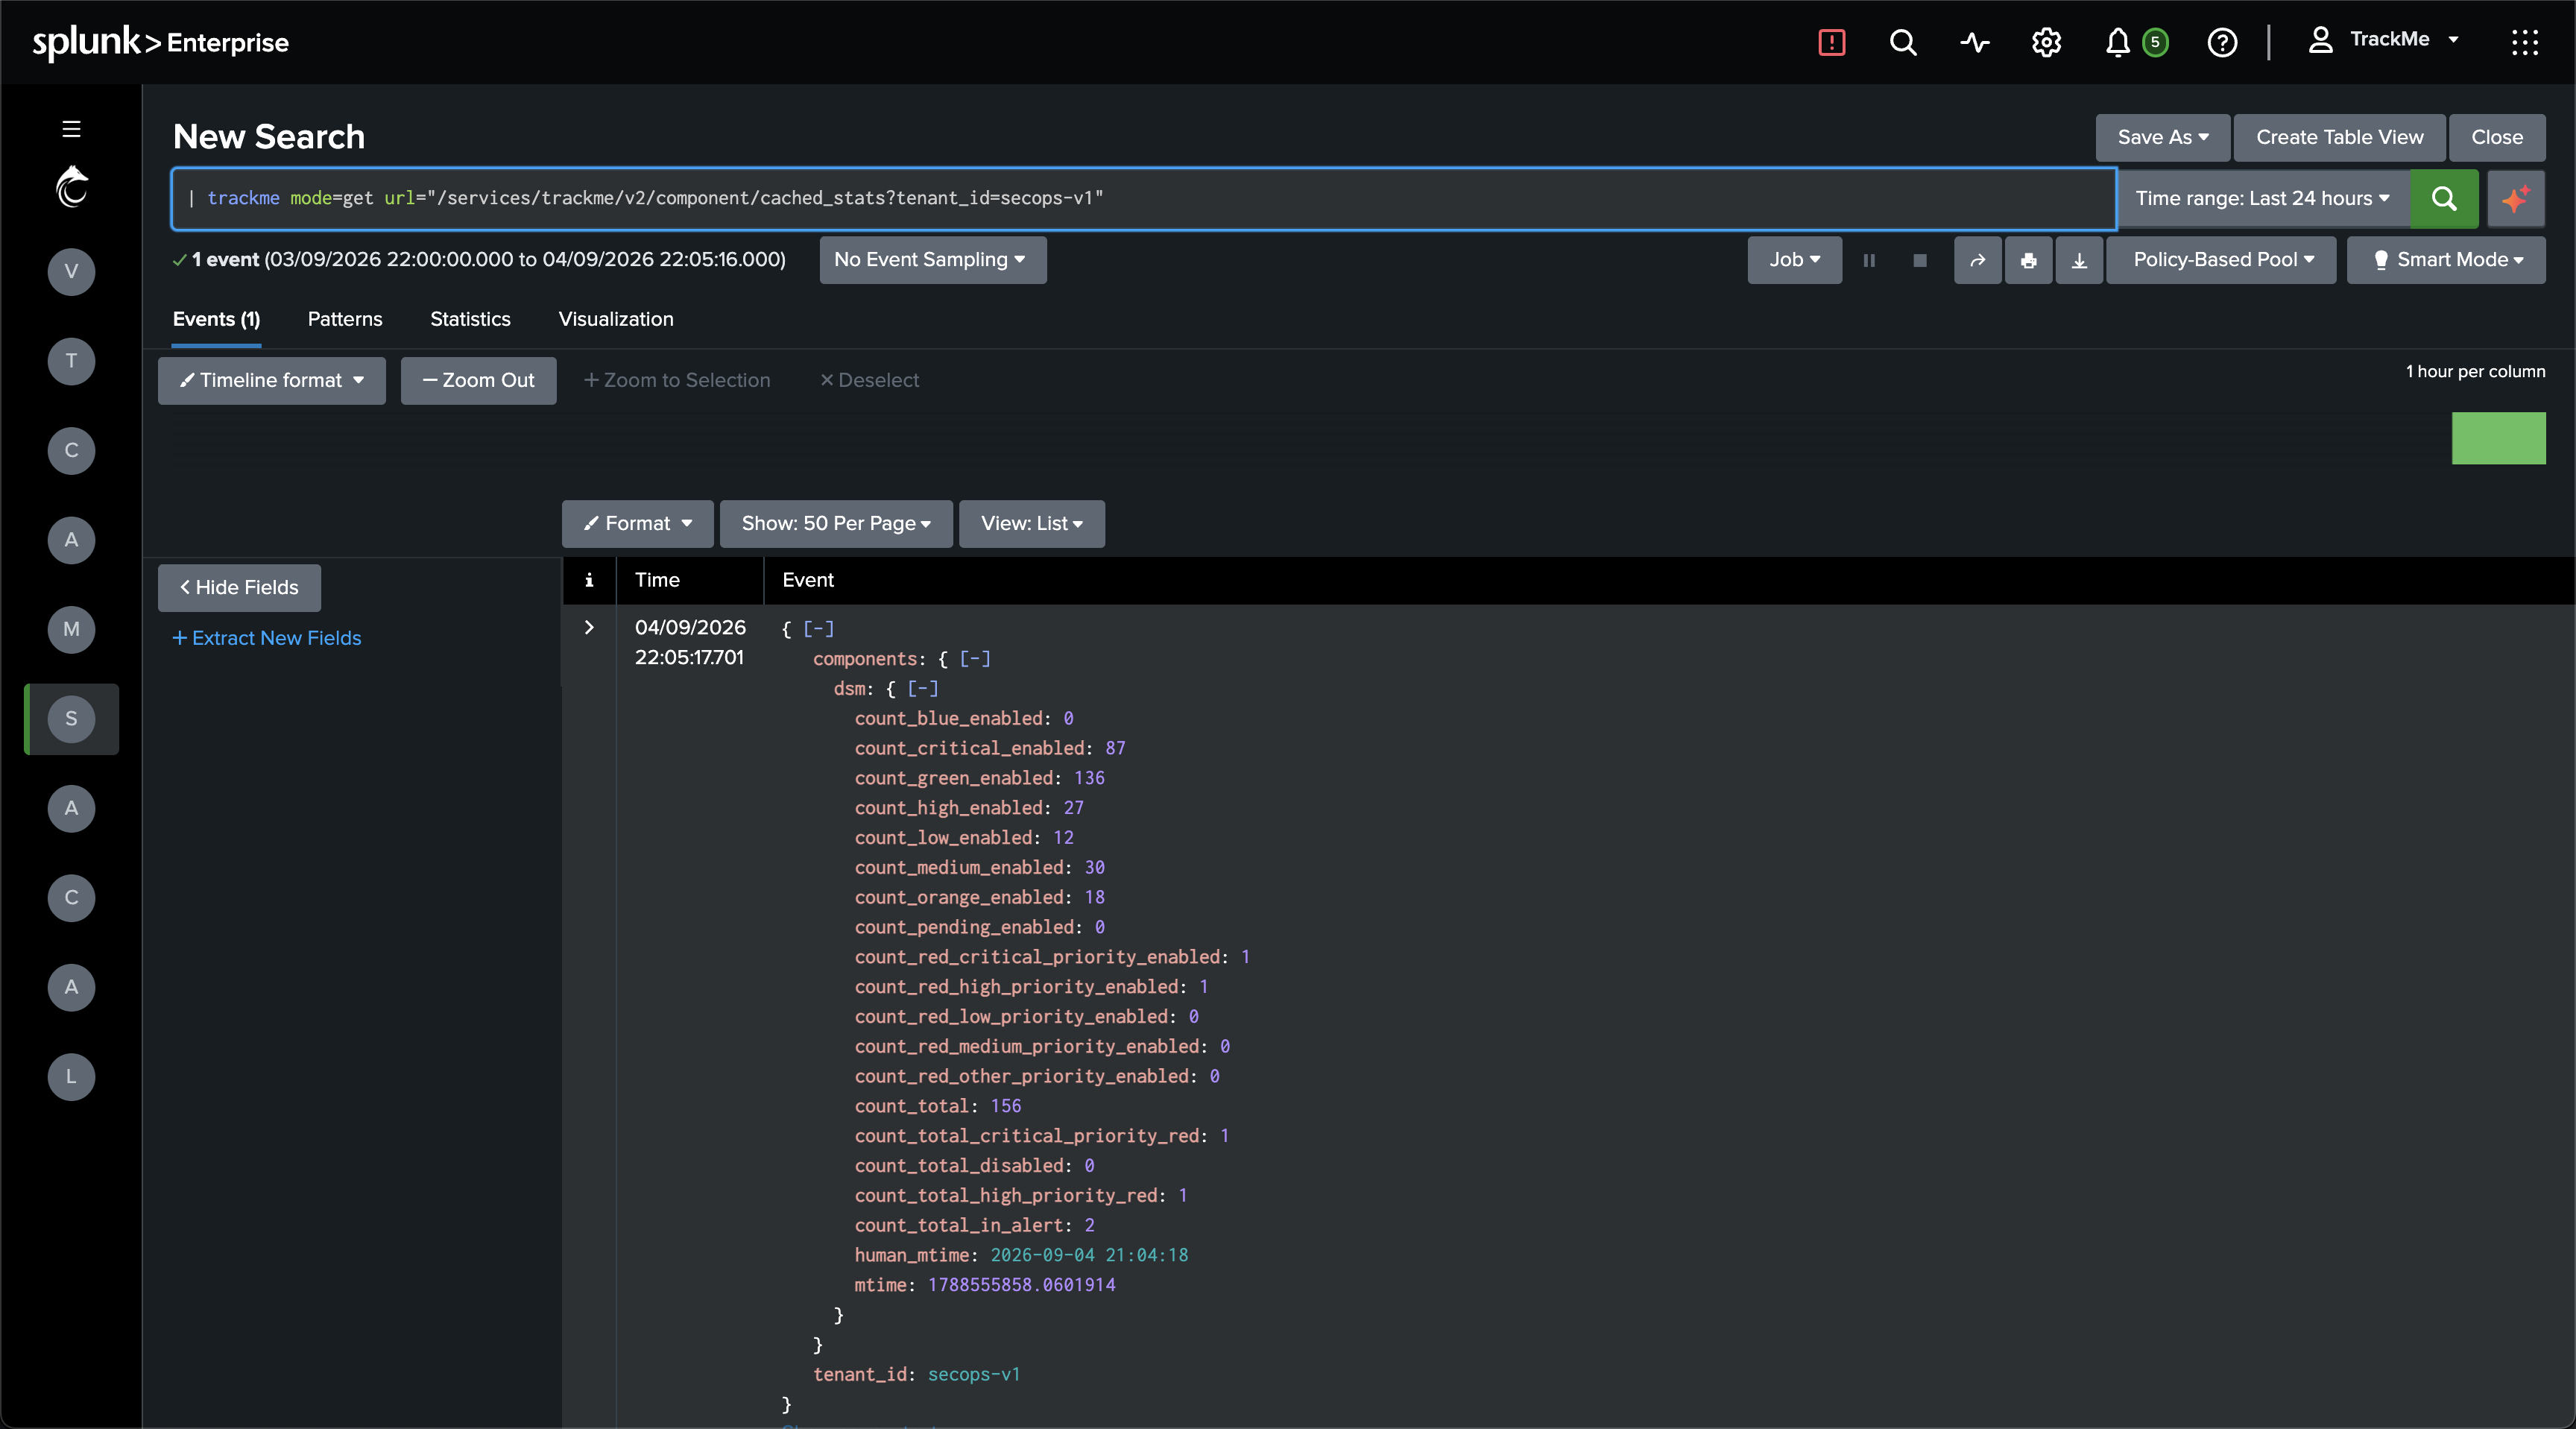
The fields you will most often use:
Field |
Meaning |
|---|---|
|
All entities of the component, including disabled ones. |
|
Entities whose monitoring is disabled. |
|
Enabled entities currently in that state. |
|
Enabled entities currently red, regardless of priority. |
|
Red entities broken down by priority. |
|
Enabled entities broken down by priority, whatever their state. |
|
When the counts were last refreshed. |
To reproduce the tiles from the tenant home in your own dashboard, flatten the JSON with
spath:
| trackme mode=get url="/services/trackme/v2/component/cached_stats?tenant_id=<tenant_id>"
| spath path=components.dsm output=dsm
| spath input=dsm
| eval entities = count_total - count_total_disabled,
       red = count_total_in_alert,
       orange = count_orange_enabled,
       green = count_green_enabled
| table entities, red, orange, green
The same counts are also available from the trackmegetcoll command with
mode=cachedstats, which is what TrackMe’s own tenant_get_info macro uses:
| trackmegetcoll tenant_id=<tenant_id> component=dsm mode=cachedstats
Note
Both forms return the cached figures. If the cache is older than about 15 minutes for a
component, trackmegetcoll mode=cachedstats transparently recomputes the counts from
the live entity records instead; mode=stats always recomputes.
From outside Splunk, the same endpoint answers a plain HTTP GET:
curl -k -H "Authorization: Bearer <token>" \
  "https://<splunk>:8089/services/trackme/v2/component/cached_stats?tenant_id=<tenant_id>"
Option 2 — the entity records in SPL with trackmegetcoll
To work with the entities themselves — build your own table, filter on a field, count by
anything — use the trackmegetcoll generating command. It is the exact search TrackMe
runs behind the Search table button of a component tab:
| trackmegetcoll tenant_id=<tenant_id> component=<component>
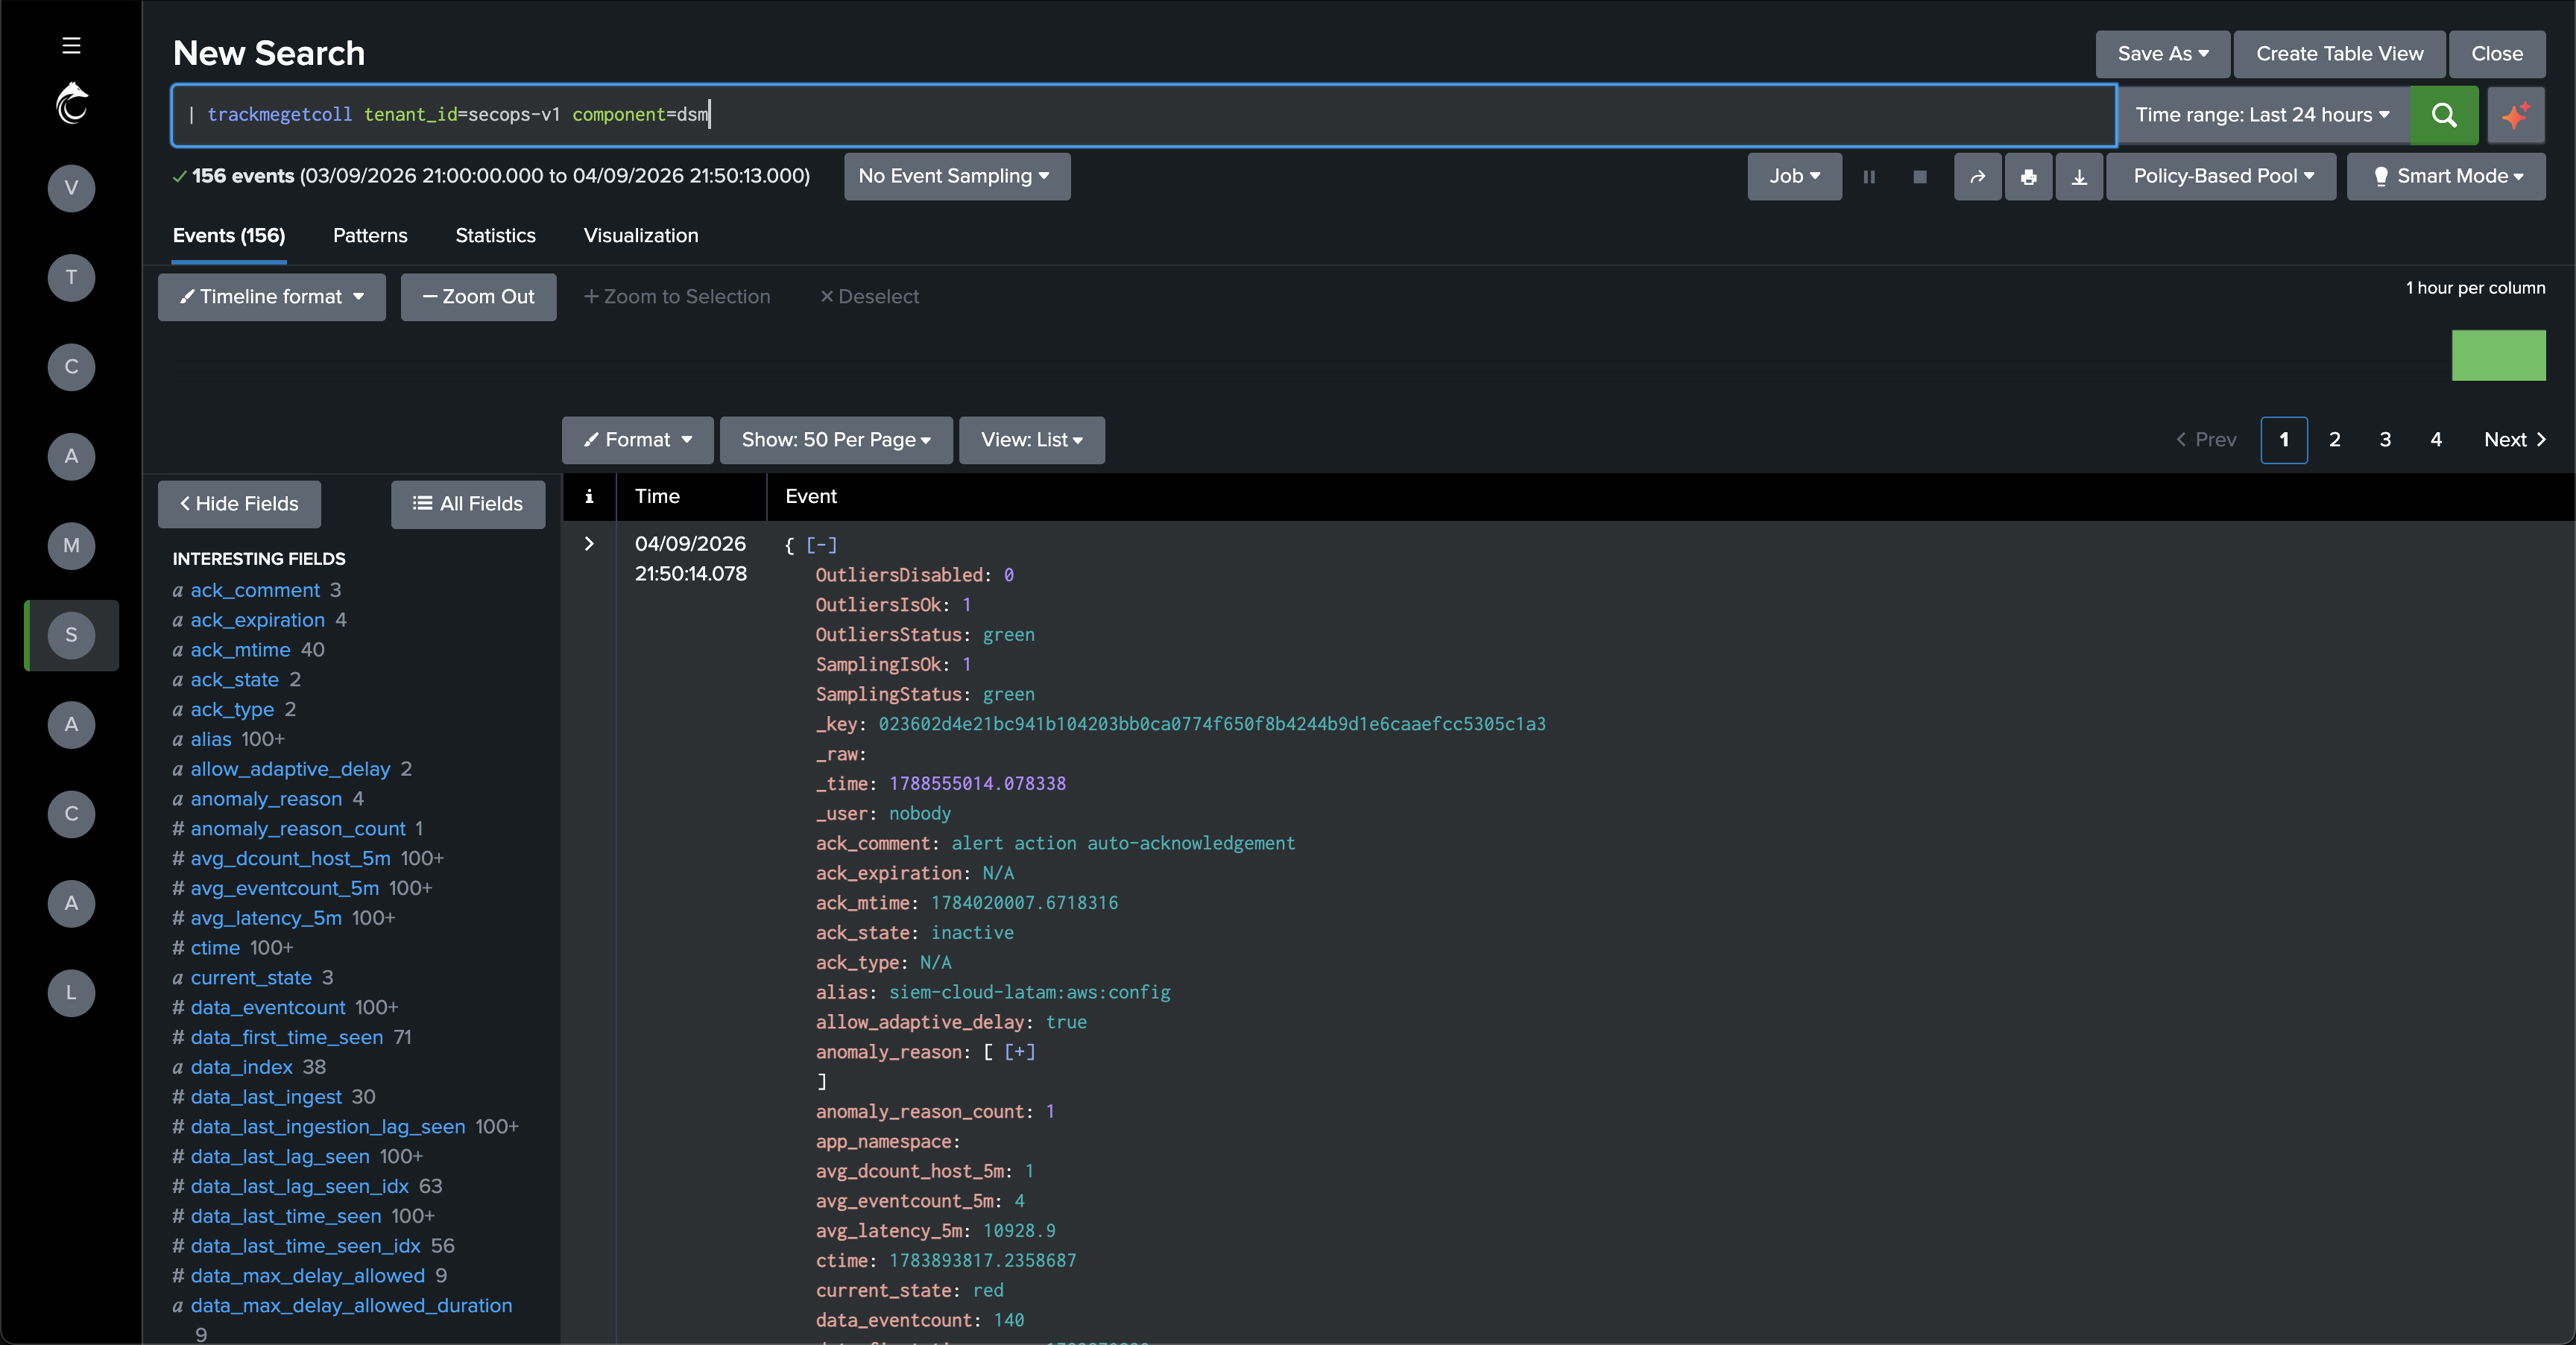
Each result is one entity with every field the UI shows: object, alias,
object_state, priority, anomaly_reason (as a multivalue field), tags,
monitored_state, the latency and delay metrics, the status message, and so on. The
records are processed by the decision maker in real time — states, refreshed dates and
enrichments are computed on the fly — so what you get is exactly what the UI would show at
that moment.
Options of the command:
Option |
Description |
|---|---|
|
Required. The tenant identifier. |
|
Required. One of |
|
|
|
Return a single entity, by its key or by its |
|
|
Then use any SPL you like. For instance, the same headline counts as Option 1, computed from the live records:
| trackmegetcoll tenant_id=<tenant_id> component=dsm
| where monitored_state="enabled"
| stats count as entities,
        count(eval(object_state="red")) as red,
        count(eval(object_state="orange")) as orange,
        count(eval(object_state="green")) as green
Or a list of what is currently in alert, with the reason:
| trackmegetcoll tenant_id=<tenant_id> component=dsm
| where object_state="red" AND monitored_state="enabled"
| table object, priority, anomaly_reason, status_message
Tip
Because the command is a wrapper around the load_component_data API endpoint, the
results honour tenant RBAC and reflect the live state, at the cost of one decision-maker
run per search. On large tenants the command automatically serves the records from the
shadow cache described below, so this stays fast.
Option 3 — reading the KV-store collections directly
Important
Recommendation: read the shadow collection
If you want to consume TrackMe data through the KV-store in Splunk, use the shadow
collection, trackme_<component>_shadow_tenant_<tenant_id>, described just below. It
holds the entities after processing by the decision maker, is near real time, and is
what the TrackMe UI itself reads. The raw per-tenant collection is documented first only
so you know what it is and why it is not the right source for entity status.
TrackMe stores the core data of each component in a per-tenant KV-store collection, exposed through a lookup definition named:
trackme_<component>_tenant_<tenant_id>
You can read it with inputlookup like any other collection:
| inputlookup trackme_<component>_tenant_<tenant_id>
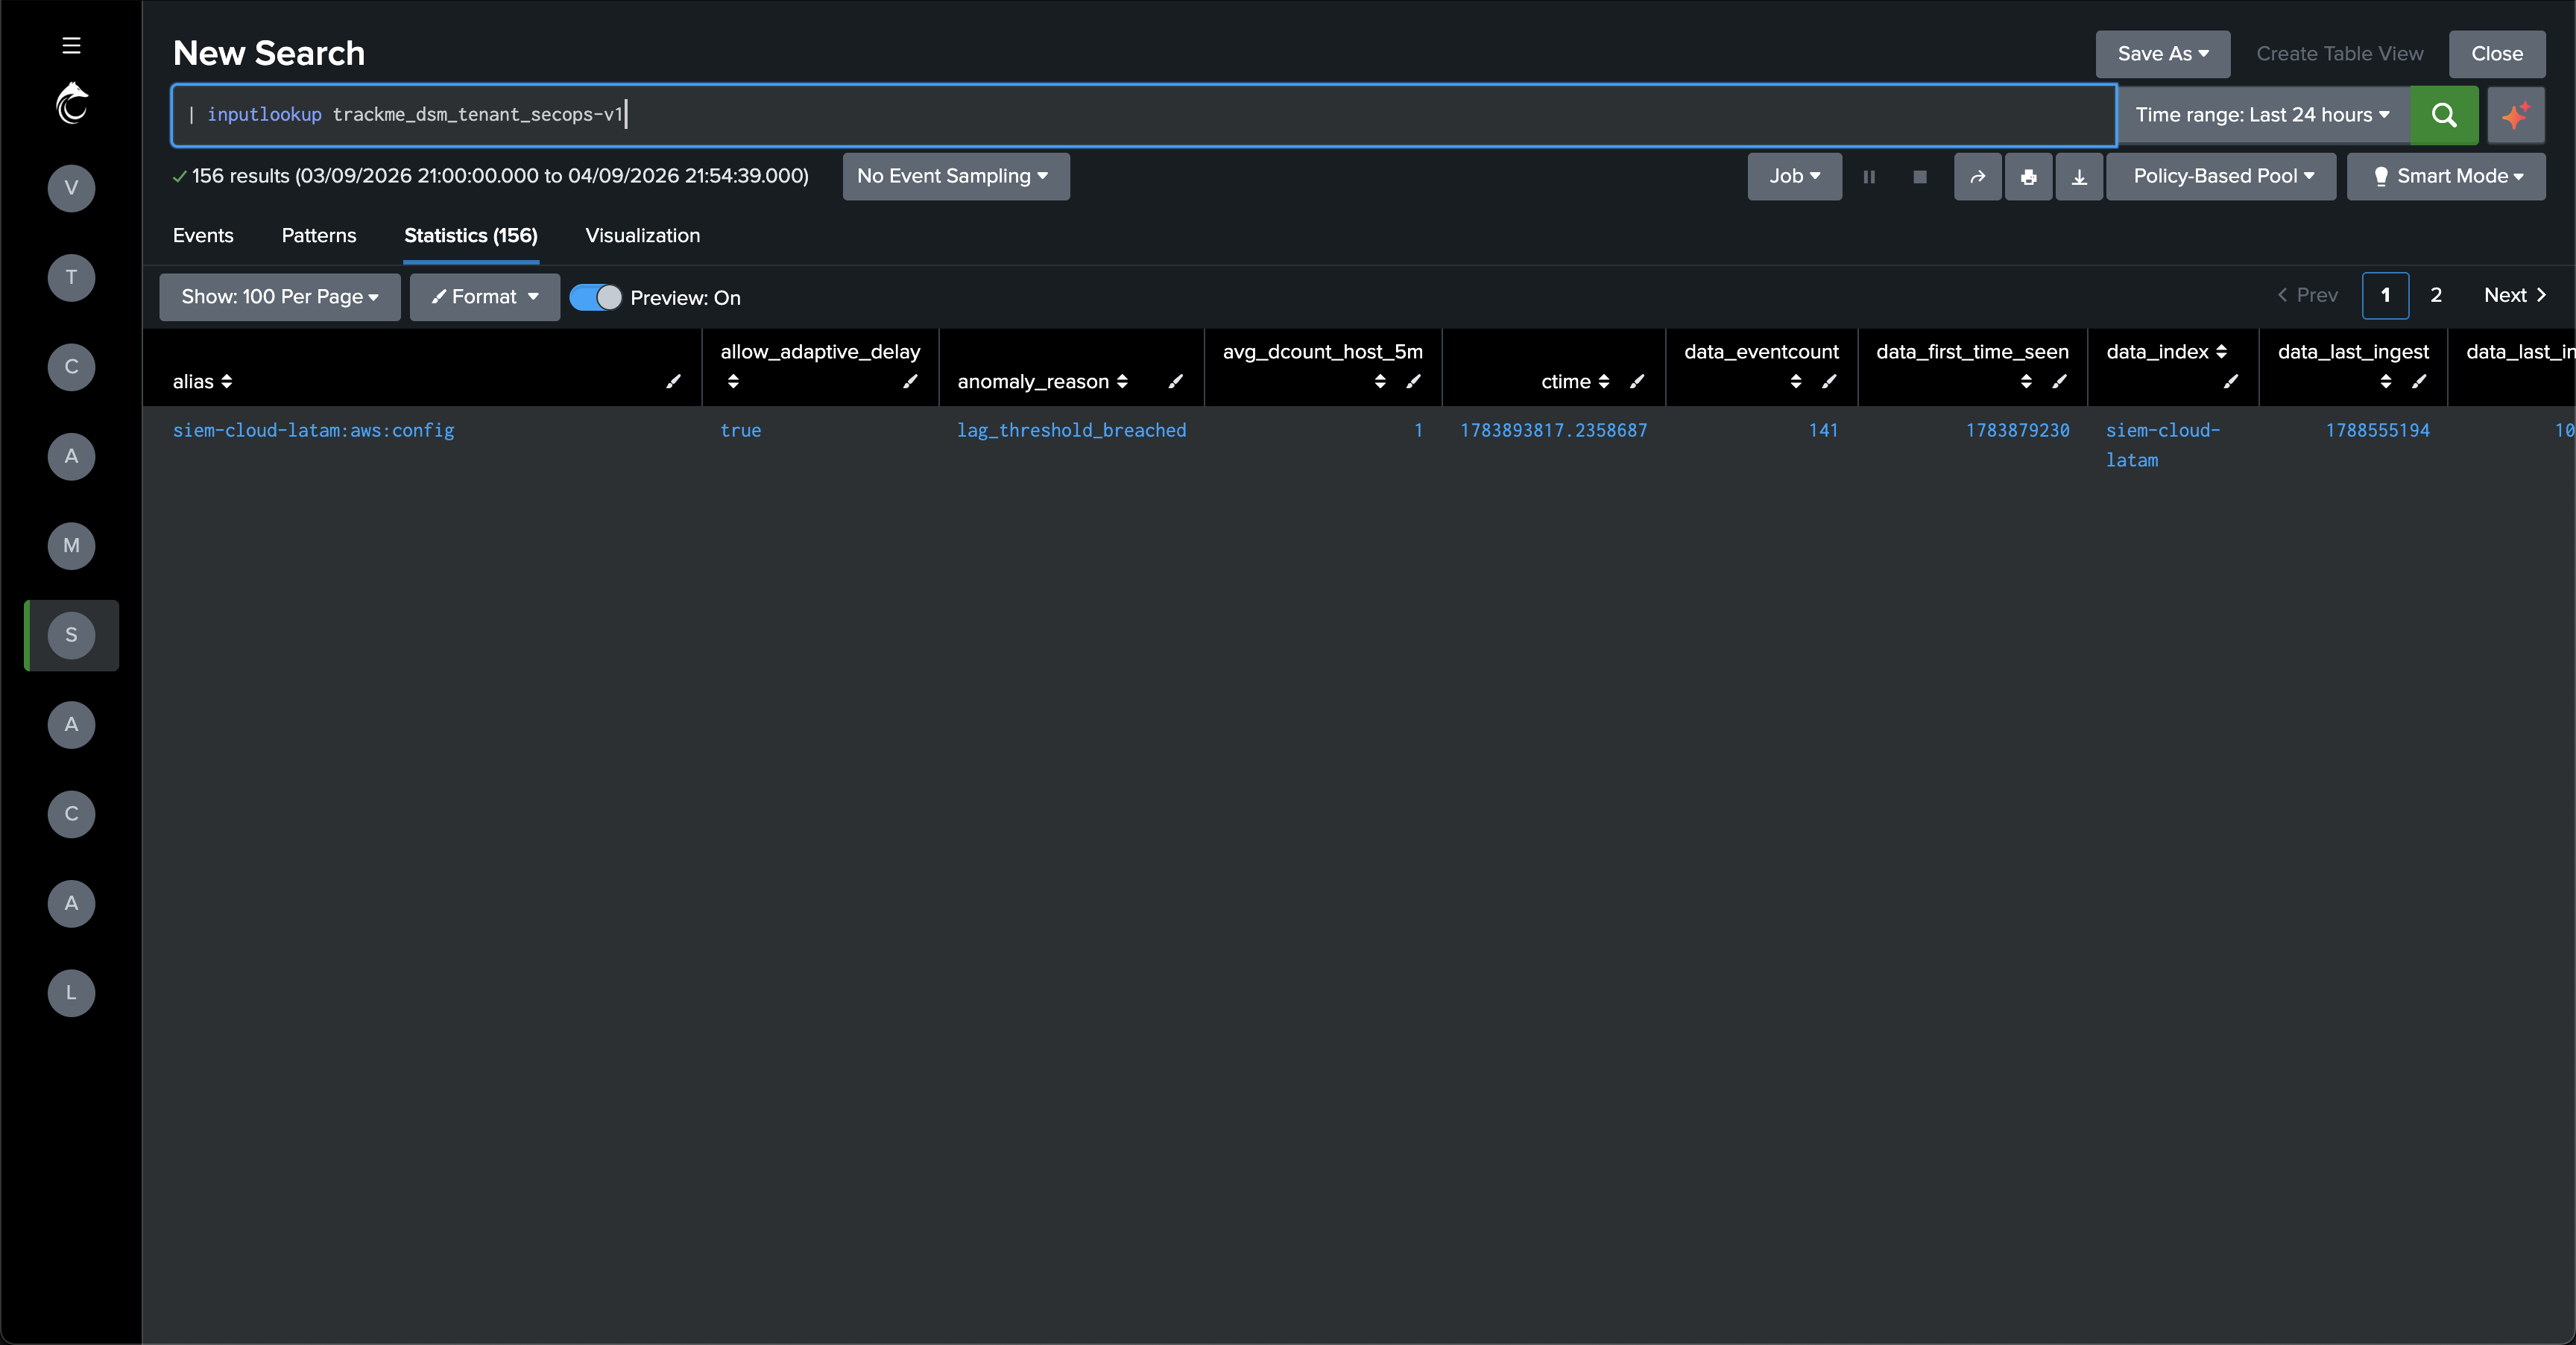
Warning
The raw collection is the input of the decision maker, not its output. It is not refreshed in real time and does not carry everything the UI shows or that TrackMe acts upon (the current state after all rules, the status message, alerting decisions …). Use it for bulk exports of the stored attributes; do not use it as the source of truth for entity status.
The shadow records: the recommended KV-store source
This is the collection to use for KV-store access to the processed data: the
shadow collection. Since TrackMe 2.4.3, the decision maker writes a post-processing
snapshot of every entity to a second collection, which the UI and TrackMe’s backends read
themselves. Each row holds the enriched entity as a JSON document in the record field,
so expand it with spath:
| inputlookup trackme_<component>_shadow_tenant_<tenant_id> | spath input=record
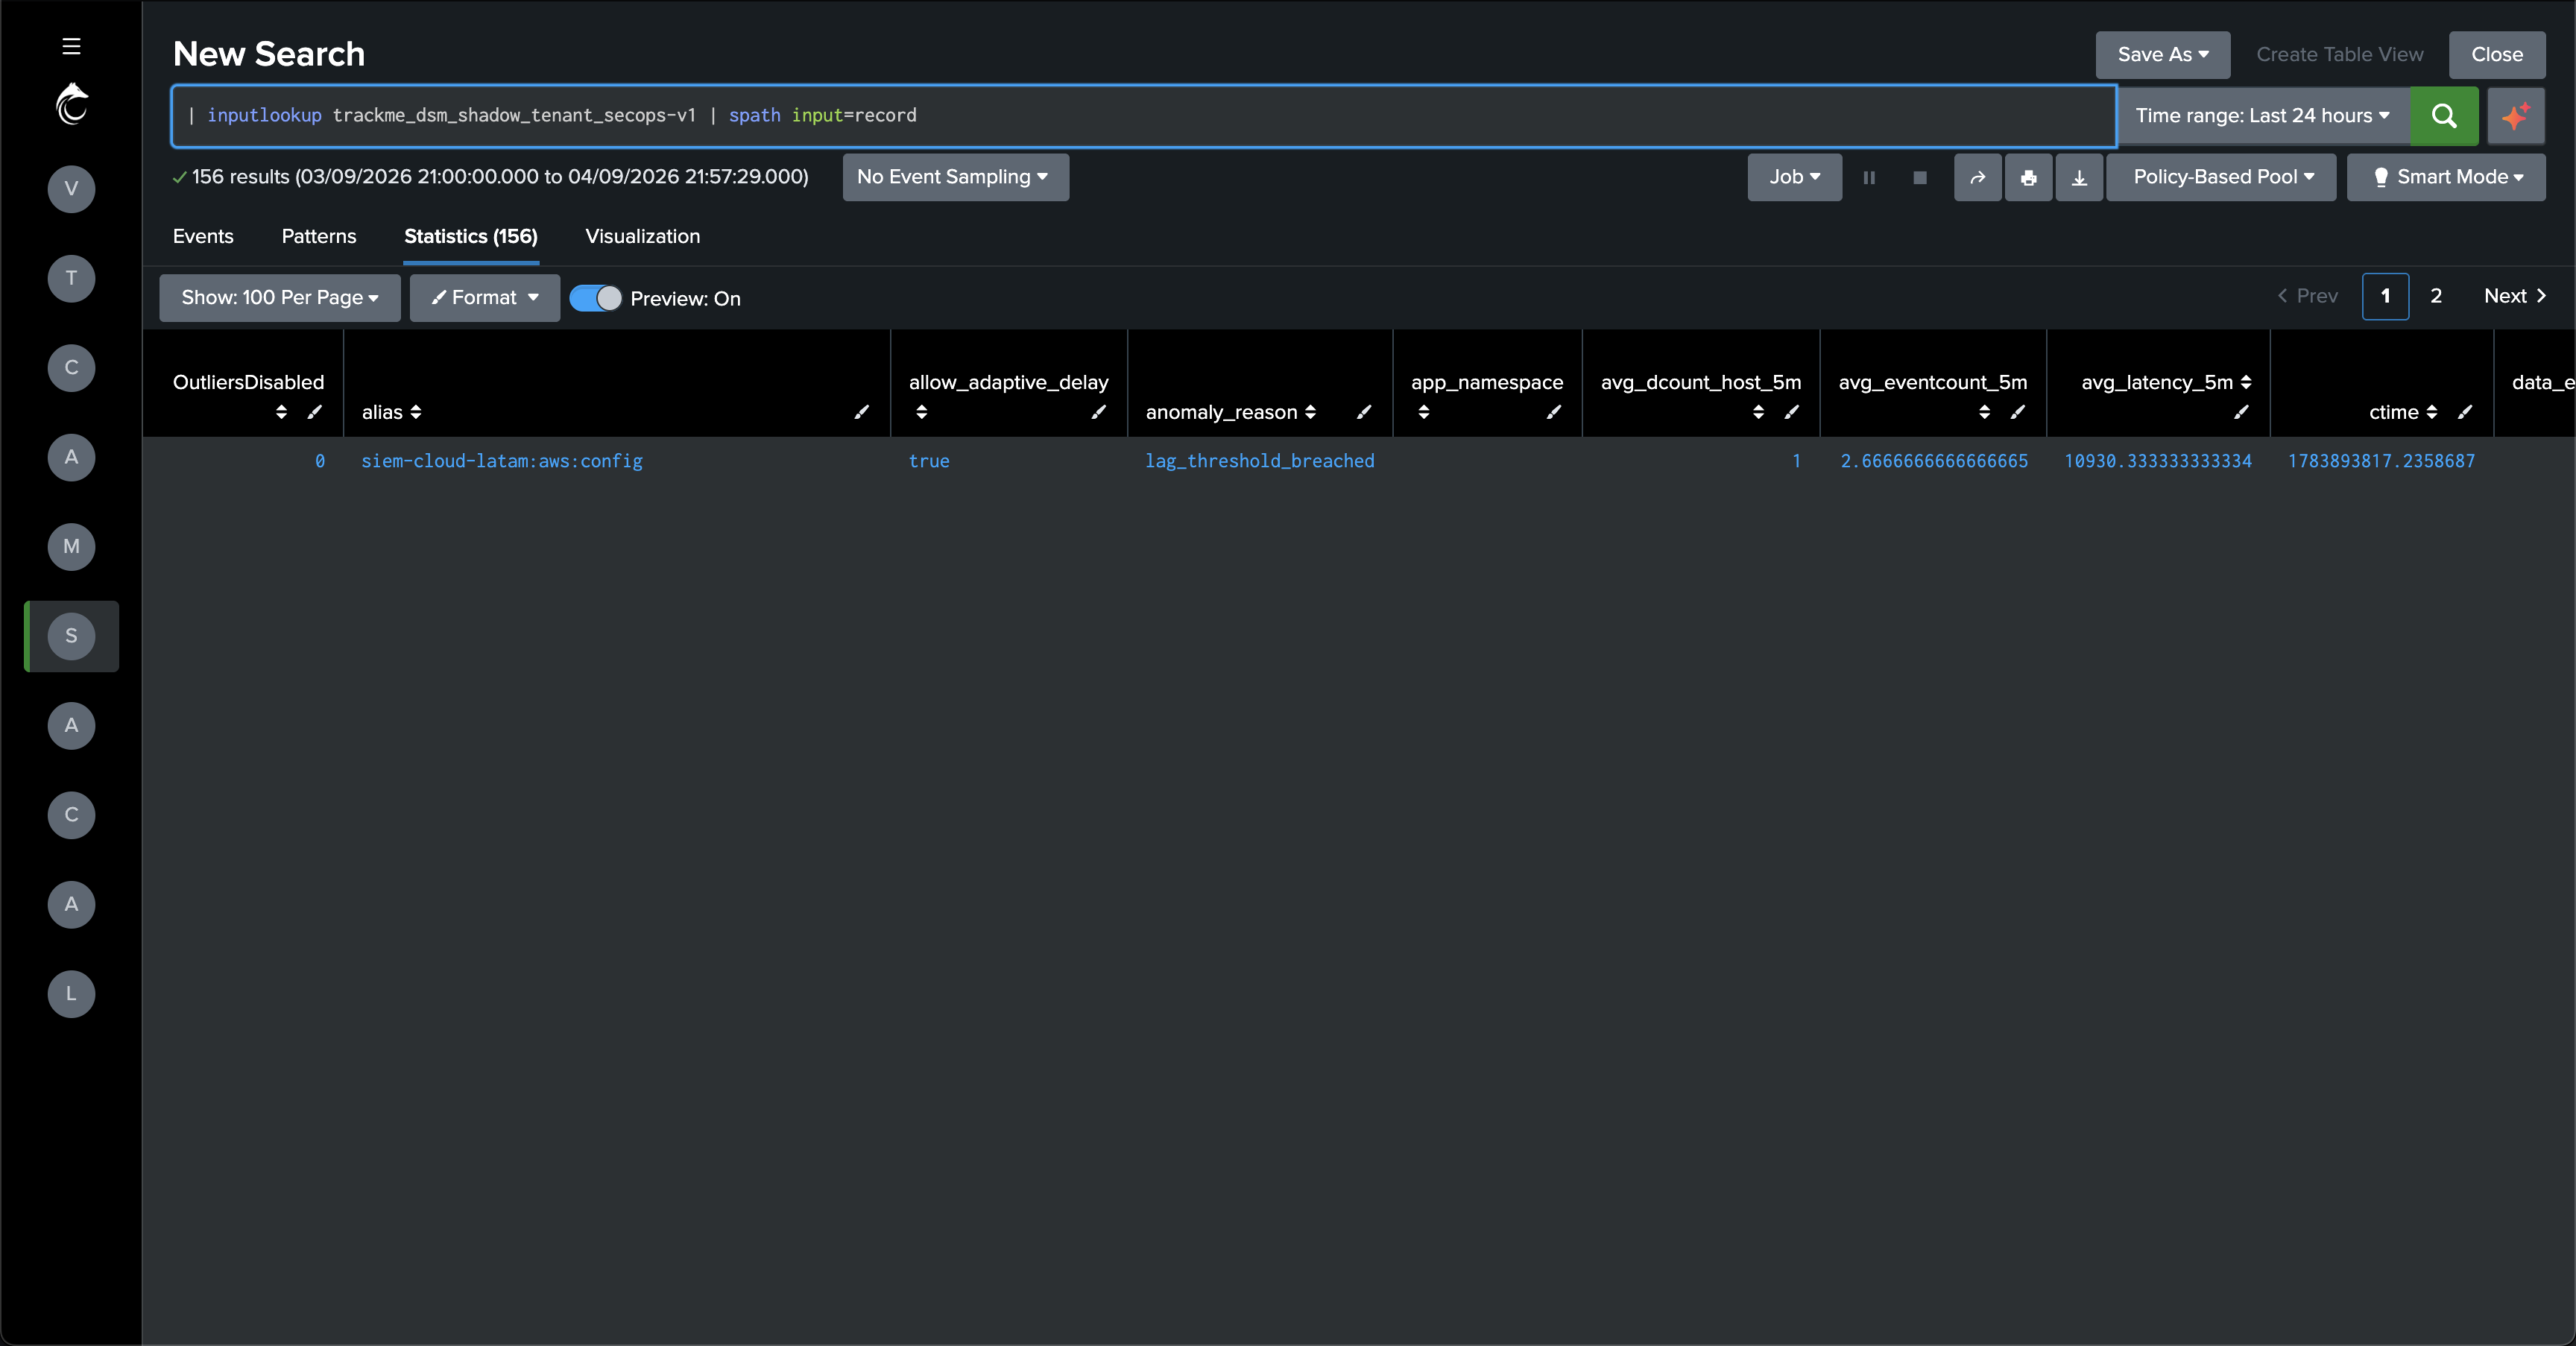
The shadow record is the same document that trackmegetcoll returns for the entity, but
reading it costs a KV-store scan rather than a decision-maker run. It is refreshed on every
tracker cycle and patched immediately when an entity is edited (priority, tags,
acknowledgement …), which makes it near real time. Shadow records are enabled by default
for every tenant; a tenant can opt out through its shadow_enabled setting, in which case
the collection is empty. You can confirm a shadow copy is available with:
| trackme mode=get url="/services/trackme/v2/component/check_shadow?tenant_id=<tenant_id>&component=dsm"
Tip
In the support case that prompted this page, the customer’s own dashboard ended up reading the shadow collection: pre-processed, cheap to query, and current enough for a status board. This is our recommendation whenever a Splunk dashboard or search consumes TrackMe entities through the KV-store.
Option 4 — from outside Splunk, through the REST API
When the consumer is not a Splunk search at all — an external portal, a script, another
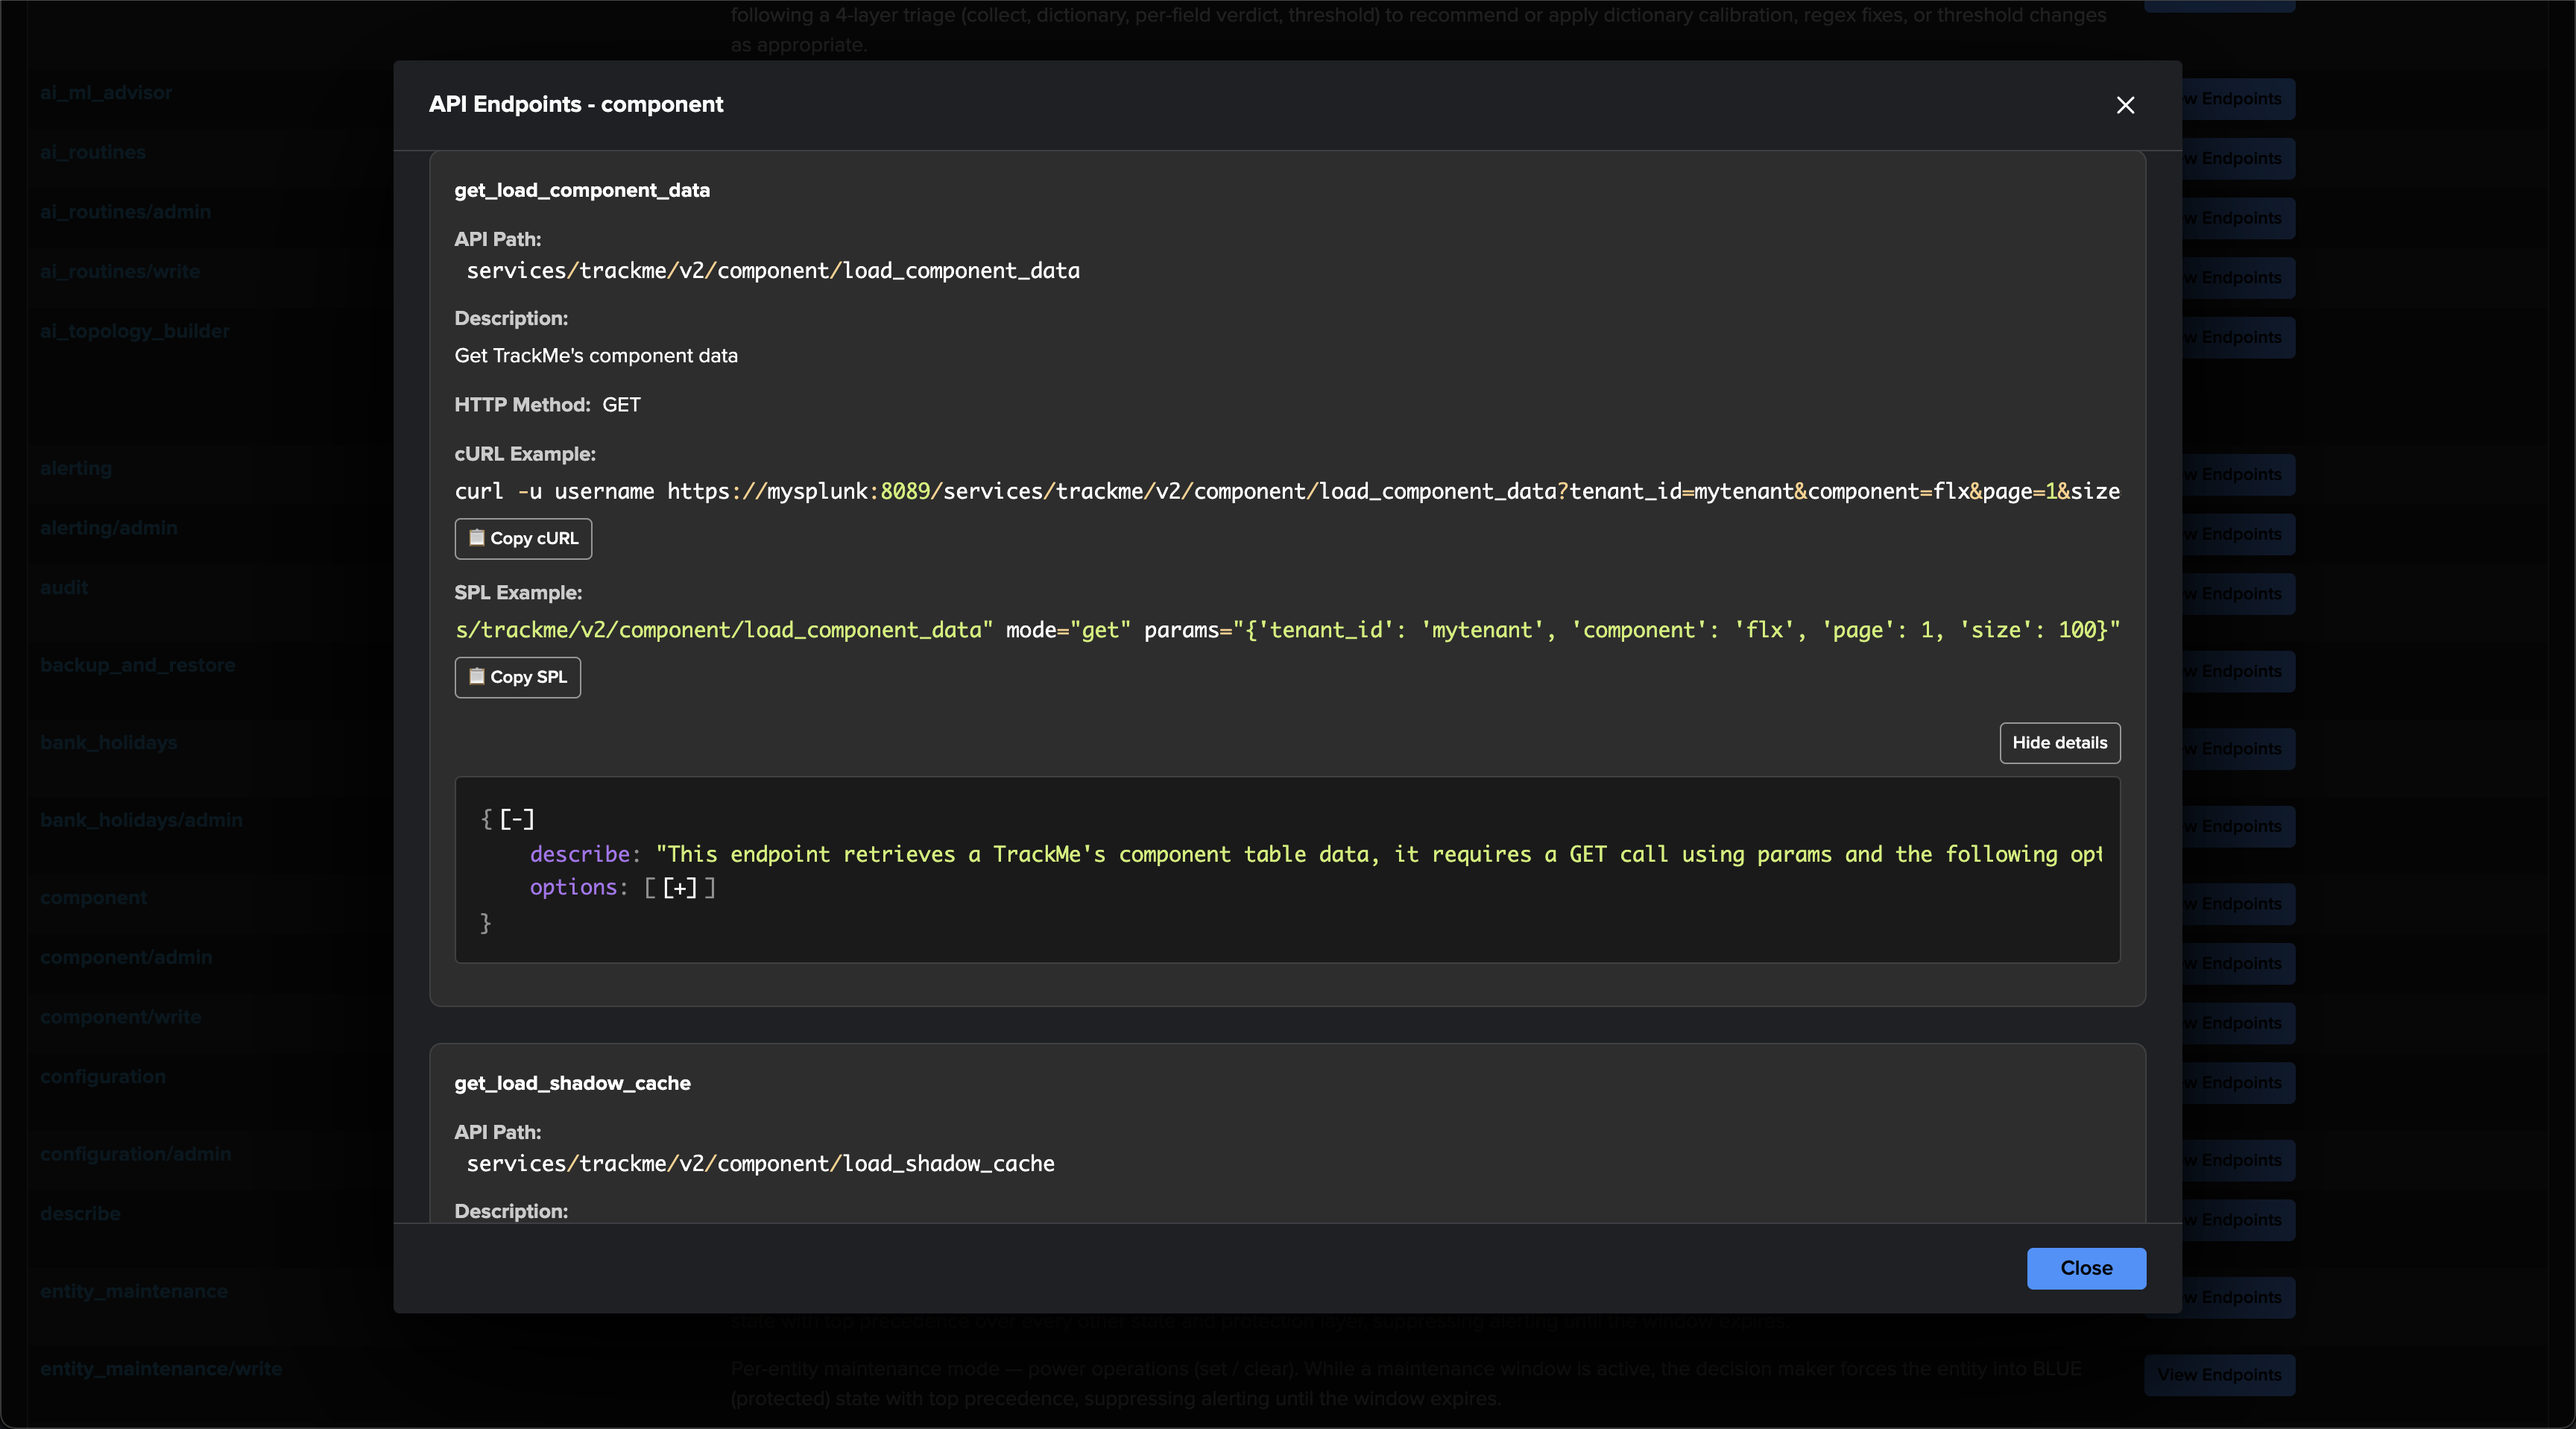
monitoring platform — call the REST endpoints directly. All of them are documented in the
UI under API & Tooling → TrackMe REST API Reference, with ready-to-copy cURL and SPL
examples (see REST API reference). The endpoints of the component resource group are
the ones to use:
Endpoint (GET) |
Purpose |
|---|---|
|
The precomputed per-component counts of a tenant (Option 1). |
|
The entity records, processed live by the decision maker, paginated with |
|
The entity records from the shadow cache, without a decision-maker run. |
|
Whether a shadow copy is available for a tenant and component. |
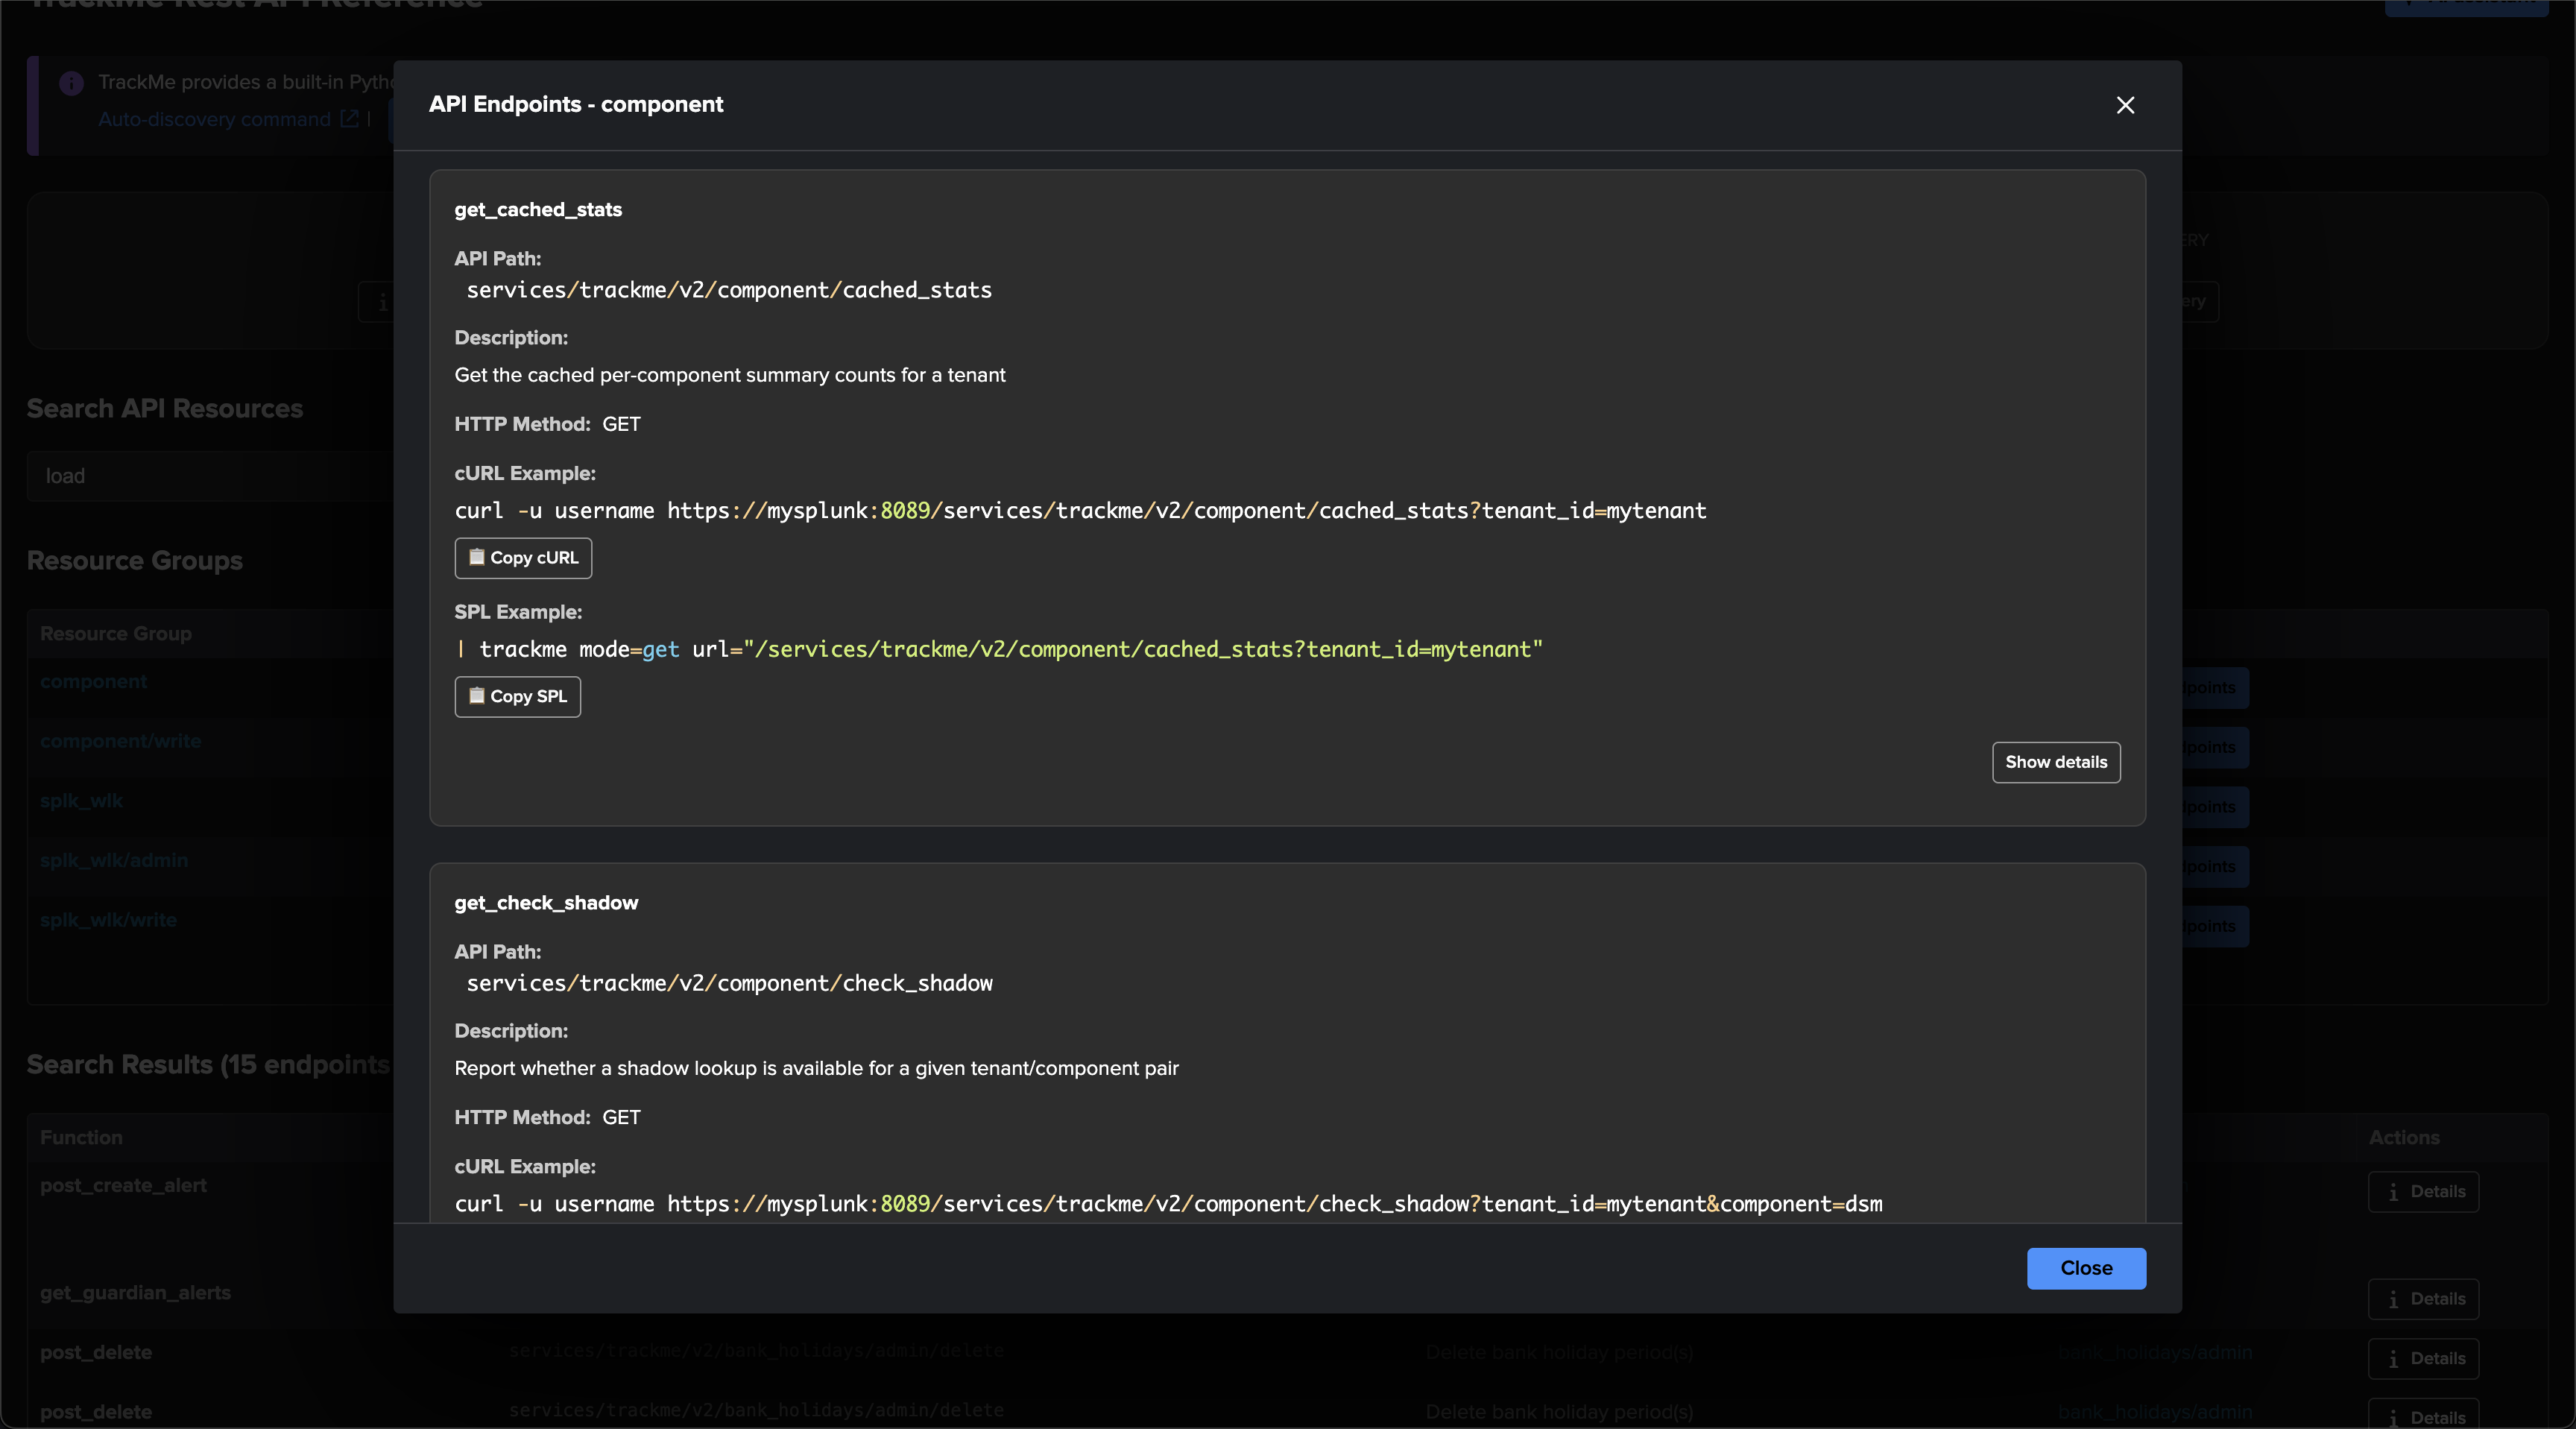
For example, to offload every DSM entity of a tenant:
curl -k -H "Authorization: Bearer <token>" \
  "https://<splunk>:8089/services/trackme/v2/component/load_component_data?tenant_id=<tenant_id>&component=dsm&page=1&size=0"
Authentication is the standard splunkd authentication (bearer token, basic auth or session key), and the same TrackMe capabilities and tenant RBAC apply as in the UI.
Which one should I use?
You want… |
From SPL |
From outside Splunk |
|---|---|---|
The status counts of a tenant |
|
GET |
The live entity table, exactly as the UI |
|
GET |
The processed entity table through the KV-store (recommended for KV-store access) |
|
GET |
The stored attributes only, bulk export (not for entity status) |
|
Splunk’s KV-store REST API |
See also
REST API reference — the REST API reference and how to authenticate from outside Splunk.
Roles & access control — the capability and tenant-role model that gates every read.
Configuration — in depth — the system settings, including the shadow filesystem cache.