Cribl Stream
Monitor a Cribl Stream deployment from the metrics it already sends to Splunk and its Leader API: create the tenant, triage Finding groups, investigate traffic outliers against what each object learned, observe Workers, the Leader and the data paths, and operate the tenant with policies, notifications, the AI Agent, Topology Studio and the Configuration Guardian.
about 35 minutes · 33 slides. Each slide is followed by a description of what it shows — read top to bottom, this page is the walkthrough.
Overview
This walkthrough covers the Cribl Stream tenant, generally available in TrackMe 2.4.19. Everything was captured live on lab deployments: a Cribl.Cloud workspace and a self-managed Leader with five Workers. In four parts: create the tenant, read and triage the findings, observe the deployment and its traffic models, and operate the tenant with policies, notifications, the AI Agent and Topology Studio.
Why a dedicated Cribl Stream tenant
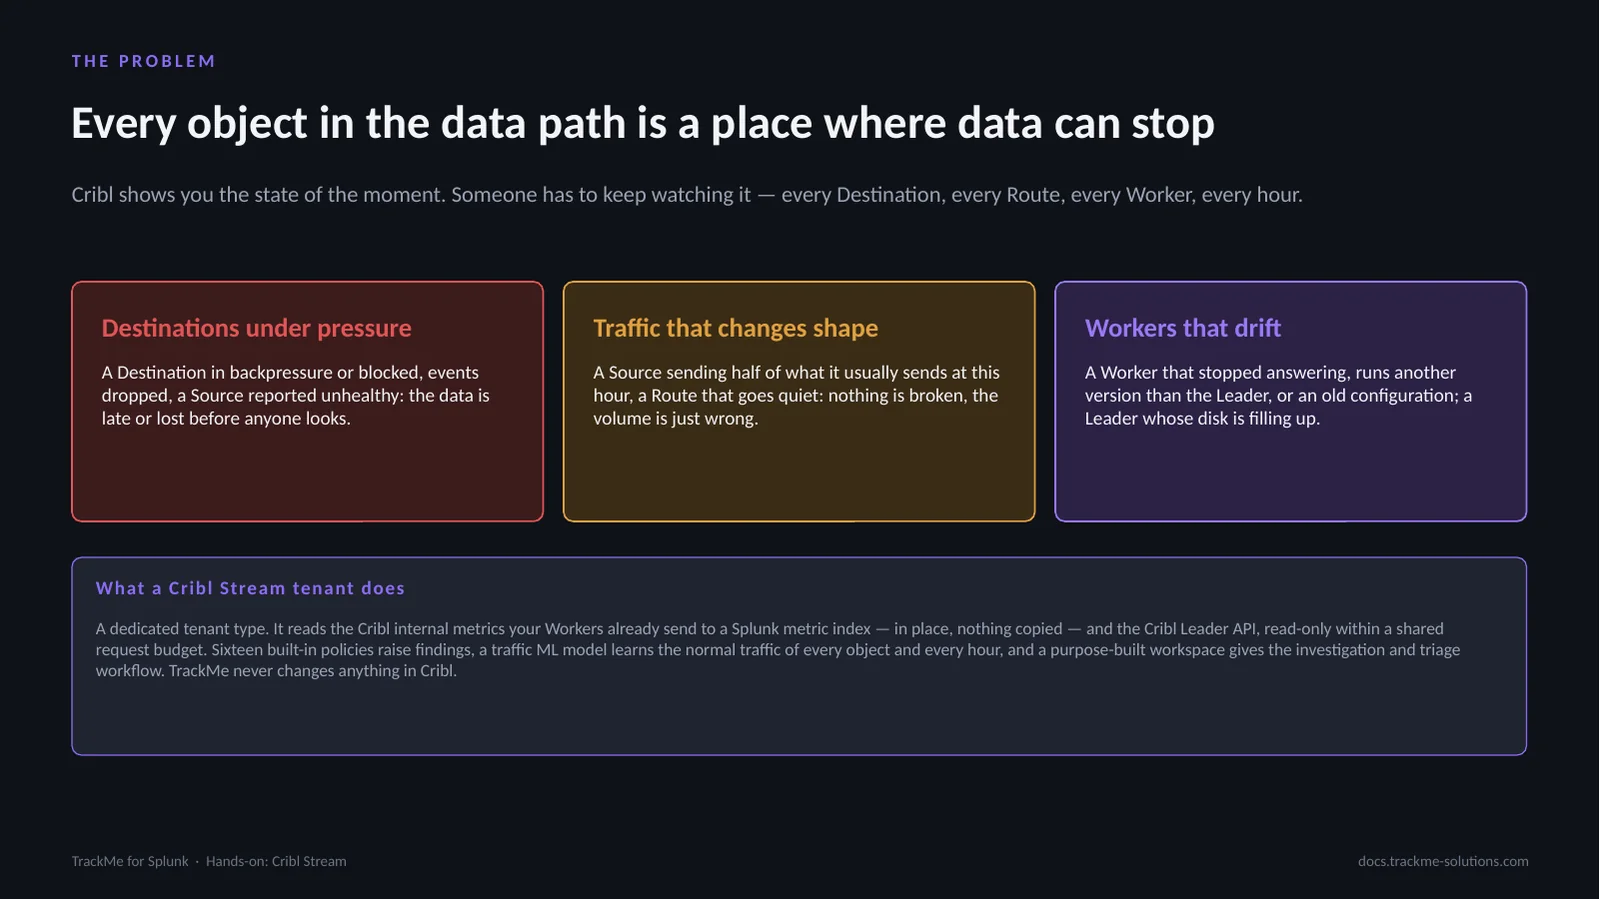
Cribl Stream sits in the middle of the data path. Every Source, Route, Pipeline and Destination is a place where data can slow down, back up, be dropped or stop, and every Worker can disconnect or drift from its Worker Group. The Cribl UI shows the state of one moment; a Cribl Stream tenant keeps watching, raises findings and gives you the triage workflow.
How a Cribl Stream tenant works
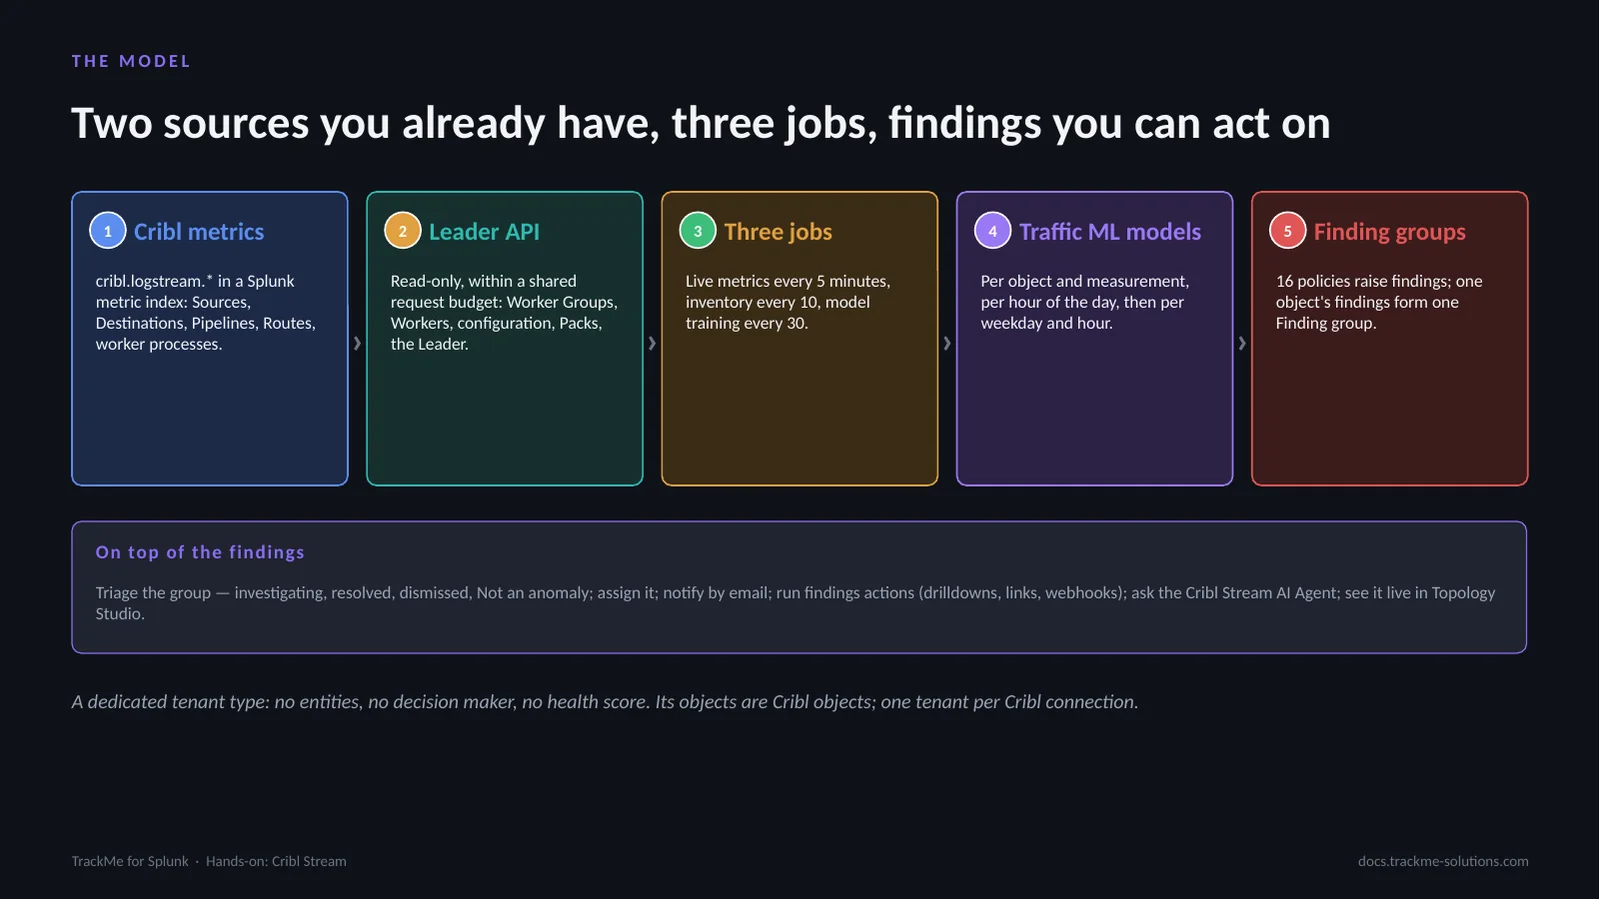
The live metrics job reads the newest five-minute interval of the Cribl metrics in Splunk every five minutes and evaluates the policies; the inventory job reads the configuration and the Workers from the Leader within its request budget; the model training job keeps a traffic ML model per object and measurement. Policies turn what is measured into findings, grouped per object into Finding groups.
The parts of the walkthrough
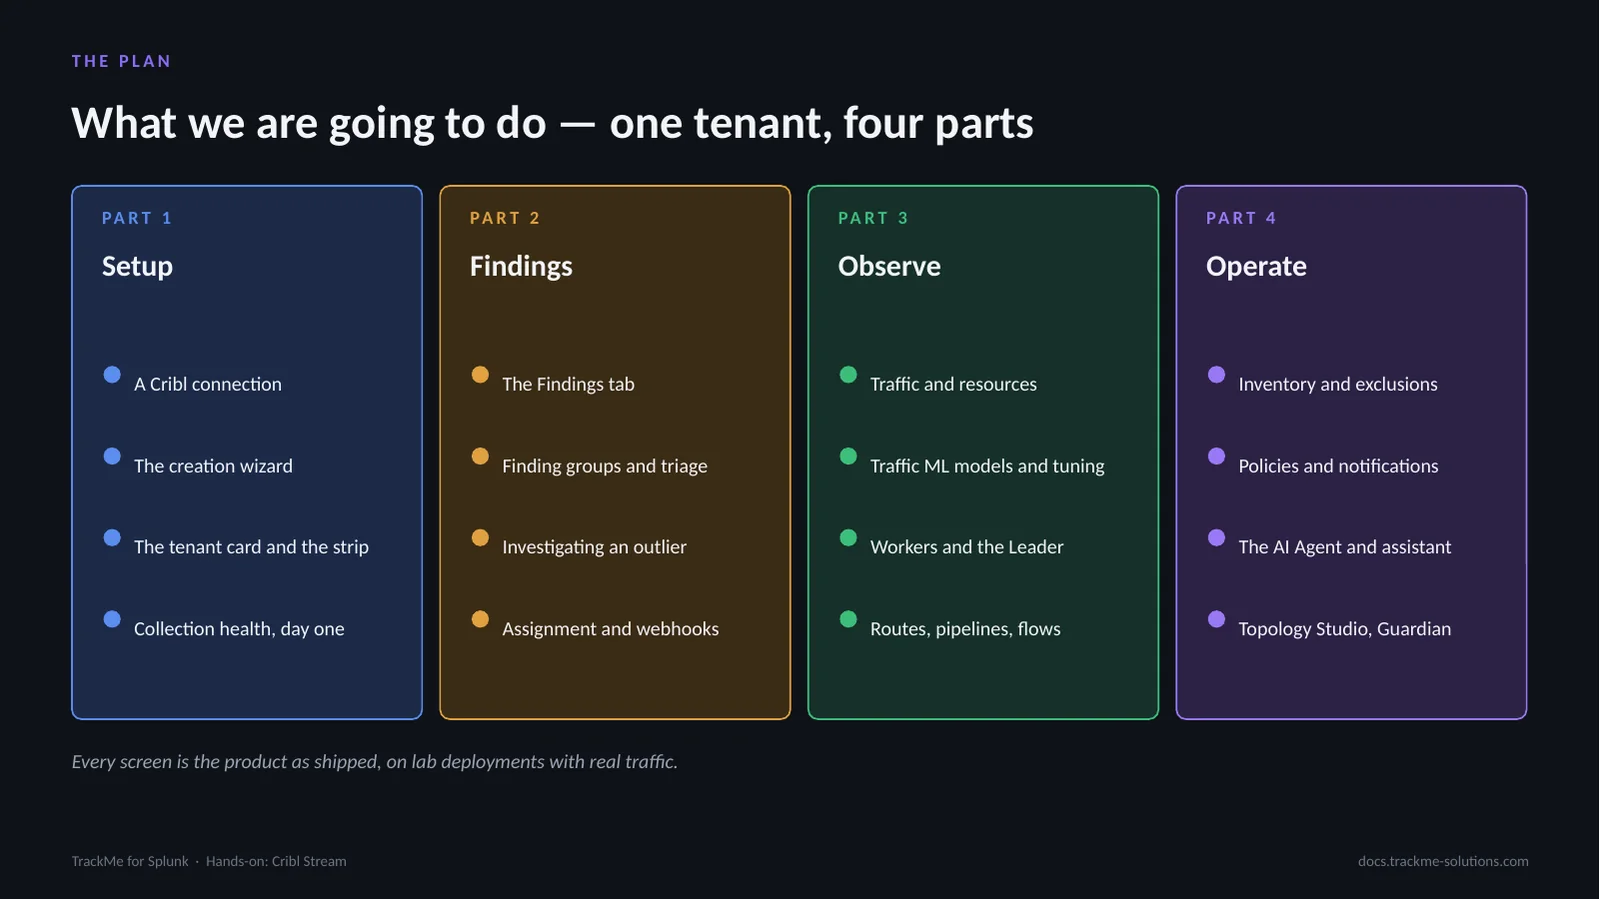
Four parts. Setup: the Cribl connection, the creation wizard, the first collection. Findings: the backlog, Finding groups, the investigation and the triage, assignment and webhooks. Observe: traffic, the traffic ML models, the machines and the data paths. Operate: inventory and exclusions, policies, notifications, the AI Agent, Topology Studio and the collection health.
Part 1 — Setup
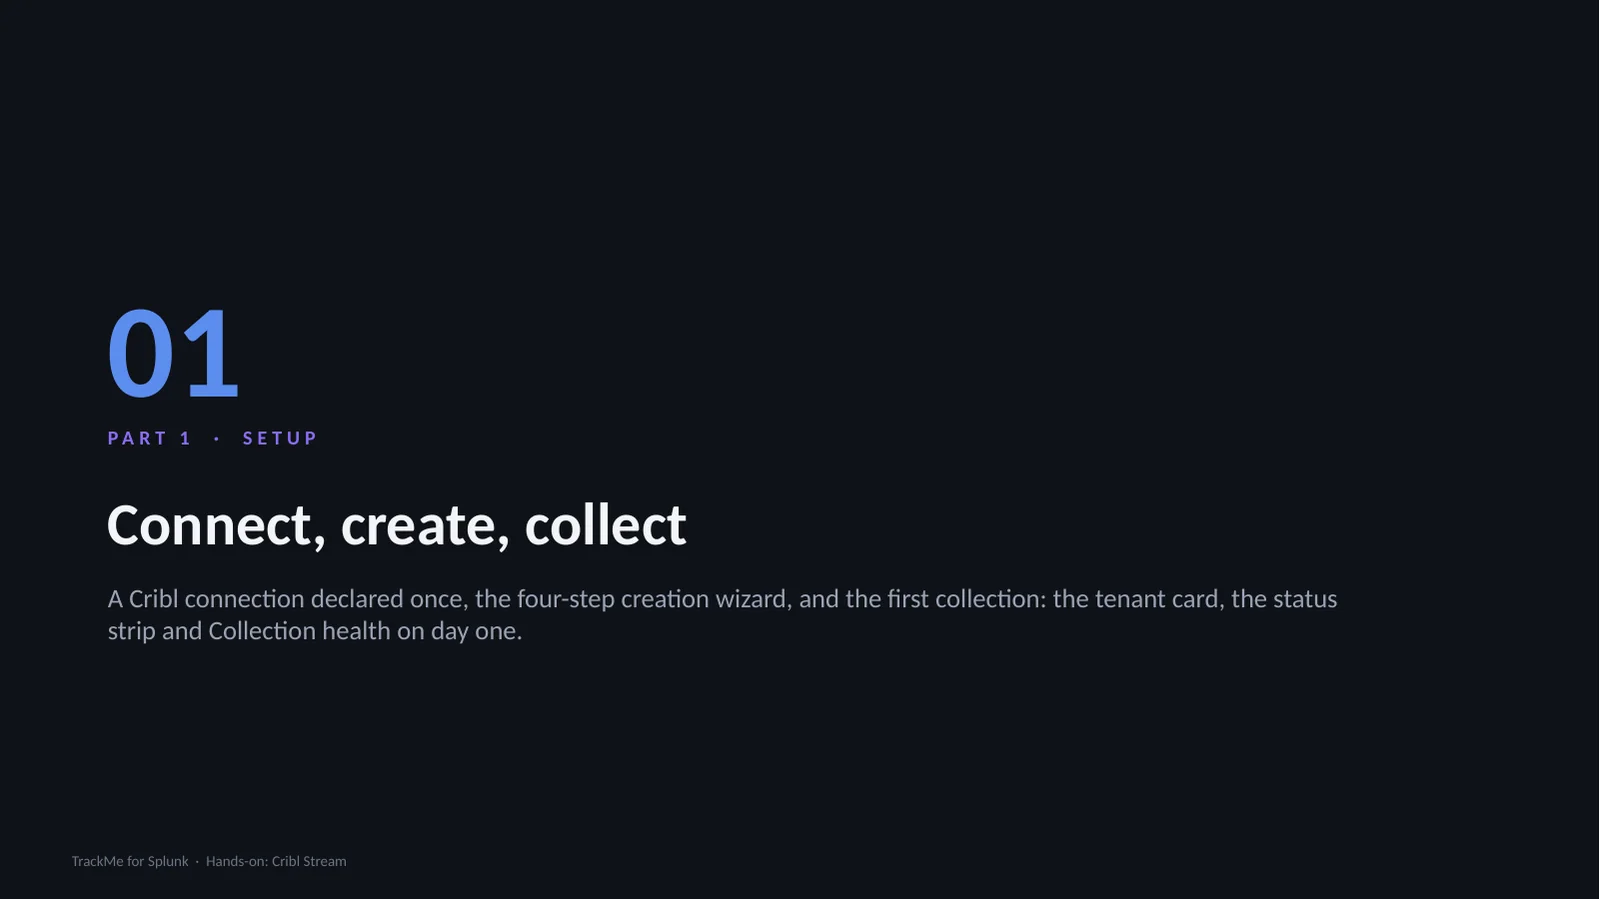
A Cribl connection is declared once and serves Cribl Stream and Cribl Edge tenants. The wizard does the rest, and the first collection starts within minutes. Configuration, Cribl connections holds one connection per Cribl.Cloud workspace or self-managed Leader, read-only. The creation wizard has four steps: Basics, Connection & Worker Groups, Indexes & RBAC and Review.
Declaring the Cribl connection
Configuration, Cribl connections. A connection is a Cribl.Cloud workspace with an API client ID and secret, or a self-managed Leader with a user name and password and its TLS settings. The Leader request budget is shared by every tenant that uses the connection. The account only needs read access: TrackMe never writes to Cribl.
Choosing the connection and Worker Groups
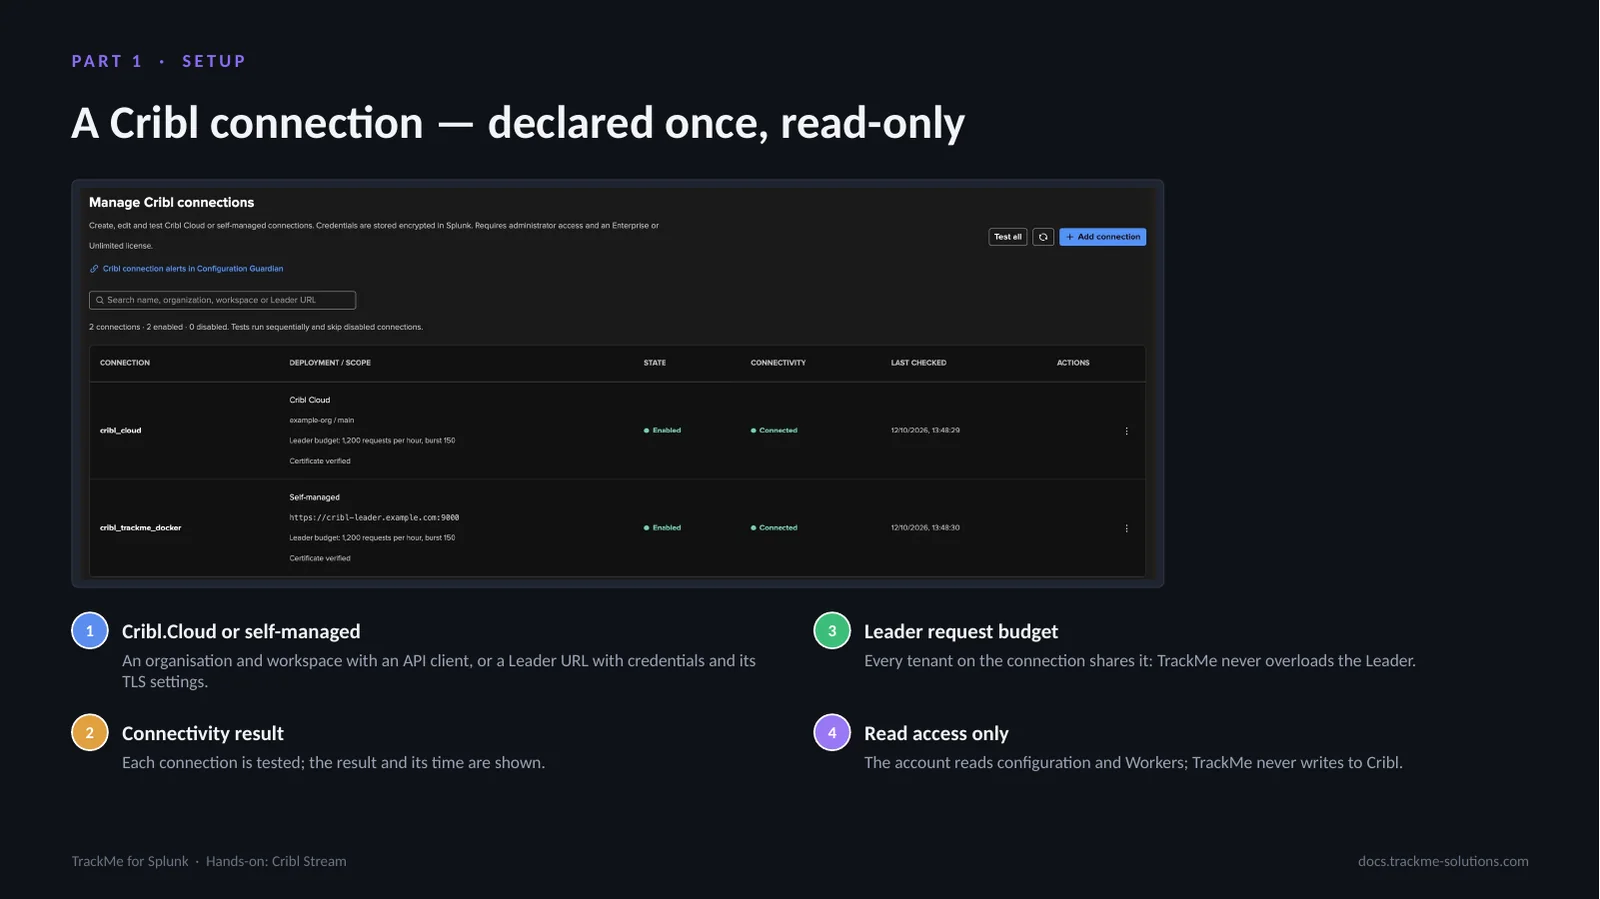
Actions, Create a tracking tenant, Cribl Stream card. Step 1 is the identifier and alias. Step 2 is where TrackMe meets the deployment: the connection, the metric index that TrackMe proposes from where this connection’s Workers report, the metric prefix, how much history the traffic ML models learn from at creation, and the Worker Groups. With history in the metric index the models can detect on the first day. Steps 3 and 4 are the indexes, roles and review.
Status at a glance
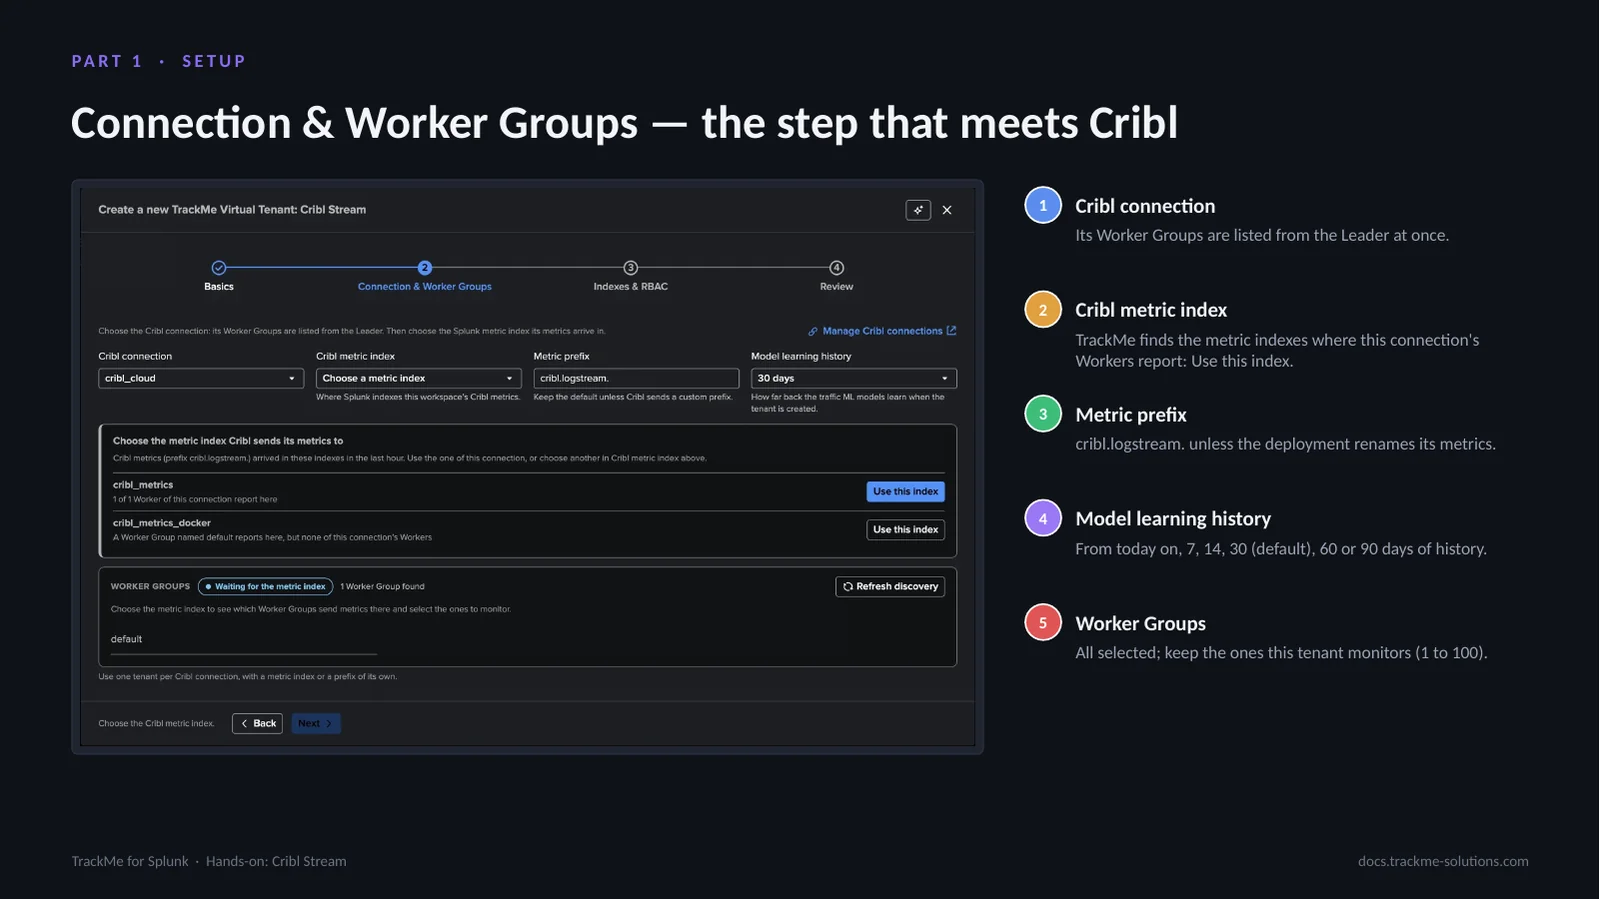
On Virtual Tenants the tenant card shows the open Finding groups and findings, the critical ones and the collection status. Inside the workspace, the status strip says at a glance that the tenant is working: the connection, the Leader, the Worker Groups, the last run of each job and how many traffic ML models are detecting; Refresh, and for a TrackMe administrator of the tenant Collect now.
Collection health on day one
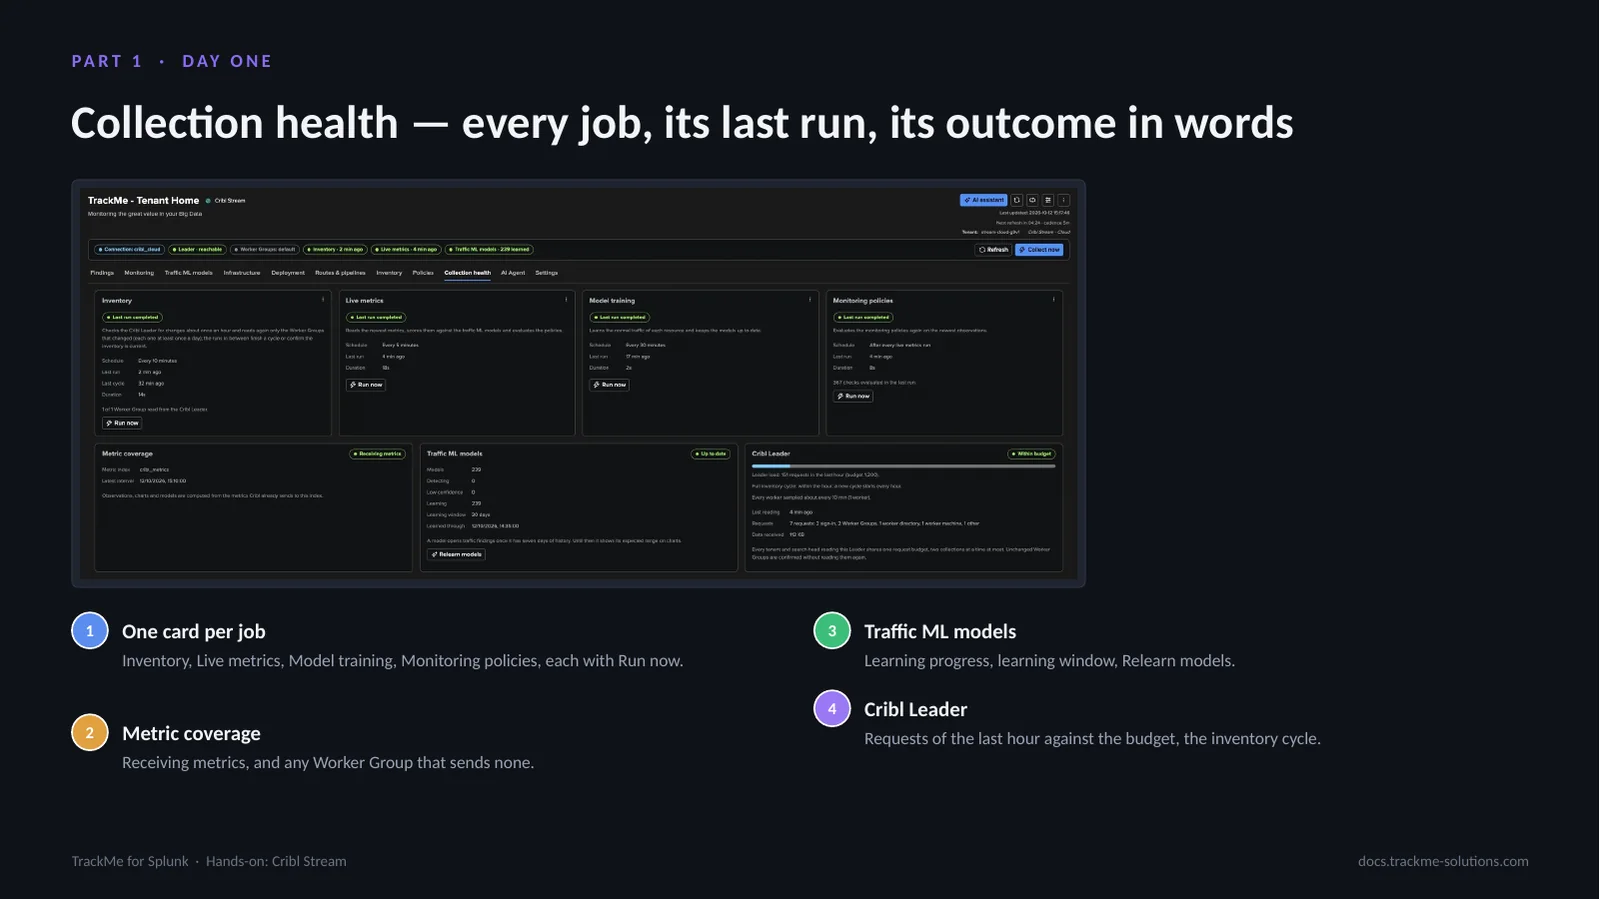
Collection health answers: is TrackMe collecting what it should? One card per job with its last run, its outcome in words, View last run and Run now; the metric coverage; the traffic ML models with their learning progress; and the Cribl Leader card with the requests against the budget and the inventory cycle.
Part 2 — Findings
A finding is one policy applied to one measurement of one object. One object’s findings form one Finding group: one row, one decision. Each finding shows its condition, what the newest evaluation measures, and its status, the decision taken. Triage, assignment rules and findings actions are shared with the other findings tenants.
The findings backlog
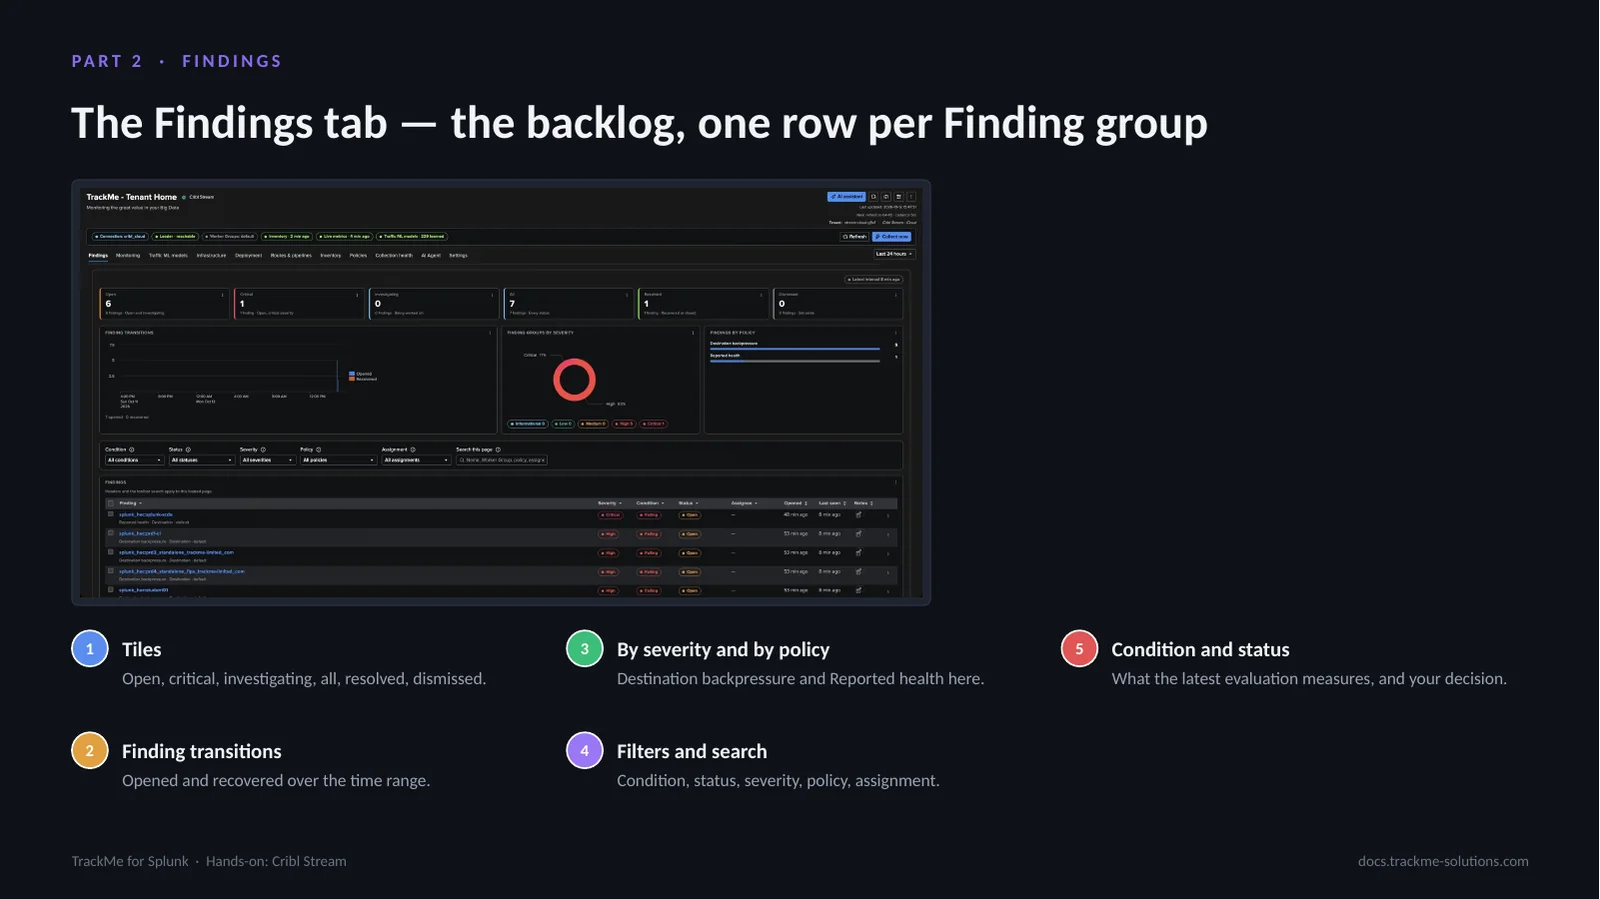
The Findings tab is the backlog and the tab the workspace opens on. Each finding shows its condition — Failing, Recovered, Awaiting data — and its status, the decision: Open, Investigating, Resolved, Dismissed. Severity uses the TrackMe scale from Informational to Critical. A measured recovery resolves an open finding by itself; a new failure reopens it.
One decision per object
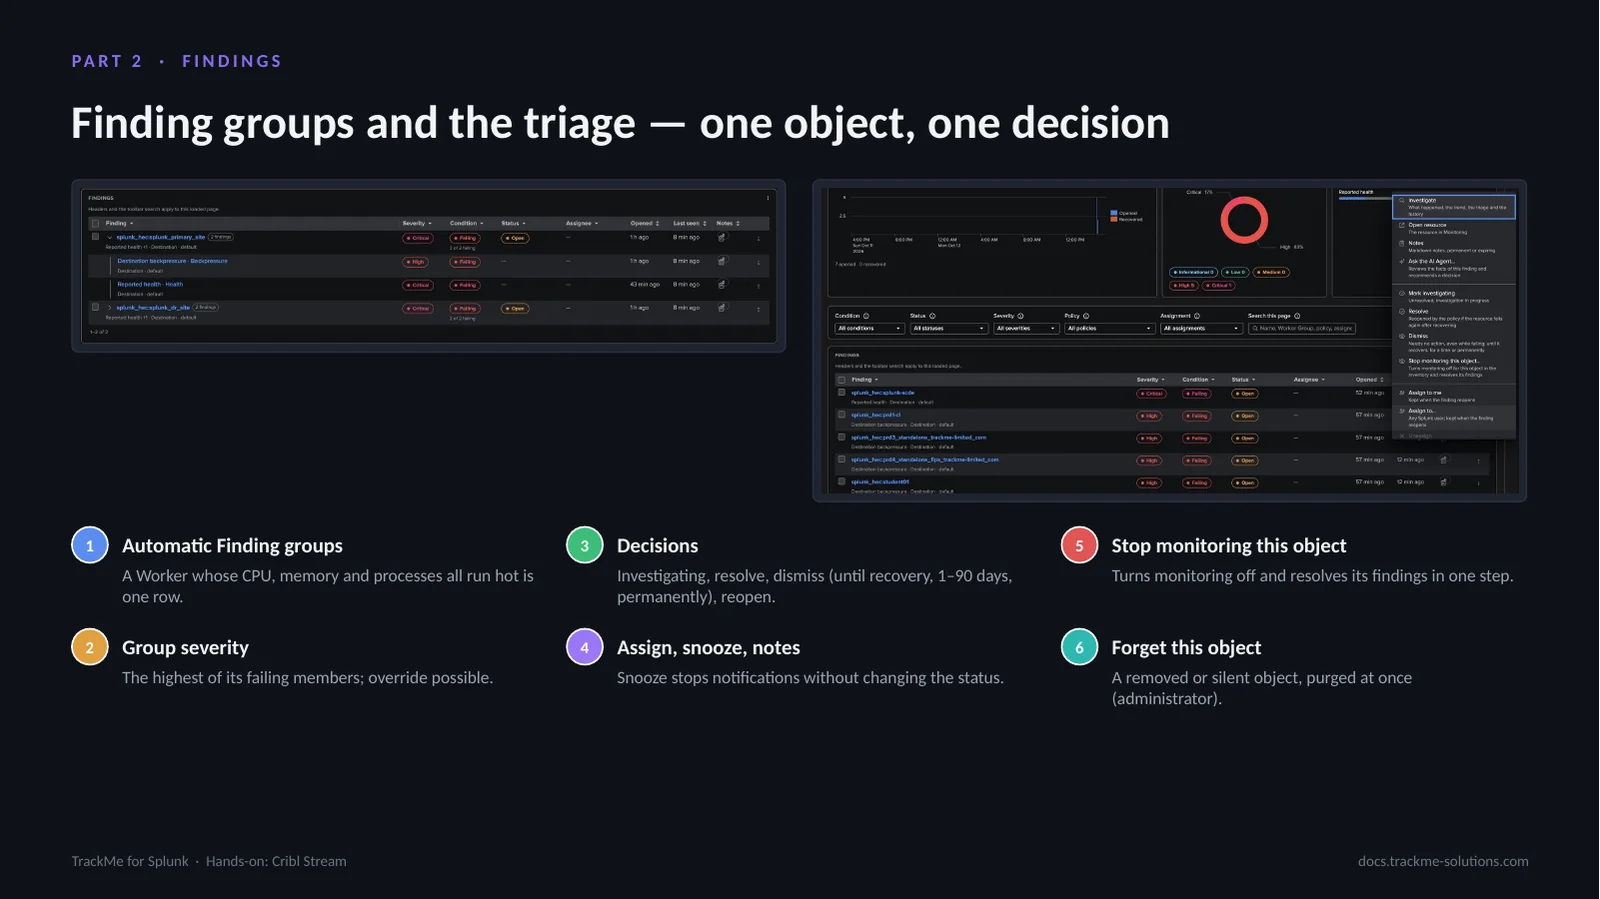
One object can fail several policies at once. TrackMe groups its findings automatically into a Finding group, so you make one decision: status, assignee, snooze, dismissal and severity override live on the group. Groups can also be merged, edited or ungrouped by hand. The row menu carries Ask the AI Agent, the decisions, and two Cribl-specific actions: Stop monitoring this object and Forget this object.
Investigating a traffic outlier
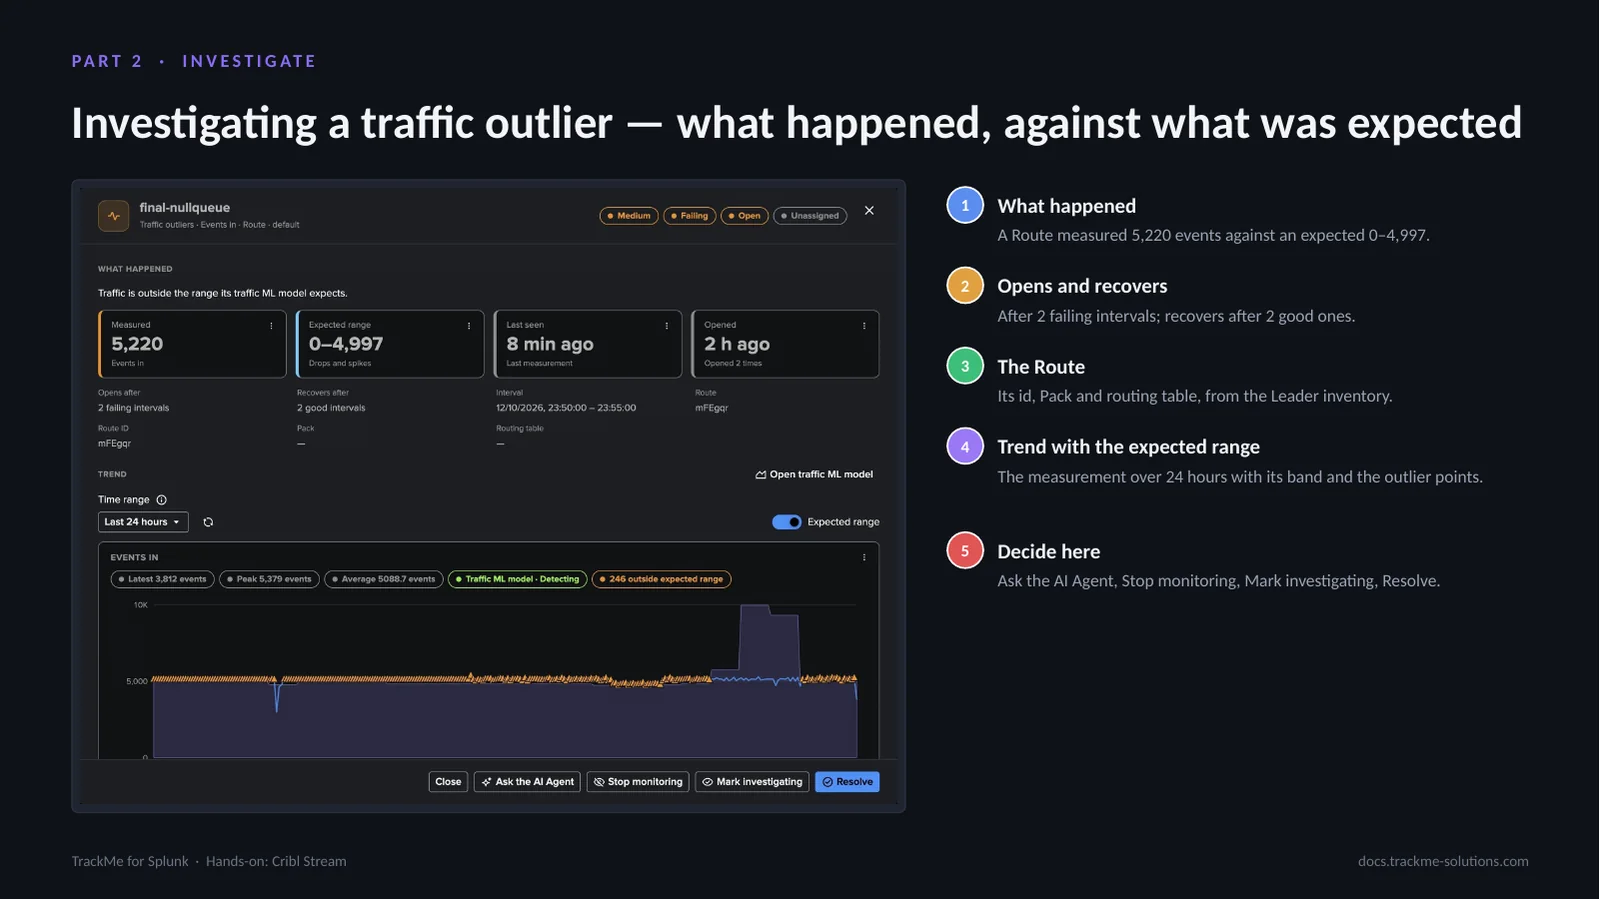
Selecting a row opens the investigation drawer: what happened in plain words, the measurement against its expected range, the open and recovery rules, the object in the inventory, the trend chart with the band, notes and history. For a Worker or the Leader the chart shows the policy threshold and recovery lines instead of a band.
When a Worker goes down
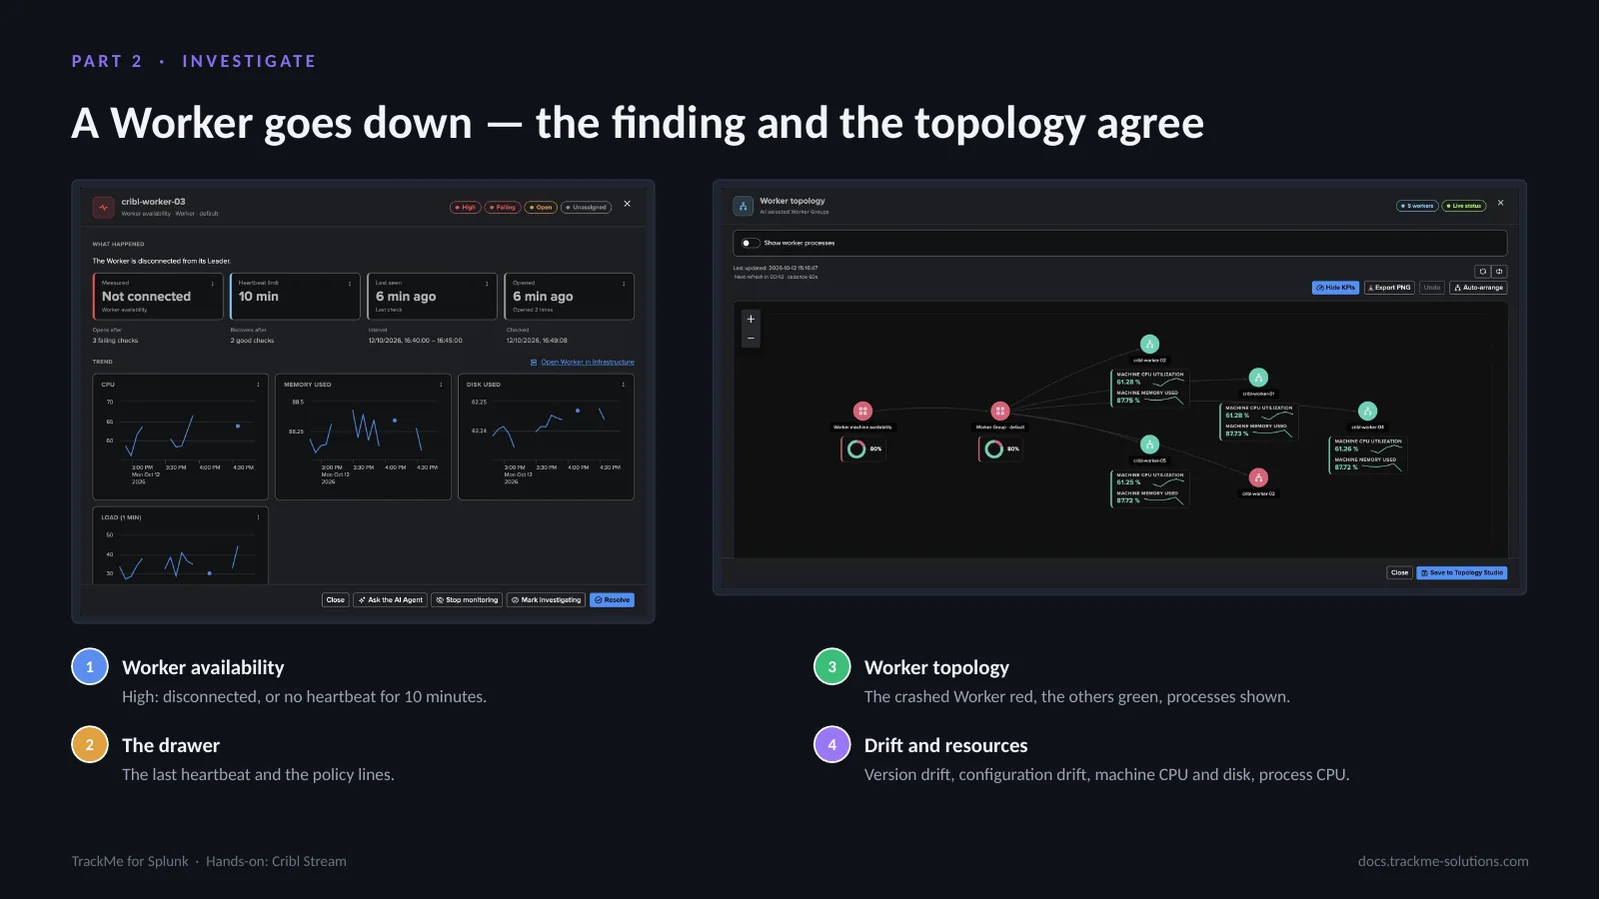
From the Leader, TrackMe knows every Worker and how it should look. A Worker that stopped answering opens a High Worker availability finding. The Worker topology of the Infrastructure tab shows the same story: the crashed Worker in red with its processes. Version and configuration drift, machine CPU and disk and process CPU follow the same pattern.
Routing findings to a team
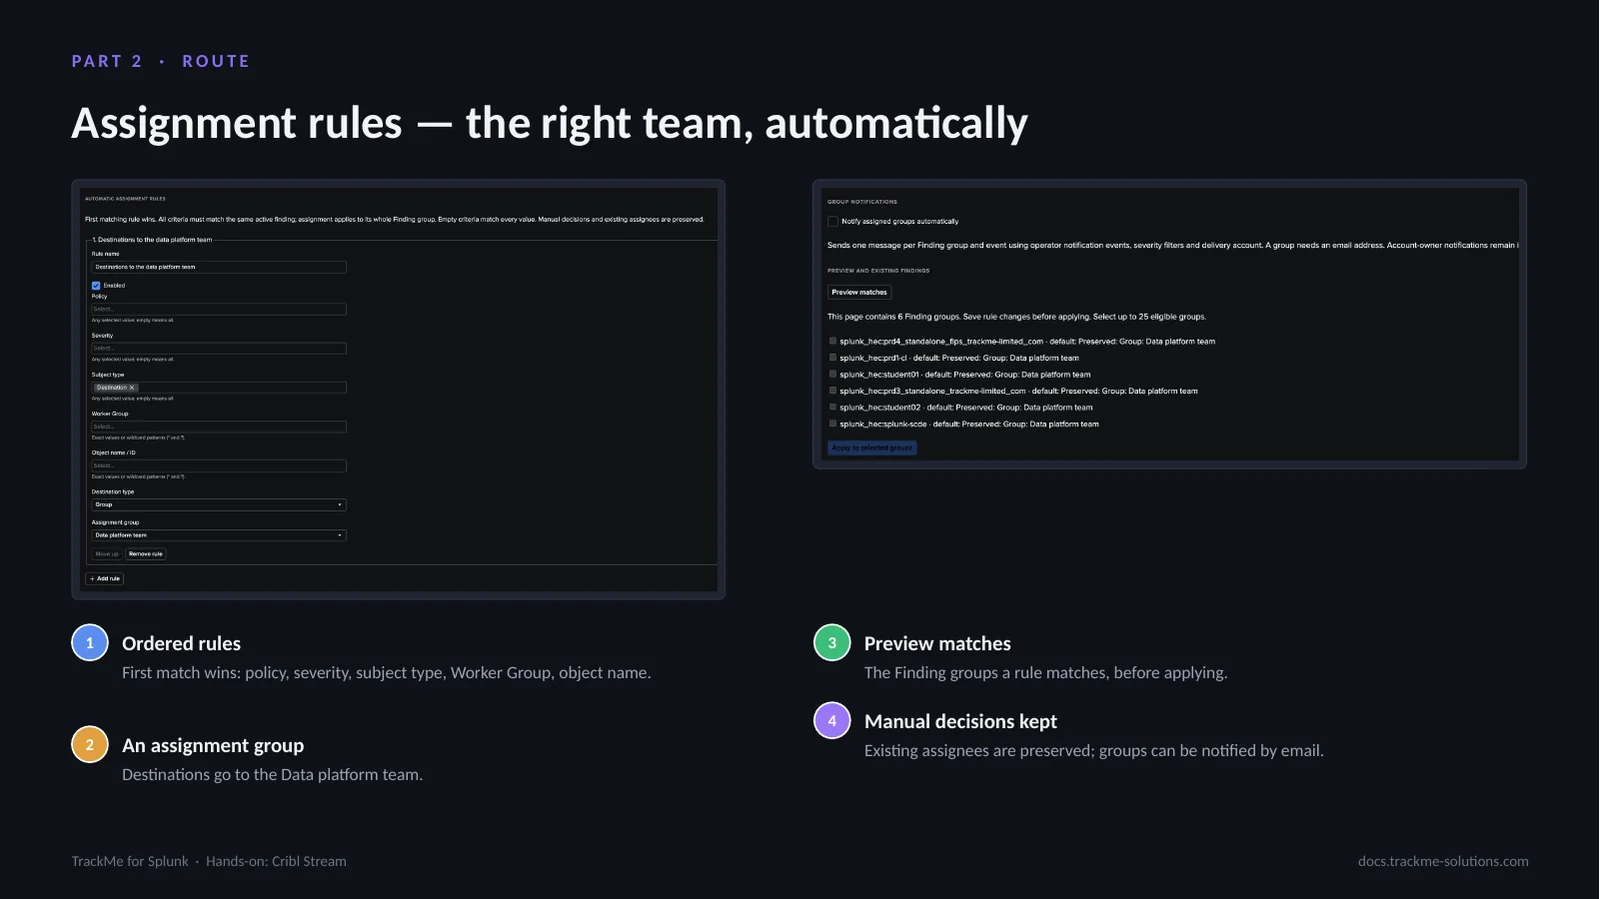
Settings, Assignment. Assignment groups and ordered rules route new findings to the right team. Preview matches lists the Finding groups a rule matches, here already assigned to the Data platform team and preserved, with Apply to selected groups for the existing ones. Assignment groups carry a team email, so an assigned group can be notified automatically.
Drilldowns, links and webhooks
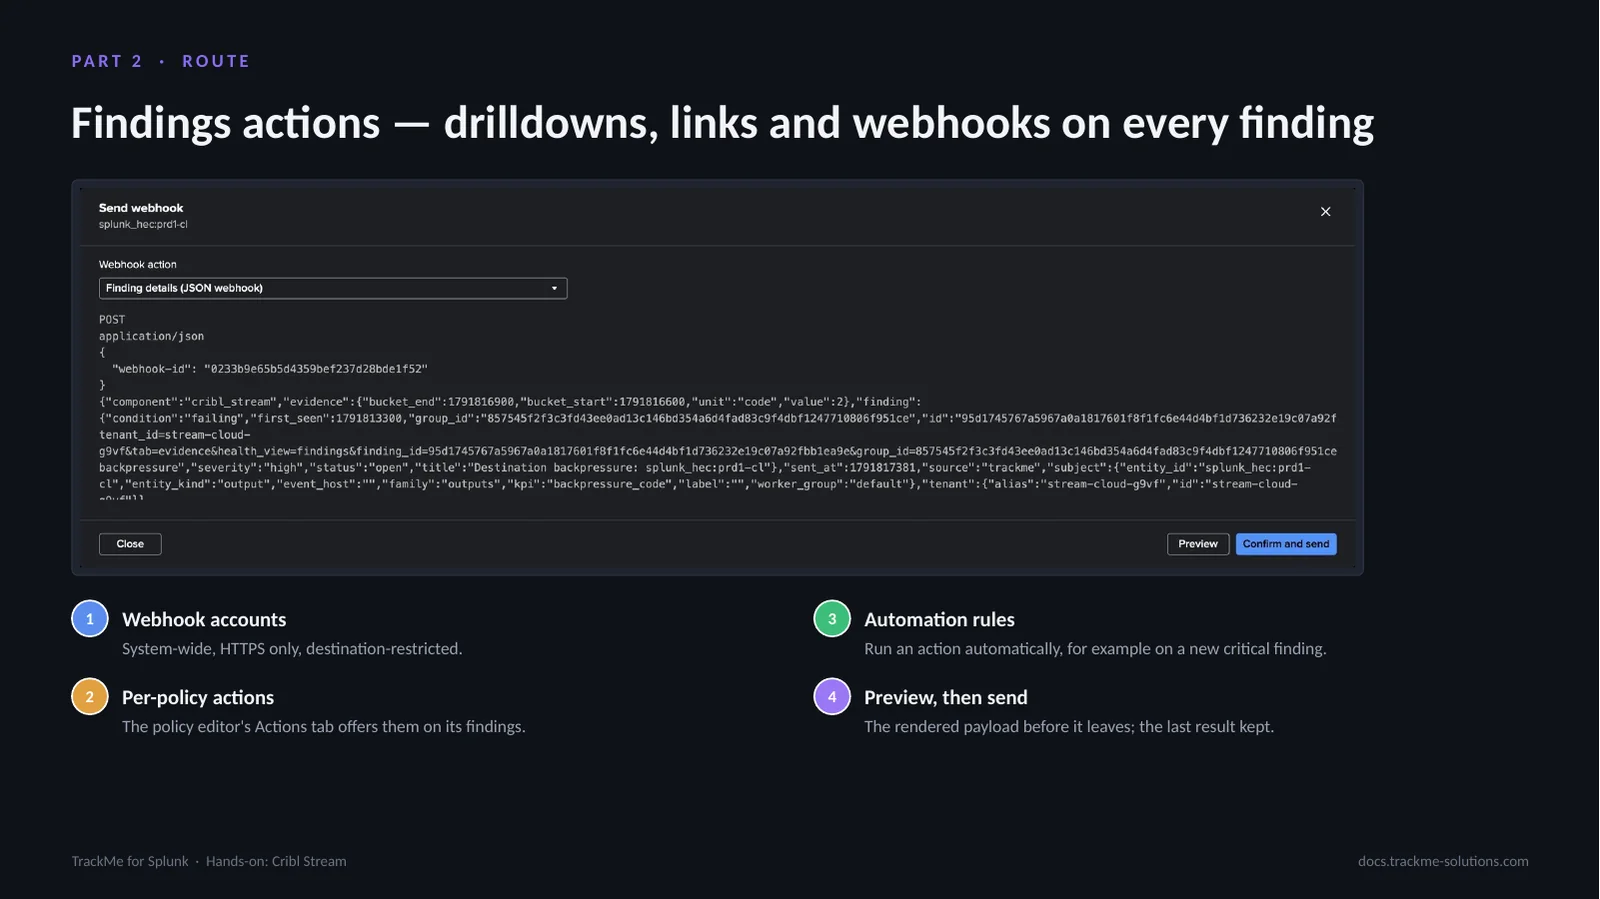
Findings actions add drilldown searches, links and webhooks to the findings, run by hand or by automation rules, through system-wide Webhook accounts. The preview shows the payload before it is sent. The concepts are shared with the other findings tenants. An automation rule can run an action without anyone opening the finding, for example posting every new critical finding to a chat channel.
Part 3 — Observe
Every figure has a menu with View chart data and Open in Search, a plain editable search that reproduces it. Monitoring, the traffic ML models, Expected traffic and silent objects, the Infrastructure tab with Workers and the Leader, and Routes & pipelines with the flow topology are covered in turn.
Traffic and resources
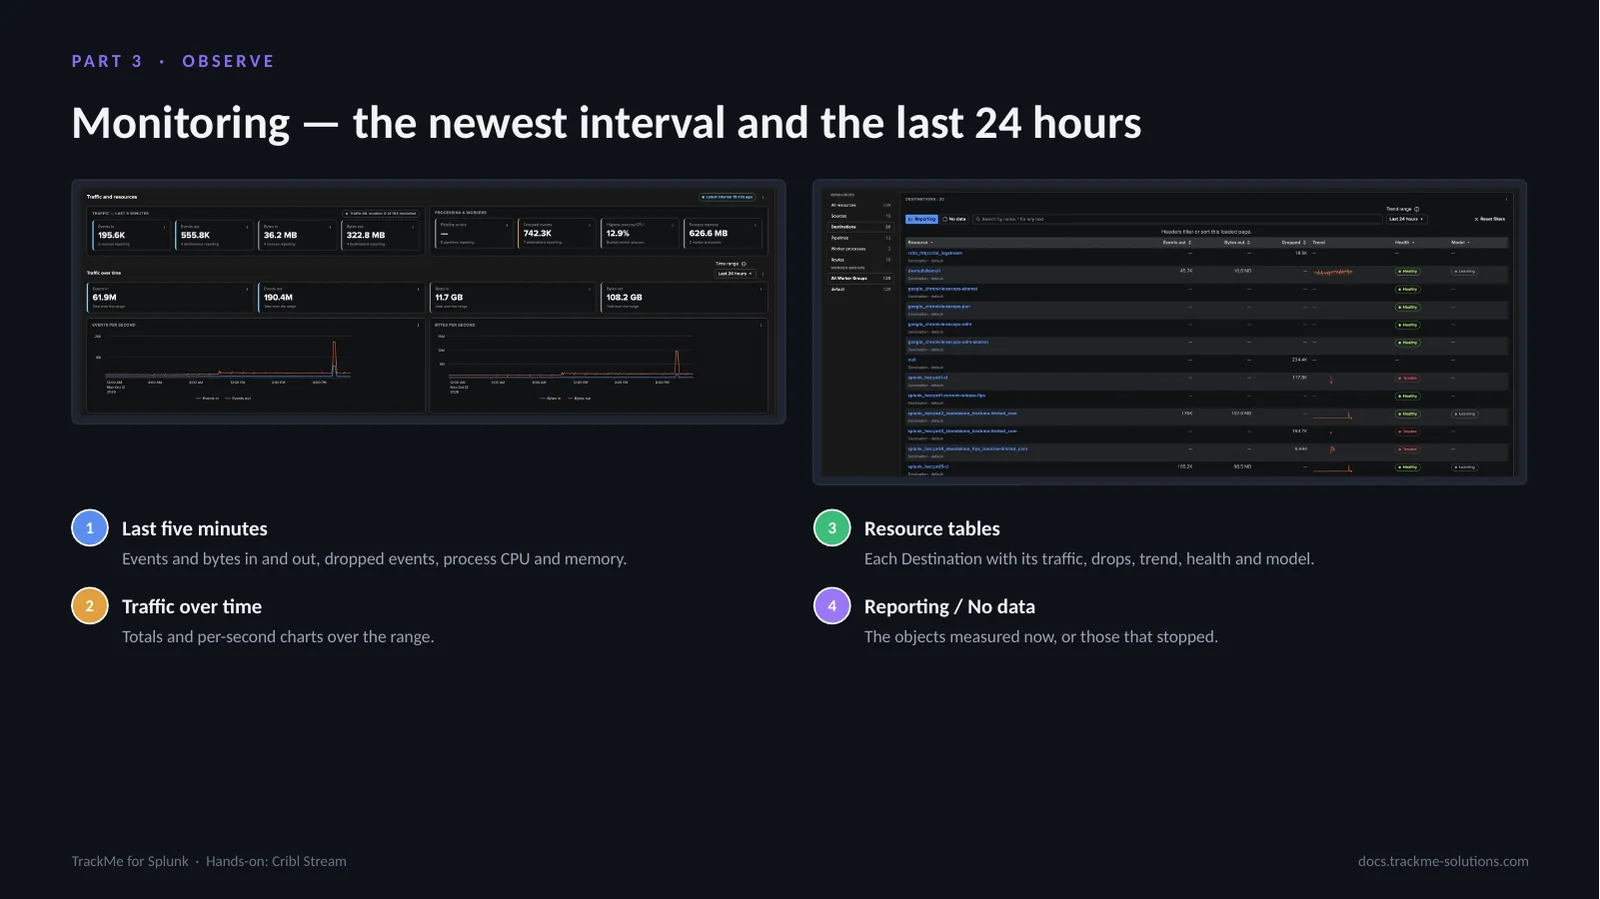
Monitoring shows the newest five-minute interval of every object and the traffic over the selected range. The resource tables list each Source, Destination, Pipeline, Route and worker process with its latest values, its health, its traffic ML model and a trend; a row opens its charts with the expected range and, for a Source or Destination, its live status from the Leader.
One model per object and measurement
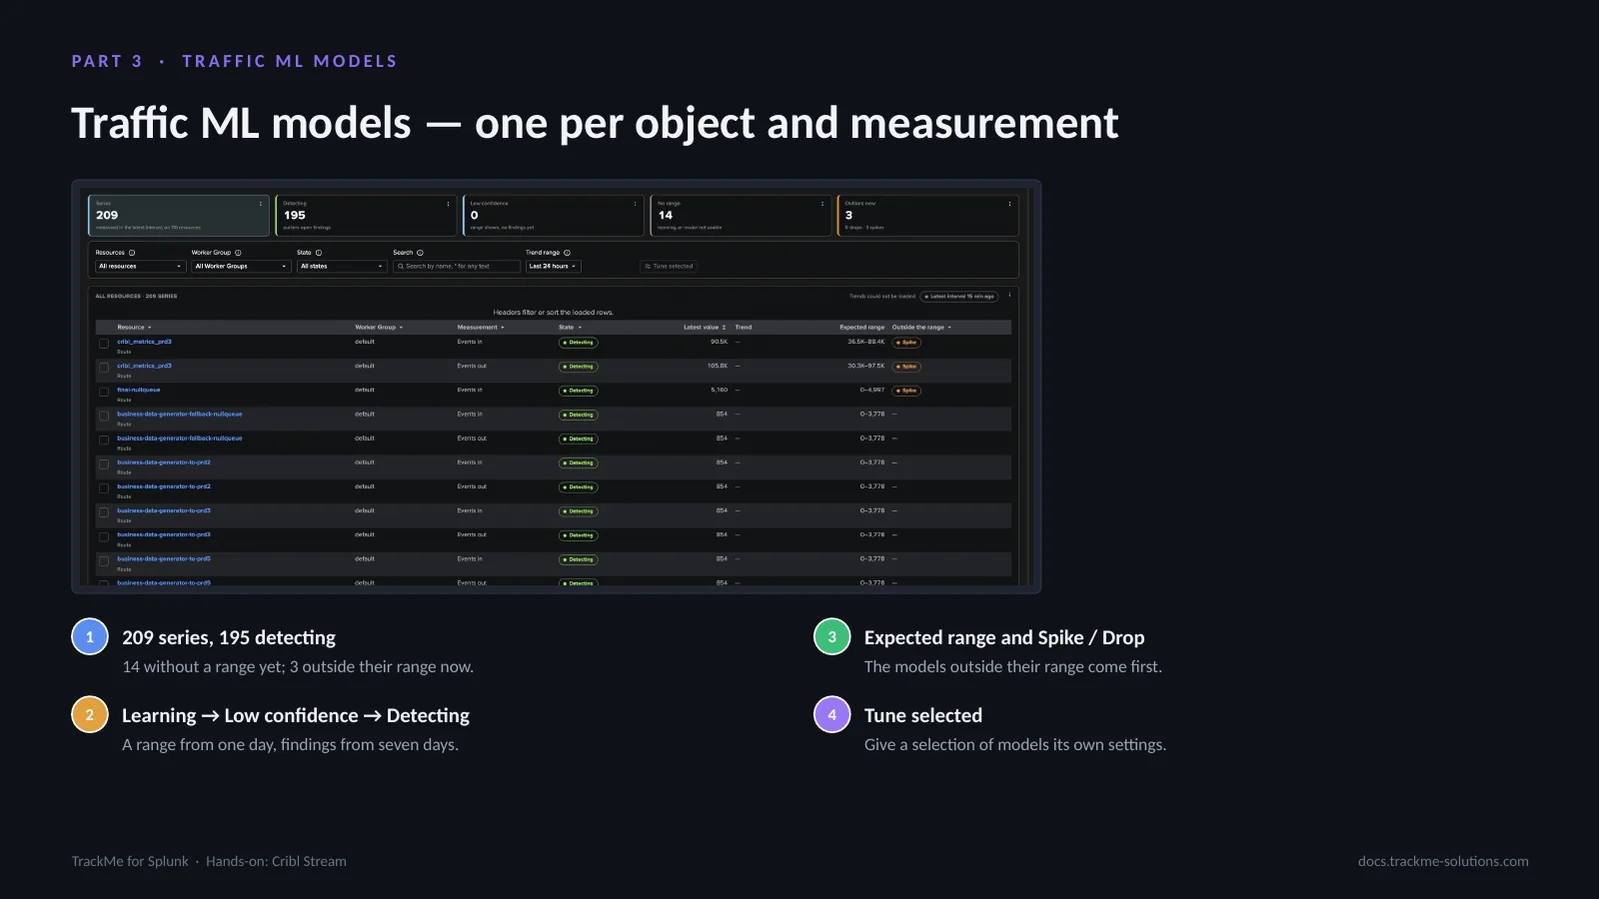
Every Source, Destination, Pipeline and Route gets its own traffic ML model. A model learns per hour of the day, then per weekday and hour after four weeks, with recent days counting more, and keeps learning from the newest intervals: there is no periodic full retrain. Learning means no range yet; Low confidence draws the range without findings; Detecting opens findings through the Traffic outliers policy.
A model and its tuning
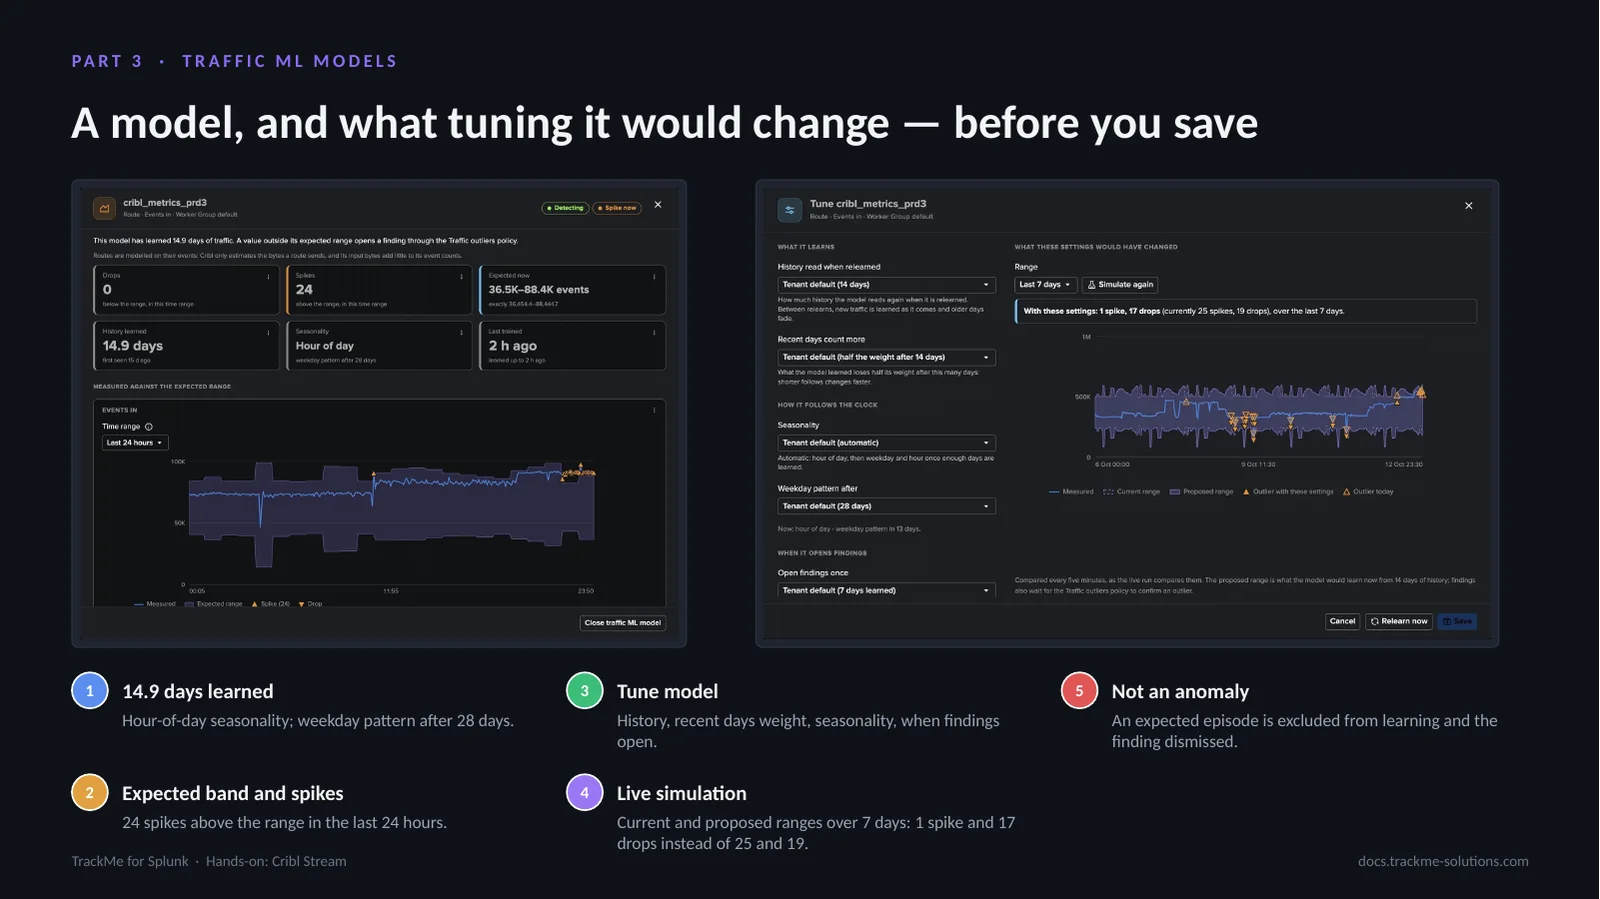
A model shows what it learned, its drops and spikes, its expected range, the history learned and its seasonality. Tune model gives a model or a selection its own settings, and the tuning screen simulates the current and proposed bands over 24 hours, 7 or 30 days, with the drops and spikes each would have raised, before anything is saved. Not an anomaly excludes an expected episode from what the model learns.
Expected traffic and silent objects
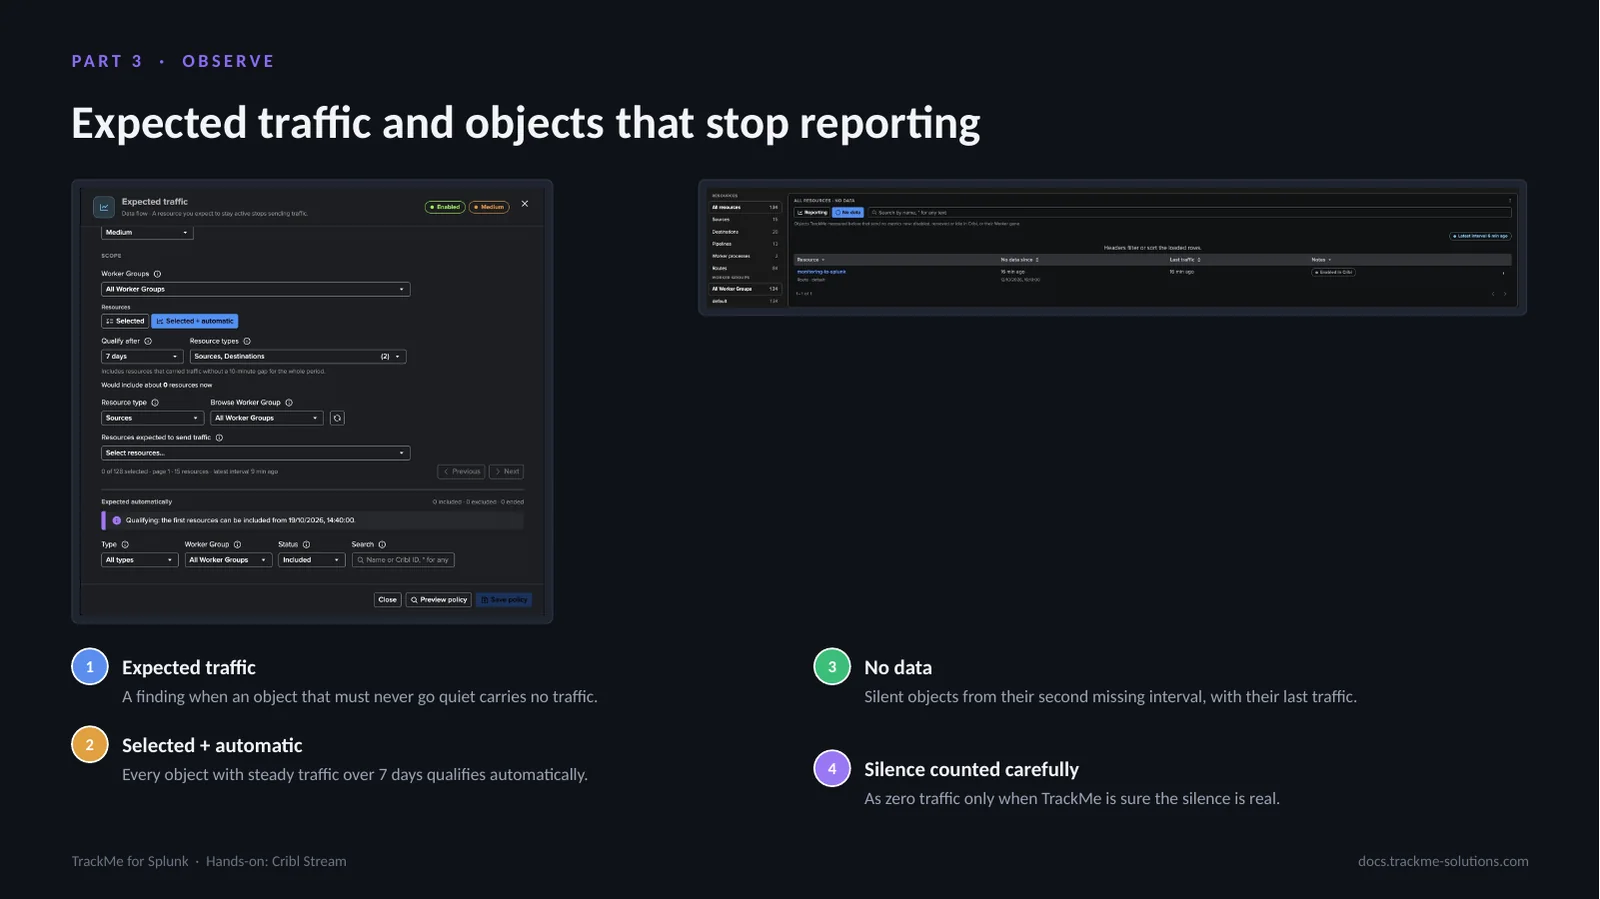
Some objects must never go quiet. Expected traffic opens a finding when an expected object carries no traffic; in Selected plus automatic mode TrackMe also expects every object that carried traffic steadily over the qualifying window. TrackMe remembers every object it measured: a silent object appears under No data, and Traffic outliers counts its silence as zero traffic only when the inventory, the Worker Group and the model confirm it is real.
Workers and the Leader
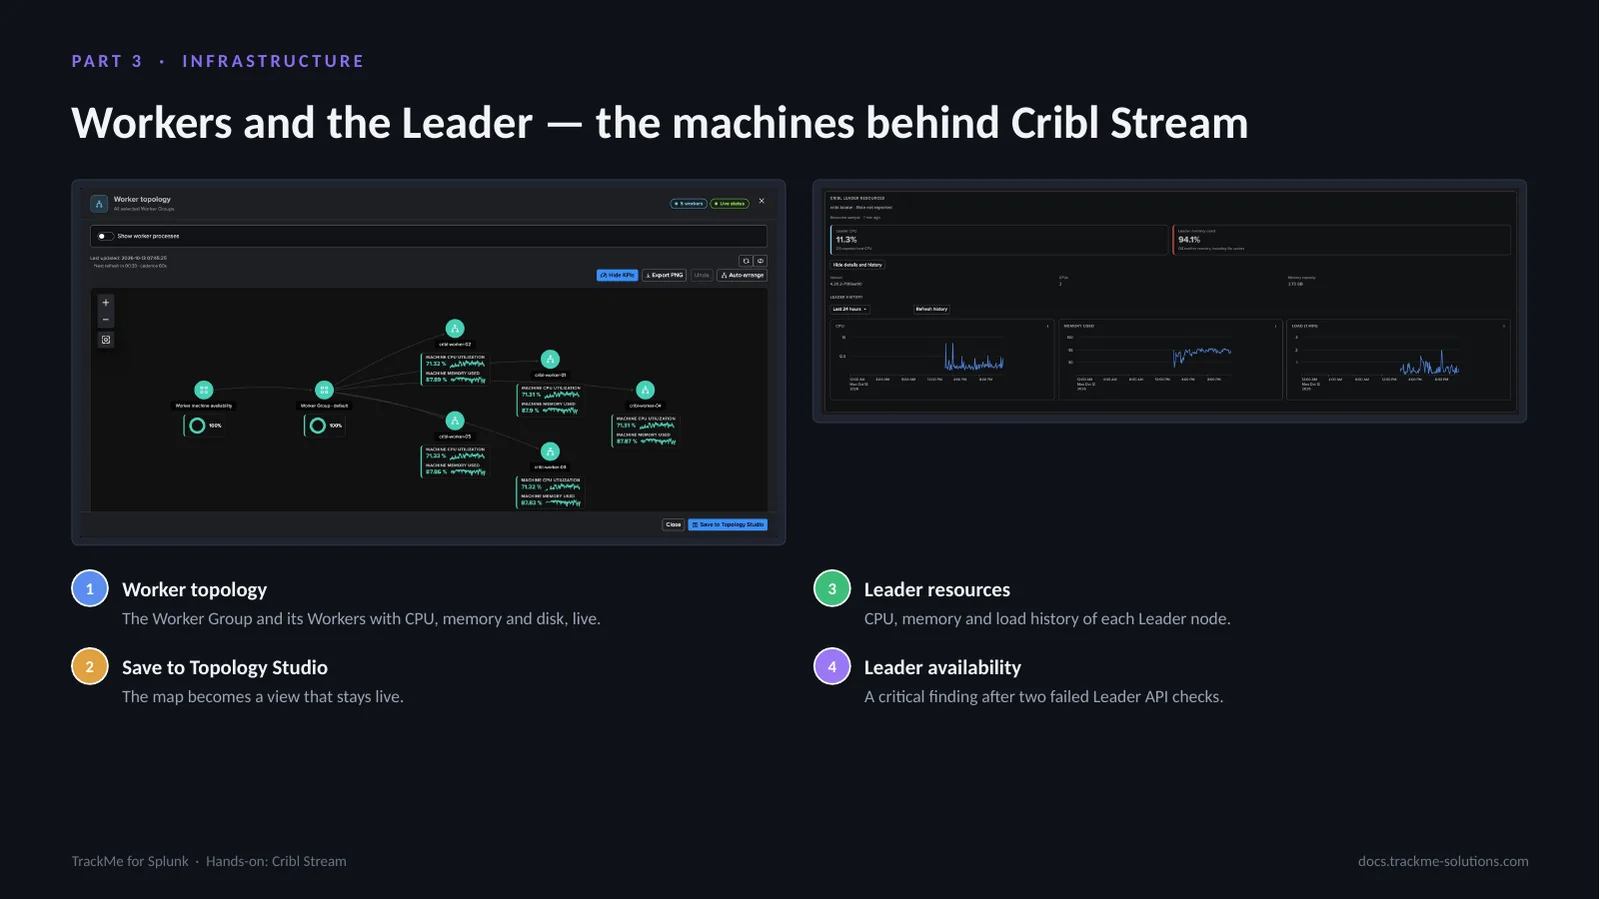
Infrastructure shows the machines: the Leader nodes with their resources and history, every Worker with its heartbeat, CPU, memory, load and disk, and every worker process. Worker topology draws them as a live map, ready to save to Topology Studio. TrackMe checks the Leader API at every live run: two failed checks open a critical Leader availability finding.
Routes and pipelines
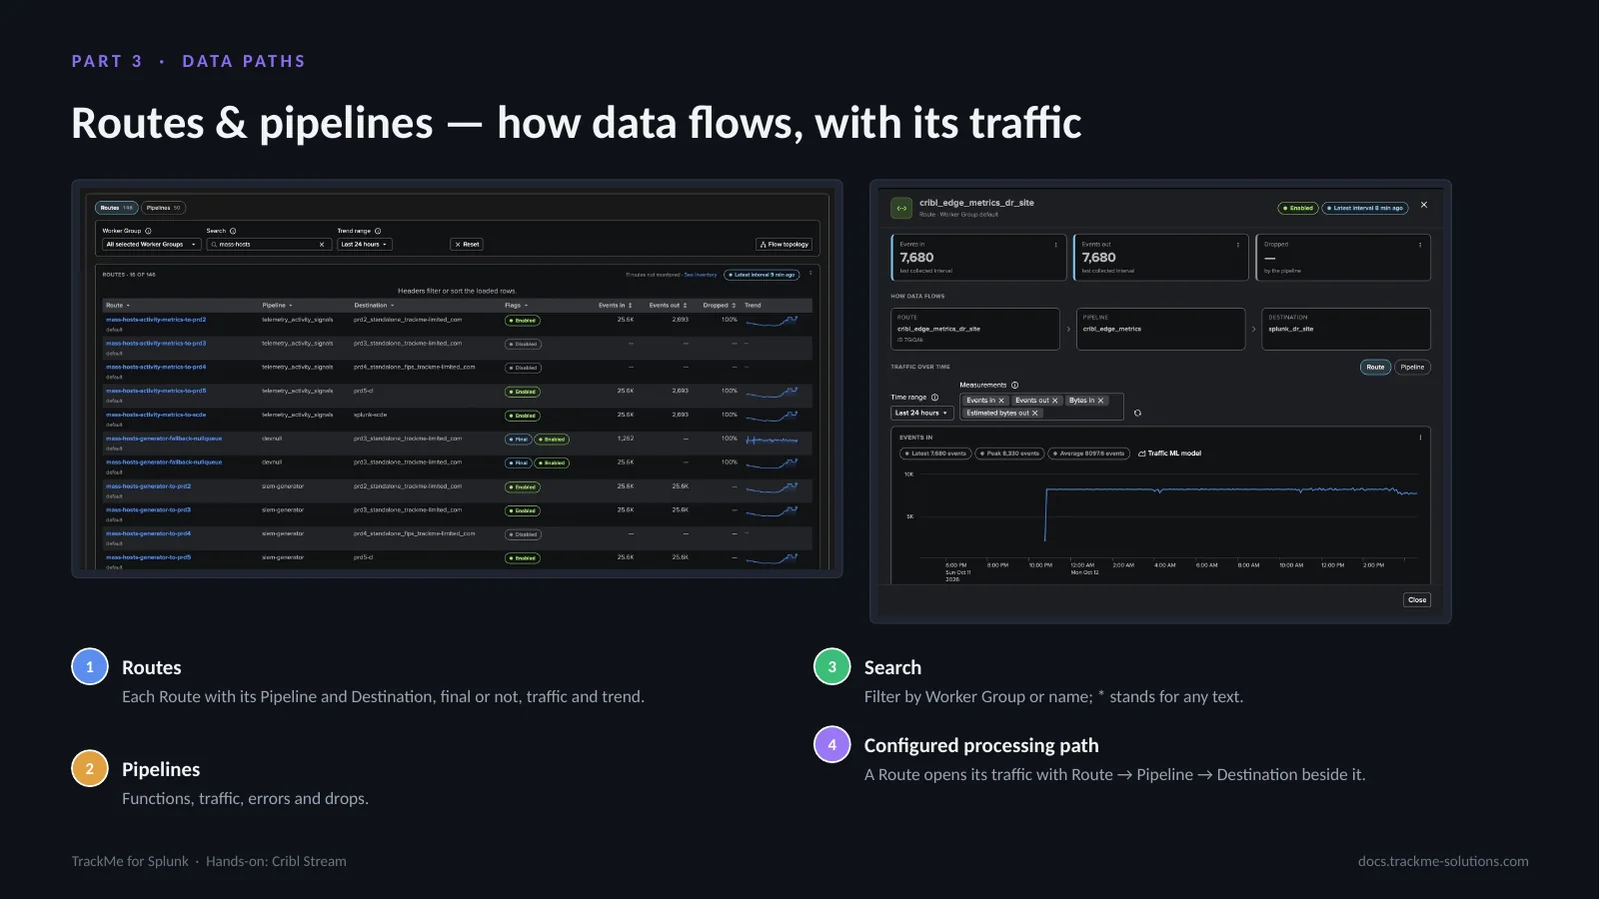
Routes & pipelines shows how data flows: every Route with its Pipeline and Destination and its measured traffic, and every Pipeline with its functions, errors and drops. A Route or Pipeline opens its traffic over time with its configured processing path beside it. Filters select a Worker Group or a name, with * standing for any text.
Data paths drawn as flows
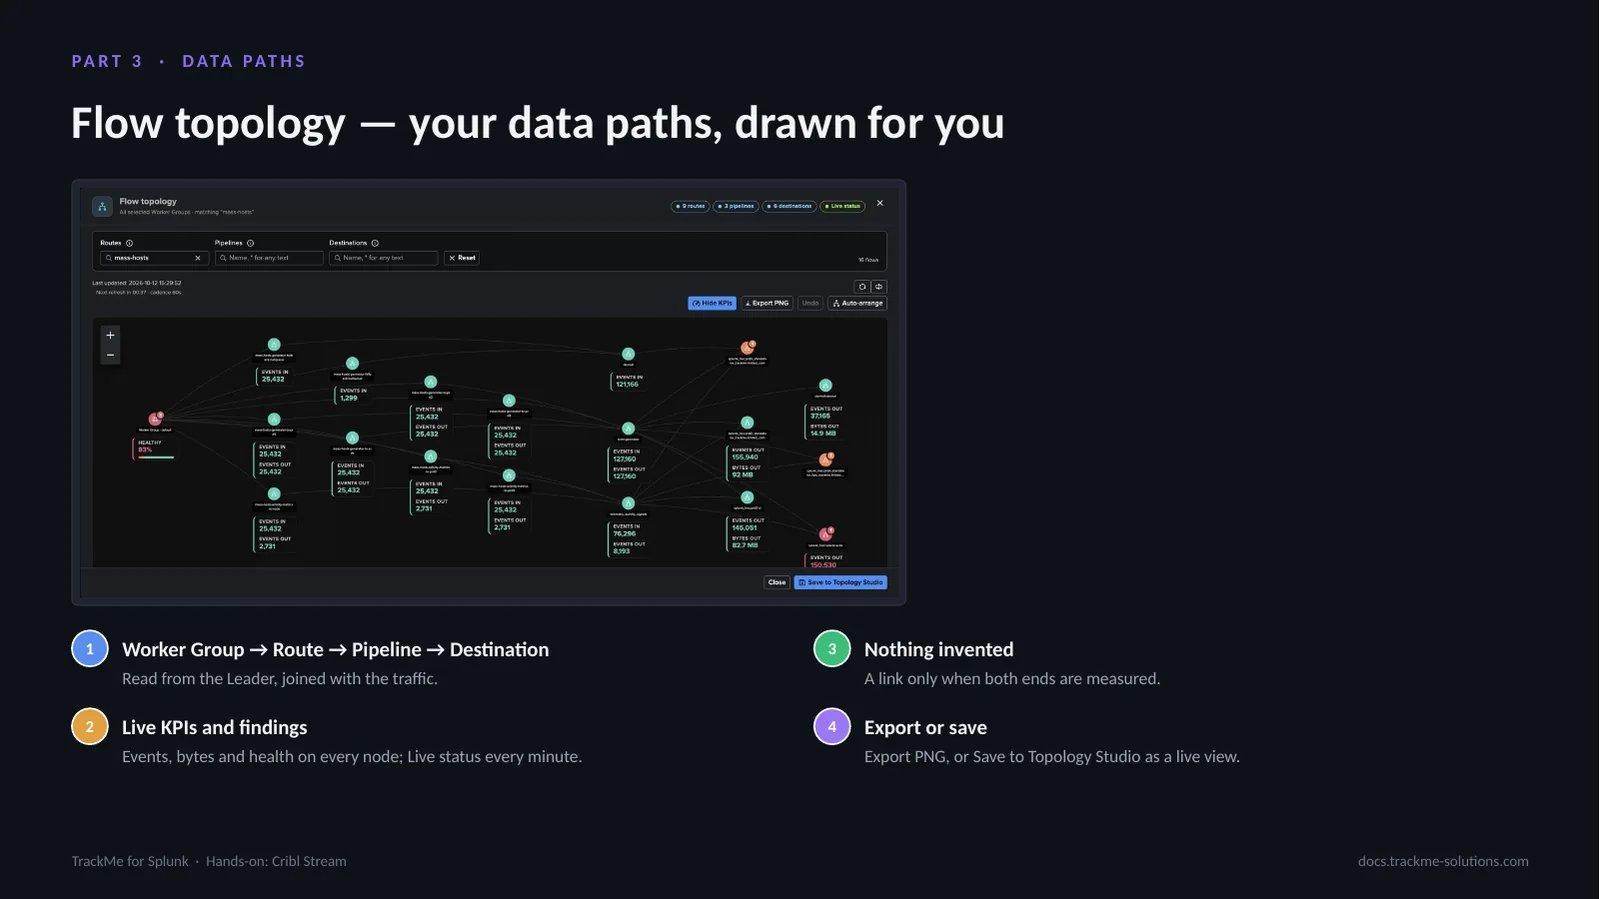
Flow topology draws the Routes the table selects as flows, left to right. You configure nothing: TrackMe reads each Route’s Pipeline and Destination from the Leader and joins them with the traffic it measures. A Destination fed by several Routes shows once, so you see which Routes depend on a Destination under backpressure. It covers up to 200 Routes at a time.
Part 4 — Operate
The Inventory and exclusion rules decide what is monitored; the sixteen policies, notifications, the Cribl Stream AI Agent, Topology Studio, the AI Assistant with the Concierge, and the Configuration Guardian complete the operation of the tenant. Policies, exclusion rules and settings are changed by a TrackMe administrator of the tenant; every role of the tenant reads them.
Choosing what to monitor
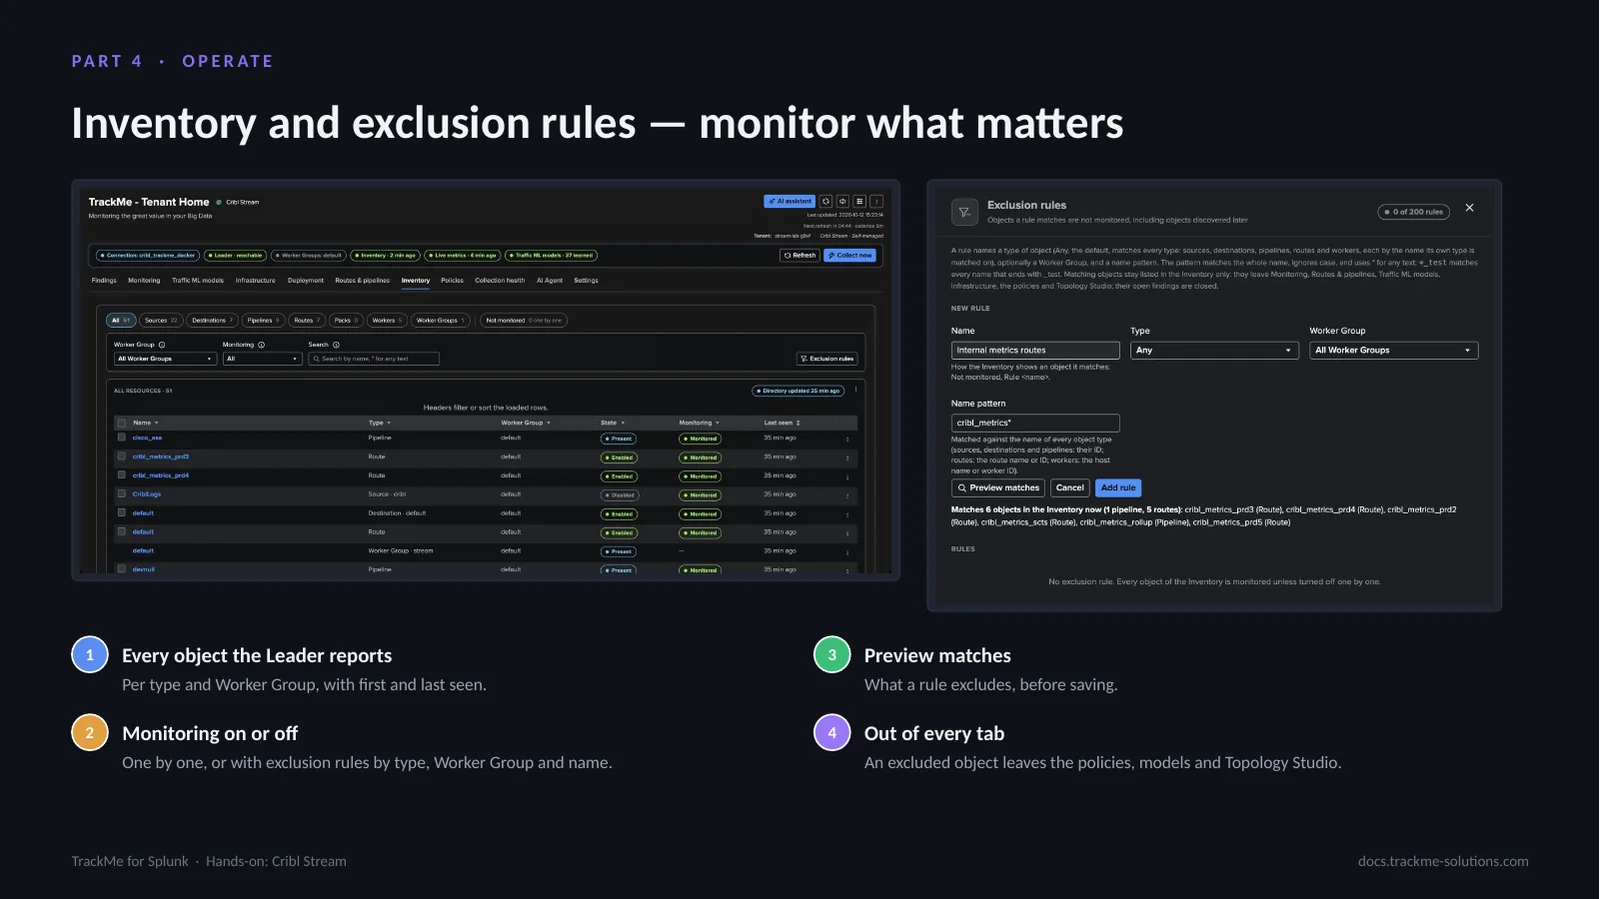
The Inventory lists every object the Leader reports, with its monitoring state. Turn monitoring off for objects you do not care about — a test Route, a retired Destination, a lab Worker — one by one or with exclusion rules. An object turned off appears only in the Inventory: it leaves the other tabs, the policies, the model training and Topology Studio, and its open findings close.
The policy catalogue
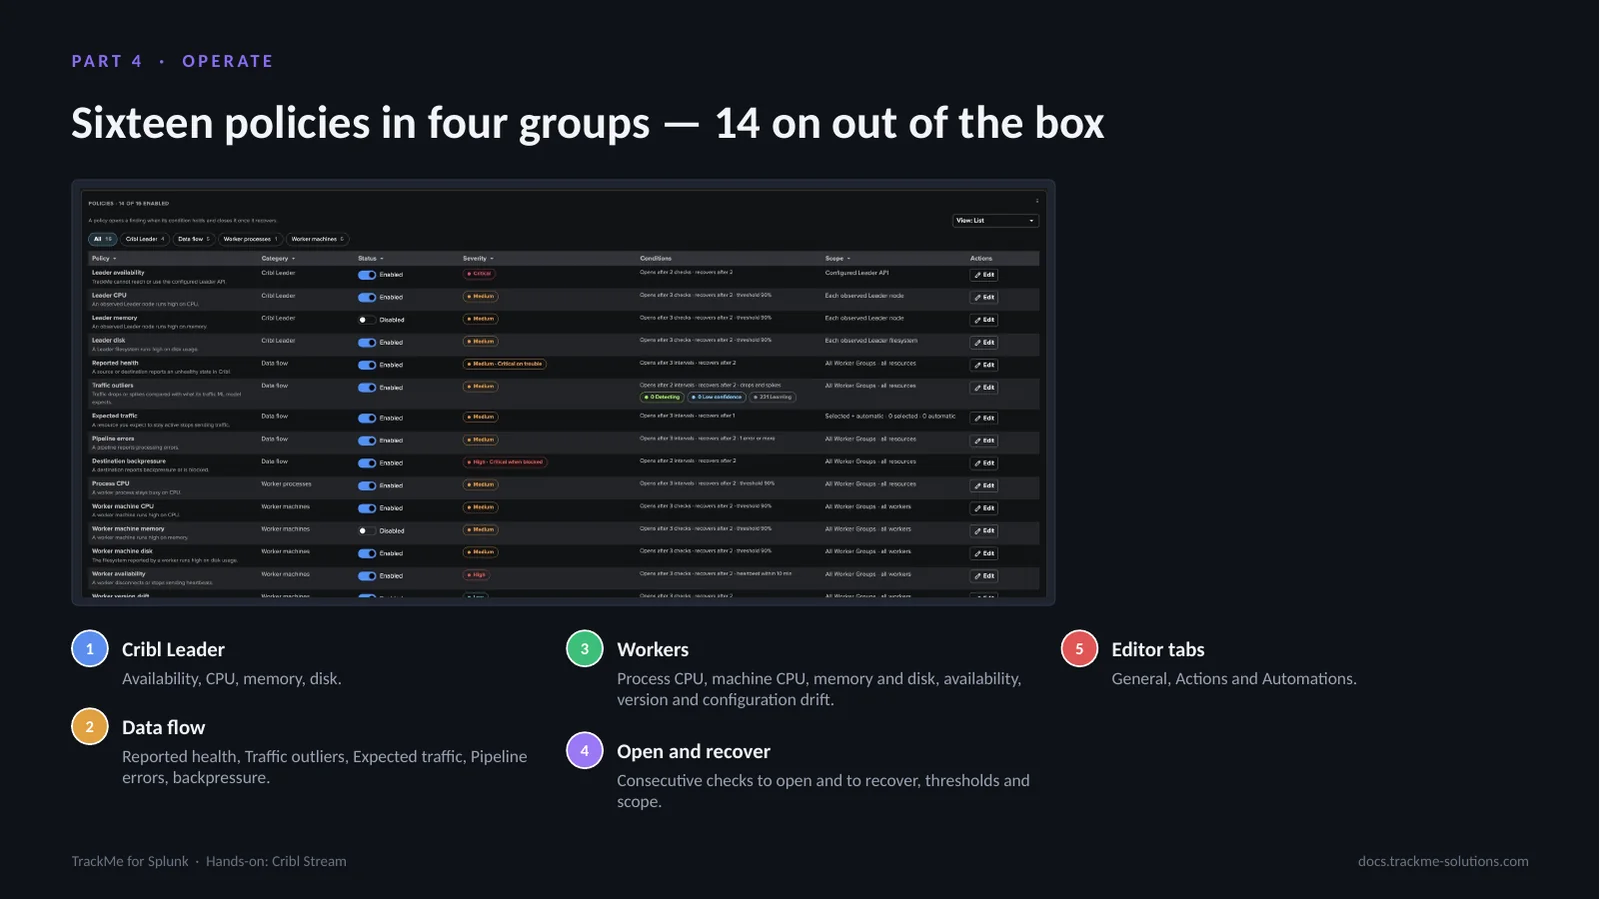
The 16 built-in policies in four groups. Each has its enablement, its severity, how many consecutive checks open and recover a finding, its thresholds and its scope, with a preview of what it would select. Leader memory and Worker machine memory are off by default because the memory the operating system reports as used includes its file cache.
Notifications and indexed events
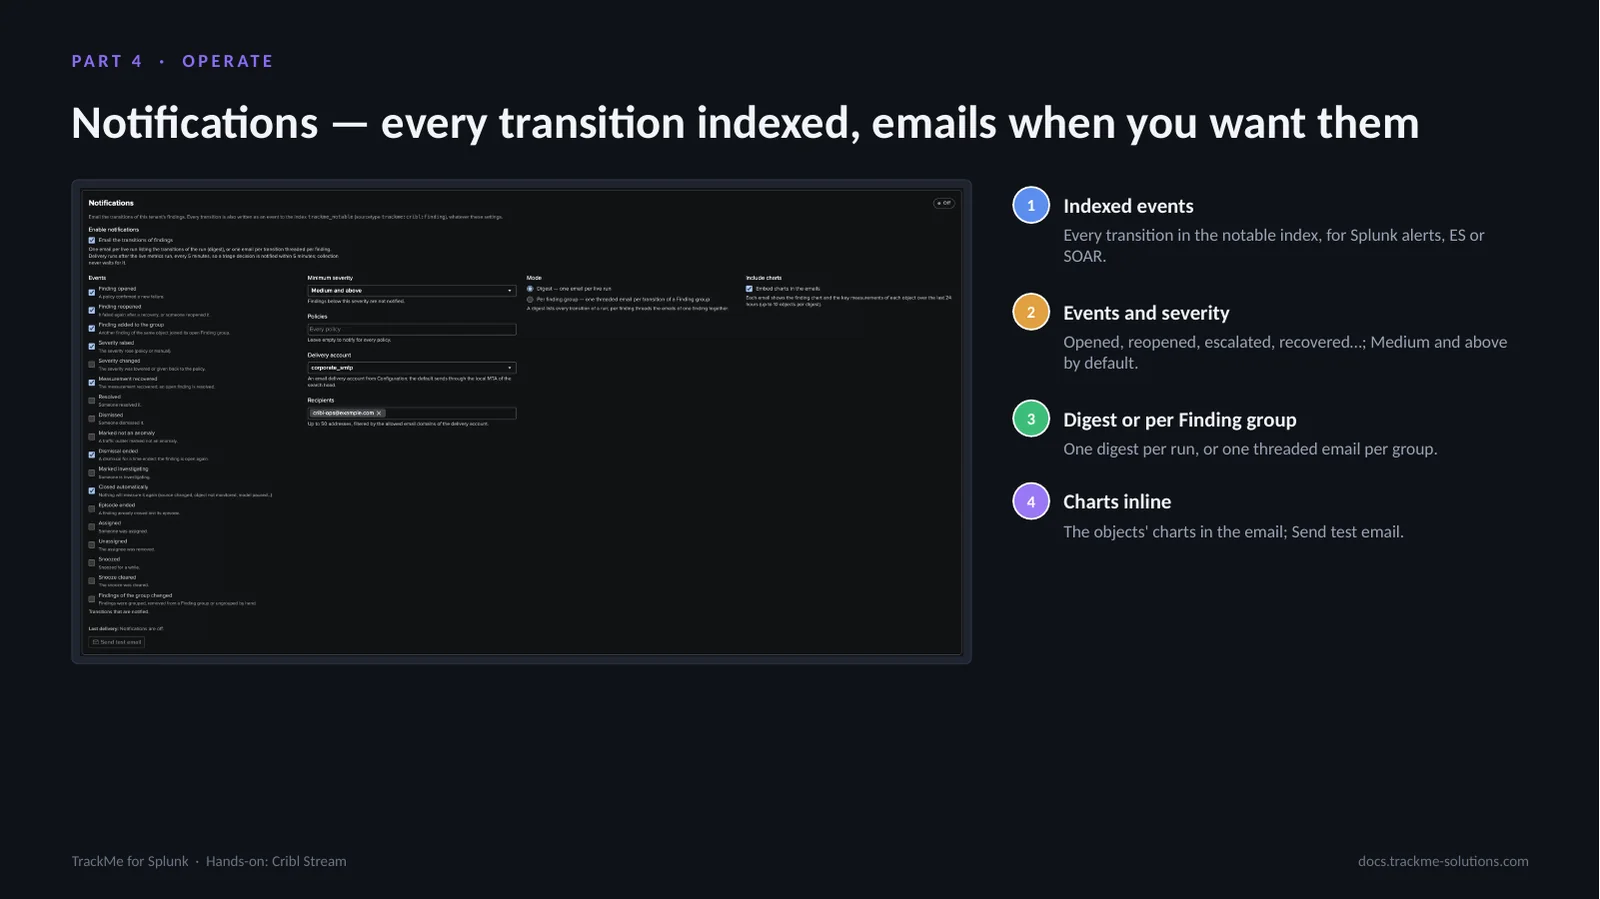
Every transition of a finding or Finding group is written to the notable index, whatever the notification settings. Email notifications are off by default; a TrackMe administrator of the tenant chooses the events, the minimum severity, the policies, the delivery account and up to 50 recipients, and the digest or per-group mode.
The Cribl Stream AI Agent
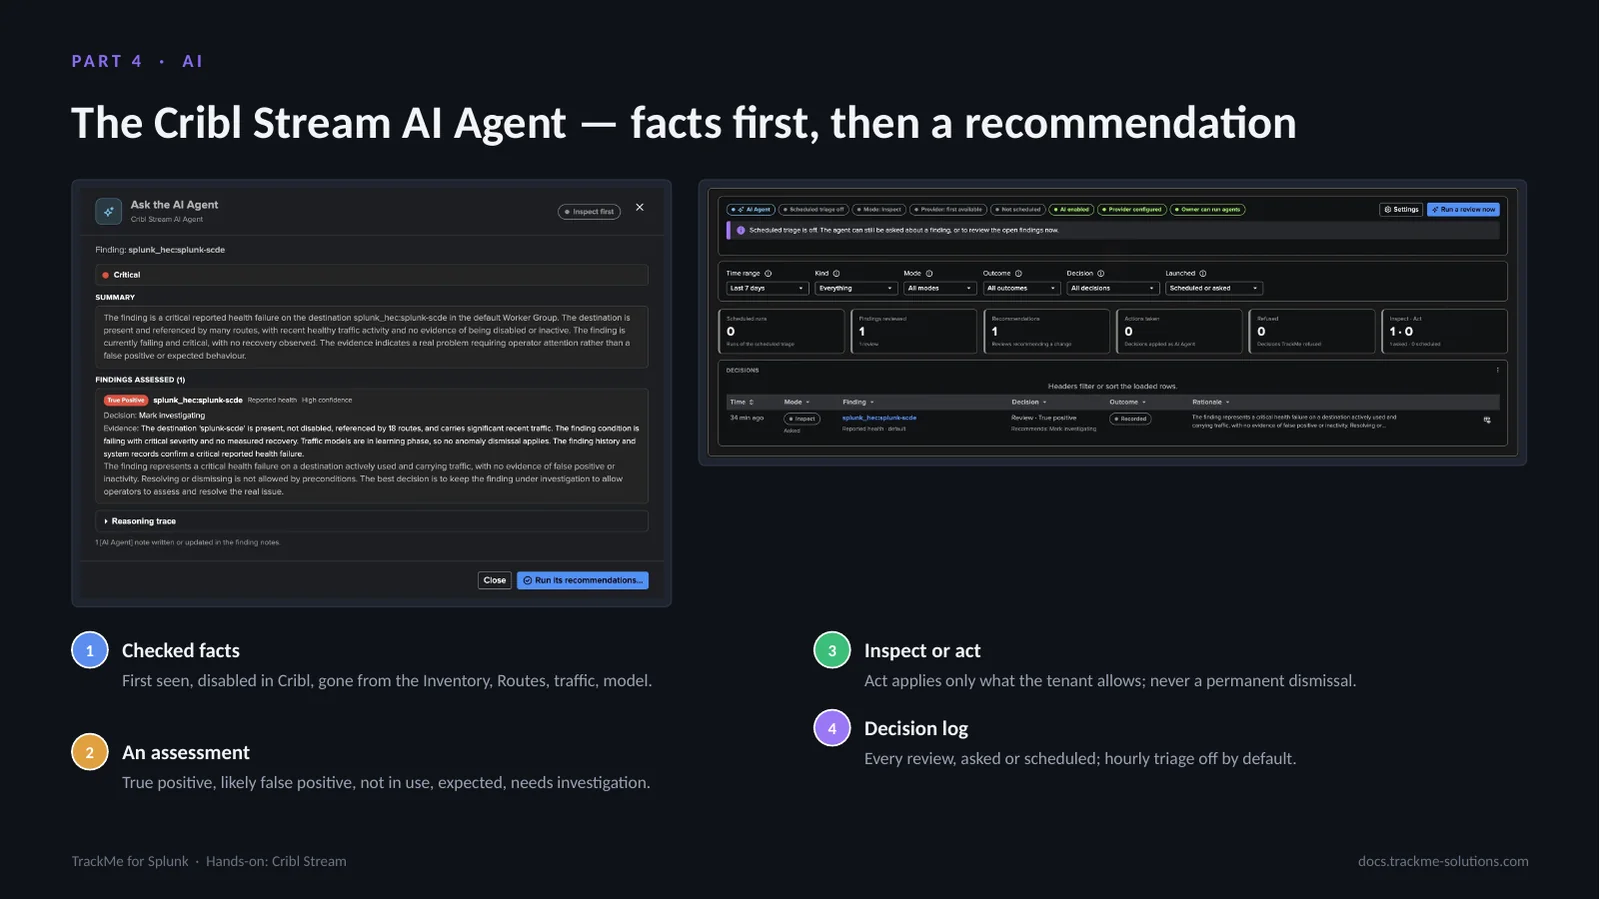
The Cribl Stream AI Agent reviews findings from facts TrackMe checks: when the object was first seen, whether it is disabled in Cribl or gone from the Inventory, which Routes reference it, its traffic and its model. It recommends a decision and keeps one current AI Agent note. Act applies by default only Mark investigating, Dismiss for a time and Not an anomaly; Resolve and Stop monitoring need a proof.
Cribl objects in Topology Studio
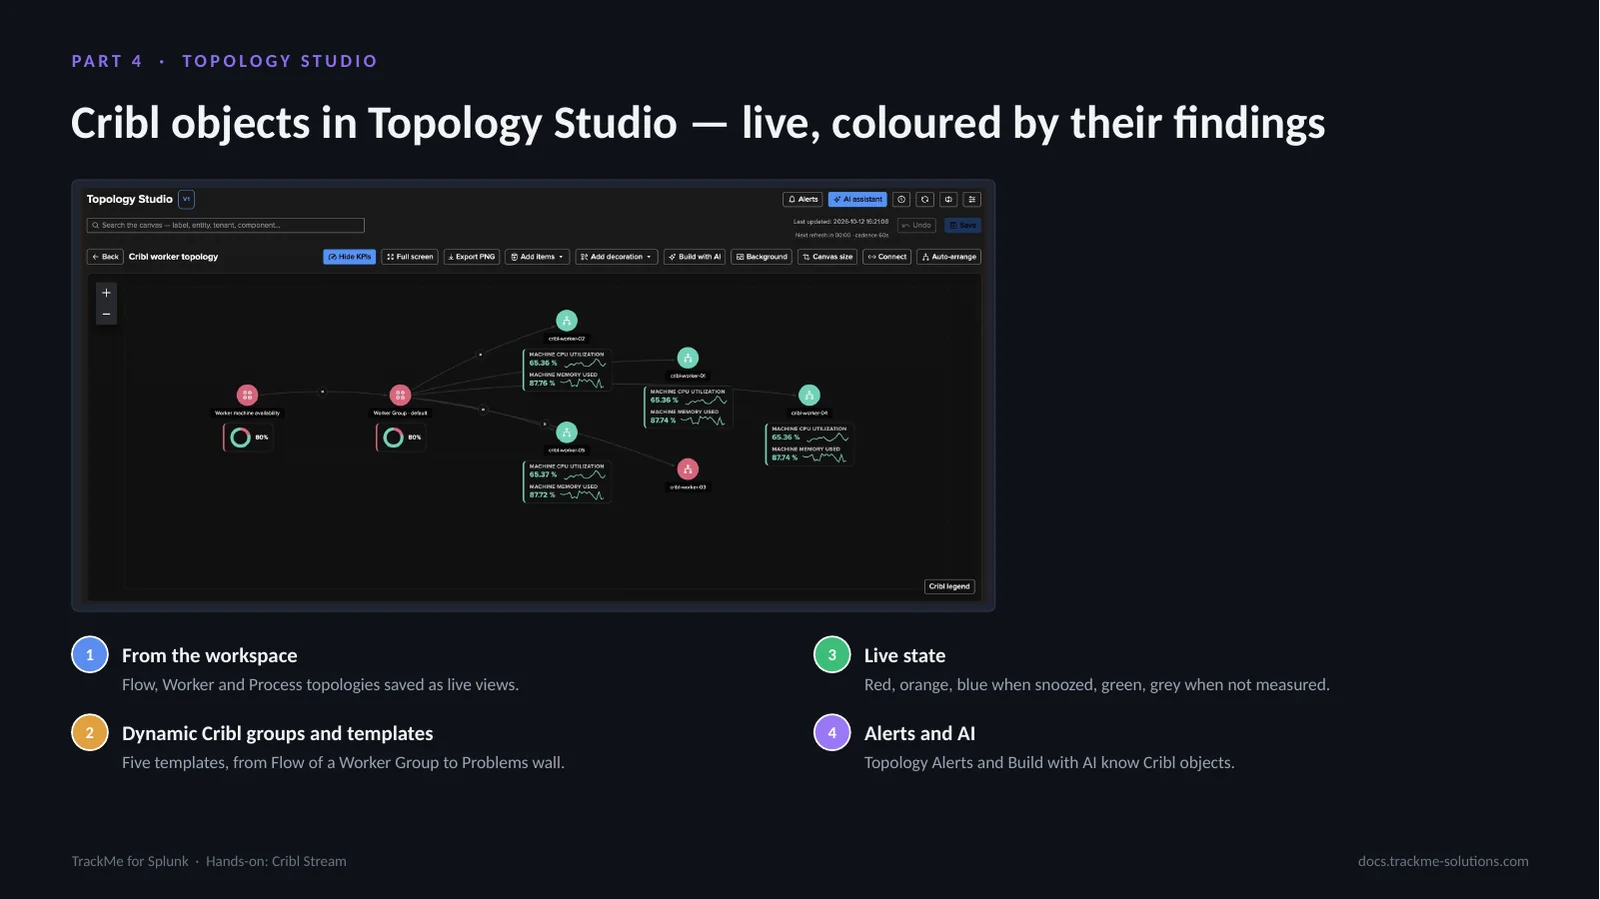
Cribl objects are first-class citizens of Topology Studio: Sources, Destinations, Pipelines, Routes, Workers and worker processes, dynamic Cribl groups that follow a selection, and five templates. Nodes carry their KPIs and 24-hour sparklines, and their colour follows their findings. From the workspace, the Flow, Worker and Process topologies are saved as live views. In the Studio, Add entities and dynamic Cribl groups pick objects, and Topology Alerts and Build with AI know Cribl objects.
AI Assistant and Concierge
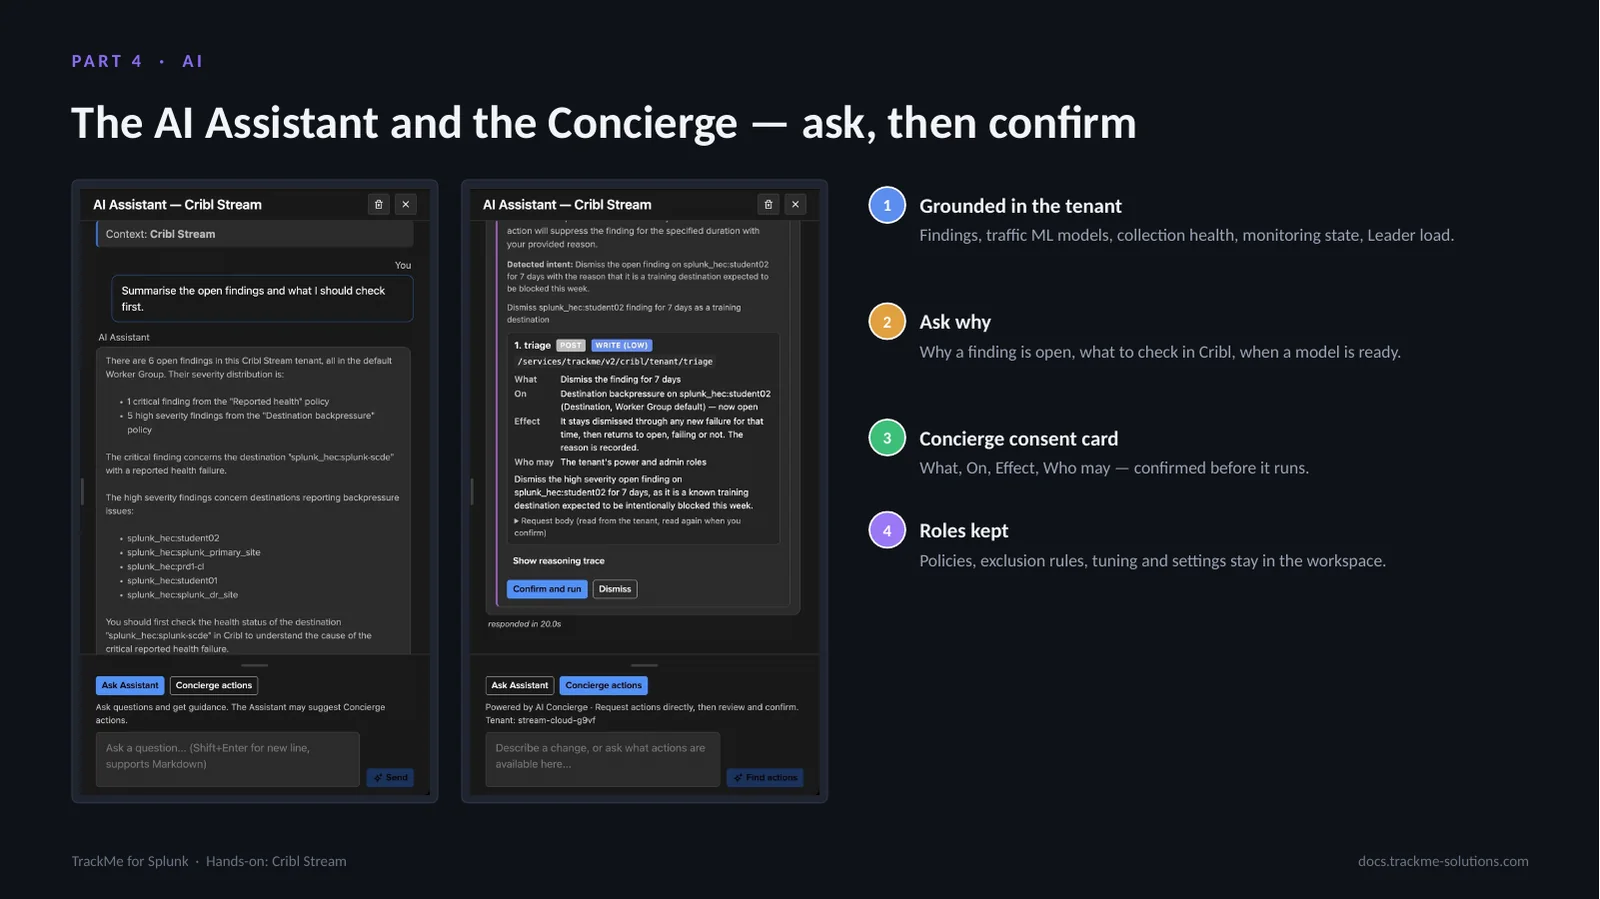
The AI Assistant of a Cribl Stream tenant is grounded in its findings, models, collection health, monitoring state and Leader load. When you ask for a change it can make, it proposes an AI Concierge consent card that you confirm before anything runs: a decision on a finding, Not an anomaly, monitoring on or off for named objects, a collection job, or relearning a model. Each action keeps the role it requires.
Collection health and the Guardian
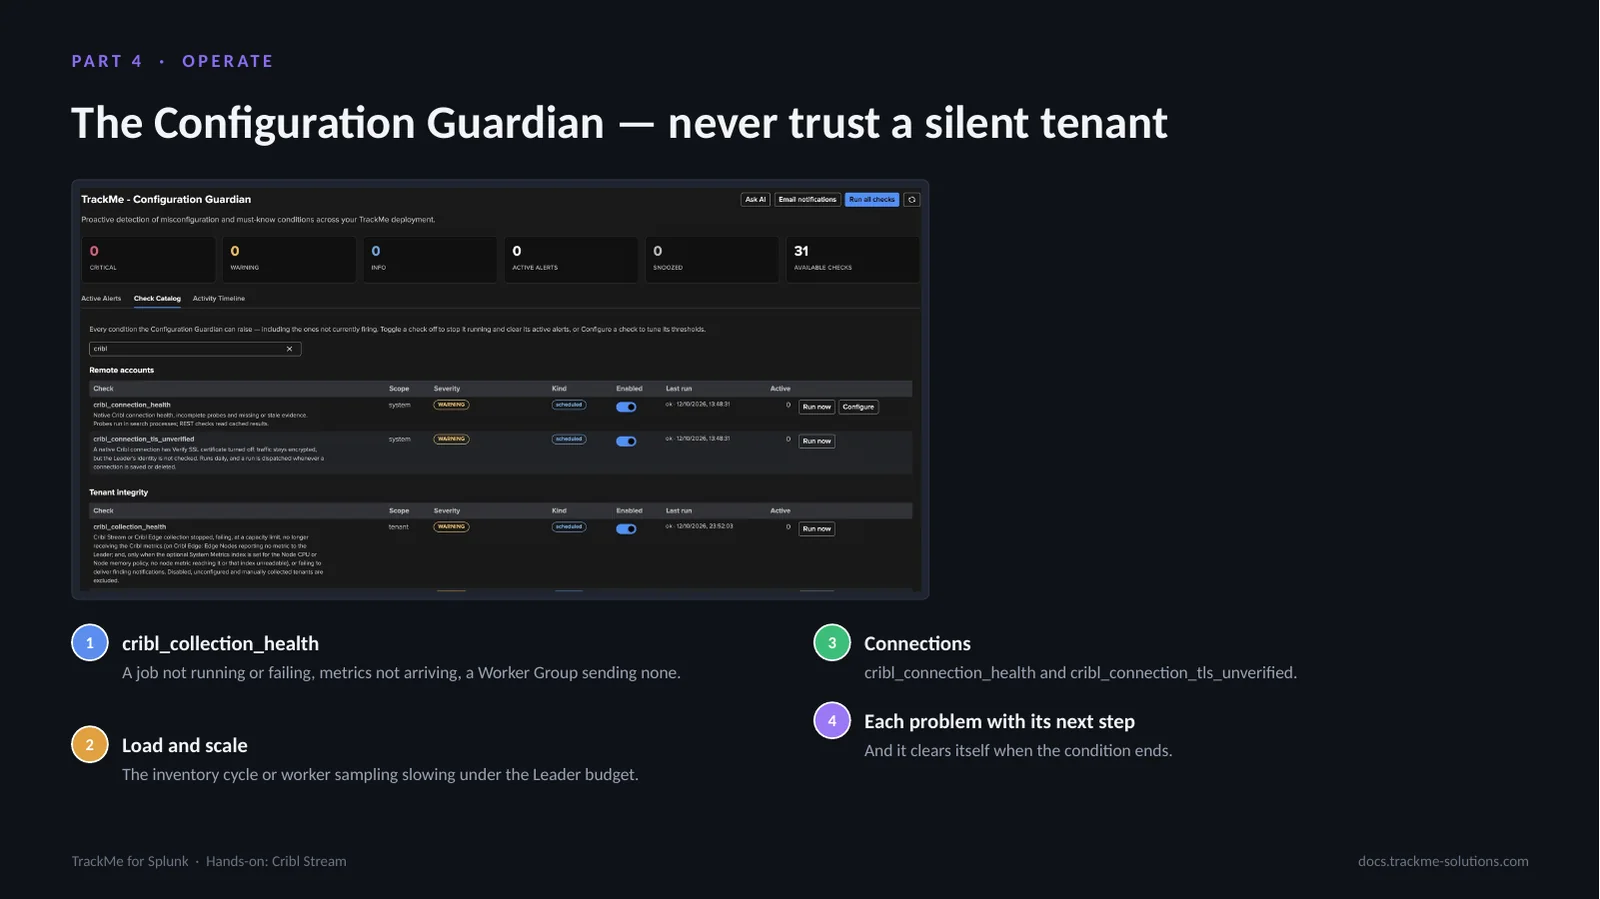
Collection health keeps you from trusting a silent tenant. The Configuration Guardian check cribl_collection_health raises a warning when a job is not running or keeps failing, when metrics stop arriving, when the collection slows down under the Leader budget, when many objects stop together, or when notification emails fail. The Guardian also checks the Cribl connections themselves.
Where we are
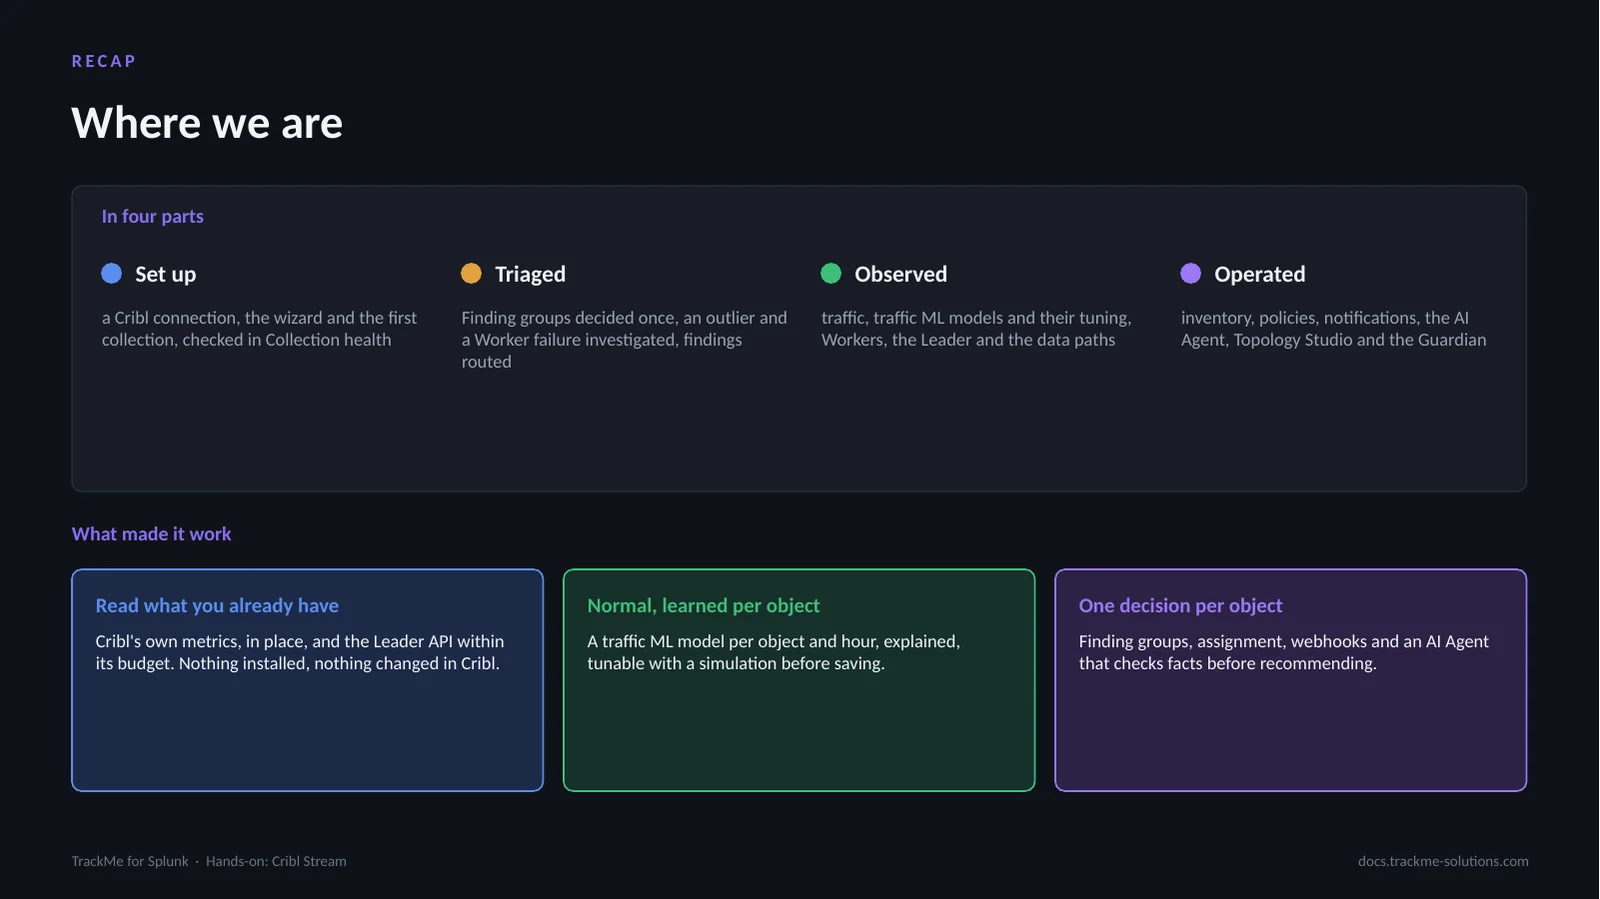
A tenant created on a Cribl connection, its findings grouped per object and triaged, a traffic outlier investigated against its learned range, a Worker failure seen in the finding and the topology, findings routed to a team and to a webhook, the deployment observed from its traffic to its machines and data paths, and the tenant operated with policies, notifications, the AI Agent, Topology Studio and the Guardian.