Splunk S2S
Follow the Splunk-to-Splunk receiving side of a deployment from the telemetry Splunk already writes: the indexer cluster found without configuration as one pool per site and its manager account for planned work, the heavy forwarder tier found as an automatic pool and made a configured one, what is blocked now, a pool’s load distribution, a receiver’s pipeline queue by queue and the data path from the senders to the indexers; a heavy forwarder stopped on purpose, the three findings it opens, how each is evaluated, the notification email and the Splunk S2S AI Agent; then the twenty-two policies, the traffic models and collection health.
about 30 minutes · 26 slides. Each slide is followed by a description of what it shows — read top to bottom, this page is the walkthrough.
Overview
This walkthrough covers the Splunk S2S tenant, generally available in TrackMe 2.4.22. Everything was captured live on a deployment with a four-peer indexer cluster on two sites, a tier of four heavy forwarders, and universal forwarders sending to that tier. In four parts: create the tenant, follow the pools, the hosts and the data path, read the findings of a heavy forwarder stopped on purpose, and operate the tenant.
Why a dedicated Splunk S2S tenant
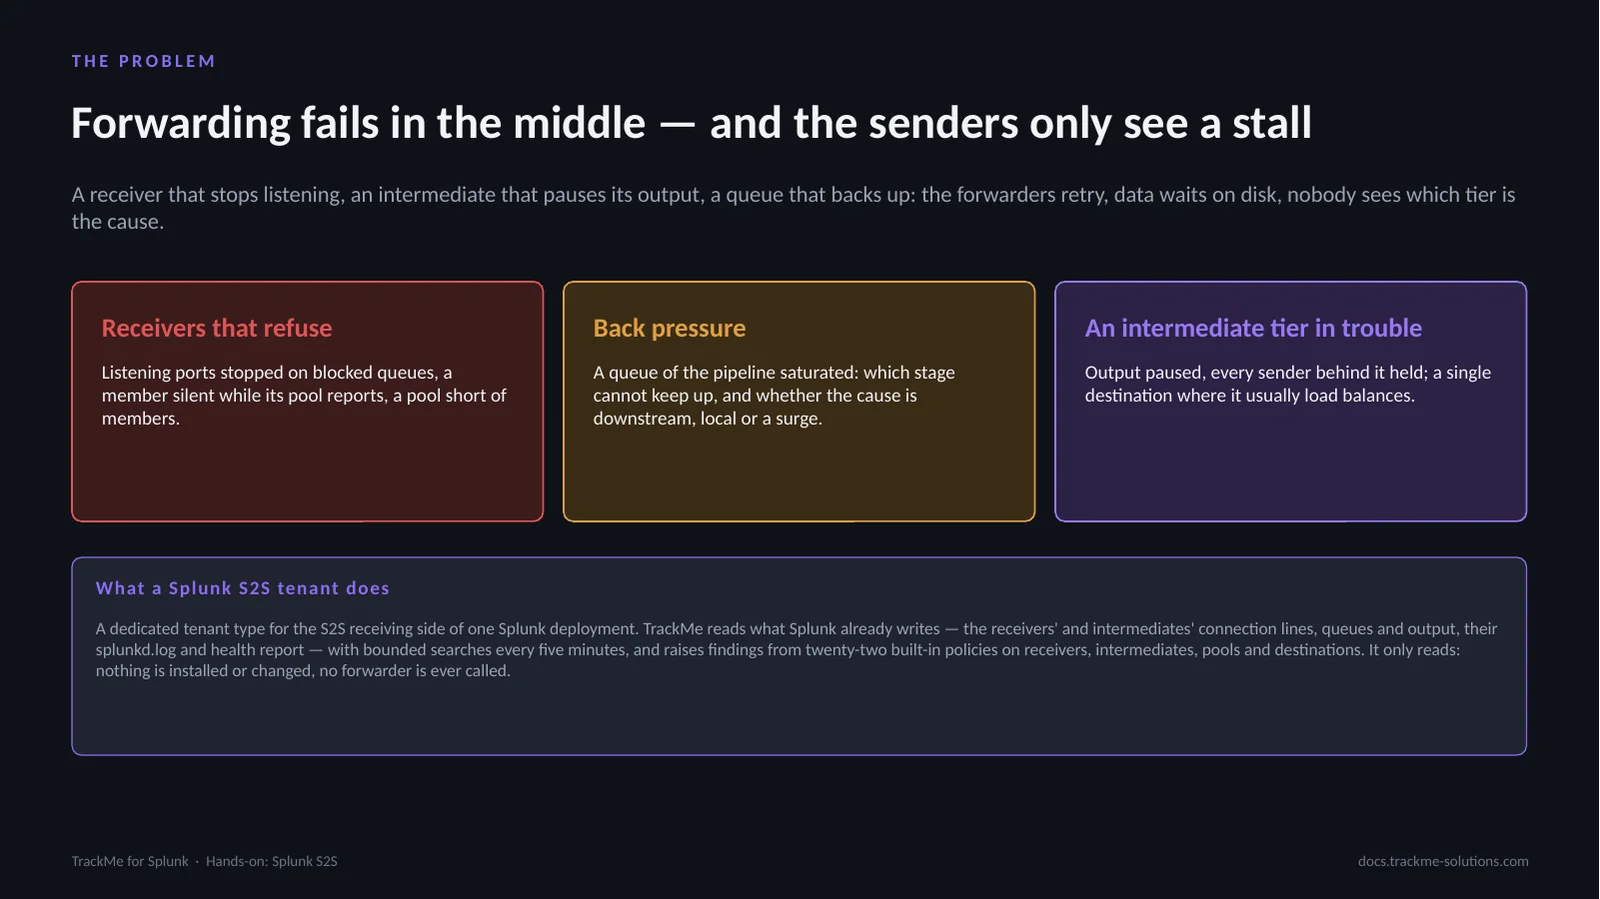
A Splunk administrator asks the same forwarding questions every day: is every receiver accepting and keeping up, is the intermediate tier blocked, backed up or silent, which tier is the bottleneck when senders are held back, and is the cause downstream, local or an upstream surge. How much flows into each pool, from how many senders, with which TLS and acknowledgement posture? The Splunk S2S tenant answers them with findings raised by twenty-two built-in policies. It only reads the telemetry Splunk already writes: nothing is installed or changed on a forwarder or an indexer.
How a Splunk S2S tenant works
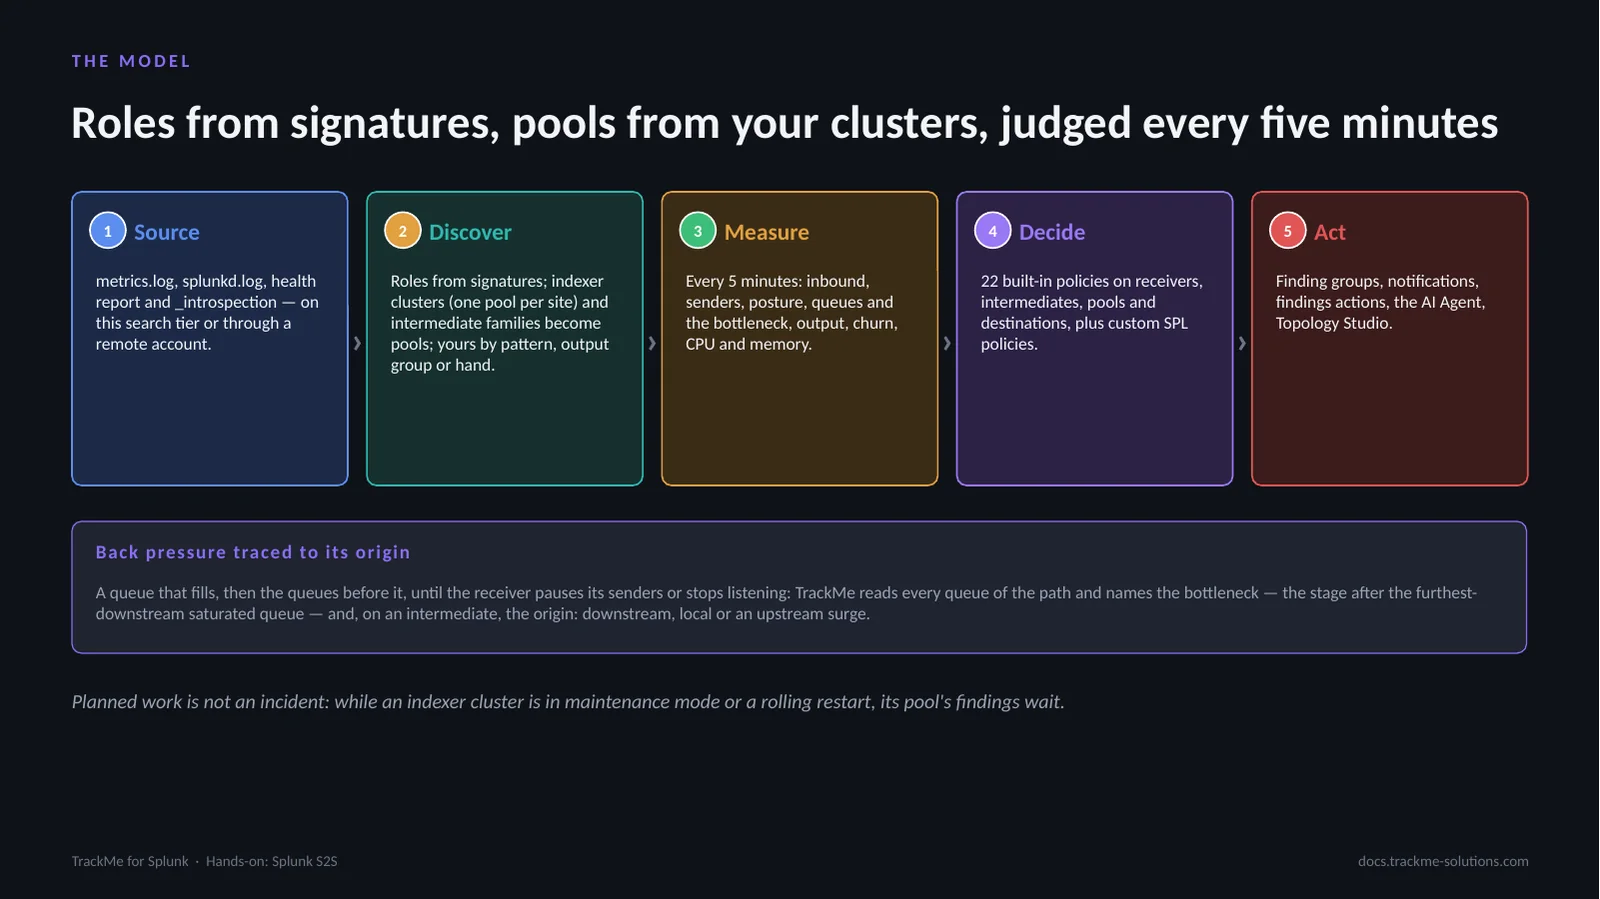
Roles are read from signatures over a day: a host that receives and indexes is a receiver, a host that receives and forwards is an intermediate forwarder. Each indexer cluster the search head is attached to becomes a pool by itself, one per site of a multisite cluster; the intermediate forwarders no pool claims form one automatic pool per host-name family, and other hosts are grouped by host patterns, output groups or hand assignment. Every five minutes the live job reads the last settled index-time window, and the policies decide. Back pressure is traced to its origin: the stage that cannot keep up, and whether the cause is downstream, local or an upstream surge. Planned work is not an incident: an indexer cluster in maintenance mode or a rolling restart holds the pool’s findings.
The plan
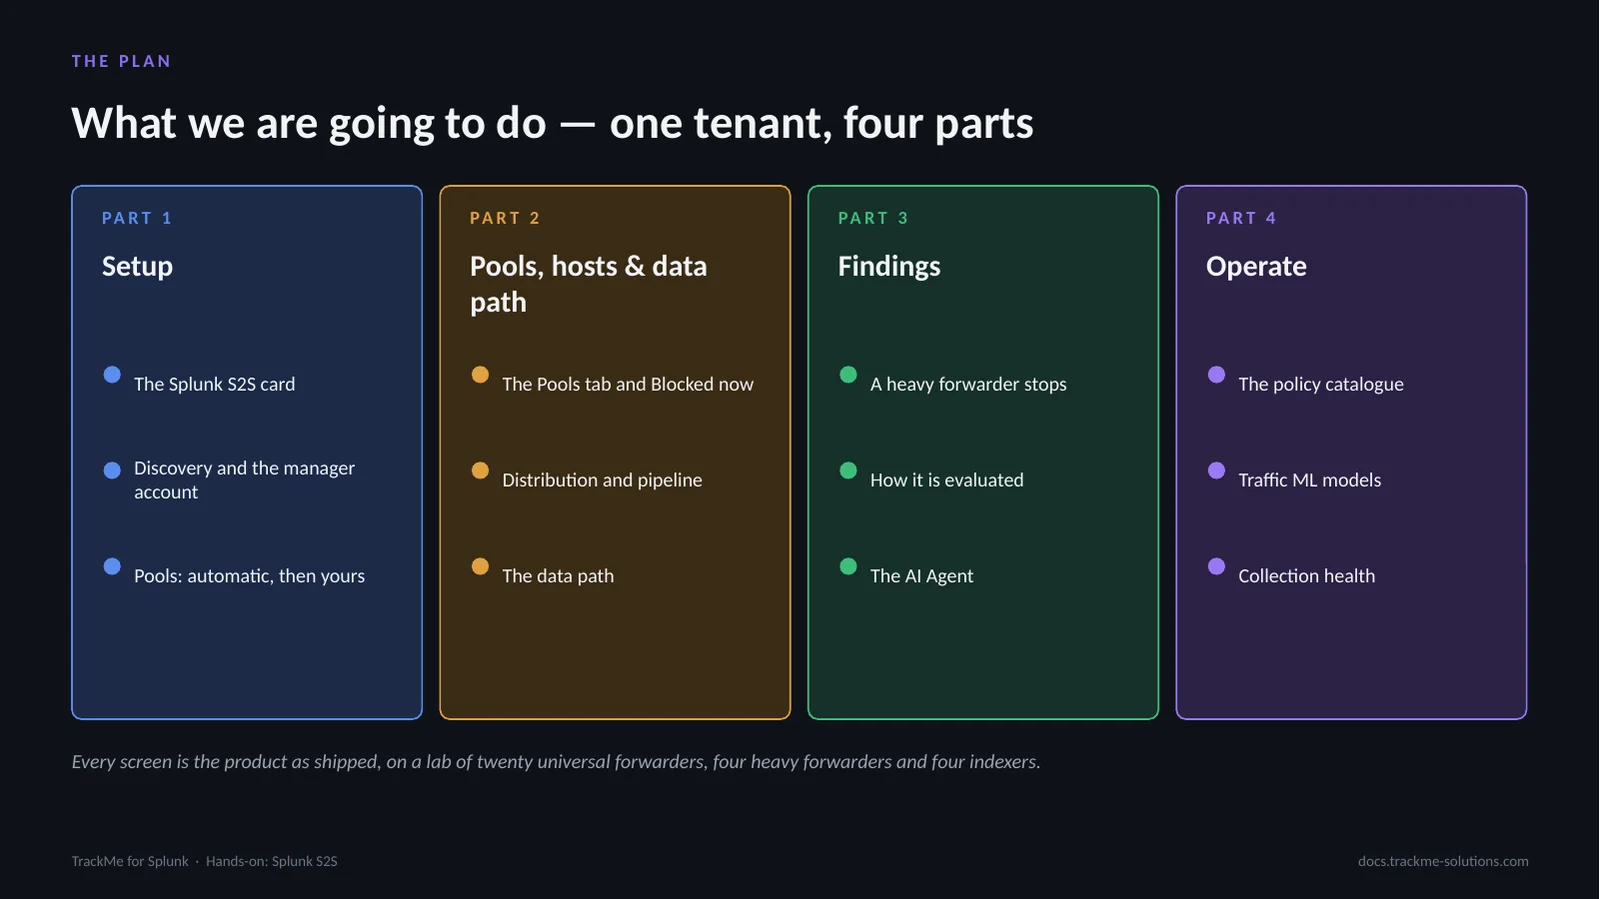
Four parts. Setup: the wizard, the indexer cluster’s site pools and their manager account, the automatic pools and the heavy forwarder tier made a configured pool. Pools, hosts and the data path: the Pools tab and Blocked now, a pool’s distribution, a receiver’s pipeline and the data path. Findings: a heavy forwarder stopped on purpose, what opens and how it is evaluated, the AI Agent and the notification email. Operate: the policies, the traffic models and collection health.
Part 1 — Setup
Part one: setup. A Splunk S2S tenant reads one deployment: its local search tier, or another deployment through a TrackMe remote account.
A dedicated tenant — pick Splunk S2S
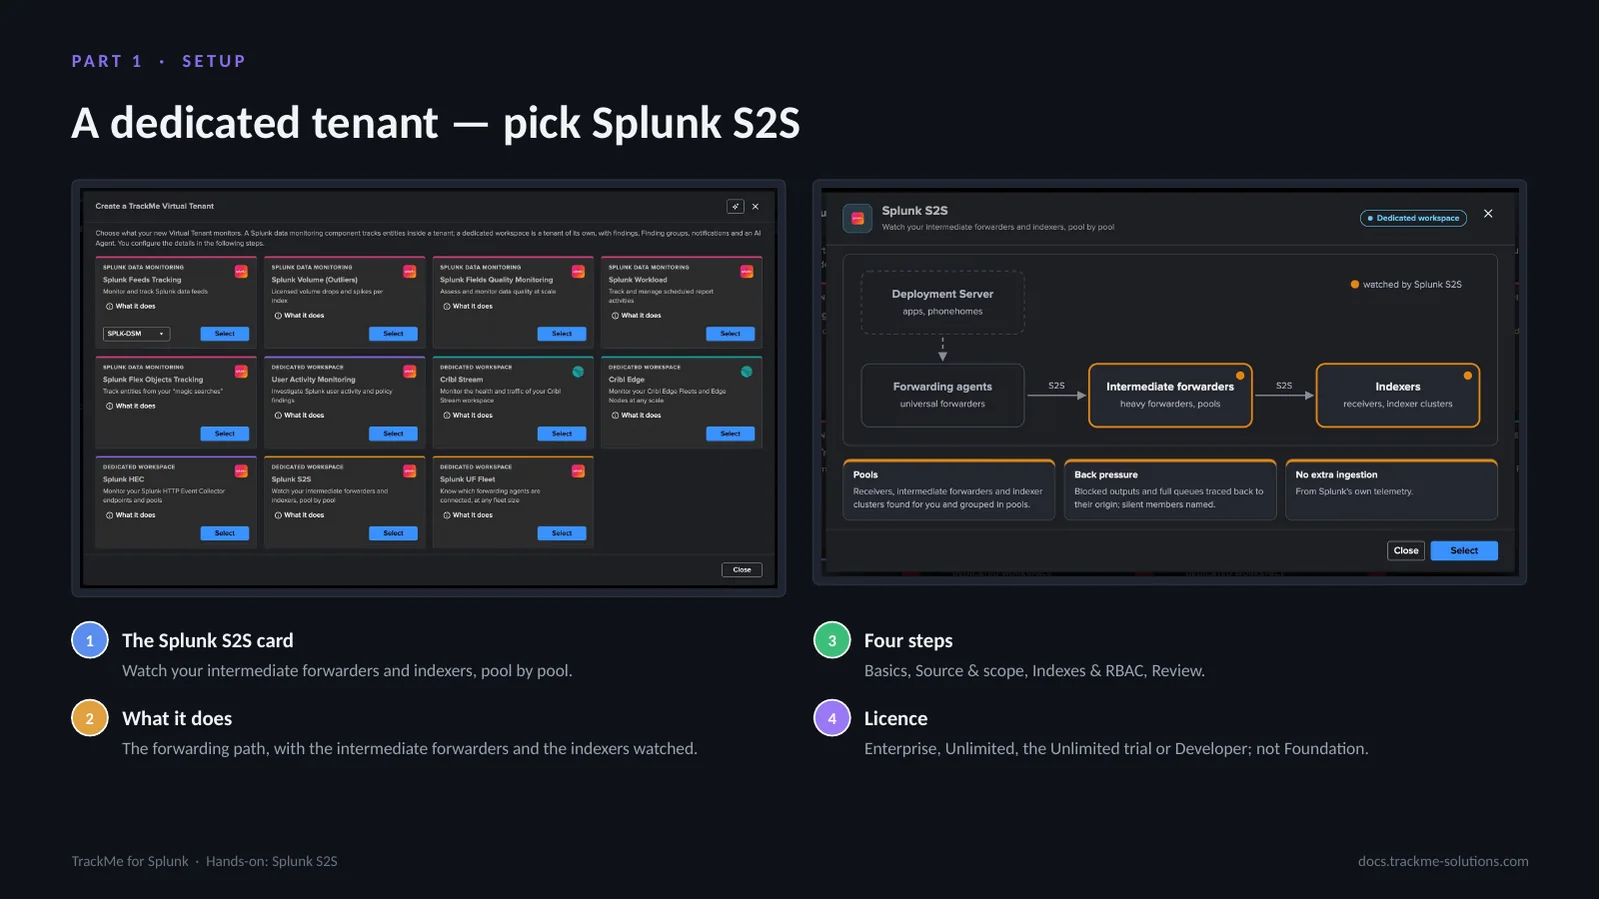
Virtual Tenants, Actions, Create a tracking tenant, then the Splunk S2S card. What it does draws the forwarding path: the forwarding agents send over S2S to the intermediate forwarders, which forward to the indexers, and Splunk S2S watches the intermediates and the indexers. A Splunk S2S tenant has no entities and no state colour: it is a findings tenant, like the Splunk HEC, Cribl and User Activity Monitoring tenants.
The discovery finds the indexer cluster
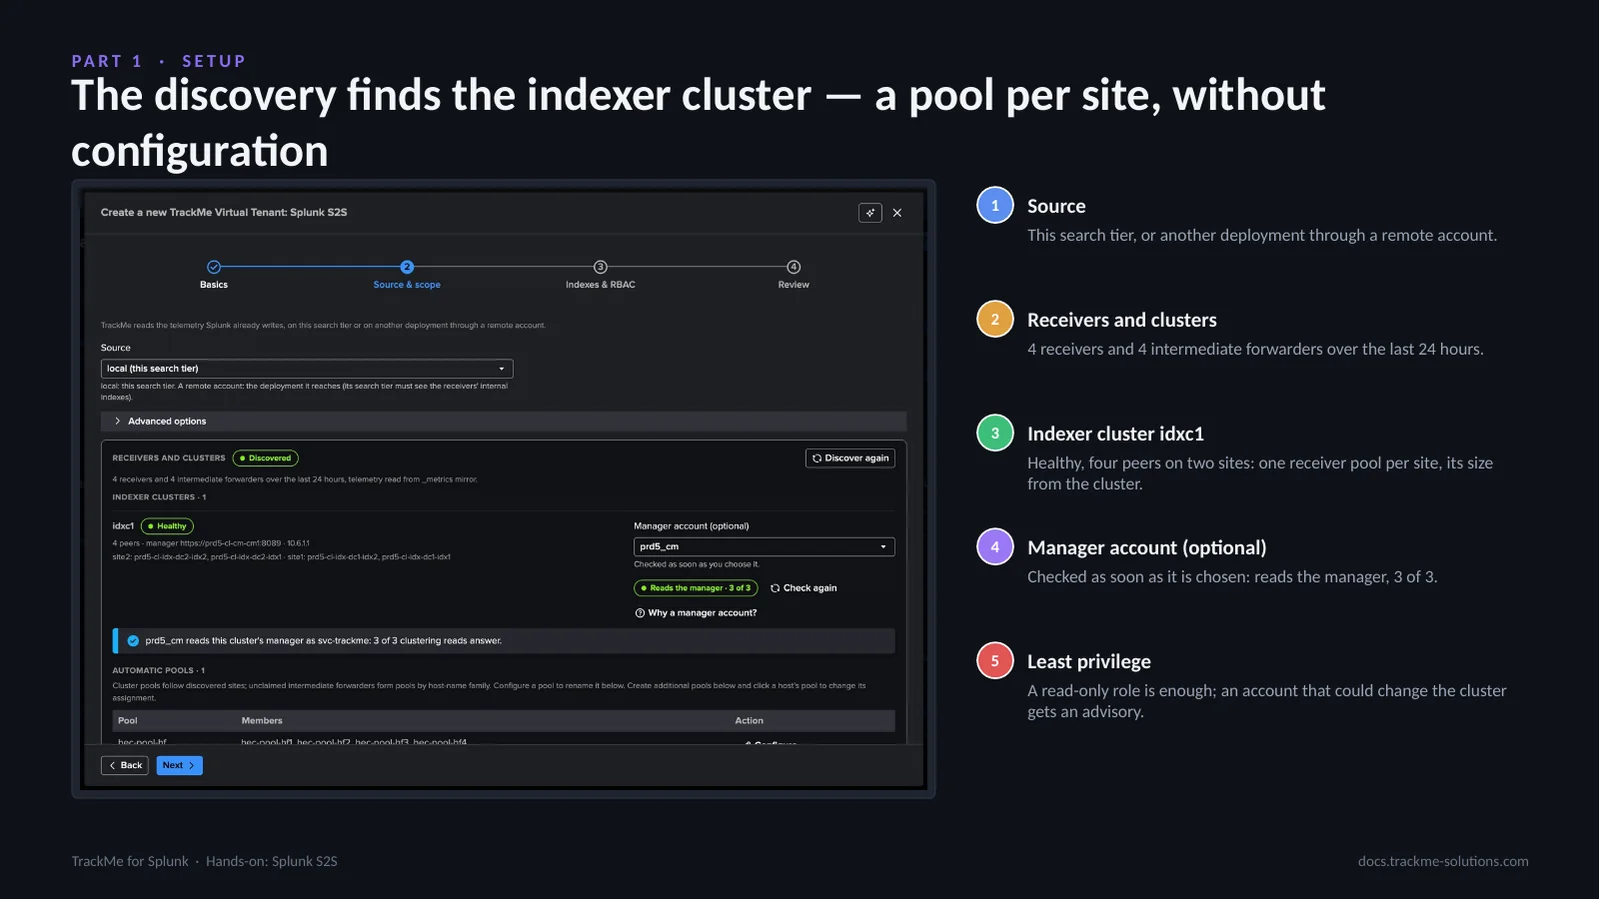
Source and scope. The discovery reads the receivers and intermediates of the last day, and each indexer cluster the search head is attached to: here idxc1, four peers on two sites, which forms one receiver pool per site. The optional manager account lets the tenant read the manager’s maintenance mode and rolling restarts. It is checked as soon as it is chosen: here a least-privilege service account reads the manager, 3 of 3 clustering reads. An account that could change the cluster gets an advisory with the read-only role to create: search, rest_properties_get and list_indexer_cluster.
Why a manager account? Planned work is not an incident
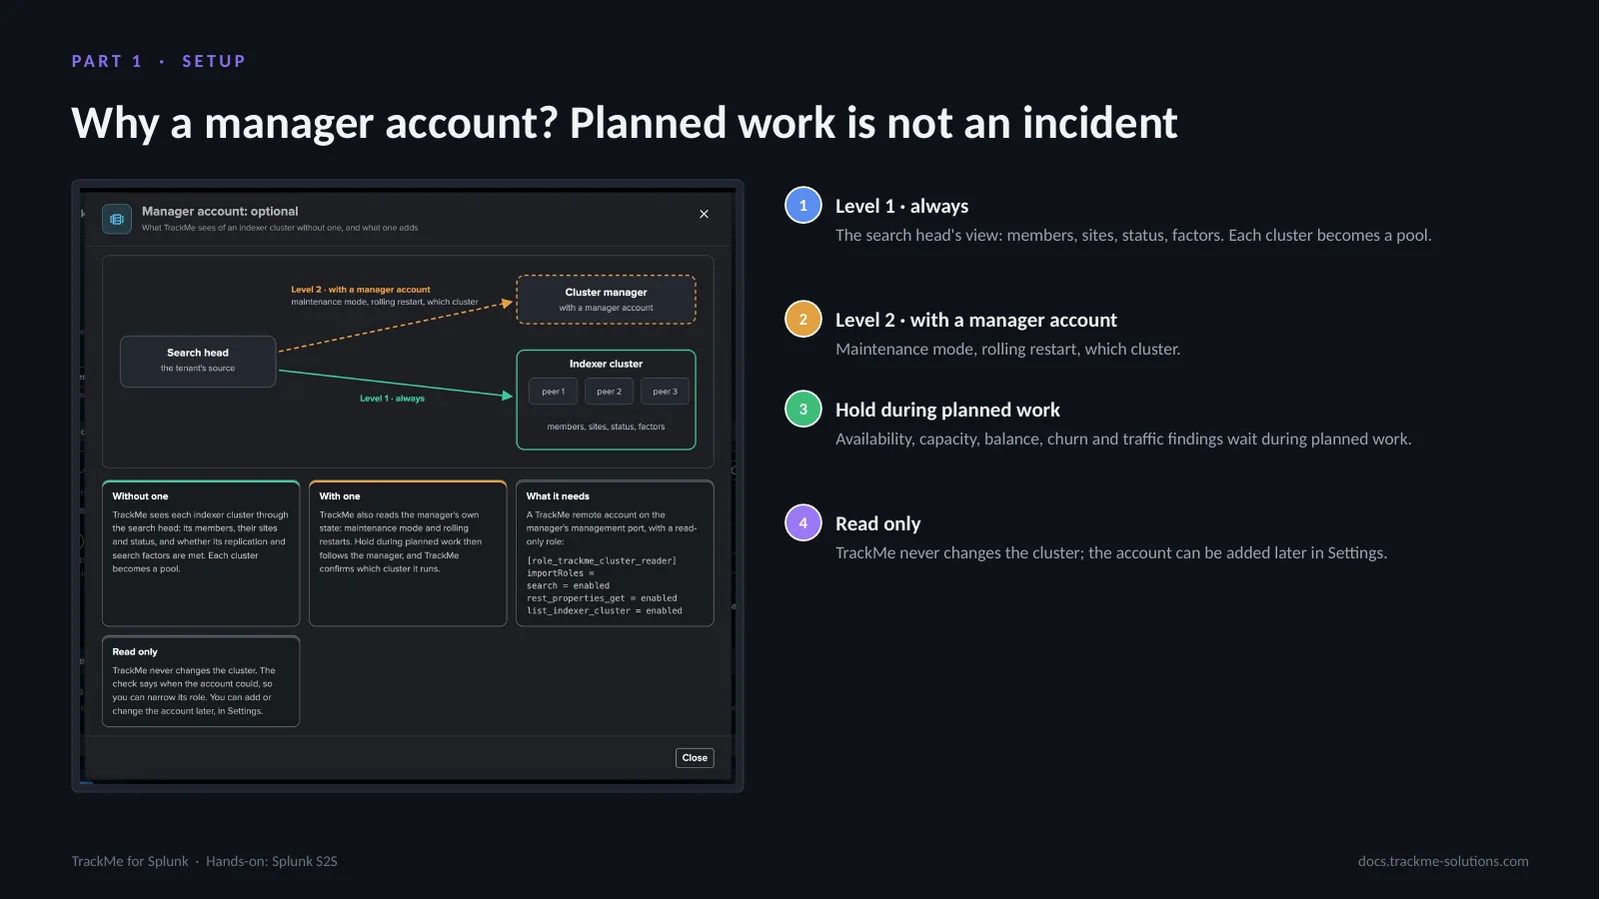
The search head always sees its indexer clusters: their peers, their replication and search factors, whether the data is searchable. A manager account adds the manager’s own state, so a rolling restart or a maintenance window holds the pool’s findings instead of opening them: an open finding stays open, and a new one waits until the planned work ends. Without it, the tenant works from the search head’s view only, and the Review step says so.
Advanced options and the pools
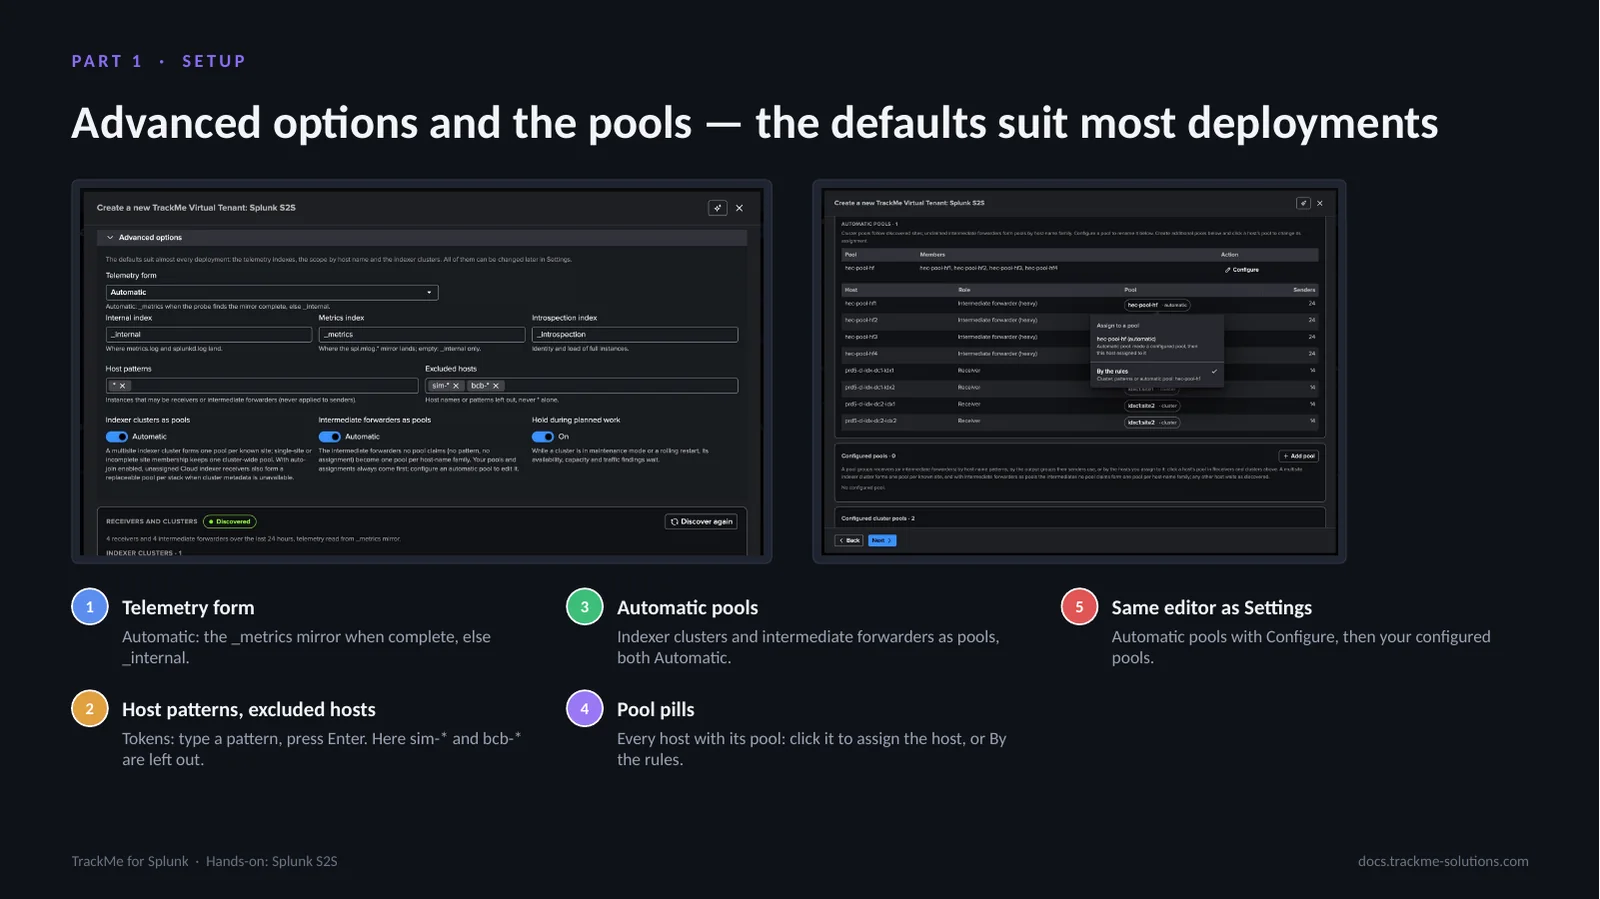
Advanced options stay folded unless a setting needs a fix: the telemetry form, the host patterns and excluded hosts, typed as tokens, and the automatic pools of indexer clusters and intermediate forwarders. Below the clusters, the step shows the pools the tenant starts with: the indexer cluster’s two site pools and the automatic pool hec-pool-hf of the four heavy forwarders. Every host carries its pool pill: clicking it assigns the host to another pool, and By the rules gives it back. Nothing needs configuring at creation.
Configure the automatic pool
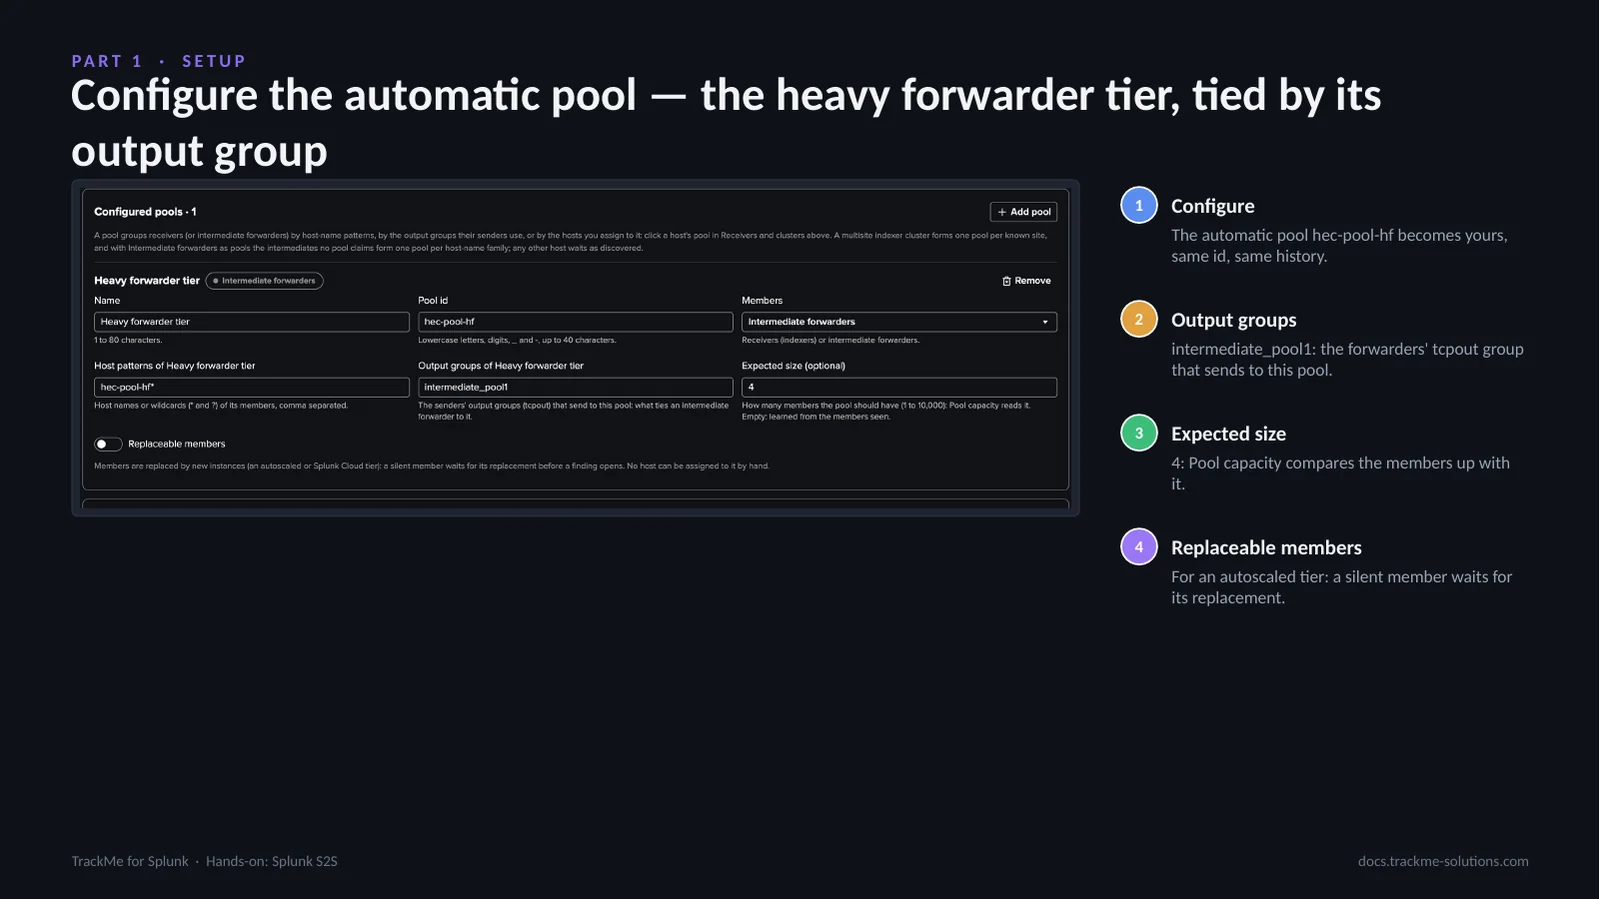
Settings, Pools. The indexer cluster and the heavy forwarder tier are pools from the first run. Configure on the automatic pool hec-pool-hf makes it a configured pool with the same id, so its findings and history continue: here it is named Heavy forwarder tier, given the output group its senders use, which ties the tier to the data path, and its expected size, four. A pool change applies from the next inventory run; Run now on the inventory, then Collect now, shows it at once.
Part 2 — Pools, hosts and data path
Part two: the workspace. The pools, the receivers and the intermediates, and the data path between them.
The Pools tab
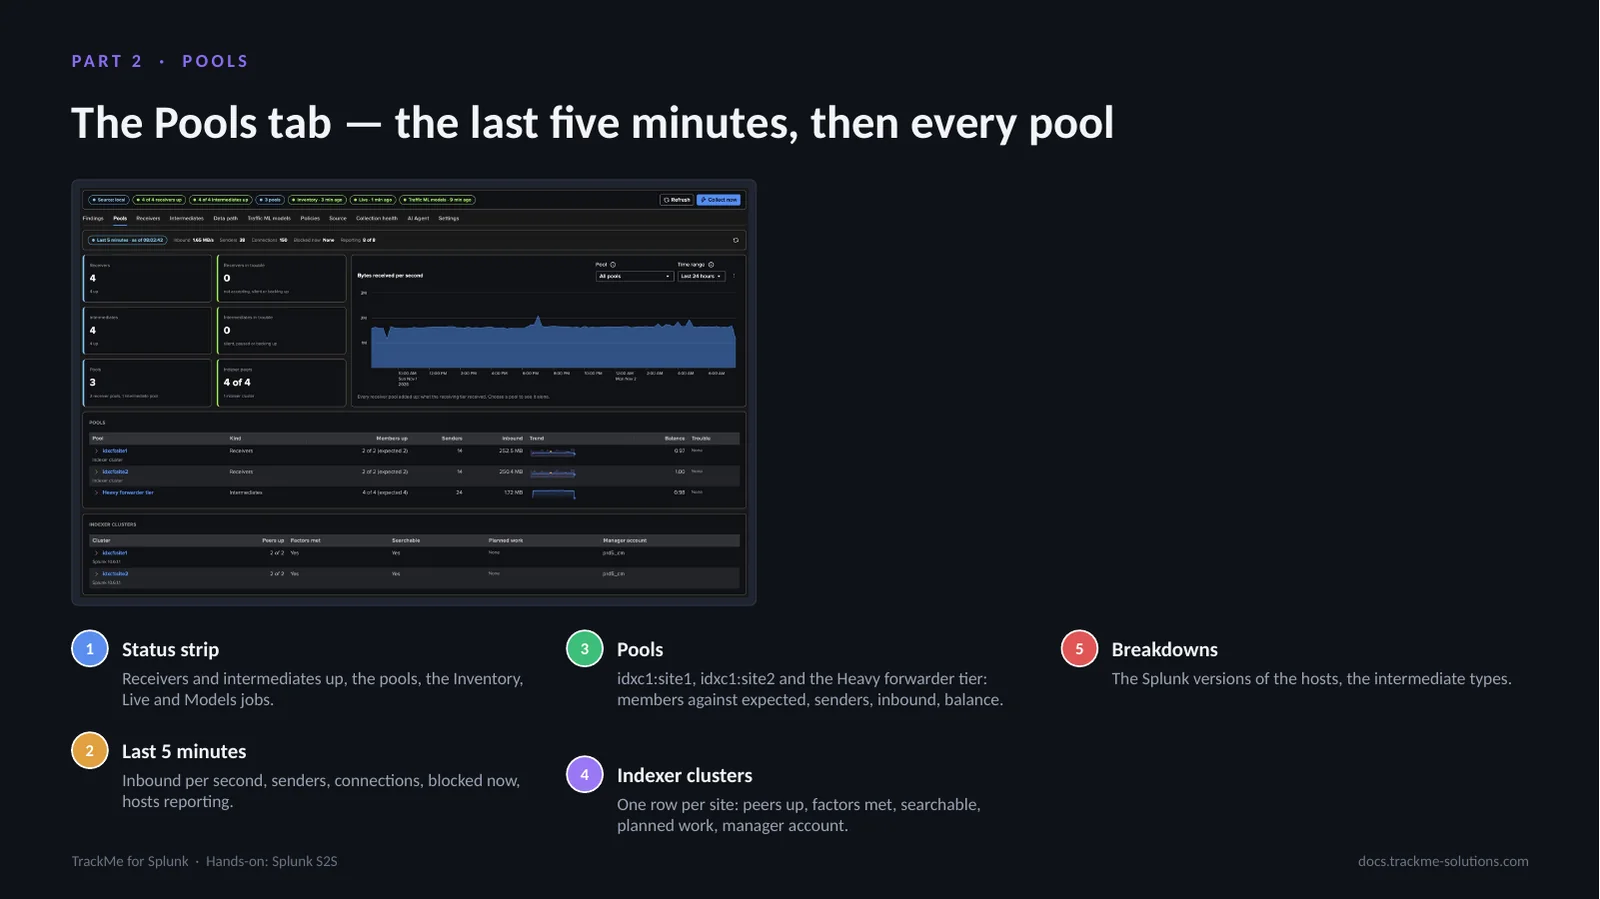
The Pools tab opens on the last five minutes: inbound per second, senders, connections, blocked now and hosts reporting. Then come the host tiles, the pools with their members up against the expected size, their senders, inbound volume, trend and balance: the two site pools idxc1:site1 and idxc1:site2 and the Heavy forwarder tier. The indexer clusters list one row per site with its peers, factors, planned work and manager account. A pool row expands to its members, an indexer cluster pool to its peers.
Blocked now
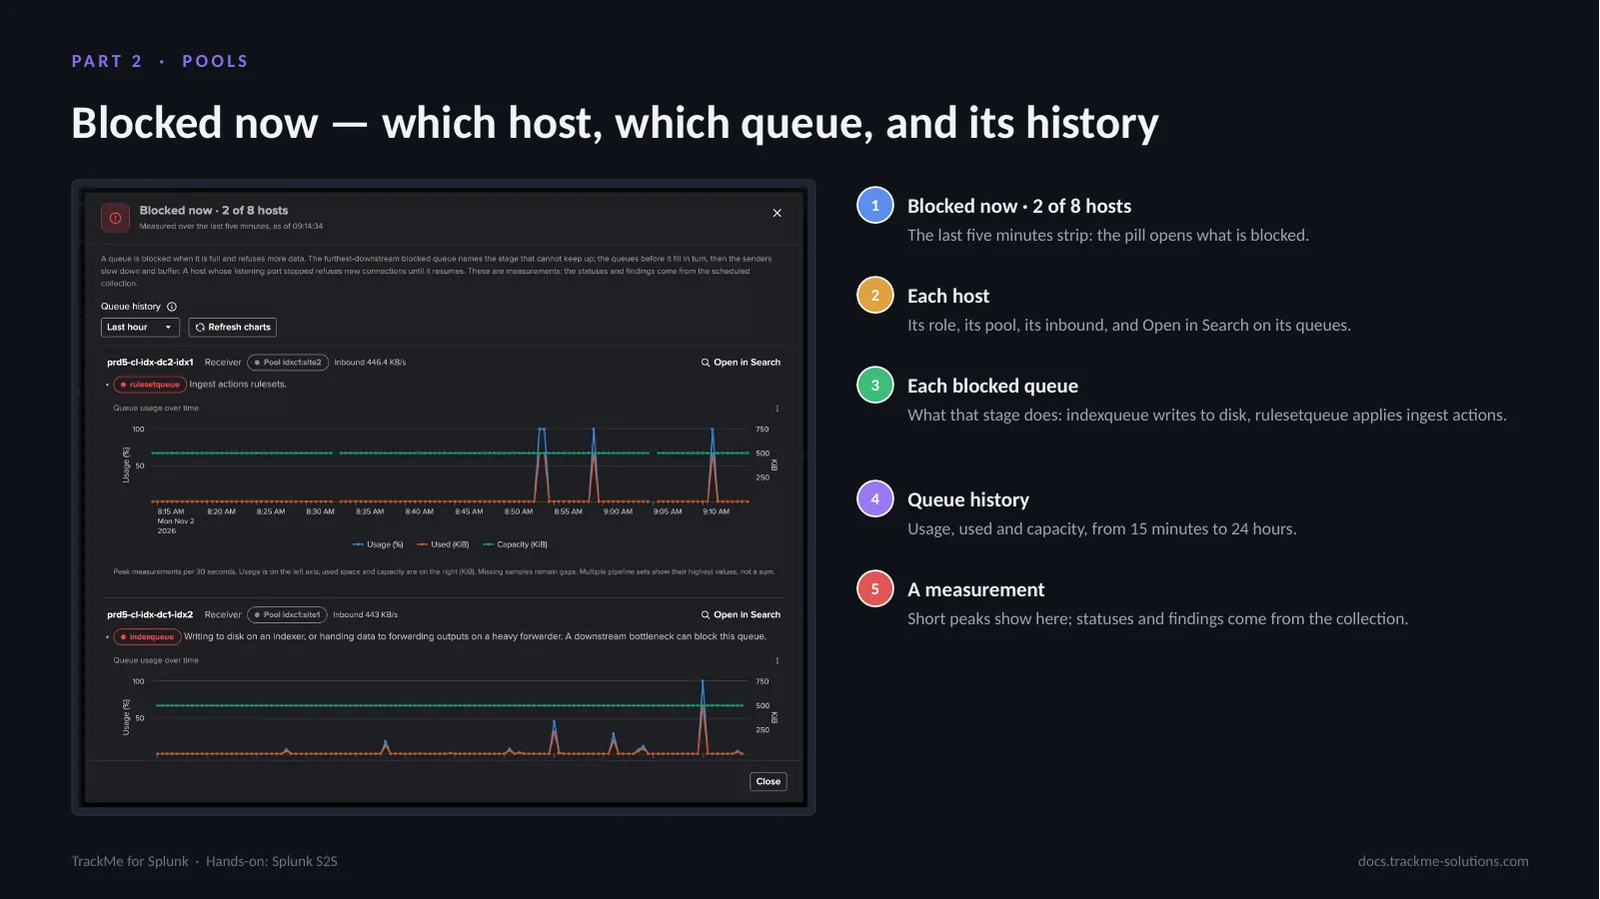
The Blocked now pill of the last five minutes opens what is blocked: each host with its role, its pool and its inbound, every blocked queue with what that stage of the pipeline does, a stopped listening port, Open in Search on the host’s queues, and the queue history of each blocked queue, from 15 minutes to 24 hours. Here an indexer of each site shows short peaks of a queue: the index queue on one, the ruleset queue on the other. These are measurements: the statuses and findings come from the scheduled collection.
How the pool spreads its load
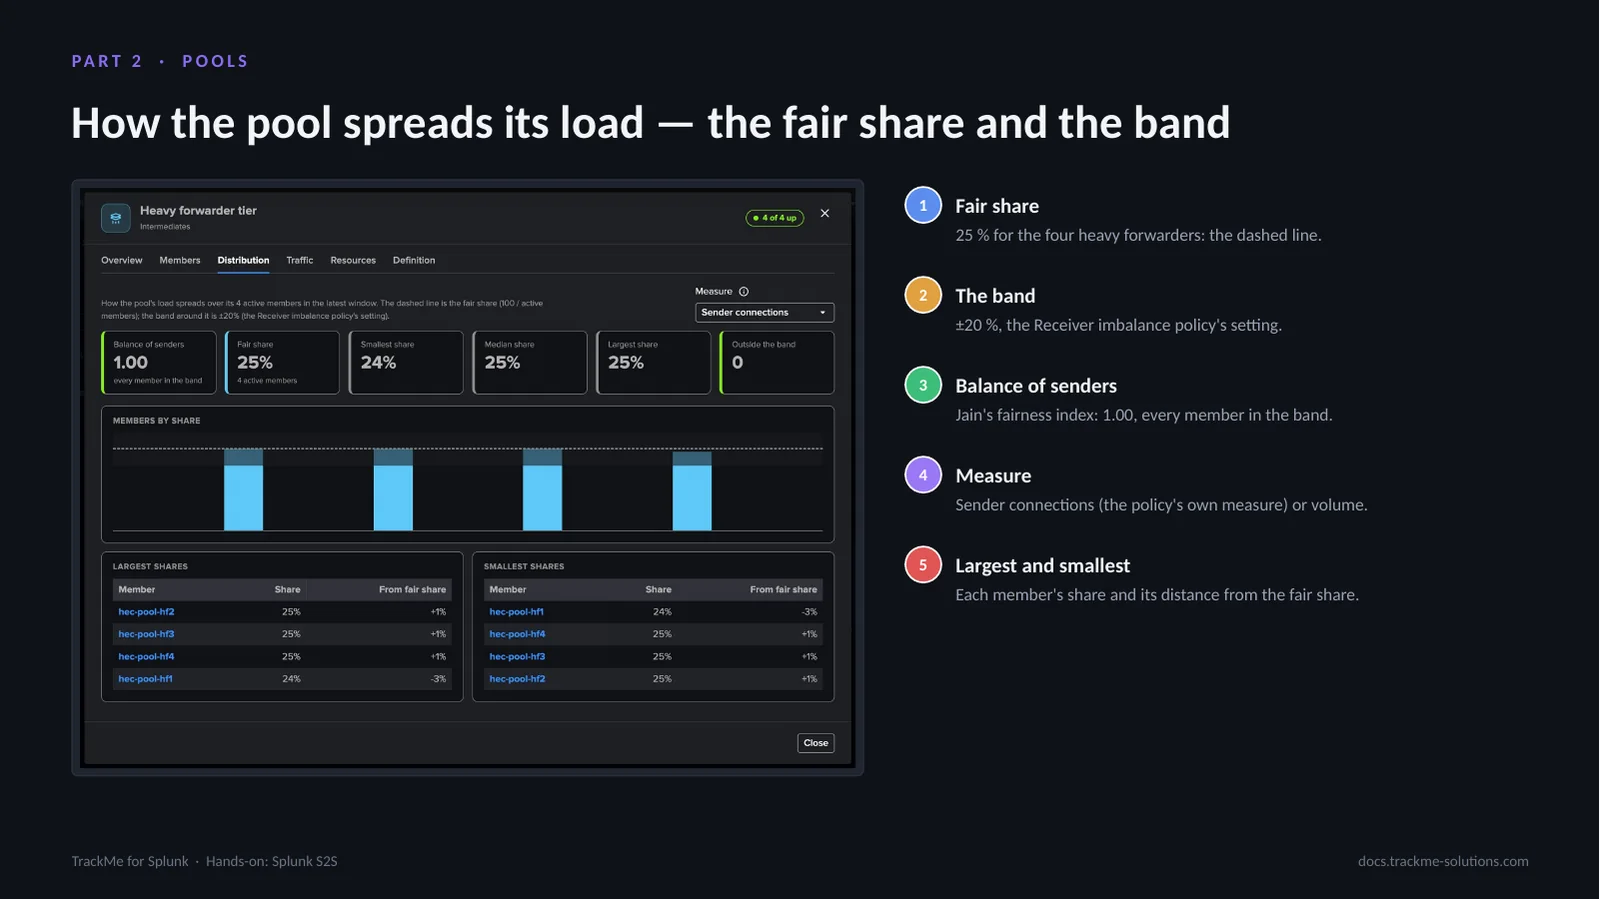
The pool modal of the Heavy forwarder tier, Distribution tab. One bar per active member’s share of the pool, the fair share, 25 % for four members, and the band of the Receiver imbalance setting. A load balancer that starves one member shows here first, and the policy opens when a member stays below the band. The largest and smallest members are listed with their distance from the fair share.
A receiver’s pipeline — queue by queue
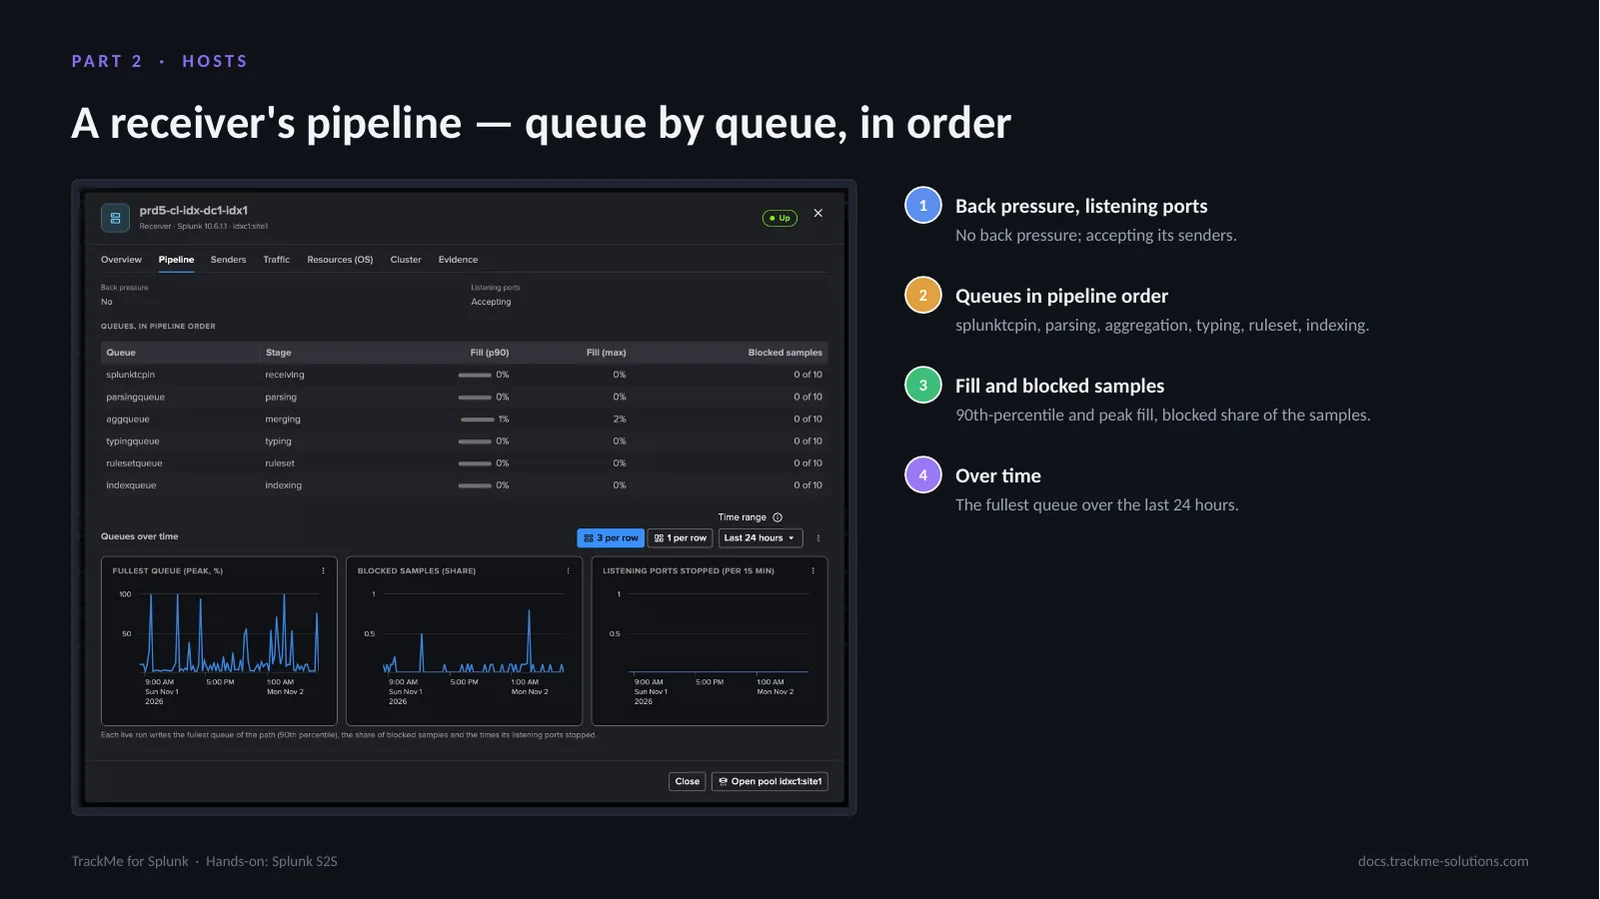
The host modal, Pipeline tab. Each queue of the receiver path, in order, with its fill and its blocked samples. A queue saturated at 80 % or blocked in 30 % of its samples is back pressure: the finding names the stage that cannot keep up, and whether its thread was busy or waiting on the next stage. The chart below follows the fullest queue over time.
The data path
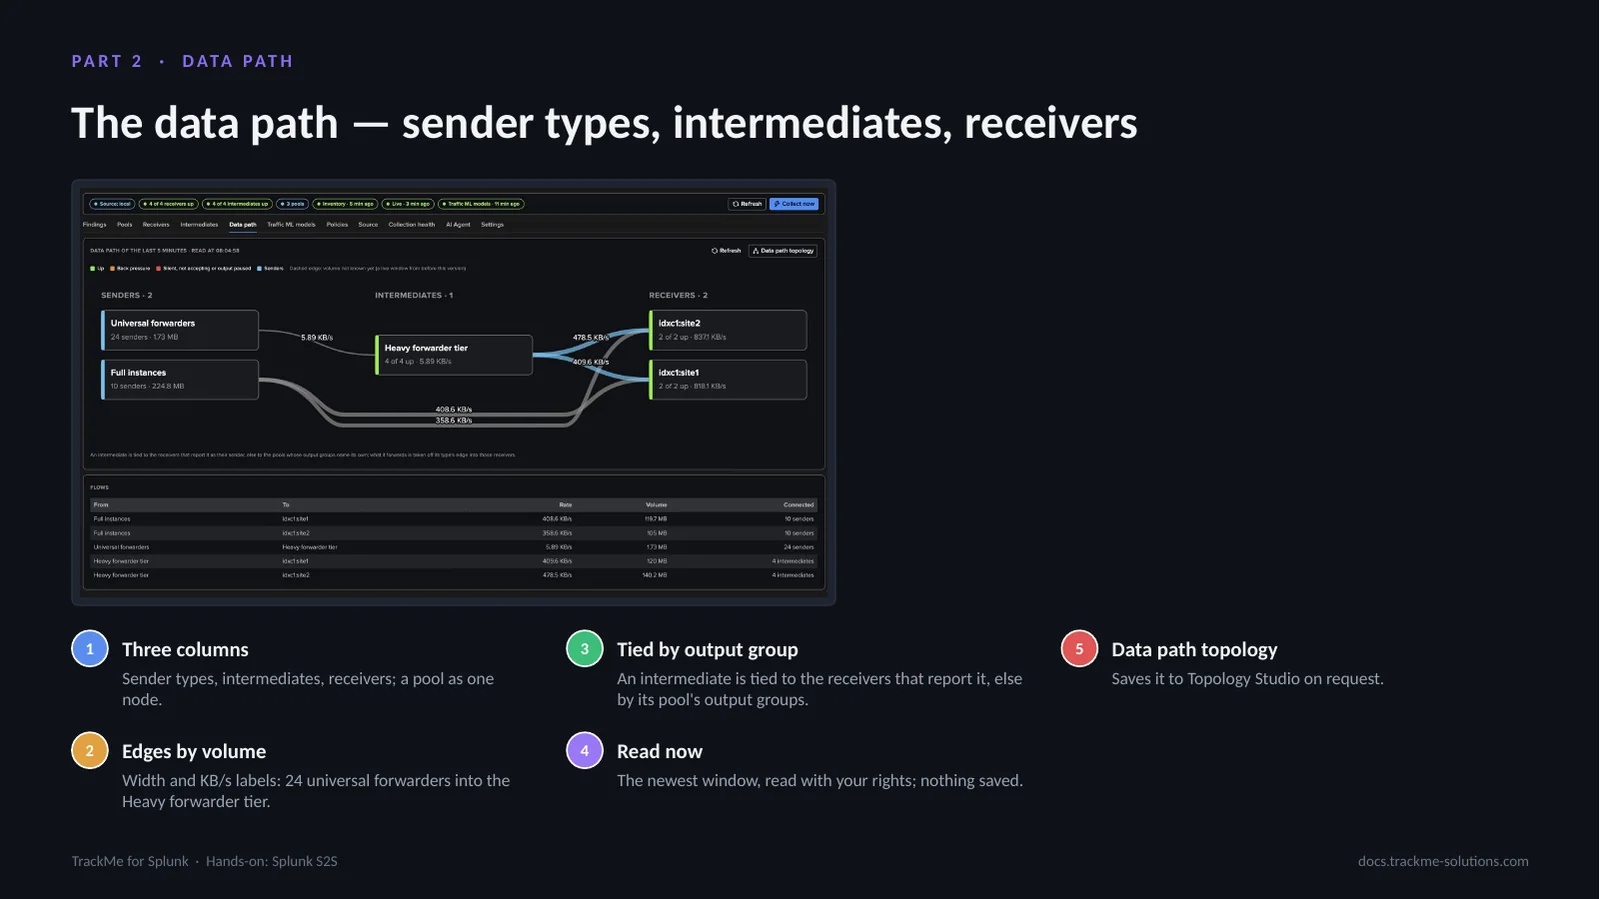
The Data path tab draws the forwarding path from what the receivers report: the universal forwarders into the Heavy forwarder tier, the tier into the two site pools of the indexer cluster, and the full instances sending straight to the indexers. Edges are drawn by volume. A Flows table states every edge in words. An intermediate is tied to its receivers by its output group, never by guessing from a destination address. The topology can be saved to Topology Studio.
Part 3 — Findings
Part three: findings. One heavy forwarder of the tier, hec-pool-hf3, was stopped on purpose for about thirty-five minutes.
What opens when a heavy forwarder stops
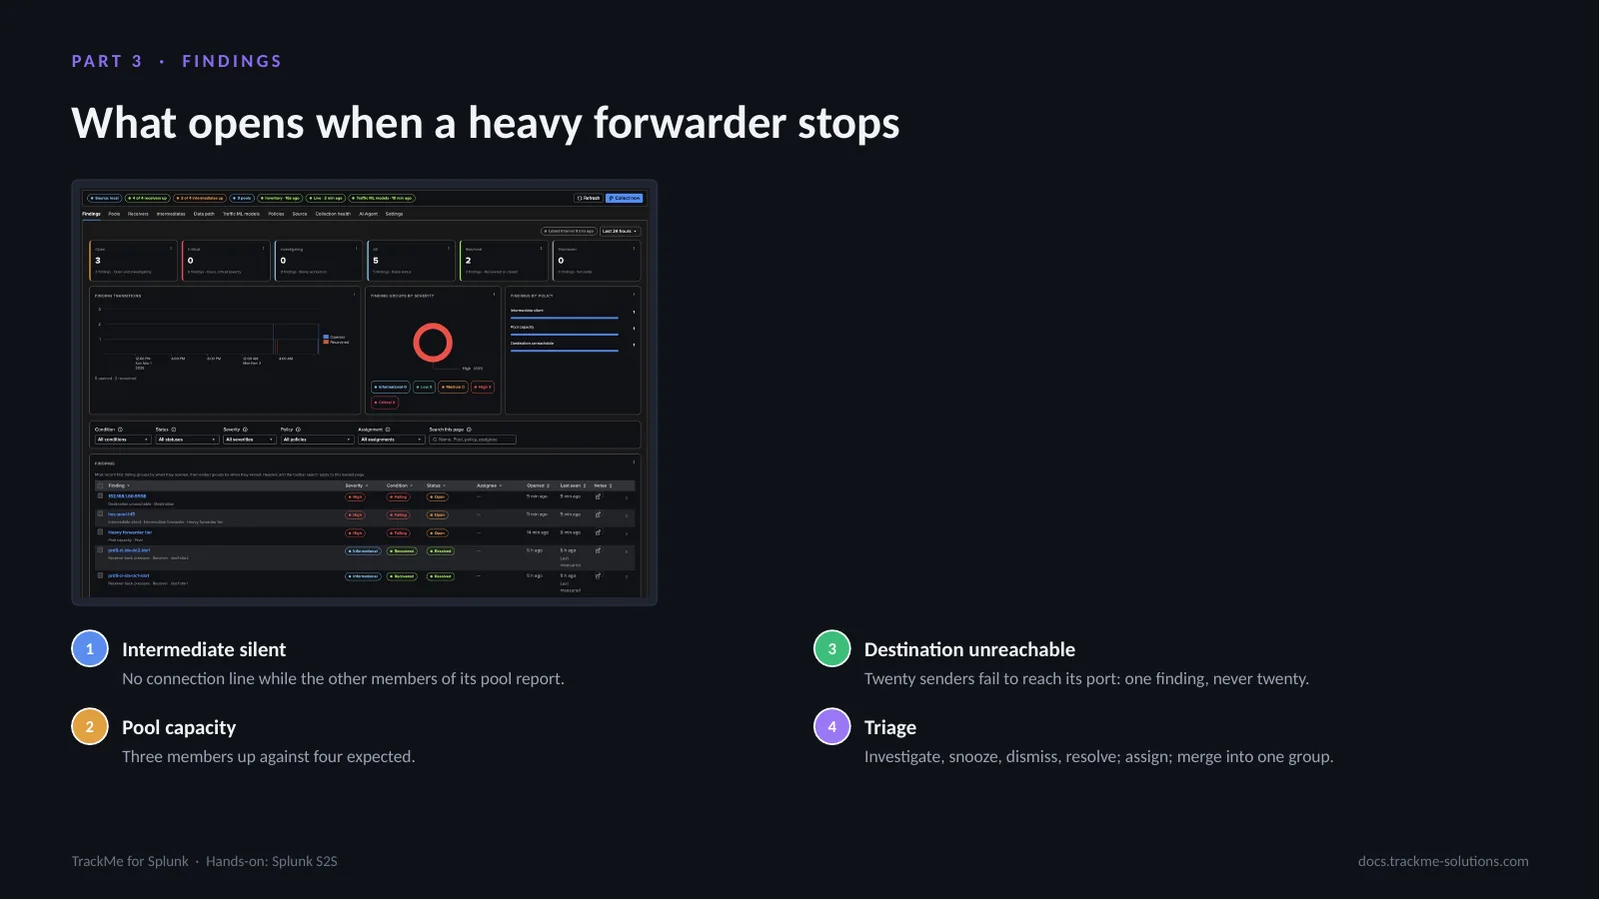
The Findings tab. The stopped heavy forwarder first opens Pool capacity on the Heavy forwarder tier (three members up against four expected), then Intermediate silent on the heavy forwarder and Destination unreachable on its receiving port, measured on the 23 universal forwarders that failed to reach it for 15 minutes or more: one finding on the destination, never one per sender. Each object has its own Finding group; they can be merged by hand when one incident is worked as one. The forwarders load balance to the three other members, so no sender is held: there is no back pressure cascade.
A finding up close
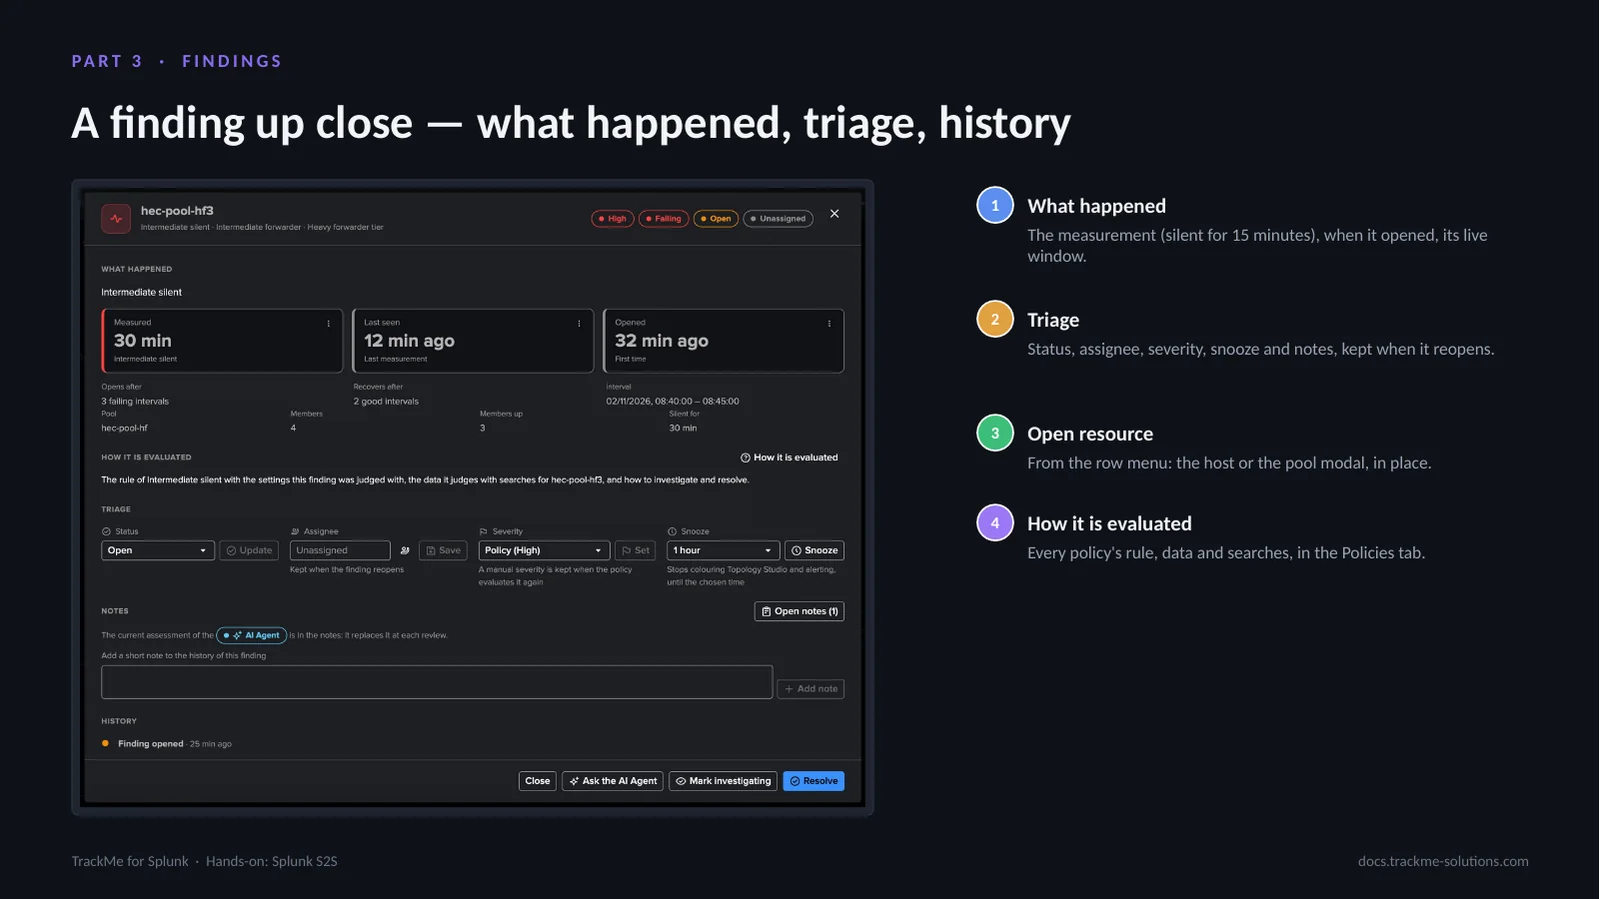
A finding opens with what happened (here the heavy forwarder silent for 10 minutes), when it opened and its live window, its pool with its members up, then its triage — status, assignee, severity, snooze — its notes and its history. Open resource, in the row menu, opens the host or the pool modal in place. How each policy is evaluated — the rule as configured, the data it reads with ready-to-run searches on the tenant’s own source, and how to investigate and resolve — is one click away. When the heavy forwarder restarts, the findings recover after two healthy live windows.
The Splunk S2S AI Agent
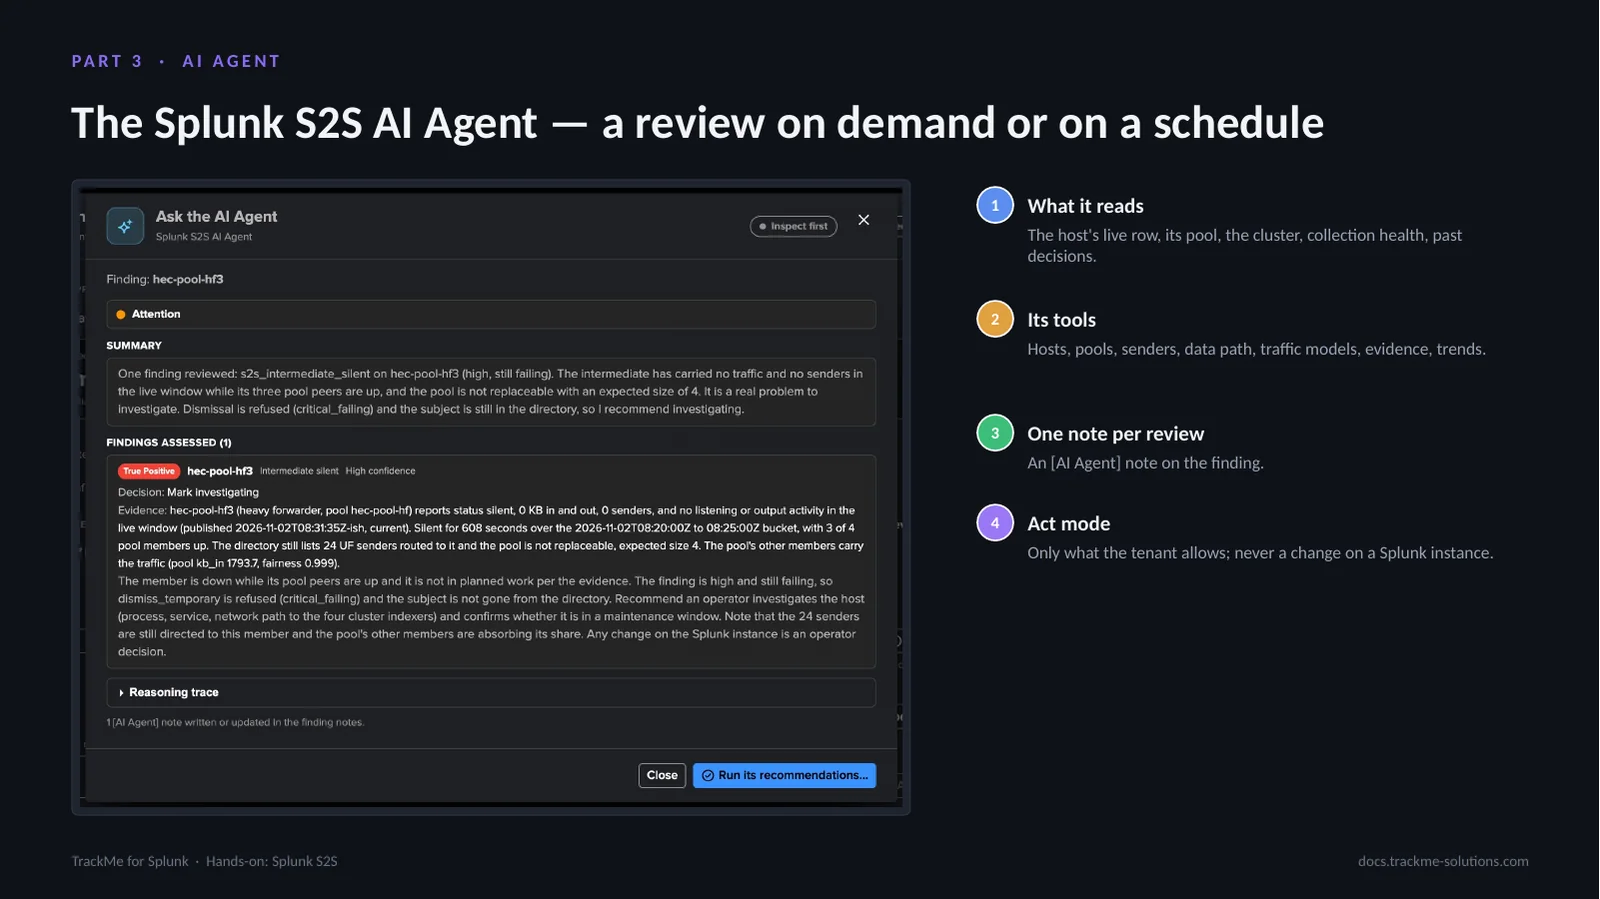
Ask the AI Agent from a finding or a Finding group. The Splunk S2S AI Agent reads the host’s live row, its pool, the cluster, collection health and past decisions, and may read further through its tools: hosts, pools, senders, the data path, the traffic models, the evidence and the trends. It knows the pipeline model, the bottleneck and cascade reading, planned cluster work and the TLS and acknowledgement posture. Each review leaves an [AI Agent] note on the finding. Scheduled triage is off by default: hourly, up to ten findings per run, and in act mode only the decisions the tenant allows, never a change on a Splunk instance.
The notification email
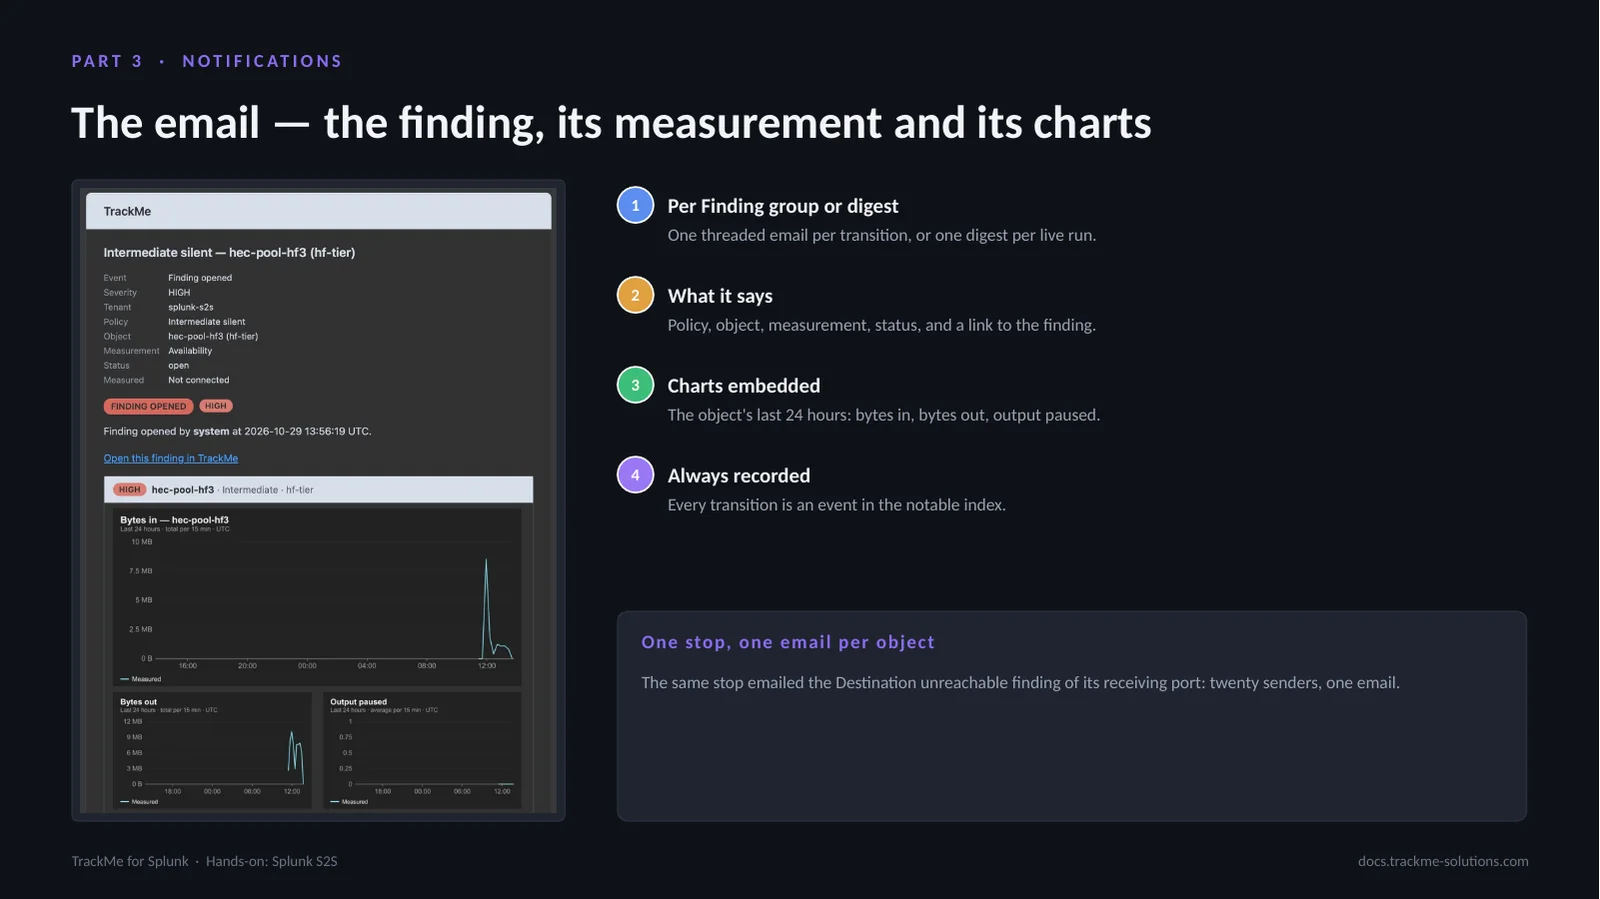
Settings, Notifications sends the transitions of the findings from a minimum severity, for every policy or chosen ones, through an email delivery account: one threaded email per transition of a Finding group, or one digest per live run. Here, the email of the silent heavy forwarder: the policy, the object, its measurement and a link back to the finding, with the intermediate’s last 24 hours embedded. The same stop emailed the Destination unreachable finding of its port. Every transition is also an event in the tenant’s notable index, whatever the notification settings.
Part 4 — Operate
Part four: operate the tenant. The policies, the traffic models and collection health.
Twenty-two policies
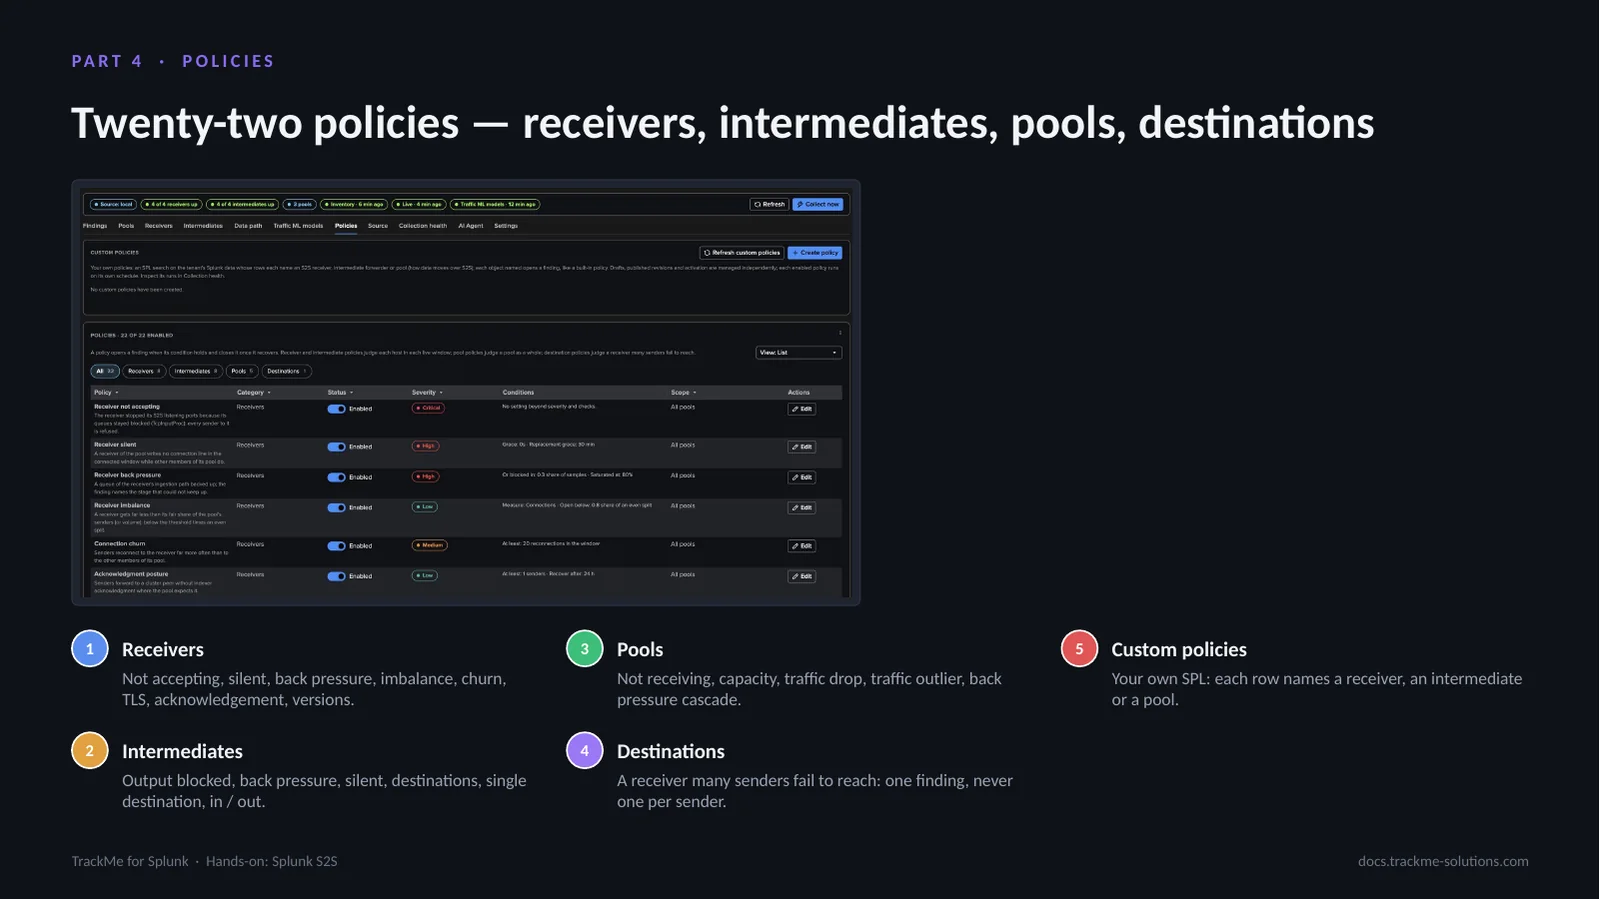
The policy catalogue, by category: receivers, intermediates, pools and destinations. Every policy has its severity, its checks to open and to recover, a scope by pool, a bank holiday hold and How it is evaluated. The ones to know first: Receiver not accepting, Intermediate output blocked and Back pressure cascade, all critical; Pool capacity, the back pressure policies and Destination unreachable, high. Above the catalogue, TrackMe administrators of the tenant write custom SPL policies: each result row names a receiver, an intermediate or a pool.
Traffic ML models
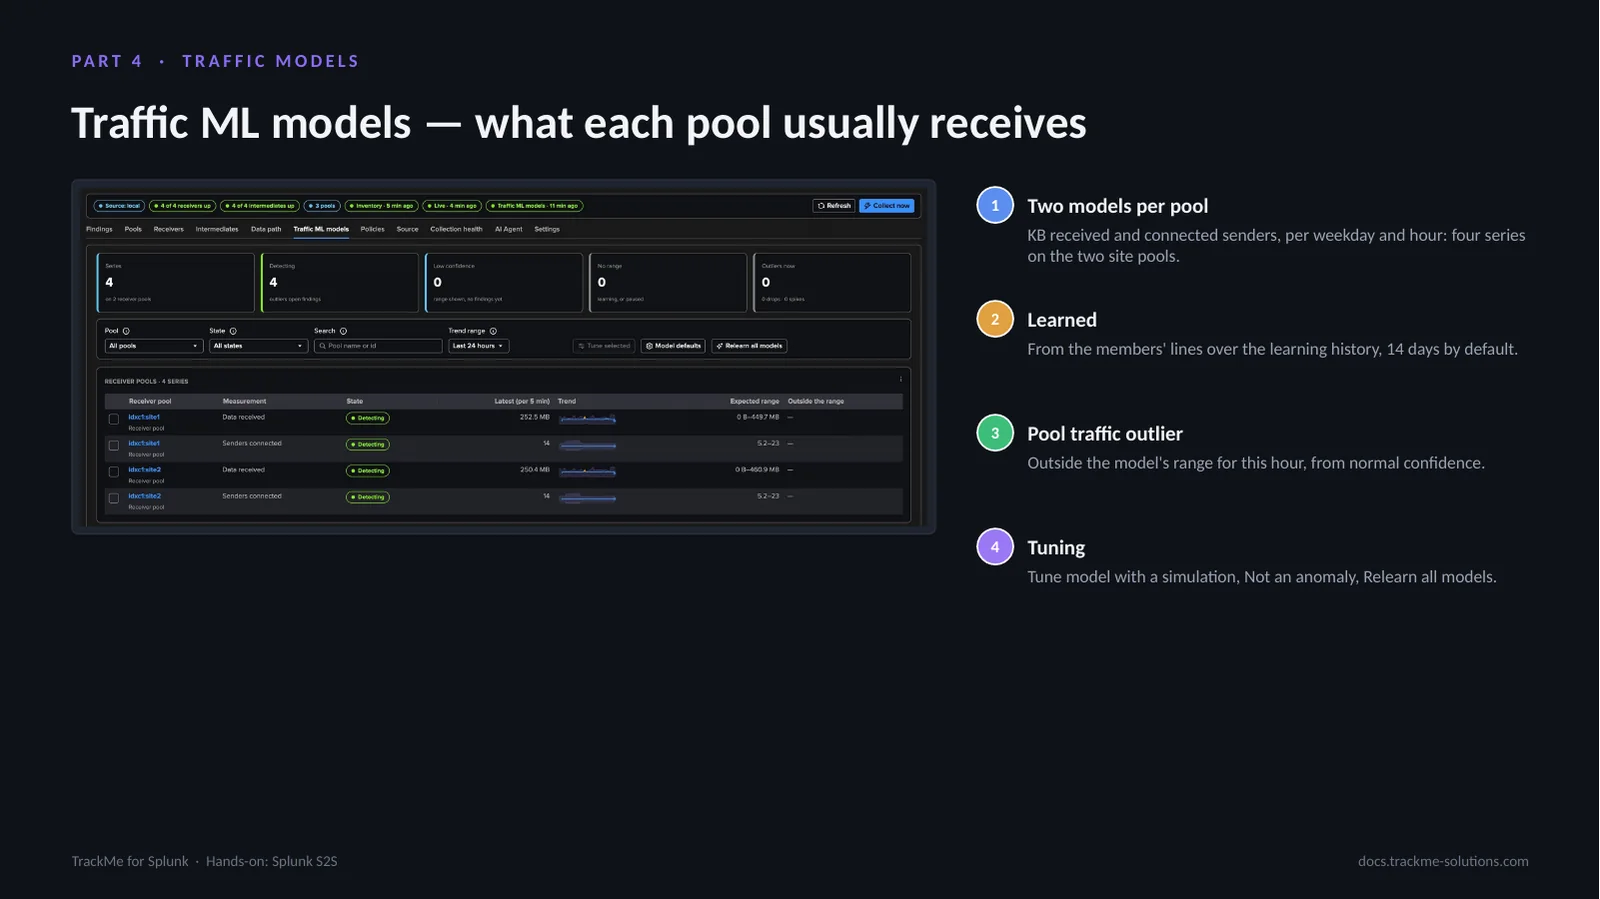
Every receiver pool has two traffic models, KB received and connected senders, learned per weekday and hour over the model learning history, 14 days by default, and refreshed twice an hour: here four series on the two site pools. Pool traffic outlier opens when a pool leaves its range for the hour, from normal confidence. Tune model simulates past windows; Not an anomaly on a finding teaches the model; administrators set the model defaults and relearn all models. Pool traffic drop, the same hour’s median over seven days, needs no model.
Collection health
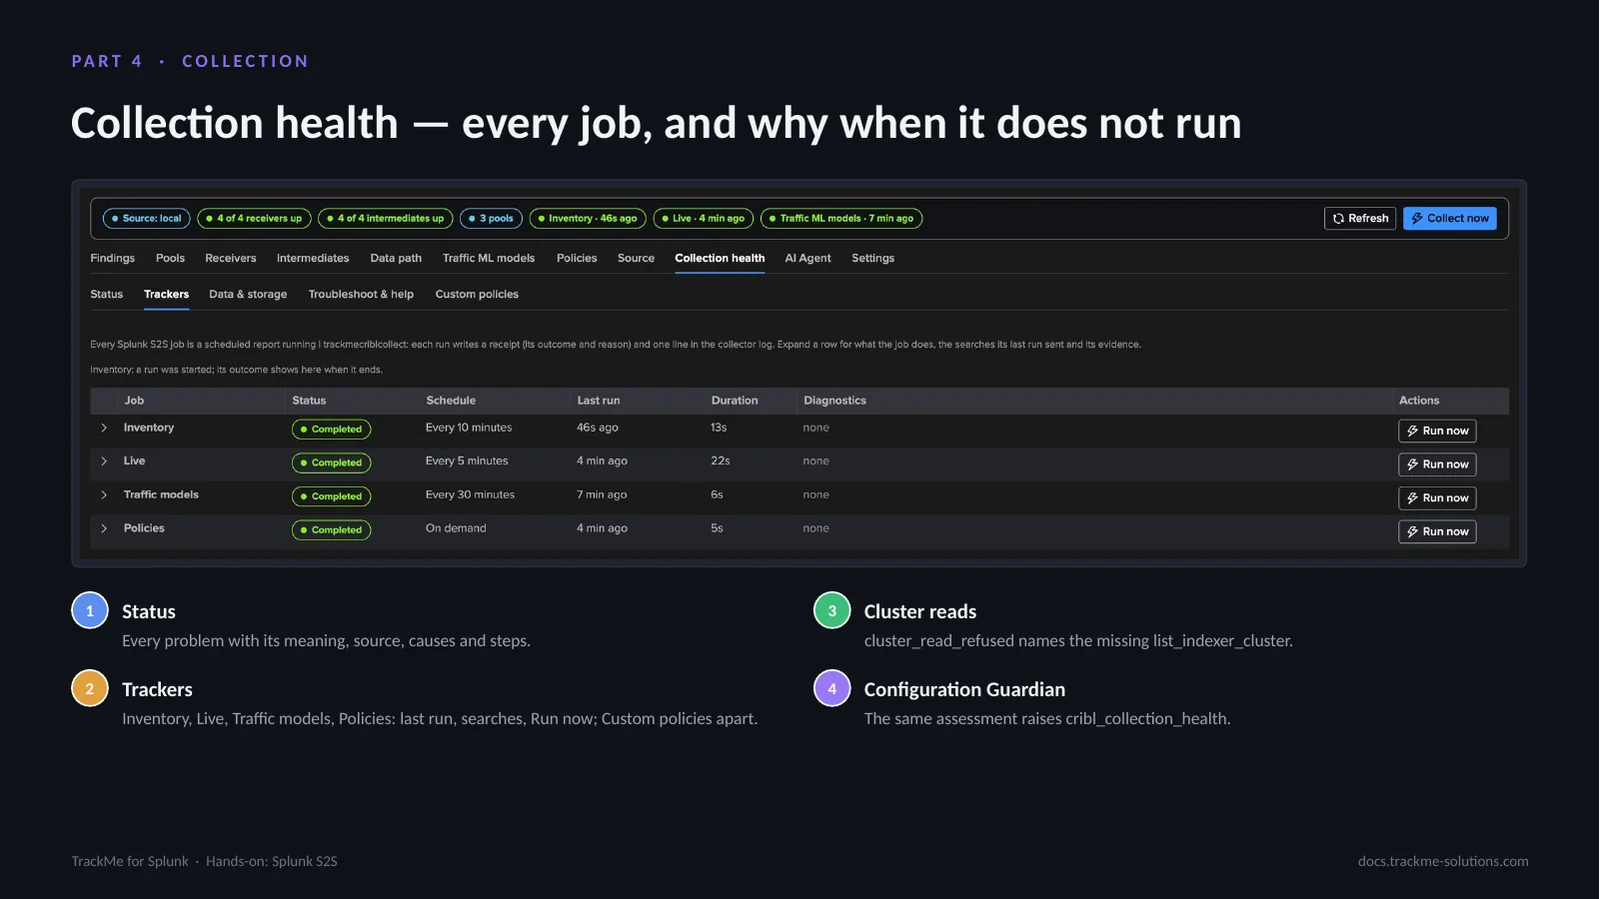
Collection health shows whether the tenant collects as configured: every problem with its meaning, source, causes and steps, and each job — inventory, live, traffic models, policies — with its last run, the searches it sent and Run now; the runs of each custom policy have their own view. The cluster reads need the read-only list_indexer_cluster capability: without it Splunk answers nothing, and Collection health names the missing capability. The Configuration Guardian raises the same assessment.
Where we are
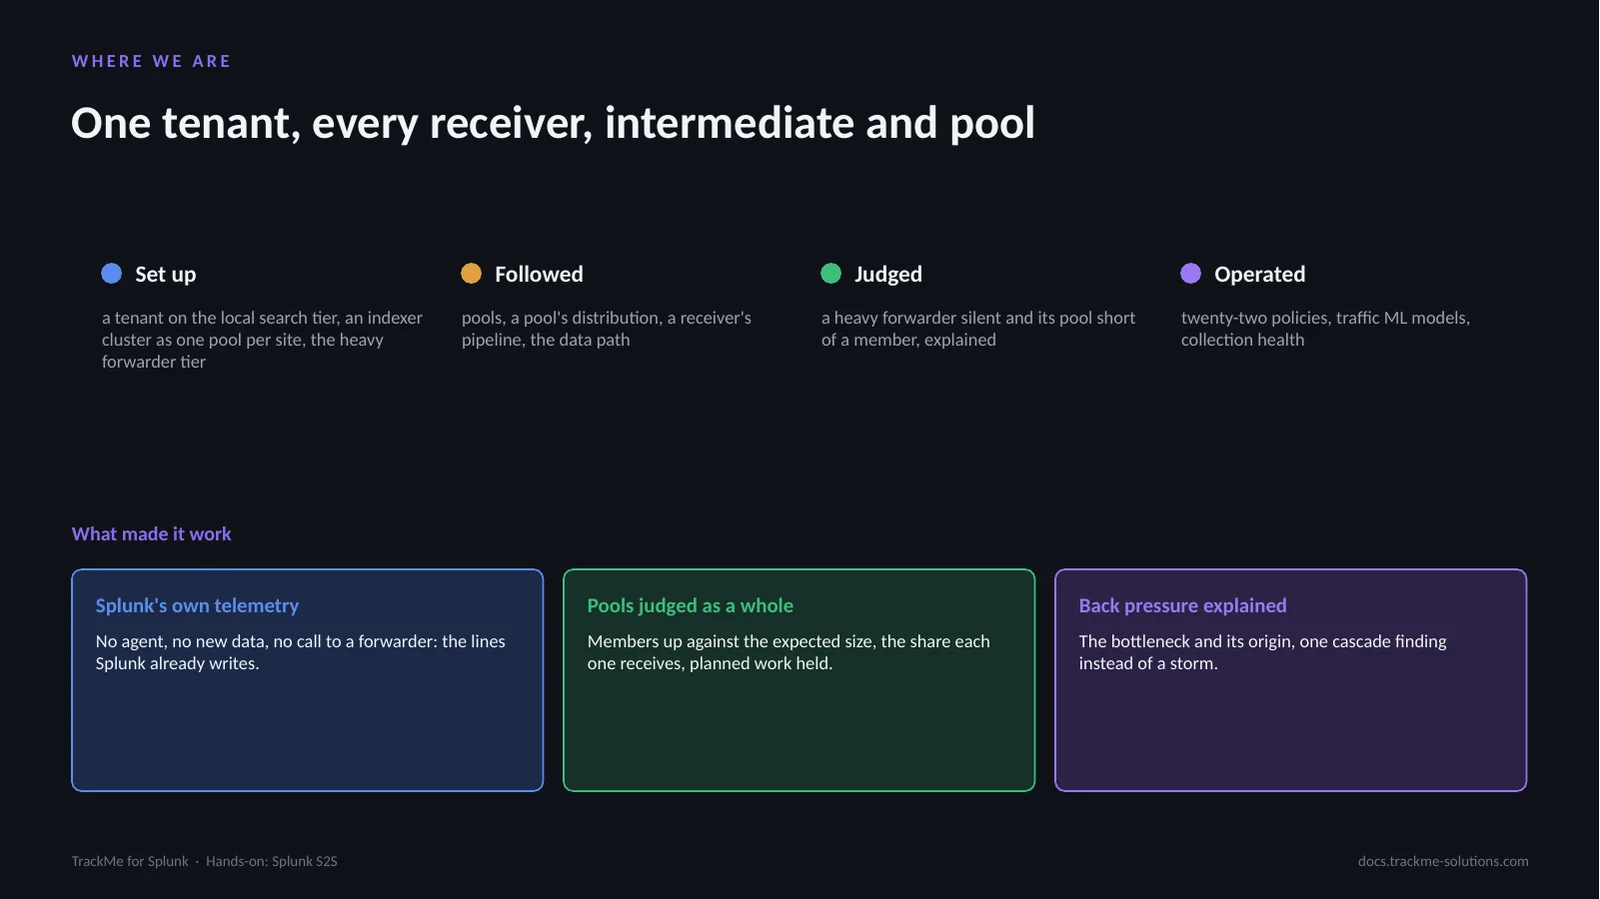
A Splunk S2S tenant set up on a deployment with a four-peer indexer cluster on two sites and a heavy forwarder tier: its cluster found without configuration as one pool per site, its tier an automatic pool made a configured one. The pools, what is blocked, a pool’s distribution, a receiver’s pipeline and the data path followed. A heavy forwarder stopped, the findings it opened explained and emailed. And the policies, traffic models and collection health that run the tenant. What made it work: Splunk’s own telemetry, pools judged as a whole, and back pressure traced to its origin.