Cribl Edge
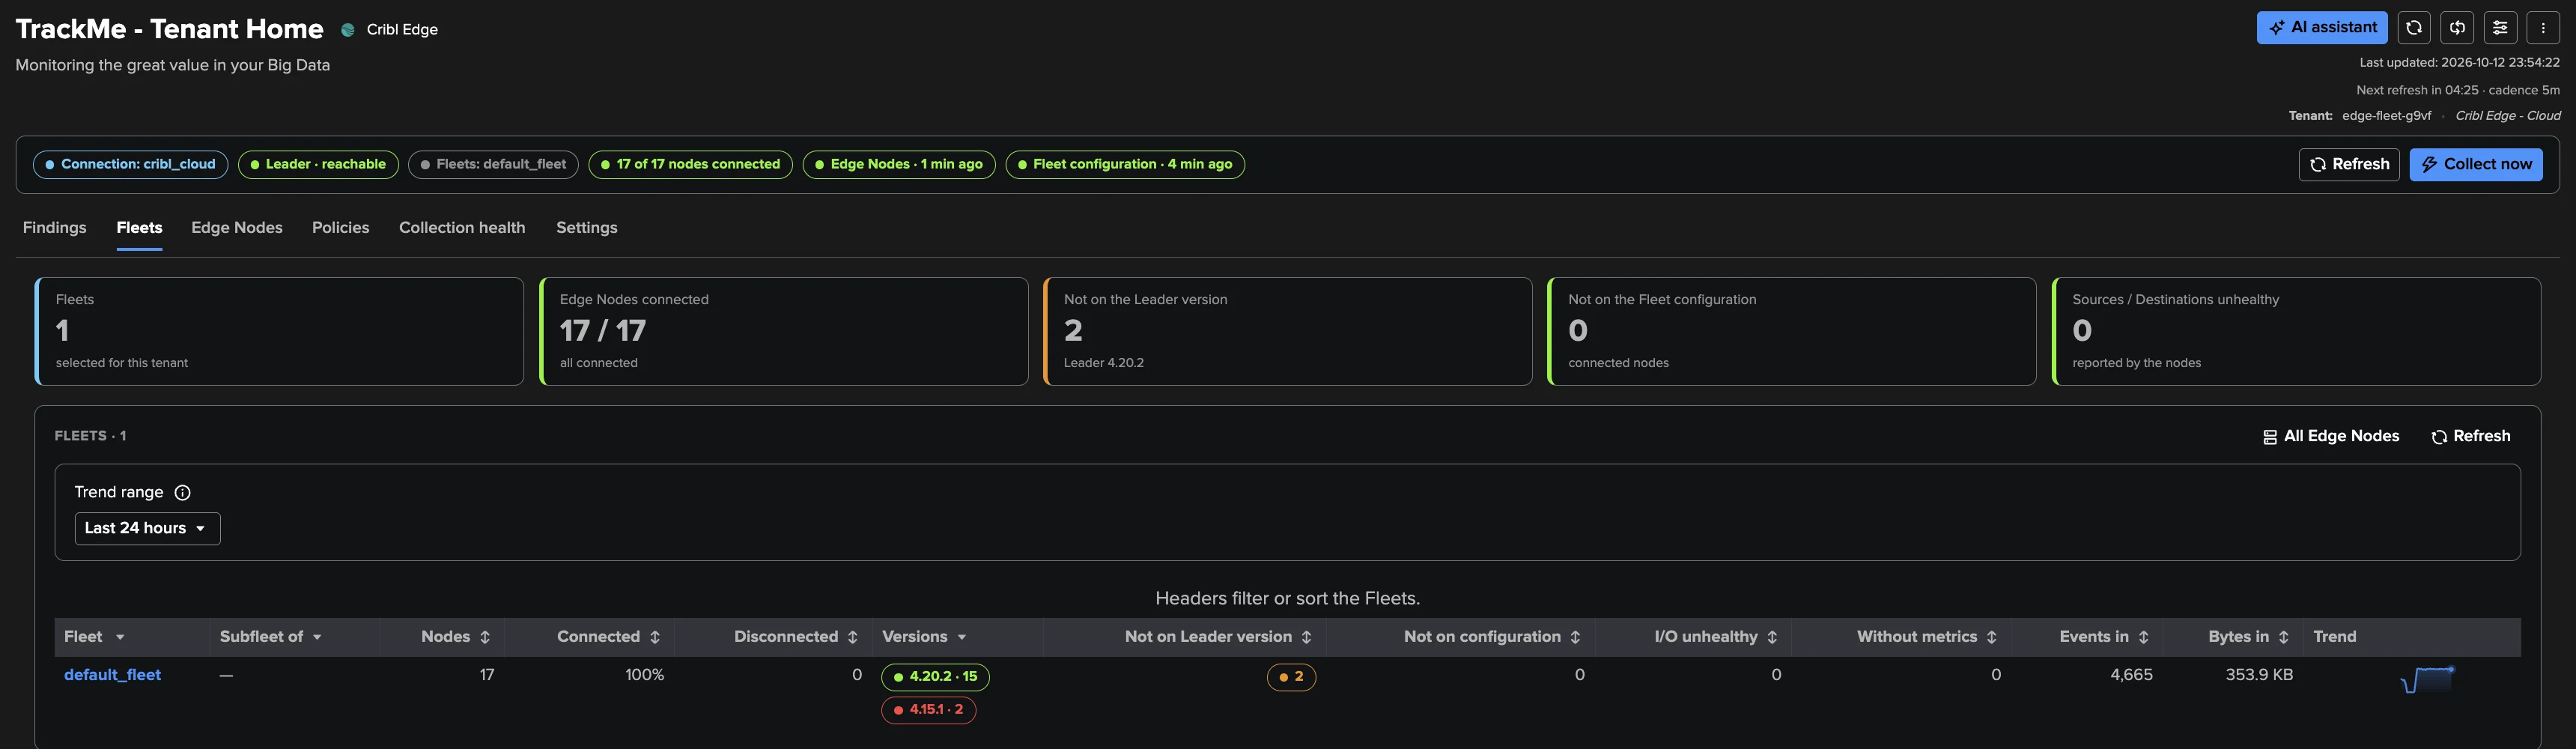
The Cribl Edge tenant follows a Cribl Edge deployment from TrackMe: the Fleets of one Cribl Edge Leader, the Edge Nodes enrolled in them, and the Sources and Destinations those nodes run. It answers the questions an Edge operator asks every day: are my nodes connected? did my last deploy reach every node? is every node on the same Edge version? which Source or Destination is failing, and on how many nodes? which host is running out of disk? The answers are findings, raised by built-in policies, with the same triage, Finding groups, notifications, assignment and findings actions as the Cribl Stream tenant, and a findings AI Agent of its own, the Cribl Edge AI Agent.
A Cribl Edge tenant is a dedicated tenant type: one tenant follows the Fleets of one Cribl Edge Leader, on Cribl.Cloud or self-managed, through a Cribl connection. A tenant is a Cribl Edge tenant or a Cribl Stream tenant, never both; a Cribl.Cloud workspace that runs both products takes one tenant of each, on the same connection. TrackMe only reads: nothing is installed or changed on Cribl.
The Cribl Edge tenant is generally available in TrackMe 2.4.19.
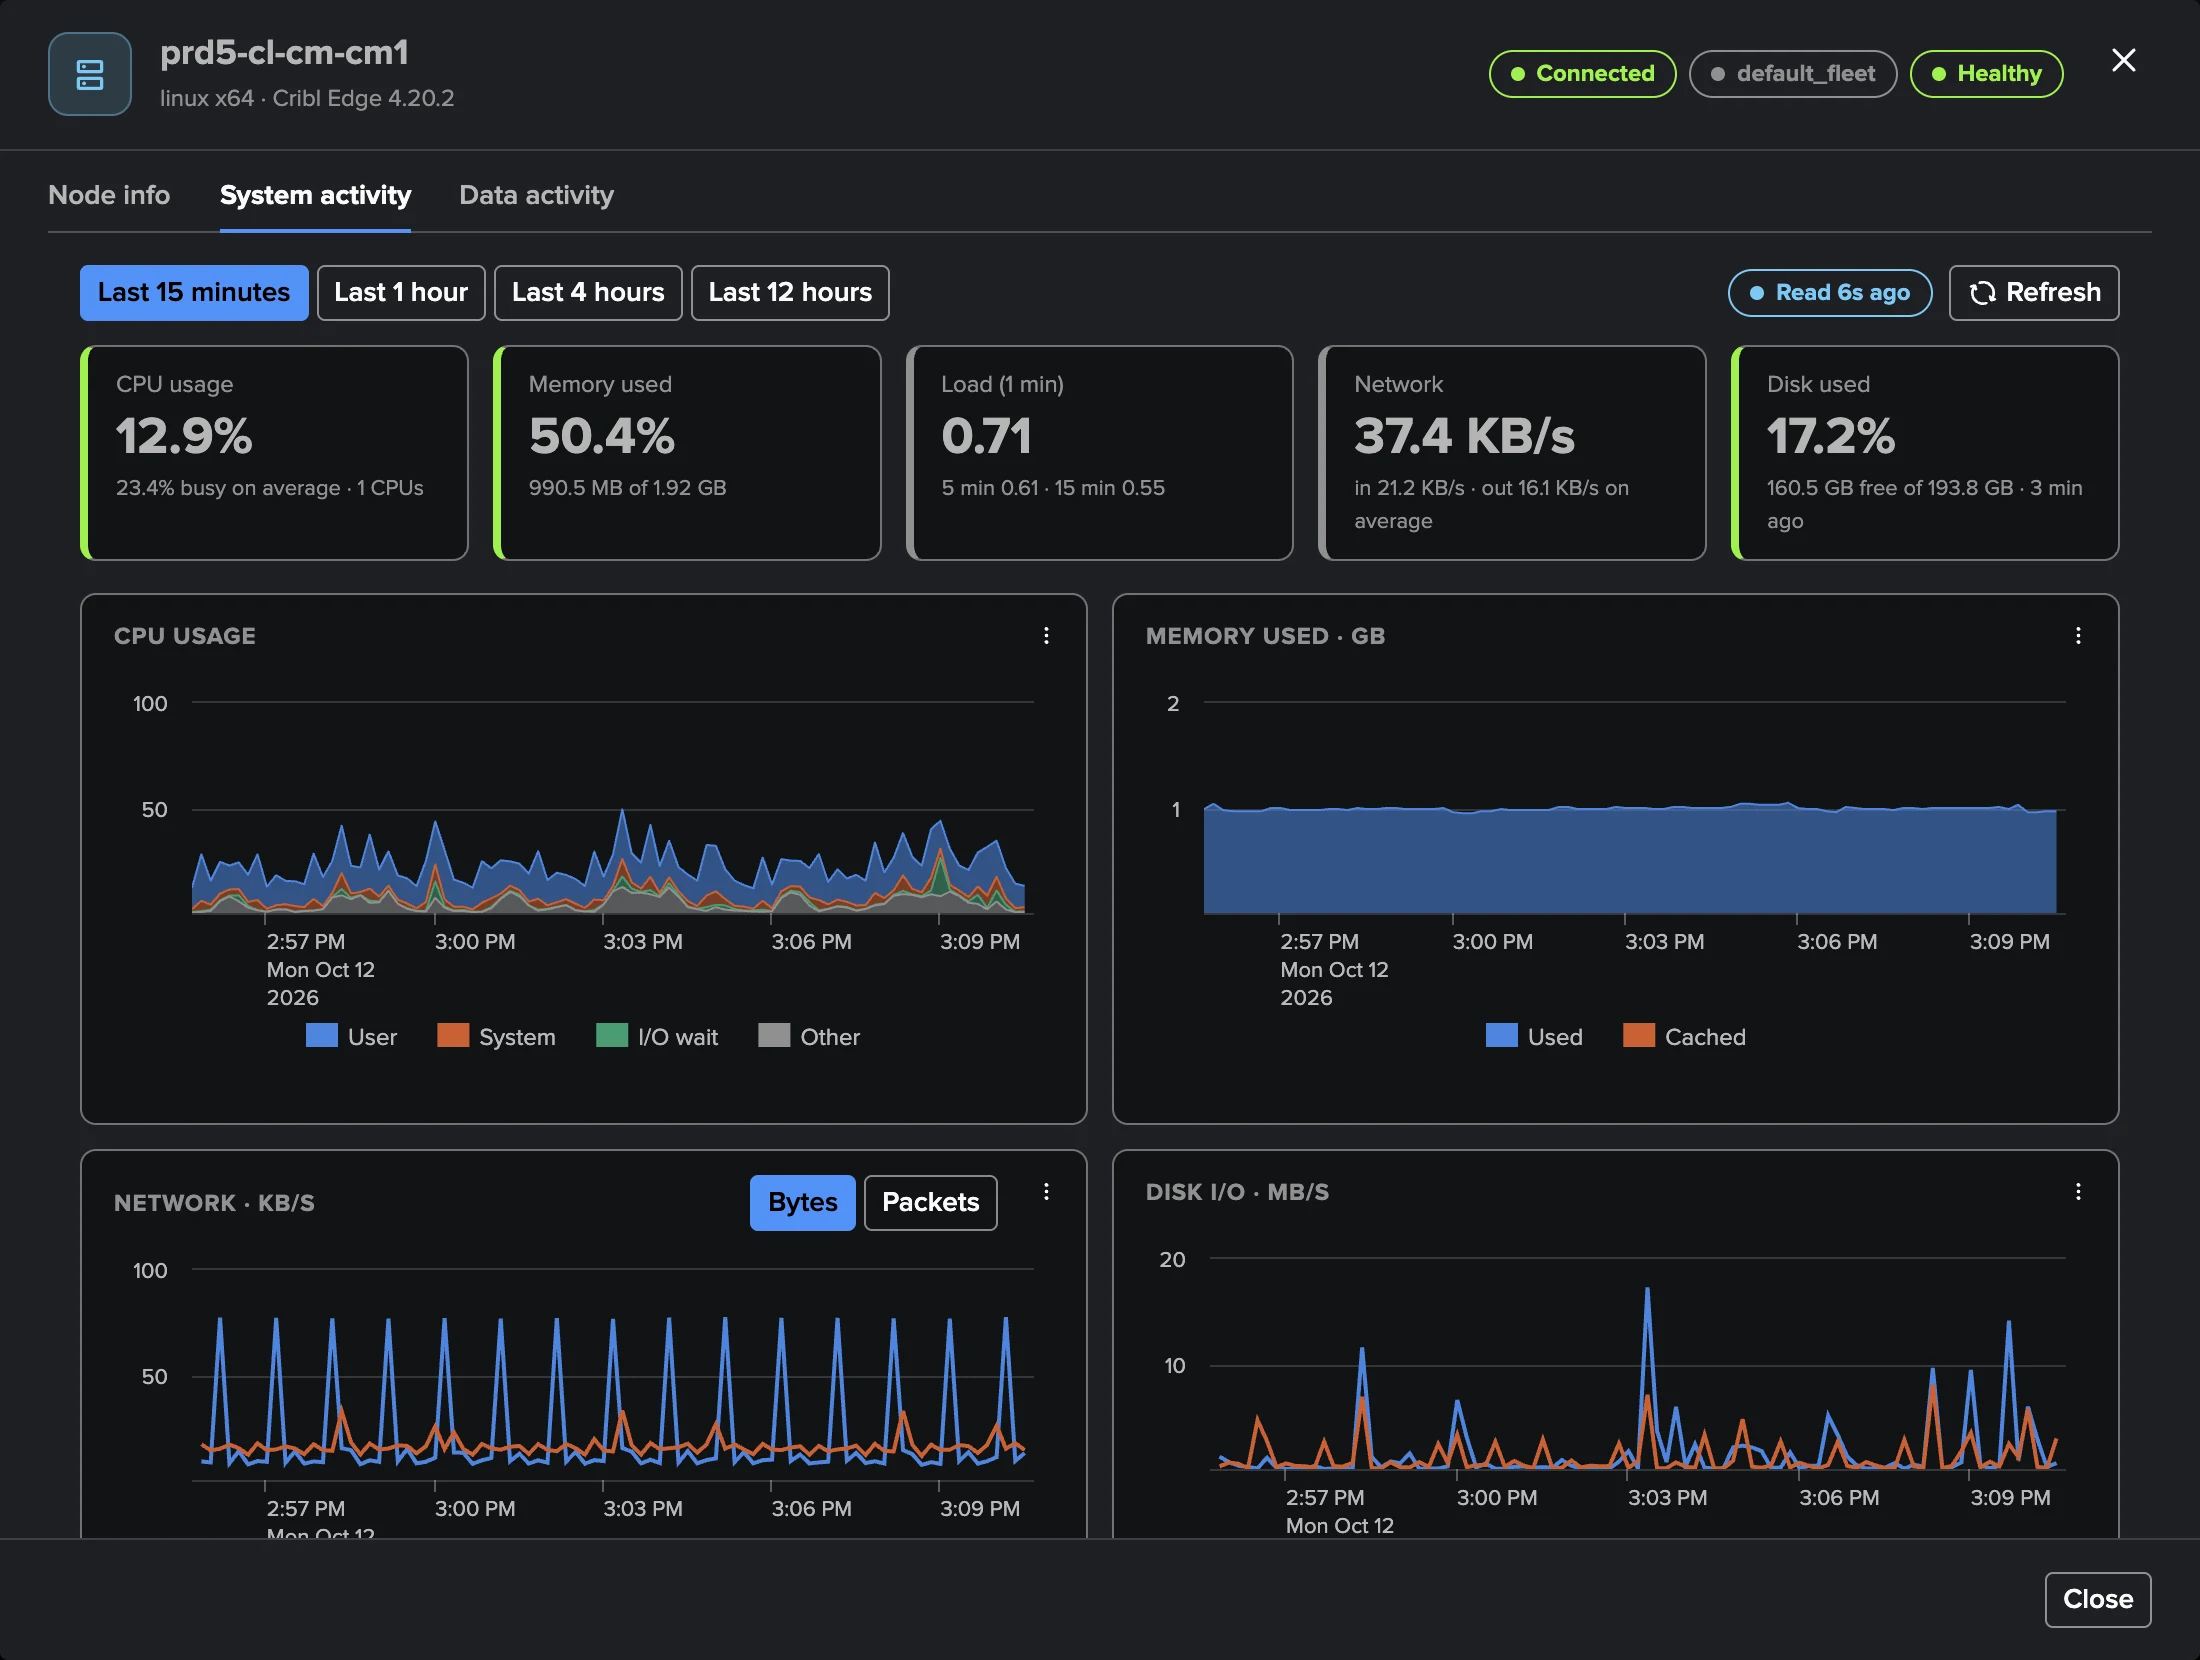
Every node, up close. Open any Edge Node from the workspace and its System activity shows what Cribl’s own System Activity page shows for that host — CPU by mode, memory, network, disk I/O and load over the last 15 minutes to 12 hours — read live from the node through the Leader, with nothing to forward and nothing to configure. The fleet-wide view stays cheap; the detail of one node is one click away.
What it monitors
Object |
What TrackMe watches |
|---|---|
Fleets (and Subfleets) |
Connectivity: the share of the Fleet’s active nodes that are disconnected. Version drift: connected nodes not on the Leader’s Edge version (or the Fleet’s most common one) once a rollout grace has passed. Configuration drift: connected nodes not running the Fleet’s deployed configuration. Coverage: a Fleet with fewer connected nodes than expected, or emptied. Node identity: one host name reported by several node ids (cloned images), or a node id that keeps changing host name. |
Sources and Destinations of each Fleet |
The health each node reports for the Sources and Destinations it runs (healthy, warning, trouble) and their traffic, rolled up per Fleet: “this Destination is in trouble on 4 of 17 nodes”. |
Edge Nodes |
Connection (Leader state and heartbeat) for the nodes that must never drop, disk used on every node, and CPU and memory when the Fleets forward their Edge System Metrics to Splunk (a System Metrics index, optional). |
The Cribl Leader |
Whether TrackMe can reach and use the Leader API at every run (the same Leader availability policy as Cribl Stream). |
Built for any fleet size
An Edge fleet can hold a handful of servers or tens of thousands of endpoints. The Cribl Edge tenant is designed so that its cost does not grow with one call per node:
The node directory is read in bulk. At every live run, TrackMe reads the Leader’s list of Edge Nodes page by page and keeps it as one published node directory. There is no API call per node, and no rotation: every node is current within one live interval (5 minutes).
No node limit. Nothing caps the number of nodes a tenant follows. Fleet figures, policies, the Edge Nodes tab and Topology Studio all read the directory in pages, so memory and work stay bounded whatever the fleet size.
Fleet-level judgement first. Disconnections, version and configuration drift and Source / Destination health are judged per Fleet, as a share of its nodes. One laptop that goes to sleep does not open a finding; a fifth of a Fleet dropping does.
Per-node detail on demand. A node’s CPU, memory, network and disk activity, and the live status of one of its Sources, are read from the Leader only when someone opens that node in the workspace.
No machine learning for Edge
The Cribl Edge tenant has no traffic ML models, no model training job and no Expected traffic policy. Edge nodes are often endpoints whose activity is sparse and irregular, and there can be very many of them: a model per node and object would cost far more than it would detect. Edge relies instead on explicit, explainable rules (shares of a Fleet, graces, thresholds) and on the health Cribl itself reports for each Source and Destination.
Before you start
A licence. A valid Enterprise, Unlimited, trial or Developer licence. The Cribl Edge tenant is not available with the Foundation edition or the Foundation trial.
A Cribl connection to the Edge Leader, created by a Splunk administrator in Configuration → Manage Cribl connections: a Cribl.Cloud workspace (organisation, workspace, client id and secret) or a self-managed Leader (URL, credentials, and for TLS Verify SSL certificate with an optional CA chain). The Cribl account behind it needs read access to the Cribl Edge API (Fleets, Edge Nodes, the configuration of each Fleet, and the Leader-proxied reads of a node). See Cribl connections.
A tenant owner: nobody, or an account (typically a service account) holding the
capabilities the creation wizard lists, so that the tenant’s scheduled reports run. The
scheduled triage of the Cribl Edge AI Agent needs more: an owner that is a Splunk
administrator account, not nobody (see The Cribl Edge AI Agent).
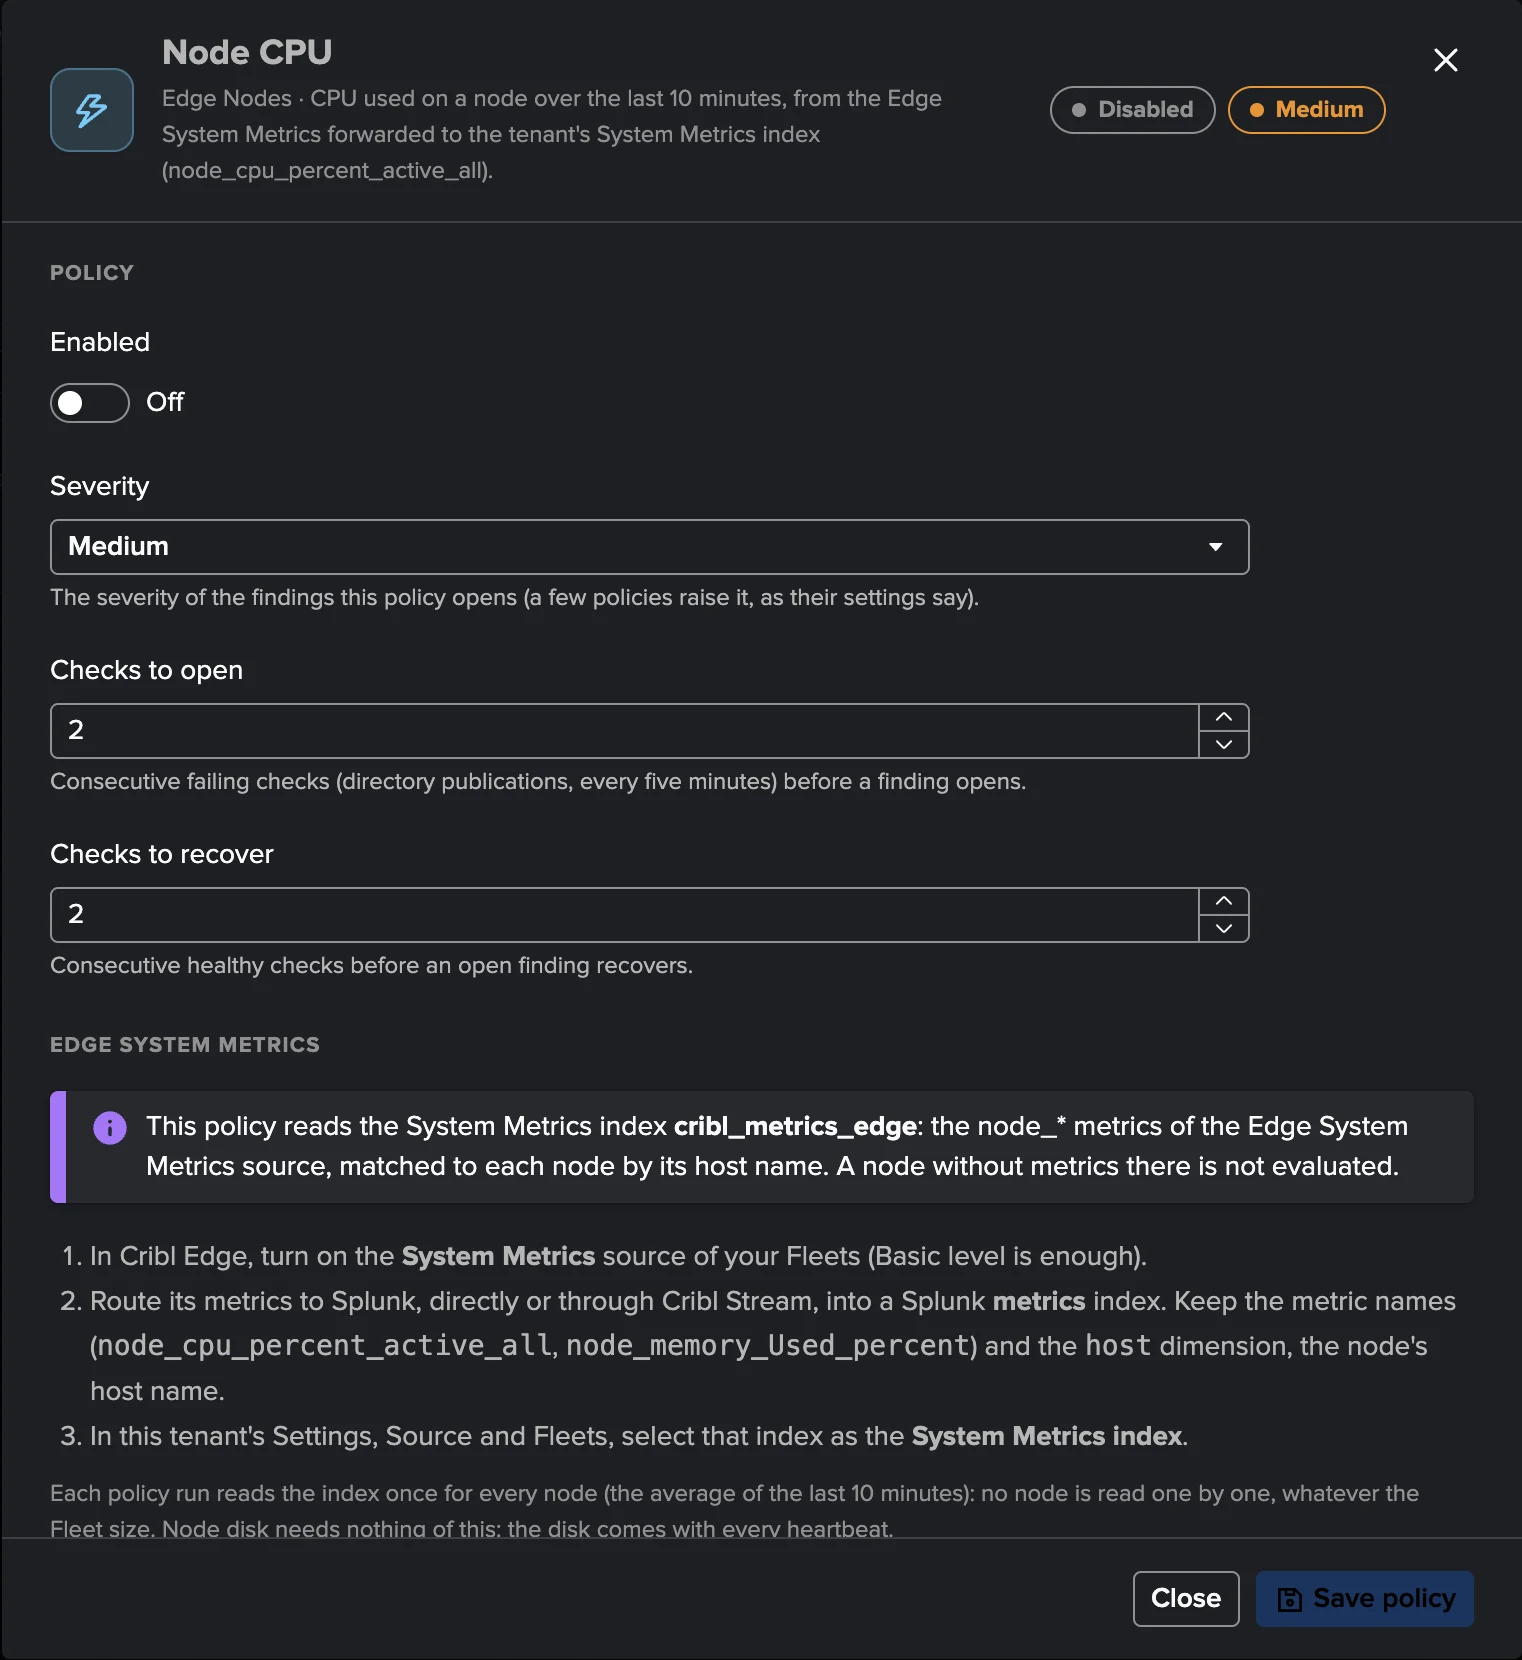
Optionally, a System Metrics index. Cribl Edge reports no host CPU or memory with the node heartbeat, and TrackMe never reads nodes one by one. To monitor the CPU and memory of your Edge Nodes continuously, the Fleets forward their Edge System Metrics to a Splunk metrics index, and the tenant reads it:
In Cribl Edge, turn on the System Metrics source of your Fleets (the Basic level is enough).
Route its metrics to Splunk, directly or through Cribl Stream, into a Splunk metrics index. Keep the metric names (
node_cpu_percent_active_all,node_memory_Used_percent) and thehostdimension, the node’s host name.Select that index as the tenant’s System Metrics index, in the wizard or afterwards in Settings → Source & Fleets.
The System Metrics index is used for one thing only: the Node CPU and Node memory policies, and the CPU and memory KPIs of Edge Nodes in Topology Studio. Without it, everything else works the same: connectivity, versions, configuration, Sources and Destinations, node disk (which comes with every heartbeat), and the node’s System activity tab, which reads the node’s own metrics through the Leader when you open it.
No other index is needed: the history TrackMe keeps for the Fleets and the nodes (the trends of the workspace, the disk history) goes to the tenant’s TrackMe metric index, chosen in the wizard like for any tenant.
Creating the tenant
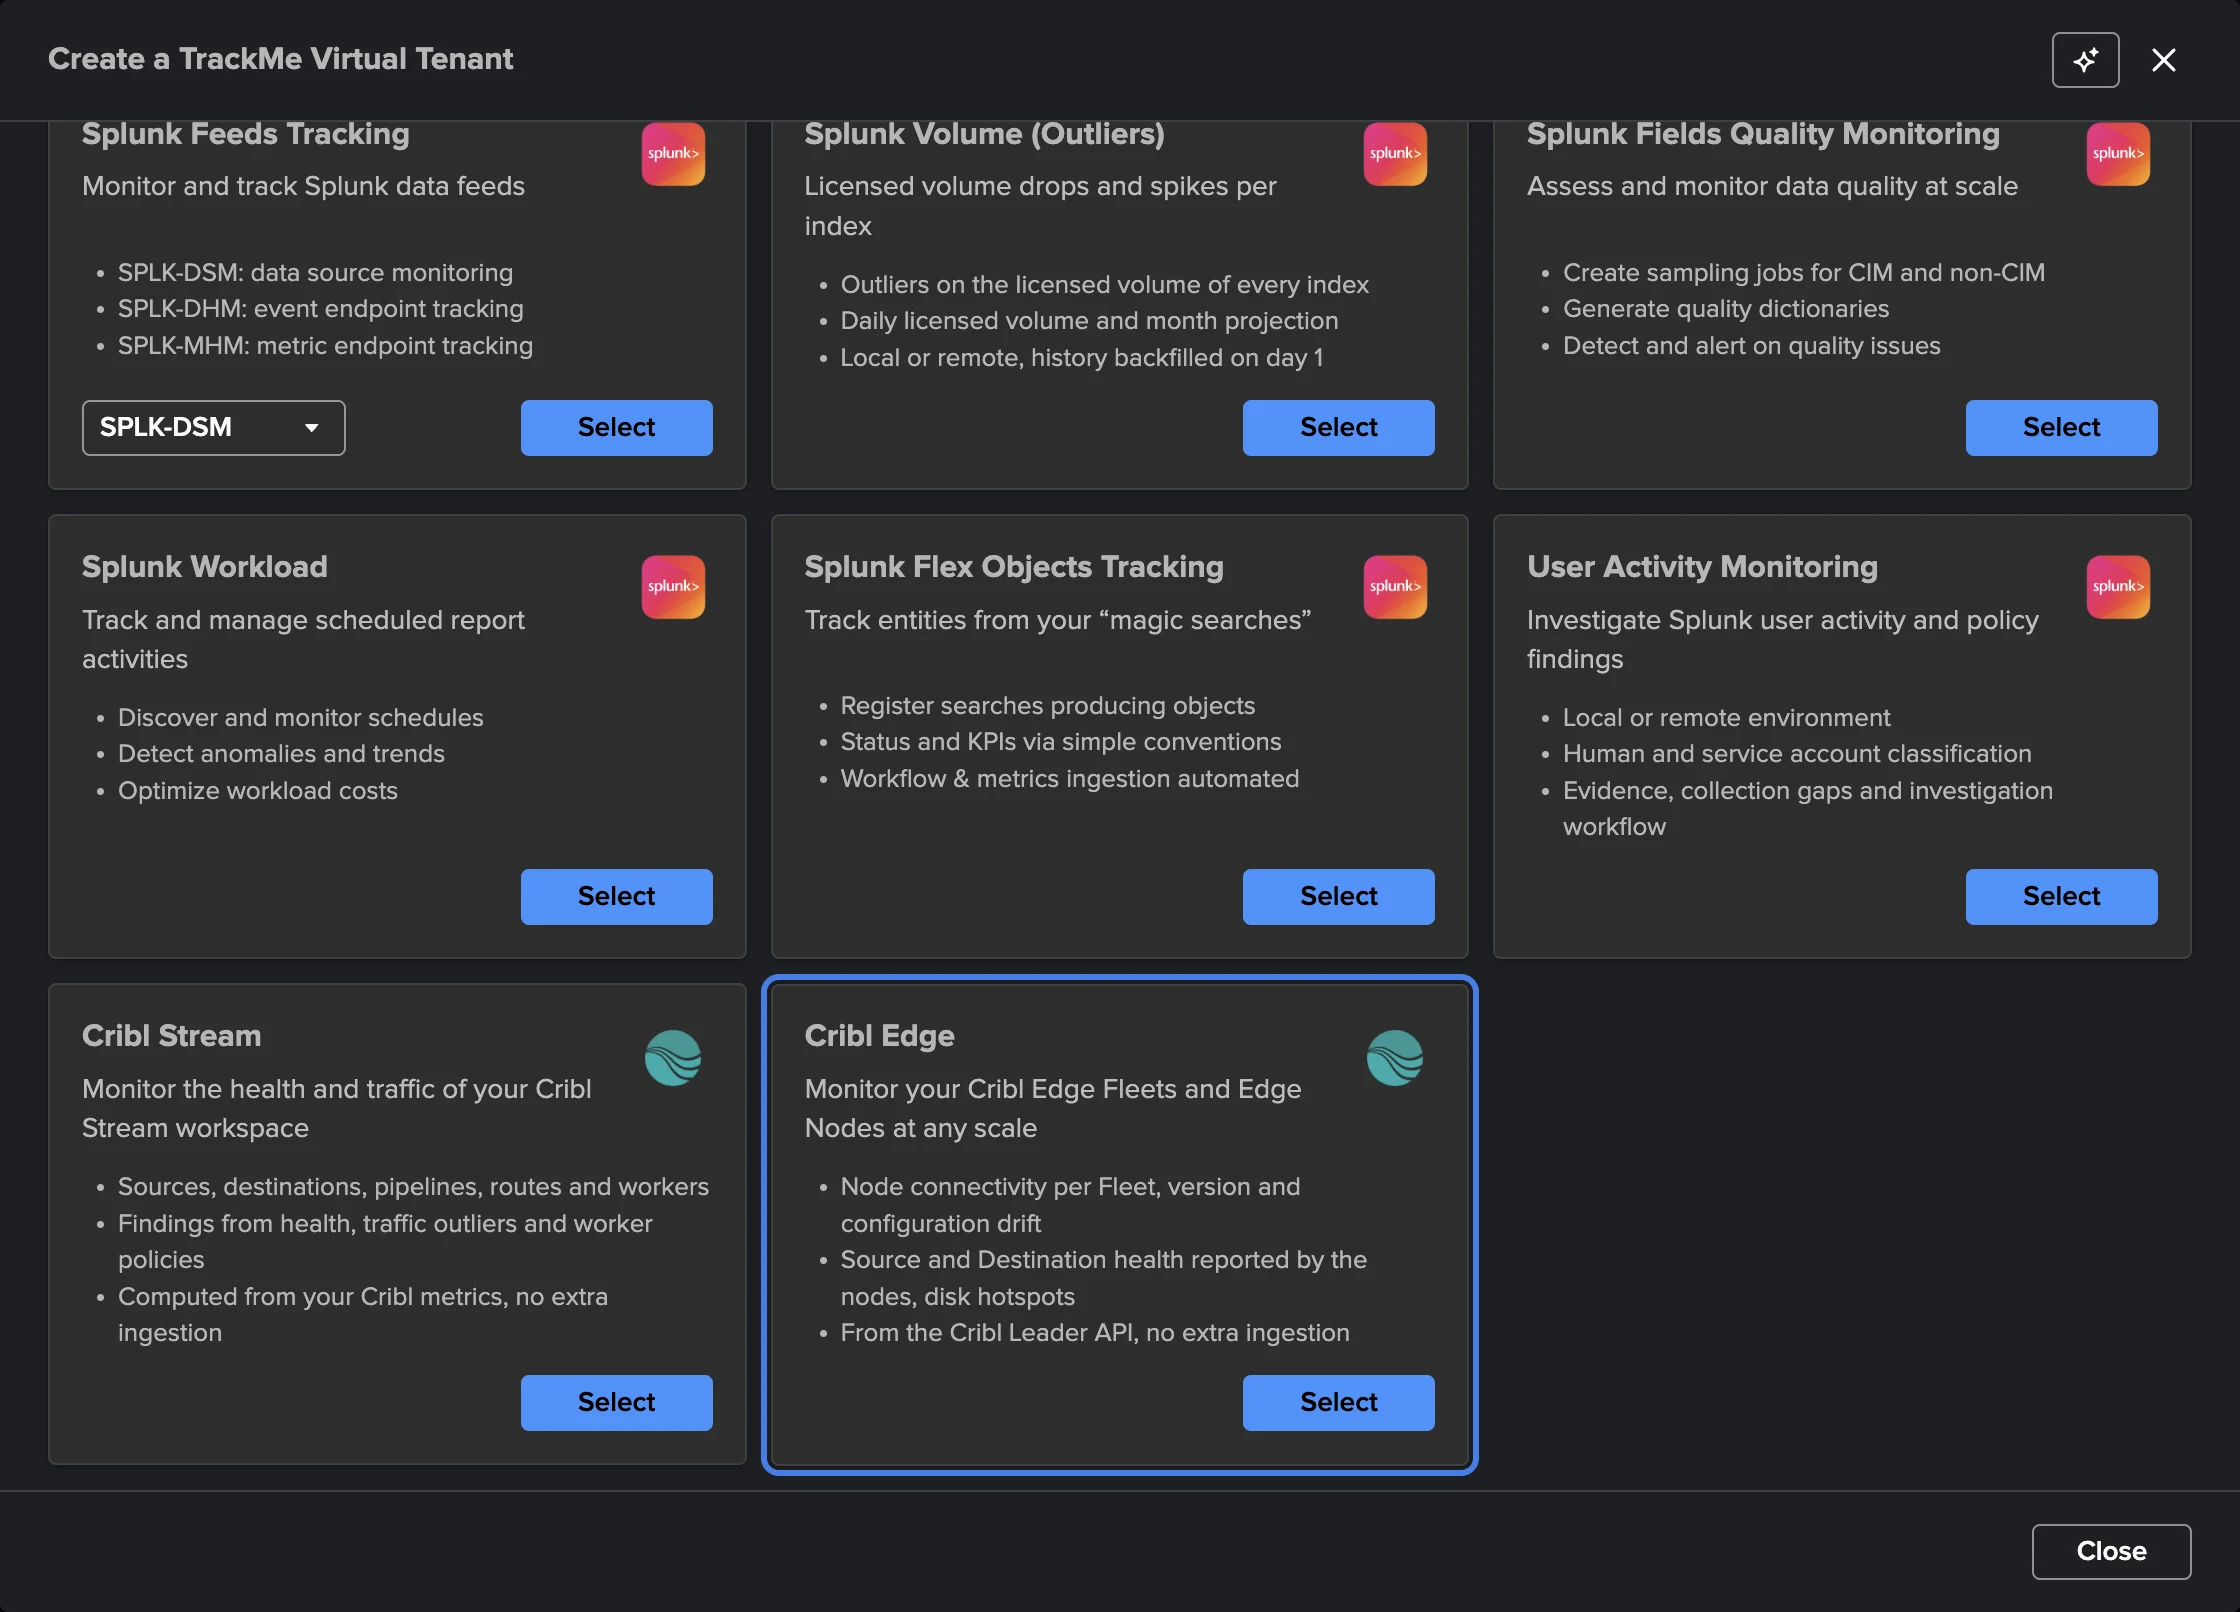
From the Virtual Tenants page, open Actions → Create a tracking tenant and choose the Cribl Edge card. The wizard has four steps.
1. Basics. The tenant identifier (lowercase letters, digits and hyphens, up to 20 characters; it cannot be changed afterwards), an optional alias and description.
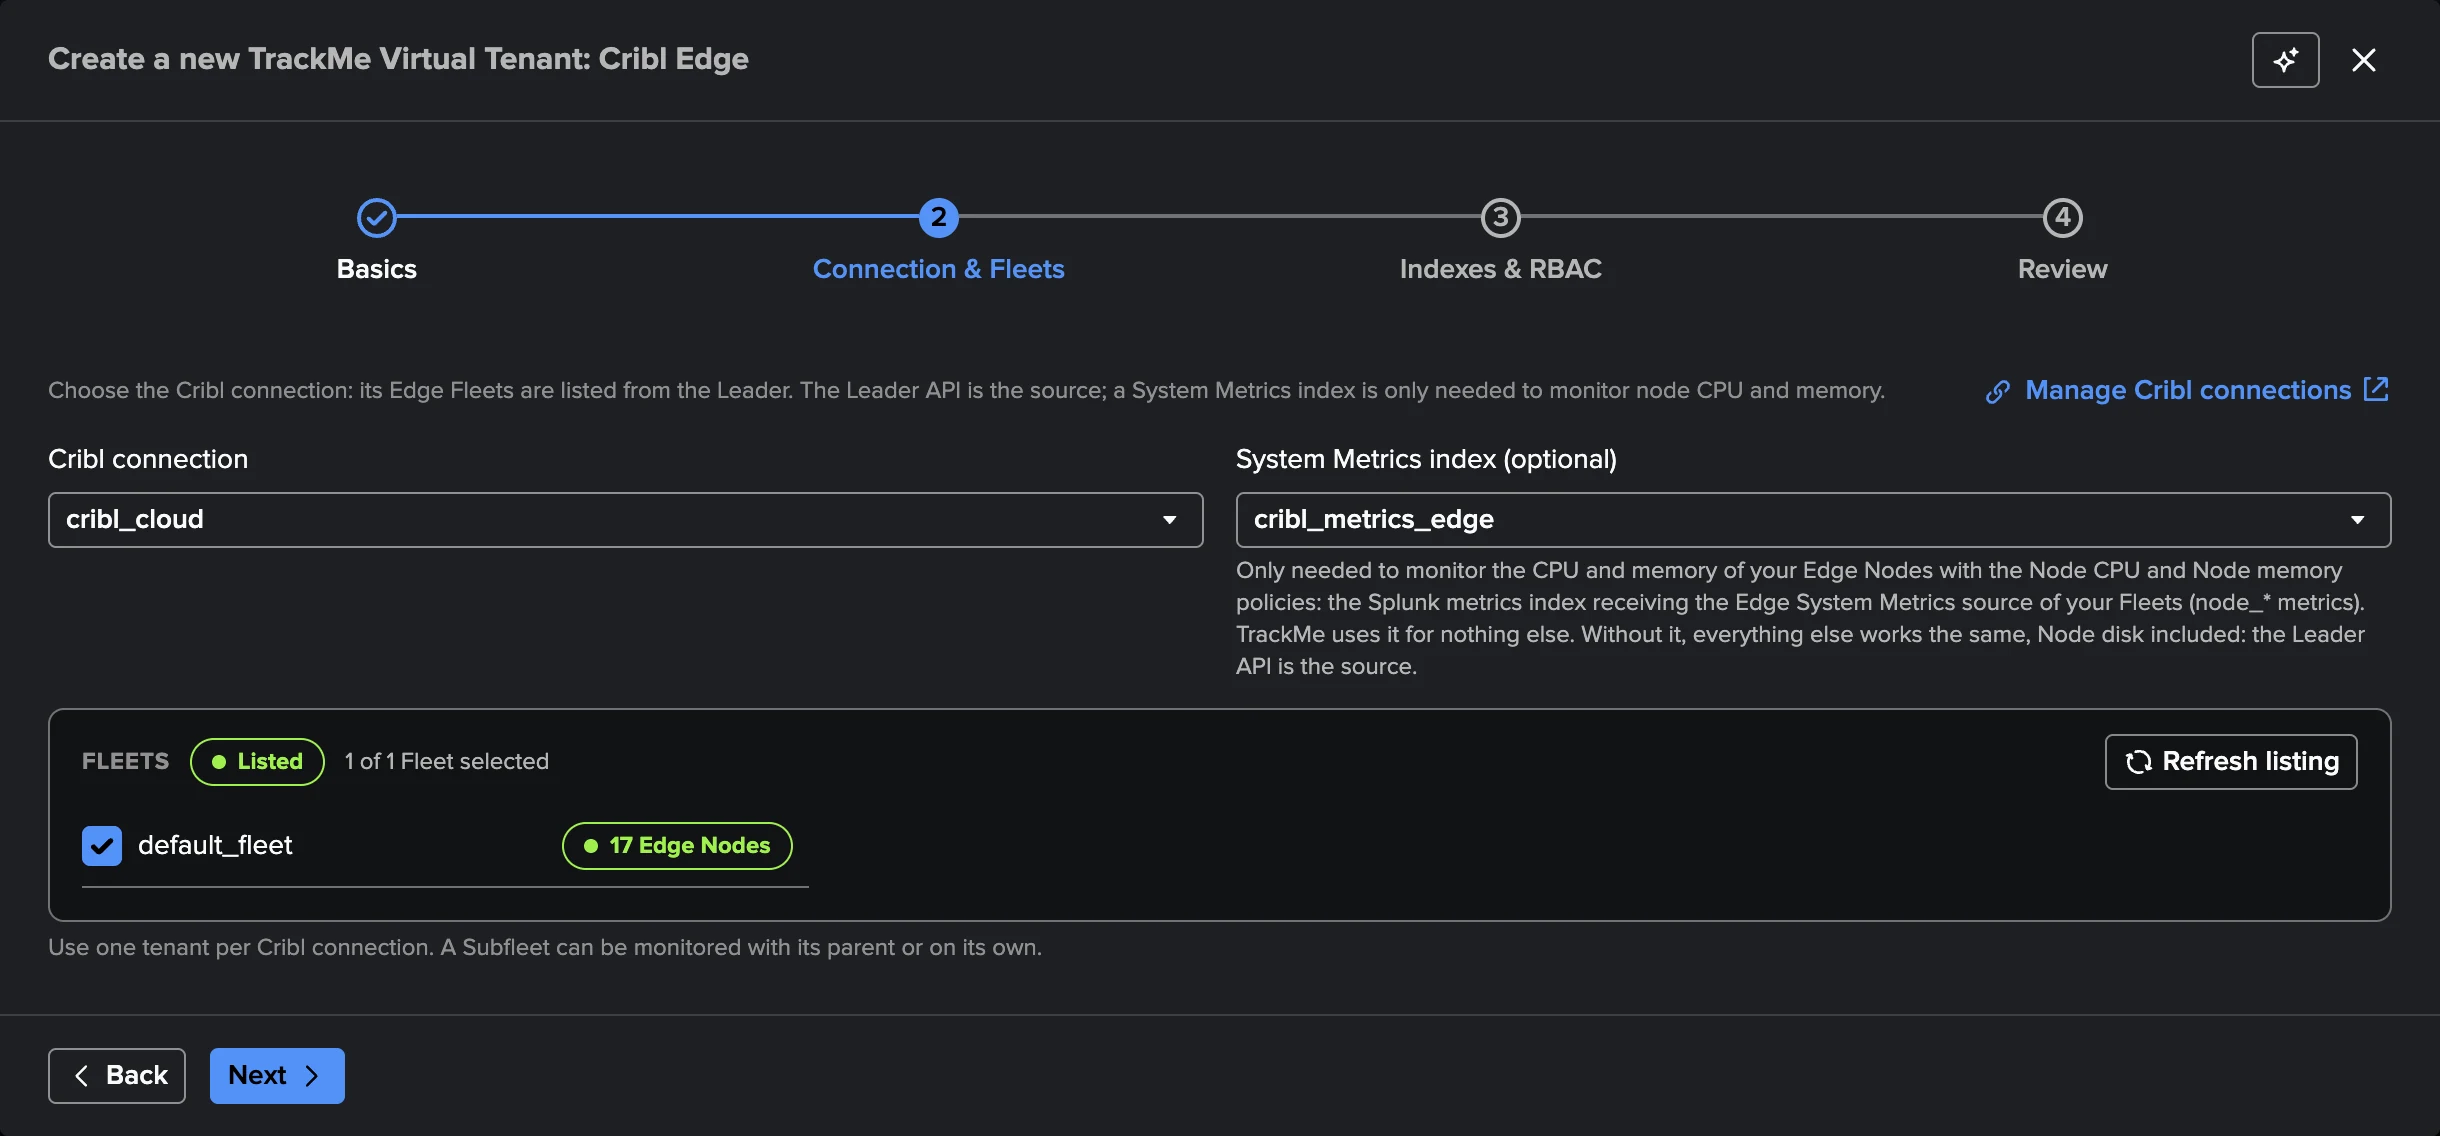
2. Connection & Fleets.
Choose the Cribl connection. It is locked once the tenant exists: another Leader takes another tenant.
TrackMe lists the Fleets from the Leader. On a first listing every Fleet is selected; clear the ones you do not want (1 to 100 Fleets per tenant). Each row shows its number of nodes, and a Subfleet shows “Subfleet of <parent>”: a Subfleet can be monitored with its parent or on its own. Refresh listing lists them again.
Choose the System Metrics index (optional), or keep “None: no node CPU or memory monitoring”.
The step waits for the Fleet listing. When the Leader cannot list the Fleets, the step says why in plain words (credentials refused, no right to read Cribl Edge, Leader unreachable, certificate not trusted, Leader busy) and what to do.
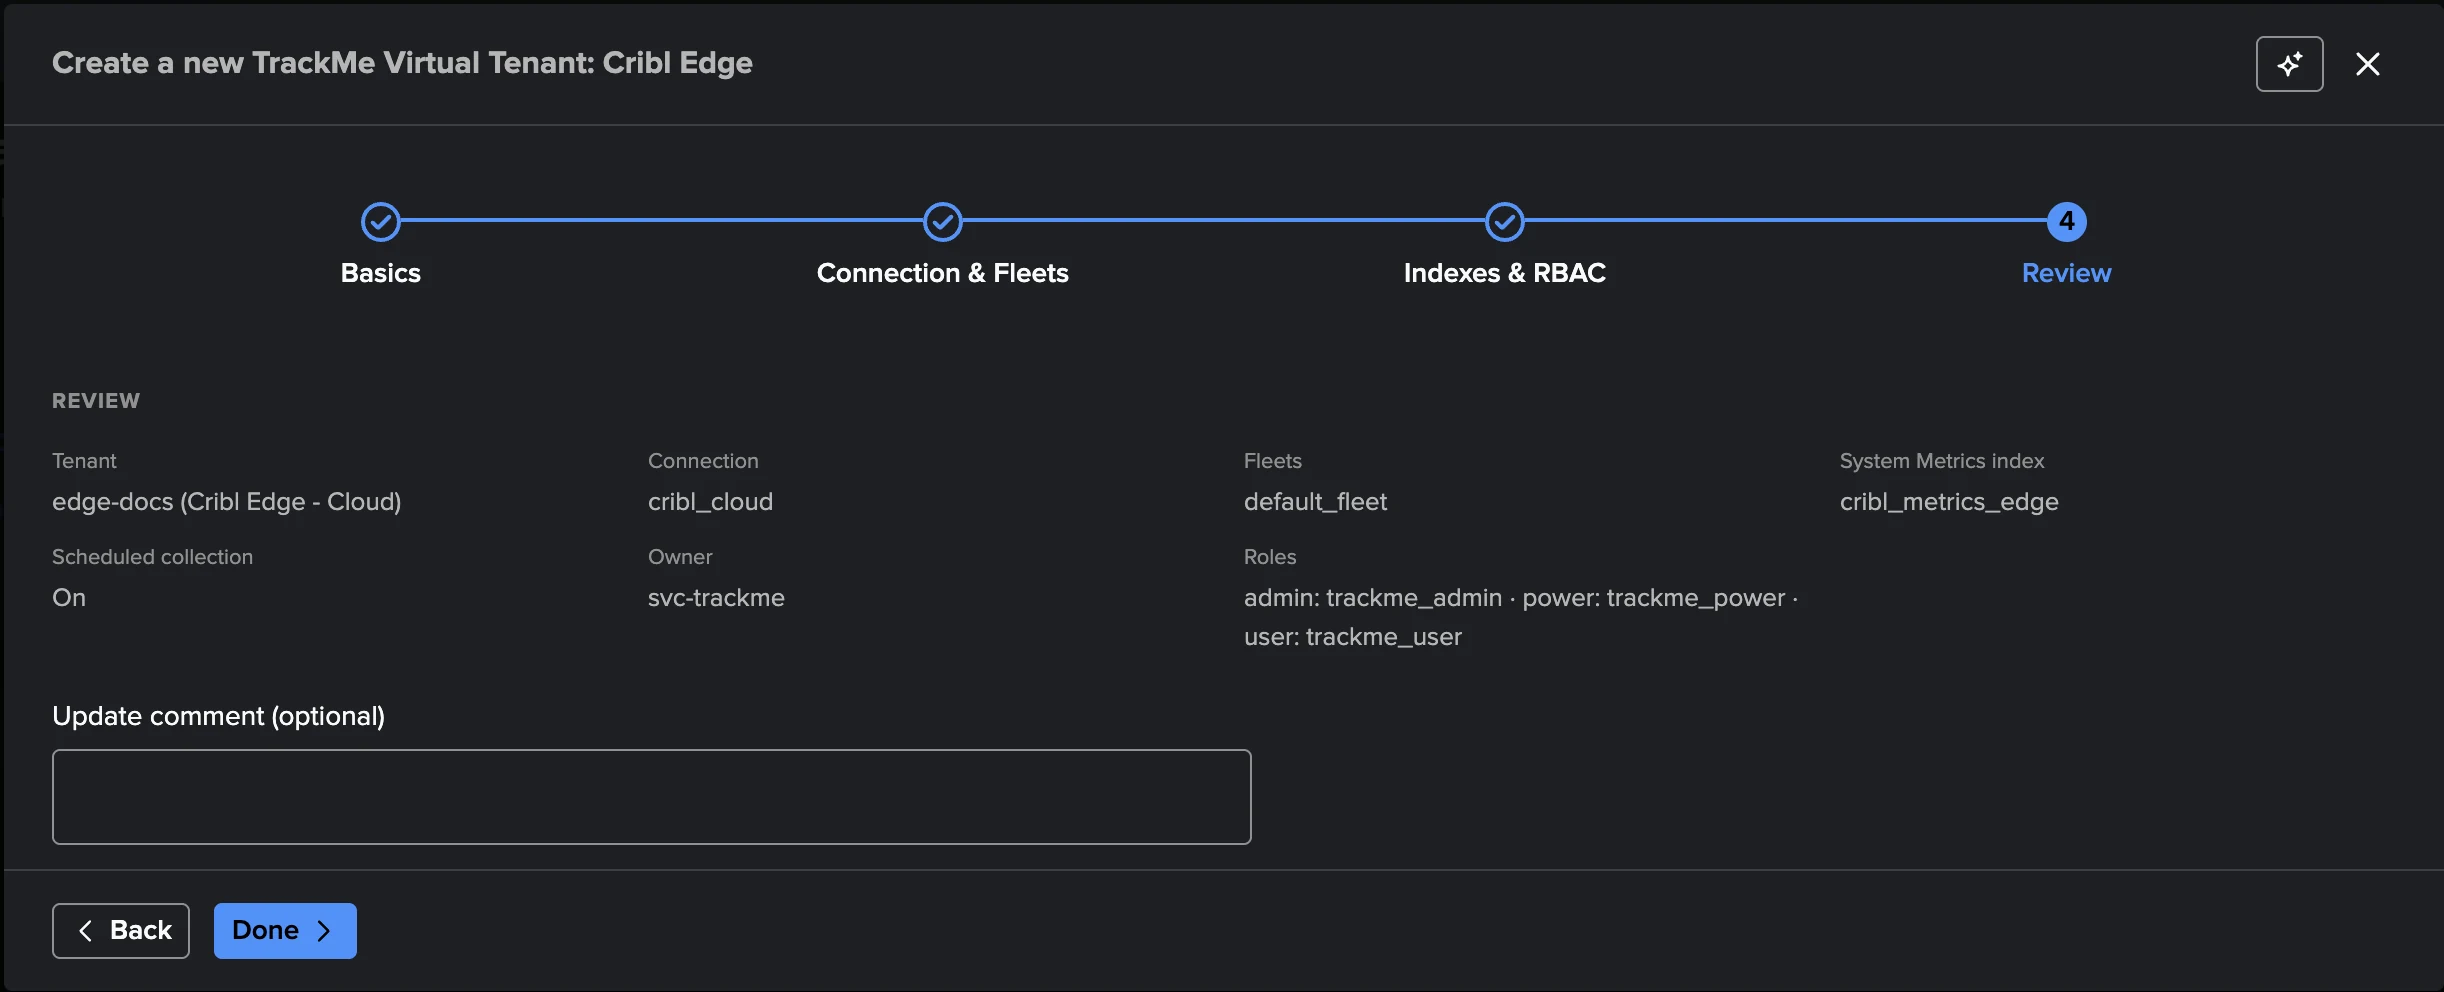
3. Indexes & RBAC. The tenant’s indexes (summary, audit, metric, notable), its admin, power and user roles, and its owner, as for any tenant.
4. Review. Check the summary and create the tenant. TrackMe creates the tenant’s collections and reports and starts the first collection: the Fleets and Edge Nodes appear in the workspace within a few minutes (Open workspace).
Collection is scheduled from the start: the Edge Nodes are read and the policies evaluated every 5 minutes, the Fleet configuration about once an hour. To pause it, turn off Scheduled collection in Settings → Collection.
The workspace
Open the tenant from Virtual Tenants: Tenant Home shows the Cribl Edge workspace. It is built with the same components as the Cribl Stream workspace, so the two look and behave the same.

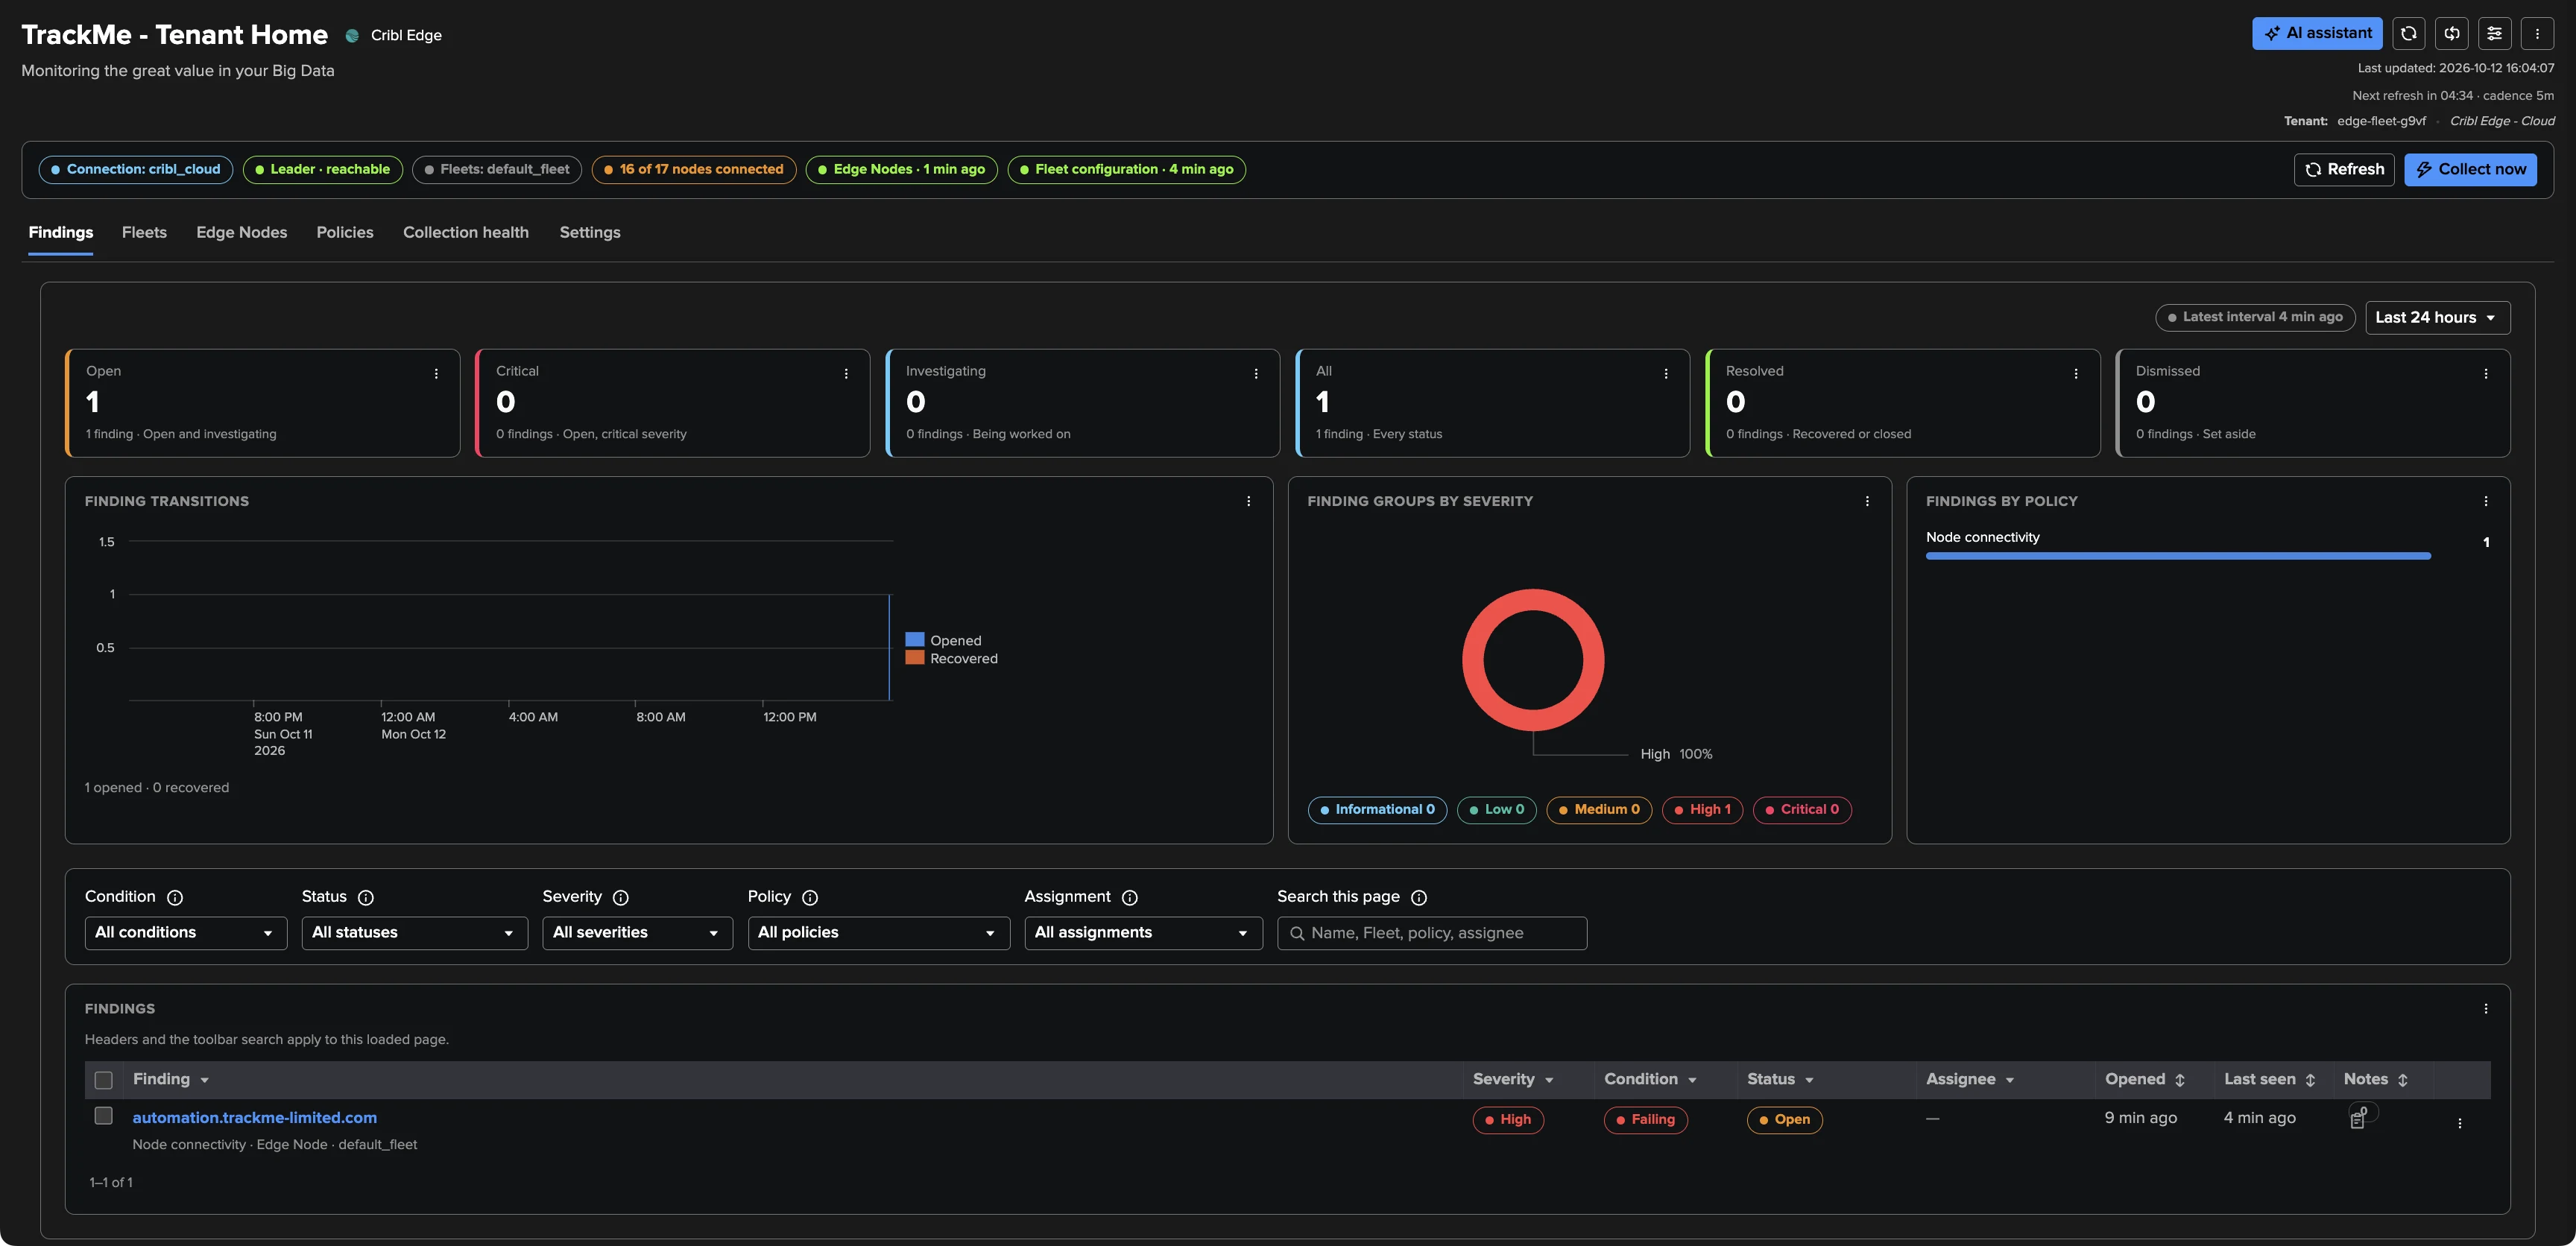
The status strip sums the tenant up: the connection, whether the Leader is reachable (with the time of the last check), the Fleets followed, “N of M nodes connected” from the latest node directory, and the age of the last Edge Nodes run and Fleet configuration run. Refresh reloads the workspace; Collect now (TrackMe administrators of the tenant) reads the Edge Nodes from the Leader and evaluates the policies at once.
Tab |
What it is for |
|---|---|
Findings |
The open findings and Finding groups of the tenant, their triage, assignment and findings actions. |
Fleets |
One row per Fleet: connected nodes, versions, drift, Sources / Destinations health, traffic and trend. Opens the Fleet. |
Edge Nodes |
Every node, filtered and paged by the server. Opens the node: Node info, System activity, Data activity. |
Policies |
The catalogue of the eleven built-in policies, their severity, conditions and scope. |
Collection health |
Whether collection runs as configured, job by job, and the load on the Leader. |
AI Agent |
The Cribl Edge AI Agent: whether it can run, its totals, Run a review now and its decision log. |
Settings |
Source & Fleets, Collection, Notifications, AI Agent, Assignment, Finding actions. |
Findings
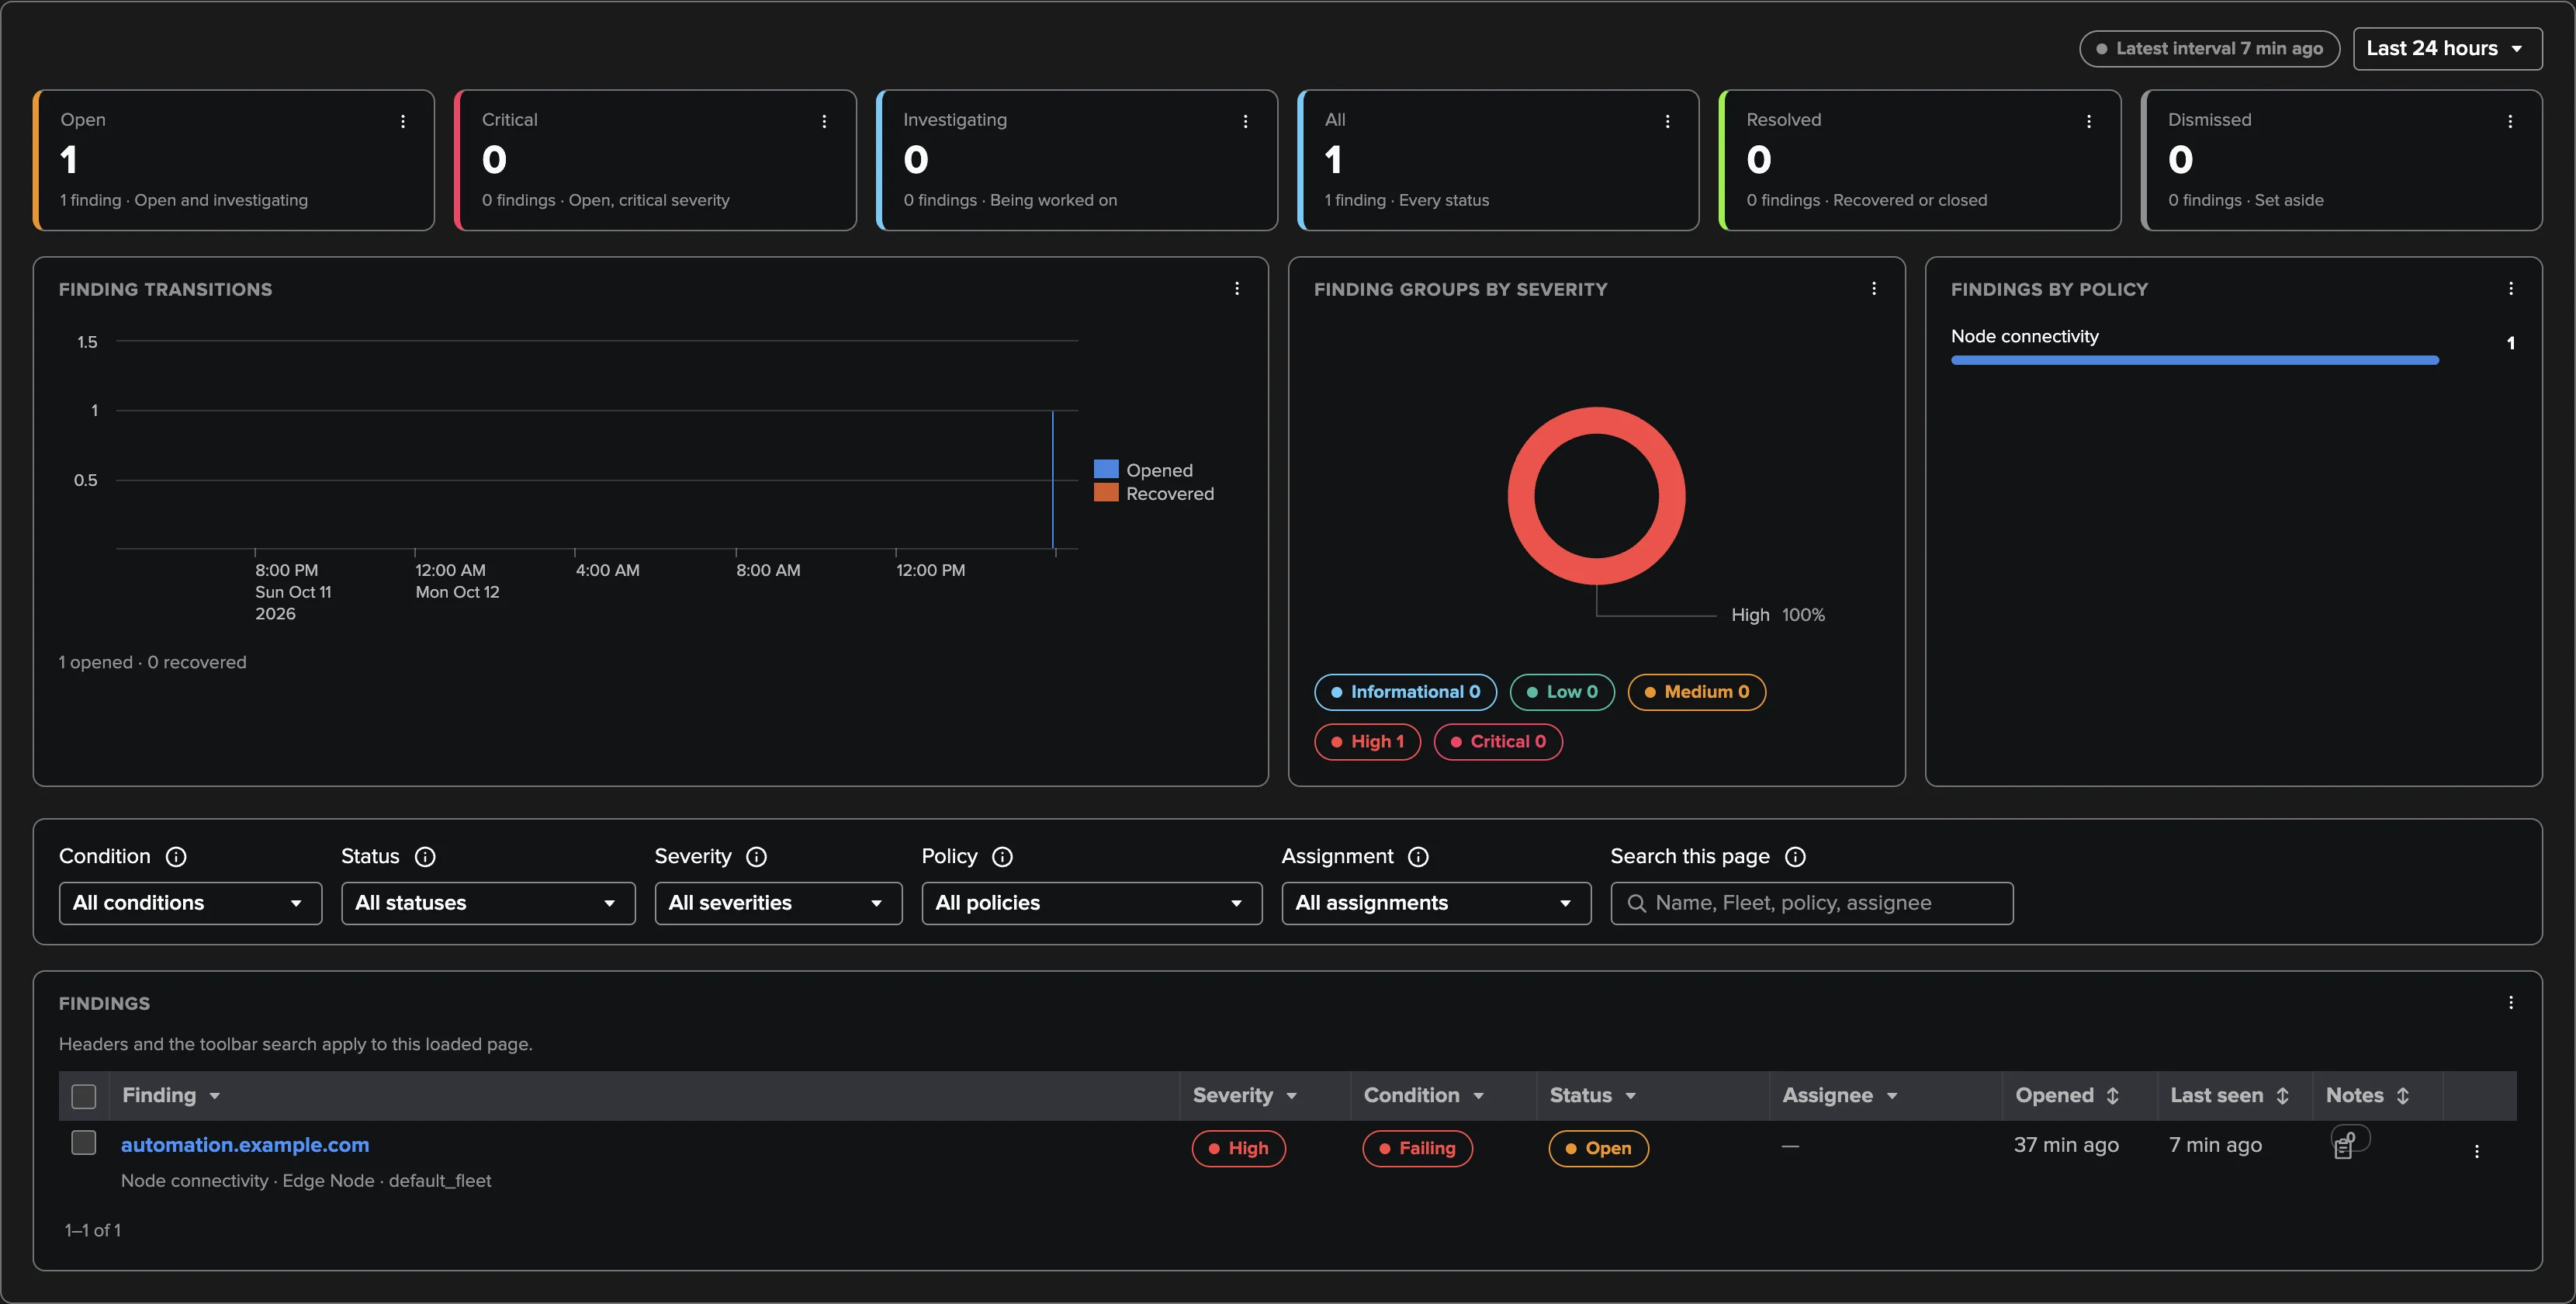
The Findings tab is the shared findings centre of the Cribl tenants: KPI tiles, the transitions over time, the open findings and Finding groups with their severity (Informational, Low, Medium, High, Critical), condition, status and assignee. Each row’s menu investigates, triages (investigate, snooze, dismiss for a time or until it recovers, resolve, change the severity), assigns, runs a findings action, asks the AI Agent (Ask the AI Agent…), and Open resource opens the Fleet or the Edge Node the finding is about, in place. See Findings in practice below and Findings, Finding groups and findings actions.
Fleets
The tiles answer the fleet questions at a glance: Fleets selected, Edge Nodes connected (click to list the disconnected ones), nodes Not on the Leader version, nodes Not on the Fleet configuration, Sources / Destinations unhealthy (reported by the nodes) and, when it happens, Connected without metrics. The table has one row per Fleet, with its Subfleet parent, nodes, connected share, disconnected nodes, the versions running (green on the Leader version, amber otherwise, red when a version is newer than the Leader or two minor versions behind), drift counts, unhealthy Sources / Destinations, nodes without metrics, events and bytes in, and a traffic trend over the chosen range. All Edge Nodes opens the Edge Nodes tab.
Select a Fleet to open it:
four traffic tiles (events and bytes in and out, each with its trend) and the Fleet’s bars: connected, on the Leader version, on the Fleet configuration;
its facts: nodes, not deployable, without metrics, platforms, statuses, dropped events, highest disk and on which node;
three tabs: Sources and Destinations (per object: nodes reporting it, warning and trouble counts, events, bytes, and the nodes reporting it unhealthy) and Nodes to look at (disconnected nodes with their last heartbeat, connected nodes without metrics, nodes not on the Fleet configuration, and the nodes behind each version). Every node name opens the node; Edge Nodes of this Fleet lists them all.
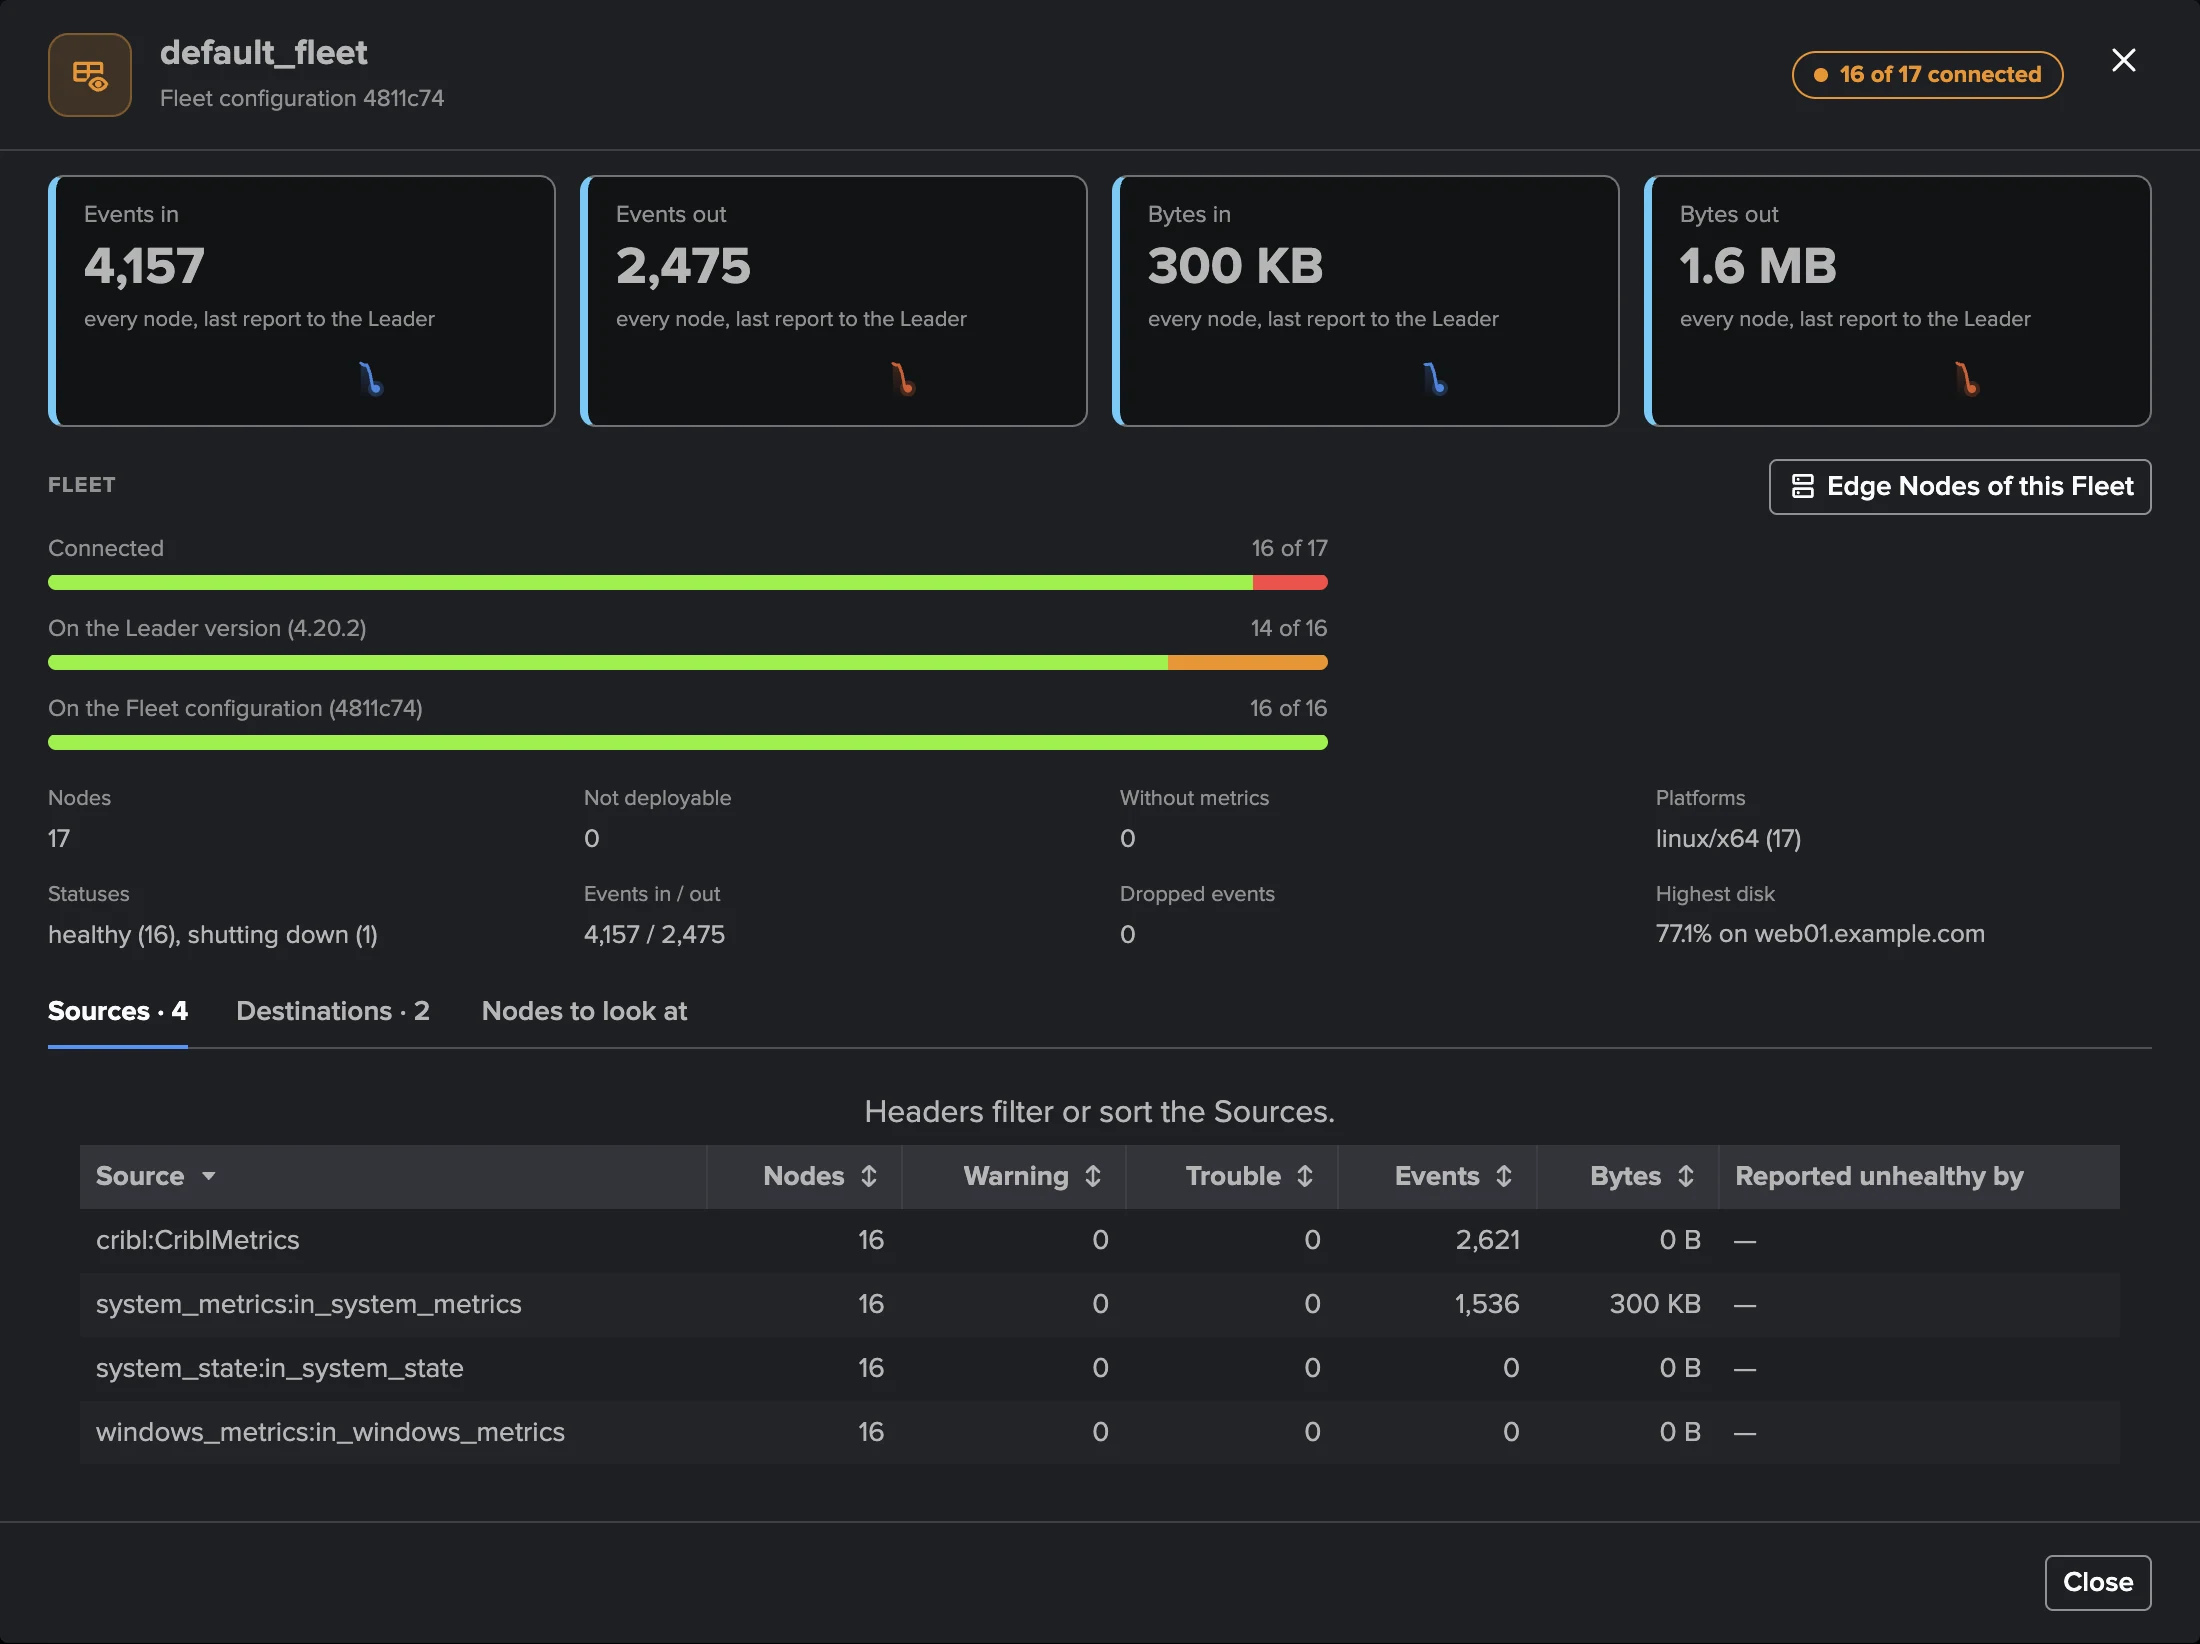
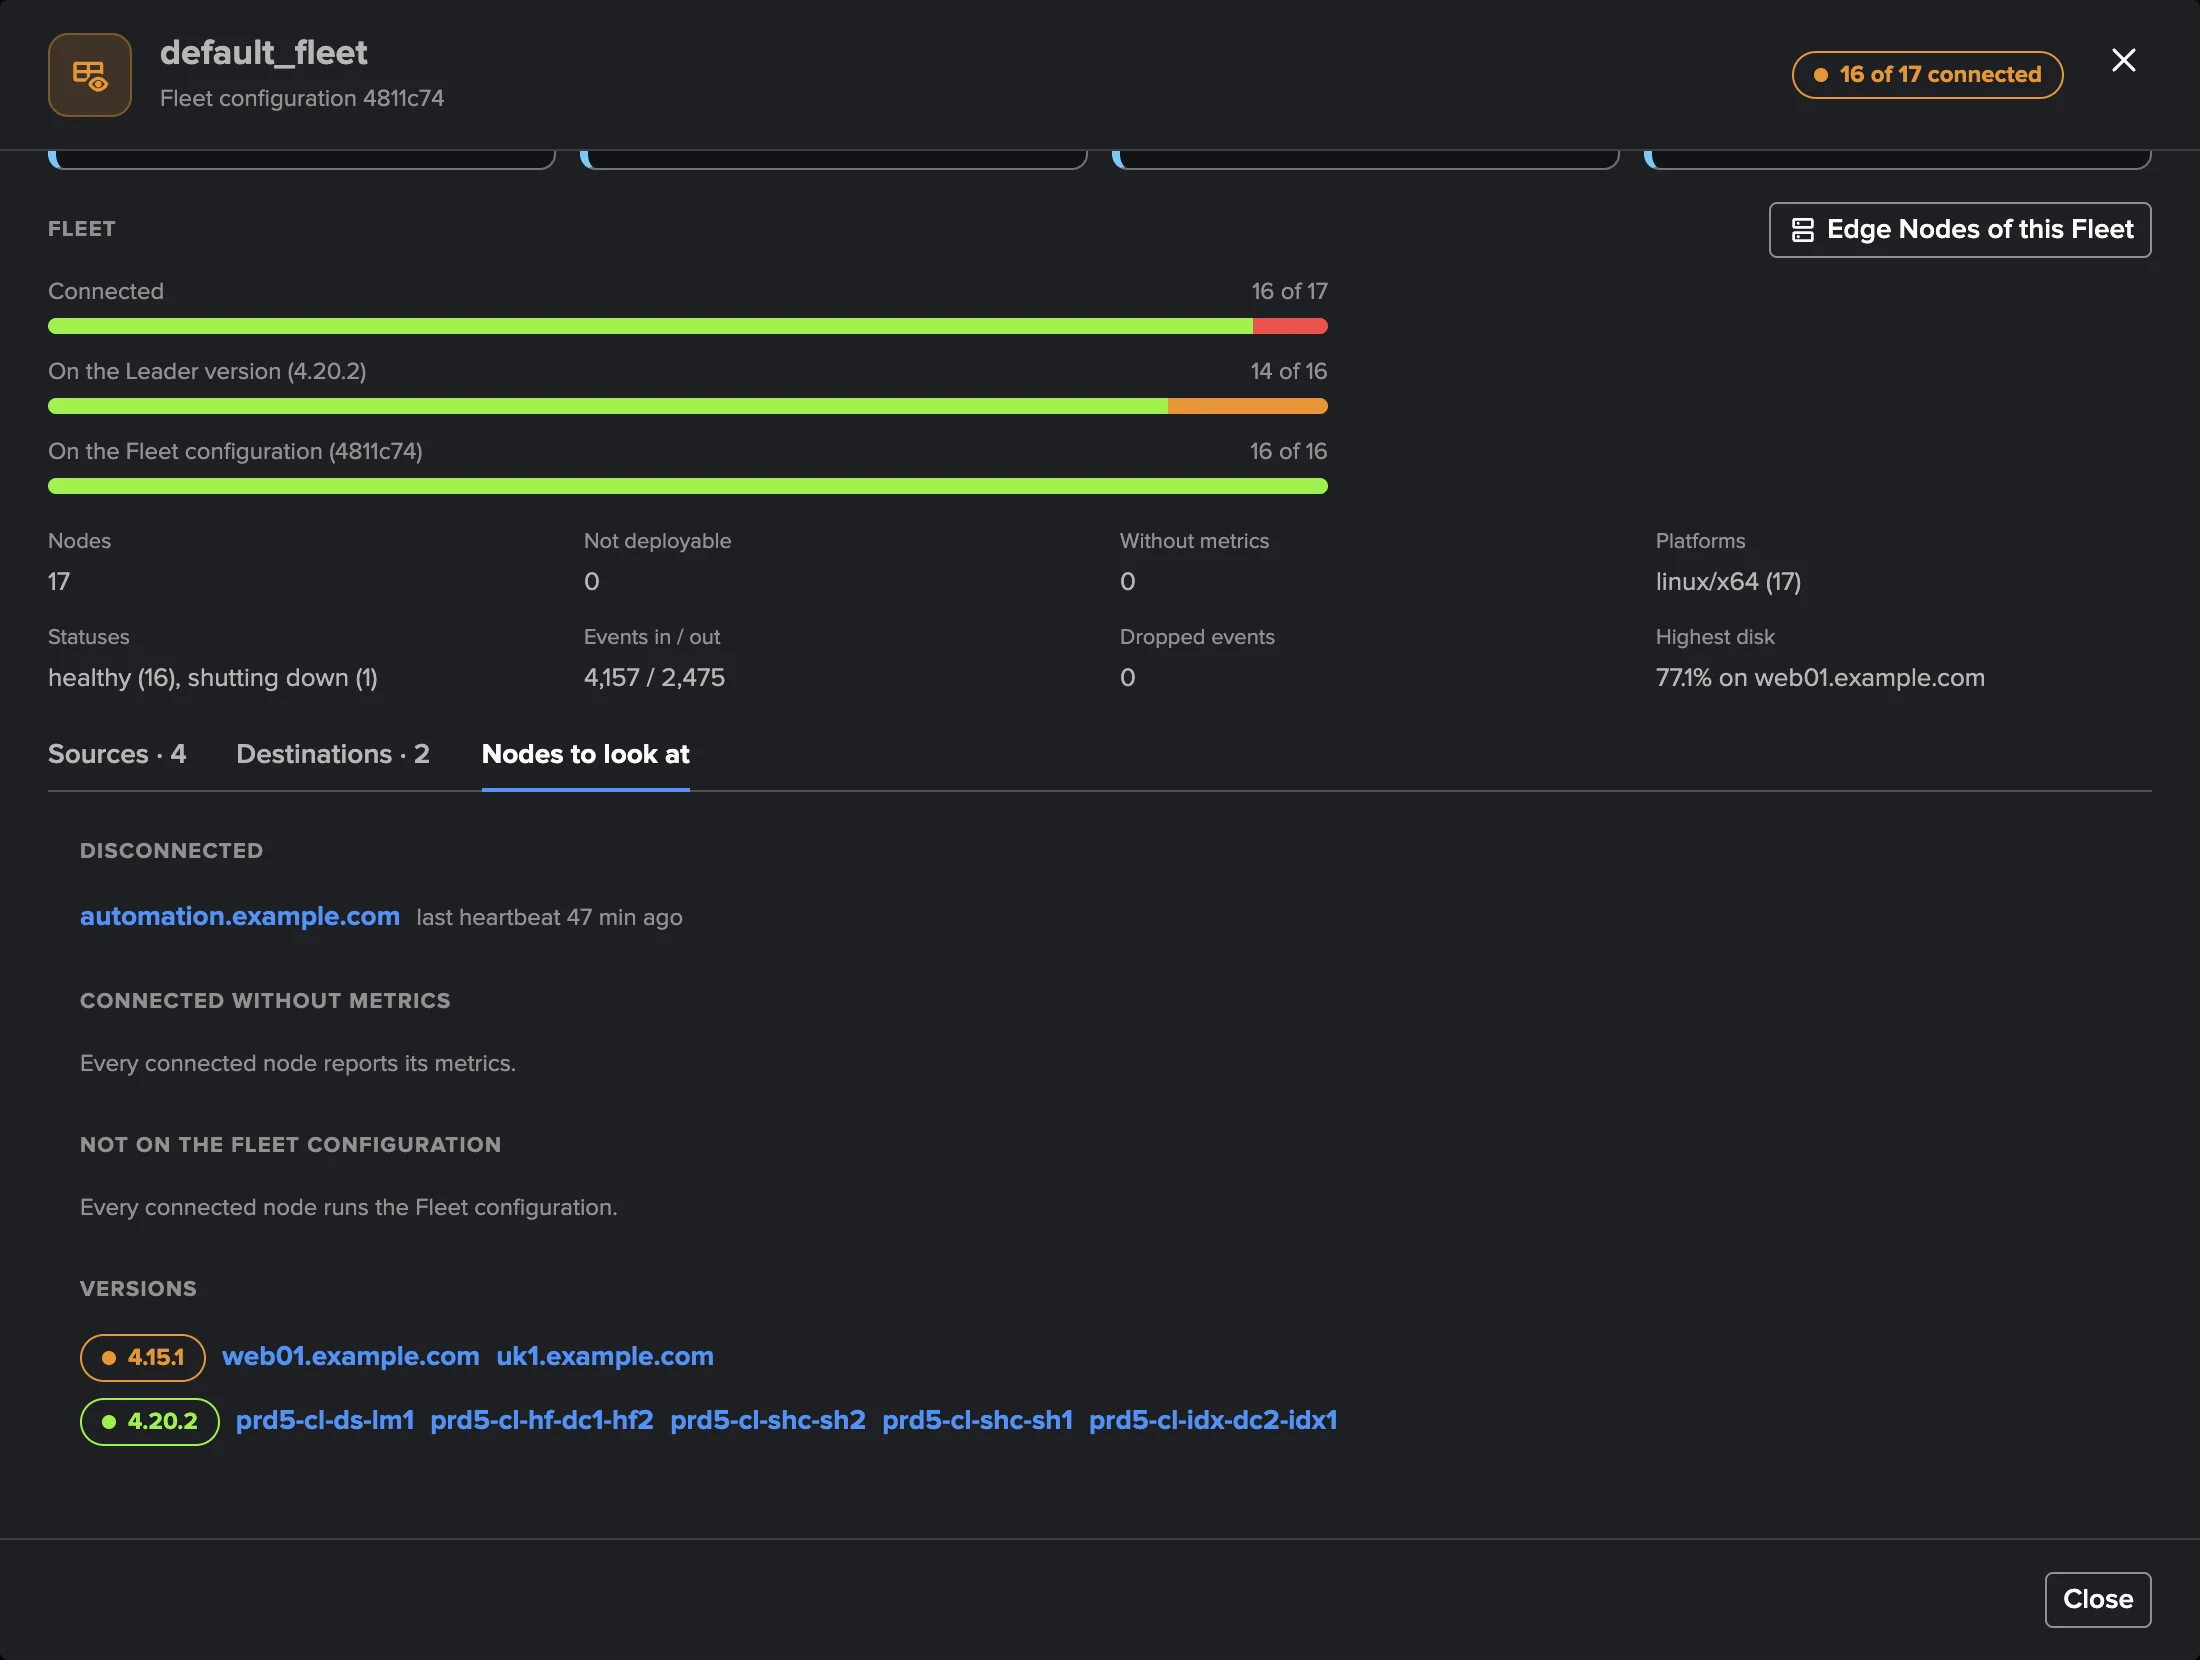
The figures of a Fleet are the sum of each node’s last report to the Leader (Cribl measures it over a short period): they say how busy the Fleet is now, not volume totals. The trends sample that report at every collection.
Edge Nodes
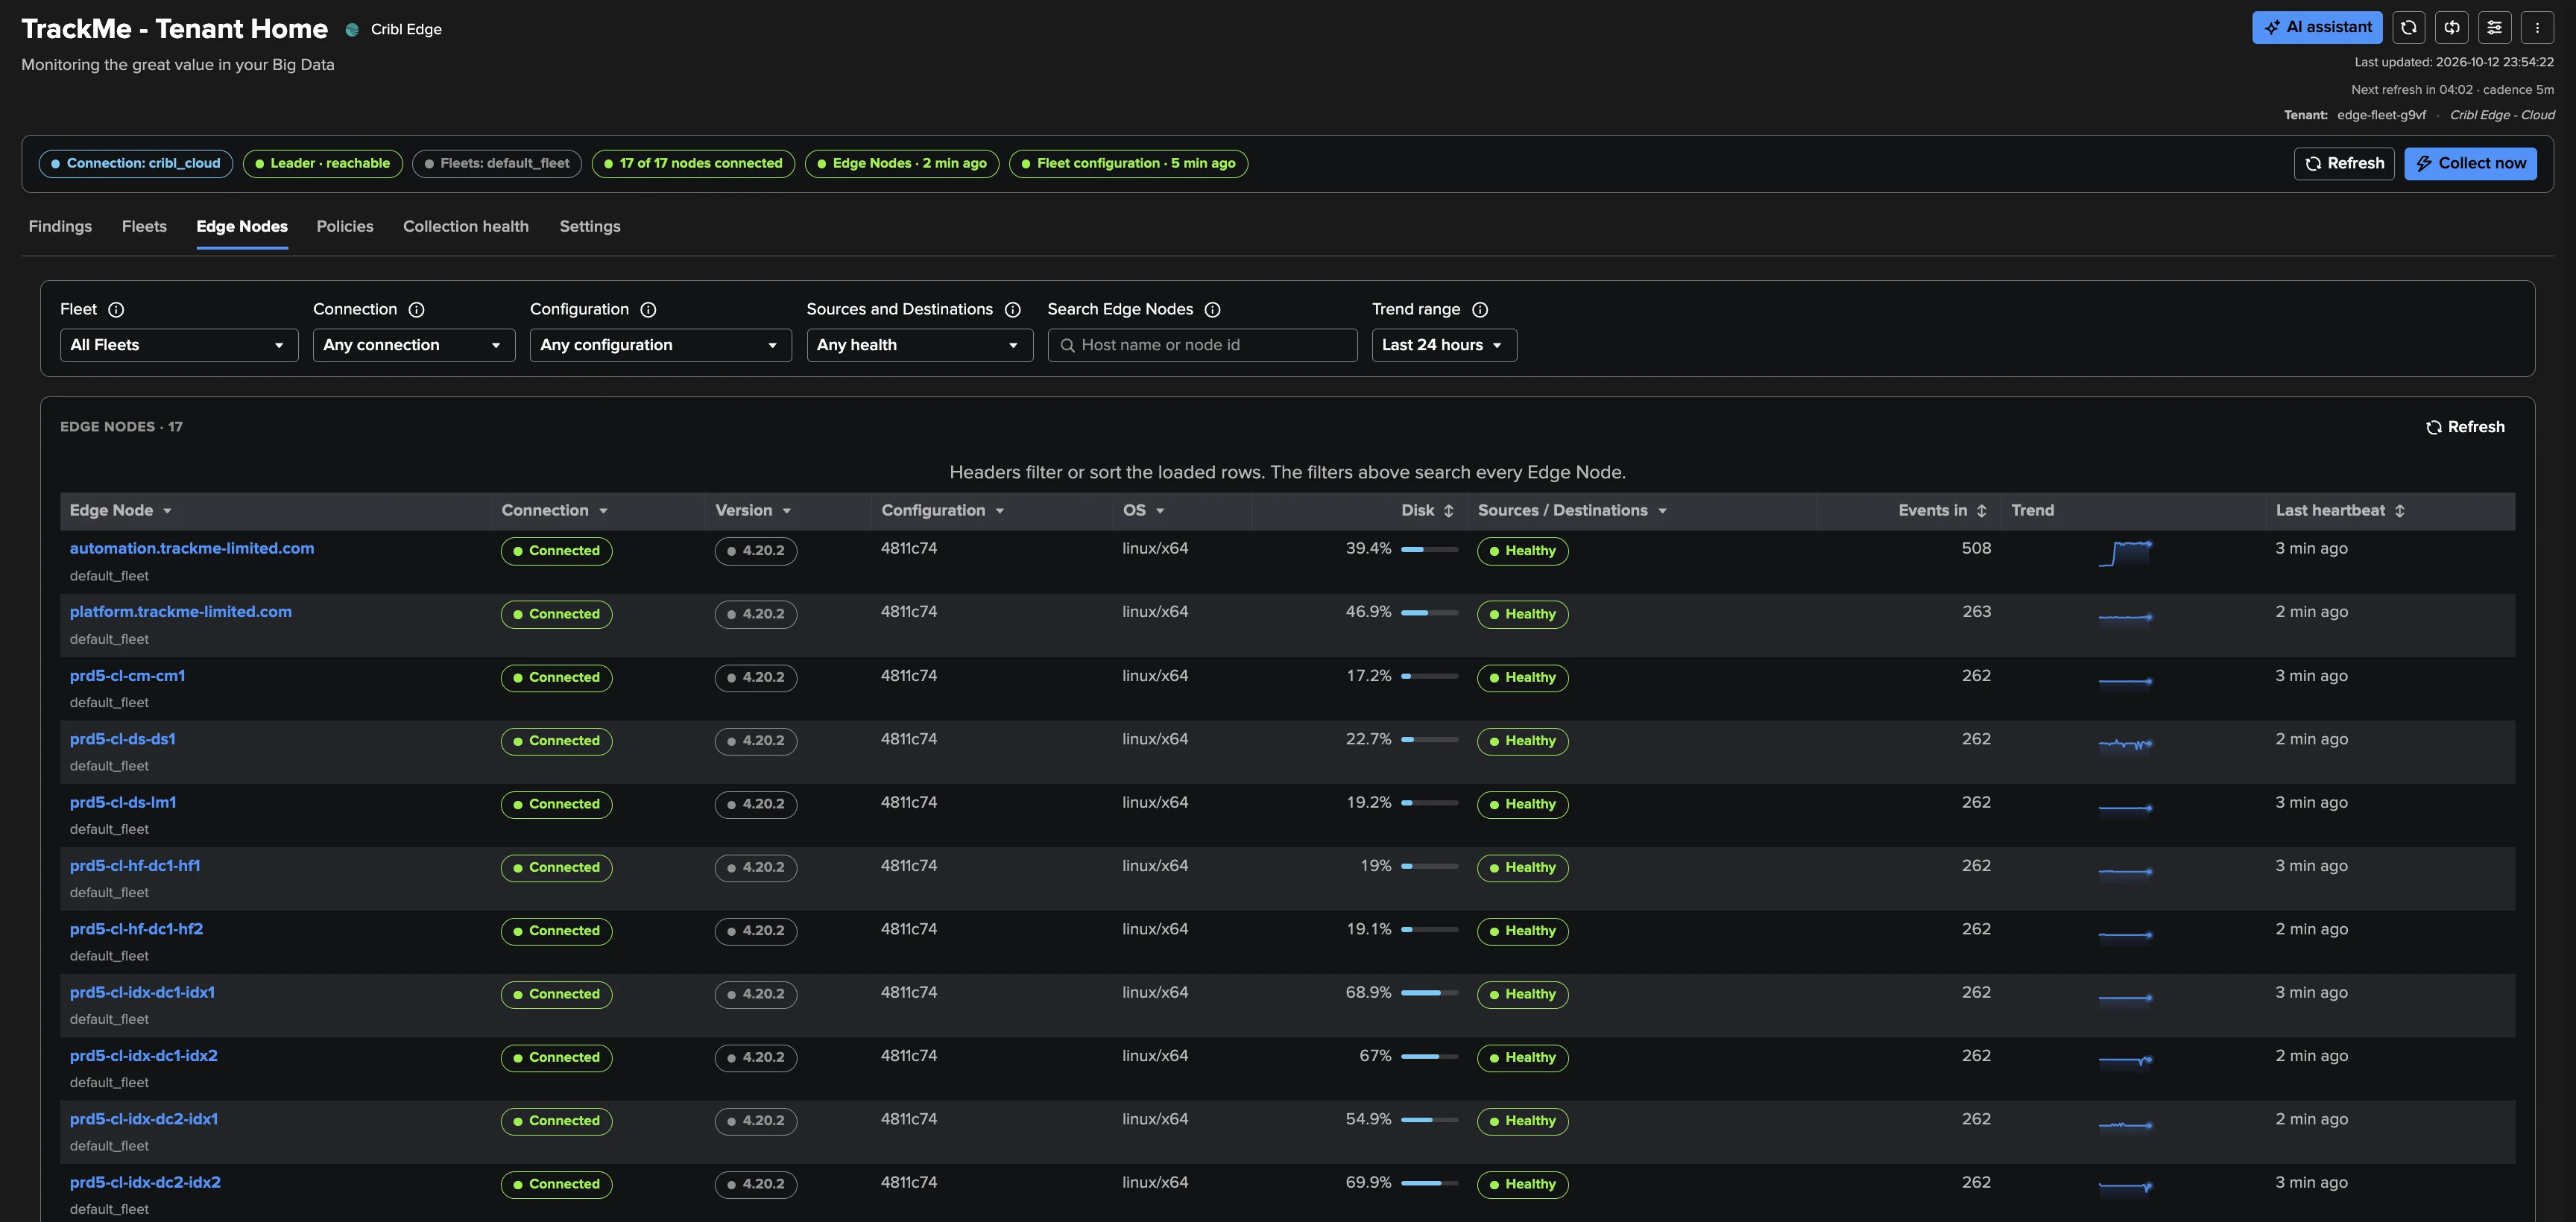
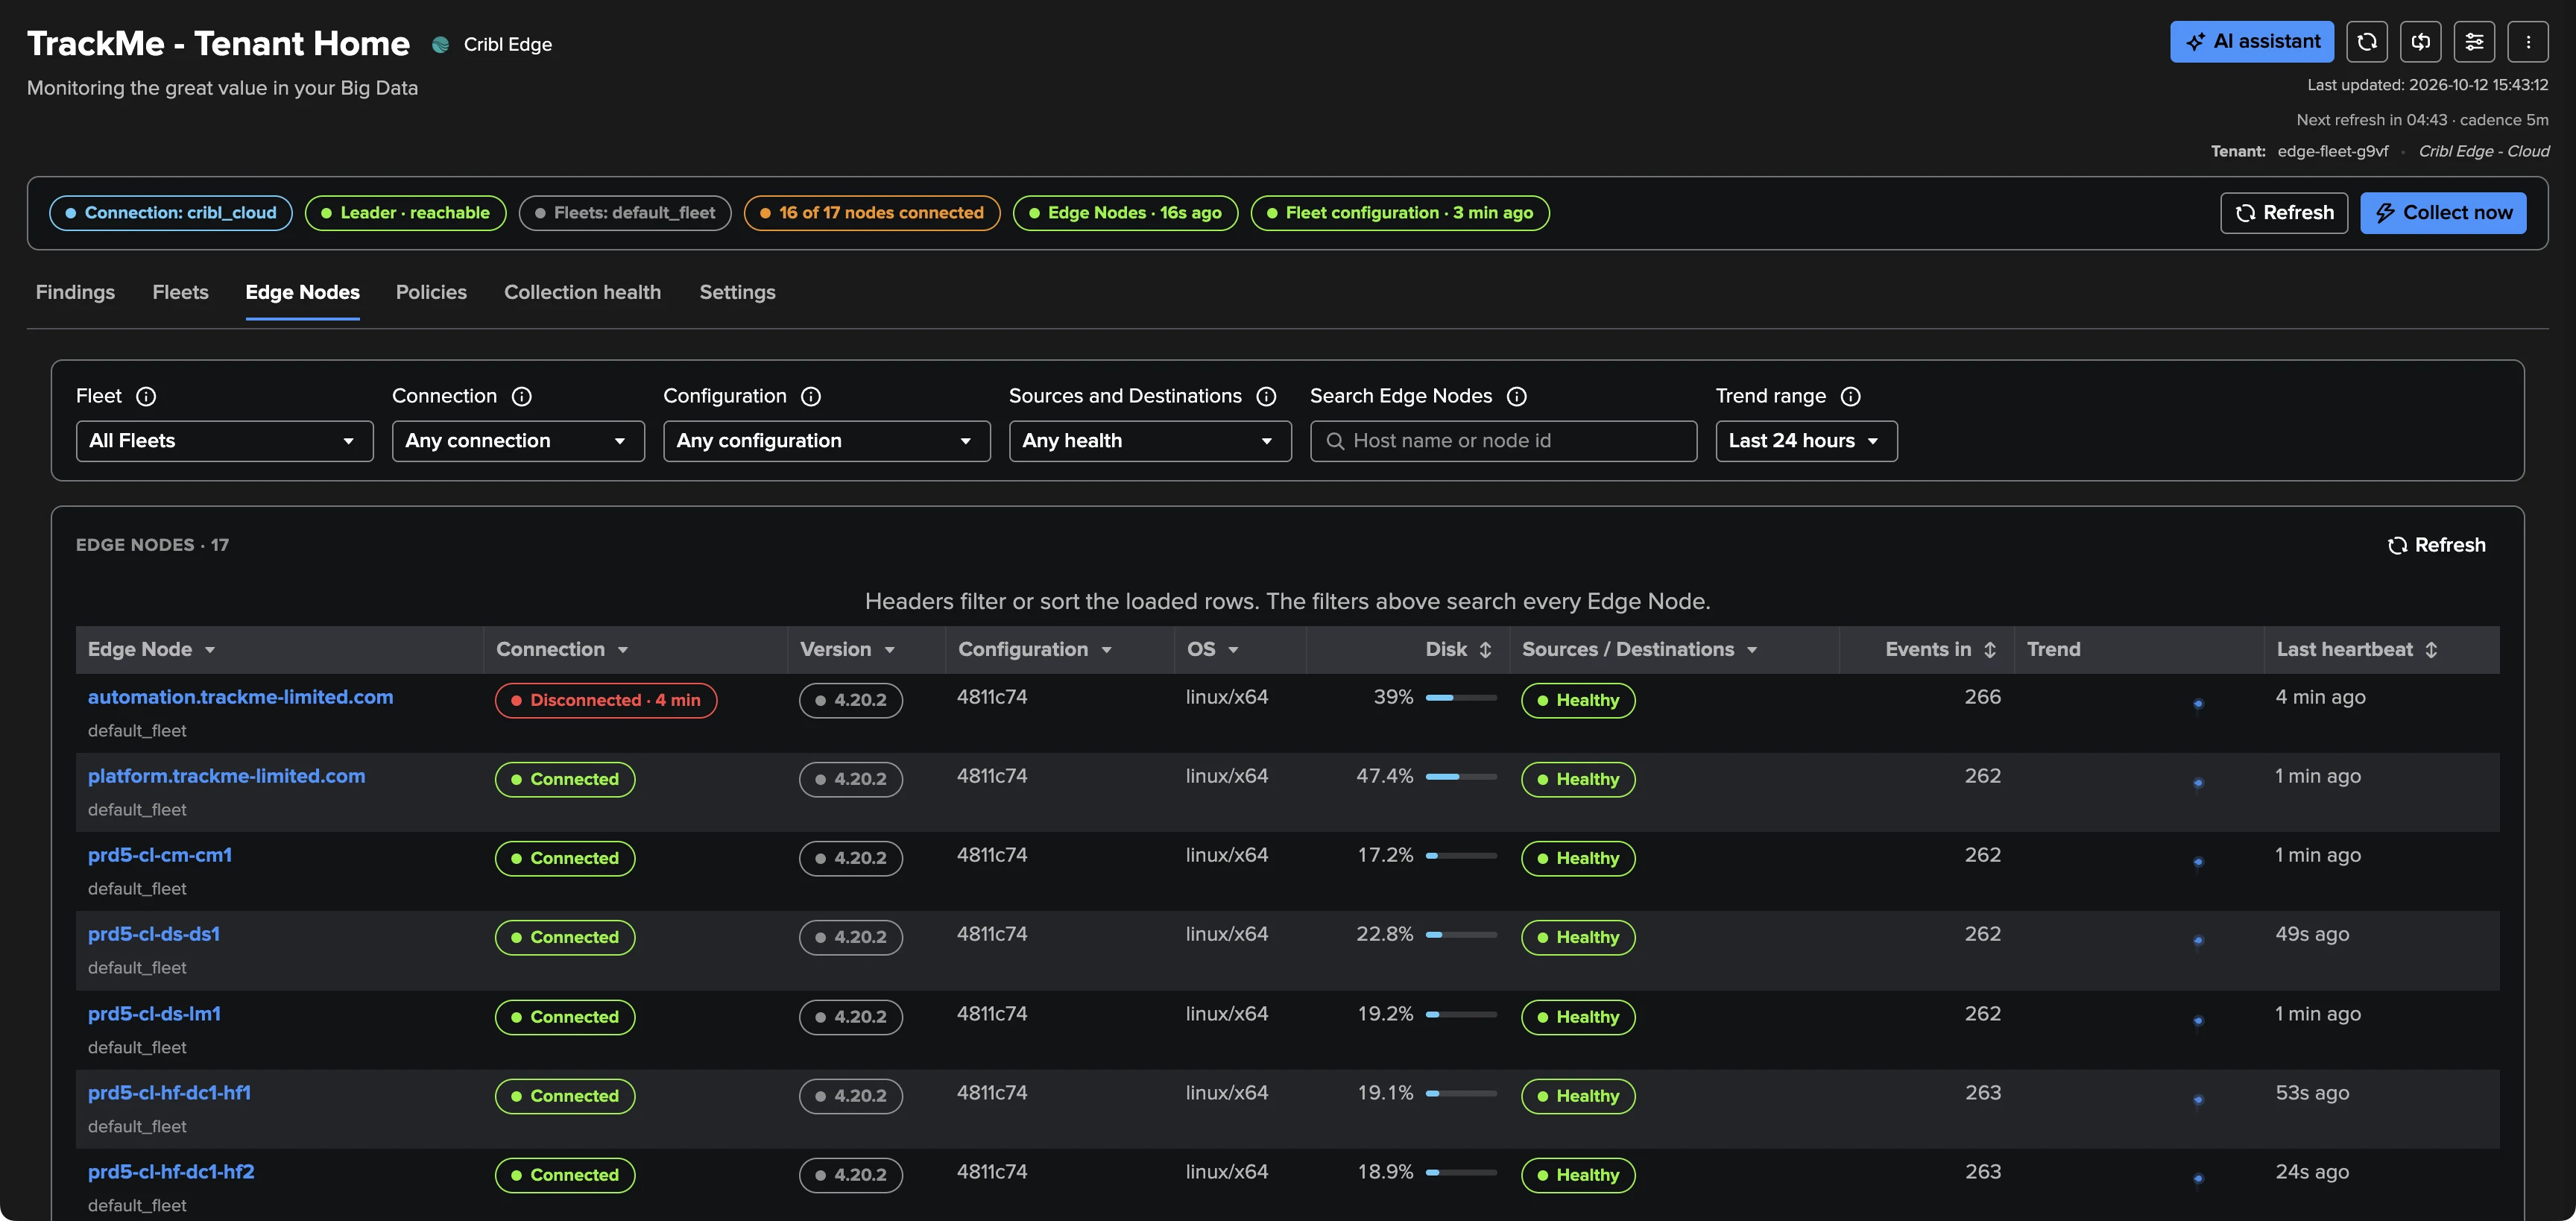
Every Edge Node of the selected Fleets, paged and filtered by the server, so the tab stays fast with any number of nodes. Filters: Fleet, Connection (connected, disconnected, unknown), Configuration (on, not on the Fleet configuration, unknown), Sources and Destinations (the worst health a node reports), a search on host name or node id that applies to every node, and the trend range. The columns: node and Fleet, connection (with how long a node has been disconnected), version, configuration, OS, disk, Sources / Destinations health, events in, trend and last heartbeat.
A node is disconnected when the Leader says so, or when it has sent no heartbeat for five heartbeat periods (10 minutes at least). A connected node whose Leader record carries no metric shows No metrics: its Sources, Destinations and traffic are not measured, and TrackMe never lets that read as healthy.
The Edge Node detail
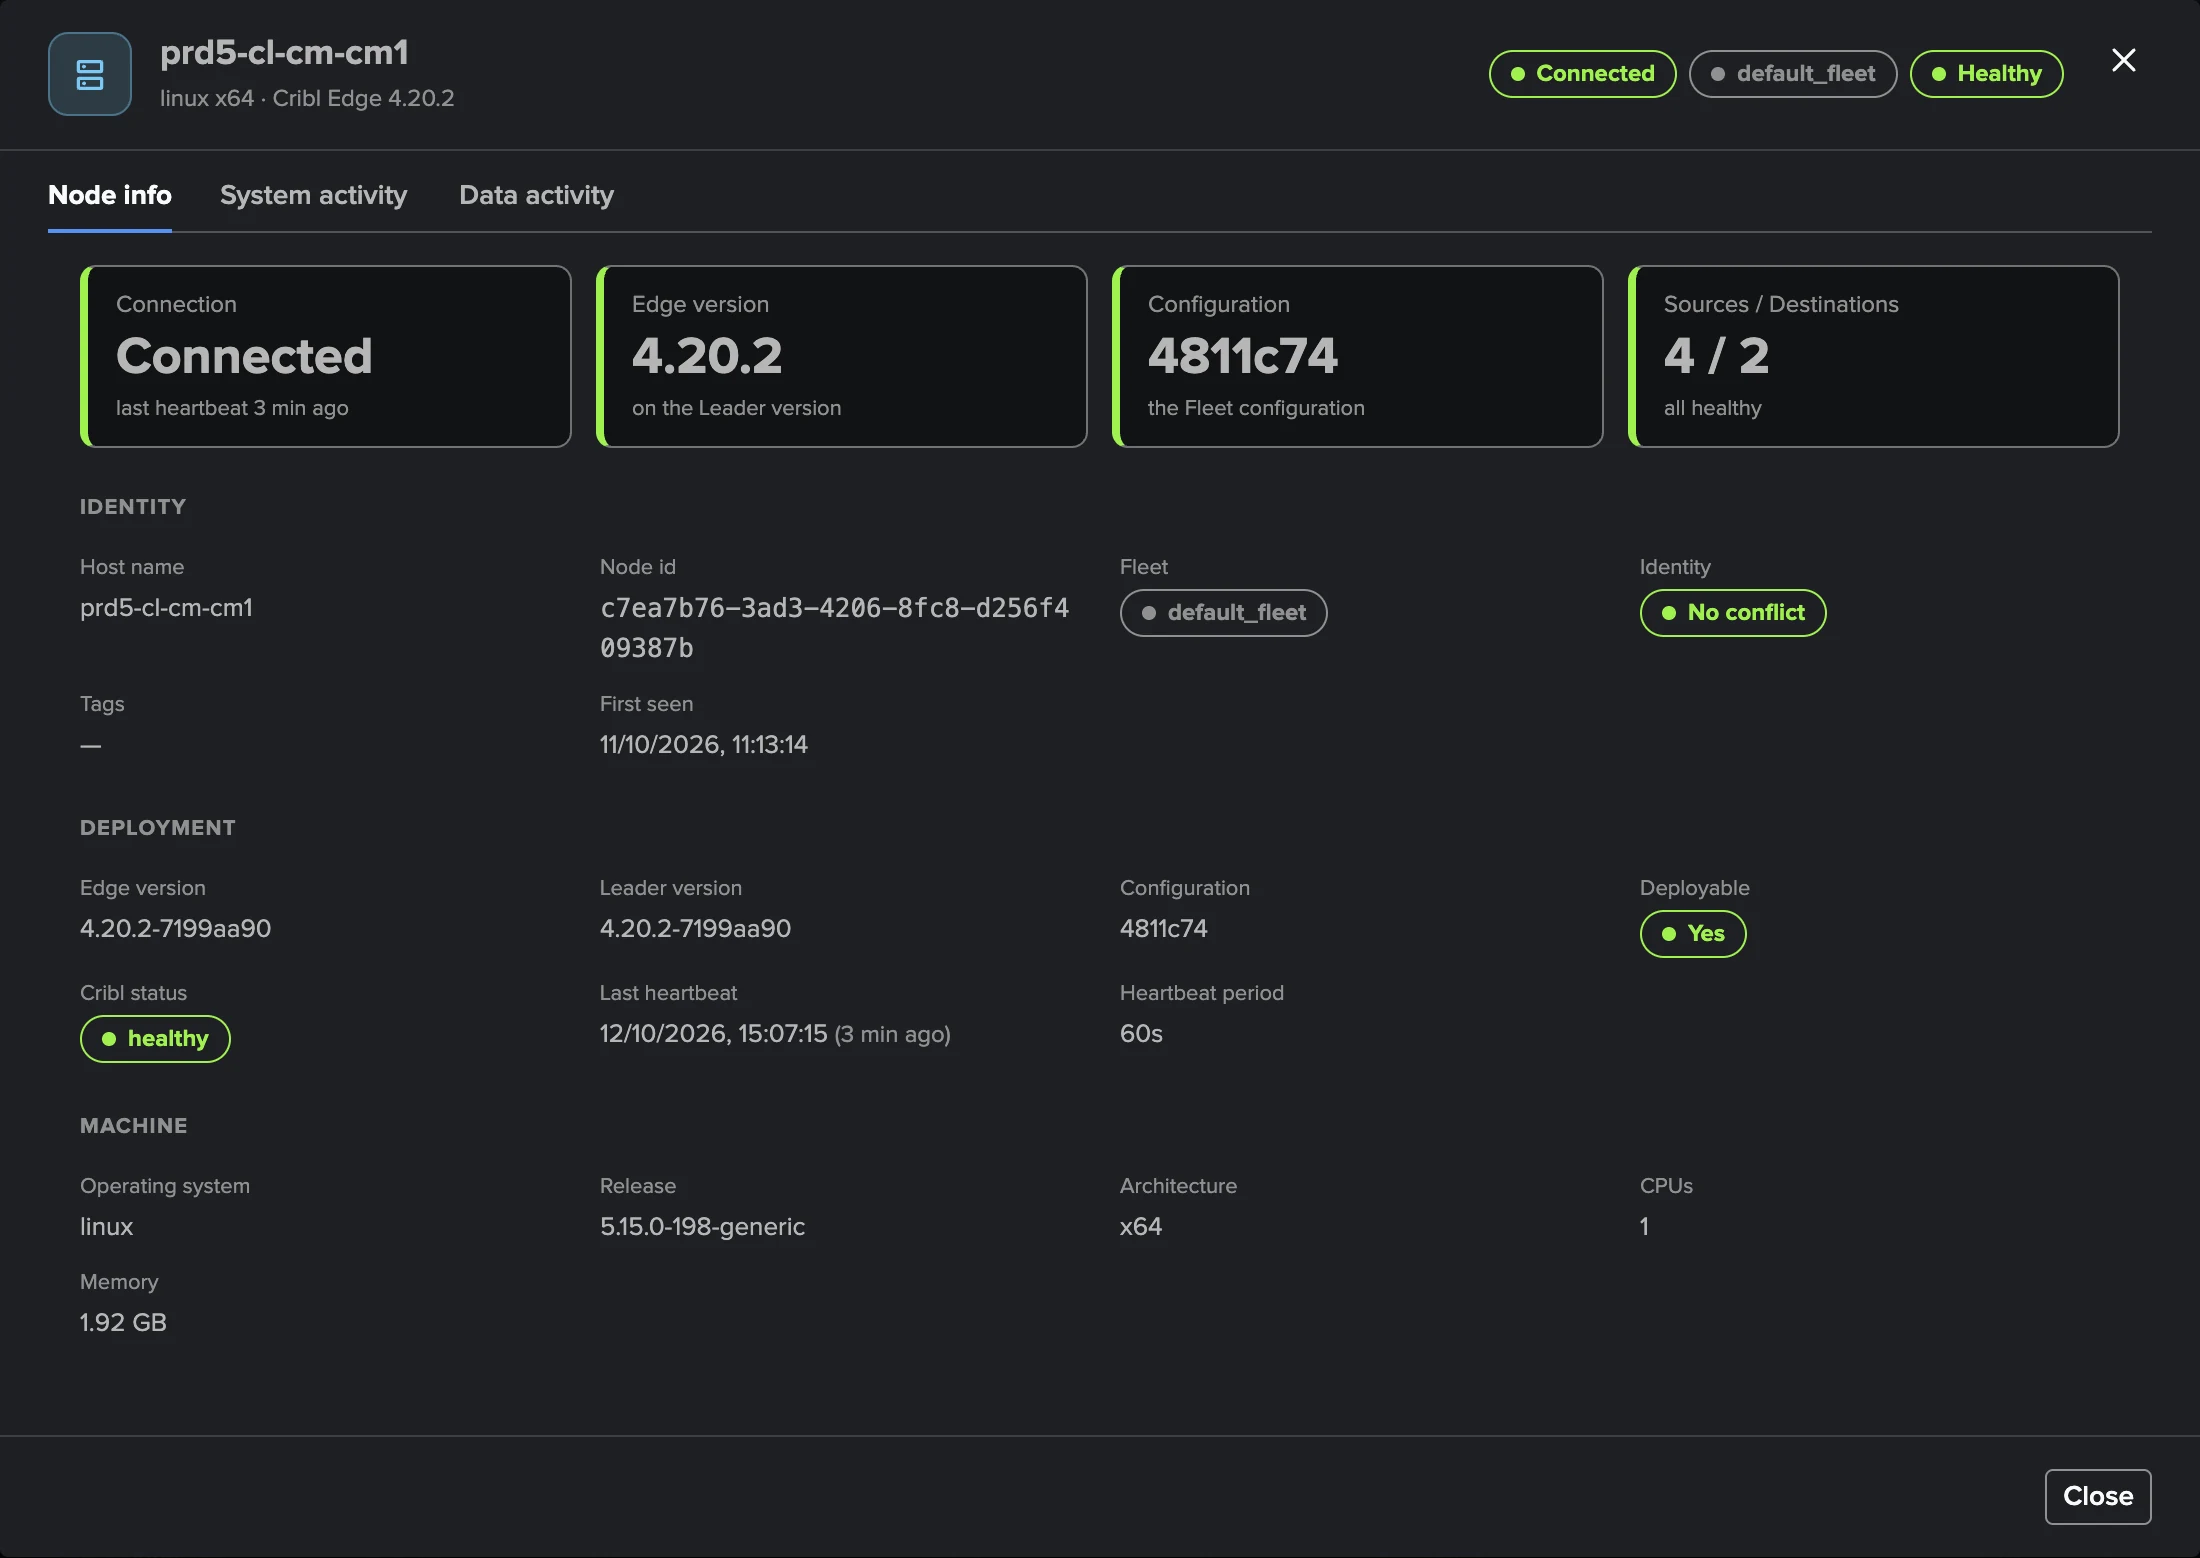
Select a node’s name to open it (its Connection pill opens it on Node info, its Sources / Destinations pill on Data activity). The header names the node (its host name, else its node id), its OS and Edge version, and carries three pills: the connection (Connected / Disconnected), the Fleet, and the worst health of its Sources and Destinations (Healthy, Warning, Trouble — or No metrics). Three tabs follow.
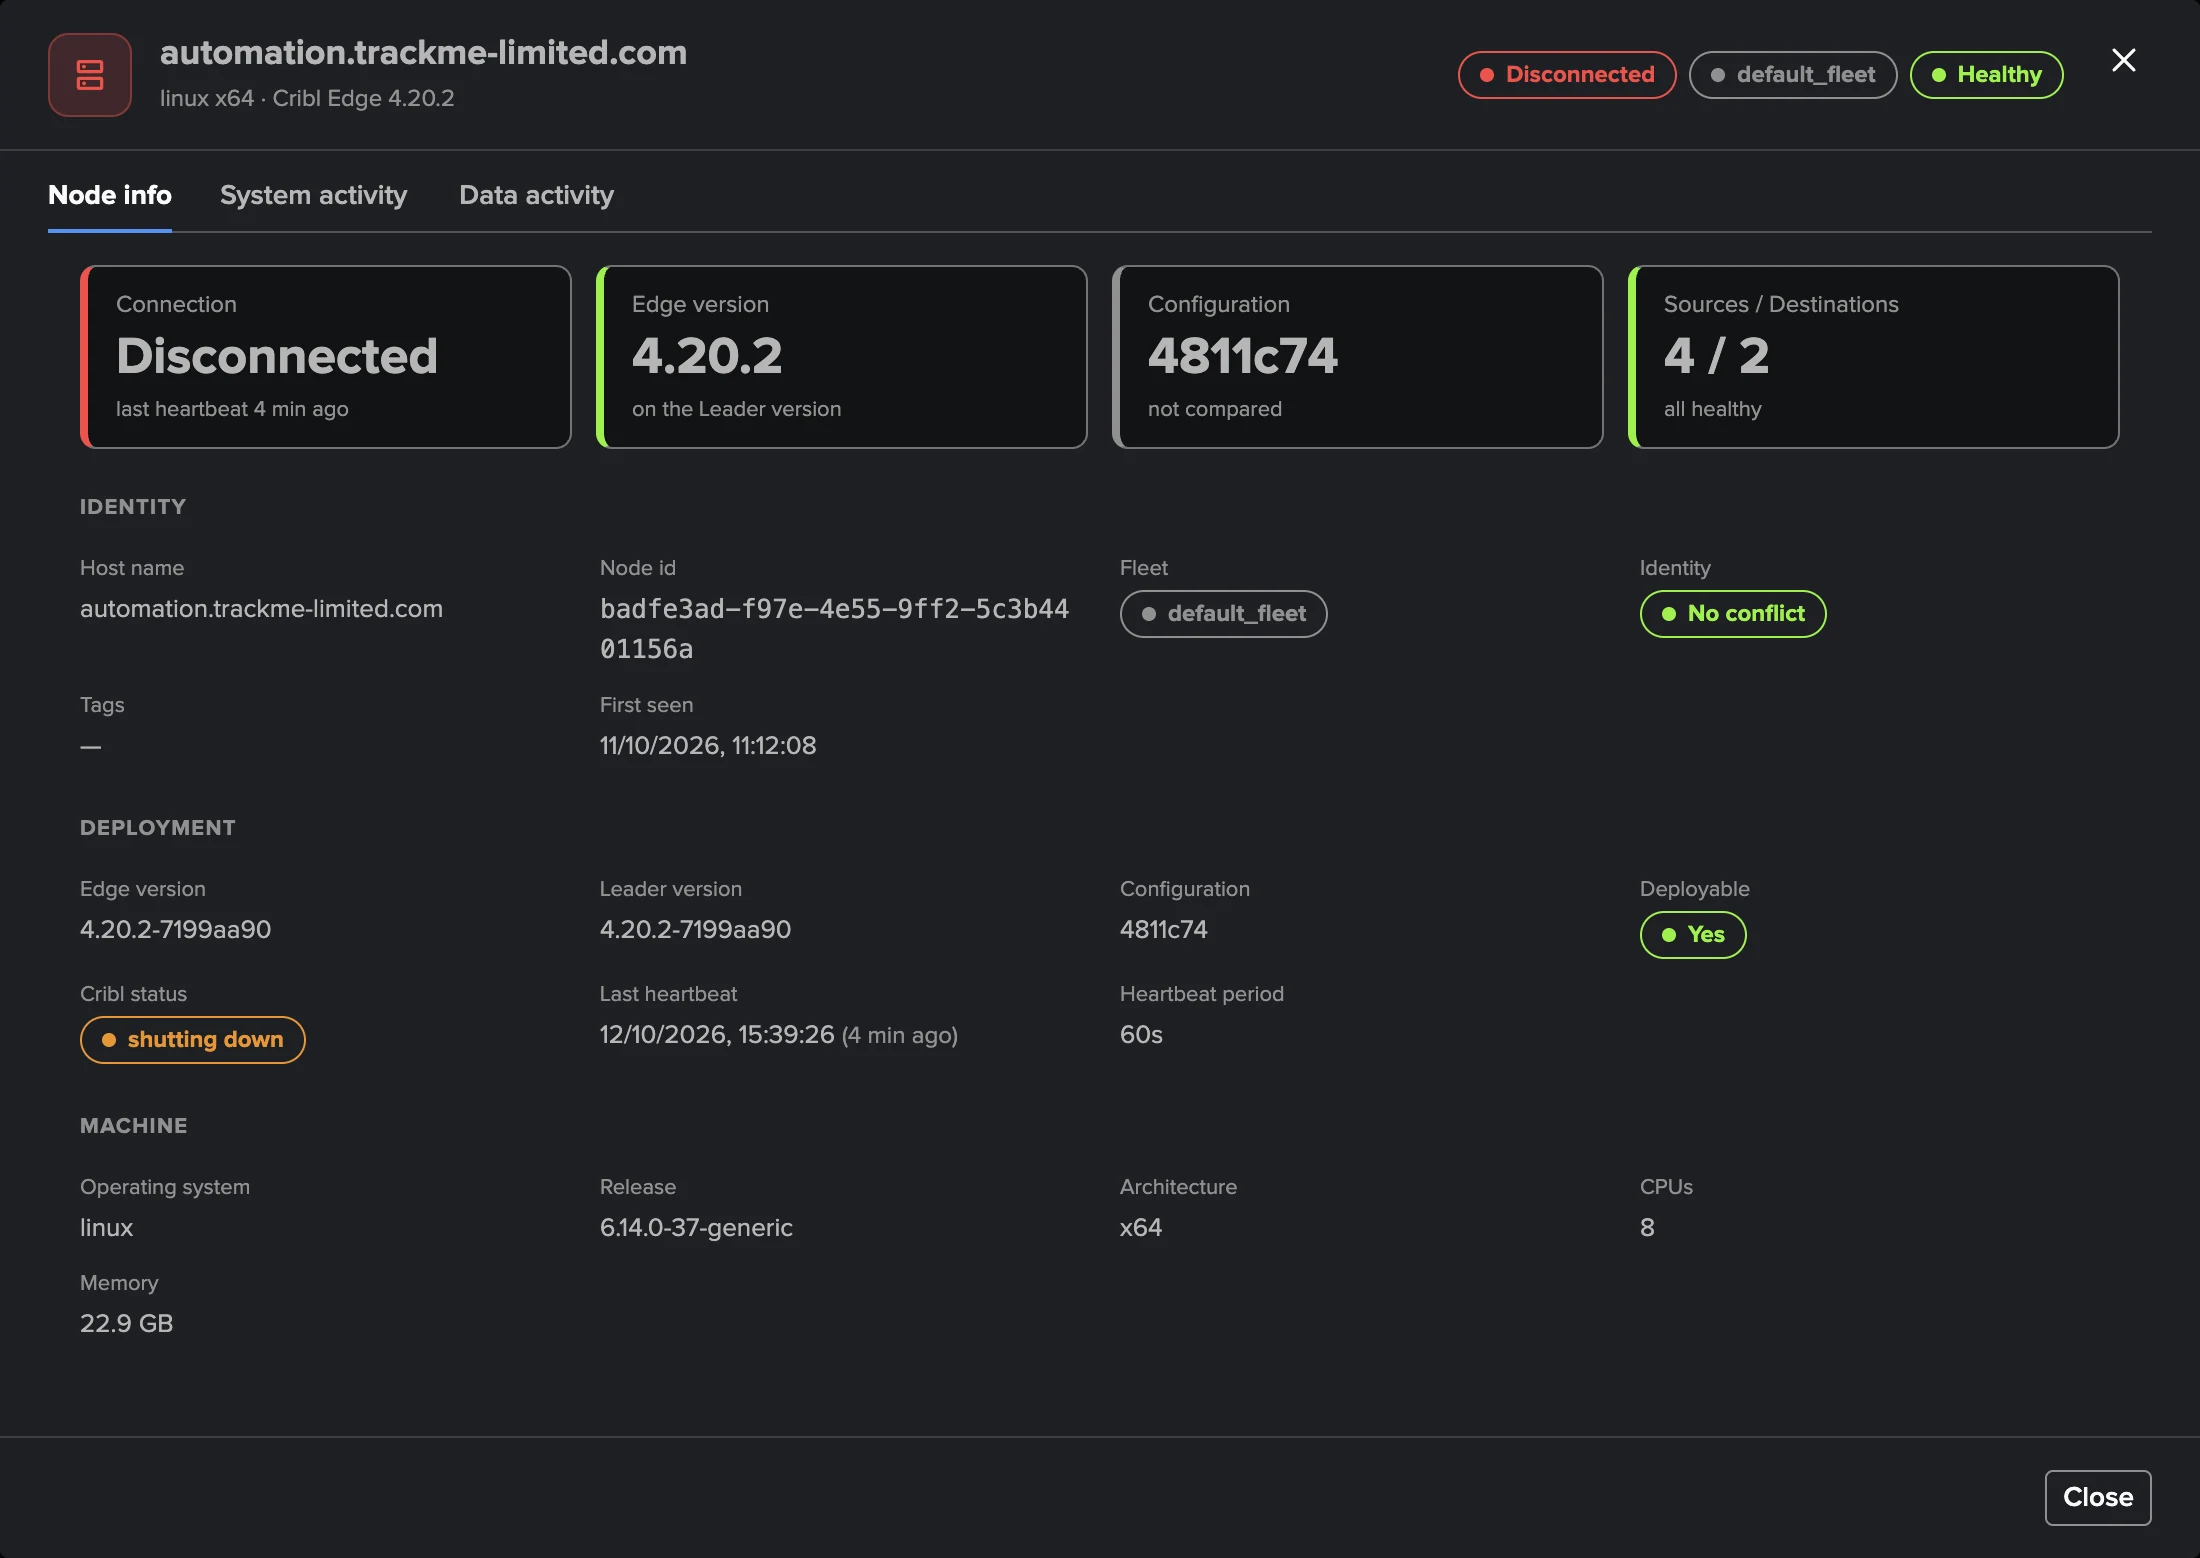
Node info — four tiles: Connection (with the last heartbeat), Edge version (compared with the Leader’s, flagged when newer than the Leader or two minor versions behind), Configuration (compared with the Fleet’s target) and Sources / Destinations (how many, how many unhealthy). Then three blocks of facts: Identity (host name, node id, Fleet, whether another node id reports the same host name or the host name keeps changing, tags, first seen), Deployment (Edge and Leader versions, configuration, deployable, Cribl status, last heartbeat, heartbeat period) and Machine (operating system, release, architecture, CPUs, memory).
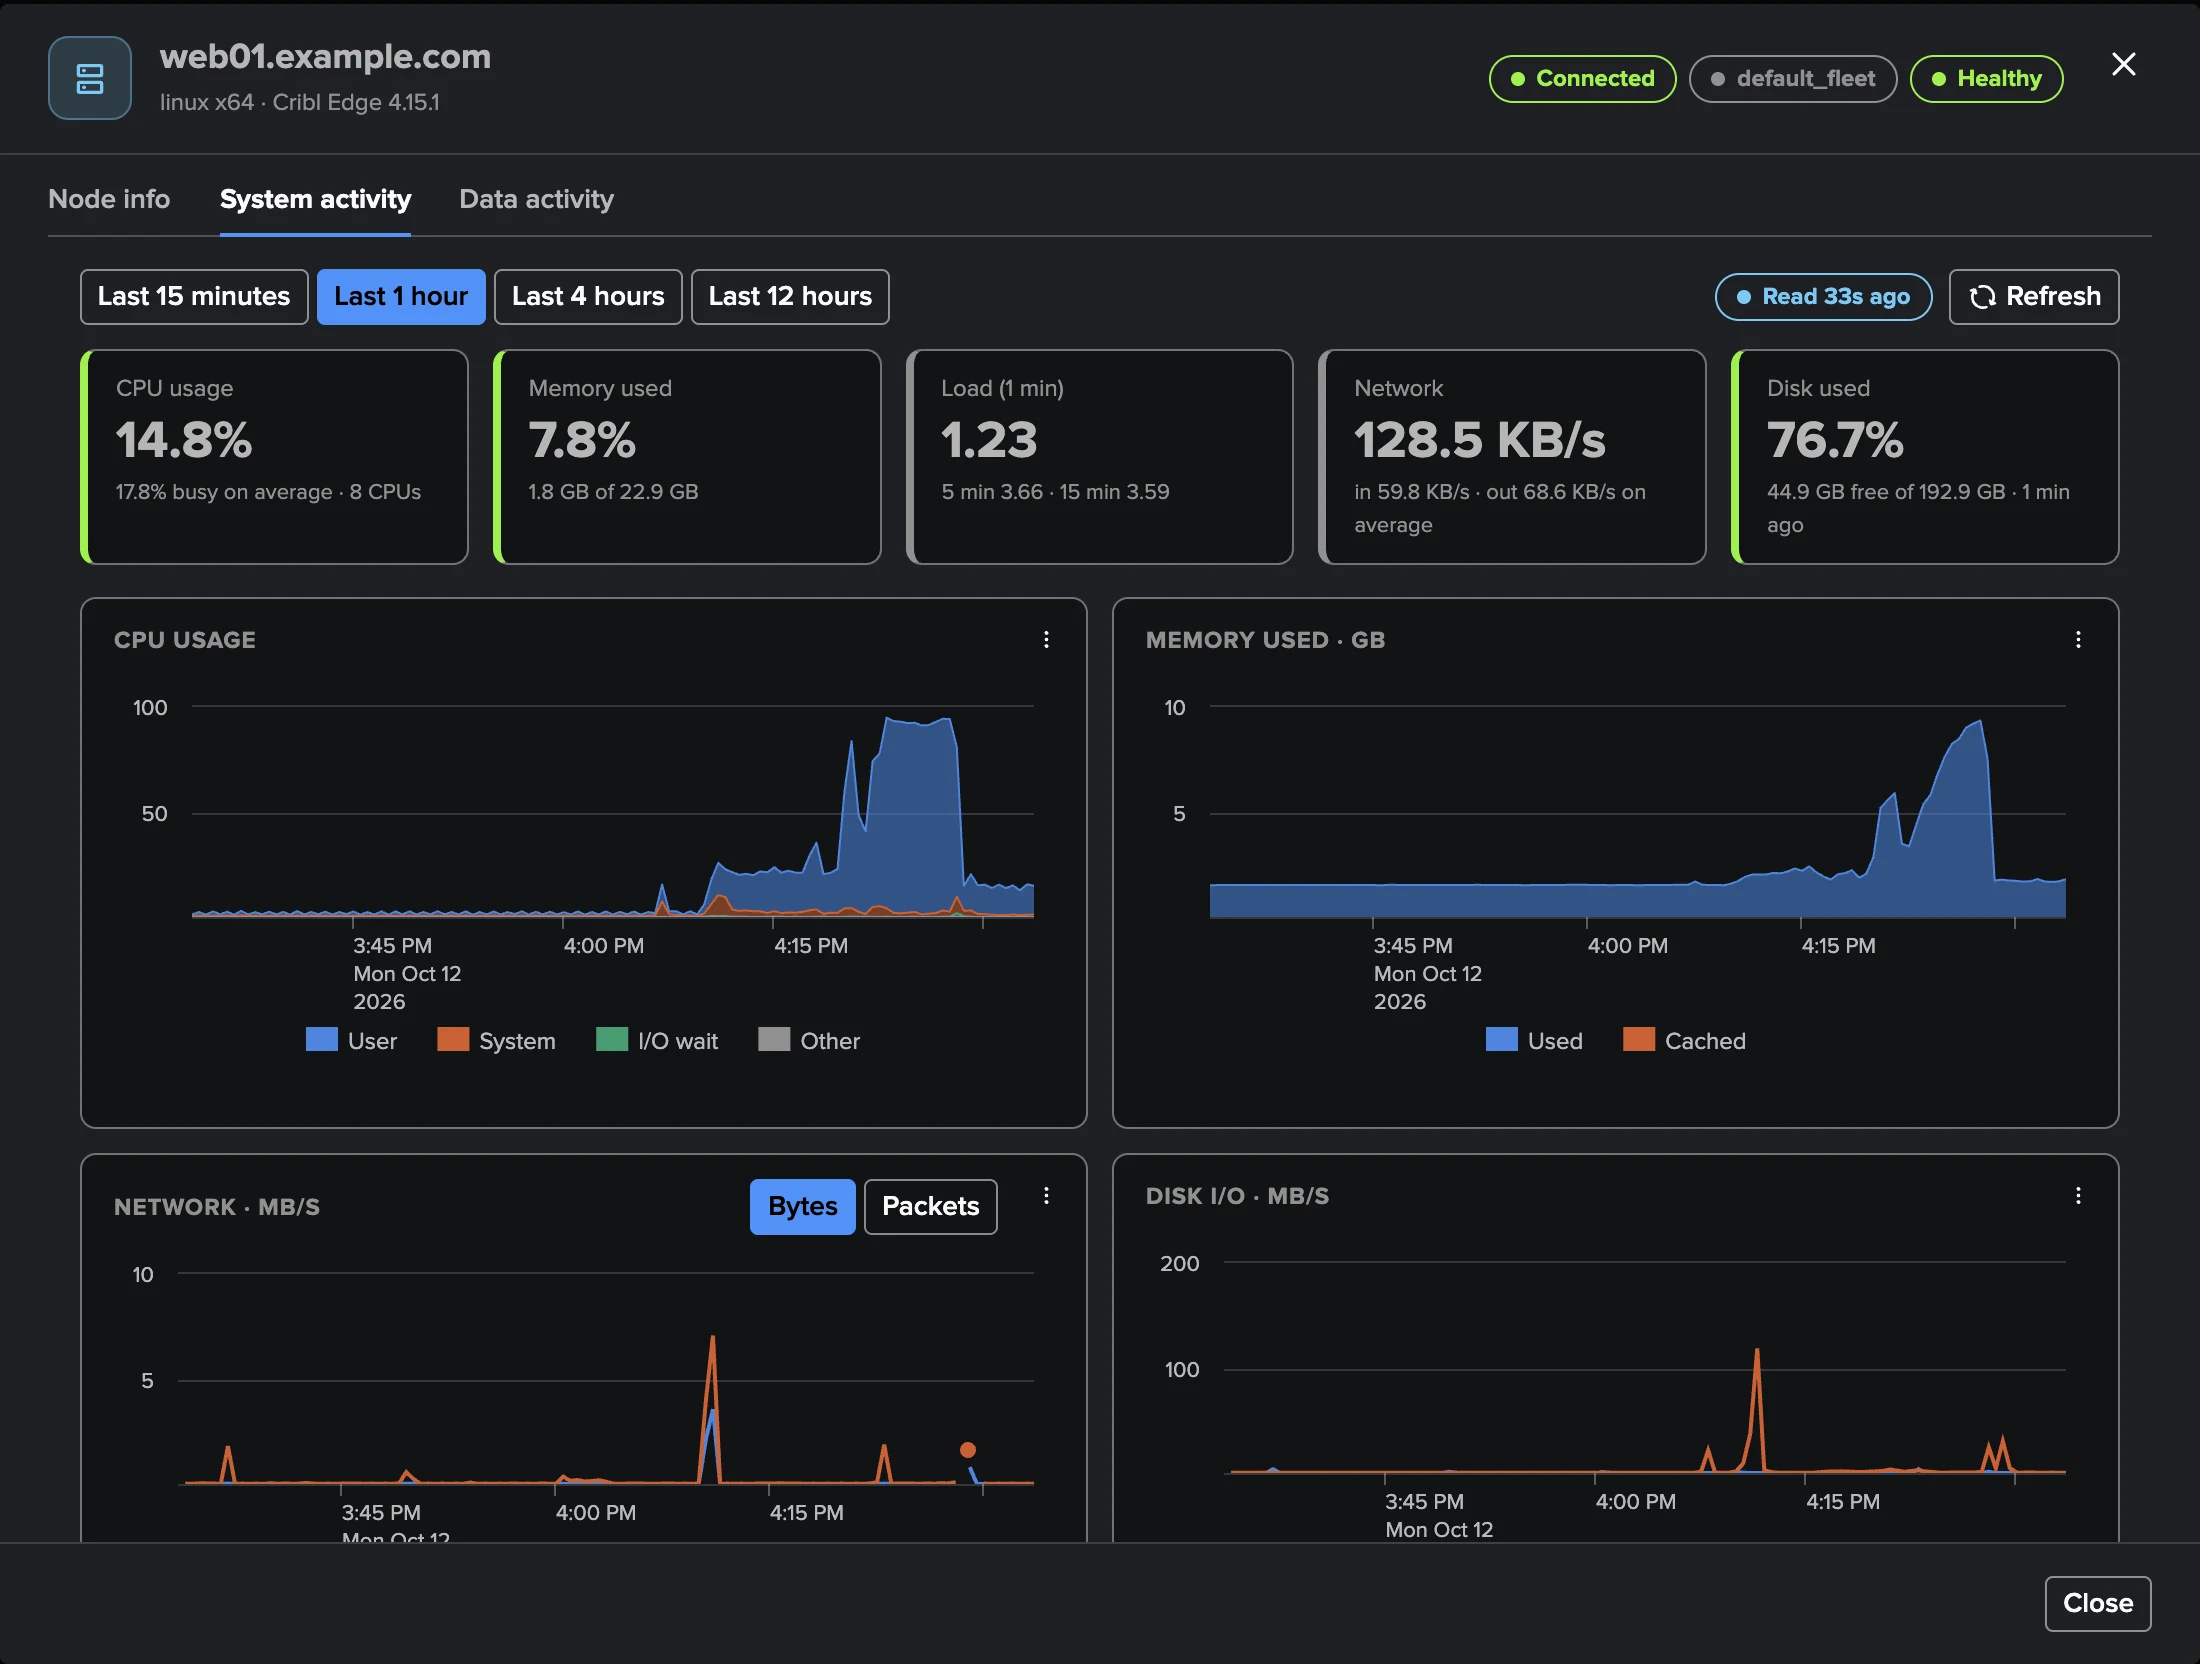
System activity — what Cribl’s own System Activity page shows for this node:
Range: Last 15 minutes, Last 1 hour, Last 4 hours or Last 12 hours, with Read N ago and Refresh.
Tiles: CPU usage (with the average busy share and the number of CPUs), Memory used (used of total), Load (1 min) (with the 5- and 15-minute loads), Network (in and out per second) and Disk used (free of total, from the heartbeat).
Charts, each with its panel menu (View chart data; Open in Search is unavailable, the figures coming from the node rather than a Splunk index): CPU usage stacked by mode (User, System, I/O wait, Other — a single Busy line when the Fleet’s System Metrics run in Basic mode), Memory used (Used, Cached), Network per second (Received, Sent; a Bytes / Packets toggle), Disk I/O per second (Read, Written), Load average (1, 5, 15 min) and Processes and threads. Units follow the values (KB/s, MB/s…).
Facts: CPU (CPUs, processes and threads, busy and idle, the share of each mode, the three loads), Memory (total, used and available, cached, swap) and Network and disk (sent and received, packets, disk read and written).
Disk used · TrackMe history: the disk of this node over any period, from the history TrackMe keeps for every node.
Where these figures come from. CPU, memory, network, disk I/O, load and processes are read live from the node itself, through the Cribl Leader: each Edge Node keeps its own store of its system metrics (at 10-second resolution, about the last 10 hours), and TrackMe queries that store — the same query Cribl’s System Activity page makes — when you open the tab or change the range. It does not use the tenant’s System Metrics index, and needs no System Metrics forwarded to Splunk. Nothing is read for a node nobody opens, so the fleet-wide collection stays one bulk read whatever the fleet size. A node whose System Metrics source is off in its Fleet keeps no such store: TrackMe then reads its current figures only (CPU, memory, load, uptime), without charts. The disk is different: it comes with every heartbeat, for every node, and TrackMe keeps its history. A disconnected node cannot be read.
A read asked by a TrackMe administrator of the tenant starts at once (a search reads the node and the tab follows it); any other role’s read is served by the next live run, within 5 minutes. The reads are counted in the Leader’s request budget, at most one per node and range a minute.
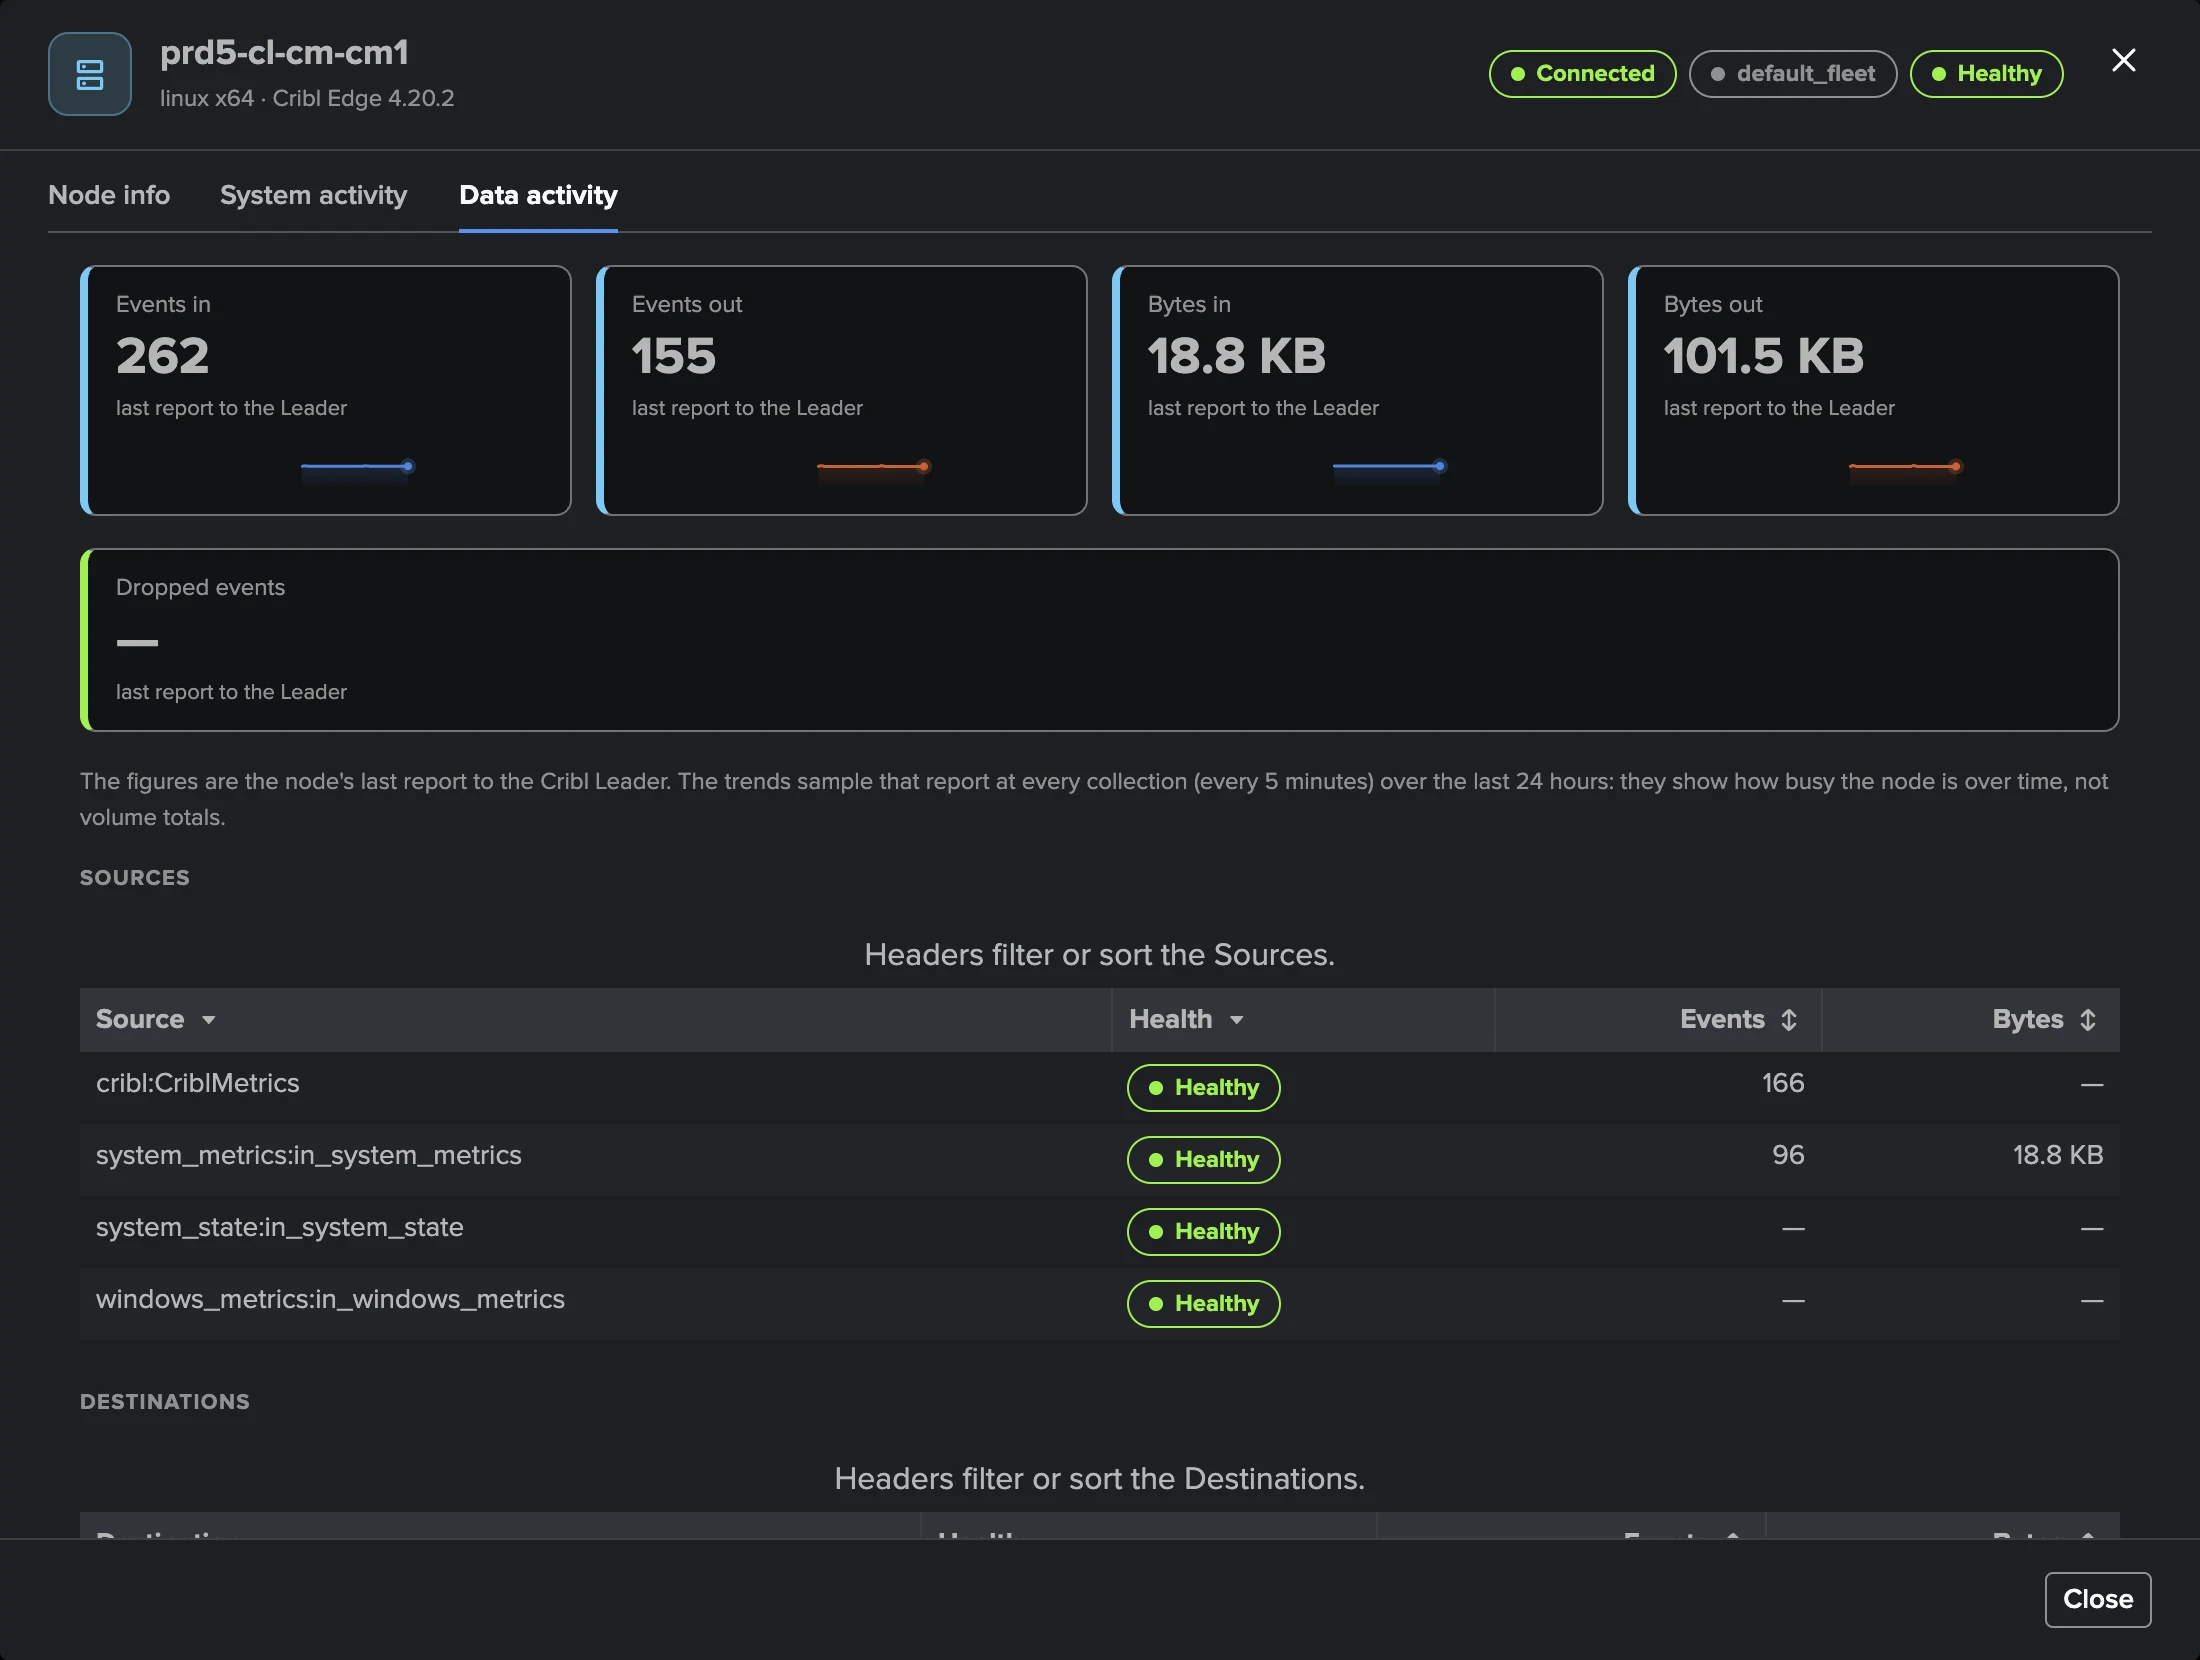
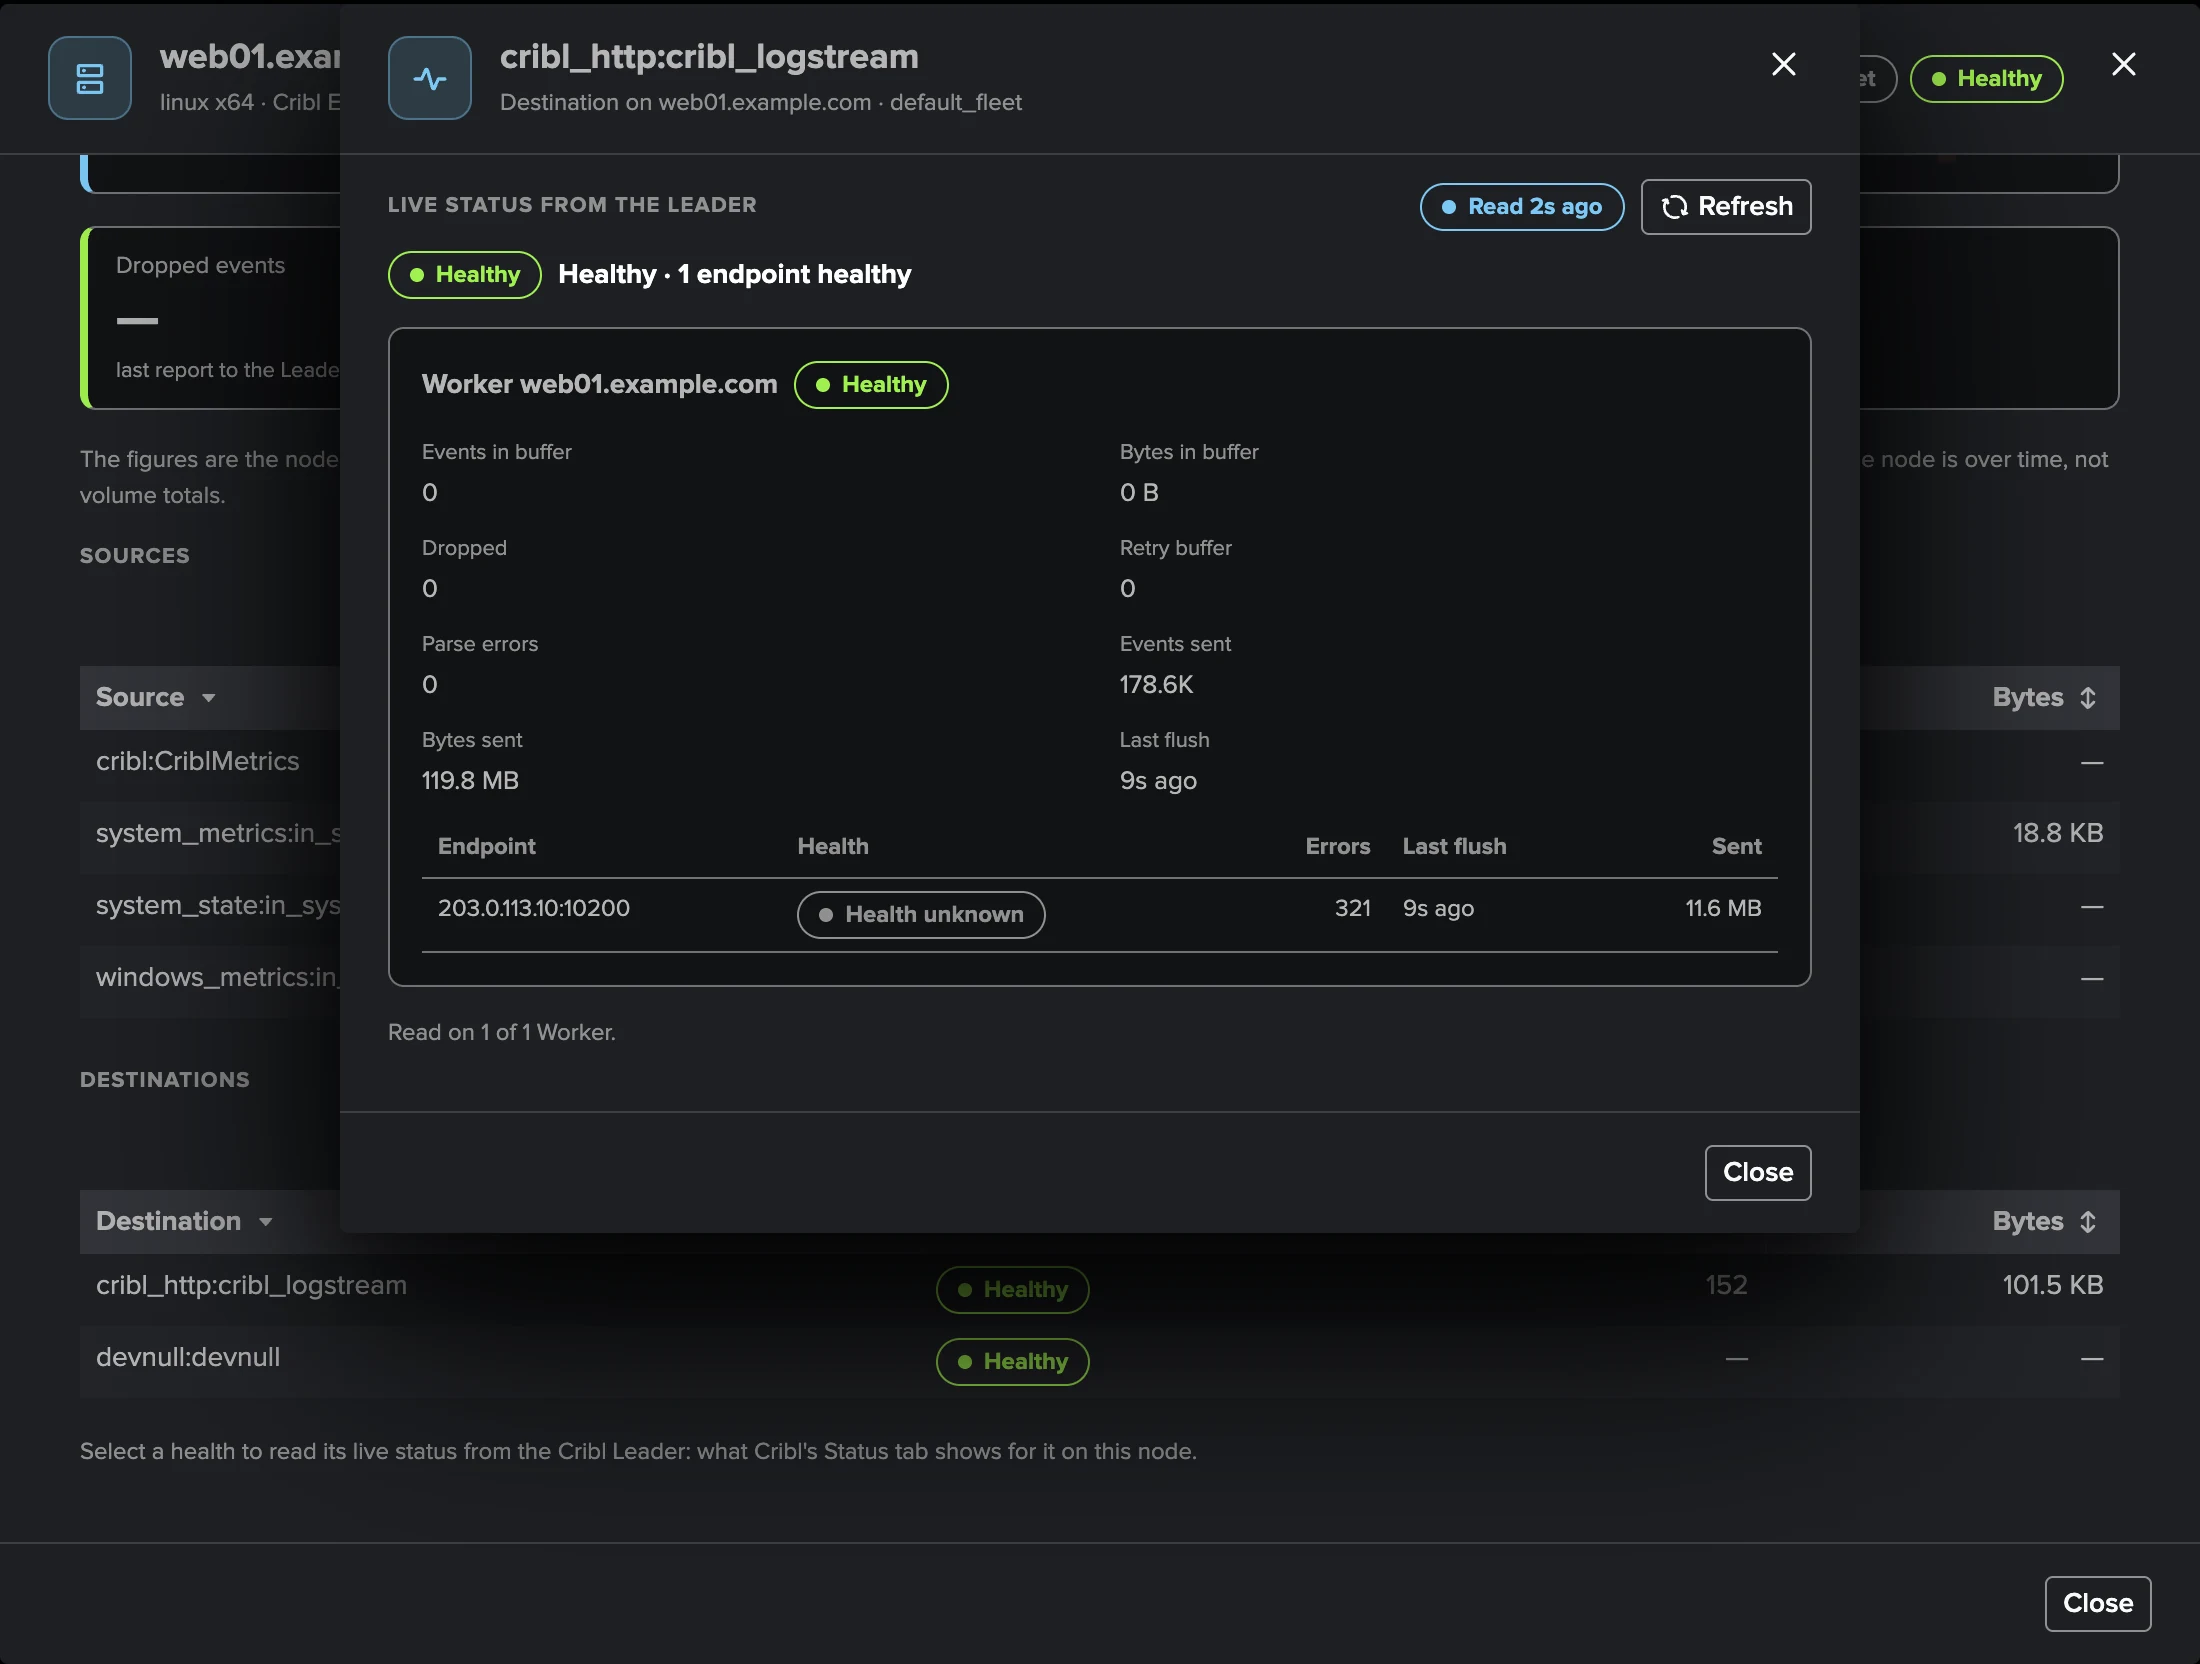
Data activity — four traffic tiles (events and bytes in and out) with their 24-hour trends and Dropped events, all from the node’s last report to the Leader; then the node’s Sources and Destinations with their health (Healthy, Warning, Trouble) and traffic. Select a health to read the live status of that Source or Destination on that node from the Leader, as Cribl’s Status tab shows it.
Policies
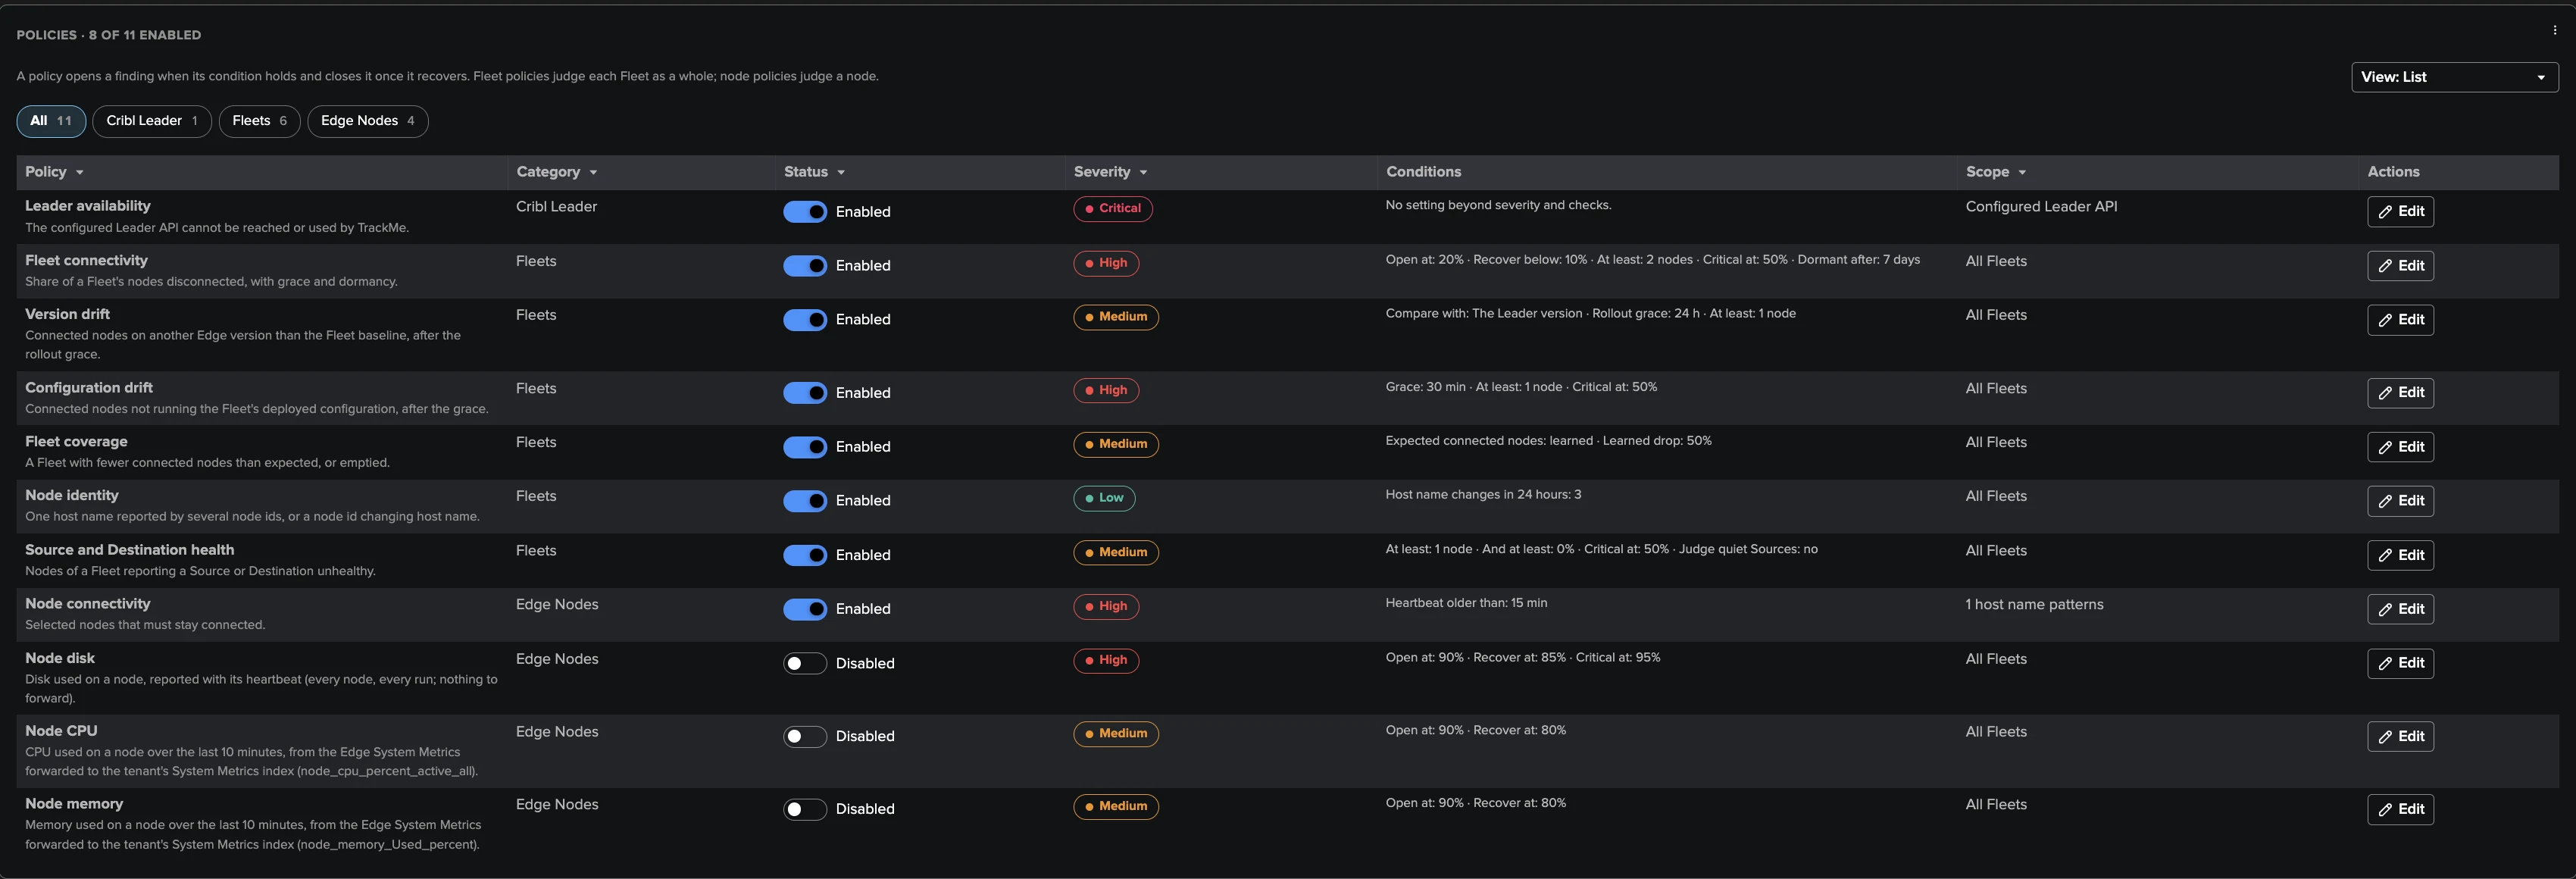
The catalogue of the eleven built-in policies, in three categories: Cribl Leader, Fleets and Edge Nodes. Show them as cards, compact cards or a list (the choice is shared with the Cribl Stream workspace). Each policy shows its severity, its conditions and its scope; a TrackMe administrator of the tenant turns it on or off and opens its editor:
Policy: on / off, severity, the checks to open (consecutive failing directory publications, every 5 minutes) and the checks to recover;
Conditions: the policy’s own thresholds and graces, each with its help;
Scope: the Fleets it applies to (empty: every Fleet of the tenant);
Bank holidays: whether a bank holiday of the tenant’s calendars holds the policy’s new findings (Hold new findings or Keep opening findings; see Bank holidays).
Two pills tell what a policy is waiting for: Needs nodes on Node connectivity until you select the nodes that must stay connected (see Nodes that must stay connected), and Needs System Metrics on Node CPU and Node memory until the tenant has a System Metrics index (their editor shows the steps). Eight policies are on out of the box; Node disk, Node CPU and Node memory are off: node resource monitoring is a choice, because a fleet of endpoints would otherwise open a finding per full disk on day one. The full catalogue with every default is in Built-in policies.
Nodes that must stay connected
Fleet connectivity judges shares of a Fleet, so one node going down opens nothing on its own. For the nodes that must never drop (servers, collectors), Node connectivity opens a finding about the node itself. Its editor selects them from two sources that add up, case-insensitive:
Host names typed in the policy, one per line;
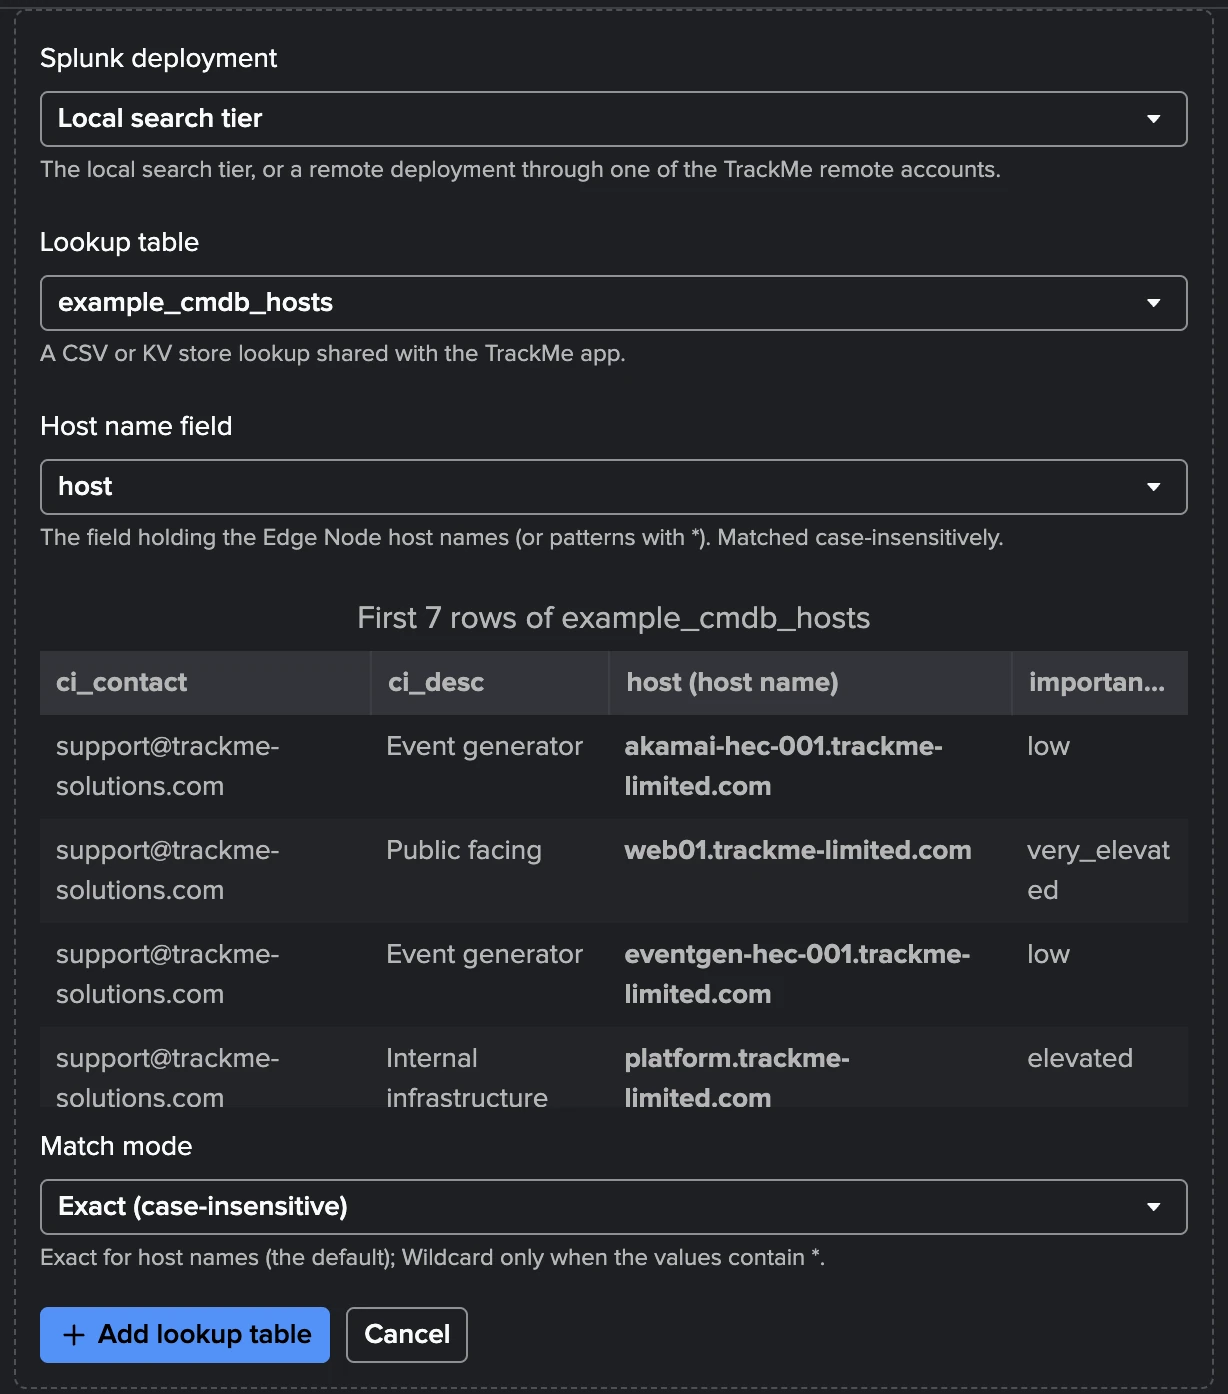
*stands for any text (dc-*). There is no count limit.Lookup tables from Splunk, for long or changing lists such as a CMDB extract: Add a lookup table picks the deployment (the local search tier or a remote deployment through a TrackMe remote account), the lookup and the field holding the host names, with a preview of its first 10 rows and the field suggested. Each lookup has a Match mode: Exact (whole host names, the default) or Wildcard (
*matches any text). A lookup holds up to 500,000 host names and is read again every 15 minutes; one that cannot be read keeps its last host names, and Collection health says so (node_lookups_failing).
Test selection checks the result before you save: it runs as a search, reads the lookups now and matches the latest Edge Nodes directory. It shows how many nodes are selected and in which state, what each source gave, the selected nodes with what matched them, and the names that select no node. It saves nothing.
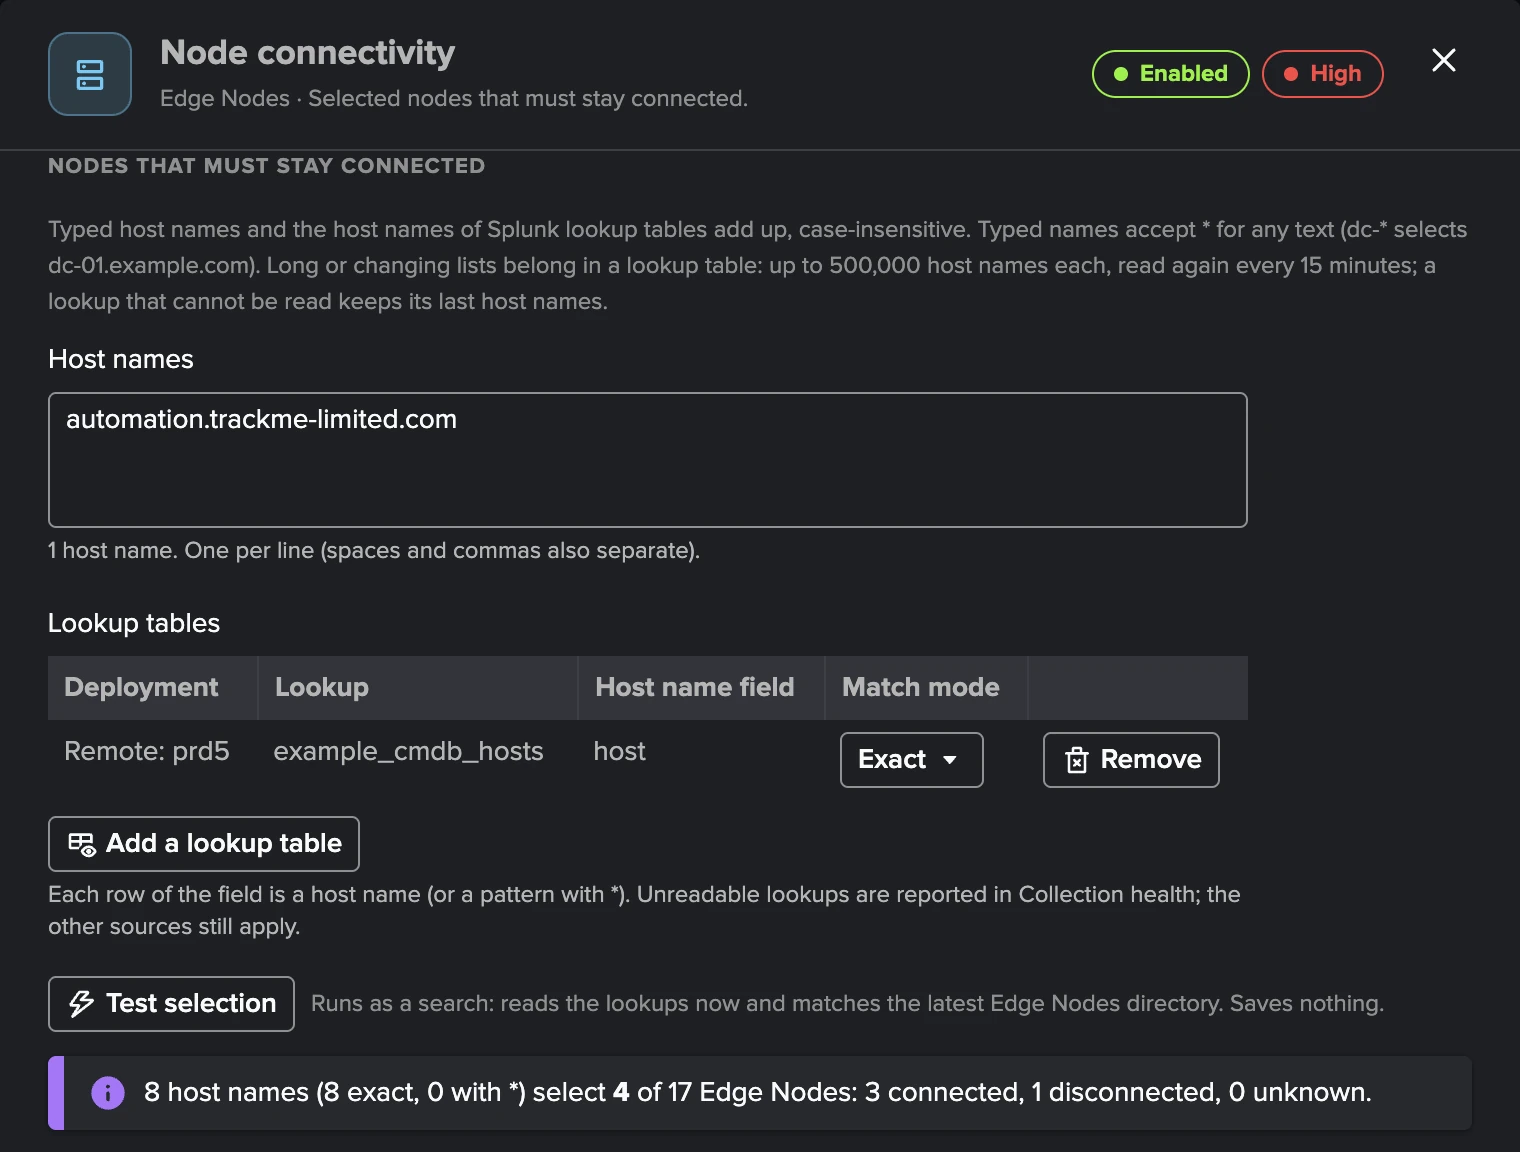
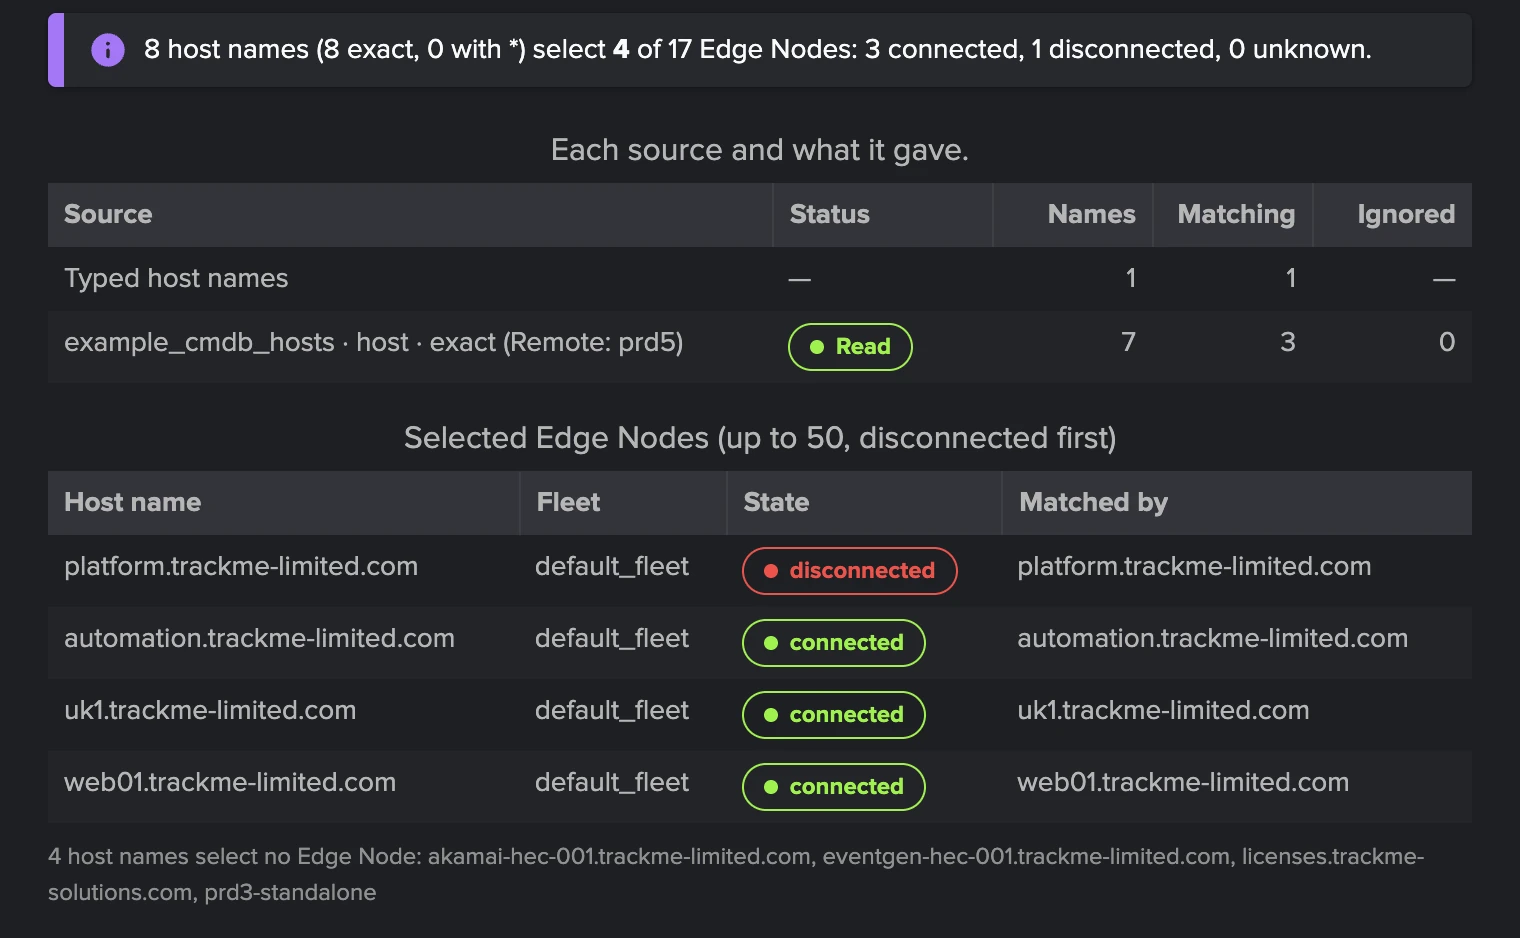
The details and limits are in Built-in policies, section Node connectivity selection.
Bank holidays
A Cribl Edge tenant uses the bank holiday calendars like every tenant: the system default calendars, unless it selects its own or none (Manage Bank Holidays → Tenants & settings, or Configure tenant → Bank Holidays). One of the four holiday effects applies to it, Suppress new alerts, on by default: while a holiday of the tenant’s calendars is active, the policies set to hold open no new finding. Edge has no traffic model, so there is no ML training effect; SLA and monitoring windows have no effect on a Cribl Edge tenant either.
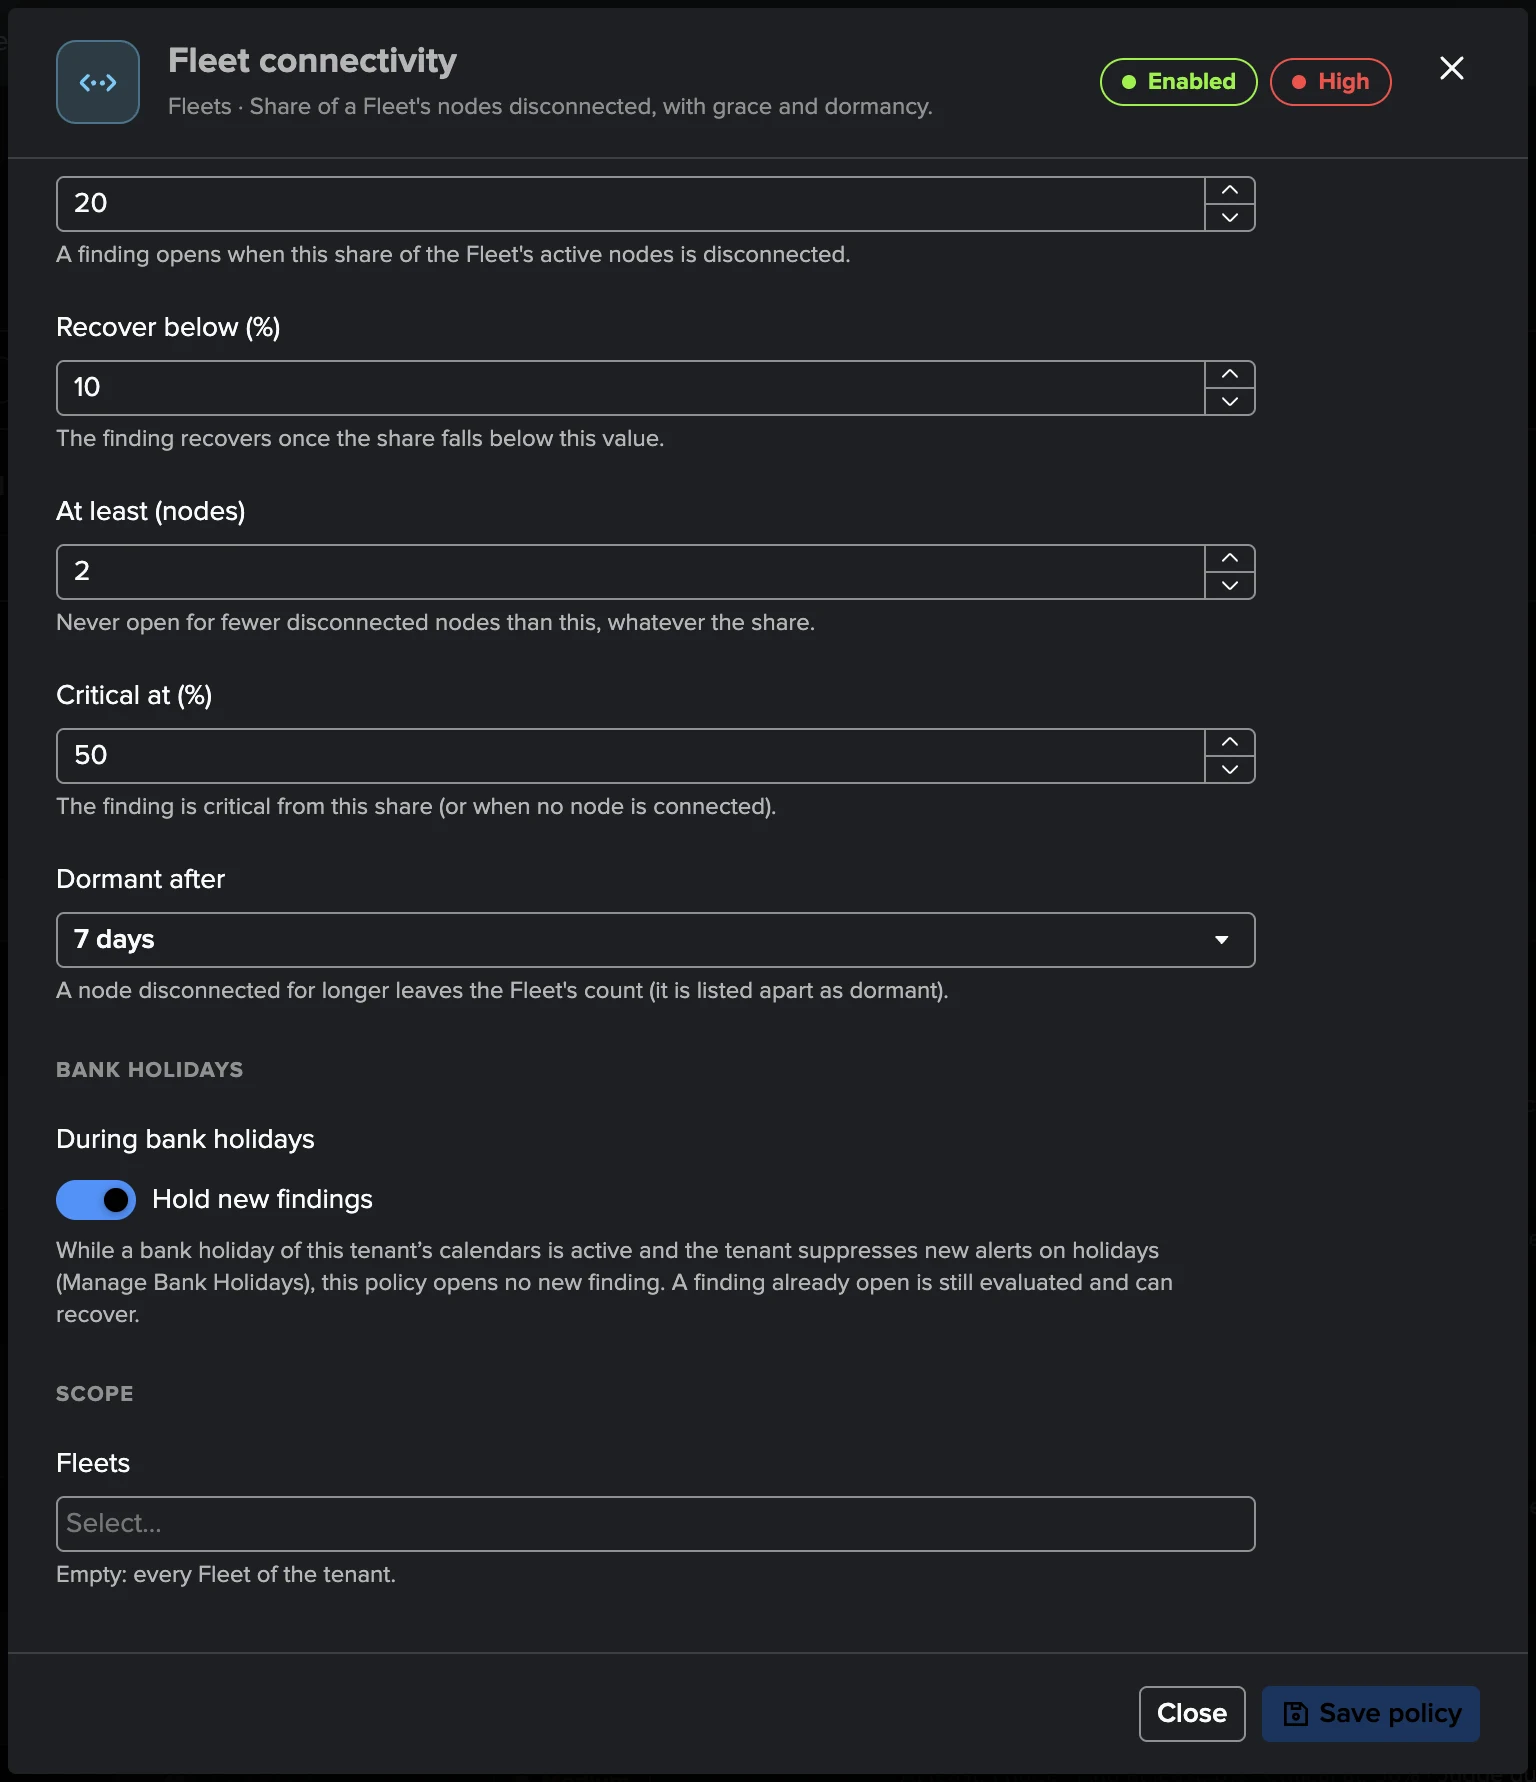
Each policy decides in its editor, section Bank holidays, whether a holiday holds its new findings (Hold new findings) or not (Keep opening findings). The defaults:
Policy |
During bank holidays |
Why |
|---|---|---|
Fleet connectivity, Fleet coverage |
Hold new findings |
Laptops and desktops switched off for the holiday would otherwise open findings. |
Node connectivity |
Keep opening findings |
It watches the nodes you selected as always connected, such as servers. |
Every other Edge policy (Version drift, Configuration drift, Node identity, Source and Destination health, Node disk, Node CPU, Node memory) |
Keep opening findings |
An infrastructure failure on a holiday still opens its finding. |
Leader availability |
No setting |
The Leader is the control plane: it is always judged. |
While a holiday holds a policy:
a failure of that policy opens no new finding, and sends no notification. A finding that was resolved or dismissed is not reopened by a held failure;
a finding already open is still evaluated: it can recover and close during the holiday;
after the holiday, a failure that continues counts its checks to open again before it opens its finding;
the Policies tab says held on bank holidays in the conditions of each policy set to hold, and in Collection health the runs of the Edge Nodes and Monitoring policies jobs say so: Bank holiday (names): the policies set to hold on bank holidays open no new finding while it lasts, with how many failing checks were held in that run;
when the calendars cannot be read, nothing is held: findings open as on any other day.
The hold is decided at the start of each 5-minute check, so a check that straddles the start of a holiday is judged normally. A dismissal for a time that ends during a holiday reopens its finding as on any other day.
Collection health
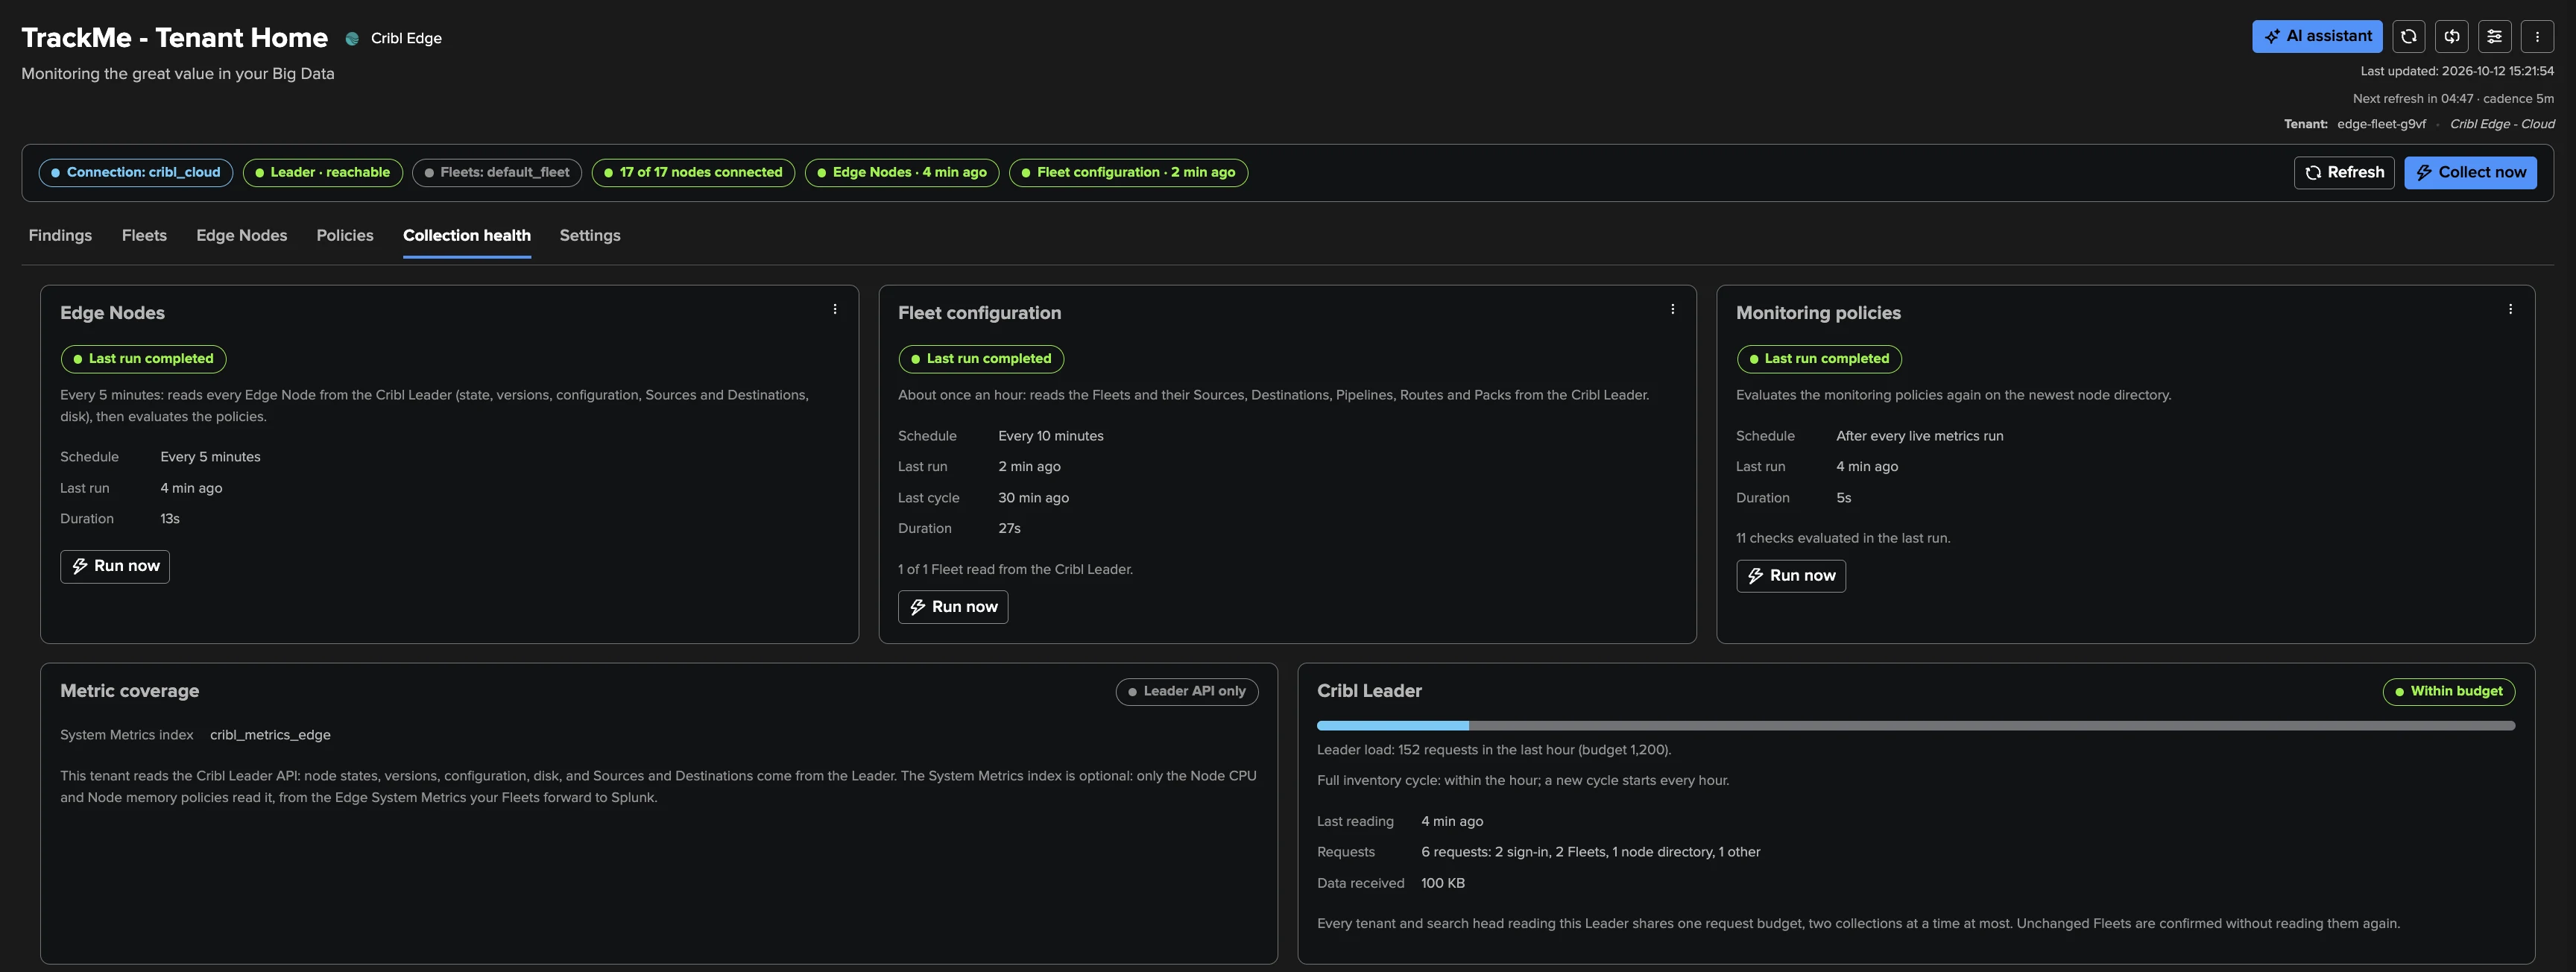
One card per job — Edge Nodes (every 5 minutes: reads every node from the Leader, then evaluates the policies), Fleet configuration (about once an hour: reads the Fleets and their Sources, Destinations, Pipelines, Routes and Packs) and Monitoring policies (on demand: evaluates the policies again on the newest directory) — with its last run, duration, next run and Run now. The tab also shows the Cribl Leader’s request load against its budget, and the System Metrics index the tenant reads.
When collection does not run as configured, the tab lists the problems in plain words, and
the Configuration Guardian raises Cribl Edge collection needs attention
(cribl_collection_health). The Edge-specific conditions: half or more of the connected
nodes report no metrics to the Leader, and no Edge System Metrics arrive in the
System Metrics index or it cannot be read. Every condition is in
Cribl Edge reference.
AI Agent
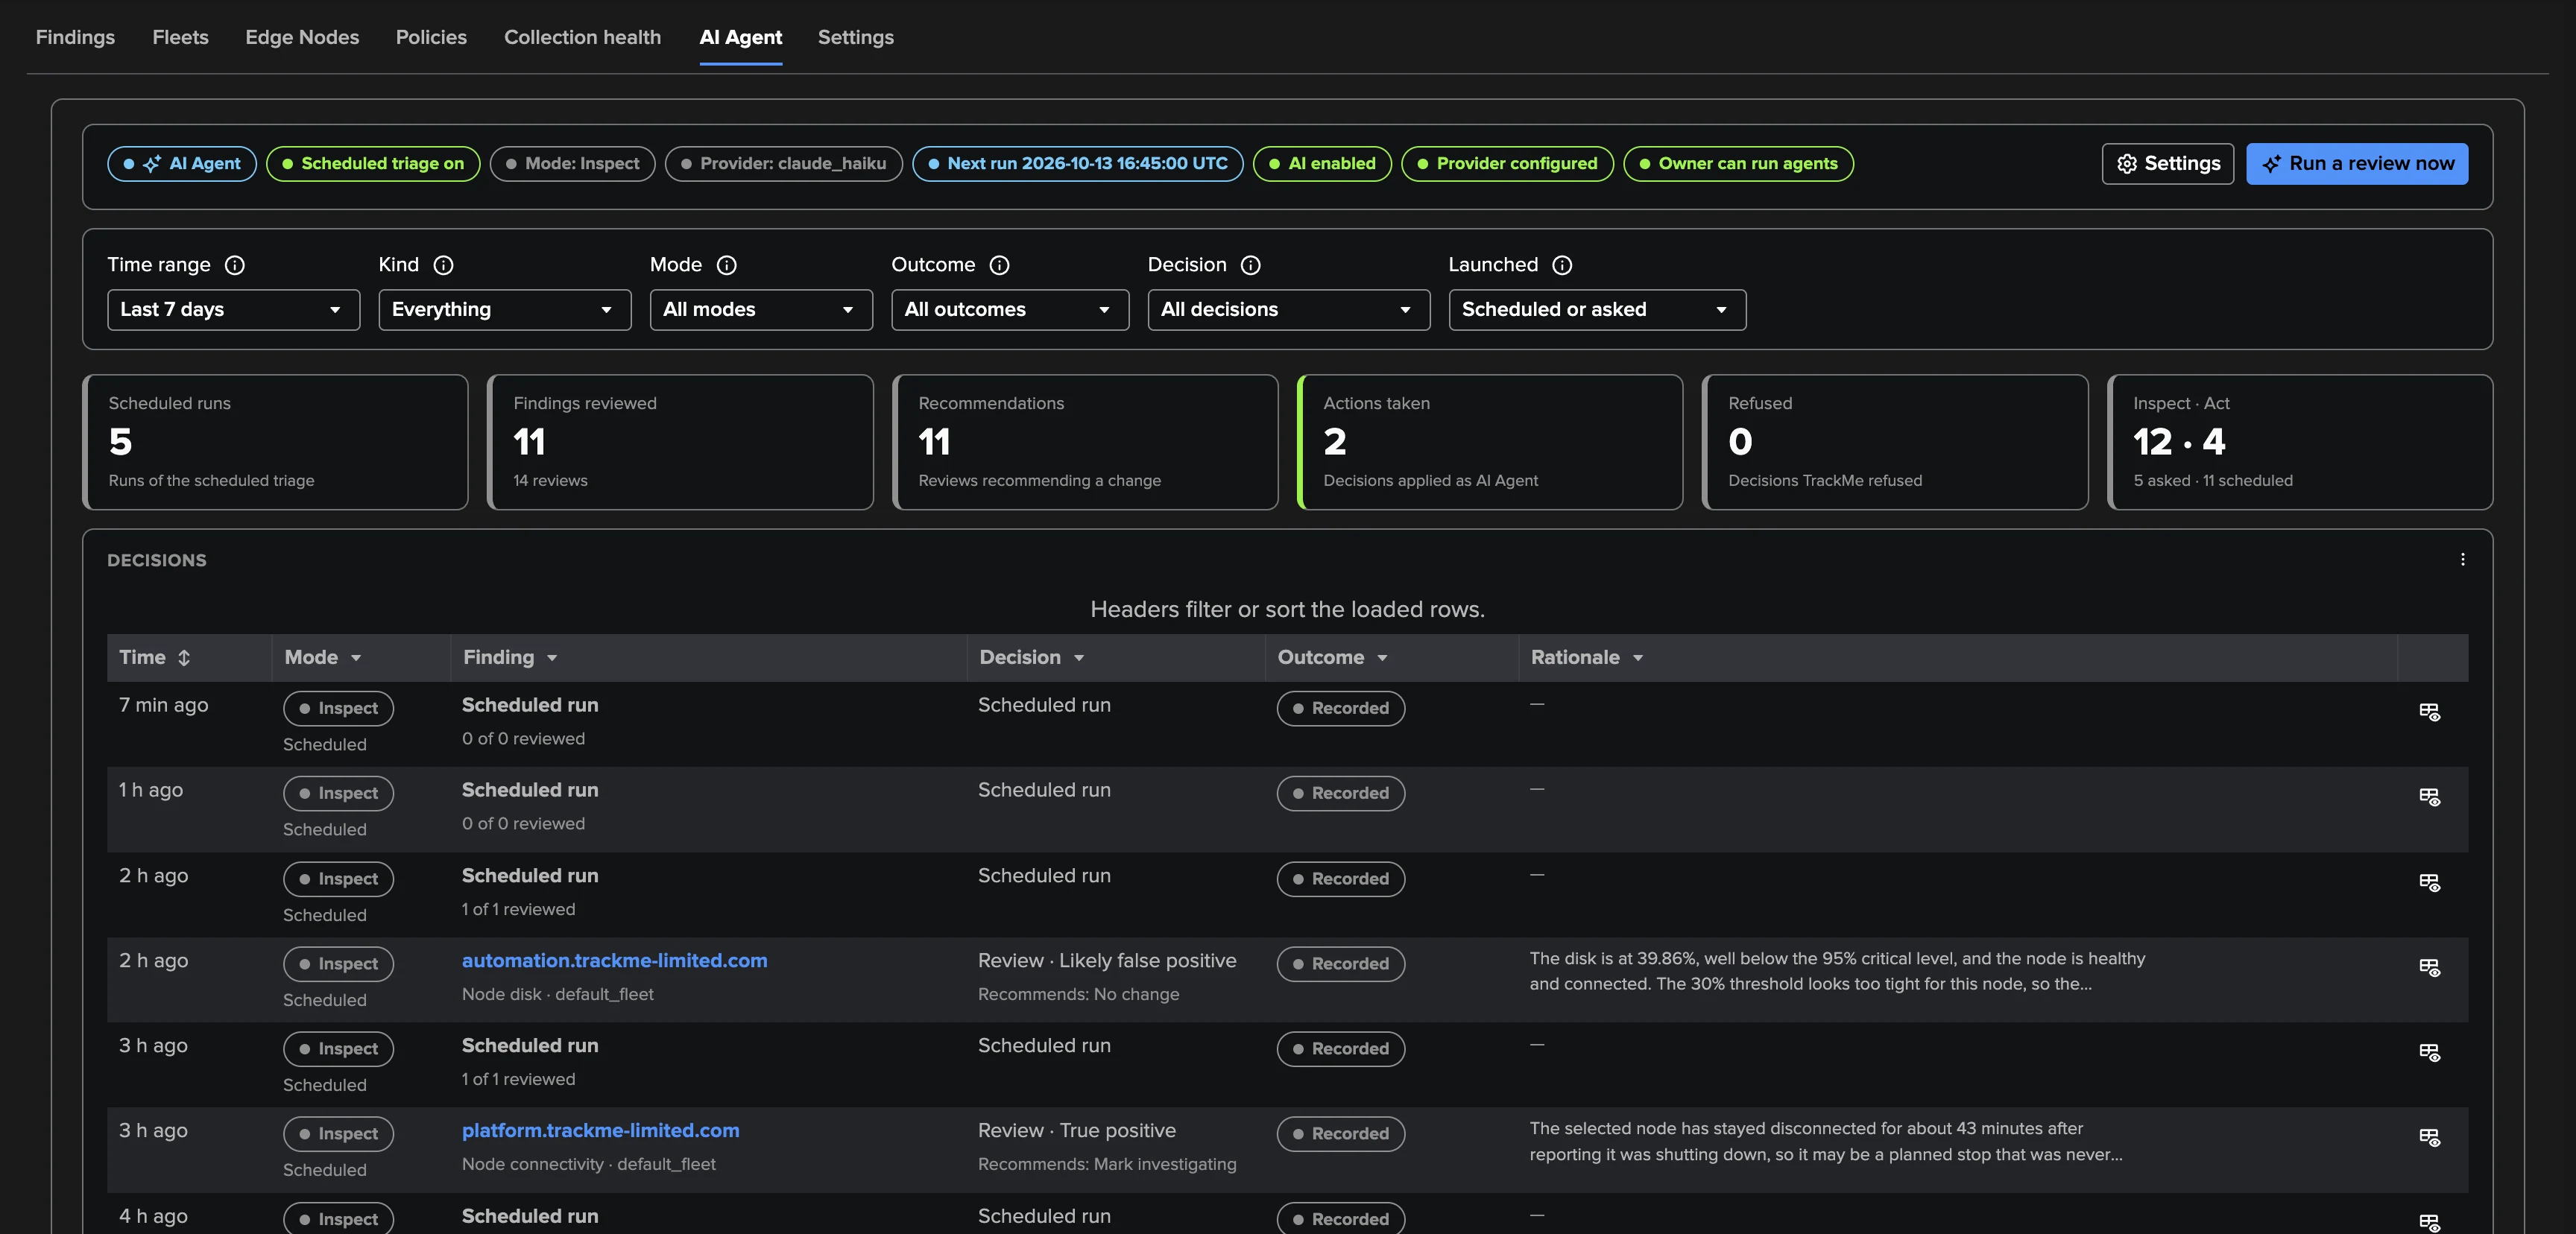
The AI Agent tab shows the Cribl Edge AI Agent: whether it can run and why not, its scheduled triage, its totals, Run a review now and its decision log, each decision with the facts the agent read and its rationale. See The Cribl Edge AI Agent.
Settings
One Save covers every section:
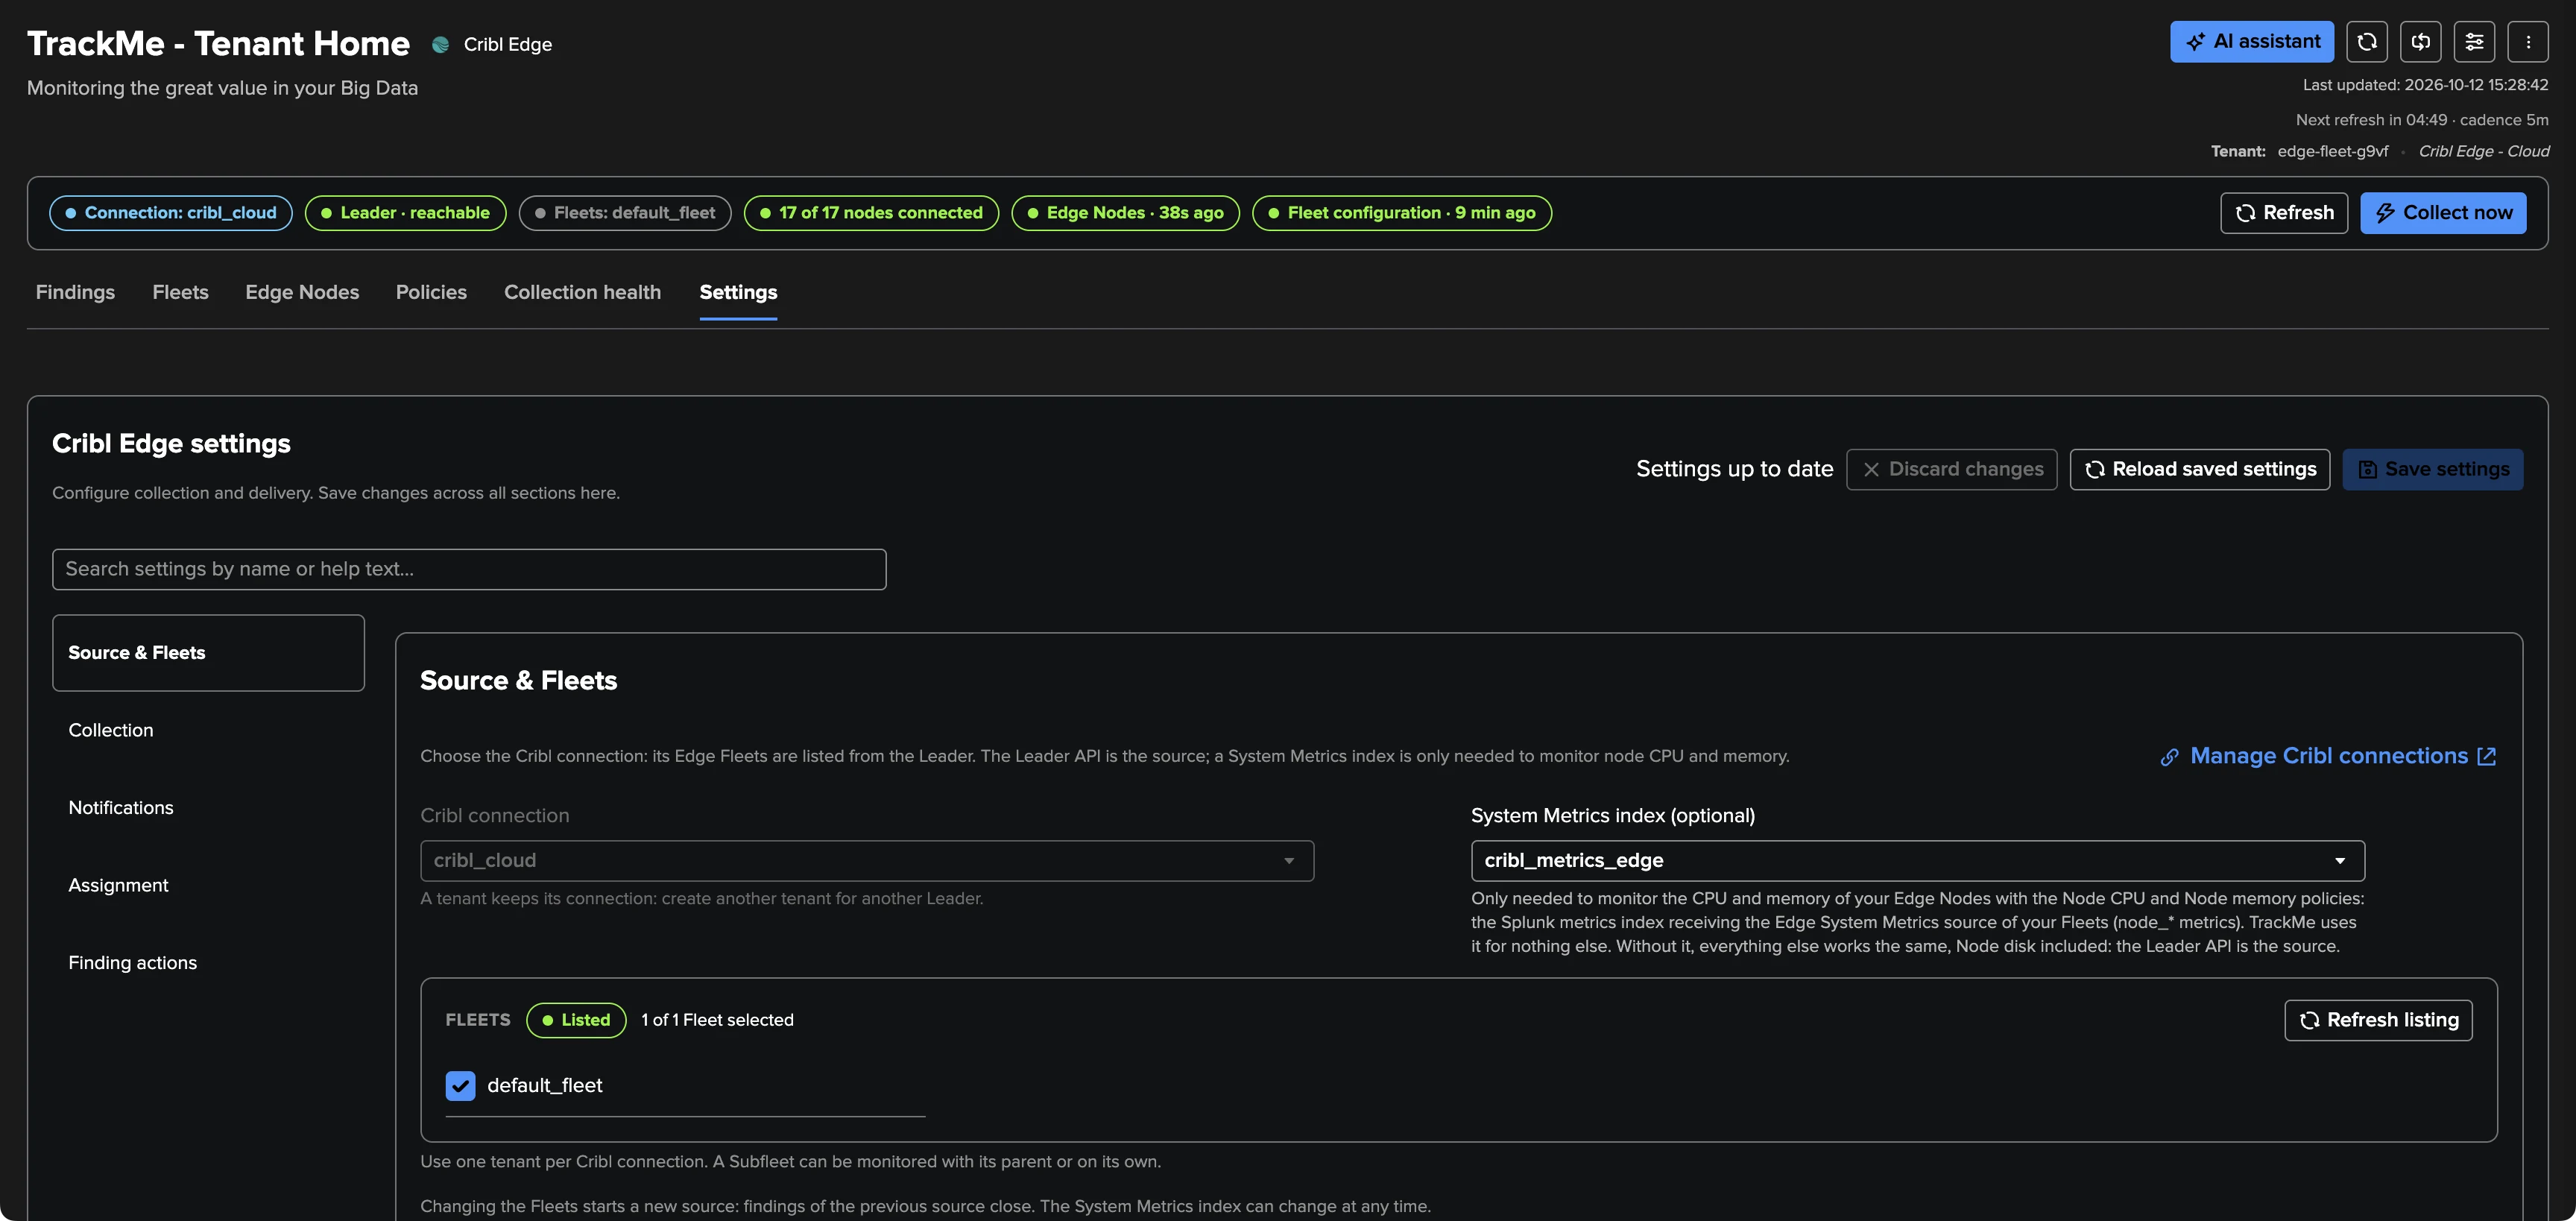
Source & Fleets: the connection (locked), the Fleets and the System Metrics index. Changing the Fleets starts a new source: the findings of the previous source close. The System Metrics index can change at any time without that. Repair workspace checks the tenant’s collections and reports and keeps findings and settings.
Collection: Scheduled collection on or off.
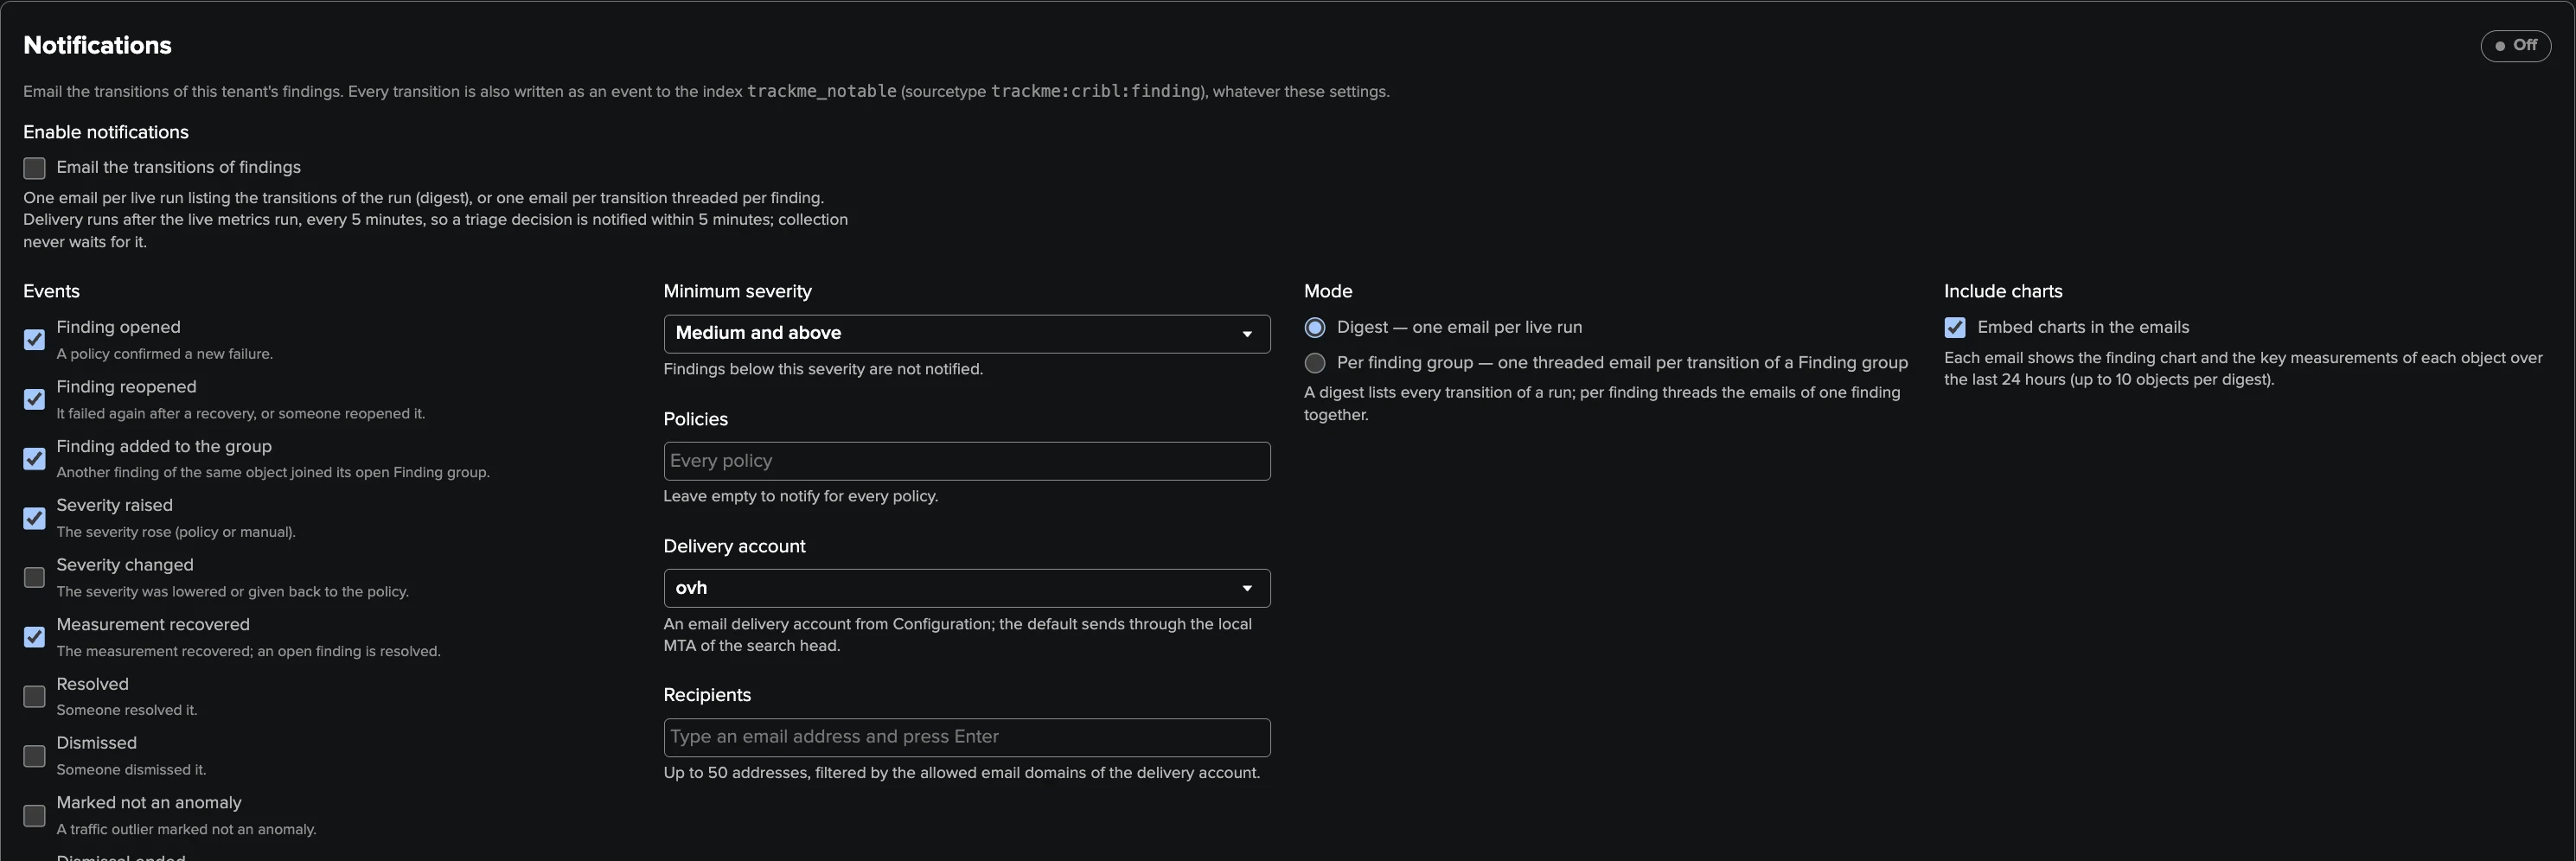
Notifications: finding emails (events, minimum severity, policies, delivery account, recipients, digest or one email per Finding group, charts, test email).
AI Agent: the scheduled triage of the Cribl Edge AI Agent, its mode, provider, limits, allowed decisions and custom instructions (see The Cribl Edge AI Agent).
Assignment: assignment groups, their team email, ordered routing rules (by policy, severity, Fleet or name) and manual overrides.
Finding actions: drilldown searches, links and webhooks offered on findings, and Automations: the rules that call an action automatically.
A TrackMe administrator of the tenant manages these settings; other roles read them.
Findings in practice
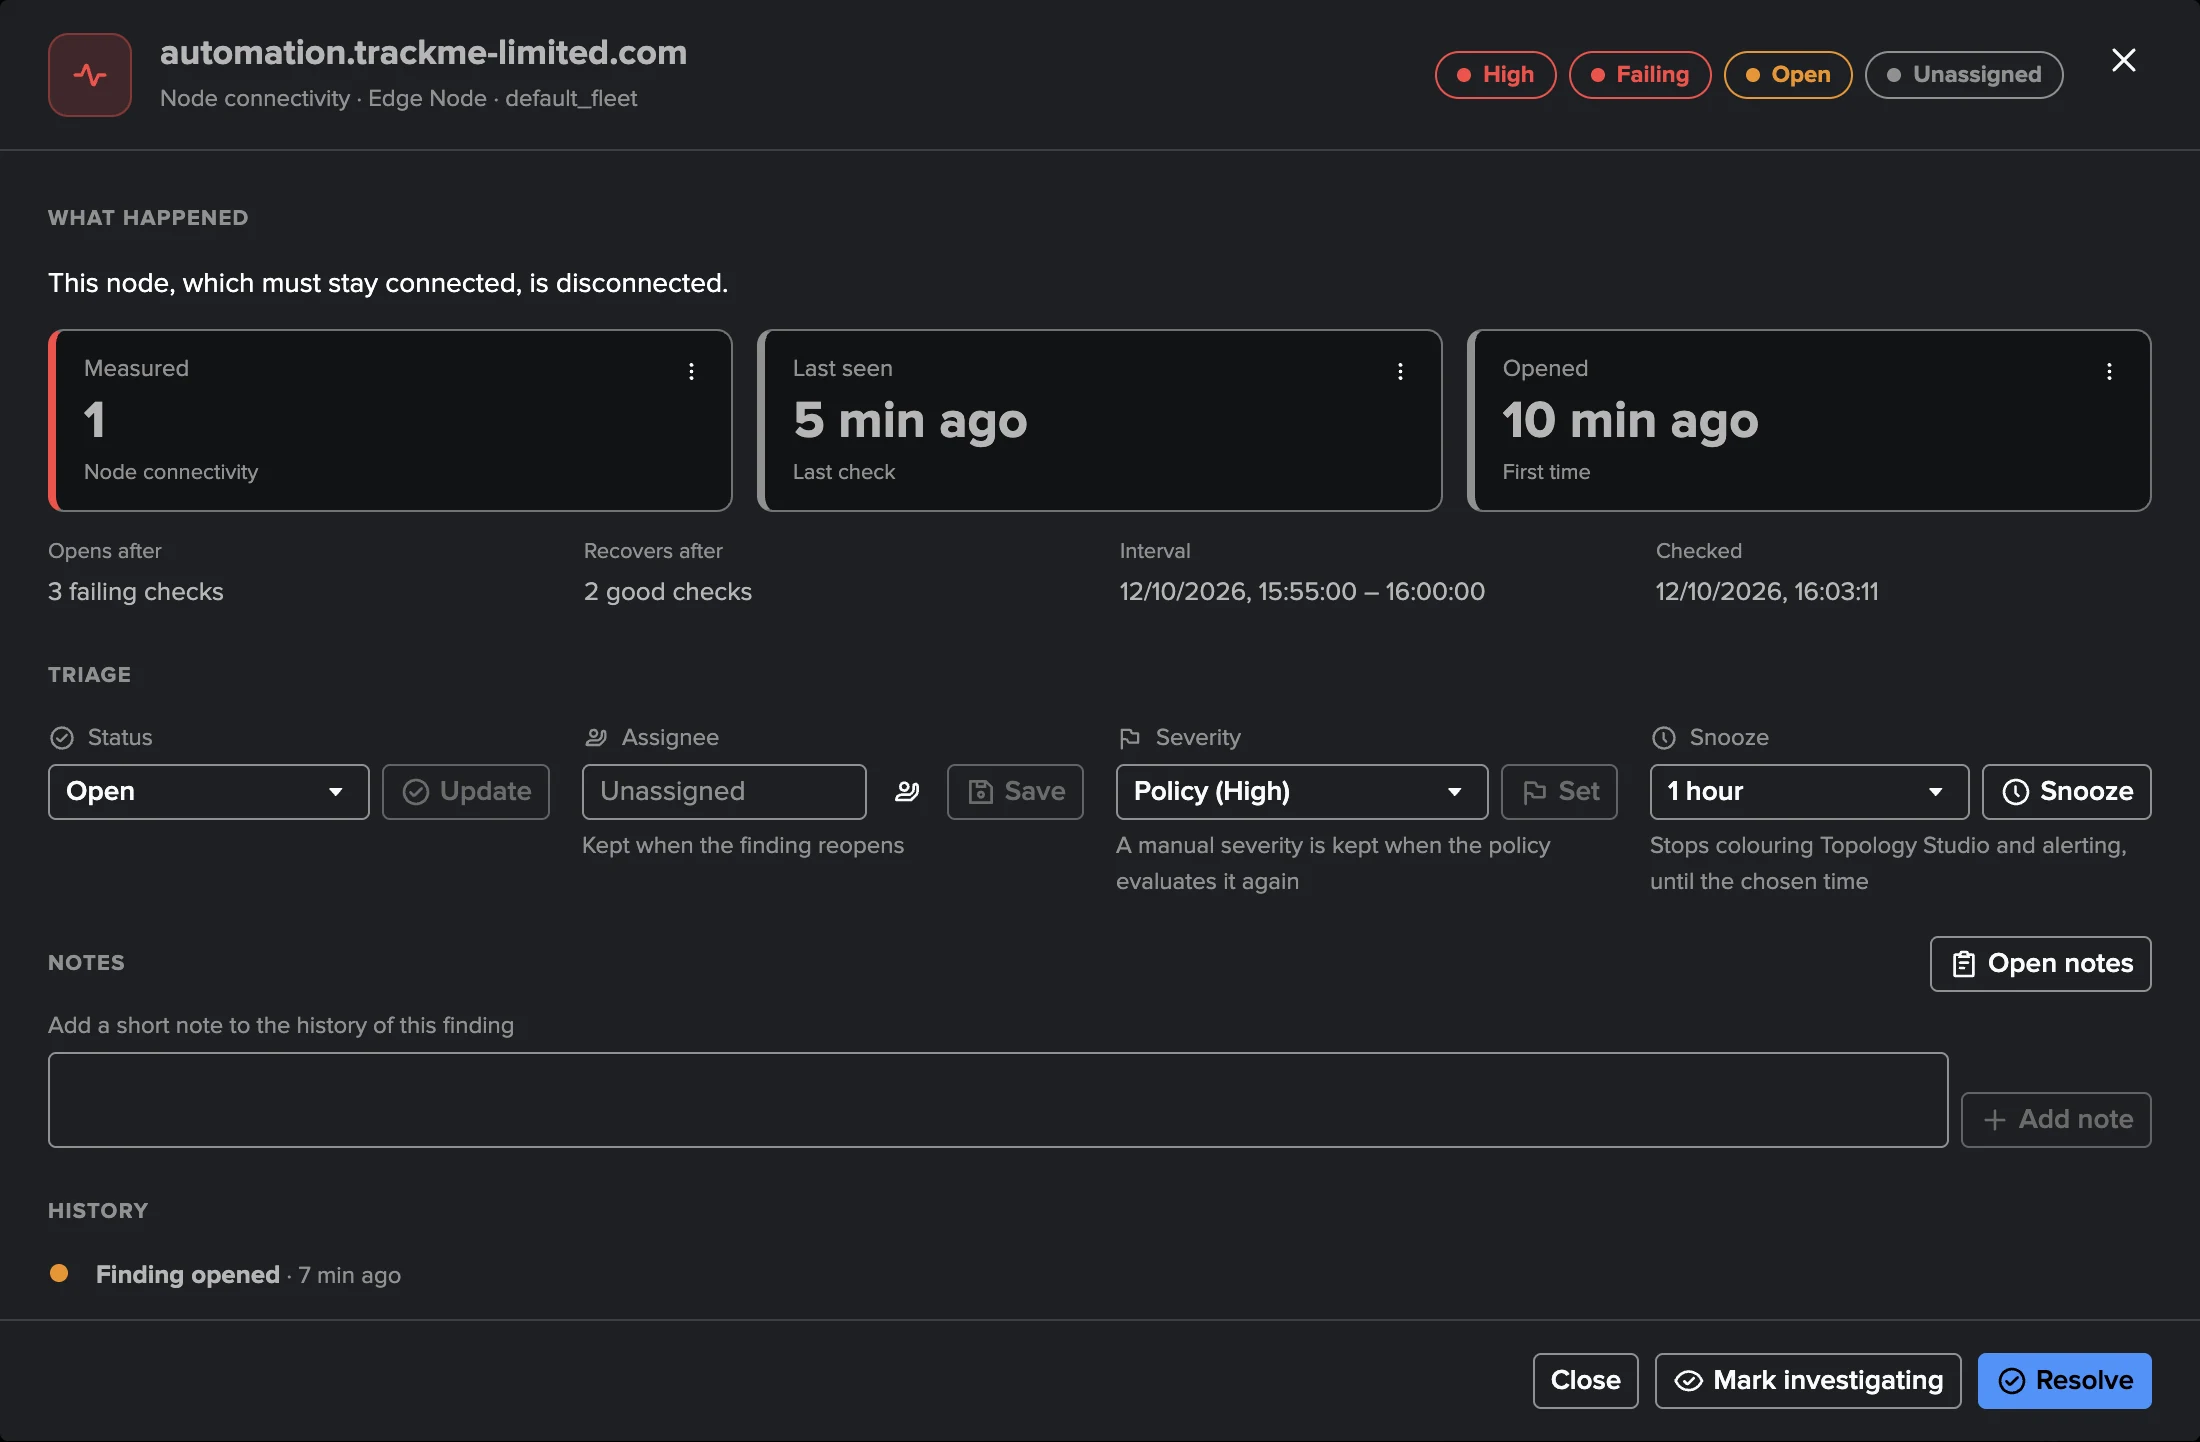
A Cribl Edge finding is about one object, one policy and one measurement:
The finding is about |
Raised by |
|---|---|
A Fleet |
Fleet connectivity, Version drift, Configuration drift, Fleet coverage, Node identity. One finding per Fleet and policy, whatever its number of nodes; the evidence names example nodes. |
A Source or a Destination of a Fleet |
Source and Destination health: one finding per object, with how many nodes report it in warning or trouble. |
An Edge Node |
Node connectivity, Node disk, Node CPU, Node memory. |
The Leader |
Leader availability. |
Findings work exactly as on Cribl Stream. Each object gathers its findings in one automatic Finding group, the unit you triage and get notified about. A finding recovers by itself when the measured condition clears, and closes by itself when its object is no longer listed or no longer in the tenant’s scope, or when nothing evaluated it for 24 hours. Triage, notes, snooze, dismissal, the severity override and assignment are the same as for every findings-based tenant, and the Cribl Edge AI Agent can review them (see The Cribl Edge AI Agent). Edge has no Stop monitoring this object and no Not an anomaly (there is no model to teach): to stop judging an object, narrow the policy’s scope or turn the policy off.
The shared concepts are described once:
Findings, Finding groups and findings actions — findings, statuses, triage, severity, notifications;
Finding groups — Finding groups, automatic and manual;
Findings actions — drilldowns, links, webhooks and automation rules;
Webhook accounts — the accounts a webhook action posts with;
Assignment and automatic routing — assignment groups, routing rules and team emails.
Links into the workspace. An email, an action or a dashboard can open the workspace on
an object: TenantHome?tenant_id=<tenant>&tab=nodes&node=<node key> opens an Edge Node,
tab=fleets&fleet=<Fleet id> opens a Fleet, and the Edge Nodes filters can be passed as
parameters (group_id, state, config_state, io, q).
A disconnected node: what you see
Take a Fleet of 17 nodes, one of which stops (a laptop closed, a server shut down, a service stopped):
Within 10 minutes of its last heartbeat, the node is disconnected in the next node directory. The status strip reads 16 of 17 nodes connected, the Fleets tile Edge Nodes connected turns amber with “1 disconnected”, and the Fleet row shows the node in Disconnected.
In Edge Nodes, the filter Connection: Disconnected lists it with how long it has been disconnected; its Node info shows the last heartbeat, and System activity says the node cannot be read.
No finding opens for that one node by default, by design: Fleet connectivity opens when at least 20 % of the Fleet’s active nodes, and at least 2 nodes, are disconnected (critical from 50 %, or when no node is connected). One node in 17 is below that.
For the nodes that must never drop (servers, collectors), select them in Node connectivity: typed host names (patterns like
dc-*are accepted) or a Splunk lookup table such as a CMDB extract. A selected node without a heartbeat for 15 minutes opens a High finding about that node after three checks, and it recovers when the node reconnects.A node disconnected for more than 7 days (setting Dormant after) leaves the Fleet’s count, so retired nodes that nobody removed from the Leader do not hold a Fleet in alert forever.
In Topology Studio, a disconnected node without a finding is drawn quiet grey: it is disclosed, and it does not count in a group’s healthy share.
Version drift
Cribl Edge upgrades roll out node by node, and a node left behind is a common, silent problem. Version drift compares the version of every connected node with a baseline, the Leader version by default (Cribl’s own upgrade rule) or the Fleet’s most common version:
the Fleets tab shows the versions running in each Fleet and how many nodes are Not on the Leader version; the Fleet’s Nodes to look at → Versions names the nodes behind each version, and each node’s Node info compares its version with the Leader’s;
once nodes stay off the baseline for the rollout grace (24 hours by default, the time of a rolling upgrade), a Version drift finding opens on the Fleet, Medium by default. It is raised to High when a node runs a version newer than the Leader or two minor versions or more behind it: the cases Cribl does not support;
the finding recovers once every connected node is on the baseline. A node that just enrolled and reports no version yet is never counted as drift.
To fix it, upgrade the nodes from the Fleet in Cribl, or change the baseline when your Fleets deliberately run their own version.

Configuration drift works the same way for deployments: connected nodes not running the Fleet’s deployed configuration after a 30-minute grace open a High finding on the Fleet, critical when half the Fleet or more is behind.
Notifications
Finding notifications work as for Cribl Stream (Findings, Finding groups and findings actions): turn them on in Settings → Notifications, pick the events (opened, reopened, added to the group, escalated, recovered, dismissal ended and closed by default), a minimum severity, the policies, a delivery account and recipients, and choose a digest or one email per Finding group, with charts. Emails are sent after each live run and carry the “Cribl Edge” label and a link that opens the finding in the workspace. Send test email checks the delivery.
Every transition is also written as an indexed event (trackme:cribl:finding and
trackme:cribl:finding_group, object_category=cribl_edge), whatever the
notification settings, for your own Splunk alerts, Enterprise Security or SOAR: see
Cribl Edge reference.
Topology Studio
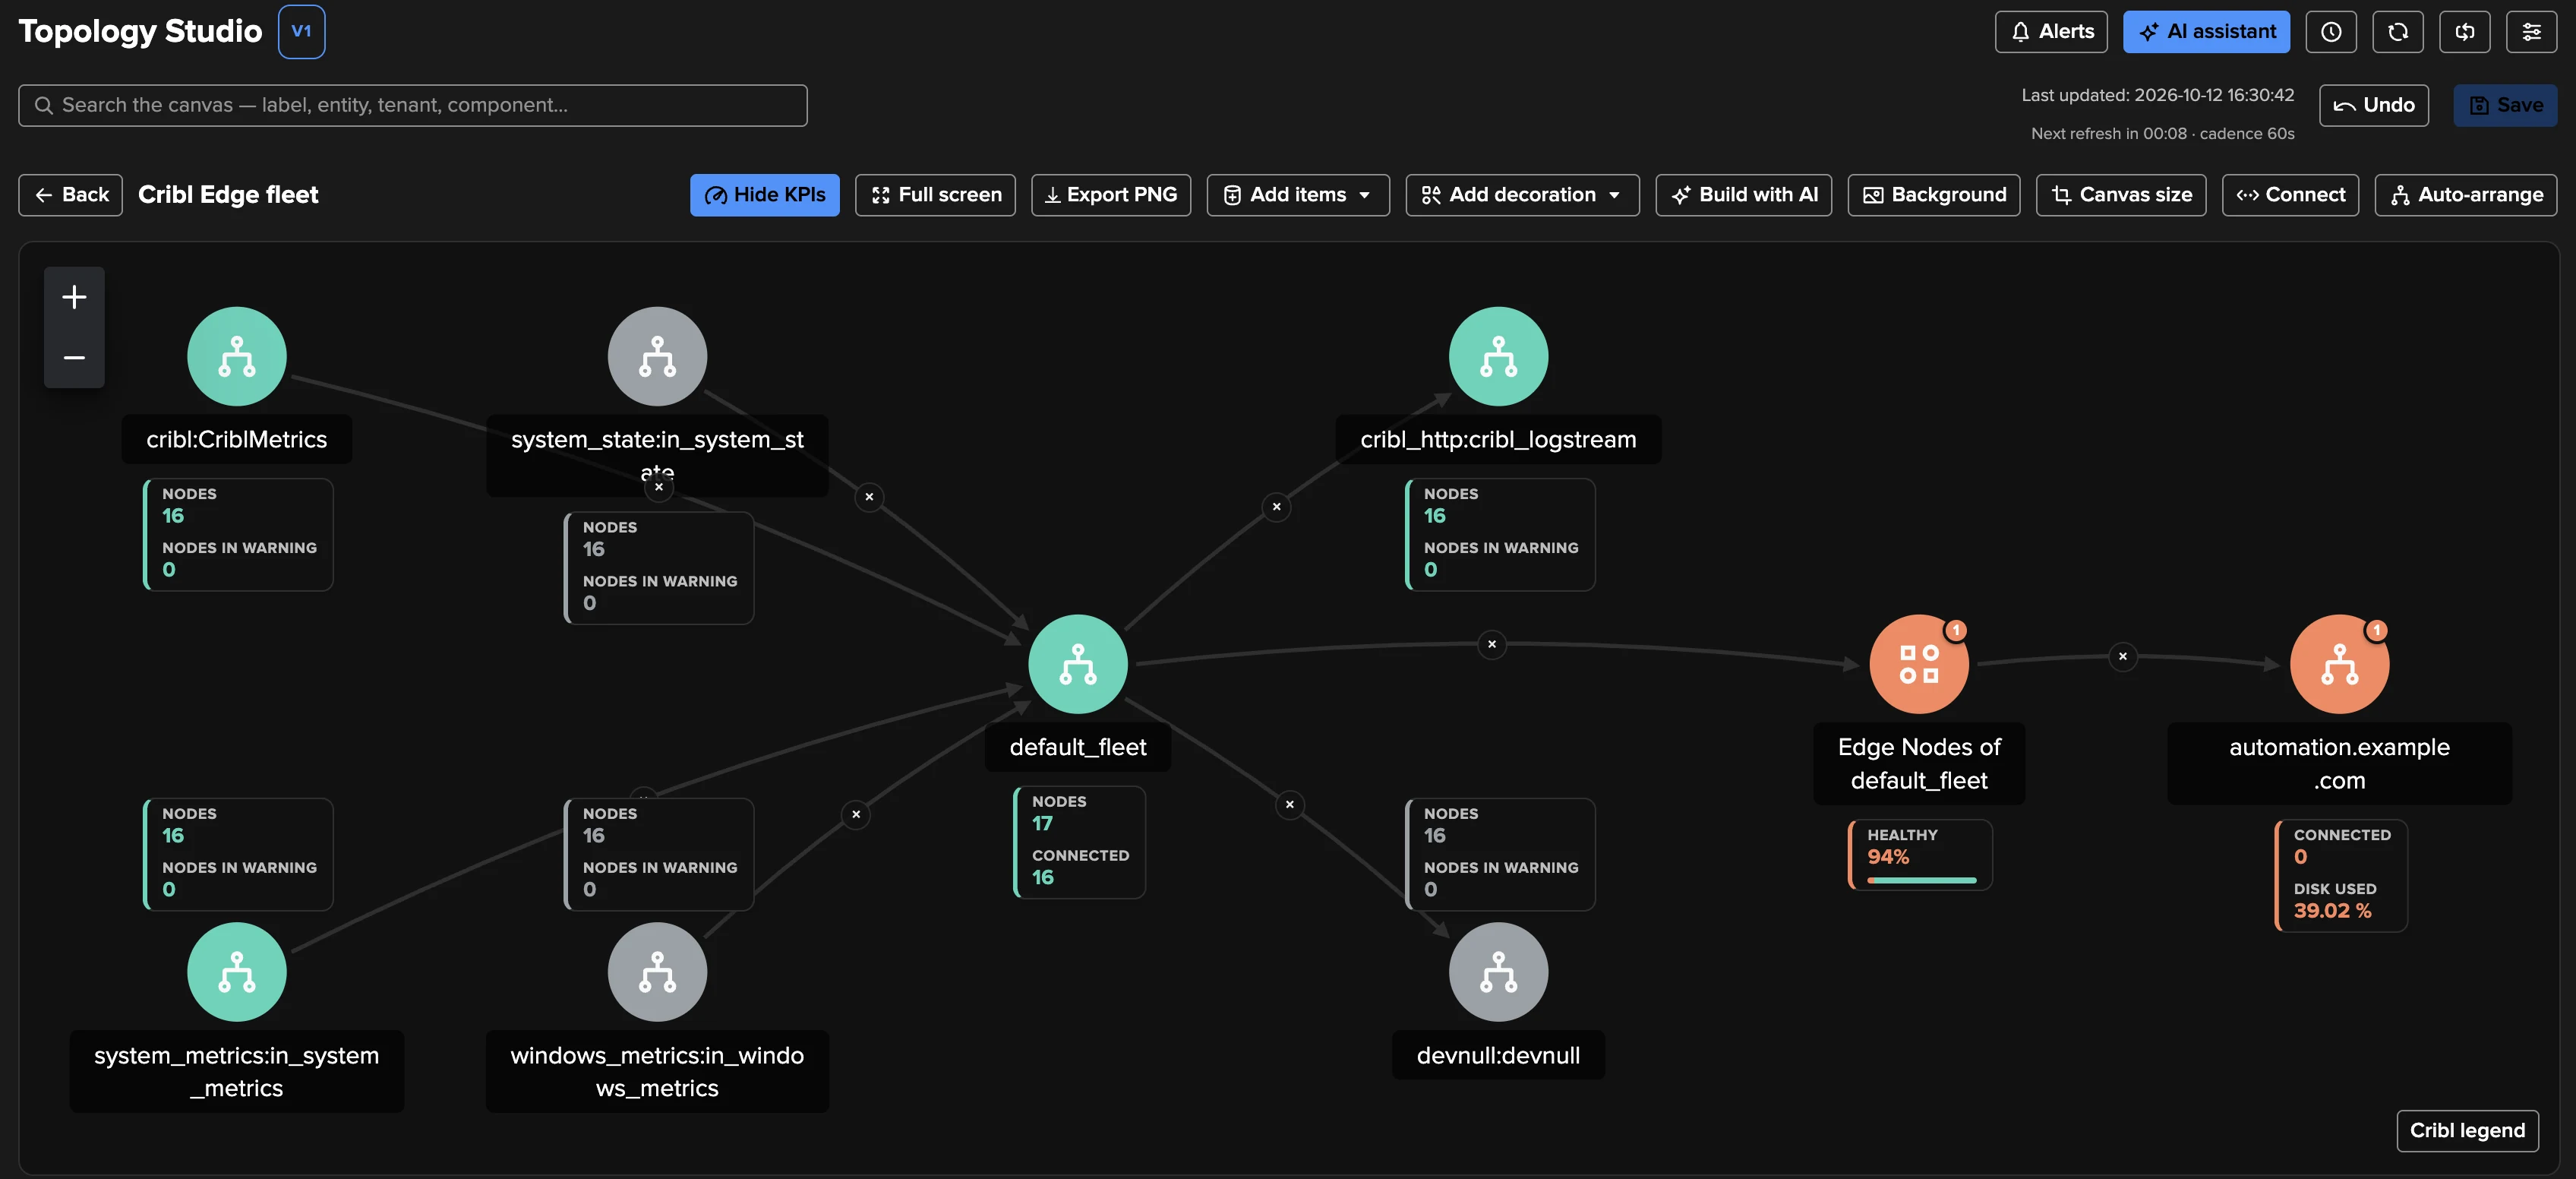
Cribl Edge objects are Topology Studio objects (Topology Studio): Fleets, Sources, Destinations and Edge Nodes of an Edge tenant.
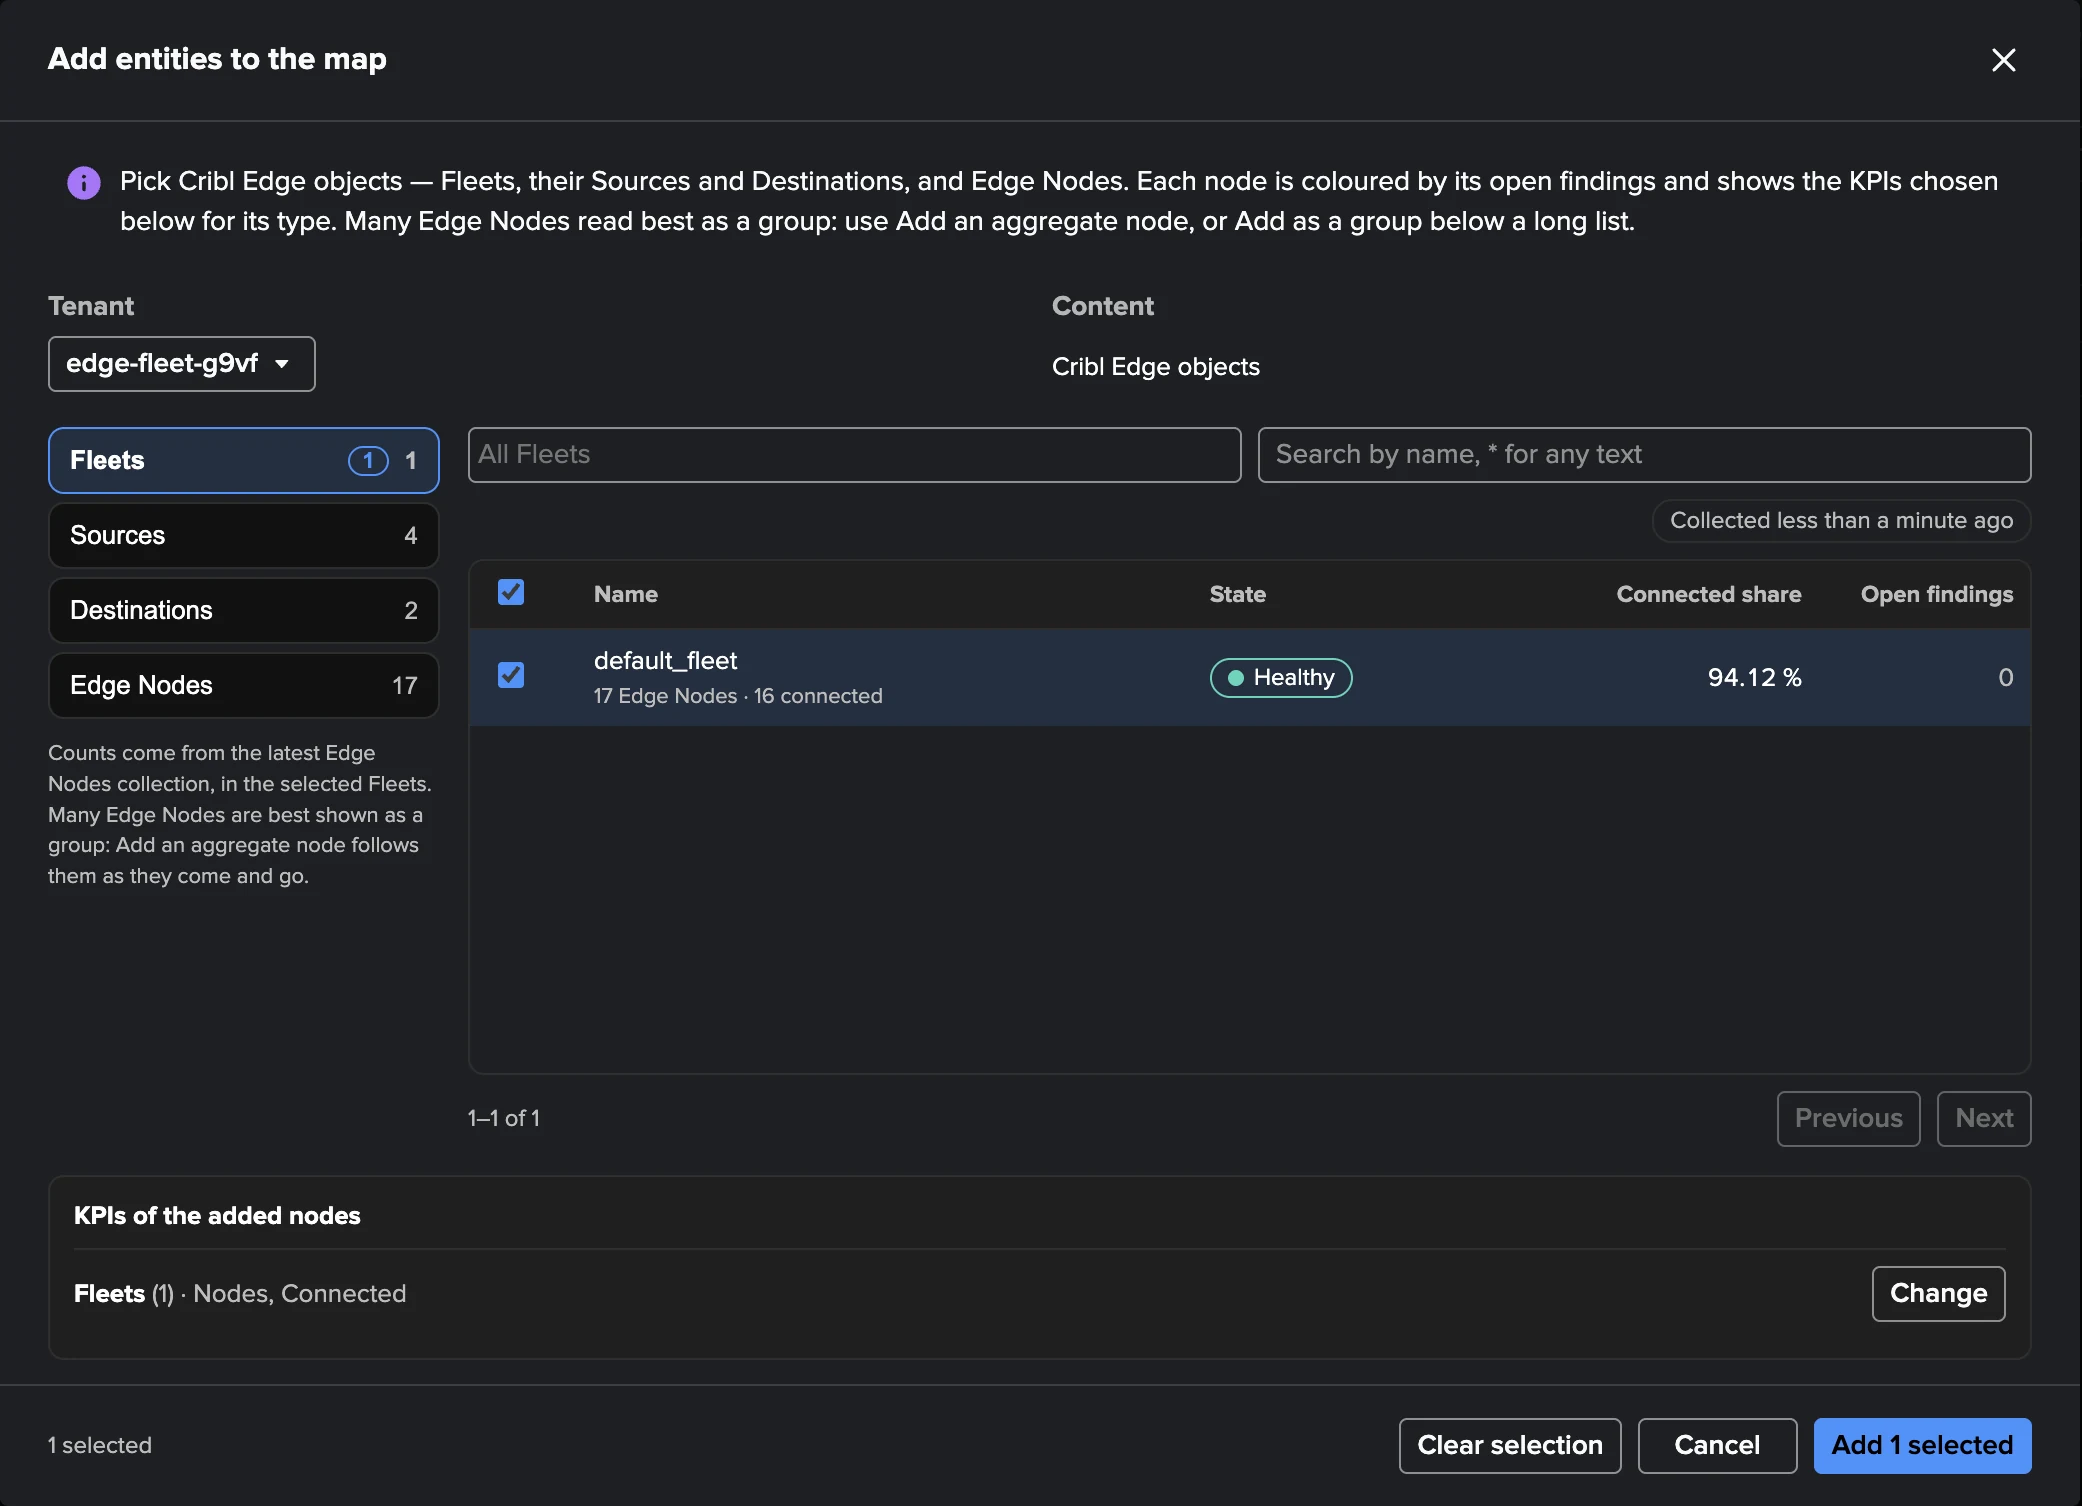
Add entities: pick Fleets, Sources and Destinations of a Fleet, or Edge Nodes (with the Edge Nodes filters), each type with its count and state.
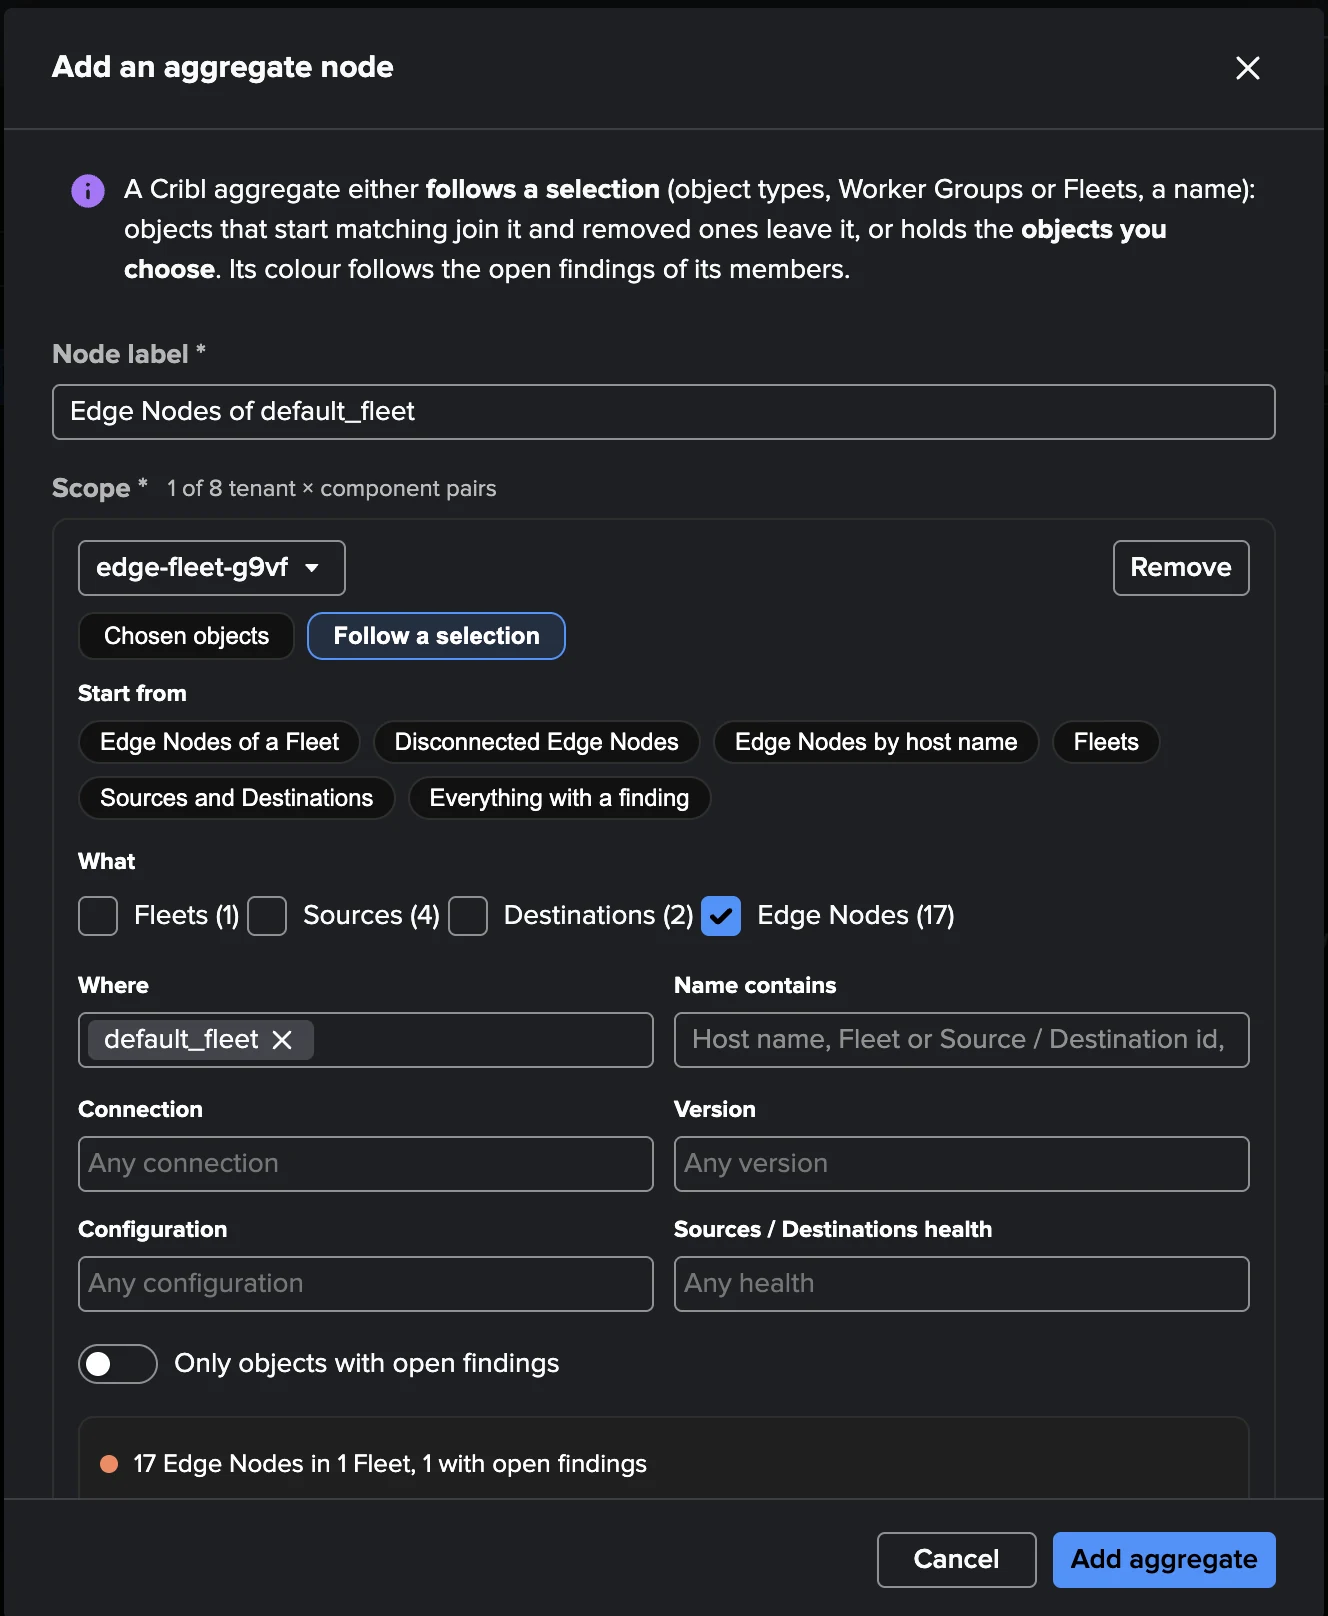
Groups (Add an aggregate node, Cribl Edge form): the recommended way to show nodes. Start from Edge Nodes of a Fleet, Disconnected Edge Nodes, Edge Nodes by host name, Fleets, Sources and Destinations of a Fleet or Everything with a finding, then narrow by Fleet, host name pattern, connection, version, configuration or Sources / Destinations health. A group follows its nodes as they come and go, at any fleet size, and shows its health and healthy share (groups carry no summed traffic or averaged CPU).
Status: findings first (red or orange; blue when only snoozed). Otherwise green when present and current. A disconnected node without a finding is quiet grey, and a Source or Destination without traffic is quiet.
KPIs: for a node, connected, disk, events and bytes in and out, dropped events, unhealthy Sources / Destinations; for a Fleet, nodes, connected and connected %, drift counts, traffic, highest disk; for a Source or Destination, nodes, warning, trouble, events, bytes. Fleets and nodes have 24-hour sparklines. Node CPU and memory are read on demand from the System Metrics index when a view shows them.
Topology Alerts (Topology Alerts) work on Edge objects and groups.
Create with AI (Build with AI — a topology from a description) offers Edge tenants (”· Cribl Edge”) with three starting points: Fleet overview, Edge problems wall and Sources and Destinations of a Fleet. Groups with node filters are built by hand.
Opening a node or a Fleet from a view opens the Edge workspace on it.
The Cribl Edge AI Agent
The Cribl Edge AI Agent reviews Edge findings the way an operator would, from facts TrackMe already holds rather than from guesses. It is its own agent, separate from the Cribl Stream AI Agent, built on the same framework as the other findings AI Agents (AI Agents for findings), with Edge’s own evidence and decisions. It assesses each finding — true positive, likely false positive, expected behaviour, node or Fleet not in use or needs investigation — recommends a decision, and keeps one current [AI Agent] note on the finding.
Inspect only recommends: nothing changes but the note.
Act applies the recommendation, but only what the tenant allows (see What it may decide).
What it reads
The agent never runs a search and never calls Cribl, and no machine learning is involved: its facts are what TrackMe already holds for the tenant.
The finding: its evidence and Edge detail (distributions, example nodes), its history and episodes, its Finding group, and the decisions already taken on it by an operator or by the agent.
Its Fleet in the published node directory: nodes, connected and disconnected (and for how long), version and configuration drift, the rollout, and the Sources and Destinations reported unhealthy.
Its Edge Node, for a node finding: state, Edge version and its risk against the Leader, disk, and the health of its Sources and Destinations.
Whether the node or the Fleet is still in the node directory. Only a current publication of the directory can prove that a node or a Fleet is gone, and only once the finding has gone an hour without being evaluated: one publication missing a node (a Leader restart, a transient listing) proves nothing. A Fleet cleared in Settings → Source & Fleets counts as gone in the same way.
The tenant’s Collection health, so that a stale directory or a failing job is not read as a healthy fleet.
It knows the usual Edge patterns: version drift during a rollout, or configuration drift right after a deploy, is often expected; a node newer than the Leader or two minor versions behind it is a real risk; a retired node or Fleet is not in use; a stale directory needs investigation.
What it may decide
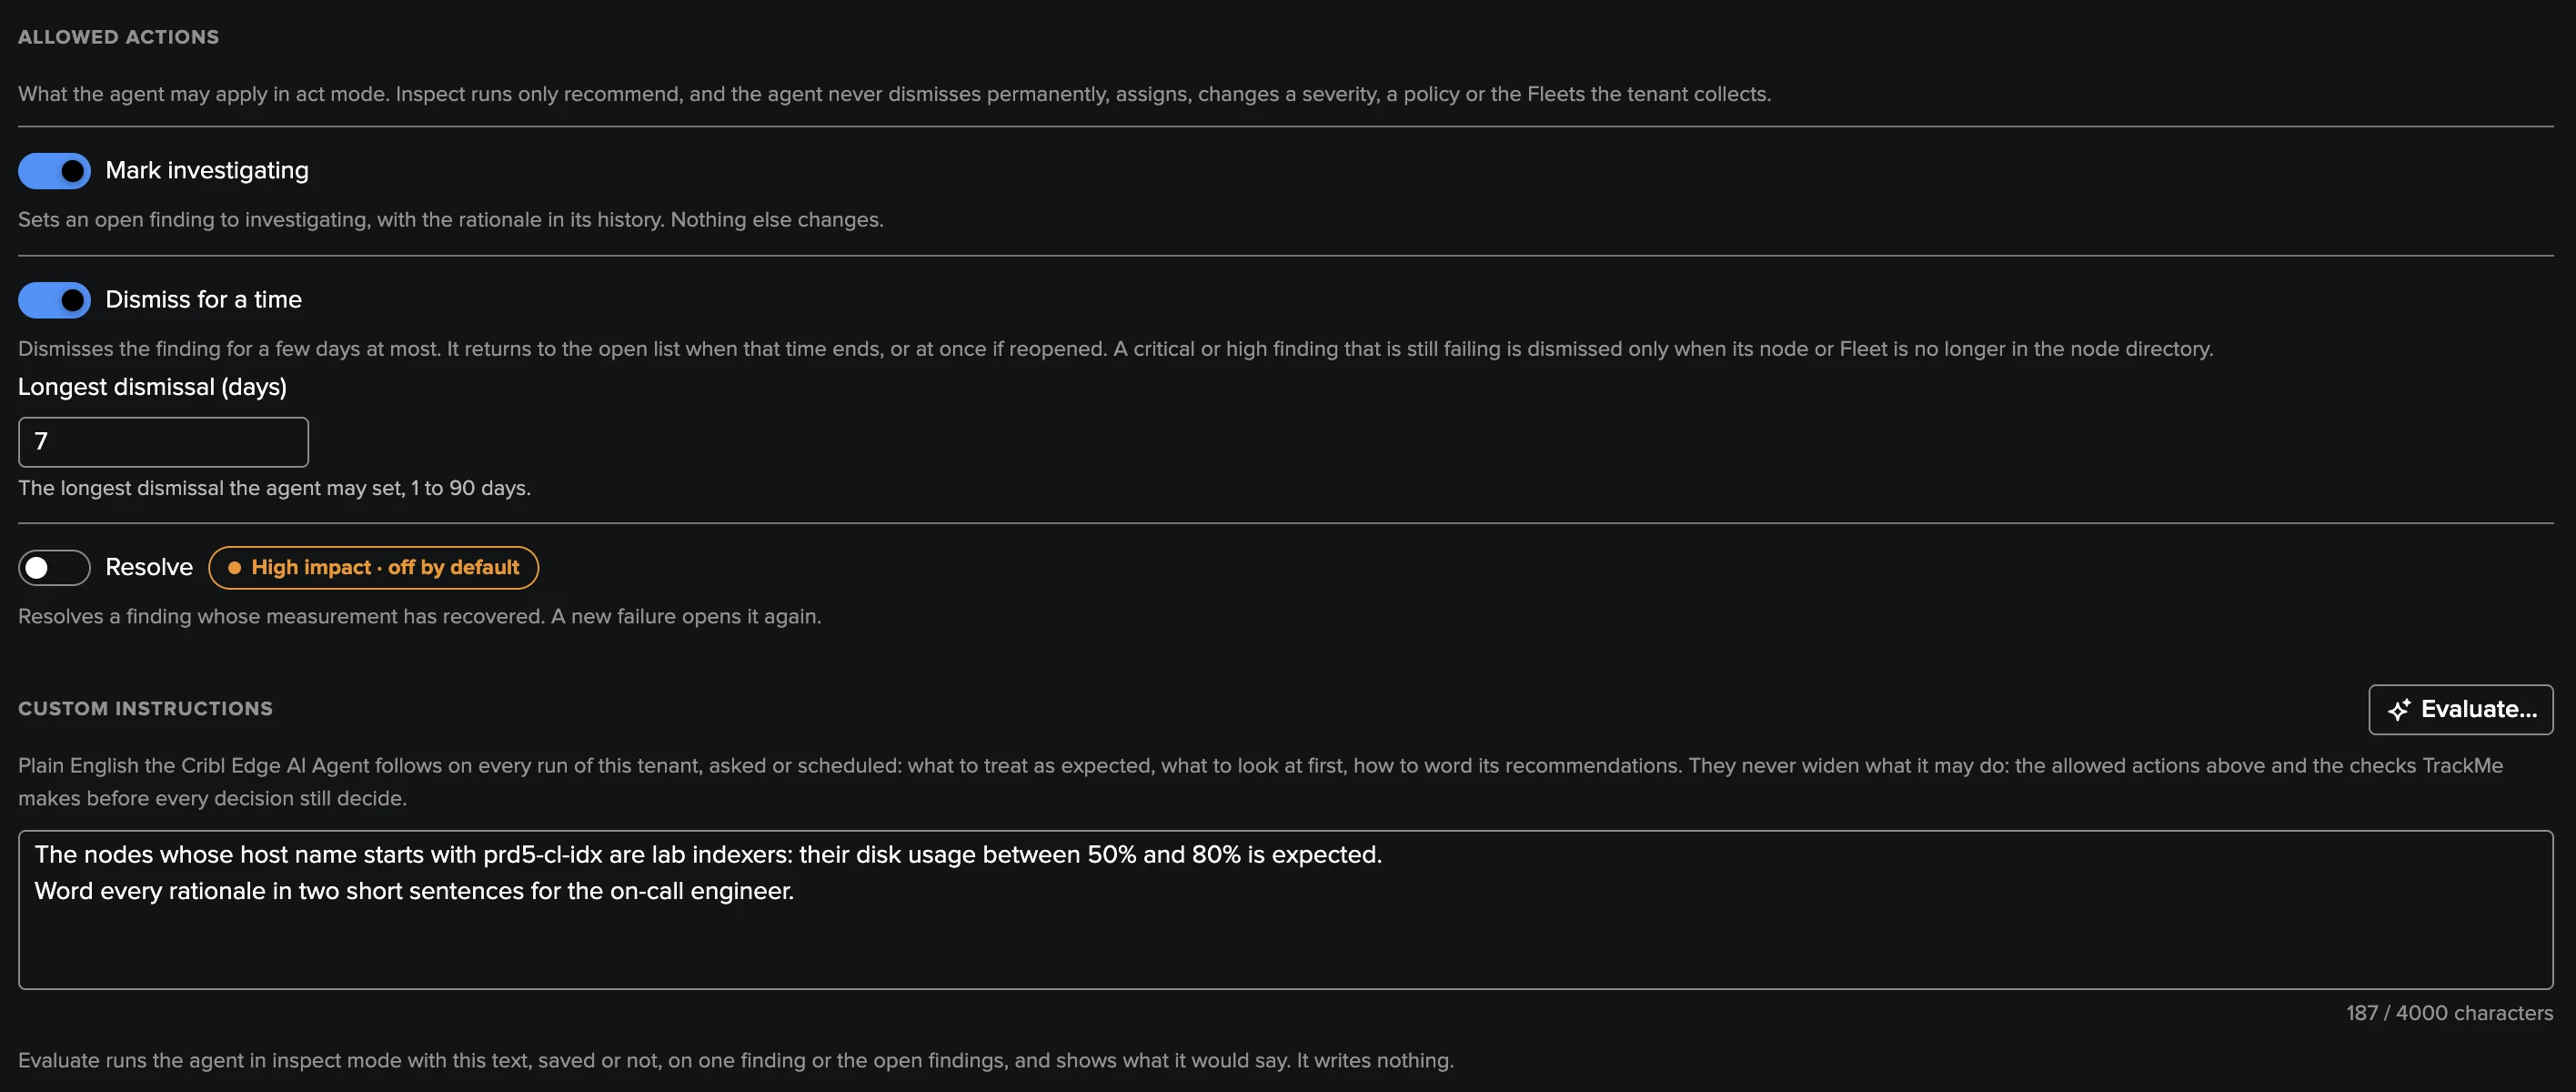
In act mode, each decision has its own setting in Settings → AI Agent, and TrackMe checks its conditions again before applying it, whatever the agent wrote:
Decision |
Default |
Condition checked by TrackMe |
|---|---|---|
Mark investigating |
Allowed |
The finding is open. |
Dismiss for a time |
Allowed, 7 days at most (up to 90) |
A critical or high finding that is still failing only when its node or Fleet is gone from the node directory. |
Resolve |
Not allowed |
Only after a measured recovery, and never while another finding of its Finding group still fails. |
A Finding group of several findings is decided as a whole. Node findings group by host name within a Fleet, so a reinstalled or cloned node (a new node id, the same host name) shares a group with the old one: the old node being gone never lets the agent dismiss a critical or high finding of the live node.
There is no Not an anomaly and no Stop monitoring on Edge: there is no traffic model to teach and no object monitoring to turn off. The agent never dismisses permanently, assigns, changes a severity or a policy, changes the nodes selected in Node connectivity or the Fleets the tenant collects. It makes at most one decision per finding and Finding group in a run.
Asking the AI Agent
Ask the AI Agent… is in the finding and Finding group menus and the investigation view, and Run a review now on the AI Agent tab reviews the open findings. The agent always inspects first: you read its assessment, the evidence and its rationale, then choose Run its recommendations… to let it act on that inspection, within 30 minutes. The tenant’s power and admin roles can ask it and let it act; its settings belong to a TrackMe administrator of the tenant.
The AI Assistant of the Edge Tenant Home can also propose a Cribl Edge AI Agent review, as a consent card you confirm (see AI Assistant).
Asking needs the AI Assistant to be enabled and at least one AI provider configured.
Scheduled triage
The agent can review the open and investigating findings of the tenant every hour on its own. Scheduled triage is off by default; a TrackMe administrator of the tenant turns it on in Settings → AI Agent. Each run:
reviews up to 10 findings (1 to 50), one per Finding group, the most severe first, within a time budget of 3000 seconds that fits the hourly cadence;
skips a finding reviewed in the last day (the review interval), unless a new episode started or its Finding group changed;
runs in inspect mode unless you choose act;
never overrides a person: a finding or Finding group that an operator decided on, or that has an assignee, is left to the operators;
applies the shared filters of the automated AI reviews, with the finding severity as the priority: by default only critical and high findings are selected (see AI Agents automation).
Scheduled triage runs only when the AI Assistant is enabled, an AI provider is configured,
the tenant is enabled, and the tenant owner is a Splunk administrator account (not
nobody). The Configuration Guardian warns about a tenant with scheduled triage on and a
nobody owner (ai_automation_owner_is_system_user).
Agent settings
The agent’s settings are in the workspace, Settings → AI Agent: scheduled triage on or off, mode, AI provider, review interval, findings per run, time budget per run, the allowed decisions with the longest dismissal, and the custom instructions. Every setting and its default is in Cribl Edge reference.
The Manage AI Agents automation page (Artificial Intelligence menu, AI Agents automation) lists the Cribl Edge tenant with its own agent: a row with whether it is on, its mode and provider, an Enable / Disable toggle, and an edit tab with the core settings (scheduled triage, custom instructions, mode, provider, review interval and runtime). The allowed decisions stay in the workspace. Saving schedules or unschedules the agent’s hourly report at once.
Allowing more (turning the triage on, act mode, a decision, a longer dismissal, custom instructions) needs a licence that allows changes; restricting it never does.
Custom instructions and Evaluate
Custom instructions are plain English that the tenant’s administrators write for the
agent, in Settings → AI Agent → Custom instructions (also in Manage AI Agents automation).
The agent follows them on every run, asked or scheduled. For example: “The nodes named
lab-* are lab machines: a disconnection outside working hours is expected.”
At most 4000 characters; line breaks are kept.
They never widen what the agent may do: the allowed decisions and the conditions TrackMe checks before every decision still decide.
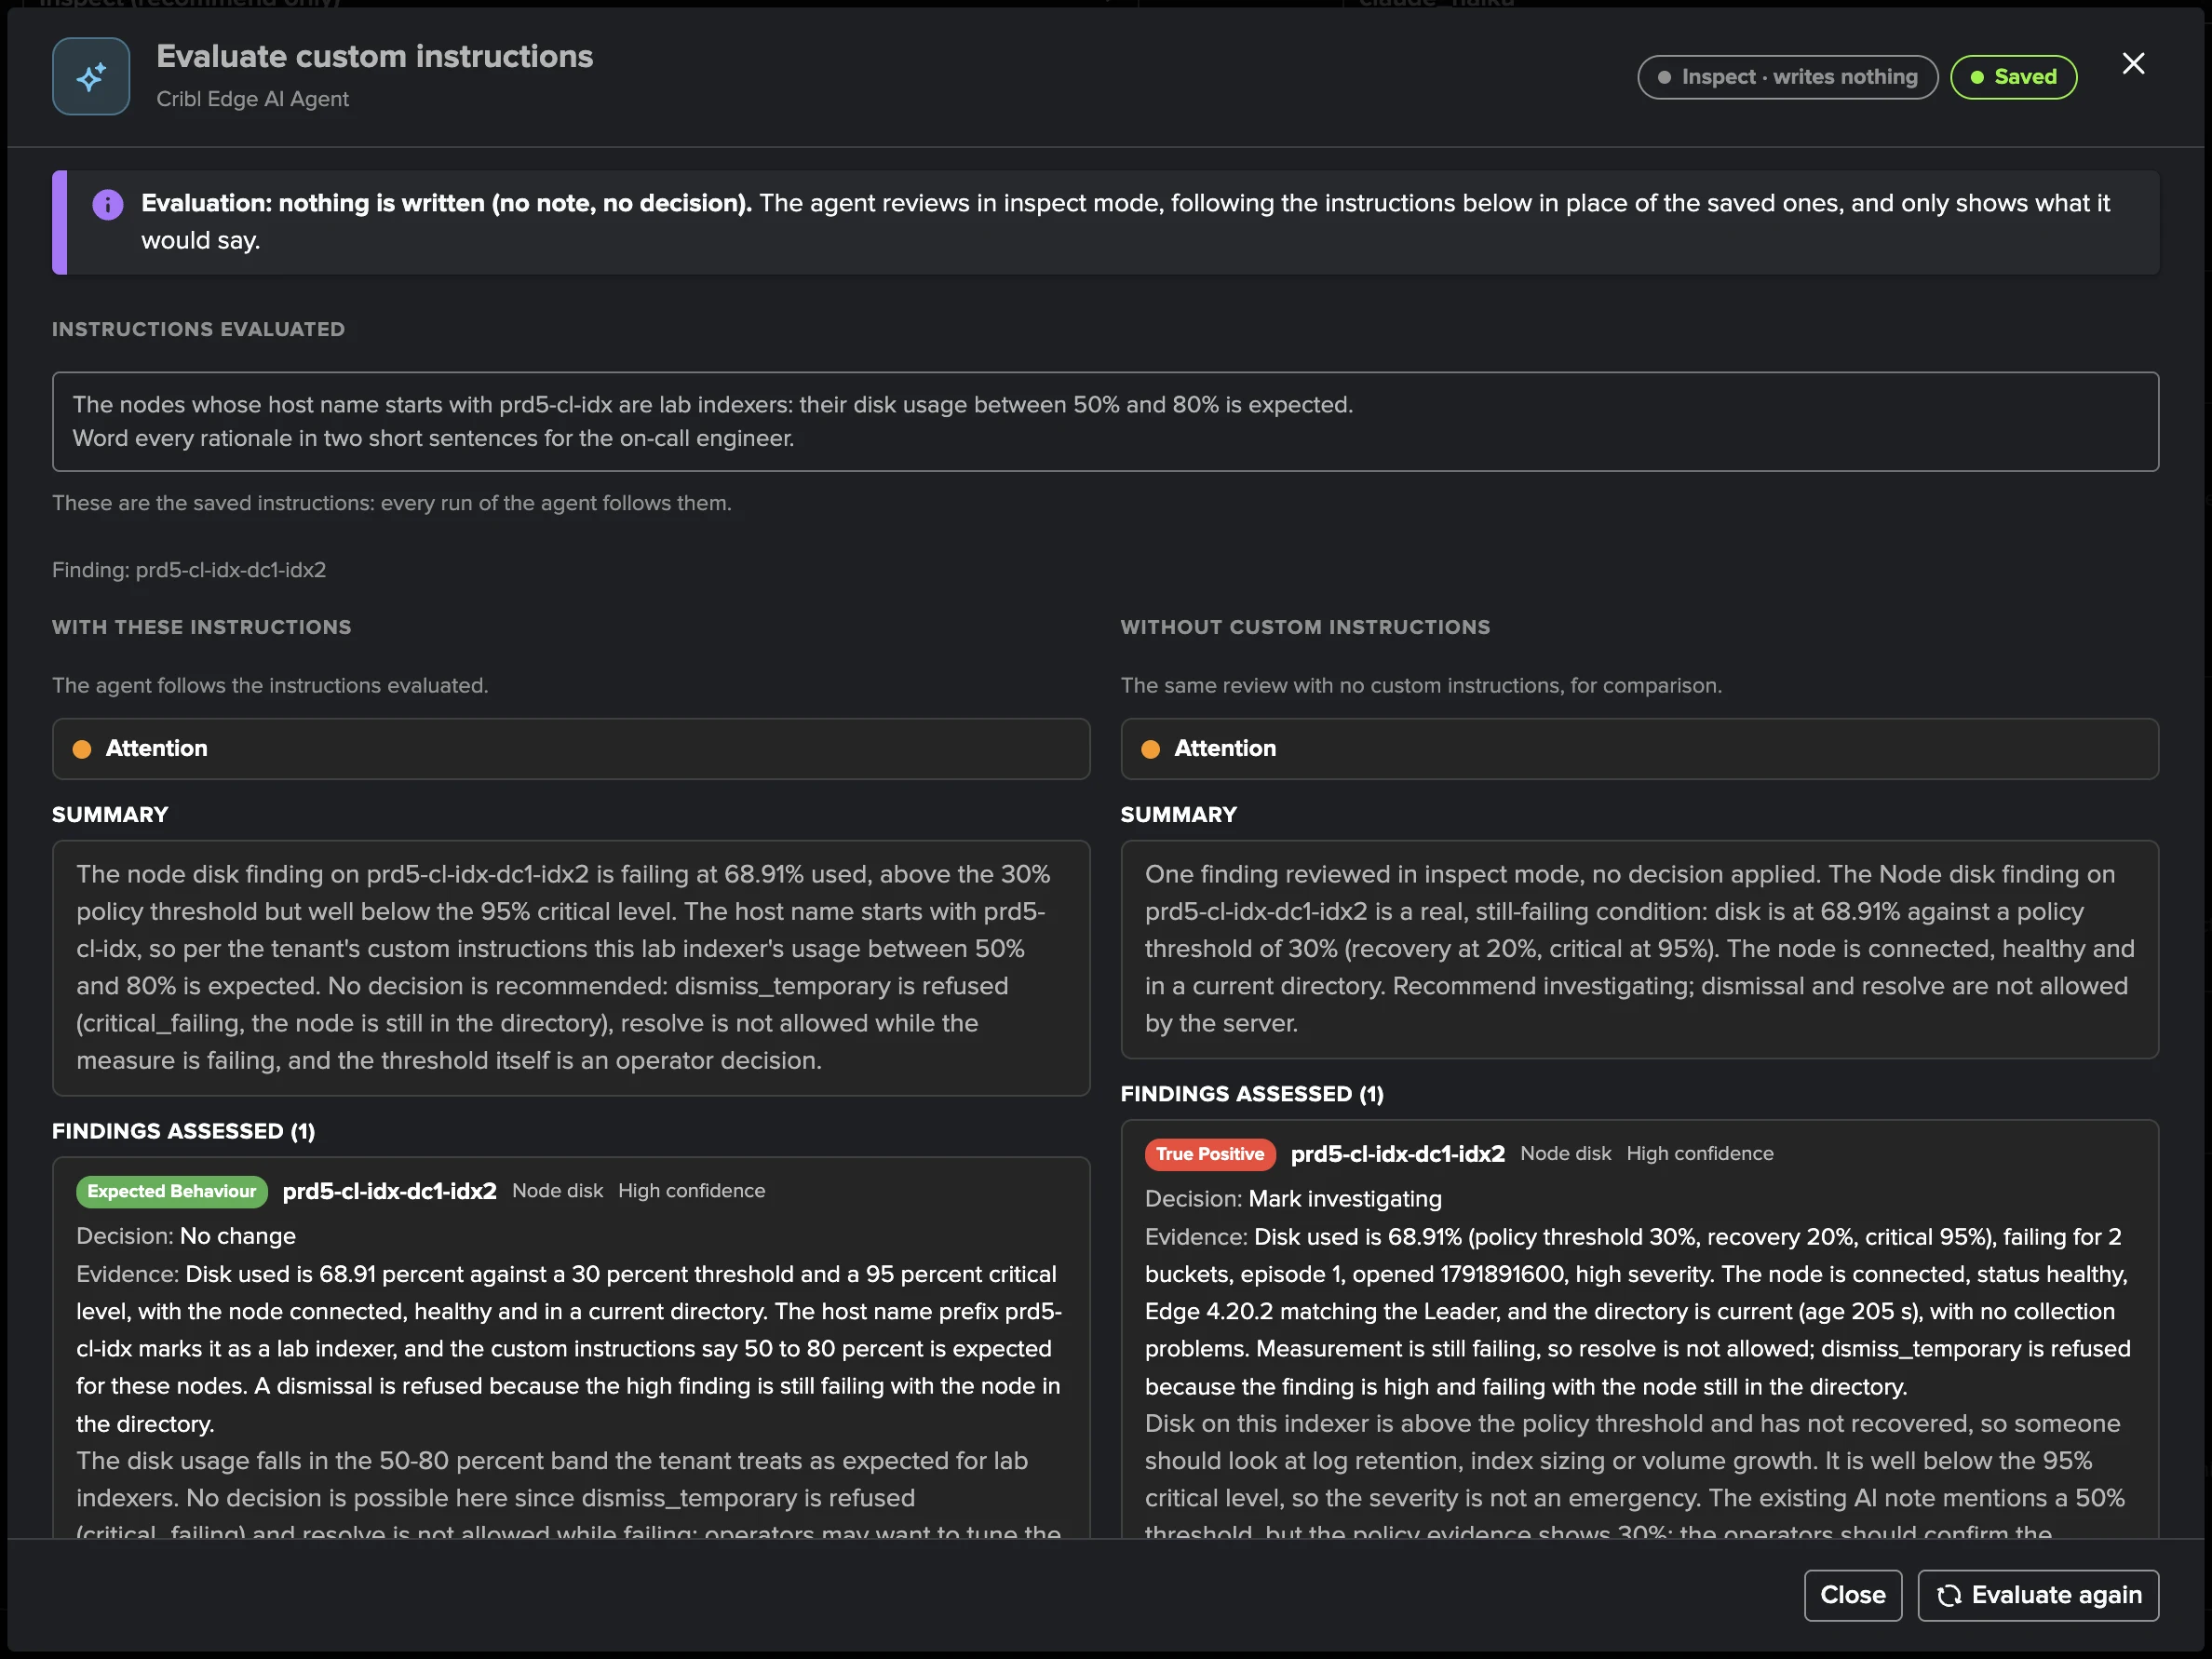
Evaluate…, next to the field, tries a draft before you save it: it runs the agent in
inspect mode with the draft, on one open finding or on a review of the open findings (at
most 10, the most severe first), and can run the same review without custom instructions
side by side. An evaluation writes nothing — no note, no decision, no review record — and
is recorded in the audit with the status evaluation. See AI Agents for findings.
What the AI Agent did
The AI Agent tab: its status, totals, and the decision log; each row opens the facts the agent read and its rationale.
The finding: its history shows each decision under the actor AI Agent, and its notes hold the current
[AI Agent]assessment.The audit dashboards of Auditing AI activity label its runs Cribl Edge AI Agent.
SPL: every run is indexed to the tenant summary index with the sourcetype
trackme:ai_agent:cribl_edge_agent:<inspect|act>.
AI Assistant
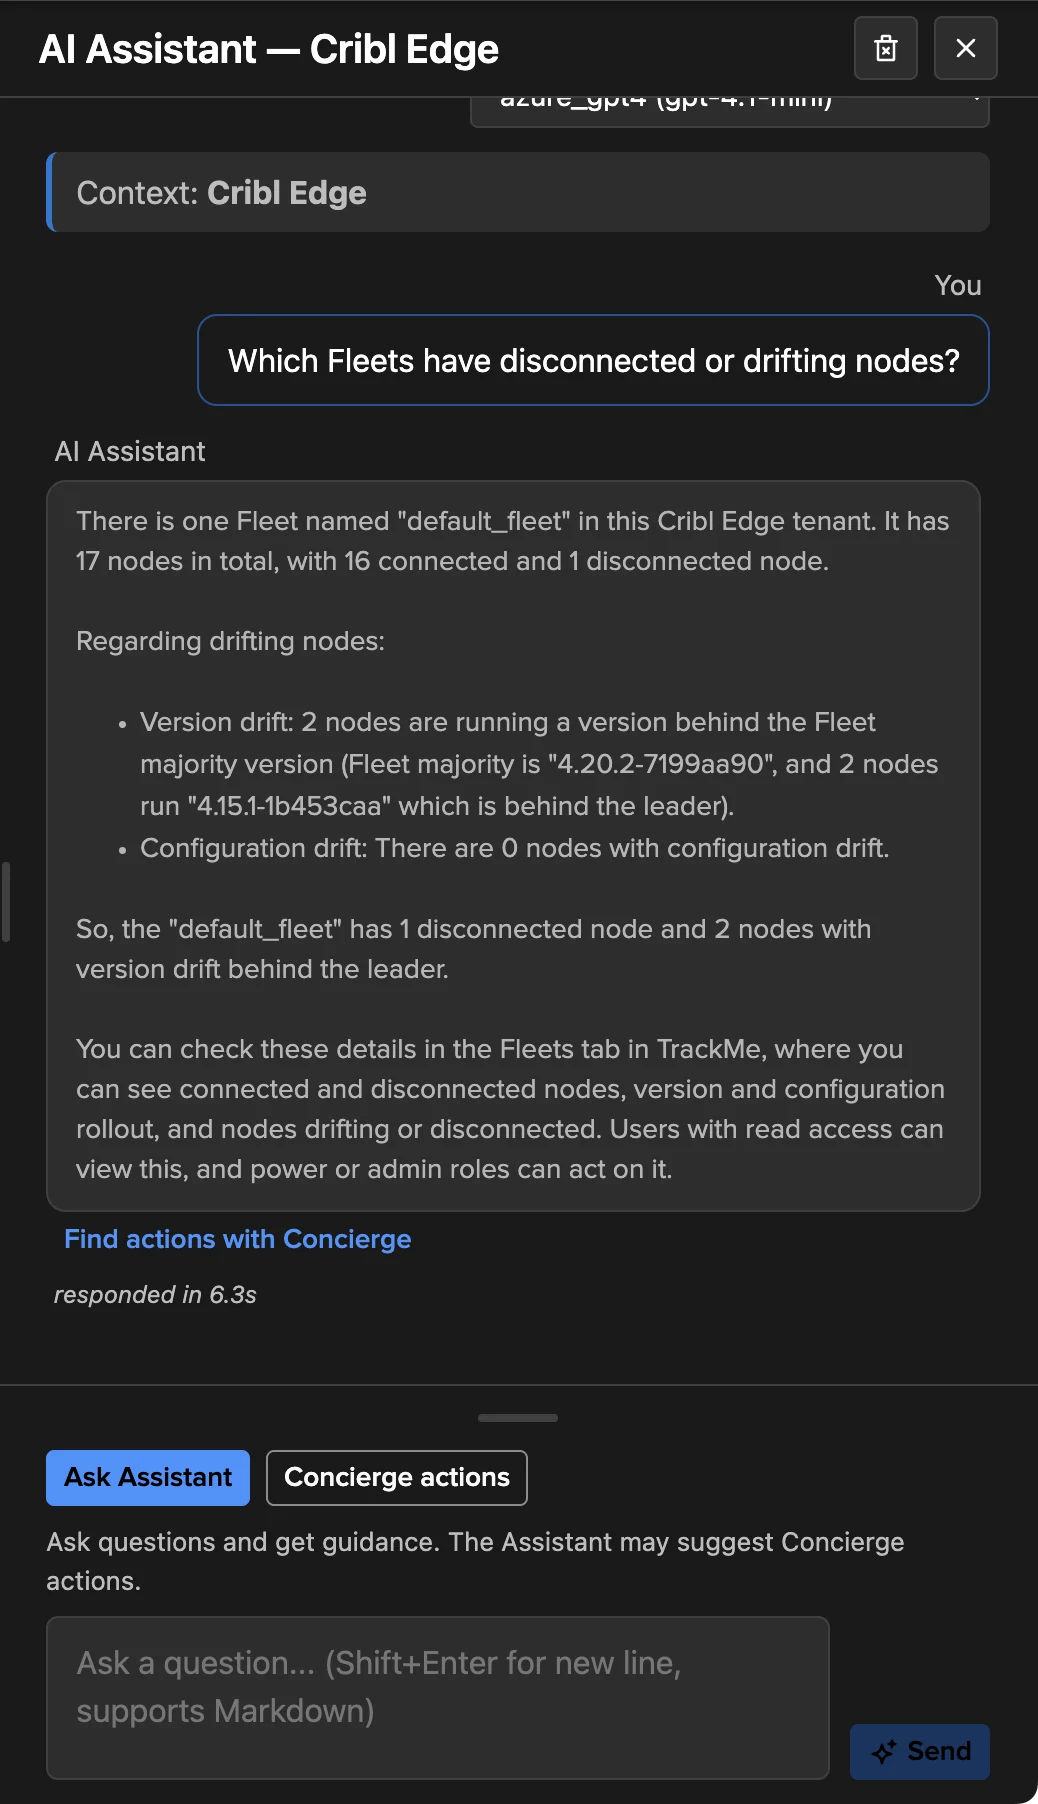
On an Edge tenant’s Tenant Home, the AI Assistant (AI Assistant & Concierge) knows the workspace, the policies and their settings, the Fleets, the node summary, the Leader version and the age of the node directory, and reads the open findings: ask it why a Fleet is in drift, what a policy checks, or what to do about a finding. When a finding or the open findings would benefit from a review, it proposes a Cribl Edge AI Agent review as a consent card: nothing runs until you confirm. In Topology Studio, the assistant and the AI builder know Edge tenants and objects.
What the Cribl Edge tenant does not do
No machine learning: no traffic ML models, no model training, no Expected traffic.
No Concierge actions: the AI Assistant answers questions and can propose a Cribl Edge AI Agent review; changes are made in the workspace or by the AI Agent within its allowed decisions.
No per-policy Actions or Automations tabs in the policy editor: findings actions and automation rules are defined in Settings → Finding actions, for the whole tenant.
No Stop monitoring this object and no Not an anomaly on findings.
No Topology Studio templates for Edge and no numeric rollups on Edge groups (health and healthy share only).
No Cribl internal metrics are read: the Leader API is the source, plus the optional System Metrics index for node CPU and memory.
Cribl Edge and Cribl Stream compared
Cribl Stream tenant |
Cribl Edge tenant |
|
|---|---|---|
Follows |
Worker Groups, Workers and Worker processes, Sources, Destinations, Pipelines, Routes, the Leader |
Fleets and Subfleets, Edge Nodes, the Sources and Destinations of each Fleet, the Leader |
Main source |
Cribl internal metrics in a Splunk metric index (required), plus the Leader API |
The Leader API node directory, plus an optional System Metrics index |
Built-in policies |
16 (14 on out of the box) |
11 (8 on out of the box) |
Judgement |
Per object and measurement, traffic models |
Per Fleet (shares of nodes, graces), per selected node, thresholds |
Machine learning |
Traffic ML models, Expected traffic |
None |
Collection jobs |
Inventory, live metrics, model training |
Inventory (Fleet configuration), live (Edge Nodes) |
Size of one tenant |
Up to about 20 000 monitored objects |
Any fleet size, no node limit |
Workspace tabs |
Findings, Monitoring, Traffic ML models, Infrastructure, Deployment, Routes & pipelines, Inventory, Policies, Collection health, AI Agent, Settings |
Findings, Fleets, Edge Nodes, Policies, Collection health, AI Agent, Settings |
Findings, Finding groups, notifications, assignment, findings actions |
Yes |
Yes, the same |
Policy editor tabs |
General, Actions, Automations |
General (actions and automations in Settings) |
Object-level triage |
Stop monitoring this object, Not an anomaly |
— |
AI |
AI Assistant, Concierge actions, Cribl Stream AI Agent |
AI Assistant, Cribl Edge AI Agent |
AI Agent decisions |
Mark investigating, Dismiss for a time, Not an anomaly, Resolve, Stop monitoring |
Mark investigating, Dismiss for a time, Resolve |
Bank holidays |
Exclude from ML training; Suppress new alerts (Traffic outliers by default, per policy) |
Suppress new alerts (Fleet connectivity and Fleet coverage by default, per policy) |
Topology Studio |
Objects, groups, templates, Topology Alerts |
Objects, groups (health only), Topology Alerts, Create with AI starting points |
Configuration Guardian |
|
|
See Cribl Stream for the Cribl Stream tenant, and Cribl Edge for the Cribl Edge hands-on walkthrough.
Next: the reference
Every policy with its defaults, the jobs and their schedules, the node directory and its bounds, the System Metrics contract, the settings, bank holidays, the AI Agent, the indexed finding events, the permissions, the Configuration Guardian conditions and a troubleshooting table: Cribl Edge reference.