Monitor data sources and hosts with Cribl signals
Use a small stream of activity metrics to monitor the logs passing through Cribl.
Cribl summarizes each host, index and sourcetype over a short window. TrackMe reads
those summaries with mstats to discover data sources (DSM) and hosts (DHM),
track event delay and alert when previously discovered subjects become stale.
This source is designed for estates where repeated searches across the original Splunk indexes are costly to operate. The original logs continue along their existing routes. We recommend a separate monitoring route for control over coverage and metrics delivery. Destination post-processing is an alternative when you want to observe all eligible logs sent to a selected Splunk destination.
Important
A signal means Cribl observed the data. It does not prove that Splunk successfully indexed the original logs. Use separate destination and indexing monitoring where that assurance is required.
Note
The cribl_signals hybrid tracker source is included in TrackMe 2.4.18.
If you are testing a pre-release build, use one that includes this source;
an earlier 2.4.18 build may not contain it.
How it works
There is still one pipeline per route. Add a separate route before the existing matching log routes and turn its Final setting off. Cribl processes a copy through the activity pipeline while the original event continues to the following routes. Existing route pipelines do not need to be replaced. See Cribl route behavior.
The selected point must already have the host, original index, sourcetype and parsed source timestamp you want to monitor. Later changes to those fields are not reflected in signals produced earlier in the flow.
Choose where to observe activity
Both options produce the same metrics and work with the same TrackMe source. Choose one observation point for each population to avoid counting it twice.
Tip
Start with the separate non-final route approach. It gives you more control and flexibility:
Select the sources or feeds to monitor, then expand coverage gradually.
Adjust or disable the monitoring route without editing existing log routes or destination post-processing.
Send metrics to a dedicated destination, independently of the logs.
Inspect and troubleshoot the monitoring branch separately.
One monitoring route can cover several feeds through its filter; you do not need a separate pipeline for every source. Both approaches still share Cribl worker resources. This recommendation is about operational control, not a guarantee of lower overhead.
Choice |
Separate non-final route (recommended) |
Destination post-processing |
|---|---|---|
Coverage |
Events matching the monitoring route, before later route pipelines. |
Eligible logs reaching the selected Splunk destination after route processing. |
Configuration |
Add a monitoring route; existing log route pipelines remain in place. |
Attach or integrate one pipeline per destination; all its routes are covered. |
Original logs |
The monitoring branch handles a copy. Its aggregation has passthrough off. |
Aggregation has passthrough on. Original timestamps and payloads are preserved. |
Metrics delivery |
A separate destination can centralize metrics independently of logs. |
Logs and summaries use the same HEC destination and its queues. |
Best fit |
Default choice for controlled rollout, flexible scope and independent metrics delivery. |
An explicit requirement to cover all eligible outgoing logs at selected destinations. |
Follow steps 1–3 below for the recommended routing option. For destination coverage, use Alternative: observe at the Splunk destination instead of steps 2–3, then continue with step 4. Neither option proves indexing of the original logs.
The pipeline processes every selected event, but emits window summaries rather
than one metric event per original log. Each worker process produces its own
partial summaries. Splunk combines counts with sum and timestamps with max.
Set up a first tracker
1. Prepare Splunk and choose the scope
Create a metrics index, for example cribl_metrics, and a Splunk HEC
destination that can write to it. The TrackMe search account needs read access
to that index. Cribl’s internal metrics may share the index, but they do not
automatically provide the activity metrics in this recipe.
Start with one known source or feed. Confirm that events at the chosen route
have non-empty host, index and sourcetype fields, and a numeric
_time containing the parsed source event time in epoch seconds.
Correct parsing before producing signals; do not replace a missing event time
with the current time, which would make stale data appear fresh.
The examples use neutral names so other monitoring consumers can reuse the same metrics. The Cribl API add-on is not needed to produce or consume them.
2. Create the activity pipeline
Create a pipeline named telemetry_activity_signals. Add the following
functions in order. Keep each function’s Final setting off so the aggregate
can reach the final Eval function. The route-level Final setting is separate.
A. Drop incomplete records from the activity branch
Add a Drop function with this filter:
!host || !index || !sourcetype ||
!Number.isFinite(Number(_time)) || Number(_time) <= 0
This excludes invalid subjects from the copied monitoring branch. The original event continues along the existing log routes. Monitor rejected records during onboarding; unexpected rejections indicate a parsing or metadata problem.
B. Preserve the original metadata and record observation time
Add an Eval function, filter true, with these added fields:
Field |
Value expression |
|---|---|
|
|
|
|
|
|
|
|
Add a second Eval function, filter true, setting _time to
observed_at. This makes aggregation windows follow activity in
Cribl while preserving the source timestamp separately. Old events replayed
today therefore enter today’s observation windows.
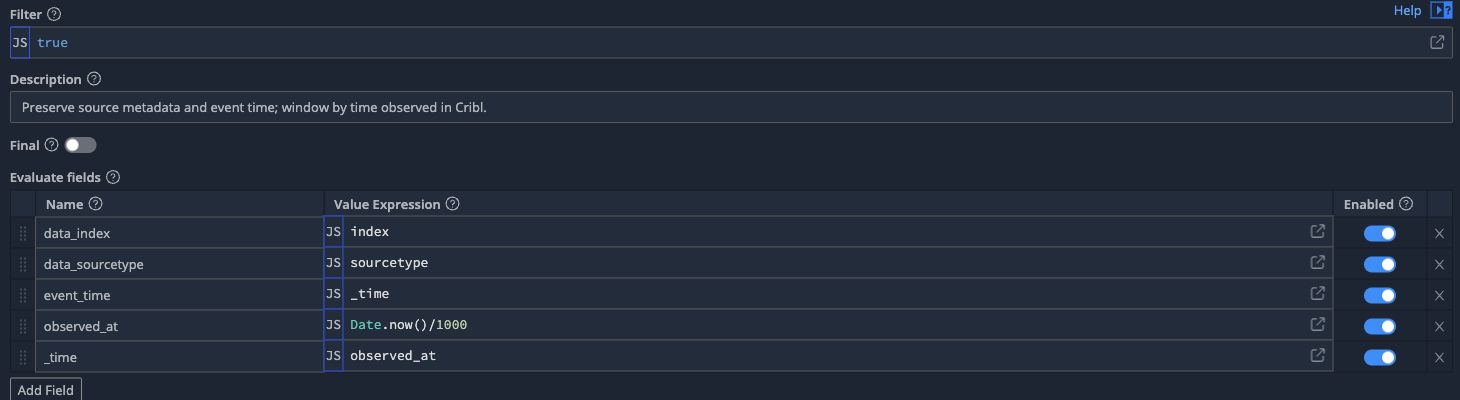
Metadata preservation in the example. Its input already has numeric _time
and its assignments share one Eval. For a new setup, follow the two Eval
functions above, including Number(_time), after the validation Drop.
Optionally remove unneeded payload fields from the copied branch before
aggregation, retaining _time, the three grouping dimensions and both epoch
fields. Retain any additional dimensions used by your trackers too.
C. Aggregate into activity metrics
Add an Aggregations function, filter true. Add these three expressions
as separate aggregates:
count().as('telemetry.activity.events.count')
max(observed_at).as('telemetry.activity.last.observed.epoch')
max(event_time).as('telemetry.activity.last.event.epoch')
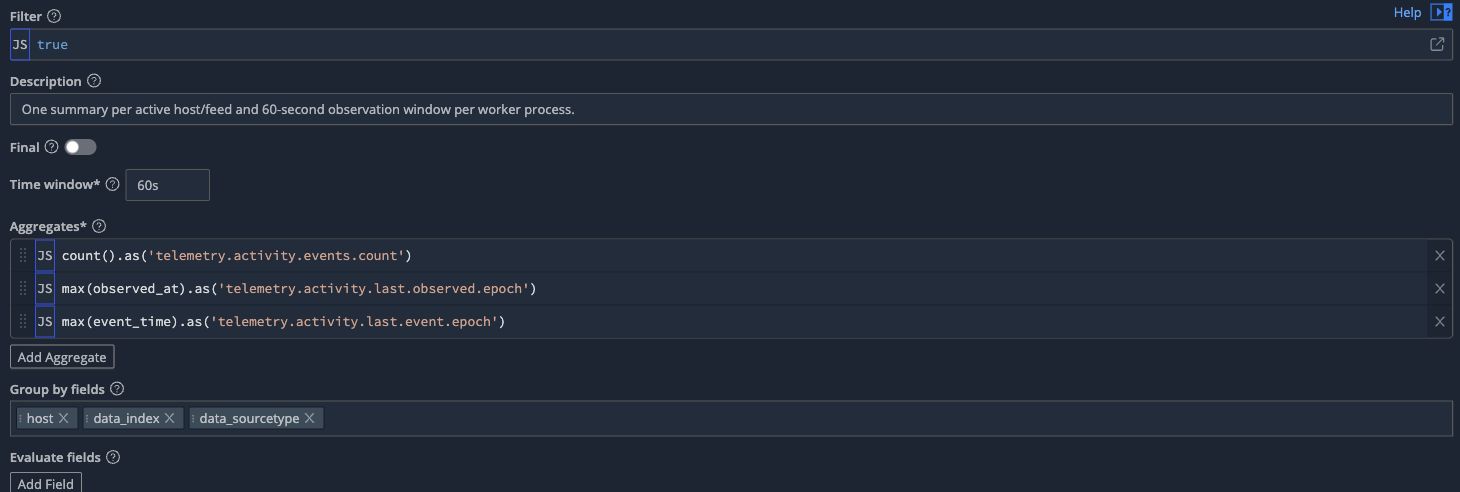
Enter each expression separately, then add the three grouping fields. Keep the function’s Final switch off so its output reaches the next Eval.
Use the following settings as a starting configuration:
Setting |
Value |
|---|---|
Group by fields |
|
Time window |
|
Cumulative aggregations |
Off |
Passthrough mode |
Off |
Metrics mode |
On |
Treat dots as literals |
On |
Lag tolerance / idle bucket time limit |
|
Flush on stream close |
Off |
Aggregation memory limit |
|
These settings are a starting configuration; size the aggregation limit for
your workload. Keep counts non-cumulative so that sum does not repeatedly
count earlier events. The memory limit is per worker process, not a cap on total
worker memory. Monitor flush behavior and memory at your own cardinality. See
Cribl Aggregations.
Keep 60 seconds for the initial setup. For a large estate that can accept less frequent updates, see Choose the aggregation window: 60 seconds or five minutes for a five-minute option and its expected reduction in metric points.
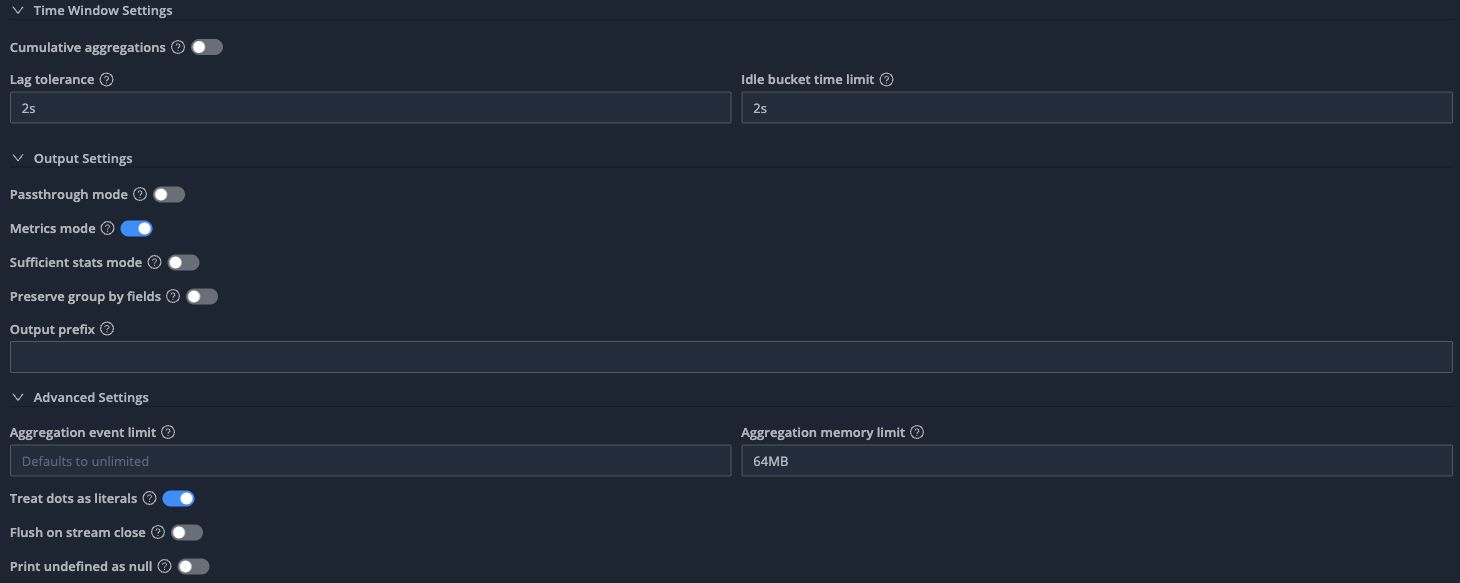
Expand Time Window Settings, Output Settings and Advanced Settings. Enable Metrics mode and Treat dots as literals; leave cumulative aggregation and passthrough off.
D. Select the metrics index
After Aggregations, add an Eval function setting index to the expression
'cribl_metrics'. Preserve the generated metric metadata, including
__criblMetrics. Do not overwrite host, data_index or data_sourcetype.
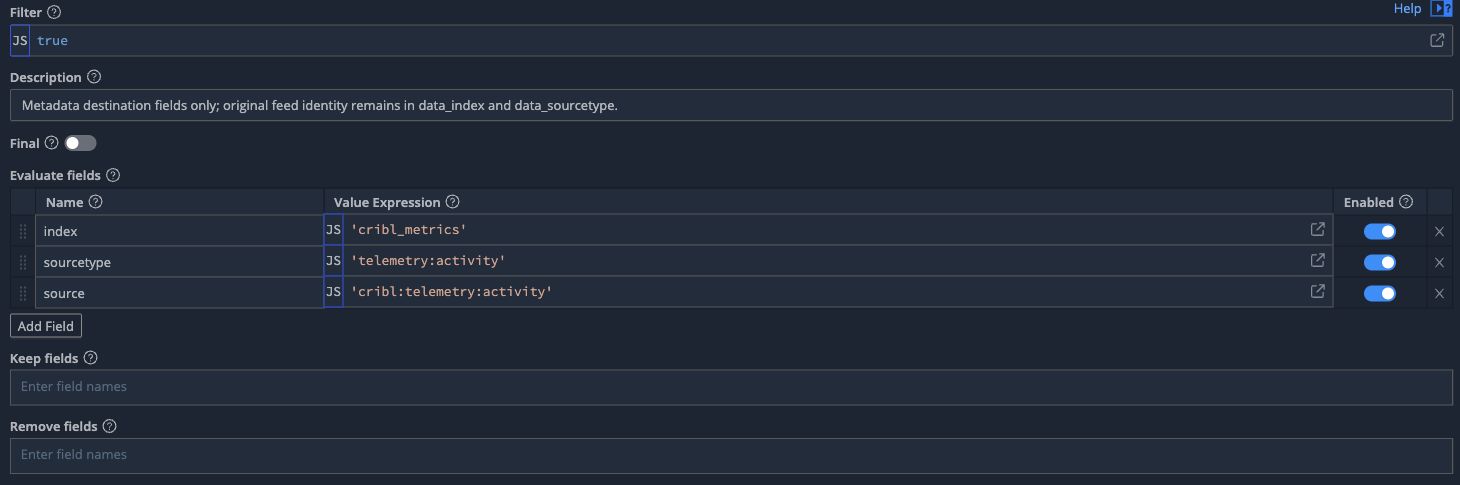
Set index to 'cribl_metrics'. The example also adds optional source
and sourcetype labels for the generated stream; the original sourcetype
remains in data_sourcetype.
The Splunk HEC destination uses Cribl’s metric metadata to format metric points. Its multi-metric option affects serialization, not the three logical measurements in each summary. Check any destination post-processing as well. See the Splunk HEC event format.
3. Add a separate non-final route
Create a route named telemetry-activity-signals immediately before the
existing log routes that handle your selected events:
Filter: your source/feed selection, excluding internal metrics and the generated activity stream.
Pipeline:
telemetry_activity_signals.Destination: the Splunk HEC destination for your metrics index.
Final: Off.

In the route editor, turn Final off. This is the route-level switch, separate from the Final switch inside each pipeline function.
For example, after substituting your actual input ID:
__inputId === 'splunk_hec:example_logs' && index !== 'cribl_metrics'
Inspect the route order: an earlier matching final route prevents events from reaching this branch. Do not add a second activity route matching the same events, or count metrics will be duplicated. Keep the original routes’ settings and destinations as they are.
Use Data Preview to check the field names and numeric values, then commit and deploy to a small scope. Confirm that original pipeline traffic continues and that fresh metrics arrive after the window flushes.
A separate route still shares workers and buffering resources. Configure and test the metadata destination’s backpressure and queue policy so a metadata outage does not unexpectedly stall the original log flow.
Alternative: observe at the Splunk destination
Destination post-processing is a valid alternative when broad destination coverage is the priority. One attachment covers eligible logs from all routes using that destination, after their route pipelines. Repeat the attachment for each destination you intend to monitor. Prefer the separate-route approach when you need finer scope control, gradual rollout or independent metrics delivery.
This changes the observation boundary: records dropped earlier are absent, and prior sampling, cloning or metadata changes affect the resulting counts and identities. Broader coverage also means processing more traffic; qualify worker overhead and delivery behavior for that scope before expanding it.
Important
Do not attach the routing recipe above unchanged. Its aggregation consumes the copied events, and its final Eval changes every output to the metrics index. On the live log path, use passthrough On and restrict metric formatting to the newly generated summaries.
1. Create a separate destination pipeline
Download telemetry_activity_destination.json. Create a pipeline
with that ID and paste the JSON into Manage as JSON, or import it. This is an
example for a metrics index named cribl_metrics; adjust both the exclusion
filter and summary index if you use another name.
The six functions run in this order, all with Final off:
Step |
Function |
Purpose |
|---|---|---|
1 |
Eval: select eligible logs |
Require host, index, sourcetype and a valid source epoch. Exclude existing metrics and the metrics index. Save the original timestamp internally. |
2 |
Eval: observation window |
Temporarily set |
3 |
Aggregations: passthrough On |
Group by host, index and sourcetype. Emit the same count and two maximum
epochs over 60 seconds. Its Evaluate fields setting adds
|
4 |
Eval: restore original logs |
Restore the original |
5 |
Eval: summary dimensions |
Only on marked summaries, copy index to |
6 |
Eval: summary destination |
Only on marked summaries, set the metrics index and update
|
Reserve the example’s __activity_* fields for this pipeline. The recipe
preserves original _raw, index, sourcetype and source timestamps; Cribl can
still add its usual pipeline bookkeeping. Existing transformations continue to
apply. If you add grouping dimensions, add them to both the aggregation group-by
list and the final metric dimension list in the JSON.
View the complete destination pipeline JSON
{
  "id": "telemetry_activity_destination",
  "conf": {
    "output": "default",
    "streamtags": [],
    "groups": {},
    "asyncFuncTimeout": 1000,
    "description": "Preserve original logs and emit 60-second activity summaries to a Splunk metrics index.",
    "functions": [
      {
        "id": "eval",
        "filter": "typeof __criblMetrics === 'undefined' && index !== 'cribl_metrics' && !!host && !!index && !!sourcetype && Number.isFinite(Number(_time)) && Number(_time) > 0",
        "conf": {
          "add": [
            {
              "name": "__activity_original_time",
              "value": "_time"
            }
          ]
        }
      },
      {
        "id": "eval",
        "filter": "typeof __activity_original_time !== 'undefined'",
        "conf": {
          "add": [
            {
              "name": "_time",
              "value": "Date.now()/1000"
            }
          ]
        }
      },
      {
        "id": "aggregation",
        "filter": "typeof __activity_original_time !== 'undefined'",
        "conf": {
          "passthrough": true,
          "preserveGroupBys": false,
          "sufficientStatsOnly": false,
          "metricsMode": true,
          "timeWindow": "60s",
          "aggregations": [
            "count().as('telemetry.activity.events.count')",
            "max(_time).as('telemetry.activity.last.observed.epoch')",
            "max(Number(__activity_original_time)).as('telemetry.activity.last.event.epoch')"
          ],
          "cumulative": false,
          "shouldTreatDotsAsLiterals": true,
          "flushOnInputClose": false,
          "printUndefineds": false,
          "groupbys": [
            "host",
            "index",
            "sourcetype"
          ],
          "lagTolerance": "2s",
          "idleTimeLimit": "2s",
          "flushMemLimit": "64MB",
          "add": [
            {
              "name": "__activity_summary",
              "value": "true"
            }
          ]
        }
      },
      {
        "id": "eval",
        "filter": "typeof __activity_original_time !== 'undefined'",
        "conf": {
          "add": [
            {
              "name": "_time",
              "value": "__activity_original_time"
            }
          ],
          "remove": [
            "__activity_original_time"
          ]
        }
      },
      {
        "id": "eval",
        "filter": "__activity_summary === true",
        "conf": {
          "add": [
            {
              "name": "data_index",
              "value": "index"
            },
            {
              "name": "data_sourcetype",
              "value": "sourcetype"
            }
          ]
        }
      },
      {
        "id": "eval",
        "filter": "__activity_summary === true",
        "conf": {
          "add": [
            {
              "name": "index",
              "value": "'cribl_metrics'"
            },
            {
              "name": "source",
              "value": "'cribl:telemetry:activity'"
            },
            {
              "name": "sourcetype",
              "value": "'telemetry:activity'"
            },
            {
              "name": "__criblMetrics",
              "value": "[{dims: ['host', 'data_index', 'data_sourcetype'], values: __criblMetrics[0].values, types: __criblMetrics[0].types}]"
            }
          ],
          "remove": [
            "__activity_summary"
          ]
        }
      }
    ]
  }
}
2. Preview before attachment
Use representative samples, including multiple hosts/feeds, replayed timestamps, missing metadata and pre-existing metric events. Compare original log payloads, metadata and timestamps before and after. Eligible logs should produce additional summaries; other events must remain on the normal output path. Check the metric view for separate host/feed series and the exact three required dimension names.
In our synthetic preview, 100 logs across three feeds produced 103 outputs: 100 original logs and three summaries with counts 80, 15 and 5. Original source timestamps remained unchanged; summary windows used current observation time. After mapping the internal metric dimensions, preview showed nine metric series: three metrics for each of three feeds. This validates the sample pipeline transformation, not a live destination rollout or an overhead benchmark.
3. Attach to the destination and qualify delivery
Open the Splunk HEC destination and select the pipeline under its post-processing setting. If a post-processing pipeline already exists, integrate these functions at the intended observation point within it; do not overwrite existing processing. Ensure earlier Final functions do not skip the activity functions. Repeat this configuration for each destination you intend to cover.
Use the HEC event endpoint and ensure its token permits both the original event
indexes and the metrics index. Cribl uses __criblMetrics to distinguish metrics
from logs on this shared output. Existing field-removal or serialization functions
must preserve that metadata and the three dimensions on generated summaries.
Then commit/deploy in a controlled scope and verify both original logs and
metrics in Splunk before expanding coverage. See
Cribl pipeline attachment and
Splunk HEC event format.
Avoid duplicate observations. Do not enable the route and destination recipe for the same events into the same signal population. If logs fan out to several Splunk destinations, observing all copies inflates event counts. Choose one boundary, or emit a stable destination dimension and scope separate trackers to it. Do not sum those destination copies as unique source events.
This option shares the destination’s delivery path: its queue or outage can delay signals together with logs. Observation still occurs before successful indexing. If metrics must go to an independent central destination, the separate-route option is usually simpler. TrackMe configuration is identical once the required metrics and dimensions arrive.
4. Verify the signals in Splunk
Before creating a tracker, check that the three metrics and their dimensions arrive in the metrics index. These searches inspect the signals stored in Splunk; they do not confirm indexing of the original logs.
Discover the metrics with mcatalog
Set the search time picker to Last 60 minutes, then run:
| mcatalog values(metric_name) AS metrics, values(_dims) AS dimension
  WHERE index=cribl_metrics metric_name=telemetry.activity.*
The result should list telemetry.activity.events.count,
telemetry.activity.last.observed.epoch and
telemetry.activity.last.event.epoch. values(_dims) lists dimension
names, such as data_index and data_sourcetype; it does not list their
values or calculate event counts.
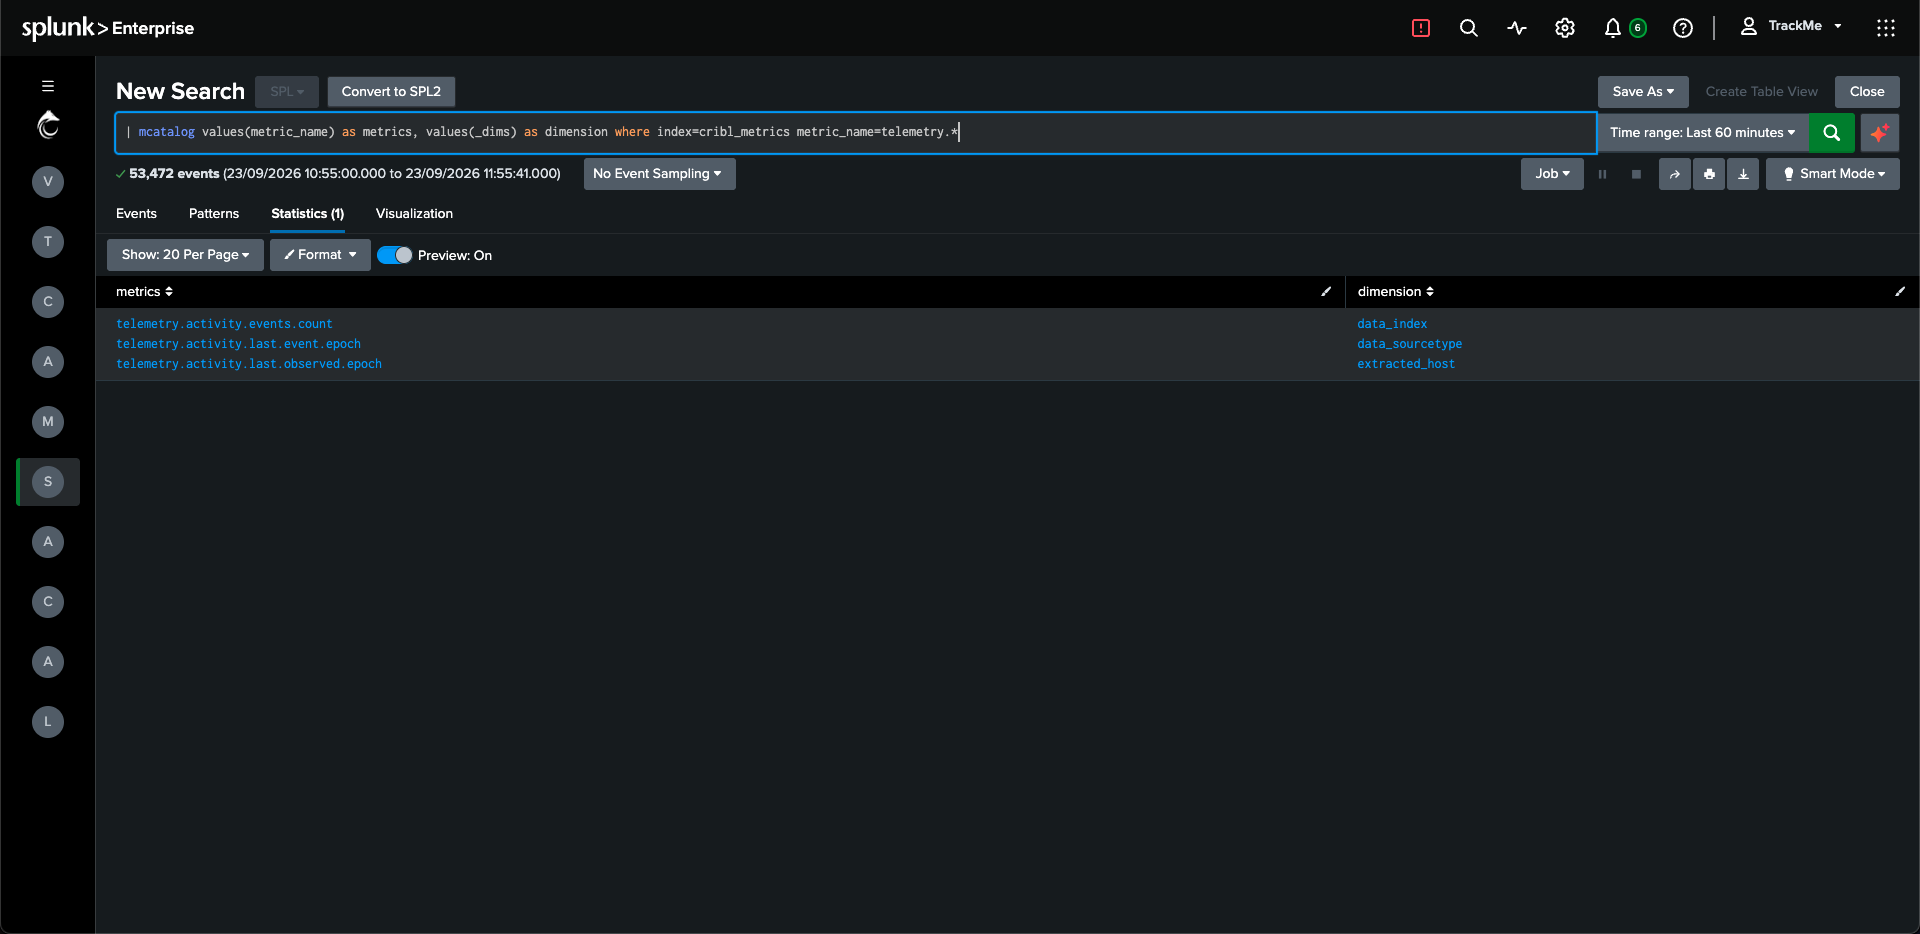
Discover the metric names and dimensions before running the tracker query.
Inspect individual metric points with mpreview
Use mpreview to inspect the stored values and metadata. Start with the
last observation timestamp:
| mpreview index=cribl_metrics
  filter="metric_name=telemetry.activity.last.observed.epoch"
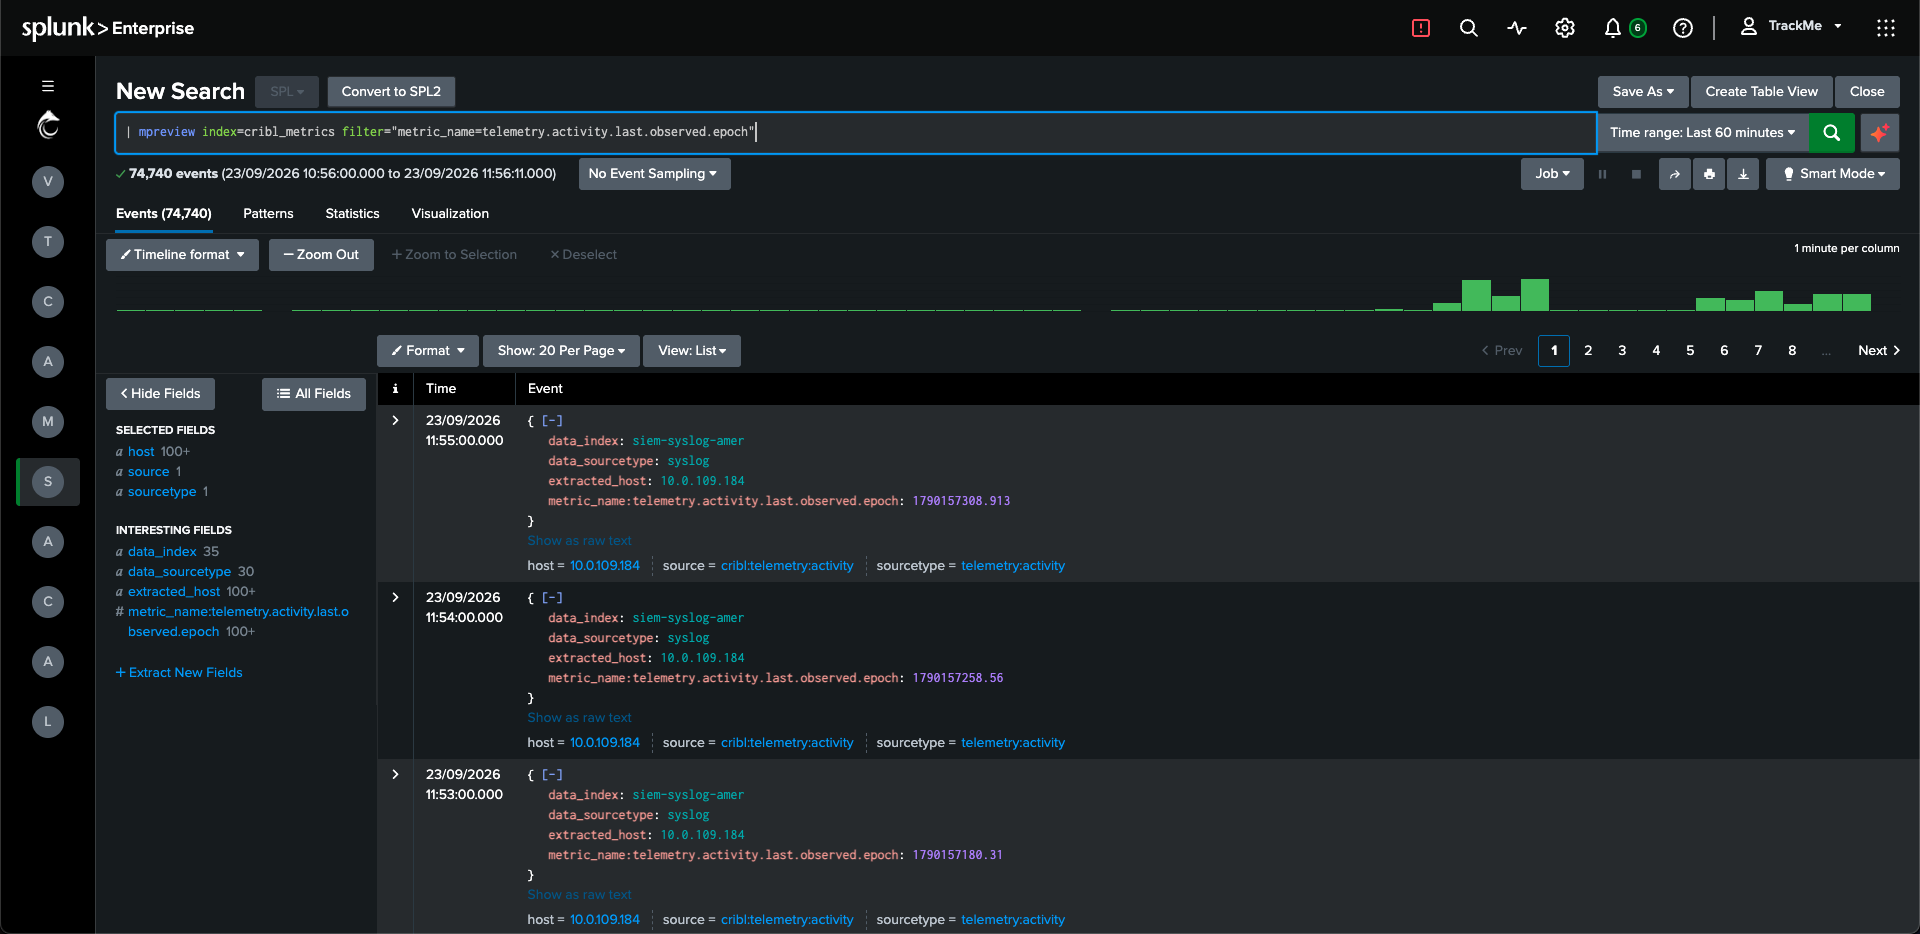
The numeric metric value is the latest observation epoch recorded by Cribl for that aggregation window.
Inspect the latest source event timestamp in the same way:
| mpreview index=cribl_metrics
  filter="metric_name=telemetry.activity.last.event.epoch"
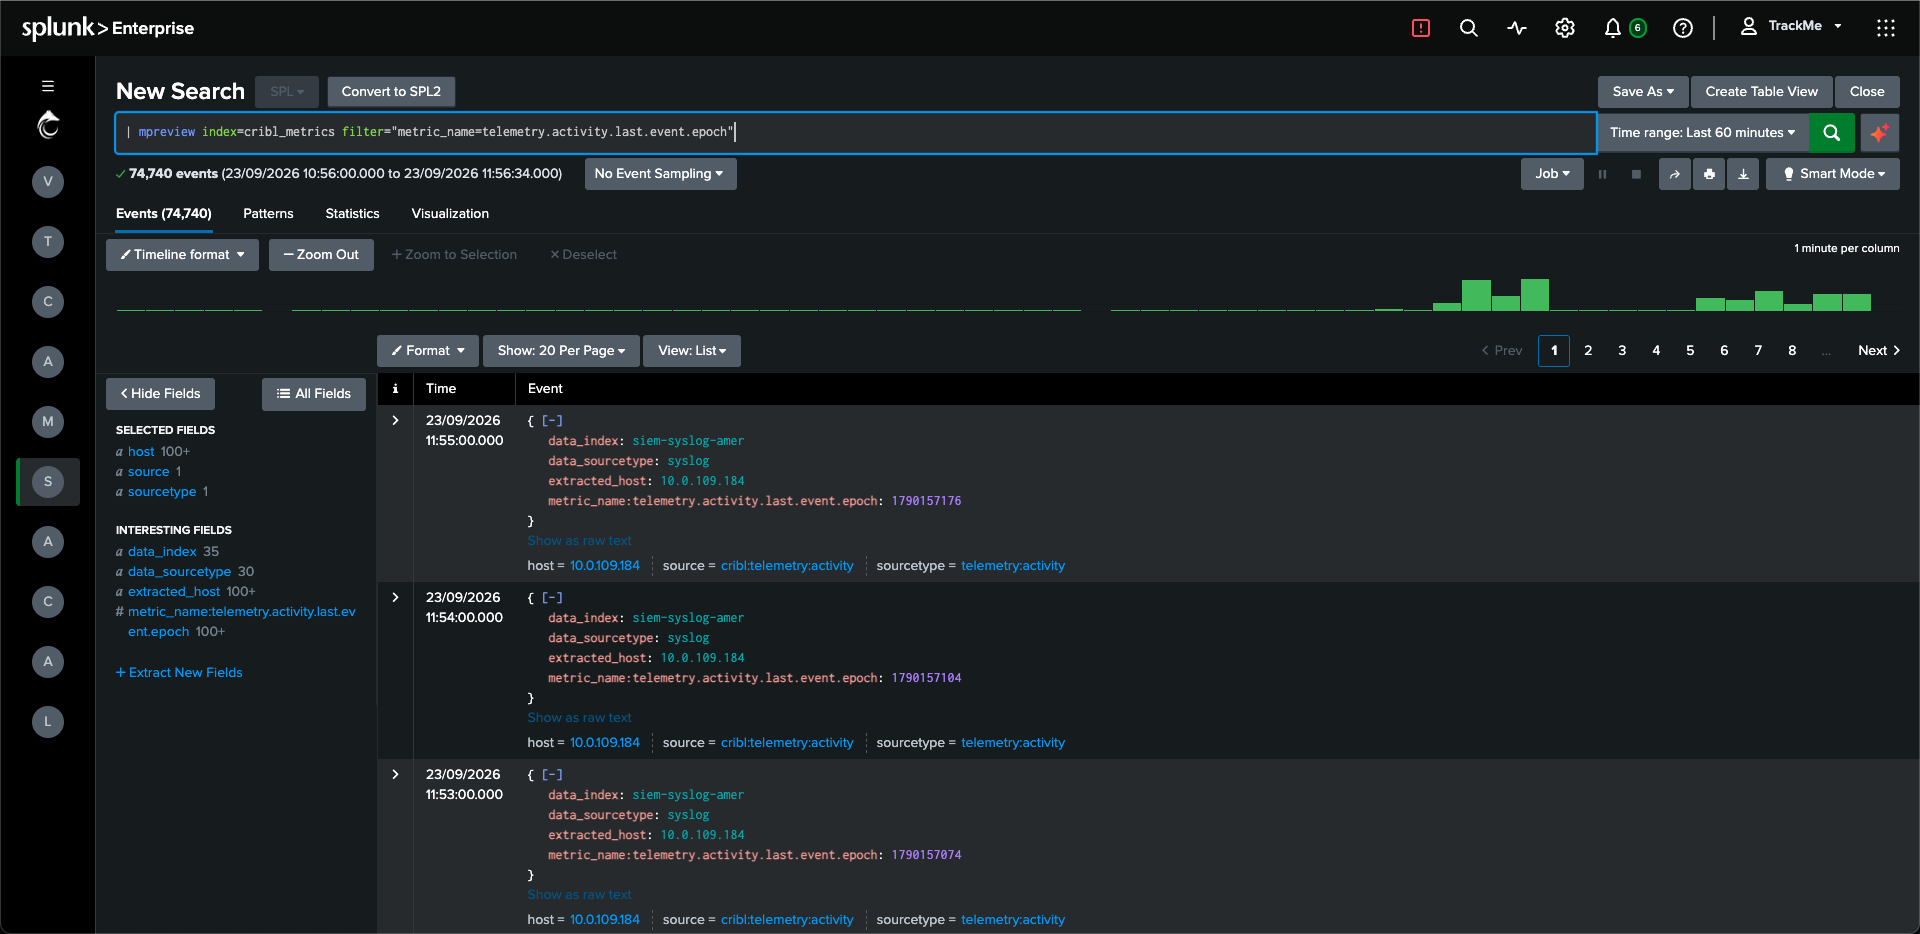
This metric carries the latest source event timestamp. The displayed row time is the metric point’s timestamp, not this metric’s epoch value.
Finally, inspect the event count:
| mpreview index=cribl_metrics
  filter="metric_name=telemetry.activity.events.count"
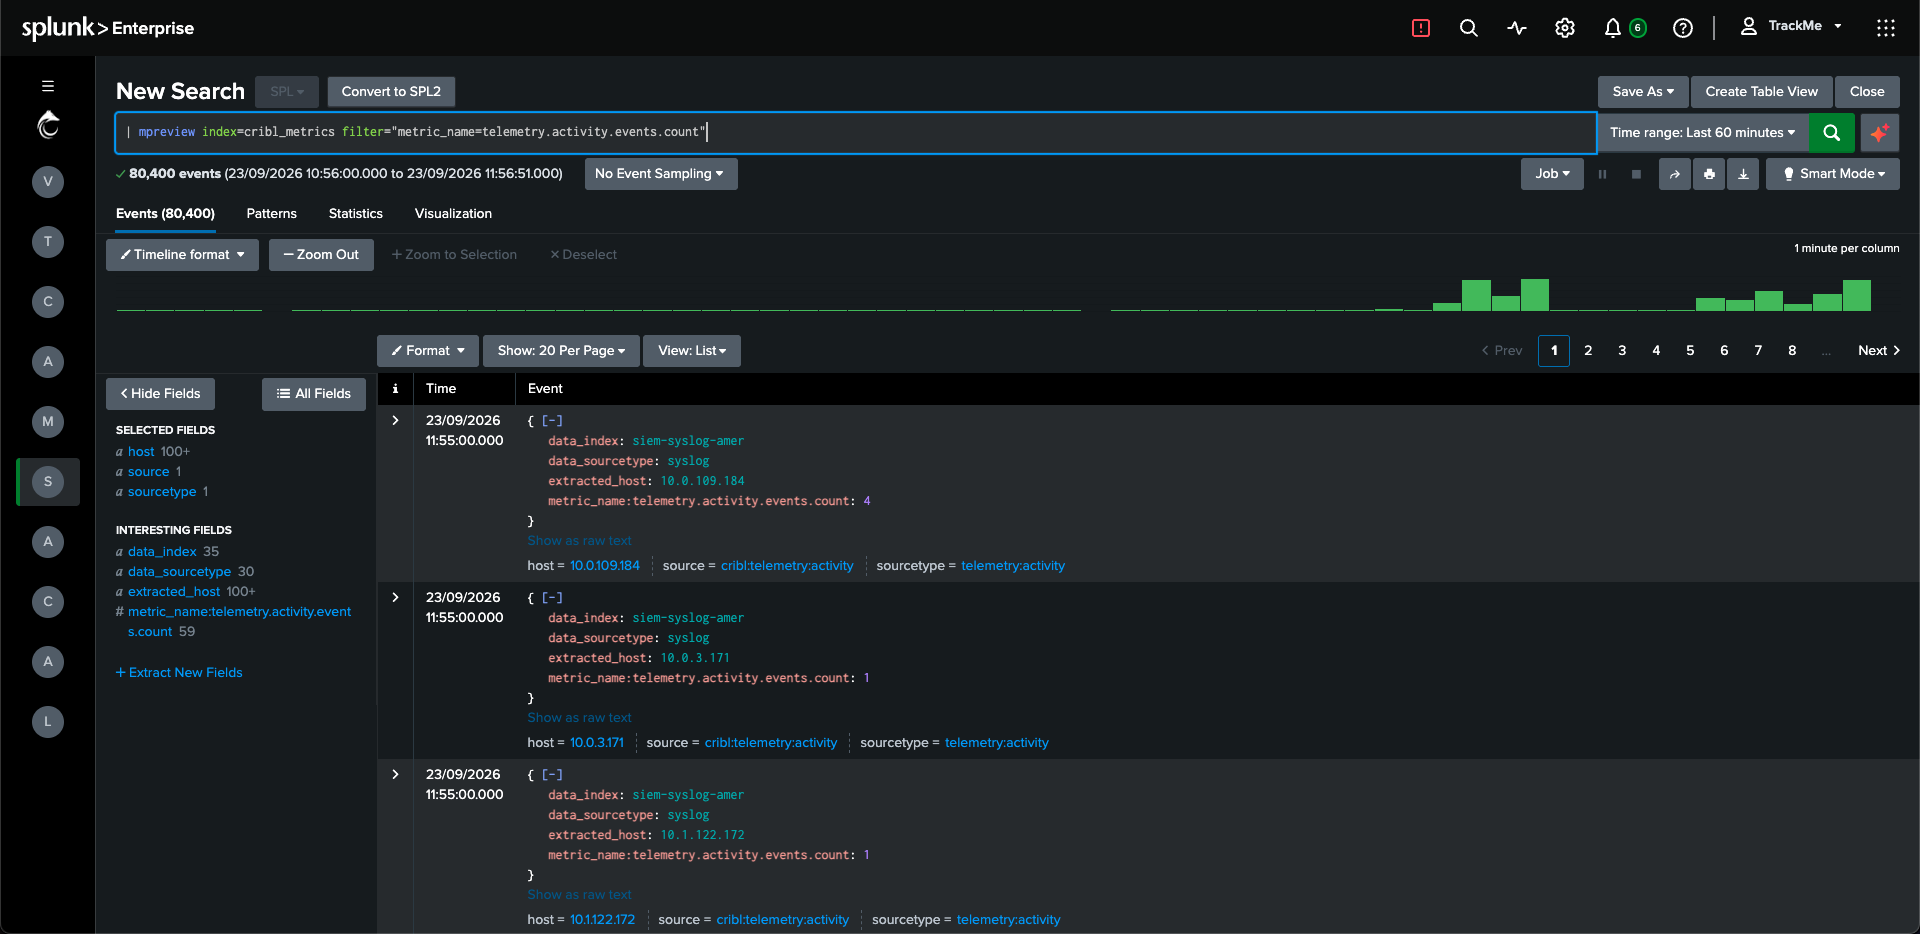
Each value counts source events in one emitted aggregation summary.
The screenshots show an additional extracted_host dimension in this example.
The original host is also present as Splunk’s host metadata beneath each
preview row. Verify that host identifies the original producer; the tracker
query below uses host, data_index and data_sourcetype.
mpreview returns a preview of metric points, with a default target of five
points per time series per metrics index file. Its displayed result count is
not the number of original log events. Keep a bounded time range and, for a
large estate, add a known host to the filter, for example
filter="metric_name=telemetry.activity.events.count host=example-host".
Use mstats for the event-count totals. See Splunk’s
mpreview reference
and mcatalog reference.
Aggregate activity with mstats
Run this search to produce one row per subject:
| mstats
    sum(telemetry.activity.events.count) AS event_count
    max(telemetry.activity.last.observed.epoch) AS last_seen
    max(telemetry.activity.last.event.epoch) AS last_event
  WHERE index=cribl_metrics earliest=-15m latest=now
  BY host data_index data_sourcetype
| eval delay_seconds=round(now()-last_event,1),
       inactivity_seconds=round(now()-last_seen,1)
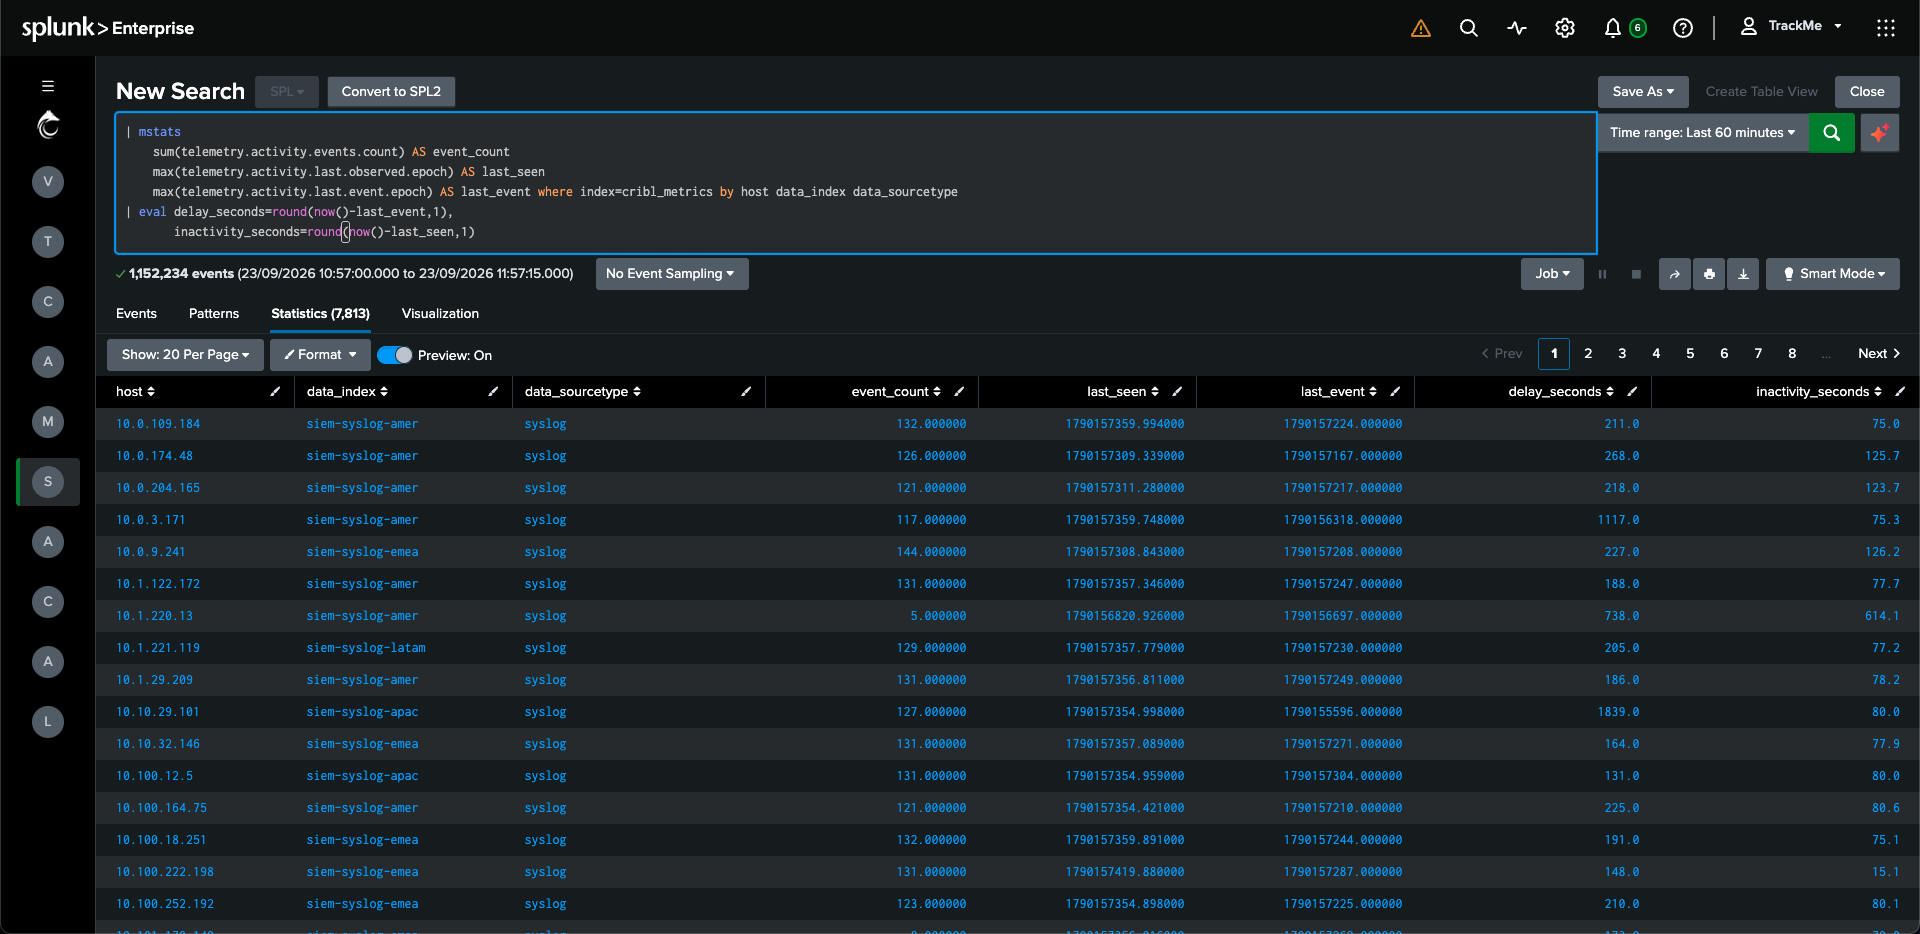
Aggregated activity by host, original index and sourcetype. The screenshot uses the Last 60 minutes time picker; the query above explicitly uses the last 15 minutes.
Each row should identify an original host/index/sourcetype combination.
index=cribl_metrics selects the storage index; data_index names
the original log index. Check a known subject’s count and timestamps against
the input, allowing for flush, delivery and search-window boundaries.
The two ages answer different questions:
Event delay:
now() - last_event. How old is the newest source event timestamp represented in the signals?Inactivity:
now() - last_seen. How long since Cribl observed activity for this subject?
last_seen - last_event is not event-level latency: the maxima may come from
different events. Neither value is Splunk’s original-log indexing time.
5. Create the DSM or DHM hybrid tracker
In the TrackMe tenant, create a hybrid tracker and select Cribl signals as the search mode. Choose the Splunk deployment containing the metrics index. Use the default constraint:
index=cribl_metrics
This is an mstats WHERE constraint, not a complete SPL search. Add dimension
filters when needed, for example:
index=cribl_metrics estate="example" region="emea"
Those dimensions must exist on the generated metrics. Add them to the producer’s
group-by list before using them for filtering or custom tracker grouping.
Do not group by *: unnecessary dimensions increase cardinality and cost.
Keep the initial observation lookback at -15m to now, test discovery, review the results, then choose the schedule and create the tracker. The lookback must cover aggregation, delivery and scheduling jitter. It selects summary timestamps, not the source event timestamps stored as metric values; index-time controls do not apply to this source.
DSM normally creates one entity per original index/sourcetype. Custom grouping and merged-sourcetype mode follow the existing DSM conventions.
DHM normally creates one entity per host and keeps its index/sourcetype combinations. Custom host identifiers and additional combination dimensions must also exist in the producer’s metric dimensions.
Use a separate tenant for an initial comparison with existing trackers. Filters scope input data; they do not automatically become entity identity. If two trackers discover the same identity in one tenant, they update the same entity. Use separate tenants or disjoint identities for overlapping estates, repeated hostnames, or comparisons between signals and indexed-log monitoring.
What changes in the entity view
The regular DSM/DHM overview shows event delay, time since Cribl observation and the last known event count in formatted single-value cards, alongside impact score and SLA percentage. Use the time picker to explore the recorded event-count and delay timeline. DHM also retains its index, sourcetype and configured extra-dimension breakdowns. Chart search and refresh actions, delay thresholds, monitoring windows, retained entities and the normal alert lifecycle remain available.
Splunk ingestion latency is marked as unavailable. Latency columns and DSM sampling controls are hidden. Performance Metrics retains supported count, delay and DSM host-count options; count-based outlier detection remains available when enough history exists. Raw sampling and parsing-quality views are excluded.
The search icon, row action and bulk search can investigate original logs using the recorded index, sourcetype and host or custom identifier. Verify the search deployment and time range: centralized metrics do not imply that the original logs are searchable there. No result is not, by itself, proof of data loss.
AI Assistant and the relevant Advisors receive the Cribl observation context. They distinguish event delay from observation age, treat latency as unavailable, and can help with delay thresholds, count-based models and history readiness. The AI Feeds Advisor remains available when AI is enabled. Monitor Cribl’s own workers and destinations separately with the Cribl infrastructure integration.
Counts are totals over the last successful tracker lookback. They are not a cumulative counter, and overlapping tracker runs must not be added together. The history’s five-minute counts describe observation windows; the newest bucket can be partial and missing buckets are not synthesized as zero.
A subject with no recent signal produces no new mstats row. TrackMe retains
previously discovered entities and evaluates their stored timestamps, so silence
can become an alert. Replayed older data does not move retained maxima backwards.
A host that never appeared still needs expected-host inventory monitoring.
Scale, overhead and validation
The monitoring workload moves from searches over distributed original-log
metadata to searches over a dedicated summary dataset. tstats already uses
indexed metadata; the benefit comes from reducing the dataset and consolidating
the monitoring searches, not from avoiding raw-payload reads that tstats
never required.
Cribl adds per-event evaluation, aggregation state and summary delivery work. CPU demand follows input event rate and processing complexity; memory also follows active grouping cardinality and flush behavior. Output volume can be estimated from active feeds, aggregation windows and emitted summaries, but worker requirements need measurements at representative traffic and peak load.
For 200,000 hosts, two active feeds per host, a 60-second window and one contributing process per feed/window, the arithmetic is approximately 6,667 summaries/s, containing 20,000 numeric measurements/s. A 300-second window reduces the nominal output rate to one fifth under those assumptions, while increasing reporting delay. Neither scenario predicts worker count or license cost.
Read the overhead and sizing guide for worker resource considerations and a repeatable validation method. Use Splunk storage estimation to convert metric points into daily disk growth, retained volume and storage cost.
Before expanding the scope, validate peak event rate, active feed cardinality, worker-process fan-out, memory, output volume and search duration. Also test silence, replay, restart and metadata-destination failure. TrackMe still maintains its own entities and host/feed combinations; this source does not remove those capacity considerations.
Choose the aggregation window: 60 seconds or five minutes
60 seconds remains the default in this guide and its downloadable recipe. It provides responsive feedback during setup and troubleshooting. Consider five minutes for a large estate when reducing metric volume matters more than seeing new activity within about a minute.
With continuous activity and one summary per feed, worker process and window, the comparison is:
Measurement |
60 seconds |
Five minutes |
|---|---|---|
Summaries per hour |
60 |
12 |
Metric points per hour (three metrics) |
180 |
36 |
Reduction in metric points |
Baseline |
80% fewer |
A metric point here means one numeric measurement, not one HEC request or serialized event. The reduction assumes the same active feeds and contributing processes in both cases. Sparse activity and early flushes can change the result. See Five-minute windows: estimated savings for estate-wide examples.
How to try five minutes
In the activity pipeline, open Aggregations and change Time window from
60sto5m(equivalently300s). In the function’s JSON configuration, this is"timeWindow": "5m". Update any description that still says 60 seconds.Keep the metric names, grouping dimensions and non-cumulative counts. Preserve the recipe’s passthrough setting: off for the monitoring route, on for destination post-processing. Keep Flush on stream close off.
Review the other flush settings. The recipe uses a 2-second idle bucket limit; idle, event-limit or memory-limit flushes can affect the output rate. Start with the existing limits and measure the cadence before tuning them. A five-minute window alone does not guarantee one summary every five minutes.
Check the tracker lookback, schedule and delay thresholds before deployment. -15m to now remains a starting lookback, but it must cover aggregation, delivery and scheduling jitter in your environment. Running the tracker more frequently does not make Cribl flush sooner.
Save, commit and deploy to a limited scope. Allow several complete windows to settle, then compare count-metric samples, represented event counts, worker memory and CPU, destination queues and signal freshness. Use the searches in the sizing guide.
The metric contract and TrackMe source configuration stay the same. Both observation approaches support this setting; do not enable both for the same population during the comparison.
What changes for monitoring
The stored event and observation epochs keep their precision. Their visibility
is delayed: an event arriving near the start of a five-minute window may wait
almost five minutes for that window to end, followed by flush, delivery and
tracker scheduling delays. This is not a guaranteed five-minute end-to-end bound.
Event delay still means now() - last_event, but the tracker cannot use a newer
timestamp until its summary arrives. Allow for that freshness budget in alert
thresholds and test both normal activity and silence.
Counts also arrive in coarser batches. A longer lookback can retain visibility, but cannot recover minute-by-minute detail from five-minute summaries. Inspect the count timeline and count-based outlier models after changing the window; allow representative history at the new cadence and retrain models if needed.
Fewer summaries can reduce serialization, transport and downstream indexing work. Every selected event still needs processing, and a longer window may retain more distinct feeds in memory and produce larger flush bursts. An 80% reduction in metric points is not an 80% reduction in worker CPU or memory. Measure both before expanding coverage.
Troubleshooting
Symptom |
Check |
|---|---|
No signal rows |
Route order and filter, deployment status, metric-index type, HEC index permissions, exact dotted metric names, and all required dimensions. |
Counts higher than expected |
Duplicate activity routes, simultaneous route and destination observation, destination fan-out, re-ingestion/retries, cumulative aggregation, and whether compared searches cover identical observation windows. |
Increasing event delay with recent observation |
Old data, replay or timestamp parsing. Cribl may be actively receiving events whose source timestamps are stale. |
Many subjects become stale together |
The signal pipeline, destination and tracker schedule, as well as the original sources. A broken monitoring path can resemble an estate outage. |
Unexpected merged subjects |
Reused identities across estates and missing identity dimensions. Dimension filters alone do not create distinct TrackMe entities. |