Alerting & third-party integration — in depth
Tip
This is the in-depth reference for alerting. For a quick, readable introduction, start with Stateful alerting, Notable events, and Acknowledgments. This page collects the full detail: the stateful-alert wizard step by step, embedded charts, the AI status report, active commands, the anatomy of stateful incident events, worked examples per component, and the legacy notable-based and per-alert third-party integration architectures.
Introduction to Stateful Alerting in TrackMe
Hint
TrackMe Stateful alerting is TrackMe’s core alerting model: state-aware alerts that follow the full life cycle of an incident, with advanced email thread notifications and active command execution.
TrackMe automatically maintains cycles of incidents in a persistent, state-aware manner.
It delivers rich HTML email notifications with automated, embedded metrics charts, and can include an AI-generated entity status report so recipients get immediate insight into an entity’s health without opening the Splunk UI.
It generates stateful events to trigger advanced third-party integrations — on incident creation, on updates, and on closure when the entity returns to a normal state.
It can execute active commands (generating or streaming) depending on whether the incident is opened, updated or closed — for example, to create, update and close incidents in an ITSM.
It can automatically acknowledge entities when an incident opens, and lets you select which priority levels generate emails and commands, at the handler level.
The charts time range window is configurable per alert (default 24 hours).
Together, these provide a complete, powerful and flexible state-aware alerting architecture.
Email charts are not available in Splunk 9.1 / 9.2 environments (they require Python 3.8 or later).
Sophisticated Alerting Made Easy - TrackMe Alerting in a Nutshell
In short:
Once enabled, when a given entity turns into an alerting state, a new incident is created.
When new events are detected, such as Notable events or SLA breaches, the incident is updated.
Eventually the entity returns to non alerting state, the incident is closed.
Rich HTML emails notifications can be delivered by TrackMe, including automated and embedded metrics charts.
When AI providers are configured, an AI-generated status report can be included in email notifications, providing contextual analysis adapted to the incident lifecycle (opened, updated, or closed).
Events are also generated, in the
sourcetype=trackme:stateful_alerts.Therefore, TrackMe can generate Opening / Updating / Closing events, and/or rich Emails notifications.
Active commands (generating or streaming commands) can also be executed, depending on the incident status.
Creating a Stateful Alert in a Few Easy Steps
In the TrackMe Virtual Tenant, open the “Tracking Alerts” tab. From the Actions menu (the ⋮ button, top right), click “Create a new alert”:

The “Alert tracking definition” wizard opens in assisted mode. Choose the type of alert to track — here TRACKME STATEFUL ALERTS (the other types are Notable events, splk-DSM data sources, and SLA breaches) — then work through the guided steps:

Step 1: Select the Stateful Alert Mode
The first step is to select the alert mode, available options are:
Emails and Ingest: generate both emails deliveries and ingest eventsEmails, Commands and Ingest: generate emails deliveries, active commands and ingest eventsCommands and Ingest: generate active commands and ingest eventsCommands and Emails: generate active commands and emails deliveriesIngest Only: generate ingest events onlyEmails Only(not recommended): generate emails deliveries onlyCommands Only: generate active commands only
Ingest actions
We recommend to always have the ingest actions enabled, unless you have a specific use case with multiple alerts.
Select the delivery mode from the Mode dropdown (in the wizard’s “Stateful main features” step):

Step 2: Configure emails delivery, if wanted
When the selected mode includes emails, configure the delivery under Email Configuration — choose the delivery account (the default localhost MTA, or an SMTP account you configured), an optional environment name added to the email header, the list of recipients (type an email and press Enter to add each one), whether to keep sending update emails while an entity is acknowledged, and optionally the priority levels that trigger emails (leave empty for all):

For Splunk Cloud environments:
You cannot configure an external SMTP destination in Splunk Cloud; the local MTA is mandatory.
Therefore, for Splunk Cloud, you do not need any further configuration; TrackMe uses the local MTA as a default.
For Splunk Enterprise environments:
You can choose to use the local MTA or configure an external SMTP destination.
You can configure an external SMTP destination in Splunk Enterprise, and TrackMe will use it to deliver emails.
External SMTP destinations are managed from Configuration → Manage Email delivery accounts. The page lists every account with its SMTP server, security mode and last connectivity status, and offers per-row Edit / Clone / Test connectivity / Delete actions plus Test all and Add account. When no account exists yet, the page shows a short getting-started guide:

Click Add account, fill in the SMTP connection details and use Test SMTP connection to validate before saving. SSL or TLS is recommended, but not mandatory — an external SMTP server with no security is also supported:

Once saved, the account appears in the list with its live connectivity status, and can be selected in the stateful-alert email configuration:

Step 3: Charts generation
About Emails clients compatibility
Emails charts use SVG images format, some limited email clients such as Web Gmail do not support this format and charts are not displayed.
In the Charts Generation section, choose whether to generate charts, the charts theme (light or dark) and the charts time window. By default, TrackMe generates dynamic charts using super fast TrackMe metrics queries and indexes, and embeds them in the emails notifications:

What does this look like? Very cool!:
|
|
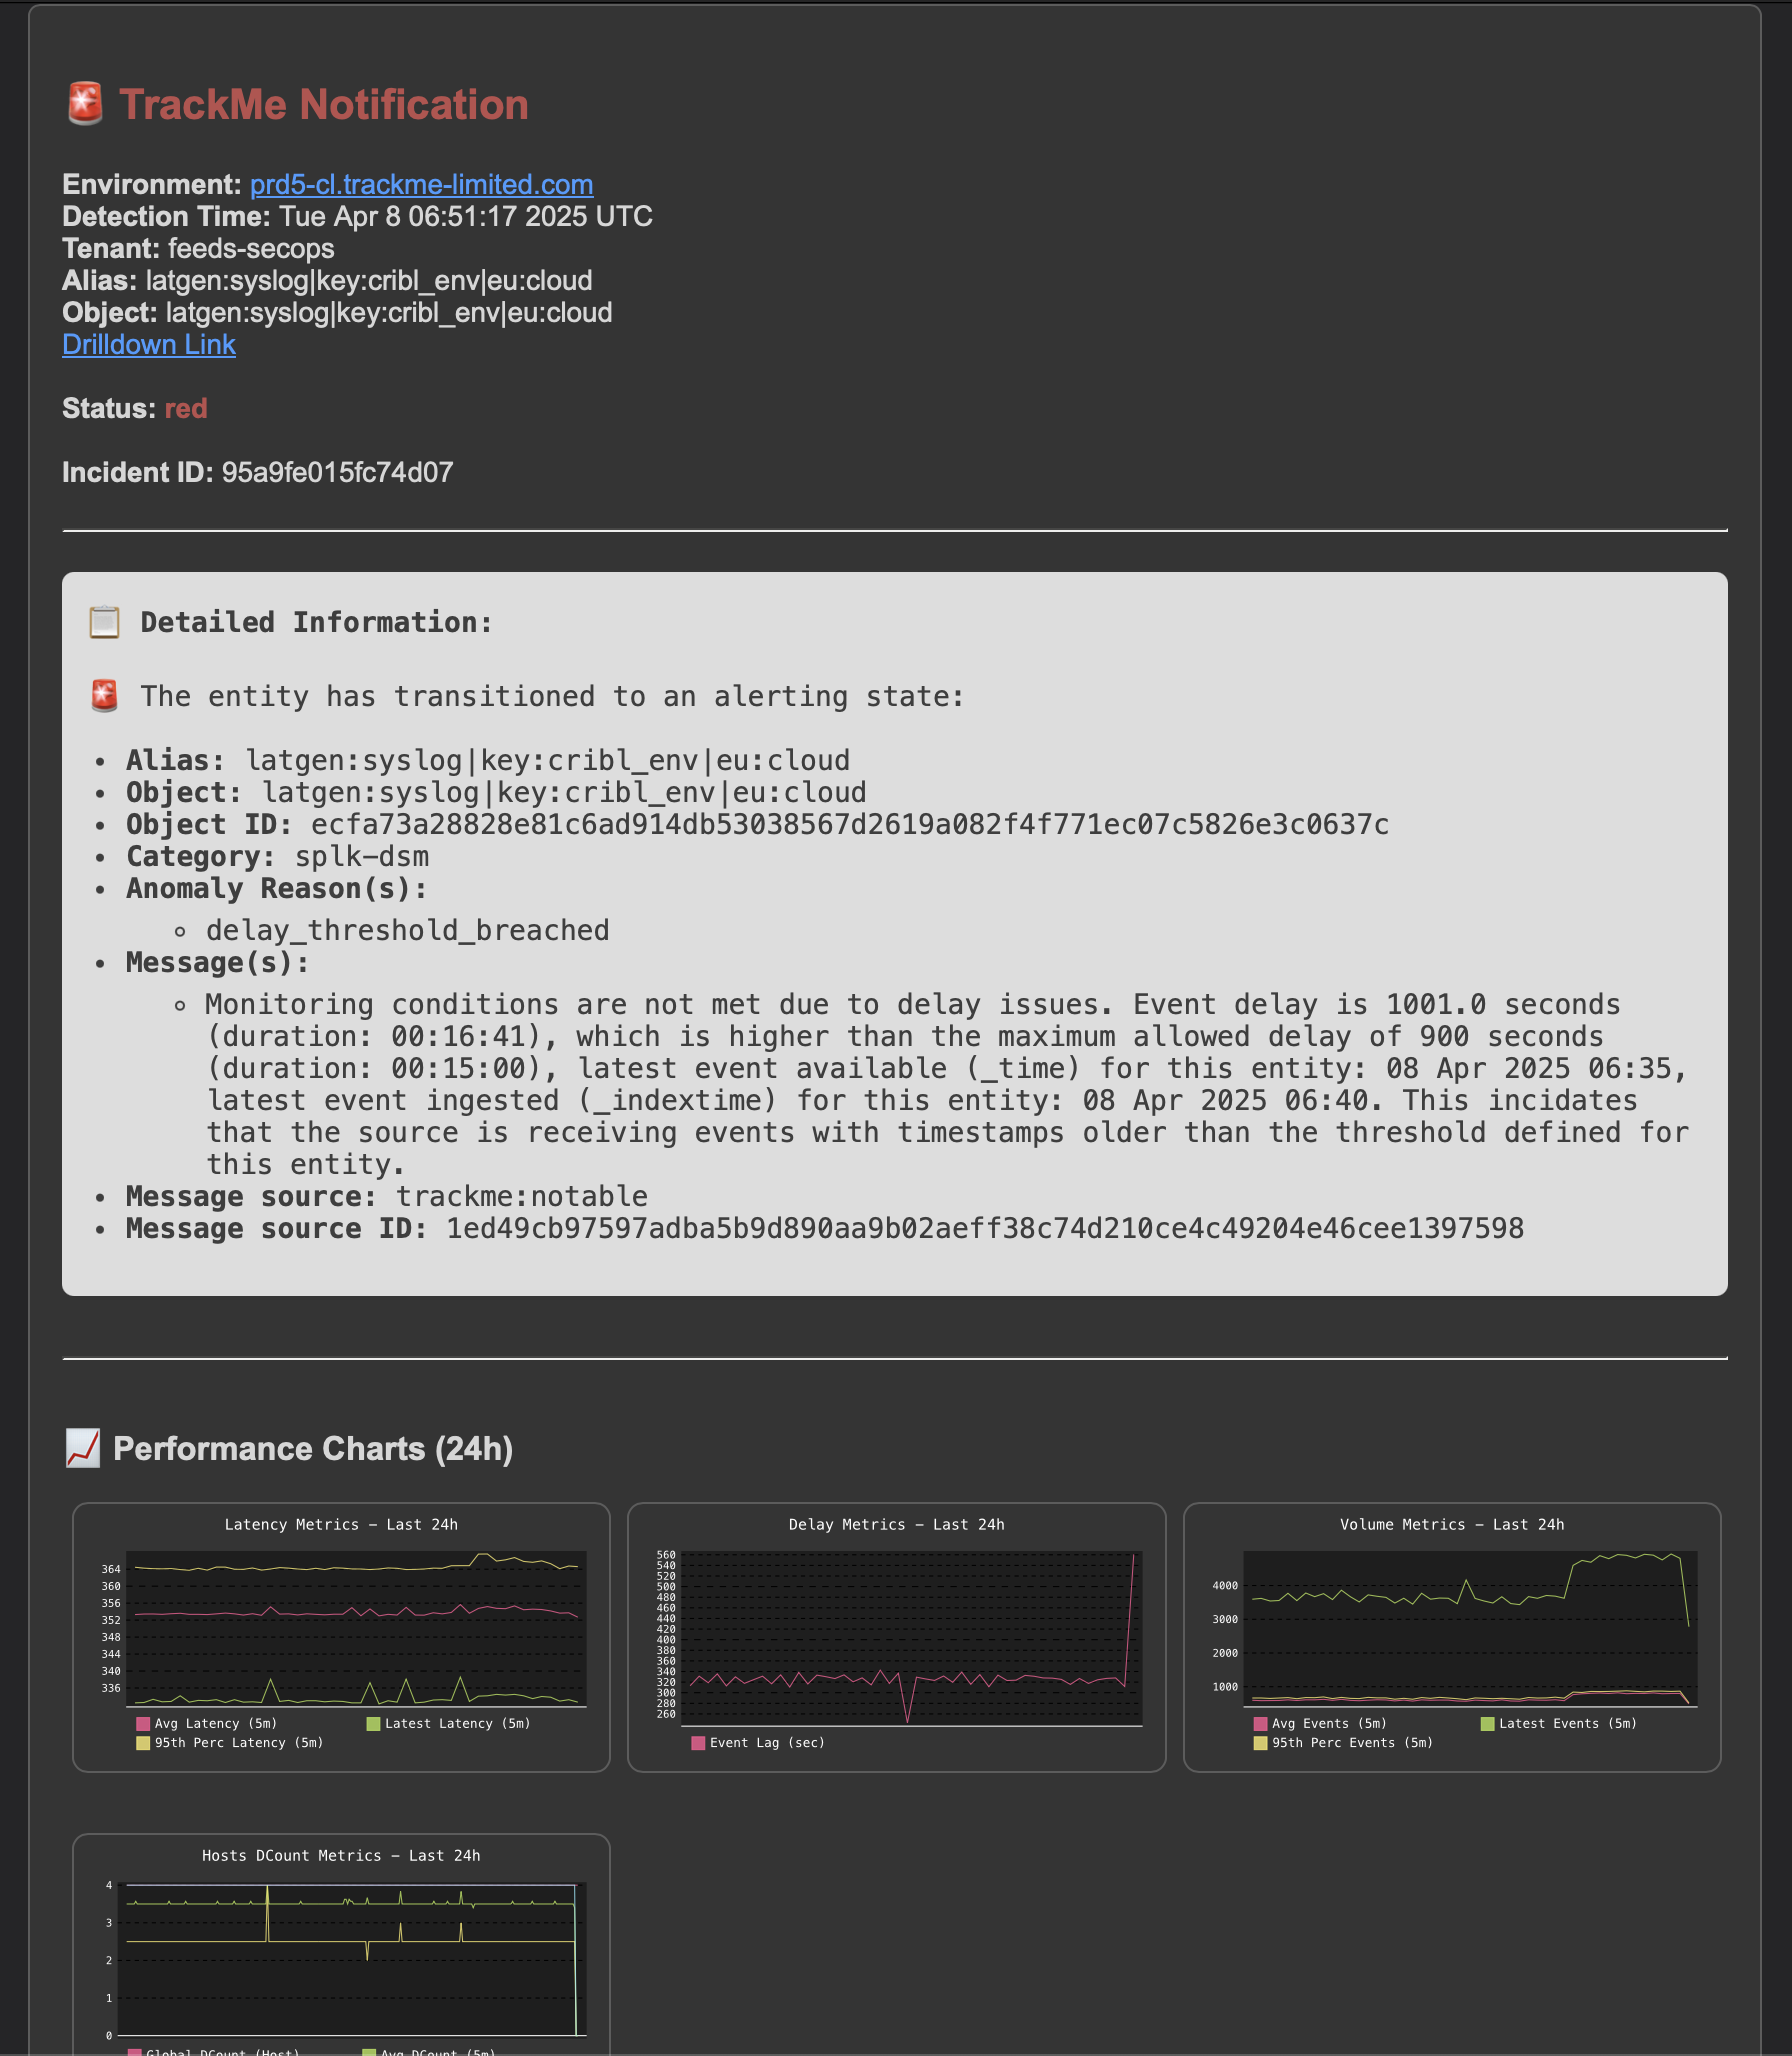
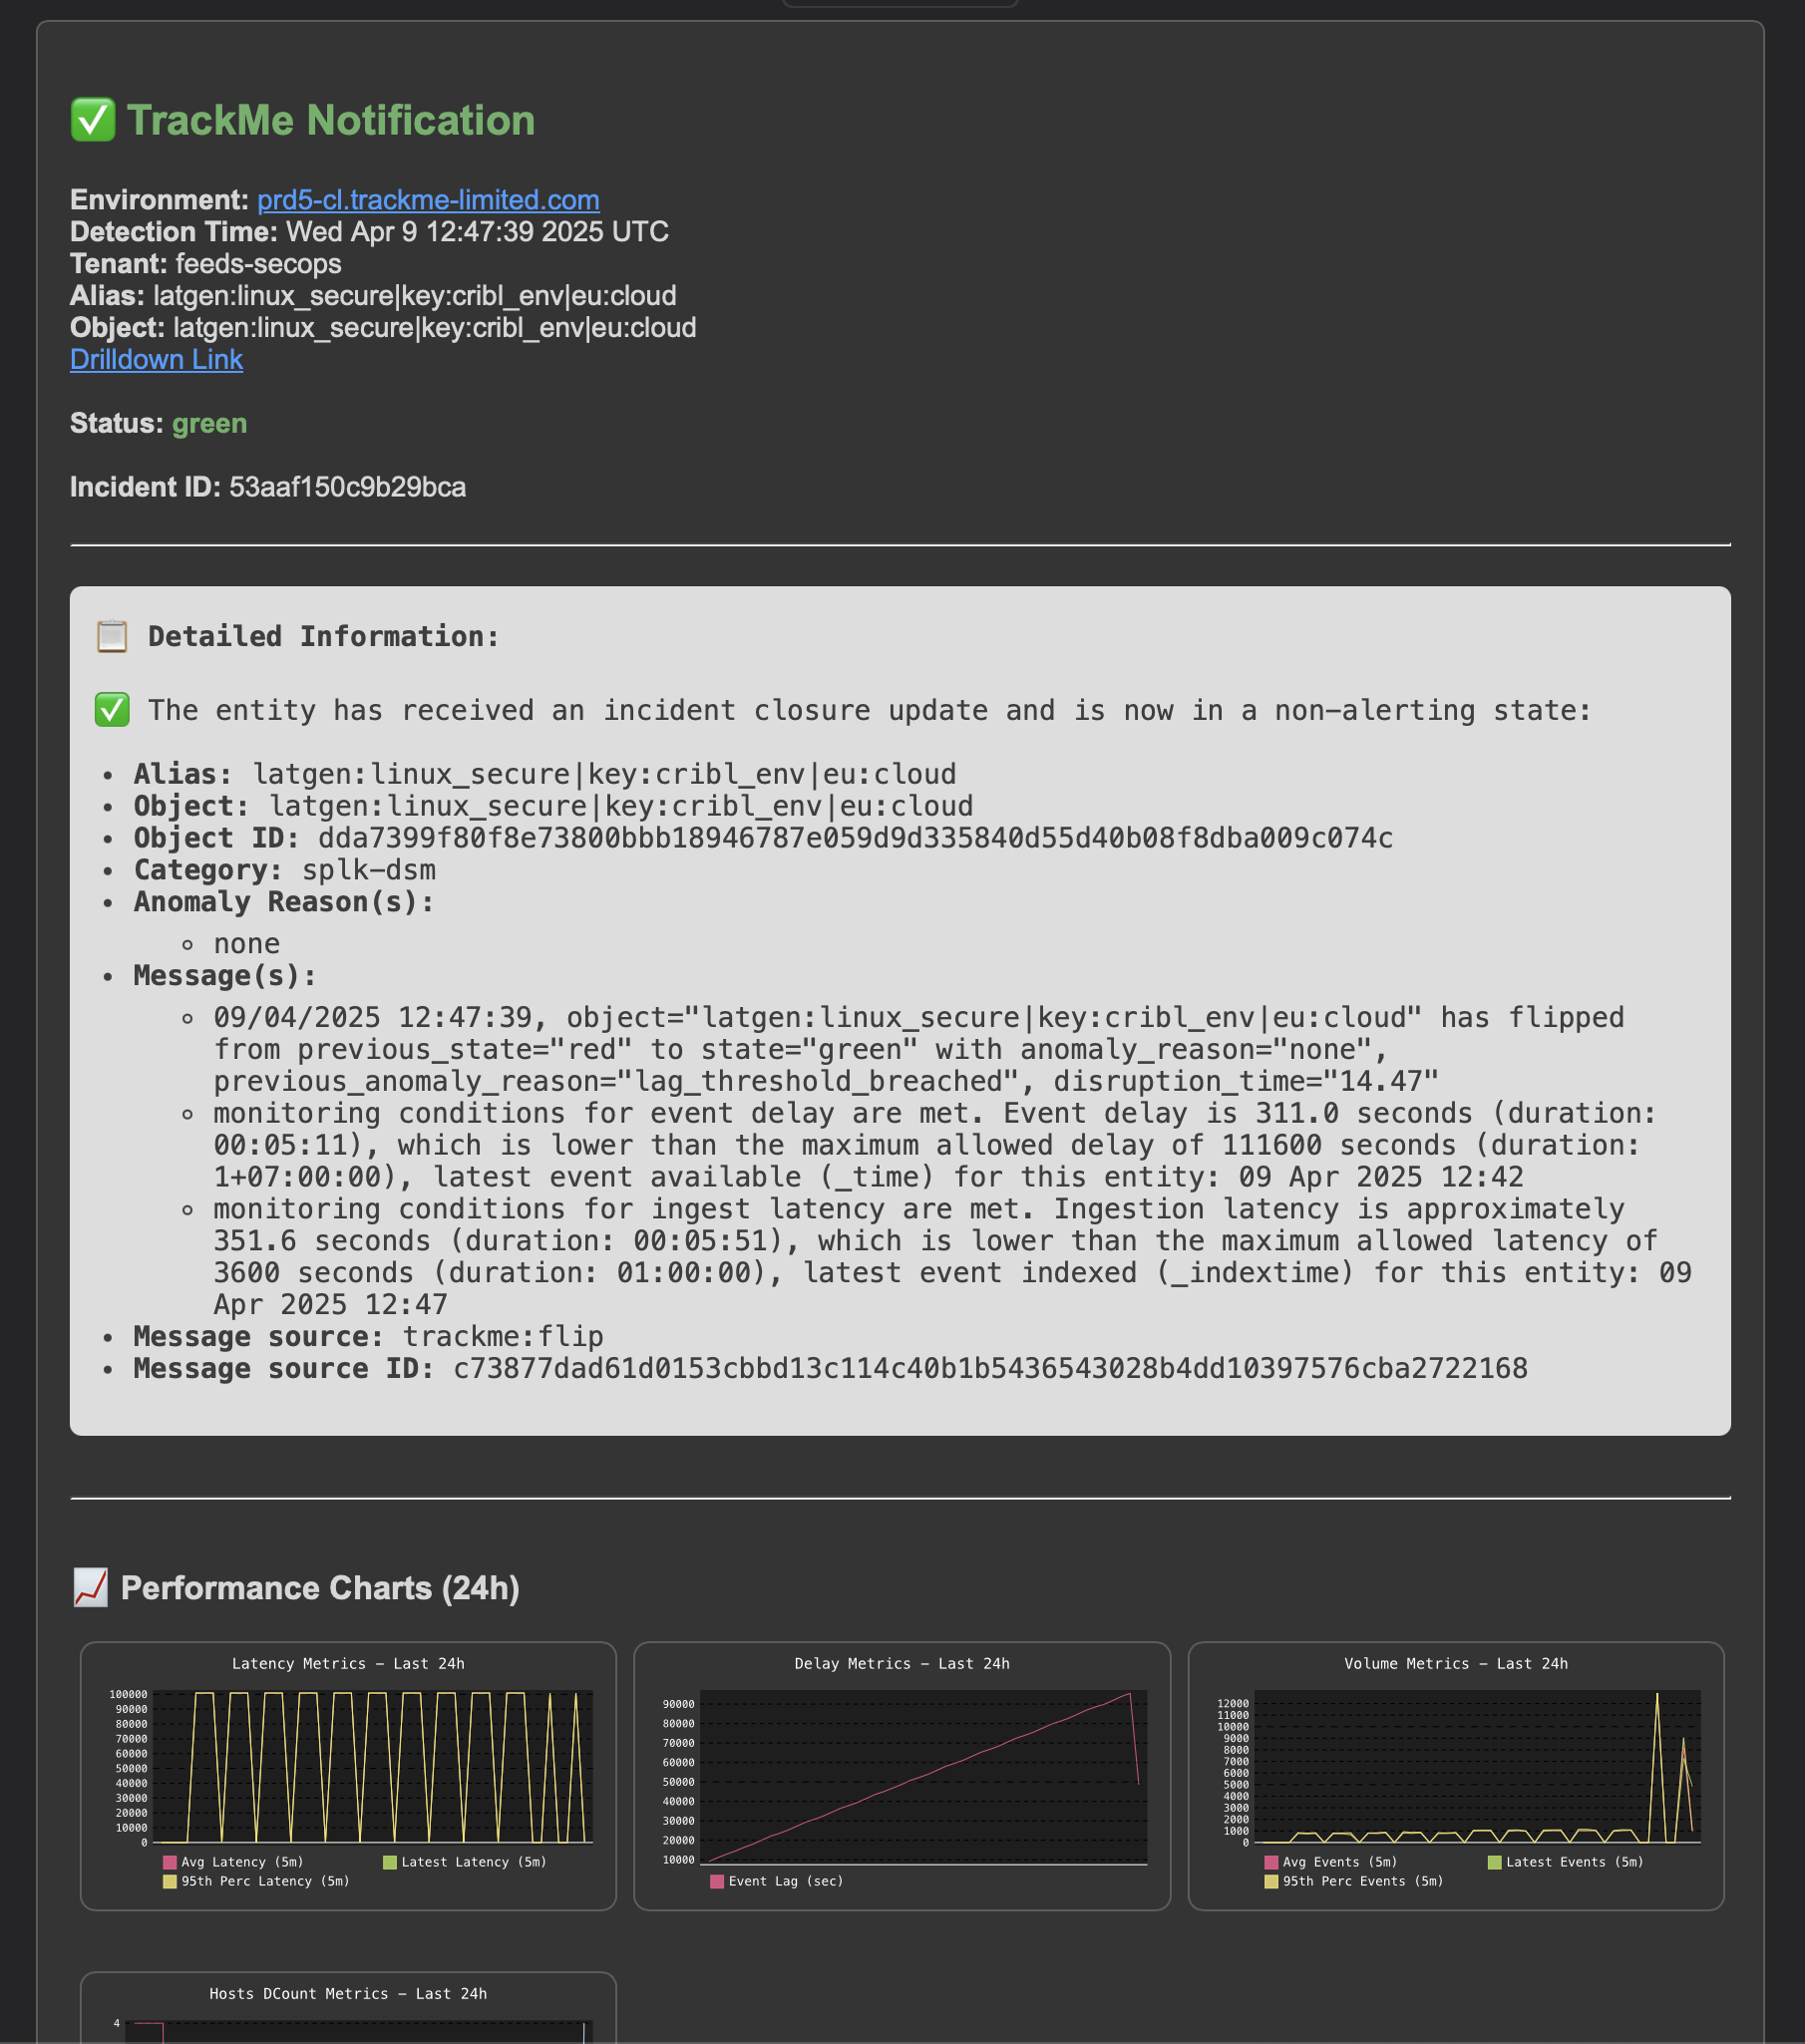
TrackMe also stores the charts in base64 format in the persistent KVstore collection, so you can access them later on if needed notably for third party integrations.
Replace mytenant with the name of your Virtual Tenant:
| inputlookup trackme_stateful_alerting_charts_tenant_mytenant | eval key=_key, _time=mtime
You could link stateful alerts events to the charts in the KVstore collection, in a Splunk search:
index=trackme_summary sourcetype=trackme:stateful_alerts tenant_id=mytenant
| lookup trackme_stateful_alerting_charts_tenant_mytenant incident_id OUTPUT chart_svg_base64
Step 4: AI Status Report in emails
About the AI Status Report
The AI Status Report feature requires at least one AI provider to be configured in TrackMe. If no AI provider is available, this section will not appear in the wizard.
For more information about configuring AI providers, consult the AI Assistant documentation.
When AI providers are configured in TrackMe, the stateful alert wizard offers the option to include an AI-generated entity status report in email notifications.
The AI Status Report is a concise, actionable summary generated by the configured AI provider (such as OpenAI, Azure OpenAI, or Claude) that analyses the entity context and health status. It is embedded directly in the HTML email notification, between the detailed information section and the charts section.
Key features:
Context-aware analysis: The AI prompt adapts to the incident lifecycle stage — it provides different insights depending on whether the incident is being opened (what went wrong and where to investigate), updated (whether the situation has changed), or closed (confirmation of recovery and what was previously wrong).
Automatic formatting: The AI response is automatically converted to email-safe HTML, ensuring clean rendering in all email clients.
Fail-open behaviour: If the AI provider is unavailable or returns an error, the email notification is delivered normally without the AI section — no email is ever blocked by an AI failure.
Cost-aware: The AI report is only generated when email delivery is actually required. If the entity’s priority level is filtered out from email notifications, no AI call is made.
Configuration options:
AI Status Report: Enable or disable the AI status report in email notifications. When at least one AI provider is configured, this defaults to enabled.AI Provider: When multiple AI providers are configured, you can select which provider to use. If only one provider is configured or no specific selection is made, the first available provider is used automatically.


Example of an email notification with the AI Status Report:


Step 5: Active commands
In TrackMe, active commands run a custom SPL command depending on the incident status. Choose the Commands mode (Streaming or Generating), optionally restrict execution to specific priority levels, and provide the SPL command for each state — opened, updated and closed (each with an Edit / SPL Preview toggle):

Streaming commands example: Creating / Updating / Closing incidents in ServiceNow
This implementation example uses the Splunk TA for ServiceNow application and its built-in command to create, update, and close incidents.
For more details about the command usage, consult the ServiceNow TA documentation.
When creating the TrackMe alert, set up the active commands for each state of the alert (opened, updated, closed).
These are examples of commands that need to be adapted to your ServiceNow context:
commands_created:
| eval account="snow_account_name" | eval contact_type="email" | eval ci_identifier=object | eval priority="1" | eval category="Software" | eval subcategory="TrackMe" | eval custom_fields="u_affected_user=nobody||u_caller_id=12345" | eval short_description="The TrackMe entity " . alias . " has transitioned to an alerting state: " . object_state . ", detection_time: " . detection_time . ", messages: " . mvjoin(messages, "|") | snowincidentstream
commands_updated:
| eval account="snow_account_name" | eval contact_type="email" | eval ci_identifier=object | eval state="2" | eval category="Software" | eval subcategory="TrackMe" | eval custom_fields="u_affected_user=nobody||u_caller_id=12345" | eval short_description="The TrackMe entity " . alias . " The entity has received an update: " . object_state . ", detection_time: " . detection_time . ", messages: " . mvjoin(messages, "|") | snowincidentstream
commands_closed:
| eval account="snow_account_name" | eval contact_type="email" | eval ci_identifier=object | eval state="7" | eval category="Software" | eval subcategory="TrackMe" | eval custom_fields="u_affected_user=nobody||u_caller_id=12345" | eval short_description="The TrackMe entity " . alias . " has received an incident closure update and is now in a non-alerting state: " . object_state . ", detection_time: " . detection_time . ", messages: " . mvjoin(messages, "|") | snowincidentstream
You can call tokens at any stage of the command, using the format:
field_name="$result.field_name$"
Or:
field_name="$field_name$"
Tokens are applicable against any field resulting from the alert, as well as fields added by TrackMe, you can consult an example of an incident event in the Incidents tab, see the anatomy of StateFul Incidents Events section for more details.
Generating commands example
TrackMe can also call a generating command instead, which you can leverage to tackle your specific use case.
The following example shows a simple usage for demonstration purposes using the Splunk makeresults command, where we would add a subset of the content to a lookup file, which could then be consumed by a third-party logic.
commands_created:
| makeresults | eval request_type="new", ci="$object$", ci_id="$object_id$", alert_status="$alert_status$", event_id="$event_id$",description="The TrackMe entity $alias$ has transitioned to an alerting state: $object_state$, detection_time: $detection_time$" | outputlookup append=t trackme_incidents.csv
commands_updated:
| makeresults | eval request_type="update", ci="$object$", ci_id="$object_id$", alert_status="$alert_status$", event_id="$event_id$", description="The TrackMe entity $alias$ has received an update: $object_state$, detection_time: $detection_time$" | outputlookup append=t trackme_incidents.csv
commands_closed:
| makeresults | eval request_type="close", ci="$object$", ci_id="$object_id$", alert_status="$alert_status$", event_id="$event_id$", description="The TrackMe entity $alias$ has received an incident closure update and is now in a non-alerting state: $object_state$, detection_time: $detection_time$" | outputlookup append=t trackme_incidents.csv
Troubleshooting active commands execution
Hint
About the user context
It is important to remember that the command is executed in the context of the owner of the alert.
When it comes to TrackMe, the owner of the alert is handled automatically by TrackMe to correspond to the owner of the Virtual Tenant.
By default, the owner when creating Virtual Tenants in TrackMe is nobody. (splunk-system-user)
Therefore, keep this in mind while troubleshooting the command execution, as a third party command might potentially require specific permissions and capabilities to be available for the user context.
Consult the logs of the Stateful alert action to review the execution of the active commands:
index=cim_modactions sourcetype=modular_alerts:trackme_stateful_alert "Command"
Especially, the command execution will be logged as:
index=cim_modactions sourcetype=modular_alerts:trackme_stateful_alert "Executing command"
If the active command is executed, but does not return any results, the logs will show an error message, otherwise an informational message will be shown.
TrackMe processes active commands by converting the upstream results in a base64 encoded string, then executing the trackMe command trackmeyieldjson followed by the requested search logic.
This is a very powerful and flexible approach, you can easily re-execute the command at anytime with 100% of the original context and easily troubleshoot any issue:
| trackmeyieldjson json_value_b64="<encoded_base64_string"
Step 6: Various options
Hint
About the cron schedule: the cron schedule is not exposed as a configurable option, on purpose, because stateful alerts are meant to run on a frequent basis, ideally every 5 minutes:
The stateful handlers tracks changes in the entities from different angles, and then decides if the notification means the beginning of an incident, an update or a closure.
For this to work as expected, the alert must be execute as soon as possible and it then handles the incident life cycle.
Therefore, it is not recommeded to change the default cron schedule which should be set to every 5 minutes.
Finally, there are various options that you can configure for the alert, such as:
Consider orange as an alerting state: In TrackMe, orange is typically used to indicate a warning state; you can configure TrackMe to consider this as an alerting state.Drilldown URI: The drilldown URI is used to build the drilldown link in the email notifications.Priority: The priority of entities for triggering the alert; you may, for instance, want to trigger the alert only on high or critical priority entities.
In the current interface these options appear within the relevant blocks of the wizard rather than in a single “common options” screen — the priority filters sit inside the email and active-command blocks, and the remaining options under the wizard’s Various step.
Additional information
TrackMe implements various dynamic actions, depending on the circumstances or the type of entities it is dealing with, to adapt automatically the behavior of Stateful alerts.
Time detection, deduping and backfilling: TrackMe automatically identifies if events should be skipped according to the entity cycle, this means that it will skip events if necessary and will never send duplicated alerts, whatever the triggers of the alerts are. (so you can have an overlapped search approach safely and TrackMe does the hard work!)
Dynamic charting: TrackMe automatically chooses which metrics should be charted, and how, based on the entity type and metrics available.
For instance, for the splk-dsm component, it will automatically add component specific charts such as data sampling charts. (quality issues)
For components like splk-flx and splk-wlk, TrackMe will automatically verify metrics availability for the entity, and will generate charts accordingly.
For the splk-vol component (Volume Outliers), the notification embeds the rolling volume charts (24h / 12h / 4h / 60m over the alert’s chart window), the ML outliers chart of each model and a daily licensed volume bar chart over the last 30 license days.
Status flexibility: TrackMe has different statuses, you can influence for instance if orange should be considered as an alerting state or not. On the other hand, “blue” which is a special status (notably for logical grouping) is automatically considered as a non alerting state, eligible for incident closures.
Anatomy of Stateful Incidents Events
In addition with rich email notifications, TrackMe also generates incident events, which can easily be used to trigger third party integrations.
alert_status:
opened- This is the start of the incidentalert_status:
updated- This is an update of the incidentalert_status:
closed- This is the closure of the incident
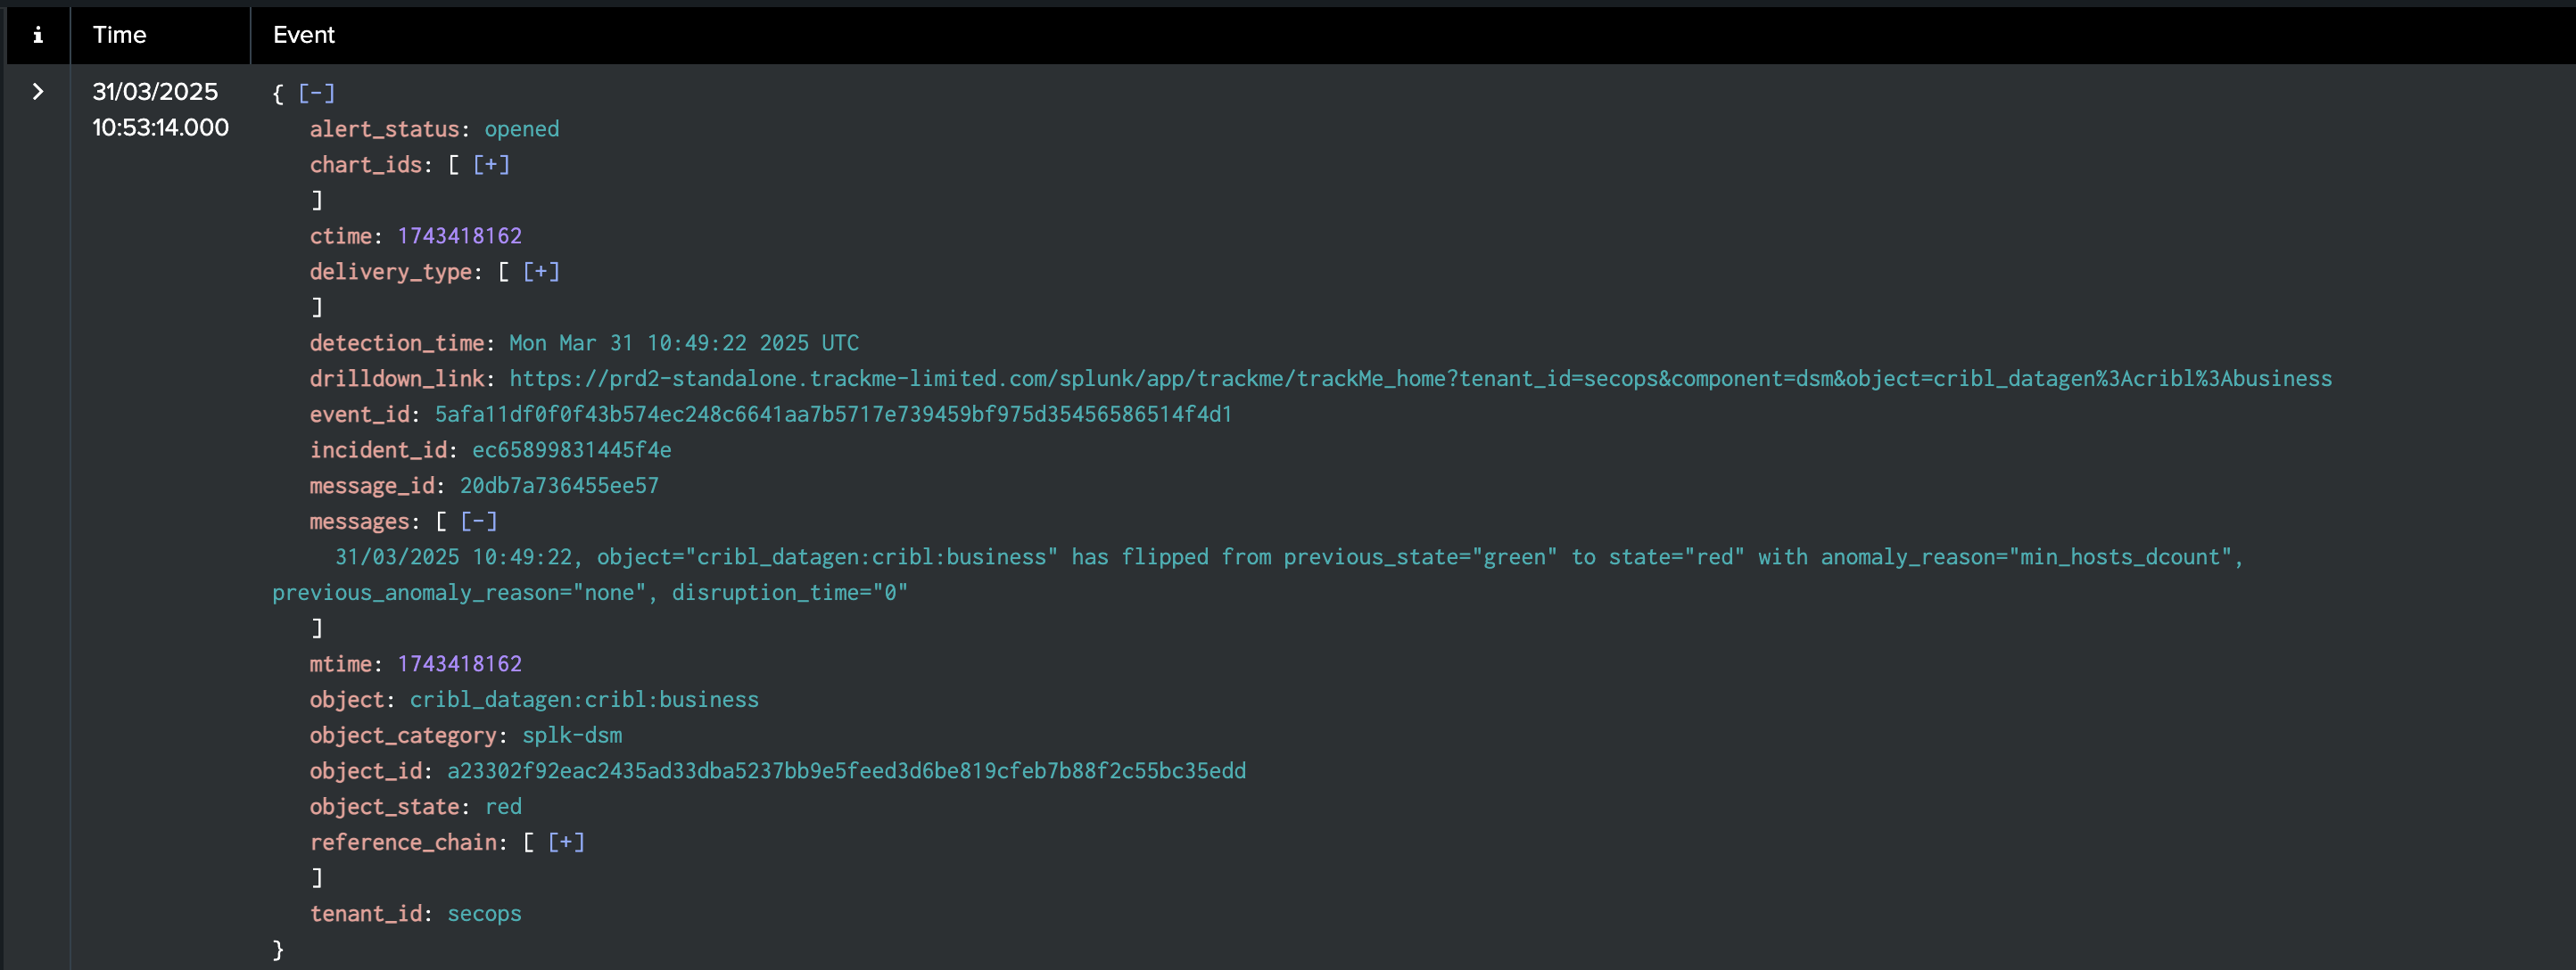
Example of an opening incident event:
index=trackme_summary sourcetype="trackme:stateful_alerts" alert_status=opened tenant_id=* object_category=* object=*
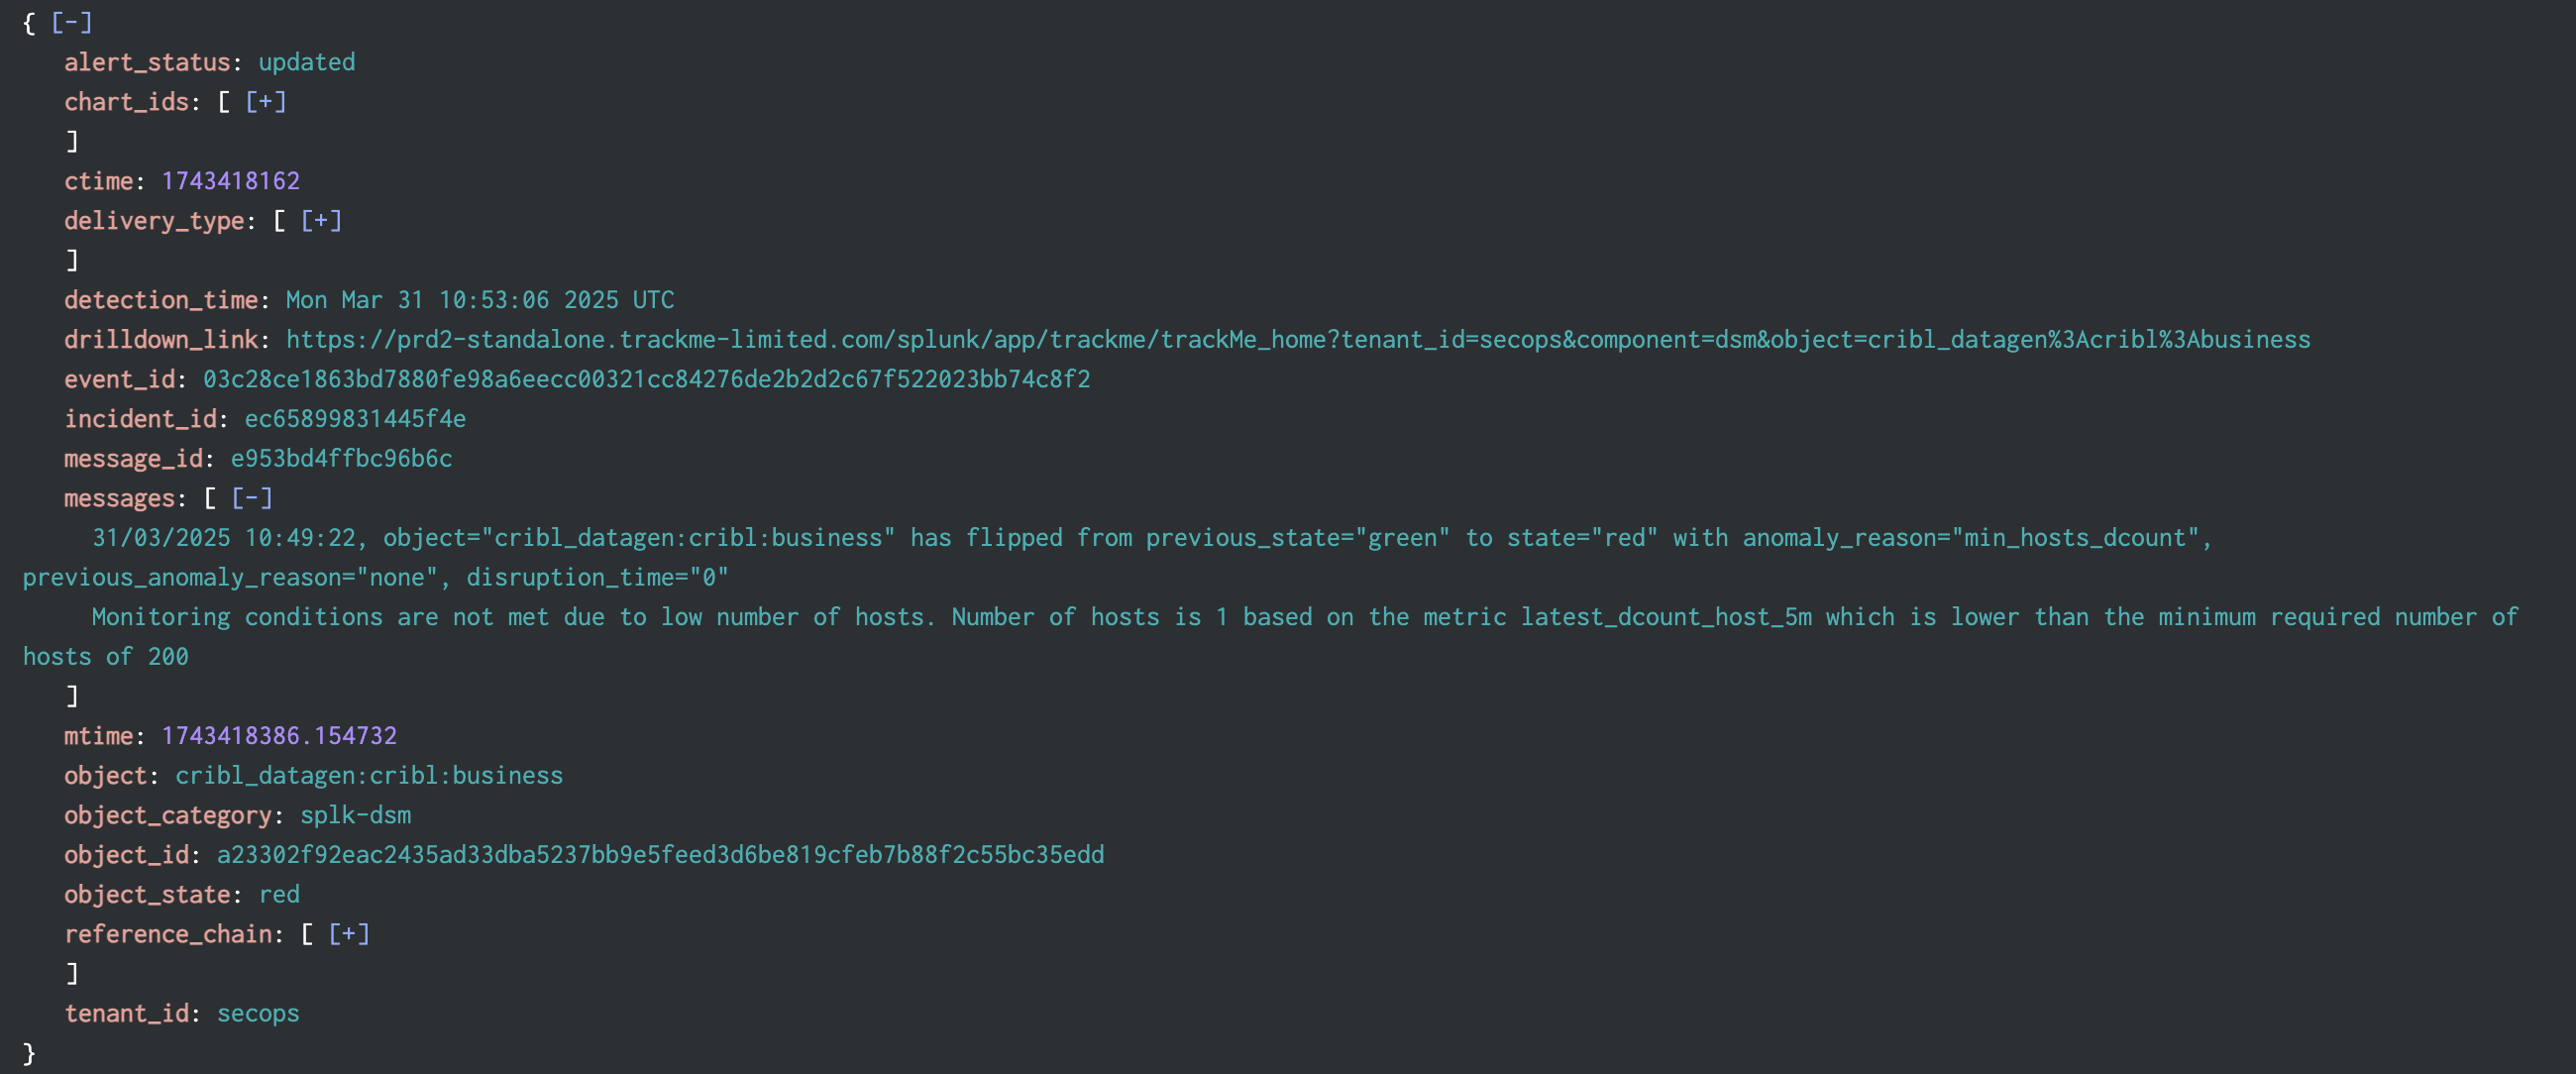
Example of an updating incident event:
index=trackme_summary sourcetype="trackme:stateful_alerts" alert_status=updated tenant_id=* object_category=* object=*
Example of a closing incident event:
index=trackme_summary sourcetype="trackme:stateful_alerts" alert_status=closed tenant_id=* object_category=* object=*
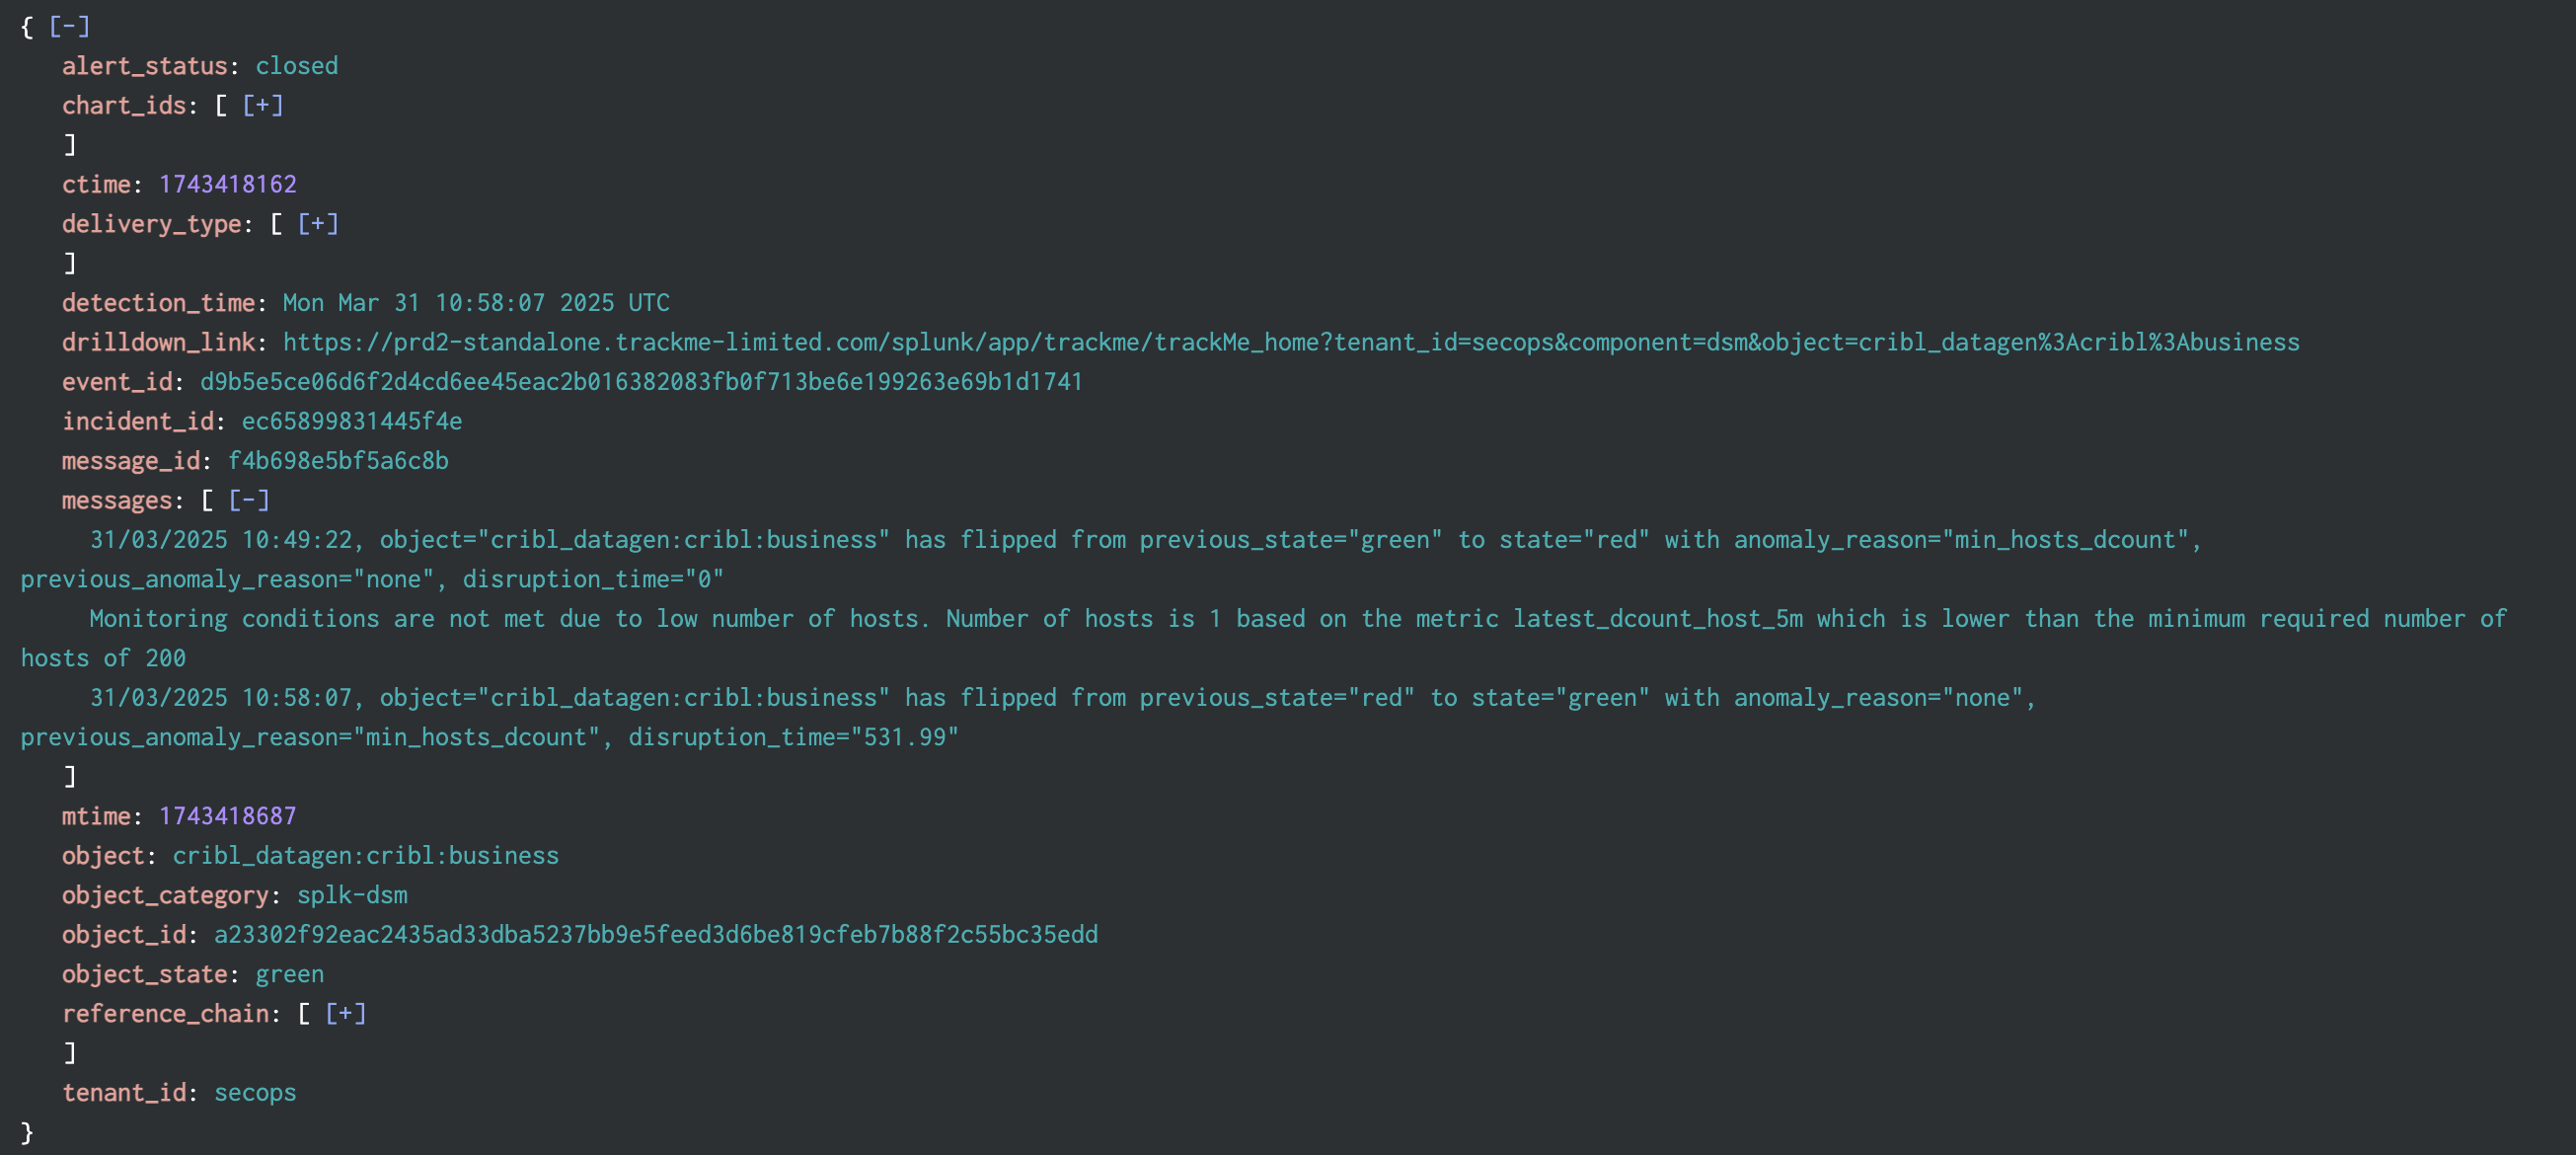
In TrackMe, incidents events can be accessed through the UI and the Incidents tab:

TrackMe Stateful alerts events are JSON formatted events, these contain the following key information:
Field |
Description |
|---|---|
alert_status |
The status of the incident, one of |
alias |
The entity alias, if defined. |
cmdb |
The matched CMDB record(s) for the entity — a single object, or a list of objects — from the tenant’s configured CMDB lookup. Present only for ingest delivery and when a CMDB match is found. |
ctime |
The creation time of the incident (epoch) |
delivery_type |
The delivery mode(s) called for this incident, such as |
detection_time |
The time of the detection of the alert in human readable format (strftime %c %Z) |
drilldown_link |
A link to the TrackMe Home user interface which filters on the tenant, component and entity, and automatically opens the entity overview screen. |
event_id |
The unique identifier for this event, the sha-256 hash of the event content. |
incident_id |
The unique identifier for this incident — a stable, shorter identifier common to every event and object related to the same incident (from |
labels |
The entity’s labels, as a list (present only when the entity has labels). |
message_id |
A unique identifier for this message, principally used for emails. |
message_source |
The sourcetype at the origin of the incident, such as |
message_source_id |
The unique identifier ( |
messages |
The list of messages from TrackMe that occur during the incident life cycle, this related to the TrackMe status_message field |
mtime |
The last modification time of the incident (epoch) |
object |
The object name for this entity, this basically is the name of entities in TrackMe |
object_category |
The TrackMe component this incident relates to (splk-dsm, splk-dhm, splk-mhm, splk-vol, splk-flx, splk-fqm, splk-wlk, splk-cim). |
object_id |
The unique identifier for this object in the tenant / component central KVstore collection. |
object_state |
The current state of the object (blue / green / orange / red). |
opened_anomaly_reason |
The anomaly reason captured when the incident was opened. |
priority |
The priority of the object (low / medium / high / critical). |
reference_chain |
The list of |
score |
The entity’s impact score (present when scoring applies to the entity). |
score_definition |
The human-readable definition of the impact score (present alongside |
tags |
The entity’s tags, as a list (present only when the entity has tags). |
tenant_id |
The tenant this incident is related to. |
updated_anomaly_reason |
The anomaly reason at the time of an update or closure (present on |
Example: Feed tracking entity (splk-dsm)
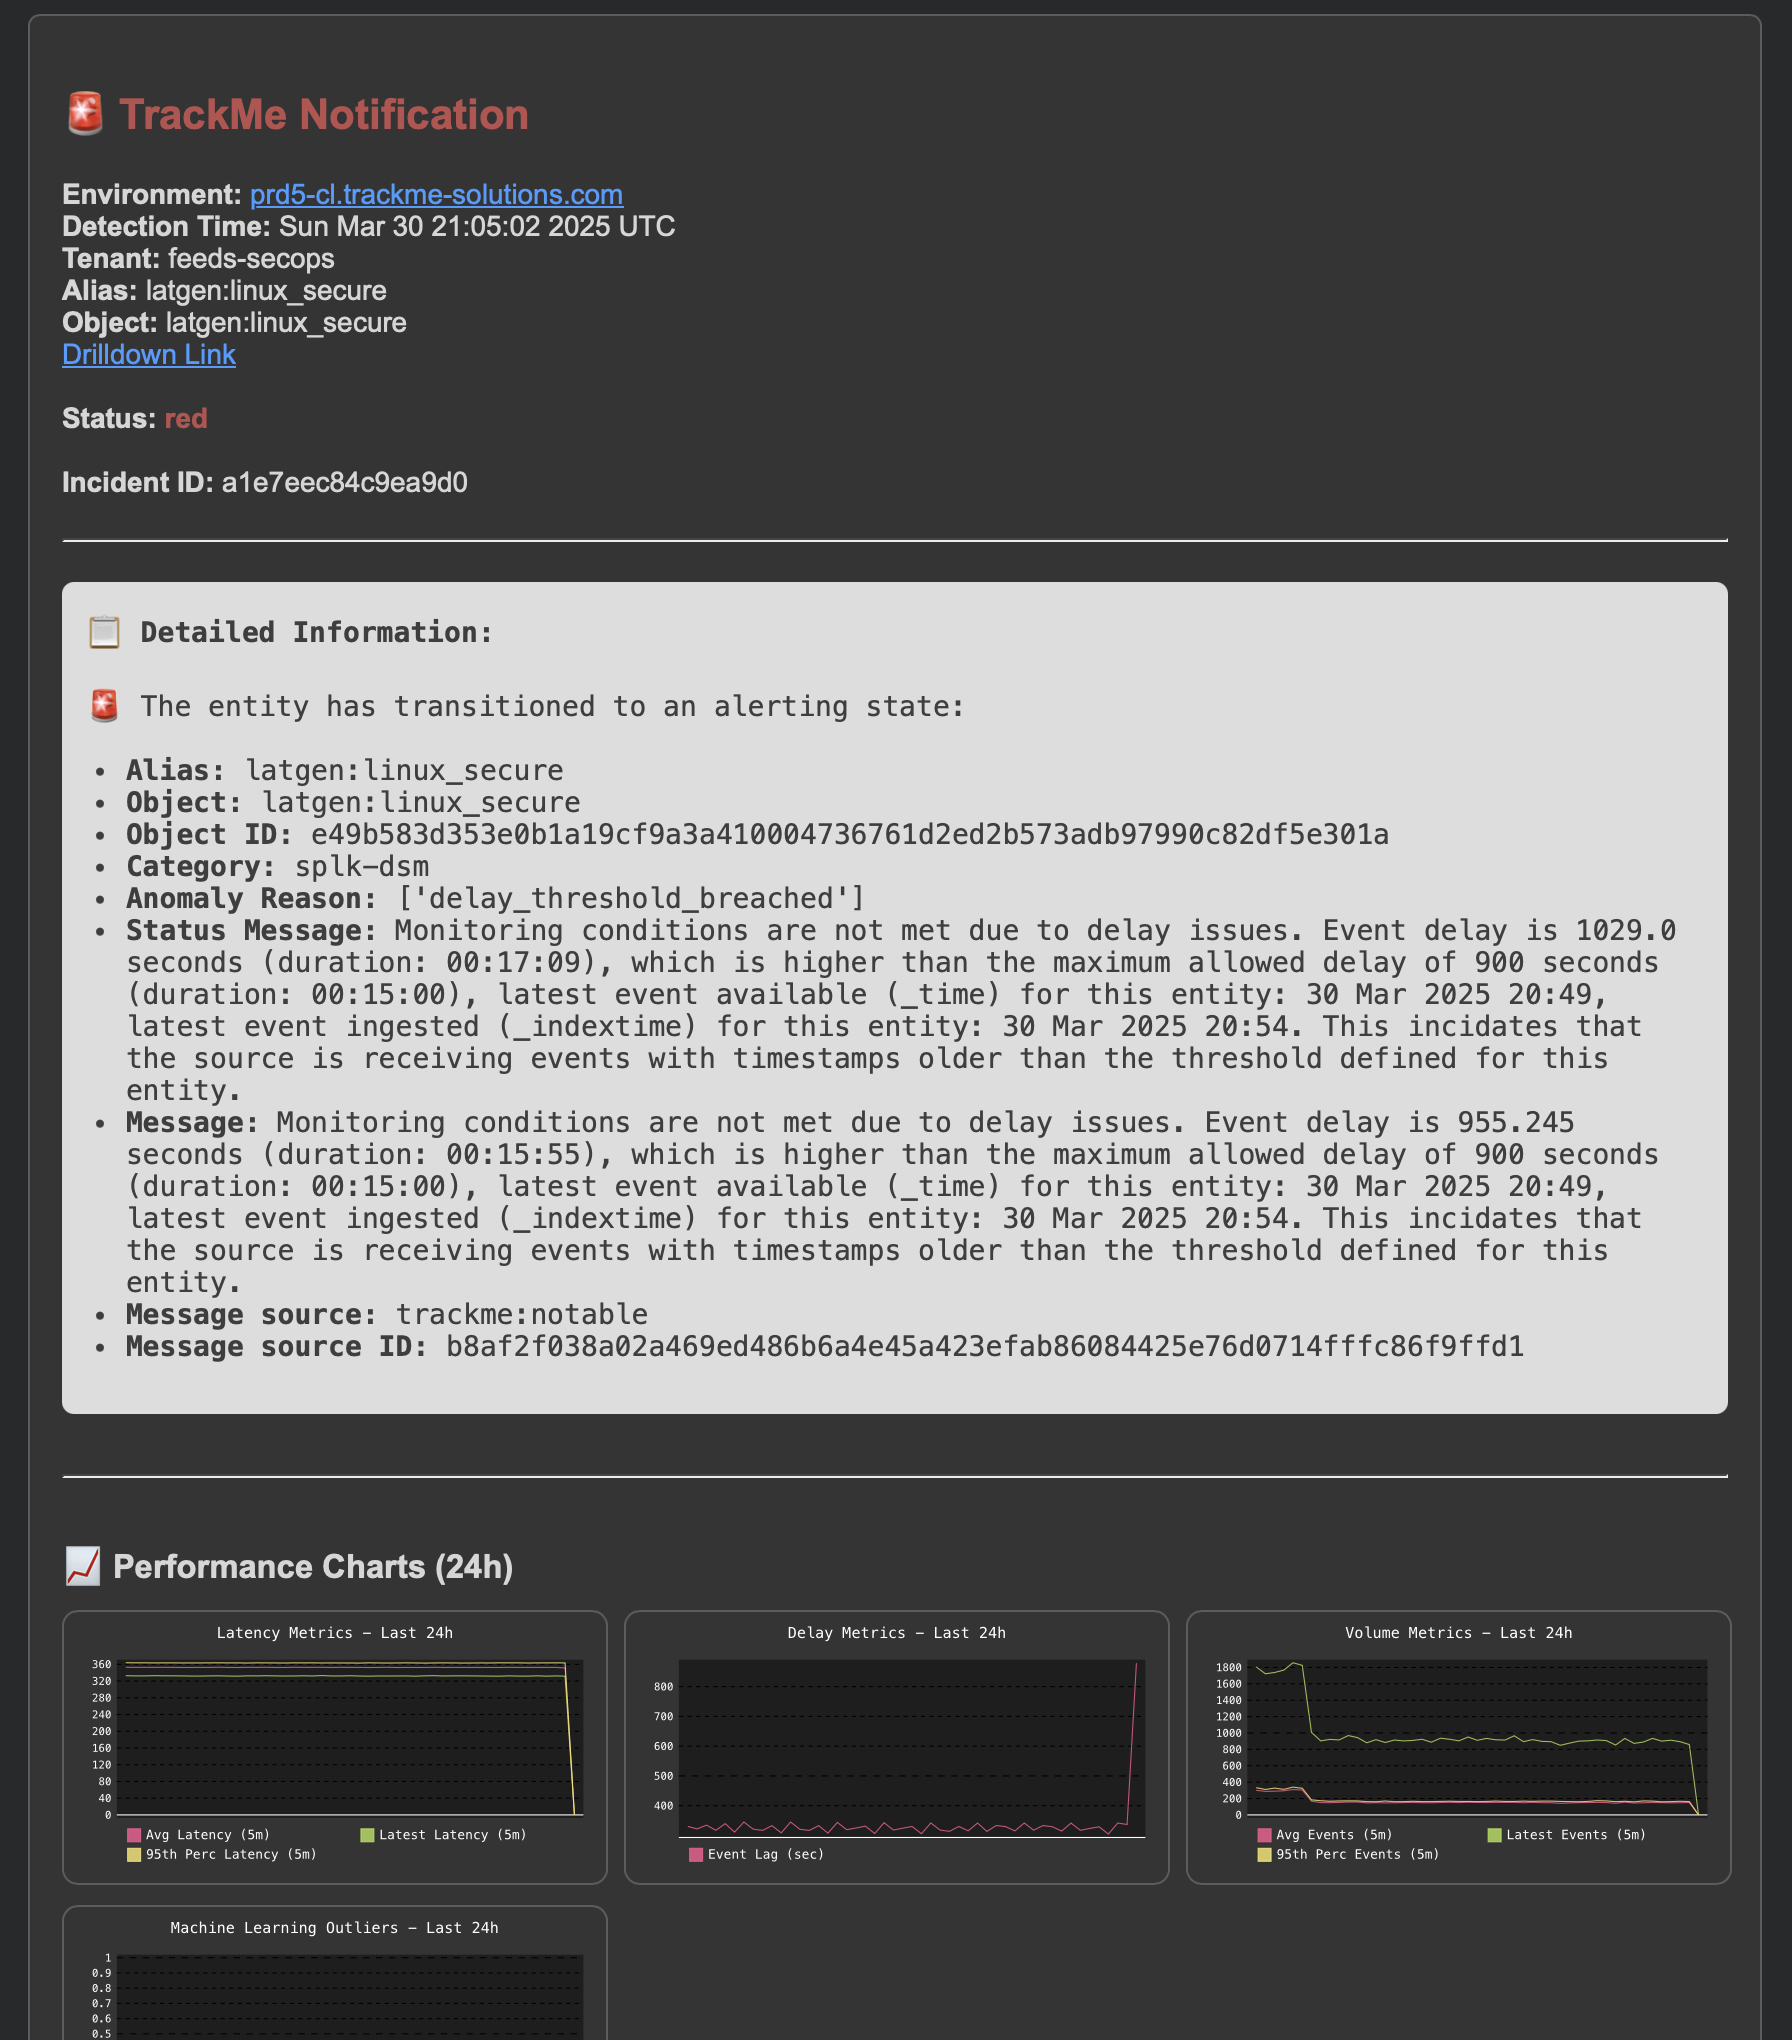
In this example, a sourcetype is affected by high latency and/or delay, a first notification is generated:
A first notification is generated, either through a notable event of a flip event:
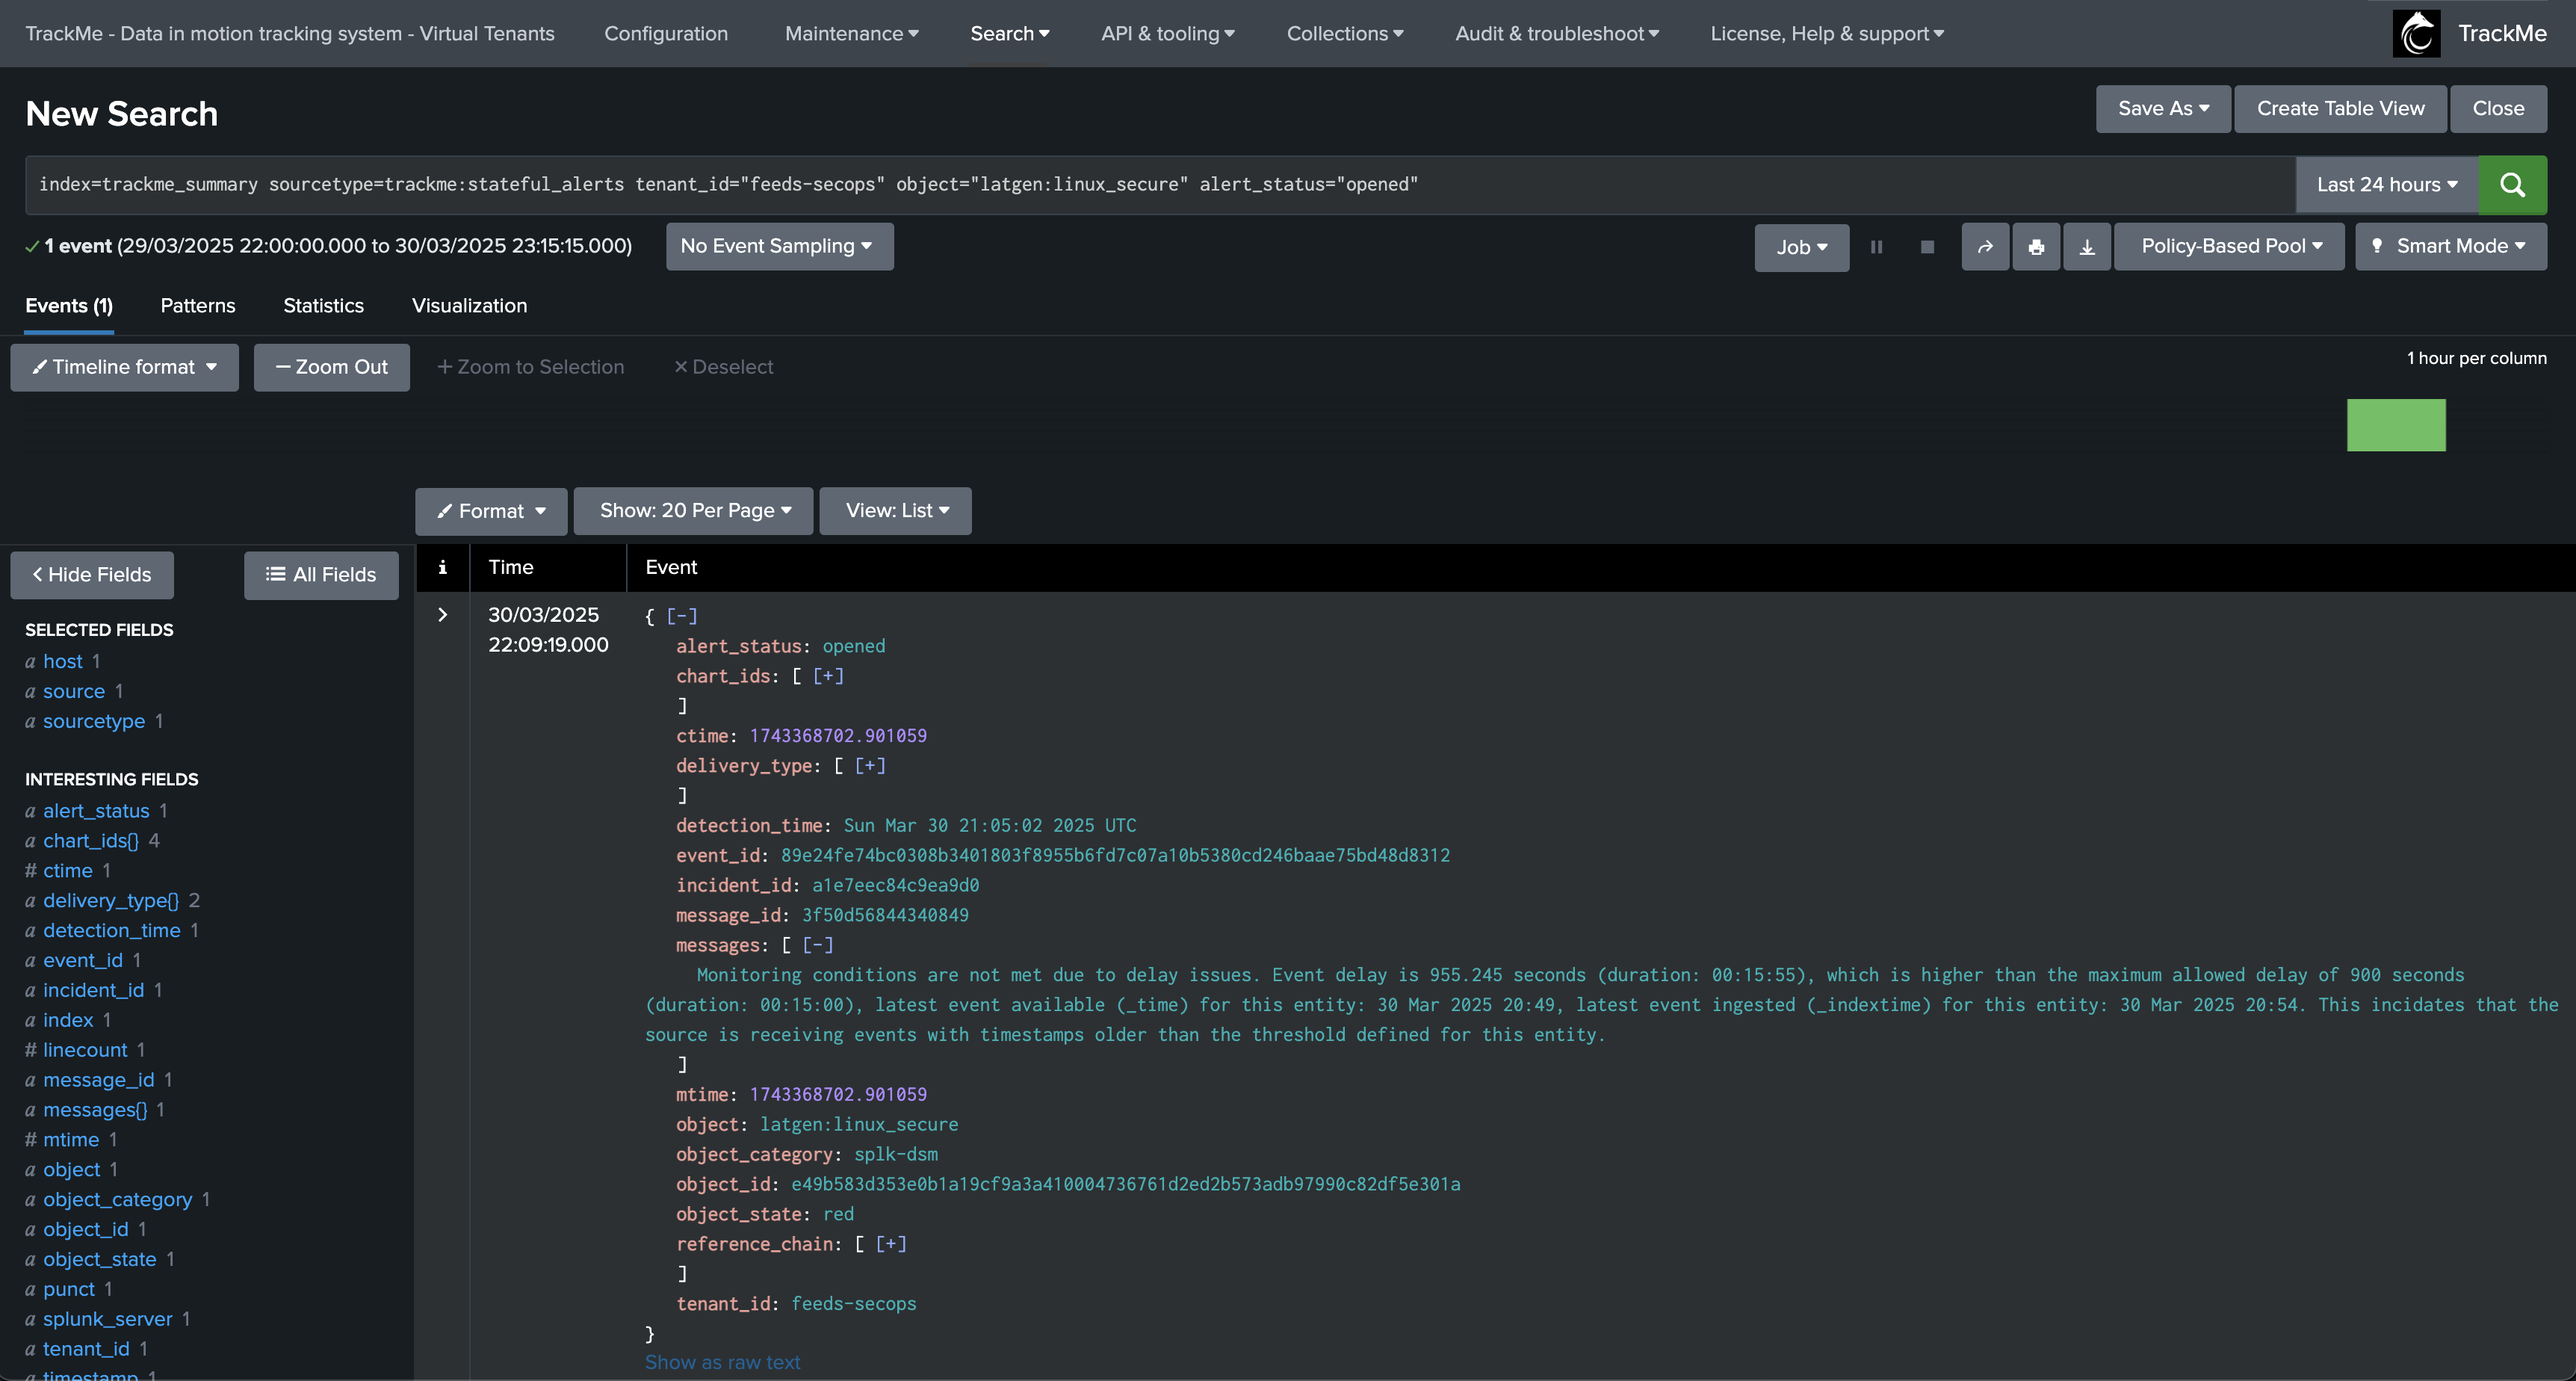
An opening incident event is created:
index=trackme_summary sourcetype=trackme:stateful_alerts tenant_id="mytenant" object="myobject" alert_status="opened"
Eventually, an update will be issued if a new event is generated:
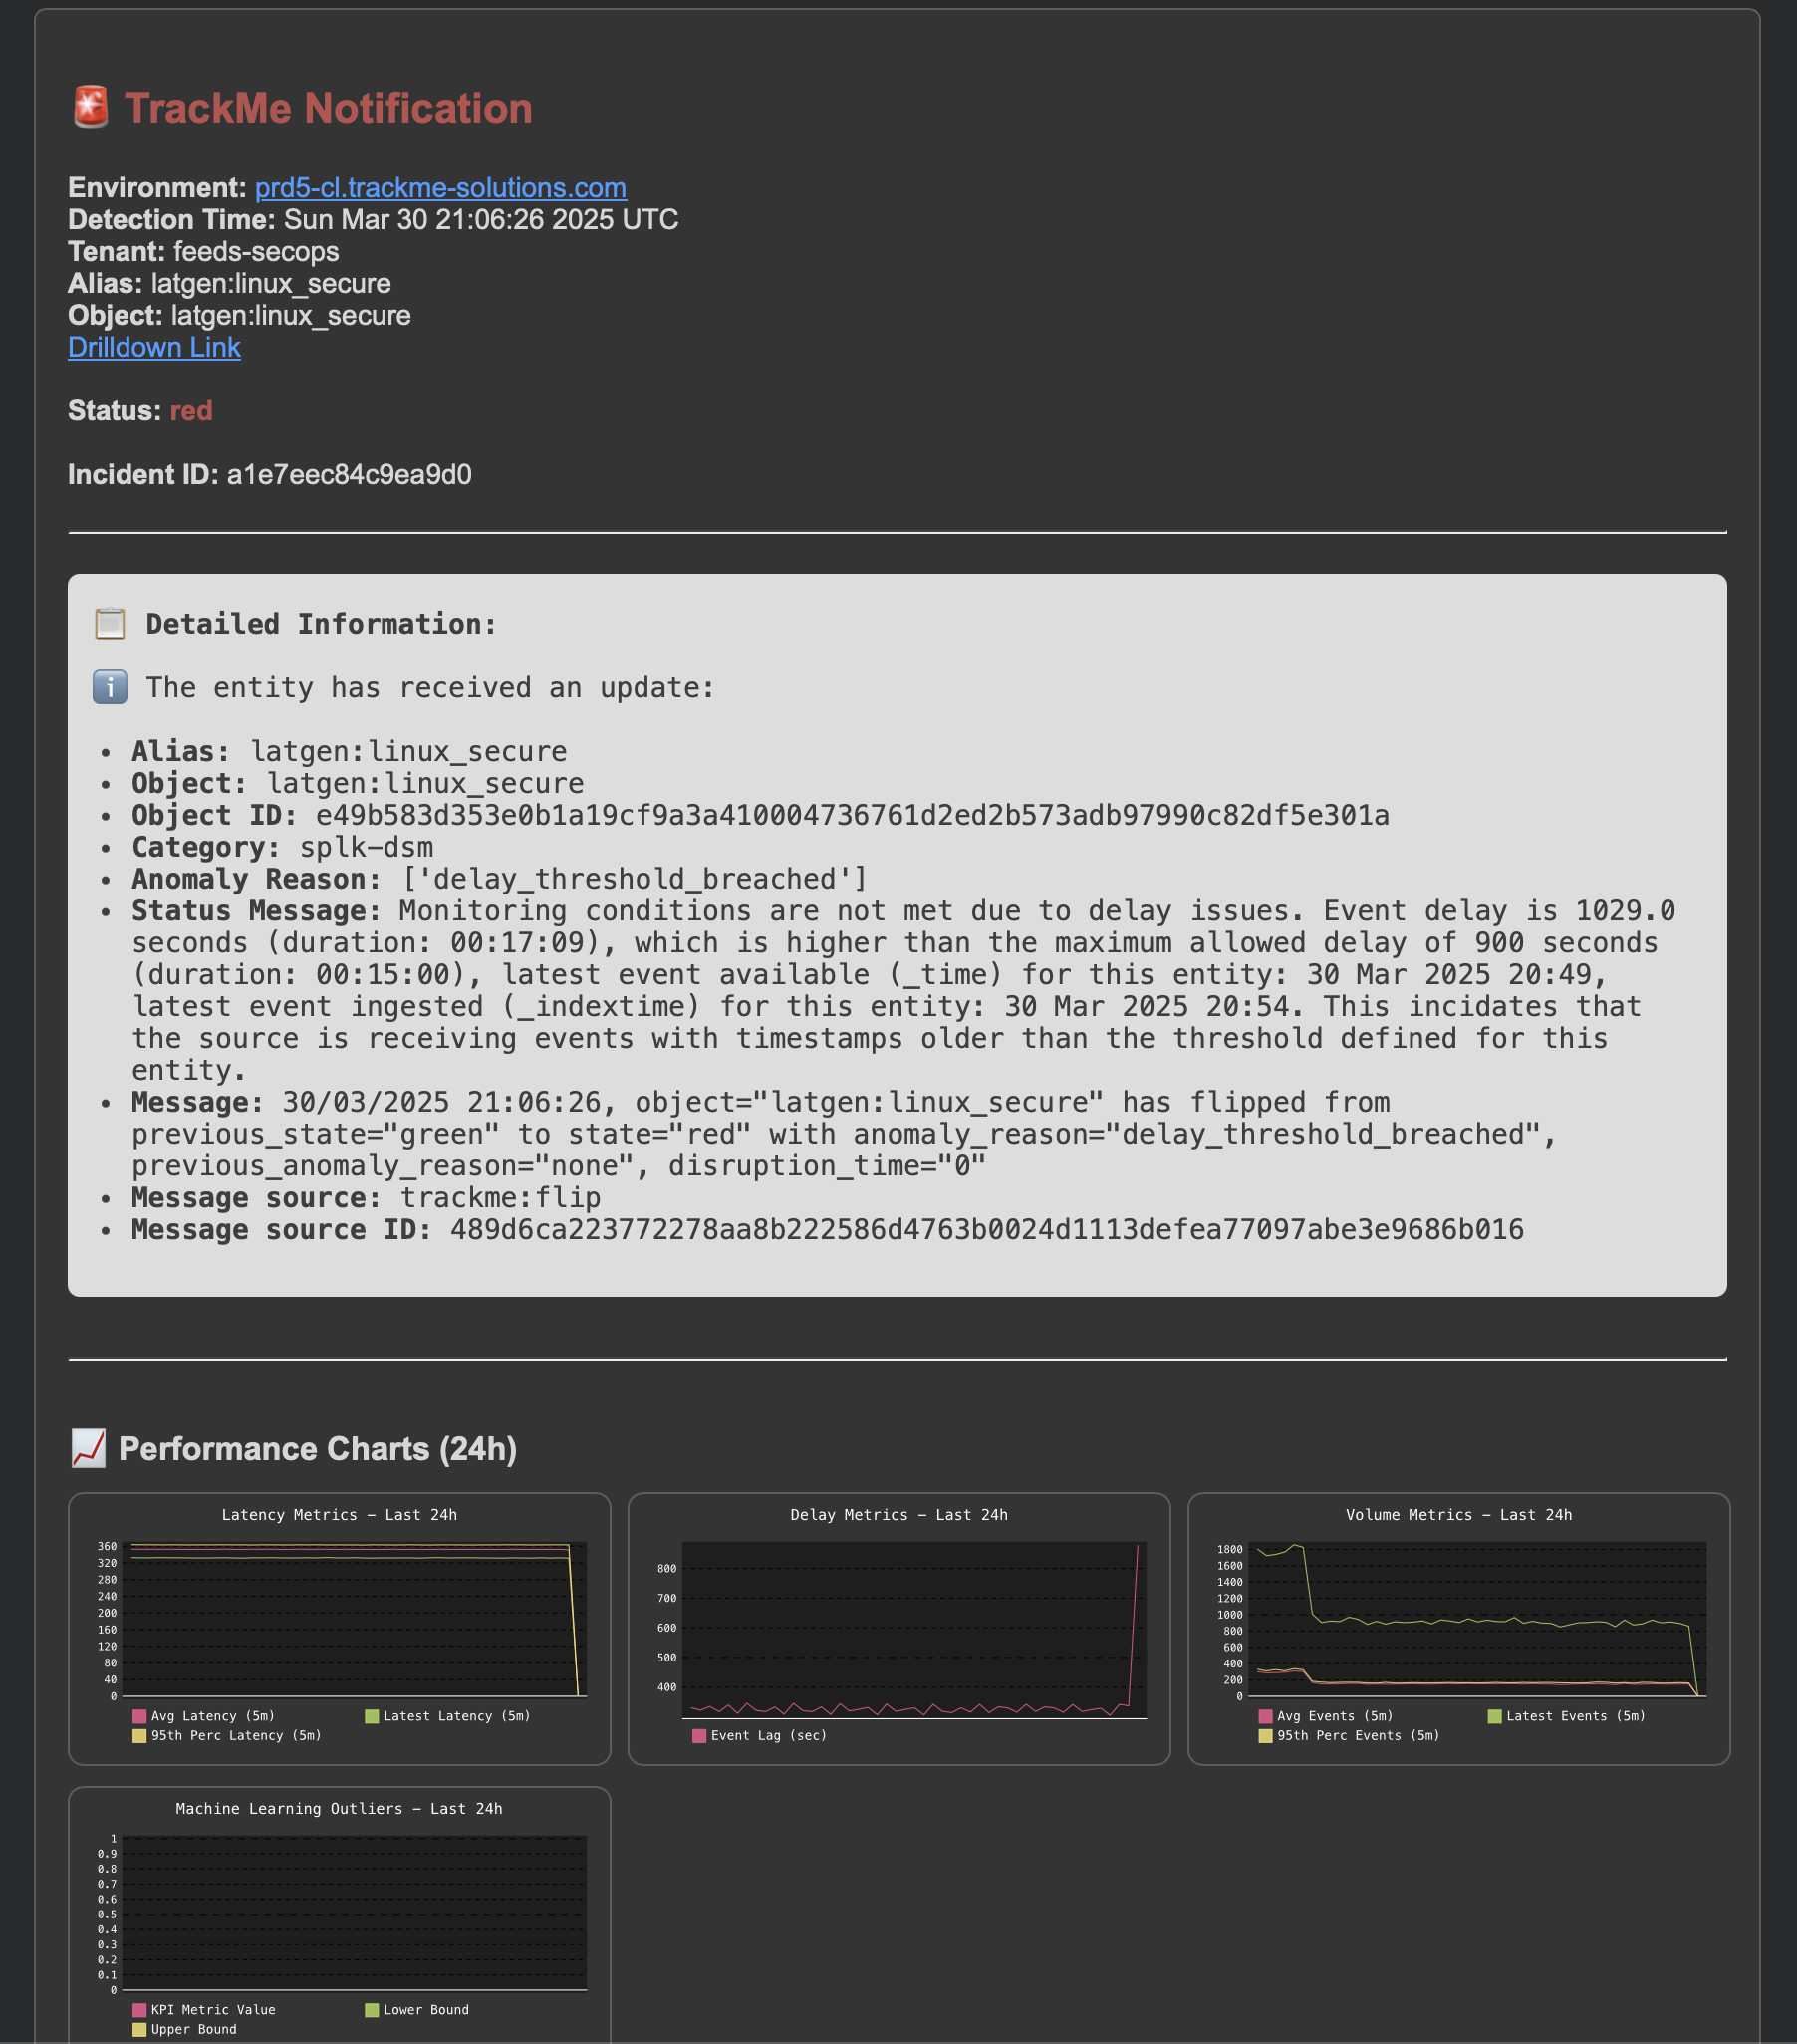
An update incident event is created:
index=trackme_summary sourcetype=trackme:stateful_alerts tenant_id="mytenant" object="myobject" alert_status="updated"
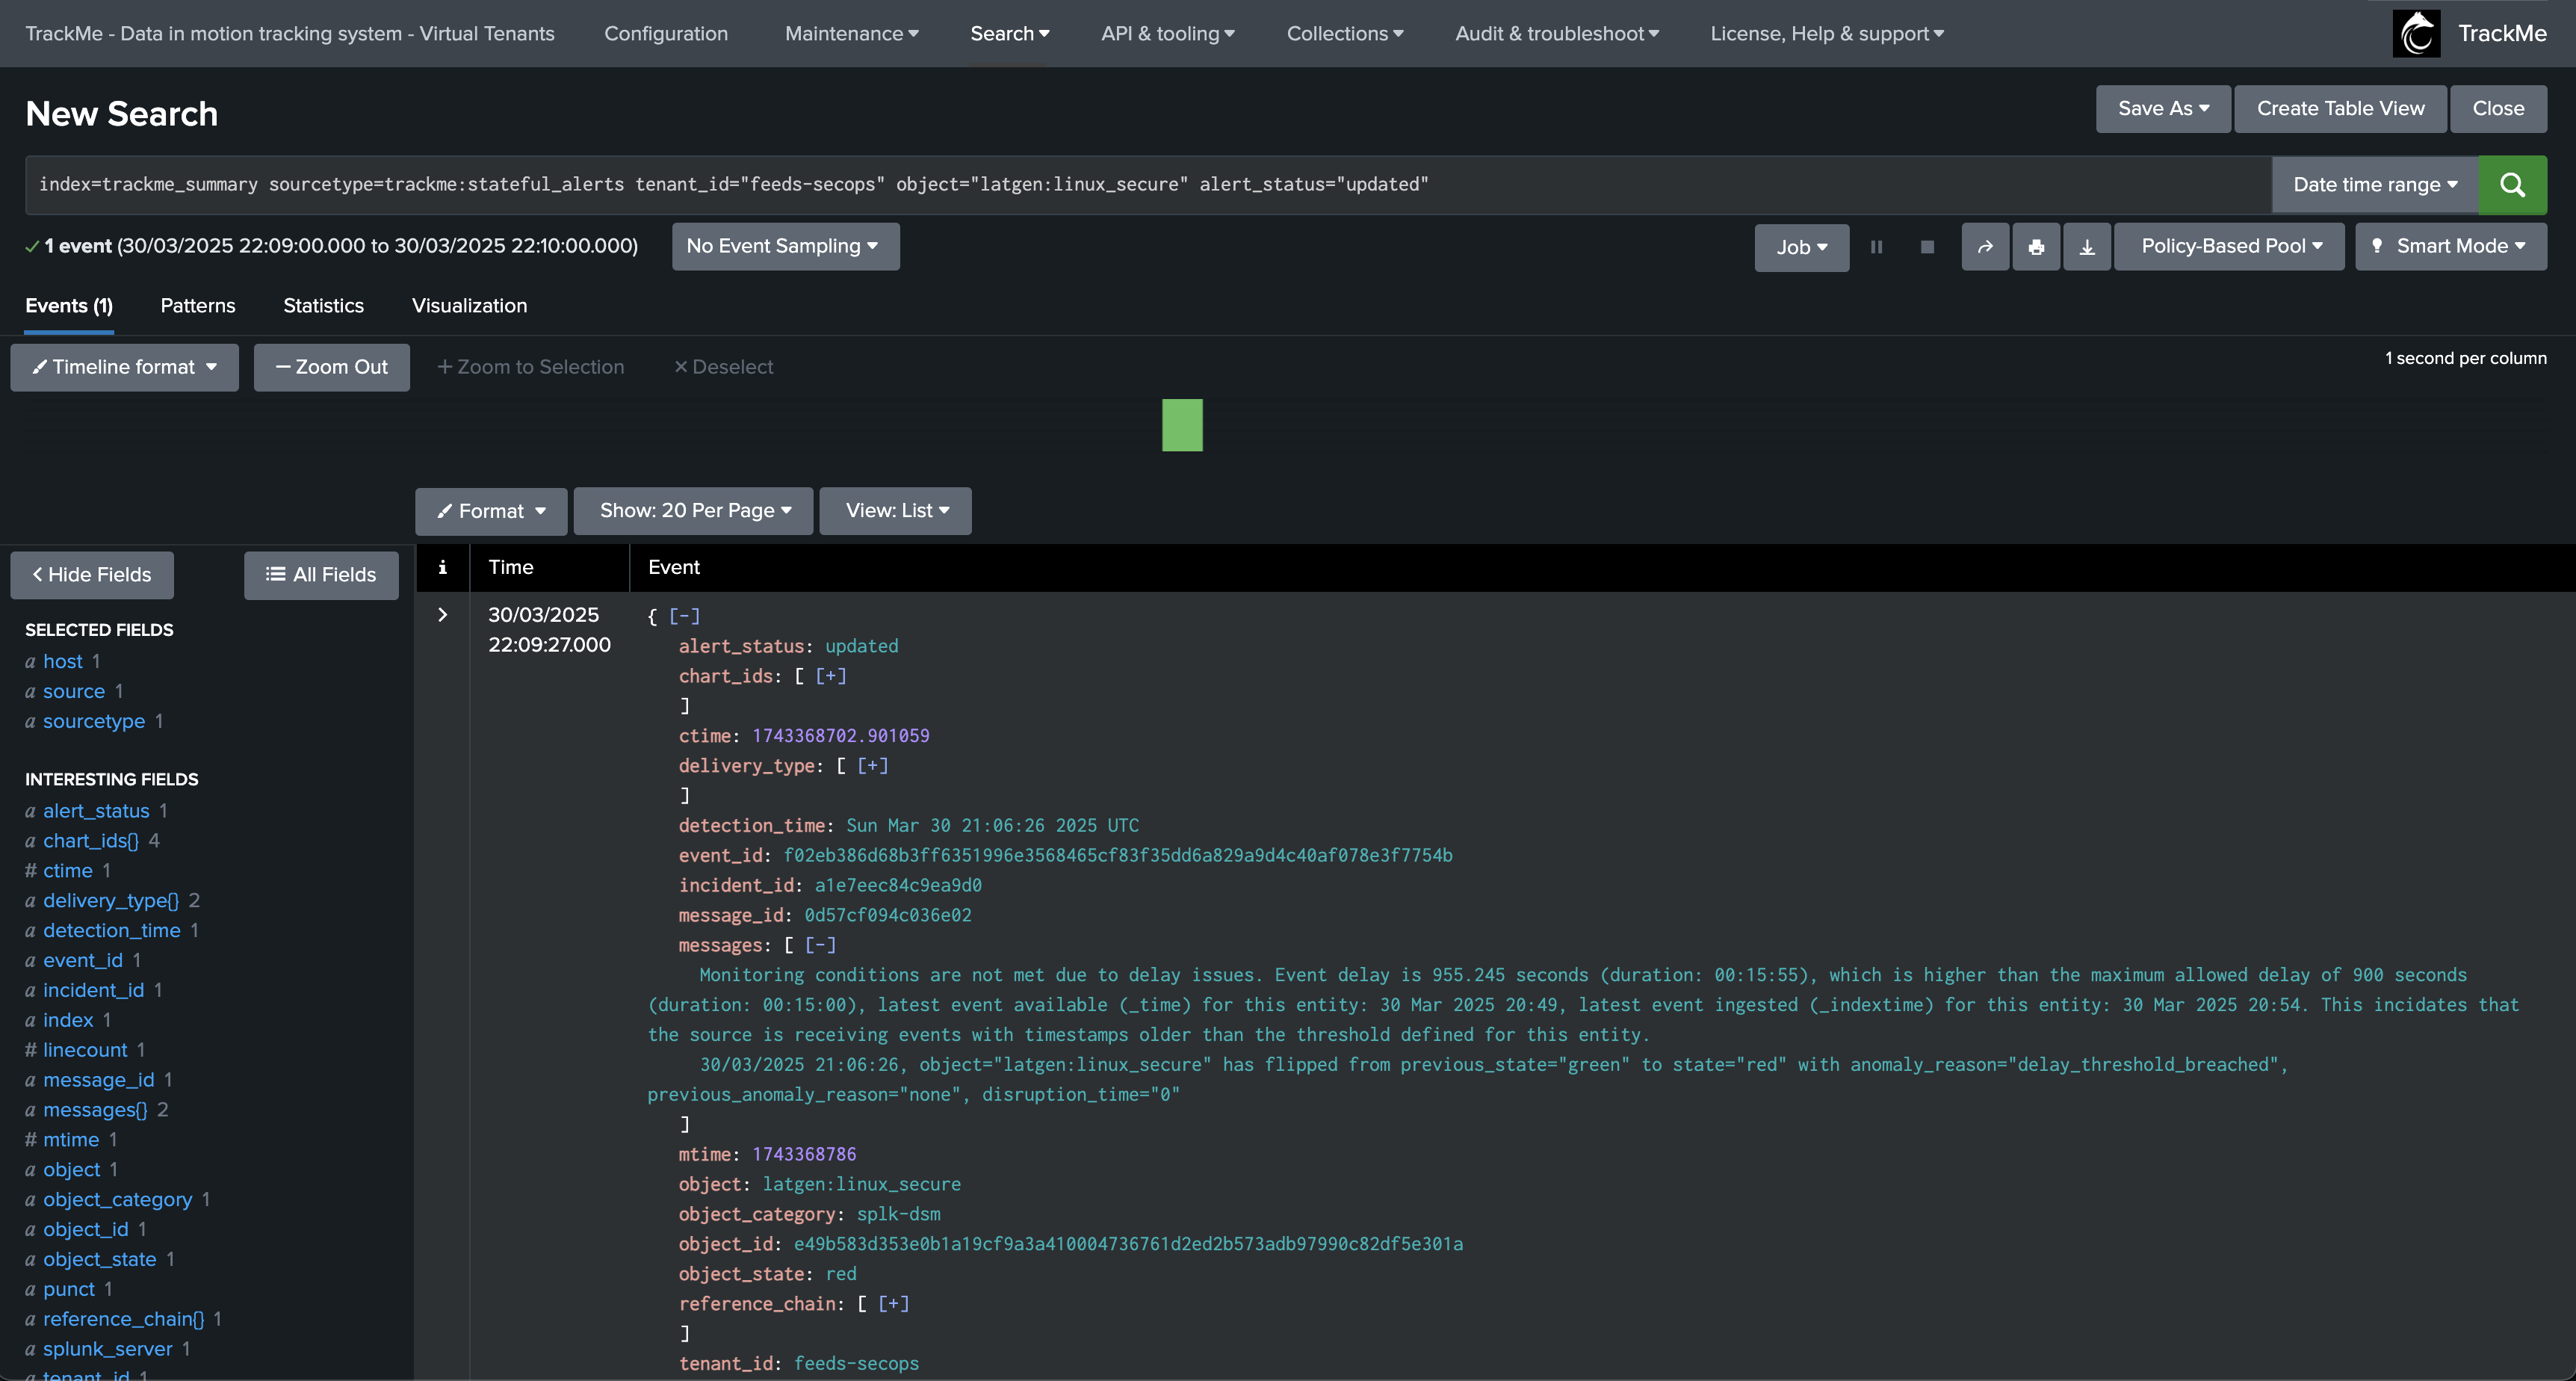
Later on, the SLA is breached, a new notification is generated:
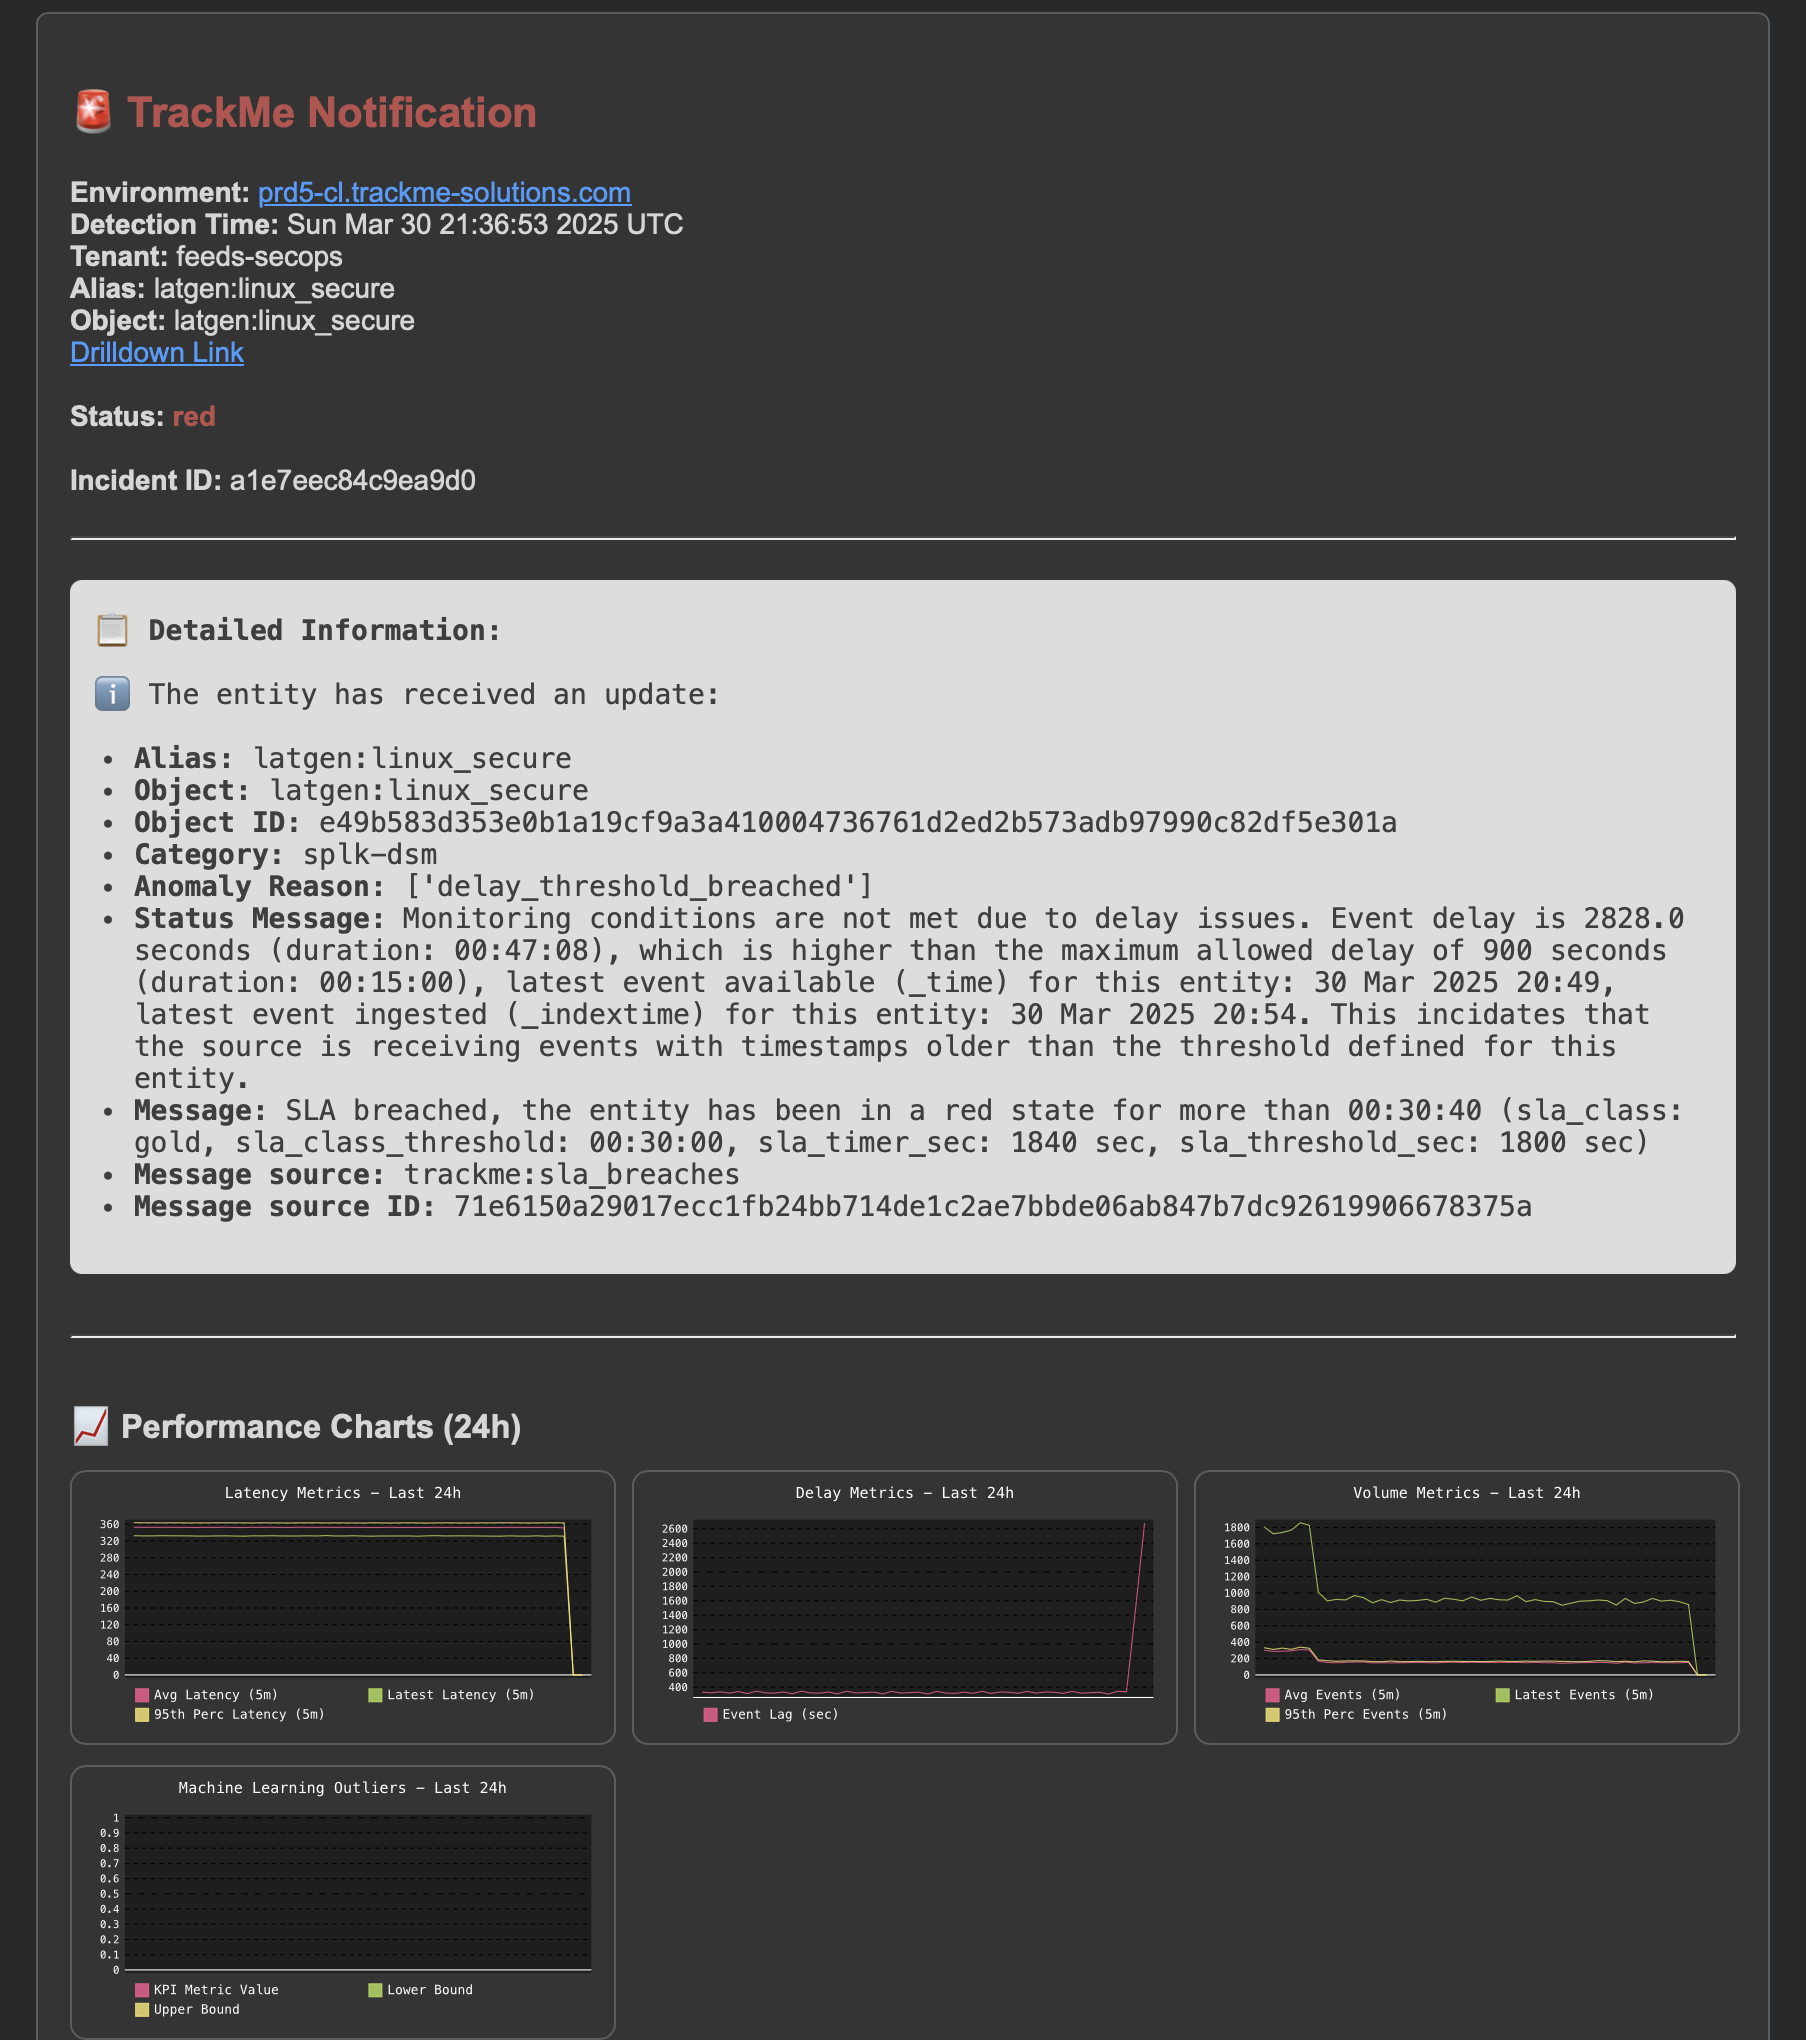
Another update incident event is created:
index=trackme_summary sourcetype=trackme:stateful_alerts tenant_id="mytenant" object="myobject" alert_status="updated"
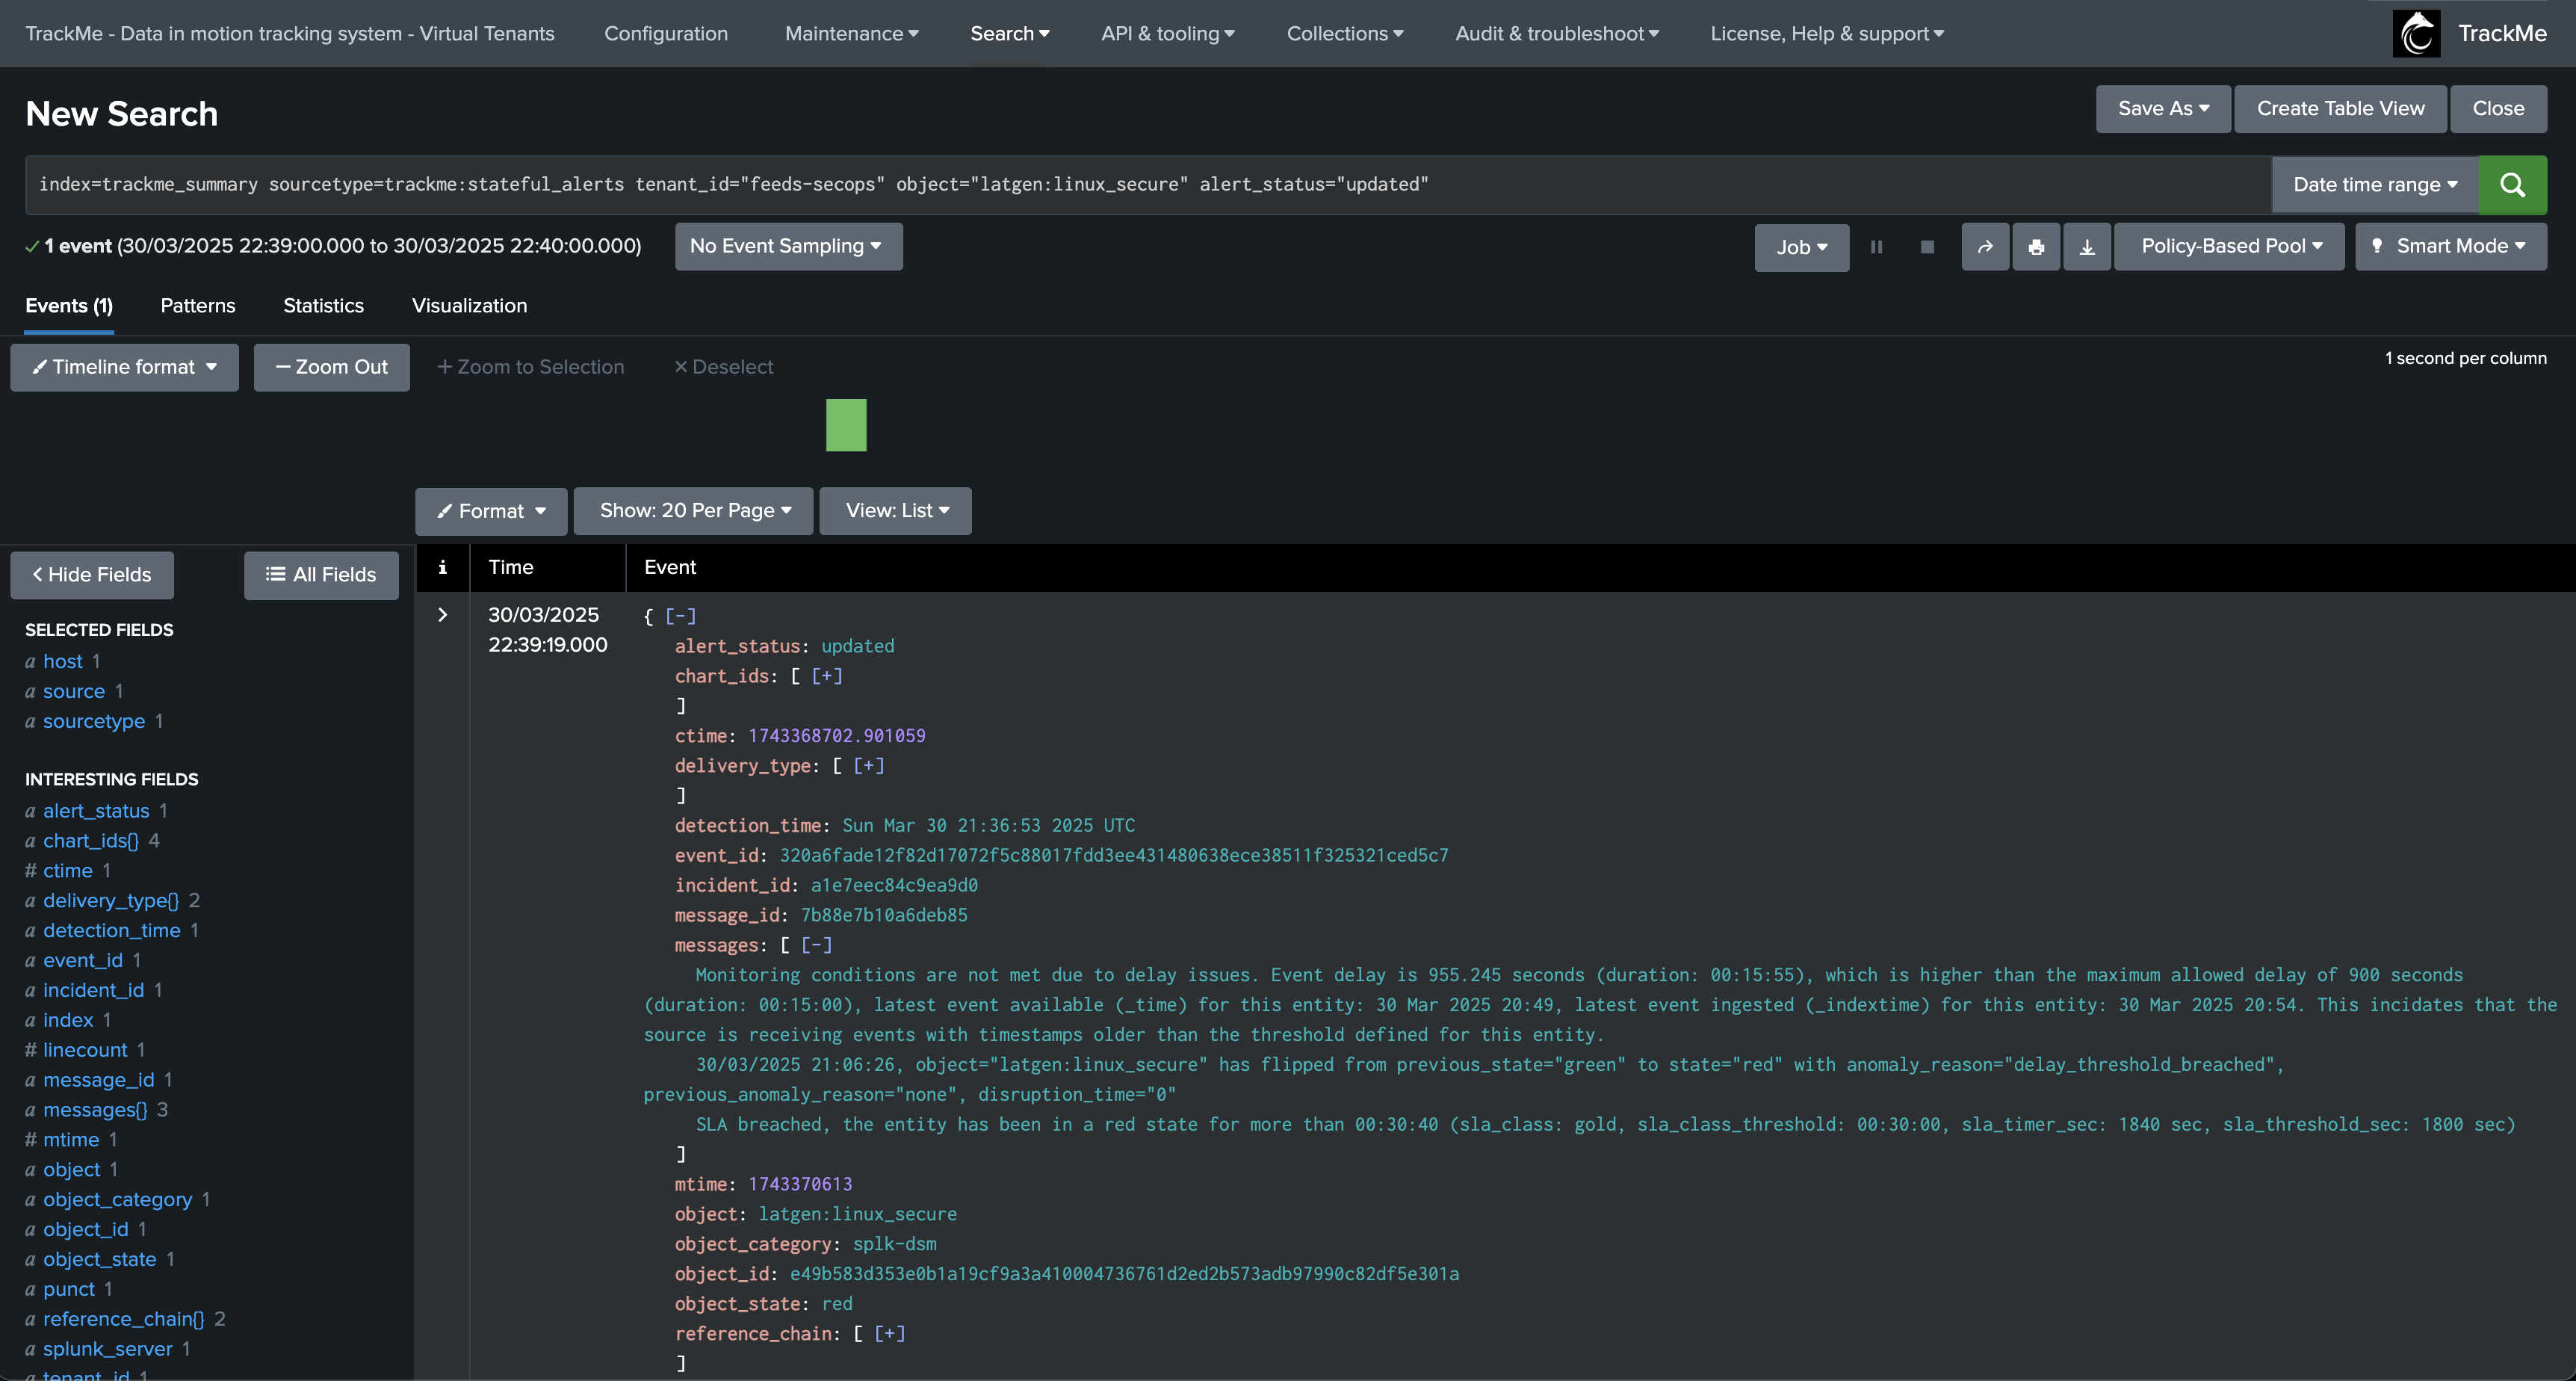
Finally, the issue is resolved, an incident closure notification is generated:
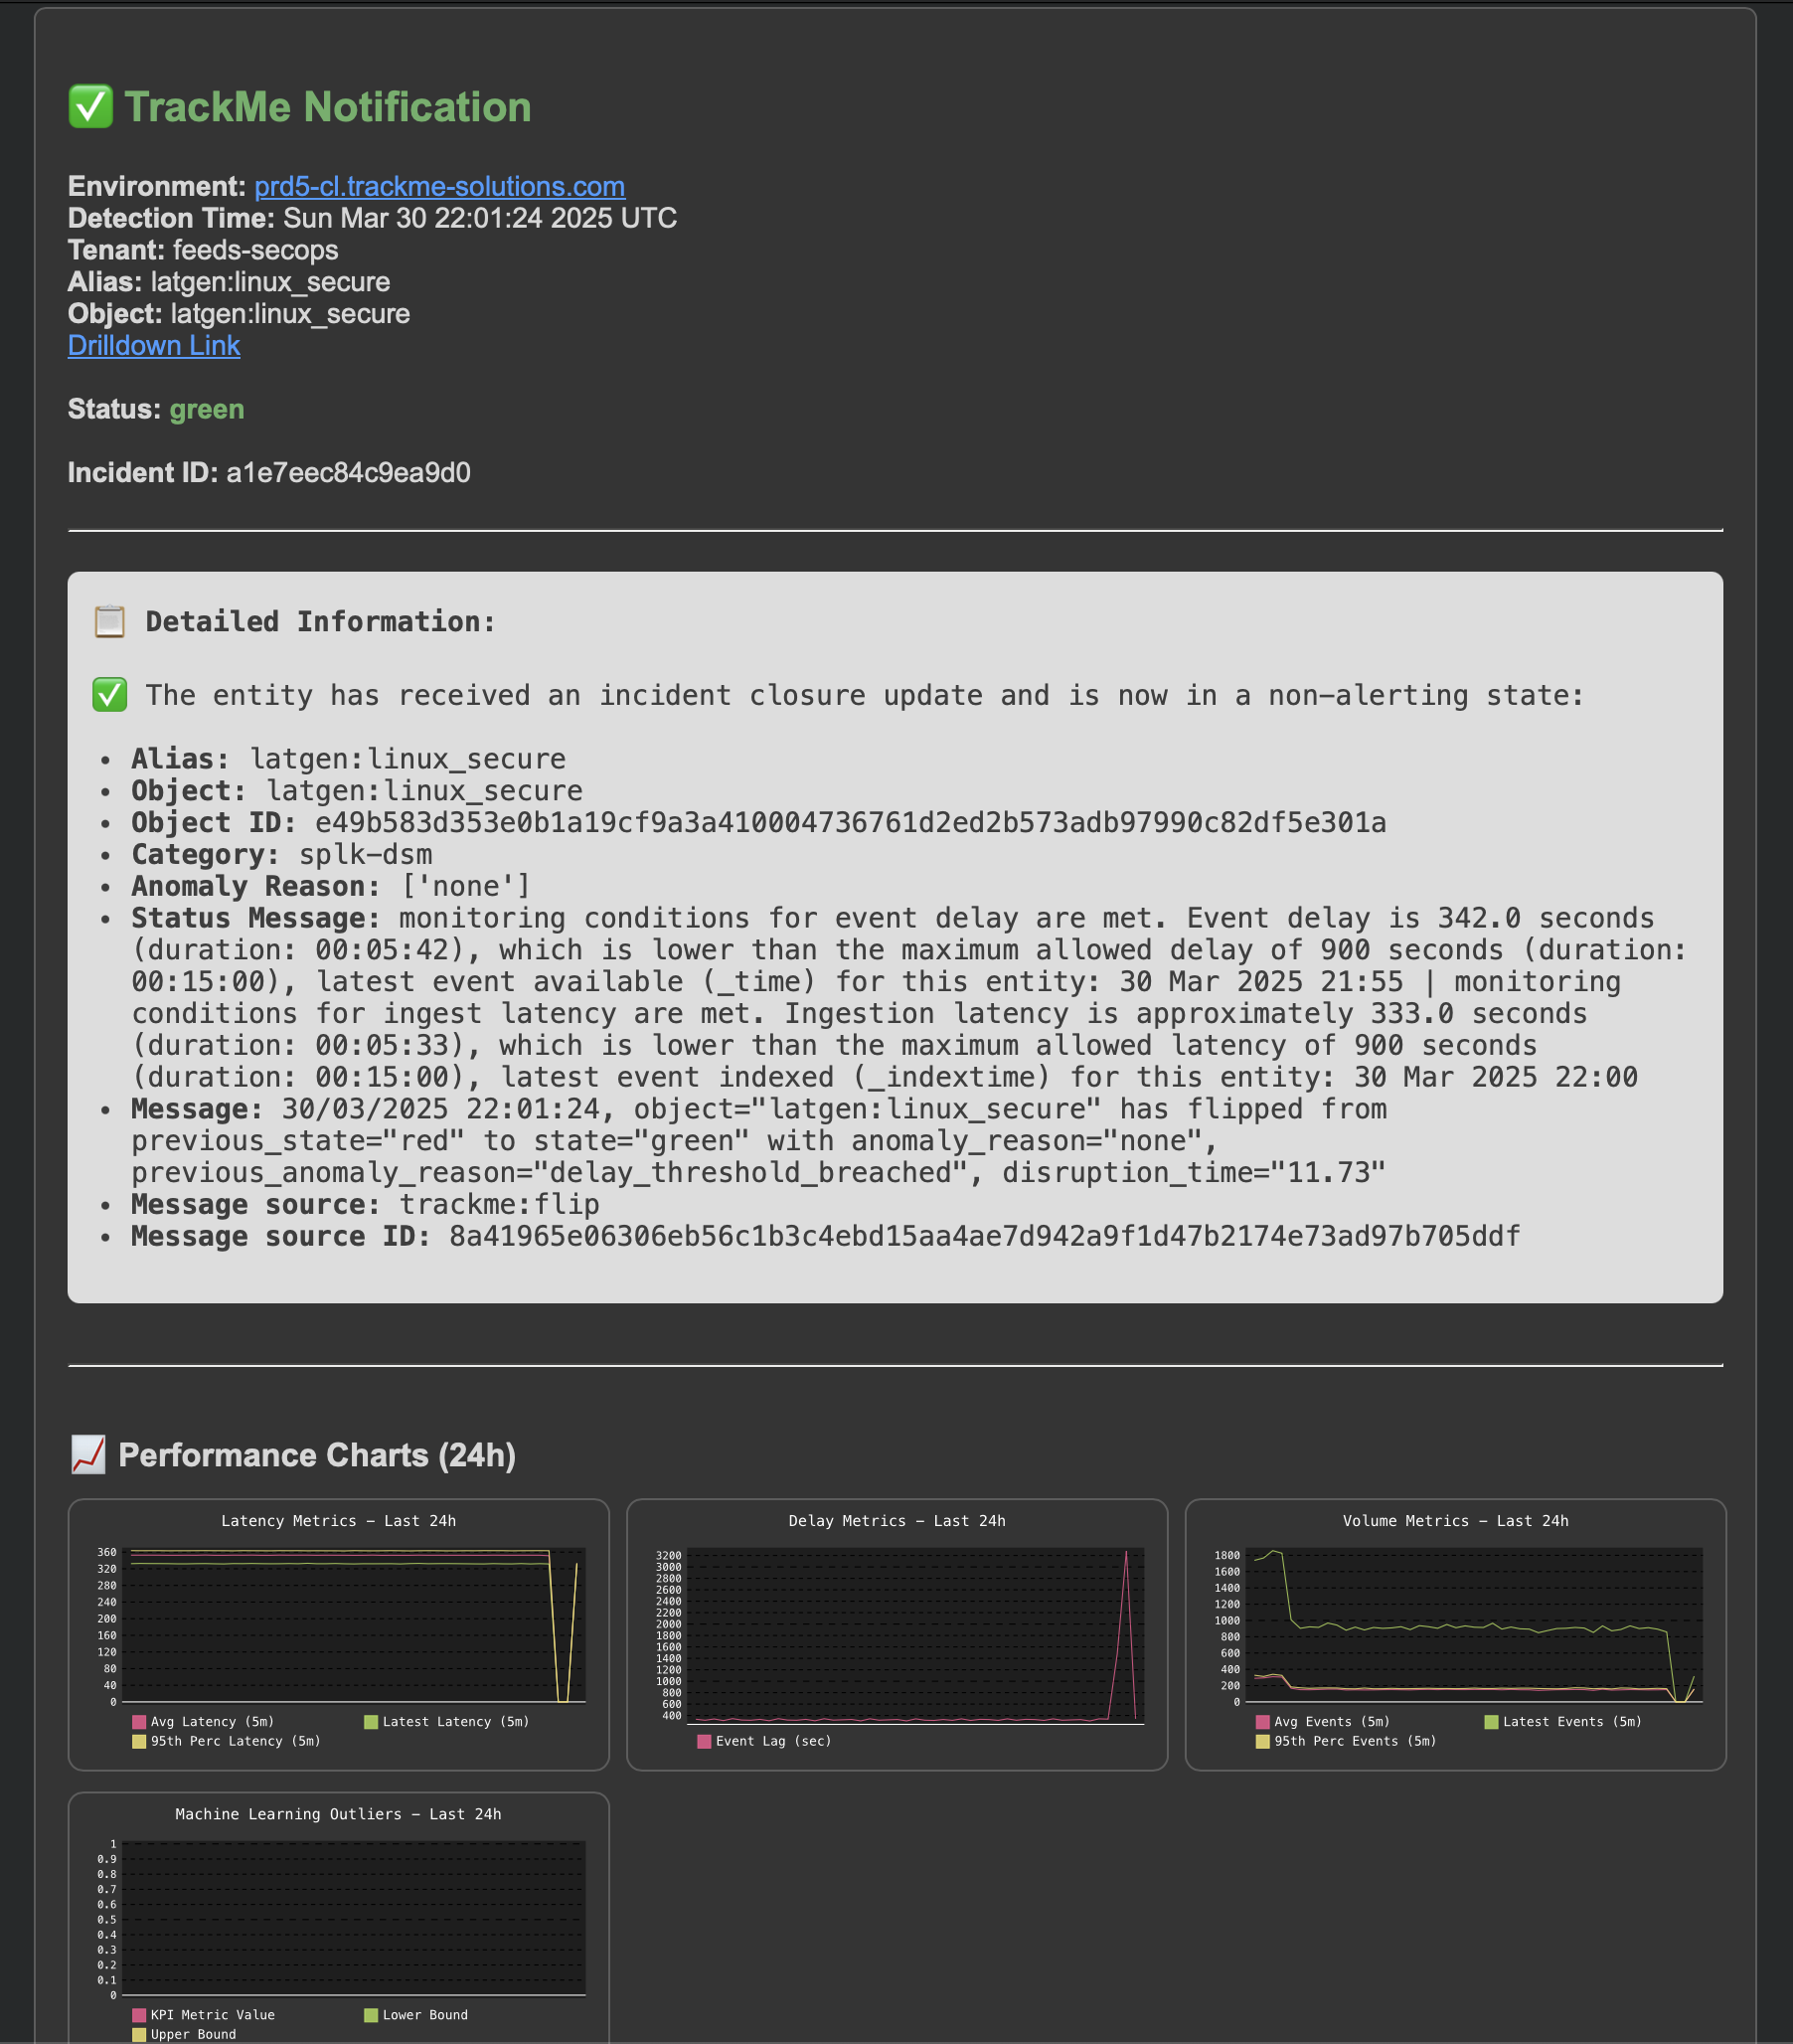
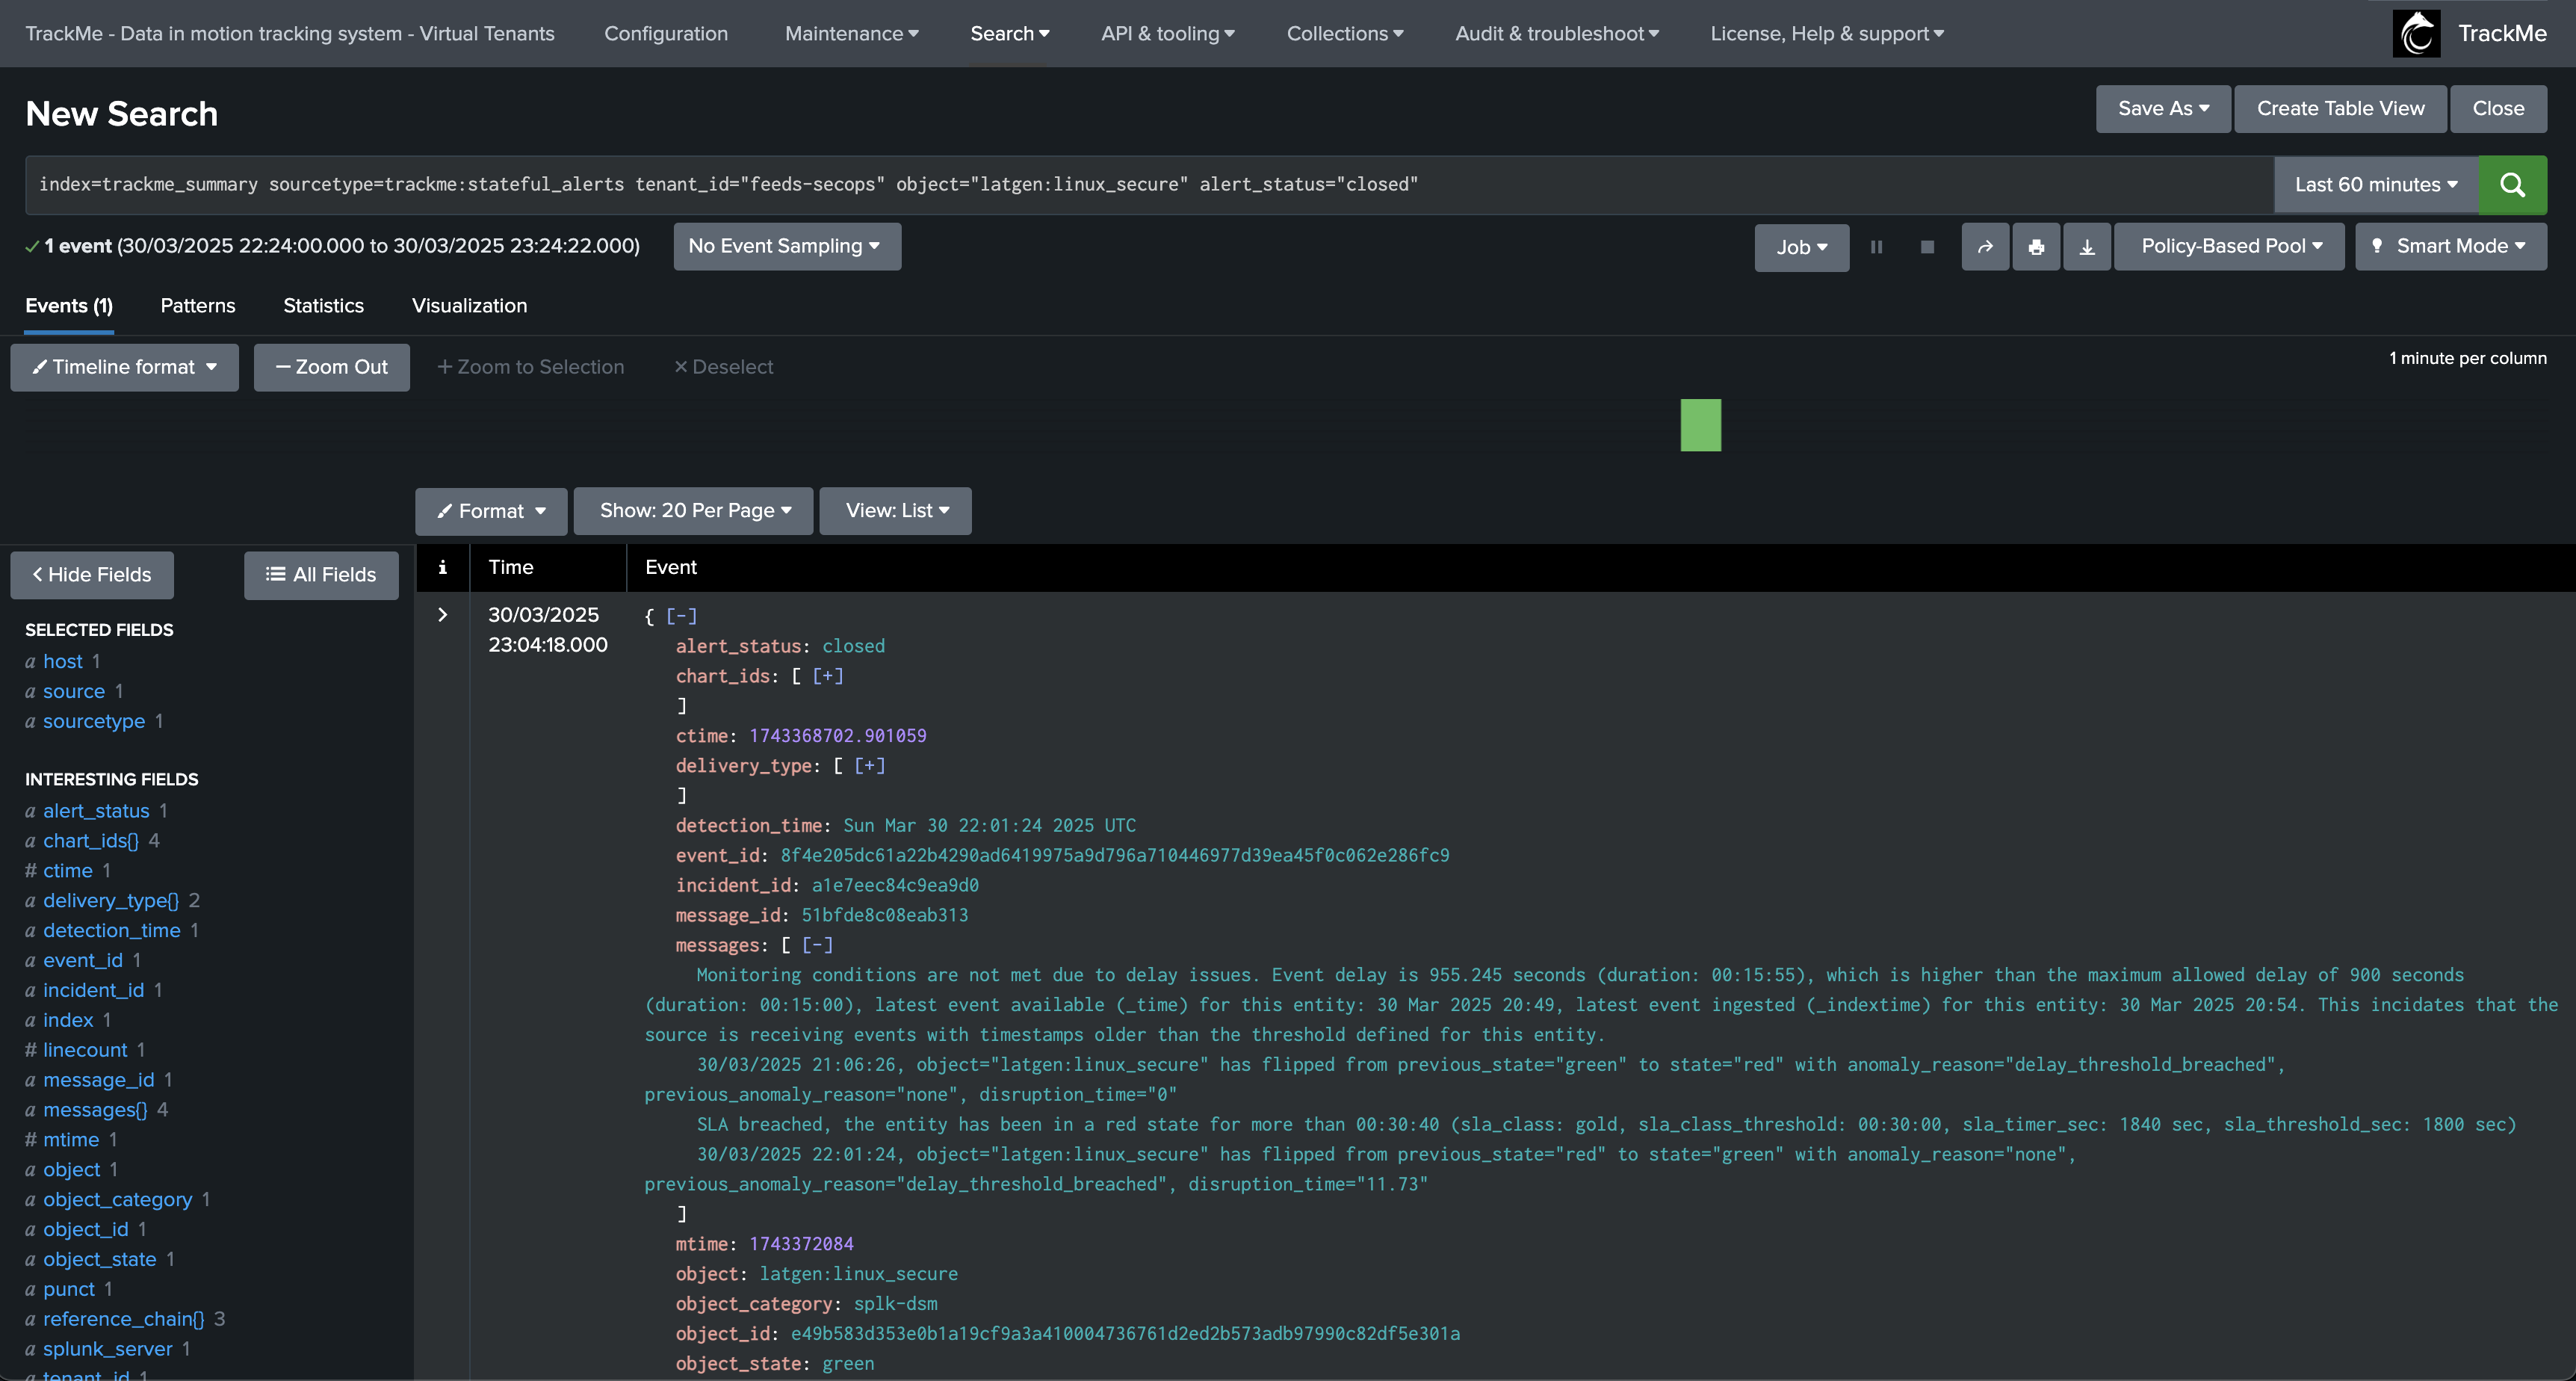
An incident closure event is created:
index=trackme_summary sourcetype=trackme:stateful_alerts tenant_id="mytenant" object="myobject" alert_status="closed"
Example: Splunk Cluster Monitoring with splk-flx
In this example, we monitor a Splunk cluster and Splunk indexers through the Flex object component.
Initial status: The cluster global status is healthy, all peers are up and running:


The cluster and its members can also be visualised as a topology — either as a hierarchical link graph or as a node-link network graph:


An incident affects an indexer, the global cluster status as well as the indexer turn into alerting state:


Drilling into the affected cluster entity shows the peer drop and the detailed cluster status message:


A first notification is generated for the cluster status. The rich HTML email, top to bottom: the incident header and detail, the AI status report with the 24-hour event charts, and the embedded performance charts:


The affected indexer peer raises its own notification too — the same rich format, scoped to that peer:


An opening incident event is created:
index=trackme_summary sourcetype=trackme:stateful_alerts tenant_id="cluster-mon" object="infrastructure:splunk_cluster:idxc1" alert_status="opened"

Once the underlying issue is fixed and the peers rejoin the cluster, both entities return to a healthy (green) state and TrackMe closes their incidents — each recovery raises a closure notification and writes a closure event.
The affected indexer peer recovers first: it is back to green, and its incident is closed. The closure event appears both in the entity’s Incidents tab and in the summary index:


The peer’s closure notification — the same rich, threaded email, now delivering the all-clear:


With the peers back in service, the cluster status returns to green too, and its own incident is closed:


And the cluster status raises its own closure notification:


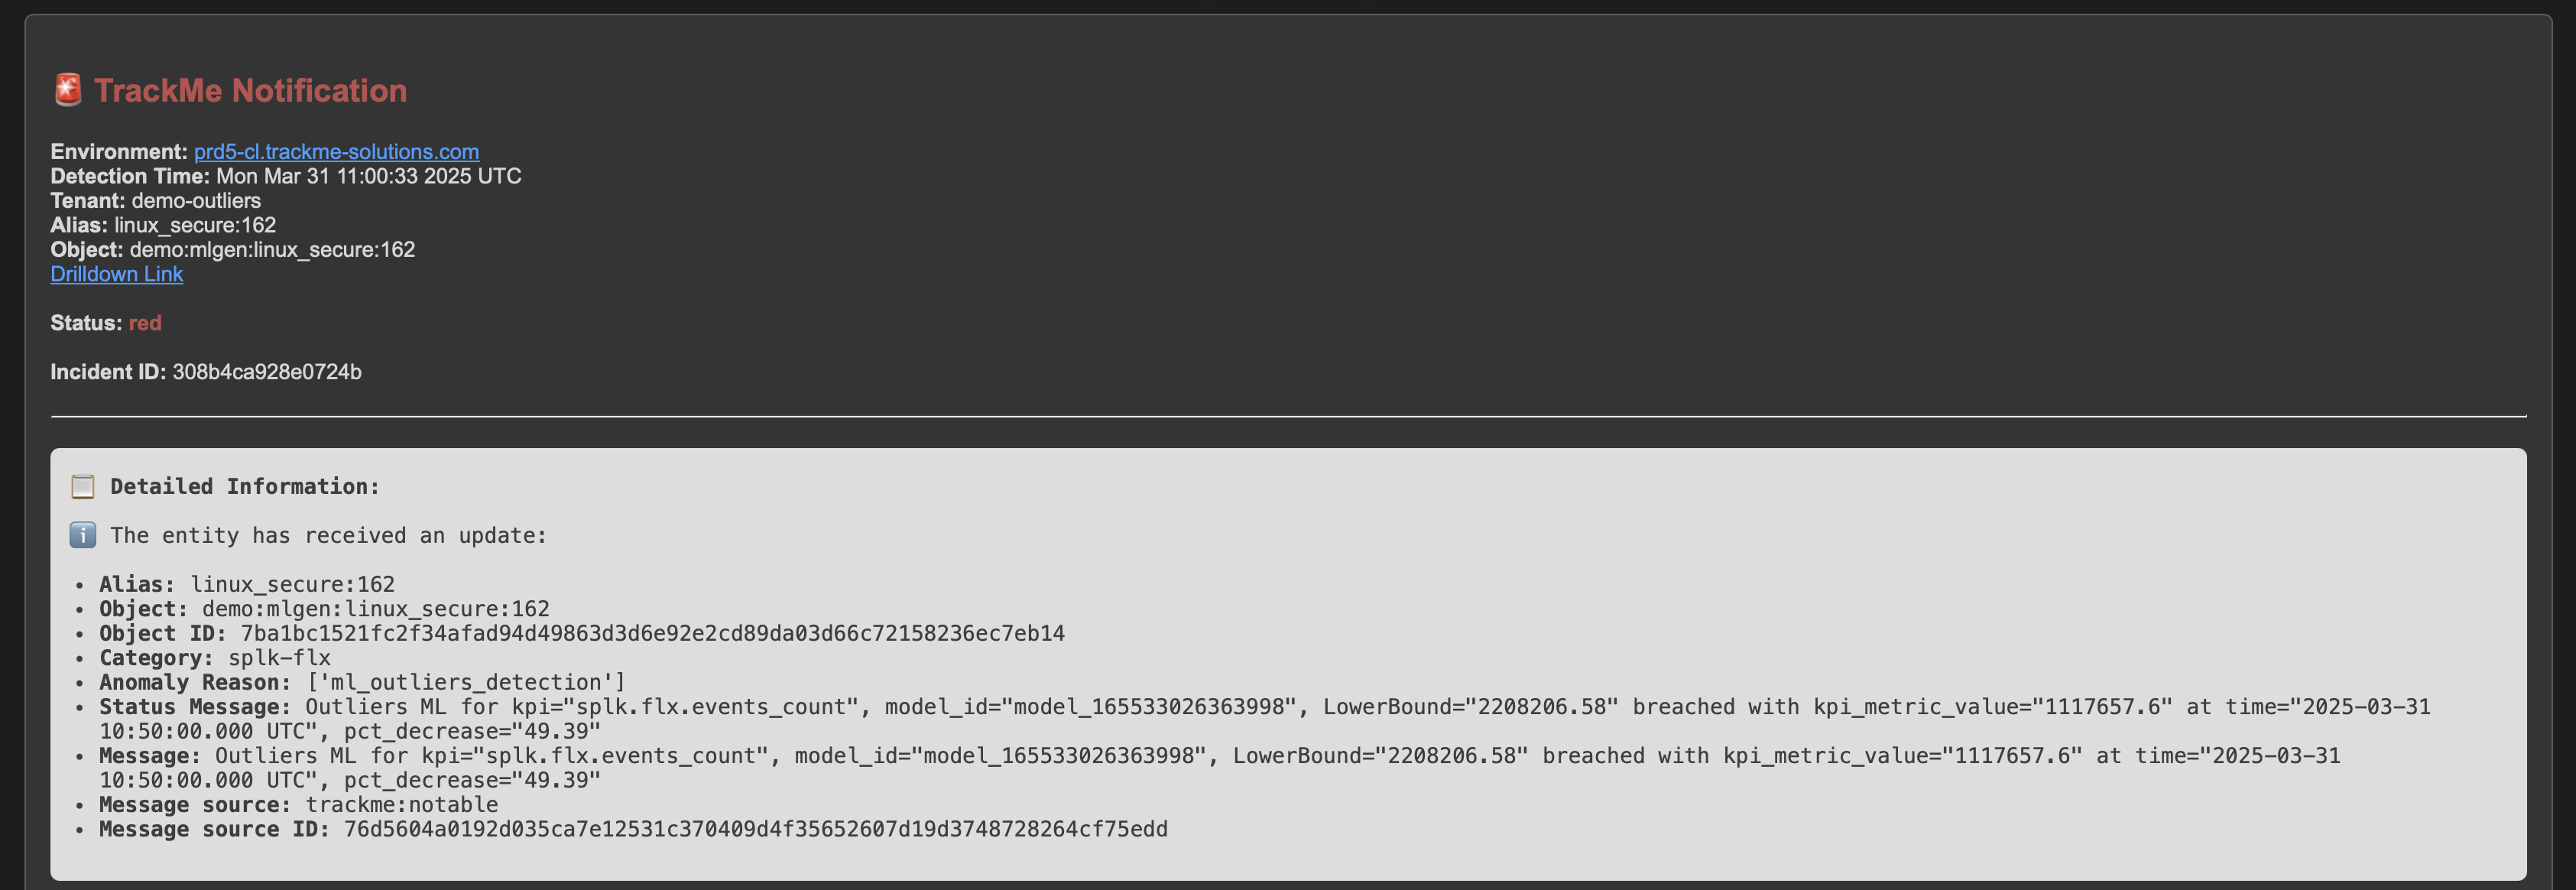
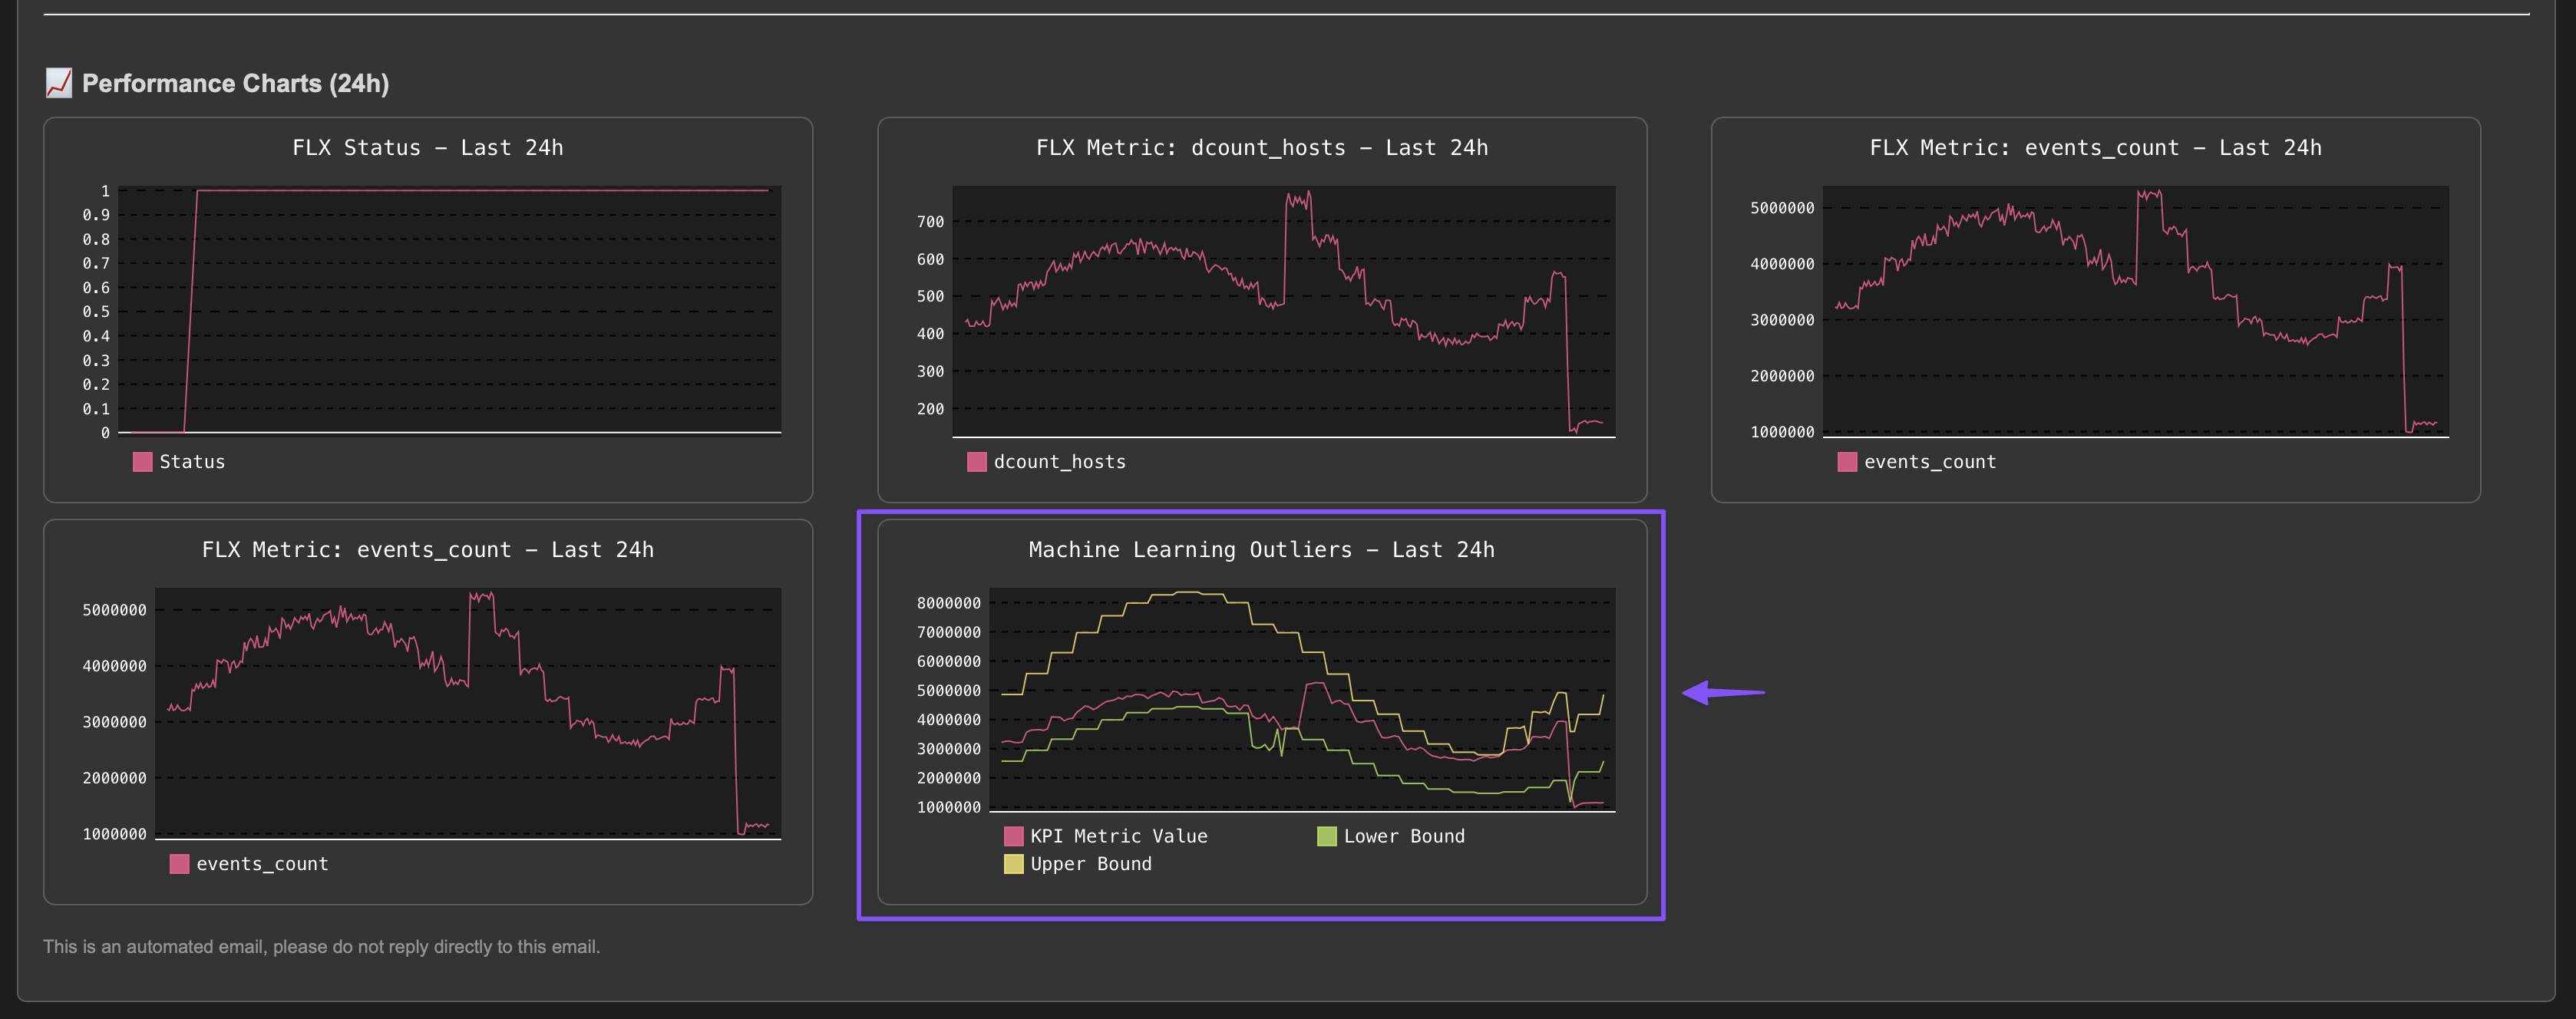
Example of a notification due to Machine Learning Outliers detection:
Below is an example of a notification due to Machine Learning Outliers detection:
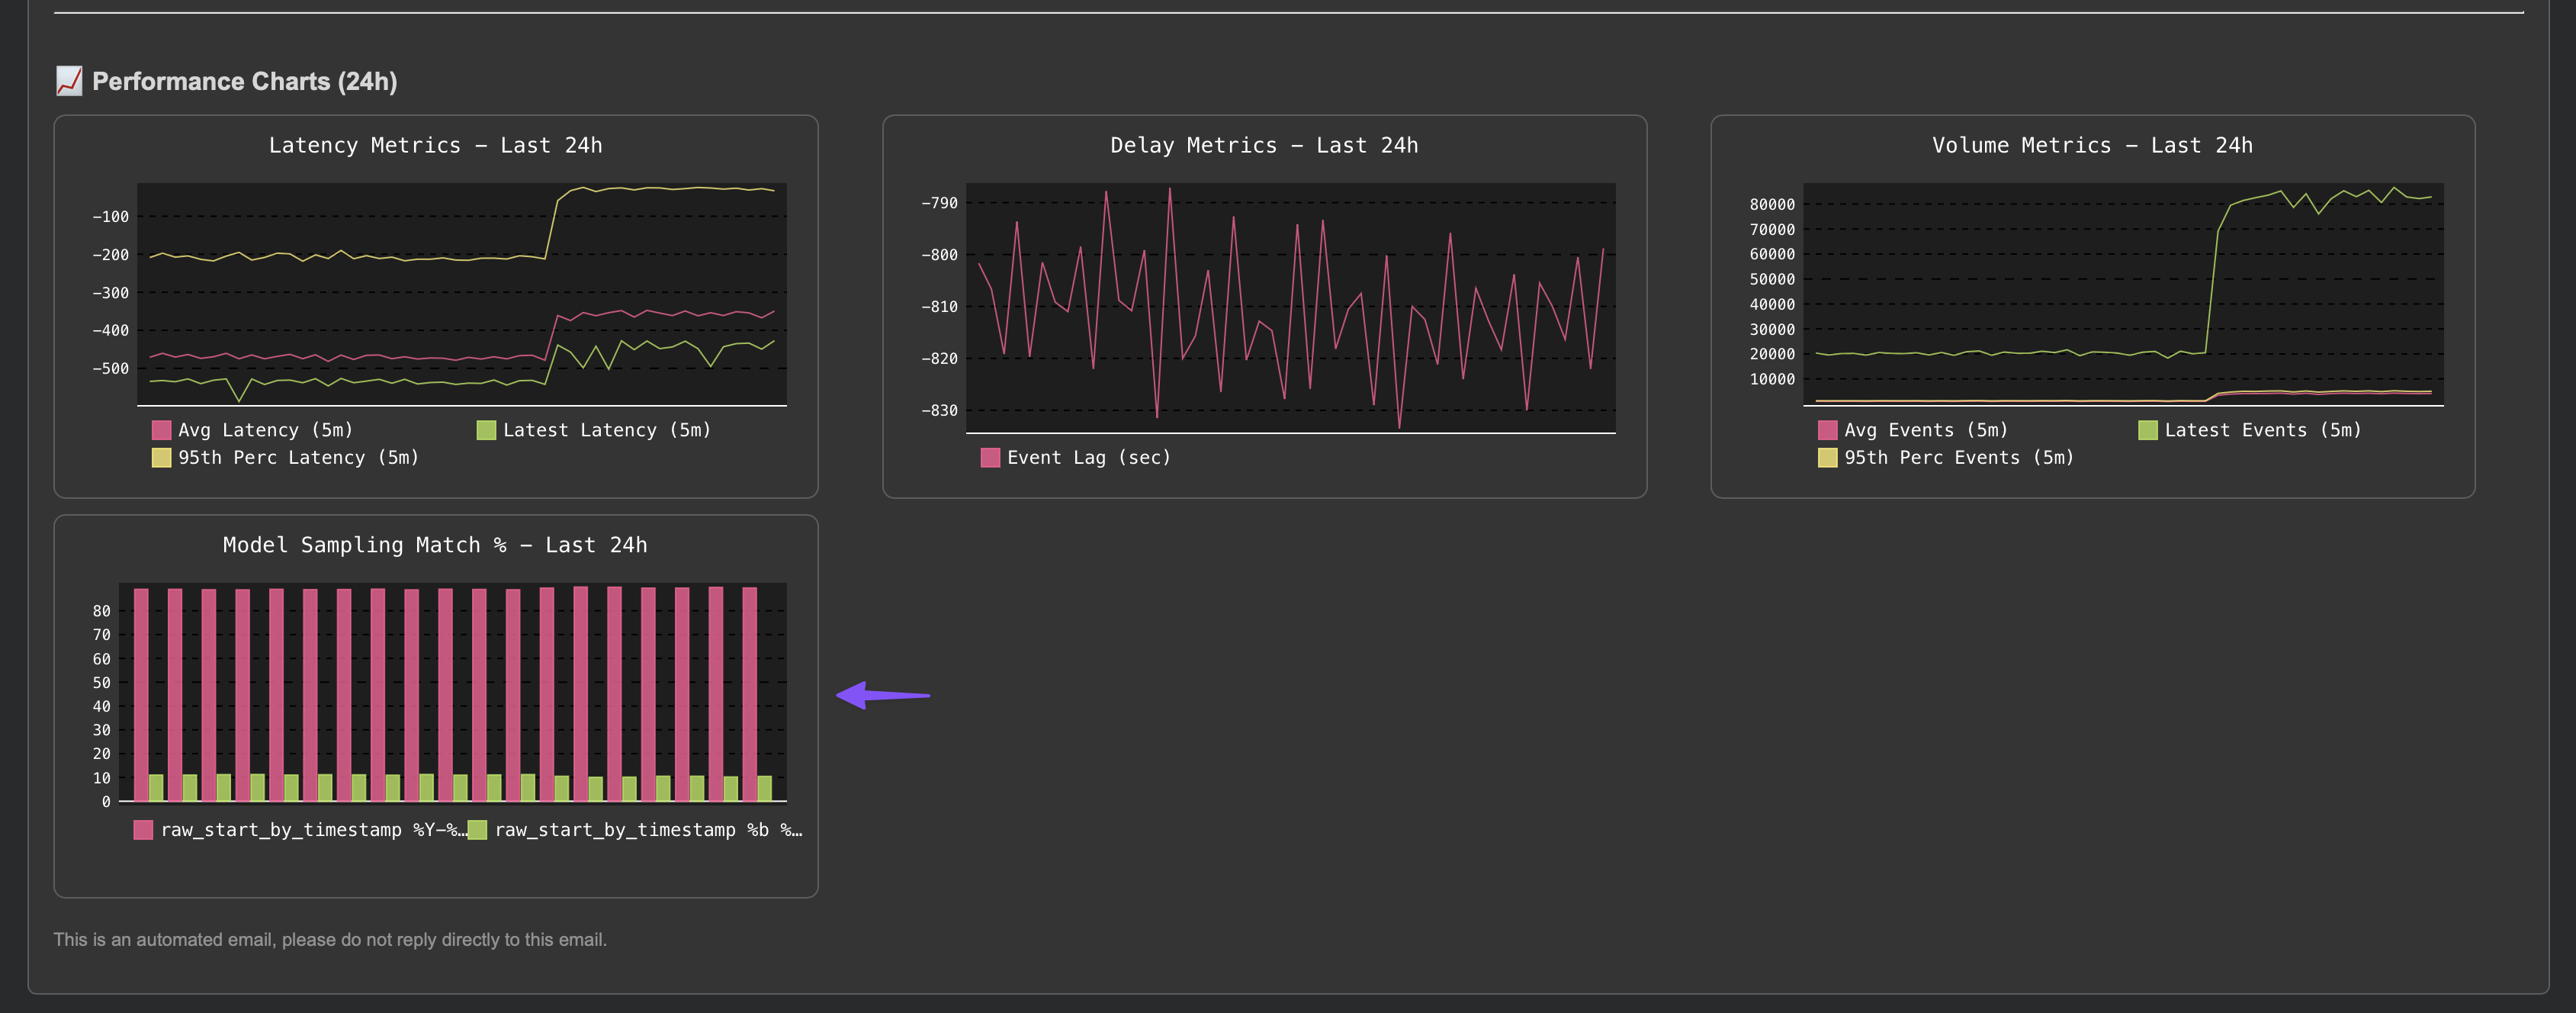
Note: TrackMe will automatically add a data sampling related chart in the notification, to help you visualise the issue.
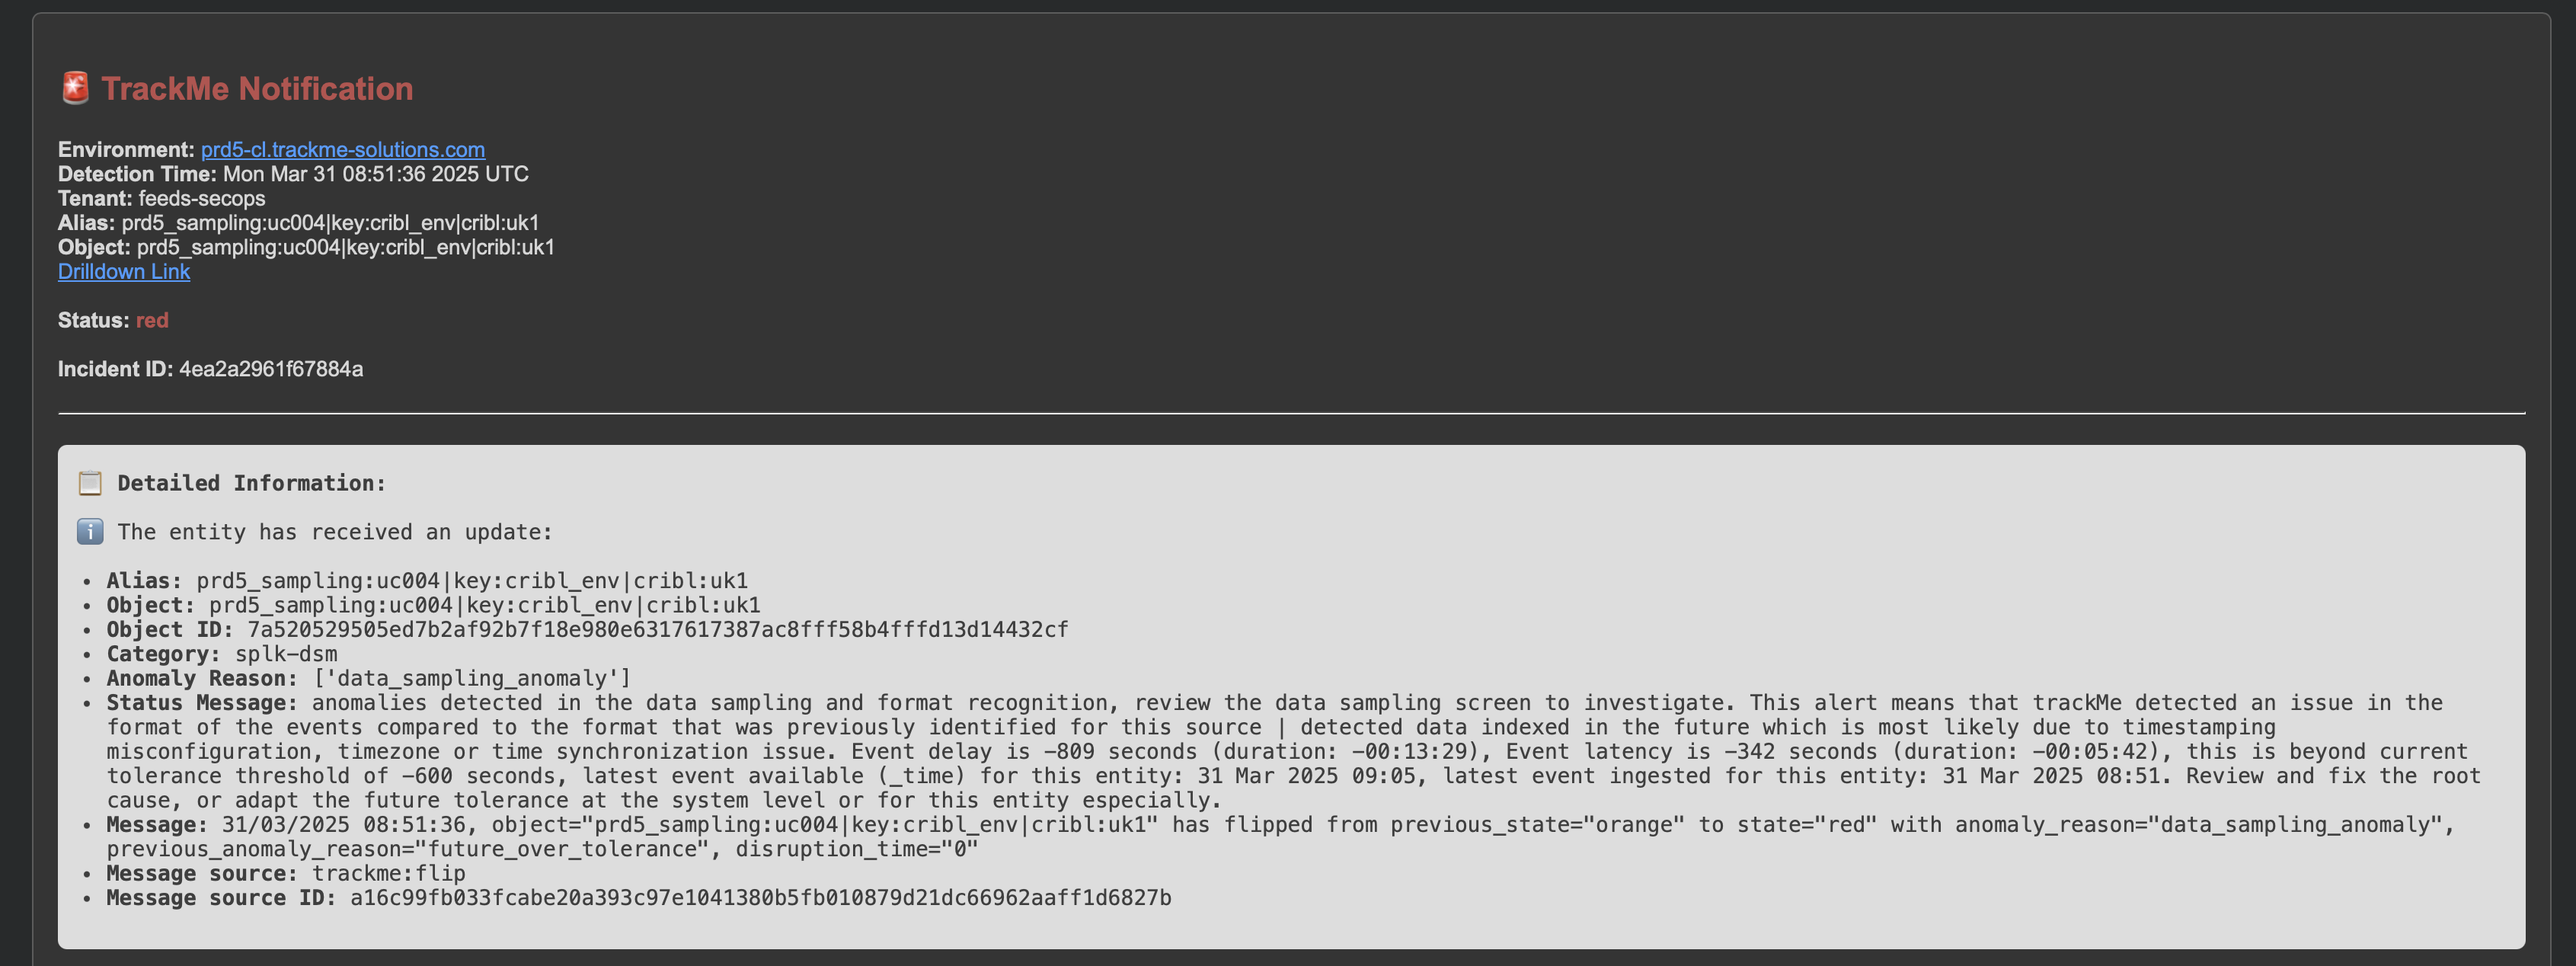
Example of a notification due to a feed data quality issue (data sampling):
Below is an example of a notification due to a feed data quality issue (data sampling):
Note: TrackMe will automatically add a data sampling related chart in the notification, to help you visualise the issue.
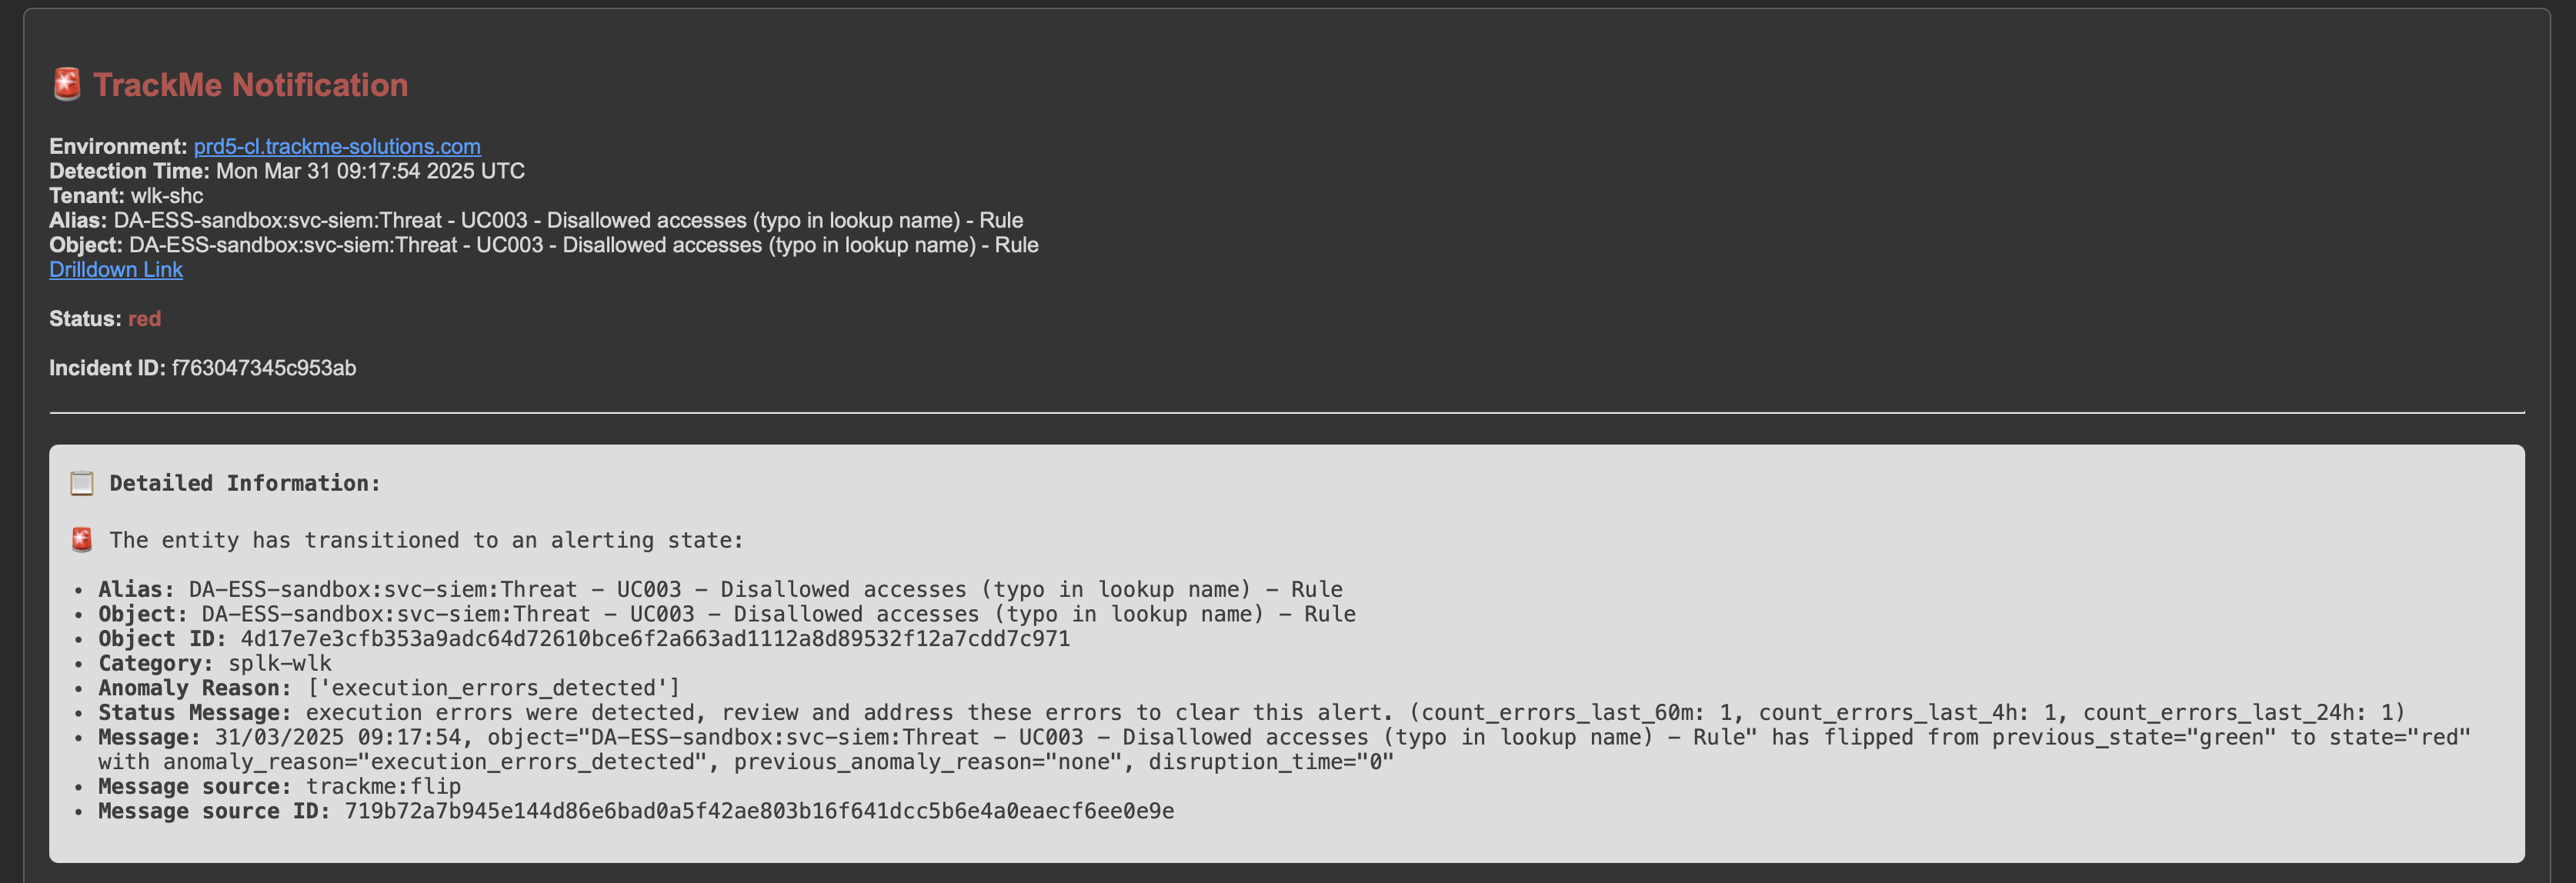
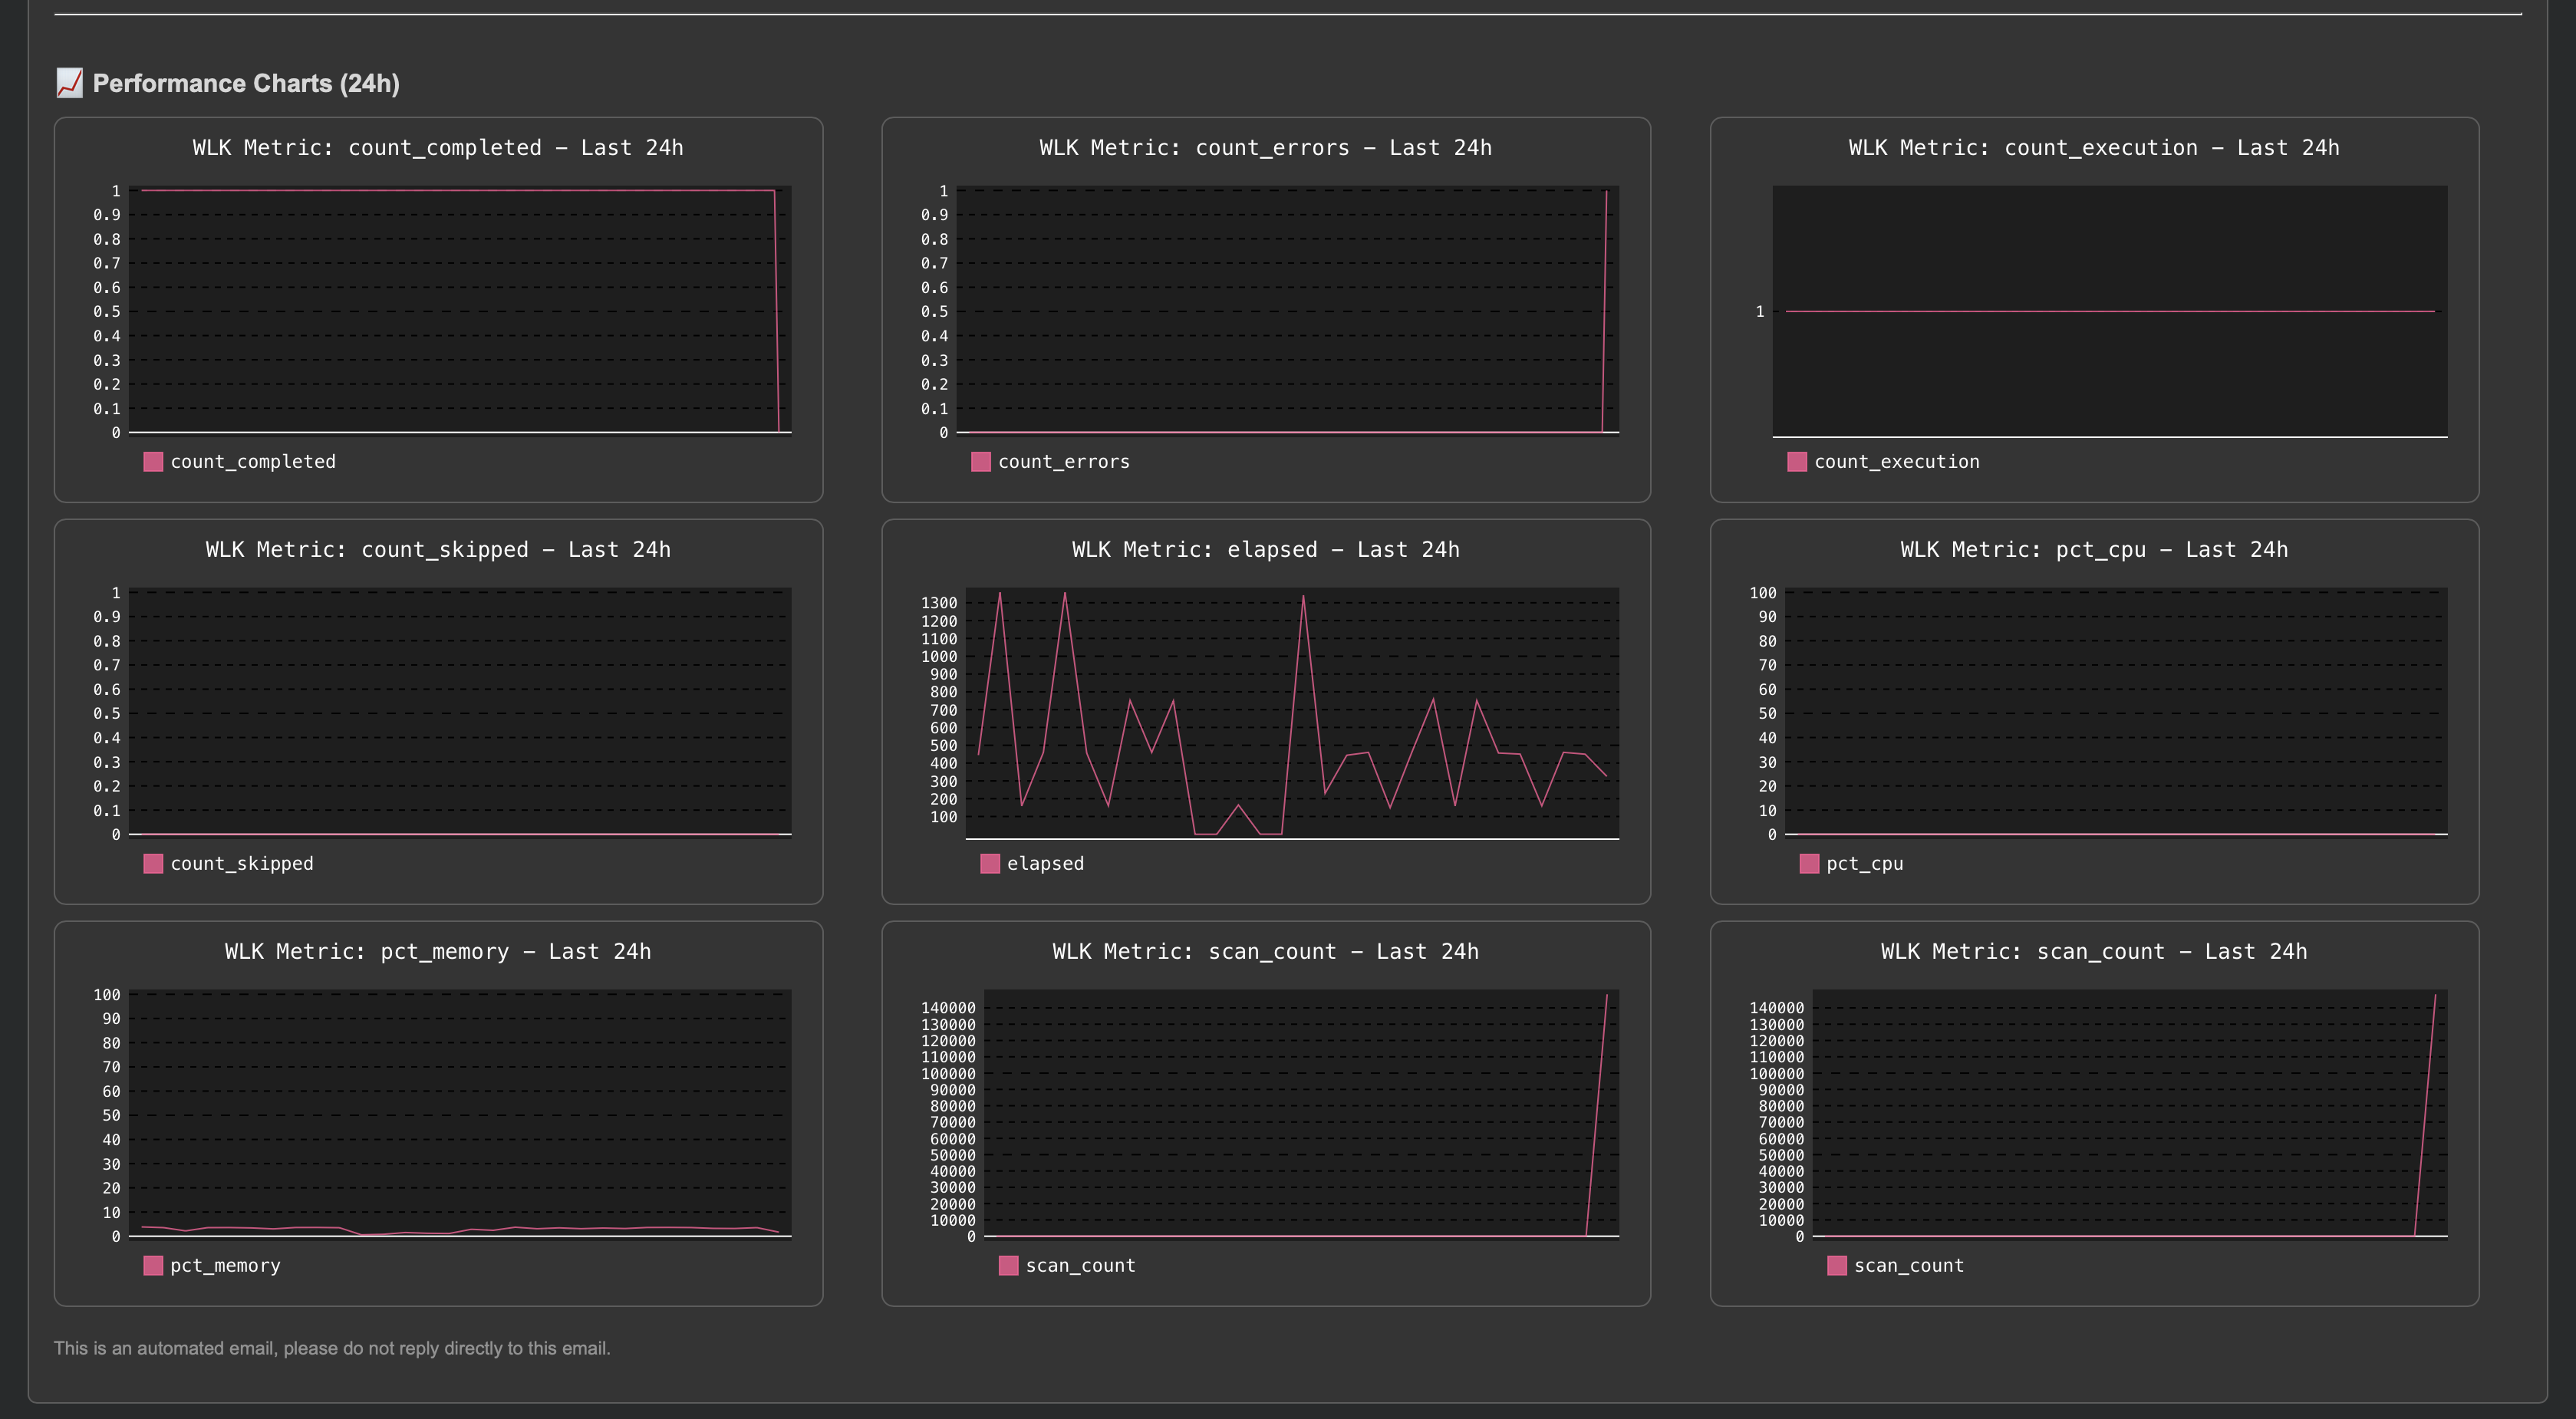
Example of a notification for the Workload component (Splunk scheduled searches and alerts monitoring):
Below is an example of a notification for the Workload component (splk-wlk):
Note: For this component, TrackMe will automatically generate charts per metrics, depending on metrics available in the entity.
Legacy Alerting with Notables or direct alerts
Legacy Alerting is based on Notables or direct alerts:
Creating an alert in TrackMe
You can create a new alert in the scope of any Virtual Tenant:
Available options differ per TrackMe component. Creating a splk-dsm (data source) alert opens the wizard on the component-specific steps — start by naming the alert:

Step 2 is the entity filters. For legacy alerting architecture, it is recommended to keep these filters at their default values (ANY priority, Red state, all objects, all tags) so that Notable events and acknowledgements are generated for all entities. Apply filtering at the Notable alert level instead:

Step 3 is where the component alert earns its keep: its Alert Actions trigger the TrackMe Auto Acknowledgment and the TrackMe Notable event. Keeping Notable enabled (strongly advised) means every triggering entity produces a Notable event:

Hint
Volume Outliers (splk-vol). The wizard offers a SPLK-VOL alert type for a Volume
Outliers tenant. Its entity filters keep Trigger on Outliers on by default — the ML
outliers are the state of that component (a drop or a spike of the licensed volume of
an index) — and the same alert also covers an index turning red for inactivity.
splk-vol is selectable in the stateful email component filter and in the SLA
breaches alert. See Volume Outliers — in depth.
Generating the Notable events is the whole point of the component alert: once written to the tenant’s notable index, they can be consumed in several ways — by creating a Notable alert (see the next section) that filters and forwards them to third parties, by any home-made Splunk search (including cross-tenant searches over several notable indexes), or by an external system reading the index directly. This decoupling between generating the notables and acting on them is what makes the pattern so flexible.
TrackMe modular alert actions
TrackMe has several alert actions that are leveraged when creating alerts:
TrackMe Notable event: This alert action generates a JSON event in the Virtual Tenant notable index summarizing the status of an entity when the alert triggers
TrackMe Auto Acknowledgment: This alert action automatically acknowledges the entity in TrackMe’s workflow for a given period of time
These actions are attached to the underlying Splunk scheduled search — in the native alert view you can see them listed alongside the trigger condition and the trigger history:

The TrackMe Notable event is a mandatory alert action, others can be disabled during the creation of the alert if you wish to do so.
Alerts Triggering
When the alert fires, the Tracking Alerts tab summarises the enabled and recently-triggered alerts — with per-alert triggering charts and, in the Alert details table, the exact modular actions each alert runs (here add_to_triggered, trackme_auto_ack and trackme_notable ):

Opening an alert’s Actions view drills into its trigger history and the alert actions executed over time — one series per action, confirming the auto-acknowledge and notable-event actions ran on each trigger:

Third Parties Alert Integration
Introduction to Third Parties Alerting Notification
Any TrackMe alert can be extended to send notifications to a third party, typically:
Sending emails to a recipient, such as the owner of the entities/service, or TrackMe administrators and analysts
Opening an incident to your ITSM such as ServiceNow or Atlassian Jira
Creating a message in a Slack or Microsoft Teams channel
Note
Two main alerting architecture design can be implemented:
Architecture scenario 1: Notable based design TrackMe alerts generate notable events, a centralised Splunk alert monitors for TrackMe notables and run alert actions for the third party
Architecture scenario 2: Per alert design TrackMe alerts are configured to run the third party alert action and perform the associated action directly
While the two options are possible, the Architecture scenario 1 based on Notables has multiple advantages:
Each TrackMe alert handles all entities, ensuring the creation of TrackMe notable events and other features such as the acknowledgment
Allows centralising the definition of what should lead to the creation of an incident, sending an email or sharing channel message
Notable events are normalised and provide all necessary information in a consistent fashion
For instance, you can have a single “TrackMe forward notable” alert which restricts to
highpriority entities and any additional logic of your own, easily in SPLThis logic can easily be maintained over time, without having to modify multiple alerts and provides a deeper and more consistent control
This documentation covers both approaches in the next sections.
Architecture scenario 1: TrackMe Notable Events
Introduction: Anatomy of TrackMe Notable Events
Hint
Bringing TrackMe Notable Events into Splunk SOAR
If you are looking to bring TrackMe Notable Events into Splunk SOAR, the recommended approach is the built-in ingestion of the TrackMe App on SOAR — see Ingesting TrackMe alert events into SOAR.
TrackMe Notable Events creation
TrackMe notable events are generated when a TrackMe alert triggers against one or more entities, relying on the built-in TrackMe Notable modular alert action (see the TrackMe modular alert actions covered earlier — the TrackMe Notable event action is what writes these events).
Note
Notable events are ONLY created when a TrackMe alert is configured and triggers; in this scenario, all eligible entities should therefore be covered by an alert per tenant and component.
TrackMe Notable Events structure
TrackMe Notable events are JSON formatted events, these contain the following key information:
Field |
Description |
|---|---|
alias |
The entity alias (friendly name), when defined. |
anomaly_reason |
A normalised list of the reason(s) behind the entity’s status. |
cmdb |
The matched CMDB record(s) for the entity — from the tenant’s configured CMDB lookup. Present only when a CMDB match is found. |
drilldown_link |
A link to the TrackMe Home user interface which filters on the tenant, component and entity, and automatically opens the entity overview screen. |
event_id |
The unique identifier for this notable event — the sha-256 hash of the notable event content. |
keyid |
The unique identifier for this object in the tenant / component central KVstore collection. |
labels |
The entity’s labels, as a list (present only when the entity has labels). |
object |
The object name for this entity, this basically is the name of entities in TrackMe. |
object_category |
The TrackMe component this notable relates to (splk-dsm, splk-dhm, splk-mhm, splk-vol, splk-flx, splk-fqm, splk-wlk, splk-cim). |
priority |
The priority of the object (low / medium / high / critical). |
properties |
The complete TrackMe entity record as nested JSON, as it was when the alert triggered. It is also field-extracted automatically, so you can address |
score |
The entity’s impact score (present when scoring applies to the entity). |
score_definition |
The human-readable definition of the impact score (present alongside |
state |
The status of the object (blue / green / orange / red). |
status_message |
A human readable detailed description of the reason why TrackMe generated an alert for this entity. |
tags |
The entity’s tags, as a list (present only when the entity has tags). |
tenant_id |
The tenant this Notable event is related to. |
timeStr |
The time of the event in human readable format. |
Therefore, TrackMe Notable events contain all necessary information in a consistent and normalized manner, to interact with any third party.
Example of a TrackMe Notable event in Splunk search — the JSON payload with its extracted fields, including the nested properties record (which carries the whole entity record, so you can address properties.* fields directly):

The same Notable events are also surfaced in TrackMe’s user interface, from an entity’s Incidents view:

Step 1: Create TrackMe alerts for tenants and components in used
The first step is to create a TrackMe alert for every tenant and component that is in use.
From each tenant’s TRACKING ALERTS tab, use the wizard to create an alert per component, leaving the entity filters at their defaults — the exact flow is covered in Creating an alert in TrackMe. At this stage there is no need to filter on priority: filtering is applied later, when monitoring the Notable events. Keep the TrackMe Notable event action enabled so every triggering entity produces a Notable.
Step 2: Create the alert monitoring TrackMe notables
The second step is to create the alert that consumes the Notable events and drives the third-party interactions.
TrackMe ships a built-in Notable events alert type for exactly this. From the TRACKING ALERTS tab create a new alert, choose Notable events, and (optionally) restrict it to the priority levels that matter — leave the filter empty to trigger on any priority:

For advanced cases — cross-tenant searches, custom normalisation or enrichment — you can also drive this from a plain Splunk alert over the notable index. As a basis:
index=trackme_notable tenant_id=* priority=*
| table tenant_id, keyid, event_id, object, object_category, state, priority, anomaly_reason, status_message, drilldown_link
For instance, a typical use case would be to create incidents only for high priority entities in alert:
index=trackme_notable tenant_id=* priority="high"
| table tenant_id, keyid, event_id, object, object_category, state, priority, anomaly_reason, status_message, drilldown_link
Note
In TrackMe, you can define different notable indexes per tenant, if you did so you will want to adapt your search.
When building such a custom Splunk alert, a good baseline is:
Cron every 5 minutes: */5 * * * *
Earliest time: -15m
Trigger for each result
Throttle against the keyid for 60m
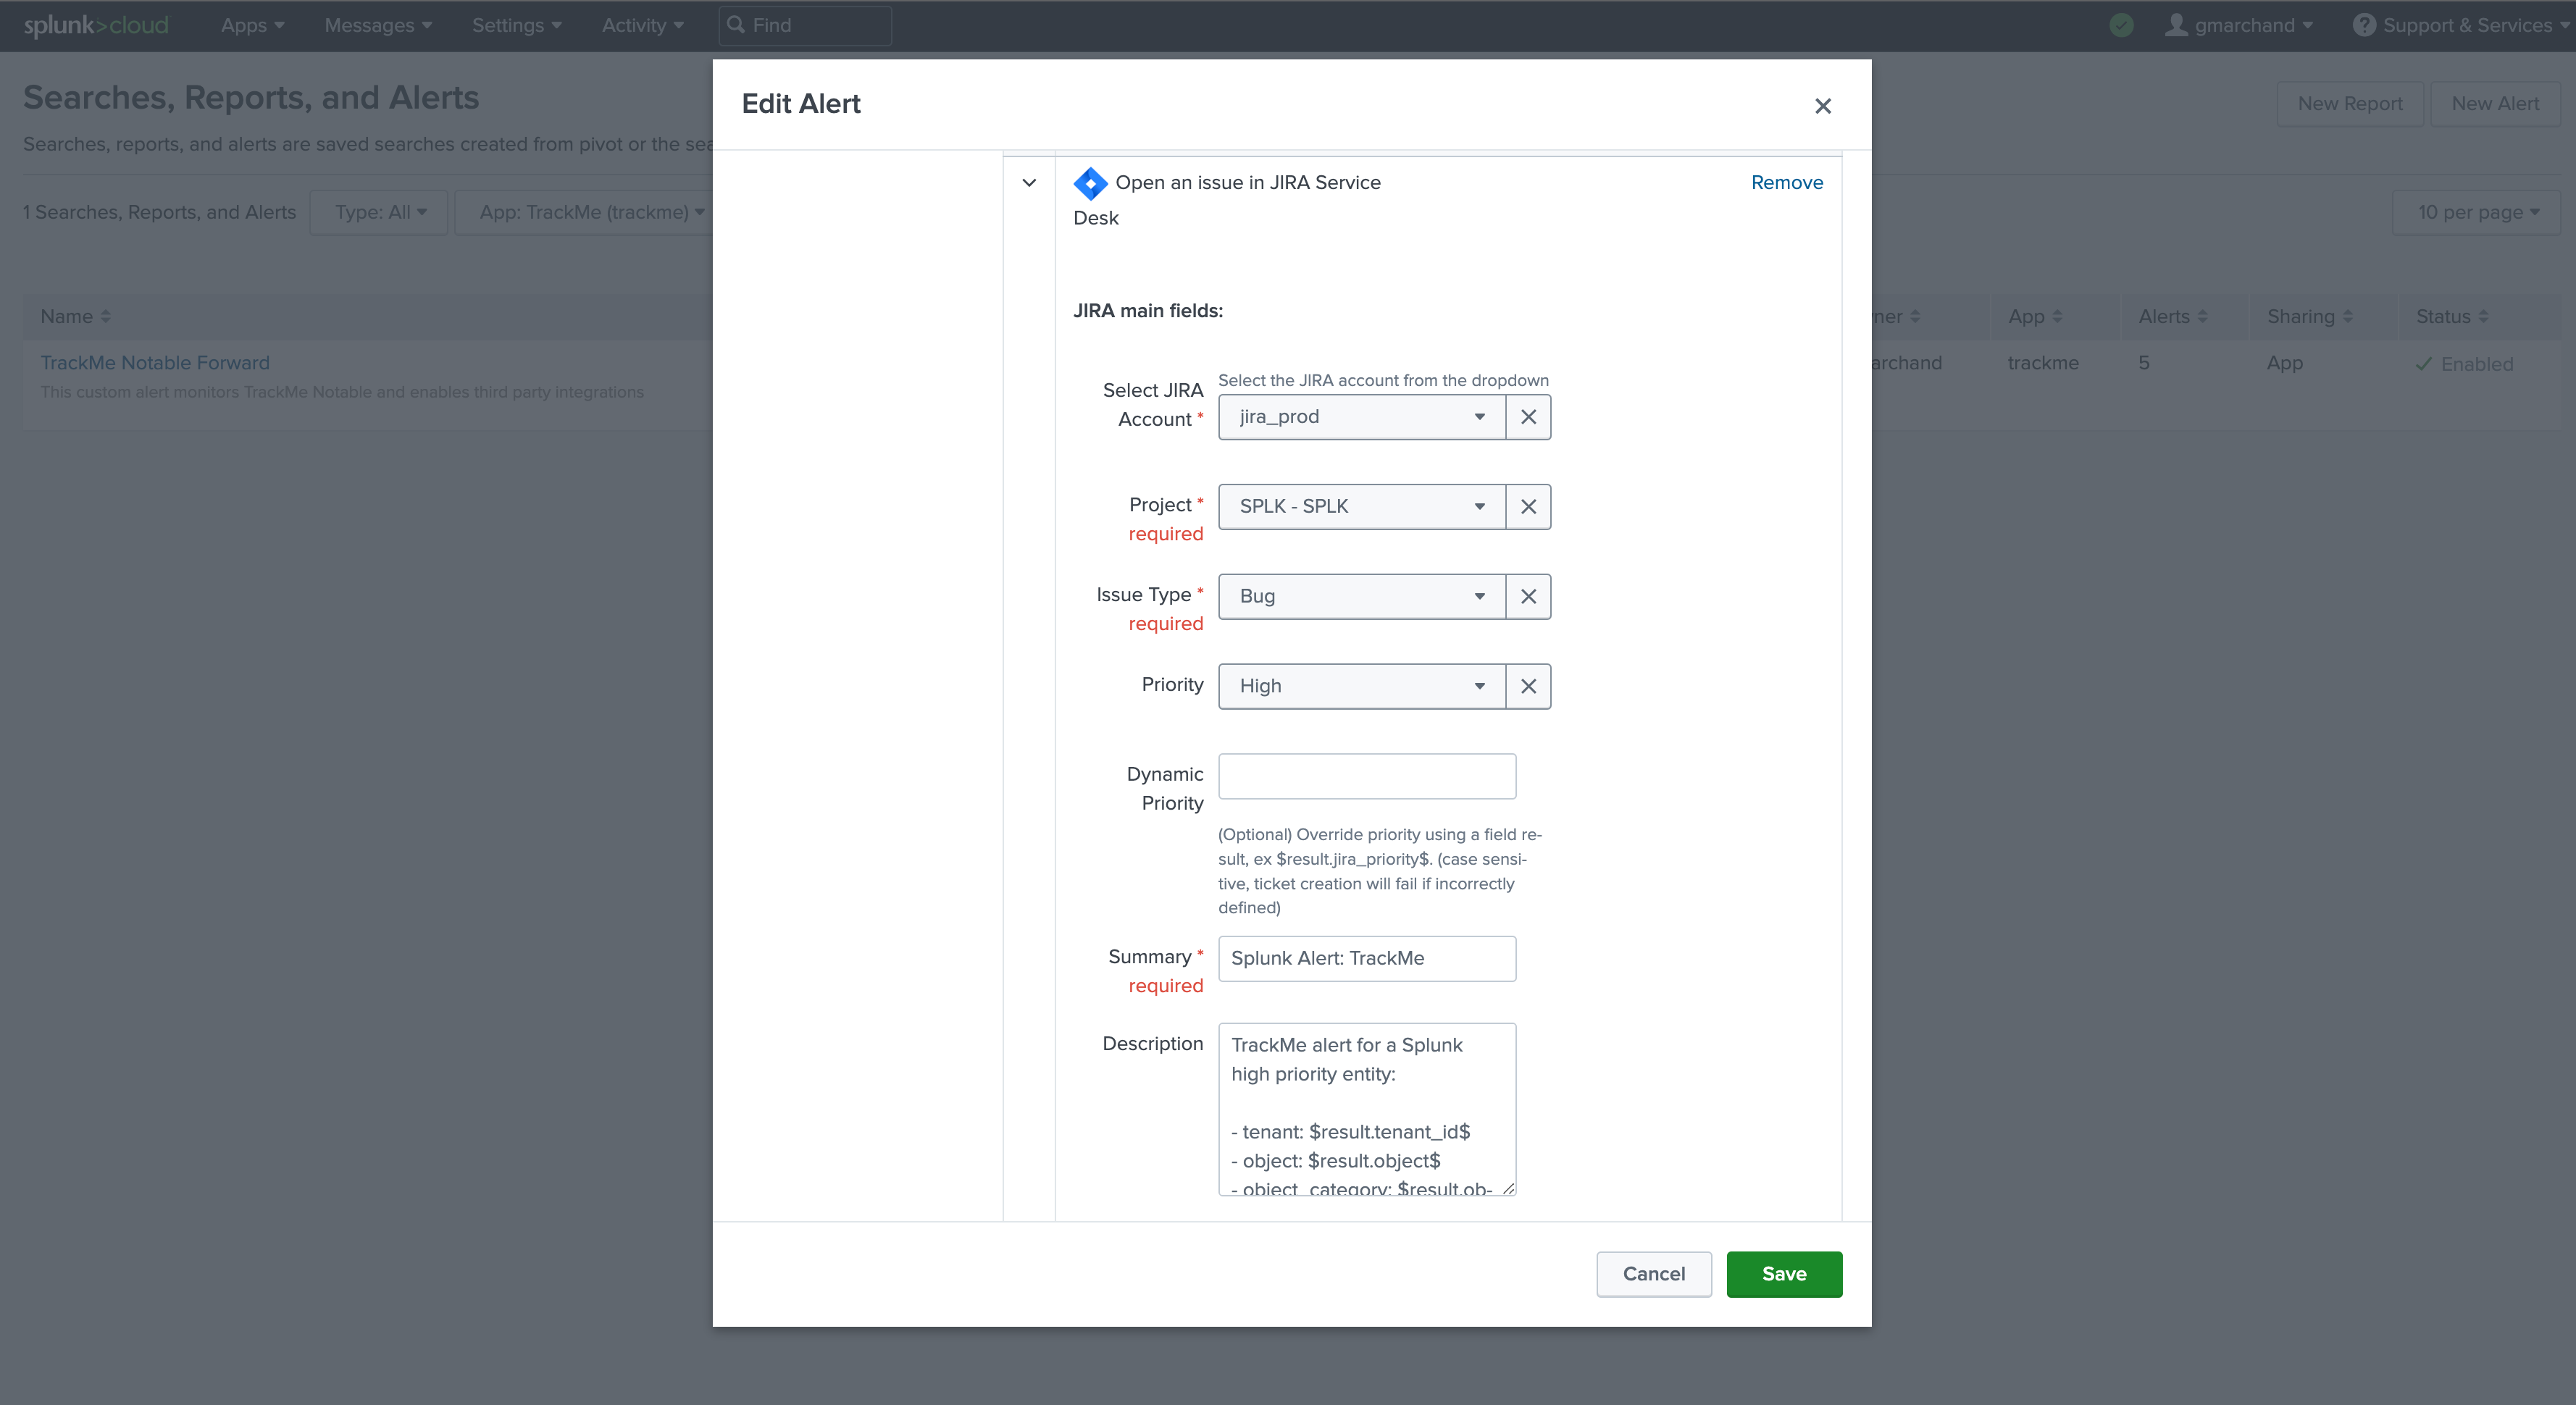
Either way, you then enable the third party alert action on that alert. For example, to create an incident in JIRA, the following shows example content that uses token replacements:
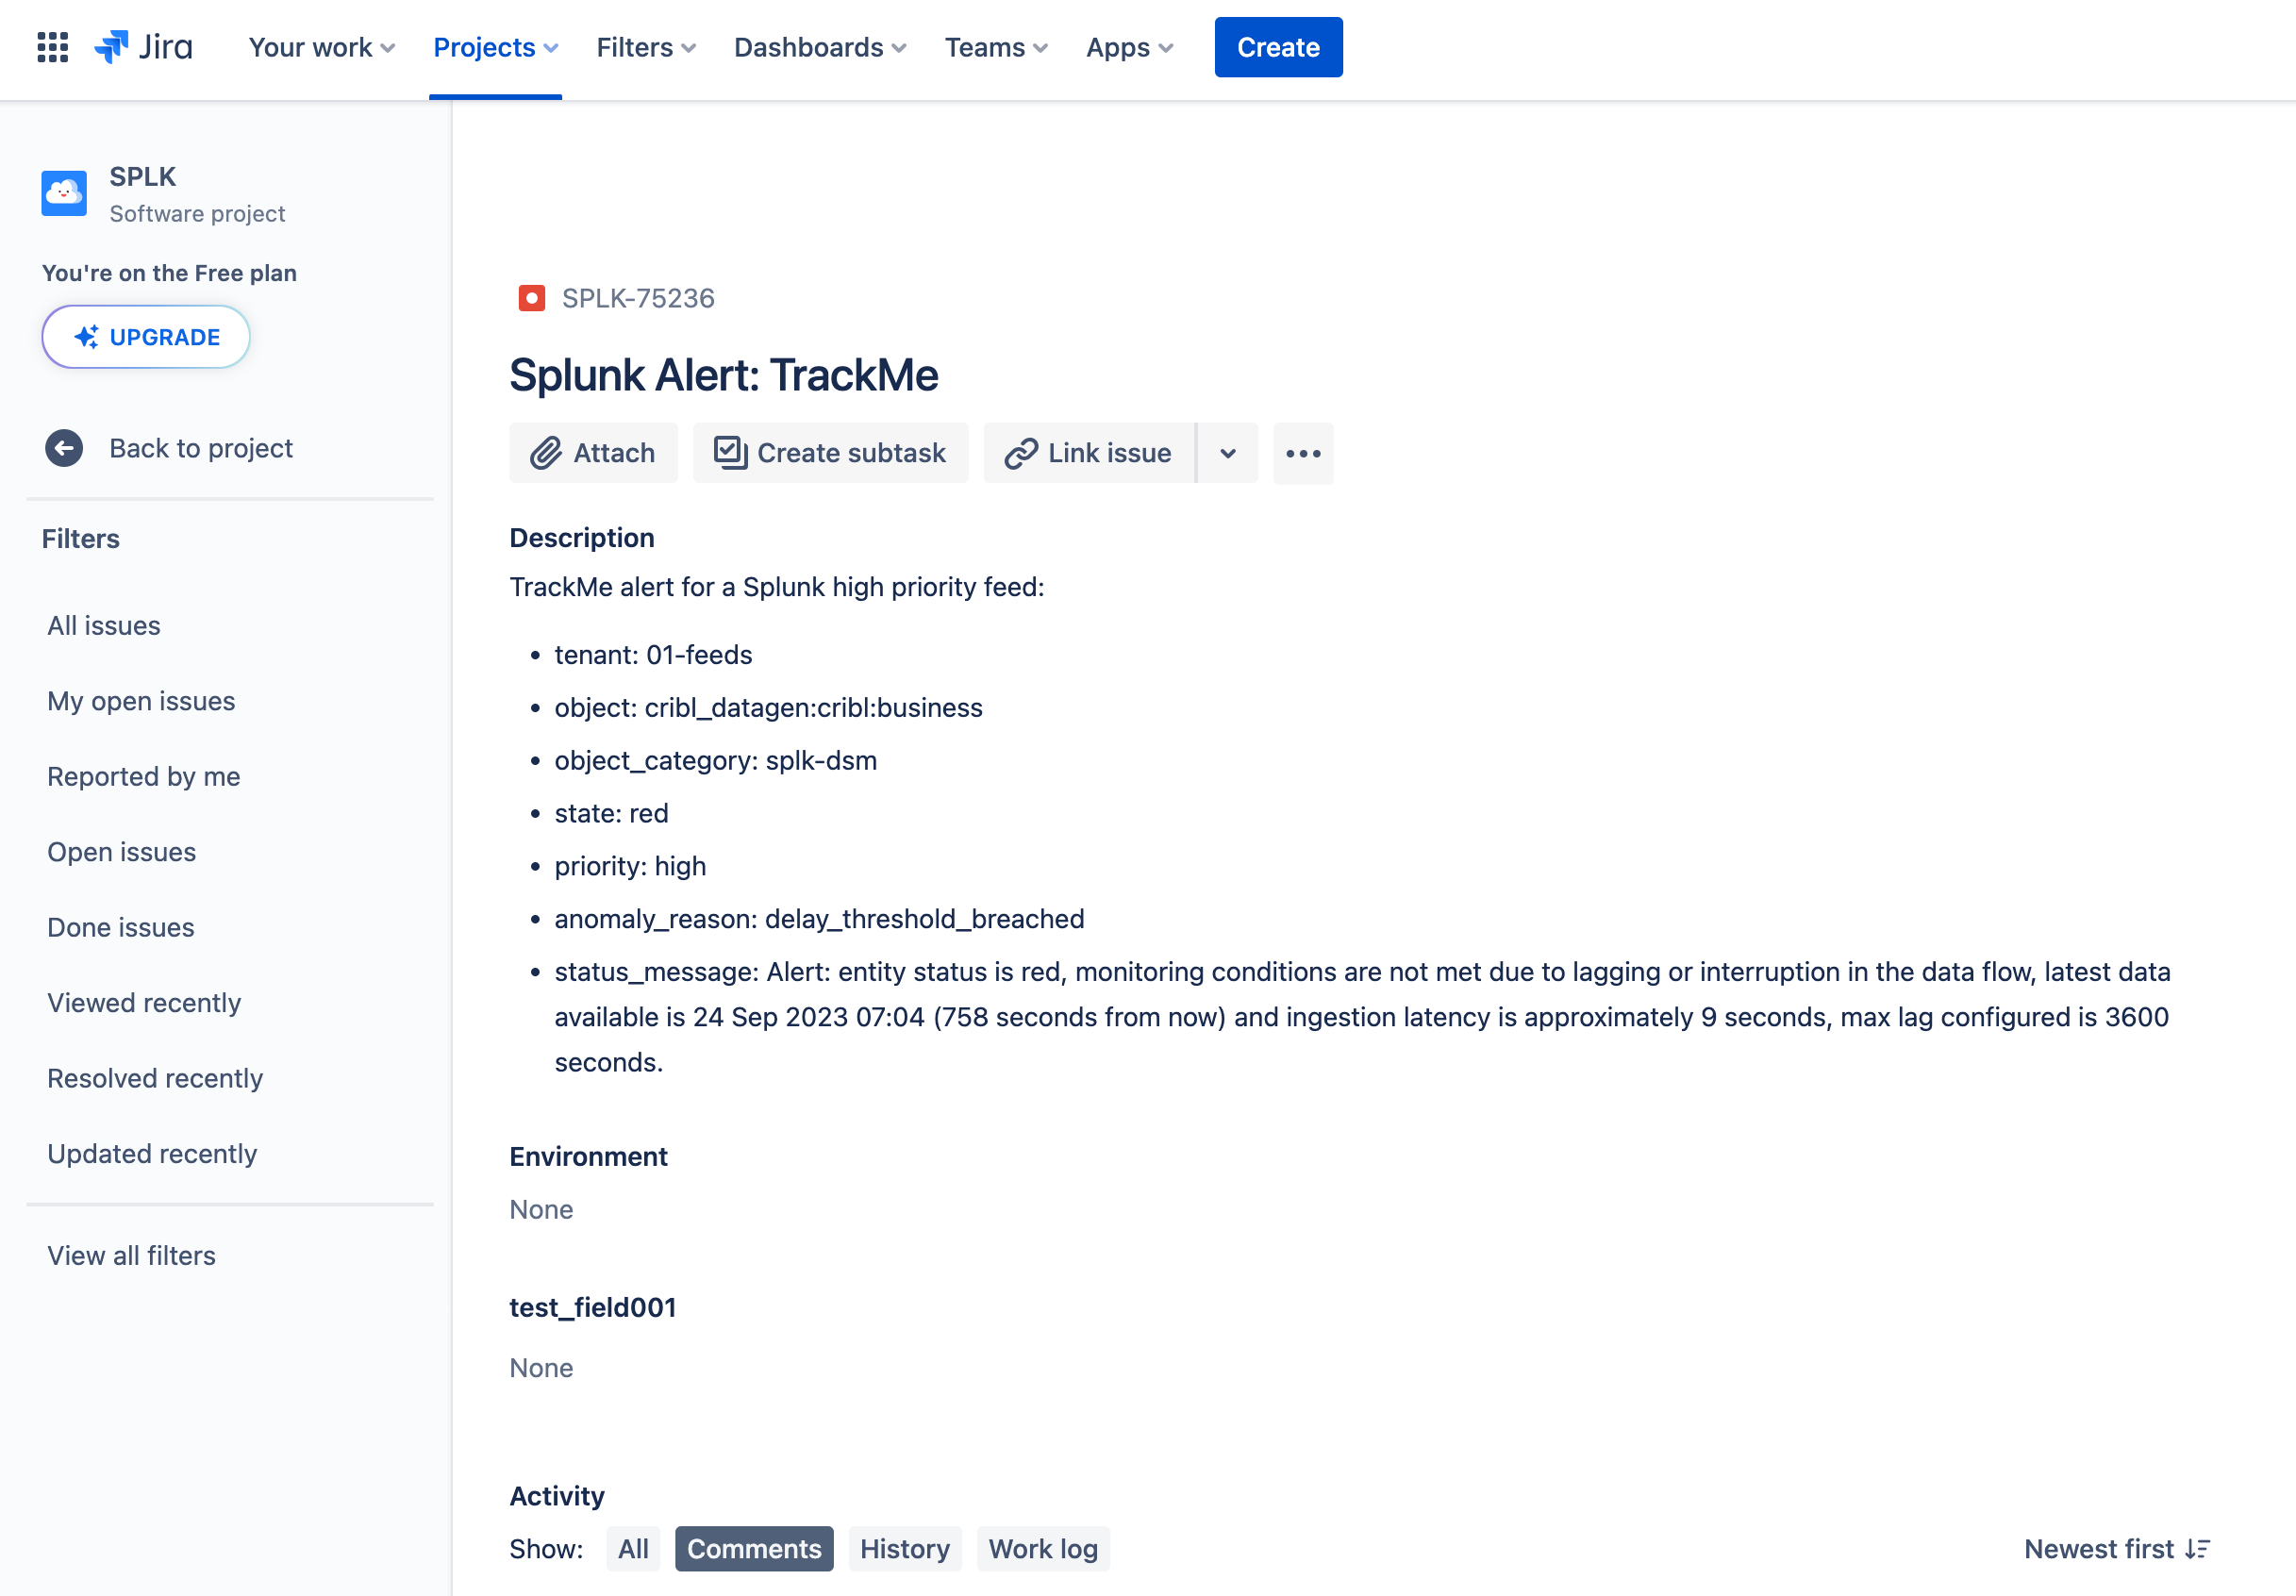
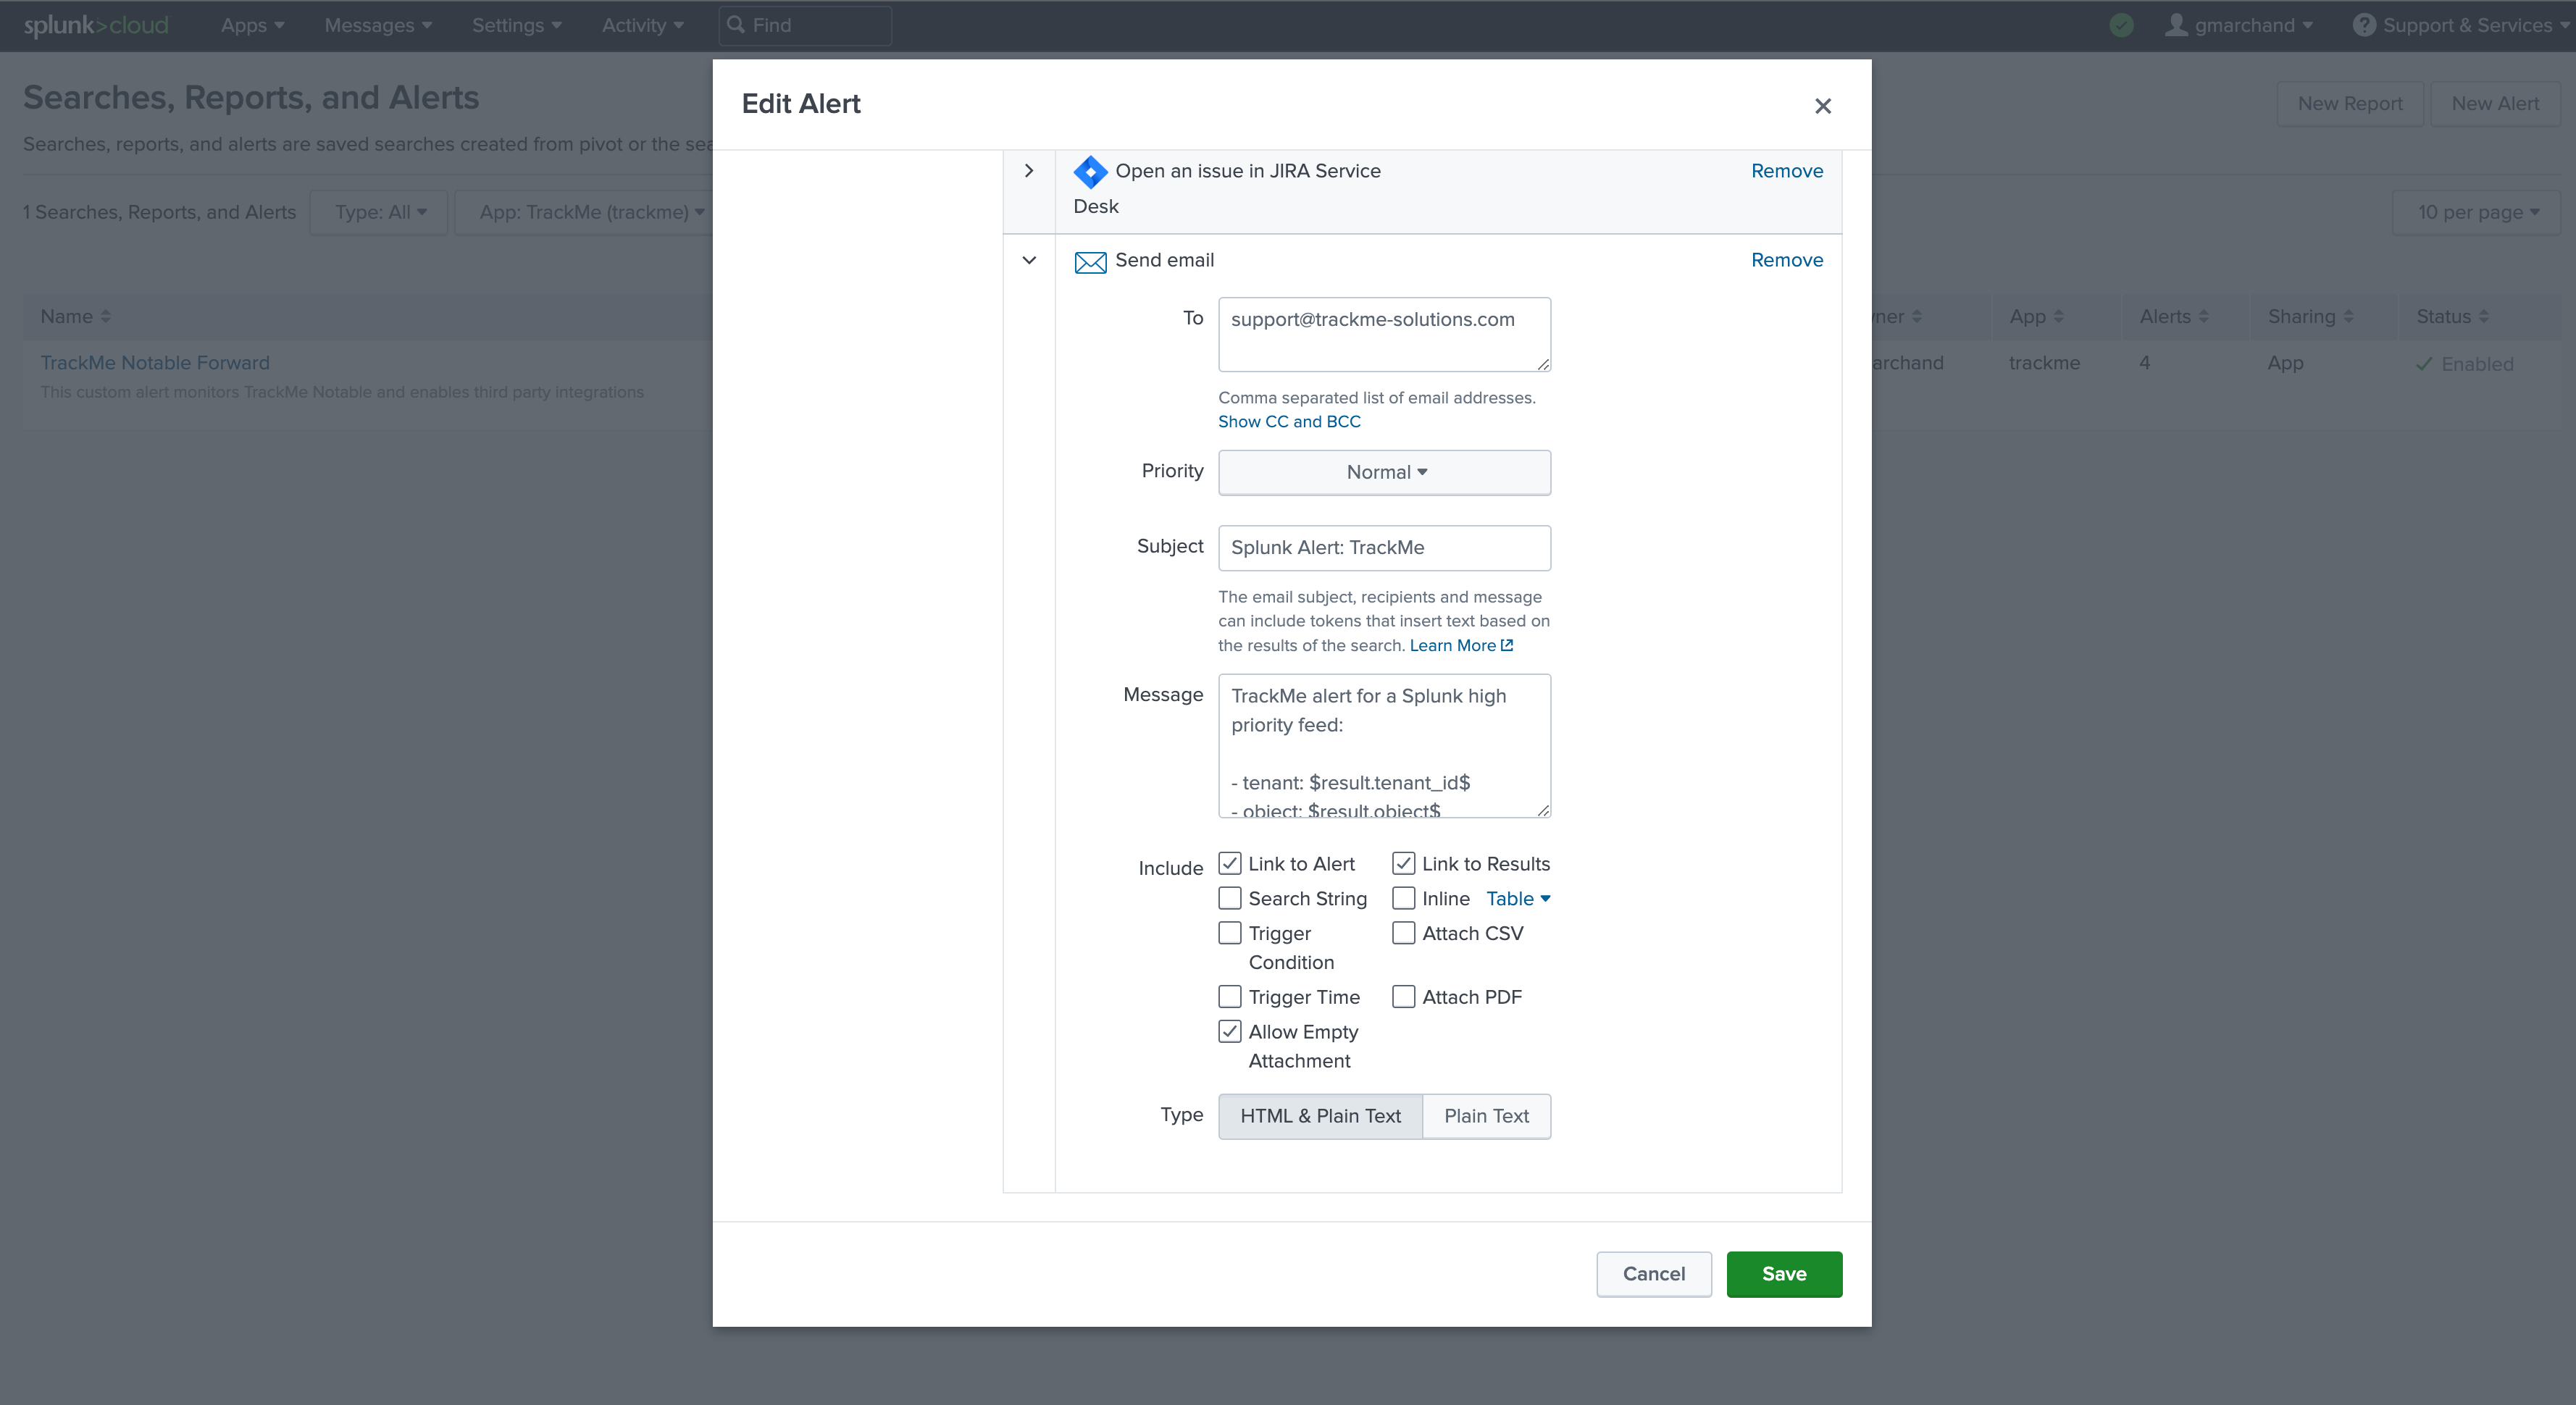
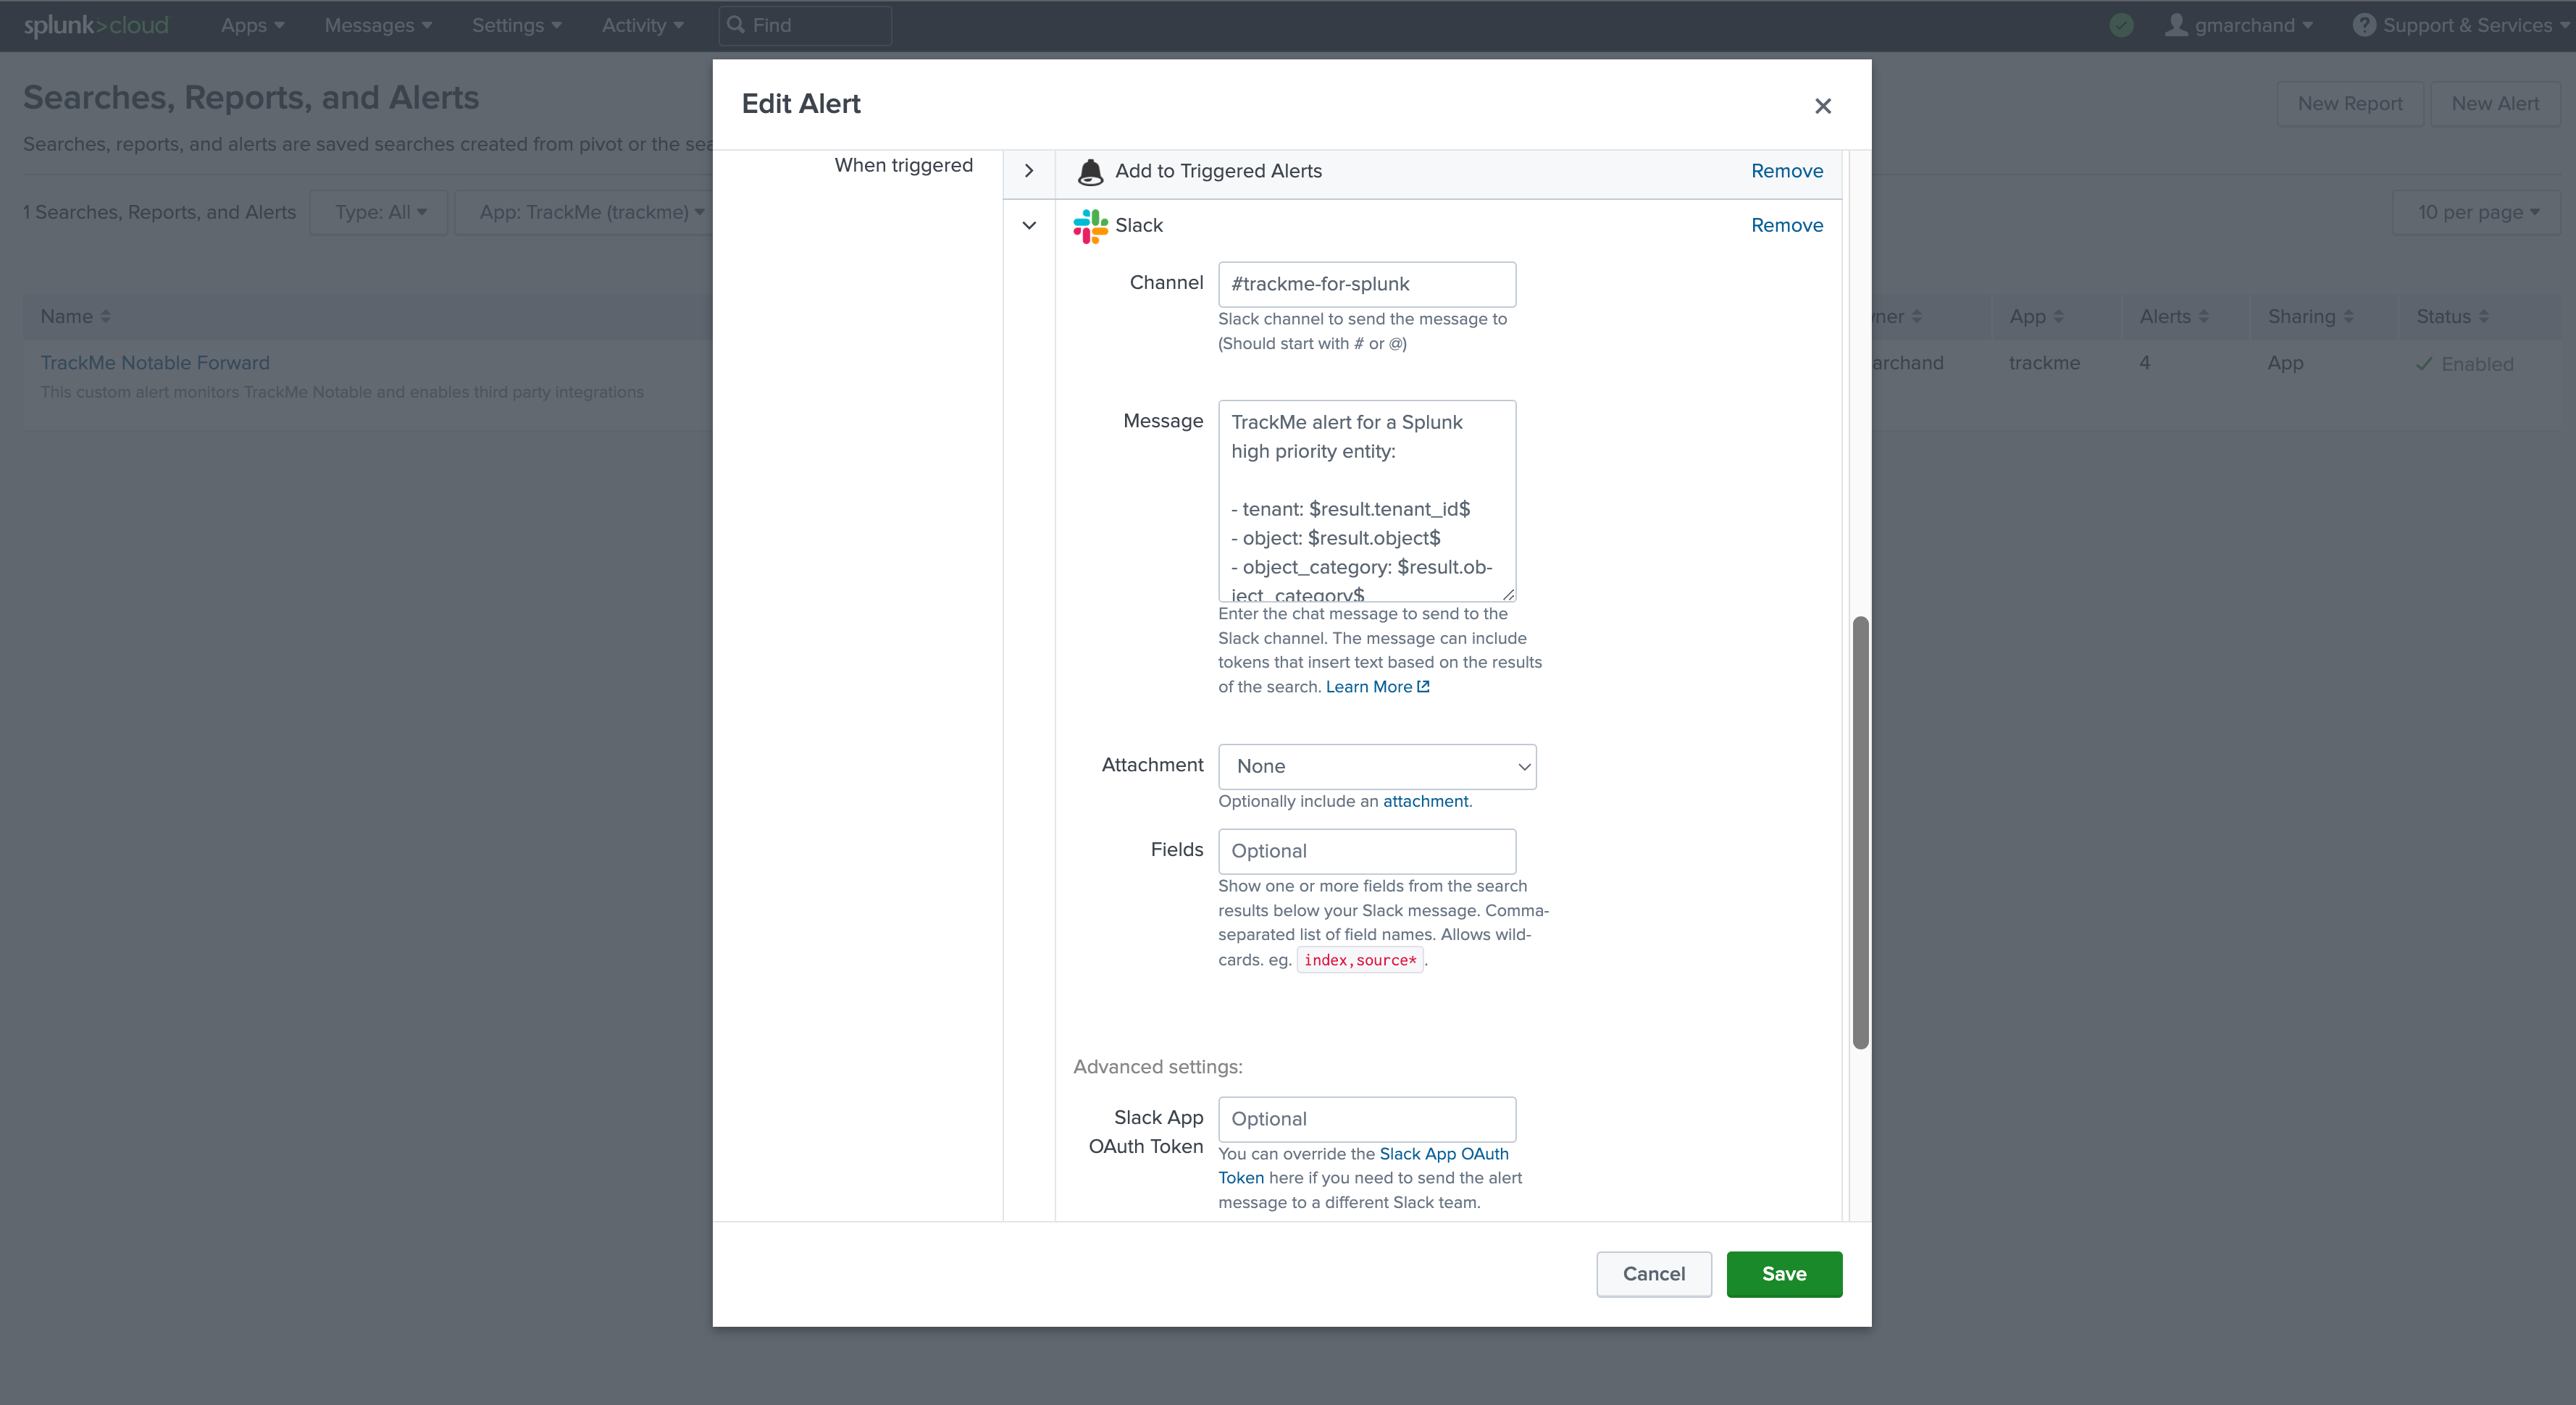
TrackMe alert for a Splunk high priority entity:

- tenant: $result.tenant_id$
- object: $result.object$
- object_category: $result.object_category$
- state: $result.state$
- priority: $result.priority$
- anomaly_reason: $result.anomaly_reason$
- status_message: $result.status_message$
- drilldown_link: $result.drilldown_link$
Hint
Re-assigning to a service account
As a good practice, you should re-assign the created Splunk alert to the TrackMe service account user, or nobody
You should avoid running alerts on behalf of normal users
Adding third parties actions:
Atlasian Jira example:
Note: this integration relies on the following Add-on for Jira: https://splunkbase.splunk.com/app/4958
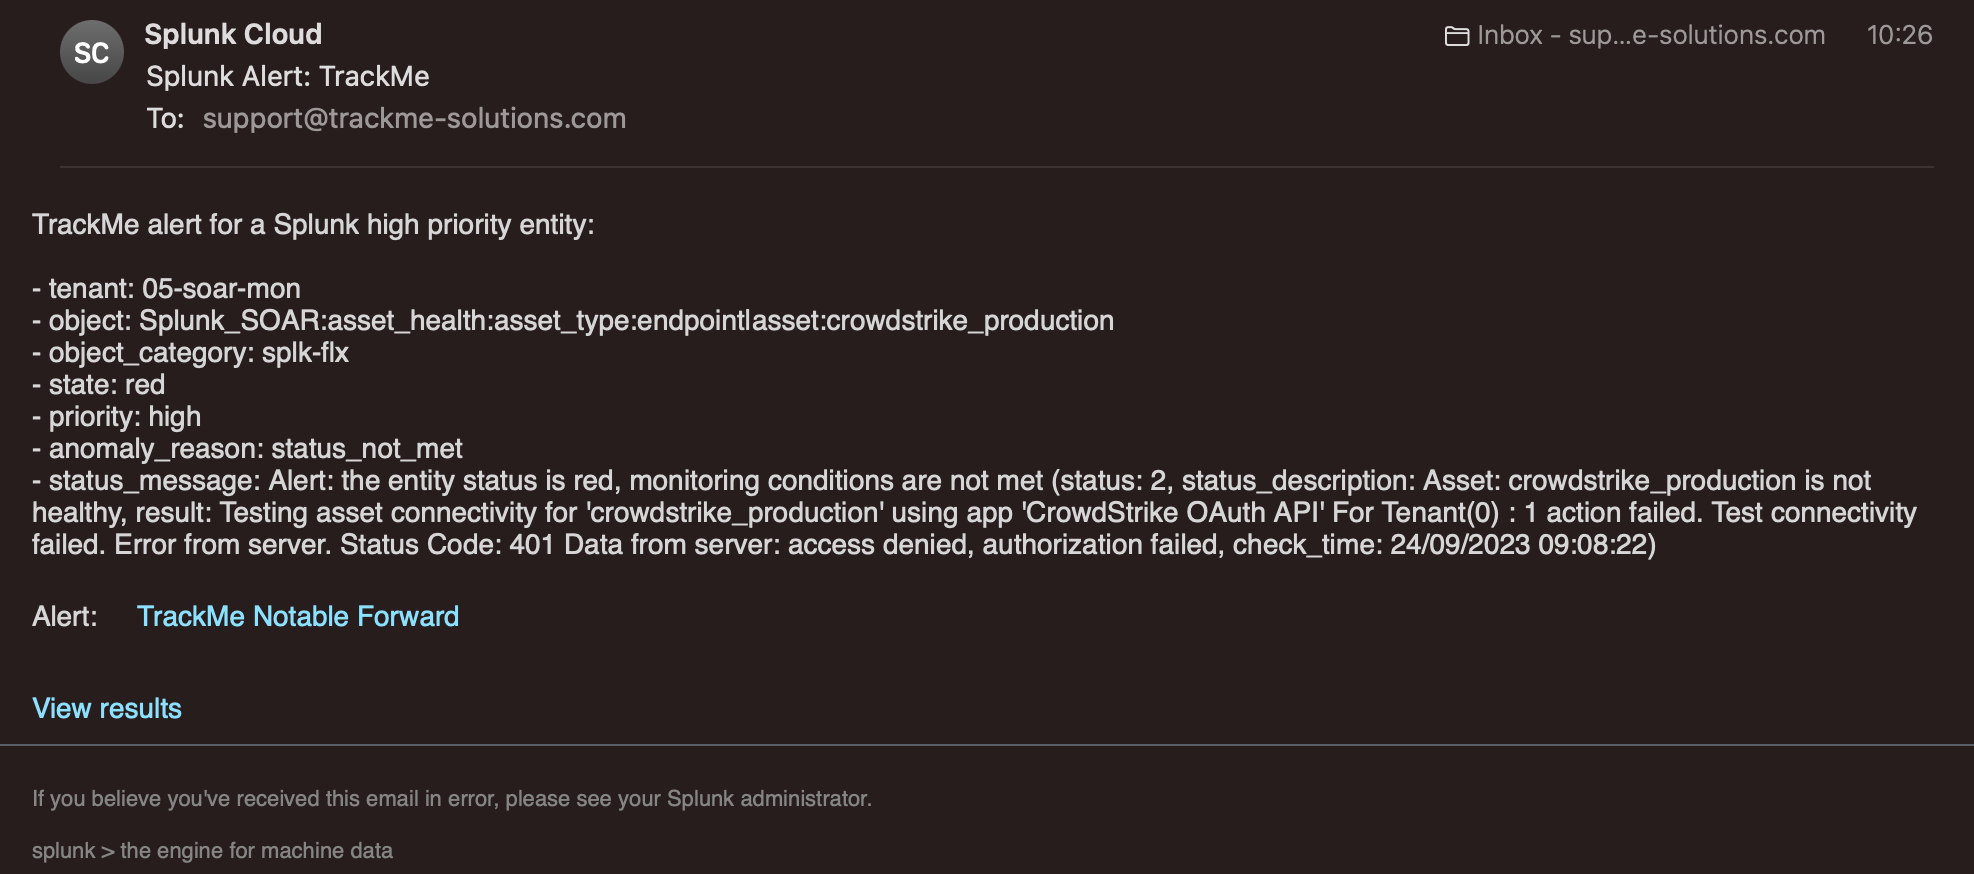
Email example:
Note: Sending emails is a builtin alert action in Splunk
Slack example:
Note: this integration relies on the following Add-on for Slack: https://apps.splunk.com/app/2878

Optional: Notable events enrichment
When using Notable events as the central means for third party alerting, further logic can easily be implemented such as custom normalisation and enrichment.
With enrichment for instance, you may want to leverage your CMDB knowledge to add context information such as the owner or contact address email for the notification, there are plenty of options and designs possible.
TrackMe allows to lookup easily in your CMDB to provide context information handy in the user interface, you can leverage the same content from the central Notable alert, for more information about the CMDB Lookup integrator see: CMDB integration
For instance, we could enrich our Notable event alert by joining a CMDB lookup on the entity’s index and sourcetype — taken from the properties.* fields:
index=trackme_notable tenant_id=* priority="high"
| lookup my_cmdb index as properties.data_index, sourcetype as properties.data_sourcetype OUTPUT
| table tenant_id, keyid, event_id, object, object_category, state, priority, anomaly_reason, status_message, drilldown_link
The enrichment fields are then available alongside the notable fields, and can be used as tokens in the alert action. For example, to set a recipient email address with a fallback for unknown entities:
index=trackme_notable tenant_id=* priority="high"
| lookup my_cmdb index as properties.data_index, sourcetype as properties.data_sourcetype OUTPUT
| eval contact=if(isnull(contact), "support@trackme-solutions.com", contact)
| table tenant_id, keyid, event_id, object, object_category, state, priority, anomaly_reason, status_message, drilldown_link, contact
Architecture scenario 2: Per TrackMe Alert Design
Another design choice is to configure third party alert actions on a per TrackMe alert instead of relying on the Notable events.
Note
This integration can also be considered as a valid choice, eventually easier and more logical, however it does not present some of the advantages in comparison with a TrackMe Notable based design:
Each alert needs to be configured individually, which can be more challenging to maintain over time
Entities that are not covered by any TrackMe alert will not lead to TrackMe alert actions being executed (Notable, Ack), for instance if you restrict alerts using entities priority or tags and some entities are out of the scope
Normalisation, enrichment or the introduction of custom SPL logic is decentralised opposed to the central alert based on Notables
Finally, you may need more alerts to be created (for instance to cover entities by priority and have alert actions executed for all entities)
For the purposes of this documentation, the following scenario will be implemented:
A first alert is created which targets
highpriority entities, when triggering a notification is sent using a Splunk alert action to open an incident in our ITSM tool (we will use Jira but this is applicable to any Splunk supported third party)A second alert is created which targets
mediumpriority entities, this time an email will be sent when the alert triggersEntities set as
loware not subject to a third party integration, however an alert should also be active for notable events and other TrackMe alert actions to be triggered
Step 1: Create a TrackMe alert for high priority entities
We start by creating an alert in TrackMe for high priority entities — using the splk-dsm (or relevant component) alert type and setting the priority filter to high, exactly as shown in Creating an alert in TrackMe. Repeat for the other priority levels so that all entities are covered by alerts — in this example, three alerts in total.
Step 2: Enable alert actions per alert
Next, update each TrackMe alert to add the third-party alert action. From the alert’s actions menu, open the Splunk alert-edit screen and add the action you need — for example the Jira alert action — mapping the TrackMe fields to the action’s parameters using token replacements. These steps are identical to architecture scenario 1 (Notable based); consult that section for the details.
Context body example:
TrackMe alert for a Splunk high priority entity:

- tenant: $result.tenant_id$
- object: $result.object$
- object_category: $result.object_category$
- state: $result.state$
- priority: $result.priority$
- anomaly_reason: $result.anomaly_reason$
- status_message: $result.status_message$
- drilldown_link: $result.drilldown_link$
The same process needs to be achieved for every alert that should monitor TrackMe entities, per tenant and component.
When alerts trigger, Splunk automatically configured the alert actions according to your settings.
Deleting TrackMe alerts
Hint
We recommend deleting TrackMe alerts through TrackMe
When creating a TrackMe alert, TrackMe preserves knowledge of it, which lets it automatically manage assignment and Role Based Access Control settings according to the Virtual Tenant setup.
Deleting through TrackMe keeps that knowledge in sync. If an alert is removed directly in Splunk, TrackMe still verifies the existence of the alerts it created and updates its own knowledge accordingly.
Deleting an alert from the user interface
You can delete TrackMe alerts from the user interface — from the TRACKING ALERTS tab, open the alert’s actions menu and choose Remove alert, then confirm. Because TrackMe maintains the knowledge of objects associated with a given Virtual Tenant, alerts should always be deleted through the user interface or the REST API.


Deleting an alert from the REST API
You can as well delete an alert using the REST API and the following endpoint:
| trackme mode=post url="/services/trackme/v2/alerting/admin/del_alert" body="{'tenant_id':'mytenant', 'alert_name': 'TrackMe alert tenant_id:mytenant - Alert custom on splk-dsm'}"