Creating dynamic views from Tenant Home
Starting with TrackMe 2.4.16, you can generate a live Topology Studio canvas directly from any Virtual Tenant, using the topology action in Tenant Home. Start with the current tenant, monitoring component or entity selection, choose how to group it, and save the result when you want a view to share and refine.
The preview is temporary: opening it creates no saved view. It already shows live health, supports inspection and layout changes, and keeps the existing Link graph and Network graph available as alternate tabs.
This walkthrough uses a SecOps tenant with Data Source Monitoring (DSM), then shows a Cribl Logstream example with a priority filter using Flex Objects.
Step 1 — Open the tenant topology
Open the Virtual Tenant’s Tenant Home, select the monitoring component you
want to explore, and click the topology icon in the upper-right toolbar.
The example starts from the secops-v1 tenant’s DSM overview:
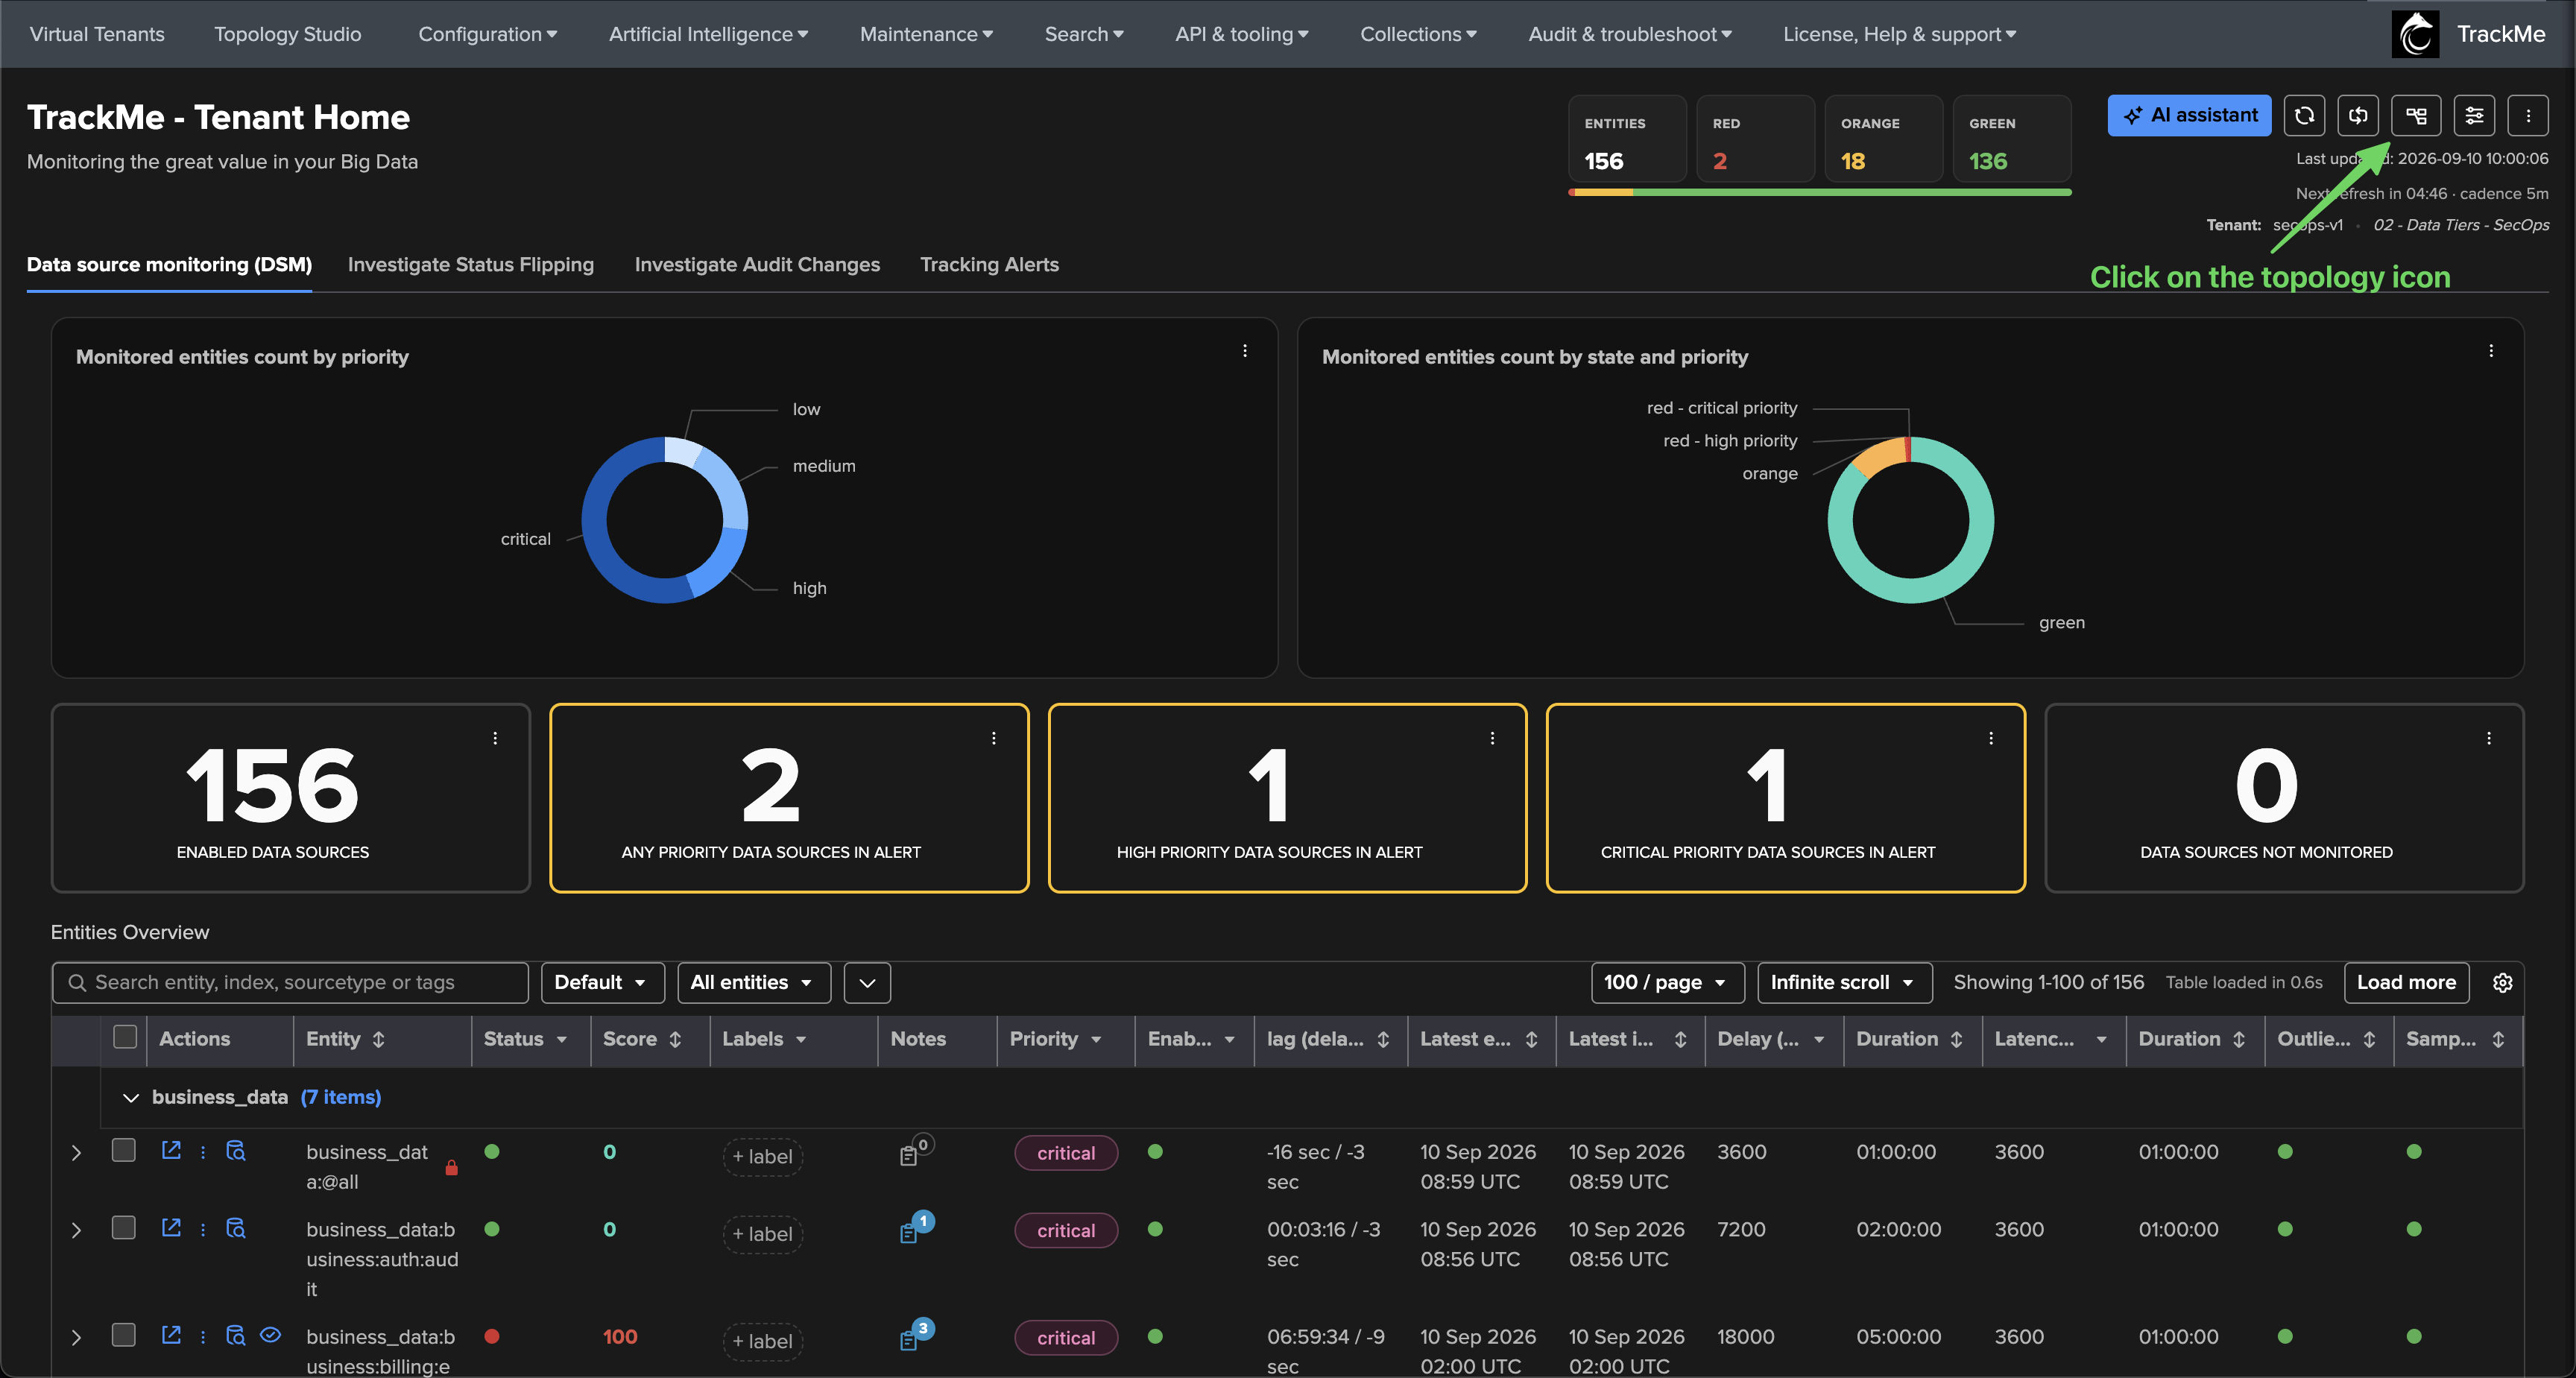
The topology panel opens on the Topology Studio tab. Its source is the selection used to open it; the component-wide action in this example generates a map of the tenant’s data sources.
Step 2 — Review the live preview and its scope
The initial canvas contains aggregate nodes, with a root for the tenant and groups chosen by the component’s default hierarchy. For DSM, the default is Index. The root and each group show their own live aggregate health and KPI.
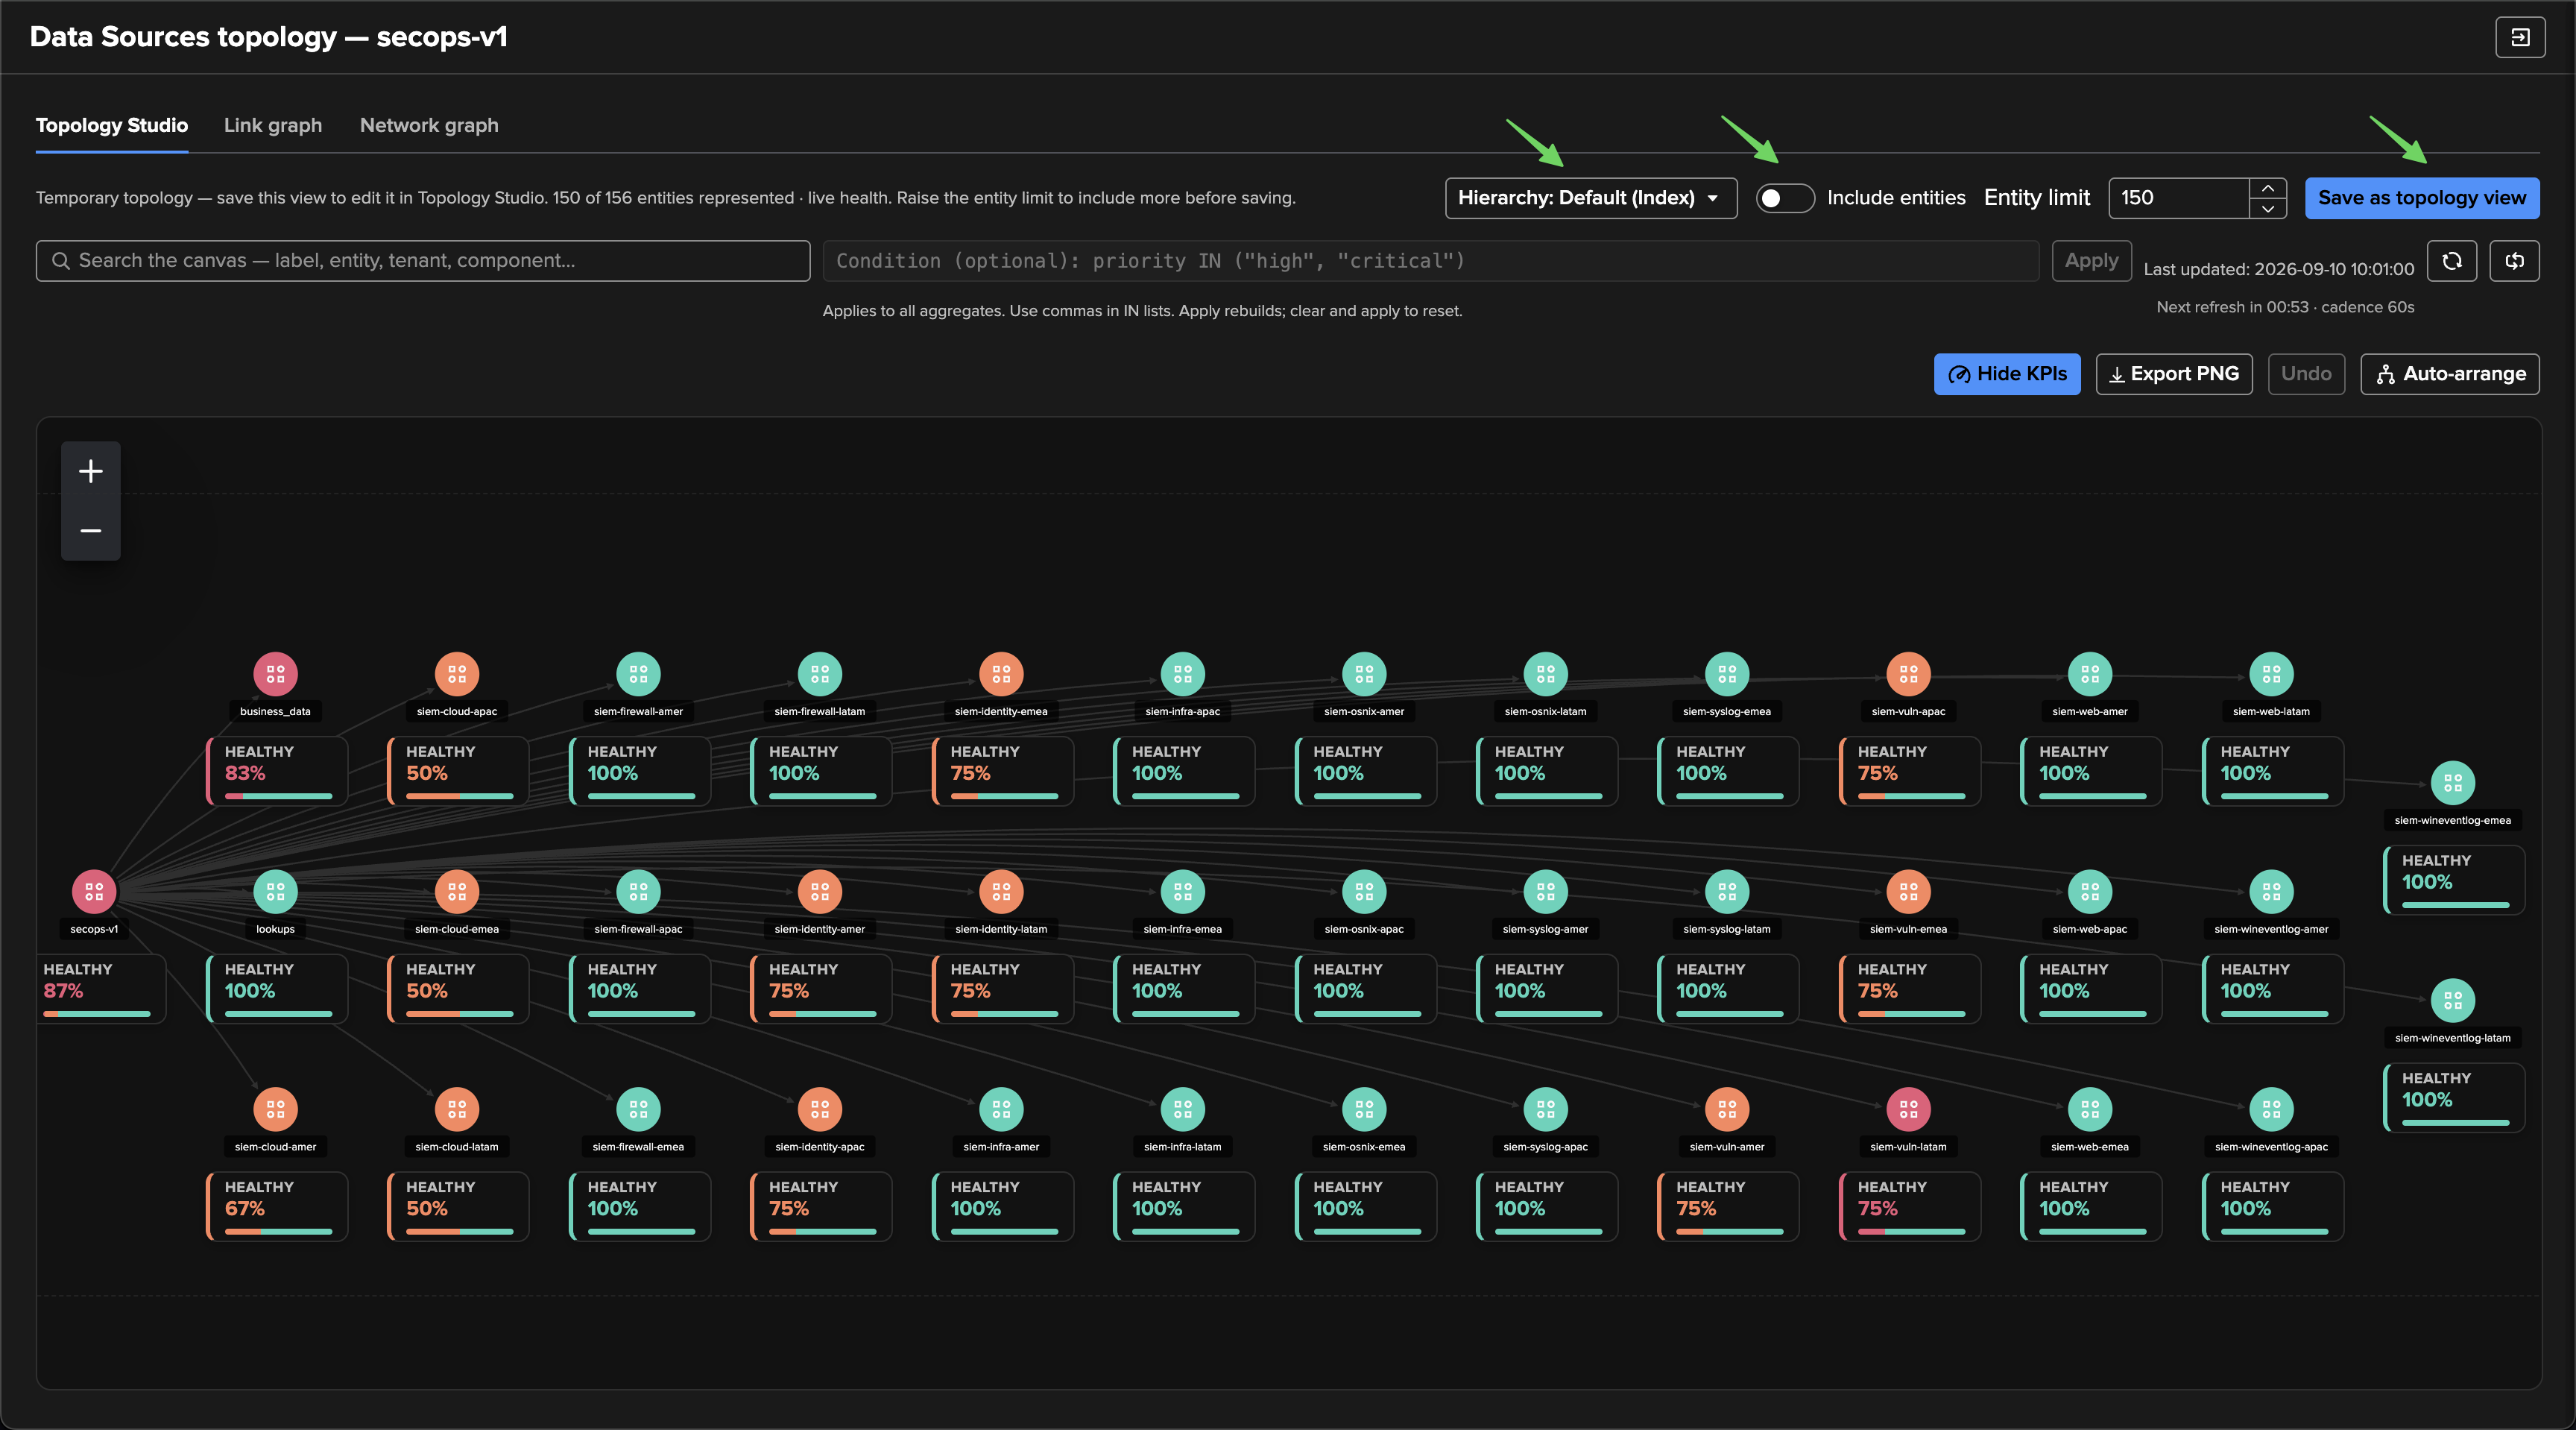
Use the controls above the canvas to decide what the view should represent:
Hierarchy selects the grouping structure.
Include entities adds individual entity nodes beneath the groups. It is off initially to keep the map compact; the aggregates still include their represented members and evaluate their live health.
Entity limit bounds the number of distinct entities represented, including when individual entity nodes are hidden. Check the count beside Temporary topology before saving.
Important
In this capture, the preview represents 150 of 156 entities. The aggregates describe those 150 entities, so their health may differ from the full Tenant Home summary. Raise Entity limit within the allowed range if you want to include more entities before saving. Turning off Include entities does not remove the membership limit.
Step 3 — Choose a hierarchy
Keep the component-aware default, choose an existing Tenant Home grouping preset, or use a custom hierarchy with up to three distinct fields in order. The available fields depend on the component and source records, and include tags and labels. For example, an ordered hierarchy using tags then priority creates a tag level followed by priority groups beneath it.
In the SecOps example, choosing Tags replaces the index groups with operational
categories such as business, cloud, firewall and vulnerabilities:
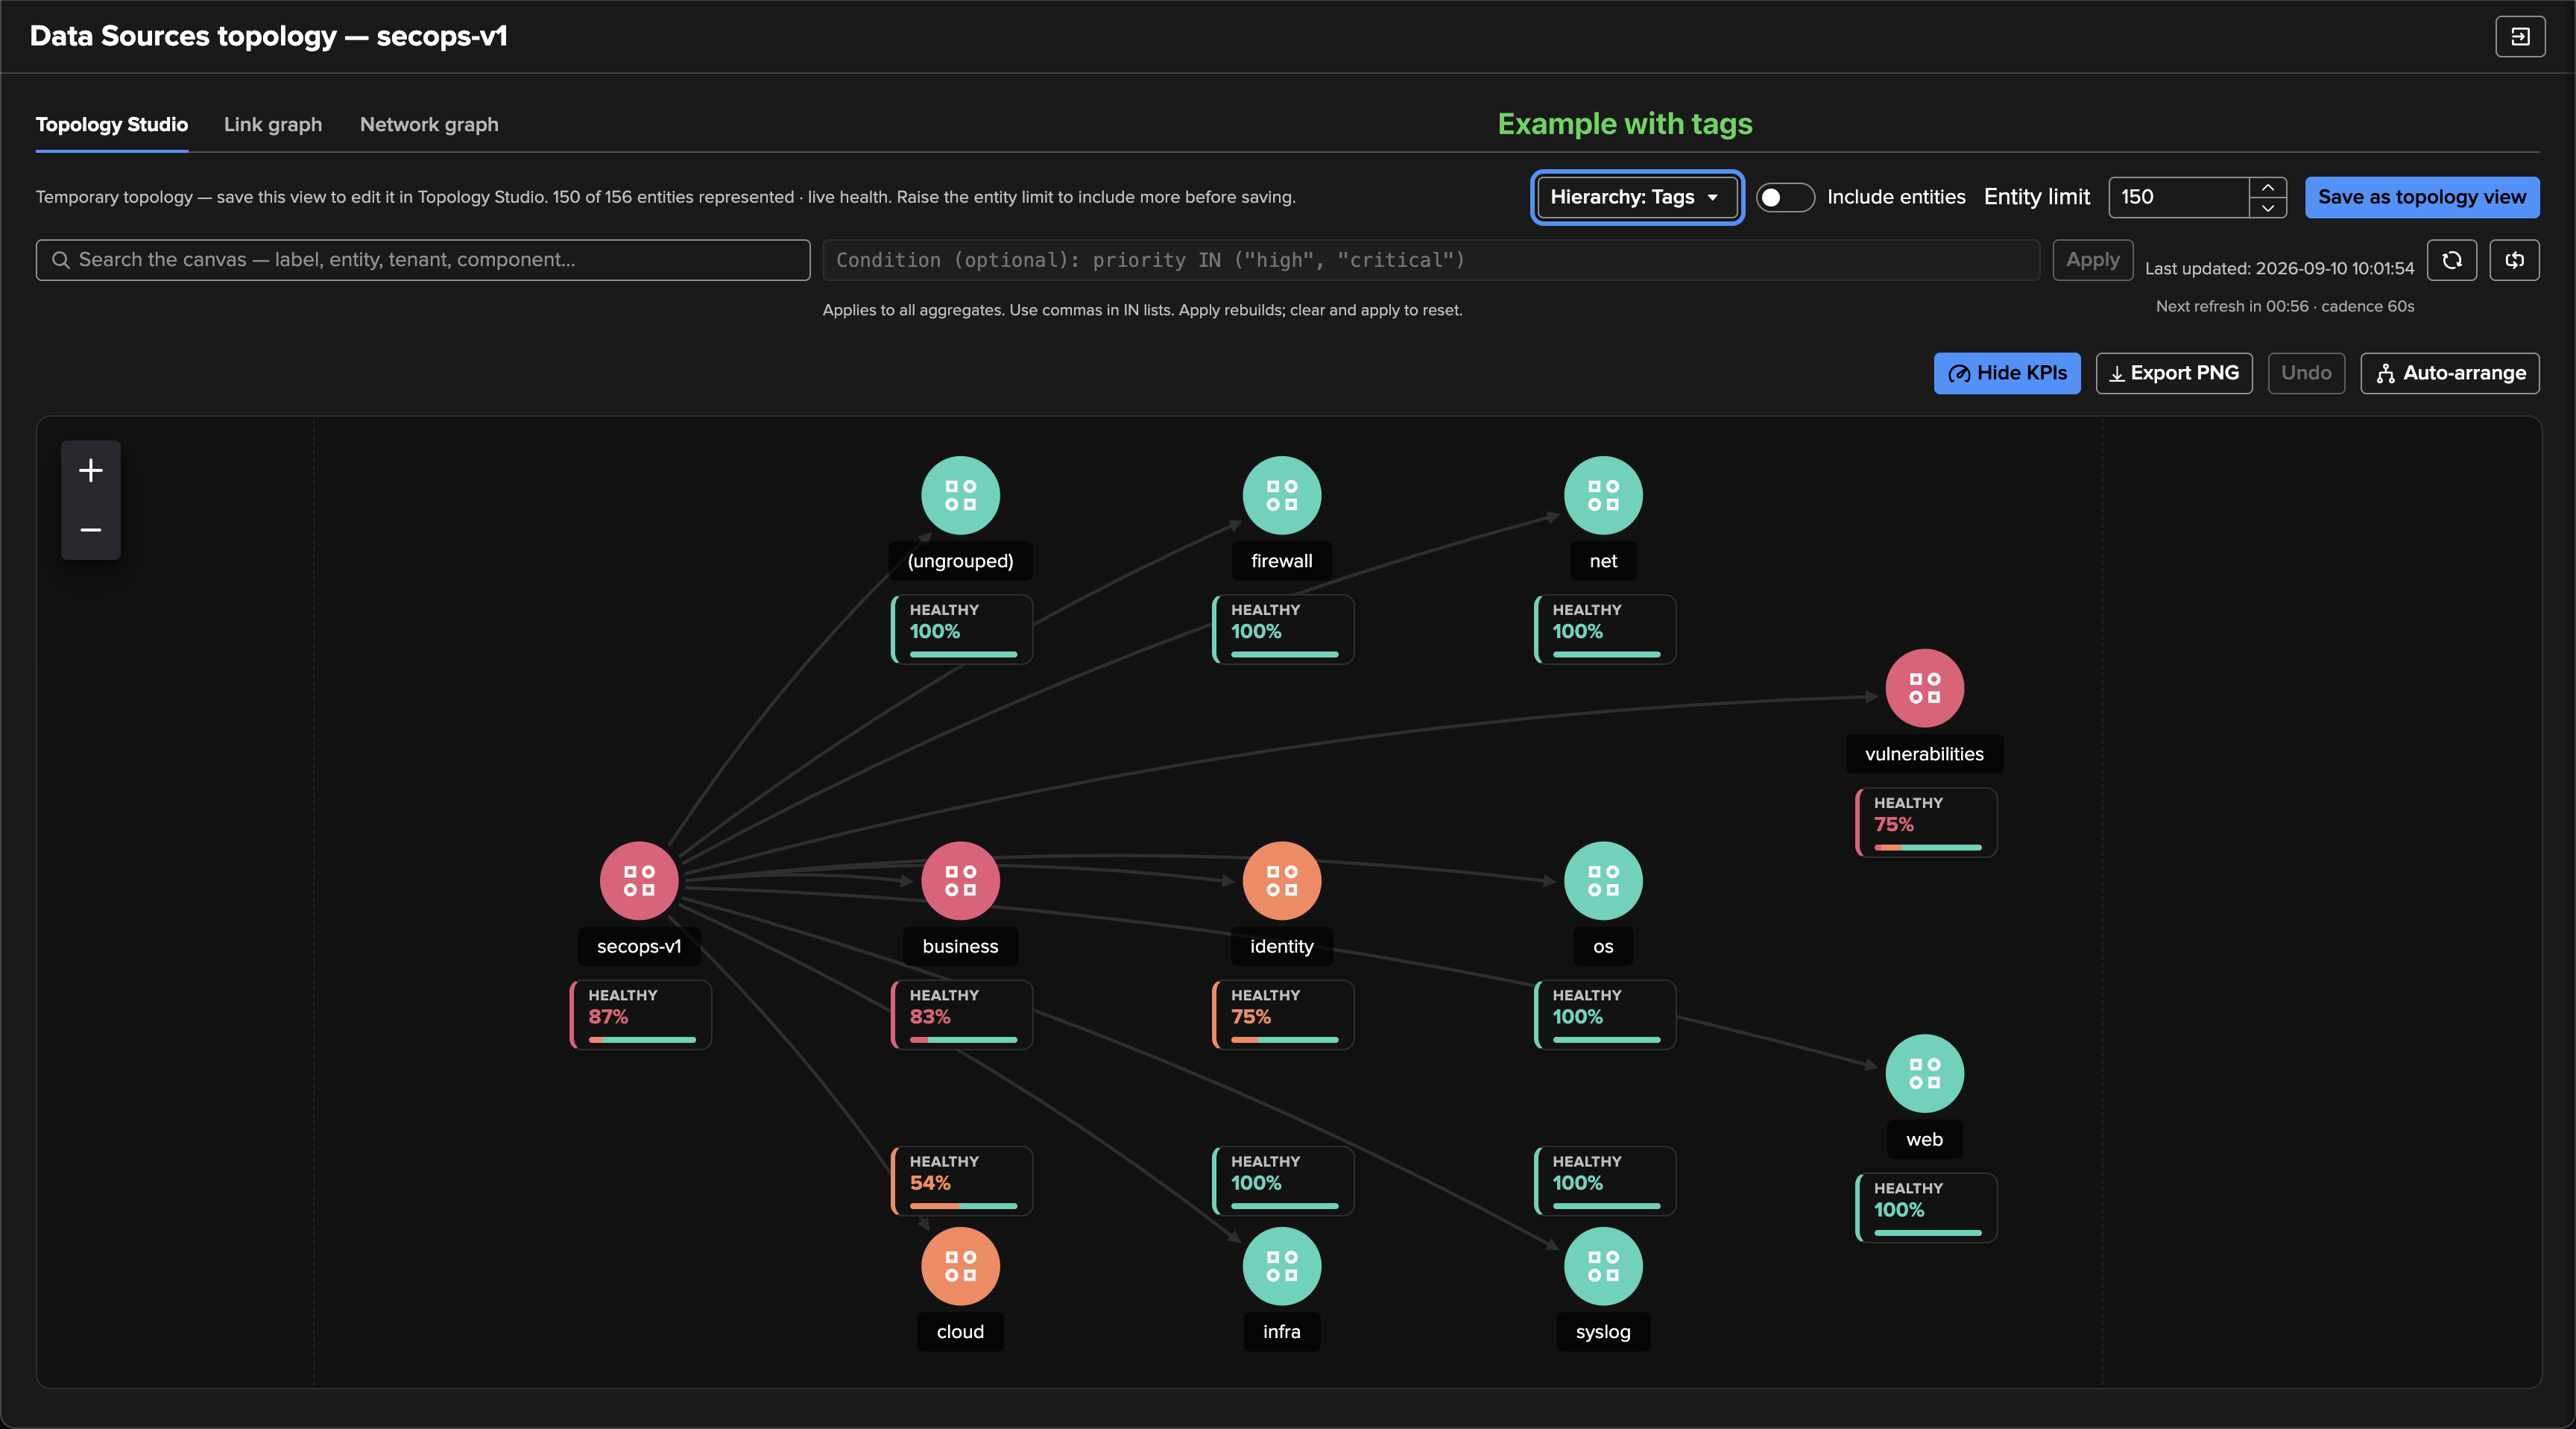
Every intermediate group is a live aggregate of its descendants. Entities can belong to more than one tag or label group; overlapping membership is counted once in ancestor totals. Records without a value for a grouping field appear under an (ungrouped) branch.
Changing the hierarchy rebuilds the layout while retaining the applied condition and represented membership. If a hierarchy expands beyond the supported graph limits, the preview reports an error and prevents saving. Reduce the number of levels or the entity limit, then review the new scope.
Step 4 — Inspect and arrange the map
Click an aggregate to inspect its members. Here, the vulnerabilities group
shows 75% healthy; the inspector’s Members map helps identify the member
in red and the members in orange, without adding every entity to the main canvas.
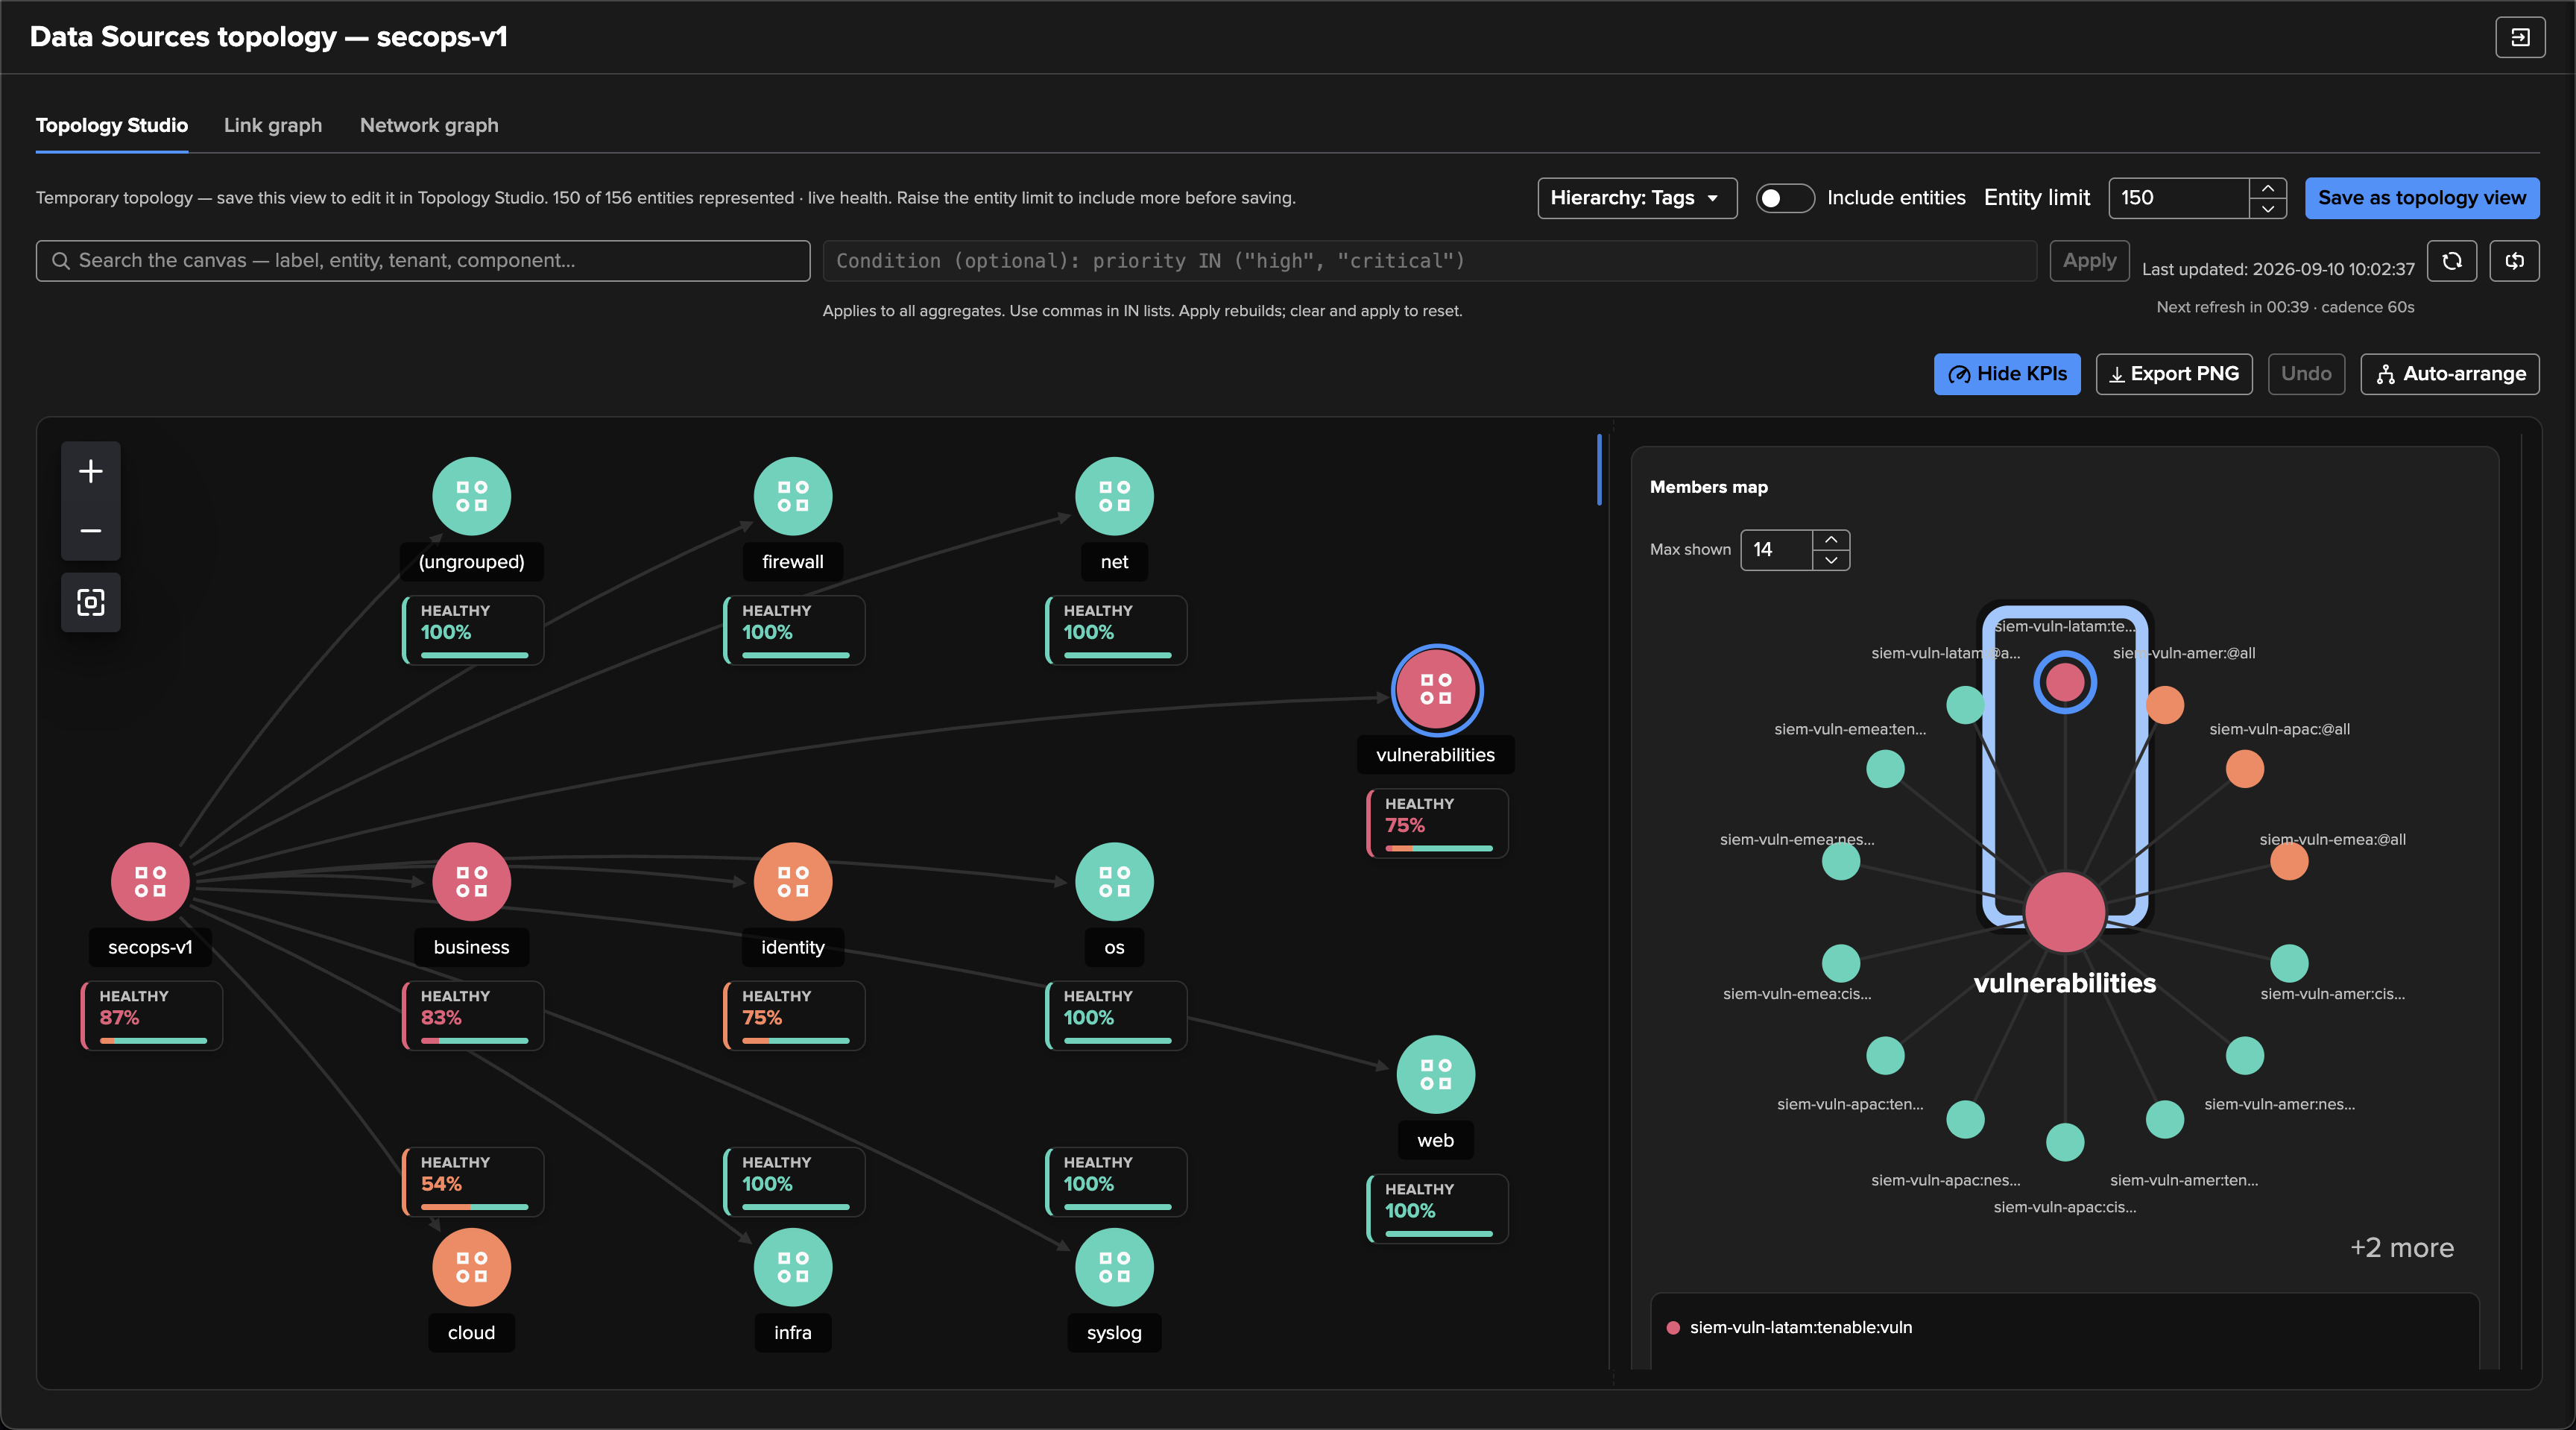
While the view is temporary, you can:
Search the canvas to locate nodes by label, entity, tenant or component.
Show or hide KPIs, zoom, and inspect the groups and entities.
Drag nodes, use Undo, or run Auto-arrange to organise the layout.
Refresh live health, pause/resume refresh, or Export PNG for an image of the current map.
Use Condition and Apply when you want to filter the represented membership itself, as in the Cribl example below. Applying a condition rebuilds the layout, so apply filters and choose the hierarchy before making final layout adjustments.
Note
The generated connections describe the selected grouping hierarchy; they do not infer dependency impact propagation. Save the view to author membership, connections and other Studio settings. Switching between the topology tabs keeps the temporary preview; closing the panel discards an unsaved preview and its layout changes.
Step 5 — Save as a Topology Studio view
Click Save as topology view. In the Create topology view dialog, enter a unique View ID and a Display name, optionally add a description and category, and choose the roles that Can view and Can edit the result. The identifier cannot be changed later.
The example uses secops-by-tag, the display name
SecOps feeds - organised by tag, and the category Feeds tracking:
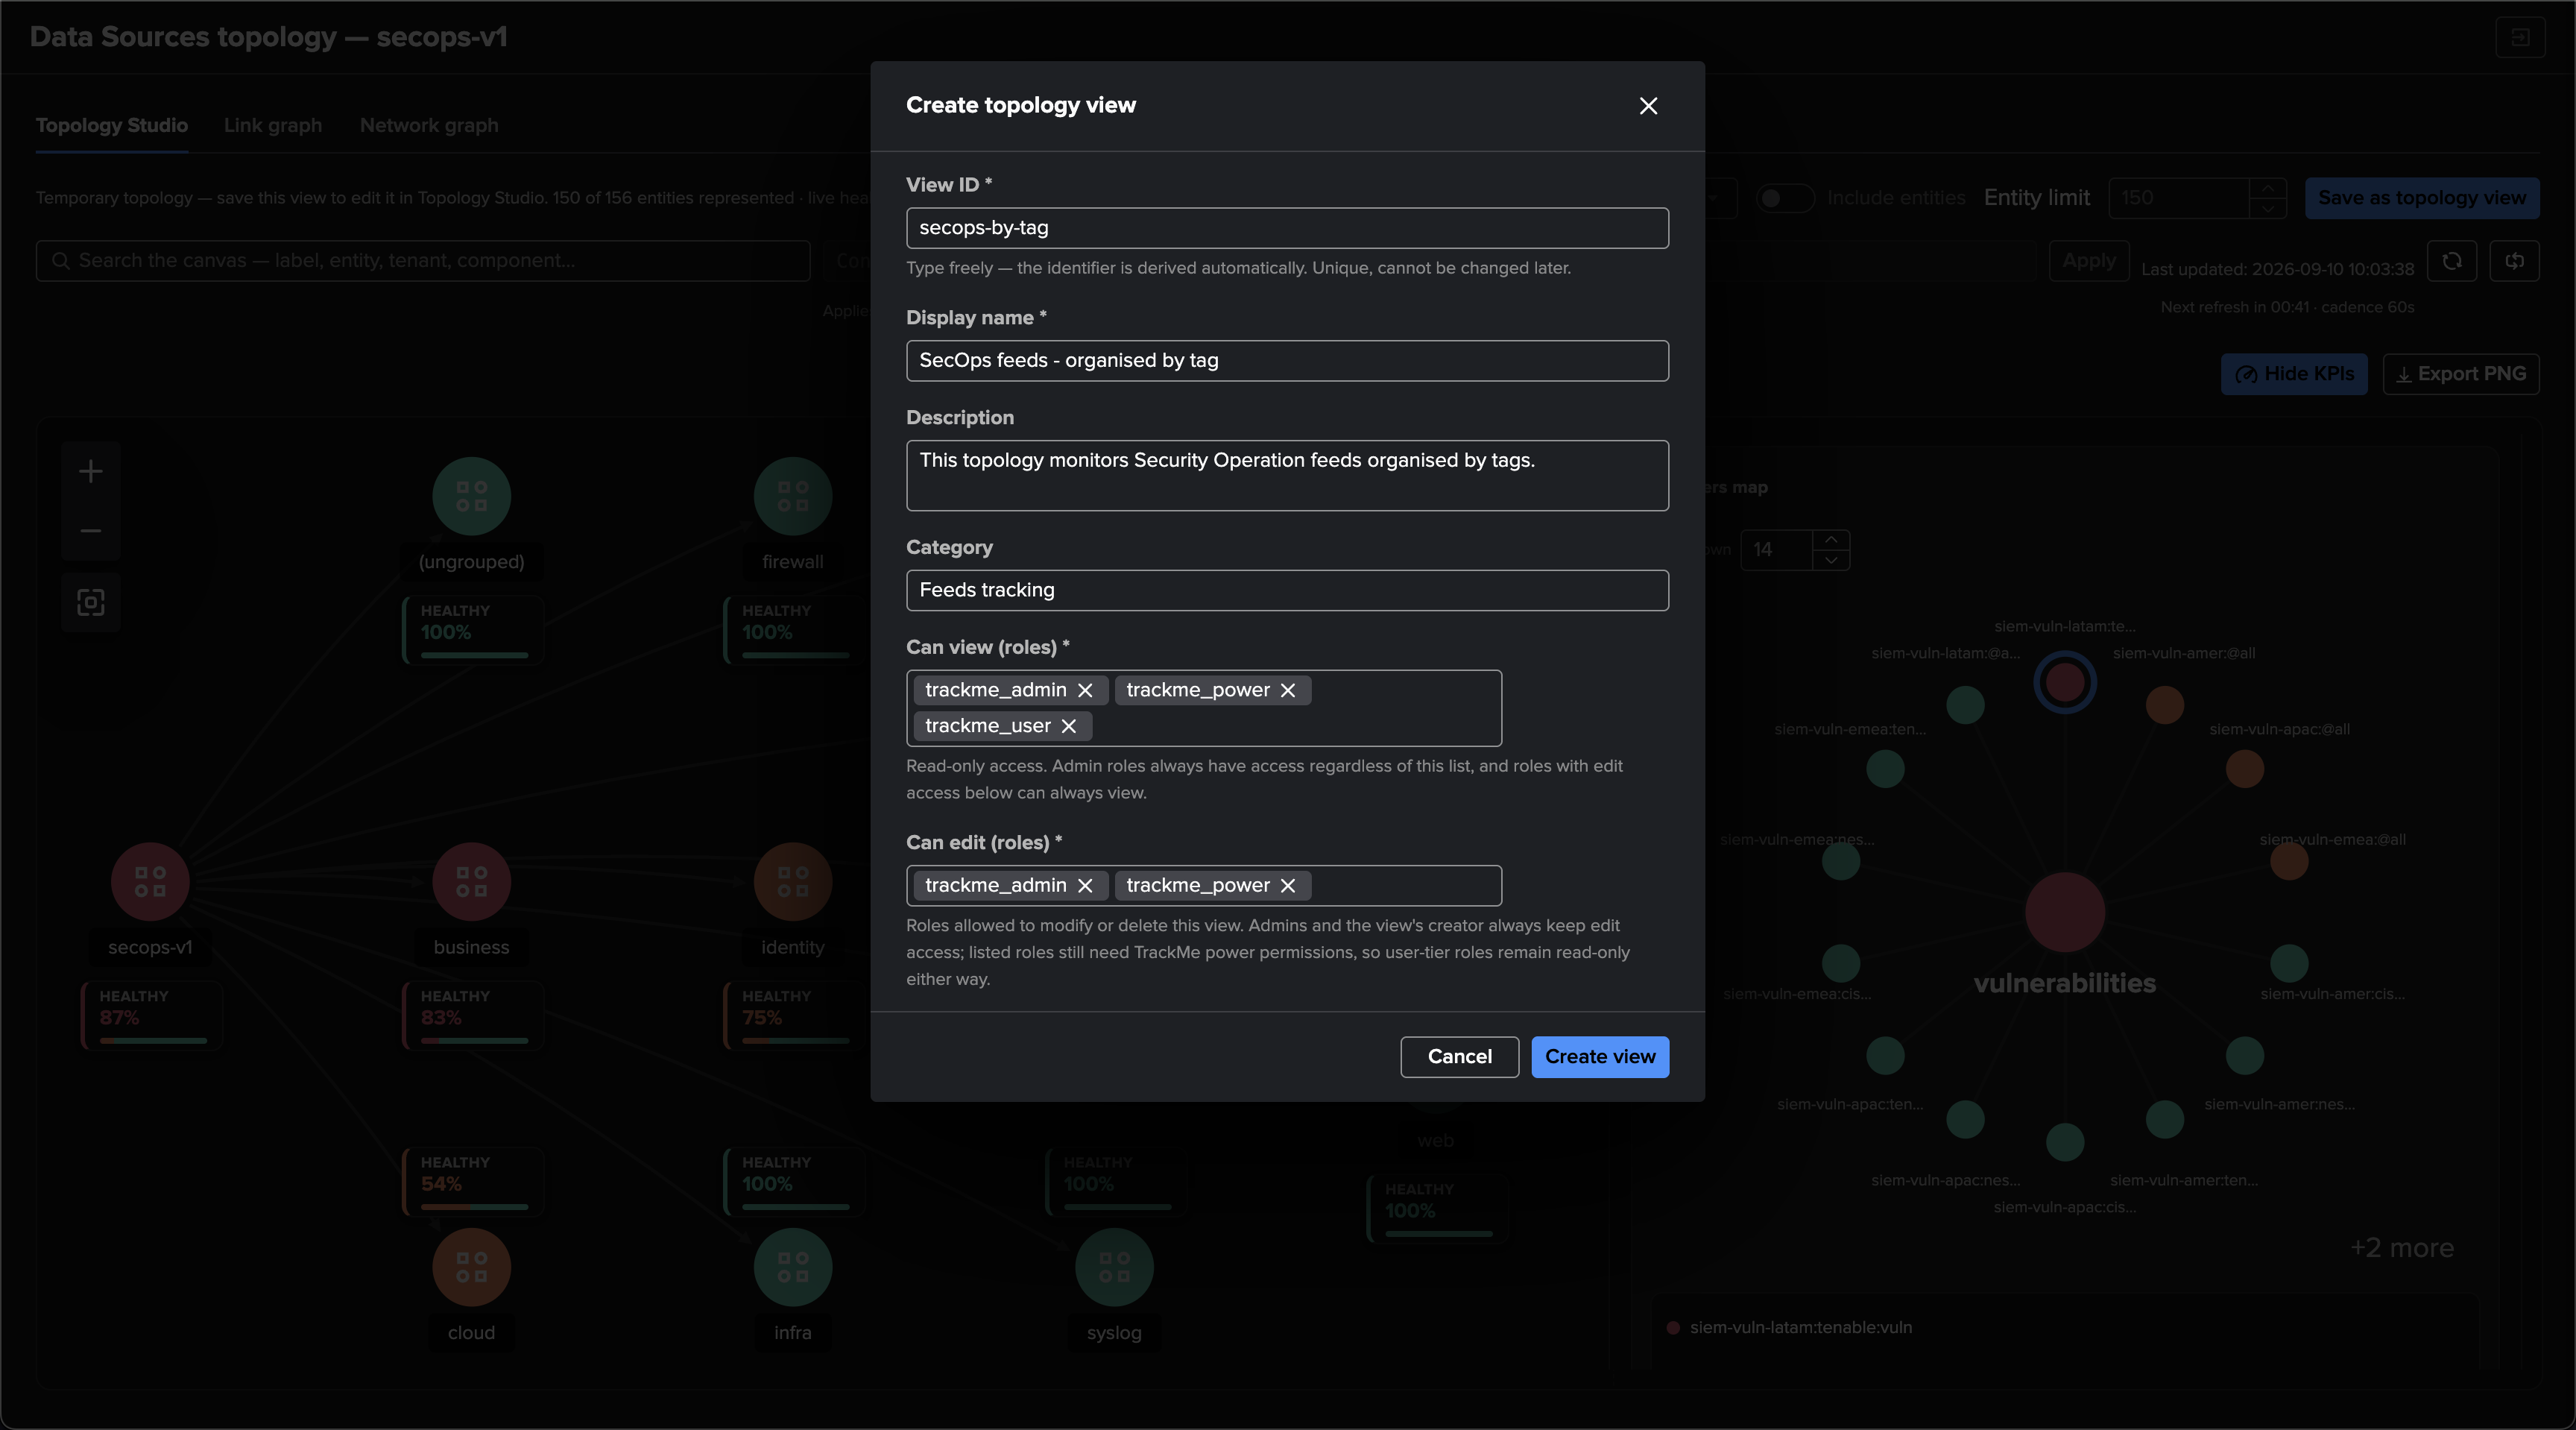
Saving requires the usual Studio authoring permissions and a license that permits writes. A role in Can edit still needs TrackMe power permissions; see Administration for the access rules.
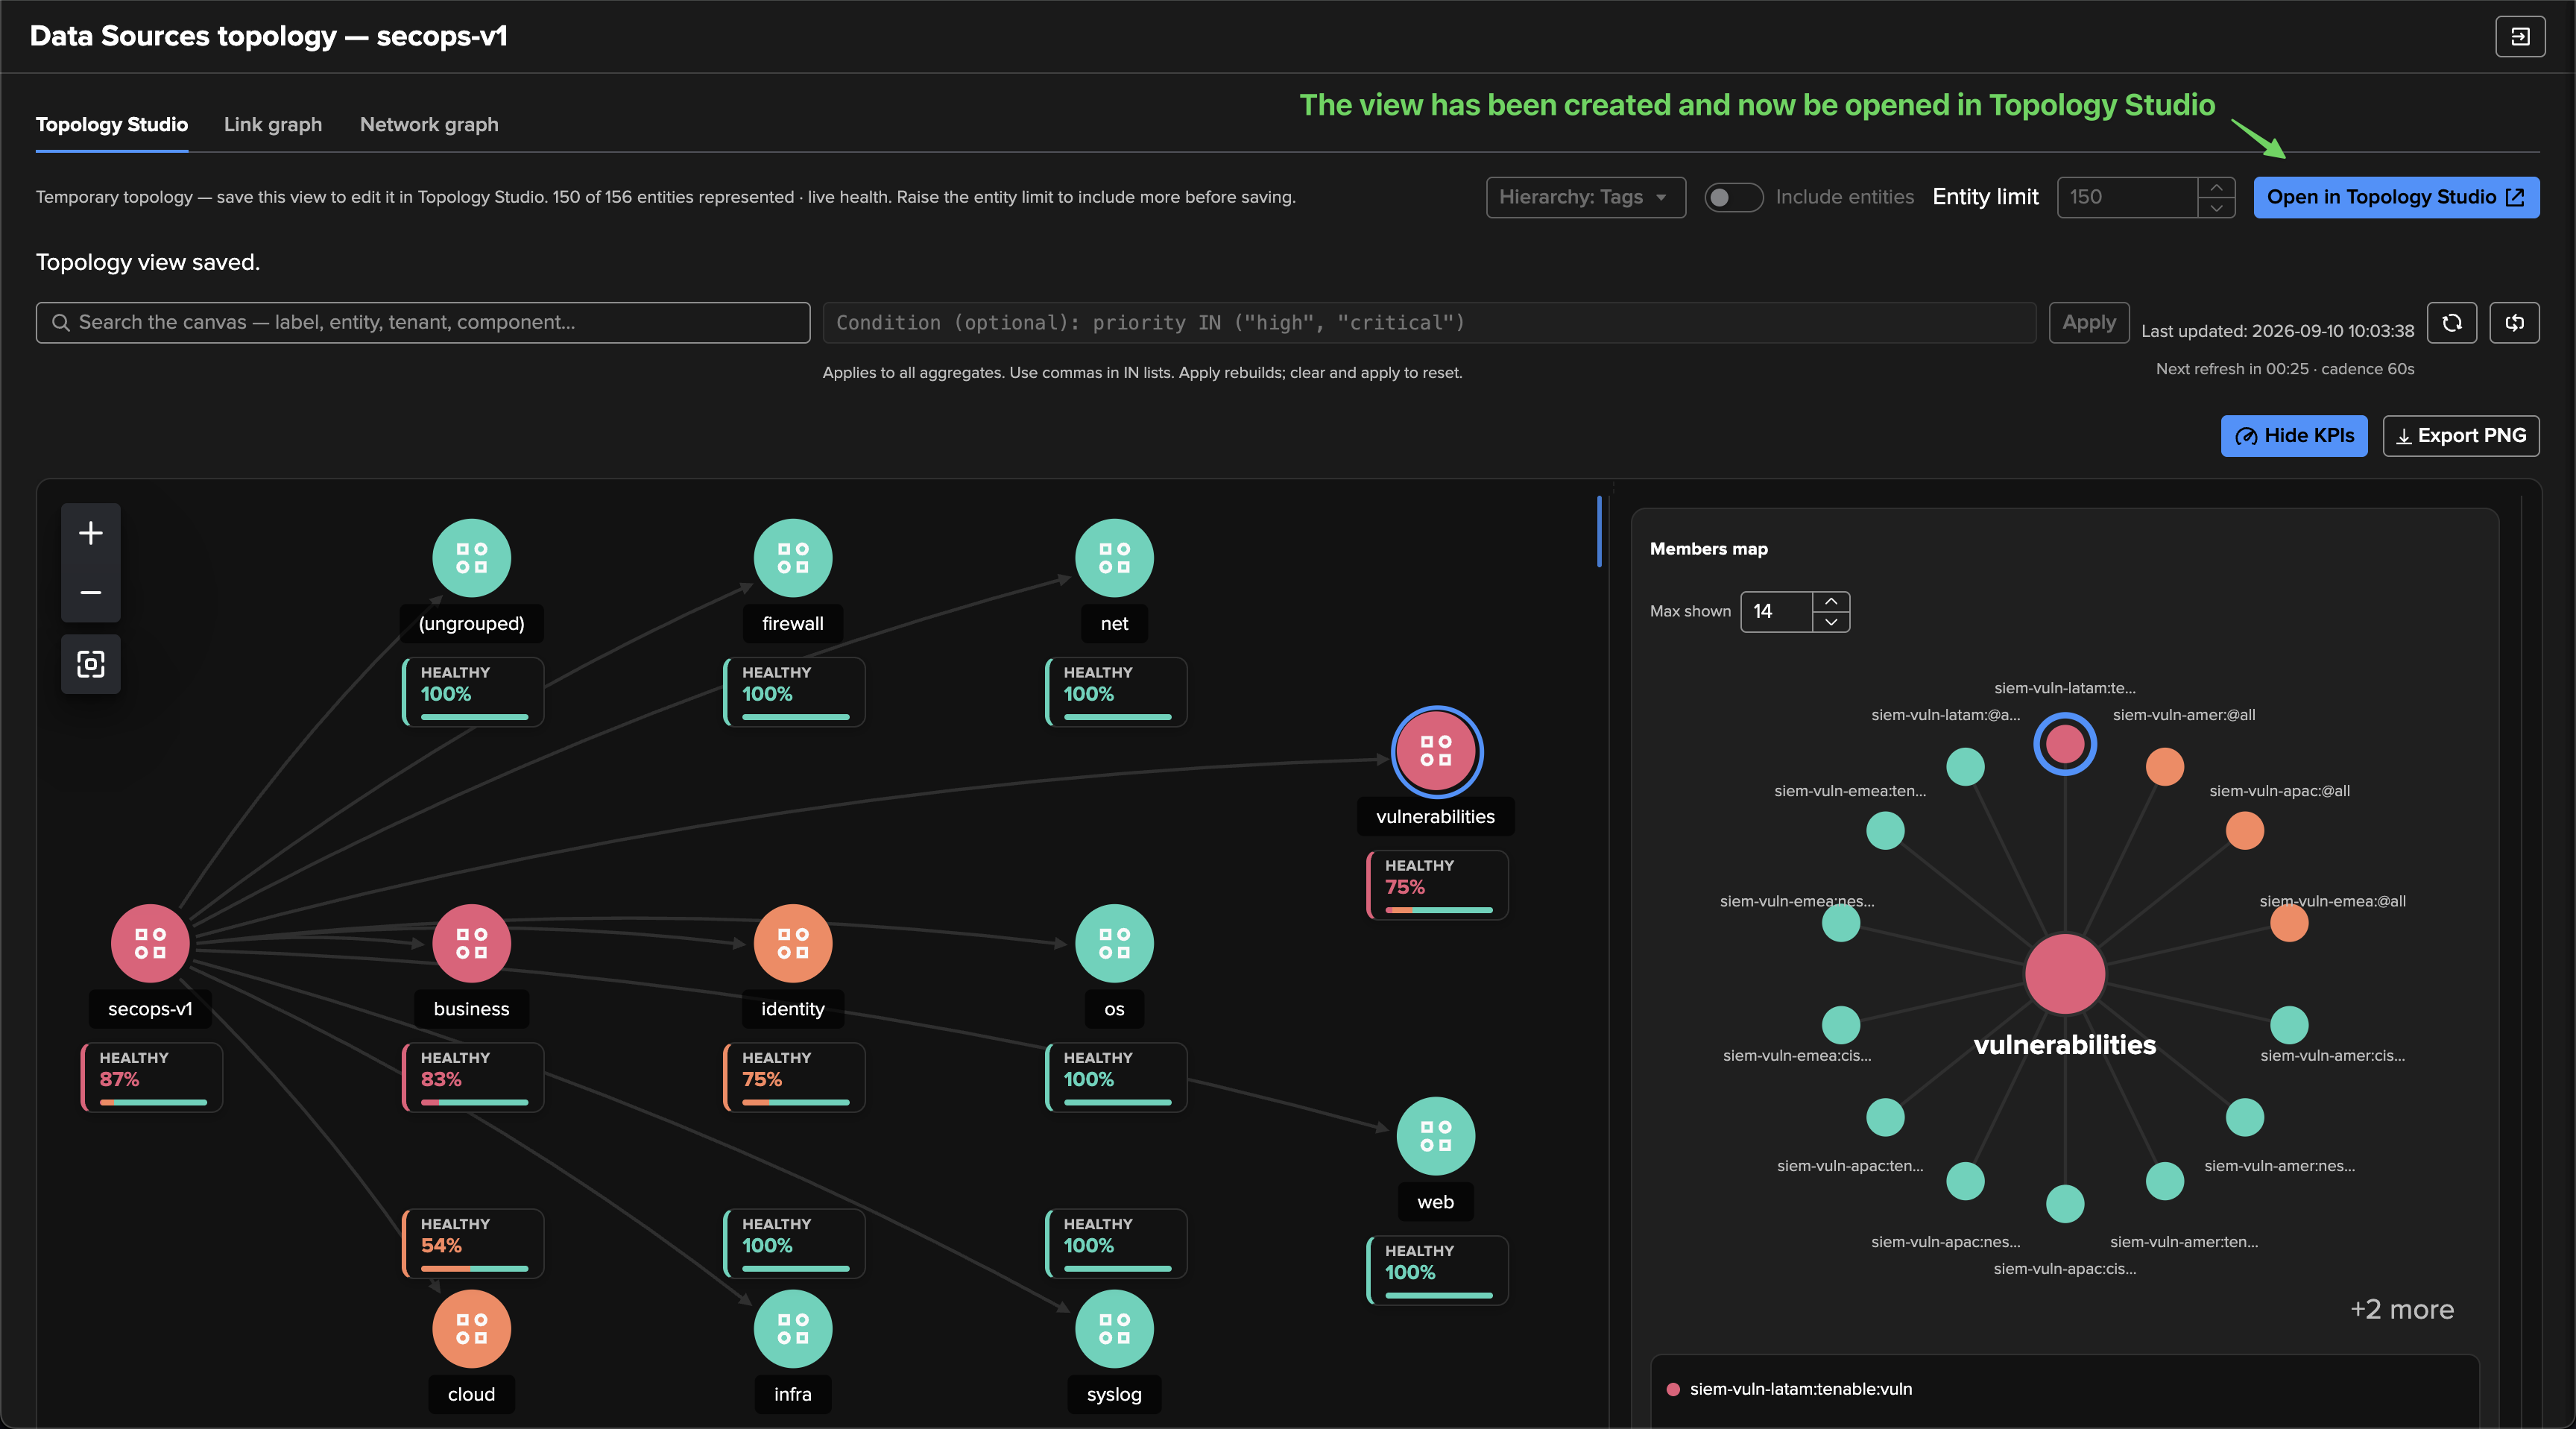
Click Create view. After the confirmation Topology view saved, click Open in Topology Studio:
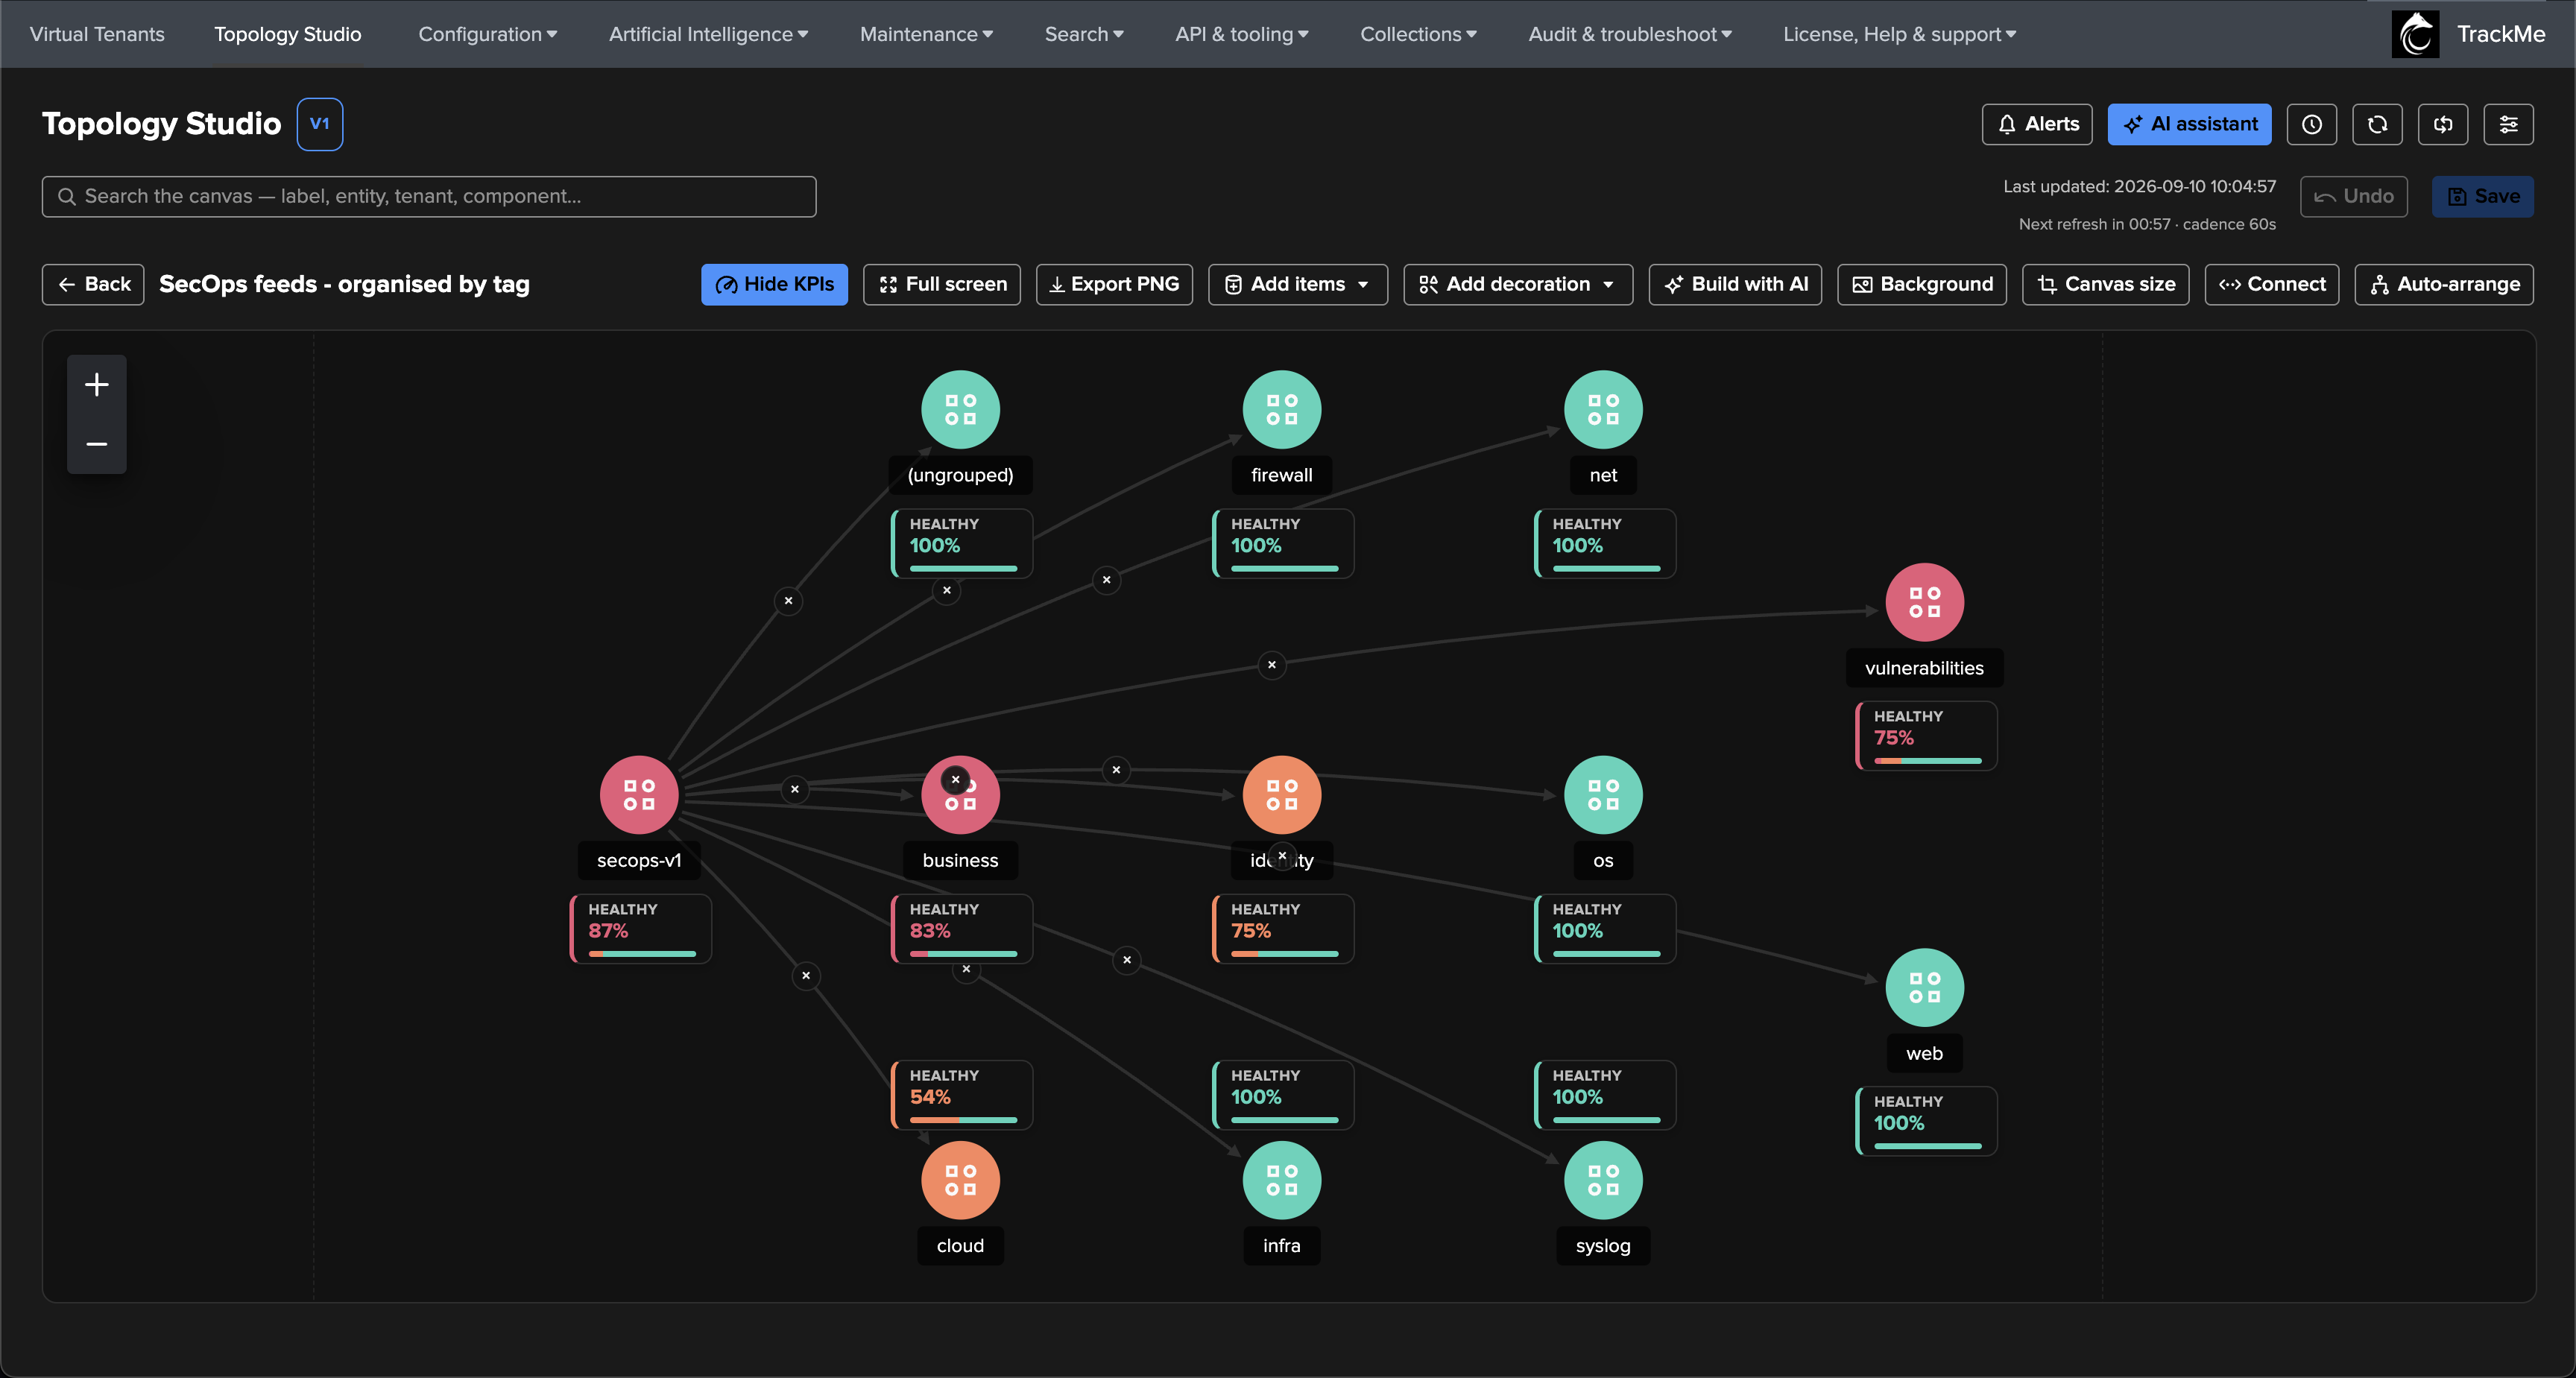
The saved canvas opens with the generated groups and your layout, ready for continued authoring:
Important
Saving captures membership and layout; health remains live. The generated aggregates retain the explicit entity selection and any applied condition. New entities later added to the tenant do not automatically join this saved selection. You can change membership and aggregate settings in Studio.
From here, use Authoring topologies to add nodes, edit connections or refine aggregate policies, and Decorations and canvas layout to present the map. You can also configure Topology Alerts on the saved view to monitor its health.
To combine these groups with other items or saved views, add an auto aggregate as a parent in the saved view. Its incoming links compose the children’s health without duplicating their selections or filters; the generated groups retain their own membership.
Example — Cribl Logstream with a priority filter
The same workflow works with other monitoring components. This example opens
the Flex use cases topology for the cribl-mon tenant, containing
Cribl Stream monitoring entities.
Keep Hierarchy: Default (Group) and enter the following in Condition:
priority IN ("high", "critical")
Click Apply. The condition selects the high- and critical-priority members
from the source selection and applies to all generated aggregates, including
the root. Use commas between values in an IN list.
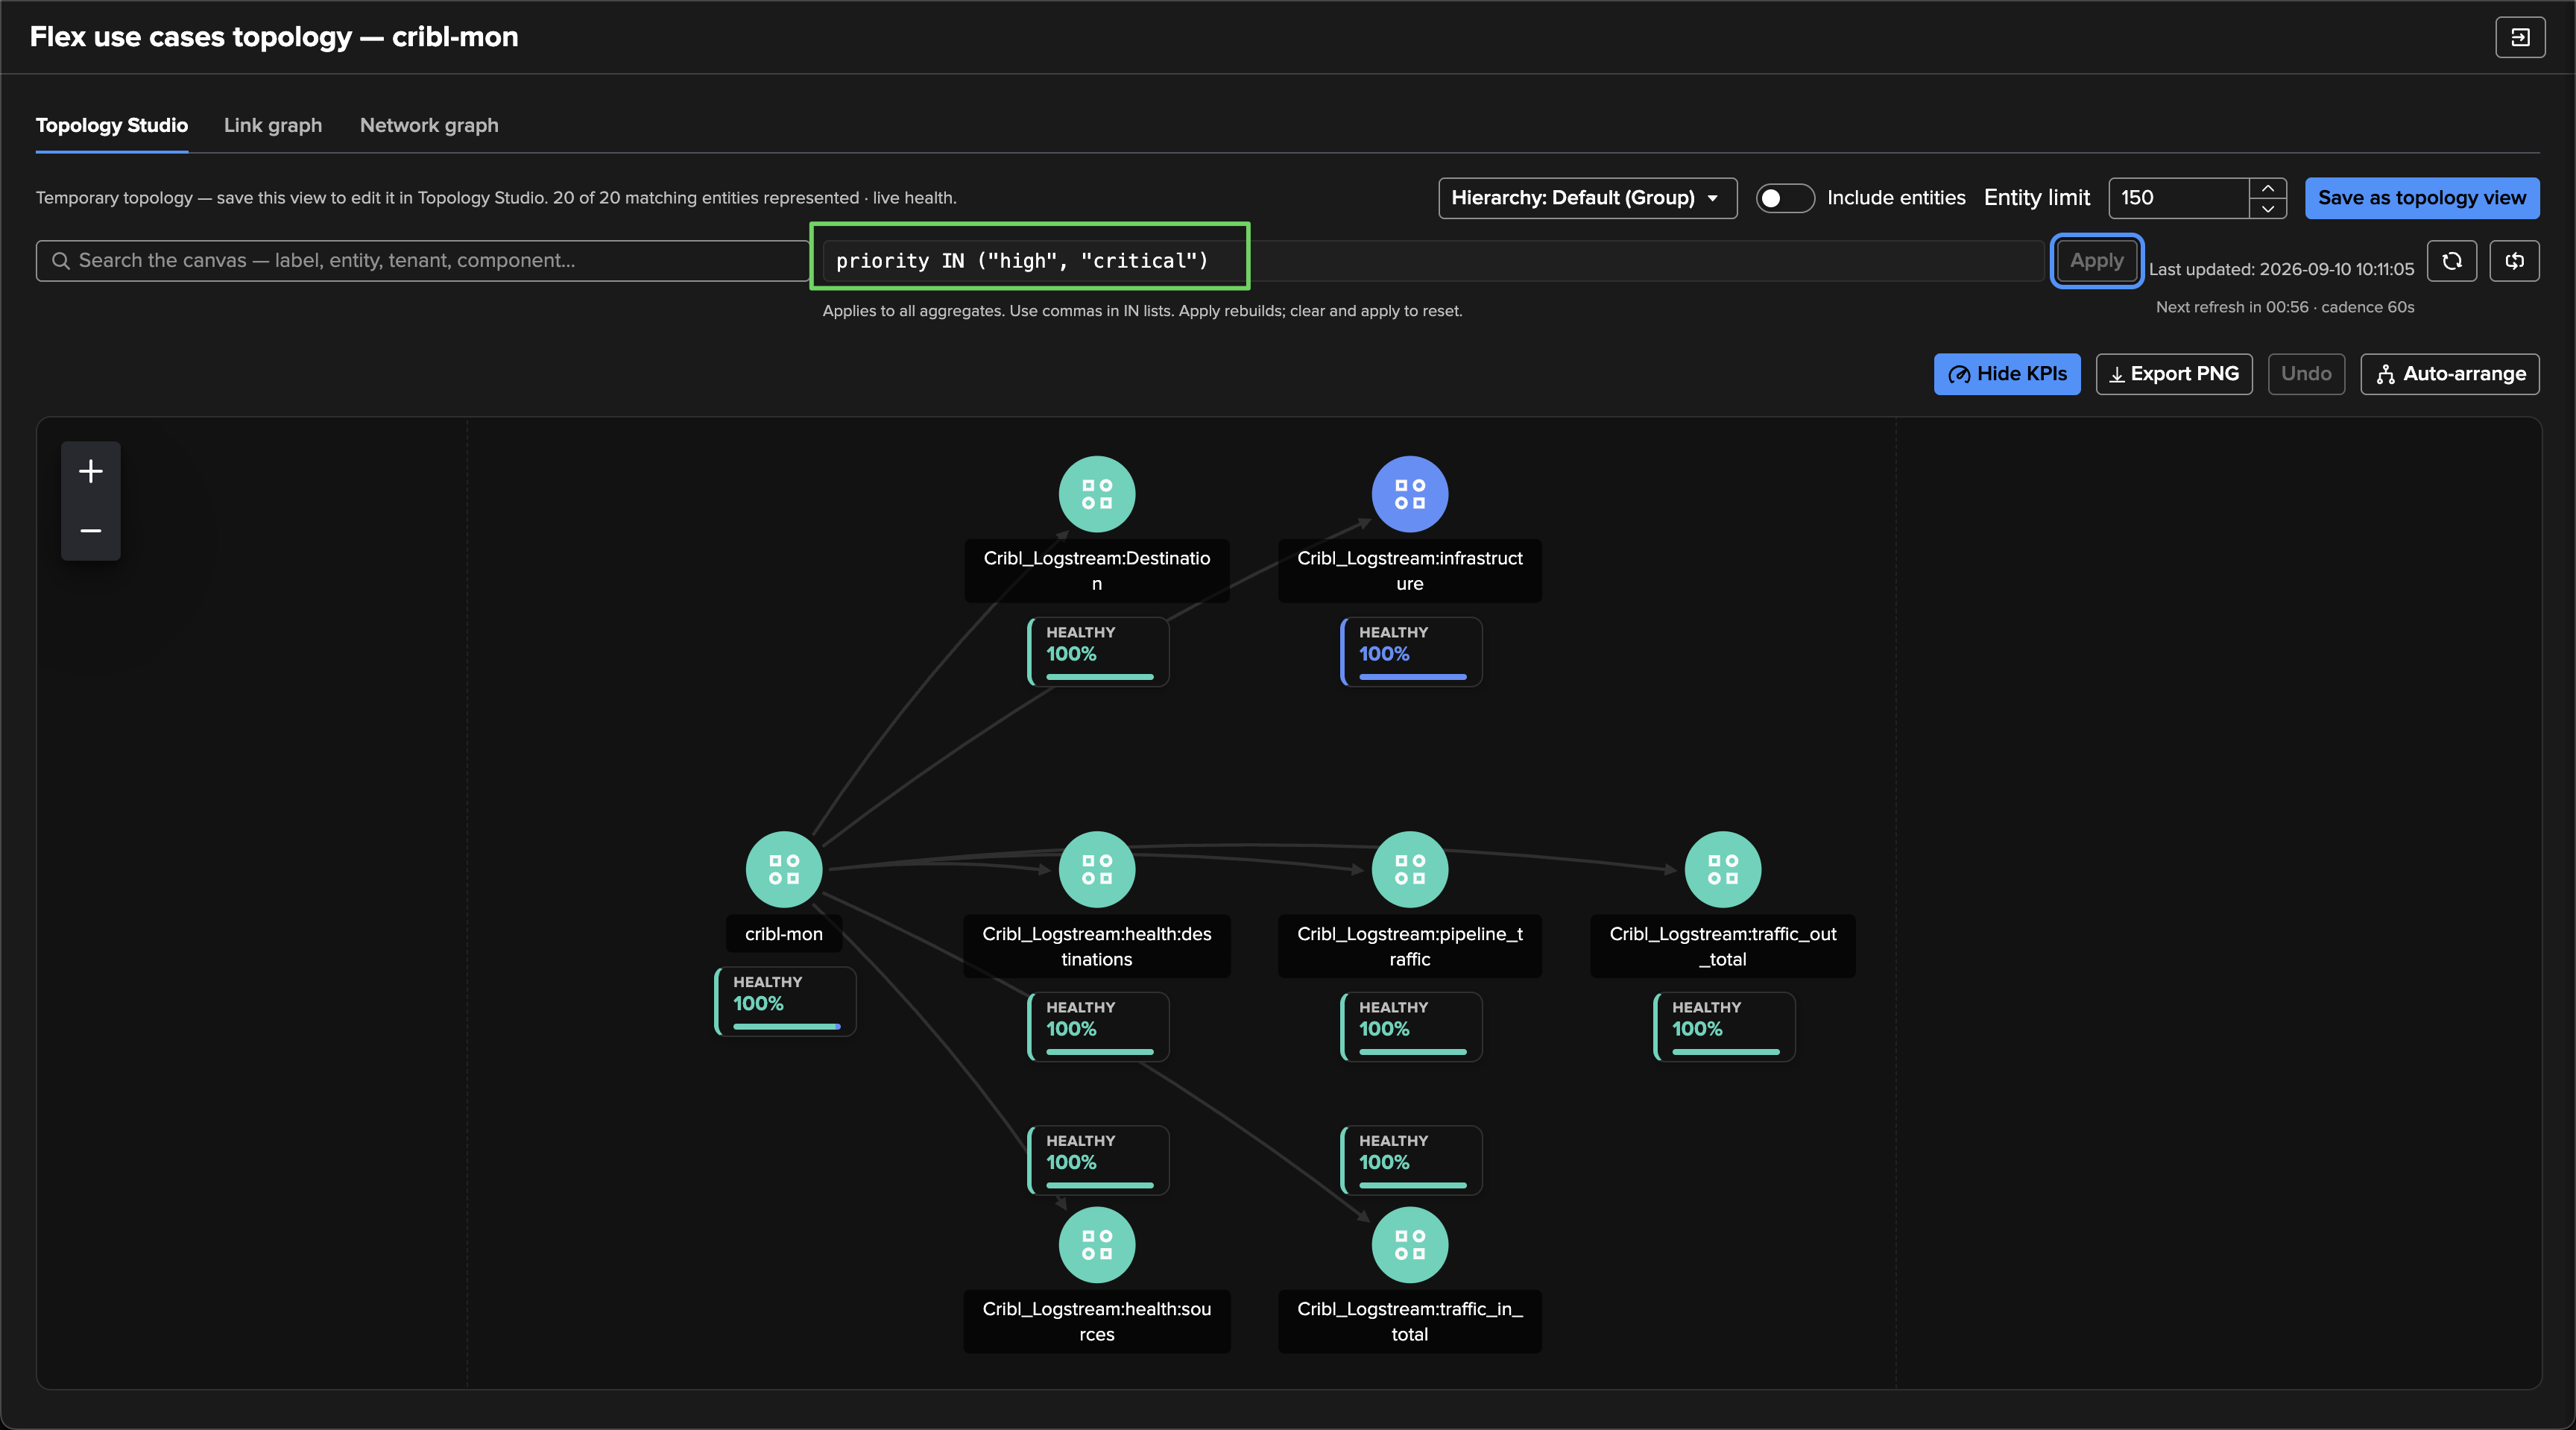
The preview reports 20 of 20 matching entities represented. Its groups cover destinations, source and destination health, infrastructure, pipeline traffic, and total traffic in and out. Include entities remains off, giving a compact health overview of the selected Cribl monitoring entities.
To reset the filter, clear Condition and click Apply again. If a condition is invalid or its results cannot be retrieved completely, resolve the displayed error before saving; edited condition text must be applied before creating the view. After applying a valid filter, check the matching-entity count and use Save as topology view to keep the result with its condition and layout.