User Activity Monitoring
Who is doing what on your Splunk: one tenant watches every account through the audit trail, the introspection and the REST API catalogs, raises findings from twelve built-in policies and your custom policies, groups them by account, and lets you investigate, assign and email the people concerned.
about 35 minutes · 36 slides. Each slide is followed by a description of what it shows — read top to bottom, this page is the walkthrough.
Overview
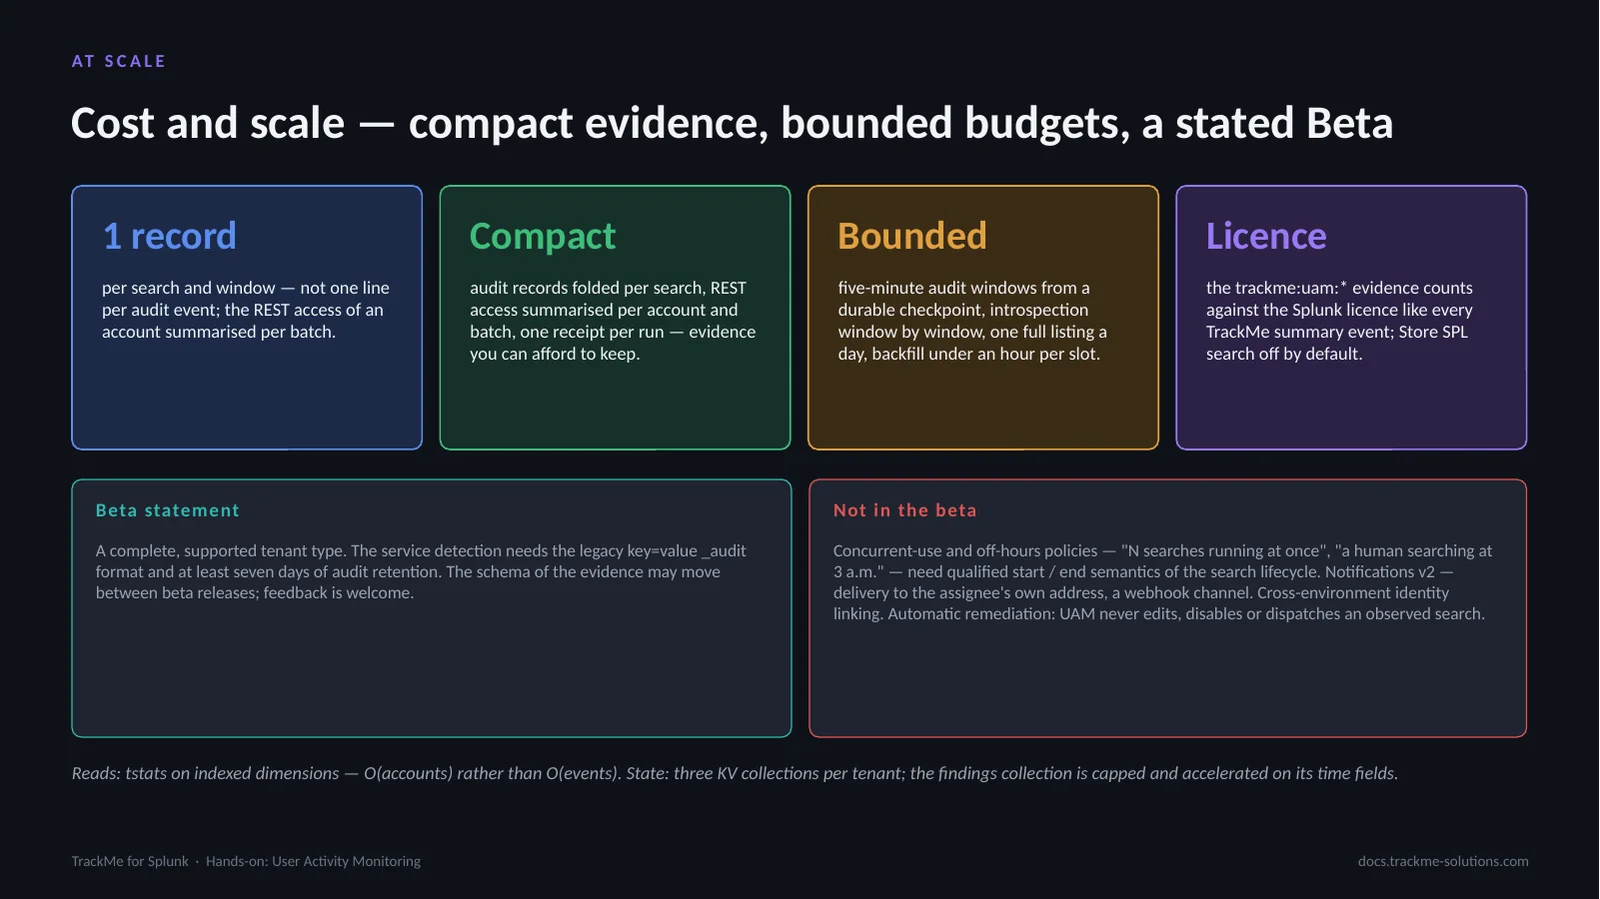
User Activity Monitoring (UAM) is a dedicated tenant type of TrackMe, generally available in 2.4.19. One tenant watches every account of a deployment: their searches, their cost and the knowledge objects they own. It raises findings from a policy catalogue, groups them by account, and lets operators talk to the people concerned.
Everything shown here was captured live on TrackMe 2.4.19, mostly on a tenant watching two search head tiers of one indexing layer; the screens that need a longer history come from a second lab tenant. The accounts that appear, alice.moreau, jane.doe, ben.okafor, svc-siem and others, are fictitious names of a small platform team. Four parts follow: setup, reading and grouping, communicating, tuning and operating.
The other half of the platform
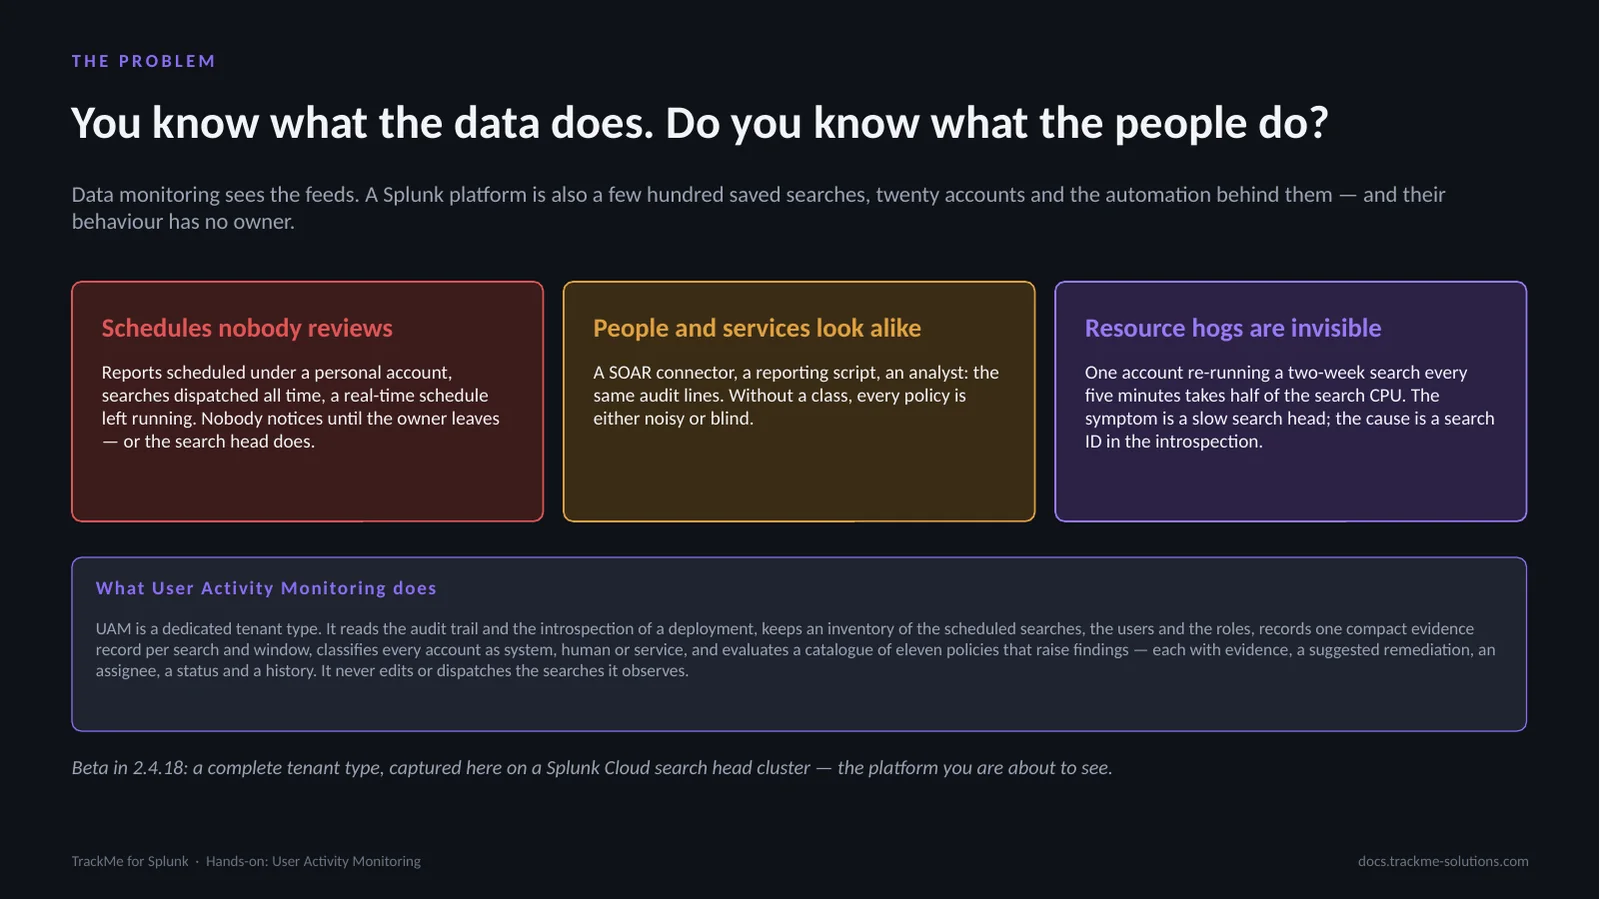
Data monitoring sees the feeds. A Splunk platform is also hundreds of saved searches and knowledge objects, dozens of accounts and the automation behind them, and their behaviour has no owner. Three cards name the symptoms: searches nobody reviews, knowledge objects that grow (a CSV lookup rewritten every hour until it weighs hundreds of MiB) and cost without a name (one account taking a large share of the search CPU).
UAM reads the audit trail and the introspection of one indexing layer, catalogues every search head tier through the REST API, classifies every account as system, human or service, and evaluates twelve built-in policies plus custom policies. It never edits, disables or dispatches what it observes.
From sources to Finding groups
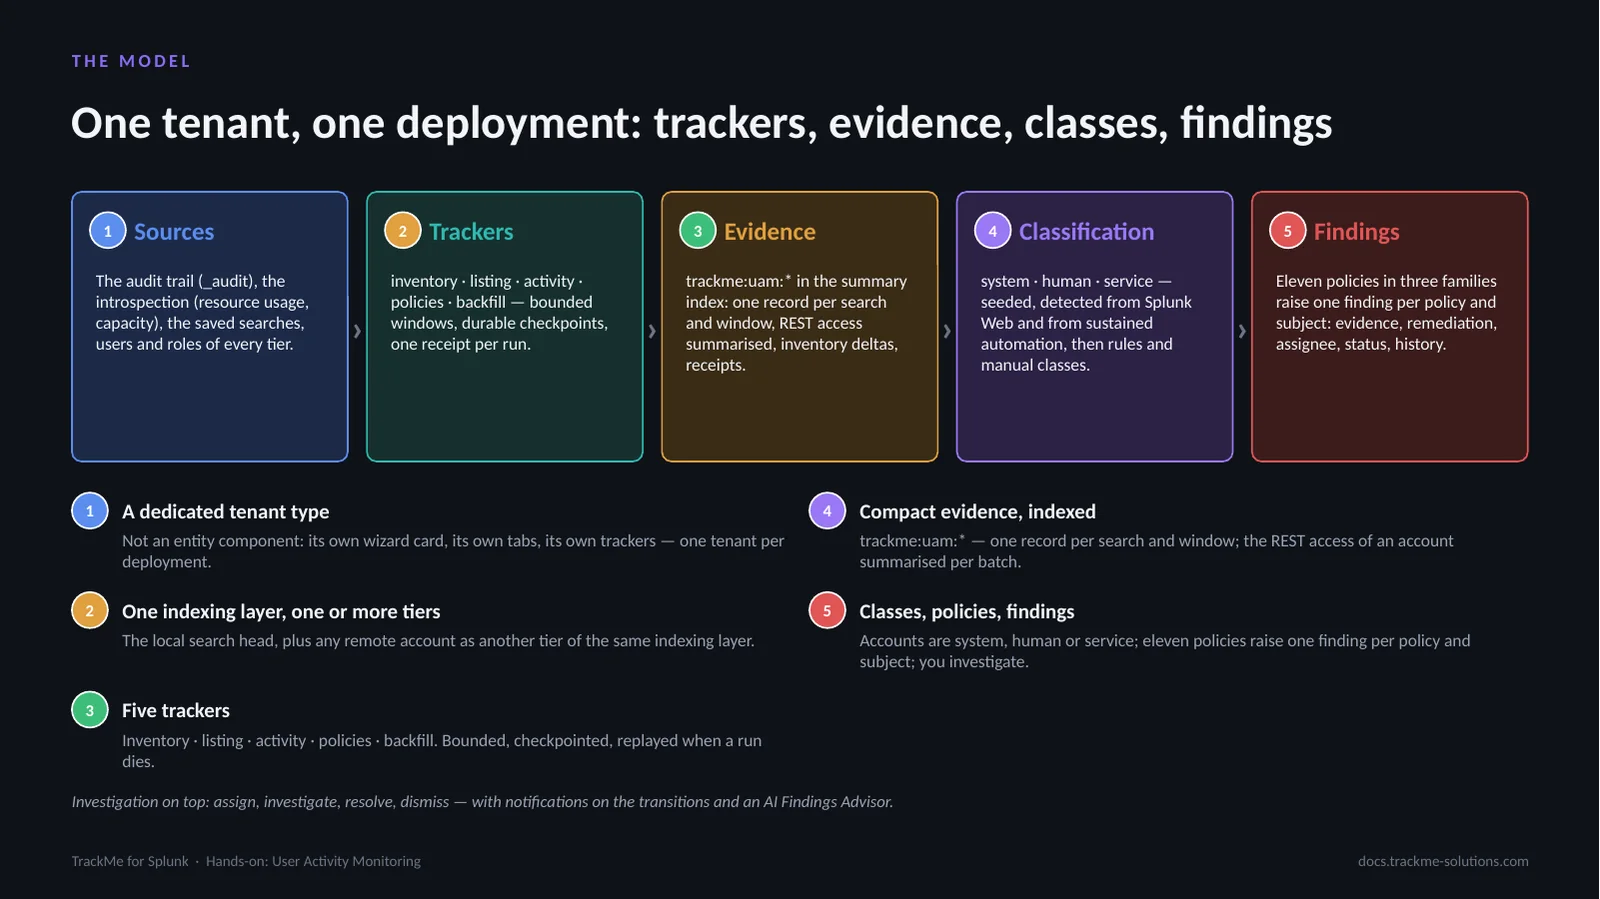
Five stages make the model. Sources: the audit trail, the introspection, and the REST API of every search head tier. Reports: catalogs per tier, activity every five minutes, policies every fifteen, a bounded historical backfill, one receipt per run. Evidence: compact trackme:uam:* records in the tenant indexes. Classes: system, human or service, from system defaults, rules, manual classes and detection. Finding groups: the built-in and custom policies raise findings, and an account with its saved searches forms one Finding group.
On top of the findings sit the triage, assignment, operator notifications, emails to the account concerned, findings actions and the UAM AI Agent. An account is the one Splunk reports in its audit trail, not a verified person.
Four parts, one tenant
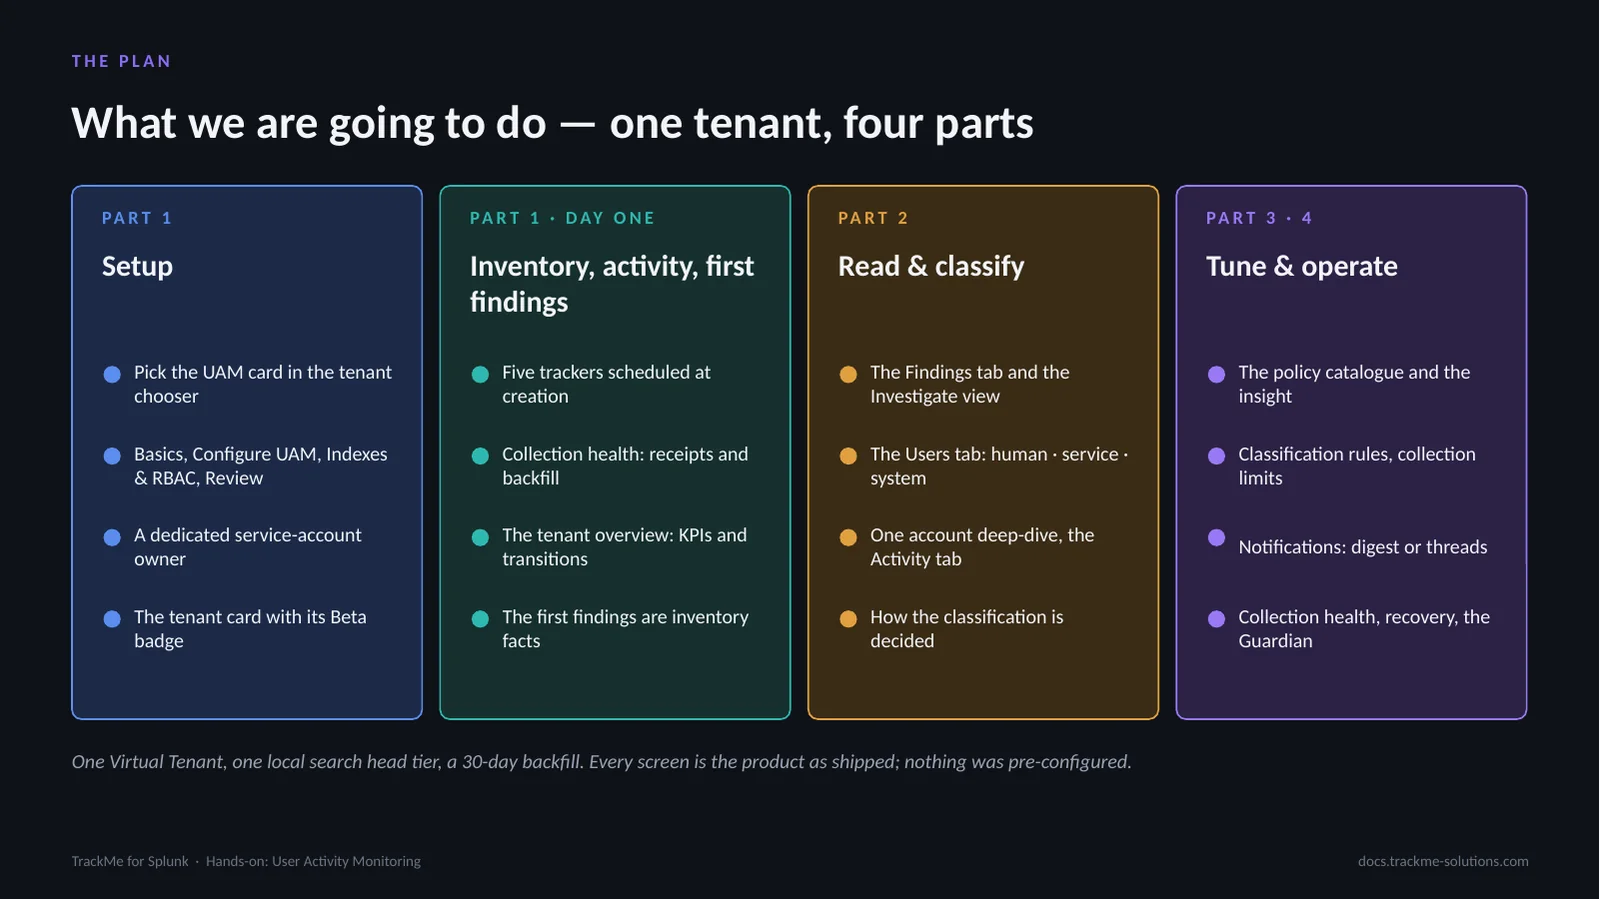
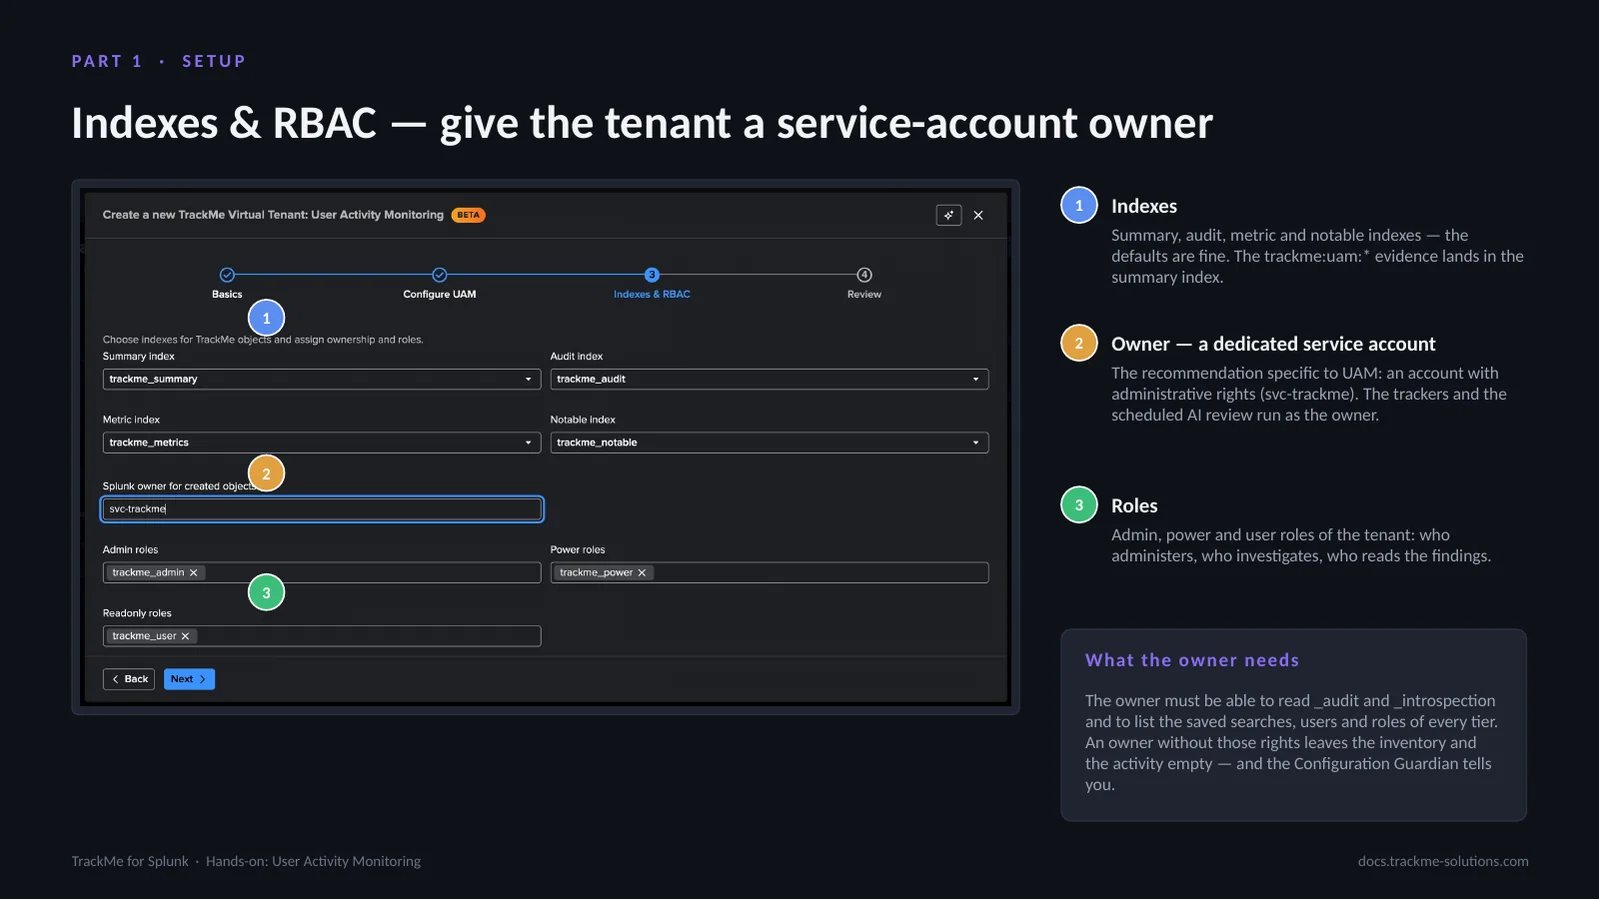
The walkthrough has four parts. Setup creates the tenant from the User Activity Monitoring card, with two search head tiers, the route account and a 30-day historical backfill, then checks the collection health and the catalogs. Read and group covers the findings and Finding groups, the investigation, the accounts with their classes and owner catalogs, and the knowledge objects across owners.
Communicate covers the finding and group menus, the email communication, and the notifications to users and to operators. Tune and operate covers the policy catalogue with its insight and email templates, a custom policy written in SPL, the UAM AI Agent, the scheduled searches and the collection health. Every screen is the product as shipped.
Part 1 — Setup
The first part creates the tenant and follows its first collection: the User Activity Monitoring card, the search head tiers and the route account, the historical backfill, then the tenant card, the status strip and the collection health on day one.
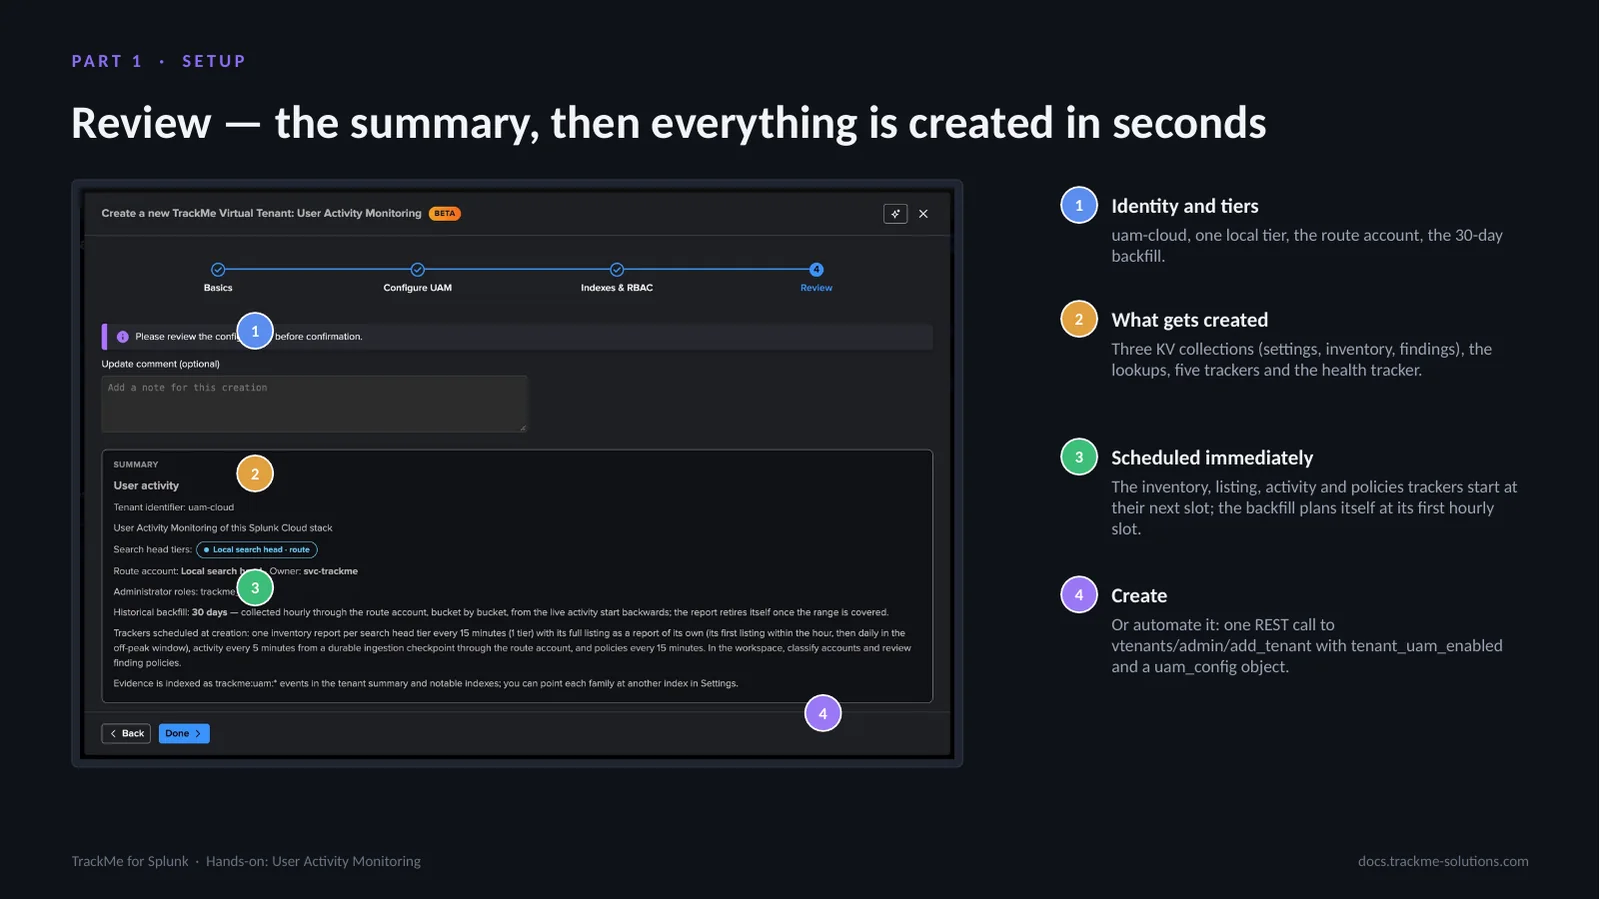
The wizard has four steps. Within minutes of the creation the catalogs of every tier are published and the first activity records arrive, and Collection health shows every report at work.
Choosing the tenant type
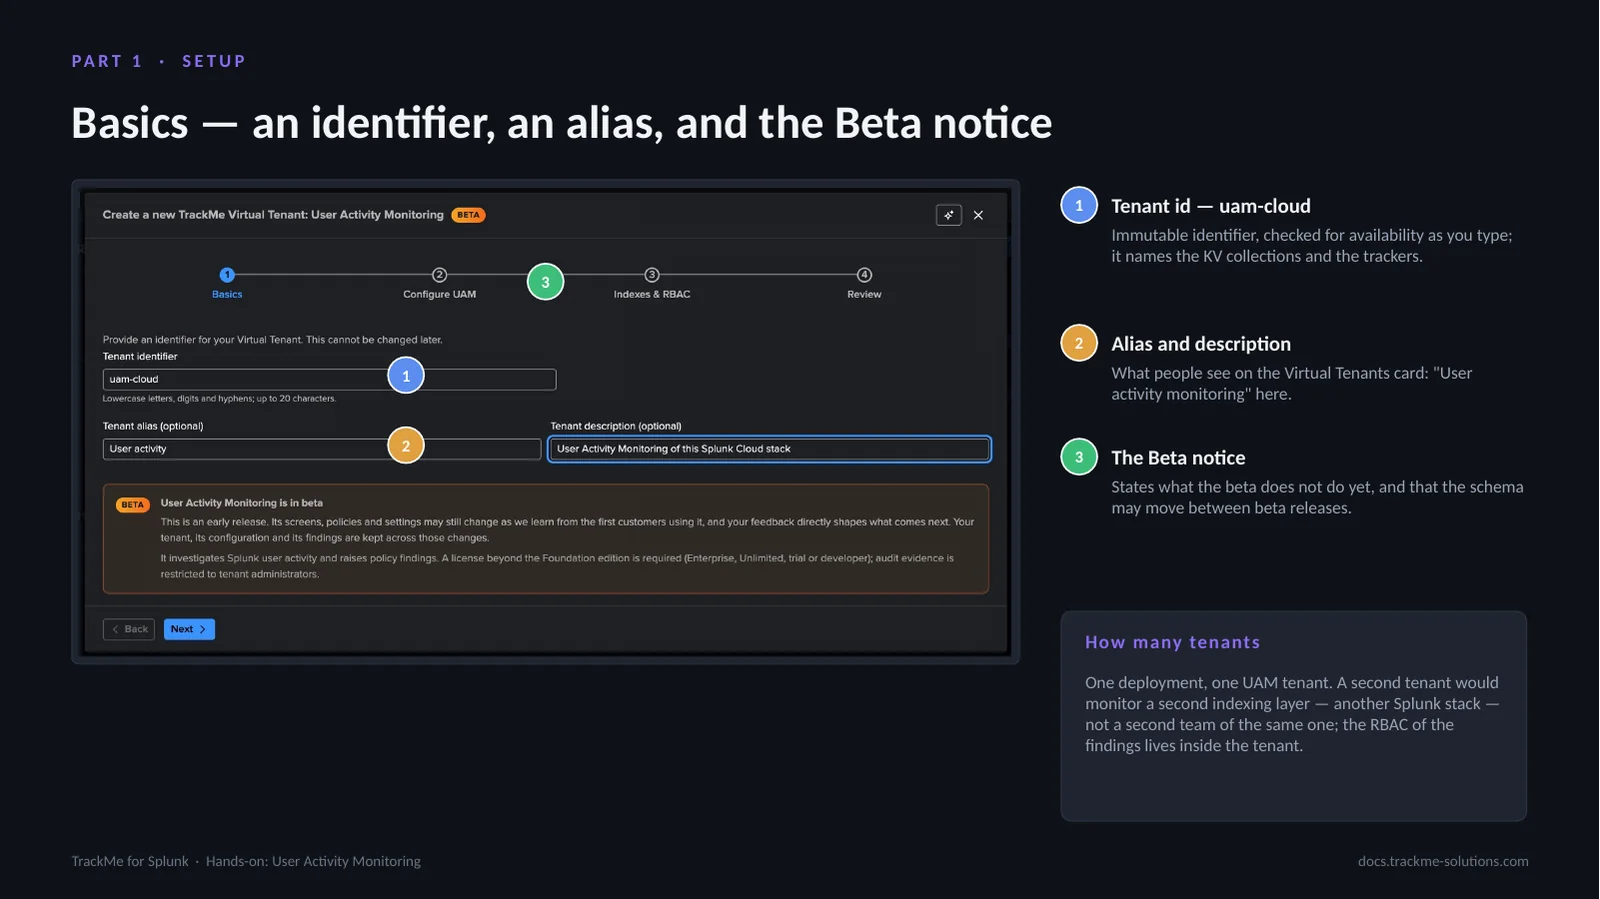
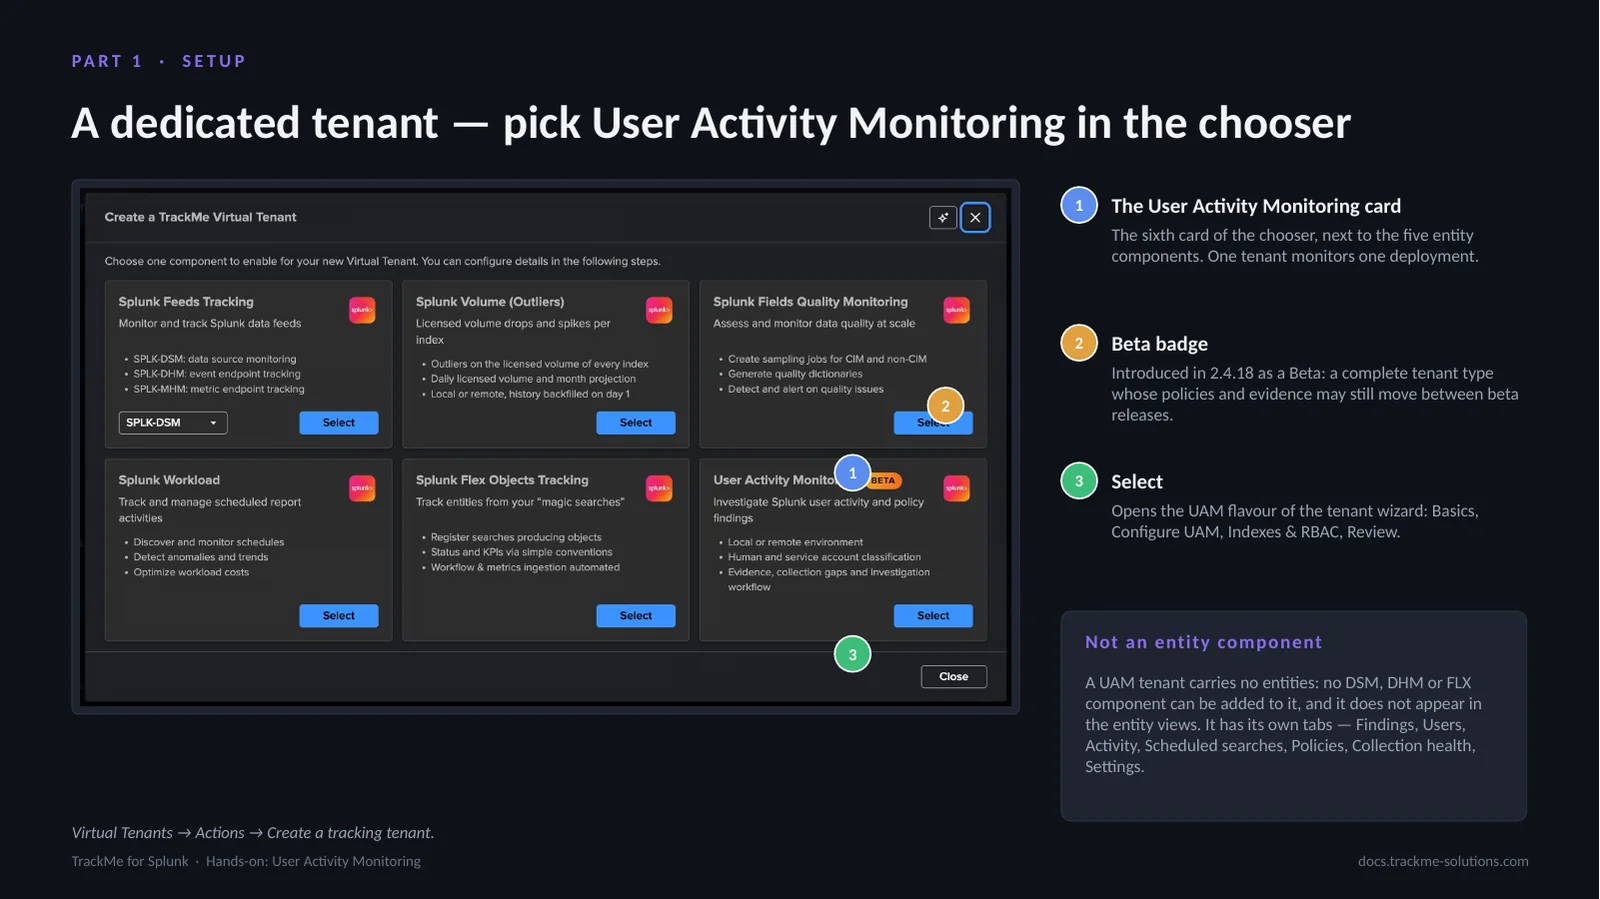
Virtual Tenants, Actions, Create a tracking tenant opens the chooser. The User Activity Monitoring card sits next to the entity components and the Cribl Stream and Cribl Edge cards and lists its scope: local or remote environment, human and service account classification, evidence, collection gaps and the investigation workflow. Select opens the UAM wizard: Basics, Configure UAM, Indexes & RBAC, Review.
A tenant is either an entity tenant or a UAM tenant, never both. A UAM tenant has no entities, no decision maker and no scoring: its object is the finding. It requires any licence beyond Foundation: Enterprise, Unlimited, trial or developer.
Tiers, route account and backfill
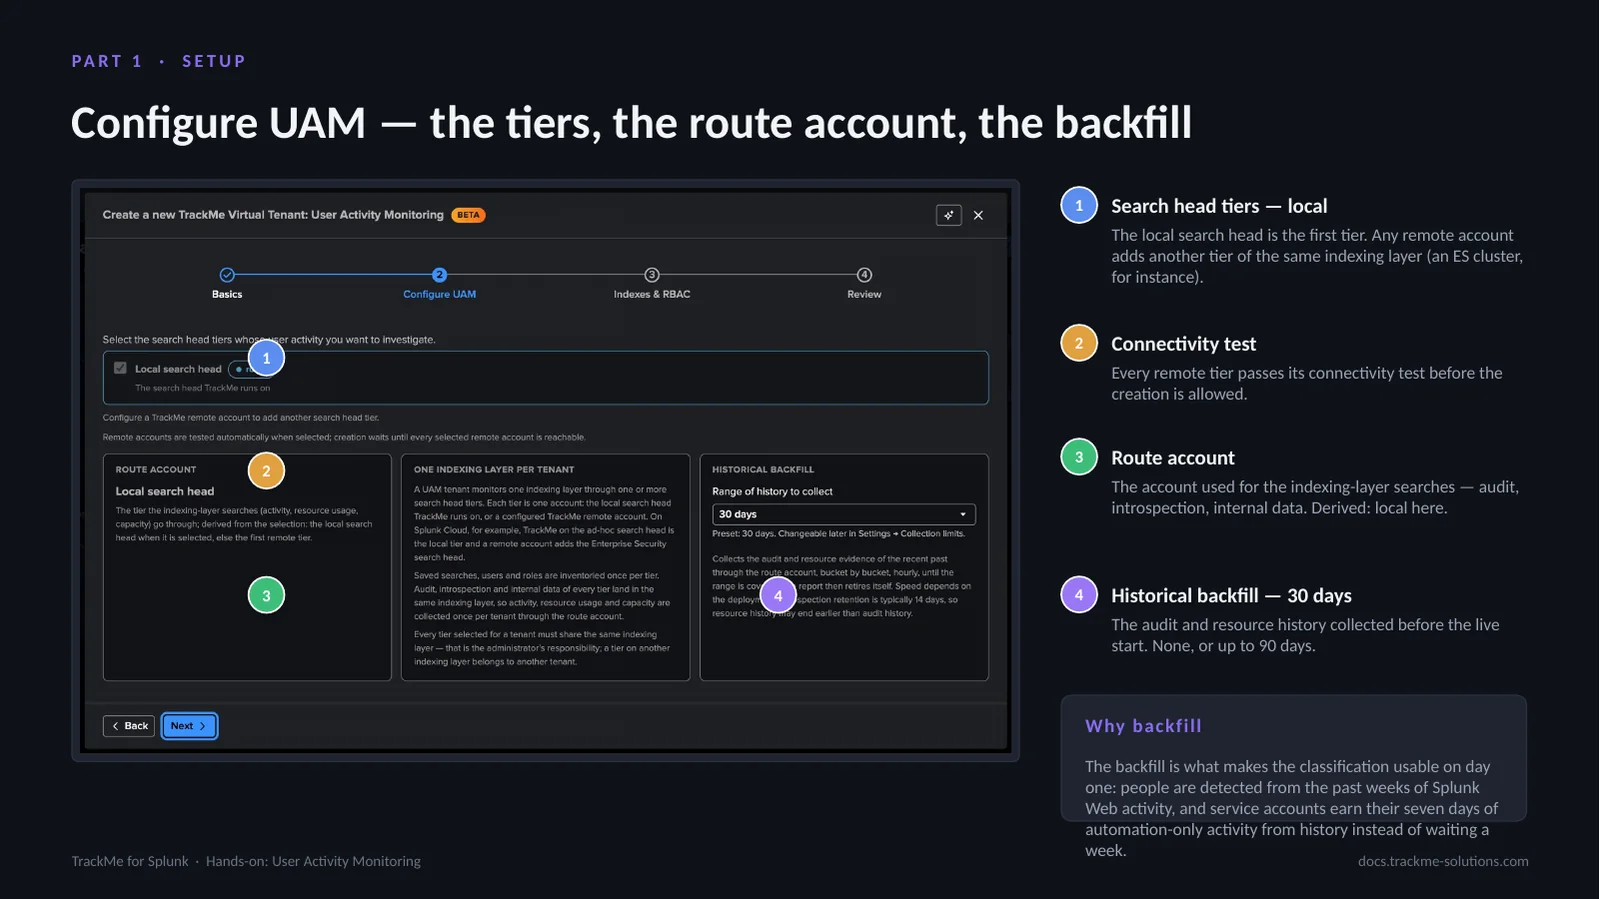
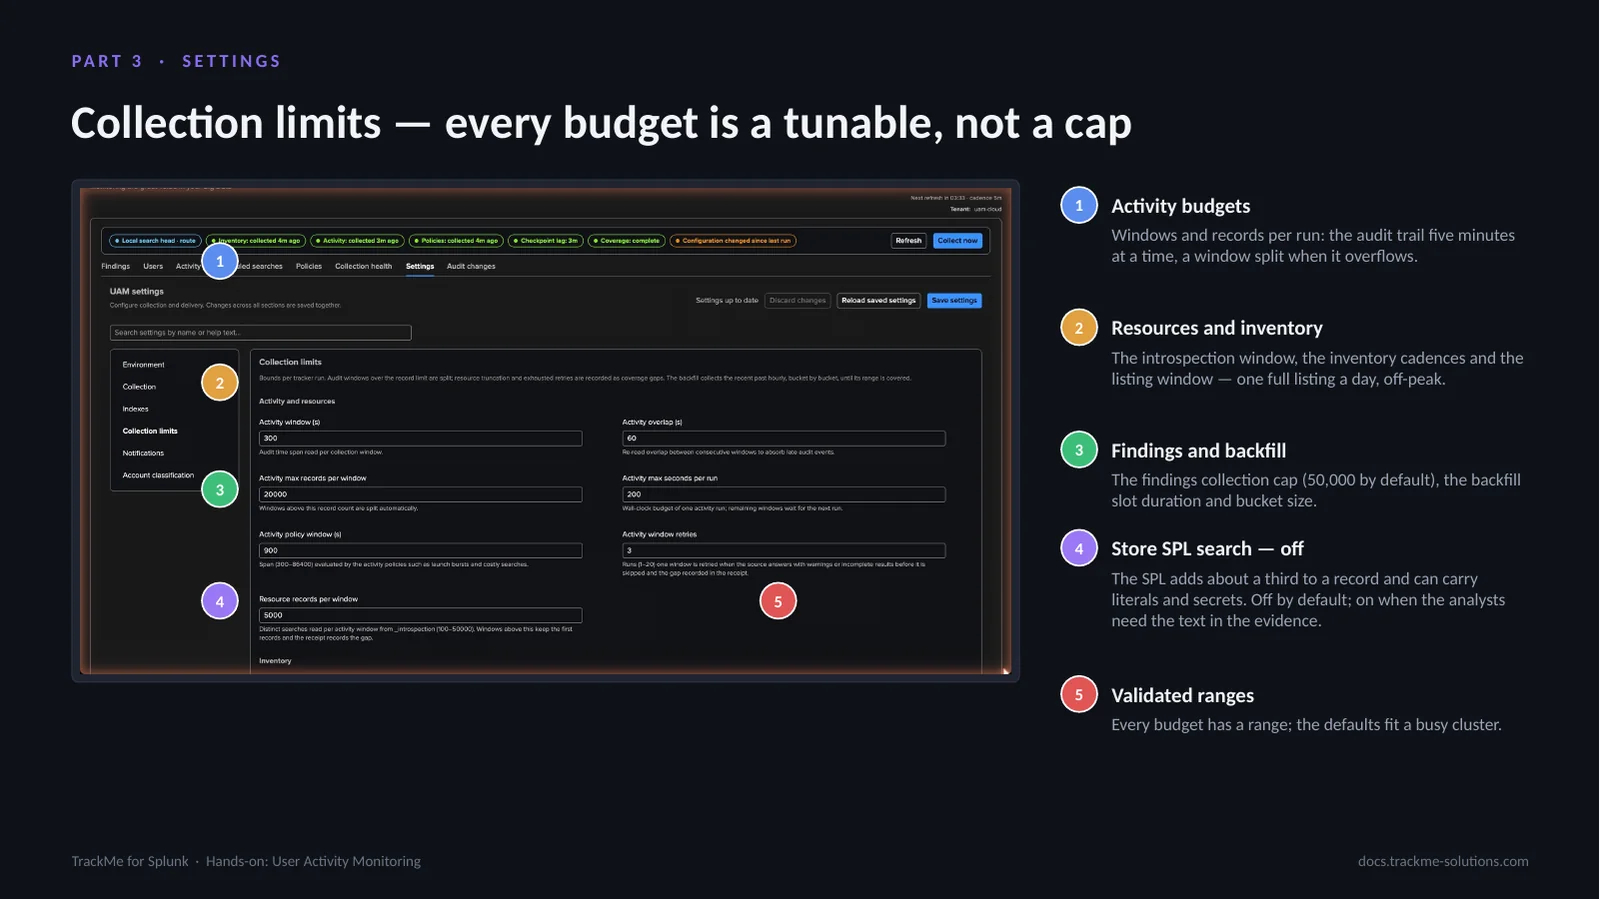
Configure UAM shapes the tenant. Search head tiers lists the local search head plus any TrackMe remote account as another tier of the same indexing layer, up to ten. Every remote tier is tested when selected (here prd5, reachable), and creation waits until each one answers. The route account is the tier through which the indexing-layer searches run (audit, introspection, capacity), once for the whole tenant.
The historical backfill collects none, 7, 14, 30, 60 or 90 days of audit and resource history before the live start; 30 days are chosen here, so that classification and the first findings are meaningful on day one. The optional activity scope restricts the collected search heads by host name patterns.
Status at a glance
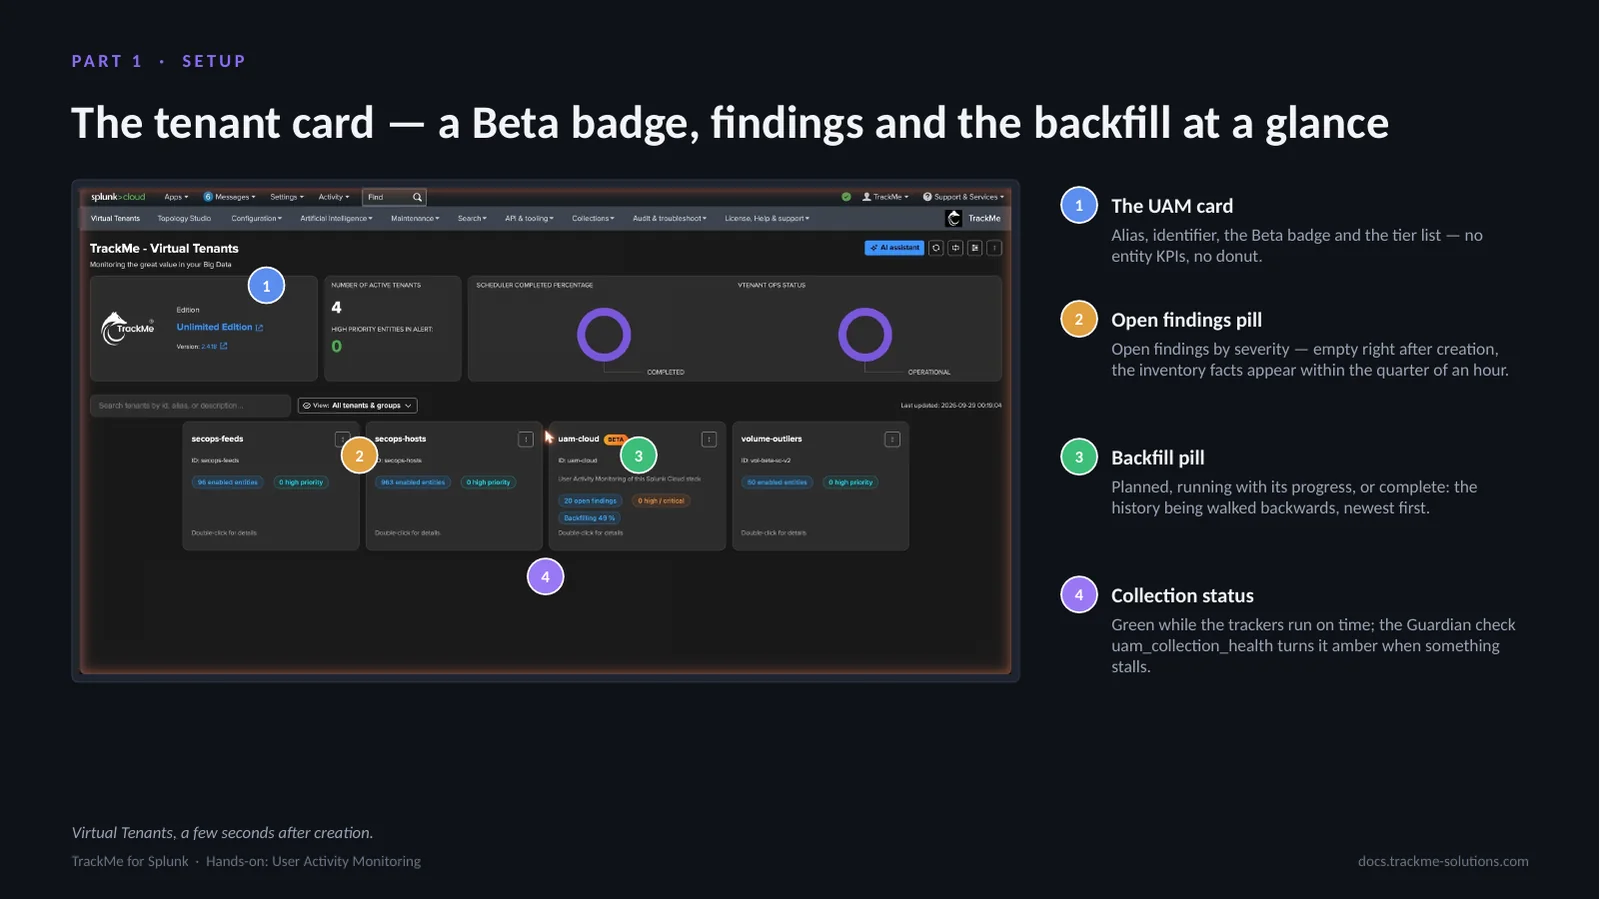
On the Virtual Tenants page, the tenant card shows the open Finding groups and findings (10 groups, 36 findings), the high or critical ones, and the collection status, here the backfill at 16 %. Selecting the card opens the workspace; a double-click opens a read-only overview.
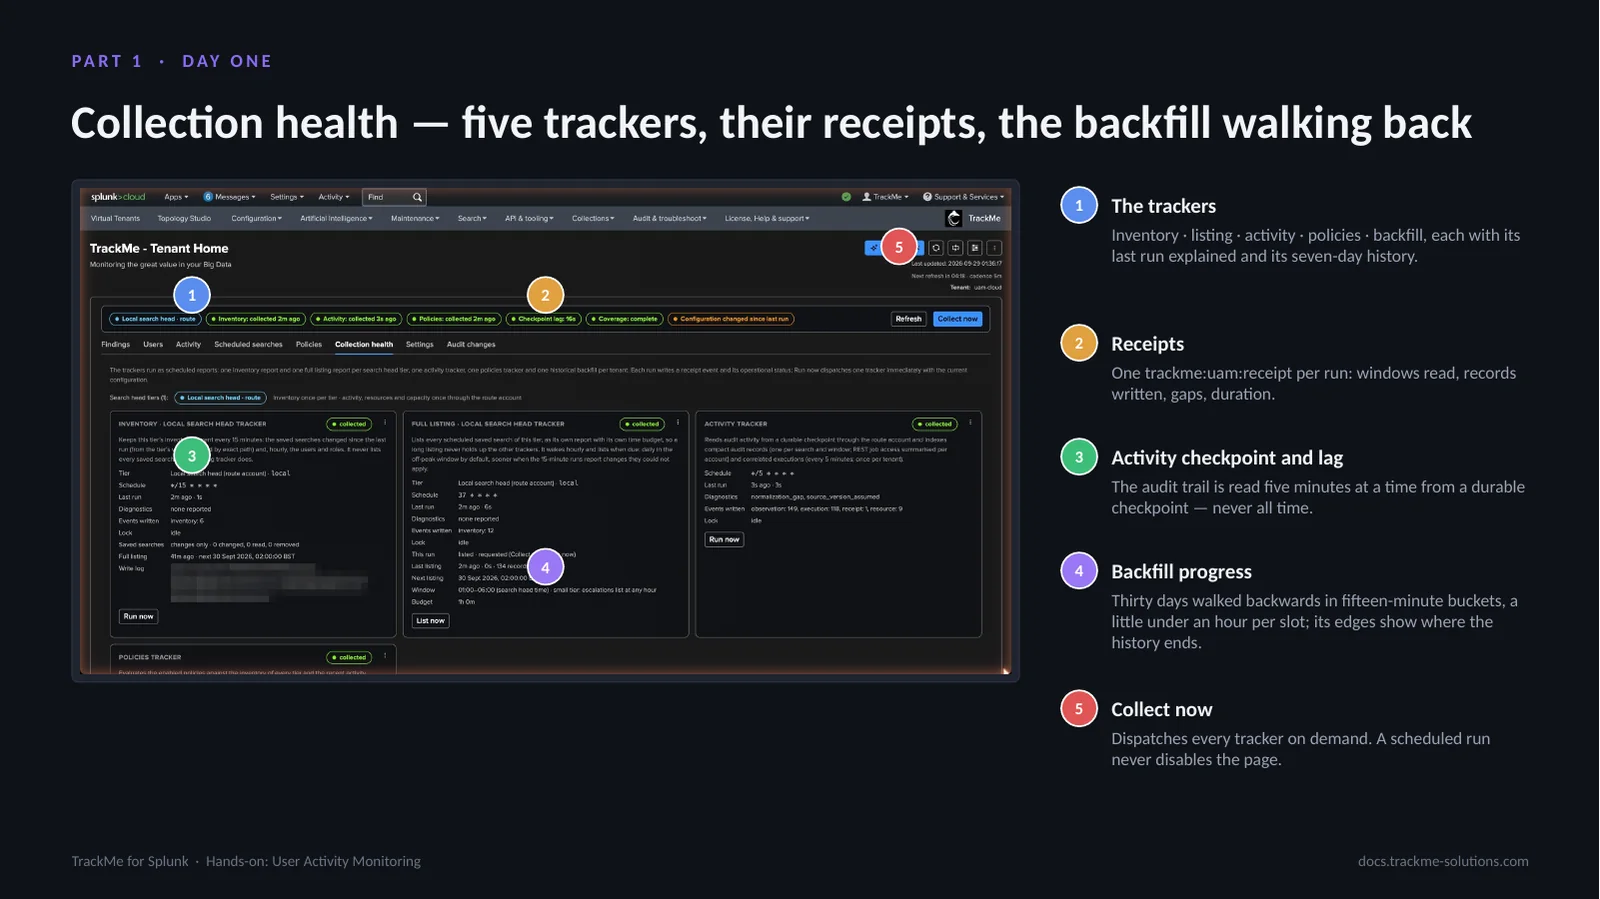
Inside the workspace, the status strip summarises the collection: the tiers (local search head as route, and prd5), the age of the inventory, activity and policies runs, the checkpoint lag, the coverage and the backfill progress. Refresh and Collect now sit on the right; Collect now runs every report on demand.
Day one in Collection health
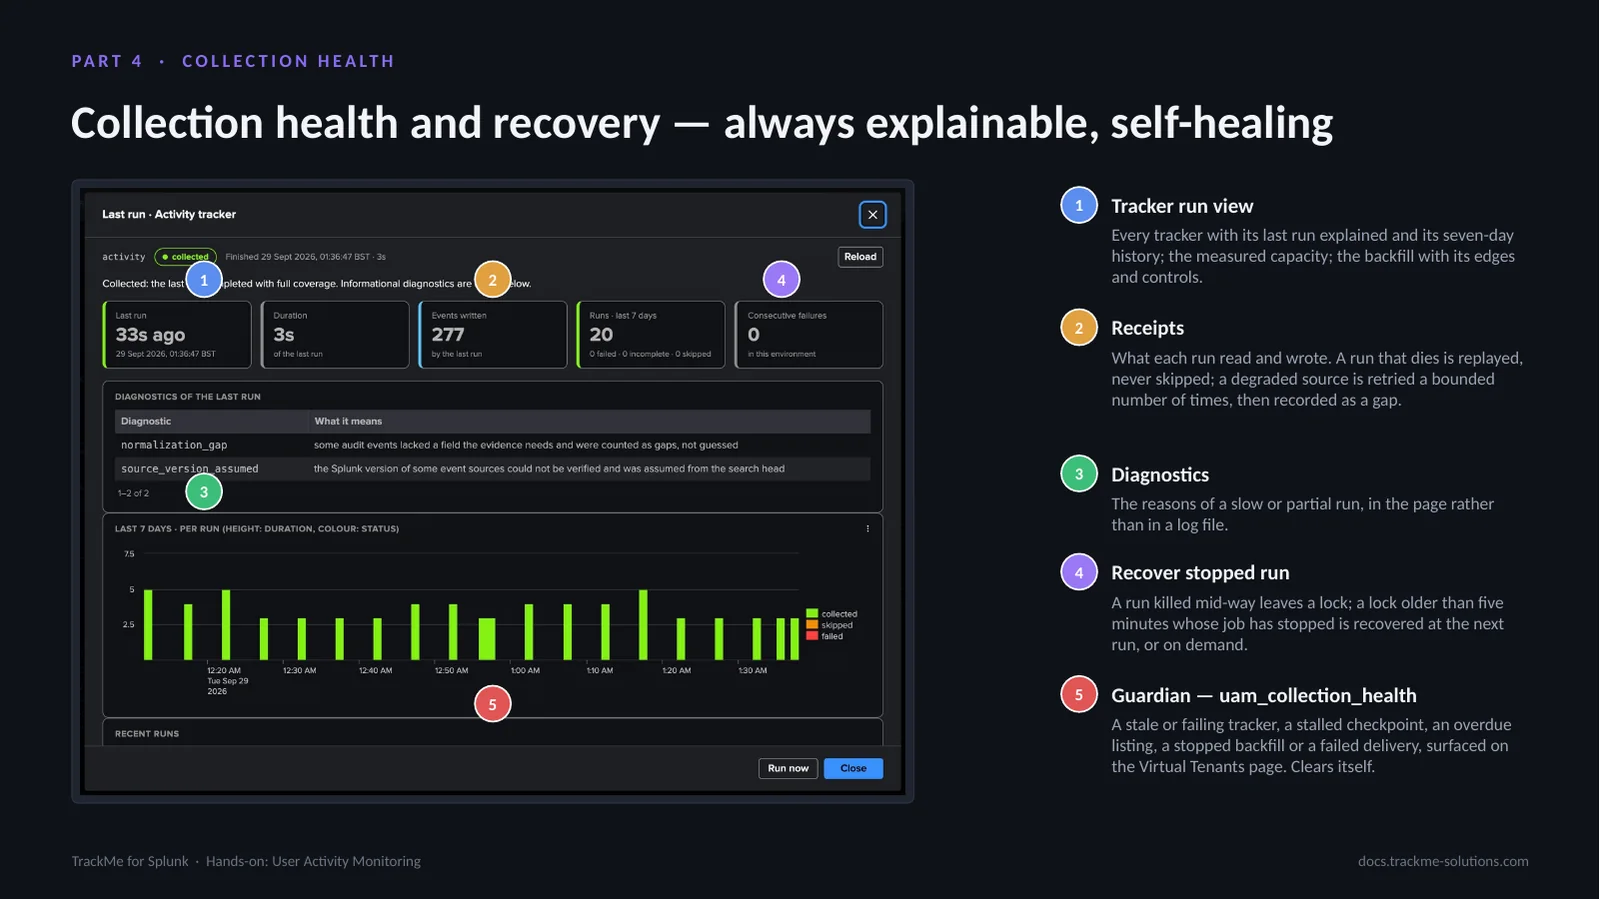
The Collection health overview is a read-only summary of every report. Its verdict reads No collection failures reported, or names the reports that need attention. The tiles show 28 of 28 catalogs published across the two tiers, the reports running now and the activity checkpoint lag. Coverage per tier lists each tier with its oldest published dataset, 14 of 14 on both.
One panel each covers activity and resources (collected 51 seconds earlier, coverage complete for the last run), the default policies and the historical backfill, which runs separately from the live activity checkpoint. The topic tabs (Inventory, Knowledge objects, Activity & resources, Policies, Historical backfill, Capacity & indexes) hold the details and the controls.
Knowledge objects from the REST API
In 2.4.19 the inventory reads only the Splunk REST API. Every tier has one catalog report per knowledge-object family: automatic lookups, calculated fields, dashboards, event types, field aliases, field extractions, transforms, lookup definitions and files, macros and tags. The local search head and prd5 are collected independently, and each report is published on its own, so one slow family never blocks the others.
Each row shows the last run, duration and diagnostics; Run now dispatches a report. Users and roles and CSV lookup files are collected every 15 minutes, the other families hourly, and the full saved-search listing once a day. These catalogs feed the account view, the Search knowledge objects dialog and the CSV lookup footprint policy.
Part 2 — Read and group
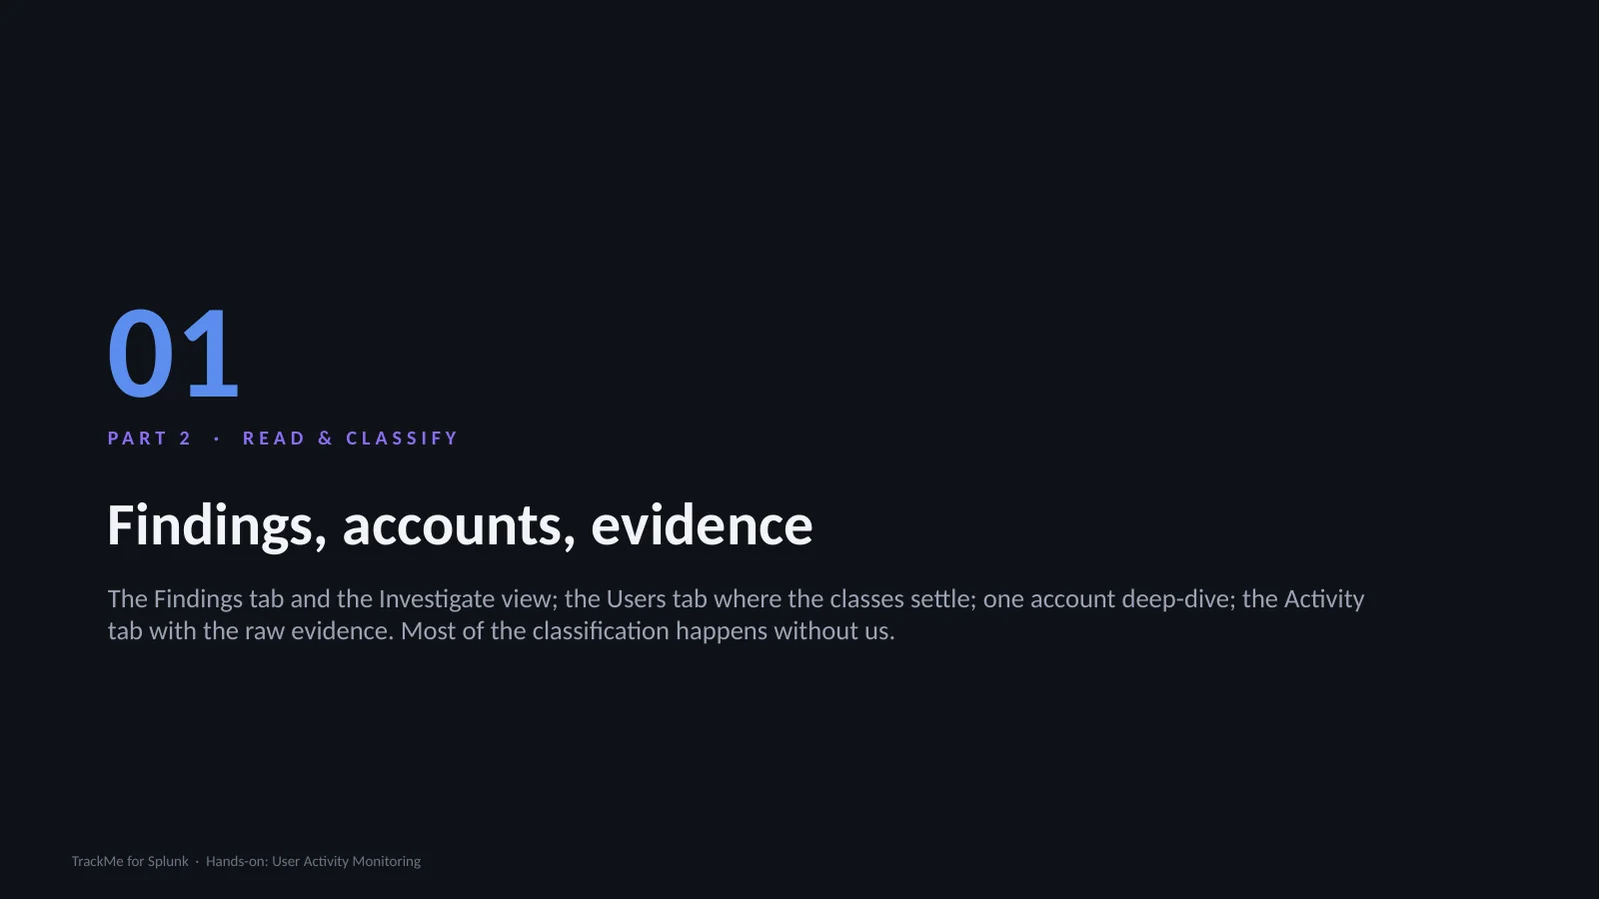
The second part is about reading what the tenant found: the Findings tab and its Finding groups, the investigation with its evidence and the triage of the group, then the accounts, their classes, their activity and the knowledge objects they own.
Findings about the same account and the saved searches it owns form one Finding group, decided on together.
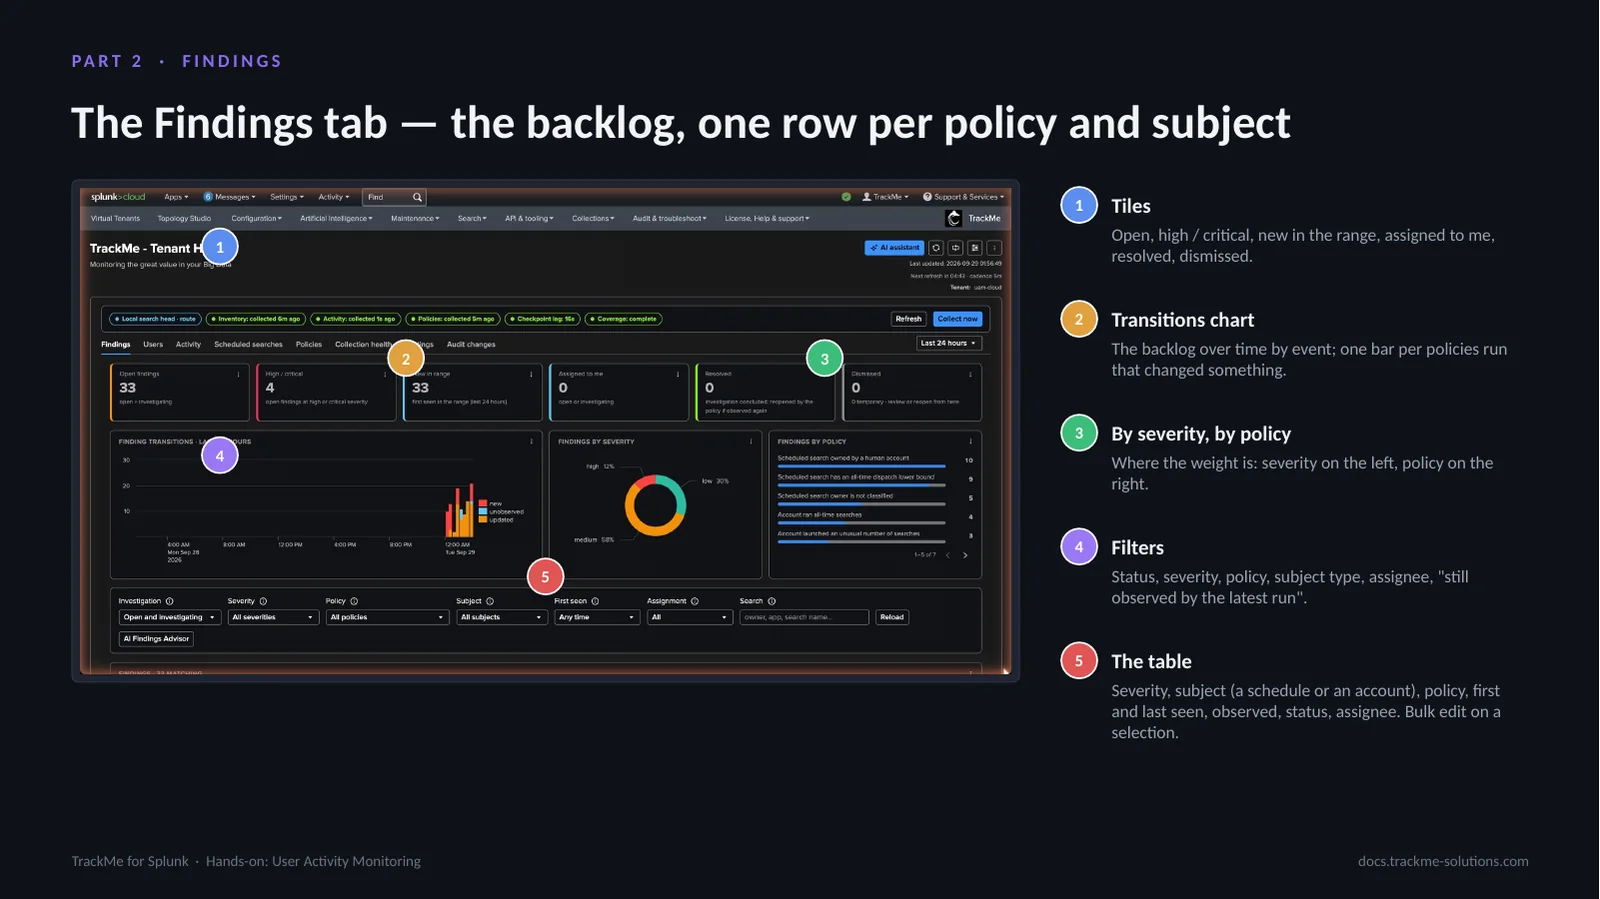
The findings backlog
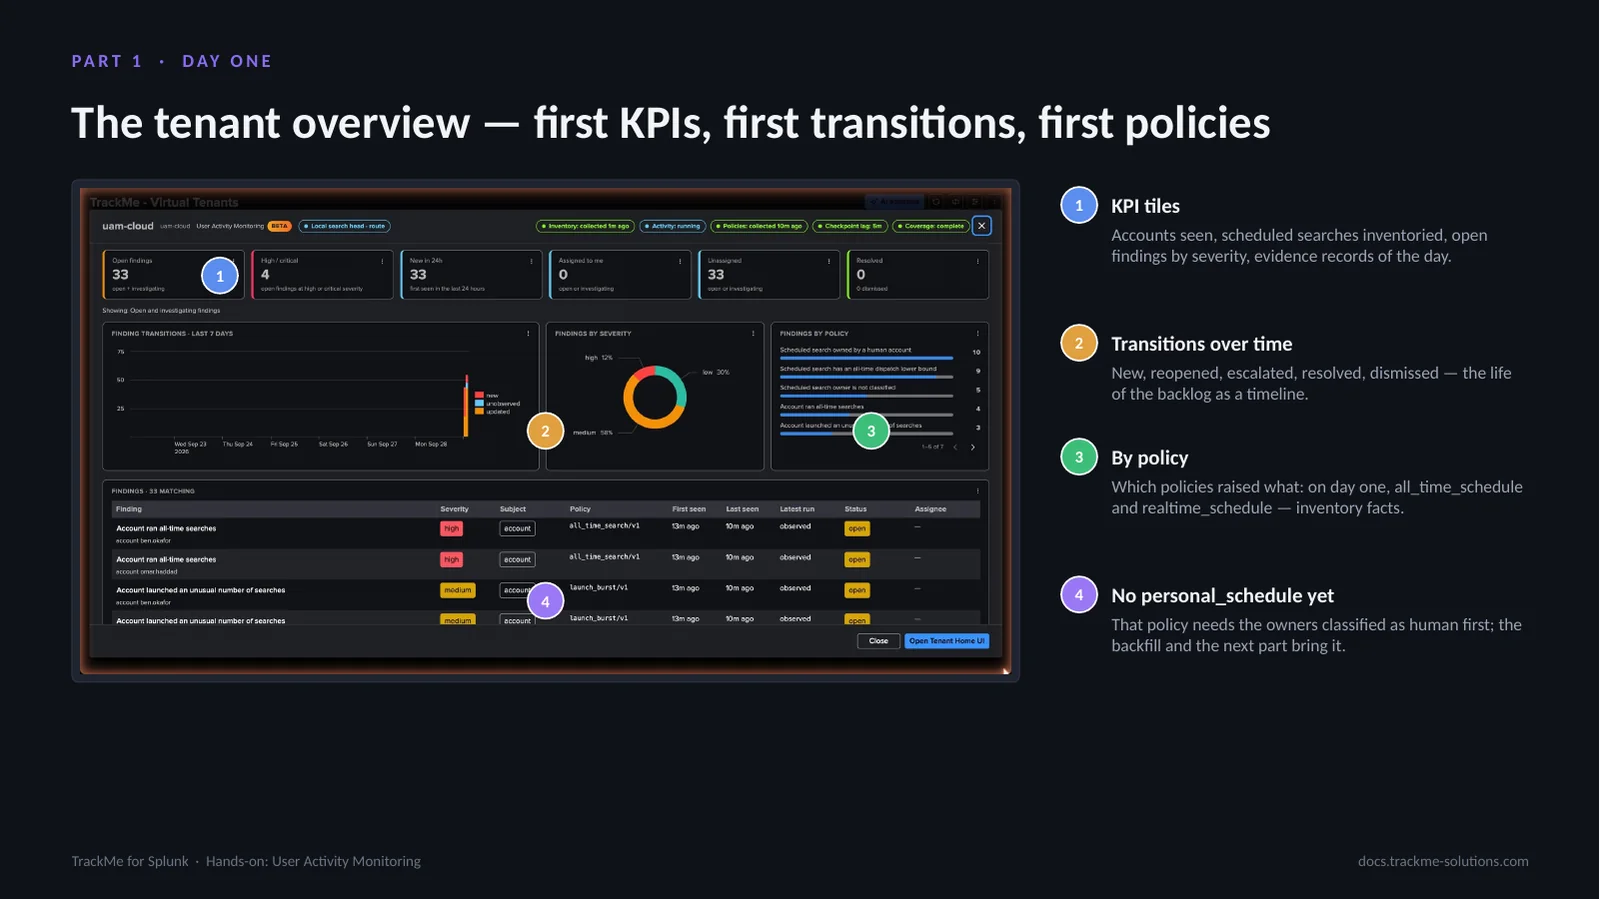
The Findings tab is the backlog. The tiles count Finding groups: here 9 open groups holding 12 findings, 7 of them high or critical, with the groups new in the range, assigned to the current user, resolved and dismissed. Finding transitions charts the reobserved, unobserved and updated findings over the last 24 hours.
By severity shows where the weight is across low, medium and high. By policy shows which policies raised what: accounts that ran all-time searches, scheduled searches owned by a human account and repeated resource-intensive searches. Below the charts come the filters and one row per Finding group.
One decision per account
All findings about the same account and the saved searches it owns automatically form one Finding group. Each row is a group, for example account: tom.hendricks with 4 findings; the group carries the status, the assignee and the severity, and expands to its members, each with its policy and its own evidence.
The condition column says whether the latest complete evaluation still observes the condition; a finding that is no longer observed stays listed until a person resolves it. The jane.doe group combines an all-time search no longer observed, a custom policy and the CSV lookup footprint. Selecting rows merges them into a manual group; an object’s findings always move together.
The investigation view
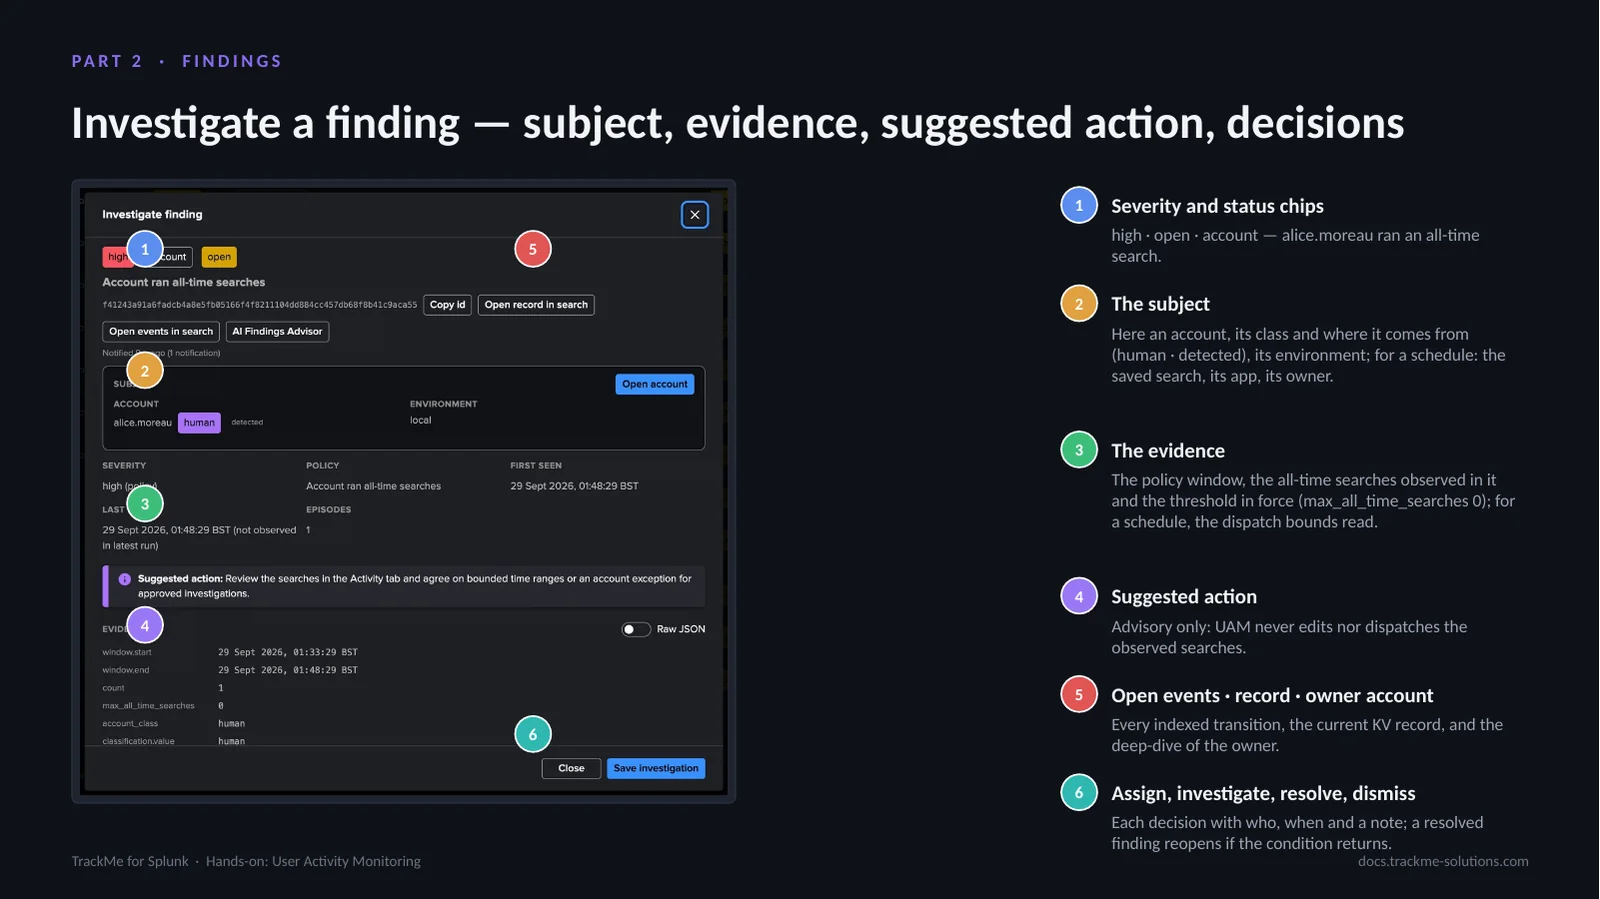
Investigate opens the whole case. The header names the Finding group, account: jane.doe with 3 findings, with its severity, status, observed count and assignee. Findings in this group lists each member with its severity and whether it is still observed; selecting one shows it below.
For the CSV lookup footprint finding, the subject section shows the account, its class (human, detected), its tier and environment, with Open account view. What happened gives the severity, the policy, the first and last seen times and the episodes. The suggested action is advisory: UAM never deletes a file nor changes the replication. Copy id, Open record in search, Open events in search and Ask the AI Agent complete the view.
Evidence and triage of the group
The CSV lookup footprint policy is new in 2.4.19. The evidence totals 1,102.29 MiB of CSV lookups attributed to jane.doe against a 500 MiB allowance, with a largest file of 662.21 MiB against 100 MiB. Every attributed file is listed: the recorded owner is nobody, and the attribution is probable writer, the account that wrote the file according to the audit evidence. Writer attribution is an audit-based estimate, not proof of authorship; the recorded owner is the fallback.
Below the evidence, the triage applies to the whole Finding group: status, assignee, severity (Members means the highest of its findings) and notification snooze. A finding dismissed on its own keeps its decision.
Every account in one table
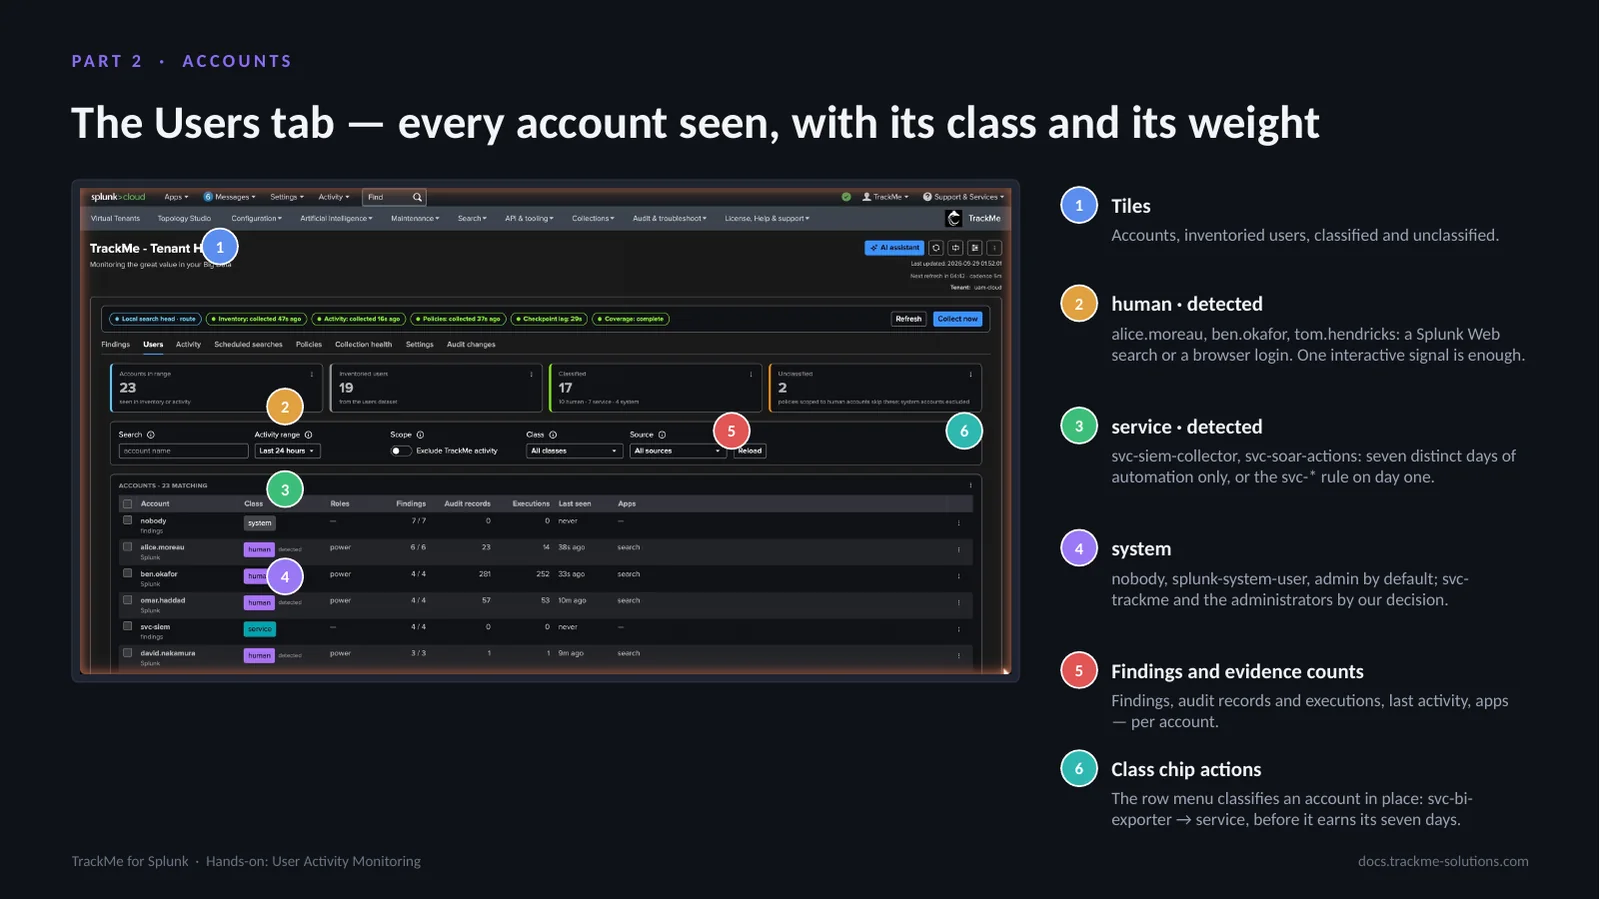
The Users tab is the account-centric view. The tiles count the accounts in range, the inventoried users, the classified accounts (human, service, system) and the unclassified ones. Each row shows the email address, collected from Splunk per tier or set by an administrator as a manual override; that address is where notifications to users and email communications are sent.
The class column shows human (detected from interactive activity), service (by rule or sustained automation) or system. Findings, audit records, executions, last seen and apps complete the row. Search knowledge objects opens a search over every catalogued object across owners and tiers.
Activity and cost of one account
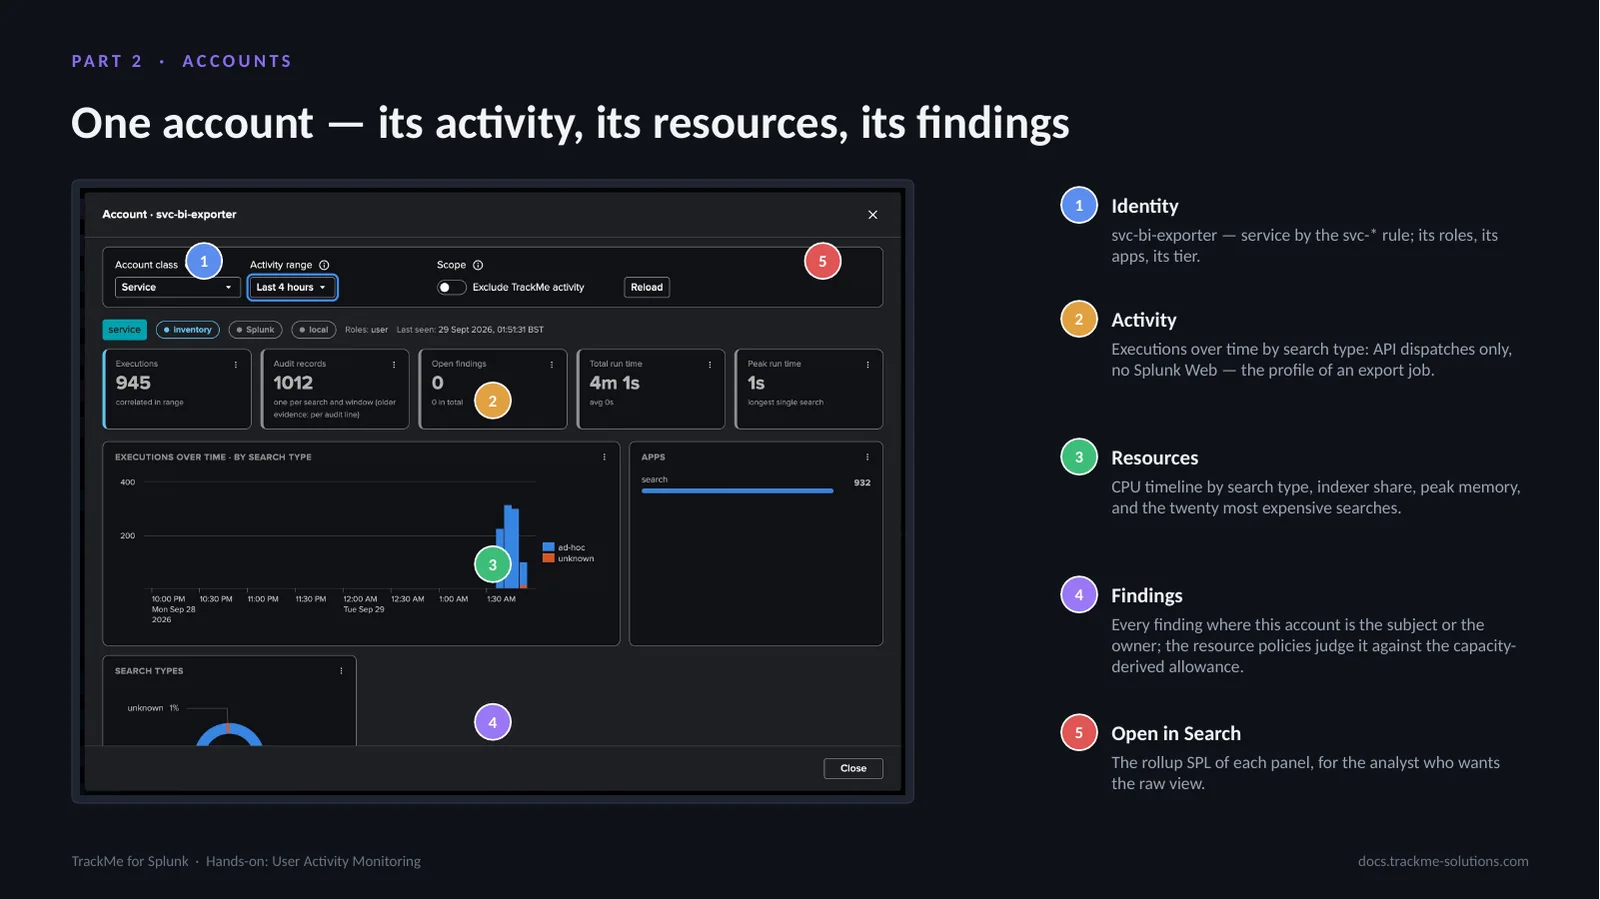
The account view gathers everything about one account, here svc-siem, a service account, over the last 24 hours. The top shows its class, the activity range and the scope, then the tiles: 1,983 executions, 2,481 audit records, one open finding and 2h 11m of run time, with the executions over time by search type and the app it works in.
Further down, the resource usage tells what the account costs: 8m 56s of CPU time, 411 MB peak memory and 0.2% of the environment, with CPU over time and the most expensive searches ranked by CPU time. Searches the resource records could not measure are counted and shown, never estimated. Seven catalog tabs list what the account owns.
What an account owns
The seven catalog tabs of the account view (Saved searches & alerts, Dashboards, Macros, Event types, Fields, Lookups, Tags) answer the question every offboarding asks: what does this account own? A name or wildcard pattern and a search head tier narrow the list; here three objects are owned by alice.moreau, each with its app, sharing and tier.
Expanding a saved search shows its definition: schedule, dispatch window, alert settings and SPL. The data comes from the latest completed catalog collection, not from a live call, and private objects depend on the permissions of the collection account.
Finding objects across owners
Search knowledge objects runs one search across the catalogued objects of every tier and owner. The name *john* finds the two CSV lookup files behind jane.doe’s footprint finding; the object type, owner, app and search head tier narrow the 12,480 catalogued objects.
Each row shows the owner, app and sharing, here recorded owner nobody, app search, global sharing. For lookup files, the expanded row adds the size and the last modification: 662.21 MiB, modified at 18:21. The files are owned by nobody and were written by jane.doe, which is exactly the case the writer attribution resolves.
The raw audit evidence
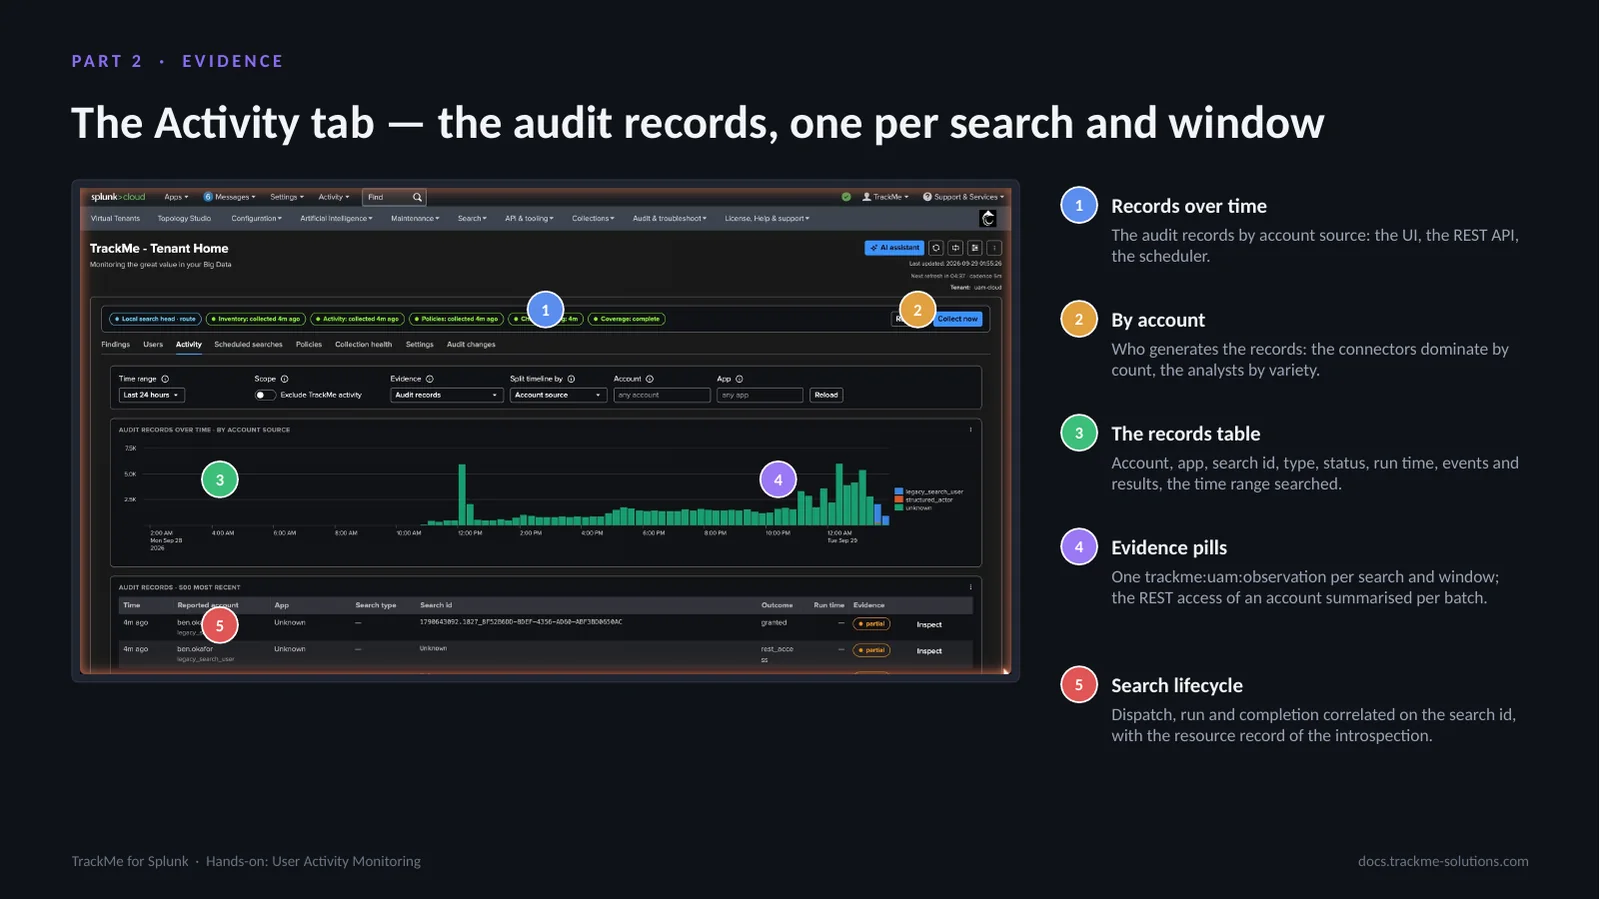
The Activity tab is the raw evidence: one record per search and window rather than one line per audit event. The time range and scope sit on top; Exclude TrackMe activity leaves out the searches run in the trackme app. Evidence switches between the audit records and the executions correlated per search id, and the account and app filters narrow the view, here to alice.moreau.
The chart shows the records over time by account source, with history from the backfill. The table lists the 500 most recent records with search id, outcome, run time and evidence state; Inspect opens a record. This is the material every activity policy is evaluated on.
Account classification
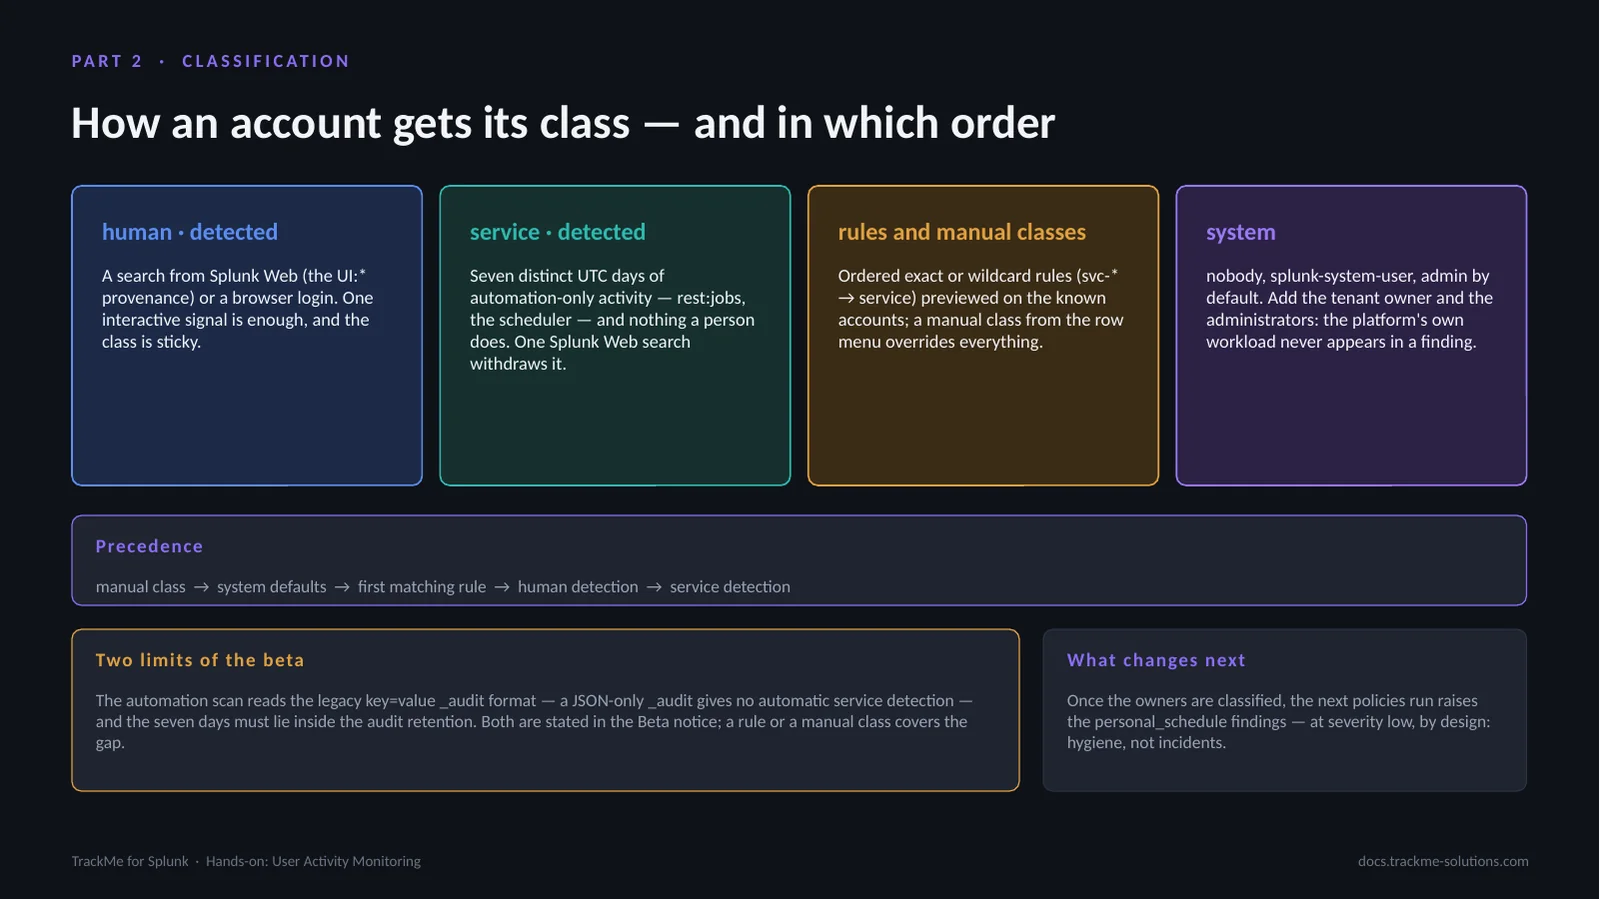
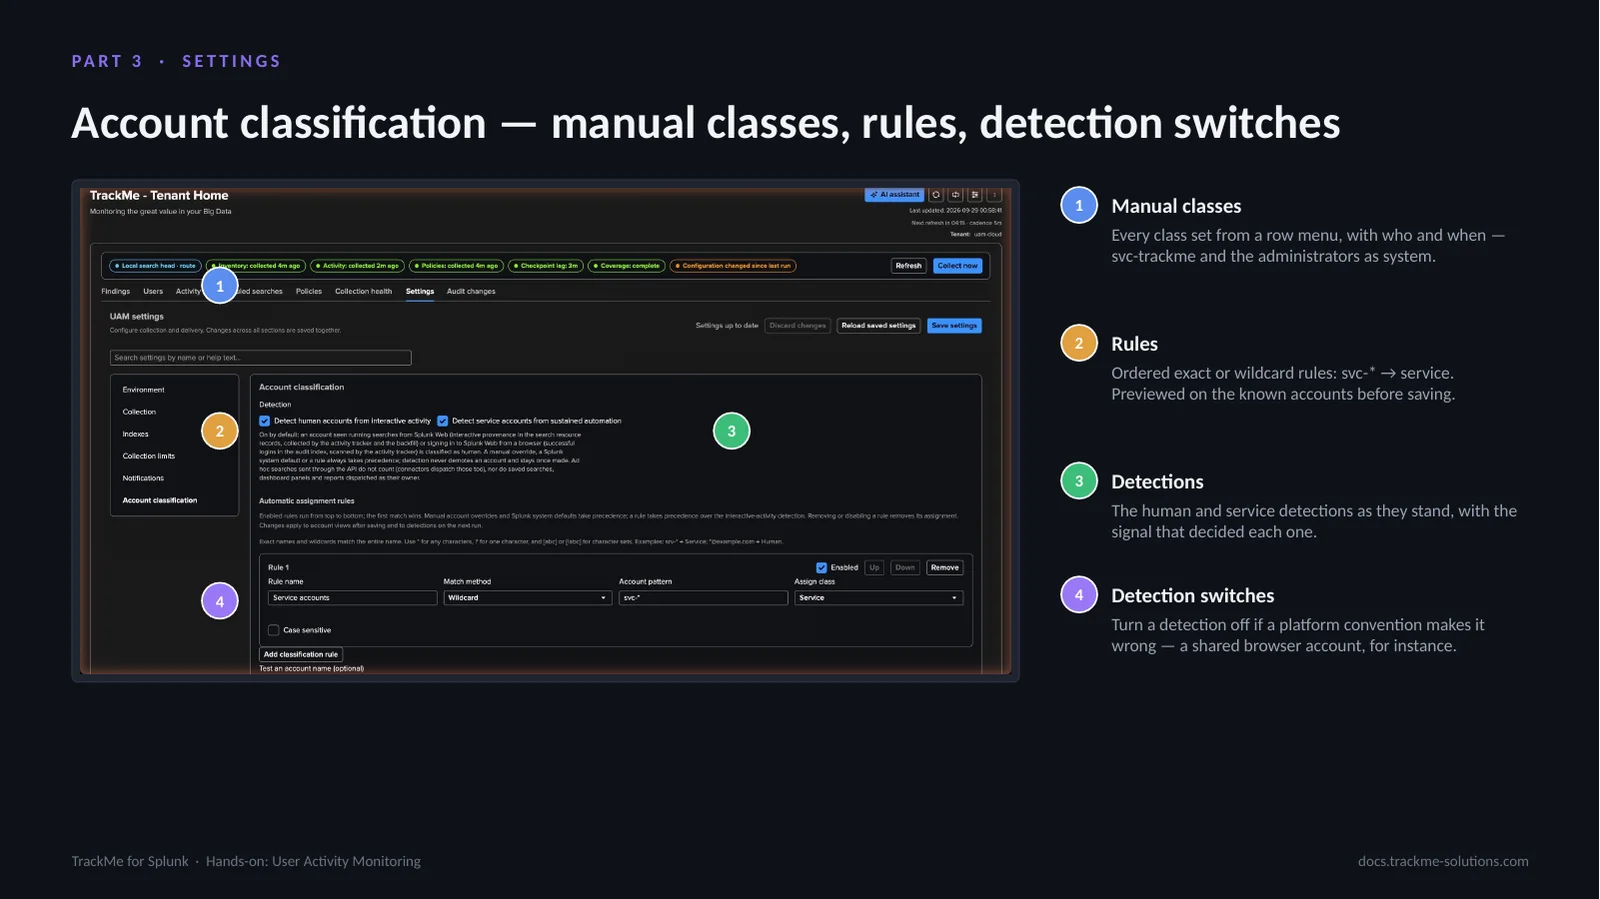
Settings, Account classification decides who each policy looks at: activity policies judge human accounts by default, resource policies classified accounts. Detection classifies an account as human from interactive activity in Splunk Web and as service from sustained automation.
Automatic assignment rules are ordered exact or wildcard rules where the first match wins; the rule svc-* to Service classifies every service account that will ever be created. Preview classifications shows the effect on the known accounts before saving. Manual overrides take precedence over rules and detection, and Automatic removes one. Precedence is always manual class, Splunk system defaults, the first matching rule, then detection.
Part 3 — Communicate
The third part is new in 2.4.19: UAM can talk to the people behind the accounts. It covers the finding and Finding group menus, a reviewed email to the account a finding is about, notifications to users on new detections, and notifications to operators on the transitions of the findings.
A one-off communication is reviewed before it leaves; automatic notifications to users work independently of the operators’ notifications.
The finding and group menus
Two menus carry the decisions. The menu of a single finding offers Send email communication, Investigate, Notes, Dismiss only this finding (the group and its other findings stay as they are), Exclude owner from this policy (which adds the owner to the policy exclusions), Copy finding id, and Open record and events in search.
The Finding group menu offers Send email communication for every finding of the group, Investigate, Notes and Open account view, then the group decisions: mark investigating, resolve, dismiss, assign to me or to an assignment group. Snooze notifications pauses the emails without changing the status.
A reviewed email to the account
Send email communication prepares a private preview of one email for the account concerned. The recipient is resolved from the account override or the inventoried addresses and can be changed for this email only. From a Finding group, every finding is included, here three, a custom policy among them, under the subject [Splunk] 3 user activity findings.
The email carries the common banner and introduction, then each policy with its evidence in plain words, such as 1,102.29 MiB of CSV lookups against 500 MiB. Nothing leaves before Confirm and send email; the email is sent from a search process and never retried blindly. It changes neither the findings nor their notification lifecycle.
Automatic emails to account owners
Notifications to users email each account about its own findings at its inventoried address. Enable user notifications is off by default, and the first enable sets a baseline so that no backlog is sent. Events are New detection and Condition cleared; a closure needs two successful clear evaluations.
A delivery account (a TrackMe email account with its allowed-domain rules, or the local MTA) and a reply-to address send them. Address coverage shows 13 manual overrides; service, unclassified and system accounts are excluded by default. The common template holds the banner, introduction, footer and support link, while each policy has its own subject and body. Limits protect the mailboxes: at most 50 per run and 3 per user per hour.
Emails to the operators
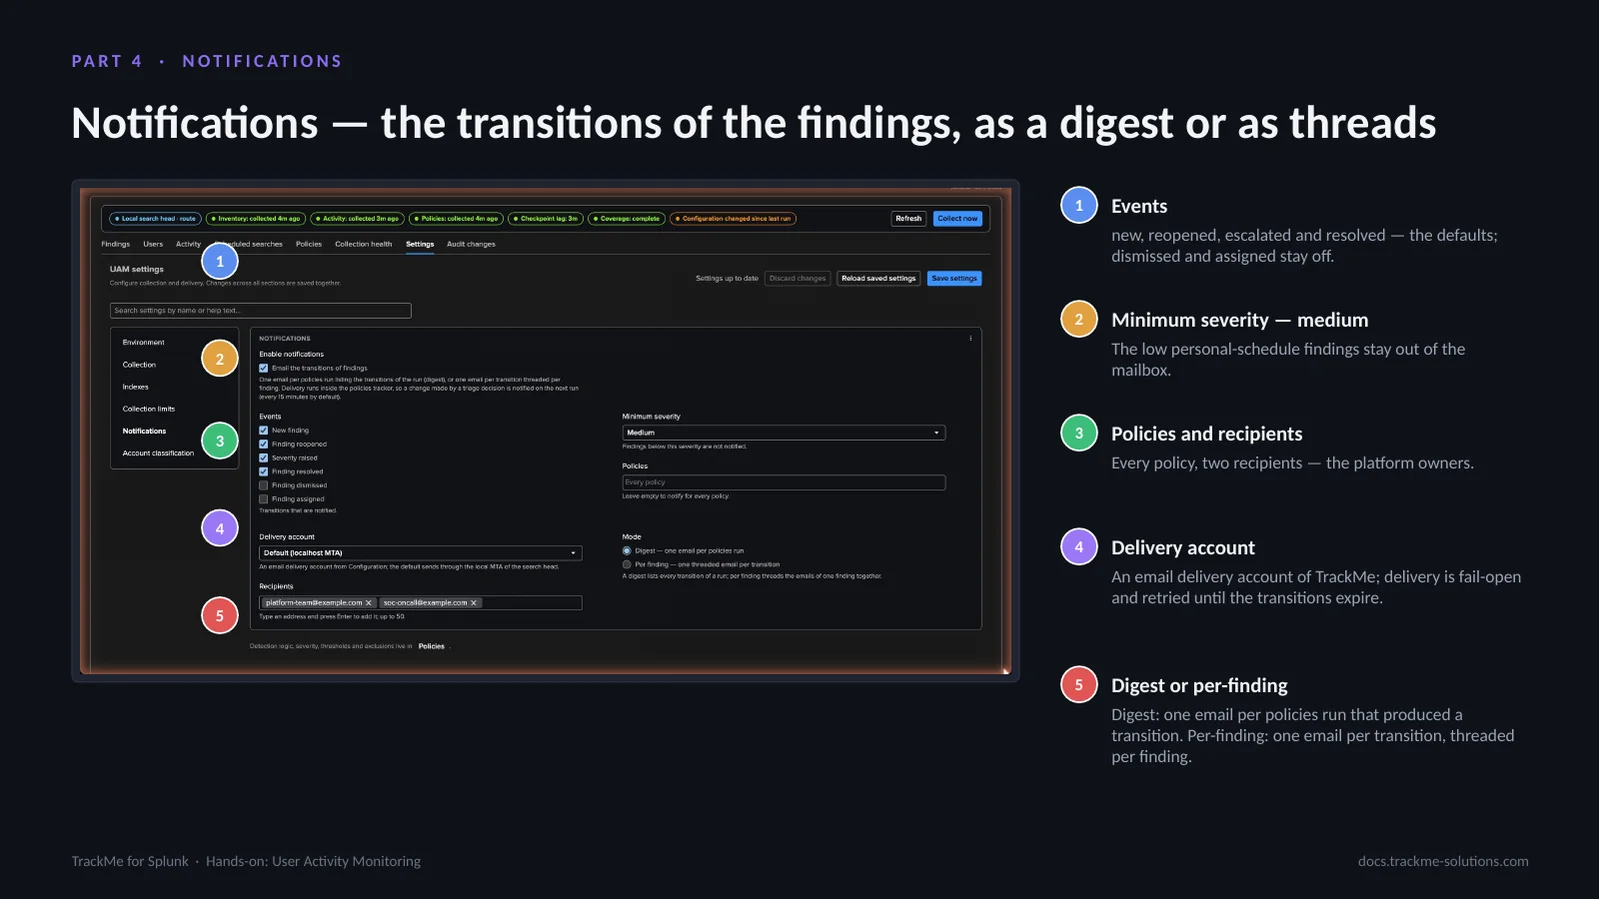
Notifications to operators email the transitions of the findings, behind one switch for the tenant that is off by default. The events are new finding, reopened, severity raised and resolved, with dismissed and assigned optional. A minimum severity (medium by default) and a policy list (every policy by default) narrow them.
A delivery account sends them to up to 50 recipients, and Send test email checks the delivery. The mode is either a digest, one email per policies run, or one threaded email per finding transition. Emails link straight to the finding in its investigation.
Part 4 — Tune and operate
The fourth part covers tuning and operating: the built-in policy catalogue with its insight and email templates, a custom policy written in SPL, previewed and published, the UAM AI Agent, the scheduled searches and the collection health.
The catalogue ships with defaults that fit a busy platform; a rule that is not in it can be written as a custom policy.
The policy catalogue
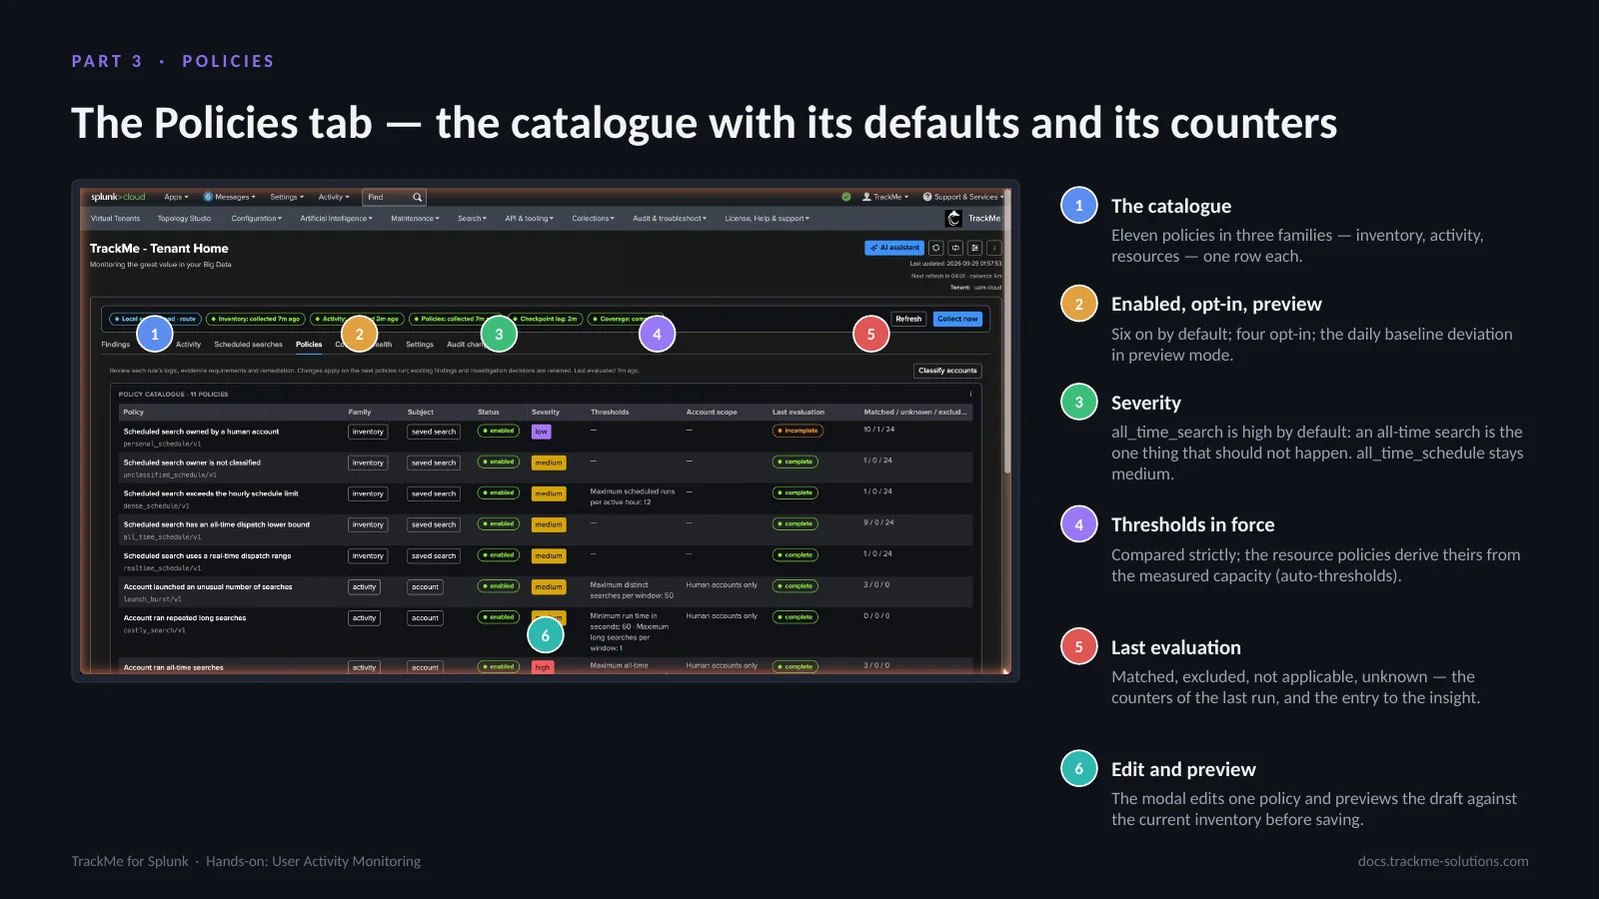
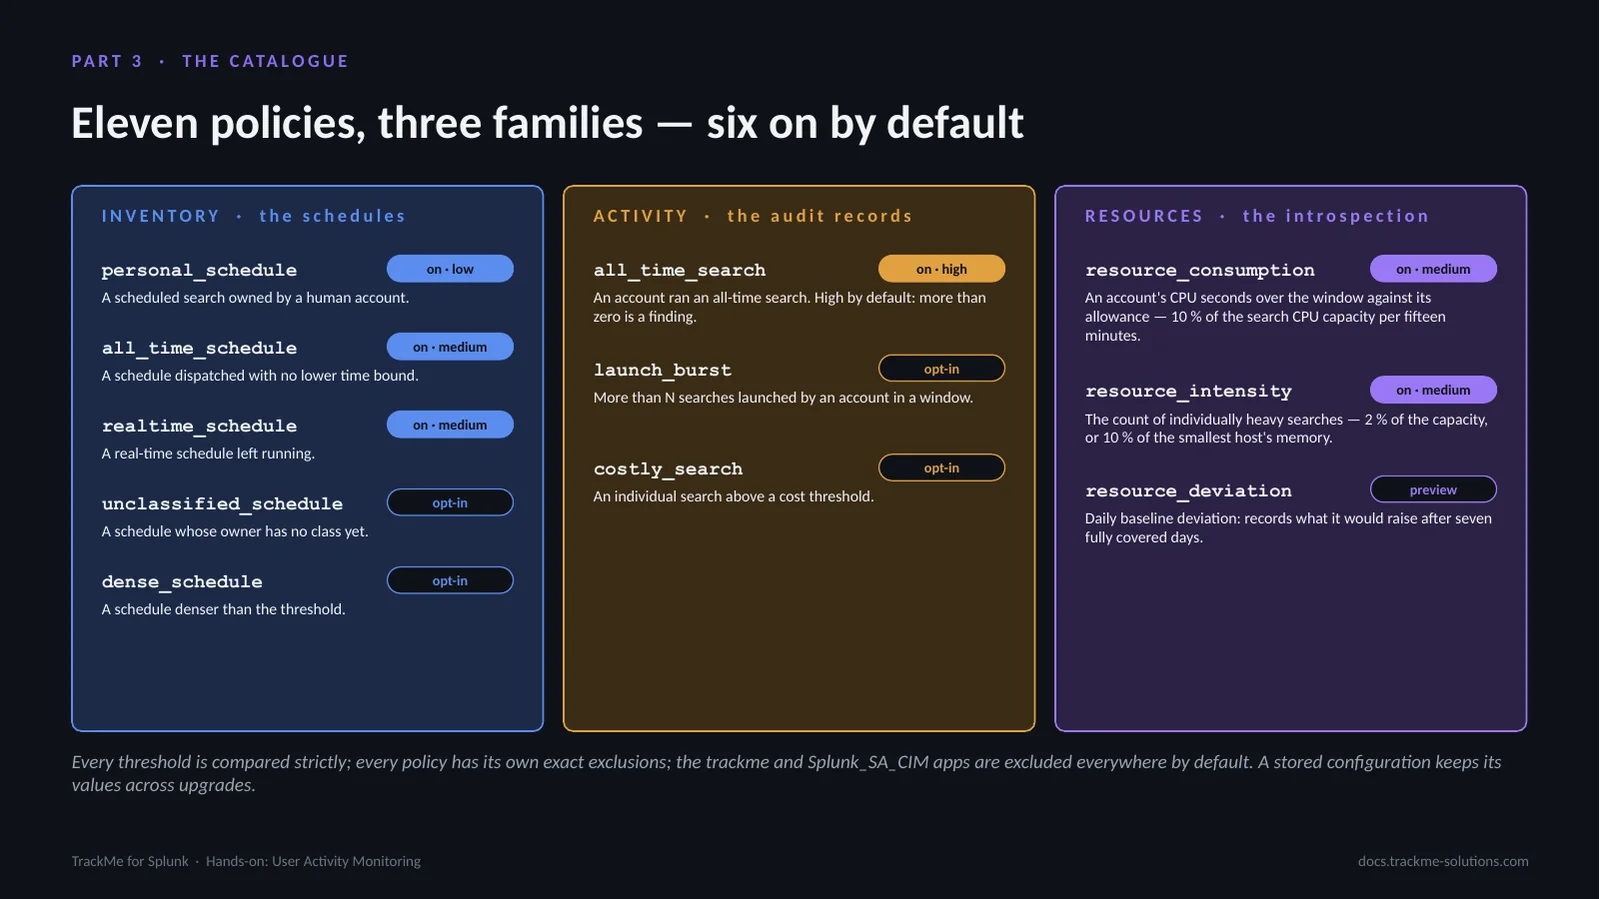
The Policies tab lists the custom policies of the tenant first, then the twelve built-in policies, seven of them on by default, as cards, compact cards or a list. The families are inventory (schedules and CSV lookups), activity (audit records) and resource (CPU and memory).
Each row shows the status and severity (Account ran all-time searches is high by default, personal schedules low), the settings in force (thresholds, automatic budgets from the measured capacity, the account scope), the last evaluation (complete, incomplete or learning) and the matched, unknown and excluded counters; Edit opens the policy. Resource policies learn for 24 hours before they judge anyone, and a policy never resolves a finding.
Explaining one evaluation
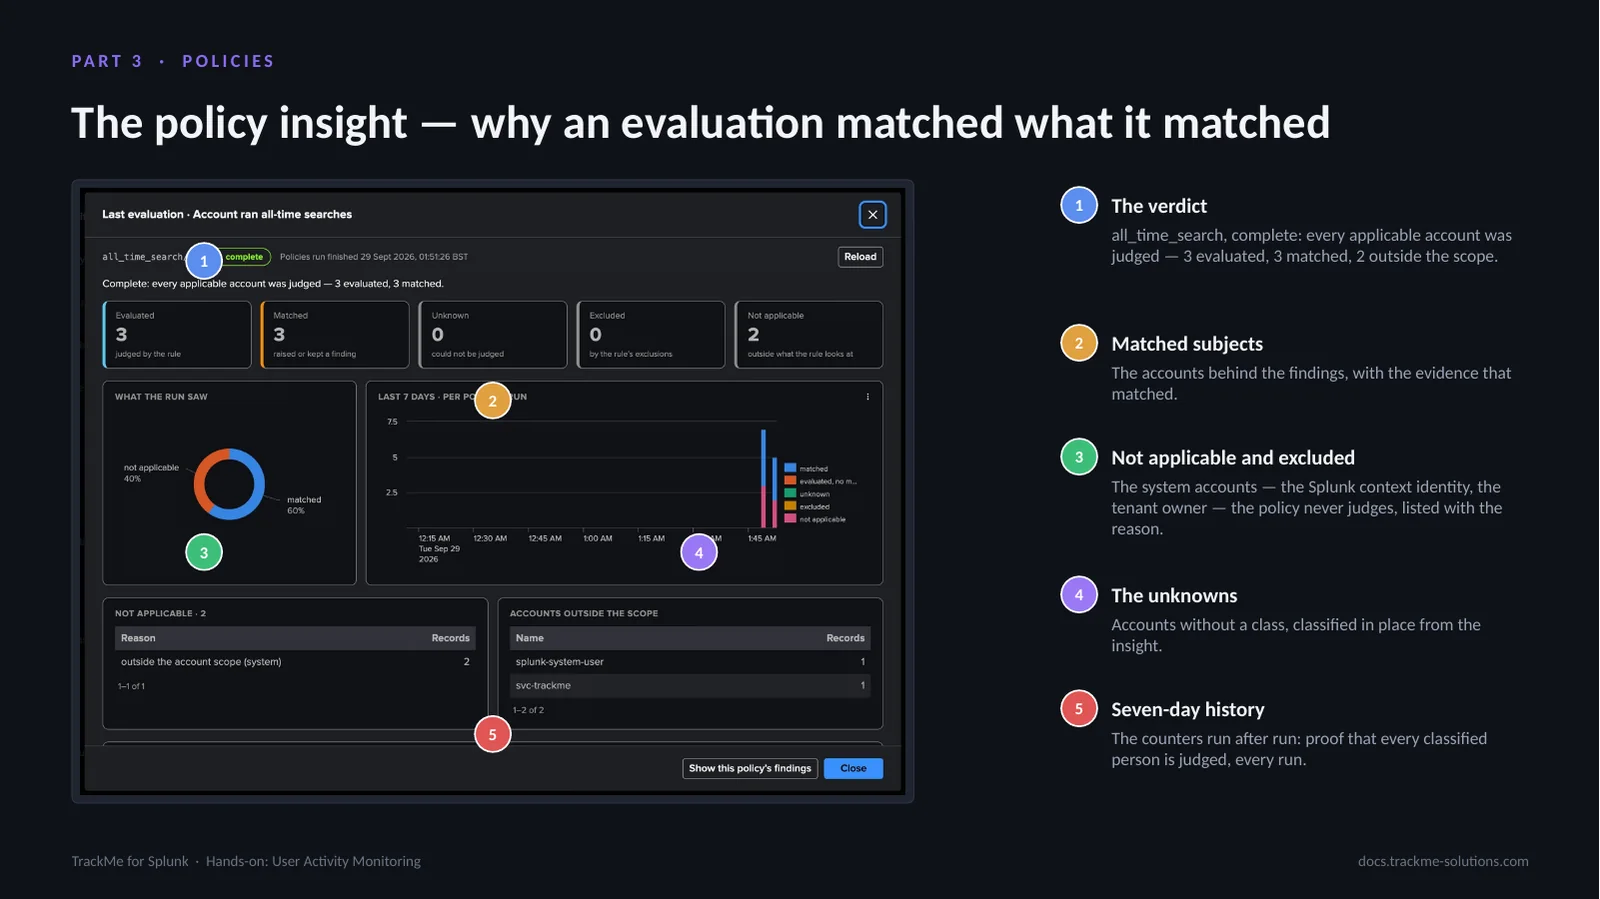
The policy insight opens from the Last evaluation pill. For Account ran all-time searches the verdict reads Complete: every applicable account was judged, 3 evaluated and 3 matched. The counters show evaluated, matched, unknown, excluded and not applicable.
What the run saw splits the population by outcome, and the last 7 days chart repeats the counters for every policies run since 6 October. Activity left out lists the excluded apps, here trackme, whose searches never count against the rule. Show this policy’s findings jumps to the findings the policy raised.
Policy email templates
The edit modal of a policy has four tabs: General settings, Email template, Actions and Automations. Email template holds the words sent to the account. Notify users for this policy is on for every built-in policy except the unclassified schedule.
Each email event (New detection or Condition cleared) has its own subject and body, in plain text with placeholders such as account, policy, search, app, environment, summary, action and window. Restore policy default reverts the text, and Preview email renders it with sample data under the common banner and introduction; a test recipient receives a synthetic test email.
Writing a custom policy
When the catalogue lacks a rule, a custom policy adds it: an SPL search plus a mapping of its results to findings. This one, Account searched every index, flags accounts that searched index=* in the last 24 hours. The remediation text is shown with every finding. The search source is the route for account policies, while saved-search policies may use any tier, and the app context resolves the macros and lookups of the search.
Below the SPL, the policy defines its window, a cron, and the mapping of the results to findings: subject type (account or saved search), identity, dimensions, evidence, count and time fields. A tenant holds up to 100 definitions and 25 enabled policies.
Preview, publish and enable
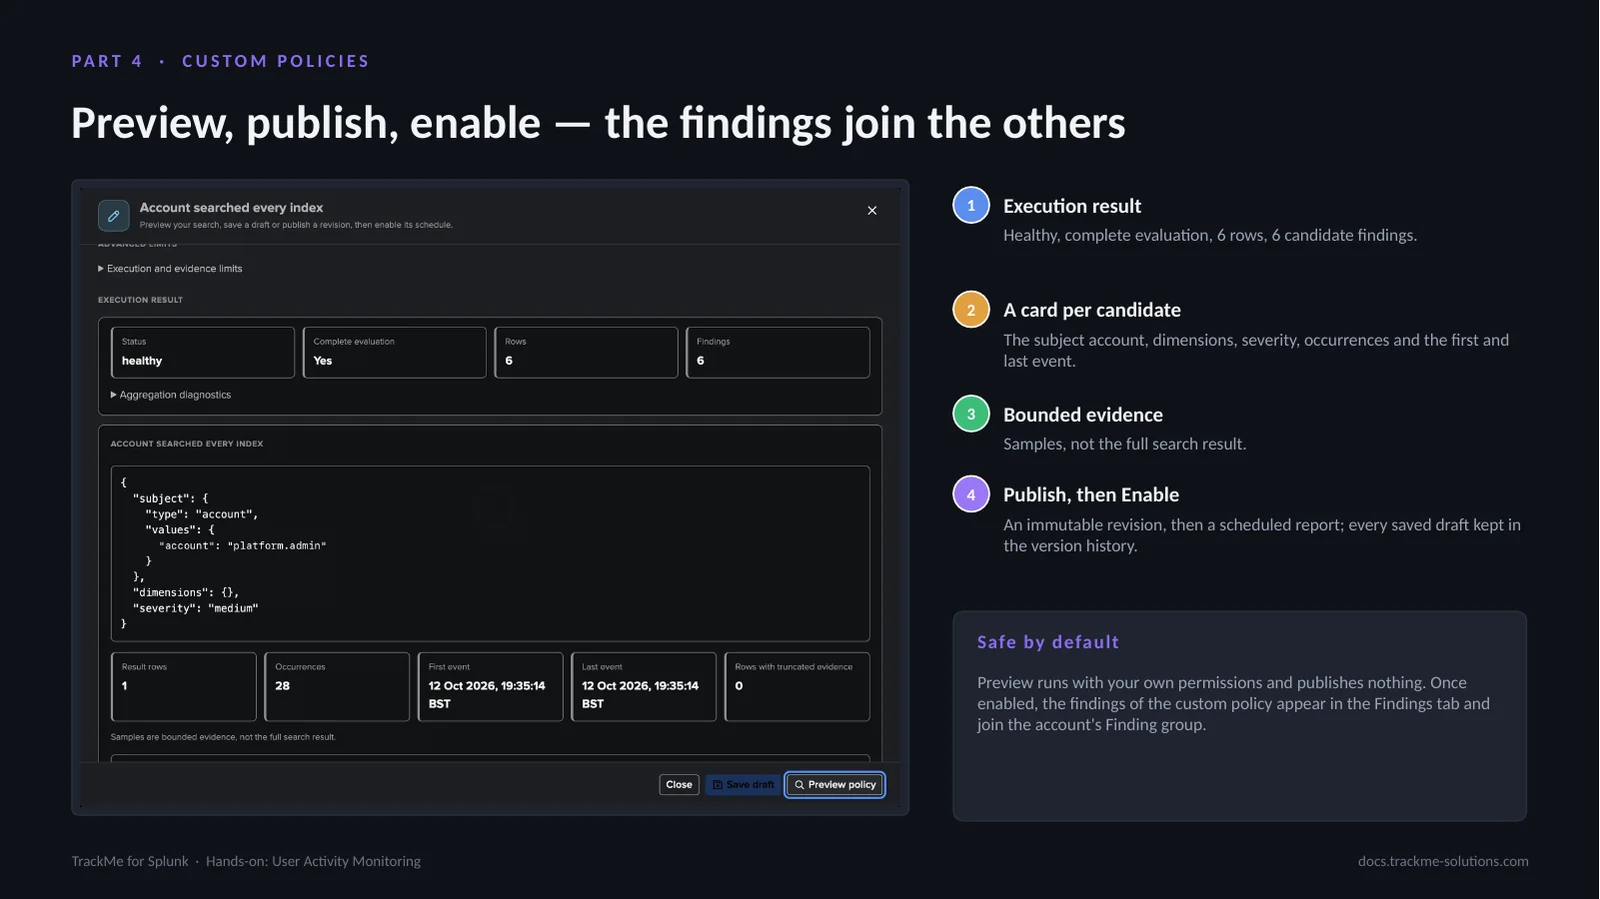
Preview runs the search as the author, asynchronously, and publishes nothing. The execution result reads healthy, complete evaluation, 6 rows and 6 candidate findings. Each candidate is a card with its subject, dimensions, severity, occurrences and first and last event; the evidence is a bounded sample, not the full search result.
Publish freezes an immutable revision, and Enable installs its scheduled report; every saved draft stays in the version history. Once enabled, the findings of the custom policy appear in the Findings tab and join the Finding groups of the accounts concerned, next to the built-in policies.
Assessments and the decision log
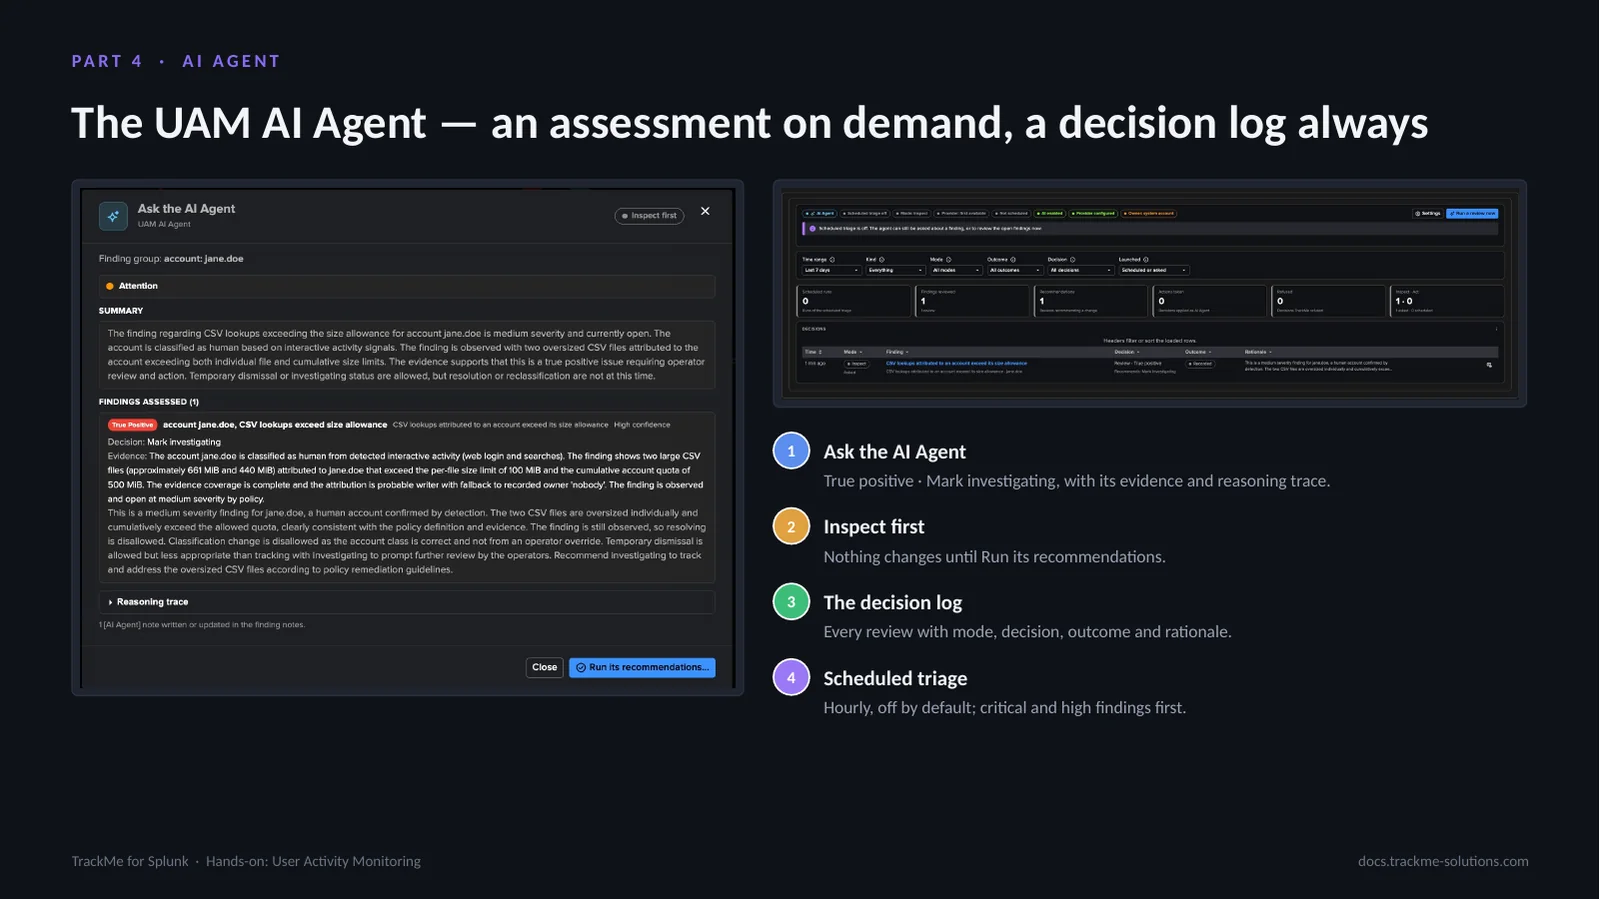
Ask the AI Agent on a finding reads the evidence of the Finding group and returns an assessment, here a true positive of medium severity with its evidence and reasoning trace, and recommends a decision, Mark investigating. In inspect mode nothing changes until Run its recommendations is selected.
The AI Agent tab logs every review, asked or scheduled, with its mode, decision, outcome and rationale. Scheduled triage runs hourly and is off by default, critical and high findings first; in act mode it applies only the decisions the tenant allows and never overrides an operator decision.
The scheduled-search inventory
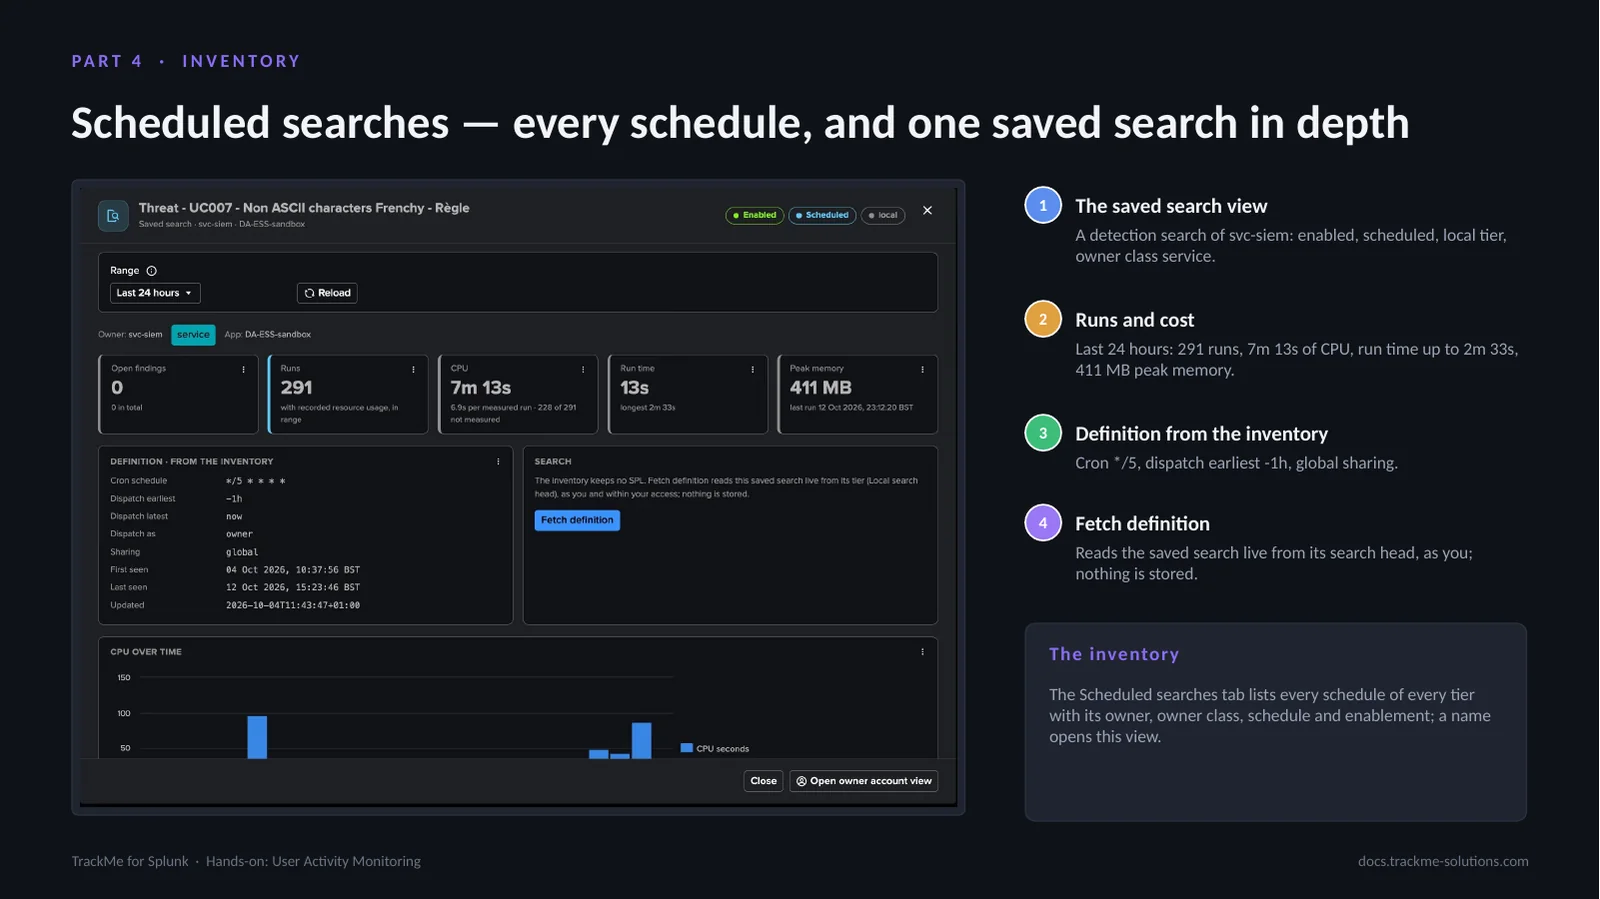
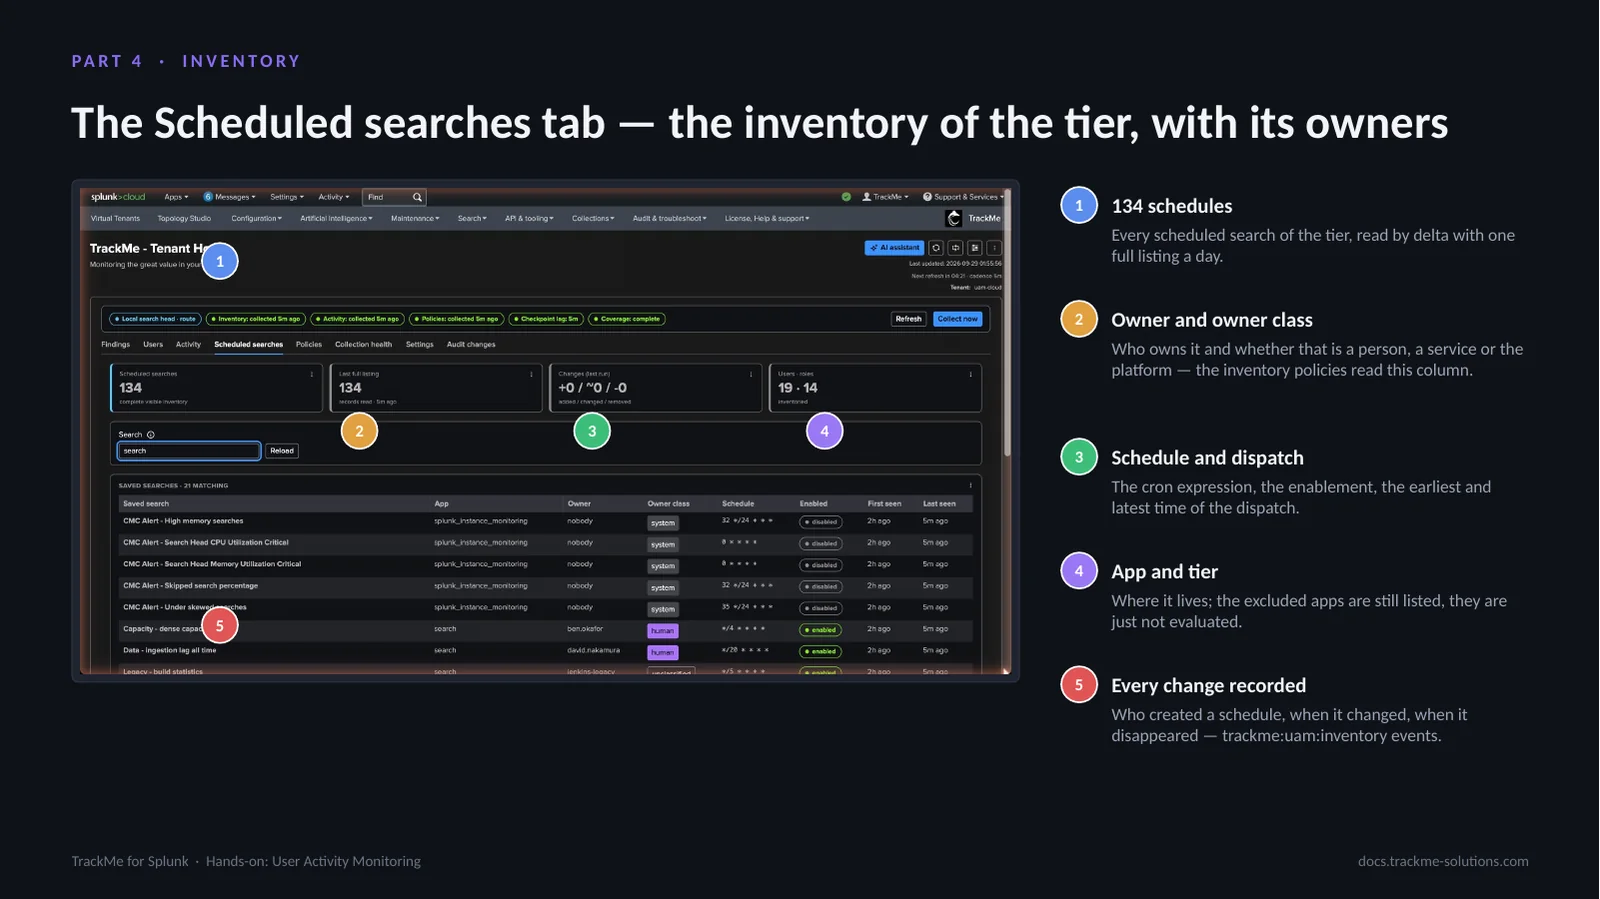
The Scheduled searches tab lists every schedule of every tier with its owner, owner class, schedule and enablement; a name opens the saved search view. Here, a detection search of the svc-siem service account is enabled, scheduled on the local tier and shared globally.
Over the last 24 hours it ran 291 times for 7m 13s of CPU, with a longest run of 2m 33s and a peak memory of 411 MB. The definition from the inventory shows a cron of */5 and a dispatch earliest of -1h. Fetch definition reads the saved search live from its search head with the caller’s permissions; nothing is stored.
Backfill and recovery
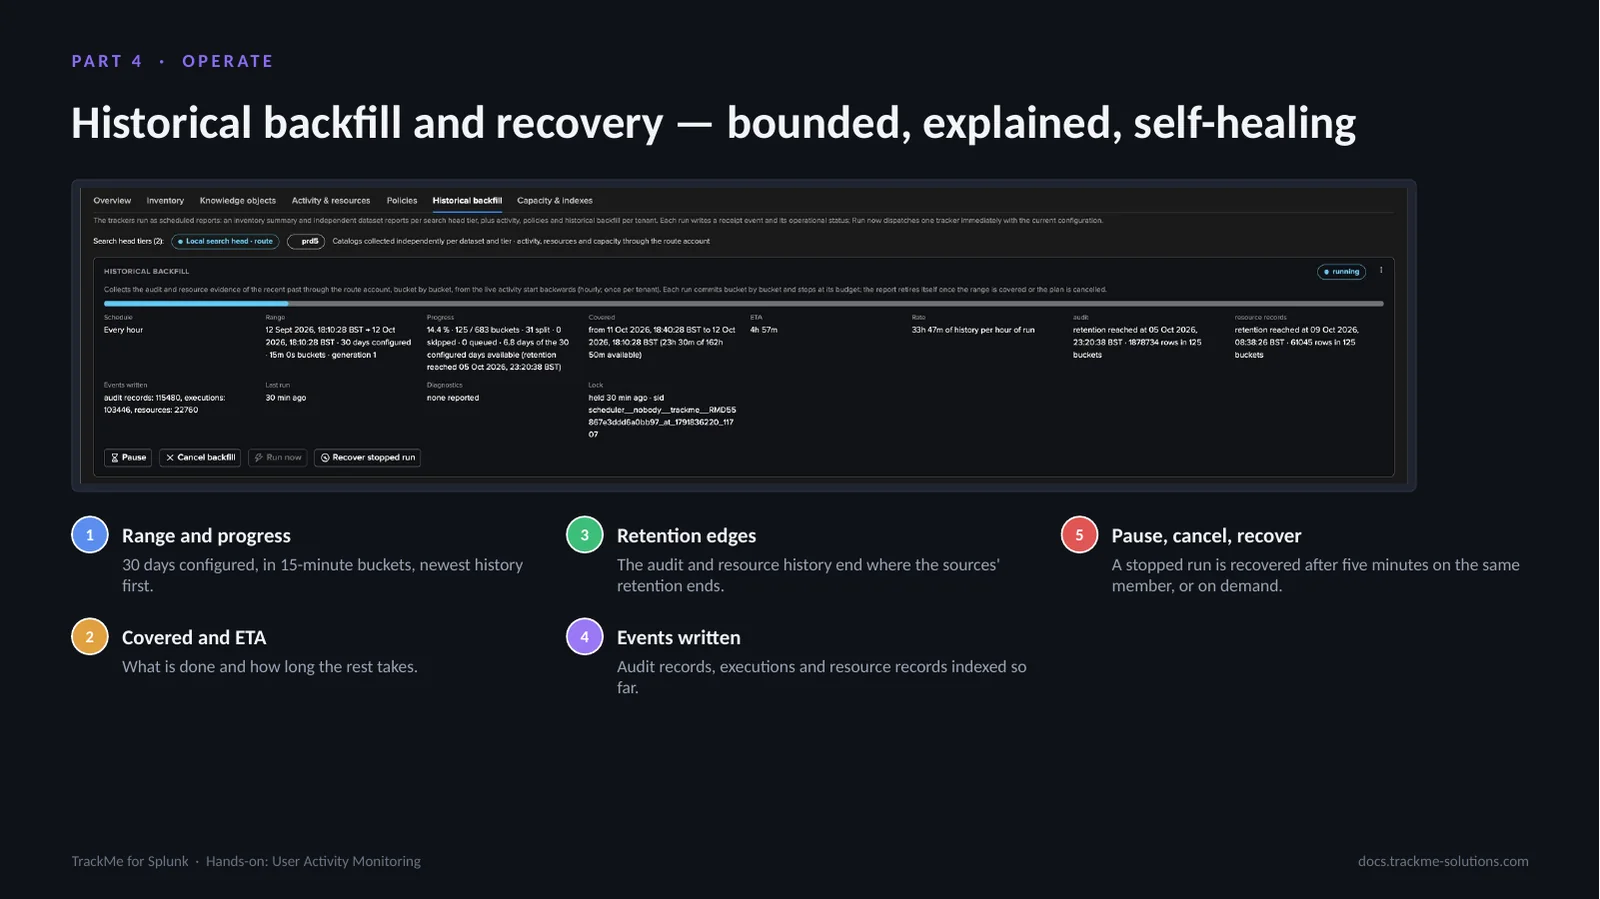
The Historical backfill tab shows the configured range, 30 days in 15-minute buckets collected newest first, with what is covered and the estimated time for the rest. The retention edges show where the audit and resource history end because the sources’ retention ends there, and the counters show the audit records, executions and resource records written so far.
Pause and Cancel backfill control the run; a stopped run is recovered after five minutes on the same member, or on demand. The backfill never collects a span twice and retires itself once the range is covered. The Configuration Guardian check uam_collection_health surfaces whatever stays wrong and clears itself.
Where we are
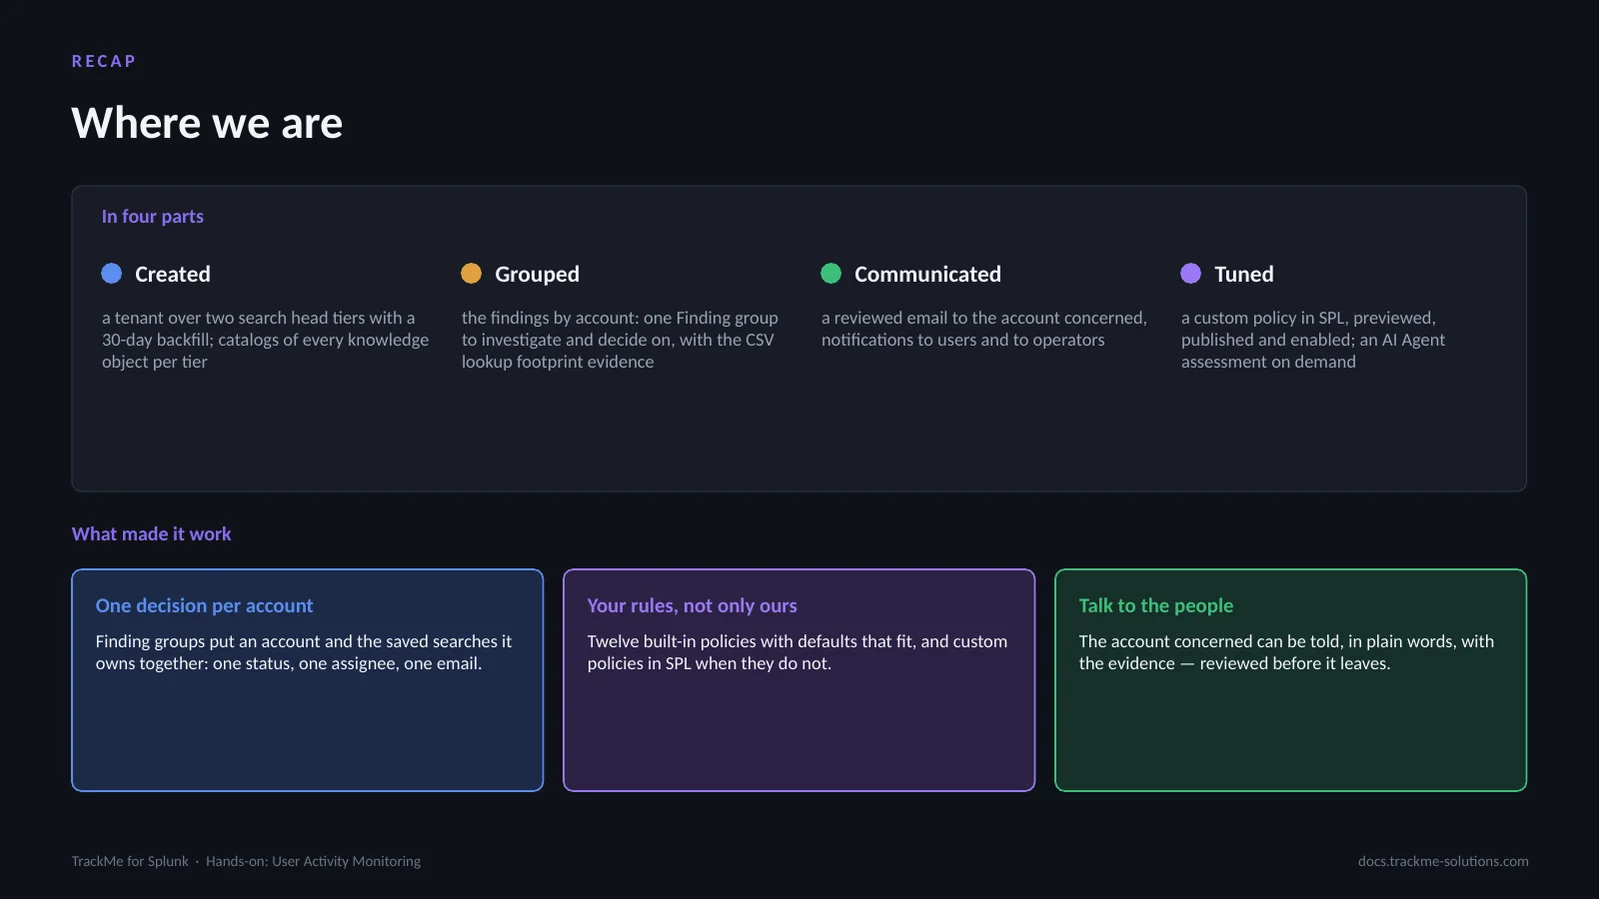
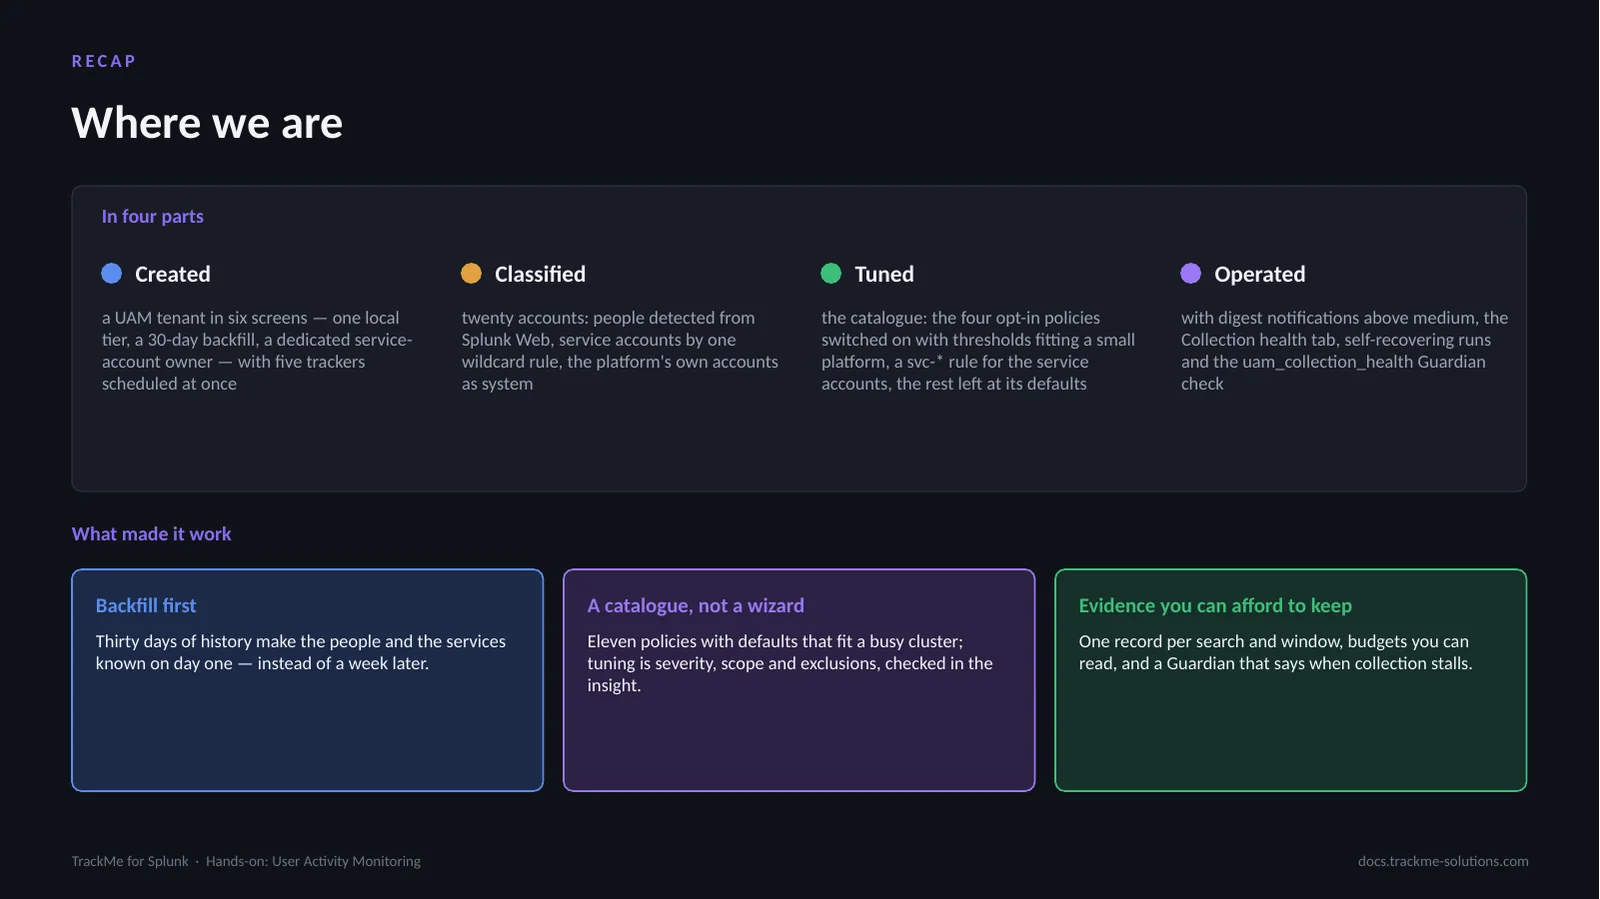
In four parts, a tenant was created over two search head tiers with a 30-day backfill and catalogs of every knowledge object per tier. Its findings were grouped by account into Finding groups and investigated, with the CSV lookup footprint evidence. A reviewed email went to the account concerned, next to the notifications to users and to operators. A custom policy was written in SPL, previewed, published and enabled, and the AI Agent gave an assessment on demand.
Three things make it work: one decision per account through Finding groups, rules beyond the built-in catalogue through custom policies, and plain-language communication with the people behind the accounts.