Authoring topologies
Creating a view
To start from existing monitoring data, you can also generate a view from Tenant Home (TrackMe 2.4.16+), choose its hierarchy and condition, then save it into Studio for authoring.
From the Topology Studio landing page, click Create topology view:
View ID — type freely; the identifier is derived automatically from what you enter. It is unique and cannot be changed later, so it is worth a moment’s thought — it is what deep links and exports refer to.
Display name — the label shown on the card, the canvas and in alert emails.
Description — optional, free text.
Category — optional grouping label (for example
Production). Views sharing a category are grouped under one heading in the Cards layouts of the views browser, and the browser’s Category filter narrows the list to one of them.Can view (roles) — read-only access.
Can edit (roles) — roles allowed to modify or delete the view.
Two guarantees are built into the role lists, so you cannot lock yourself out: administrators always have access regardless of what is listed, and the view’s creator always keeps edit access. Roles with edit access can always view, so they need not be repeated in the view list.
Important
A role listed under Can edit still needs TrackMe power permissions to author. Granting edit to a user-tier role does not promote it — such a role remains read-only either way. See Administration.
The new view opens directly on the canvas editor.


The canvas editor
The editor is a direct-manipulation canvas: drag nodes to place them, click to inspect, right-click for context menus. The essential mechanics:
Explicit Save. Nothing is persisted until you click Save — you can experiment freely. The editor warns before you navigate away with unsaved changes, and Undo (the button, or the universal Ctrl/Cmd+Z) reverts the last 25 structural operations.
Conflict detection. If someone else saved the view while you were editing, Save is refused and you choose between reloading their version or overwriting it — no silent lost updates.
Multi-select and group moves. Modifier-click (or select-all) selects several nodes at once — drag any one of them and the whole group moves together, with a live preview of where every companion will land. Bulk deletion works on the same selection.
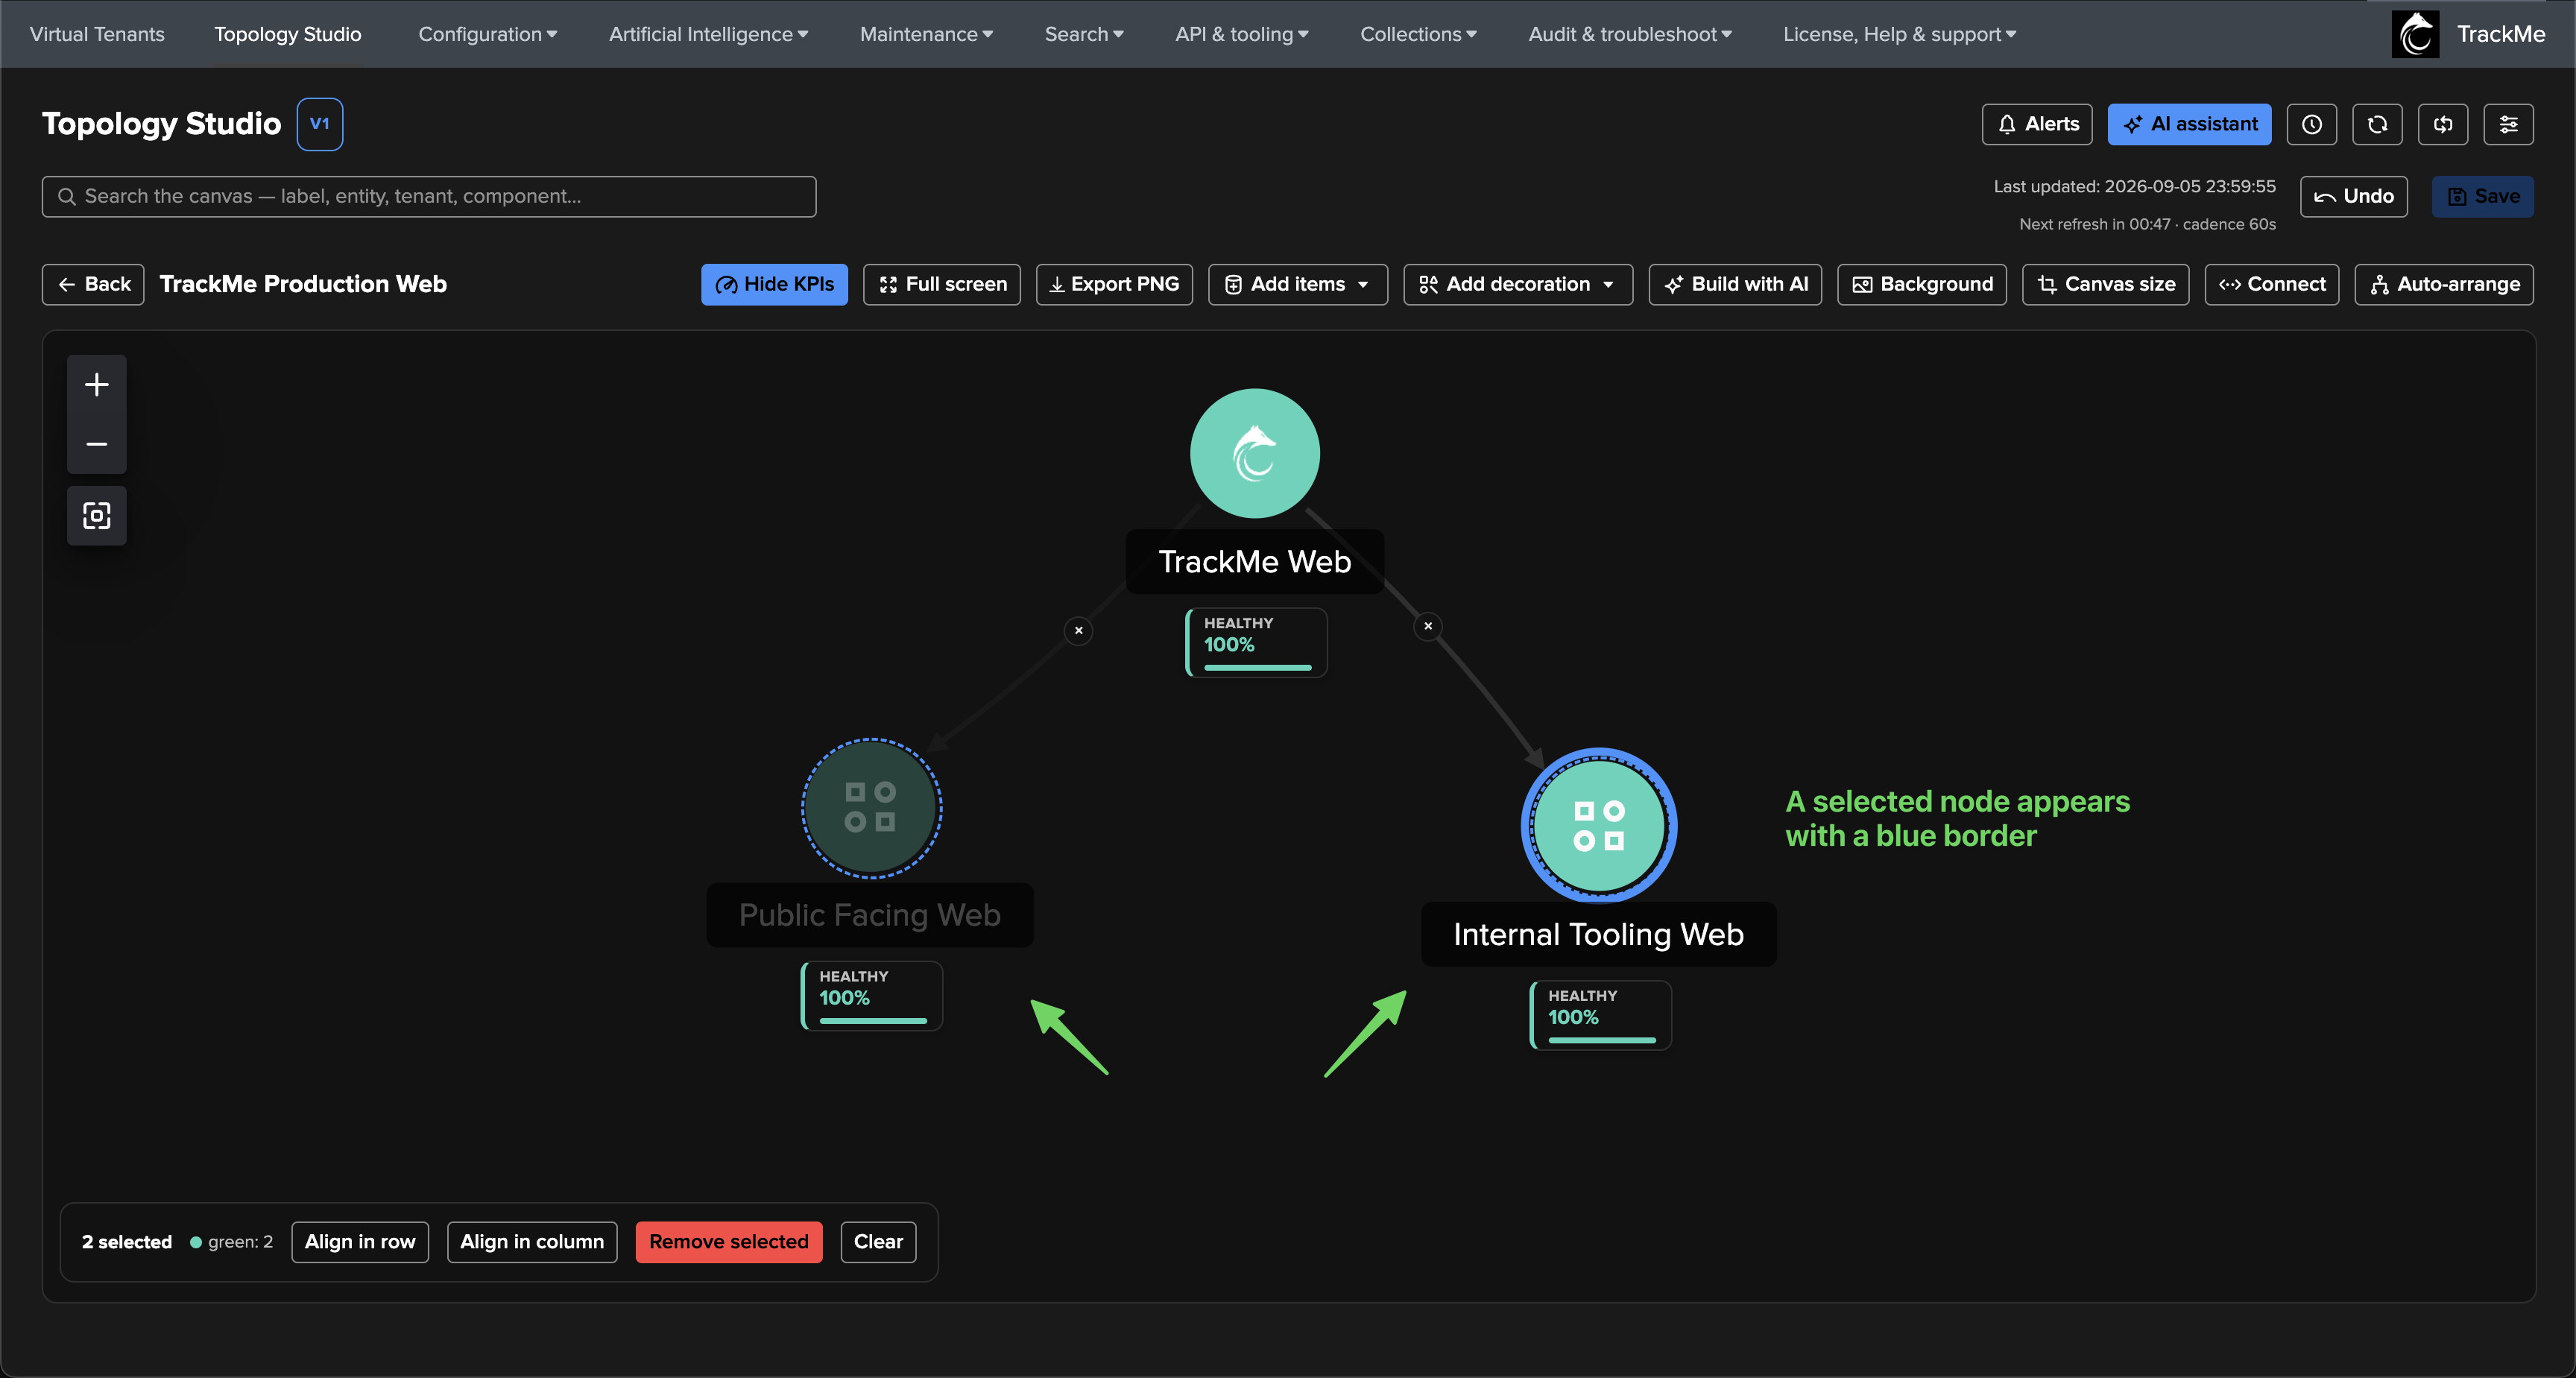
Escape releases. Grabbed a node (or a group) and changed your mind? Escape releases it back where it was — the drop never happens and no undo step is consumed. Undo remains the tool for a move that already landed.
Auto-arrange. Compute a hierarchical layout from your edges, with configurable direction, spacing, wrapping and canvas sizing in TrackMe 2.4.15. Expanded aggregates’ visible members participate too. Use it as a starting point, then refine by hand and Save. See Auto-arrange for the options and examples.
Large maps with bounded composition. General canvas content is guarded by a storage-size backstop. Auto aggregates have a separate limit of 100 per graph and 12 composition levels; referenced views also have nesting and evaluation budgets. See Auto aggregates.
Version history and rollback
Every Save automatically snapshots the previous state of the view, so each view carries its own version history: open it from the canvas toolbar to list the versions (who saved, when, and from which action), preview any version’s graph, and restore one. Restore is non-destructive — the state you are replacing is snapshotted too, so a rollback is itself reversible. Broke the map at 5 pm? Go back to how it was at noon in two clicks.
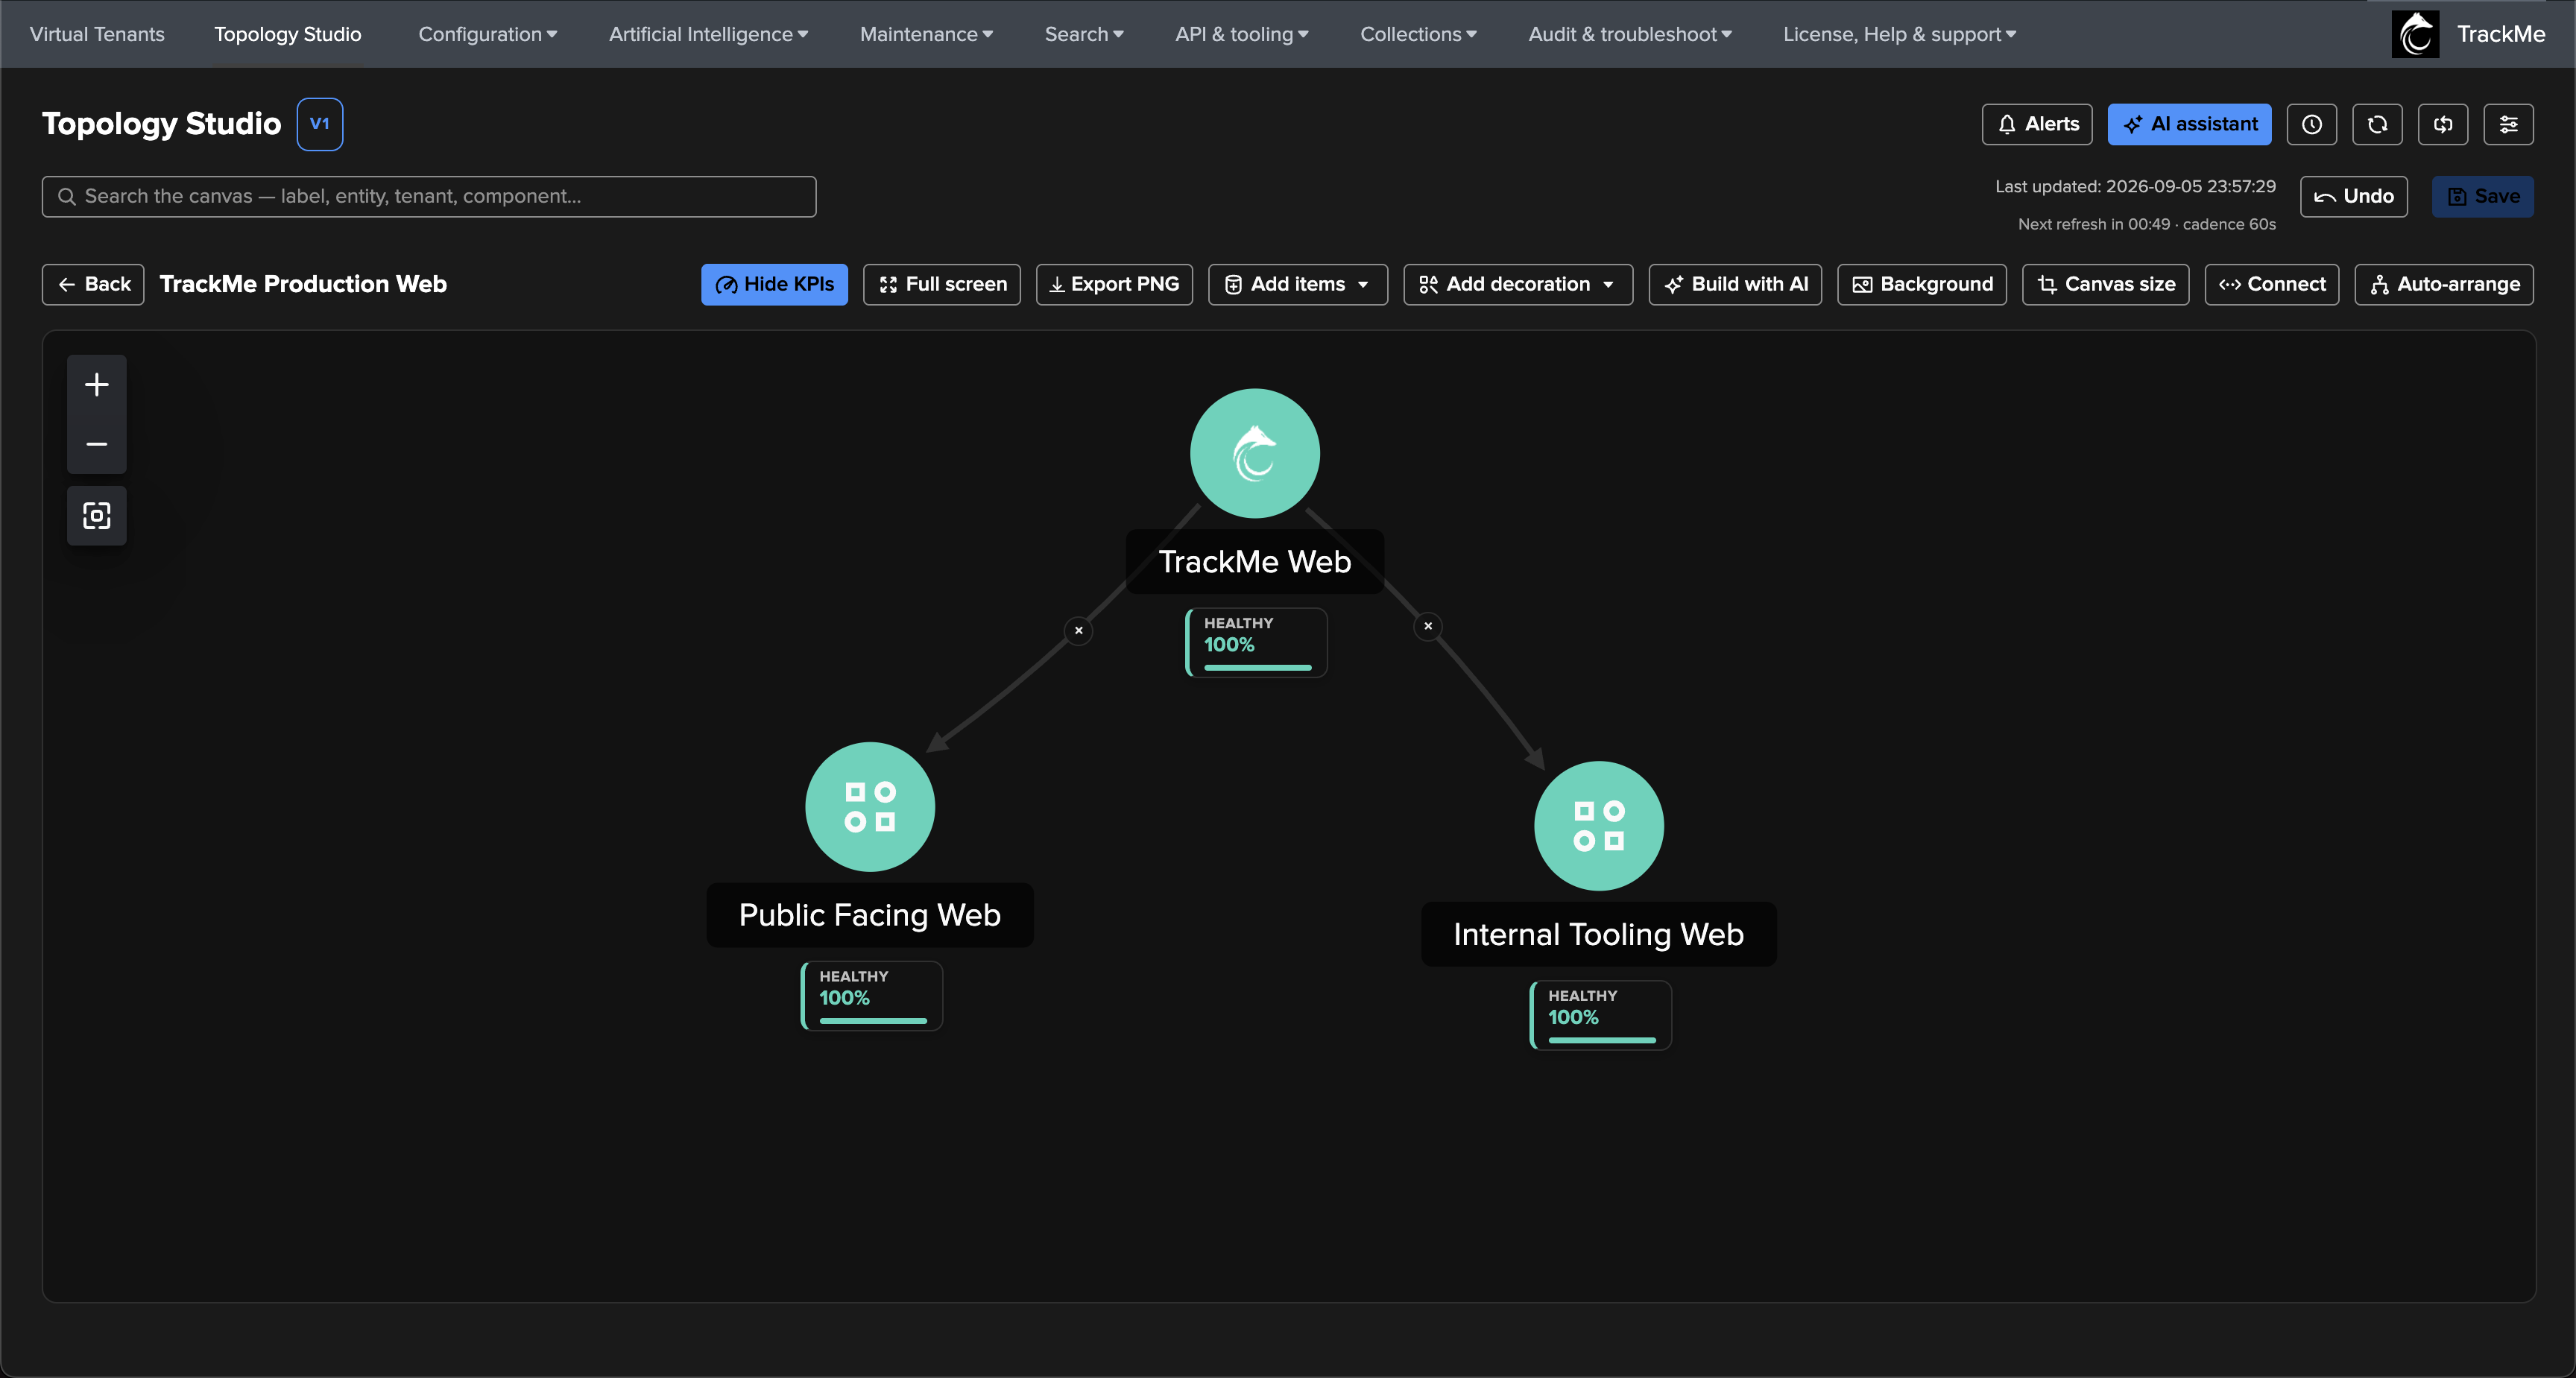
Auto-arrange
Auto-arrange organises the topology from its connections, placing roots and their descendants in a hierarchy. TrackMe 2.4.15 extends this capability with four directions, three spacing presets, wrapping and control over canvas sizing. It also arranges the currently visible auto-generated members of expanded aggregates alongside the rest of the map.
Open Auto-arrange from the authoring toolbar, or right-click an empty area of the canvas and choose Auto-arrange. The options panel lets you decide how the map should flow before applying the layout:
Choose Direction, Spacing and Canvas behaviour.
Set Wrap wide groups and Fit view after arranging as needed.
Click Arrange to apply the layout. Cancel closes the panel without applying your choices.
Review the result, refine positions by dragging if needed, then Save. Undo reverts an arrangement as one change, including any canvas resize.
Choosing a direction
The Direction setting controls where the hierarchy starts and which way it flows. It changes node positions while preserving the existing connections and their source/target relationships.
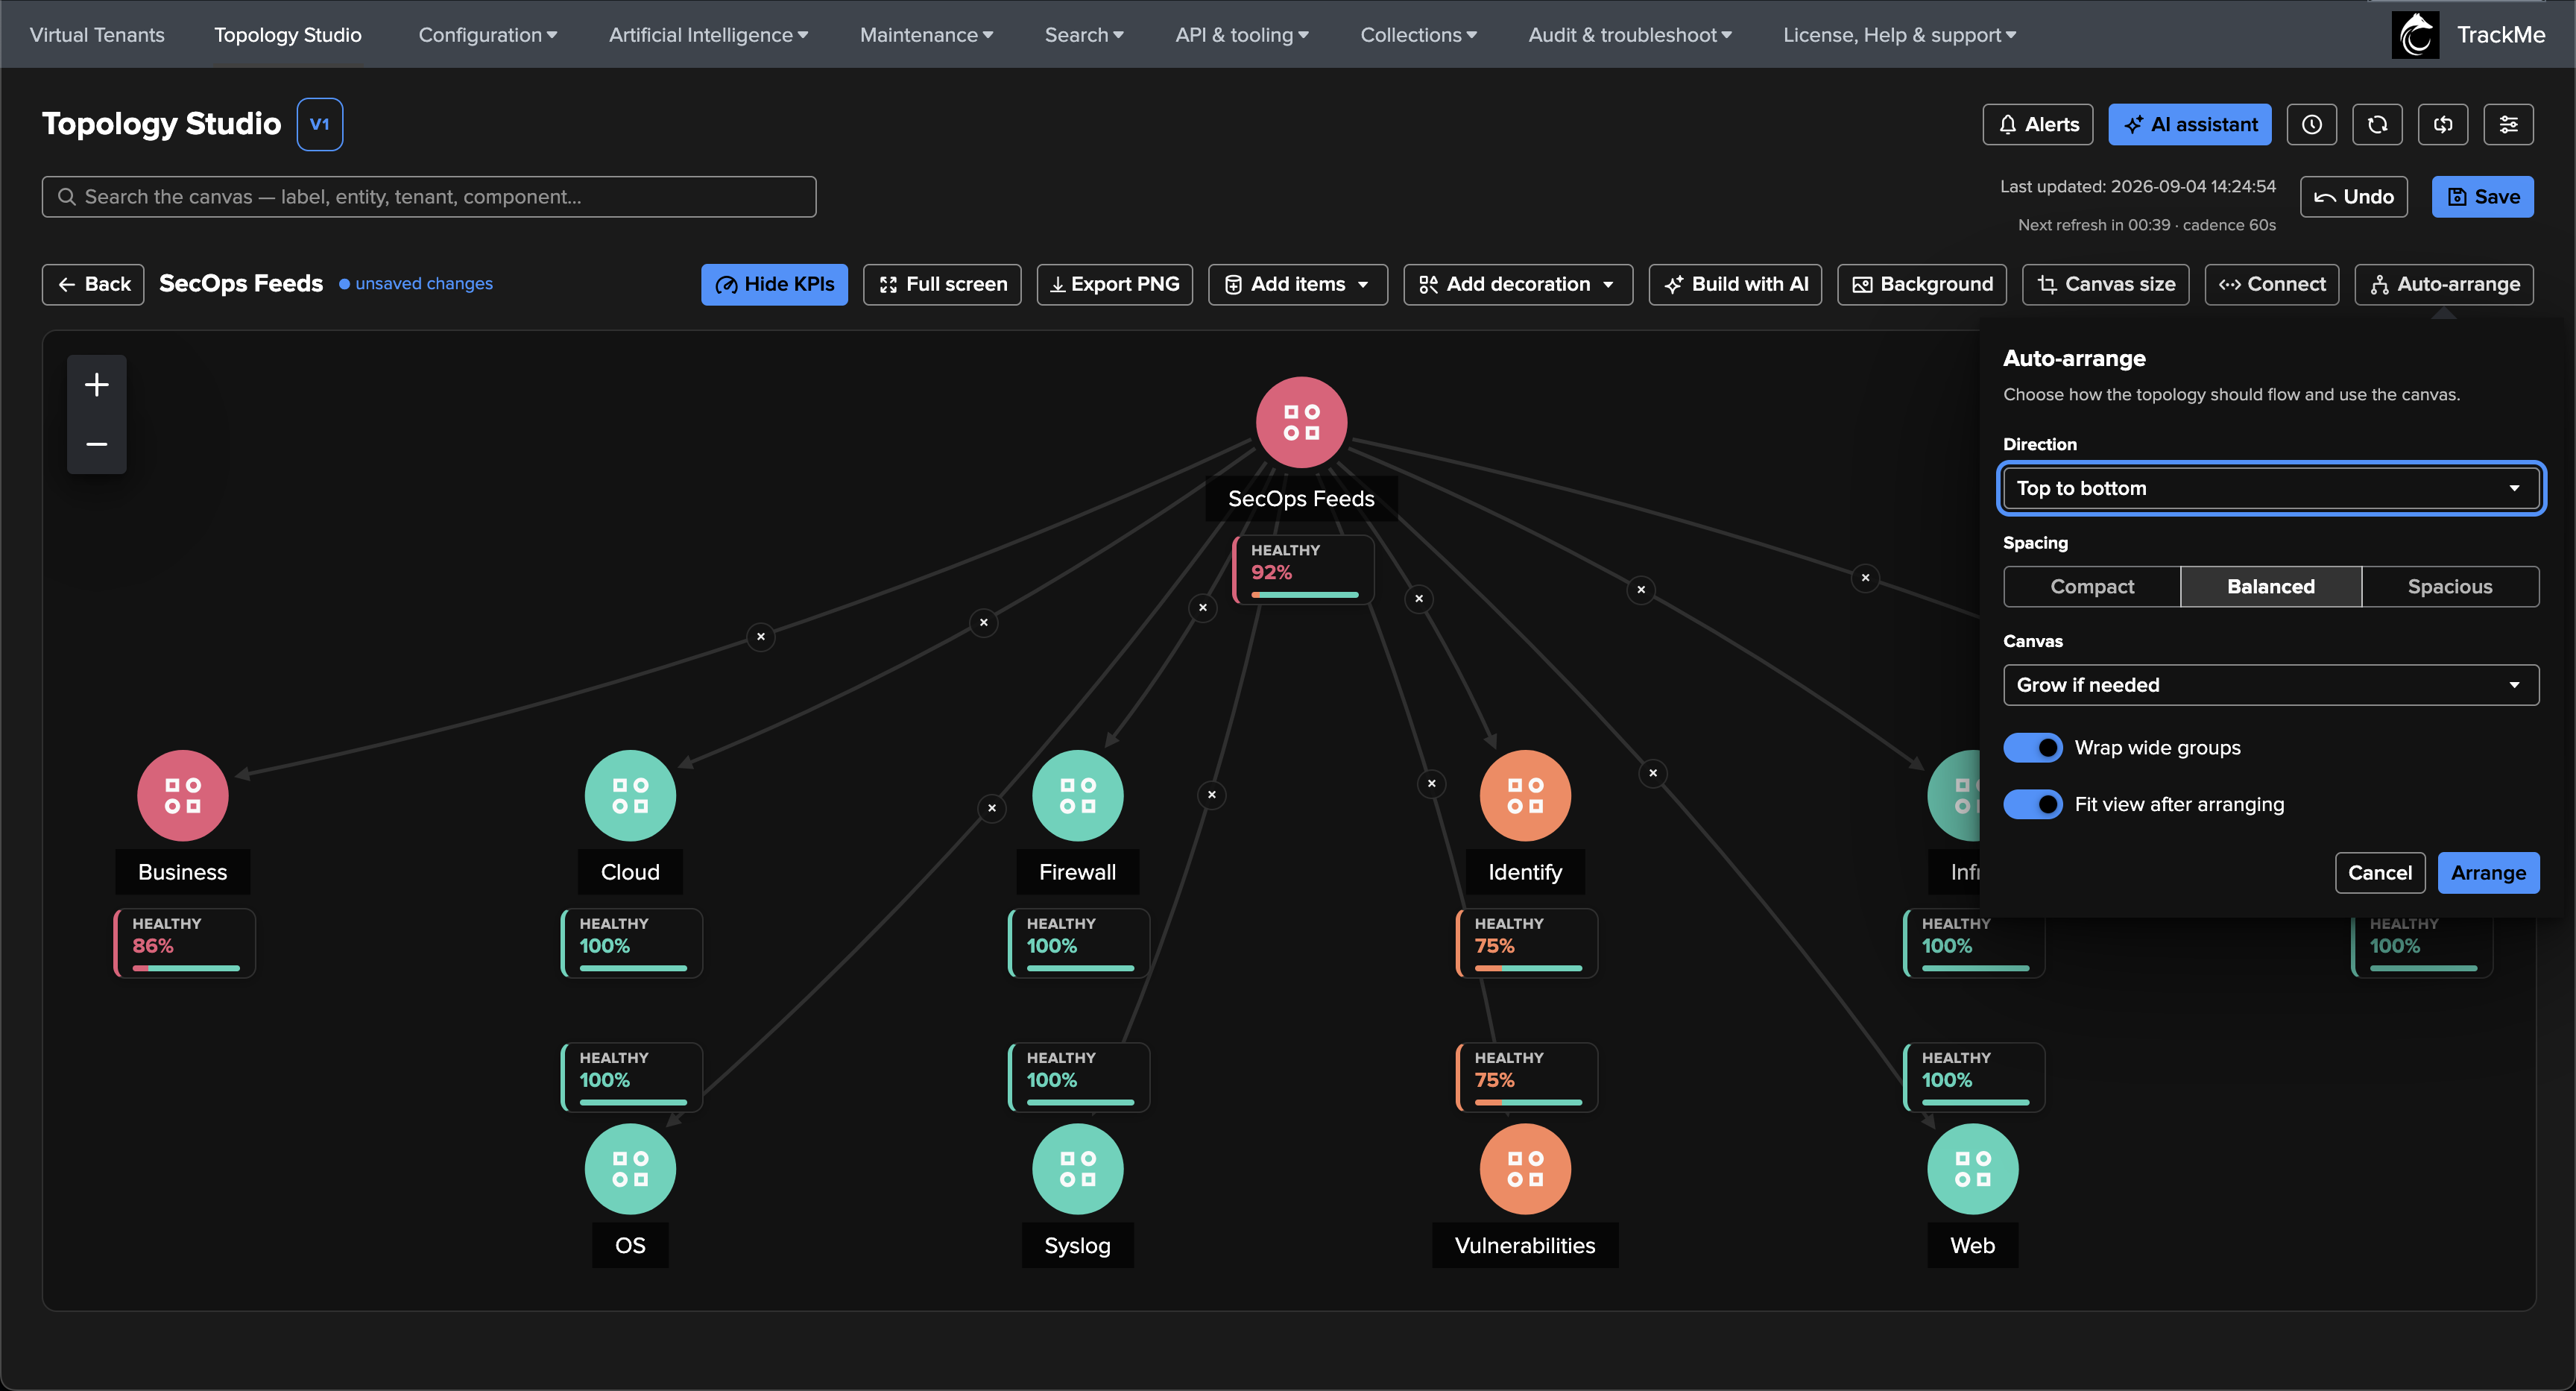
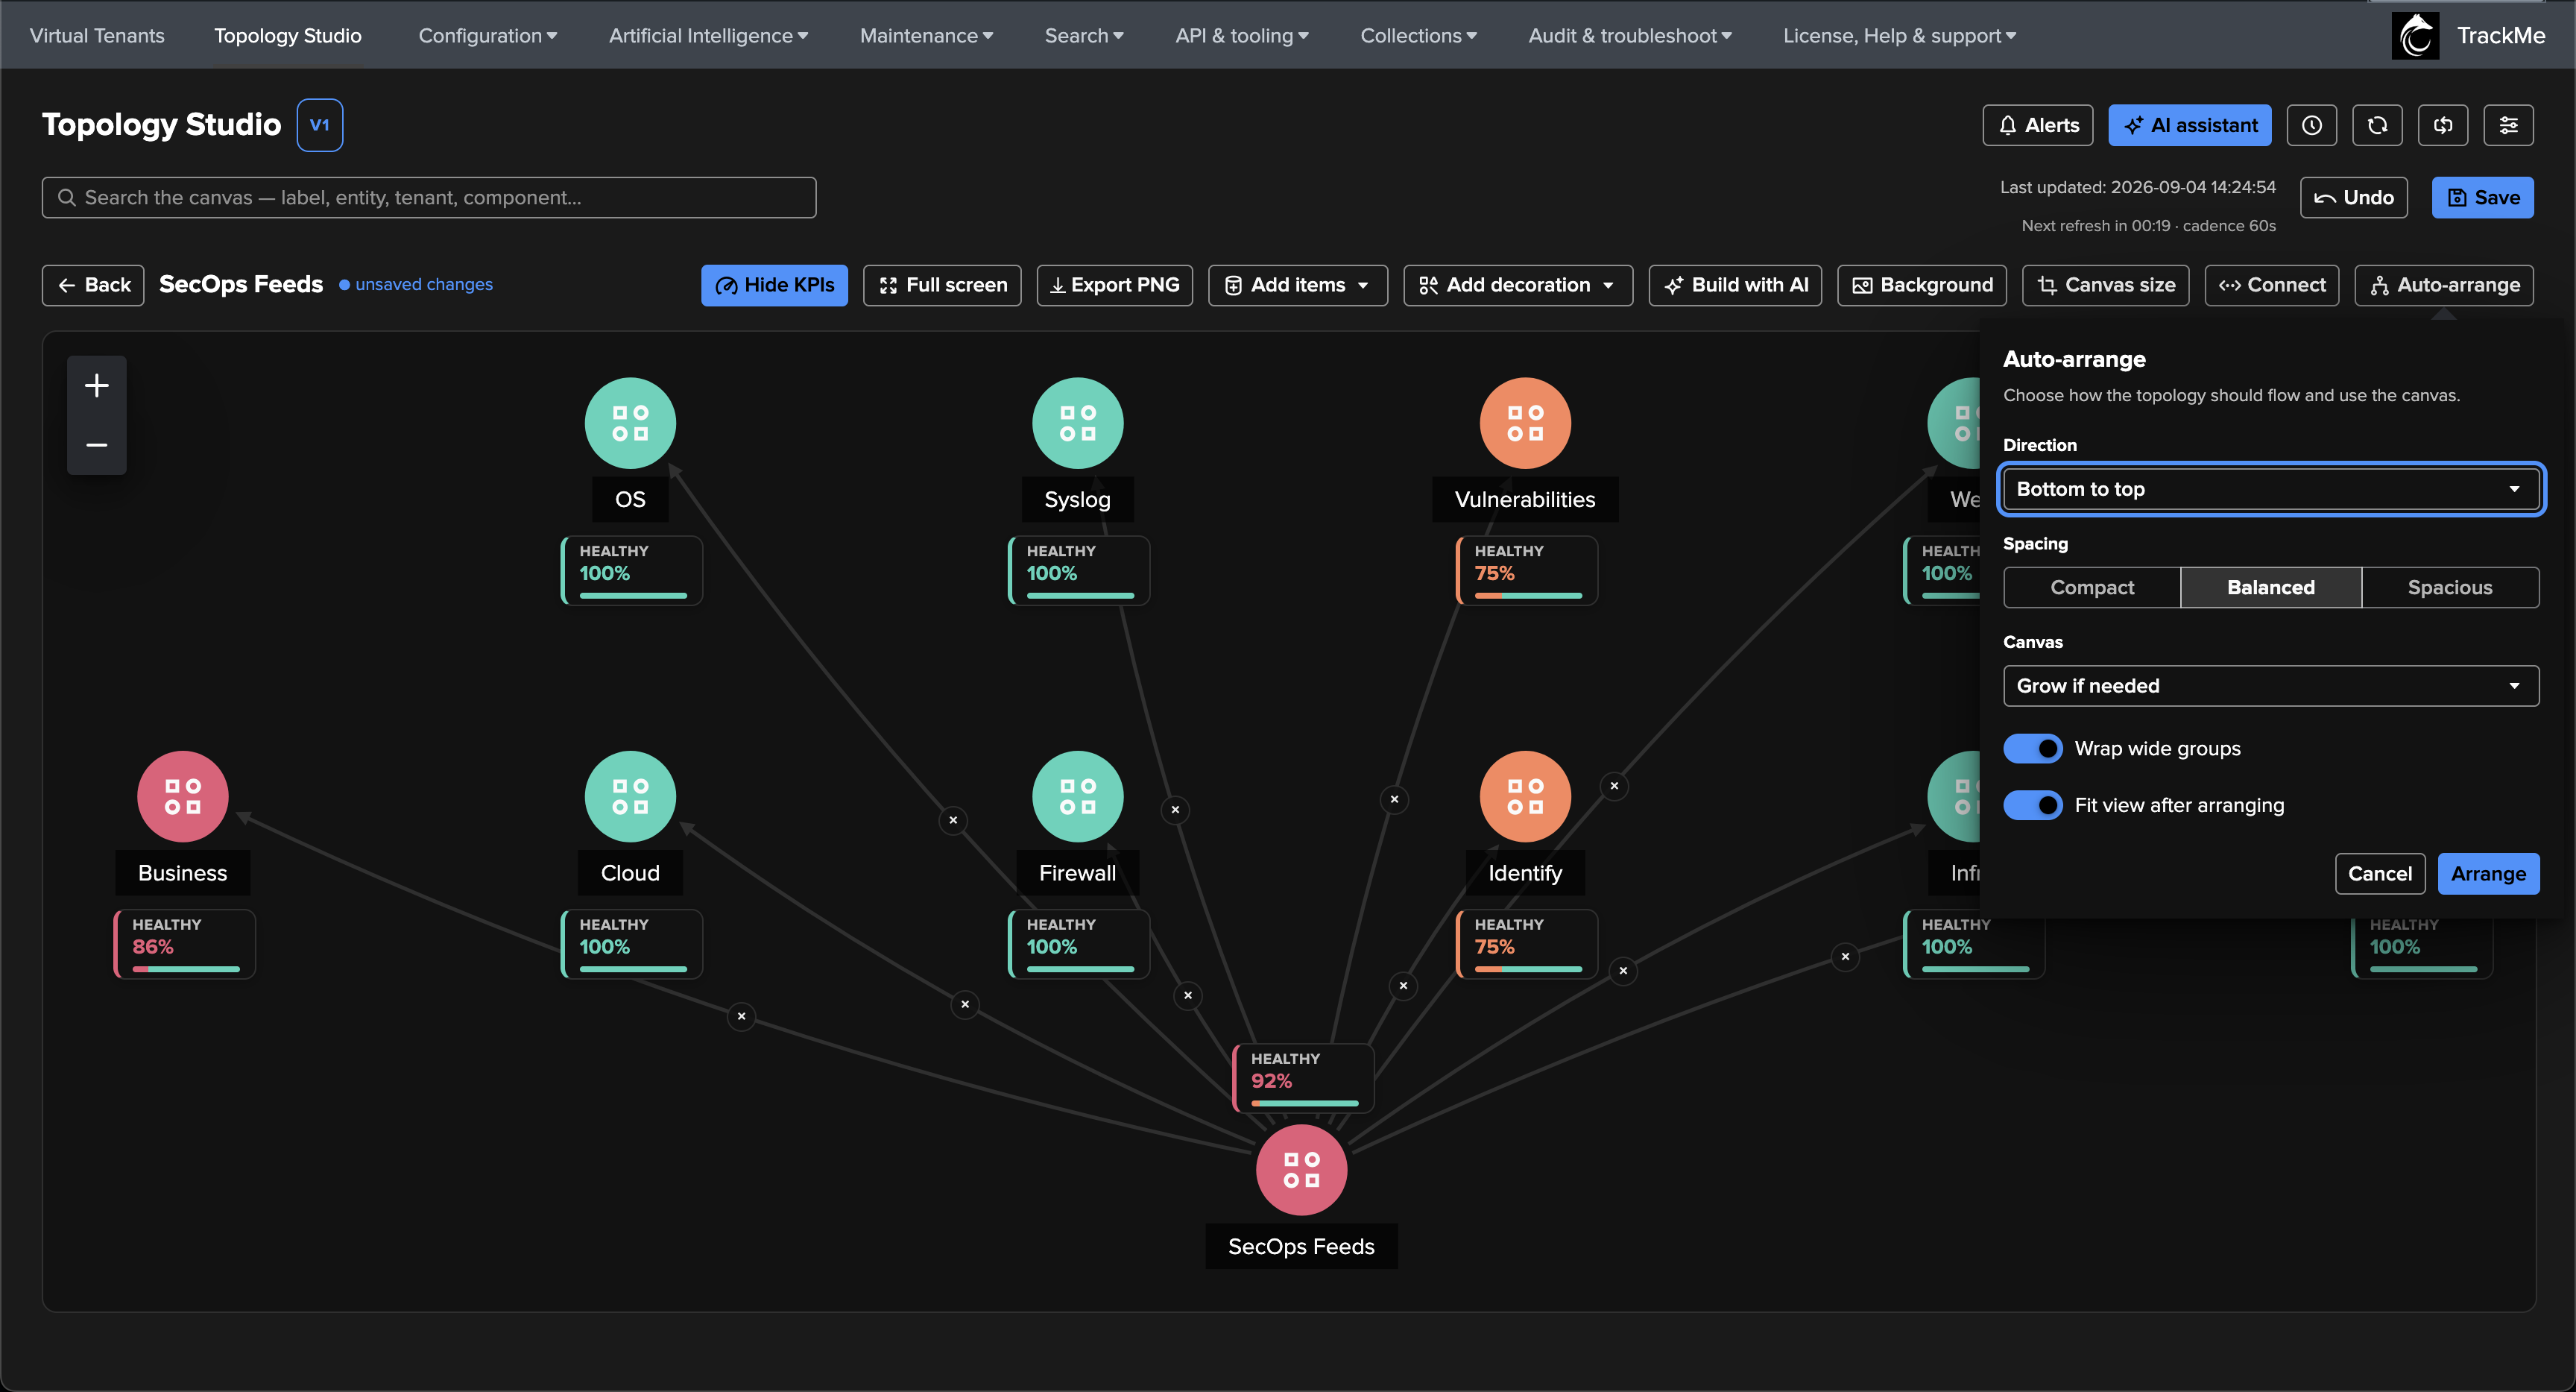
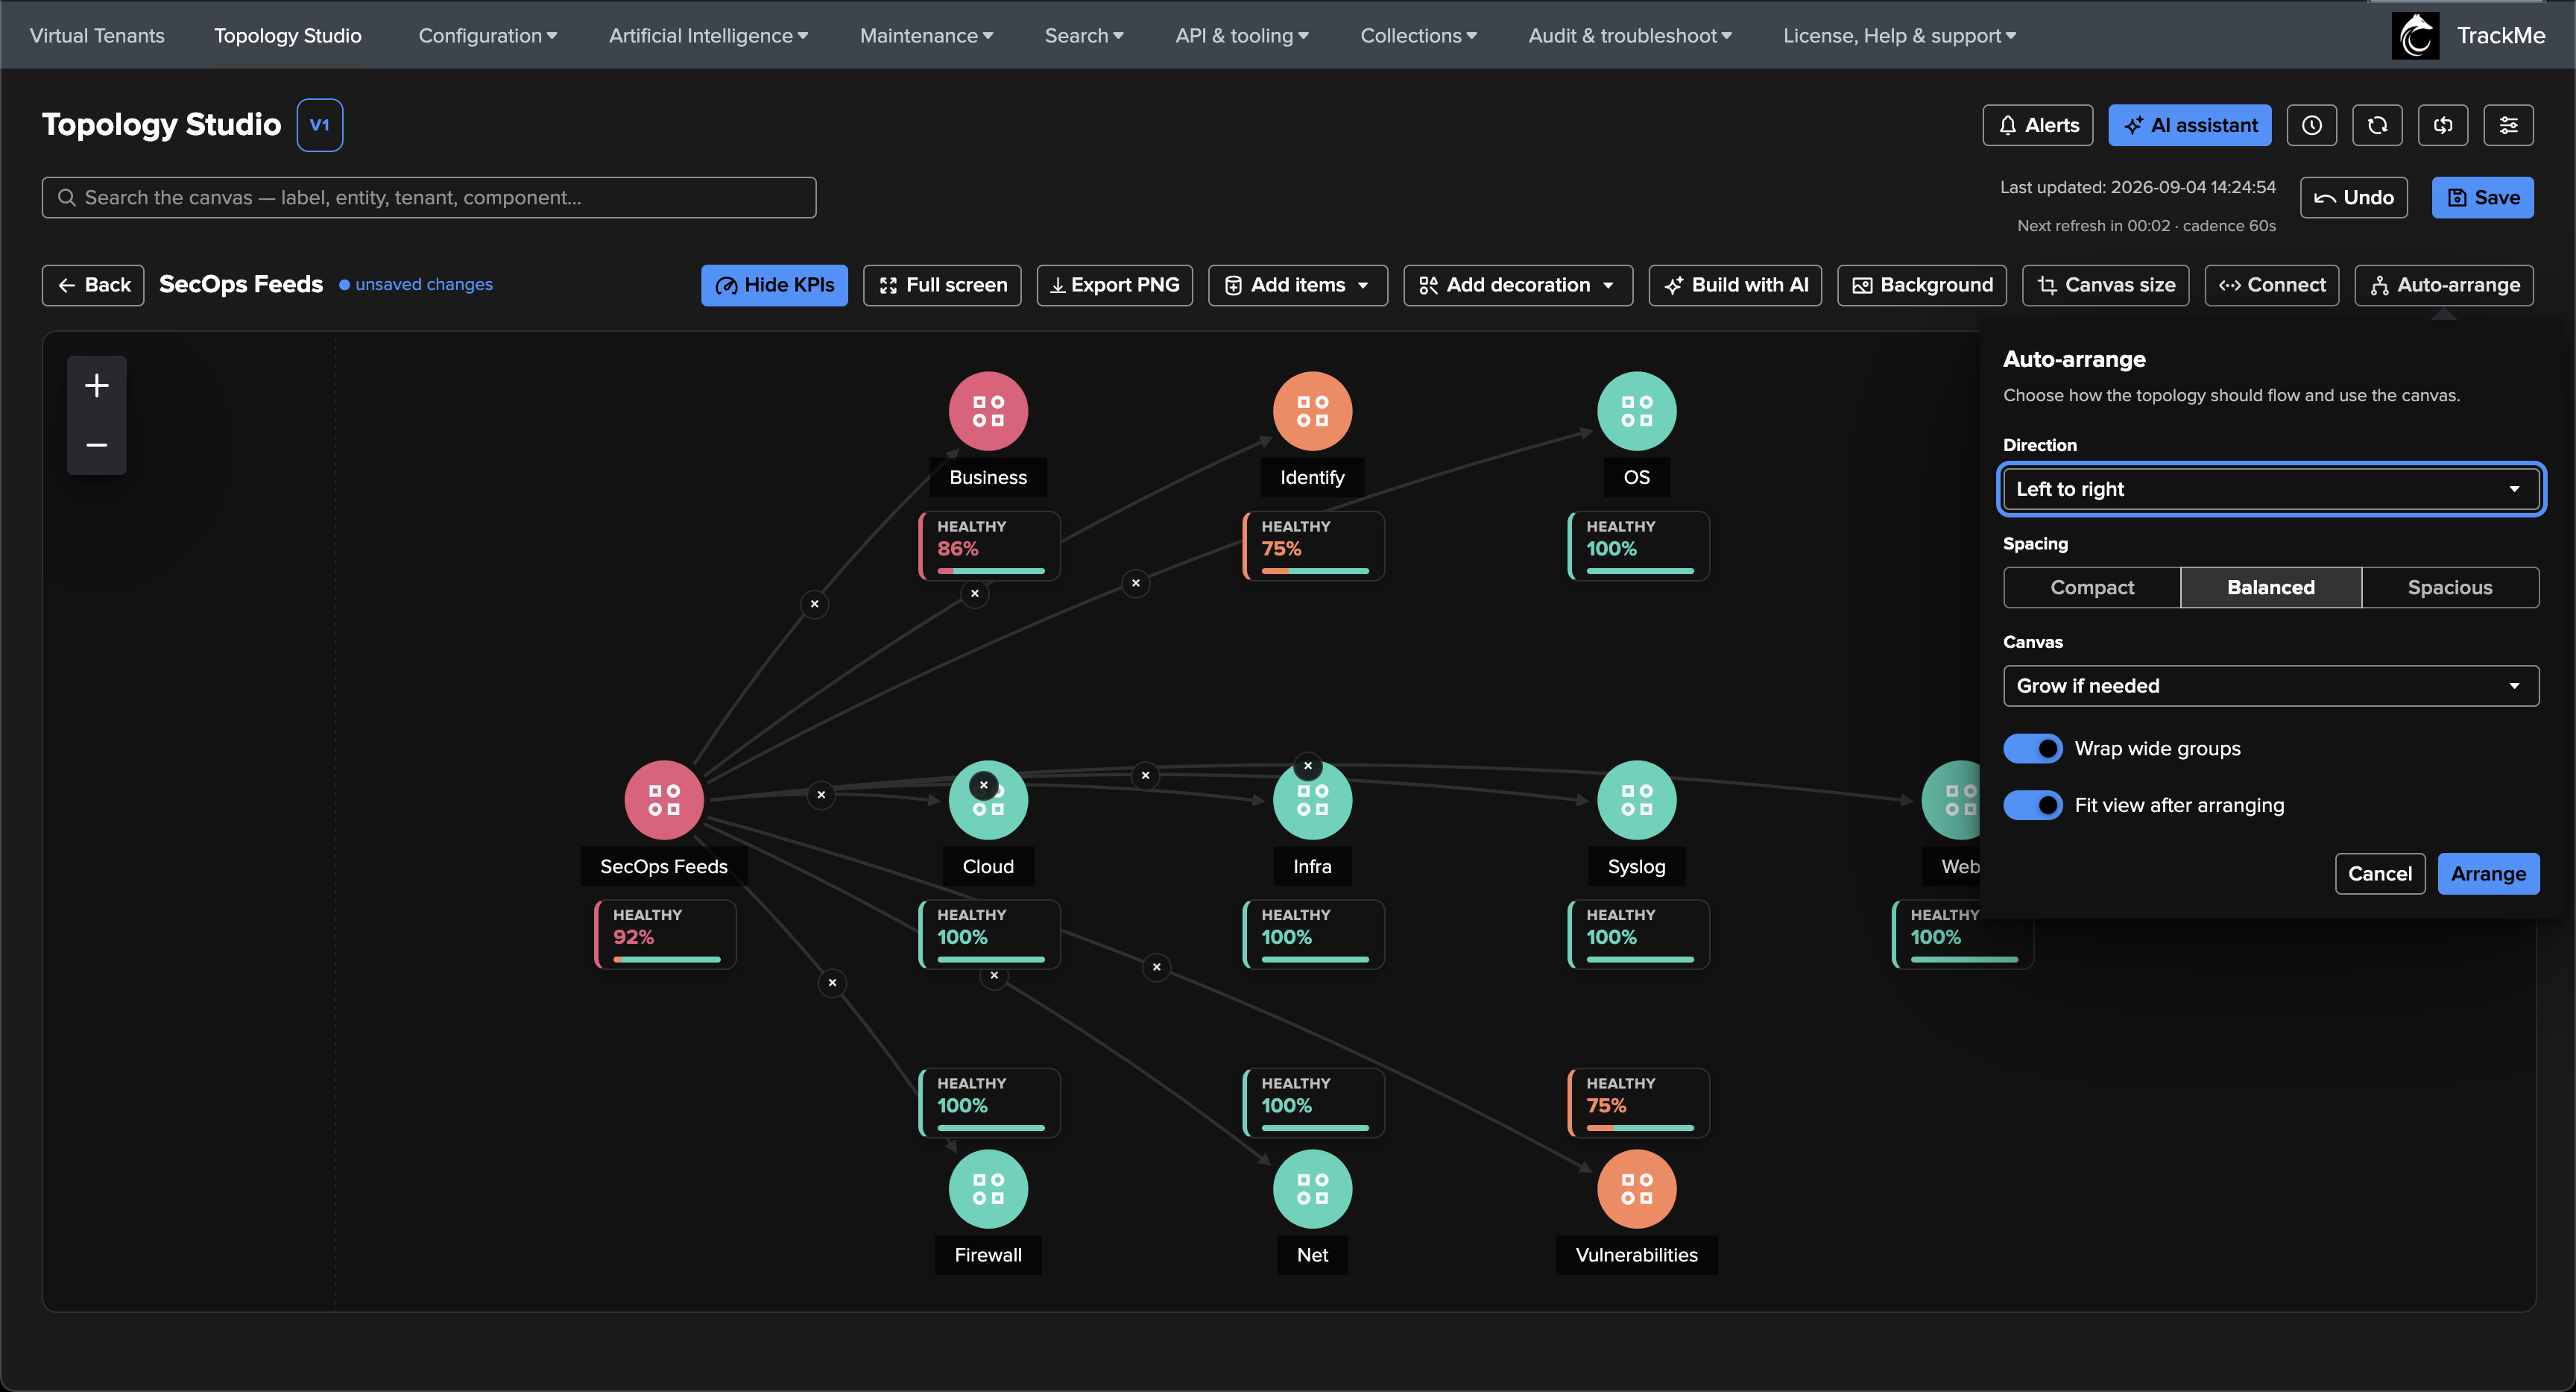
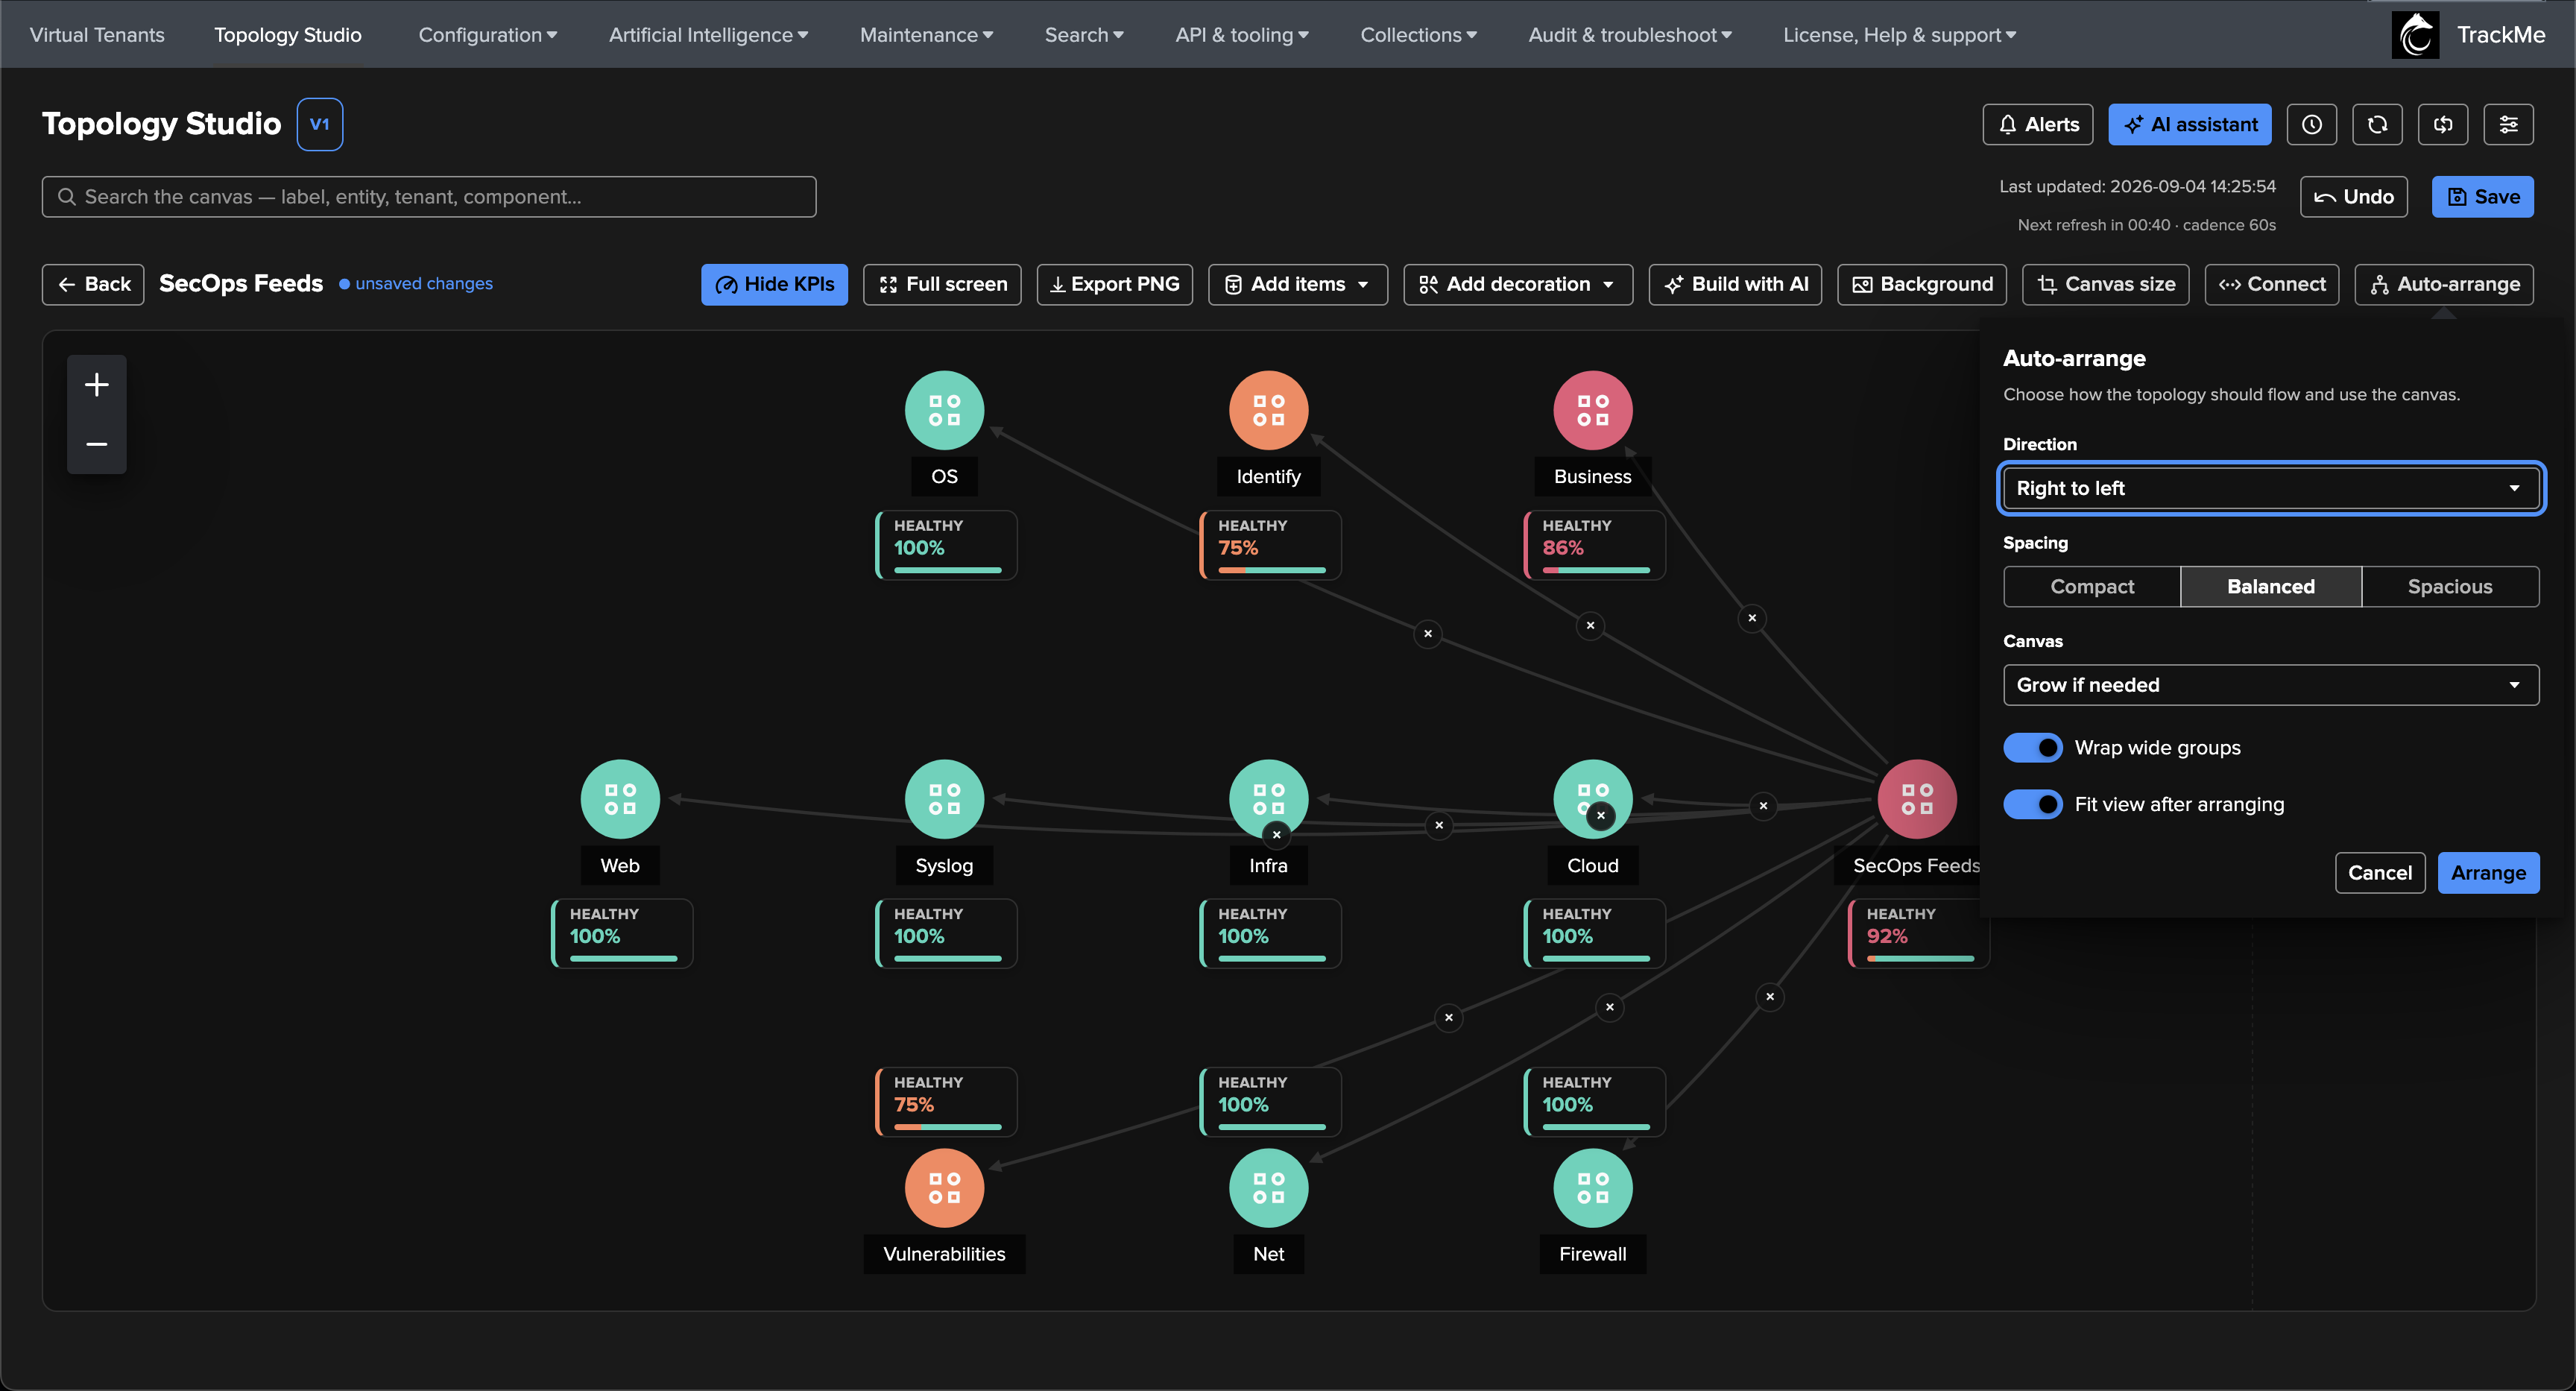
The screenshots use the same SecOps Feeds map to compare all four choices, with Balanced spacing, Grow if needed, wrapping and viewport fitting enabled.
Top to bottom (the default) places the root above its descendants. Bottom to top places the root below them:
Left to right places the root on the left and flows towards the right. Right to left places the root on the right and flows towards the left:
Spacing and wrapping
Spacing controls the gaps between nodes and hierarchy levels:
Compact reduces gaps for a denser map.
Balanced is the default spacing.
Spacious increases gaps to give branches more room.
The layout reserves space for the KPI displays currently visible on the canvas, including those on generated aggregate members. Hidden KPI displays do not reserve that space; arrange with KPIs visible if you intend to show them in the finished view.
Wrap wide groups is enabled by default. When a hierarchy level is too wide for the current canvas, its nodes wrap into additional rows. For a horizontal direction, the same option wraps tall groups into additional columns using the canvas height. Turn it off to keep each hierarchy level on a single row or column, allowing more canvas space if needed.
Canvas sizing and viewport fitting
The Canvas setting controls the logical dimensions of the map:
Option |
Behaviour |
|---|---|
Keep current size |
Arrange within the existing canvas dimensions. A crowded map may have tighter gaps because the canvas cannot grow during this operation. |
Grow if needed |
The default and recommended option. Keep the existing dimensions, enlarging the canvas where the layout needs more room. |
Fit to content |
Resize the canvas around the arranged content, growing or shrinking it as needed within the supported canvas limits. |
Fit view after arranging is a separate option, enabled by default: it adjusts the viewport zoom and framing to show the arranged map. Turn it off to keep your current viewport while applying the new layout. Fit to content changes the canvas dimensions; Fit view after arranging controls how you look at that canvas in the browser.
Shapes, images and text decorations stay in their existing positions during auto-arrange. Canvas fitting includes their extents so that resizing around the nodes does not leave those decorations outside the canvas. You may want to reposition a decorative frame or title after moving the nodes it describes. See Decorations and canvas layout for manual canvas sizing and decoration controls.
Expanded aggregates and saved layouts
In TrackMe 2.4.15, auto-arrange includes the currently rendered members of expanded aggregates and their links. Their arranged positions are retained relative to the parent aggregate and saved with the view. Collapsed aggregates, and expanded aggregates with no currently rendered members, keep their stored member layout. Expand the aggregates whose members you want to arrange first.
The last applied options are remembered in your browser, ready for the next arrangement. Those preferences are separate from the shared view: Save persists the resulting positions and canvas dimensions. The view is not saved merely by opening the panel or clicking Arrange.
Adding entity nodes
Add items → Add entities opens a cross-tenant picker: choose a tenant and a component, search, and multi-select the entities to place. Any entity from any tenant and any of the seven components (DSM, DHM, MHM, VOL, FLX, FQM, WLK) can join the same map — this is where cross-domain dependency maps come from (the data source and the host and the workload that produce a service, side by side).
New nodes land collision-aware near the canvas center, ready to be dragged into place.

Entity KPIs
Each entity node can display up to five KPIs, stacked as on-canvas displays next to the node — the numbers you want visible at a glance:
DSM / DHM / MHM / WLK offer a fixed, typed KPI catalog (lag, latency, event volume, host counts, skip percentage, execution errors…).
FLX, FQM and WLK additionally expose the entity’s own metrics: whatever the entity reports in its
metricspayload becomes selectable as a KPI — for Flex Objects this means your custom KPIs land on the map (WLK is hybrid: catalog first, metrics on top).
The node chooses one display style applied to its whole KPI stack: a themed stat card, a card-free colored value, a compact status badge, or a sparkline (label, value and a 24h mini trend line — see below); aggregate nodes additionally offer a health donut (their member-state distribution — a display only an aggregate can have). Every KPI in the stack can carry its own short label replacing the technical metric name — rename each one independently.


Sparkline KPIs — trends over time, at scale
The Sparkline display style (TrackMe 2.4.13+) turns each selected KPI into a label, its current value, and a 24-hour mini trend line drawn right on the canvas — the same at-a-glance history the entity inspector’s Metrics (24h) panel shows, now visible for every node you choose without opening anything.
Sparklines are designed to be safe at any view size: no matter how many nodes carry the style, the whole view’s trend history is fetched by one single batched metrics search, refreshed every few minutes on its own schedule. The KPI value keeps updating with every live-status refresh — only the trend shape follows the slower cadence. A KPI without enough recorded history shows a dashed placeholder line instead of a trend, and PNG exports draw the real trend lines. In Topology Alert emails, sparkline-styled KPIs render as stat cards (the email has no live history at generation time).
The style is available for entity nodes and for the auto-generated members of an expanded aggregate (via the aggregate’s member KPI defaults). Aggregate nodes keep their own display choices (card, value, badge, donut).


Adding aggregate nodes
A scoped aggregate node rolls up many entities into one node: pick one or more
tenant/component scopes (up to 8 pairs) and optionally a filter expression — the
same filter grammar used by Virtual Groups (field=value with wildcards, OR /
AND, parentheses). By default the node folds to the worst state of everything it
matches and shows per-state counts; alternatively, an aggregate can opt into a
healthy-percentage policy — you set the orange and green thresholds, and the node
classifies by the percentage of healthy members instead of the single worst one (the
right semantics for large fleets where one red host should not paint a 500-strong
aggregate red).
To combine existing canvas items instead, use an auto aggregate: incoming connections define its membership, without a second scope or filter.
The modal’s preview shows the roll-up and lists the matching entities themselves, so you verify the filter selected the right entities — not just the right number — before you commit. Scoped aggregates have no separate per-view count limit; the normal graph storage-size guard still applies.
An existing aggregate’s scope and filter can be edited in place at any time (right-click → Update scope): the node keeps its identity, position, edges, KPIs and member layout — only the membership definition changes.

Auto-populated aggregates
This expansion option belongs to scoped aggregates. It is distinct from an auto aggregate, which combines incoming health nodes and does not expand into generated members.
An aggregate can also expand: turn on Automatically show and link member entities and its current members appear as satellite nodes linked around it, worst states first. Membership is dynamic — entities that newly match the scope join the map on their own, entities that stop matching leave it — and the positions you give individual members are remembered. This is the “self-maintaining” corner of a map: author the aggregate once, and the topology follows reality.
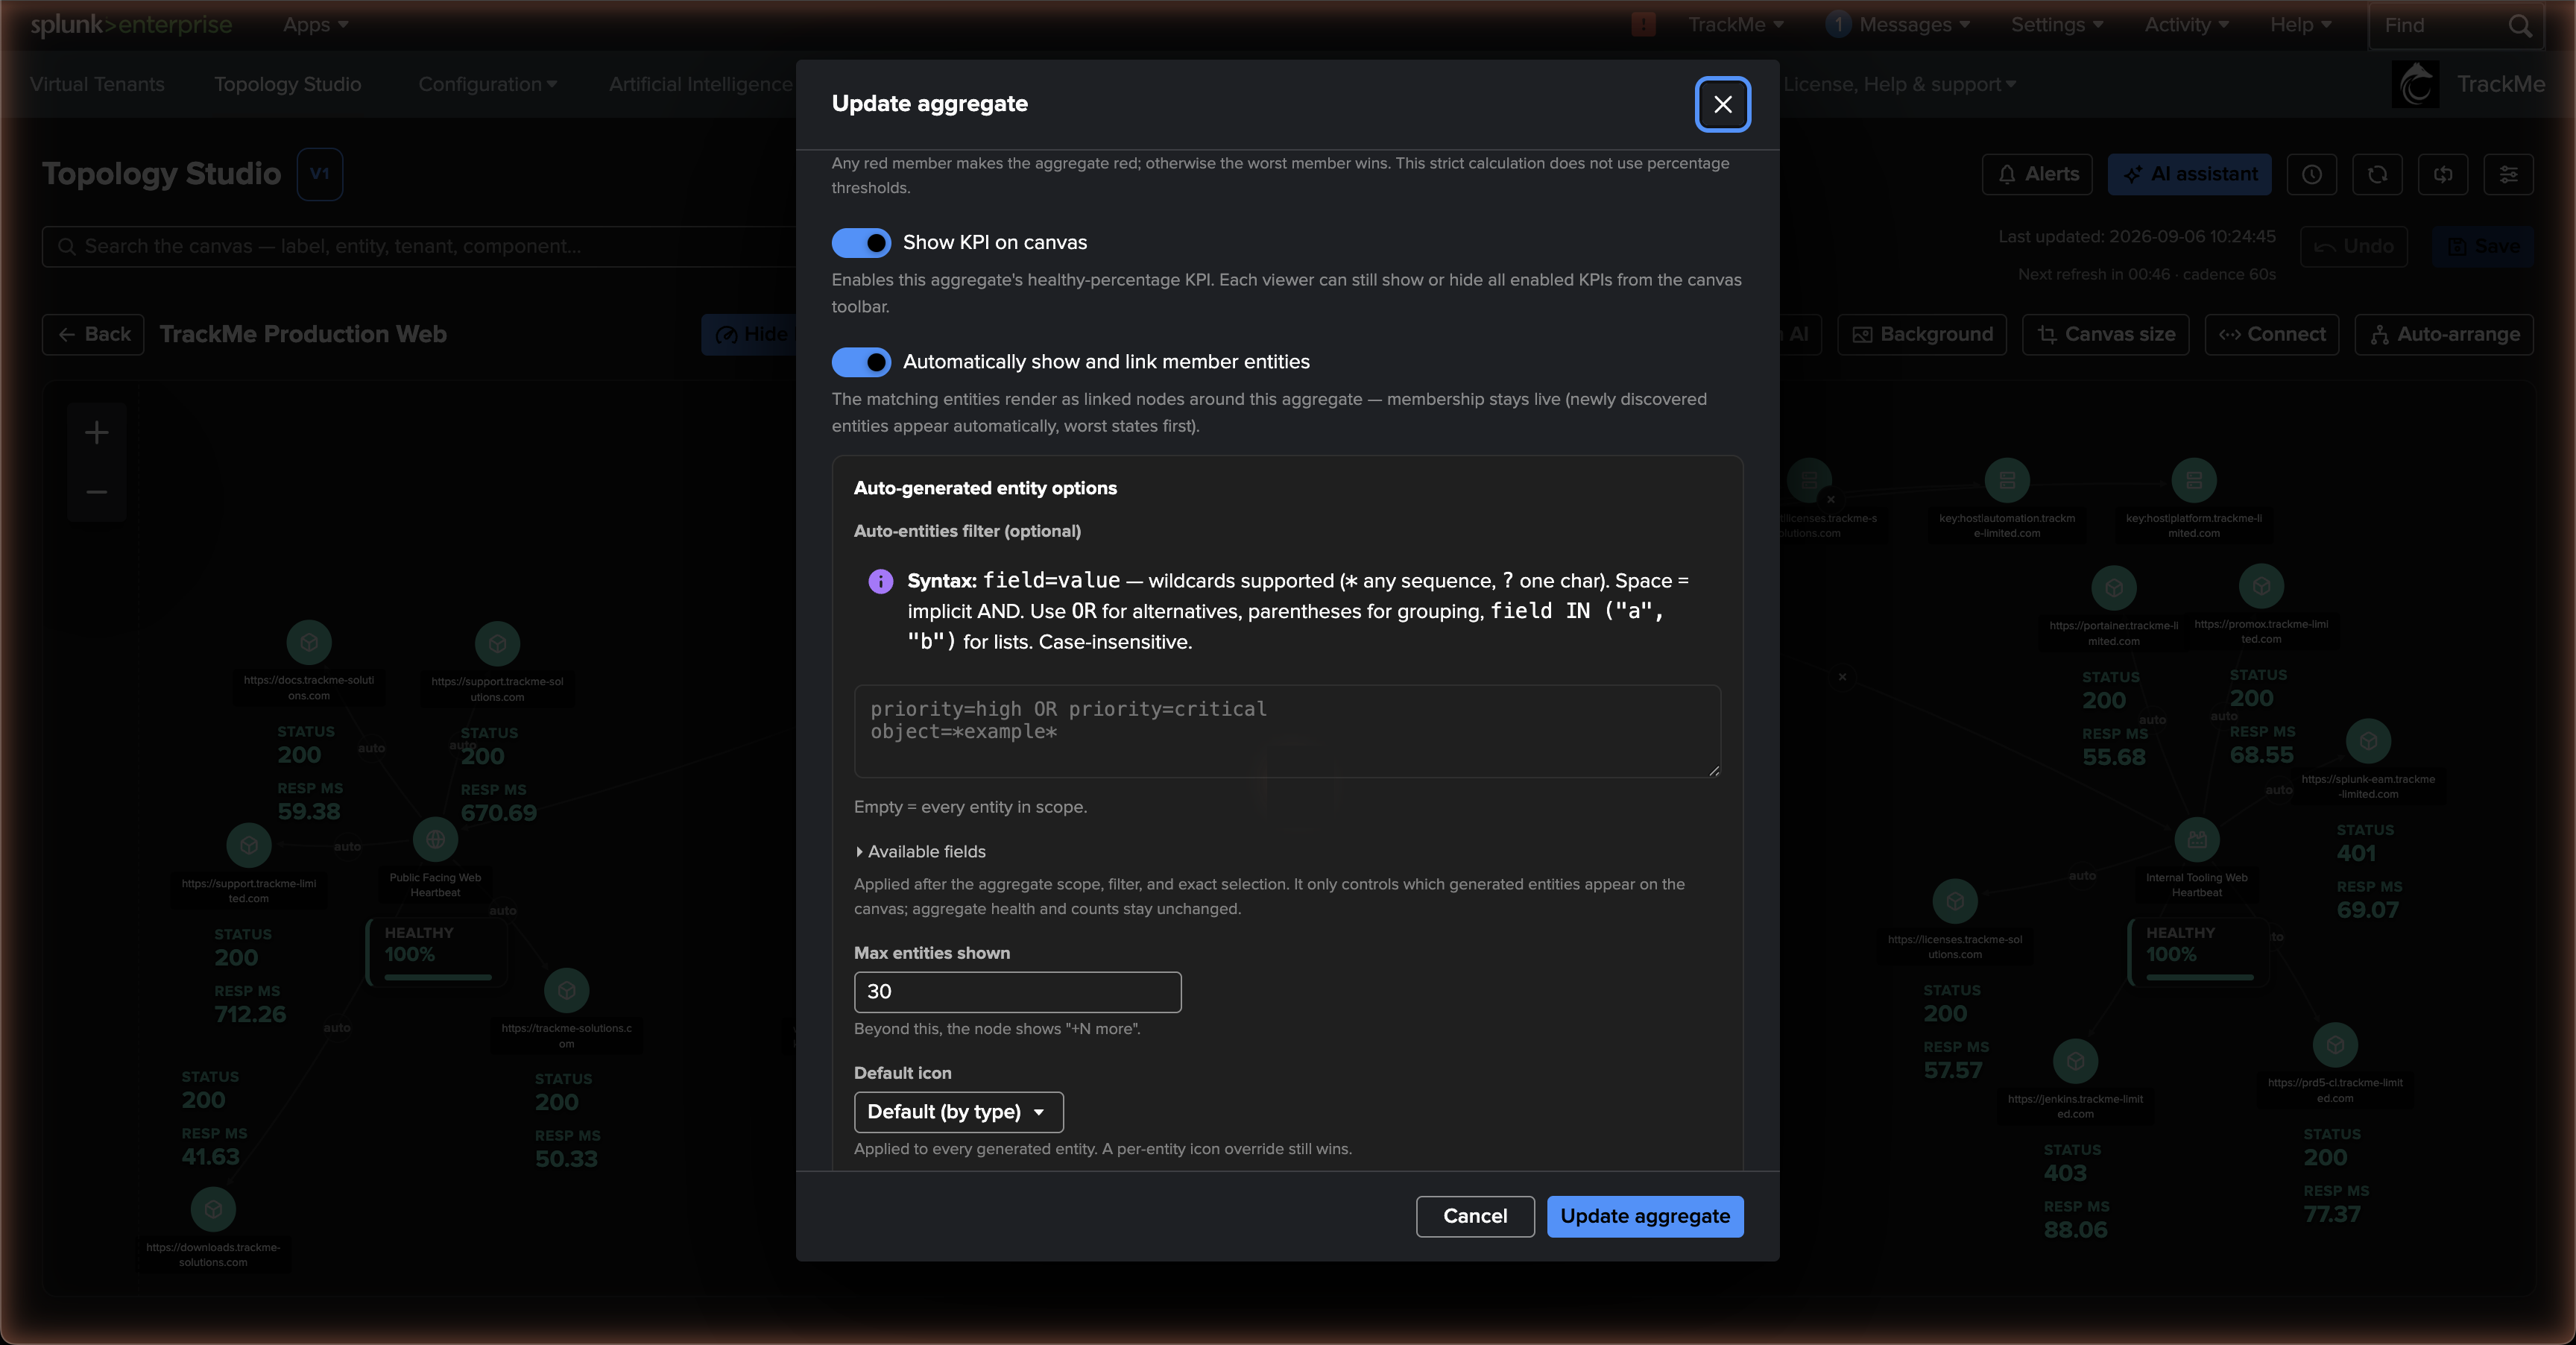
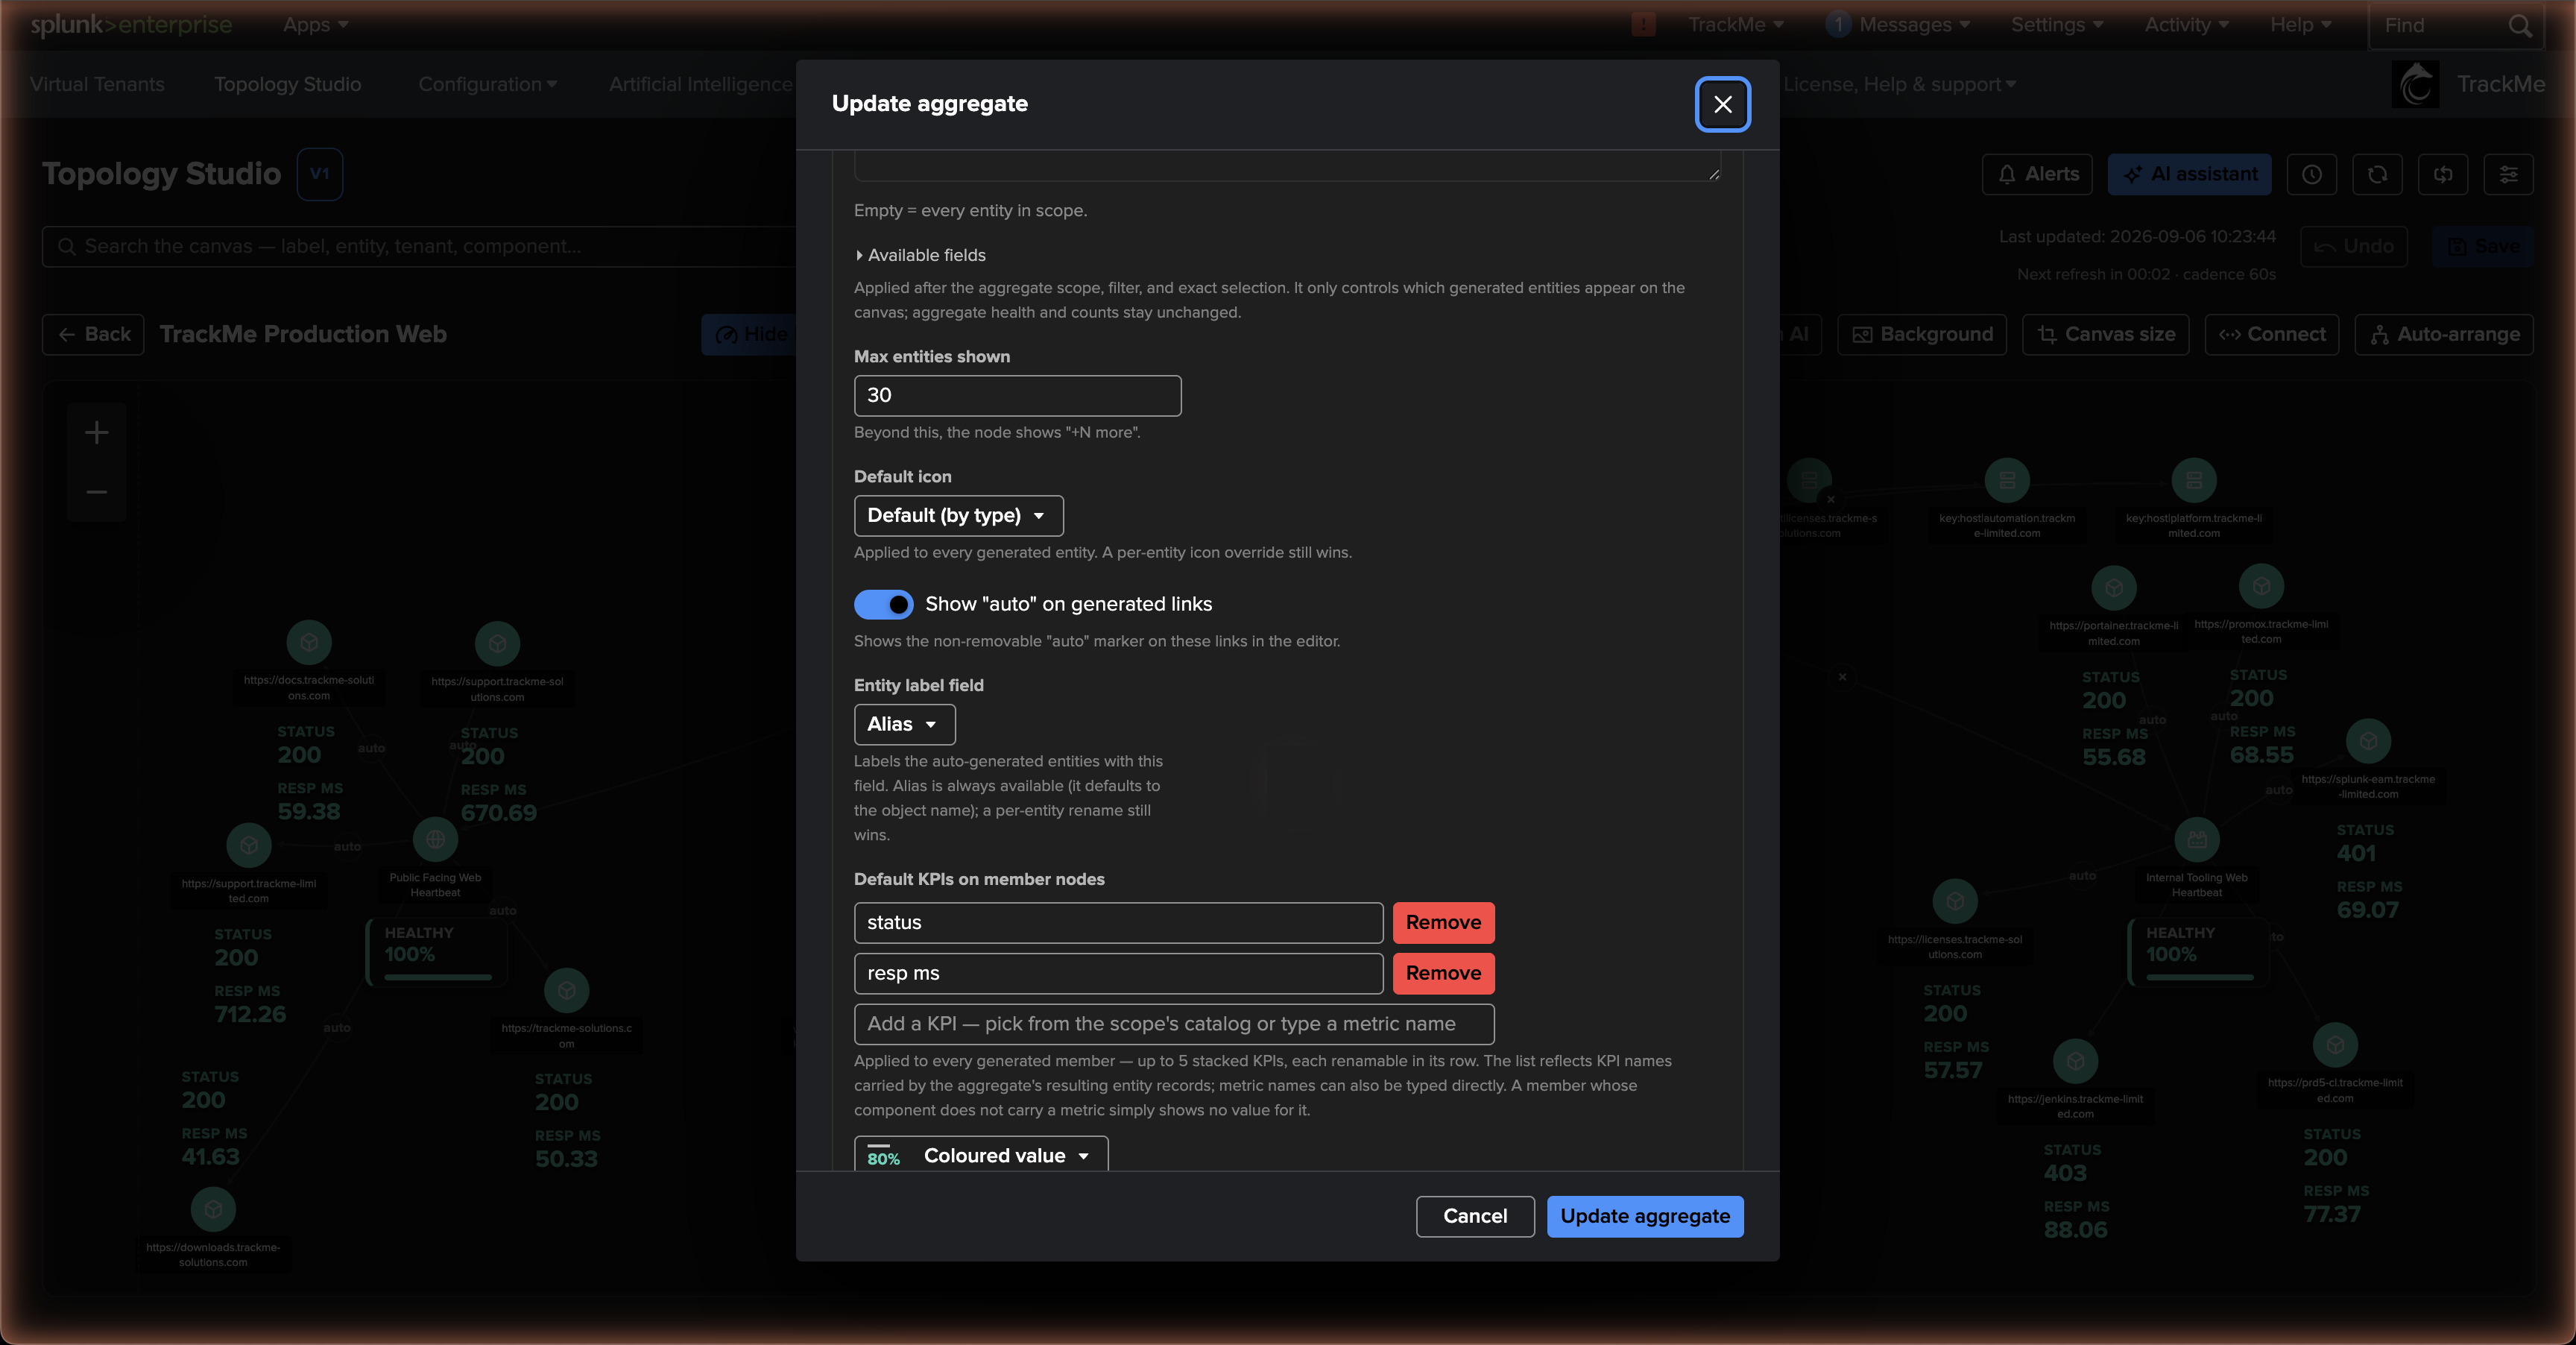
The Auto-generated entity options section of the aggregate dialog shapes that expansion (the options marked 2.4.15 are new in TrackMe 2.4.15):
Auto-entities filter (2.4.15) — a second filter, in the same grammar as the aggregate’s own, applied after the scope, filter and exact selection. It only decides which members appear on the canvas: the aggregate’s health, counts and alert evaluation still cover the full membership. Use it to draw the ten members that matter out of a 500-strong fleet without changing what the aggregate measures.
Max entities shown — the ceiling on drawn members, up to 500 per aggregate (2.4.15; 50 before). Beyond it the node shows +N more.
Default icon (2.4.15) — one icon for every generated member, from the catalog or your custom icons; a per-member icon override still wins.
Show “auto” on generated links (2.4.15) — shows or hides the non-removable auto marker on the generated links in the editor.
Entity label field — label members with their alias (the default) or the raw object name; a per-member rename always wins.
Default KPIs on member nodes — up to five stacked KPIs, each renamable, applied to every member at once with a shared display style — one setting instead of fifty. The picker is pre-populated from the members the expansion actually produces, and the same values appear on the canvas, in the inspector and in the server-rendered alert emails.
Individual members can still carry their own custom label and icon from the inspector.
Auto-generated members can also join your dependency map directly: connecting an edge to one pins it — the member becomes a permanent entity node (keeping its name, icon and position, still linked to its aggregate), so membership changes no longer remove it and your edges stay valid. Search finds them, KPIs follow them, and the alert email renders them exactly once.

Adding view nodes — views inside views
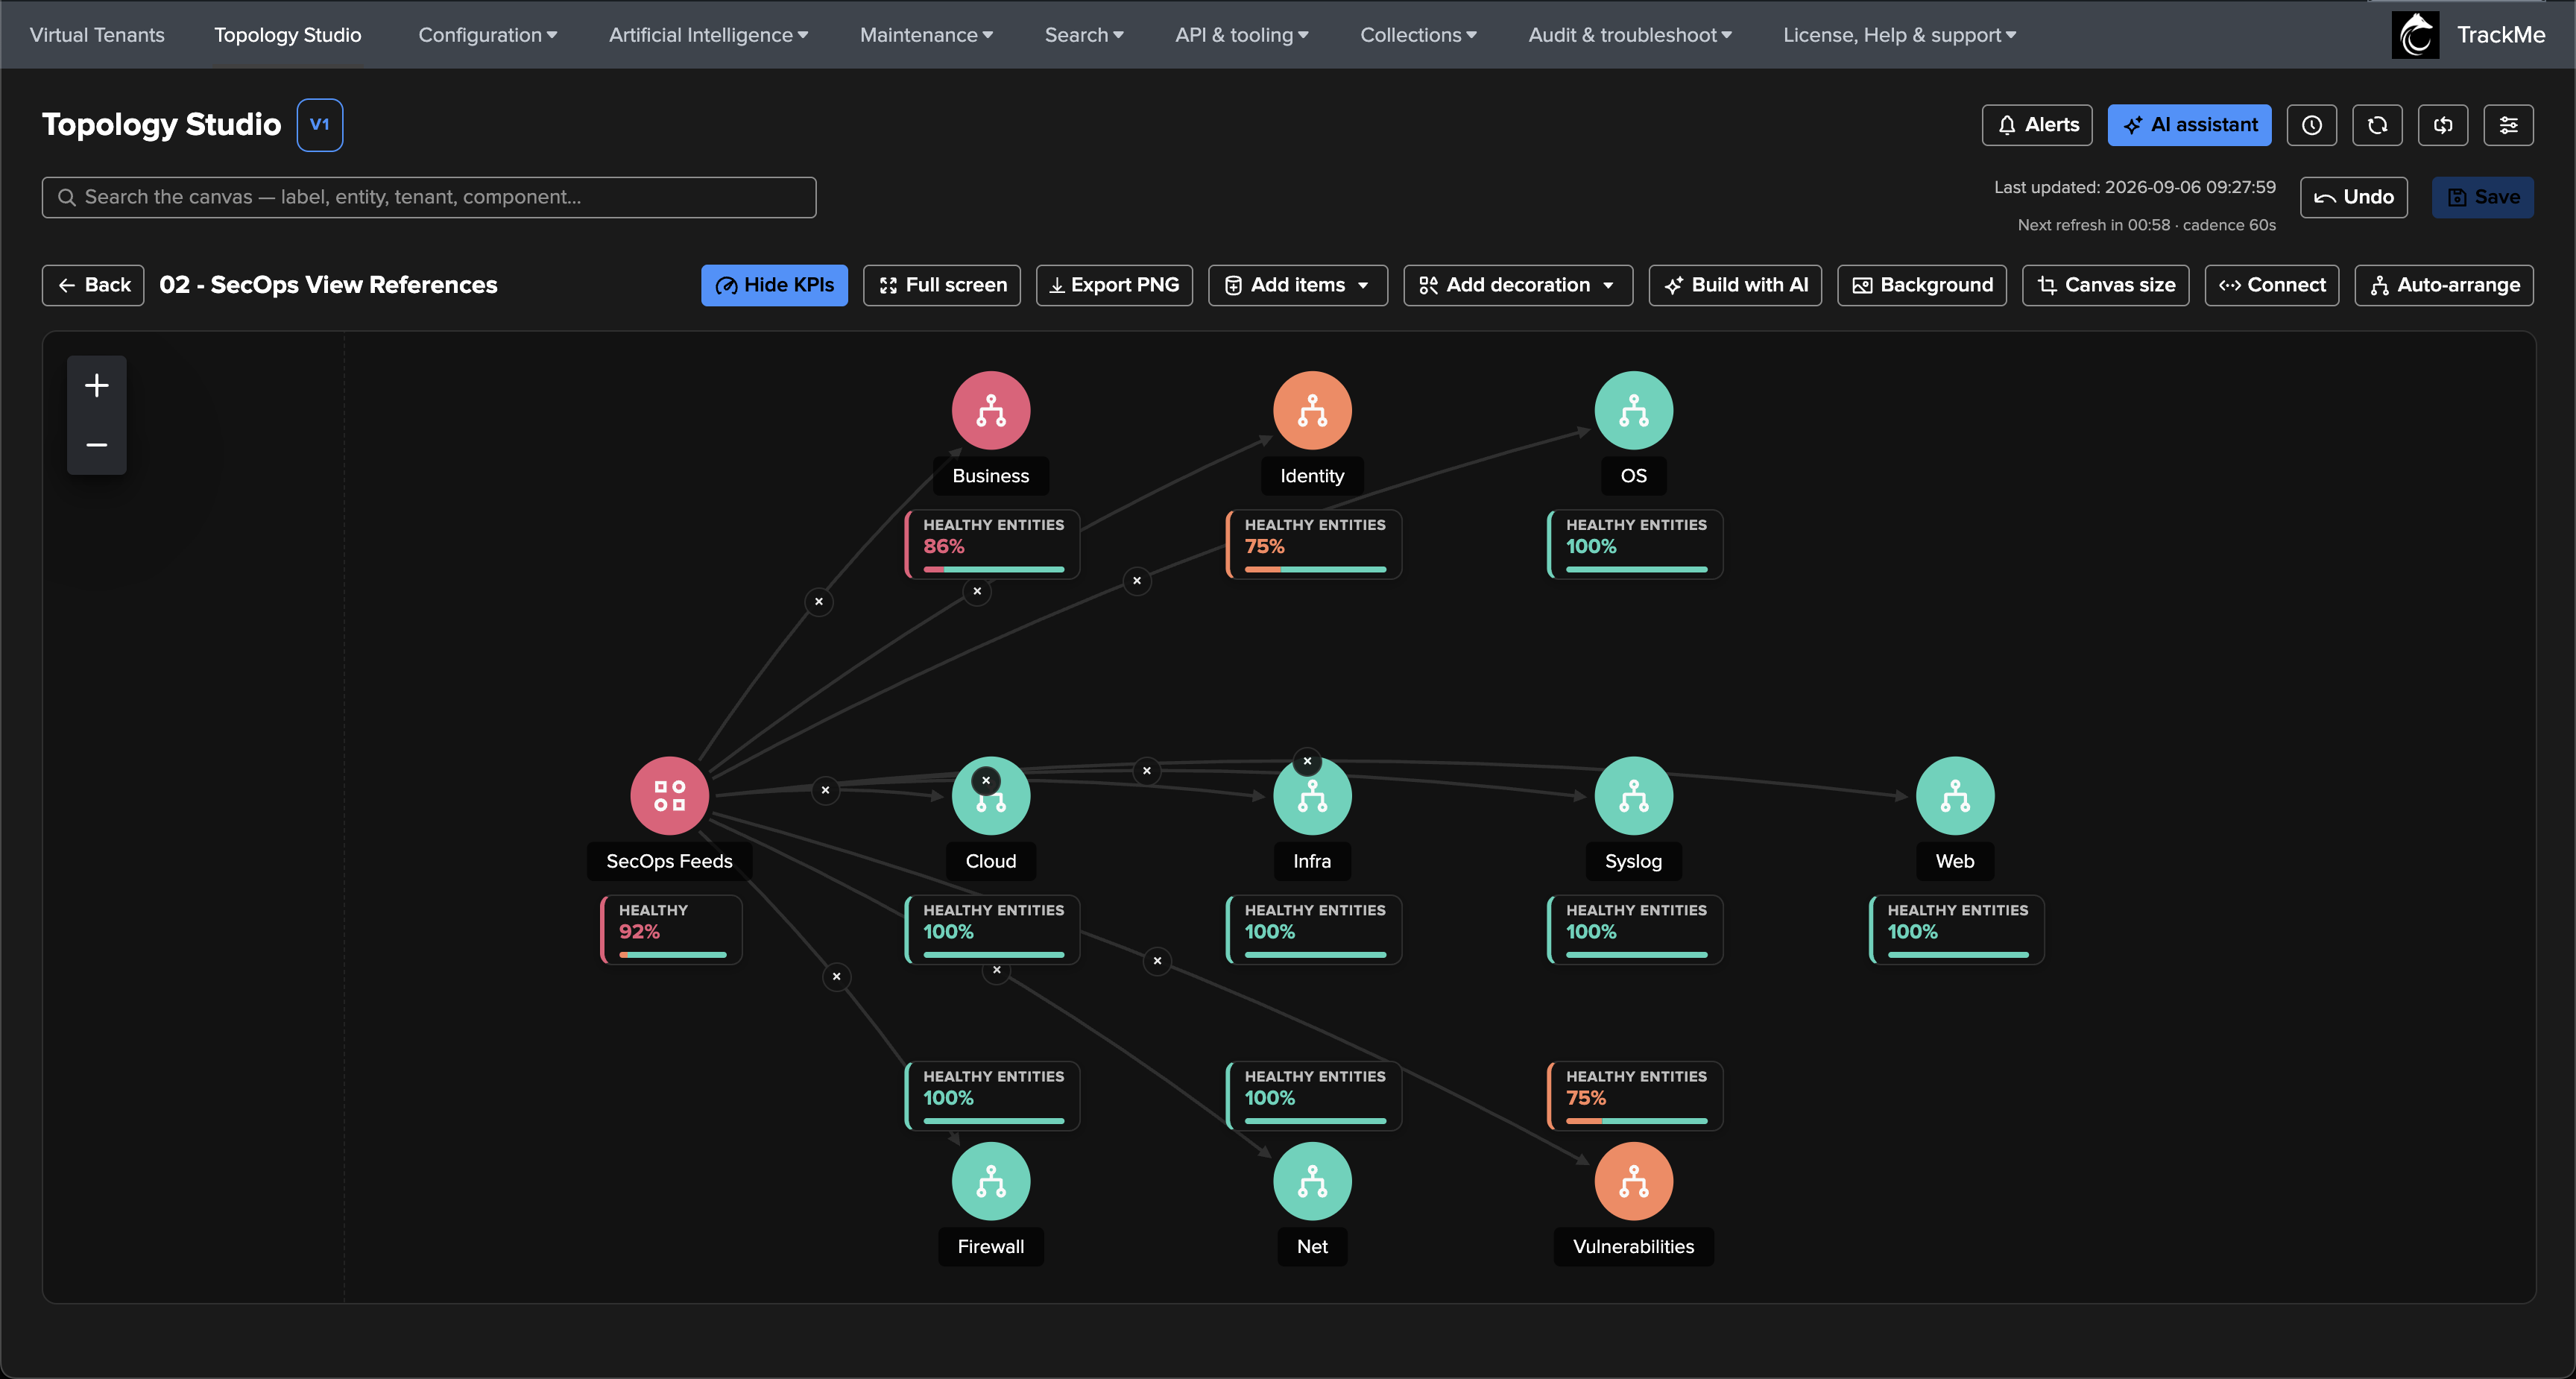
Since TrackMe 2.4.15, a saved topology view can itself be placed on a canvas as a view node: one health node that stands for the whole referenced view. This is how a map of maps is built — an estate modelled as layered, independently owned views, each rolled up into the one above it. The referenced view keeps ownership of its graph, its aggregate policies and its own Topology Alerts; the parent stores its identifier only, never a copy, so anything saved in the child is reflected at the parent’s next refresh.
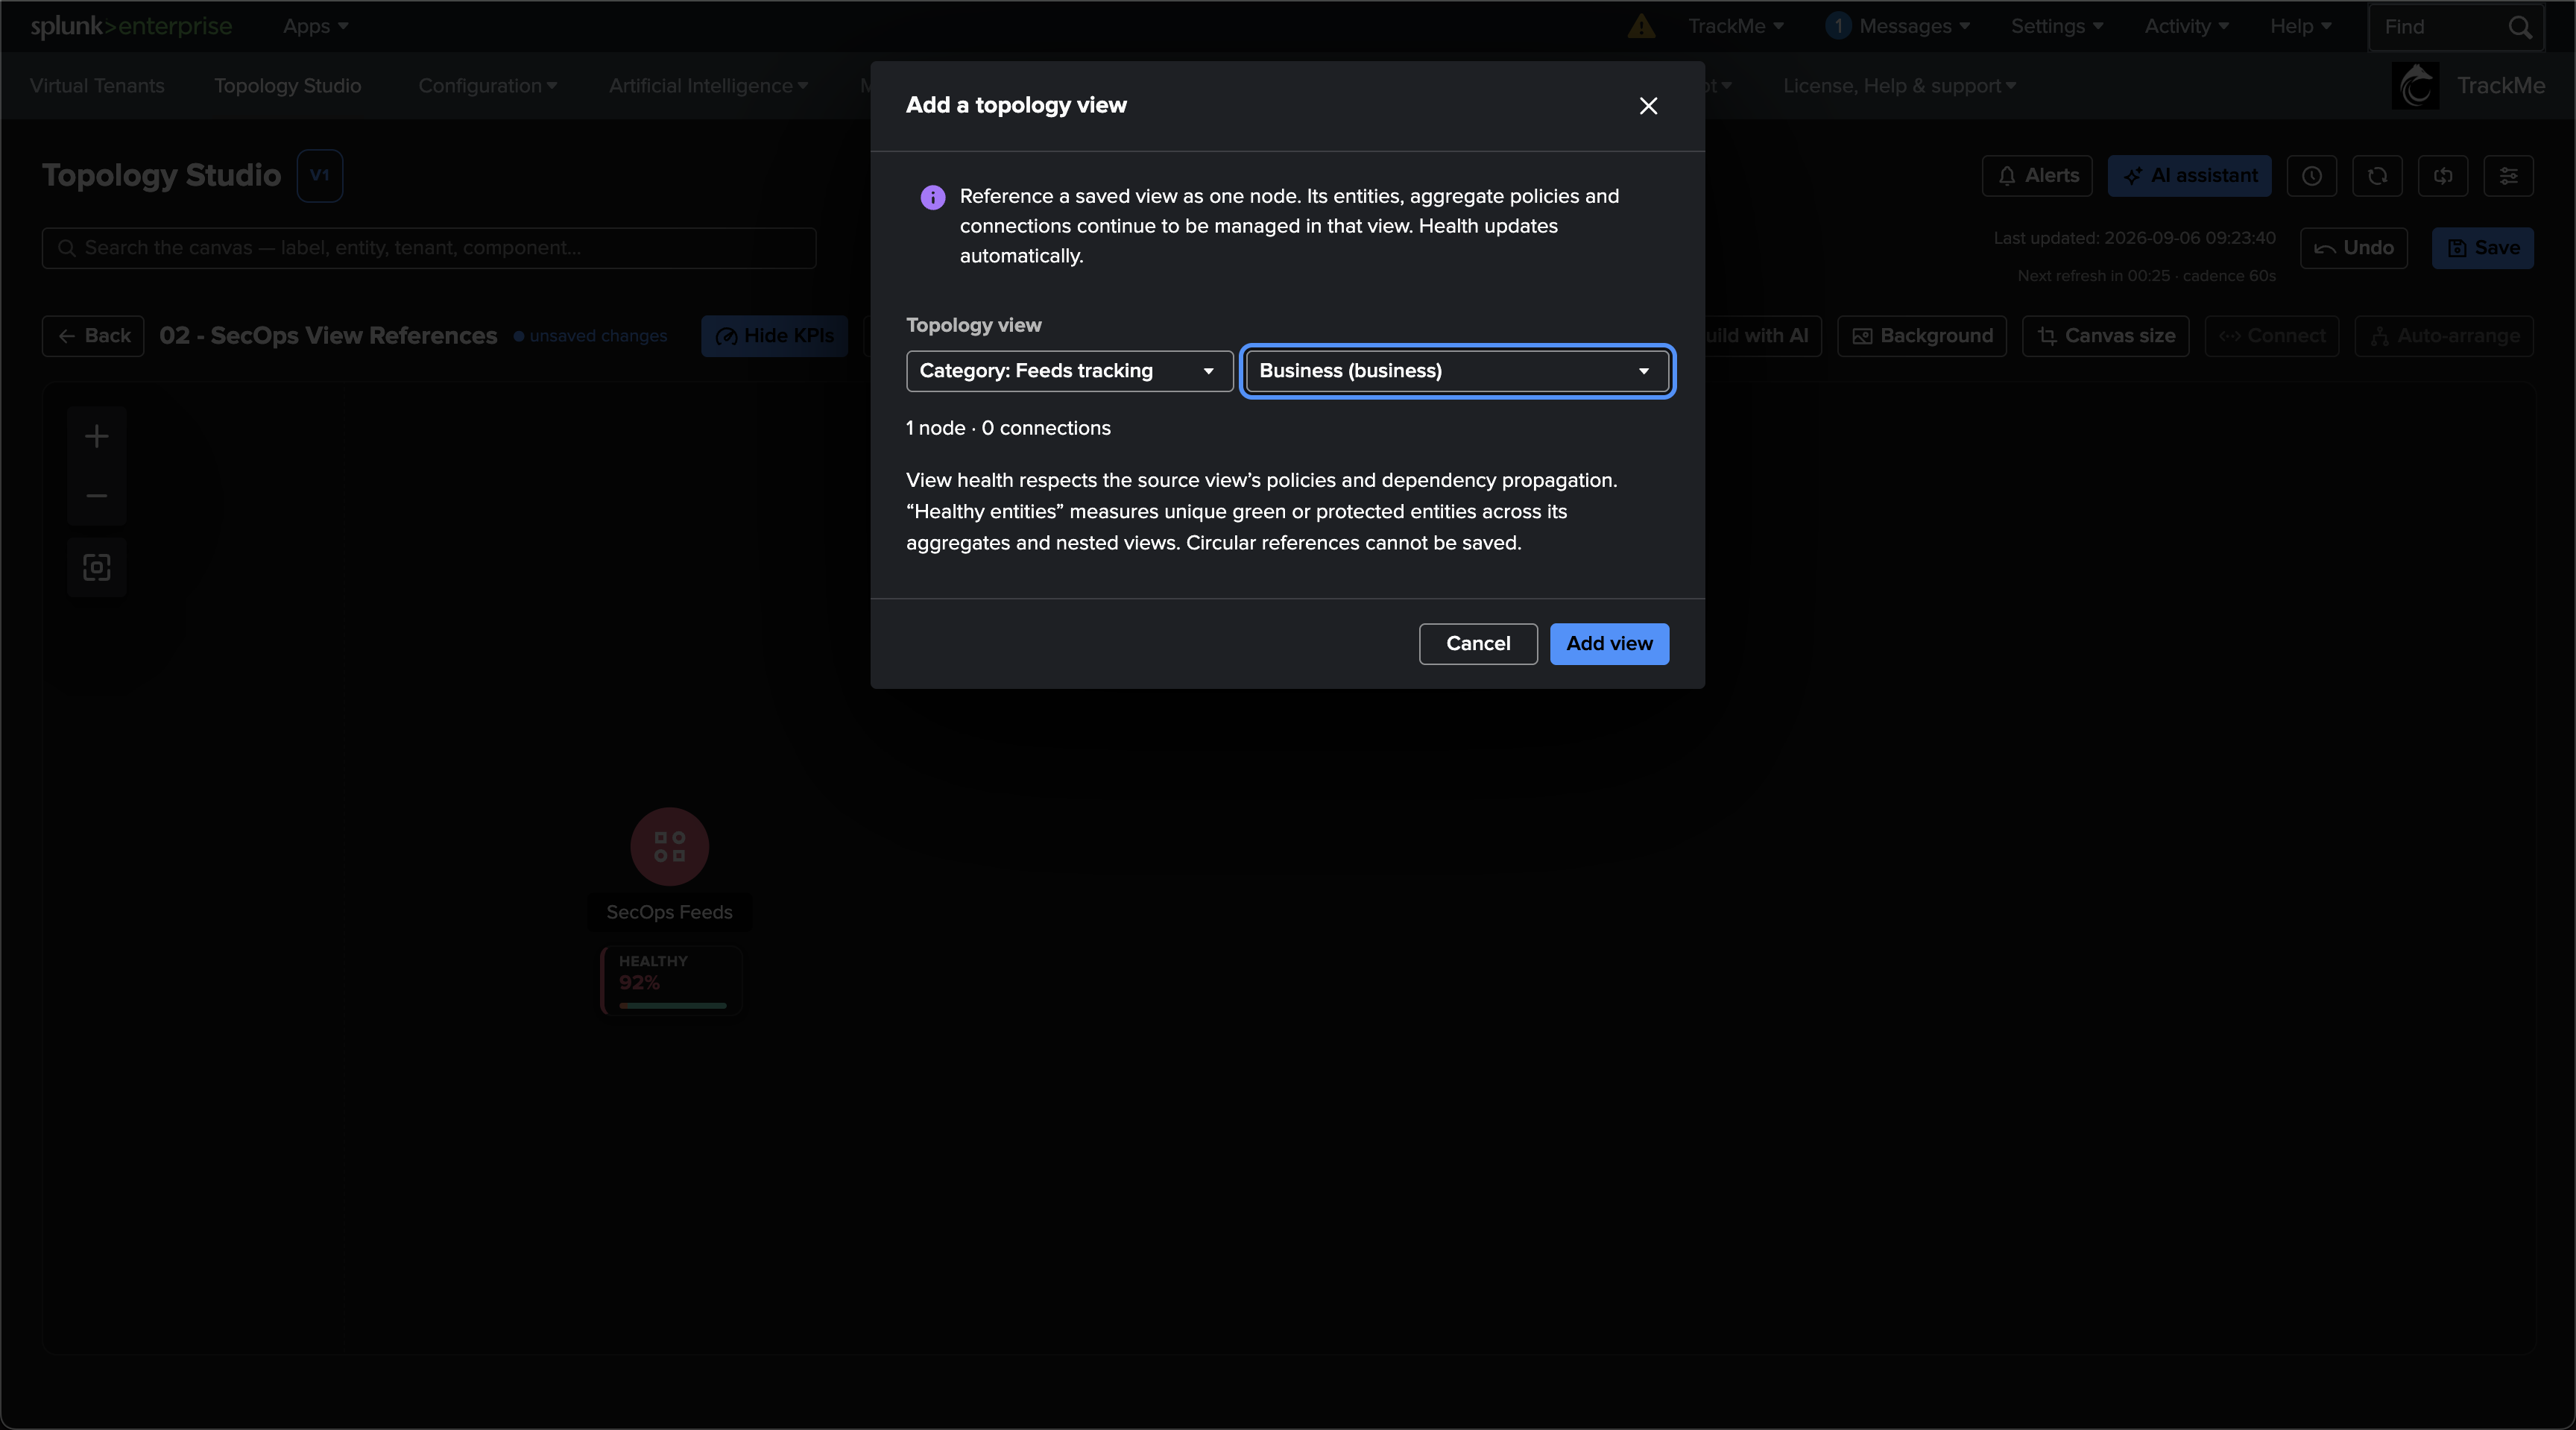
Open Add items → Add view (the empty-canvas guide’s View card and the canvas right-click menu lead to the same dialog). The dialog lists the views your roles can read, with a category filter and a search by name or identifier; the current view and views already on the canvas are excluded. Selecting a view shows its size (nodes and connections) before you add it. Circular references cannot be saved — a view can never reference itself, directly or through other views.
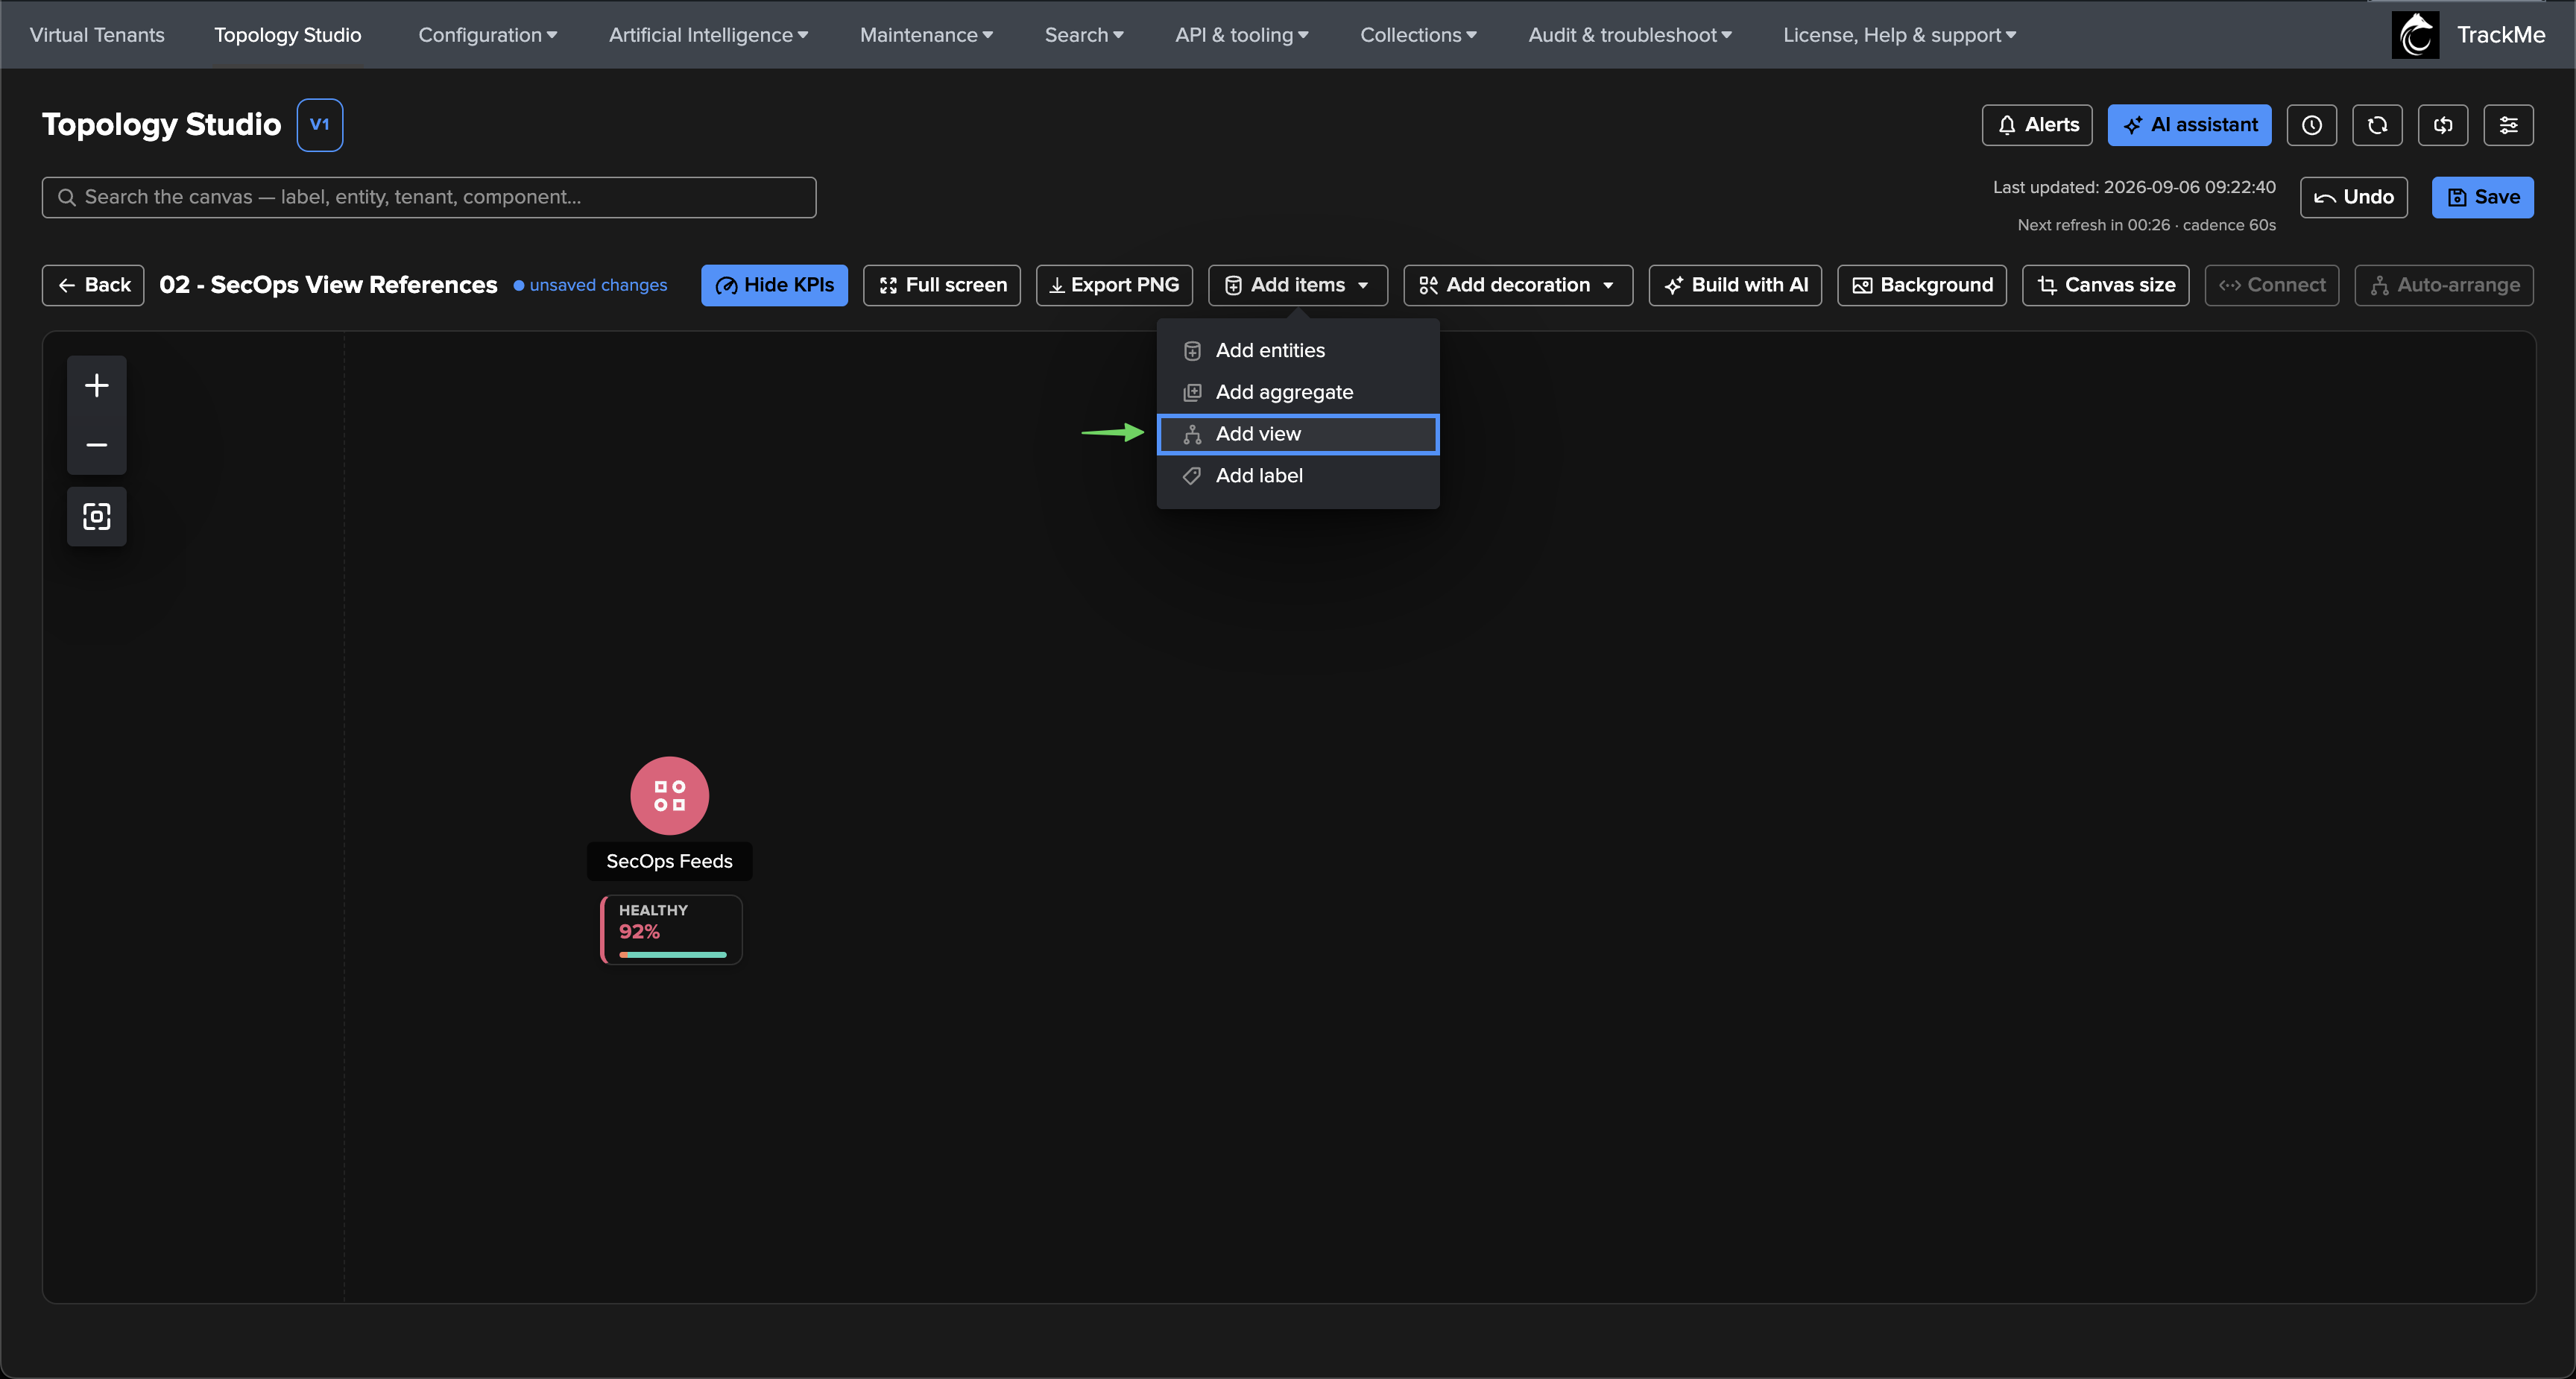
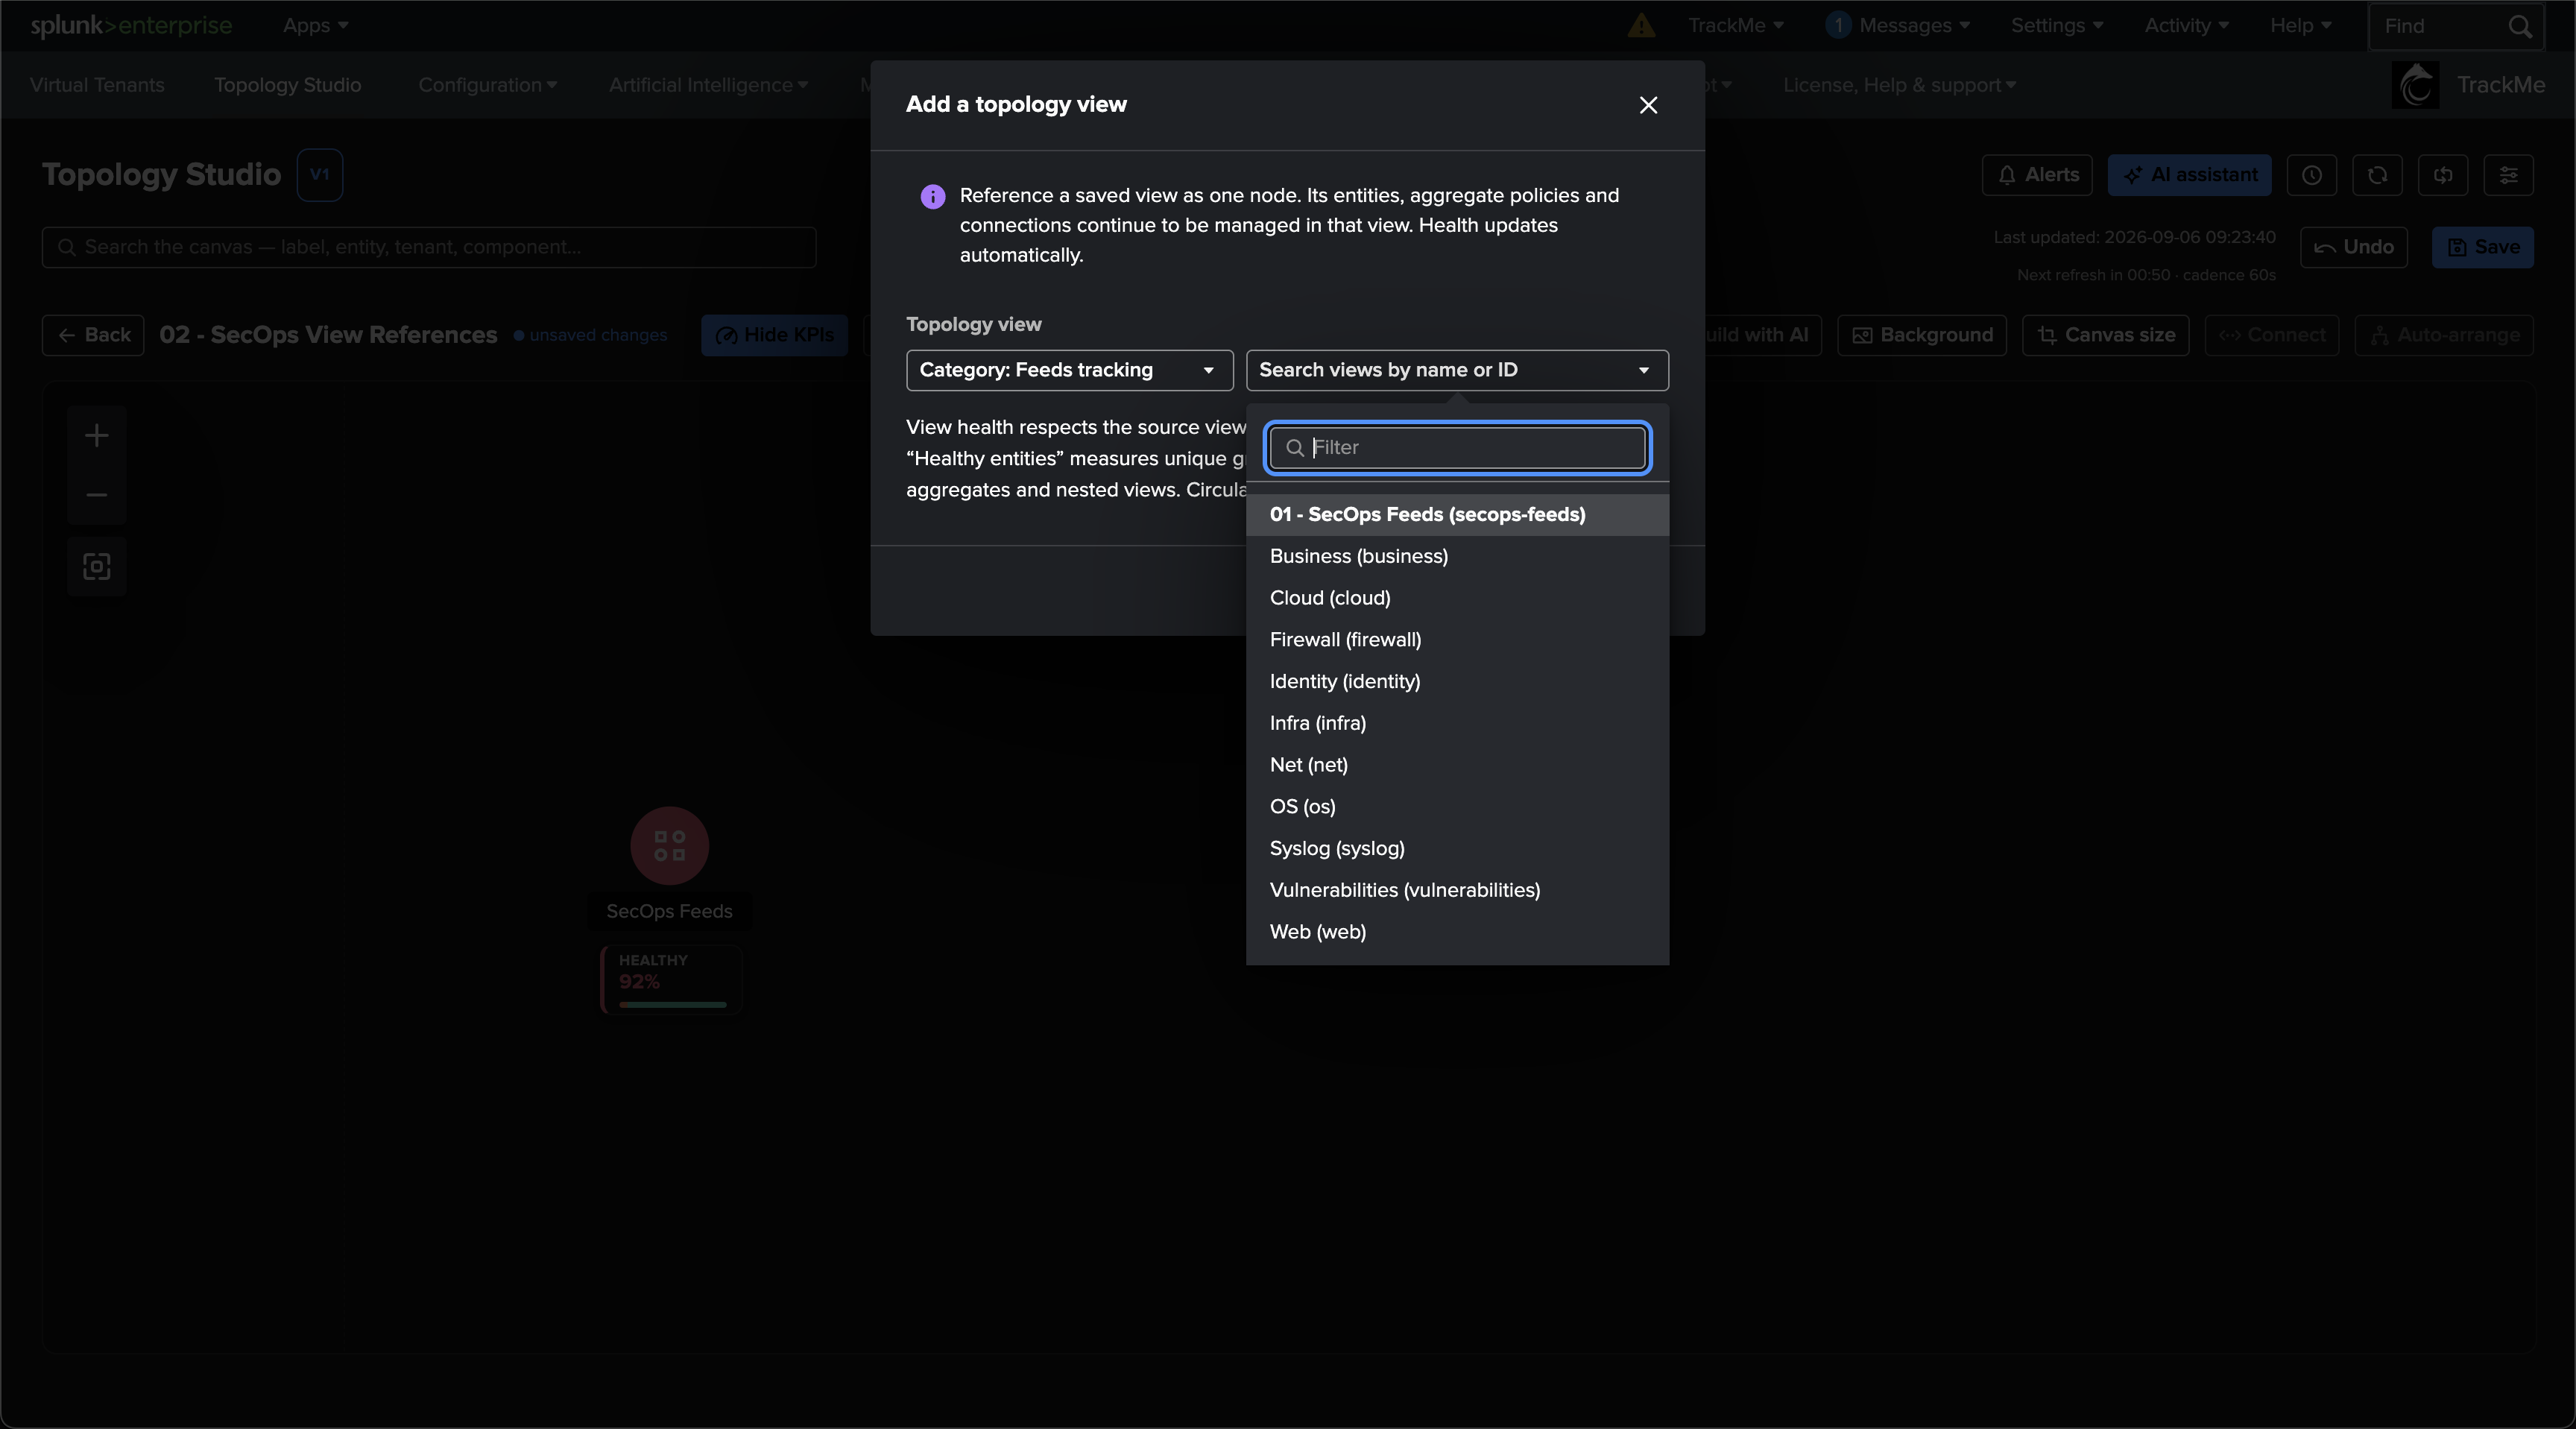
Once on the canvas, the node behaves like any other: move it, rename it, change its icon, connect it with edges, include it in bulk selections and, if you wish, let it propagate its state to what depends on it. What it shows comes from the child:
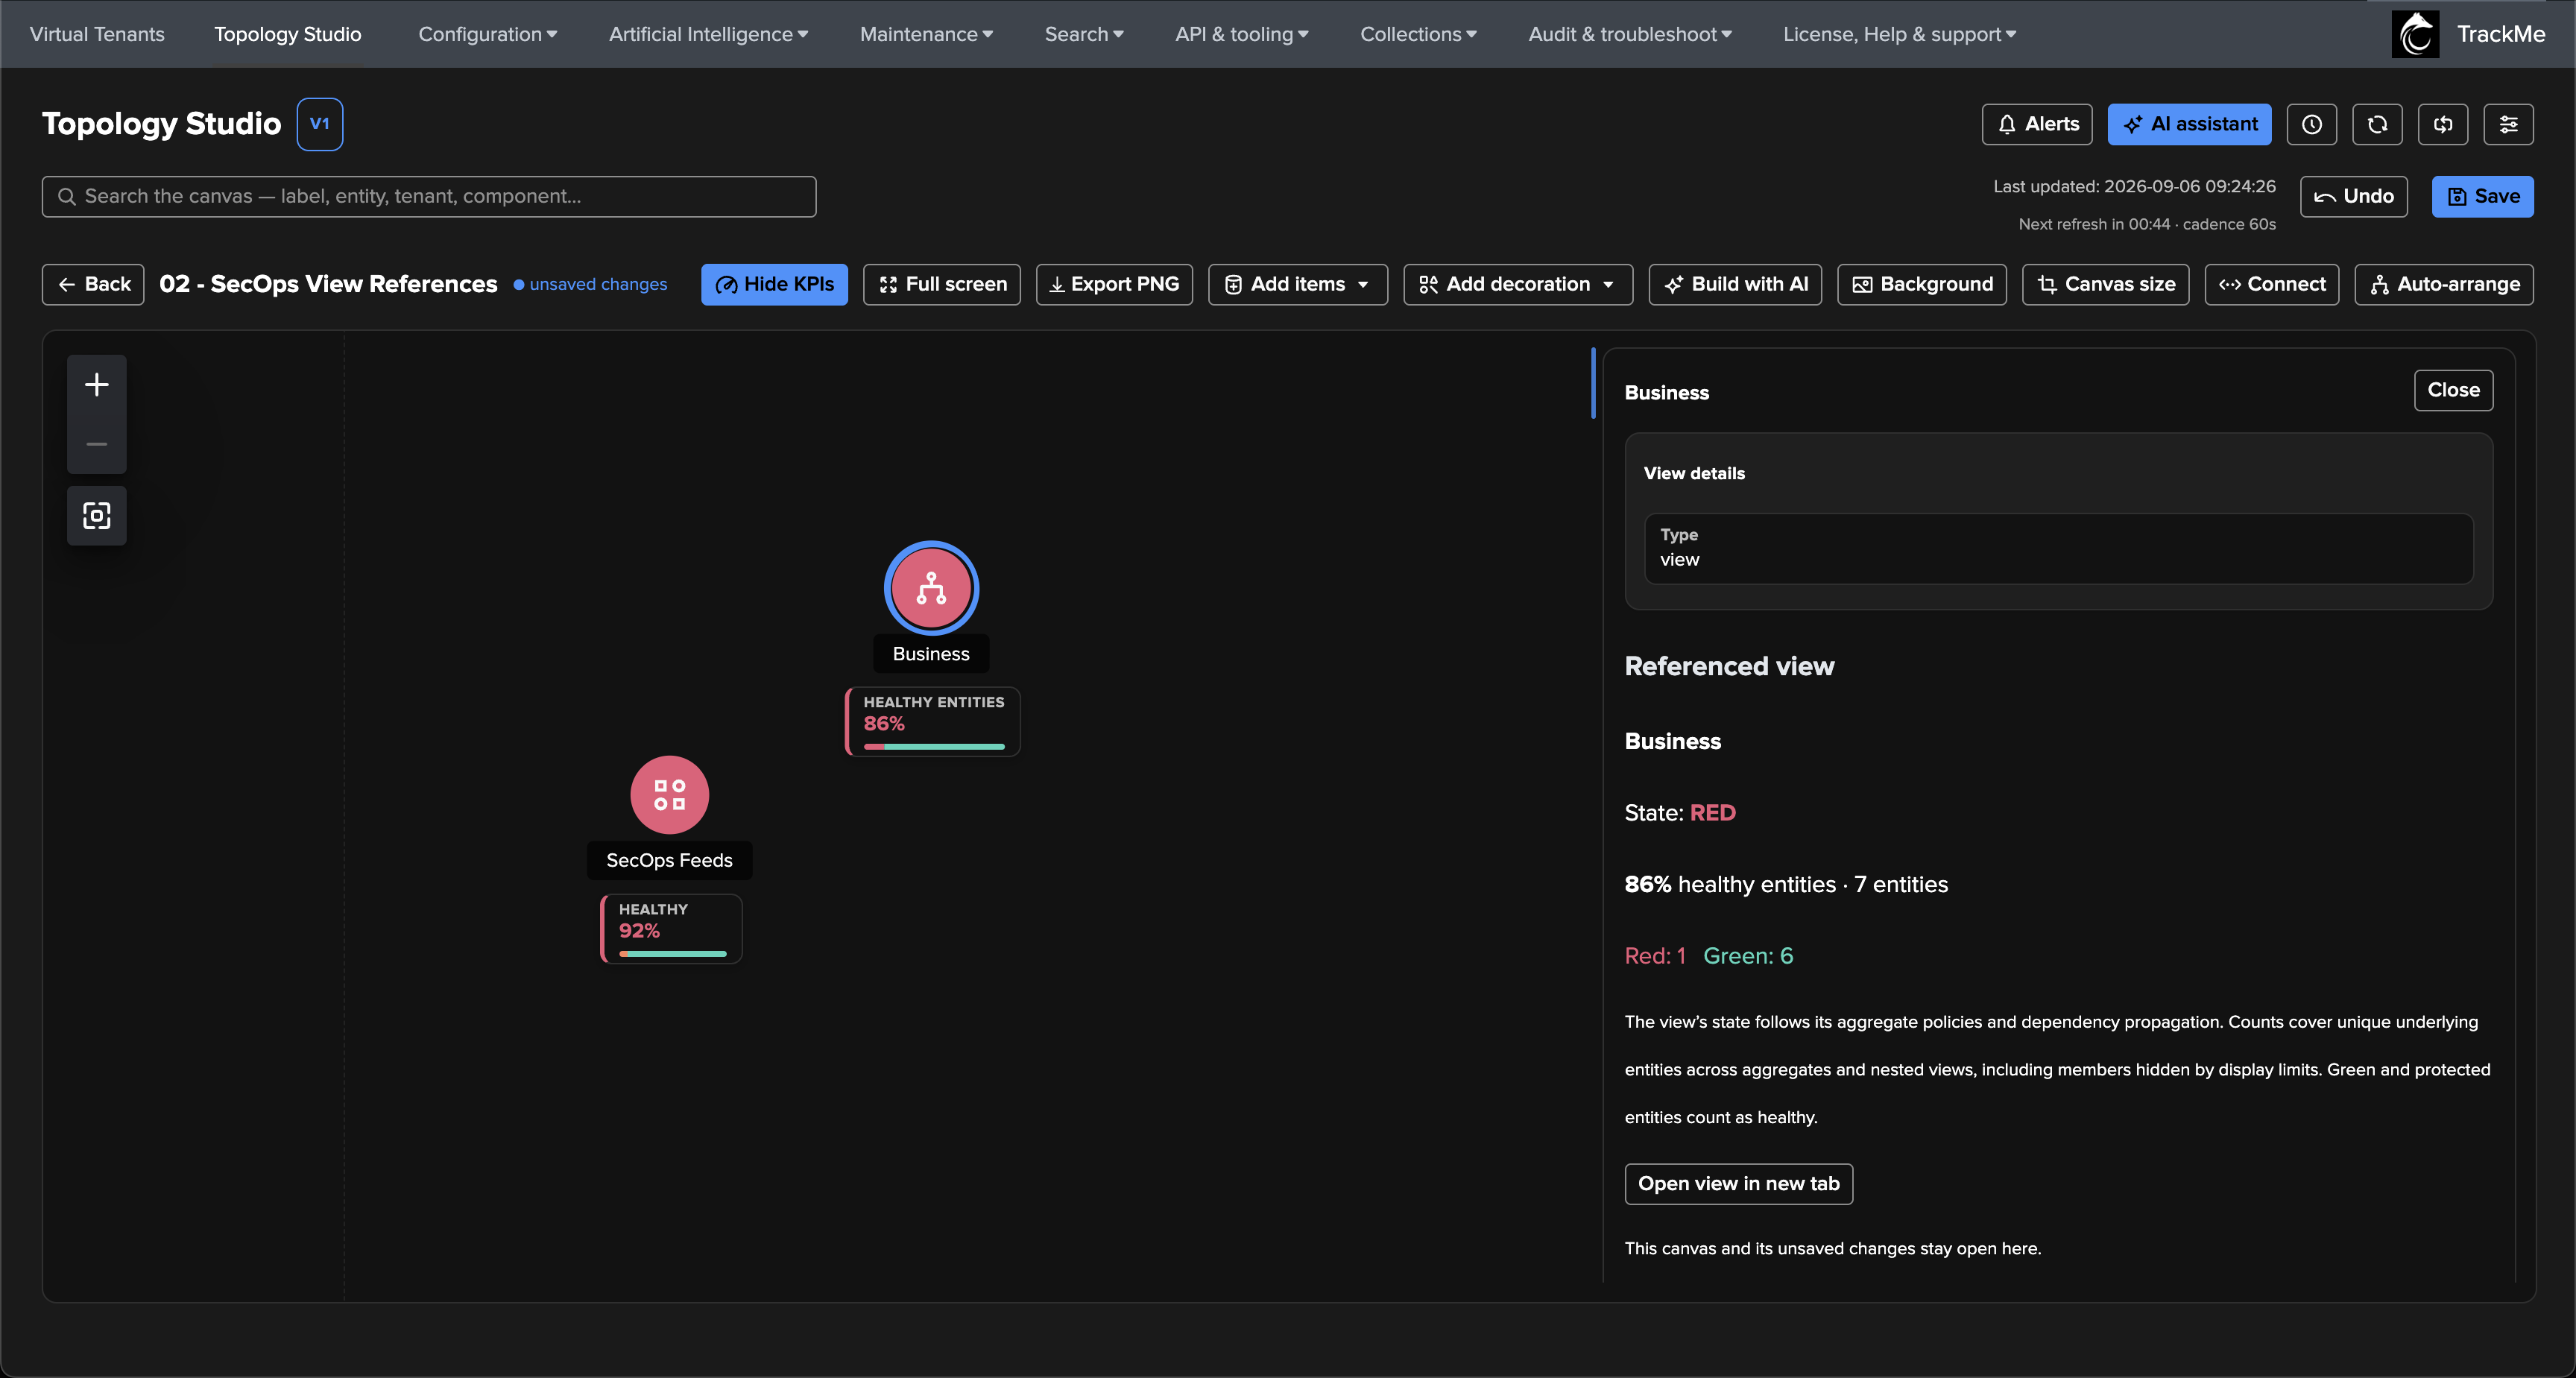
State — the worst effective state of the child’s health nodes (entities, aggregates and nested views), taken after the child’s own aggregate policies and impact propagation. Labels and decorations contribute nothing.
KPI — the Healthy entities card, enabled from the inspector’s KPI display section, shows the percentage of healthy unique underlying entities across the child’s aggregates, direct entities and nested views — members hidden by display limits included, overlaps deduplicated by tenant, component and key. Green and protected entities count as healthy. The percentage is deliberately separate from the policy-driven colour: a child that is red because one aggregate breached its policy can still report 86% healthy entities · 7 entities — both are true.
Inspector — the Referenced view section names the child, gives its state, its healthy percentage and per-state counts, and offers Open view in new tab: the child opens in its own tab while this canvas, its viewport and its unsaved edits stay exactly where they are.
To point a node at a different view, remove it and add the desired view — removing a view node removes the reference and its edges only; the referenced view is untouched.
A few rules keep views inside views safe at any depth:
Permissions at every hop. Your read access to the referenced view and to every tenant it reaches, through any depth of nesting, is checked on every refresh. A child you are not allowed to read renders neutrally with the notice This view or its contents are outside your permissions — and a missing view looks exactly the same, so a guessed identifier reveals nothing. A parent that contains references you cannot read opens read-only.
Fail closed. A cycle introduced after validation, an incomplete read of the child, or an exhausted budget makes the reference report unavailable health — never green. The bounds are generous (up to 12 nesting levels and 100 distinct views per evaluation) and no hand-authored estate approaches them.
Alerting and portability. A view node is one alertable item in Topology Alerts — selected explicitly or through all nodes — and its transitive tenants count for scoped maintenance; the child’s own alerts stay independent and are never executed by the parent. History, duplication and portable export keep the reference by identifier, but an archive does not bundle the child views: import the dependencies first, with the same identifiers, on the destination.
Integrity. A reference to a deleted view, at any depth, is reported by the view integrity checks.
Tip
Build with AI can compose view nodes too: it discovers the saved views you are allowed to reference and places them alongside aggregates and entities in its draft, and Save re-checks permissions and cycles like any other write.
Adding auto aggregates
Add items → Add auto aggregate creates a health parent with only a label. Connect each contributing entity, aggregate or view to the parent. Its colour follows the worst effective child state; its KPI counts each underlying entity once. There is no scope, filter or separate health policy on this parent.
You can also select an existing label and choose Convert to auto aggregate in its inspector. Identity, position, icon and links are preserved; verify the link direction before saving. Follow the illustrated auto aggregate guide for the full workflow and health rules.
Labels, icons and background
Label nodes are free-text annotations with color control — name your zones, tiers and flows. They do not contribute health; convert a label to an auto aggregate when it should become a health parent for its connected items.
Node icons: pick from a catalog of 74 icons with keyword search (databases, networks, clouds, applications, pipelines…). The same icons appear in the server-rendered alert emails.
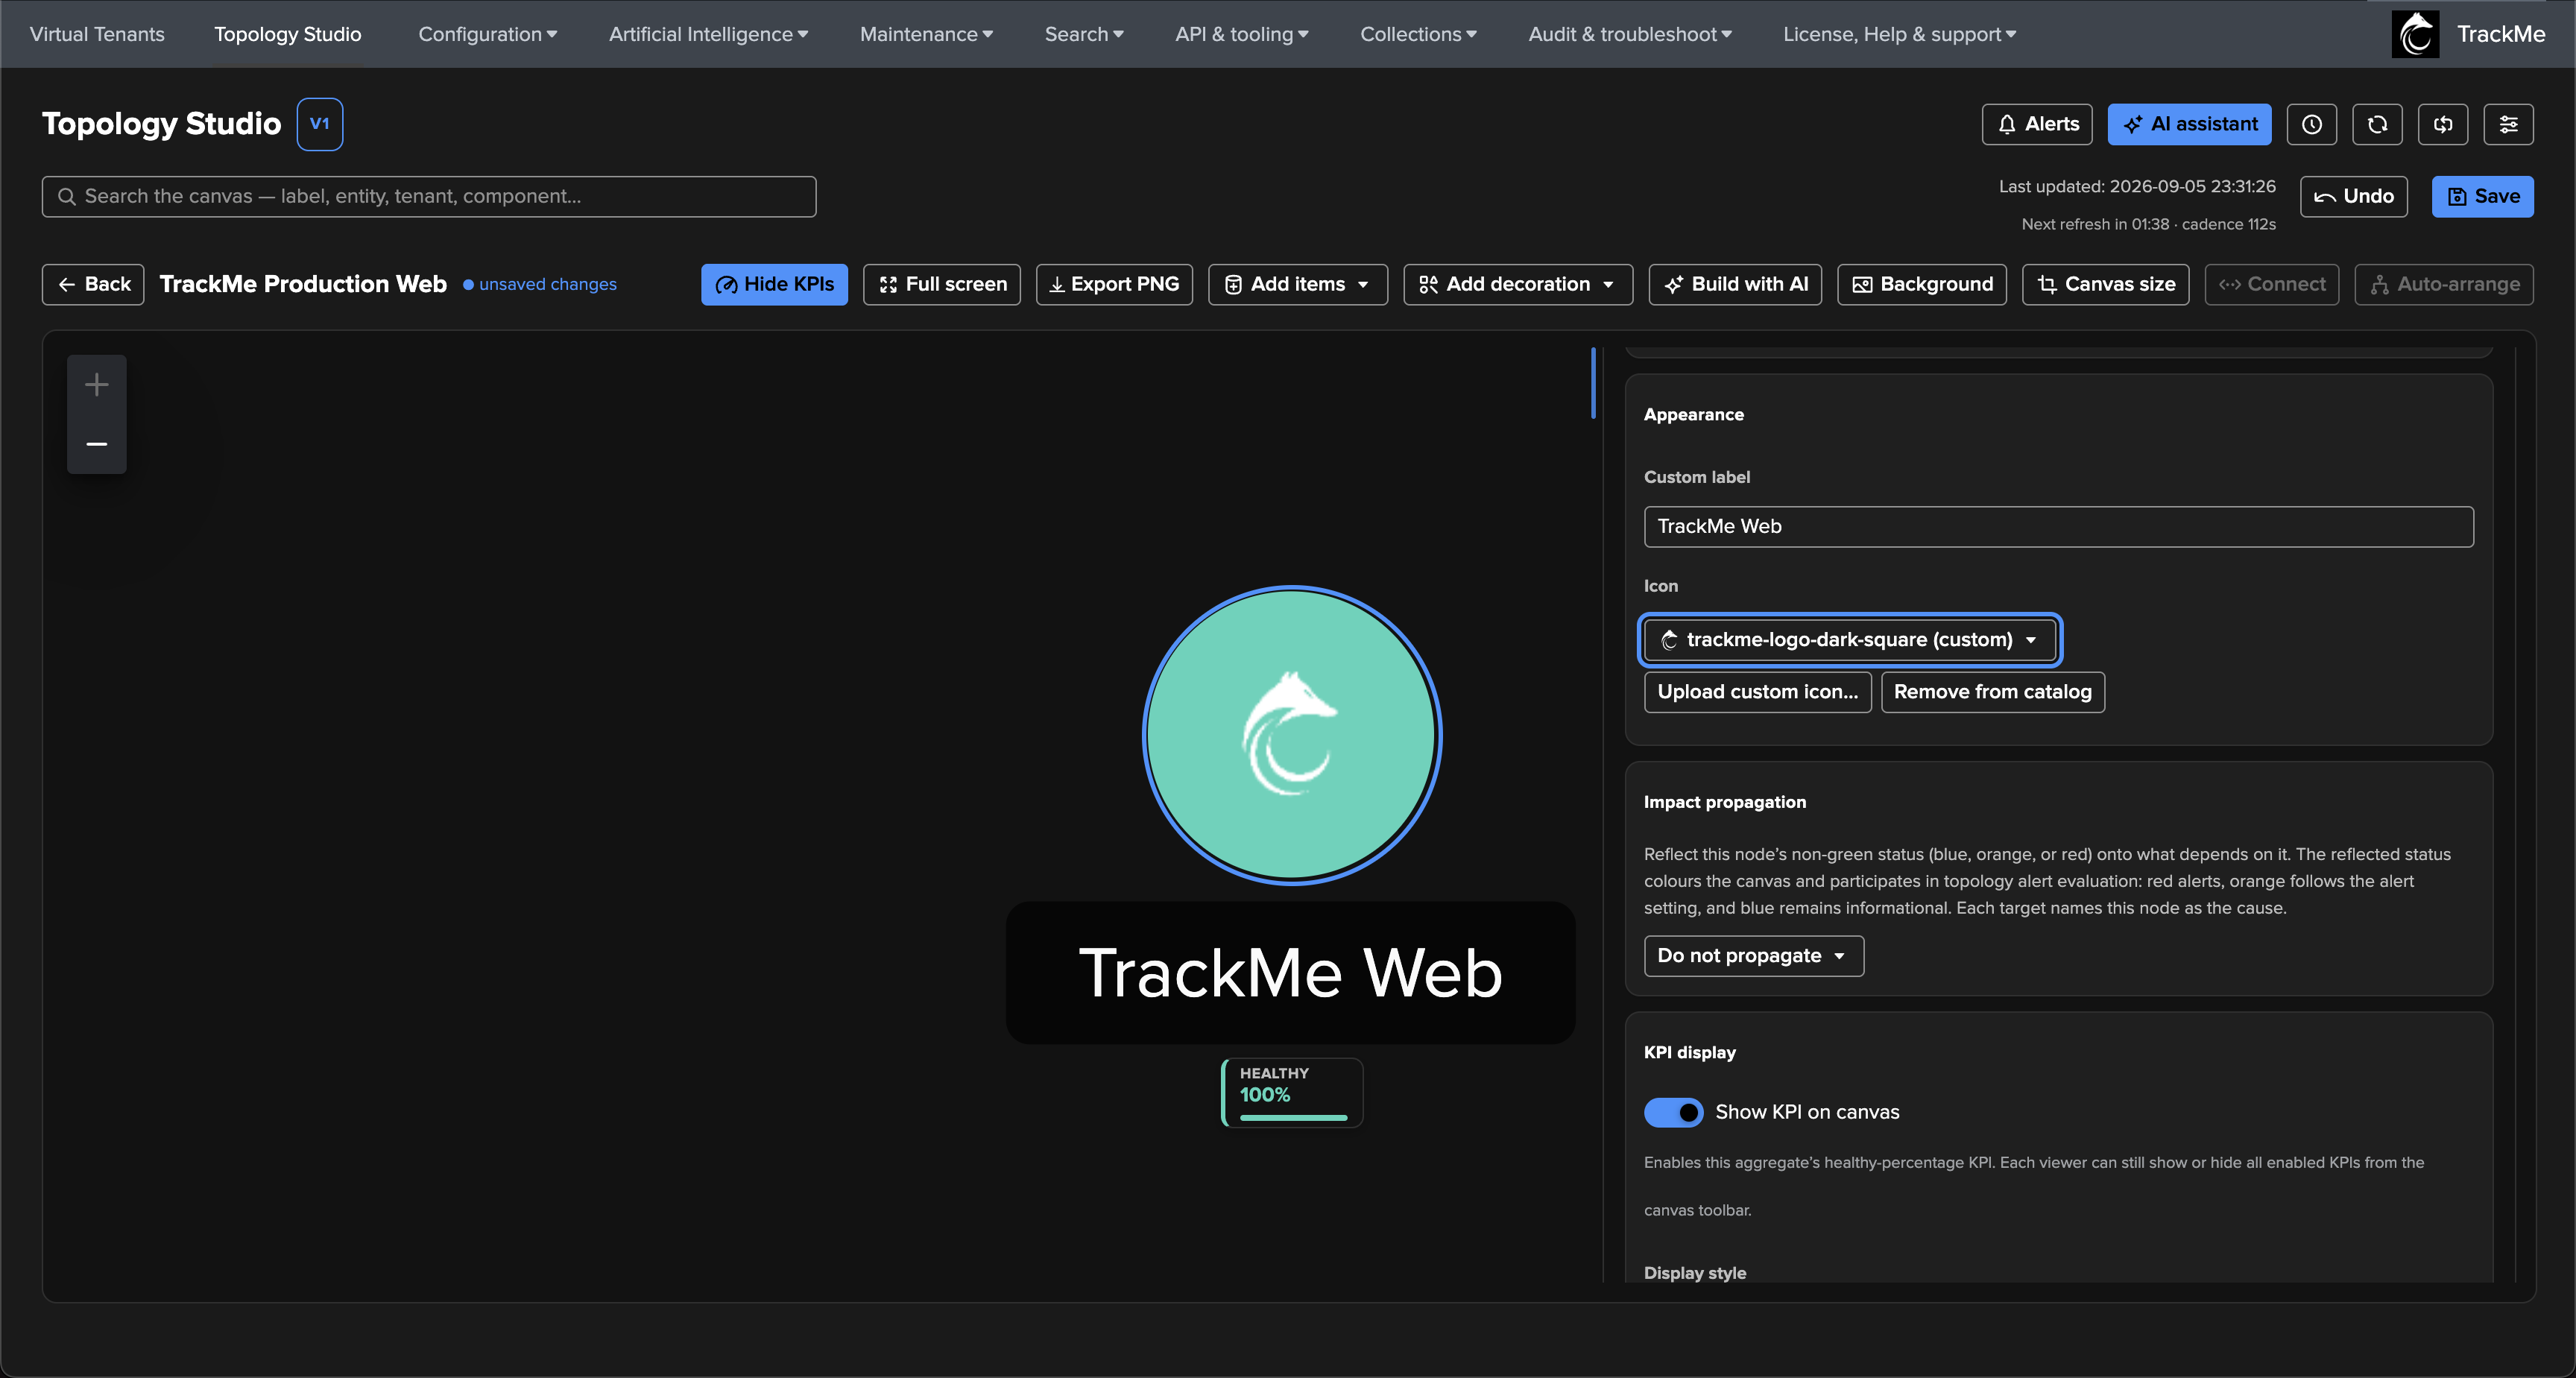
Custom icons: upload your own images — vendor logos, team emblems, product marks. TrackMe normalizes any picked image into a crisp square icon and stores it in a deployment-wide catalog: upload once, and every author sees it in the picker (a Custom section with live thumbnails) across every view. Uploads are validated server-side (PNG/JPEG, size and pixel-dimension caps), and a deleted custom icon degrades gracefully — nodes fall back to their default glyph, nothing breaks.
Background image: upload a PNG or JPEG (up to 2 MB) as the canvas backdrop — a regional map, an architecture diagram, a site plan — with fit (cover/contain) and dim controls so node colors stay readable.
Beyond labels and backgrounds, the canvas can carry free-floating decorations — shapes, images and text drawn directly on the map (TrackMe 2.4.14+). They have their own page: Decorations and canvas layout.
Connecting nodes — edges
Toggle Connect mode, click a source node, then click a target: the link is drawn and saved with a one-way source → target relationship by default. Links are what turn a set of nodes into a dependency map — and they are also what auto-arrange, live impact propagation and alert rendering follow. For auto aggregates, those same links also define membership: select the child as source and the auto parent as target. Neither impact propagation nor link selection is required for a child to contribute; hiding the arrow does not remove the contribution.
Select a saved link on the canvas, right-click it, or open it from a node’s Connections list to manage it in the link inspector. The inspector shows the stored Source and Target explicitly and lets you:
choose One way (→) — show an arrow at the target and propagate from the stored source to the stored target;
choose Bidirectional (↔) — show arrows at both ends and allow propagation in either direction;
choose No direction (—) — hide the arrowheads while retaining the stored source-to-target propagation direction;
Reverse source and target for a one-way or hidden-arrow link;
select the link for impact propagation, add an optional label, or remove it.
Reversal is disabled while a link is bidirectional because both ends are already visually equivalent. Choose One way or No direction first when you really need to swap the stored endpoints. Reversal also clears Select this link for impact propagation: that selection belonged to the old source, so enable it again only if the new source should use the reversed relationship.
Automatically generated aggregate-member links are intentionally different: they are one-way, read-only links owned by aggregate expansion. Configure the aggregate rather than the generated link.

Impact propagation
A dependency map can do more than show colours side by side — it can propagate any non-green status onto the nodes that depend on it. Red is bad, orange is a warning, and blue is informational; only green means good and therefore does not propagate. The inherited status becomes the target’s effective canvas and Topology Alert status, while its own native status is retained for explanation.
Choose the propagation mode in the source node’s Impact propagation section:
Do not propagate — the default; no dependency impact is sent. The node still contributes to any auto aggregate connected to receive it.
Propagate through selected links — reflect the node’s native non-green status one hop across every link whose Select this link for impact propagation switch is enabled. You may select several links.
Propagate through all downstream links — follow every reachable relationship, transitively, for “if this fails, everything below it is affected” semantics. Link selection is not required in this mode.
Direction remains significant. One-way and hidden-arrow links propagate from their stored source to their stored target. A bidirectional link contributes both paths, so either endpoint can affect the other immediately when its node mode permits it. On a selected bidirectional link, the selection applies from either endpoint. Ordinary propagation-only cycles terminate automatically. Feedback involving auto-aggregate membership or impact is rejected to avoid a parent depending on its own health result.
Composition remains independent of propagation. An auto aggregate respects each child’s effective state even with propagation disabled on the child. The parent’s composed state is its native state and can itself propagate to other dependencies. See Auto aggregates.
An inherited status does not become a new source by itself. Selected links stays a one-hop operation even when the target also has propagation enabled; use all downstream links when the intended impact must cross the whole chain.
Status conflicts are resolved without hiding a more important local condition. For propagation precedence only, red outranks orange, orange outranks informational blue, and blue outranks good/green. An equal or higher native status therefore remains the target’s own truth. Blue is still distinct from healthy green: a blue source can repaint a green target blue, but it does not open an alert.
Protected or maintenance-blue entities and nodes whose state is unknown are never repainted. A blue aggregate is the deliberate exception because its blue is only the derived roll-up of its members, not maintenance applied to the aggregate itself. A higher-precedence red or orange dependency may therefore repaint the aggregate while its native blue roll-up remains visible in the explanation.
Every repainted node identifies the cause in its inspector and reports its native status alongside the inherited one. The same effective status and attribution are used by Topology Alerts and their email details: red alerts, orange follows the alert’s warning setting, and blue remains informational.

Consuming a view
Open a view and it is live: status polls on the deployment’s cadence (60 seconds by default, stretched automatically on slow views — see System-wide settings), with the last-updated time and an honest countdown to the next refresh displayed under the header controls, plus a manual refresh and a pause toggle. Since TrackMe 2.4.15 a large view no longer sits greyed out while its first status loads: a compact progress card tracks graph preparation and status transfer while the canvas stays visible and usable.
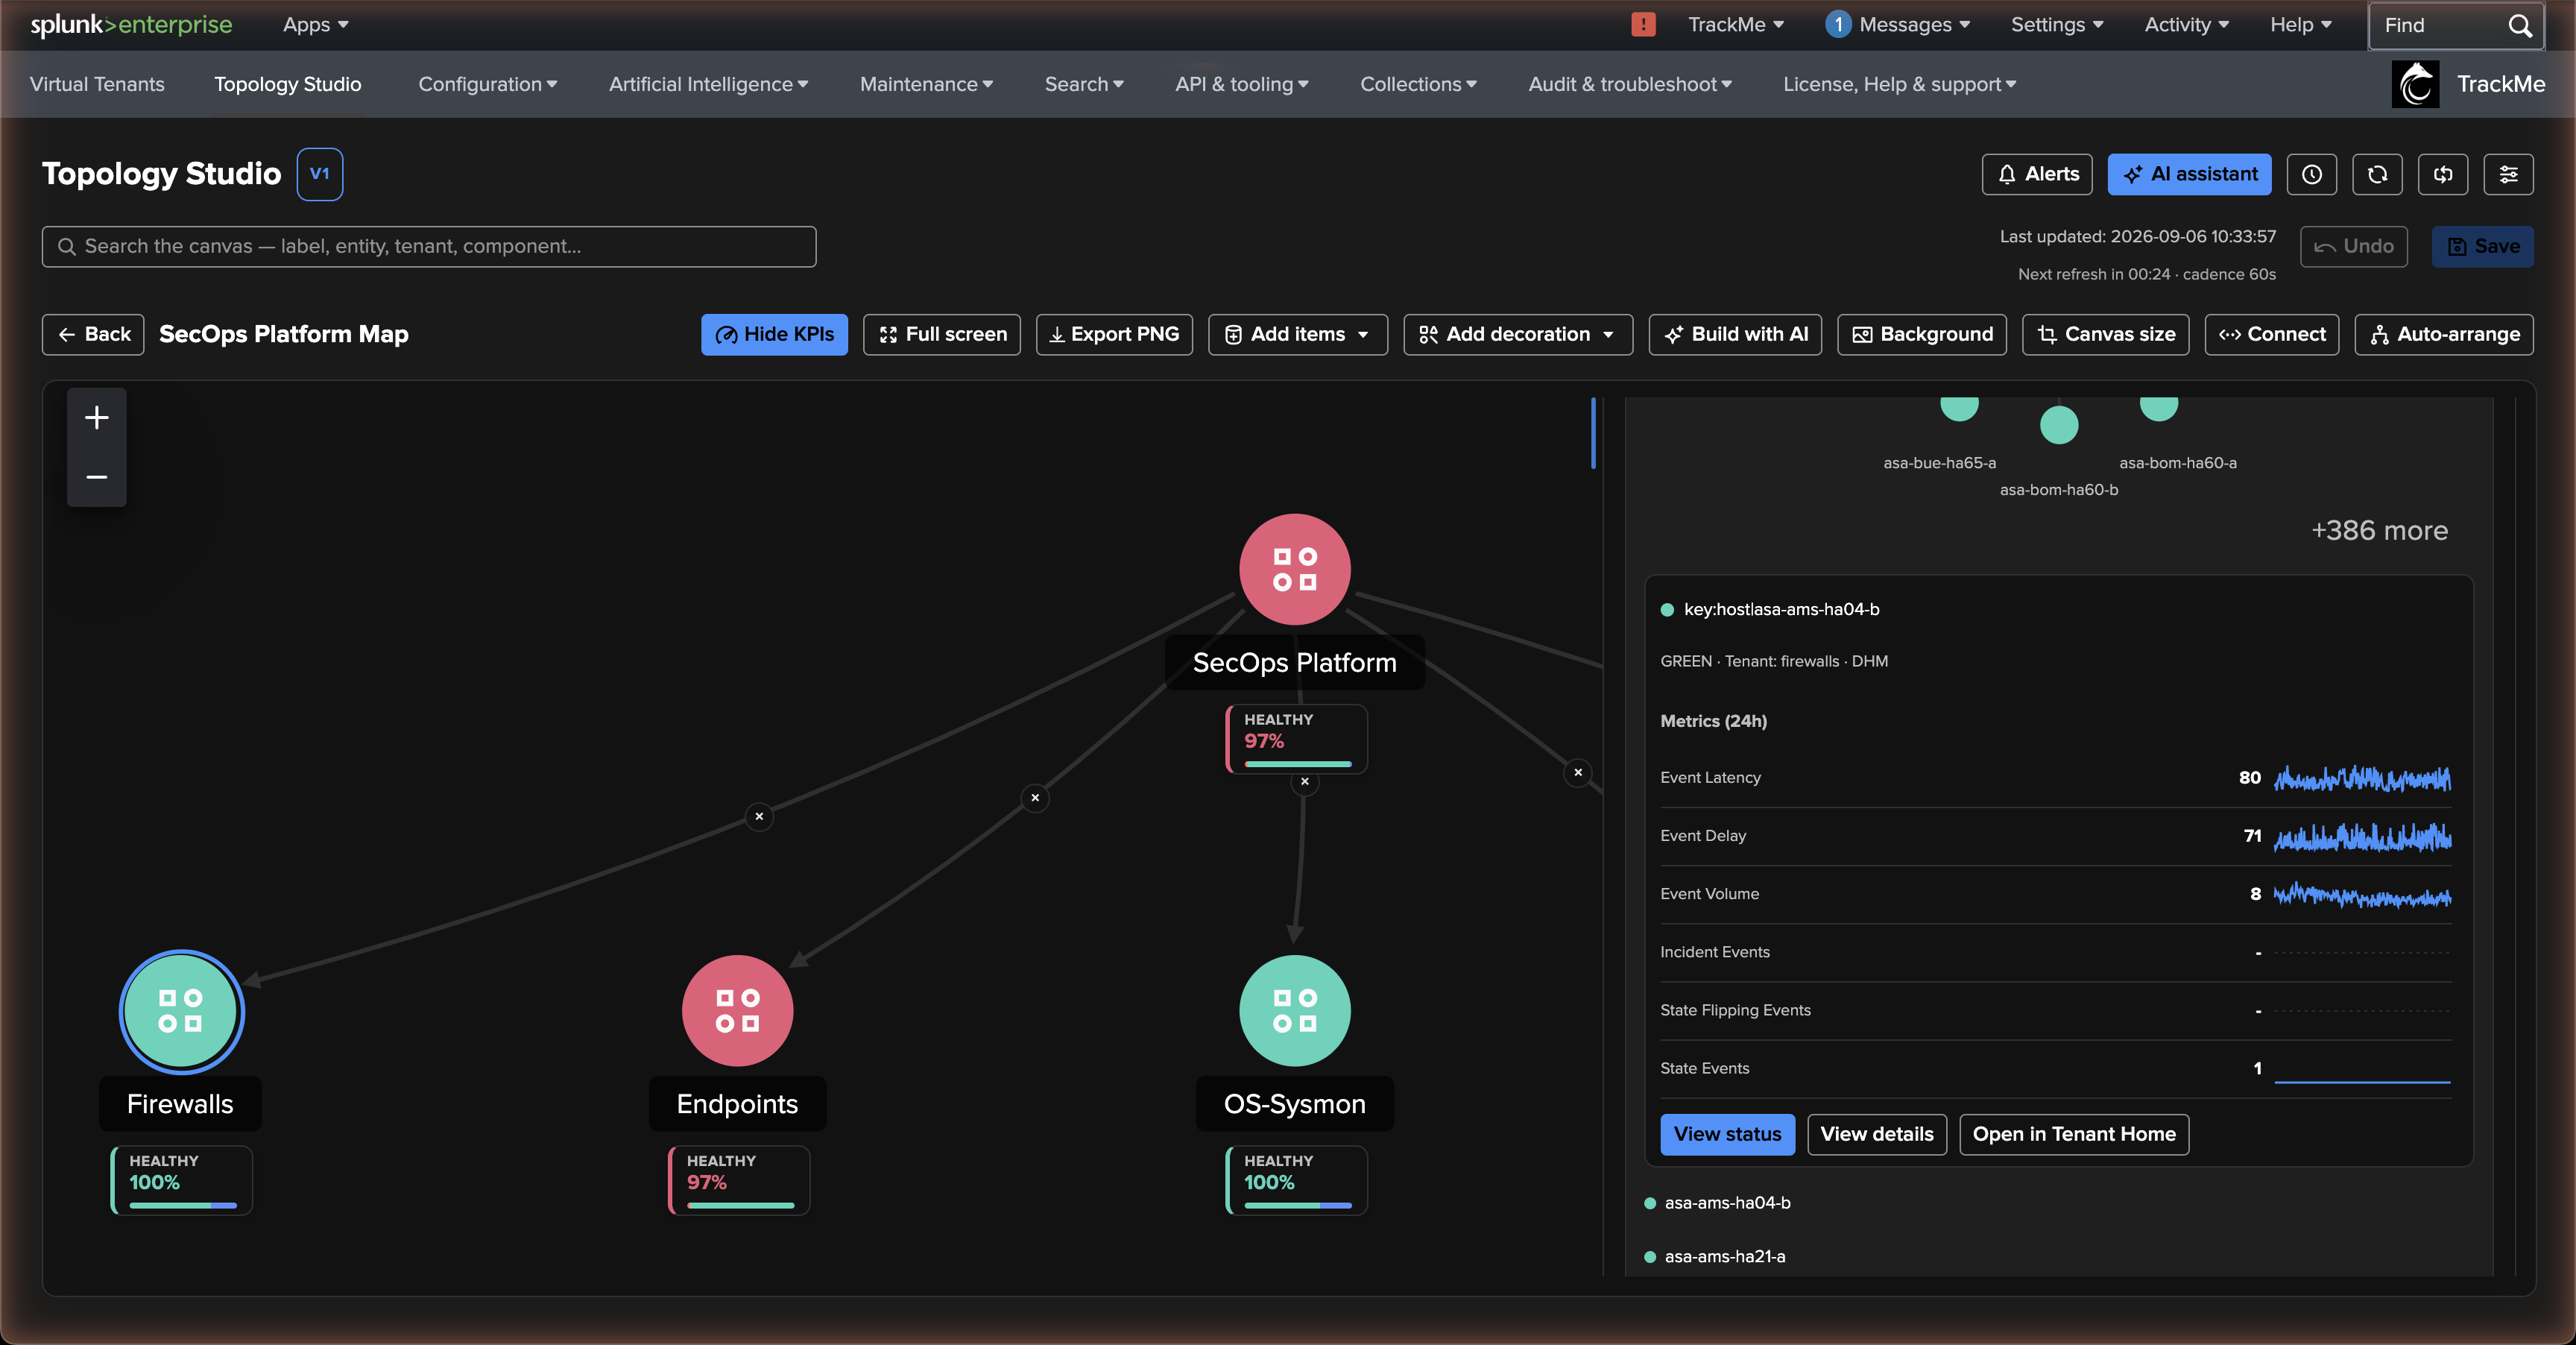
Clicking a node opens the inspector — live state, per-metric sparklines for entities, a mini-map of members for aggregates, and a one-click jump to the entity’s full Entity Overview in Tenant Home. The inspector opens at a size derived from your viewport and is resizable: drag its accent-coloured left edge (or use the arrow keys on it), and the width you pick is remembered in your browser.
For an auto aggregate, the inspector instead lists contributing nodes and their effective states; click a contributor to focus its node. The parent also shows its combined entity count and state distribution.
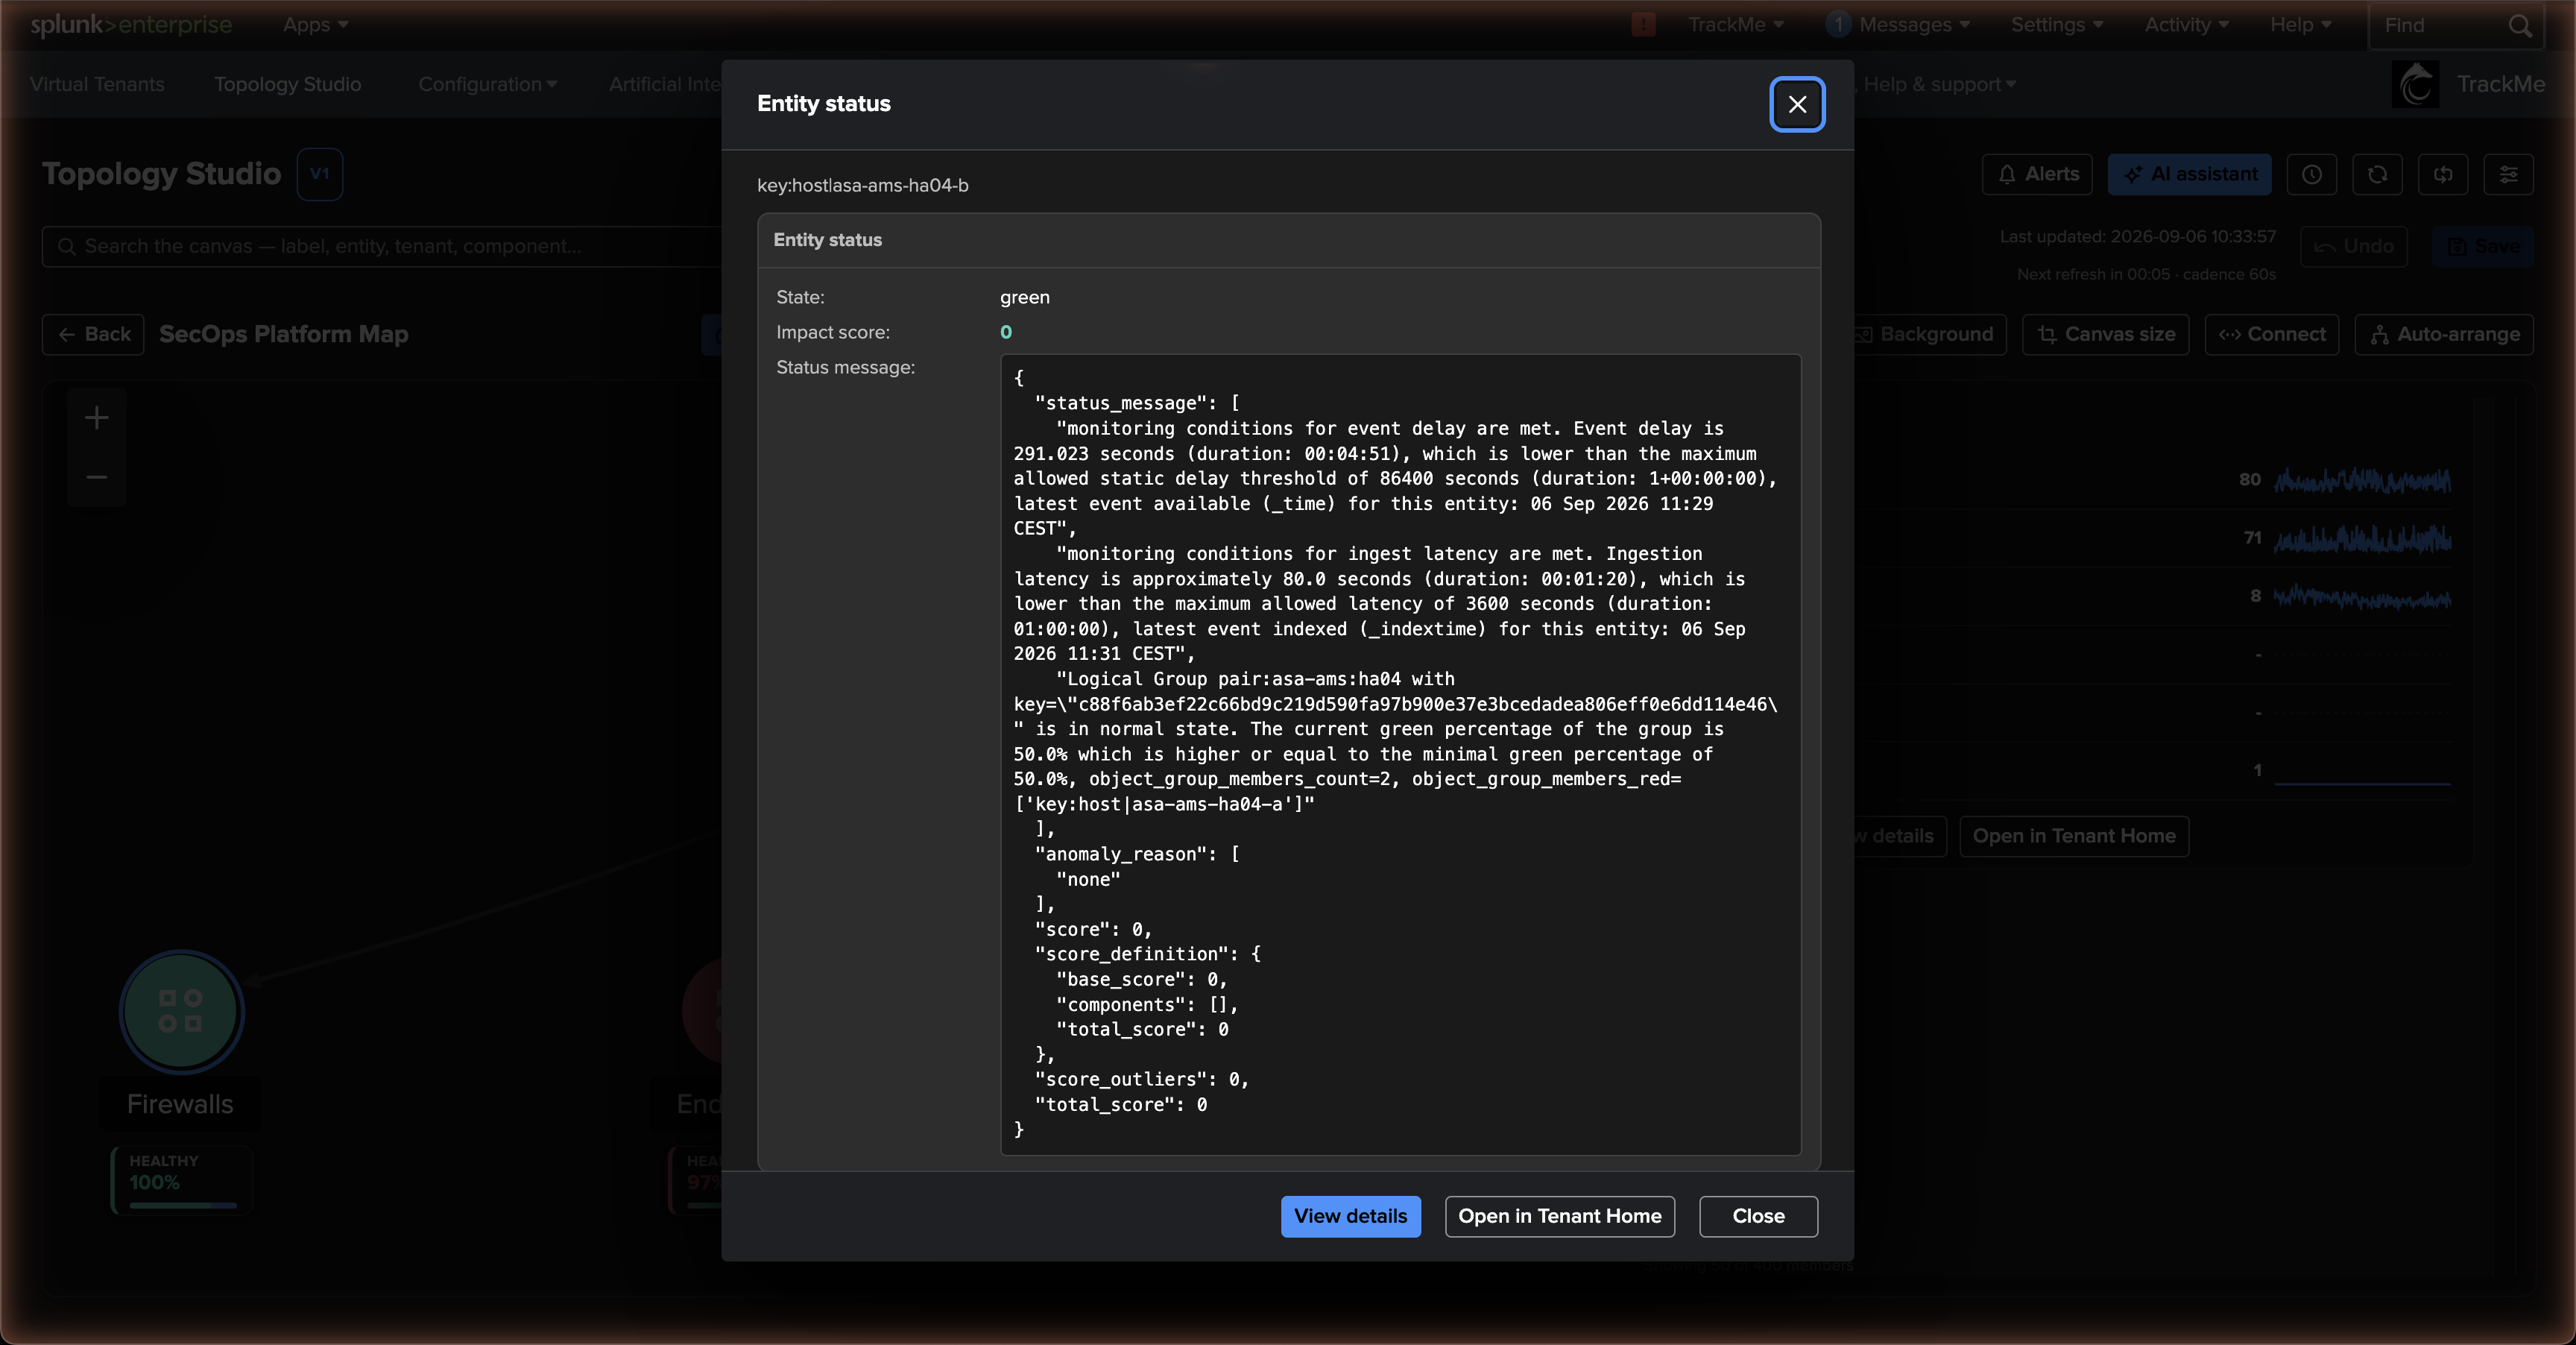
The scoped aggregate mini-map is interactive: set how many members it shows (1–50), and click any member dot — mouse or keyboard — to preview that member inline: state, name and tenant, its 24-hour metric sparklines, and (TrackMe 2.4.15) the same destinations an entity node offers — View status opens a compact status card (state, impact score, status message) in place, View details the full entity modal, and Open in Tenant Home the entity’s overview. On an expanded aggregate, Open node jumps straight to the member’s own node and inspector.
For consumption at scale:
Canvas search — a keyword box in the header finds nodes by label, entity name, tenant, component, or an aggregate’s scope and filter — matches light up with halo rings on the canvas, Enter cycles through them (selecting each node and panning it into view), Esc clears. On a large map, this is how you find the node you just added — or the one that’s red.
Deep links — every view has a bookmarkable URL; share the link, land on the map.
Full-screen mode — a chrome-free rendering for a wall of screens, addressable directly by URL parameter so a kiosk browser can boot straight into it.
KPI visibility, also by URL — the toolbar’s Show / Hide KPIs toggle controls the on-canvas displays, and the choice is URL-addressable too (
&show_kpis=1or&show_kpis=0): decide per screen what a kiosk shows, even though full-screen hides the toolbar. A complete wall-screen URL:?view=<id>&fullscreen=1&show_kpis=0.PNG export — one click captures the current canvas as an image for slides and incident timelines.

