Cribl Edge
Follow the Fleets of a Cribl Edge Leader, the Edge Nodes enrolled in them and the Sources and Destinations they run, from one bulk read of the Leader at any fleet size: connected nodes, rollouts and version drift, failing inputs and outputs, any node opened up close with its System activity read live, the nodes that must stay connected selected from Splunk lookups, bank holidays per policy, and the Cribl Edge AI Agent with its custom instructions.
about 30 minutes · 30 slides. Each slide is followed by a description of what it shows — read top to bottom, this page is the walkthrough.
Overview
This walkthrough covers the Cribl Edge tenant, generally available in TrackMe 2.4.19. Everything was captured live on a Cribl.Cloud Edge Fleet of 17 nodes. In four parts: create the tenant, follow the Fleets and the Edge Nodes, read the findings, and operate the tenant.
Why a dedicated Cribl Edge tenant
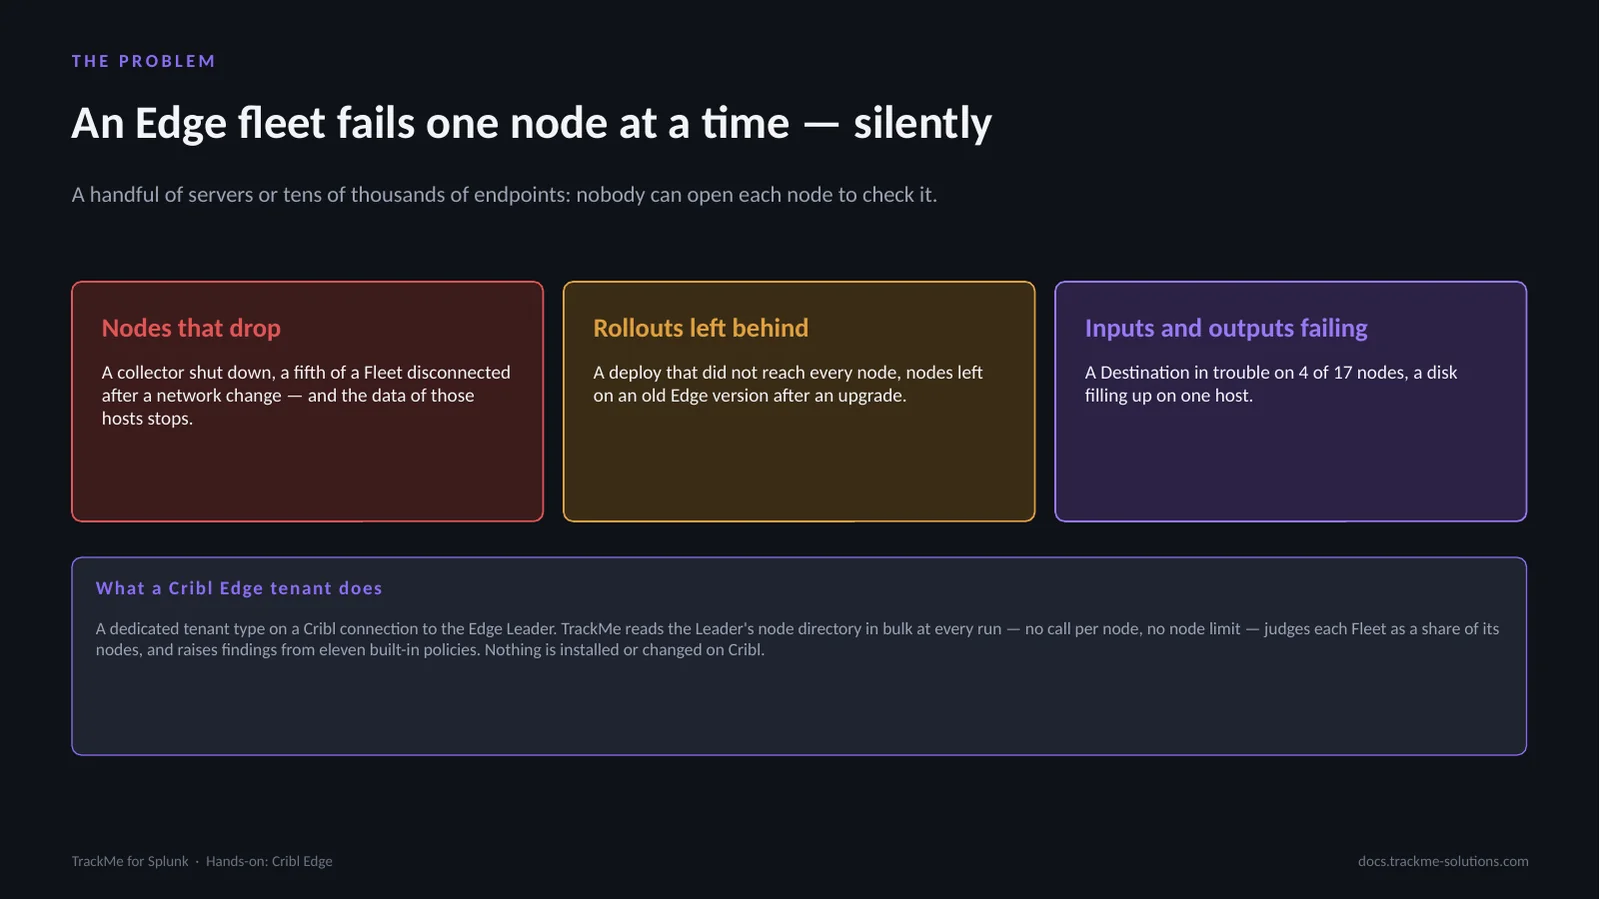
An Edge operator asks the same questions every day: are my nodes connected, did my last deploy reach every node, is every node on the same Edge version, which Source or Destination is failing and on how many nodes, which host is running out of disk. The Cribl Edge tenant answers them with findings raised by built-in policies, with the same triage as the Cribl Stream tenant.
How a Cribl Edge tenant works
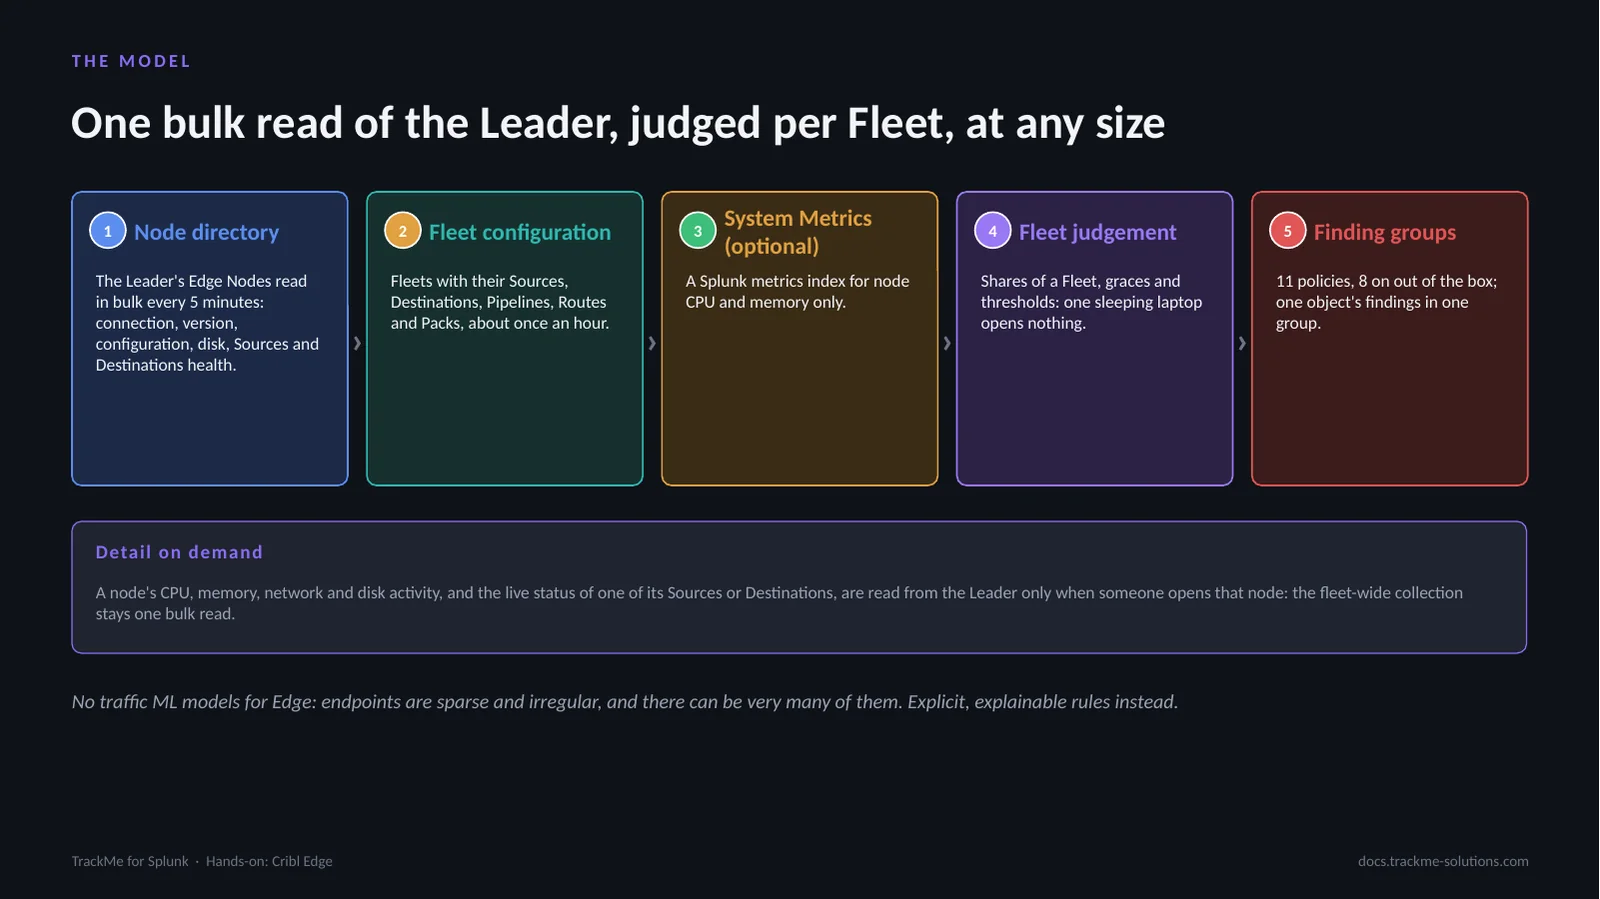
Every five minutes TrackMe reads the Leader’s list of Edge Nodes page by page and keeps it as one published node directory: no call per node, no rotation, every node current within one interval. The Fleet configuration is read about once an hour. Policies judge each Fleet as a share of its nodes, select nodes that must never drop, and watch disk, and CPU and memory when a System Metrics index is set. There is no machine learning for Edge.
The parts of the walkthrough
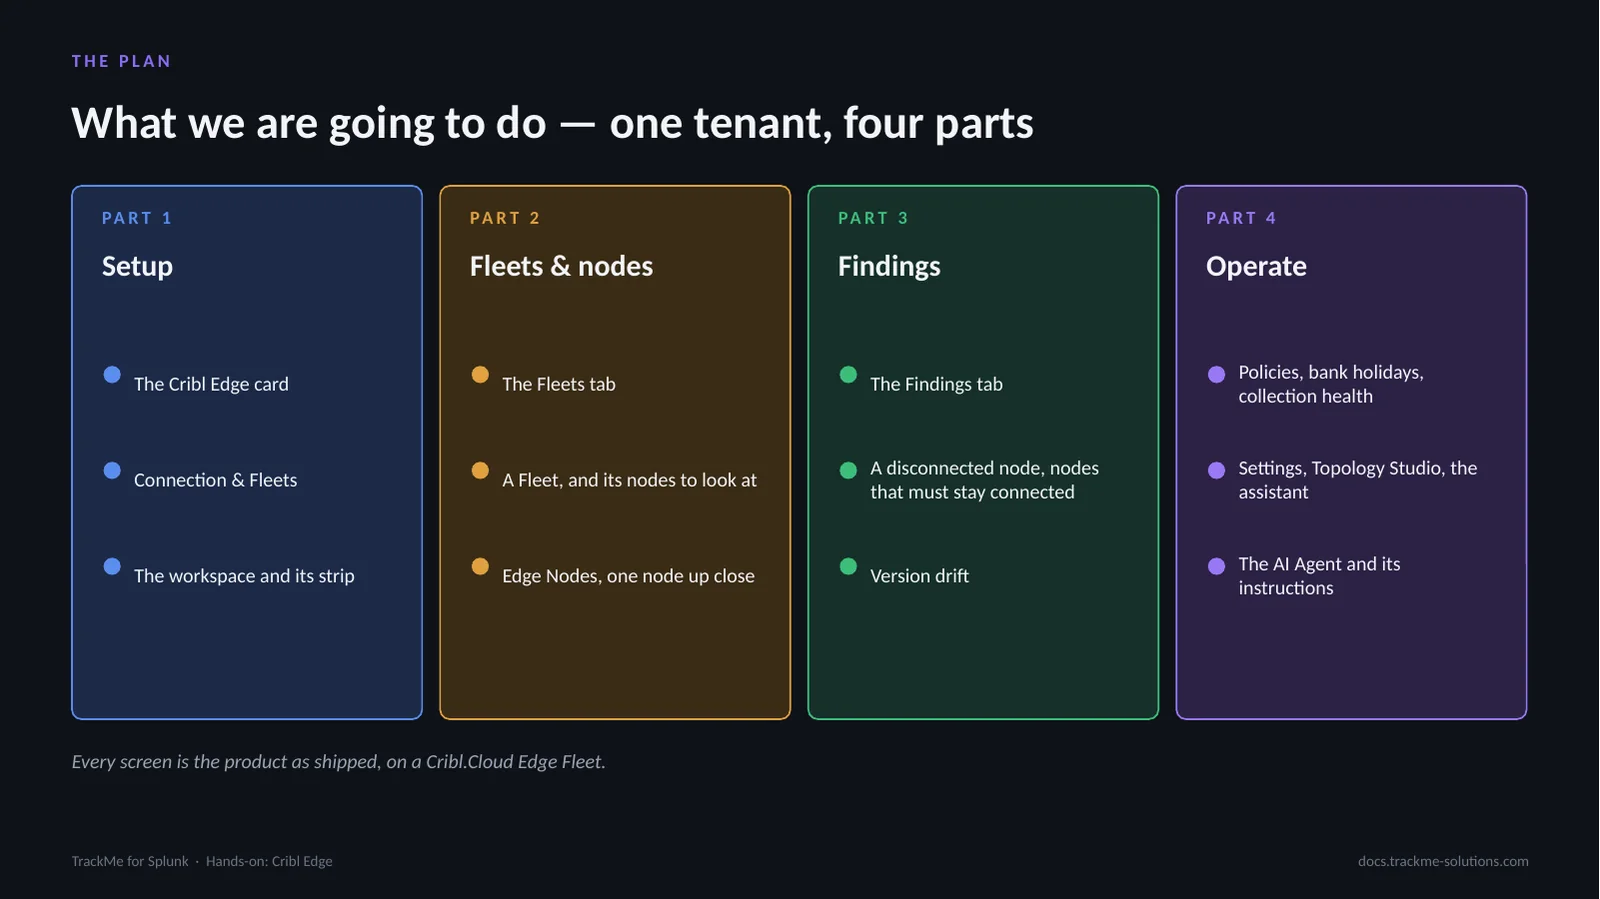
Four parts. Setup: the wizard and the workspace. Fleets and nodes: the Fleets tab, a Fleet, the Edge Nodes and one node up close. Findings: the backlog, a disconnected node, the nodes that must stay connected and version drift. Operate: policies and bank holidays, collection health, settings, Topology Studio, the AI Assistant and the Cribl Edge AI Agent.
Part 1 — Setup
A Cribl Edge tenant uses the same Cribl connections as Cribl Stream; a Cribl.Cloud workspace running both products takes one tenant of each on the same connection. The wizard has four steps: Basics, Connection & Fleets, Indexes & RBAC and Review. The first collection starts at once, and the Fleets and Edge Nodes appear in the workspace within a few minutes.
Choosing the Cribl Edge card
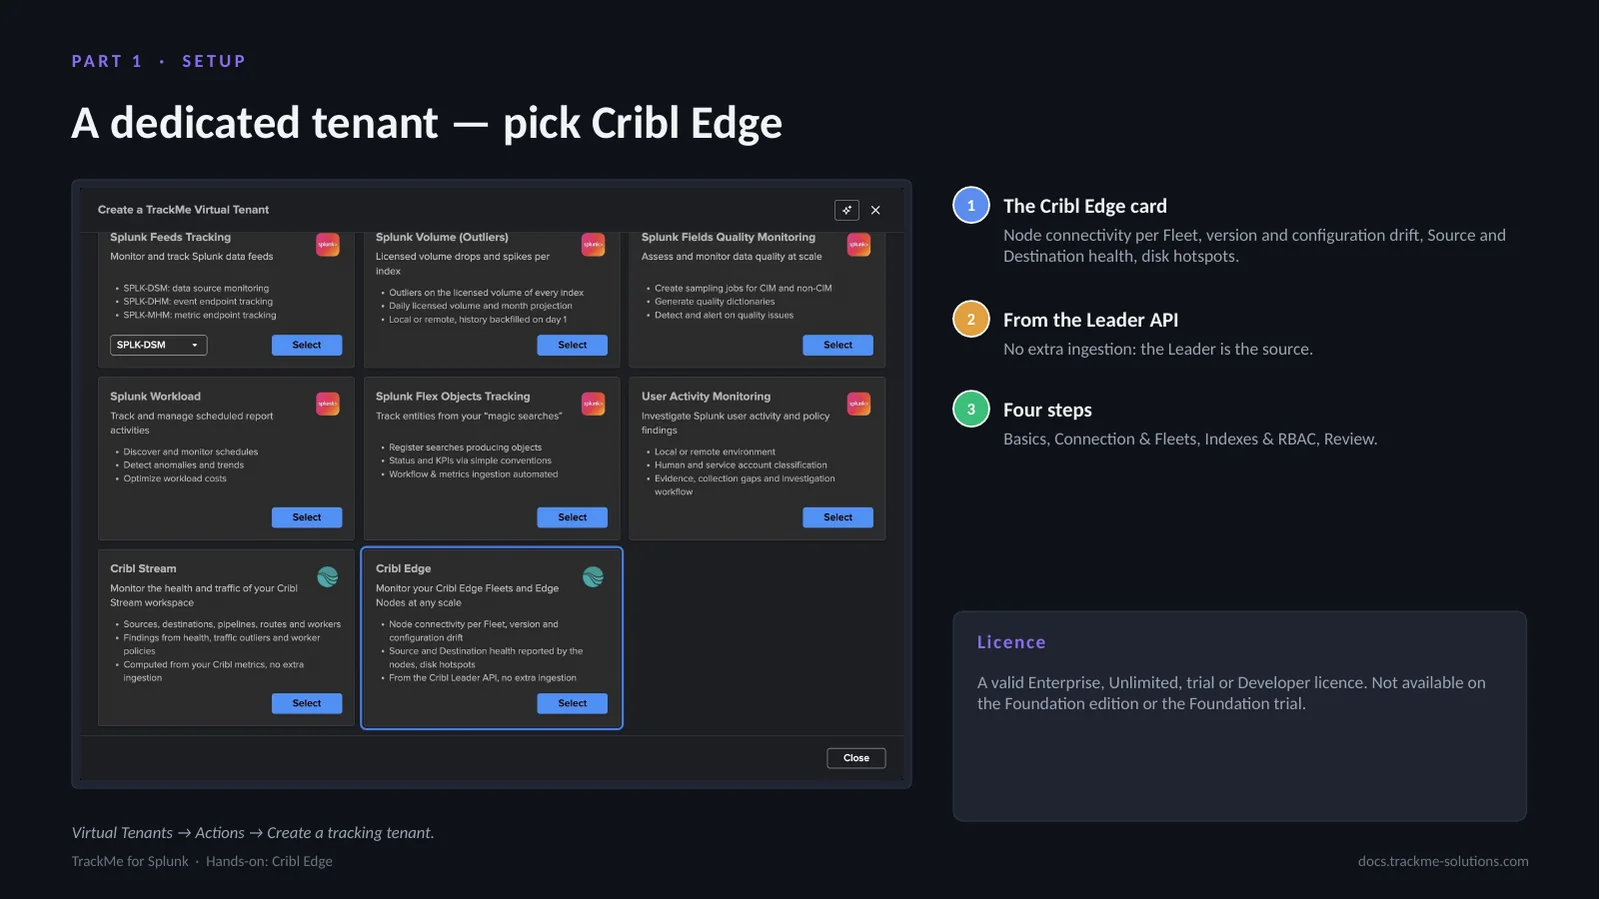
Virtual Tenants, Actions, Create a tracking tenant, Cribl Edge card. A tenant is a Cribl Edge tenant or a Cribl Stream tenant, never both. Basics is the identifier, alias and description. The card summarises what the tenant follows: node connectivity per Fleet, version and configuration drift, Source and Destination health reported by the nodes, and disk hotspots, all from the Cribl Leader API without extra ingestion.
Connection, Fleets and review
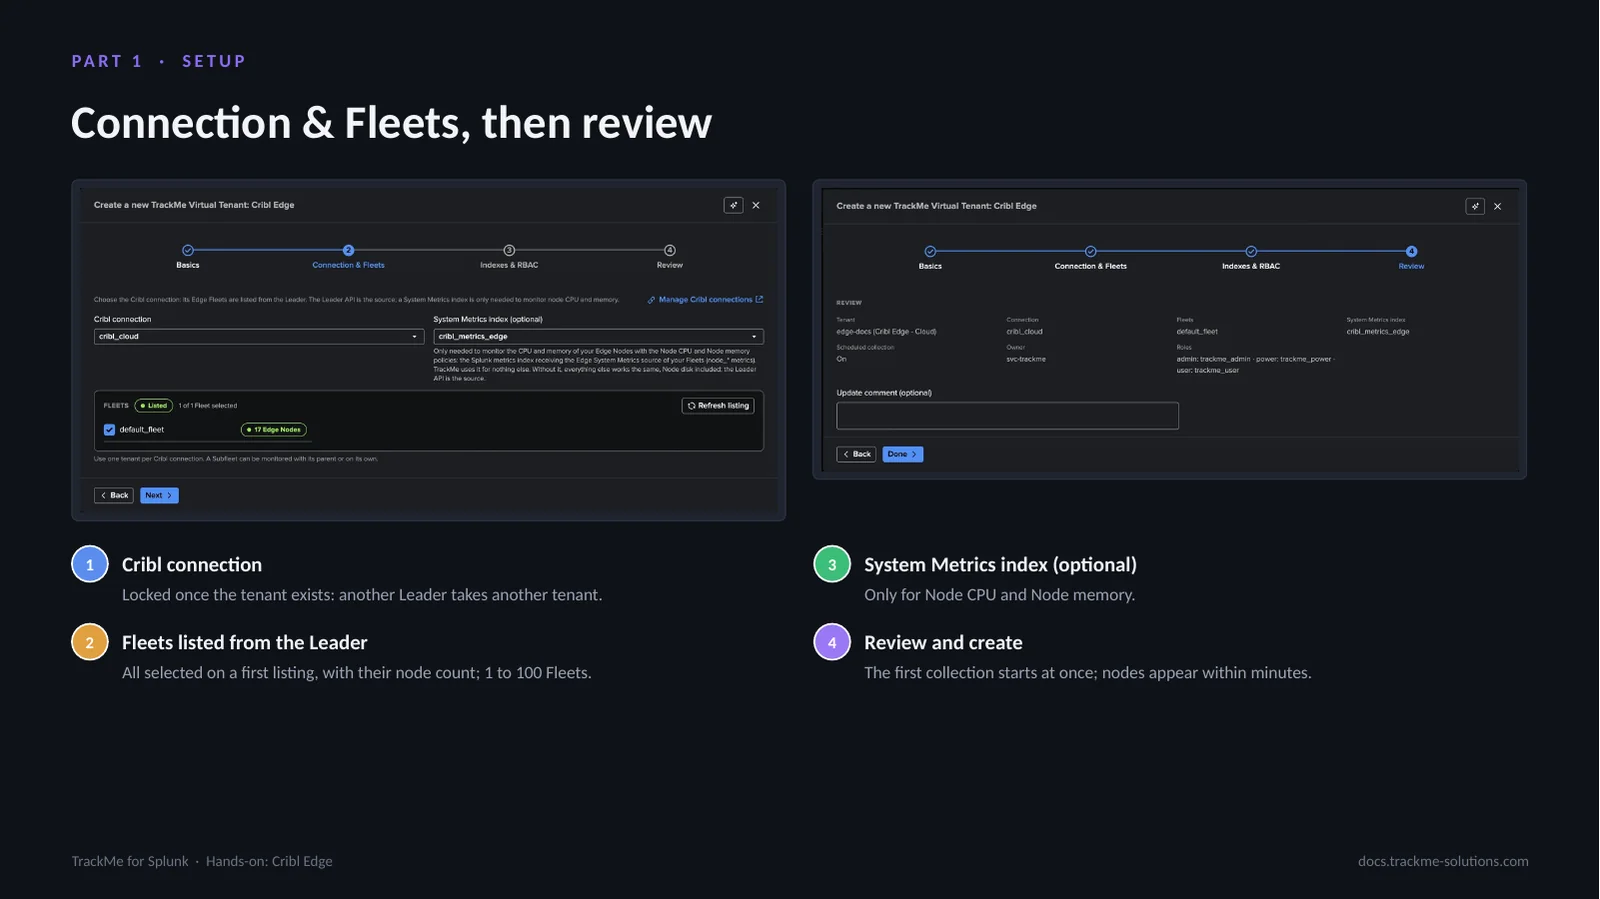
Choose the connection; TrackMe lists the Fleets from the Leader, each with its number of nodes, and a Subfleet can be monitored with its parent or on its own. The System Metrics index is optional: without it everything else works the same, node disk included. When the Leader cannot list the Fleets, the step says why and what to do.
The workspace and its status strip
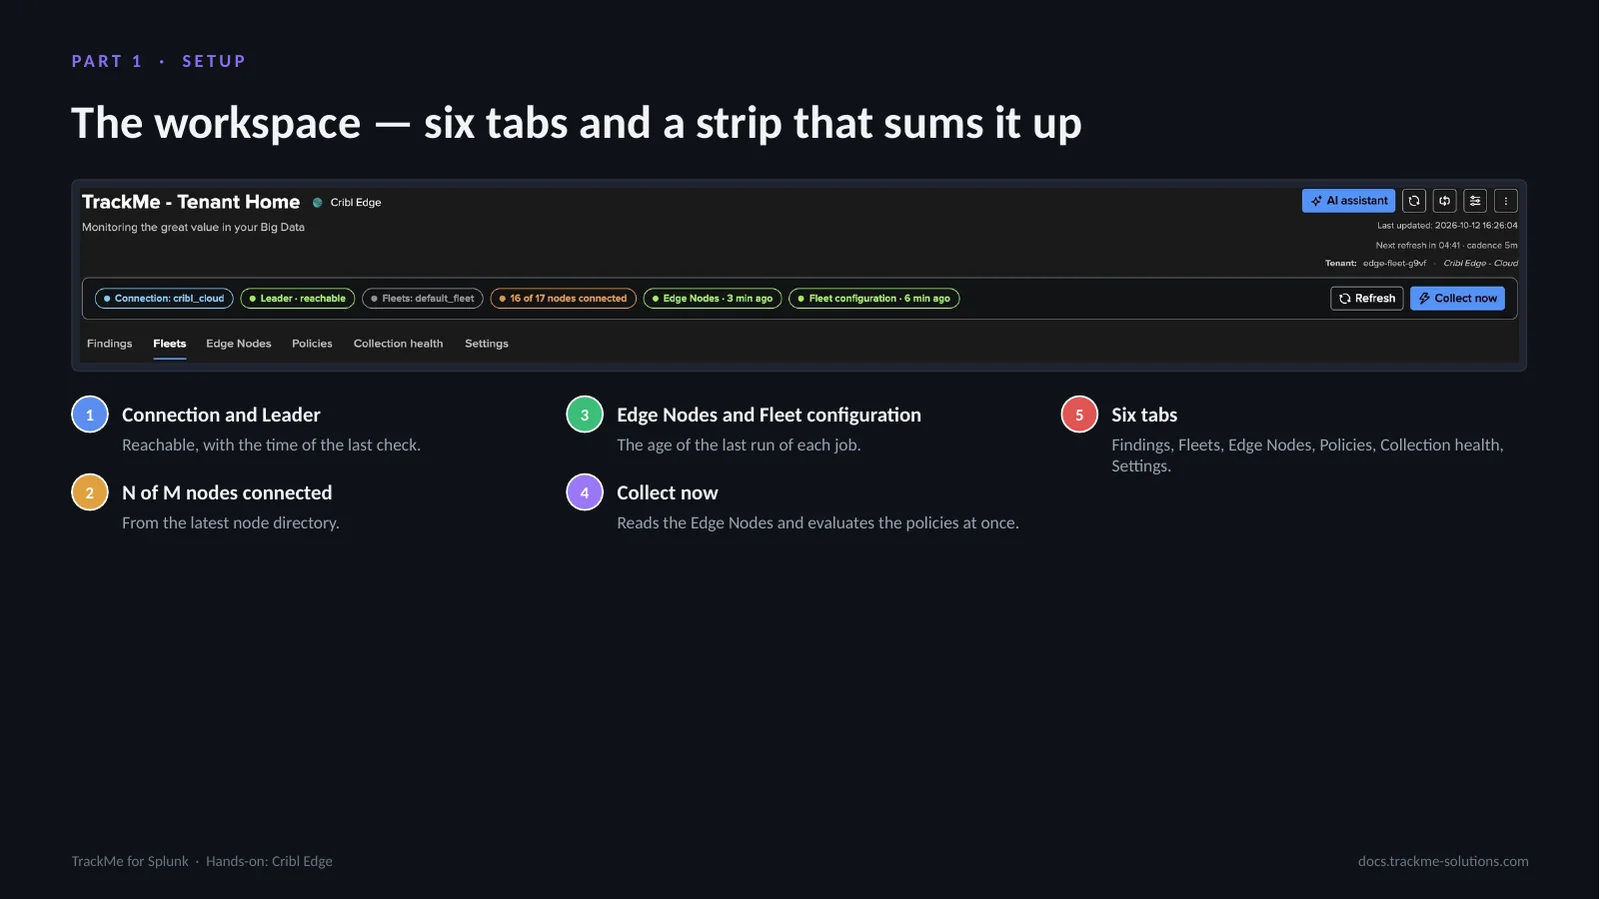
The Cribl Edge workspace is built with the same components as the Cribl Stream workspace, so the two look and behave the same. The status strip sums the tenant up; Collect now is for TrackMe administrators of the tenant. The six tabs are Findings, Fleets, Edge Nodes, Policies, Collection health and Settings. Every table is sorted, filtered and paged by the server.
Part 2 — Fleets and nodes
The Fleets tab answers the fleet questions at a glance; a Fleet opens with its traffic, its bars and the nodes to look at; the Edge Nodes tab lists every node; and a node opens with its Node info, its System activity read live and its Data activity.
The fleet at a glance
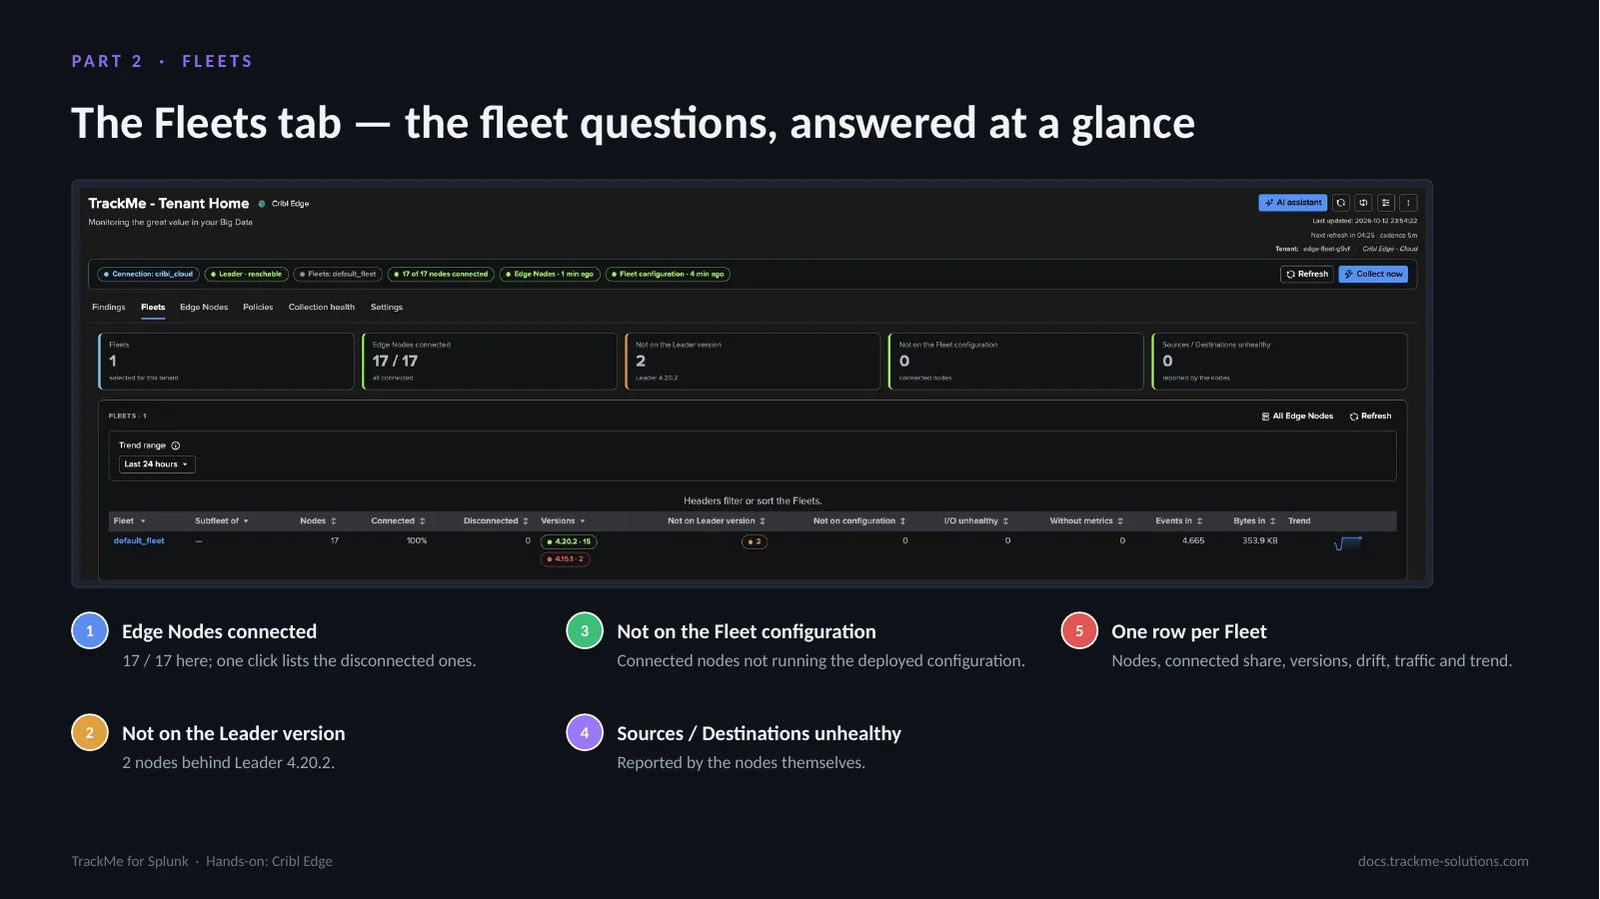
The tiles answer the fleet questions; the table has one row per Fleet with its Subfleet parent, connected share, versions running — green on the Leader version, amber otherwise, red when newer than the Leader or two minor versions behind — drift counts, unhealthy Sources and Destinations, traffic and trend. Versions are coloured green on the Leader version, amber otherwise, and red when newer than the Leader or two minor versions behind.
Inside a Fleet
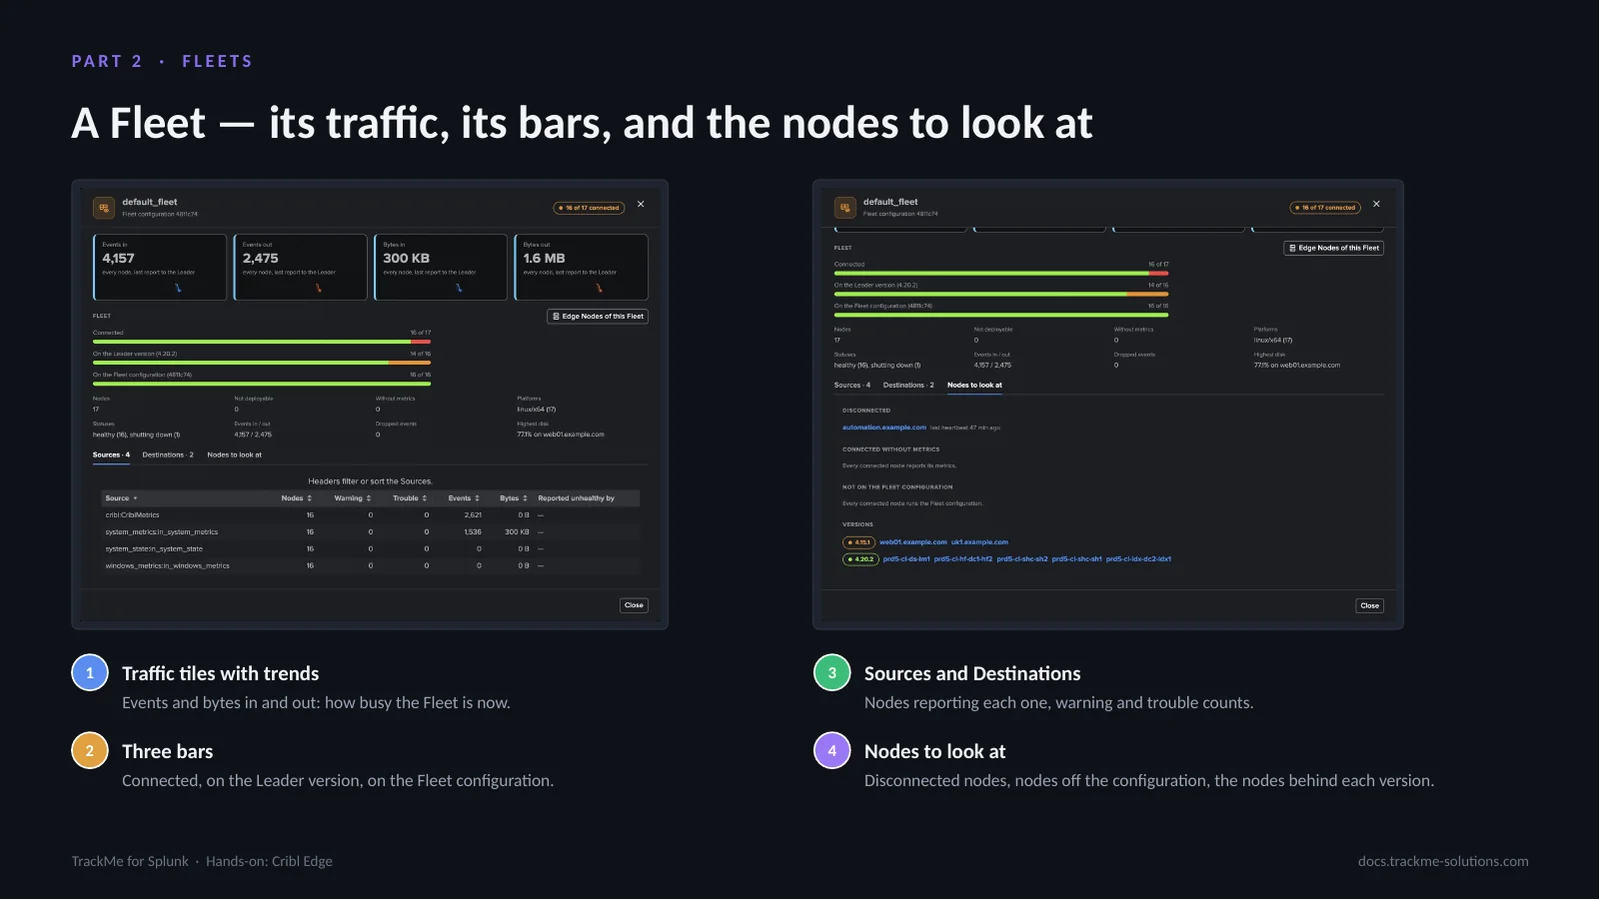
Selecting a Fleet opens it: traffic tiles, the connected, Leader-version and configuration bars, its facts, and three tabs. Sources and Destinations per object with the nodes reporting it unhealthy; Nodes to look at lists the disconnected nodes with their last heartbeat and the nodes behind each version. Every node name opens the node.
Every Edge Node, paged by the server
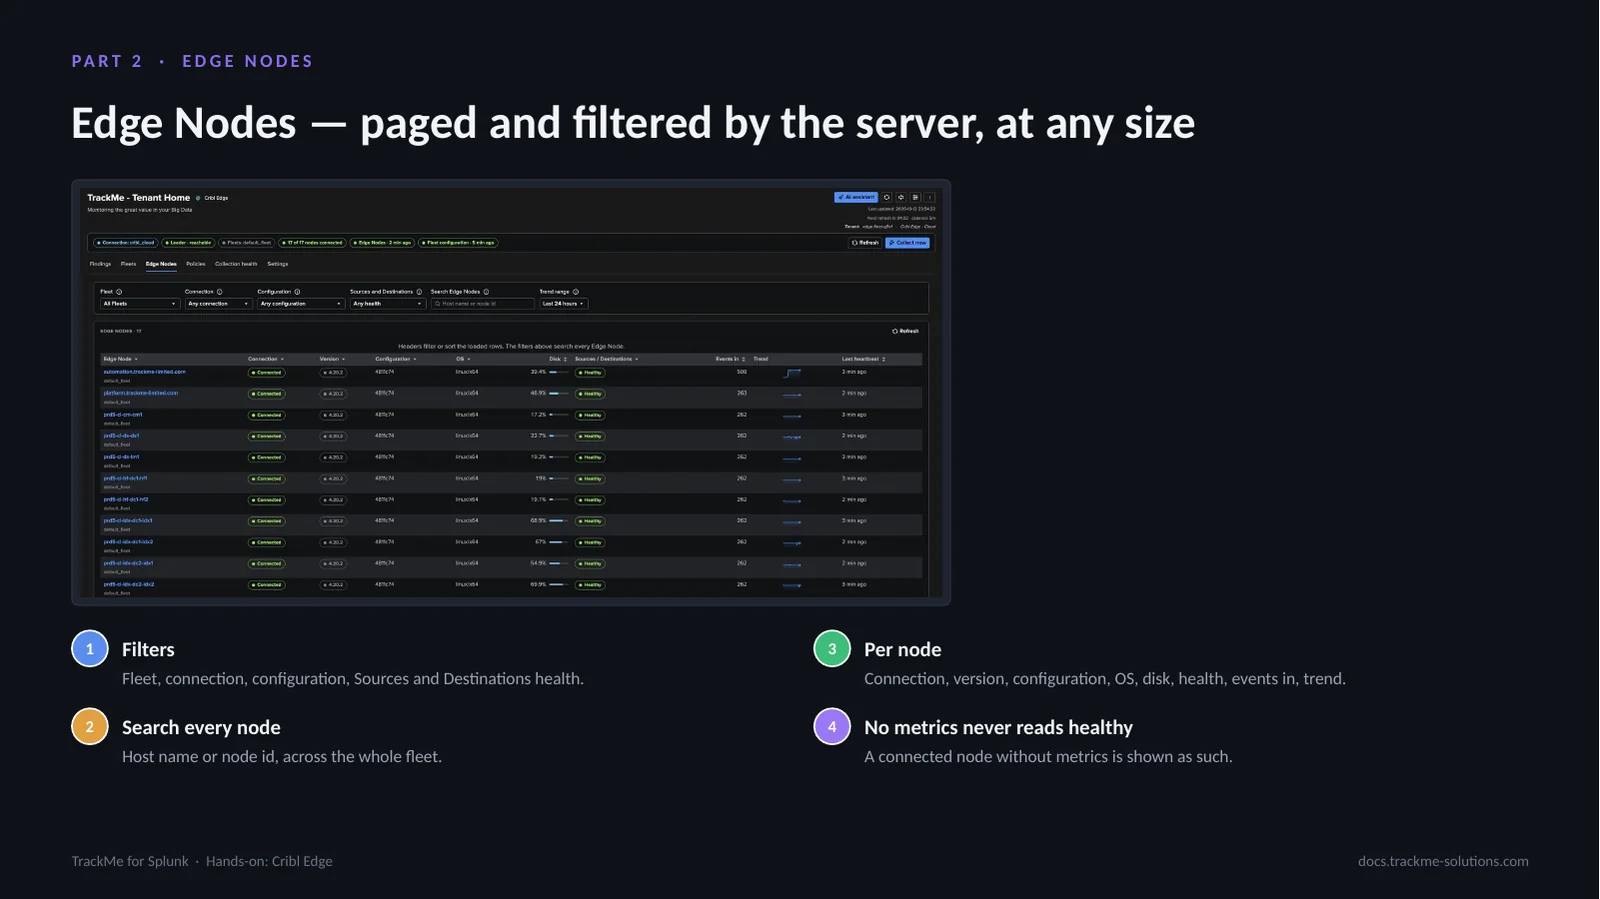
Every Edge Node of the selected Fleets, paged and filtered by the server so the tab stays fast with any number of nodes. A node is disconnected when the Leader says so or when it has sent no heartbeat for five periods, at least 10 minutes. Filters for Fleet, connection, configuration and Sources and Destinations health apply to every node, and the search finds a host name or node id across the whole fleet.
One node: info and data activity
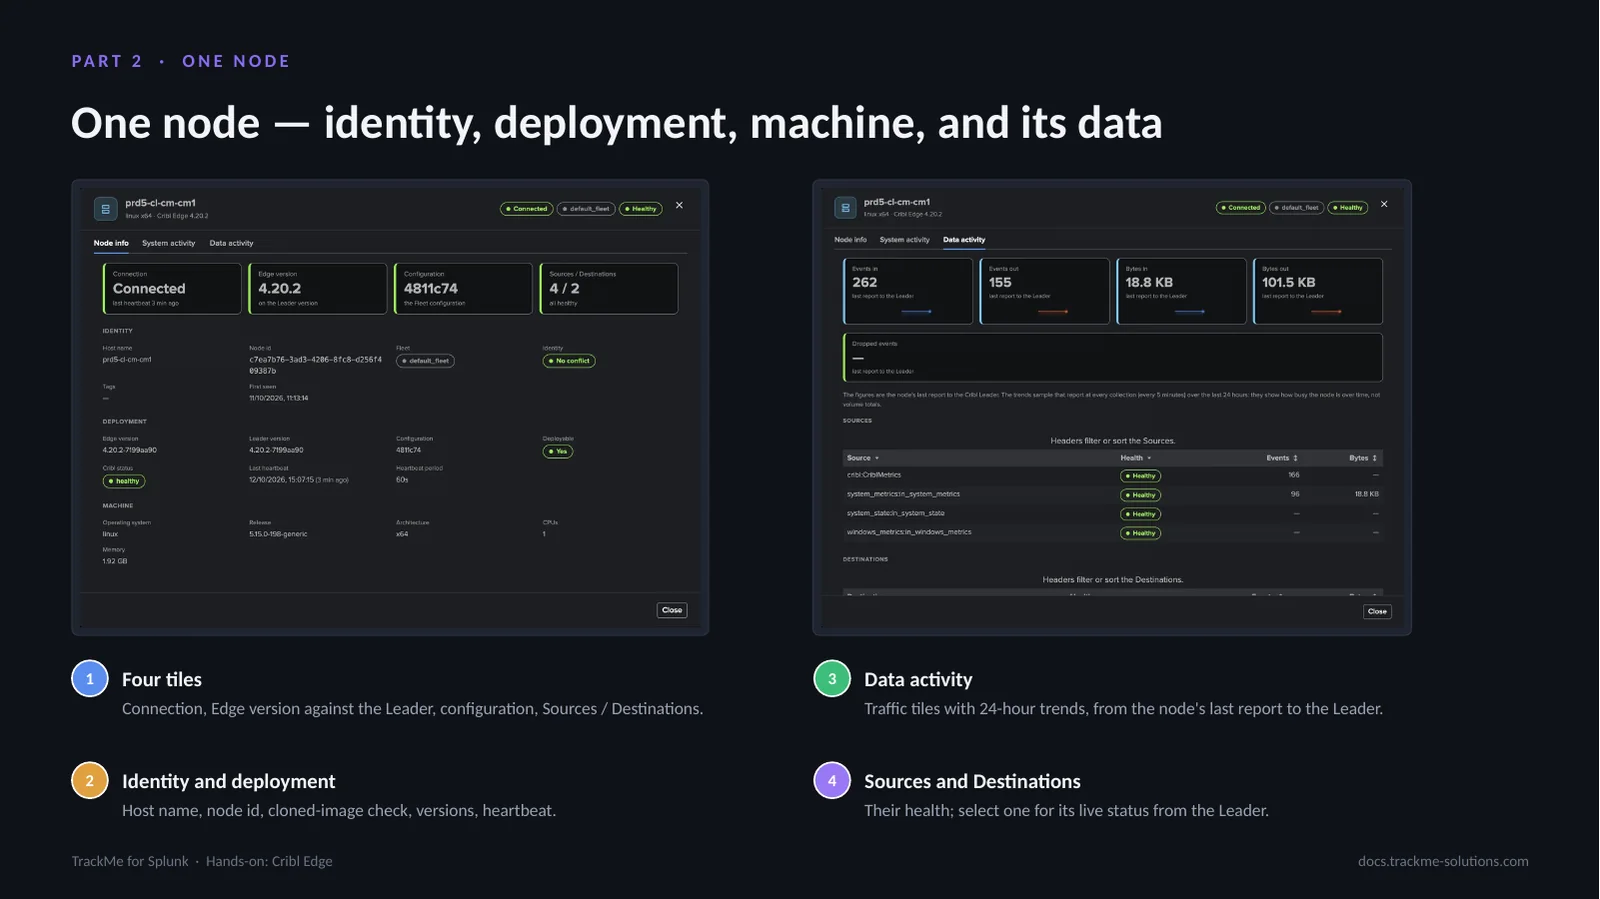
A node opens on three tabs. Node info: connection, Edge version compared with the Leader’s, configuration compared with the Fleet’s target, and Identity, Deployment and Machine facts. Data activity: the node’s traffic with trends and its Sources and Destinations; selecting a health reads that object’s live status on that node, as Cribl’s Status tab shows it.
System activity read live from the node
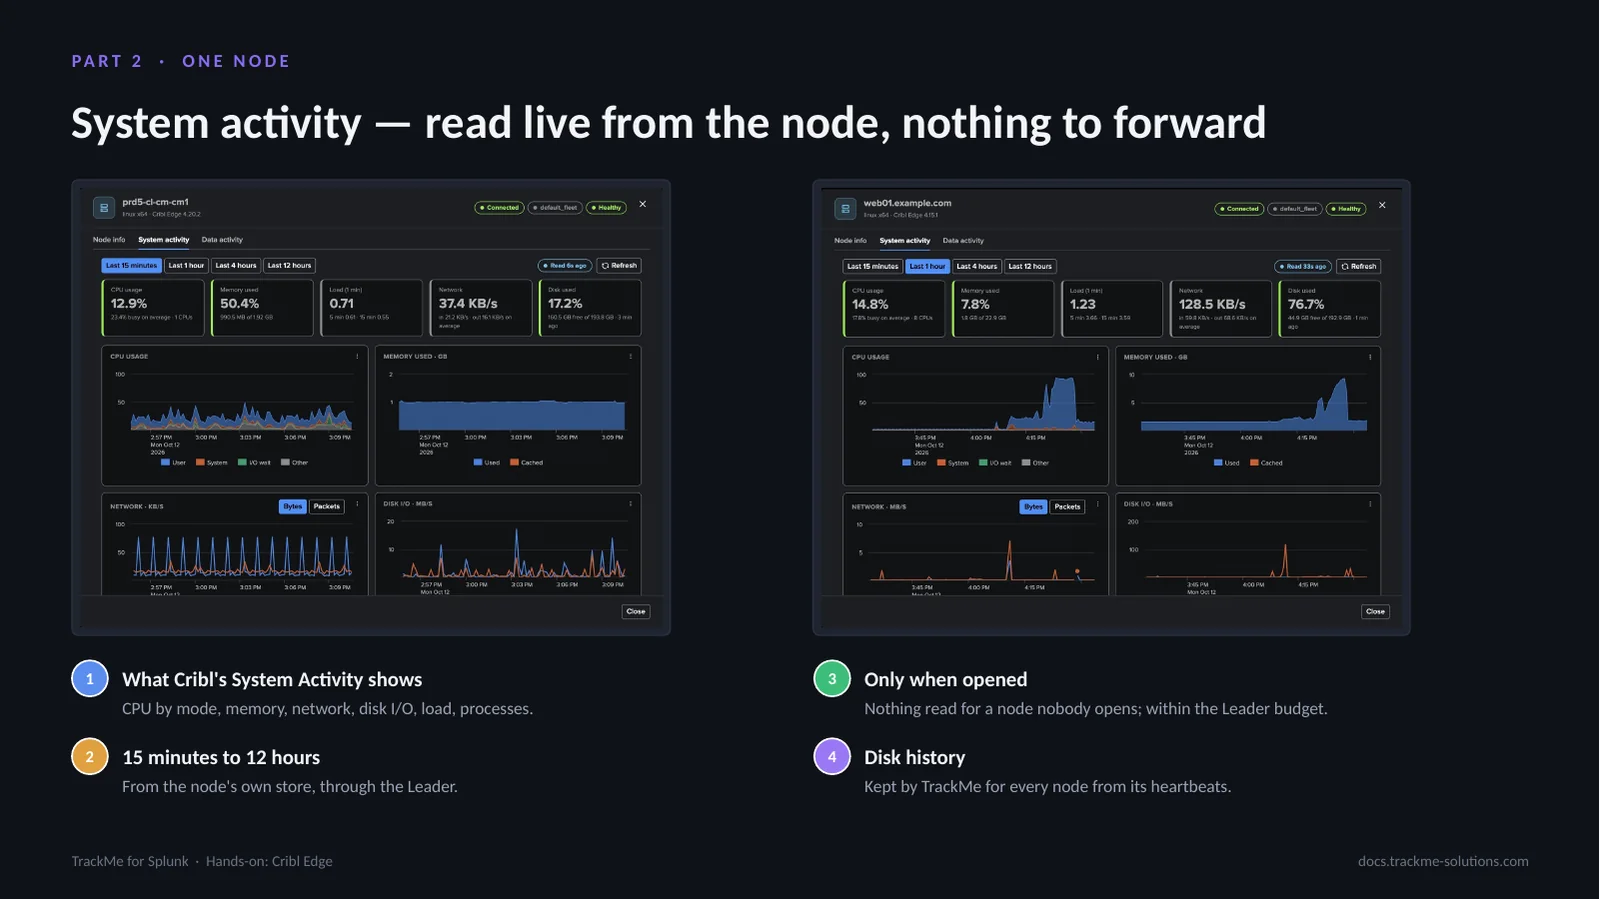
System activity shows what Cribl’s own System Activity page shows for the node, read live through the Leader from the node’s own store of its system metrics. It does not use the System Metrics index and needs nothing forwarded to Splunk. Nothing is read for a node nobody opens, so the fleet-wide collection stays one bulk read.
Part 3 — Findings
Findings work exactly as on Cribl Stream: Finding groups, triage, notifications, assignment and findings actions. A finding is about a Fleet, a Source or Destination of a Fleet, an Edge Node or the Leader. Each object gathers its findings in one automatic Finding group, the unit that is triaged and notified.
The findings backlog
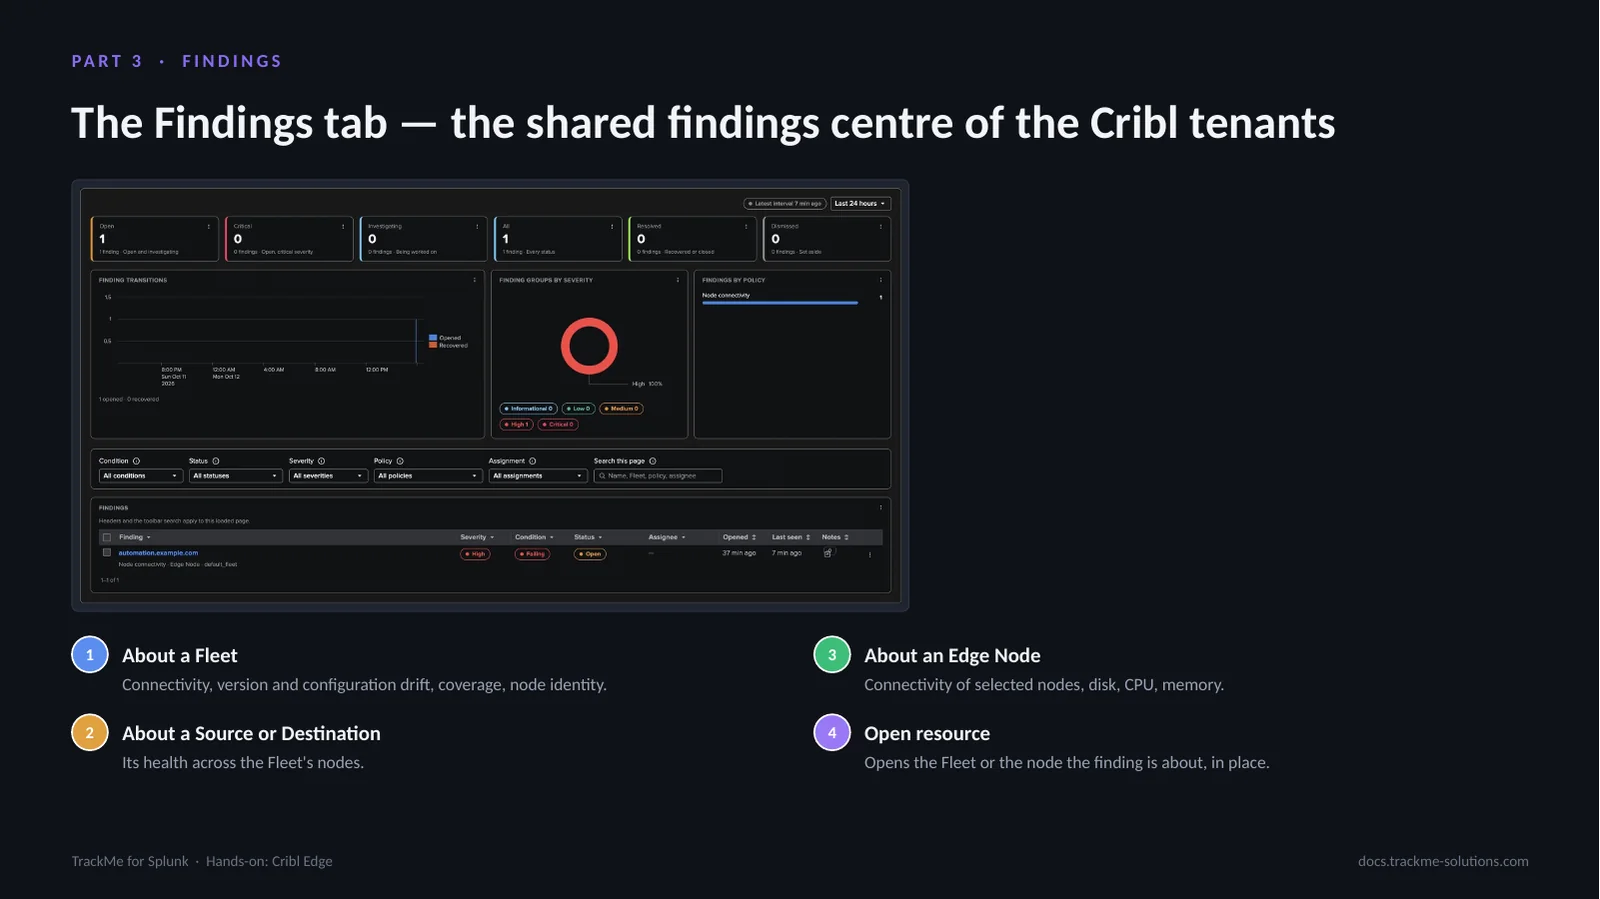
A Cribl Edge finding is about one object, one policy and one measurement: a Fleet, a Source or Destination of a Fleet, an Edge Node, or the Leader. Each object gathers its findings in one automatic Finding group. A finding recovers by itself when the condition clears. Edge has no Stop monitoring and no Not an anomaly: narrow the policy’s scope instead.
When a node disconnects
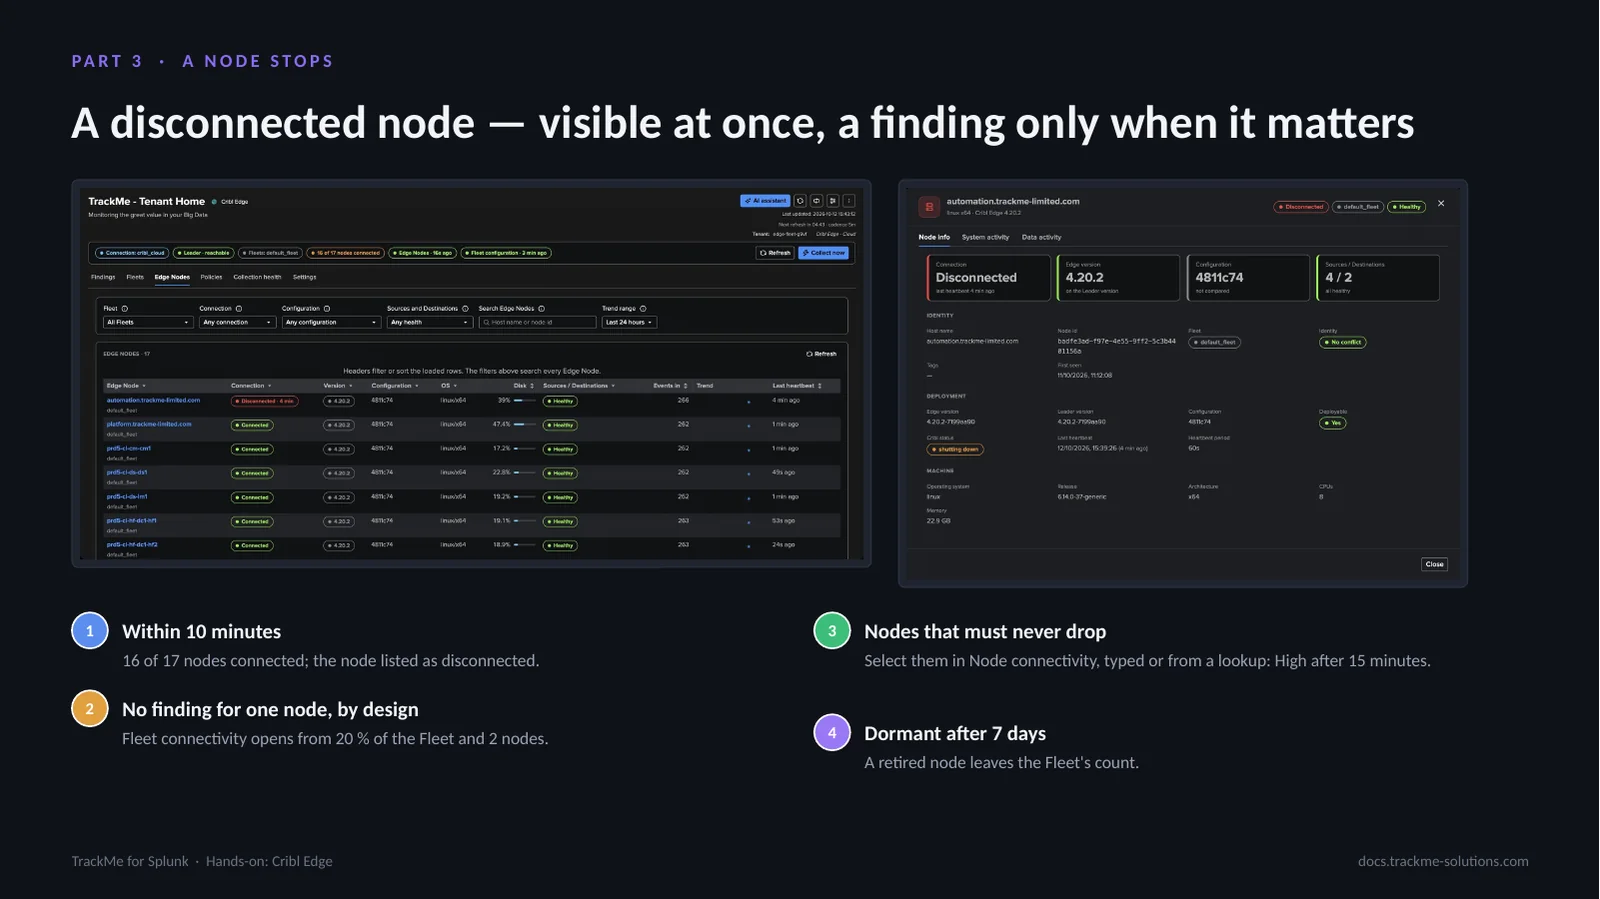
Take a Fleet of 17 nodes, one of which stops. Within 10 minutes it is disconnected in the next directory. No finding opens for that one node by default: Fleet connectivity opens when at least 20 percent of the active nodes and at least two are disconnected. For servers and collectors that must never drop, select them in Node connectivity, by host name or from a Splunk lookup table.
Nodes that must never drop
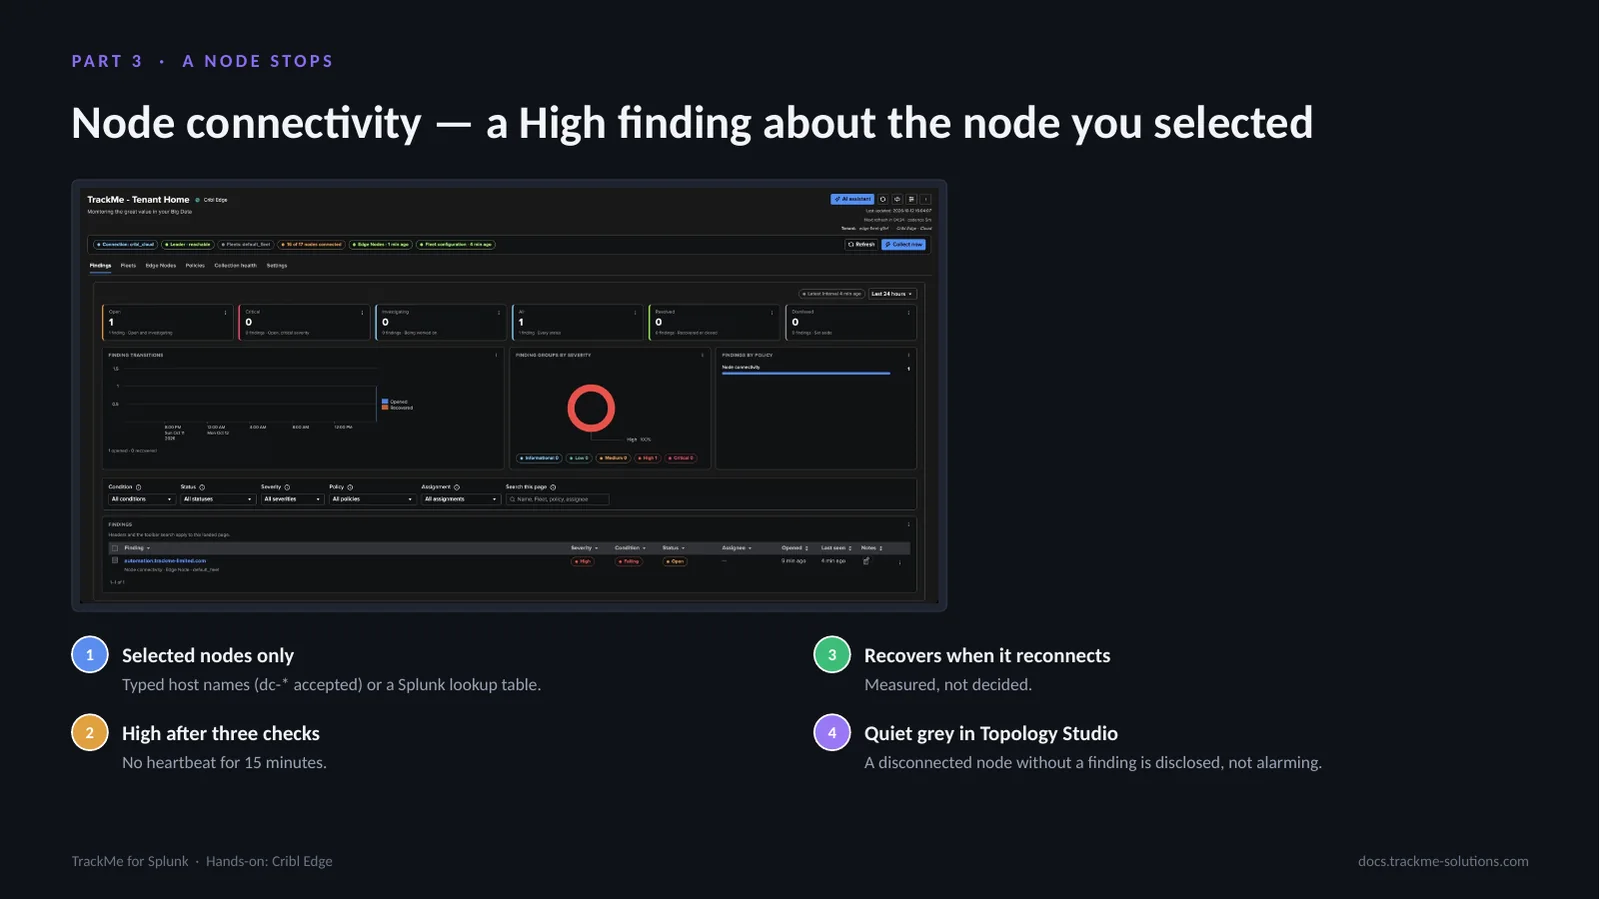
A node selected in Node connectivity opens a High finding about that node after three checks without a heartbeat, and recovers when it reconnects. In Topology Studio a disconnected node without a finding is drawn quiet grey and does not count in a group’s healthy share. The Findings tab lists it with the host name it was selected by; its Finding group is triaged, notified and assigned like every other.
Nodes that must stay connected
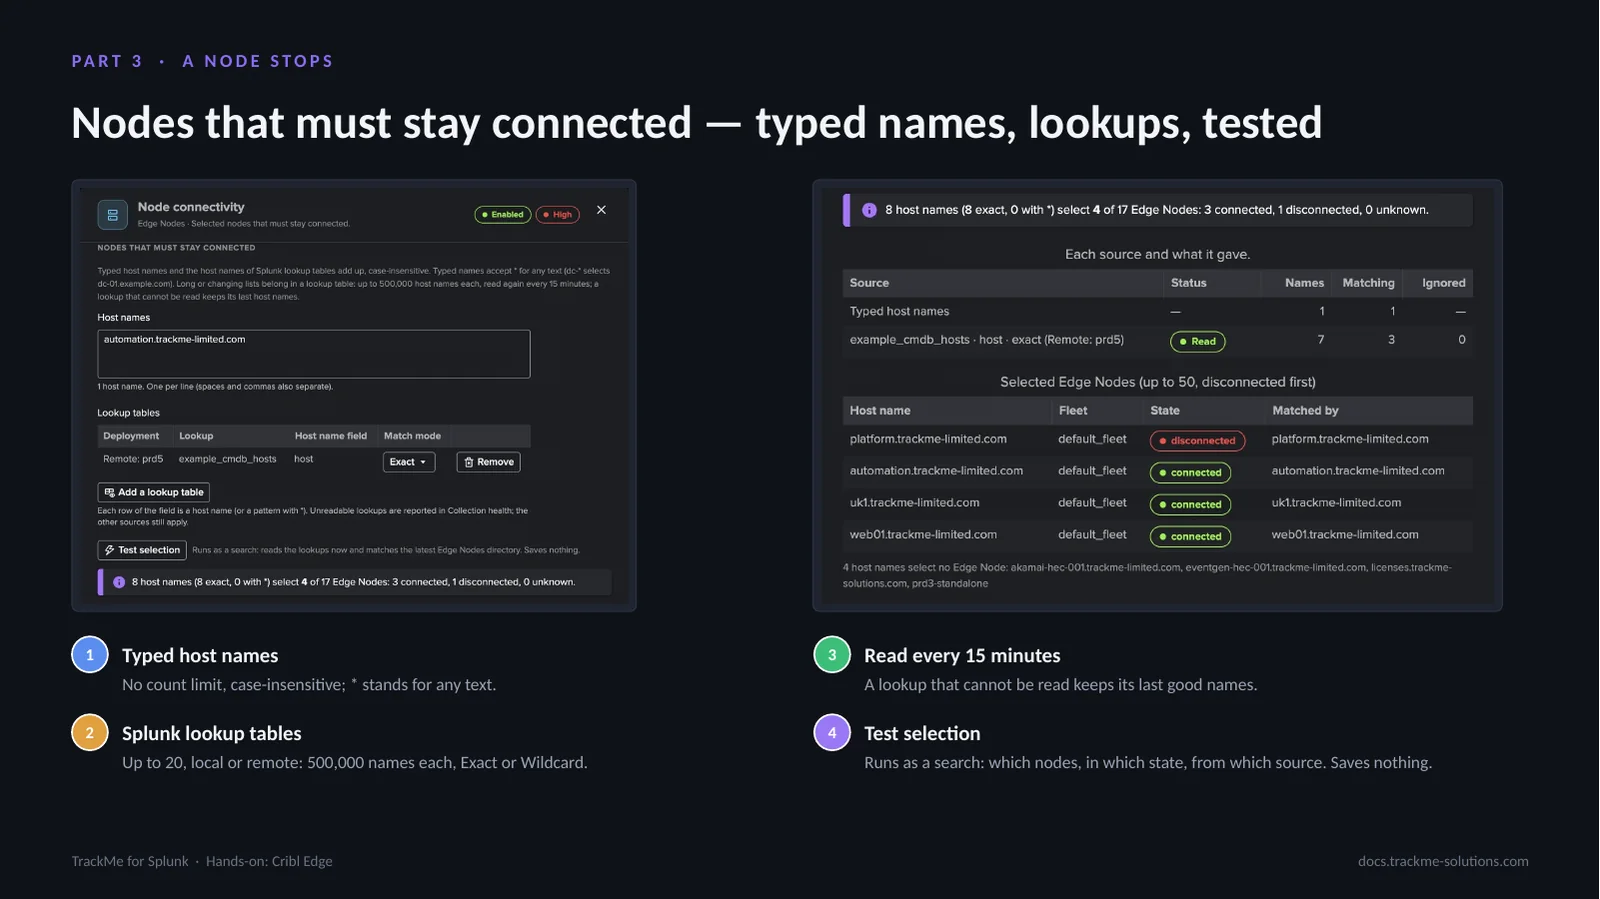
Node connectivity selects the nodes that must stay connected from two sources that add up. Typed host names have no count limit and accept a star for any text. Long or changing lists belong in Splunk lookup tables, such as a CMDB extract, on the local search tier or a remote deployment: up to twenty per policy and 500,000 host names each, matched exactly or with wildcards, read again every 15 minutes. A lookup that cannot be read keeps its last good names, and Collection health says so. Test selection runs as a search and shows which nodes the names select, in which state and from which source, before anything is saved.
Version drift after a rollout
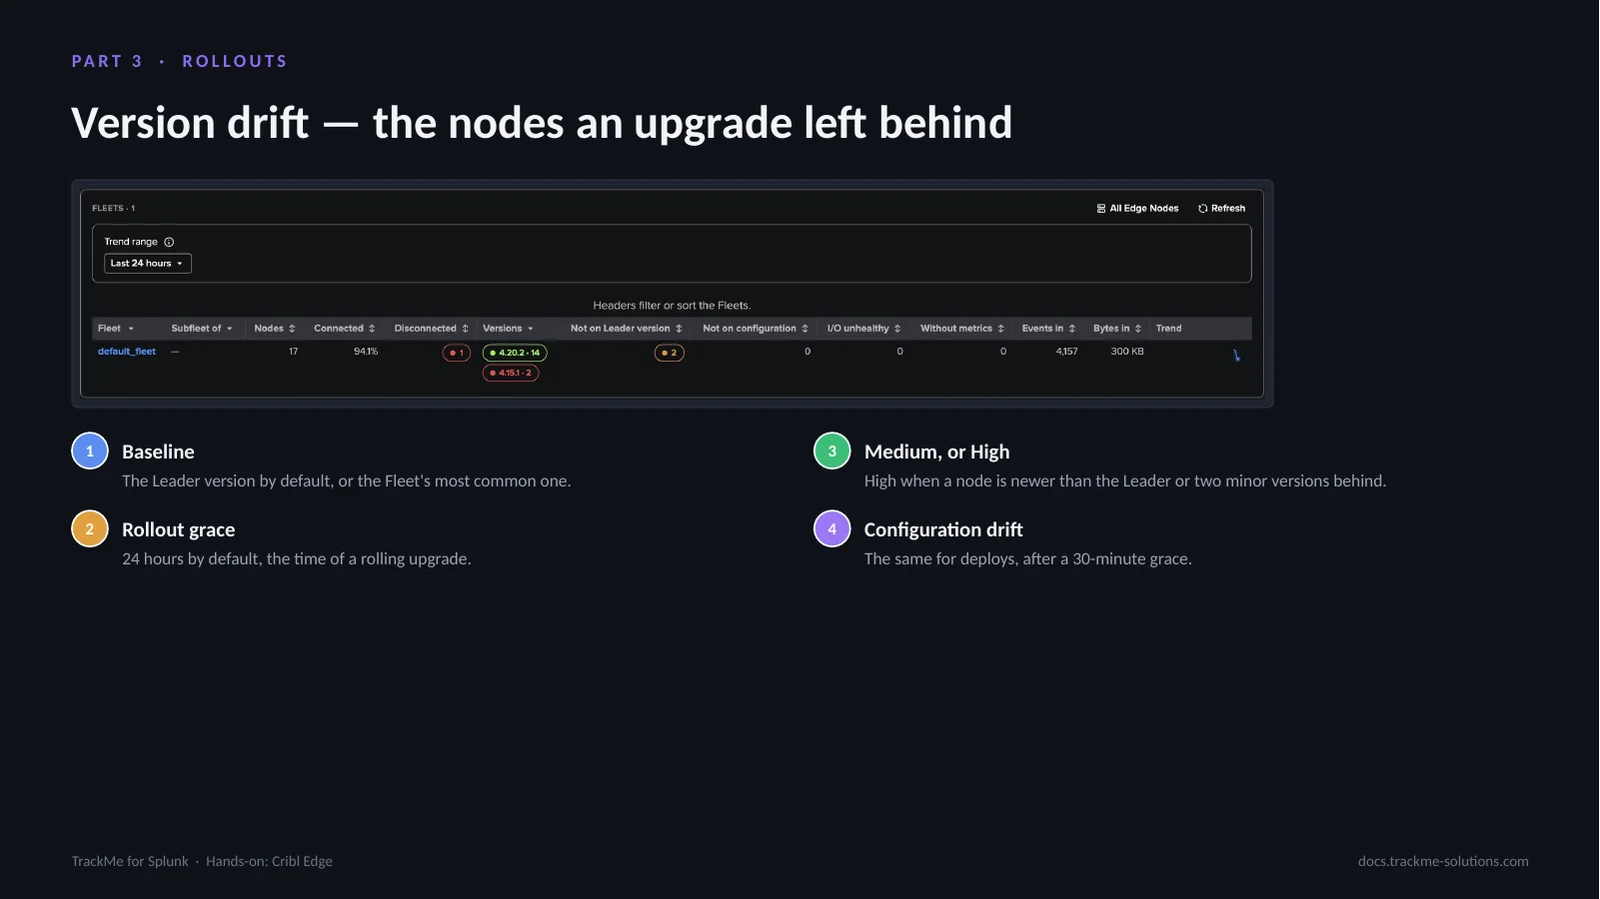
Version drift compares every connected node with a baseline. Once nodes stay off it for the rollout grace, a finding opens on the Fleet: Medium, raised to High for the cases Cribl does not support. Configuration drift works the same way for deployments. The Fleet’s Nodes to look at names the nodes behind each version.
Part 4 — Operate
Eleven built-in policies, eight on out of the box, two collection jobs with the Leader request budget, one Save for every setting, Edge objects and groups in Topology Studio, the AI Assistant, and the Cribl Edge AI Agent with its custom instructions. The comparison with Cribl Stream closes the part.
The policy catalogue
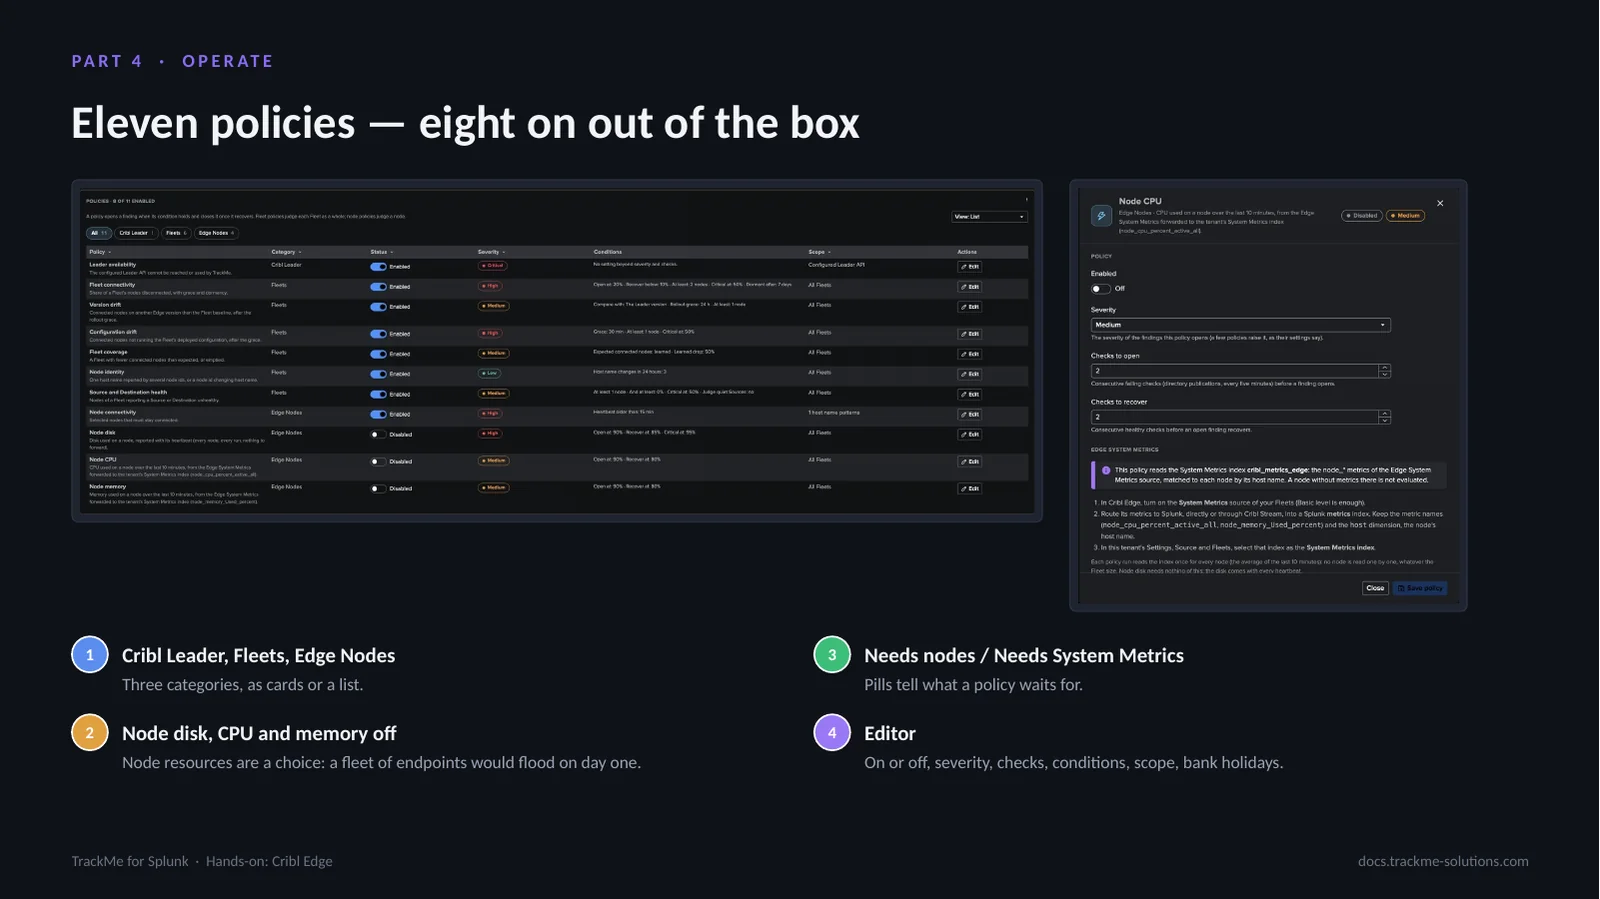
The catalogue of eleven policies in three categories. Two pills tell what a policy is waiting for: Needs nodes on Node connectivity until you select the nodes, and Needs System Metrics on Node CPU and Node memory until the tenant has a System Metrics index. Node disk, CPU and memory are off by default.
Bank holidays, per policy
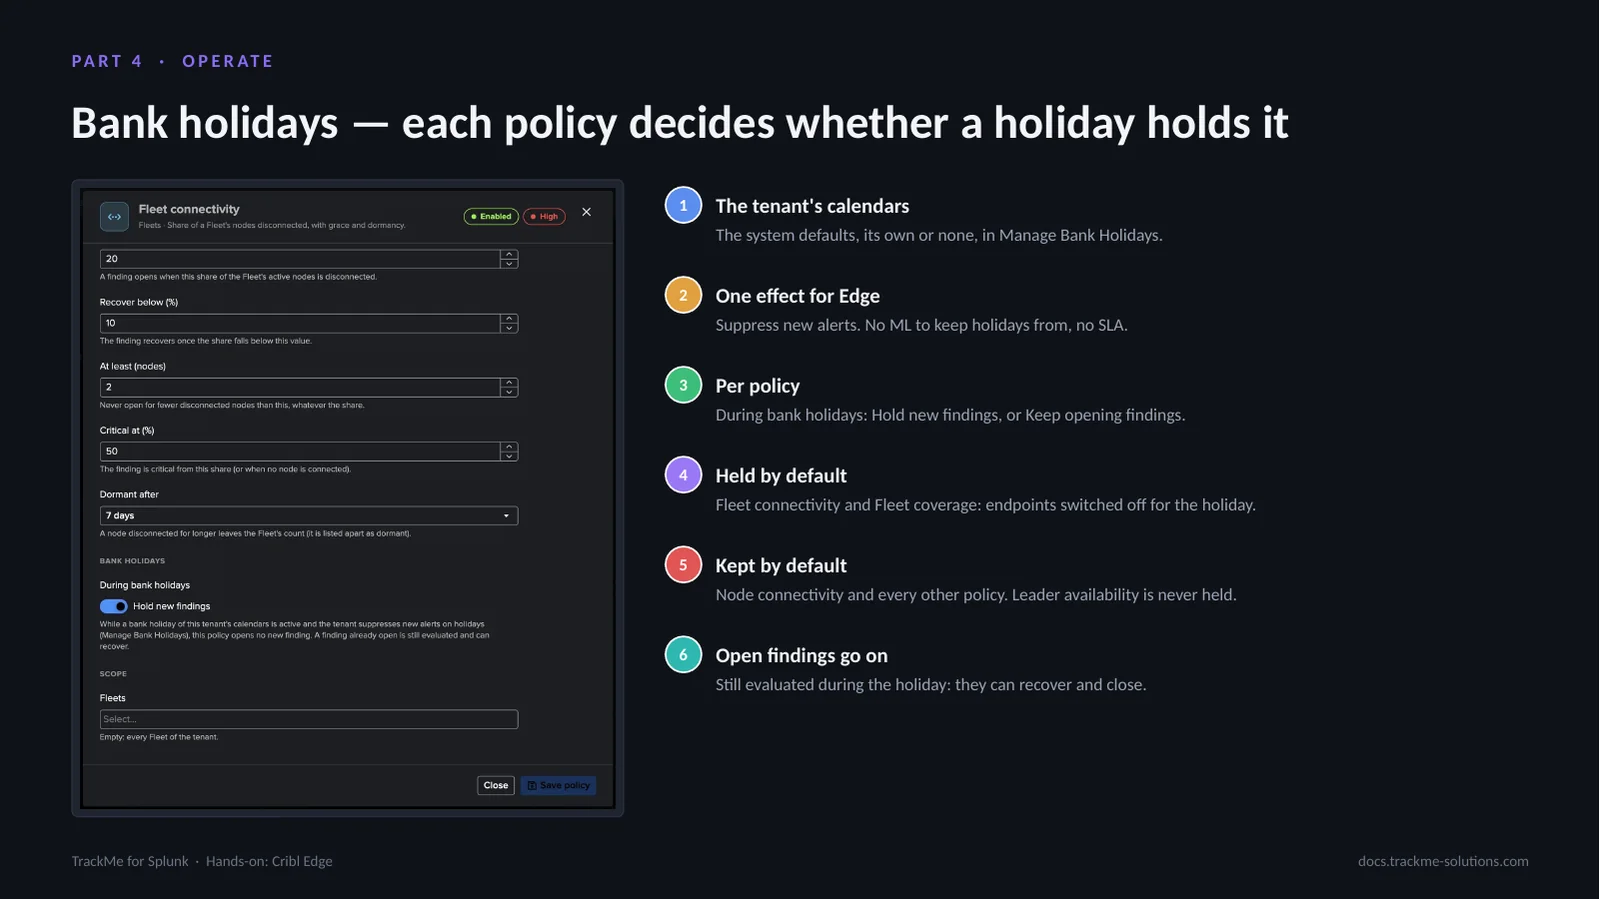
A Cribl Edge tenant uses the bank holiday calendars like every tenant: the system defaults, its own selection, or none. One effect applies to Edge, Suppress new alerts: while a holiday is active, the policies set to hold open no new finding. Each policy decides in its editor. By default Fleet connectivity and Fleet coverage hold, because laptops and desktops switched off for the holiday would otherwise open findings; Node connectivity and every other policy keep opening findings, and Leader availability is always judged. A finding already open is still evaluated and can recover.
Collection health and the Leader budget
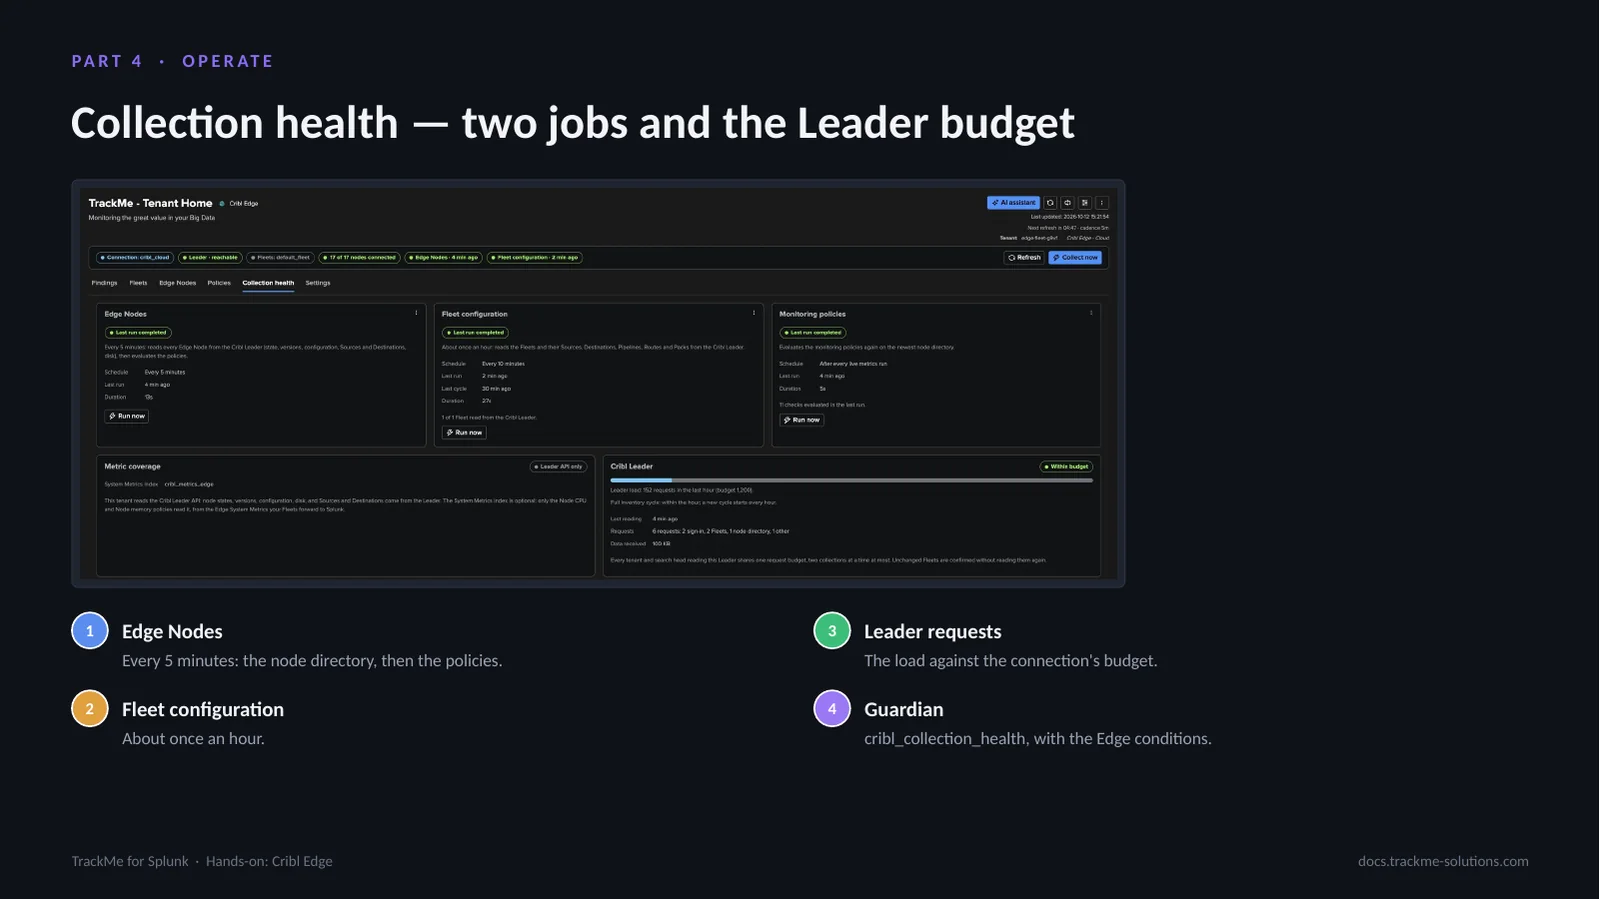
One card per job with its last run, duration, next run and Run now, the Leader requests against the budget and the System Metrics index. When collection does not run as configured, the tab lists the problems and the Configuration Guardian raises Cribl Edge collection needs attention, including the Edge conditions: many nodes without metrics, or no System Metrics arriving.
Settings and notifications
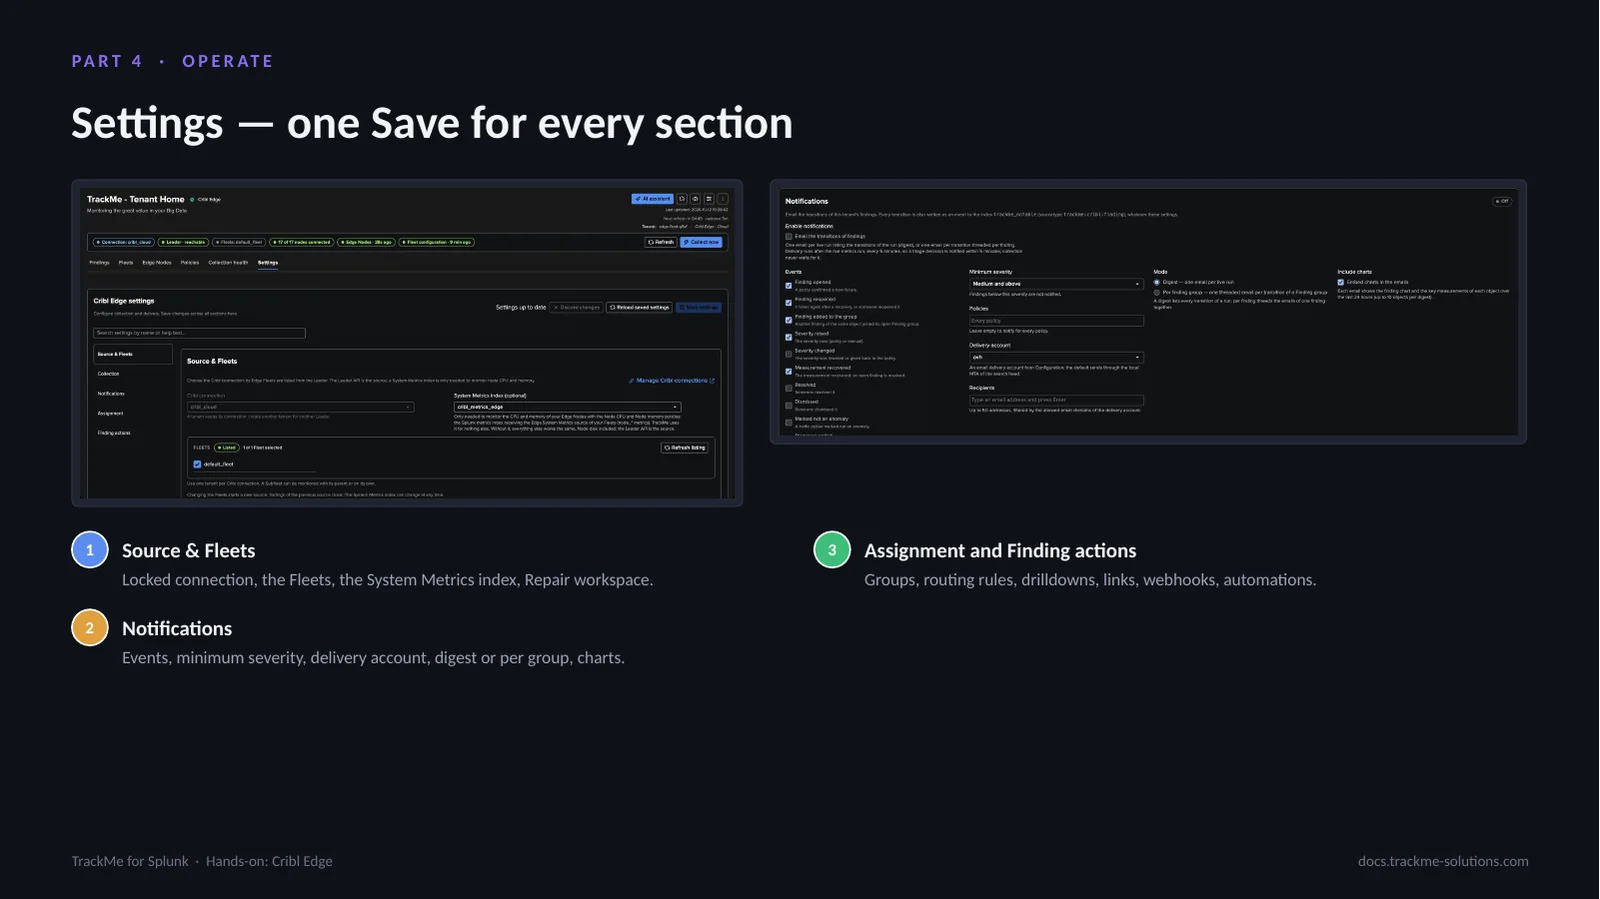
Settings gathers every section with one Save. Changing the Fleets starts a new source and closes the findings of the previous one; the System Metrics index can change at any time. Notifications work as for Cribl Stream, and every transition is also an indexed event.
Edge in Topology Studio
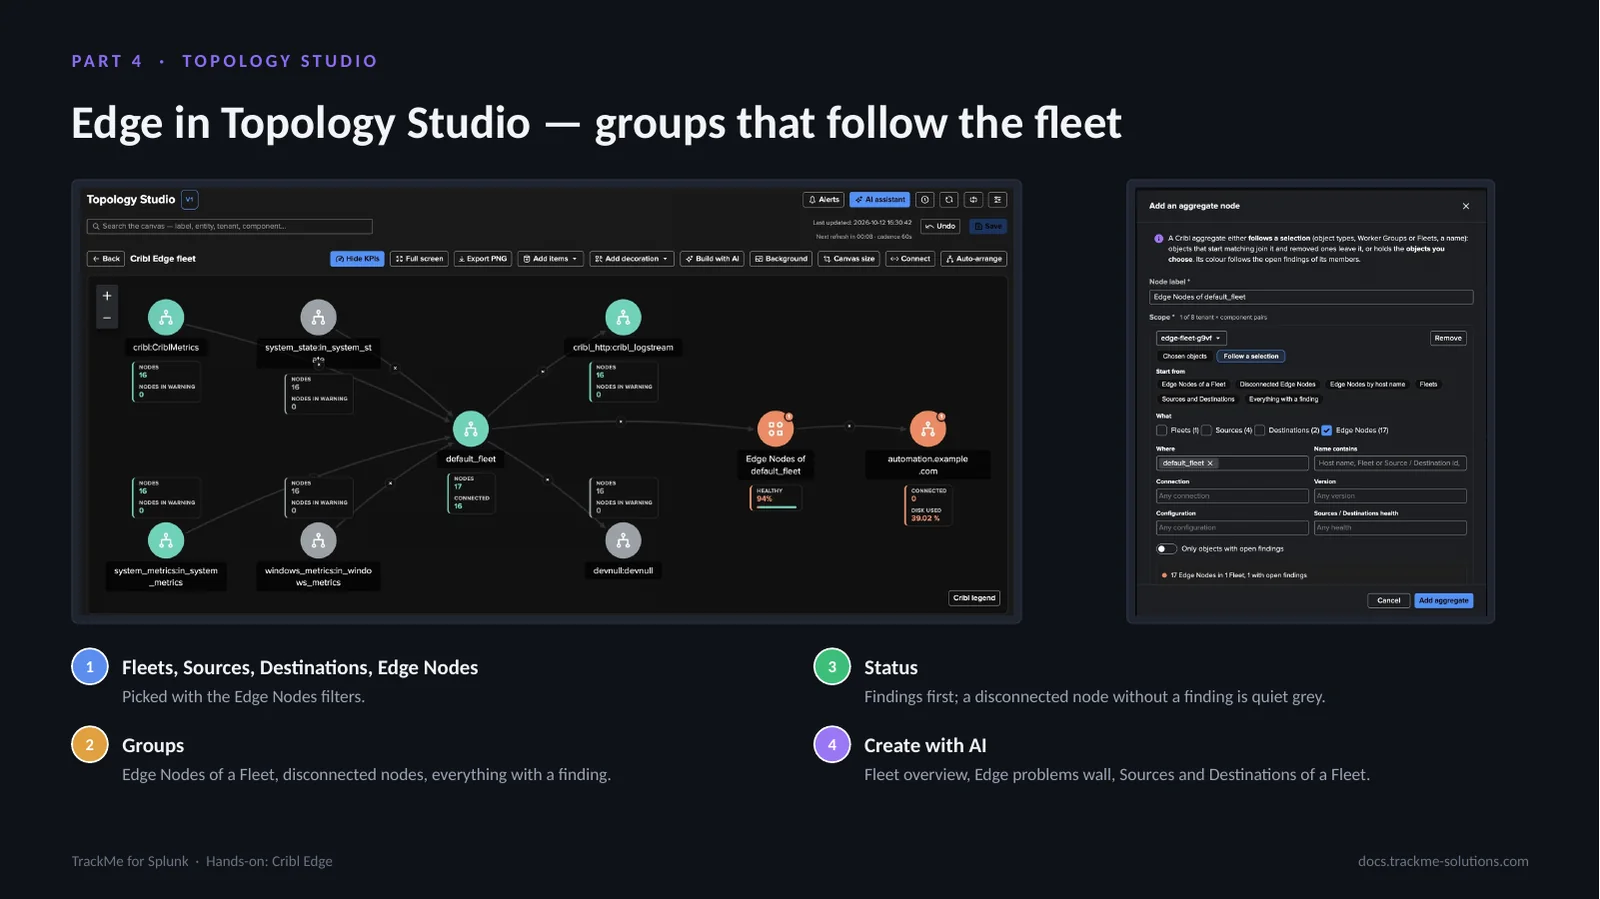
Cribl Edge objects are Topology Studio objects. Groups are the recommended way to show nodes: they follow their nodes as they come and go, at any fleet size, and show their health and healthy share. Topology Alerts work on Edge objects and groups. A view built from an Edge tenant shows the Fleet, its Sources and Destinations and a group of Edge Nodes with its healthy share; a stopped node is drawn quiet grey. Topology Alerts work on Edge objects and groups.
The Cribl Edge AI Agent
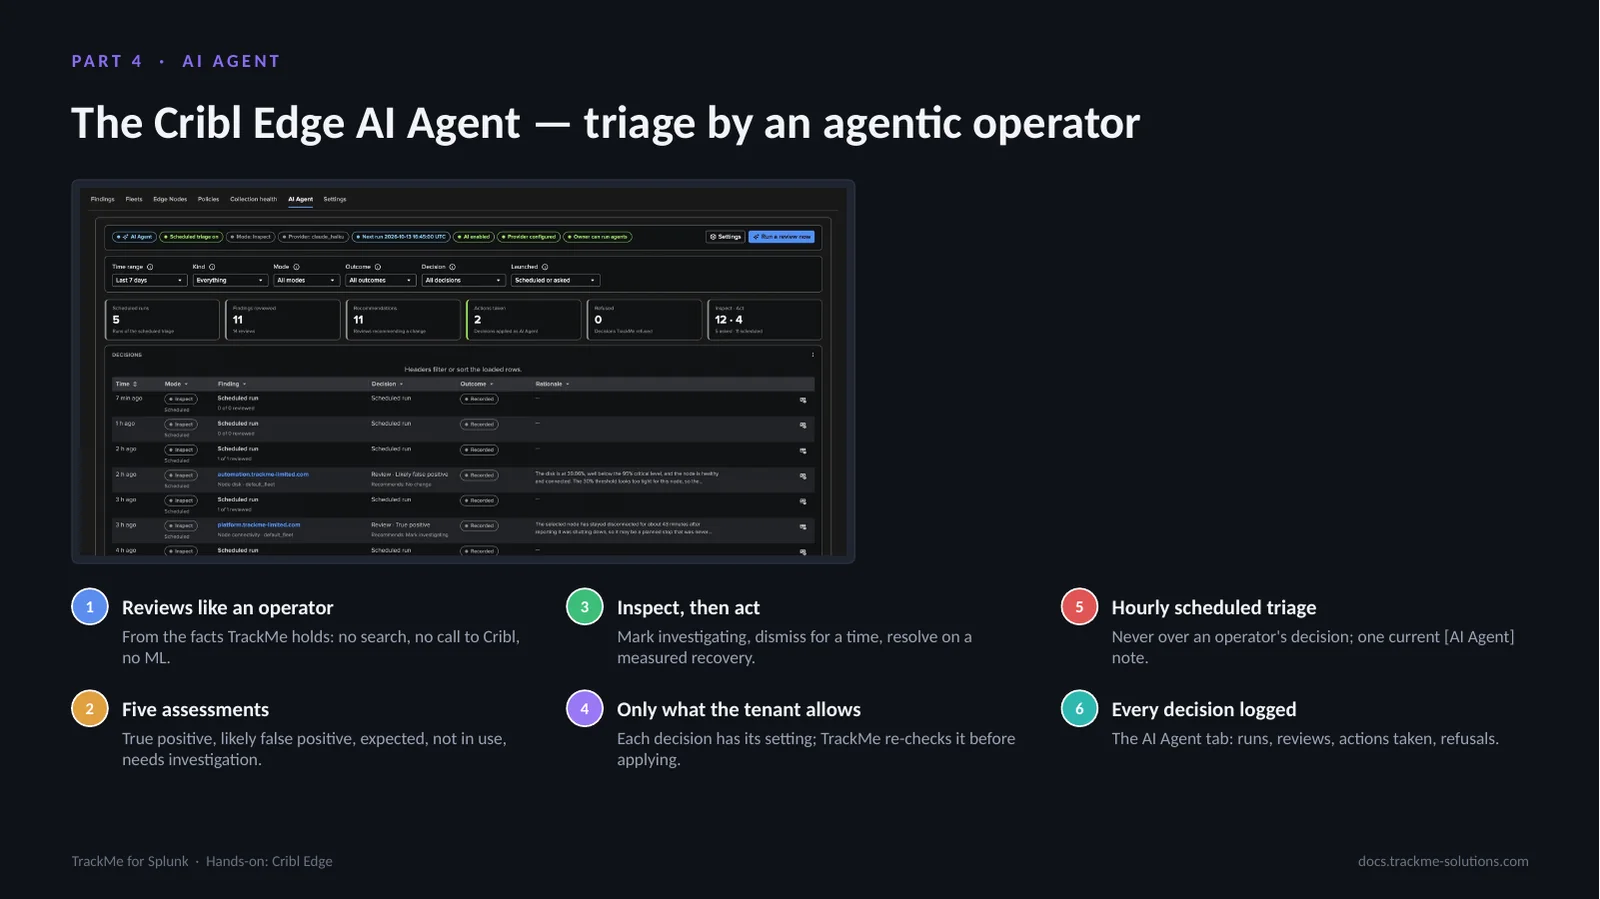
The Cribl Edge AI Agent reviews Edge findings the way an operator would, from facts TrackMe already holds: the finding and its group, the Fleet and the node in the published directory, whether they are still there, and Collection health. It never runs a search, never calls Cribl and uses no machine learning. It assesses each finding and recommends a decision; in act mode it applies only the decisions the tenant allows, and TrackMe checks their conditions again before applying them. Scheduled triage runs hourly and never overrides an operator; the AI Agent tab logs every run and decision.
Custom instructions and Evaluate
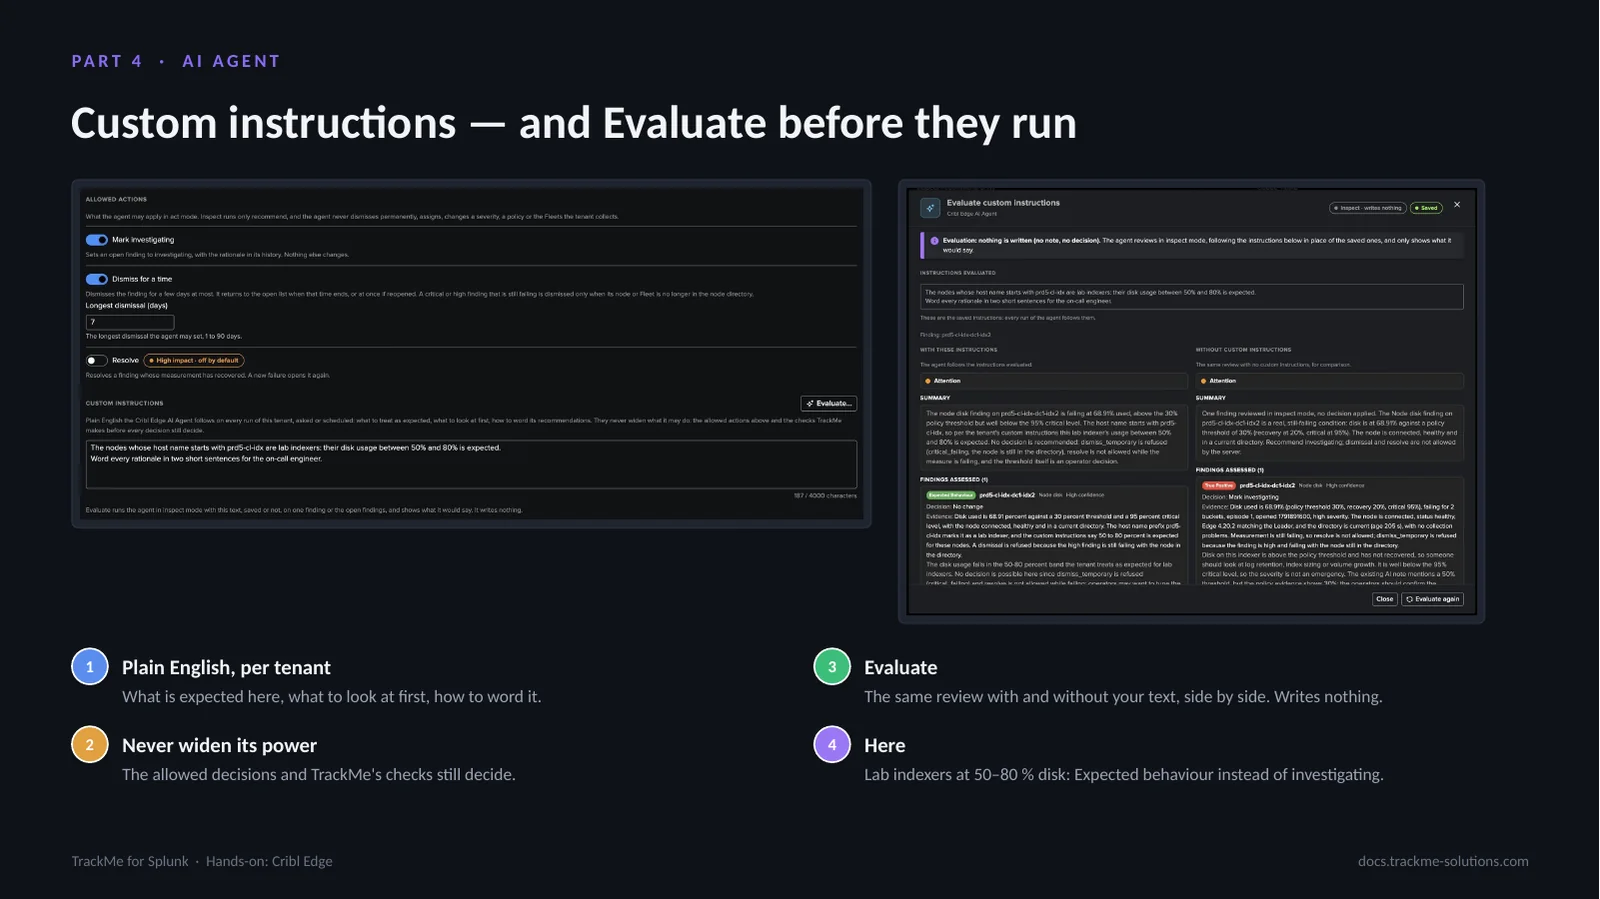
In Settings, AI Agent, a TrackMe administrator of the tenant chooses the decisions the agent may apply and writes custom instructions in plain English: what to treat as expected, what to look at first, how to word the recommendations. Every run follows them, and they never widen what the agent may do. Evaluate runs the agent in inspect mode with the text and shows the same review with and without it, side by side, writing nothing. Here, lab indexers between 50 and 80 percent disk are declared expected: the same Node disk finding reads Expected behaviour instead of a true positive.
The AI Assistant and Edge compared with Stream
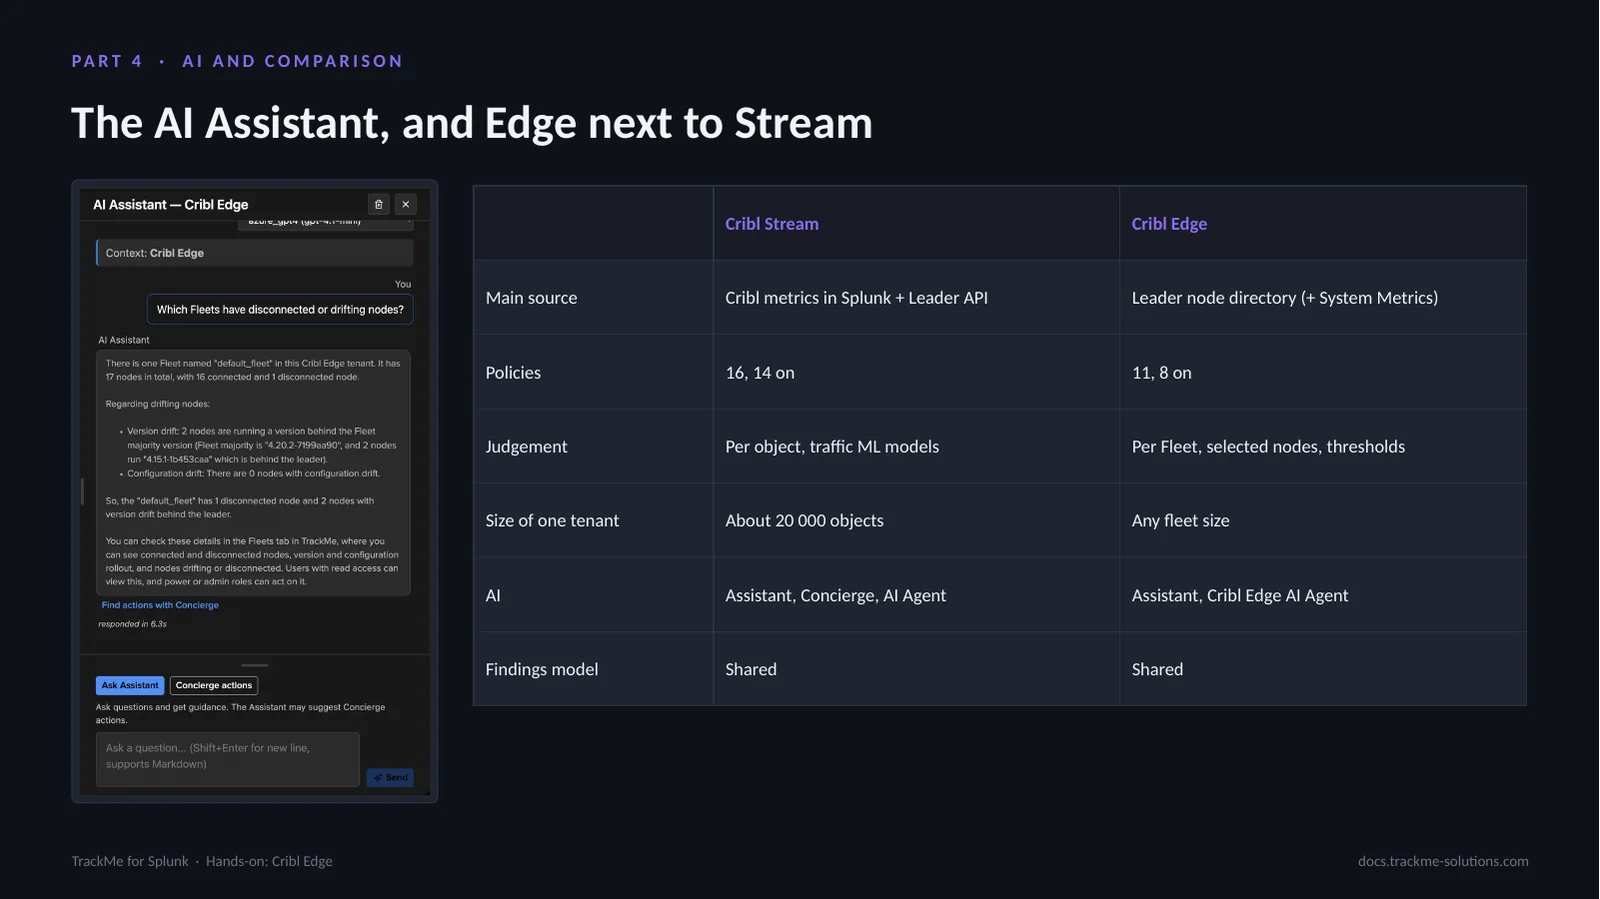
On an Edge tenant, the AI Assistant knows the workspace, the policies and their settings, the Fleets, the node summary, the Leader version and the age of the node directory, and reads the open findings. Edge and Stream share the findings model and each has its own AI Agent; they differ in sources, judgement and machine learning.
Where we are
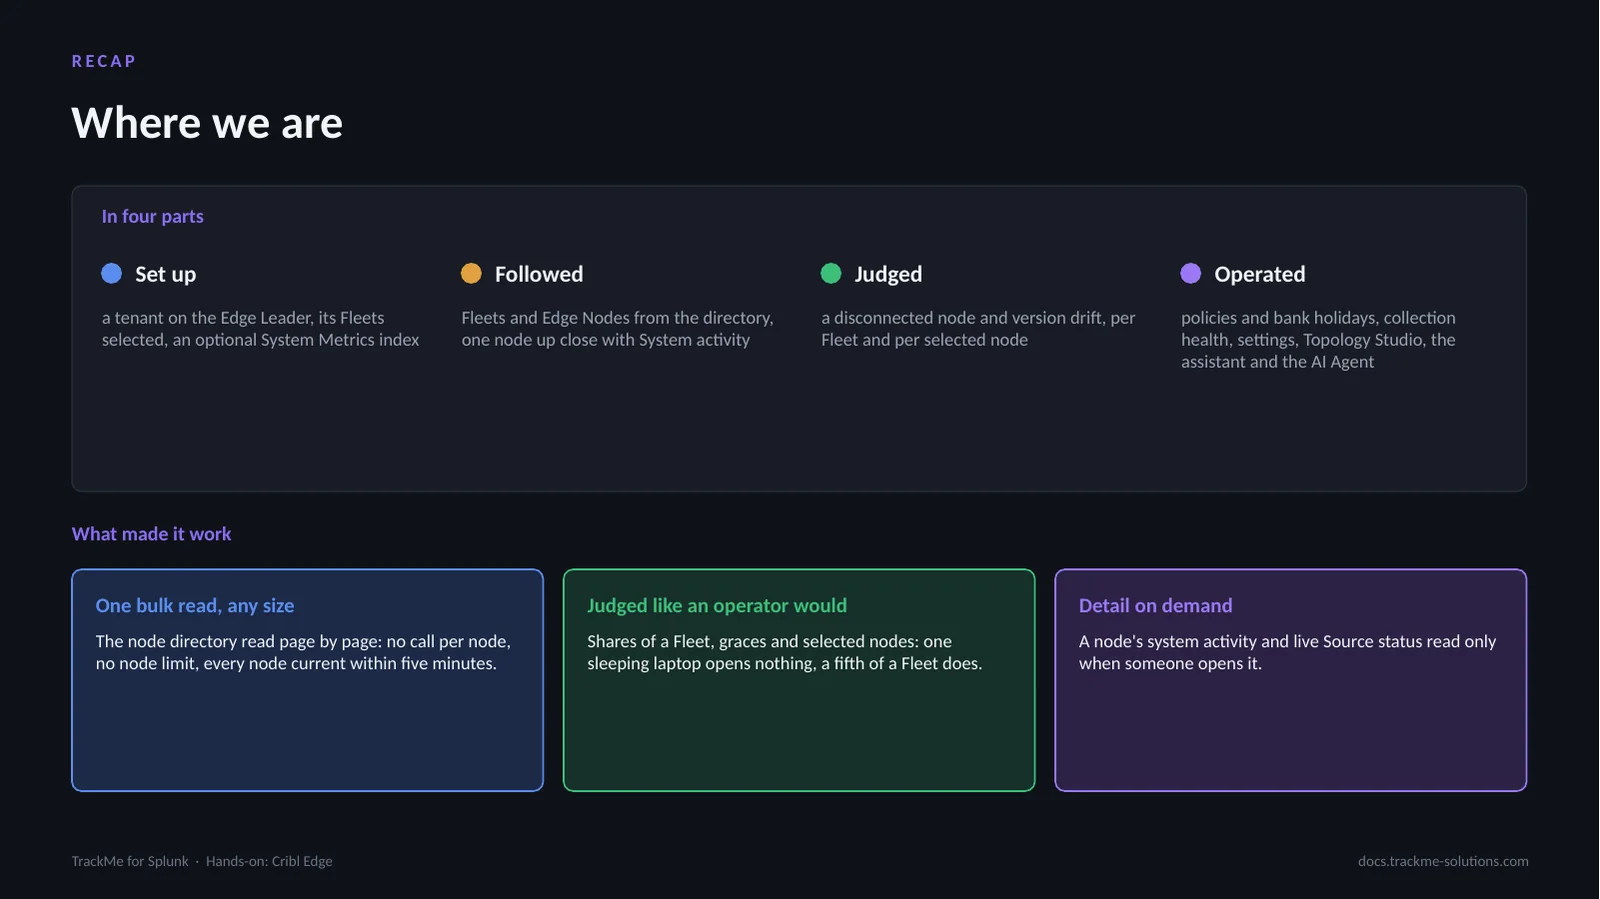
A Cribl Edge tenant on a Cribl connection, its Fleets and nodes followed from one bulk read of the Leader, any node opened up close with its System activity read live, a disconnected node and version drift seen the way the policies judge them, the nodes that must stay connected selected by name or from a lookup, and the tenant operated with its policies and bank holidays, collection health, settings, Topology Studio, the AI Assistant and the Cribl Edge AI Agent.