User Activity Monitoring — reference
This page is the reference companion of User Activity Monitoring: the tenant model and the search head tiers, every report and its schedule, the knowledge-object catalogs, the historical backfill, the indexed evidence, identity and classification, the catalogue of built-in policies, custom policies, the findings lifecycle and Finding groups, notifications and communications, the UAM AI Agent, Collection health and the Configuration Guardian check, every setting, the roles and licence, the REST endpoints, the upgrade from 2.4.18 and the troubleshooting table.
For the task-oriented guide (creating a tenant, reading the workspace tab by tab, triaging a finding), read User Activity Monitoring. The concepts User Activity Monitoring shares with the other findings tenants — Finding groups, triage, assignment, notifications, findings actions, Webhook accounts and the AI Agents — are explained once in Findings, Finding groups and findings actions. For a narrated end-to-end walkthrough, read the User Activity Monitoring white paper.
The tenant model
User Activity Monitoring (UAM) is a dedicated tenant type, created from the User Activity Monitoring card of the tenant creation wizard:
A tenant is either an entity tenant (DSM, DHM, MHM, FLX, FQM, WLK, VOL) or a UAM tenant, never both. Creation refuses a mix (
uam_tenant_must_be_dedicated), the Manage components menu is disabled on a UAM card, replica trackers are refused and the add / remove component endpoints answeruam_tenant_is_dedicated.There are no entities: no decision maker, no impact score, no green / orange / red state, no stateful alerting, no priority / SLA / logical group. The unit of work is the finding, triaged as a Finding group.
A UAM tenant watches one indexing layer seen through one to ten search head tiers: the accounts (human, service or system) and their search activity, their resource cost (CPU, peak memory, share of the environment) and their knowledge objects; the saved searches and the other knowledge objects of each tier; and the policies — twelve built in, plus the custom policies you write — that raise findings about them.
Evidence lives in indexes, state in the KV store. Collection runs in scheduled searches, never in a REST handler.
The tenant identifier of a UAM tenant is short — lowercase letters, digits and hyphens, up to 20 characters — because it keys the per-tenant collections and reports.
The Virtual Tenants card shows the open and high / critical findings and the collection problems; a double-click opens a read-only overview. Tenant Home opens the UAM workspace (tabs Findings, Users, Activity, Scheduled searches, Policies, Audit changes, Collection health, AI Agent and Settings, described in User Activity Monitoring).
Note
What UAM claims, and what it does not. An account is the principal reported by Splunk in the audit records — not a verified person. Distinct search ids are a launch-count proxy. Collection is bounded and resumable, not a lossless ingestion guarantee: gaps and partial coverage are recorded and shown (receipts, Collection health), never hidden. There is no machine learning: the daily CPU deviation rule compares against a percentile baseline.
Per-tenant storage
KV collection |
Content |
|---|---|
|
The configuration, the checkpoints, the latest receipt and the lock of every job, the capacity, the detection records, the notification outbox, the user notification state and the private contact store. |
|
The policy inventory: one row per saved search, user, role and CSV lookup file, per
tier, with |
|
The published knowledge-object catalogs and their definitions (administrator access only, no lookup). |
|
One row per finding, with its investigation state and its Finding group. |
|
One row per Finding group (automatic or manual). |
|
Custom policy definitions (drafts, published revisions) and their execution state. |
|
Findings actions definitions and automation rules. |
The settings, inventory and findings collections each have an administrative lookup
trackme_uam_<kind>_tenant_<tid>. Two global collections serve every UAM tenant:
kv_trackme_uam_agent_decisions (the UAM AI Agent decision log, 90-day retention) and
kv_trackme_uam_custom_execution (custom policy execution slots).
Search head tiers and the route account
One indexing layer, one to ten search head tiers:
Data |
Lives on |
Collected |
|---|---|---|
Saved searches, users, roles, lookup files and the other knowledge objects |
each search head tier |
once per tier, from the Splunk REST API |
|
the indexing layer (every tier forwards its internal indexes there) |
once per tenant, through the route account |
Search head tiers (
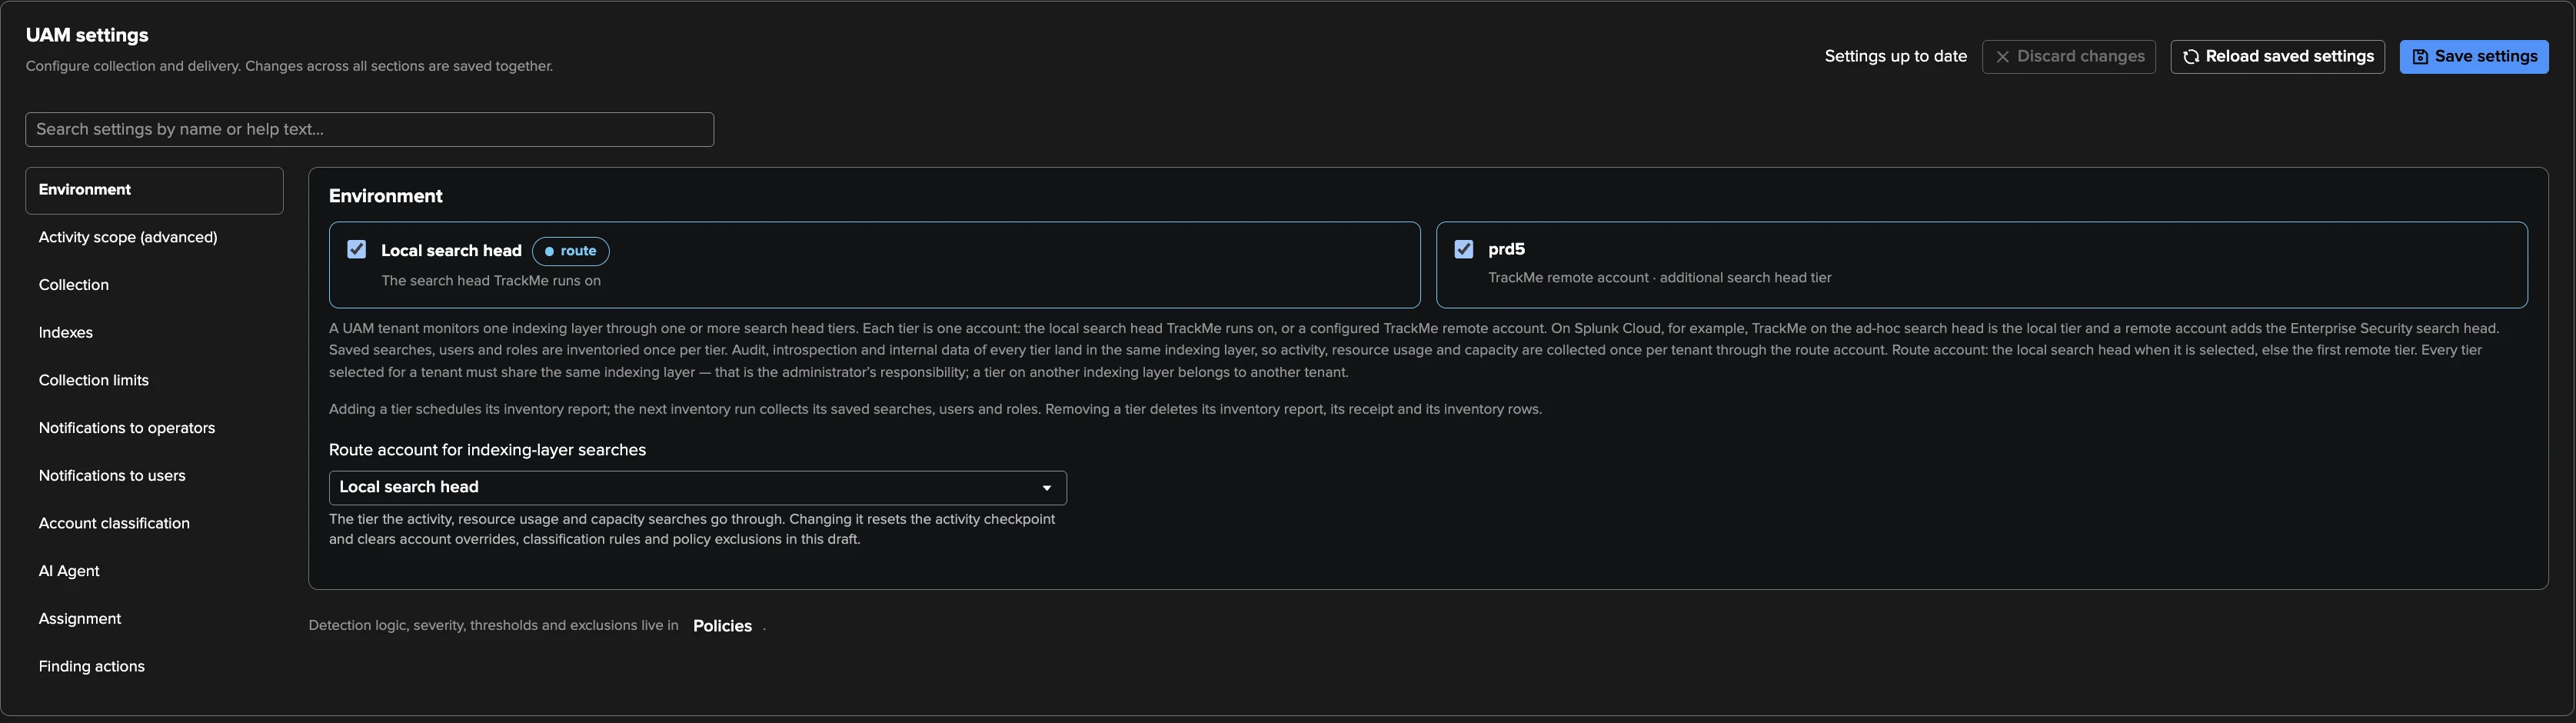
tiers) — 1 to 10 unique names:local(the search head TrackMe runs on) and / or TrackMe remote accounts (see Remote Splunk deployments), one account per tier. Every selected tier must feed the same indexing layer; that invariant is the administrator’s responsibility. The wizard tests every remote tier and waits until each is reachable.Route account for indexing-layer searches (
account) — the tier through which activity, resources, capacity and the audit lookups are read:localwhen selected, else the first tier. It must be one of the tiers.A user present on several tiers is one account (roles united, tiers listed); a saved search belongs to its tier. Each tier has its own reports, locks and receipts, so a slow tier never starves another and a skipped tier is visible on its own.
Typical shapes: on Splunk Cloud, TrackMe on the ad hoc search head (
local) plus a remote account for a premium-app search head; on Splunk Enterprise, any number of remote accounts over the same indexers; for central monitoring, remote accounts only.A search head that keeps its internal indexes local (no forwarding of
_audit/_introspection) hides its searches, logins and resource usage from the tenant — the forwarding prerequisite applies to every signal alike.
Activity scope (advanced)
The tiers select REST connections for the inventory; they do not restrict which events
are read in a shared indexing layer, so a search head that is not a tier still contributes
activity, classification evidence and resource cost. Activity scope (search_head_scope,
wizard and Settings) restricts the activity to search head hostnames:
includeandexclude— up to 20 hostname patterns each (1 to 253 characters), matched case-insensitively on the whole hostname;*matches any characters,?one character, everything else is literal. No SPL, no regular expression.Both empty (the default): every origin. An empty include list means every origin except the exclusions. Exclusions win.
Include every member of a cluster. Excluding only the cluster members does not exclude a management node that also runs searches; to isolate one search head tier completely, include its hostnames.
The scope applies to the live collection and to the backfill: audit records, logins, automation evidence, resource records (indexer samples are mapped back to the search head of their search; an ambiguous mapping is excluded and reported as incomplete coverage), completion CPU and the capacity’s search head part. A change starts a new scope.
It is a monitoring rule, not an access-control boundary: nothing is deleted from the source indexes.
Reports and schedules
Provisioning creates every report of the tenant and schedules them at once. Each report runs
| trackmeuamtracker tenant_id=<tid> job=<job> (or its own command) as the tenant
owner, with its own lock, its receipt (the outcome of the latest run, kept in KV
and indexed as trackme:uam:receipt) and its entry in the tenant’s operational status.
Report |
Schedule |
Does |
|---|---|---|
|
|
Audit activity from a durable ingestion checkpoint through the route account; resource usage; capacity (hourly); account detection; CSV writer hints. |
|
|
Evaluates the built-in policies, writes findings and Finding groups, expires temporary dismissals, delivers operator and user notifications, runs the automation rules. |
|
|
Summarises the published catalogs of the tier for the policies run (reads no source). |
|
hourly wake ( |
Lists every saved search of the tier when due: every Catalog collection every hours (24) inside the off-peak window (01:00 for 5 hours, search head local time). A tier’s first listing runs at the next hourly wake, whatever the window. |
|
15-minute wake |
Users (with the email address for user notifications) and roles, read every Users and roles every minutes (60). |
|
15-minute wake |
CSV lookup file metadata (size, owner, modification time; never the contents), read every 15 minutes. |
|
hourly wake, each at its own minute |
The ten other knowledge-object families, on the catalog cadence, in the off-peak window. |
|
|
The history before the live start, bucket by bucket; retires itself when done. |
|
the policy’s own cron |
One per enabled, published custom policy. |
|
hourly, at a minute derived from the tenant |
The UAM AI Agent’s scheduled triage; created unscheduled, scheduled only when AI is available and the tenant enables it. |
The per-tier catalog reports are named trackme_uam_kos_<dataset>_tracker_tenant_<tid>_tier_<tier>.
The tracker schedules are fixed; the cadences inside them (Catalog collection every, Users
and roles every, the listing window) are settings.
Collect now, Run now and manual collection
Collect now (workspace status strip) runs every tier’s inventory summary, then the activity, then the policies, and every tier’s full saved-search listing. The other catalog families record a request their reports pick up at their next wake.
Run now / List now (Collection health) dispatches one tracker.
With Scheduled trackers off, nothing runs on a schedule: collection only happens on request. Scheduled collection requires a tenant owner (
scheduled_collection_requires_tenant_owner).A scheduled run never blocks the workspace. A Collect now refused because a run holds the lock (
uam_job_running_or_recovery_required) is explained, not reported as an error.
Locks and recovery
One run per tracker at a time. Locks carry the local server GUID and the search id and are never stolen by age alone:
A lock at least five minutes old whose search job has provably stopped on the same search head is recovered automatically at the next acquisition.
Recover stopped run (Collection health,
POST recover) does the same on demand.Locks held by another cluster member, locks without a search id and configuration locks without job ownership are never recovered automatically: verify the originating process on its search head.
The tenant lifecycle (delete, enable, disable, RBAC) has its own guard bound to the process that holds it, so a request whose process died never blocks the tenant for good.
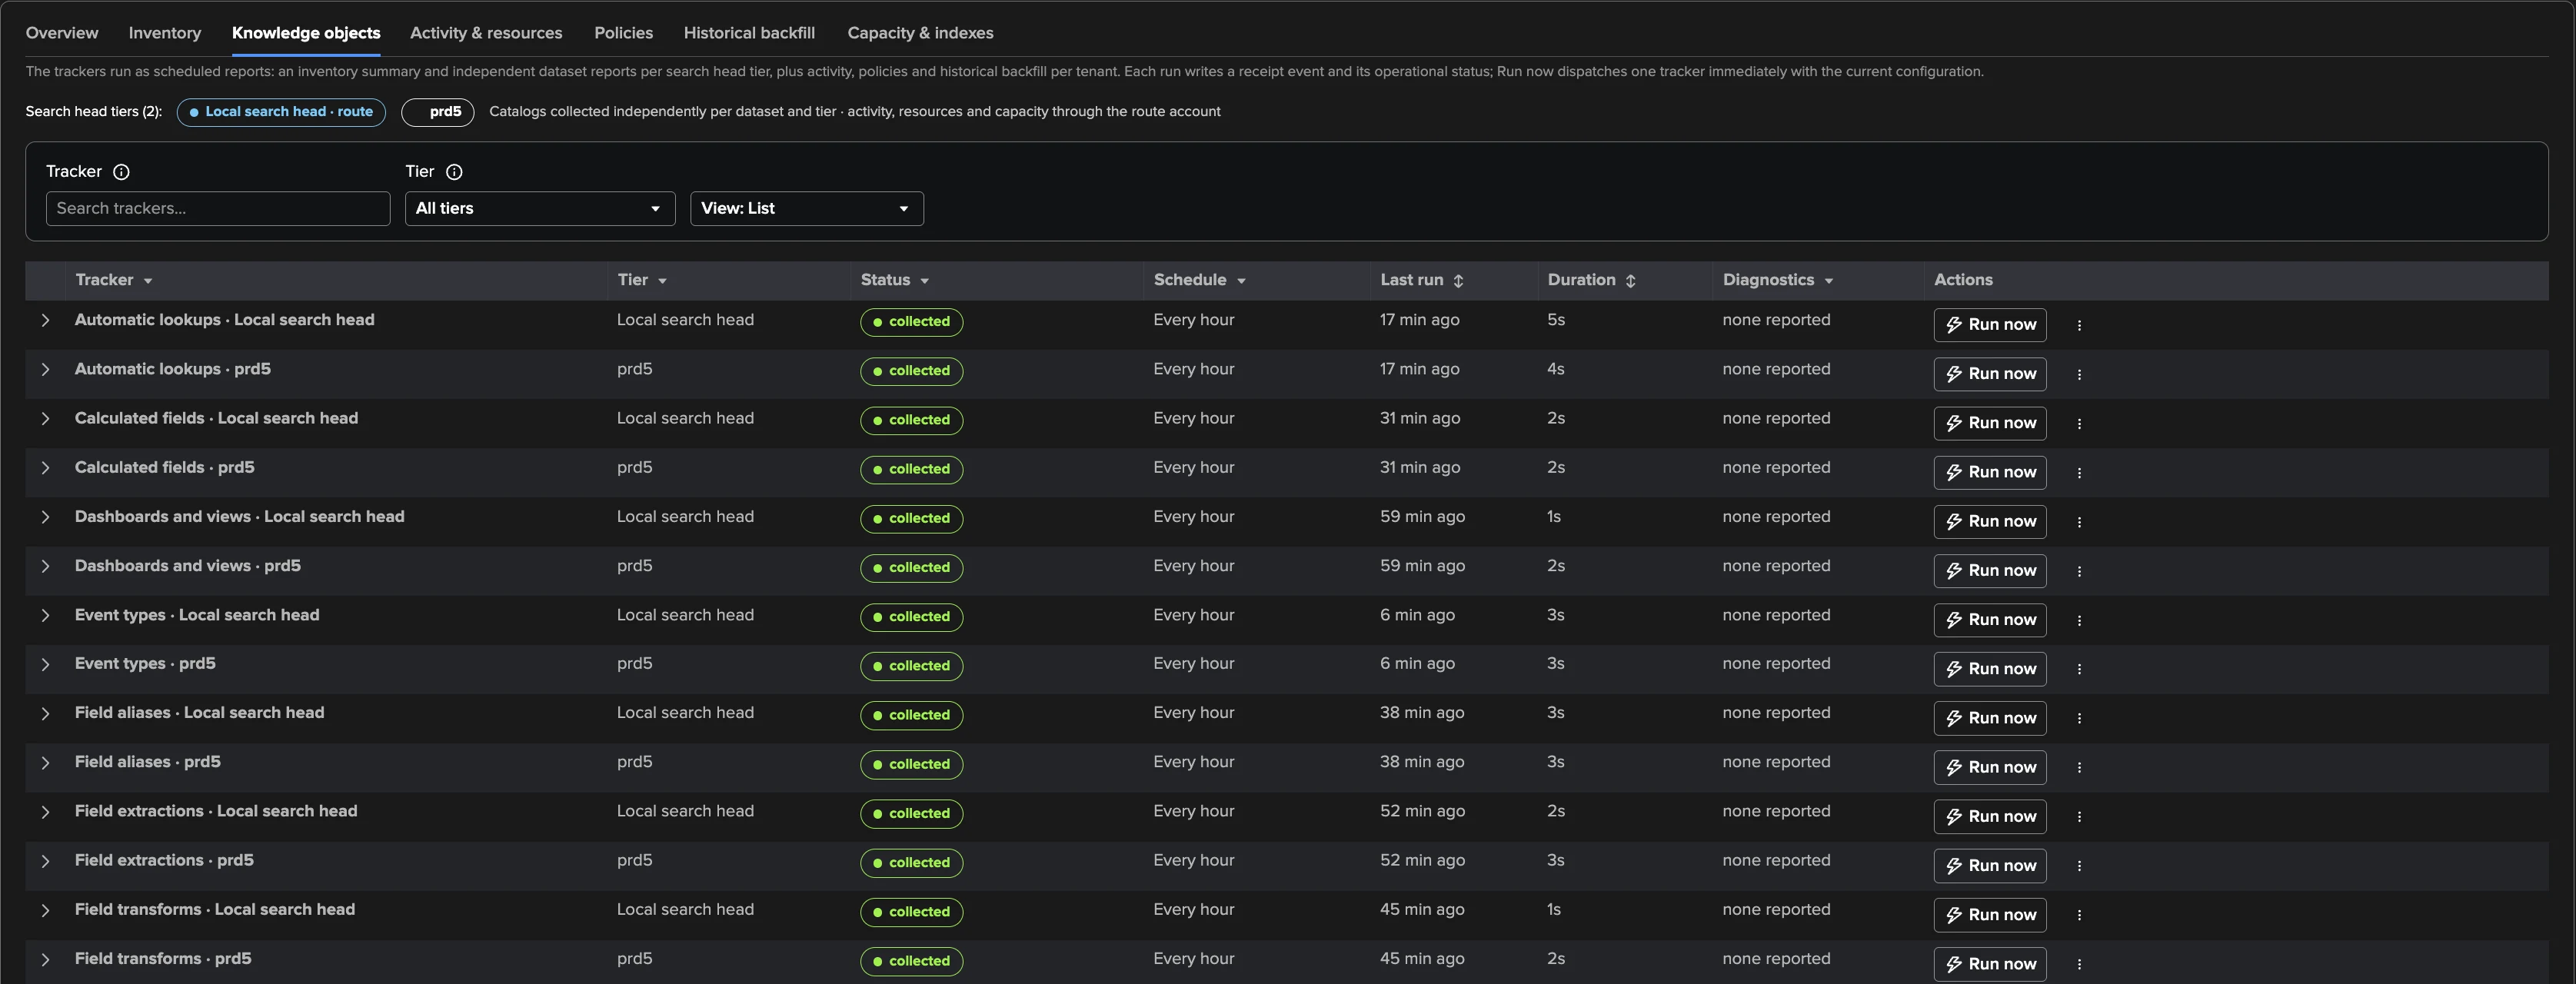
Knowledge-object catalogs
The inventory is read from the Splunk REST API only — no _internal or _audit
search is used to discover objects or changes. Each dataset of each tier is its own scheduled
traversal:
Family (account view tab) |
Datasets |
Cadence |
|---|---|---|
Saved searches & alerts |
Every saved search (reports and alerts), with owner, app, sharing, cron, dispatch bounds, enablement and the definition. |
Catalog collection every (24 h), off-peak |
Users and roles |
Users (with their email address, kept in a private store) and roles. |
Users and roles every (60 min) |
Lookups |
CSV lookup files (metadata only), lookup definitions, automatic lookups. |
Files every 15 min; the others on the catalog cadence |
Dashboards |
Dashboards and views. |
Catalog cadence |
Macros |
Macros. |
Catalog cadence |
Event types |
Event types. |
Catalog cadence |
Fields |
Field extractions, field transforms, field aliases, calculated fields. |
Catalog cadence |
Tags |
Tag assignments. |
Catalog cadence |
Every traversal is bounded (Inventory page size, Inventory max records, Full listing budget) and publishes a complete generation or nothing: a failed or partial traversal keeps the last good catalog. Only one traversal runs at a time per tenant and tier; a busy report waits for its next wake.
Definitions — saved search SPL, macro bodies, event type searches, dashboard source, field expressions, lookup configuration, tag assignments — are kept up to 256 KiB per object in the administrator-only knowledge collection, from an explicit attribute list (never credentials, never CSV contents). They are not executed, indexed or copied to the policy inventory. Older generations are kept one day.
Each saved search, user, role and lookup file is diffed against its previous row: a new row is
added, changed fieldschanged(withchanged_fields), a classification change alonereclassified, a row seen again after removalreappeared; a row absent from a complete traversal is markedpresent=false— never deleted. A partial traversal marks nothing removed. Each change is indexed astrackme:uam:inventory.The catalogs reflect what the tier’s account can see: coverage of private objects depends on its permissions. A traversal is not an atomic snapshot.
Where they appear: the account view’s owner catalogs (Saved searches & alerts, Dashboards, Macros, Event types, Fields, Lookups, Tags), Search knowledge objects on the Users tab (across every owner), the saved search view, and Collection health → Knowledge objects. Tenant administrators only.
Activity
The activity job reads the _audit trail from a durable ingestion-time checkpoint:
It loads the checkpoint, or initialises it at now − window on the first run or when the environment changed (
checkpoint_reseton the receipt).It reads windows
[cursor − overlap, min(now − 10 s, cursor + window)]until it catches up or its run budget (Activity max seconds per run, 200 s) is nearly spent.Each window is one bounded audit search (the legacy
Audit:[…]key=value line and the structured JSON record alike). The rows are normalised and correlated by search id.A window over Activity max records per window is halved, down to 60 seconds; at the minimum the bounded evidence is kept and the cursor advances with an explicit gap (
record_limit_exceeded_at_minimum_window) — a coverage gap, never a stall.The overlap re-reads the last Activity overlap seconds of ingestion time so a late event is never missed; a record already written is skipped, so nothing is written twice.
A blocking diagnostic (transport, search failure, incomplete pages) stops the run without advancing; the window is retried on later runs up to Activity window retries, after which its partial evidence is kept, the cursor advances and
window_retries_exhaustedis recorded.Evidence-quality diagnostics (
normalization_gap,locator_conflict,invalid_event_envelope,unsupported_source_contract) are recorded but never block.The checkpoint is persisted after every window.
In the same run, the activity job also collects the resource usage of the searches (see below), refreshes the capacity at most hourly, scans the span it advanced through for Splunk Web logins and automation evidence (classification), and records the CSV lookup writes it saw (probable writer hints for the CSV policy).
Source contract. The audit source contract is the format, never the Splunk version: a
line that parses as the legacy key=value grammar or the structured JSON is evidence. The
qualified families are Splunk Enterprise 10.4 and Splunk Cloud 10.5; any other version is
read all the same and only adds the soft diagnostic source_version_unqualified. With
Source version assumption on (the default), emitters whose version could not be verified
are parsed under the connected head’s version and labelled assumed.
Resource usage and CPU accounting
With Collect search resource usage on (the default), each activity window also produces
one trackme:uam:resource record per search and account: CPU seconds, the part spent on
the indexers, peak memory, elapsed time, node count, and Splunk’s own search type,
provenance, mode and label.
CPU follows Splunk’s own accounting where it exists, decided per window and per tier (search head, indexers) from the data:
Splunk Cloud 10.5 accounts CPU at search completion (the audit
cpu_timeon the search head, the indexers’ completion lines). A tier with a completion figure counts its CPU once, at completion.A tier without one keeps the CPU integrated from the
_introspectionper-process samples (Splunk Enterprise 10.4).Every record carries
cpu_source(completion,head_completion,peer_completionorintrospection). Real-time searches always use sampled CPU.Peak memory reads not measured for a search no introspection sample caught (short searches in pooled processes on Splunk Cloud).
The capacity — the cores and memory of the search hosts, the nodes that ran a meaningful share of the search processes (a utility node running its own few searches is listed but kept out of the basis) — is refreshed at most hourly and drives the automatic budgets of the resource policies. A failed refresh keeps the previous record.
Policies run
Every 15 minutes the policies job:
reads the present inventory rows of every tier under the inventory lock (a long inventory publication makes it wait up to 90 seconds, then fail with
inventory_publication_in_progressand retry at its next schedule) and evaluates the inventory policies with the completeness of each tier’s catalogs;aggregates the indexed audit and resource records of the trailing Activity policy window (15 minutes) and evaluates the activity and resource policies per account;
reconciles the findings and the Finding groups under the findings lock (see Findings and Finding groups), expires temporary dismissals, publishes the counts the card reads and writes one
trackme:uam:findingevent per transition;delivers the operator notifications and the user notifications, and runs the automation rules (fail-open: a delivery failure never fails the run).
The receipt stores one evaluation per policy (enabled, state, evaluated / matched /
excluded / unknown / not applicable counts, readiness, thresholds source) and its bounded
insight (see Policy insight and preview). Completeness is per family: inventory
findings are marked not observed only when every tier’s catalogs are complete, audit findings
when the activity window was complete, resource findings when the resource coverage is
complete on top. A rule whose aggregation failed is incomplete and neither creates nor
clears anything.
Bank holidays. A UAM tenant takes one effect of the bank holiday calendars, Suppress new alerts (Hold new findings). While a holiday of the
tenant’s calendars applies and the effect is on, the policies set to hold
(policies.<policy id>.hold_on_bank_holidays, defaults in The built-in policy
catalogue) open no new finding:
The run reads the holidays once, only when an enabled policy holds: the holidays that overlap the trailing activity window, then the tenant’s calendars and effect. The outcome is
holding,off(a holiday applies but the tenant does not hold) orunavailable(the calendars could not be read: nothing is held, a warning is logged).An inventory policy holds while a holiday is active at the time of the run (it judges the configuration as it is now). An activity or resource policy holds when a holiday overlaps its activity window: a burst on the last evening of a holiday is a holiday burst, even when the run comes after midnight.
A match of a held policy whose finding does not exist, or is not observed (resolved, dismissed, or not seen by the previous run), is skipped before the capacity check: no finding, no Finding group, no transition, no
trackme:uam:findingevent, no operator notification, no findings action, and no findings capacity used. The direct user notifications leave its state untouched: a held match is neither a detection nor a step towards a recovery.A finding already observed is evaluated as on any other day (updated, escalated, no longer observed); expiries and housekeeping are unchanged. A held match never makes the run incomplete, and the first run after the holiday opens what was held.
When the outcome is not “no holiday”, the receipt carries bank_holidays: state,
names (up to five holidays), held (the matches held) and policies (the enabled
policies set to hold). Each evaluation that held carries its own held count, and the
findings counters carry held while the run holds. The policy_evaluation endpoint
returns the run’s bank_holidays.
Historical backfill
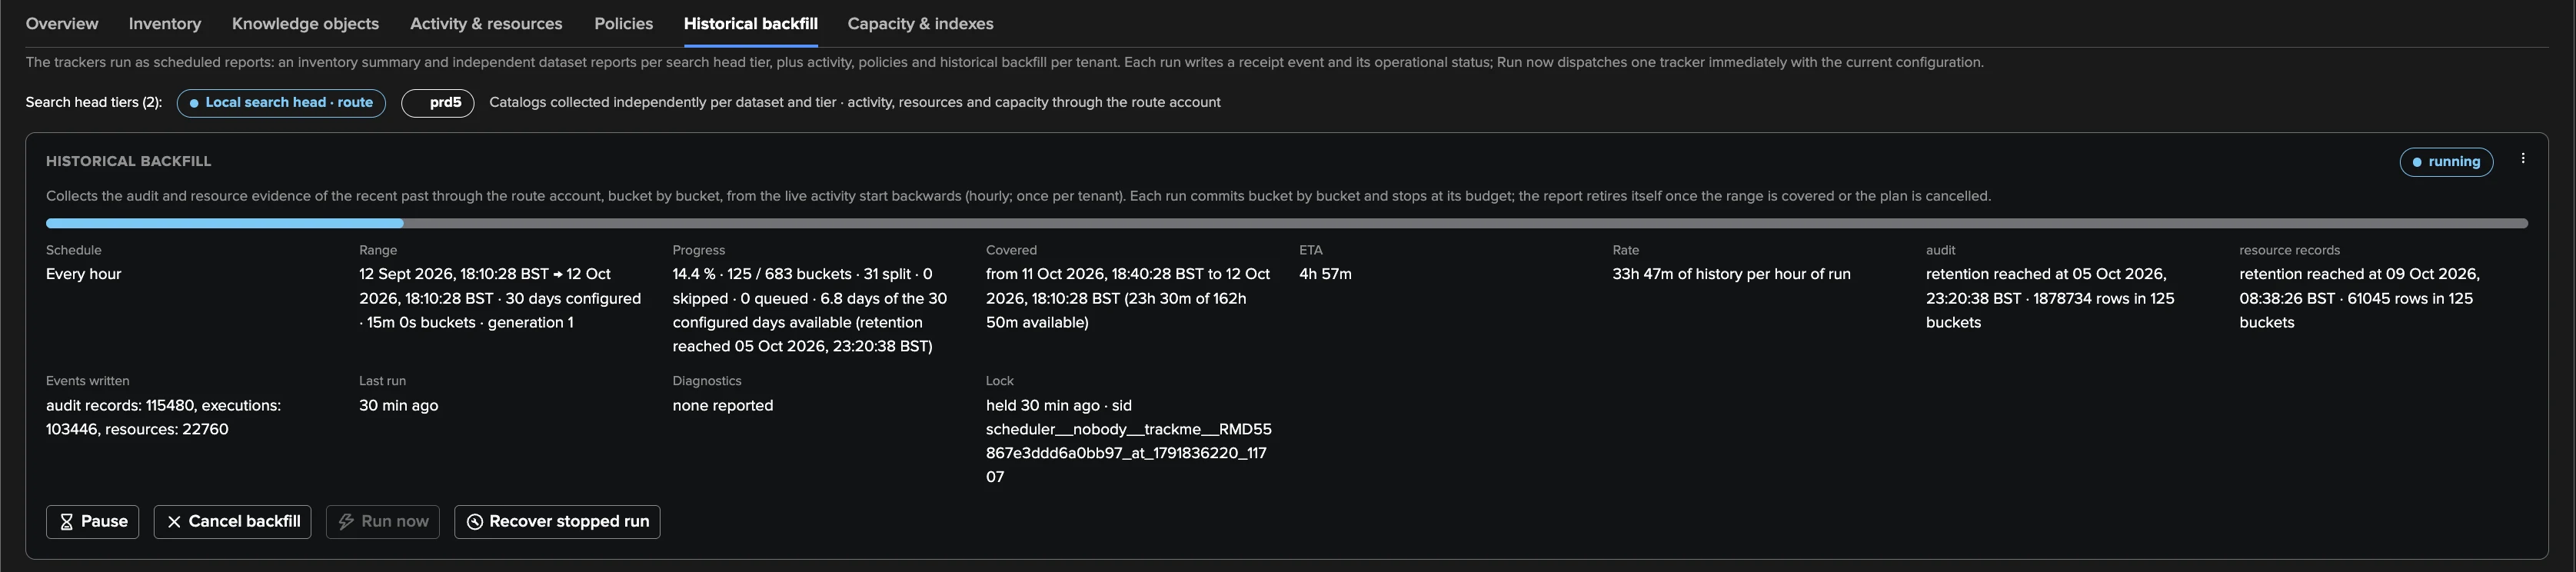
The backfill report collects the audit and resource evidence of the configured range before the live activity start (Backfill days: none, 7, 14, 30, 60 or 90 days in the wizard, 0–90 in Settings, default 30), through the route account. Evidence in an index cannot be taken back, so the backfill never collects a span twice:
The plan ends exactly where the live activity started and waits until the first activity run has set that point (
backfill_waits_for_first_activity_run, a normal receipt).Fixed buckets (Backfill bucket, 15 minutes by default) are walked backwards, newest history first, one bounded audit search and one resource search each; a bucket over Backfill max records per bucket is split in two.
One attempt per run: a bucket with a blocking diagnostic is retried at the next hourly run and the run stops (a transient outage costs an hour, not the range); after Backfill bucket retries attempts it is recorded as skipped. A run stops cleanly at Backfill max seconds per run (3,000 s). A bucket interrupted between its write and its commit counts as covered, not read again.
Retention edges come from the sources: the plan stops at the oldest
_auditand_introspectiondata (retention_reached). The introspection retention is usually shorter (about two weeks), so the resource history may end earlier than the audit history.Re-plans carry the coverage forward: a changed range or bucket size, or Plan again, starts a new plan where the previous one stopped; a range already covered completes at once. A complete or cancelled plan un-schedules the report;
backfill_days = 0disables it.The backfill also scans each bucket for Splunk Web logins and automation evidence, so the people and services already active when the tenant was created are classified without waiting. It does not record CSV writer hints, and the inventory is never backfilled.
Controls in Collection health → Historical backfill: Pause (after the current bucket, progress kept), Resume, Cancel (retires the report; collected buckets stay indexed), Plan again, and Run now. The receipt carries the buckets done / split / retried / skipped / interrupted, the events written, the progress (percent, estimated end from the measured rate) and the plan status.
Receipts and diagnostics
A receipt is value-free: counts, statuses, diagnostic codes and window bounds — never an account name, a search text or a credential. Collection health renders the latest receipt of every job and the last seven days of runs from the indexed receipts, each diagnostic explained. A completed run with zero observations is a successful run: absence of activity is not a failure. A completed run is not a lossless-ingestion guarantee — the receipt says what was covered.
The evidence
Evidence events are written to the dedicated trackme_uam_events.log under
$SPLUNK_HOME/var/log/splunk (UAM writes one line per search, so it never shares the
state-events file of the other components) and routed by TrackMe’s ingest evaluation to the
target index of their family.
Sourcetype |
Family |
One record per |
Main content |
|---|---|---|---|
|
evidence |
Search and window |
The account and app, the search id, type and status, the run metrics, the time
bounds (the |
|
evidence |
Search id |
A correlation candidate: lifecycle, claims, phases, accounts and apps reported. |
|
evidence |
Search and window |
The search’s resource usage: CPU seconds (search head and indexers) with their source, peak memory, elapsed time, nodes and samples. |
|
evidence |
Inventory change |
The object’s fields, the change (added, changed, removed, reappeared, reclassified) and the fields that changed. |
|
search text |
Reported search |
The SPL, written only while Store SPL search is on. |
|
findings |
Finding transition |
The finding with its evidence and investigation state. |
|
receipts |
Tracker run |
The outcome of the run. |
Observation fields.
accountandaccount_source,app,sid,search_type, the status,metrics(total_run_time,event_count,result_count,scan_count,exec_time),time_bounds(search_et/search_ltas text),granted_timeandmerged(what was folded into it). The same sourcetype also carries onerest_accesssummary per account and batch (REST job access counted per kind:job_poll,job_lookup,job_dispatch,stream,remote,other) and thedenied REST:lines (security evidence).Resource fields.
account,sid,app,search_type,provenance,mode,label,cpu_seconds,peer_cpu_seconds,cpu_source,peak_mem_mb,elapsed,nodes,samples,roles,window.Inventory fields. The object’s fields,
changeandchanged_fields.Every event carries
tenant_id(an indexed field),environment_id,event_kindand_time, plus the indexed dimensionsuam_kind,uam_environment,uam_account,uam_sid,uam_appanduam_status, so the per-account and timeline reads run throughtstats. These index-time settings take effect after the splunkd restart of the app installation; until then, and for older evidence, the readers fall back to slower raw searches.Default indexes: the tenant’s summary index for evidence, search text and receipts, its notable index for findings. Each family can be pointed at another index in Settings → Indexes.
One compact record per search and window: the grant folds into the completion (
granted_time), REST job access is summarised per account rather than written line by line, null keys are dropped.
Store SPL search and Fetch SPL
Store SPL search (
store_search_text) is off by default. When on, the SPL of every reported search is indexed as its owntrackme:uam:search_textrecord in the search text index. Audit search text can carry literals and secrets: point the search text index at an index restricted to the people allowed to read it before you switch this on.Fetch SPL (account view, Activity tab, saved search view) shows the SPL of one search. It reads the stored
trackme:uam:search_textrecord (or older evidence that carried the SPL inline) as the calling user; otherwise it reads the environment’s_auditrecord live through the route account, as the calling user, and stores nothing. When the text cannot be shown, a reason says why:not_in_audit,account_access_denied(your roles are not granted the route’s remote account),access_denied(the environment refused you),account_resolution_failed,authentication_failed,transport_error,search_incomplete,deadline_exhaustedoraudit_lookup_failed.
The saved search view
Opened from a saved search finding, the Scheduled searches tab or an account’s owned
searches, the saved search view shows the inventory definition of the saved search on its
tier, its runs (CPU, run time, peak memory, a CPU chart and the 50 latest runs), its findings
and its change history. Fetch definition reads the current definition live from the
saved search’s own tier, as the calling user (reasons such as not_found,
account_access_denied, access_denied or tier_not_configured explain a refusal);
nothing is stored. Runs are matched on name, app and owner (a nobody-owned saved search
runs as splunk-system-user); a run of the same saved search by another account is left
out.
Licence impact
The evidence is indexed data and counts against the Splunk licence like any TrackMe summary event. Its volume follows the search activity of the monitored environment — one compact record per search and window, one resource record per search and window, the inventory changes, one receipt per run — and is bounded by the collection limits (Settings reference). To reduce it, switch off Collect search resource usage (the resource policies then stay learning), keep Store SPL search off, and size Backfill days with the retention of your sources in mind.
Identity and classification
The account. Every observation carries account and account_source
(legacy_search_user, structured_actor or unknown). The legacy user header wins
when present: it names the caller, while the structured actor is often the system principal.
It is a labelled source claim, not a verified initiator: UAM never claims that a person sat
at the keyboard, and a scheduled search runs under its owner or the system account.
Classes and detection.
Class |
Detected when |
Limits |
|---|---|---|
|
An interactive search — a resource record whose provenance starts with |
Ad hoc alone is not a signal (connectors dispatch ad hoc searches through the API); a
labelled dispatch is not either (a dashboard set to run as its owner). Users working
only through React apps (TrackMe’s UI included) reach splunkd as |
|
Sustained automation and nothing a person does: automated searches (REST, scheduler, acceleration, internal) on at least seven distinct days, never a Splunk Web search, a splunkjs page, an MCP client or any other provenance a person might use, and not a detected human. Withdrawn as soon as such a search appears. Switch: Detection (service). |
The automation days come from the legacy key=value |
|
Seeded for |
Assign it by hand to the tenant owner and to the administrator accounts that run the platform’s own workload. |
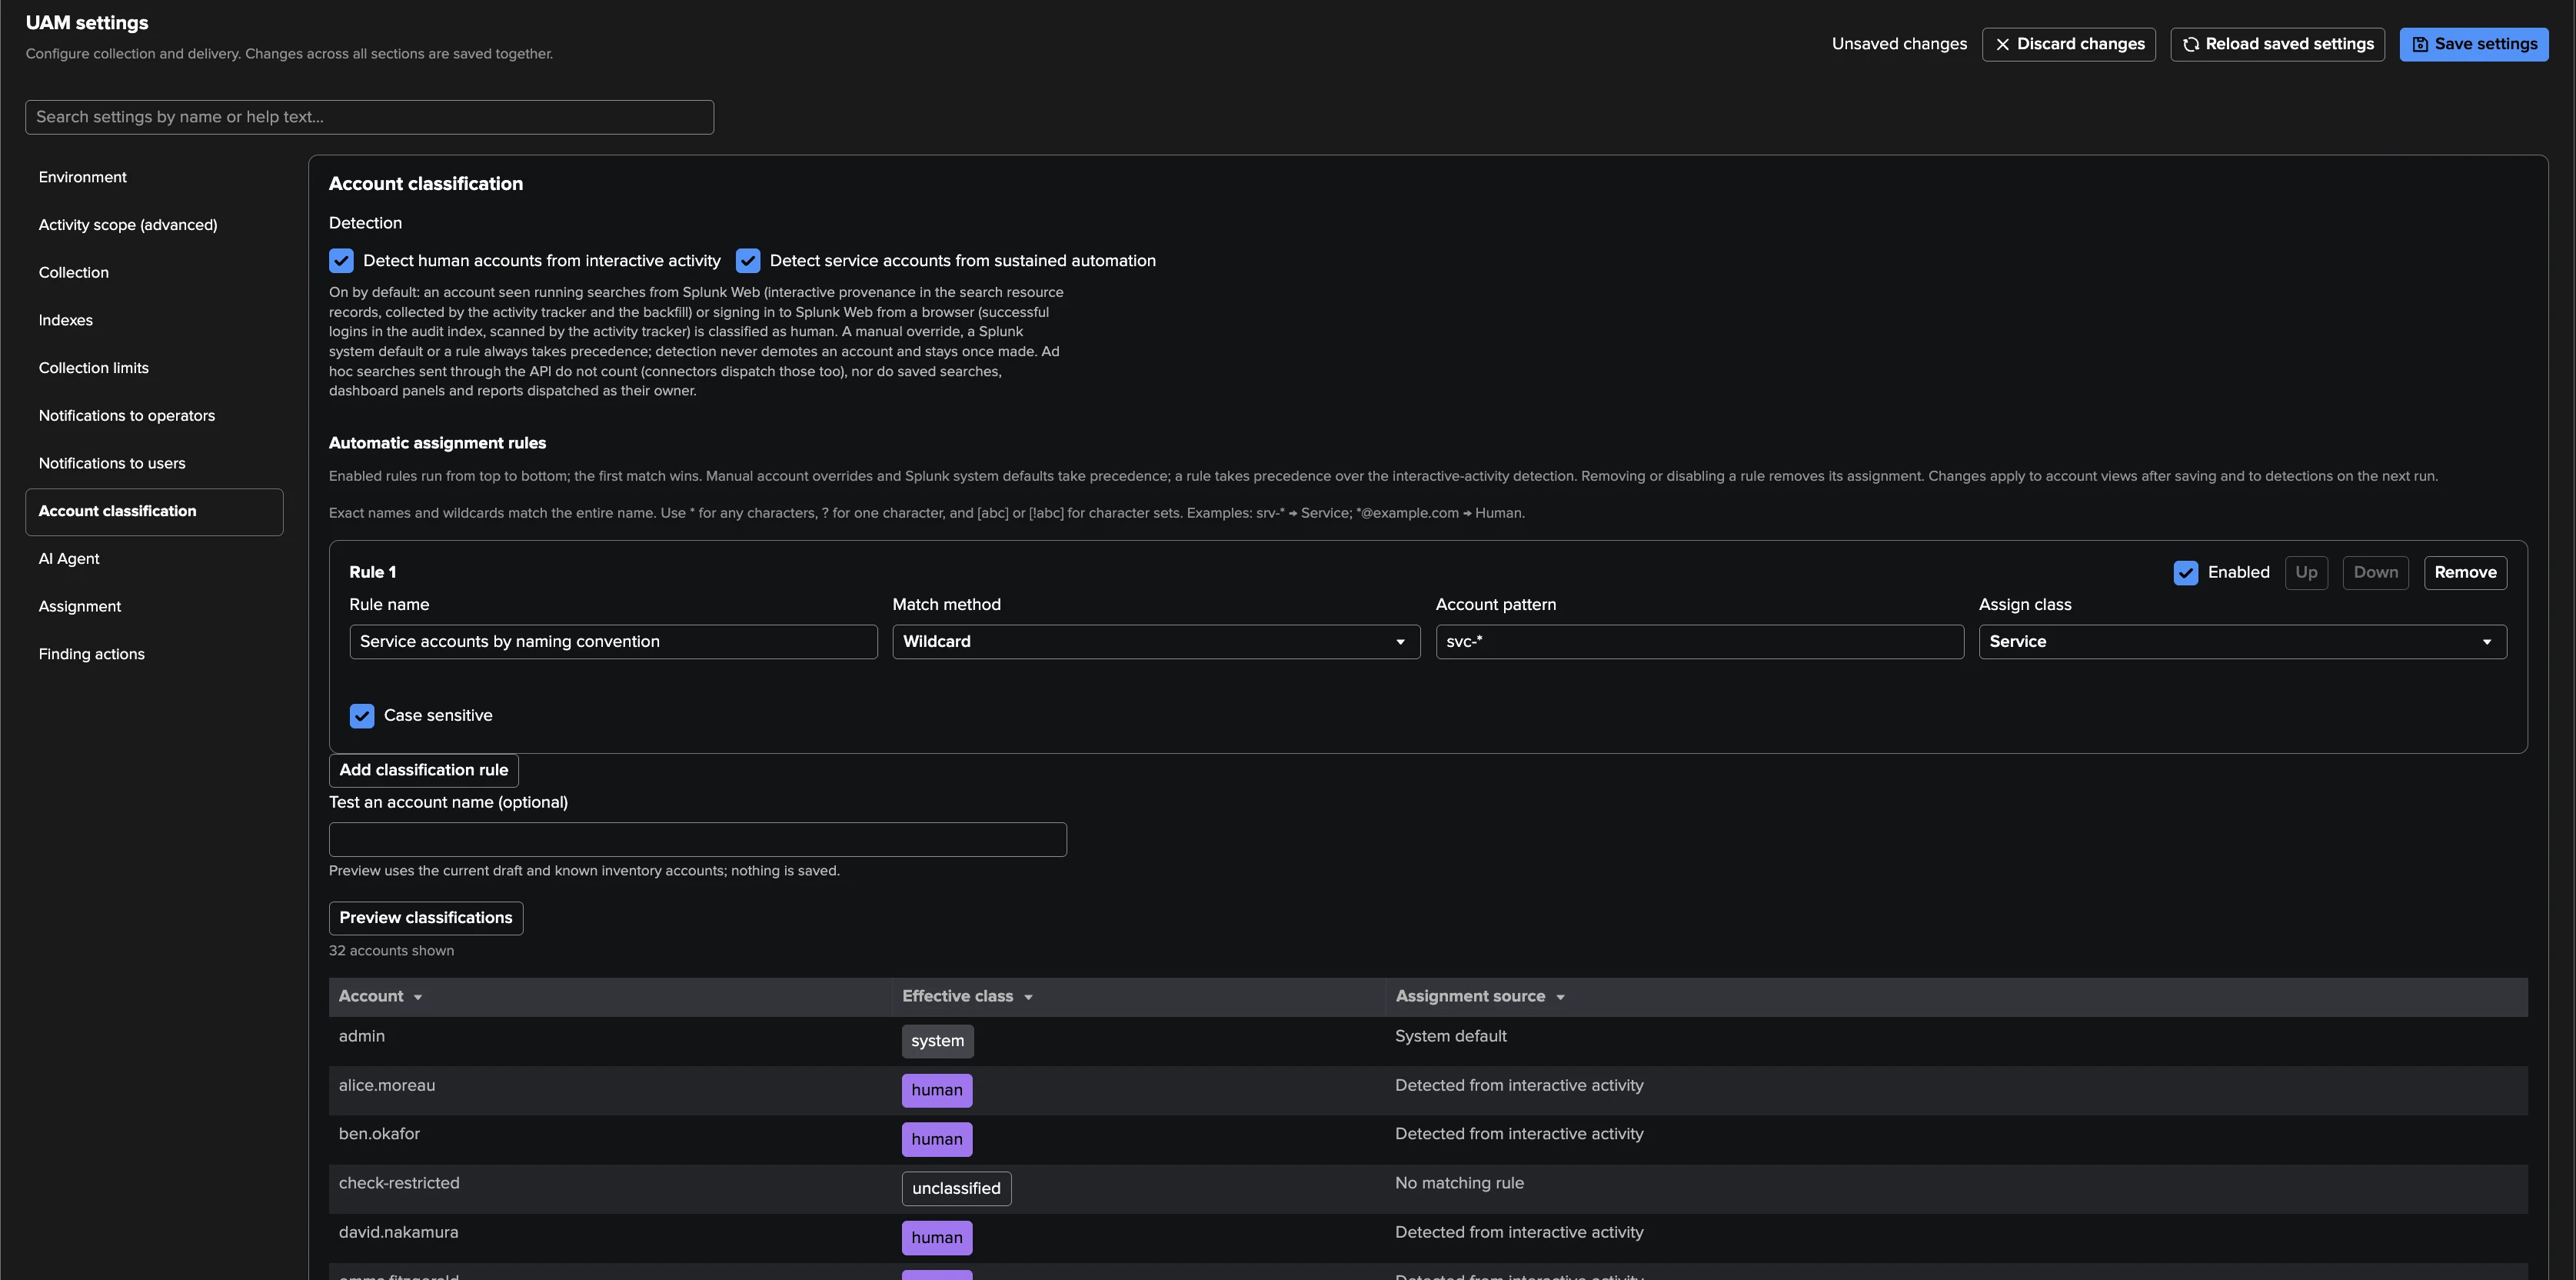
Rules. Up to 100 ordered classification rules, each with a name, an enabled flag, a
match type (exact or wildcard — *, ?, [abc], [!abc] on the whole name;
no regular expression), a pattern, case sensitivity and the class. No naming heuristic runs
unless an administrator saves a rule. Manual classes (up to 10,000, from Settings, the
Users tab or its bulk classification) always win.
Precedence, in every reader (Users tab, account view, inventory, policies): manual class → system default → first enabled matching rule → human detection → service detection. Unmatched, undetected accounts stay unclassified. Removing a manual class returns the account to the automatic resolution; disabling a rule stops it at once; switching a detection off ignores its records without deleting them. Settings → Account classification previews the draft (up to 1,000 names, the effective class and its source) before saving; the Users tab shows a detected marker with the evidence next to the class. Changing a class never rewrites historical evidence nor resolves an investigation: the policies use it at their next run.
The built-in policy catalogue
A UAM tenant evaluates twelve built-in policies in three families. Every policy has:
Enabled — on or off.
Severity —
low,medium,highorcritical(UAM has no informational level). A manual severity set on a Finding group survives later runs; choosing Members (the highest severity of its findings) restores the derived one.Excluded owners / accounts and Excluded apps — up to 500 exact, case-sensitive names each (no wildcard). Every policy except the CSV lookup footprint starts with the apps
Splunk_SA_CIMandtrackmeexcluded, so TrackMe’s own trackers and data-model acceleration do not flag the monitoring itself. Exclude owner from this policy in a finding menu adds the owner to this list.Account scope (account policies) —
human(explicitly classified human),classified(human or service, never system) orall. Accounts outside the scope count as not applicable.Its thresholds, each compared strictly: a finding needs more than the limit.
During bank holidays — Hold new findings or Keep opening findings (see Policies run). The six inventory policies hold by default: configuration reviews nobody handles on a day off, still there the next working day. The activity and resource policies keep opening findings by default: unusual activity on a day off is more telling, not less. A configuration stored before 2.4.19 reads each policy’s default. Changing it never resets the direct user notifications.
The policy editor (Policies → Edit) has four tabs: General settings (status, During bank holidays, severity, scope, thresholds, automatic budgets, exclusions, Preview policy), Email template (the direct user emails of this policy, see Notifications and communications), Actions and Automations (findings actions, see Findings actions).
Inventory: saved searches
Policy |
What it detects |
Default |
Severity |
|---|---|---|---|
|
An enabled schedule owned by an account classified human. |
On |
Low |
|
An enabled schedule whose owner has no human or service class. |
Off |
Medium |
|
More scheduled runs per active hour than the limit. |
Off |
Medium |
|
A schedule with no lower time bound (all time). |
On |
Medium |
|
A schedule with a real-time dispatch range. |
On |
Medium |
Inventory: accounts
Policy |
What it detects |
Default |
Severity |
|---|---|---|---|
|
A CSV lookup file too large, or an account’s CSV lookups too large in total. |
On |
Medium |
Activity: accounts
Policy |
What it detects |
Default |
Severity |
|---|---|---|---|
|
An account launching an unusual number of searches. |
Off |
Medium |
|
An account running repeated long searches. |
Off |
Medium |
|
An account running all-time searches. |
On |
High |
Resource: accounts
Policy |
What it detects |
Default |
Severity |
|---|---|---|---|
|
An account’s search CPU above its allowance. |
On |
Medium → High |
|
An account running repeated searches heavy in CPU or memory. |
On |
Medium |
|
An account’s CPU today unusual for its daily baseline. |
Off |
Medium |
Default settings
What each policy applies to, its account scope, what it does on a bank holiday, and its thresholds with their defaults.
Policy |
Applies to |
Bank holidays |
Thresholds and notes (defaults) |
|---|---|---|---|
|
Saved search |
Hold |
No threshold. Common where administrators own every schedule, hence low. |
|
Saved search |
Hold |
No threshold. A governance gap, not evidence of misuse. |
|
Saved search |
Hold |
Maximum scheduled runs per active hour 12 (1 to 60). Configured frequency, not observed launches. |
|
Saved search |
Hold |
No threshold. |
|
Saved search |
Hold |
No threshold. An explicit |
|
Account, scope |
Hold |
100 MiB per file, 500 MiB per account and tier. No app excluded by default. |
|
Account, scope |
Keep opening |
Maximum distinct searches per window 200. |
|
Account, scope |
Keep opening |
Minimum run time 300 s, maximum long searches 3. |
|
Account, scope |
Keep opening |
Maximum all-time searches 0. |
|
Account, scope |
Keep opening |
Allowance 10 % of the search CPU capacity (else 3,600 s). Raised one severity level above a dominant share of 40 %. |
|
Account, scope |
Keep opening |
A heavy search uses 2 % of the search CPU or 10 % of the smallest search host memory (else 300 s or 2,048 MB); maximum heavy searches 3. |
|
Account, scope |
Keep opening |
3 × the daily p95 over 14 days, floor 3,600 s. Off, in preview mode: matches are recorded, no finding and no notification. |
The server supplies the titles, descriptions, bounds and remediation of every policy; the sections below give the full detail.
Inventory policies — saved searches
The subject is one saved search of one tier; the finding keeps the same identity across runs. Explicitly unscheduled or disabled searches are not applicable; a missing flag or an unreadable bound is unknown, never assumed. Evidence: the owner and its class (with where the class comes from), the app, the tier, the schedule and the bounds read. UAM never edits nor dispatches the observed searches — the remediation is advisory. These policies follow the catalog cadence: the saved-search listing is daily by default.
Policy |
Details |
|---|---|
Scheduled search owned by a human account |
|
Scheduled search owner is not classified |
|
Scheduled search exceeds the hourly schedule limit |
|
Scheduled search has an all-time dispatch lower bound |
|
Scheduled search uses a real-time dispatch range |
|
CSV lookup footprint
csv_lookup_footprint/v1 — CSV lookups attributed to an account exceed its size
allowance — is an inventory policy whose subject is an account:
What it detects, separately on every search head tier: one CSV lookup file larger than Maximum individual CSV file size (default 100 MiB), or the cumulative size of the CSV lookups attributed to one account larger than Maximum cumulative CSV size per attributed account and tier (default 500 MiB). Both 1–1,048,576 MiB.
On by default, severity medium, account scope
all, no app excluded by default.Attribution: probable writer, recorded owner as fallback. The activity tracker records, from the audit evidence it already reads, which account last wrote each lookup file. A file is attributed to that probable writer when the evidence supports it, else to its recorded owner (a shared file owned by
nobodyfalls back to its recorded owner unless audit evidence names a writer). The evidence keeps the basis of the attribution and both identities. Attribution is best effort since monitoring began, not proof of authorship: missing audit evidence, ambiguous targets, concurrent writes or later unmatched changes use the owner fallback, and the backfill does not provide writer hints.Size is the stored file size (a compressed CSV counts at its stored size), not the replicated bundle size. Only the metadata is read — never the contents — and no third-party app is required.
Only tiers whose lookup-file catalog is complete and less than an hour old are evaluated; a missing, partial or stale catalog can never clear a finding.
Suggested action: review the largest files and their generating searches with the probable writer or the owner; reduce retained rows or columns, use the KV store where appropriate, review bundle replication settings with an administrator. UAM never deletes a file nor changes replication. Direct user emails of this policy list up to 20 of the largest attributed lookups.
Activity policies — accounts
Aggregated from the trackme:uam:observation records of the trailing Activity policy
window (15 minutes by default), one row per search first, then per account and app. The
counts are distinct search ids the activity tracker observed — a launch-count proxy —
labelled with the coverage (complete / partial). One finding per policy, environment
and account: a repeated burst updates the same finding. Evidence: the window, the count, the
thresholds, the account class and scope, the top five apps and, for costly_search/v1,
the maximum and total run time. Excluded apps are removed from the account’s aggregate before
the threshold is compared.
Policy |
Details |
|---|---|
Account launched an unusual number of searches |
|
Account ran repeated long searches |
|
Account ran all-time searches |
|
Resource policies — accounts
Read from the trackme:uam:resource records (search heads and indexers, ad hoc and
scheduled), through one bounded rollup per policies run: CPU adds up across windows, memory
keeps its peak. The system class is outside the default classified scope (data-model
acceleration never becomes a finding by default) but its CPU stays in the share
denominator: it is real load.
Automatic budgets. With automatic thresholds on (the default), the absolute limits are derived from the capacity — the core sum of the search hosts and the memory of the smallest one — and clamped to each threshold’s own range:
Policy |
Percentage (default) |
Derives |
|---|---|---|
|
Allowance as a share of the search CPU capacity (10 %) |
Maximum CPU seconds = search cores × window seconds × percentage |
|
Heavy search CPU as a share of the search CPU capacity (2 %) |
Minimum CPU seconds of a heavy search = search cores × window seconds × percentage |
|
Heavy search memory as a share of the smallest search host (10 %) |
Minimum peak memory of a heavy search = smallest search host memory × percentage |
With automatic thresholds off, the stored absolute values apply. With them on but no usable
capacity, the stored values apply and the evaluation says manual_fallback. The evidence
carries the thresholds source (auto / manual / manual_fallback) and the capacity
basis; the policy editor shows the effective values.
Learning period. The resource rules are learning — nothing evaluated, no finding created, nothing marked not observed — until the tenant holds Resource rules: minimum history (24 hours by default) of resource history (the backfill counts) and, for automatic budgets, a known capacity. The Policies tab shows the reason.
Policy |
Details |
|---|---|
Account’s search resource consumption exceeded its allowance |
|
Account ran repeated resource-intensive searches |
|
Account’s CPU consumption is unusual for its daily baseline |
|
Policy insight and preview
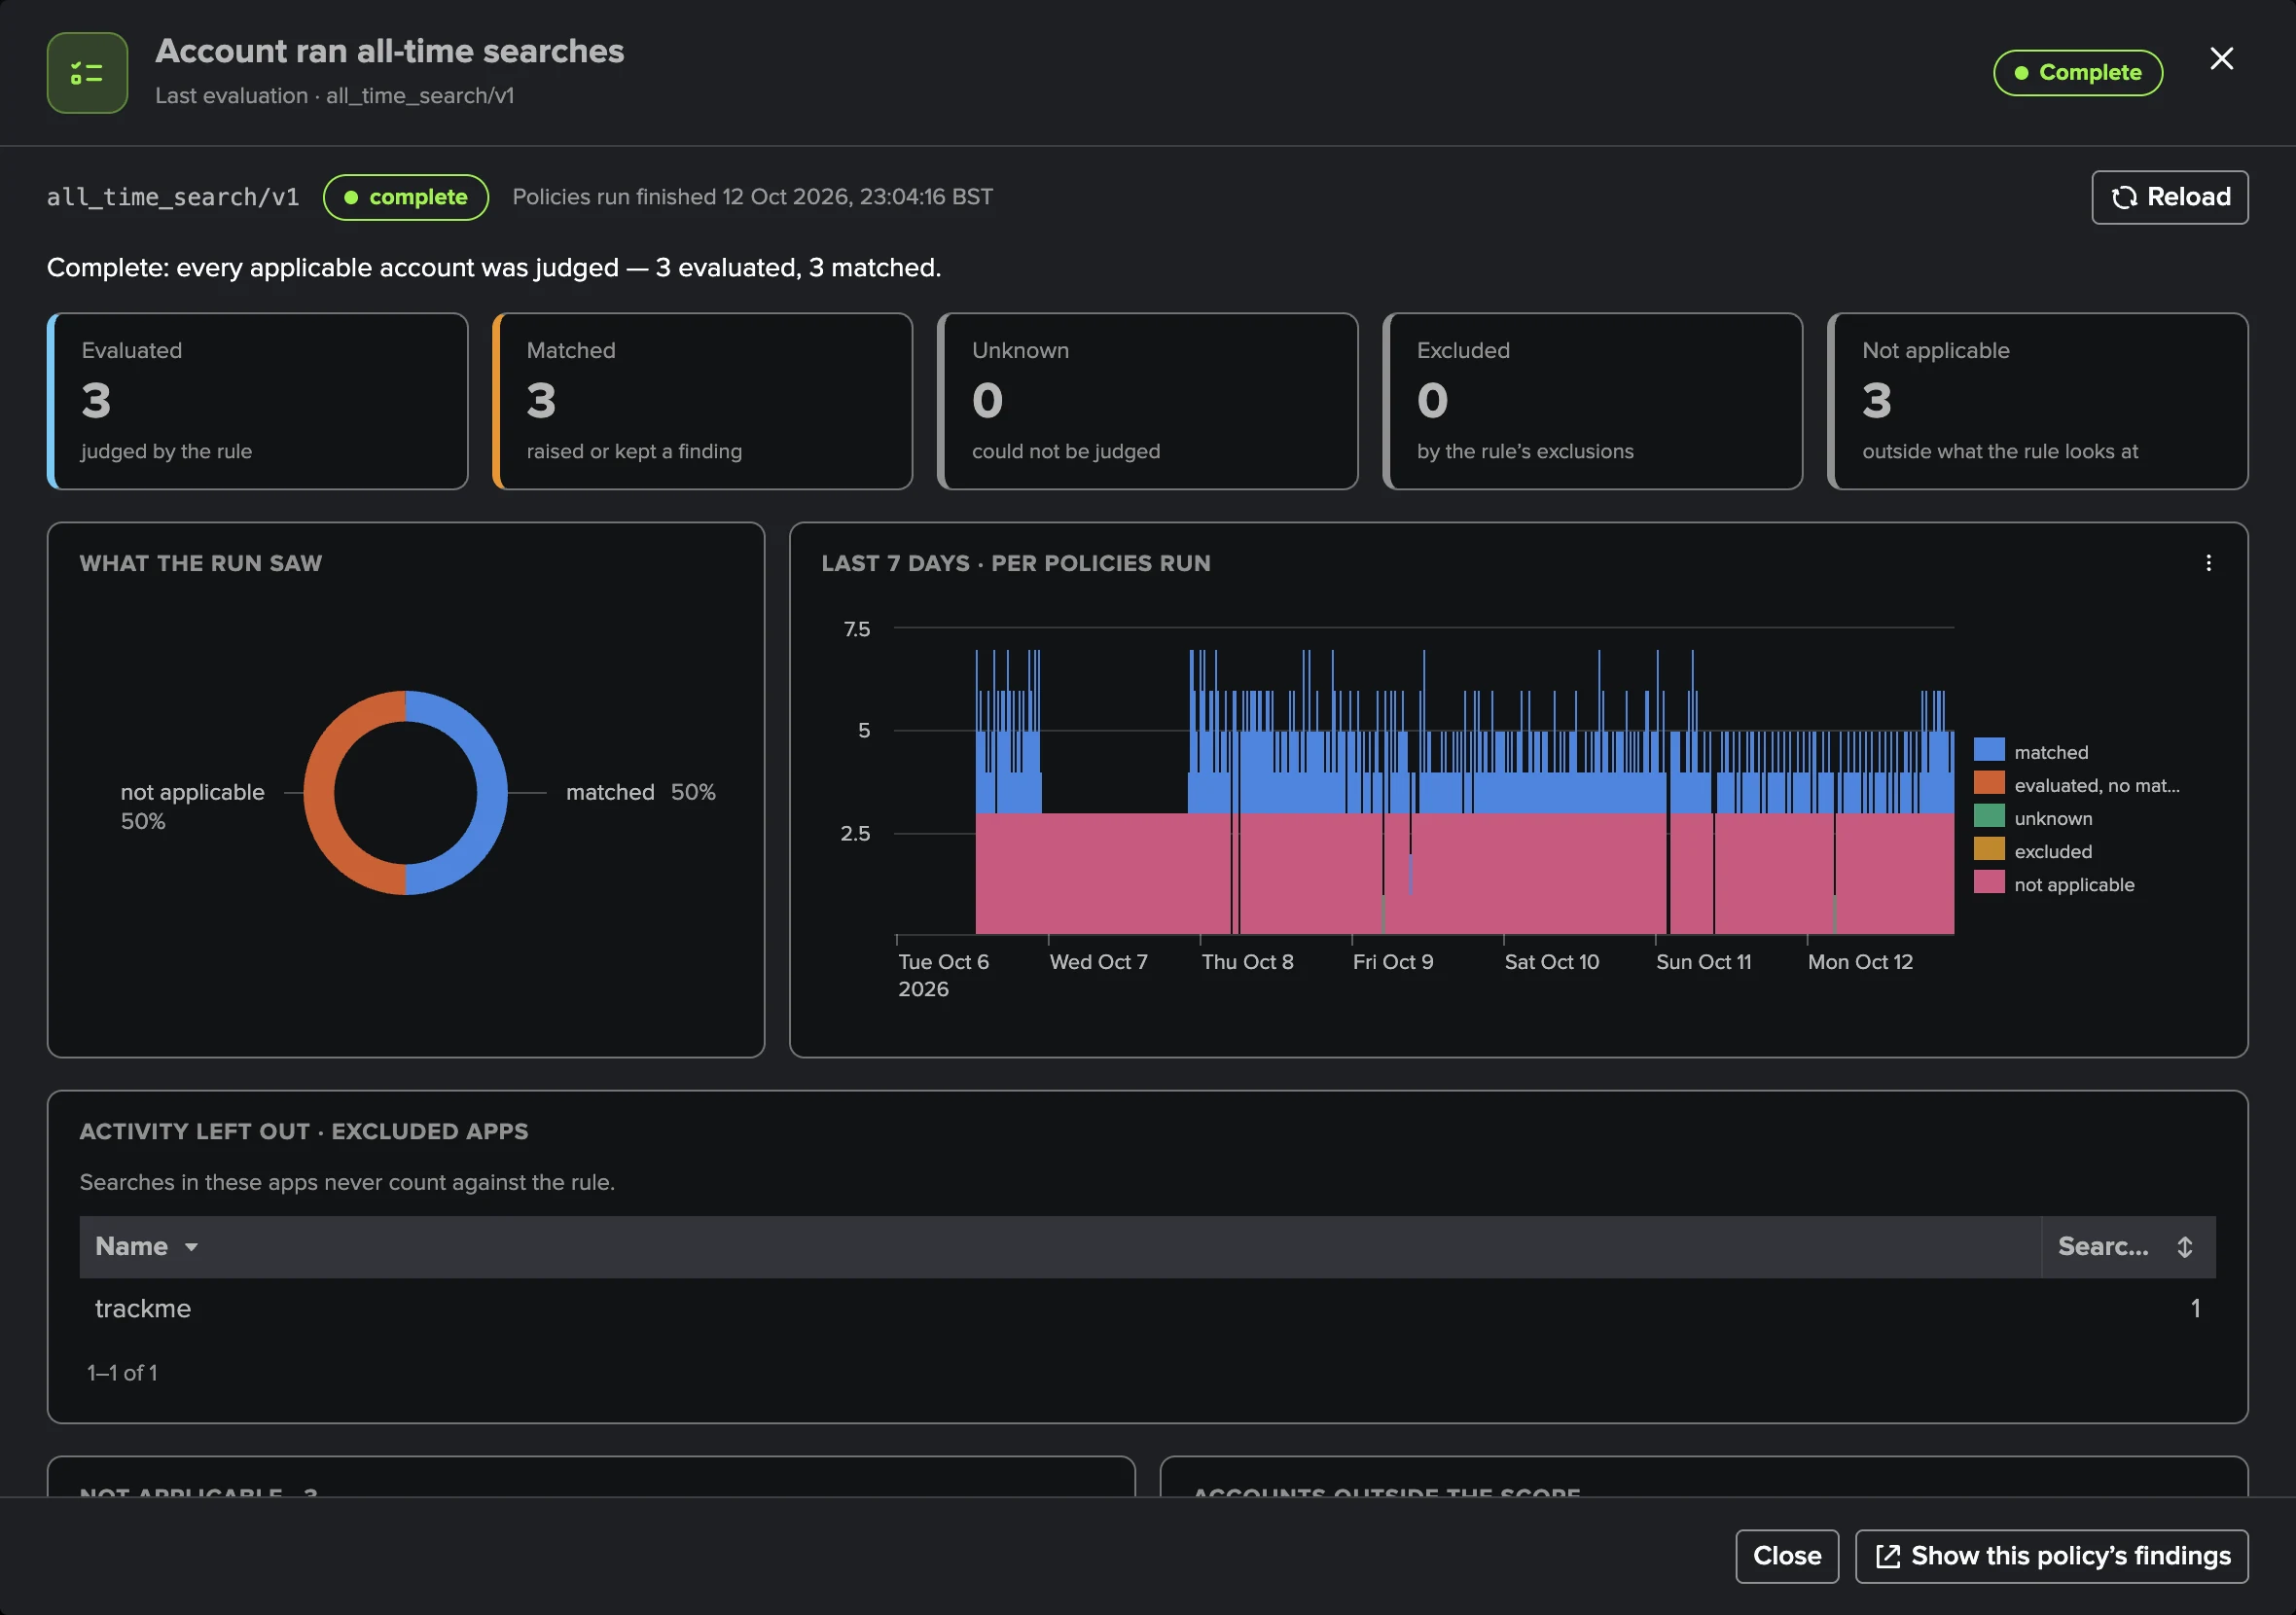
Policy insight — the Last evaluation and the count cells of the Policies tab open what the last run saw: a verdict, the population, why records were unknown, excluded or not applicable (
owner_unclassified,missing_<field>,cron_unreadable,excluded_owner/excluded_app,unscheduled/disabled,out_of_scope_<class>…), the owners and apps behind each bucket (owners can be classified in place), up to 25 samples, the run (window, readiness, thresholds source, inventory per tier) and a seven-day history per policies run.Preview policy (General settings) evaluates the draft against the latest stored inventory of the tenant without writing anything and shows the totals and up to 20 matching examples. It needs a collected inventory.
Custom policies
Tenant administrators write their own policies in SPL (Policies → Create policy). A custom policy runs on its own schedule and its findings appear with the built-in ones, in the same Finding groups.
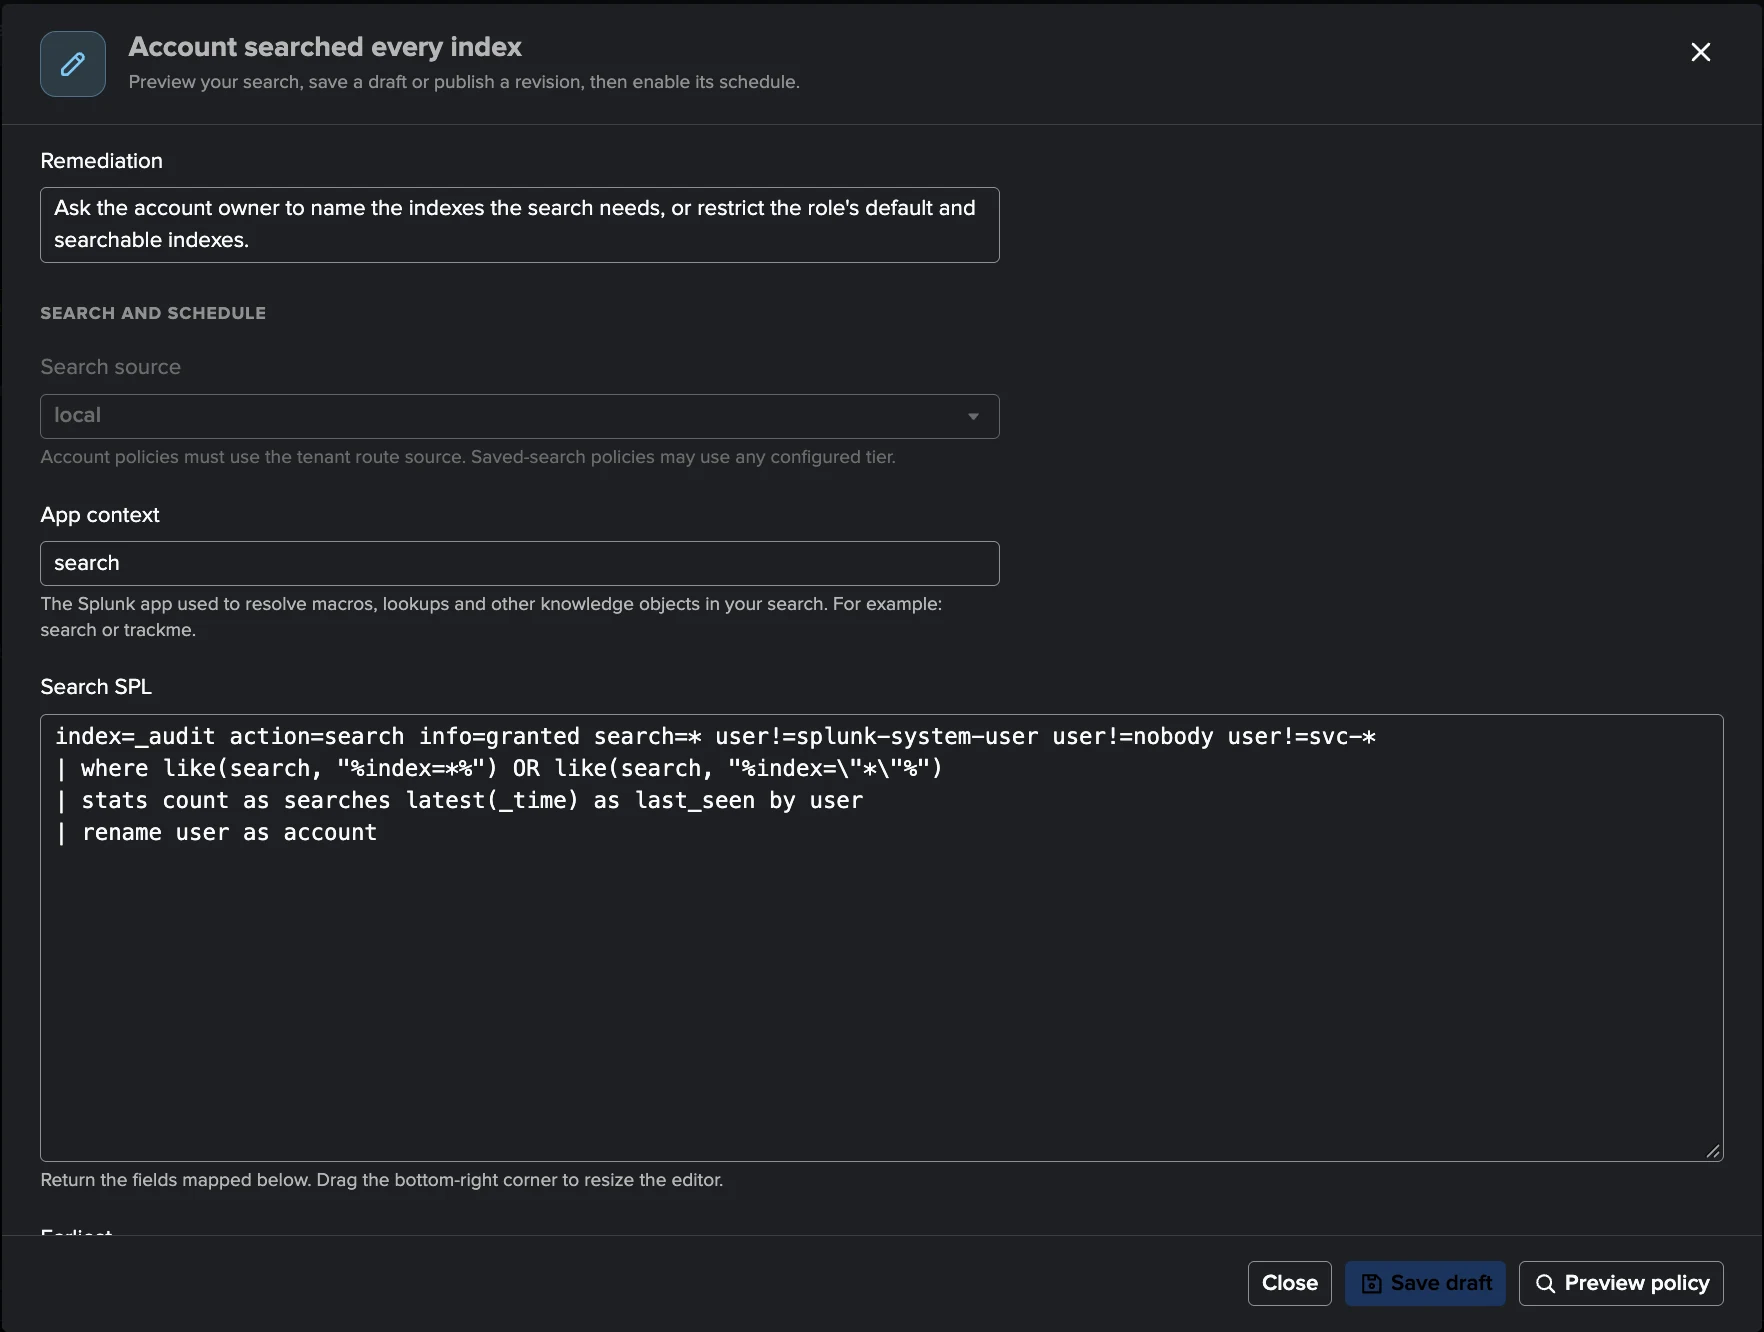
Definition.
Title, description, default severity and remediation (shown on its findings).
Source tier — a policy about accounts reads the route account (the indexing layer); a policy about saved searches reads the selected tier. App context — the search namespace.
SPL — up to 64 KiB. Time range — relative, from
-<n><s|m|h|d|w>tonowor an earlier relative bound, at most 31 days in the past; no all-time, real-time, future bound or calendar snap. Schedule — a numeric five-field cron.
Map search results to findings.
Subject type: account (the result field holding the account) or saved search (the fields holding the owner, the app and the name — three distinct fields; alias them in the SPL). The subject places the finding in the right Finding group.
Dimensions (up to eight fields) — distinguish several findings about one subject.
Evidence fields (up to eight), a count field (occurrences per row, else one per row) and a time field (epoch seconds).
Advanced limits, for example the result rows read (10,000 by default, at most 100,000), the findings per run (1,000, at most 10,000), 25 findings per subject, the samples and evidence bytes kept per finding.
Changing the subject mapping or the source requires a higher identity version before publication: a new identity, so earlier findings are not reused for a different meaning.
Bank holidays — Hold new findings or Keep opening findings (
hold_on_bank_holidays, off when absent). It is not part of the identity, so turning it on needs no new identity version; it takes effect when published. A custom policy holds while a holiday of the tenant’s calendars is active at its anchor, the end of its search window: a holiday that ended earlier inside a longer window no longer holds. Held results publish no finding and use no findings capacity; a finding already observed is still evaluated. The run’s commit recordsheldand, when a holiday applied,bank_holidays(state and names), shown as Held N (bank holiday: <names>) on the run.
Lifecycle.
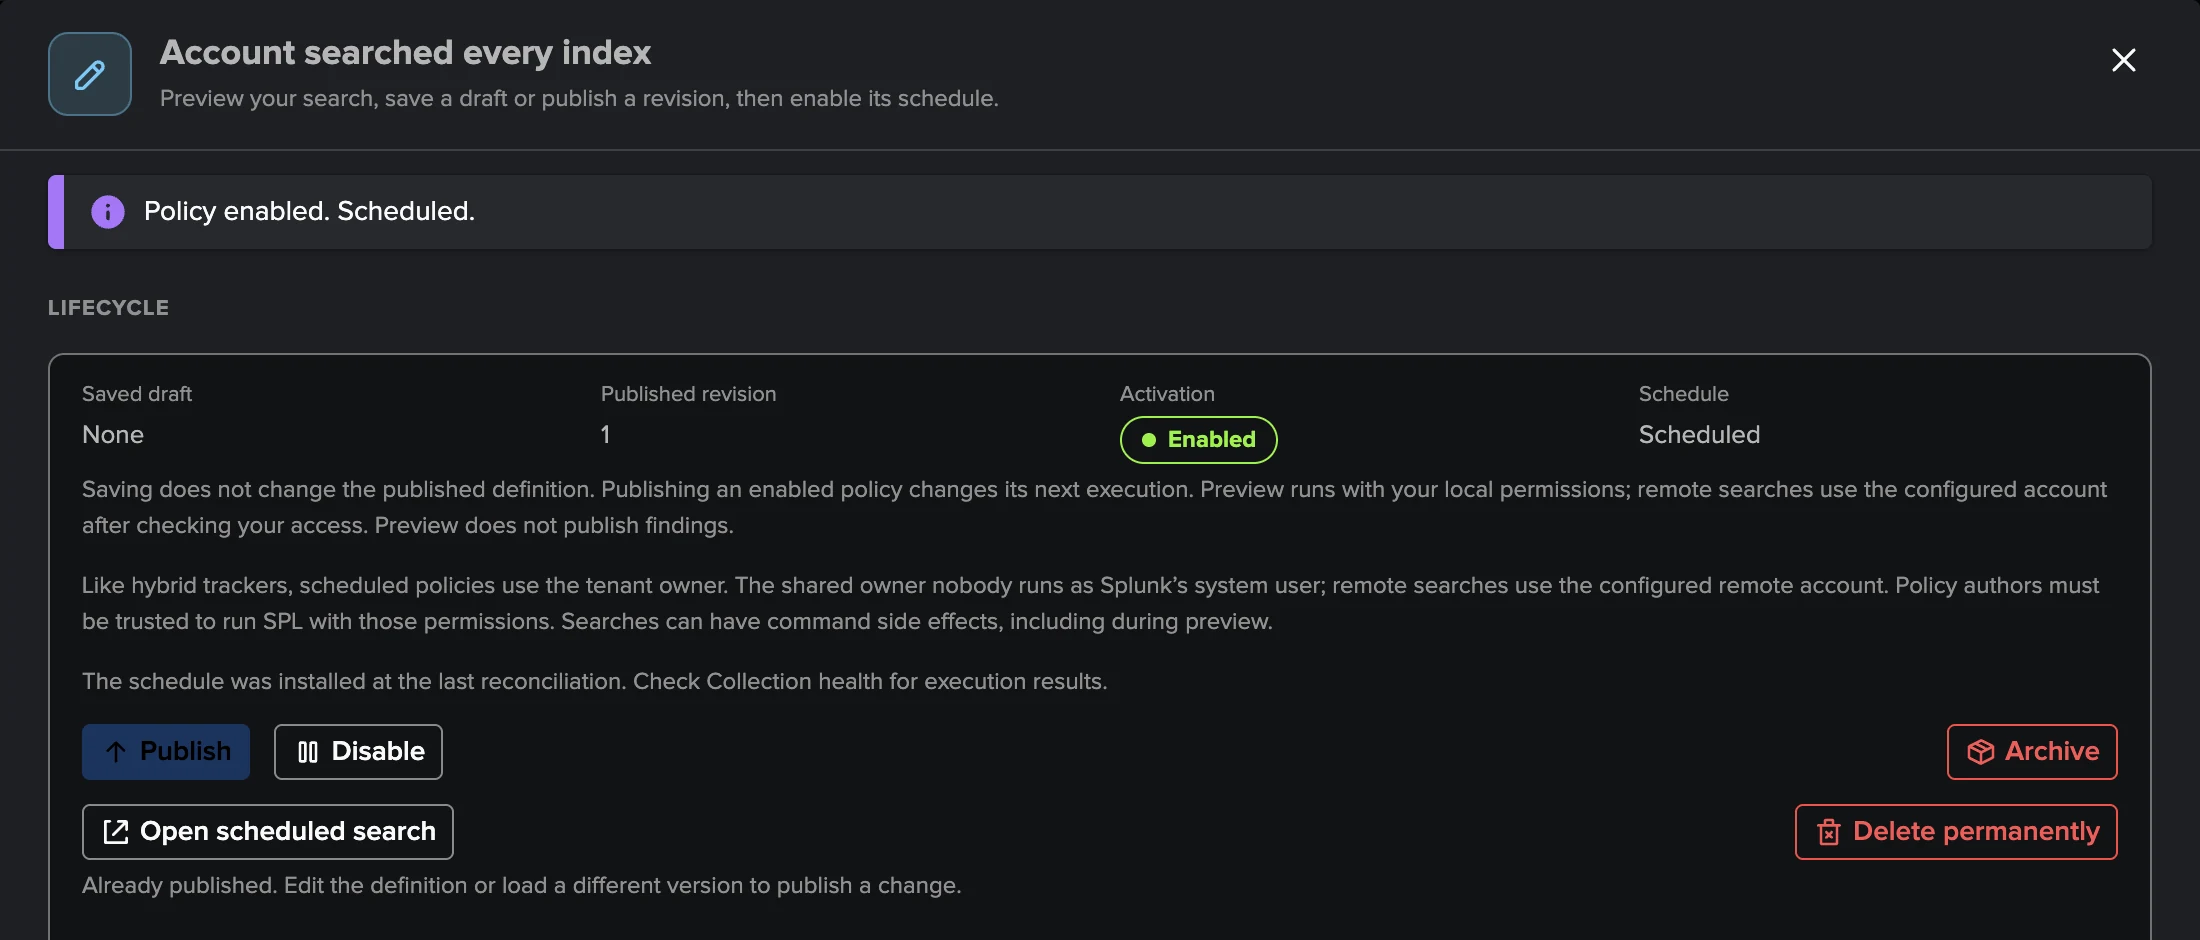
Step |
What it does |
|---|---|
Draft |
Save keeps a saved version of the draft (the 30 most recent are kept). Saving never publishes nor enables. |
Preview |
Runs the current form — saved or not — as you, asynchronously and cancellable (60 seconds, 1,000 result rows), and shows completeness, diagnostics, counts and at most 20 candidate cards. Nothing is published; a zero-row result cannot verify a mapping. |
Publish |
Freezes an immutable published revision (up to 100 per policy). Draft edits never change what is published. |
Enable / Disable |
Schedules or unschedules the policy’s report |
Archive |
Irreversible: the policy stops, its definition and findings stay readable and it can be duplicated. |
Delete permanently |
Removes the definition, its versions, its scheduled search and its execution history; findings, evidence and notes remain. |
Version history |
Load, compare, restore (as a new draft) or delete a version; the published revision is protected. |
Limits. 100 definitions per tenant (archived ones included) and 25 enabled. A scheduled run has 300 seconds and 10,000 result rows; at most 1,000 findings are kept per custom policy and 10,000 per tenant, separately from the built-in findings limit. Four custom policy runs at a time per installation, two per tenant, one per policy (previews included).
Execution health. Collection health → Policies → Custom policies shows, per policy, the requested and actual schedule, the cron and next run, the last complete evaluation, the failure count, the recent runs and any running search; states are disabled, never run, healthy, healthy (no match), incomplete, failed, cancelled, capacity deferred, schedule drift, missed schedule and recovery required. Run now runs the published revision (findings may be published) and Recover frees a run whose searches are verified stopped. The Configuration Guardian reports the problems (see Configuration Guardian).
What differs from built-in policies.
Custom findings are not notified: the operator and user notification policy selectors list built-in policies only.
There is no Exclude owner from this policy action: write exclusions in the SPL.
A custom policy can only map to accounts and saved searches.
Warning
The SPL of a custom policy is arbitrary SPL run on a schedule as the tenant owner (with
the nobody owner, as Splunk’s internal scheduler identity), and a preview runs it as
its author: a command or macro with side effects has them, preview included. Only trusted
tenant administrators can author policies; give remote accounts least-privilege
credentials.
Findings and Finding groups
The shared lifecycle, triage and grouping concepts are explained in A finding and its lifecycle and Finding groups; this section gives the UAM specifics.
The finding
A finding is one row per policy, environment and subject (a saved search or an account),
with a stable id, its status (open, investigating, resolved, dismissed),
its severity (policy or manual), its assignee, a short investigation note, observed,
first / last seen, episodes, reopened_count, the dismissal deadline, a bounded
history (the 50 most recent records) and the evidence.
Transition |
Meaning |
|---|---|
|
First match: the finding opens. |
|
Severity or evidence changed while observed (a threshold edit updates the evidence without changing the identity). |
|
Matched again after an absence: a new episode; open and investigating findings only gain the history record. |
|
Not matched by a complete evaluation: the finding stays, its Condition reads not observed. It is never resolved for you; a partial evaluation never marks a finding not observed. |
|
A resolved finding observed again returns to |
|
A temporary dismissal ended: the finding returns to |
|
An operator decision; the policies never overwrite it. |
|
The policy no longer exists and its replacement evaluated fully: resolved by the system, not notified. |
Decisions
Decisions are made on the Finding group (one group, or up to 500 groups at a time), fenced
on the group’s version (a decision captured on an older version is refused,
finding_group_version_changed):
Status — Investigate, Resolve, Dismiss, Reopen. Resolve says the investigation concluded: the policy reopens the finding the next time it observes the condition. Dismiss says the finding is accepted: it stays dismissed while observed. Dismiss permanently (“until reopened by hand”) or for 1, 7, 30 or 90 days (API: one hour to 366 days); an ended dismissal returns the finding to open. Any status change clears a deadline; a new duration replaces it.
Snooze notifications — 1 hour, 1 day, 7 days or 30 days (API: 60 seconds to 90 days): the operator emails about the group are held; the status does not change. Transitions during the snooze are not sent later.
Severity — a manual severity; Members restores the severity derived from the group’s findings.
Assign — to a user or an assignment group (see Assignment and automatic routing).
Notes — the shared TrackMe Notes (Markdown, permanent or expiring) on the group or on a finding, separate from the short investigation note recorded in the history.
Every change leaves a history record with its author (an operator, the policy, the system or
the AI Agent). Decisions on findings and groups (triage, group_members) require a TrackMe
administrator of the tenant; a power user of the tenant can run findings actions, send an
email action and set an assignment.
Finding groups
Automatic grouping. All findings about one account and the saved searches it owns form
one Finding group — for example the two personal schedules of analyst-a and its
all-time-search finding. Ownership defines the grouping; classification does not. A saved
search without an owner keeps its own group. Every tier of the indexing layer shares the
account’s group; different tenants never do. Each finding keeps its own subject, tier, policy,
evidence and id. An automatic group holds up to 5,000 findings.
The group is the triage unit. A decision applies to every member except a member dismissed on its own (Dismiss only this finding): that member keeps its own dismissal until it ends or is reopened, and the group’s decisions leave it alone. A new kind of problem on a dismissed group reopens the group and keeps the earlier members dismissed on their own: a dismissal never silences a new problem. The group’s severity is the highest of its observed members unless an operator set one.
Manual grouping. Select groups on the Findings tab:
Merge into one Finding group — 2 to 25 groups become one manual group (optional title). The most open status wins; a member whose decision differs keeps it on its own.
Add to a manual group, Remove from the Finding group (up to 25 findings at a time) and Ungroup.
An object’s findings always move together: removing a saved-search finding removes every finding of that object; removing an account returns it with its owned searches.
A manual group holds up to 50 findings; later findings of a full manual group go back to their automatic group. Automatic grouping never undoes a manual grouping.
Assignment and findings actions
Assignment (Settings → Assignment): up to 100 assignment groups (name, description, optional team email) and up to 100 ordered automatic assignment rules (by policy, severity, subject type, owner, app, environment), with optional emails to the assigned group. See Assignment and automatic routing.
Findings actions (Settings → Finding actions): up to 50 administrator-defined drilldown searches, links, webhooks (through system-wide Webhook accounts) and the email action, run by hand from a finding or group menu, and up to 100 automation rules that run them for a policy (Policies → Edit → Automations). See Findings actions.
Finding events
Every finding transition is indexed as trackme:uam:finding in the findings index (the
tenant’s notable index by default): build your own Splunk alerts, Enterprise Security
correlation searches or SOAR playbooks on them.
Notifications and communications
UAM has three email channels, all independent of each other. The shared principles are in Notifications.
Notifications to operators
Settings → Notifications to operators (notifications), off by default:
Events: New finding, Finding reopened, Severity raised, Finding resolved (on by default), Finding dismissed, Finding assigned. Being observed again or not observed never notifies.
Minimum severity (medium), Policies (empty = all built-in policies), Delivery account (a TrackMe email account, see Configuration; empty = the search head’s local mail transport), Recipients (up to 50, filtered by the account’s allowed domains), Mode: Digest (one email per policies run, grouped by event then severity) or Per finding (one email per transition, threaded per finding in the mail client).
Transitions are delivered at the end of the next policies run (within about 15 minutes); a failed send is retried at the next runs, and transitions older than 24 hours expire. A snoozed group’s transitions are not sent.
Send test email sends a synthetic message with the saved settings, even when notifications are off.
Every email links to the finding (
TenantHome?tenant_id=<tid>&component=uam&tab=findings&finding=<id>opens its Investigate view).
Notifications to users
Settings → Notifications to users (user_notifications), off by default: one email to the
account a finding is about, on detection and when the condition is no longer
detected.
Addresses come from Splunk’s user records, collected per tier by the users catalog and kept in a private store (never in the inventory, the evidence or the findings), or from an administrator’s Override email address (Users tab). A saved-search or CSV finding uses its own tier; an account finding needs one agreed address across the inventoried tiers, or the authoritative identity tier you choose. Missing, stale or conflicting addresses defer the email (at most 24 hours).
Who receives: never a system account; human accounts by default; service and unclassified accounts only when you opt in.
Detection and clearing: a new match opens an episode and sends one detection email. Two consecutive complete evaluations without the condition close the episode and send the “no longer detected” email (only after a sent detection, to the same recipient). Partial, unknown or learning evaluations never clear. A recurrence within repeat hours (24) does not send a new detection.
Baseline: the first enabled evaluation records the current matches without sending them, unless Include current detections once is on.
Independent of operator triage: resolving, dismissing, snoozing, grouping or assigning a finding does not stop or trigger user emails.
Content: a common banner, introduction, footer, reply-to address and an HTTPS support link, plus per-policy subjects and bodies (Policies → Edit → Email template; every built-in policy is on except
unclassified_schedule/v1). Plain-text templates with the placeholders{account},{policy},{search_name},{app},{environment},{summary},{action}and{window}; subjects up to 256 characters, bodies up to 10,000.Limits: 50 emails per policies run (1–200), 3 per address per hour (1–20), 24 hours between repeat detections (1–168). One recipient per email.
Preview and Send test email (to a test recipient, for one policy) use synthetic data and work while the channel is off.
Send email communication
Send email communication (finding and group menus, tenant administrators and power users) prepares a reviewed one-off email about a finding, a group member or a whole Finding group (up to 200 findings, one section per finding): the modal shows the findings, the recipient (which you may change for this email only), a full preview, and asks for explicit confirmation. It is sent once from a search process, never retried blindly: when the outcome is uncertain, check the inbox before sending again. It does not change the findings or the automatic notification state.
The UAM AI Agent
The UAM AI Agent reviews UAM findings with the evidence UAM collected; it replaces the UAM Findings Advisor of 2.4.18. Its modes, notes and decisions are those of every findings AI Agent: see Findings AI Agents.
Inspect writes one current
[AI Agent]note per finding (assessment, confidence, recommendation) and changes nothing. Act also applies the decisions the tenant allows.Ask the AI Agent (one finding, from its menu or the Investigate view), Run a review now (AI Agent tab) and the scheduled triage (hourly, off by default).
The scheduled triage reviews at most findings per run findings, one per Finding group, skips a group reviewed within the review interval unless it changed, and never overrides an operator decision. Its selection uses the shared AI filters: by default only critical and high findings.
The AI Agent tab shows the scheduled triage status and the decision log (kept 90 days).
Requirements: AI enabled with a provider configured; for the scheduled triage, a tenant owner that is not
nobodyorsplunk-system-user(Guardianai_automation_owner_is_system_user). Launching, deciding and reviewing need a TrackMe administrator of the tenant; tenant power users can read the settings and the decision log.
Setting ( |
Default |
Meaning |
|---|---|---|
|
0 |
Scheduled triage on or off. |
|
inspect |
Mode of the scheduled triage ( |
|
empty |
AI provider; empty = the first available. |
|
1 |
Days before a reviewed Finding group is reviewed again (unless it changed). |
|
10 |
Findings reviewed per scheduled run, one per group (1–50). |
|
3000 |
Time budget of one hourly run, in seconds. |
|
1 |
Act may mark a group investigating. |
|
1 |
Act may dismiss for a time — never a critical or high finding still observed. |
|
7 |
Longest dismissal, in days (1–90). |
|
0 |
Act may resolve a finding its policy no longer observes. |
|
0 |
Act may set the class (human or service) of an account without an operator class. |
|
empty |
Plain-English instructions of the tenant administrators, followed by every run of the agent, asked or scheduled (at most 4,000 characters, line breaks kept). |
|
critical,high |
Shared: the finding severities the scheduled triage reviews. |
|
empty |
Shared: a filter expression on the finding ( |
These settings are edited in Settings → AI Agent of the workspace; Manage AI Agents shows the UAM AI Agent of each UAM tenant and edits its schedule, mode, provider, review interval, runtime and custom instructions. A permanent dismissal, an assignment, a severity change and any policy or configuration change are never available to the agent. See also The AI Advisors.
Custom instructions and Evaluate. The agent’s custom instructions (Settings → AI Agent →
Custom instructions, also in Manage AI Agents automation and the Configure tenant dialog)
come last in its prompt, after the provider’s custom prompt and, for scheduled runs, after
the tenant’s shared custom instructions (ai_automated_custom_instructions, scheduled runs
only). They never widen what the agent may do: the allowed decisions and the checks TrackMe
makes before every decision still decide. Evaluate… runs the agent in inspect mode on the
unsaved draft (empty = without instructions), on one open finding or a review of the open
findings (at most 10, the most severe first), optionally side by side with a run without
custom instructions. It writes nothing — no note, no decision, no review record — and is
recorded with the status evaluation, so a later act run never starts from it. See
AI Agents for findings.
Collection health and Configuration Guardian
Collection health
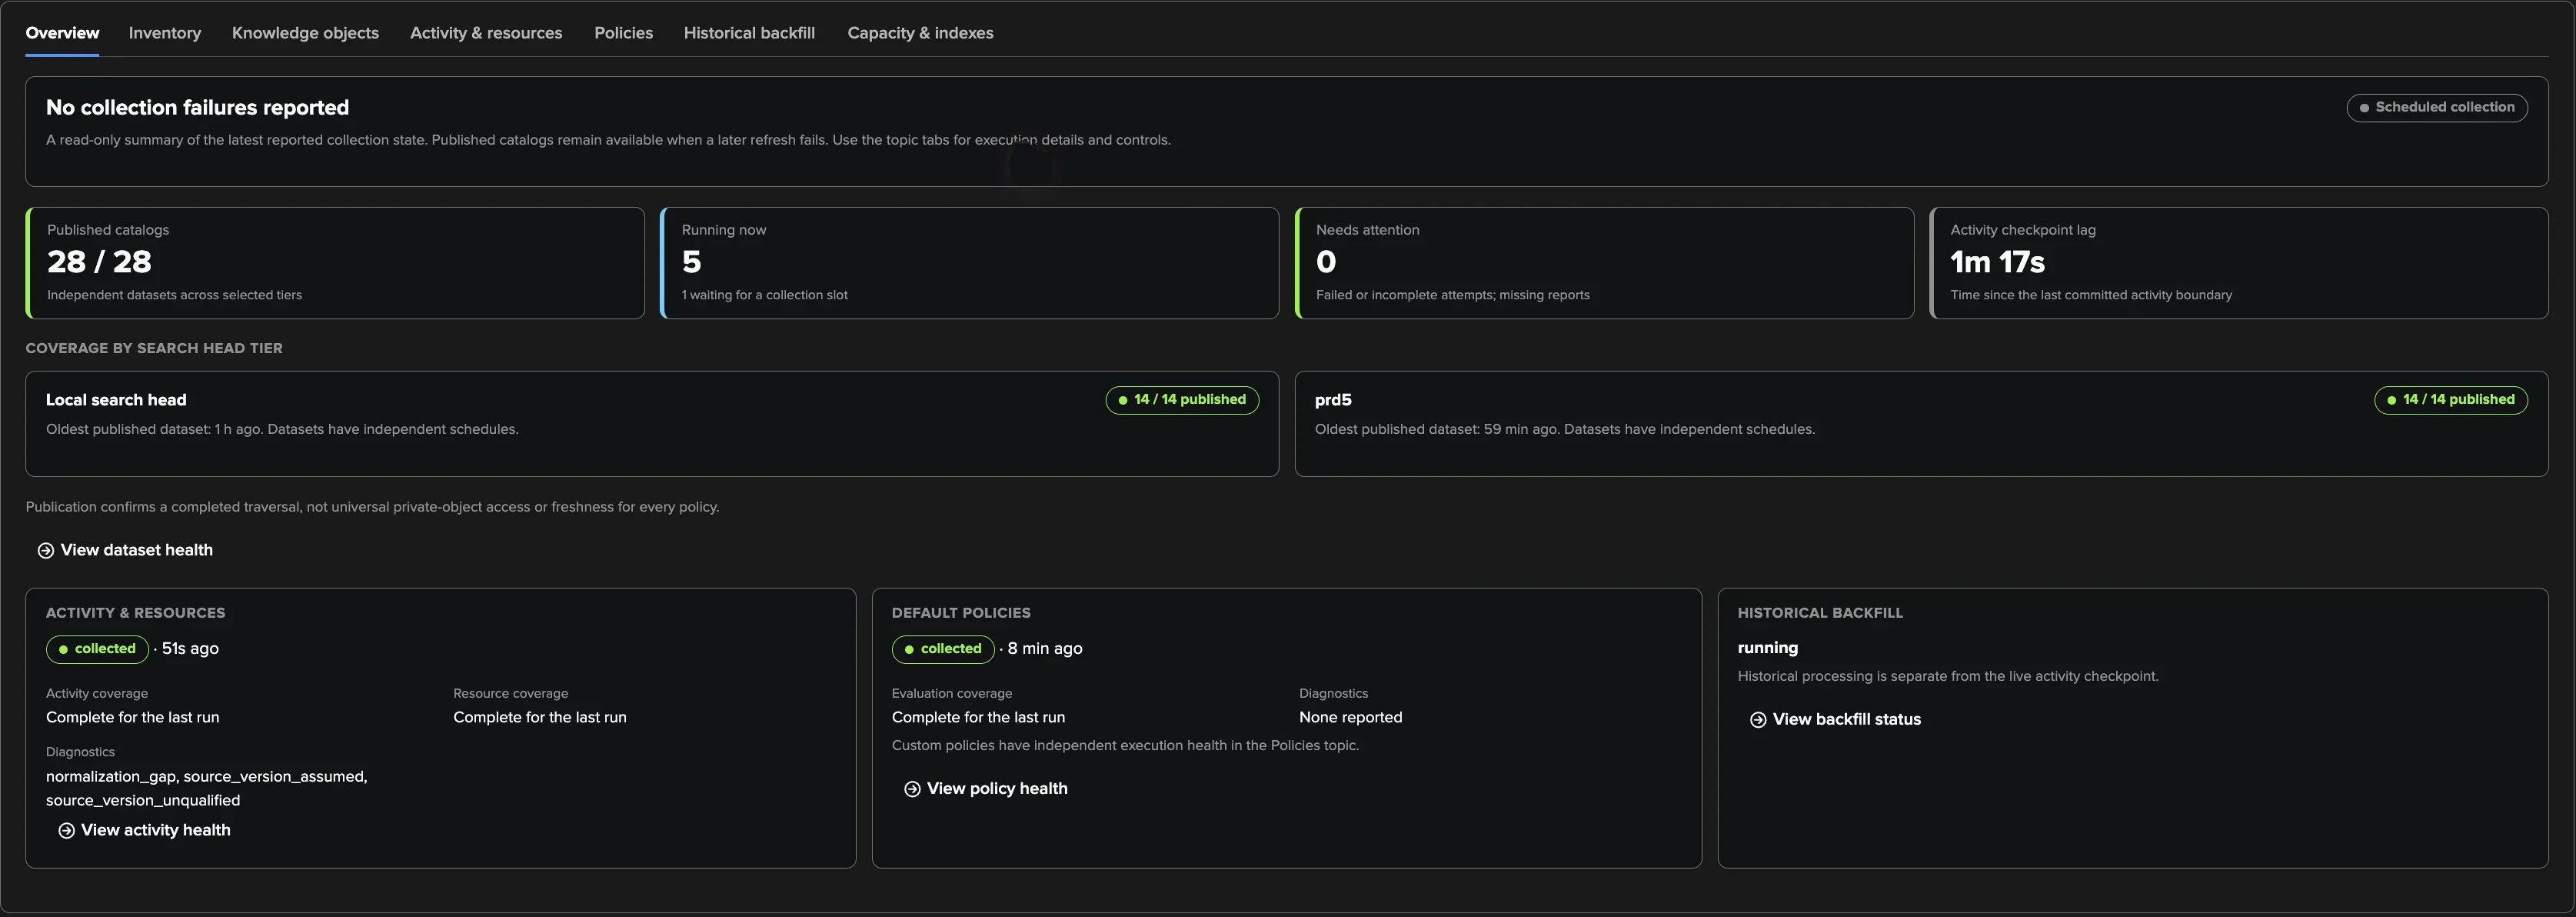
The Collection health tab is the first stop when something looks wrong. Its sub-tabs:
Overview — every tracker’s state at a glance, the activity checkpoint lag, the coverage.
Inventory — the inventory summary of each tier and the saved-search listings, with List now.
Knowledge objects — the catalog families per tier.
Activity & resources — the audit windows of the last run, the resource coverage.
Policies — the built-in policies run, and the custom policies execution health.
Historical backfill — the plan, its progress and its controls.
Capacity & indexes — the capacity basis and the target indexes.
Per tracker: the last run and its explanation, the diagnostics with their meaning, the run history, Run now and Recover stopped run.
Configuration Guardian
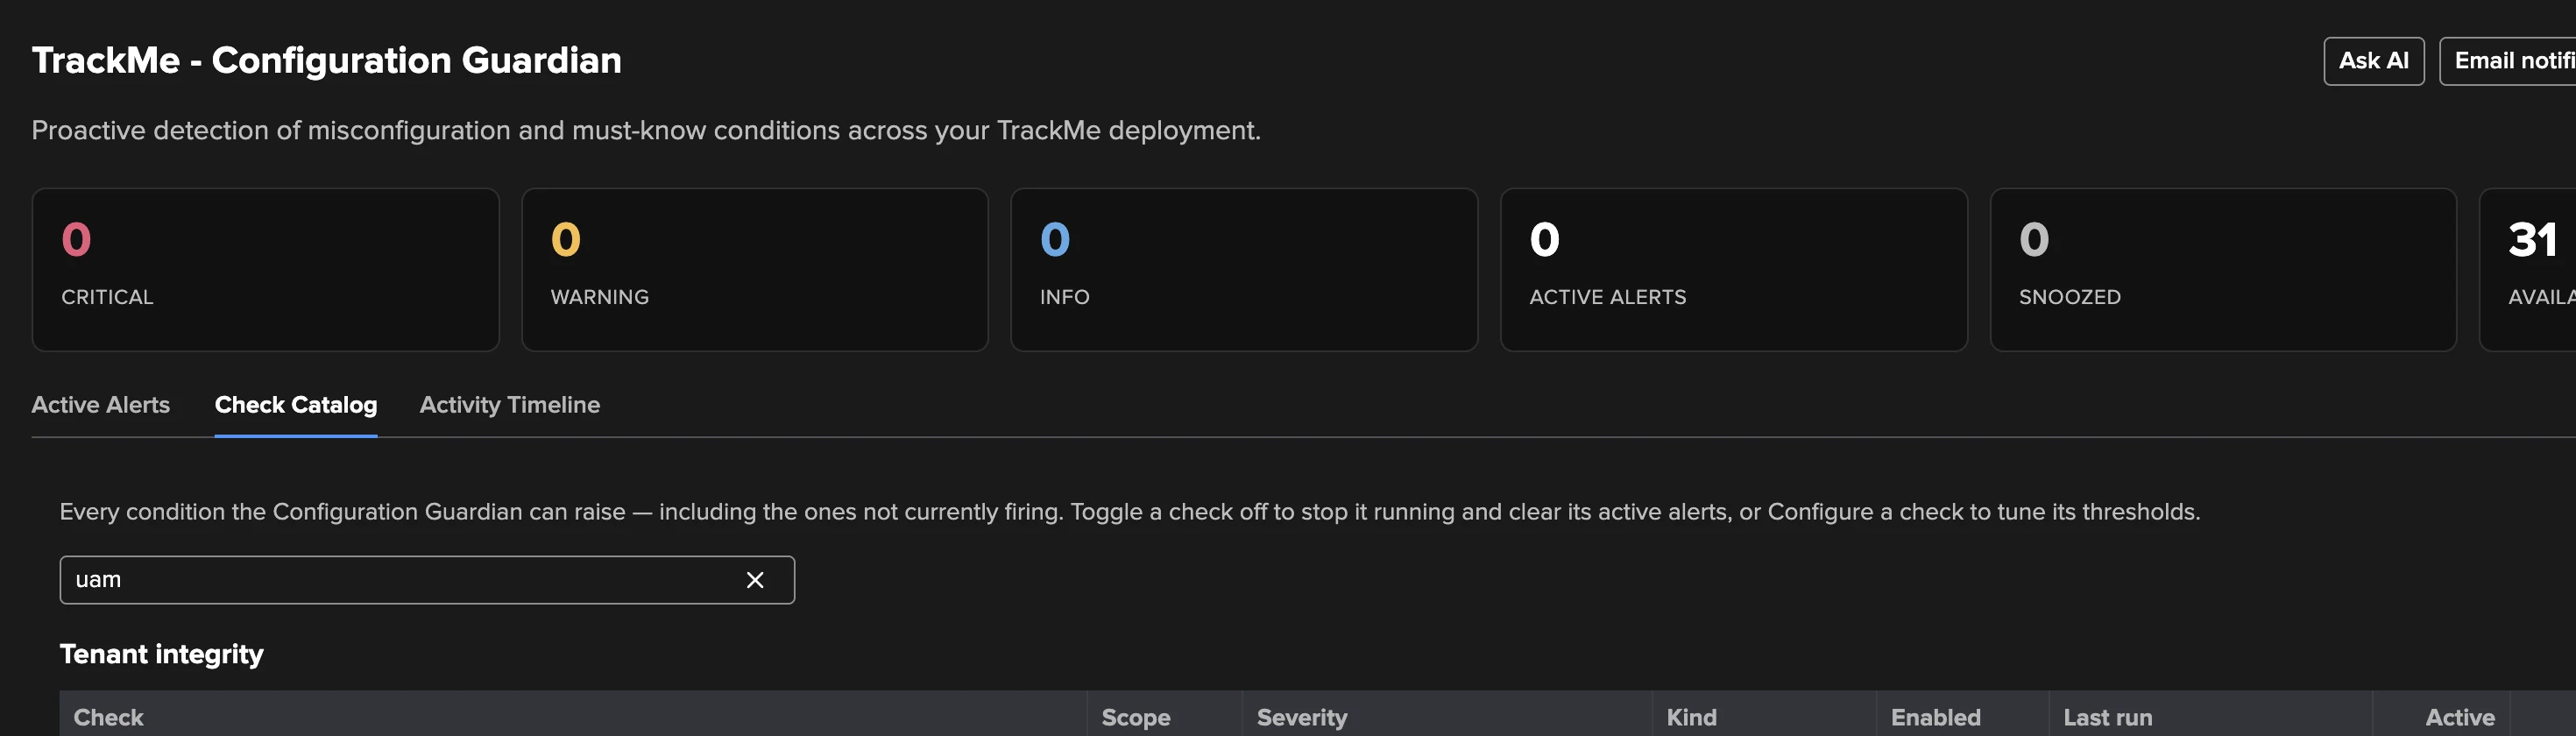
The uam_collection_health check (tenant scope, warning, see Configuration Guardian)
runs at every health cycle of each UAM tenant and on Guardian Run now. It is skipped for a
disabled tenant, an unconfigured workspace or manual collection (which clears a stale alert).
The alert names the tenant, lists its problems in the metadata and points at Collection
health; it clears itself once the conditions are gone. Unreadable inputs leave an existing
alert untouched.
Problem code |
Condition |
|---|---|
|
A report the tenant expects is absent, or not scheduled. |
|
A report has no recorded run. |
|
The last run is older than three missed schedule opportunities (plus the listing budget for the catalog reports). |
|
Three or more consecutive failed runs of one report. |
|
Operator notifications are on and the last policies run failed to deliver some. |
|
User notifications are on and the last policies run failed to deliver some. |
|
A catalog was last published more than twice its cadence plus a day ago. |
|
The last listing or catalog traversal failed or did not complete. |
|
The activity checkpoint did not advance for three schedules plus one window. |
|
A lock is held by a run whose search has stopped (use Recover stopped run). |
|
A lock’s owner cannot be verified (another member, or no search id). |
|
More custom policies are enabled than the tenant allows. |
|
A custom policy’s scheduled report is missing, unscheduled or differs from its published revision. |
|
Three or more consecutive incomplete runs of a custom policy. |
|
A custom policy run outlived its time limit and needs a verified recovery. |
|
A custom policy missed its scheduled runs. |
Tenant lifecycle
Disabling the tenant un-schedules its reports; enabling it reconciles them. Deleting a UAM tenant cancels a running backfill, disables and deletes its reports, lookups and collections, and refuses to run while a job lock is held (a provably stopped lock is recovered first; wait for or recover a live one, then retry). When provisioning is incomplete, the wizard result and the workspace offer Repair UAM workspace, which re-provisions the collections, lookups and reports idempotently.
Settings reference
The UAM configuration is one record (uam_config at creation, config of
POST uam/configure afterwards), edited from the workspace Settings tab and saved at once
with a revision check (an older draft is refused). Every limit is a tunable with a validated
range, not a product cap.
Section |
Setting (key) |
Default |
Bounds and meaning |
|---|---|---|---|
Environment |
Search head tiers ( |
|
1–10: |
Route account for indexing-layer searches ( |
|
One of the tiers; |
|
Activity scope |
Include / exclude ( |
empty / empty |
Up to 20 hostname patterns each ( |
Collection |
Scheduled trackers ( |
On |
Off = collection only on request. Requires a tenant owner. |
Store SPL search ( |
Off |
Index the SPL of reported searches in the search text index. |
|
Collect search resource usage ( |
On |
Required by the resource policies. |
|
Source version assumption ( |
On |
Parse unverified emitters under the head’s version, labelled assumed. |
|
Indexes |
|
empty |
Empty = the tenant’s summary index (evidence, receipts, search text) or notable index (findings). |
Limits · activity |
Activity window ( |
300 |
60–3,600 s per audit window. |
Activity overlap ( |
60 |
0–600 s, less than the window. |
|
Activity max records per window ( |
20,000 |
100–200,000; a larger window is split. |
|
Activity max seconds per run ( |
200 |
30–900. |
|
Activity window retries ( |
3 |
1–20 runs before a failing window is skipped as a recorded gap. |
|
Resource records per window ( |
5,000 |
100–50,000 distinct searches; overflow keeps the most expensive. |
|
Activity policy window ( |
900 |
300–86,400 s: the trailing window of the activity and resource policies. |
|
Limits · inventory |
Inventory page size ( |
500 |
50–500 records per REST page. |
Inventory max records ( |
100,000 |
100–1,000,000 per dataset and run. |
|
Catalog collection every (h) ( |
24 |
1–168: saved-search listing and the ten other families. |
|
Users and roles every (min) ( |
60 |
15–1,440. |
|
Full listing budget (s) ( |
3,600 |
300–14,000 per traversal. |
|
Listing window start / length ( |
1 / 5 |
0–23 / 1–24 (24 = any time), search head local time. |
|
Limits · policies |
Findings max records ( |
50,000 |
100–500,000; new findings stop with |
Resource rules: minimum history (h) ( |
24 |
0–720; the learning period of the resource policies. |
|
Limits · backfill |
Backfill days ( |
30 |
0–90 (0 = no backfill). |
Backfill bucket ( |
900 |
300–3,600 s. |
|
Backfill max seconds per run ( |
3,000 |
600–3,300. |
|
Backfill max records per bucket ( |
20,000 |
100–200,000; a larger bucket is split. |
|
Backfill bucket retries ( |
3 |
1–20. |
|
Account classification |
Detection ( |
On / On |
Human and service detection. |
Rules ( |
none |
Up to 100 ordered exact / wildcard rules. |
|
Manual classes ( |
|
Up to 10,000 accounts. |
|
Notifications to operators |
|
Off; new, reopened, severity raised, resolved; medium; digest |
Up to 50 recipients. |
Notifications to users |
|
Off; human accounts; baseline |
50 per run (1–200), 3 per address per hour (1–20), 24 h between repeat detections (1–168). |
Policies |
|
see the catalogue |
Enabled, severity, exclusions, scope, thresholds, automatic thresholds, preview mode,
bank holidays hold ( |
Stored elsewhere:
AI Agent — the
ai_uam_agent_*fields of the tenant (see The UAM AI Agent).Assignment — up to 100 assignment groups and 100 routing rules; group emails off by default.
Finding actions — up to 50 definitions and 100 automation rules.
Custom policies — their own definitions (see Custom policies).
Per viewer — Exclude TrackMe activity on the Users tab (browser storage, off), the Policies view mode (Cards, Compact cards, List), and the three Tenant Home display preferences (Collection monitors, Single stats, Charts).
The tracker schedules, the one-day retention of old catalog generations and the 90-day retention of the AI Agent decision log are fixed.
Roles and licence
Role |
Access |
|---|---|
TrackMe administrator of the tenant ( |
Everything: the workspace in Tenant Home, triage and grouping, configuration, policies and custom policies, search text and live definitions, the knowledge-object catalogs, collection control, the AI Agent. |
Power user of the tenant ( |
REST API access only (Tenant Home shows the UAM workspace to tenant administrators): the workspace, findings, Finding groups, counts, activity, accounts, inventory, saved search view, policy evaluation and history, tracker history, AI Agent settings and decision log; Send email communication; findings actions (run an action, email action, set an assignment). |
Read-only user ( |
No UAM operation. |
Licence: any licence beyond the Foundation edition — Enterprise, Unlimited, the trial
and Developer licences. Foundation and the Foundation Trial are refused
(uam_not_available_in_foundation). On an expired licence the workspace stays readable and
changes are refused; scheduled collection and custom policy runs continue through the
read-only and escalation stages of the licence enforcement ladder and stop with the tenants at
the stop stage.
REST endpoints
Resource group uam: /trackme/v2/uam/<operation> (browse it in TrackMe REST API
Reference). Every operation is a POST with tenant_id in the body, except GET
workspace and GET agent_settings, and answers describe=true. “Power” marks the
operations also open to tenant power users; the others need a TrackMe administrator of the
tenant. Every earliest / latest accepts what the Splunk time picker produces.
Area |
Operations |
|---|---|
Workspace reads (power) |
|
Findings and groups |
|
Policies |
|
Custom policies |
|
Notifications |
|
Inventory and catalogs |
|
Collection |
|
AI Agent |
|
Findings actions |
|
The tenant is created with POST /trackme/v2/vtenants/admin/add_tenant carrying
tenant_uam_enabled=true and a uam_config object (the wizard sends tiers,
scheduled, backfill_days and search_head_scope); see
Creating a splk-uam tenant.
Upgrading from 2.4.18
Finding groups: the first policies runs after the upgrade consolidate the existing findings into Finding groups (up to 5,000 findings per run; an account is never split). Triage decisions, notes and history are kept.
Inventory: each tier gets its
listingandkos_*reports. The first saved-search listing runs at the next hourly wake, then on the catalog cadence. The users and roles reports move from 5-minute to 15-minute wakes unless an administrator changed their schedule. Inventory max seconds, the fallback listing cadence and the delta object limit of 2.4.18 have no effect any more.UAM AI Agent: the UAM Findings Advisor report is removed; an enabled advisor’s settings (enabled, mode, provider, review interval, runtime capped at 3,000 seconds) are carried to the UAM AI Agent once.
The indexed
uam_*dimensions take effect after the splunkd restart of the upgrade.
Troubleshooting and known limits
Start with Collection health (each tracker’s last run, diagnostics and recovery) and the
Configuration Guardian check uam_collection_health. The technical logs carry outcomes only,
with tenant_id index-time extracted:
index=_internal sourcetype=trackme:custom_commands:trackmeuam* tenant_id=<tid>
(trackme_uam_tracker.log, trackme_uam_inventory.log, trackme_uam_activity.log) and
index=_internal sourcetype=trackme:rest_api tenant_id=<tid> (trackme_rest_api_uam.log).
trackme_uam_events.log is the evidence, not a troubleshooting log.
Symptom |
What to check |
|---|---|
The inventory is complete but the Activity tab stays empty |
The route account cannot read |
Most audit lines are unparsed ( |
The emitters’ version could not be verified and Source version assumption is off: turn it on. |
No service account is ever detected |
The |
The resource policies say learning for days |
Less than 24 hours of resource history (Collect search resource usage off, or
|
A policy opened a finding during a bank holiday |
The policy keeps opening findings (During bank holidays), the tenant does not hold new findings (Manage Bank Holidays → Tenants & settings), the holiday is not in the tenant’s calendars, or the finding was already observed. The policy insight and the policies receipt say what the run held, or that the holidays could not be read. |
Peak memory reads not measured |
No introspection sample caught the search (short pooled searches on Splunk Cloud). CPU still comes from Splunk’s completion accounting. |
Fetch SPL shows a reason instead of the text |
|
A finding keeps coming back after Resolve |
Expected: the condition persists and the policy reopens a resolved finding. Fix the cause, add an owner / account or app exclusion on the policy, or dismiss it. |
A CSV finding names the recorded owner, not the writer |
No supported audit evidence of the write since monitoring began (or the tier’s members could not be discovered: see the policy evaluation’s writer diagnostics). The owner fallback is by design. |
The Users tab shows a class the settings do not |
The class is detected; a manual class or a rule always wins, and a detection can be switched off. |
Collect now answers that a run is in progress |
A scheduled run holds the lock; wait for its receipt. If no run is active, Recover stopped run (after five minutes, same search head only). |
The backfill reports waiting for the first activity run |
Normal until the activity tracker set the live start; the backfill plans itself at its next hourly slot. |
A custom policy does not run |
Check Collection health → Policies → Custom policies: published and enabled,
Scheduled trackers on, a tenant owner set; the Guardian names |
The tenant cannot be deleted ( |
A tracker or backfill run is live or its lock is held by another member; wait for it or recover the lock on its member, then retry. |
Known limits.
One indexing layer per tenant: keeping the tiers on one layer is the administrator’s responsibility.
A saved search with the same name, app and owner on two tiers shares one set of run figures in the saved search view (resource records carry no tier).
The knowledge-object catalogs reflect what the collection account can see, and a traversal is not an atomic snapshot.
Several tenants monitoring the same tier each pay their own collection cost.
Activity policies judge the trailing 15-minute window by default; inventory policies follow the catalog cadence (a daily saved-search listing by default).
Custom policies map to accounts and saved searches only, and their findings are not notified.
See also
User Activity Monitoring — the task-oriented guide.
Findings, Finding groups and findings actions — findings, Finding groups, assignment, notifications, findings actions and the AI Agents.
Who is doing what on your Splunk? User Activity Monitoring (UAM) — the end-to-end walkthrough.
Creating a splk-uam tenant — the creation wizard and the REST flags.
Configuration Guardian — the Configuration Guardian.
Remote Splunk deployments — remote deployment accounts (the remote tiers).
The AI Advisors — AI Advisors and Agents.