Cribl Stream monitoring
Cribl Stream sits in the middle of the data path: every pipeline, route, pack and destination it runs is a place where data can slow down, get dropped or stop. TrackMe turns Cribl’s own internal metrics into monitored entities — one per pipeline, route, input, destination and worker host — with a state, live metrics, 24-hour history and ML-learned baselines, then lets you arrange them into a living map of your Cribl deployment with Topology Studio and alert on it as a whole.
Nothing is installed on Cribl. Monitoring is built on the Flex Objects component and a ready-made library of twelve Cribl use cases — ten for Cribl Stream, two for Cribl Edge — that query the internal metrics Cribl already ships to Splunk.
Note
Cribl monitoring uses the Flex component (splk-flx), a restricted Enterprise /
Unlimited capability (not available with the Foundation Edition trial).
How it works
Tip
This page monitors Cribl’s own infrastructure. To monitor the original data sources and hosts observed in Cribl through DSM/DHM, follow the Cribl activity signals recipe.
Three ideas make the integration robust at scale:
One tracker covers every worker group. Every search breaks by Cribl’s
groupdimension, which becomes part of each entity’s identity — add a worker group on the Cribl side and its pipelines, routes and hosts appear on the next run.Each entity group decides its state the way that fits its data. Health checks and backpressure use a ratio over the last 30 minutes so that a single blip never raises an alert; infrastructure uses thresholds you can edit per entity; traffic flows use ML outliers learned per pipeline, route, pack, input and output.
Everything is an entity. Cribl objects get the same lifecycle as any TrackMe entity: stateful alerting, maintenance, priorities, SLA, notes, and a place on a topology.
The Cribl use-case library
Cribl Stream
Use case ( |
What it monitors |
Entity group |
State decided by |
|---|---|---|---|
|
Health of every Logstream input, by input type |
|
health-check ratio |
|
Health of every Logstream output (destination) |
|
health-check ratio |
|
Destinations blocked or under backpressure |
|
health-check ratio |
|
Worker hosts CPU (average, max, 95th percentile) |
|
threshold (avg CPU < 90%) |
|
Worker hosts memory: heap total / used, RSS, heap usage % |
|
threshold (heap usage) |
|
Pipelines: events in, out, dropped, % sent, % dropped |
|
ML outliers |
|
Routes: events and bytes in and out |
|
ML outliers |
|
Packs: events in and out |
|
ML outliers |
|
Total input traffic per input: events, bytes, MB |
|
ML outliers |
|
Total output traffic per destination: events, bytes, MB |
|
ML outliers |
The CPU and memory use cases share the same entity identity, so both trackers enrich one entity per worker host. Health checks classify the last 30 minutes of Cribl’s own health values (0 green, 1 yellow, 2 red): an entity turns red when at least 75% of the checks are red, orange when they are mostly yellow — the ratio absorbs the transient flaps a raw health value would raise. Traffic use cases start green and let ML outlier detection learn what normal looks like for each pipeline or route, flagging a flow that drops, floods, or starts dropping events.
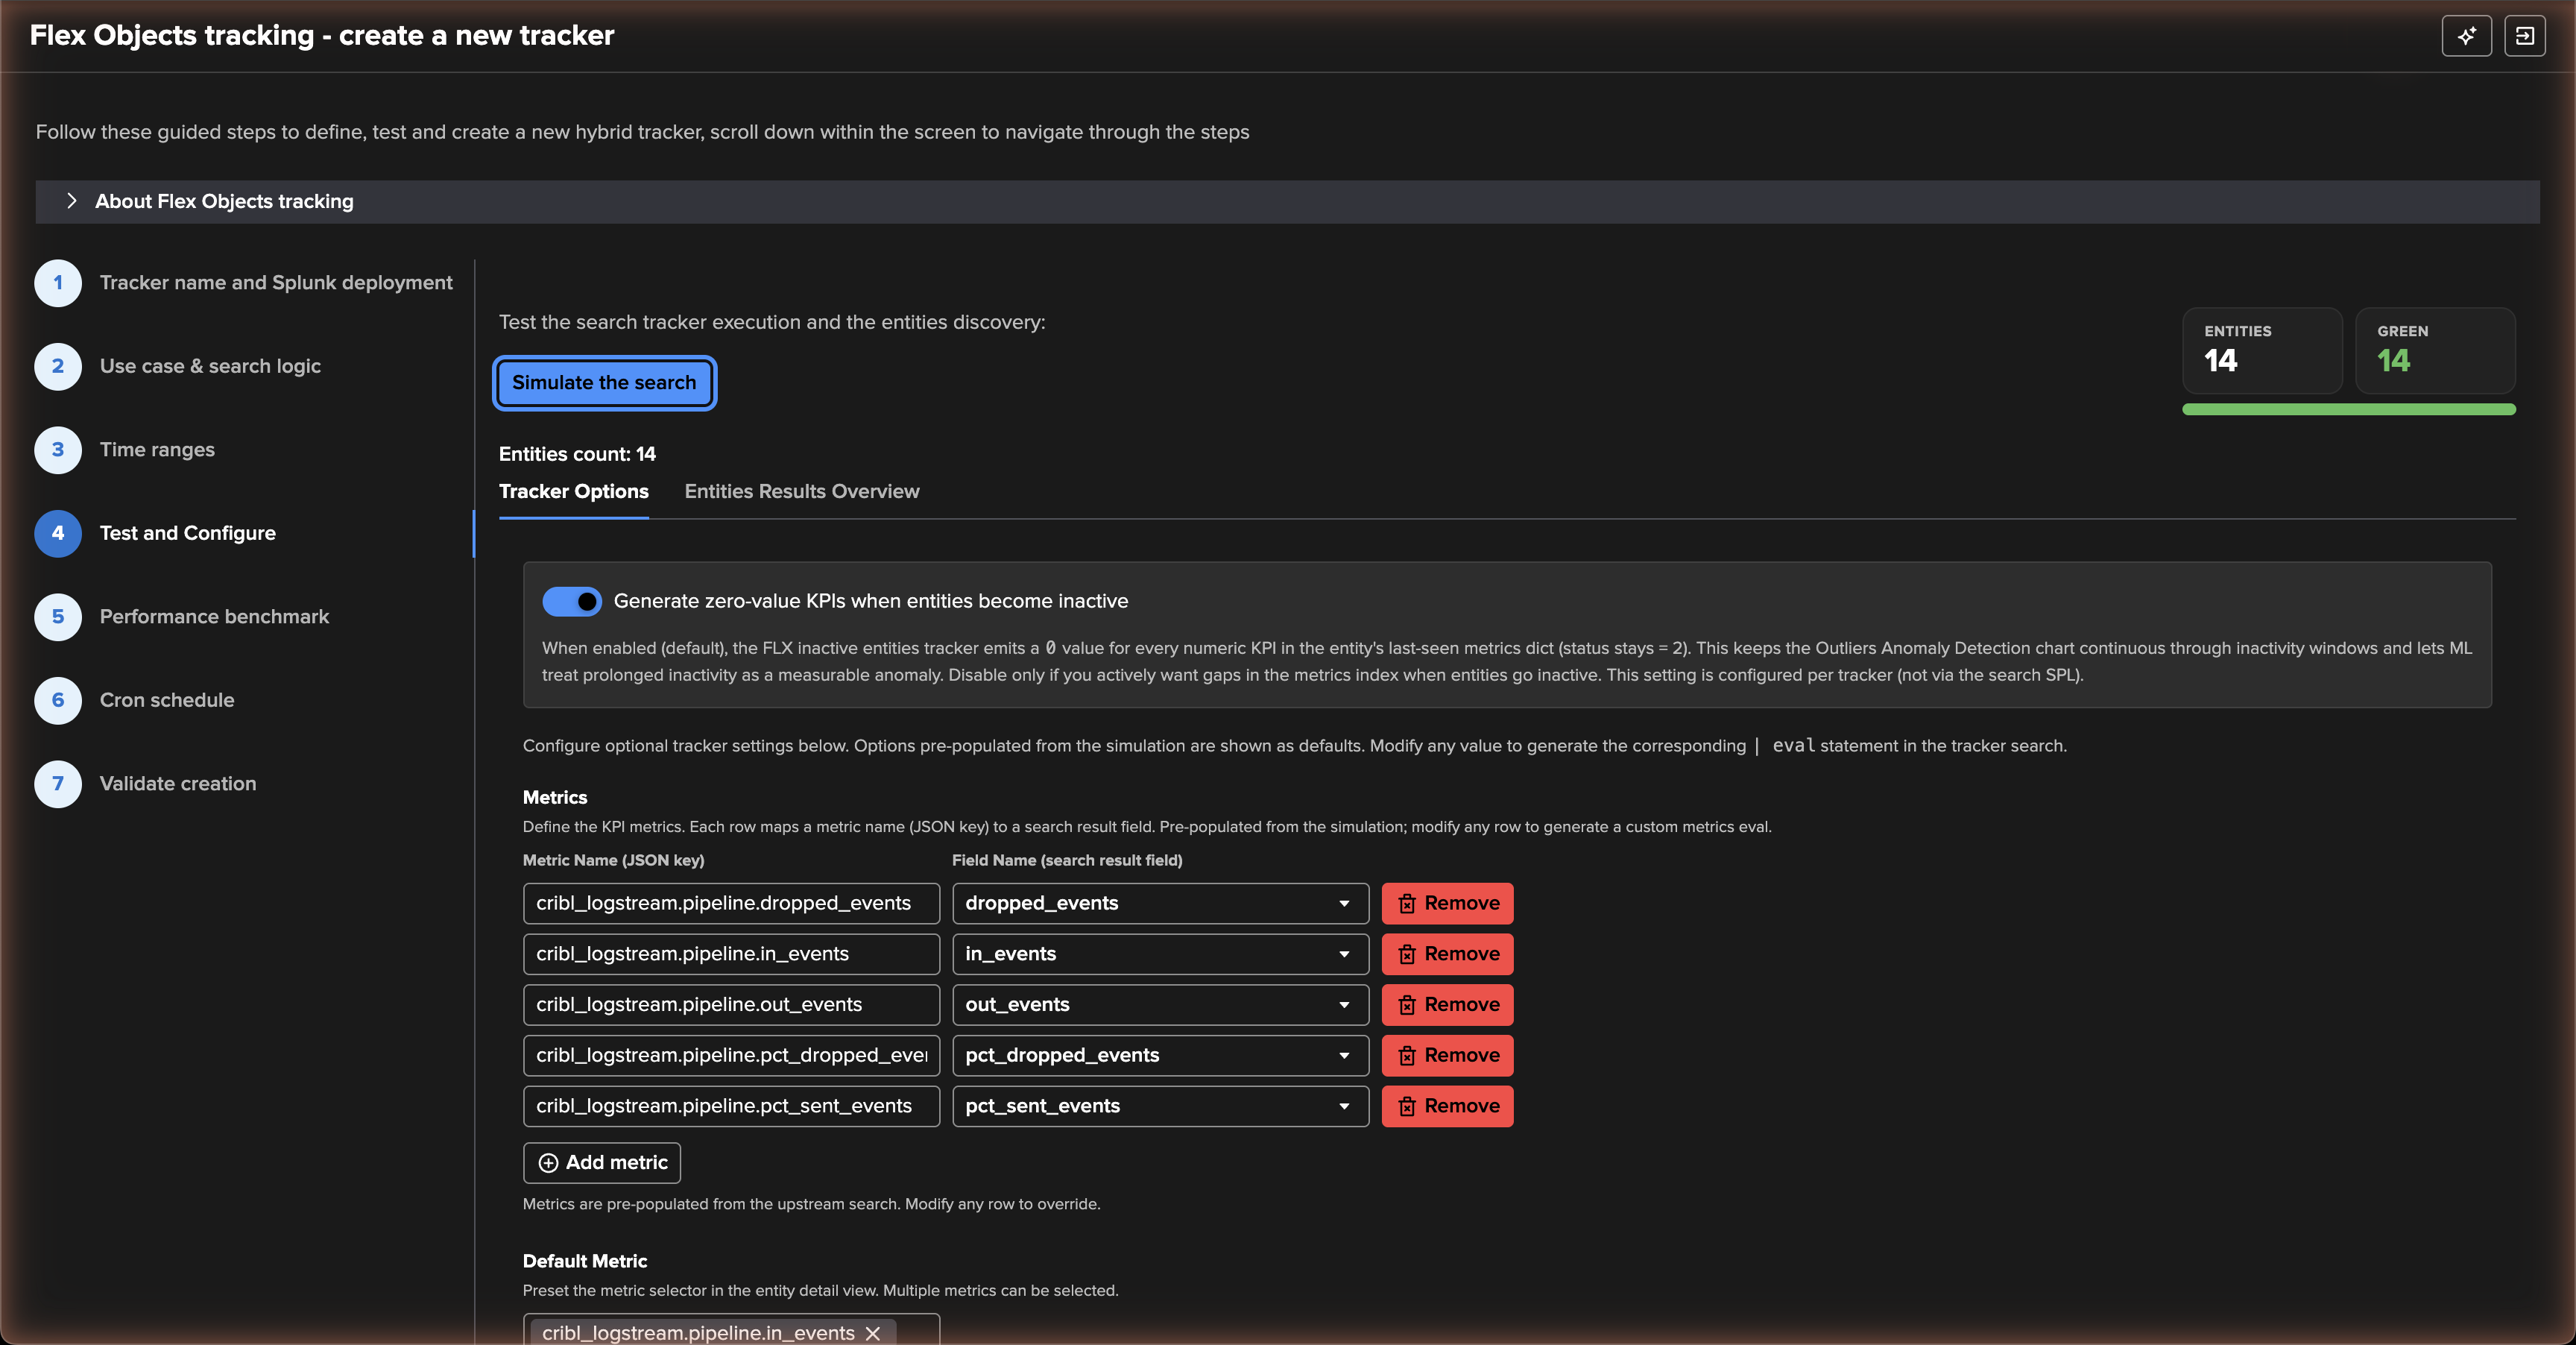
Each entity carries the metrics of its use case (cribl_logstream.pipeline.in_events,
cribl_logstream.route.route_out_mbytes, cribl_logstream.avg_cpu_perc…), so they
are available as KPIs on a topology, as sparklines in the inspector and in emails.
Cribl Edge
Two further use cases cover a Cribl Edge fleet: cribl_edge_fleet_metrics reads
the Edge internal metrics indexed in Splunk and flags a node whose metrics stop arriving,
and cribl_edge_fleet_api polls the fleet through the Cribl API with the
TA-trackme-cribl add-on, reporting each node’s heartbeat delay and input/output health.
See Cribl Stream & Edge API for the add-on.
To list every Cribl use case with its full definition, run:
| trackmesplkflxgetuc | search uc_vendor=Cribl
Requirements
Cribl internal metrics in Splunk
The Stream use cases rely on Cribl internal metrics being indexed in a Splunk
metrics index — the Cribl-side Splunk destination for internal metrics, typically an
index such as cribl_metrics. Verify they arrive before creating trackers:
| mpreview index=cribl_metrics filter="metric_name=cribl.logstream.*"
The library searches read every metrics index by default (where index=*). For
performance on large deployments, pin your Cribl metrics index when creating a tracker —
the wizard shows the SPL and lets you edit it:
| mstats sum(cribl.logstream.route.in_bytes) as route_in_bytes, sum(cribl.logstream.route.in_events) as route_in_events, sum(cribl.logstream.route.out_bytes) as route_out_bytes, sum(cribl.logstream.route.out_events) as route_out_events where index=cribl_metrics host=* by group, name
For the metrics Cribl emits, see https://docs.cribl.io/stream/internal-metrics.
Hint
Multiple worker groups
Nothing to do: a single tracker manages all worker groups individually, because every
search breaks against the Cribl group dimension and that group is part of each
entity’s name (pipeline|group:default|pipeline:webserver_nginx).
A Flex-enabled tenant
You need a tenant with the Flex Objects component enabled — a dedicated tenant for
Cribl (cribl-mon in the examples below) keeps the Cribl entities, their alerts and
their topology together, but any Flex-enabled tenant works. If the metrics live on
another search head, create the trackers against a
remote deployment.
Setting it up
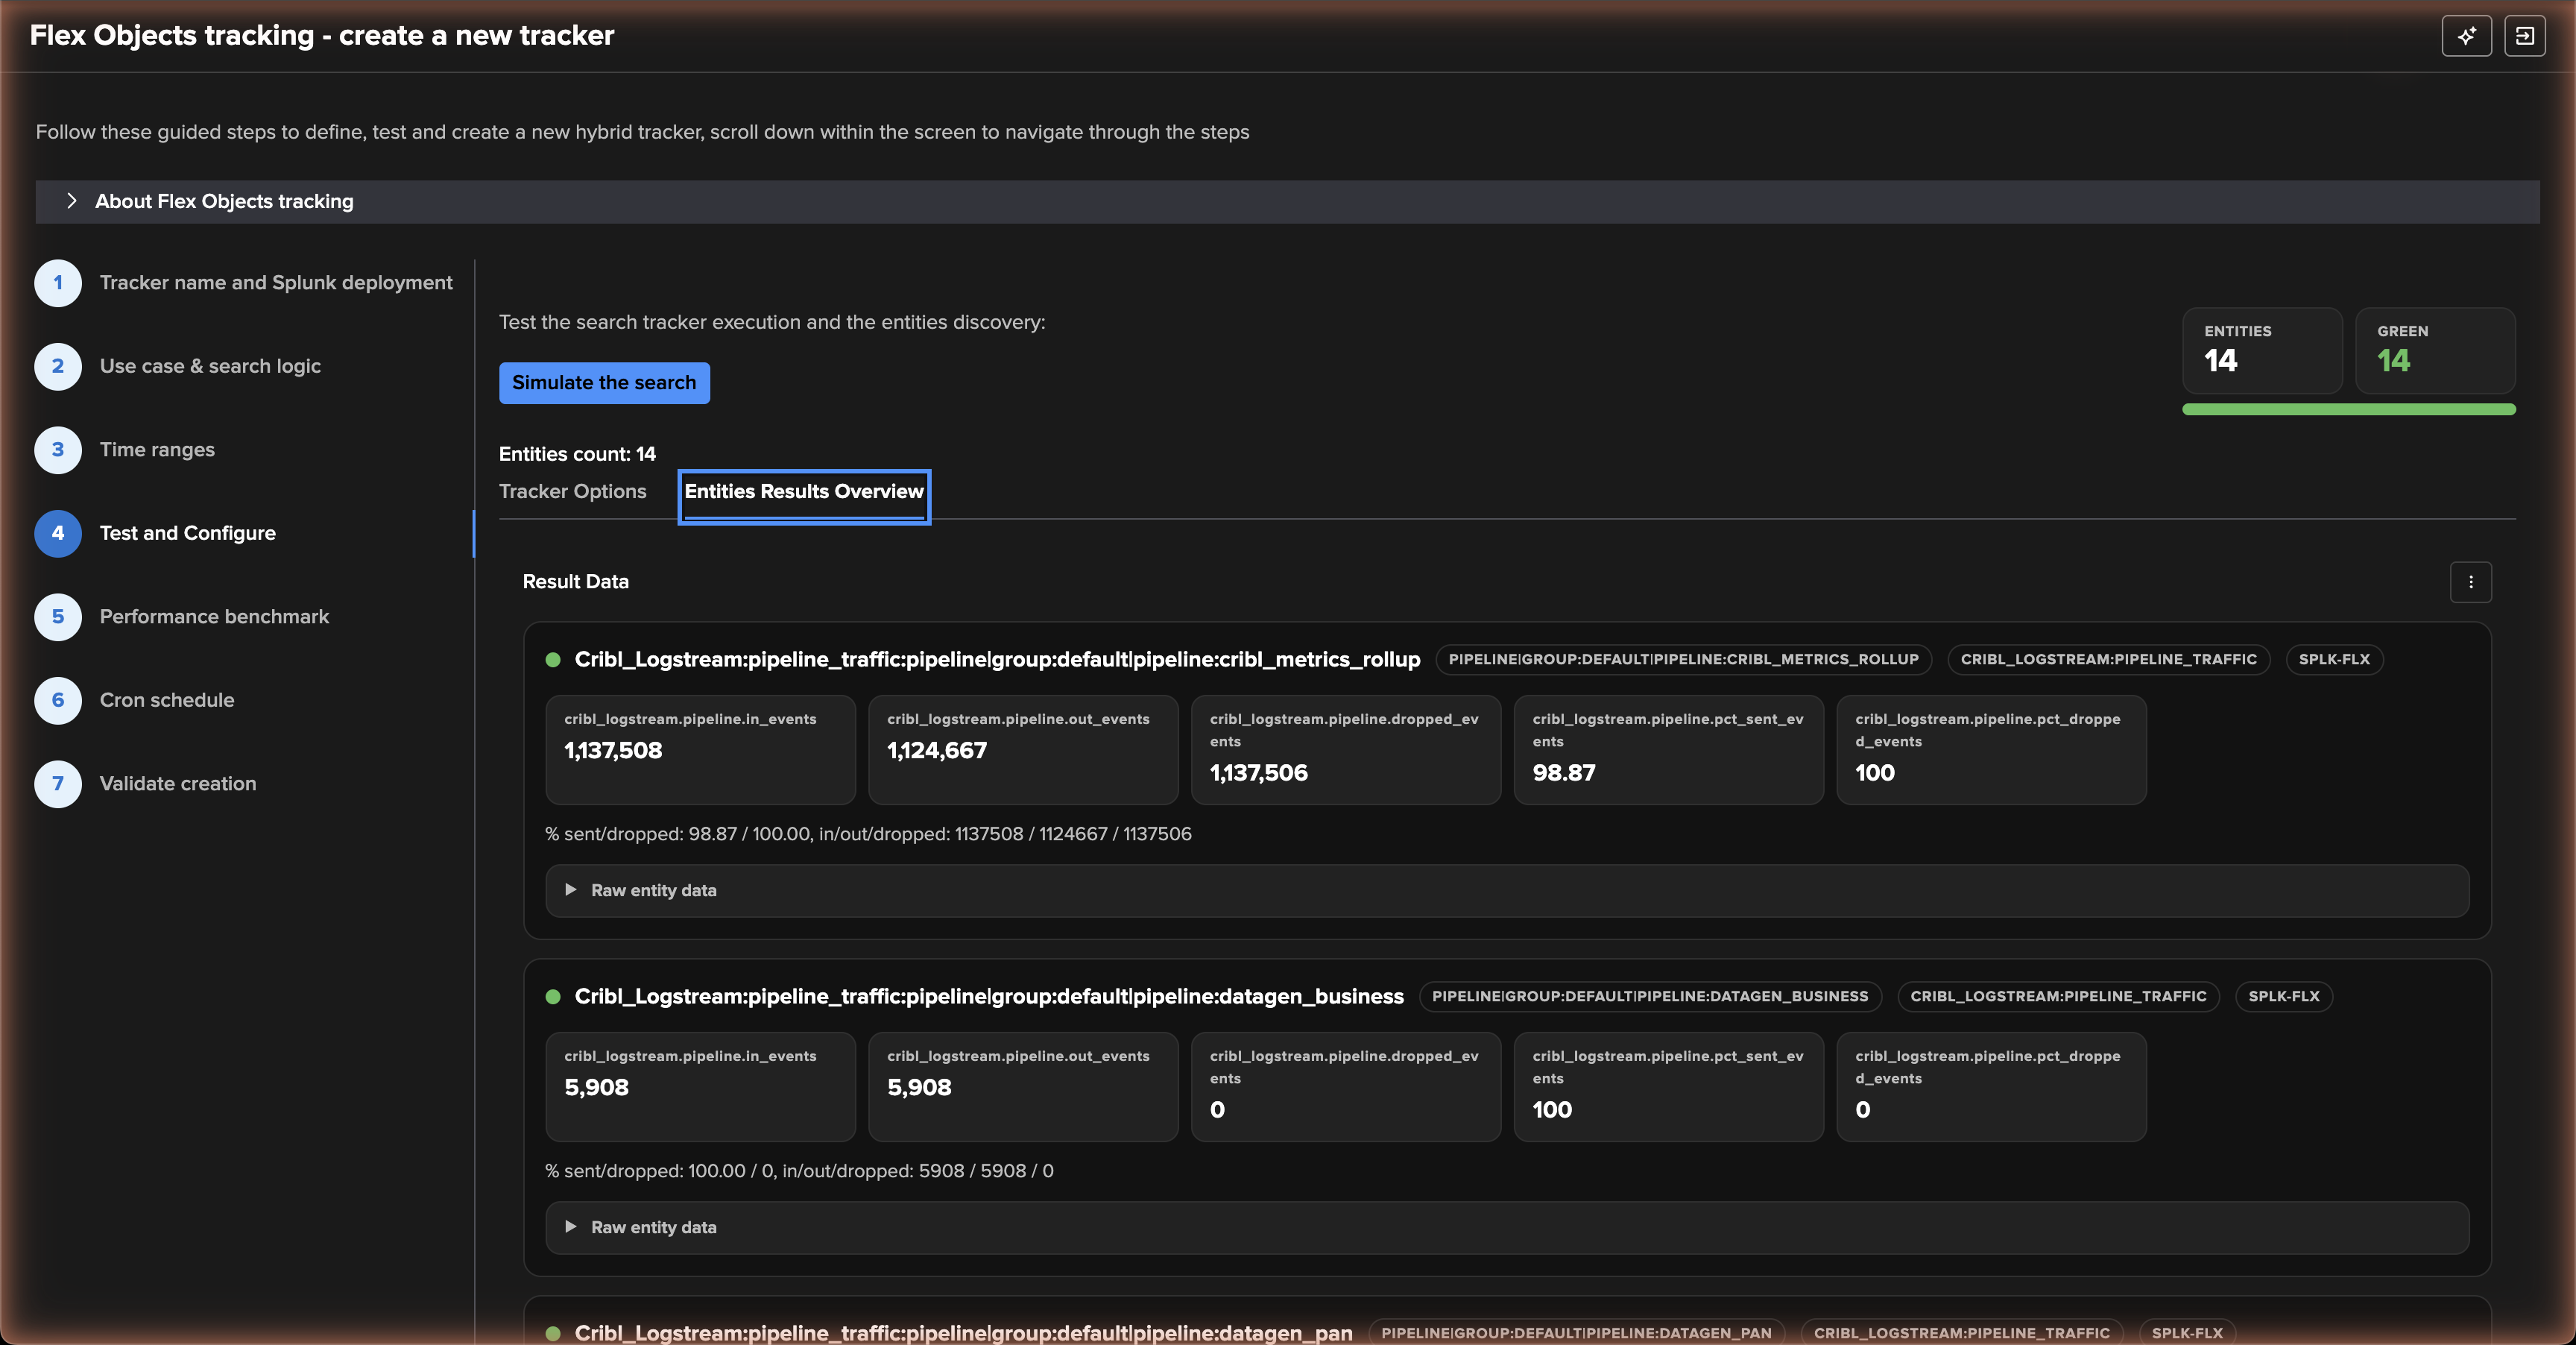
Trackers are created from the hybrid tracker wizard in your tenant (Tenant Home → Actions → Flex Objects tracking), one tracker per use case — see Creating a Flex tracker for the generic walkthrough. For Cribl the seven steps go like this:
Tracker name and Splunk deployment — a meaningful name such as
cribl_pipelines(it prefixes the tracker’s searches), local or a remote account.Use case & search logic — load the search from the library: vendor Cribl, then the use case reference. The wizard shows the use case’s description, its implementation notes and the metrics it produces, then the SPL itself, fully editable: pin your metrics index, exclude an internal destination, rename the group.
Time ranges — pre-filled from the use case (
-5mfor the traffic use cases,-30mfor the health ratios).Test and configure — simulate the search and review the entities it would create, with their parsed metrics and, for the traffic use cases, the outlier definitions.
Performance benchmark — the wizard times the search so you know what the schedule will cost.
Cron schedule — every five minutes for every Cribl use case.
Validate creation. The entities appear on the first run.
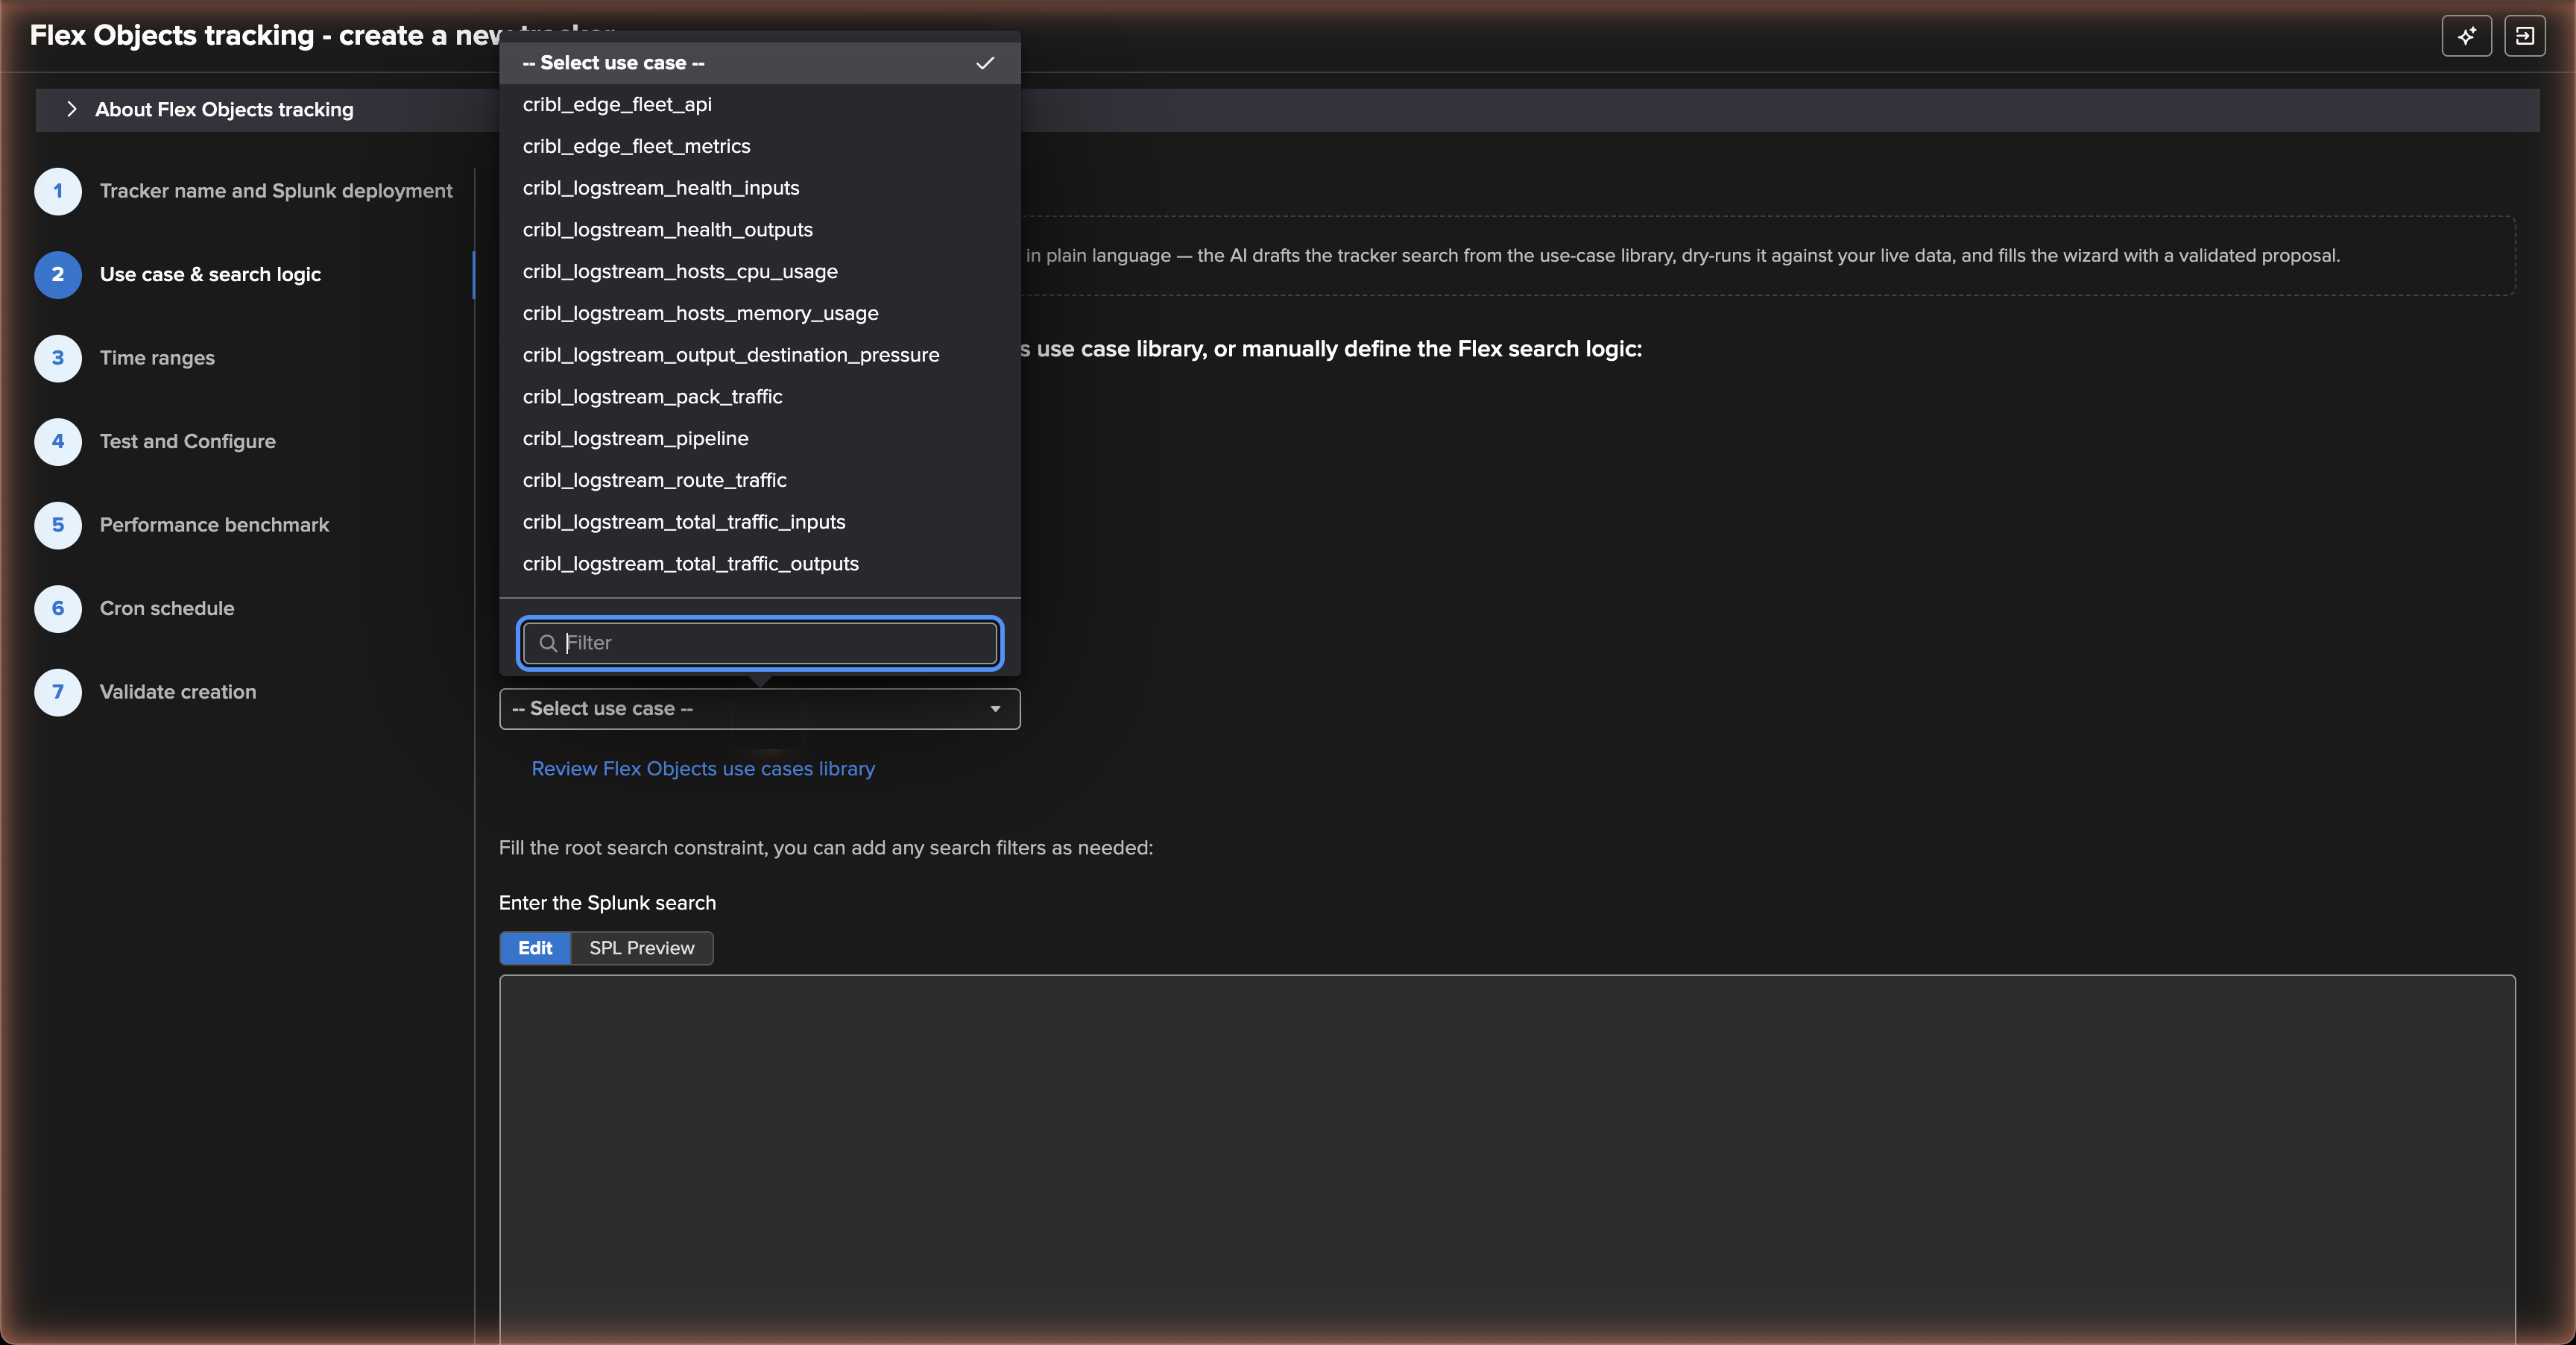
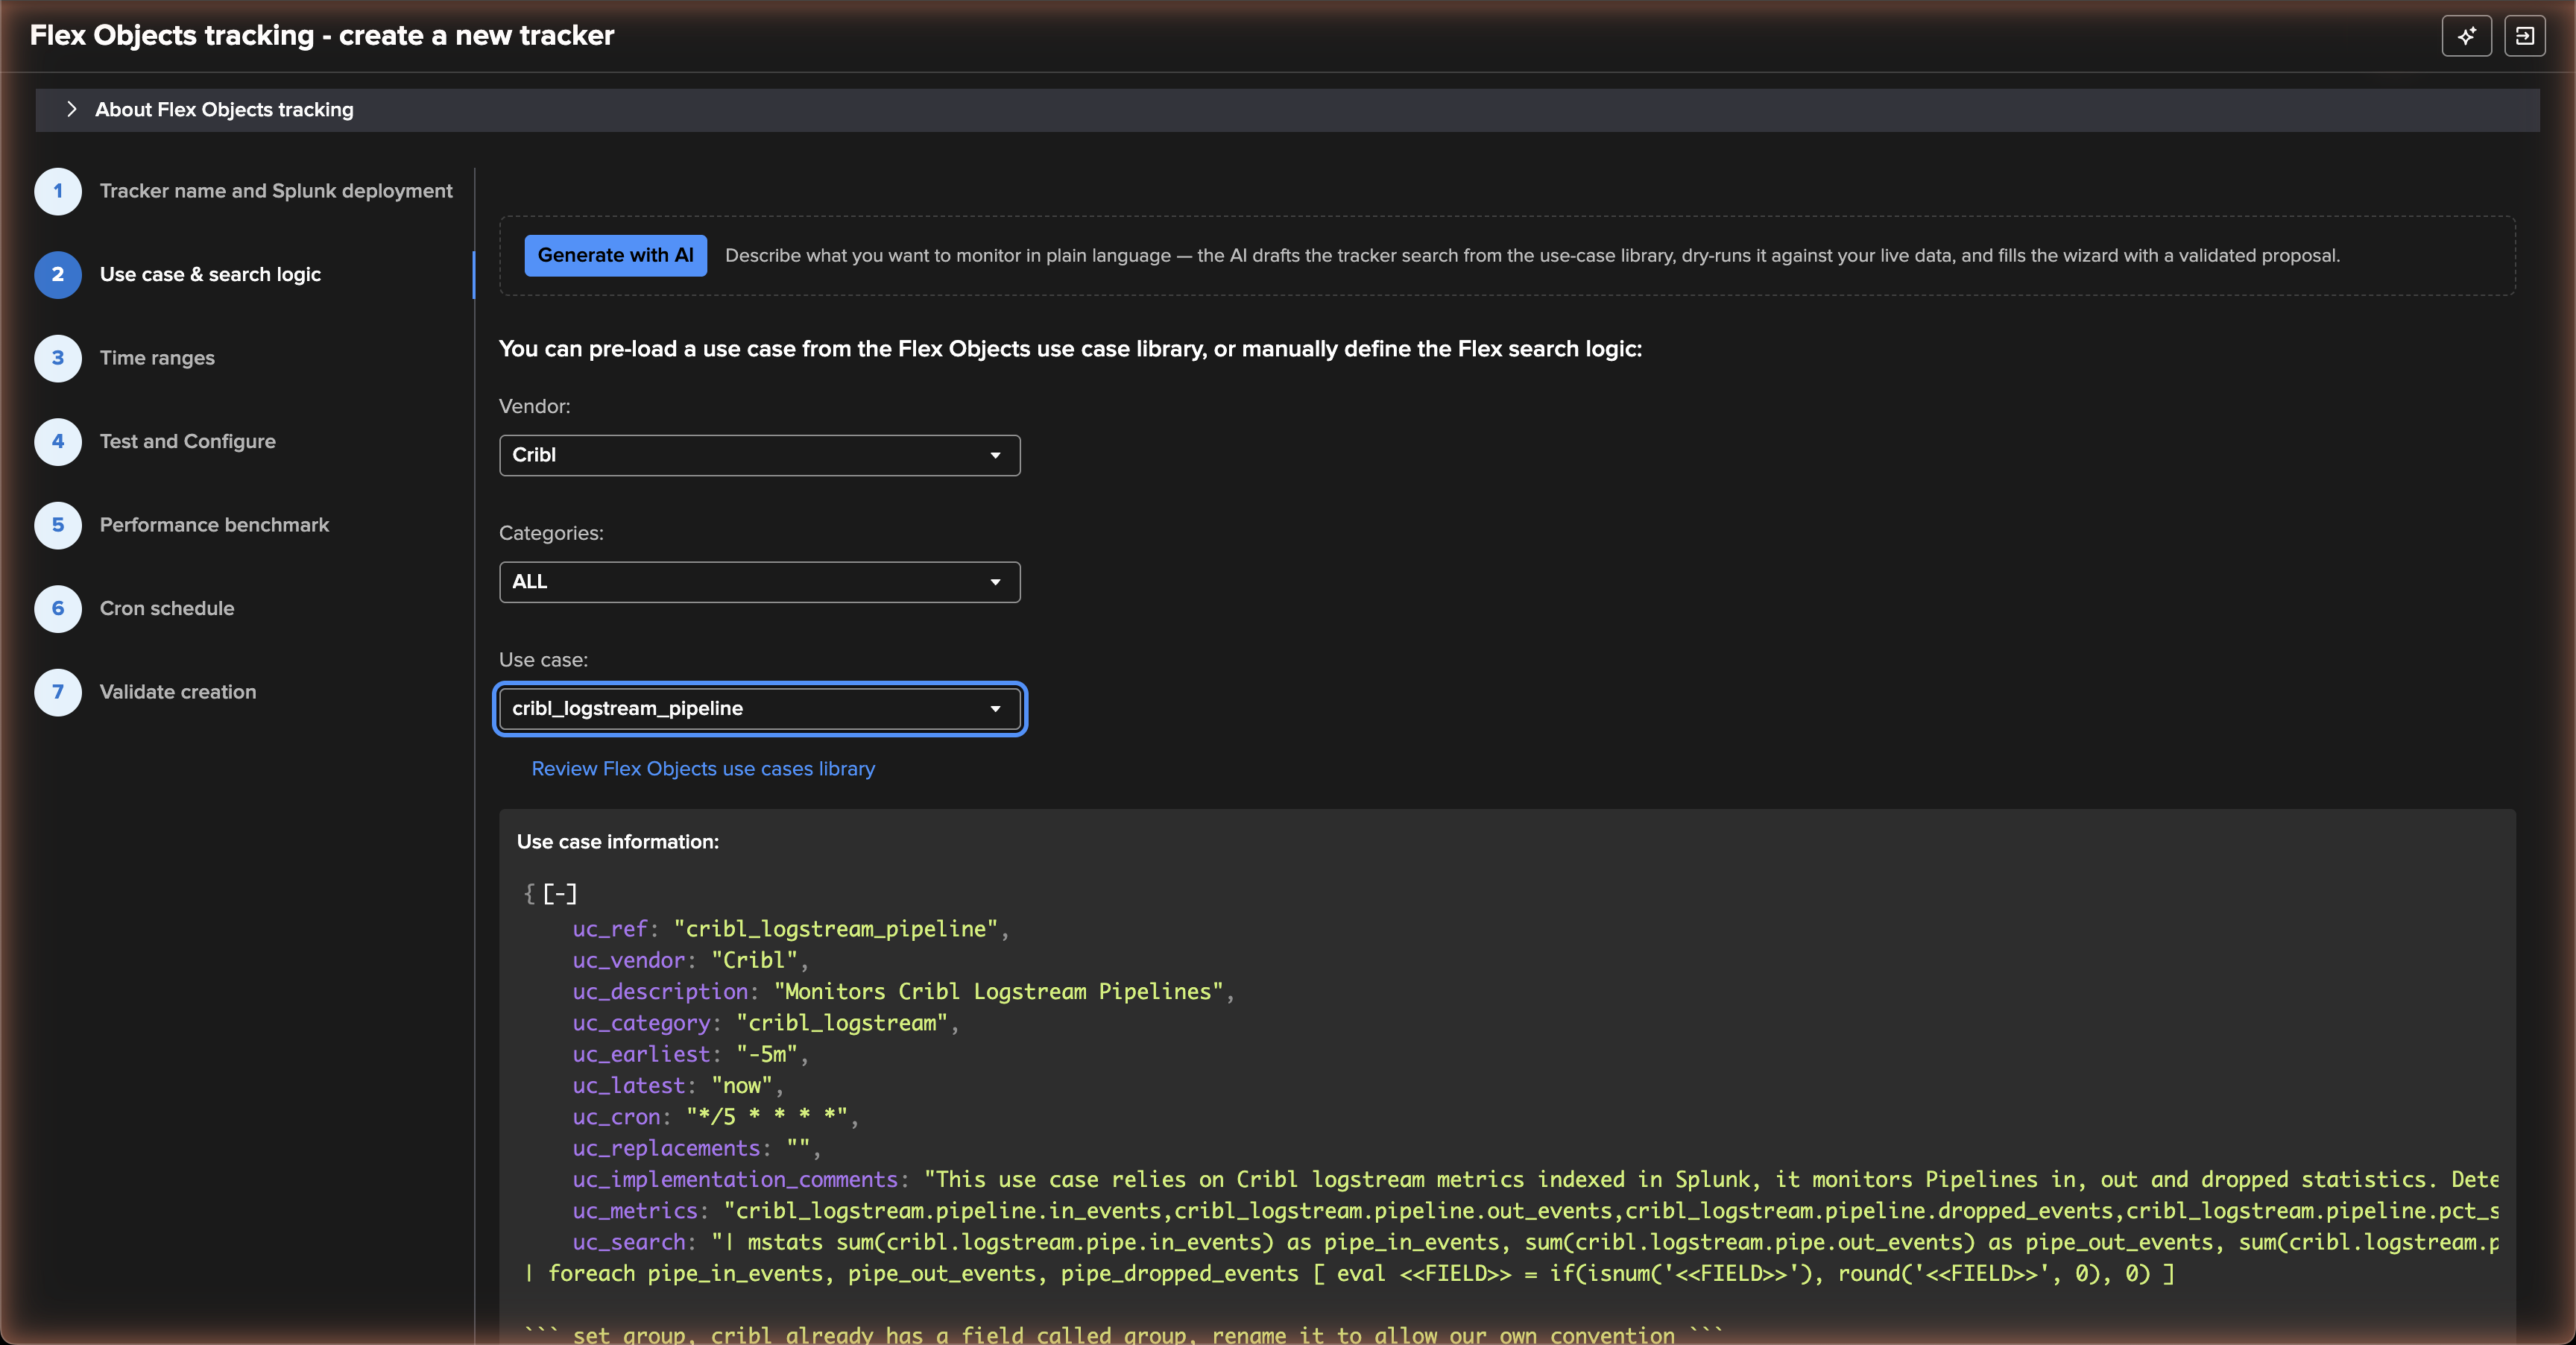
The wizard also offers Generate with AI at this step: describe what you want to monitor in plain language, and the AI drafts the tracker search from the use-case library, dry-runs it against your live data and fills the wizard with a validated proposal — handy when a Cribl use case needs a twist, such as one tracker per worker group or a filter on a naming convention.
Reading the results
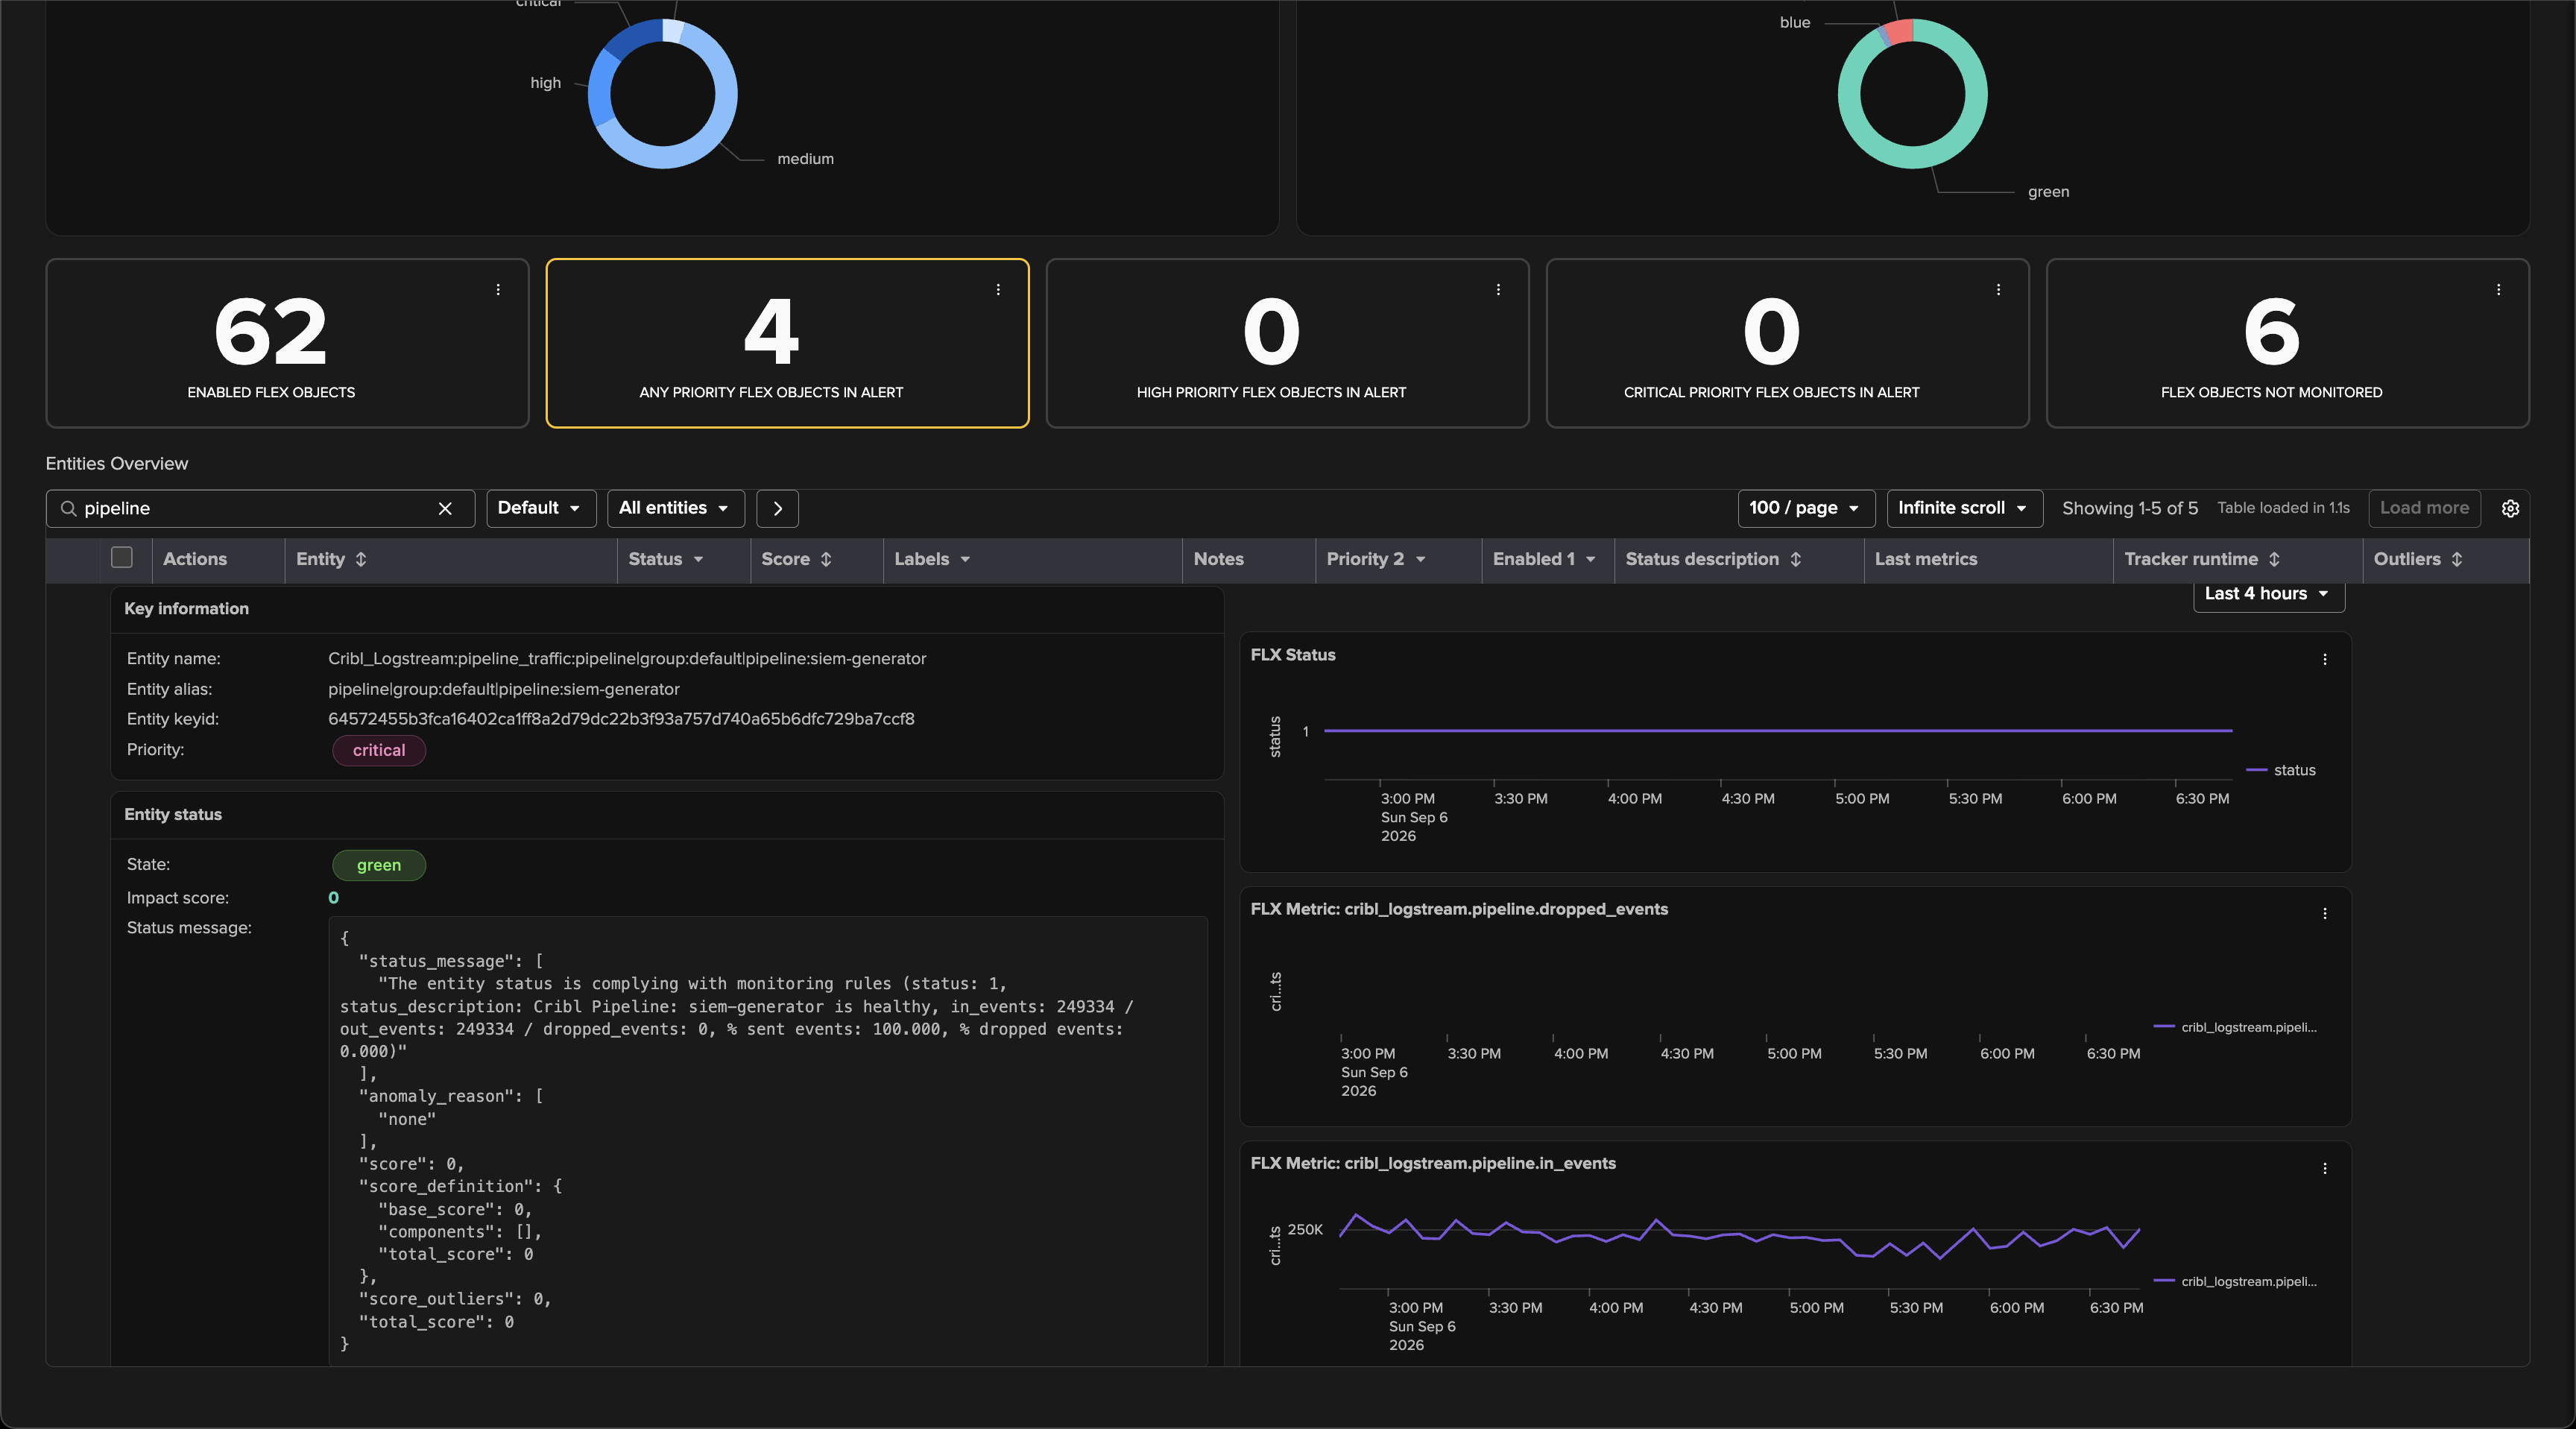
Once the trackers run, Tenant Home lists the Cribl entities under their
Cribl_Logstream:* groups, with the status description the use case wrote for each
one — for a pipeline, the percentages sent and dropped and the raw in, out and dropped
counts; for a destination, the share of green health checks and pressure checks. Filter
the table on a group or a name to focus on one family, and expand a row for the entity’s
key information, its status message and its recent metrics without leaving the table:
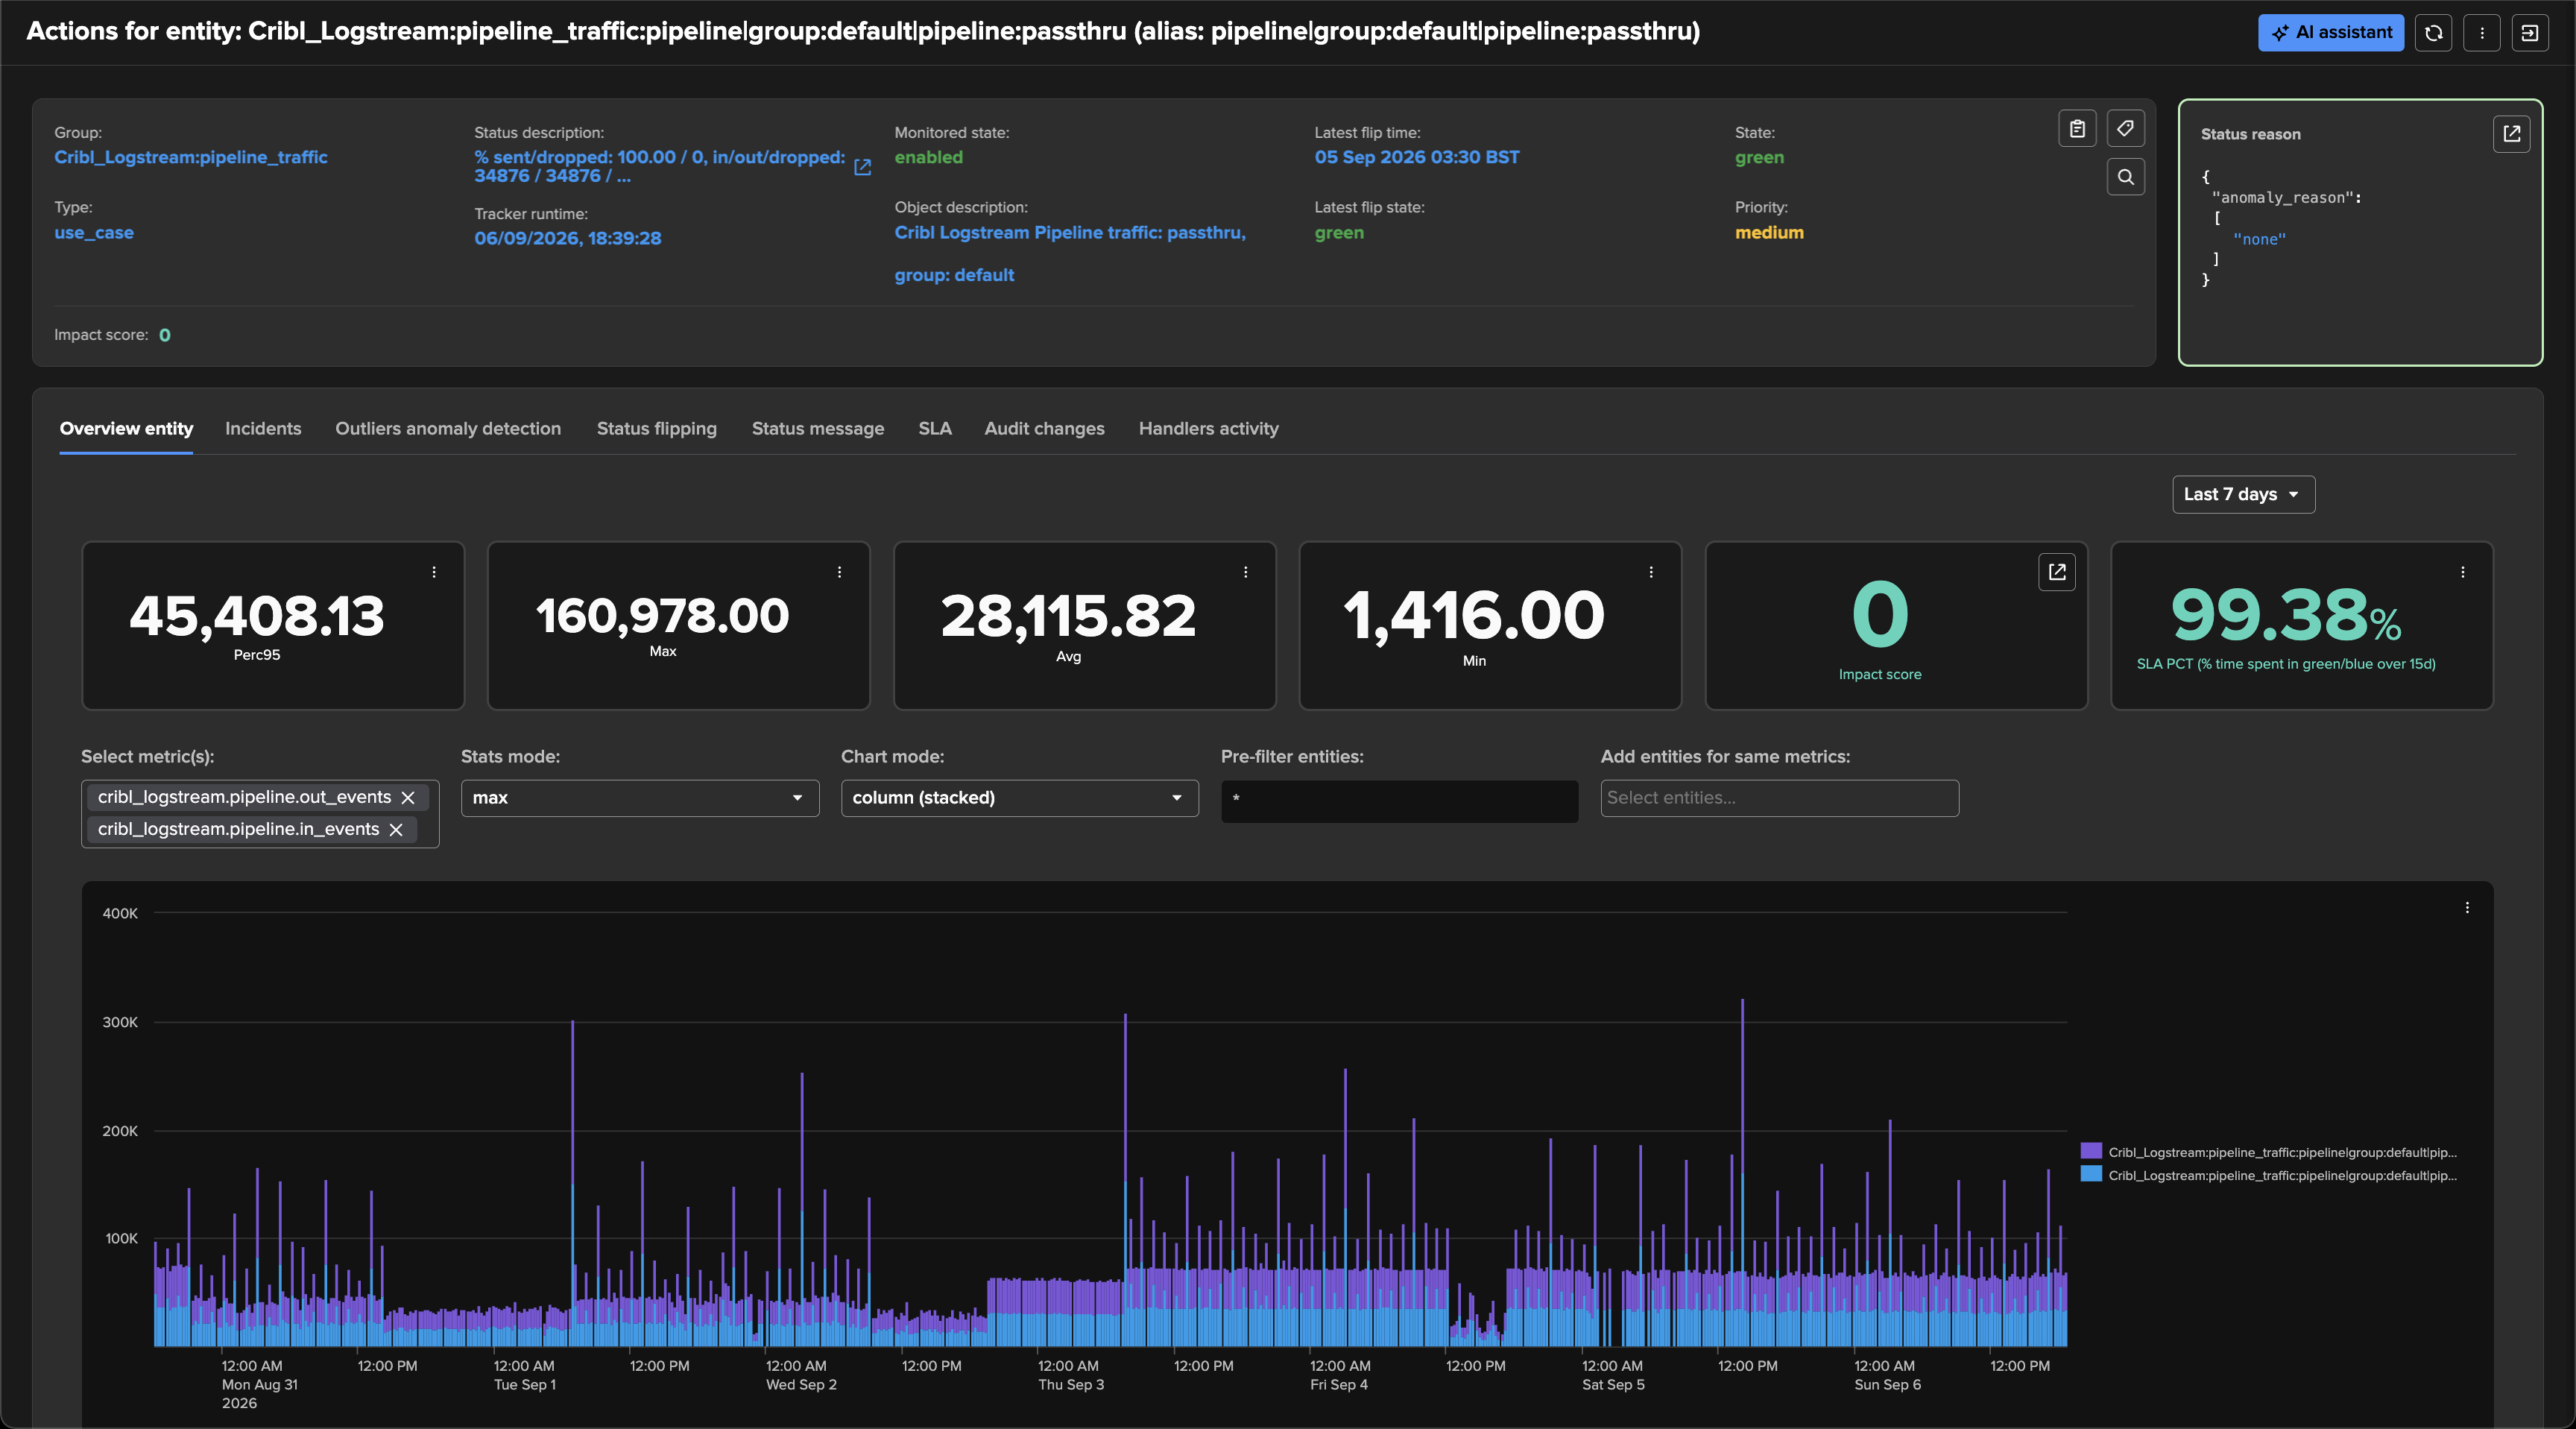
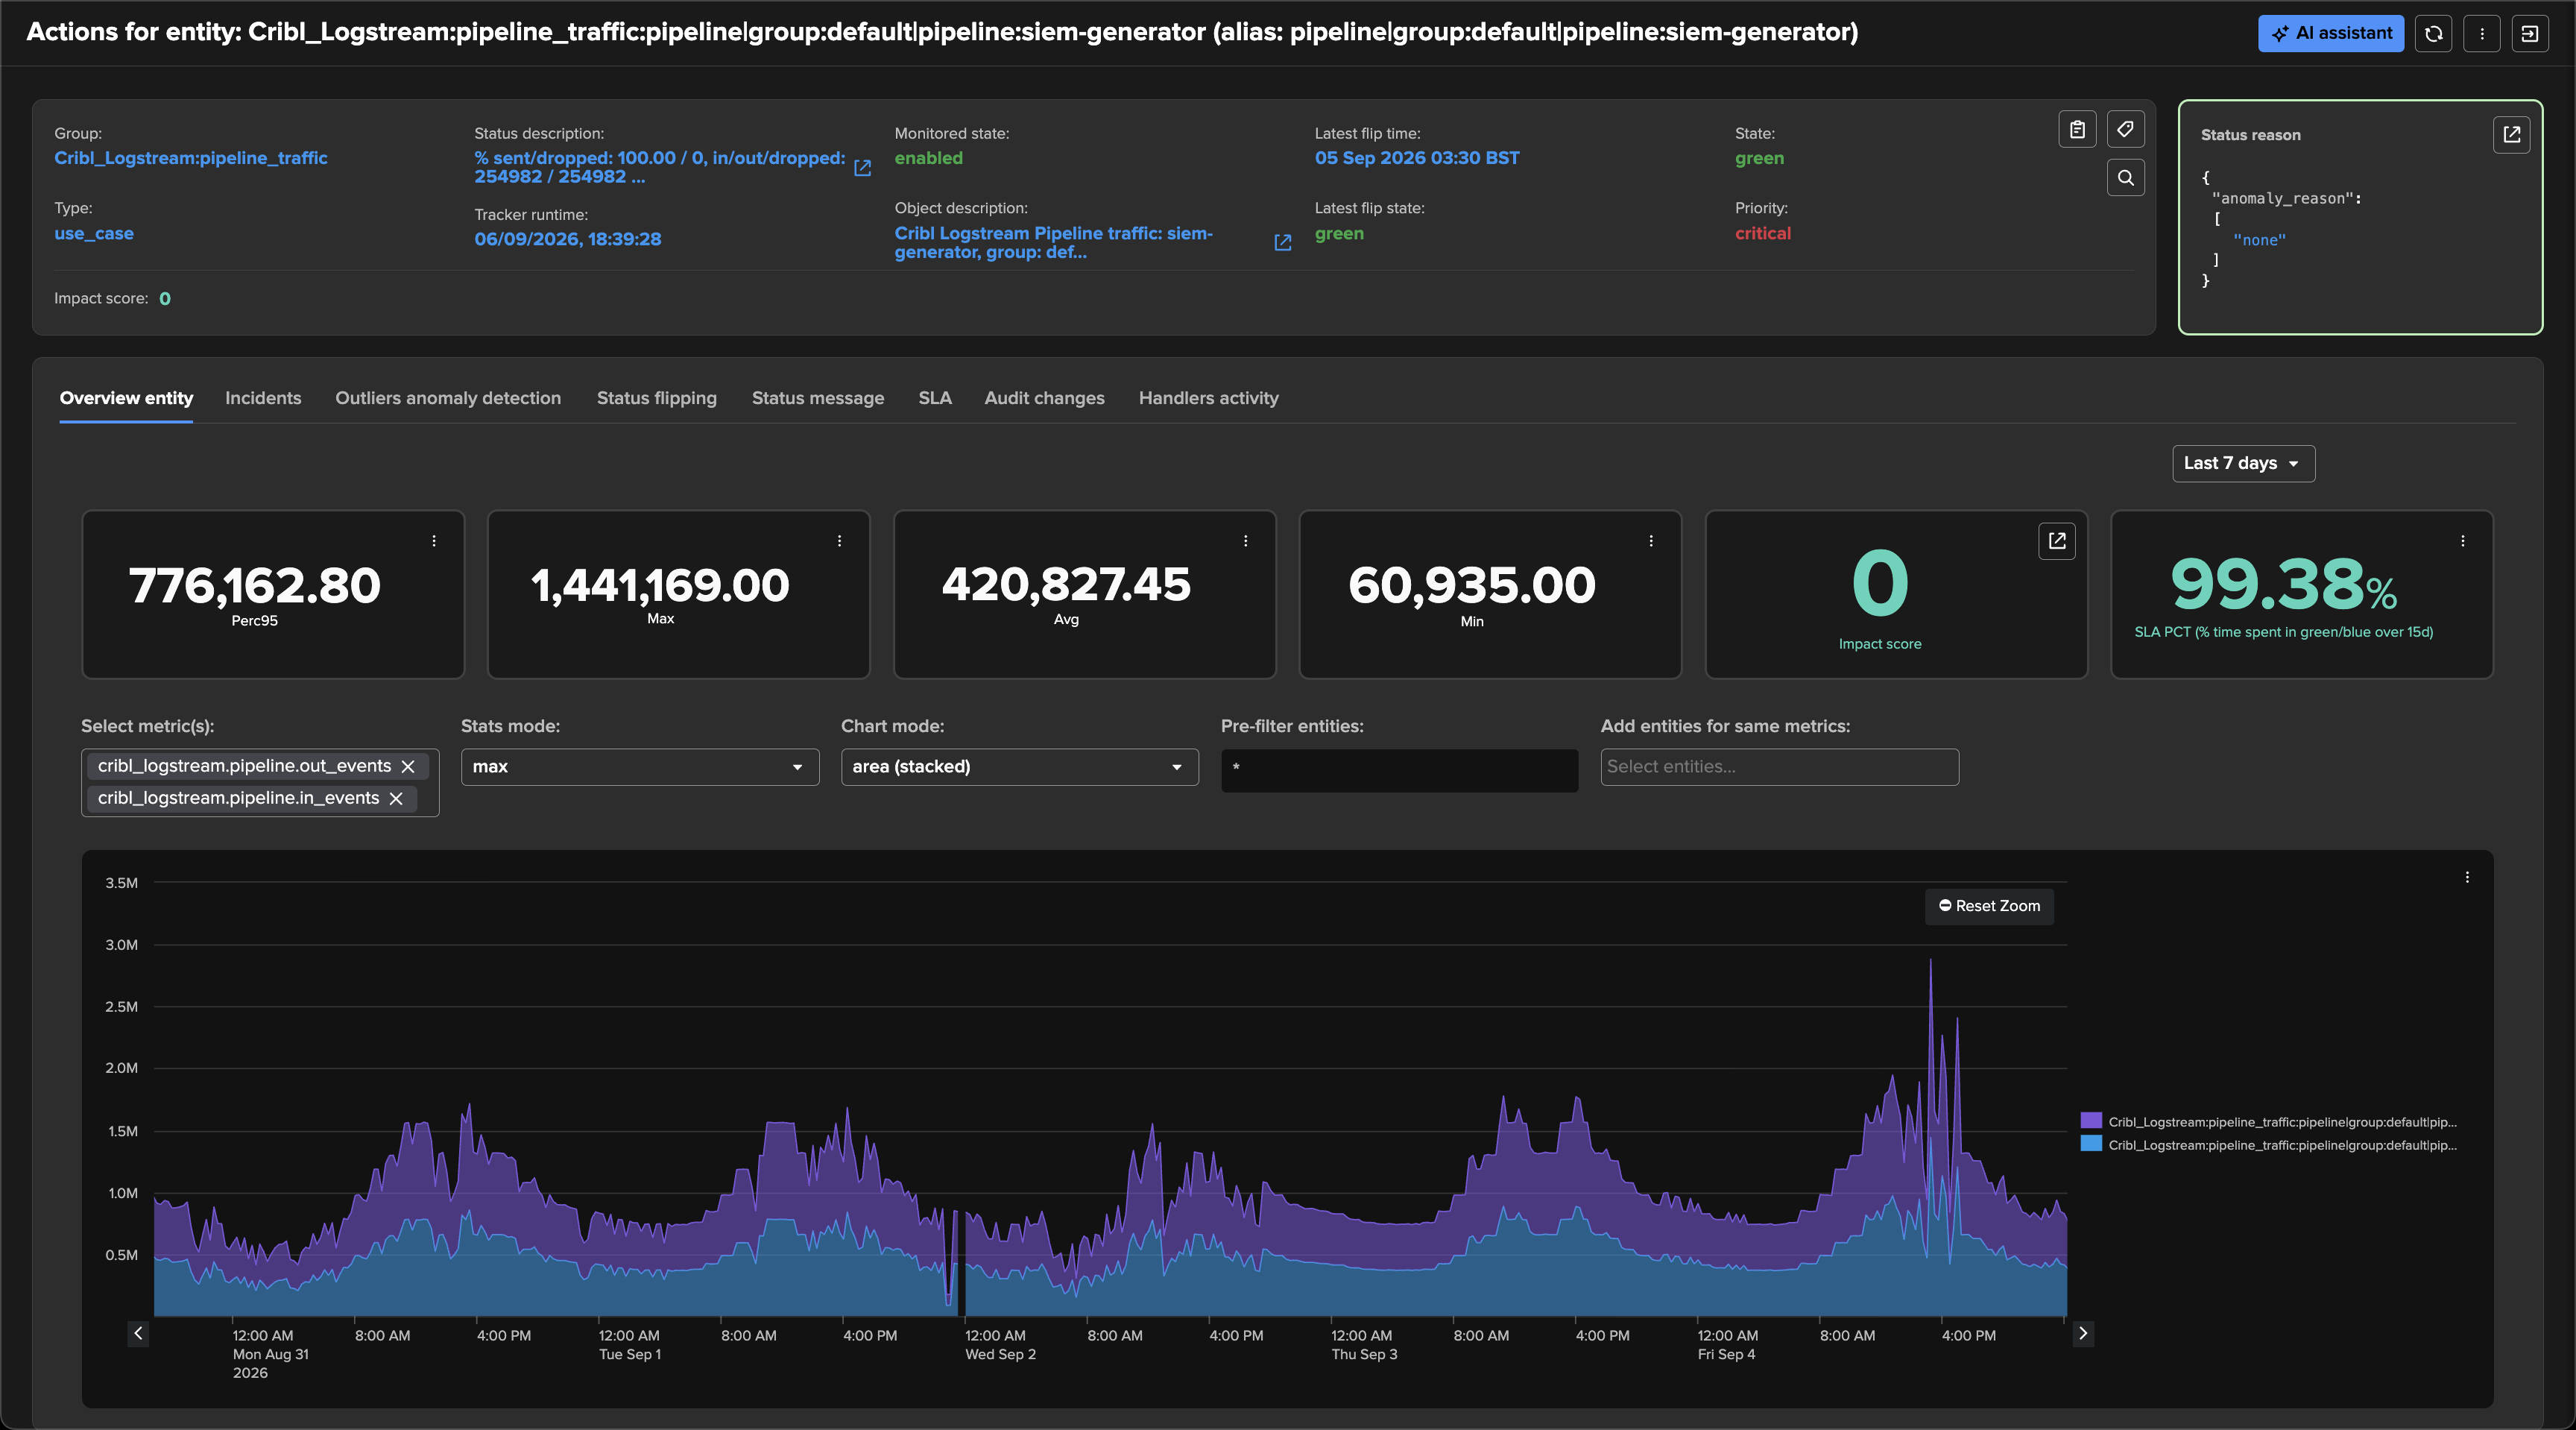
Open an entity for the full picture. The Overview tab charts any metric of the use case over the period you choose — here the events in and out of a pipeline over seven days, as stacked columns or areas — alongside the entity’s state, impact score and SLA percentage:
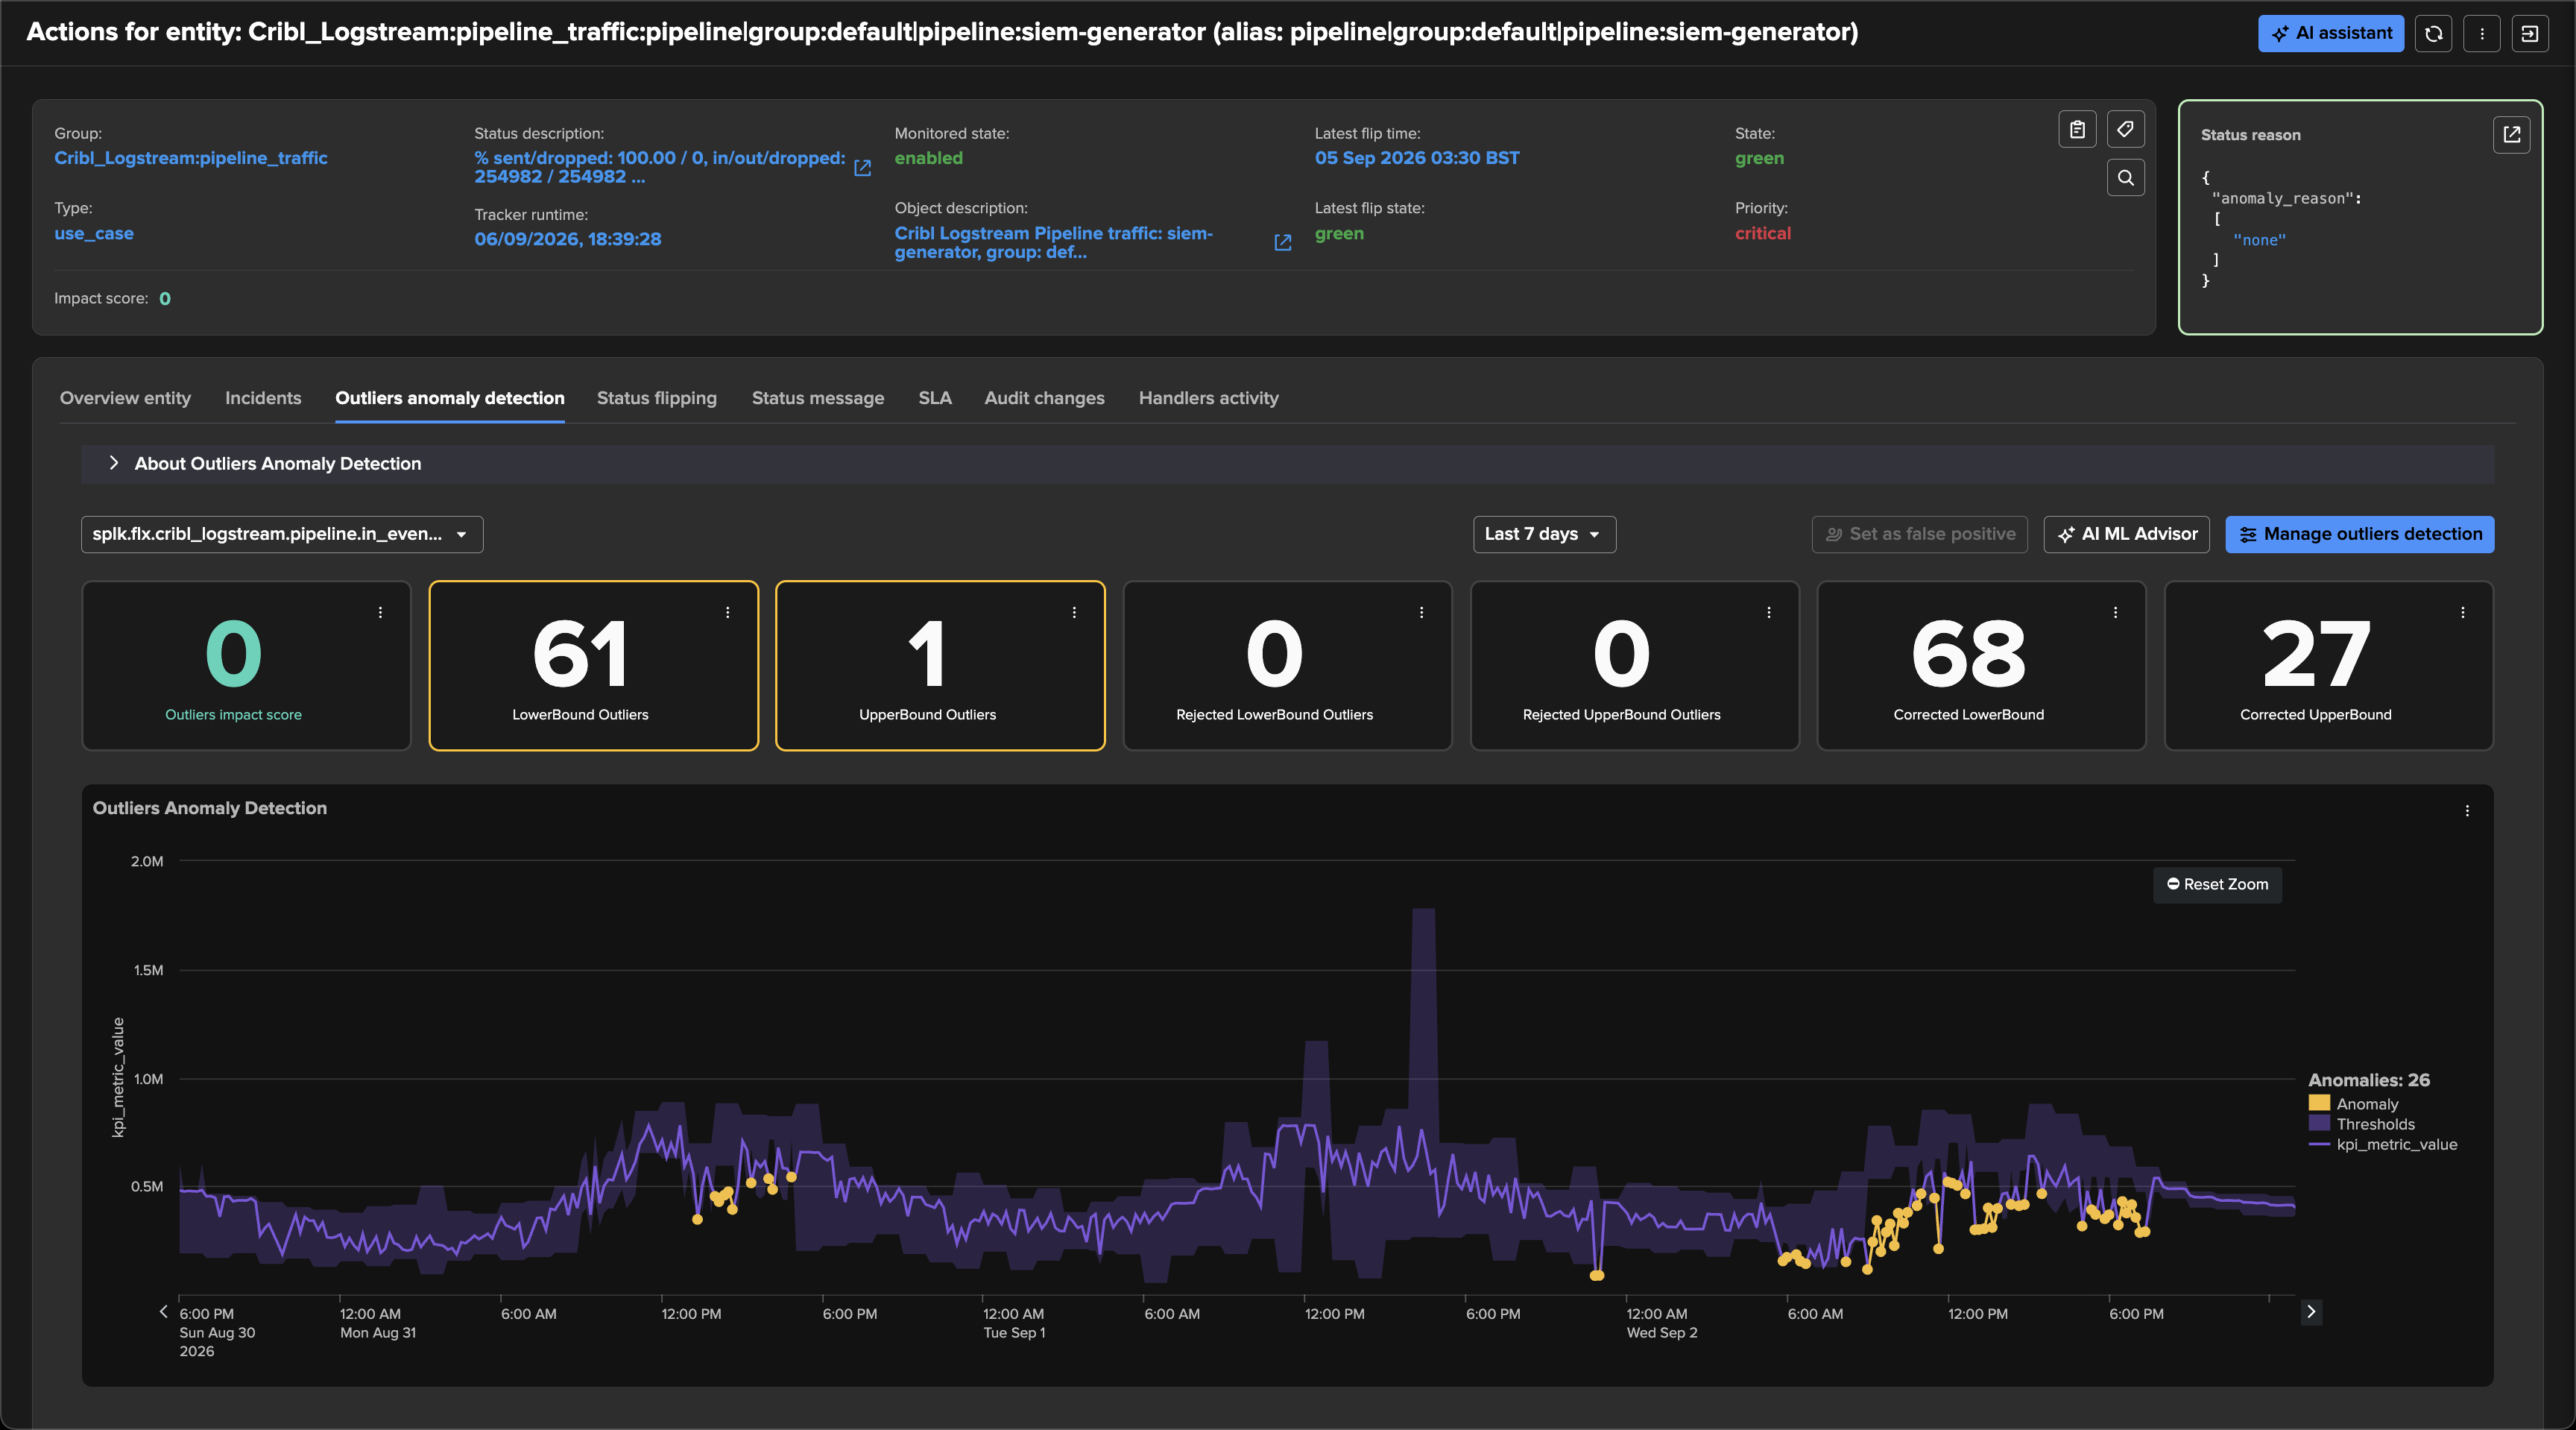
For the traffic use cases, the Outliers anomaly detection tab shows the model learned on each metric: the expected band, the values that breached it, and the counters of accepted, rejected and corrected outliers. This is where a pipeline that suddenly floods or goes quiet is caught, without a threshold anyone had to write — and where you tune the model, mark a false positive, or ask the AI ML Advisor for a second opinion:
From here the entity behaves like any other: adjust thresholds, tune outlier detection, set a priority, attach it to an SLA, or put it into maintenance.
A living map: Cribl Stream in Topology Studio
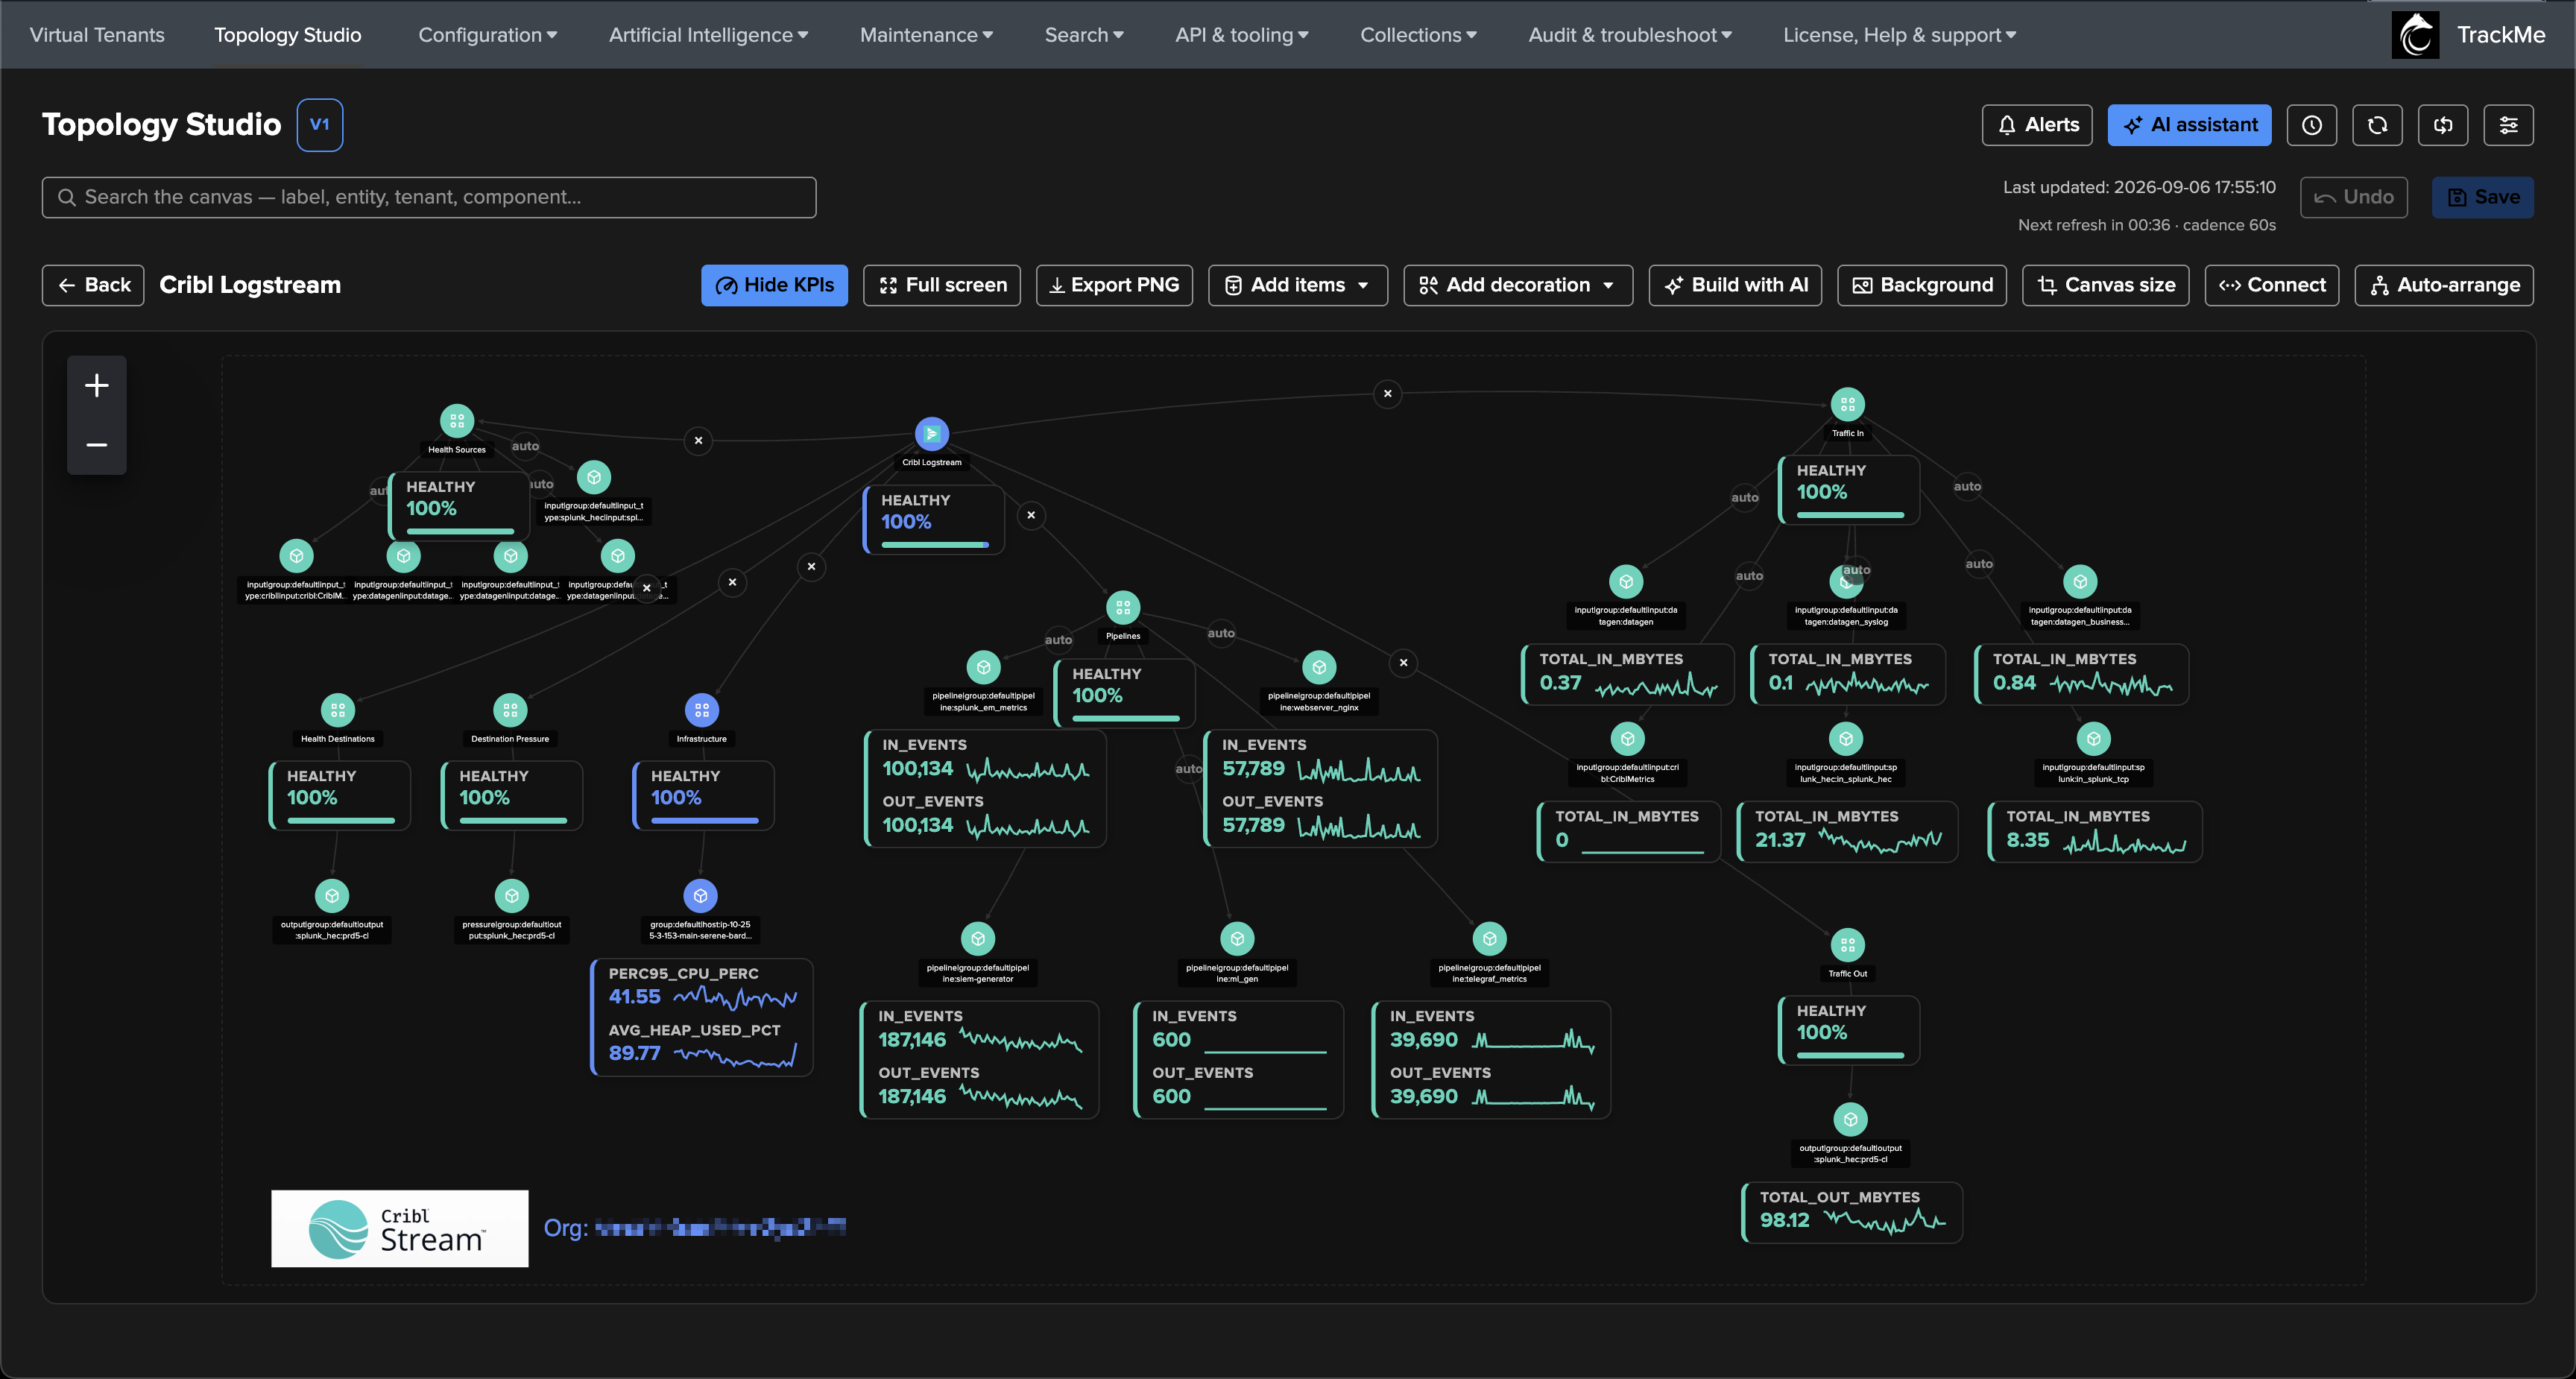
Entities tell you which pipeline is unhappy; a topology tells you what that means for the flow. The view above is eight aggregates and seven edges, built entirely from the Cribl entities of one tenant:
a root aggregate, Cribl Logstream, scoped to the tenant’s Flex component and filtered on
priority IN ("high", "critical")— it folds every important Cribl entity into one node and shows the healthy percentage of the deployment;one aggregate per entity group — Health Sources, Health Destinations, Destination Pressure, Infrastructure, Pipelines, Traffic In, Traffic Out — same scope, same priority filter plus an object pattern that selects the group, for example
priority IN ("high", "critical") object="*pipeline_traffic*";auto-generated members on every group aggregate, so each pipeline, input, output and host is its own node, with default member KPIs in the sparkline style turning the entity metrics into on-canvas trends:
in_eventsandout_eventsfor pipelines,total_in_mbytesfor inputs,total_out_mbytesfor outputs,perc95_cpu_percandavg_heap_used_pctfor hosts;edges from the root to each group so the map reads top-down, and one edge from Infrastructure into the root with impact propagation enabled: a worker host in trouble repaints the whole deployment, because nothing flows without the hosts;
a fixed canvas size (3000 × 1300) for a stable presentation, plus the Cribl Stream logo and the organisation name as decorations.
Because membership is dynamic, a pipeline added on the Cribl side appears on the map on the next refresh, with its sparklines, without anyone editing the view.
When something degrades, the map reads itself: below, one pipeline turned red on an outlier, the Pipelines aggregate dropped to 80% healthy, the root re-classified to 95% and a worker host went blue — all visible at a glance in full-screen mode, with the selected host’s live metrics in the inspector.
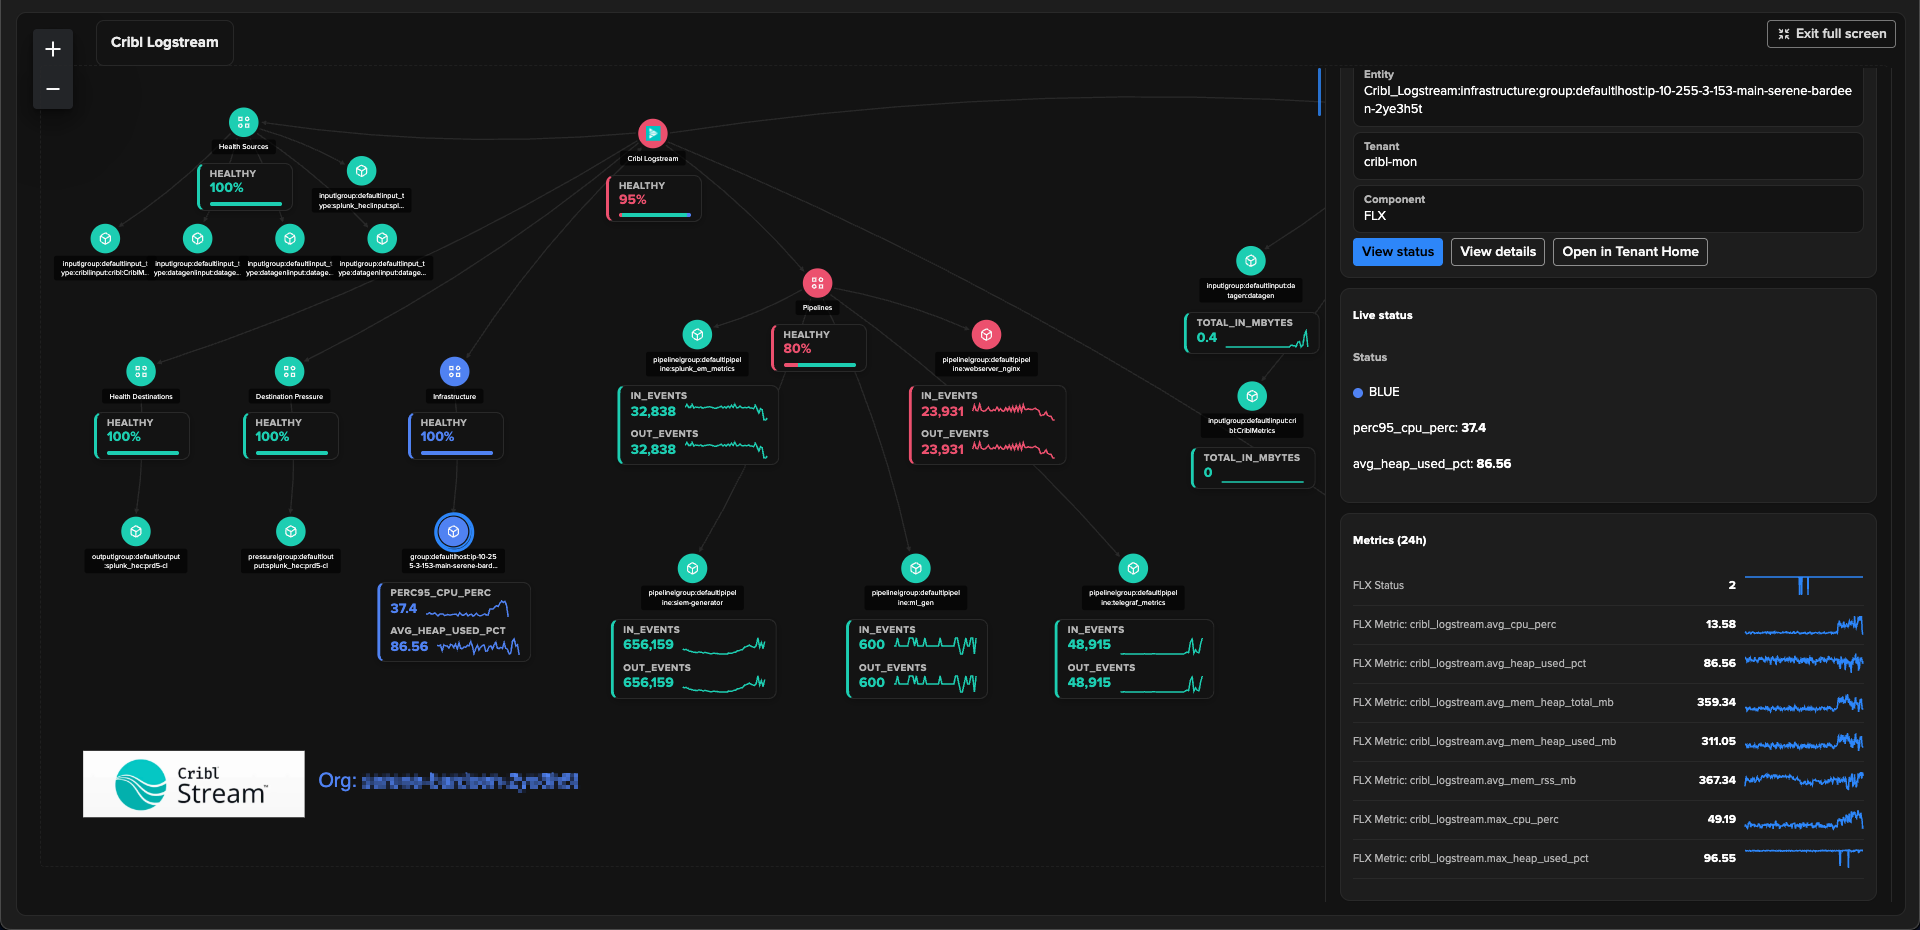
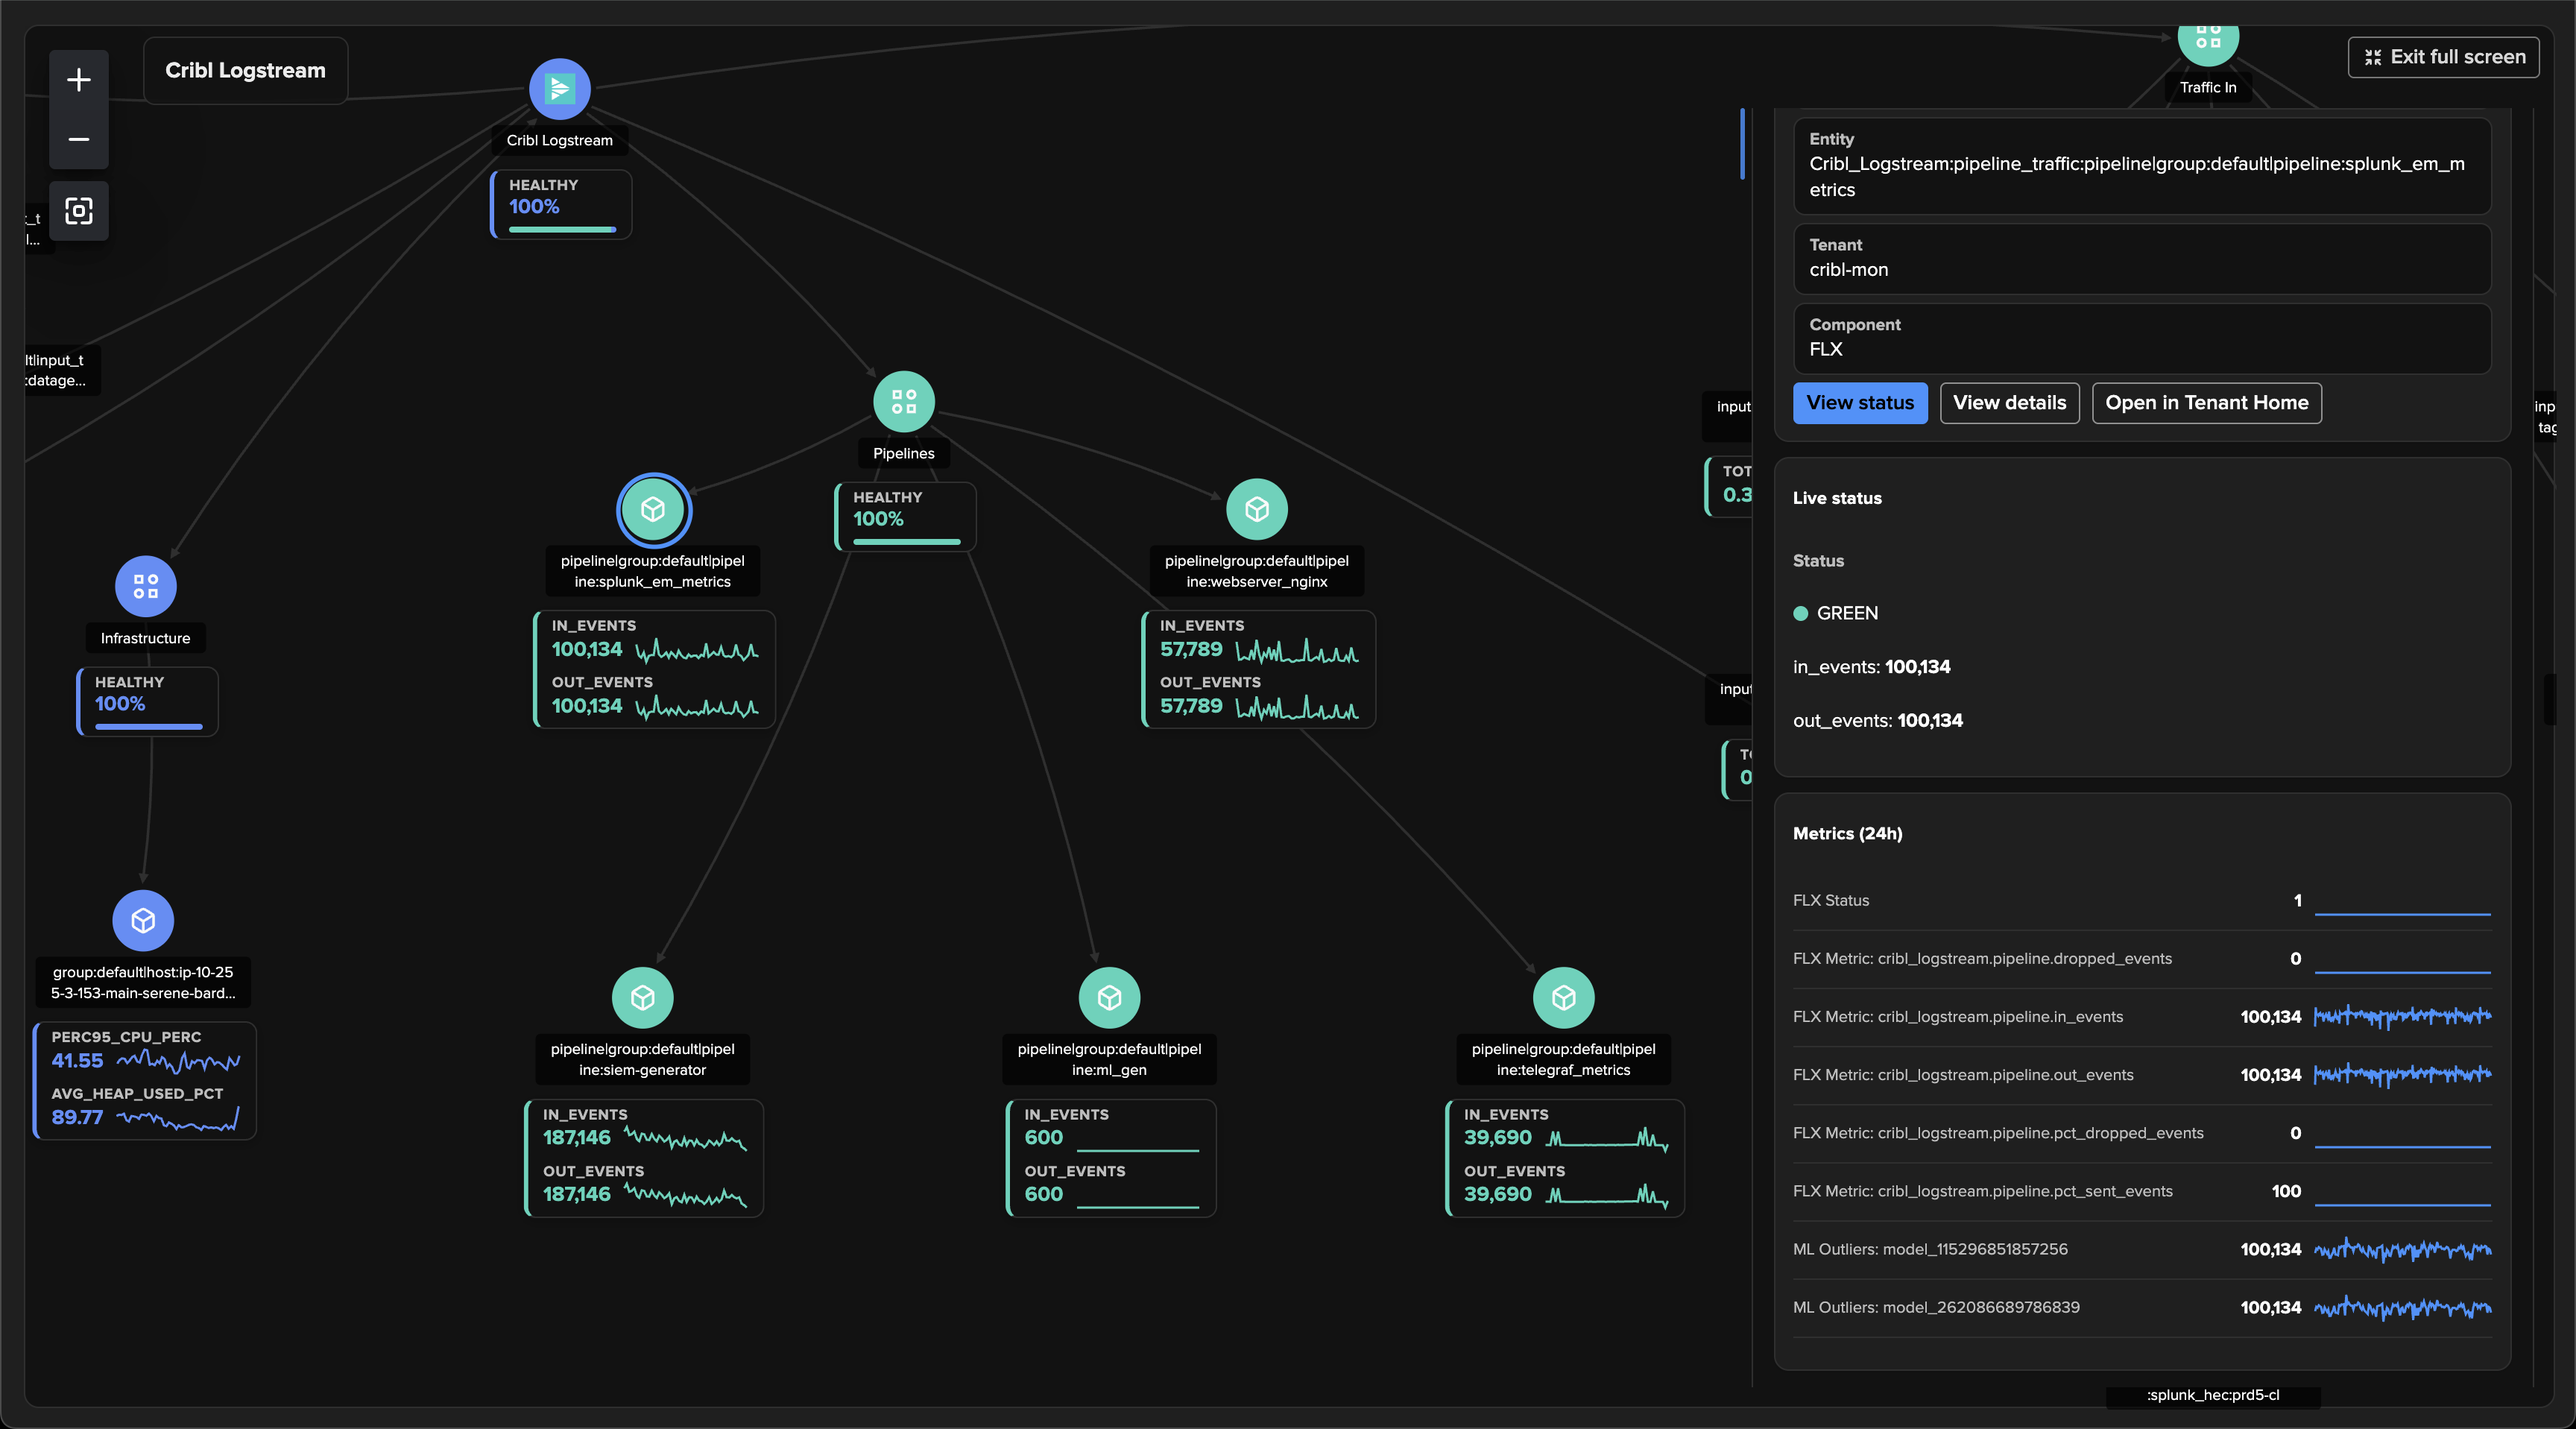
Selecting a pipeline node shows the same entity the tracker maintains — its state, its live in and out events, and the 24-hour history of every pipeline metric plus the ML outlier models — with View status, View details and Open in Tenant Home one click away:
To build your own, follow the end-to-end example with your Cribl tenant — the filters above are all you need — or describe the map to Build with AI: “one aggregate per Cribl_Logstream group of the cribl-mon tenant, high and critical priorities only, pipelines and inputs expanded with their traffic KPIs as sparklines” — and refine the draft. Then add a Topology Alert on the view: one alert covers the whole Cribl deployment and its email embeds the rendered map.
See also
FLX — Flex Objects — the Flex component and its template library.
Machine Learning — tuning outlier detection on the traffic use cases.
Remote Splunk deployments — monitoring Cribl metrics that live on a remote search head.
Cribl Stream & Edge API — the Cribl Stream & Edge API add-on.