User Activity Monitoring
TrackMe has always watched the data. User Activity Monitoring watches the other half of a Splunk platform: the people and the automation that use it. It answers a question none of the entity components asks — who is doing what on my Splunk? Which accounts run searches, how often and at what cost; which scheduled searches are owned by a person who may leave tomorrow; which account started to run all-time searches; who consumes the search capacity of the platform; whose CSV lookups keep growing.
A User Activity Monitoring tenant (UAM) reads what Splunk already keeps — the audit trail, the search resource records and the knowledge objects of every search head — and turns it into findings: one finding per policy and subject, with its evidence, a severity, an investigation status, an assignee, notes and a history. You investigate, decide, notify the people concerned and move on.
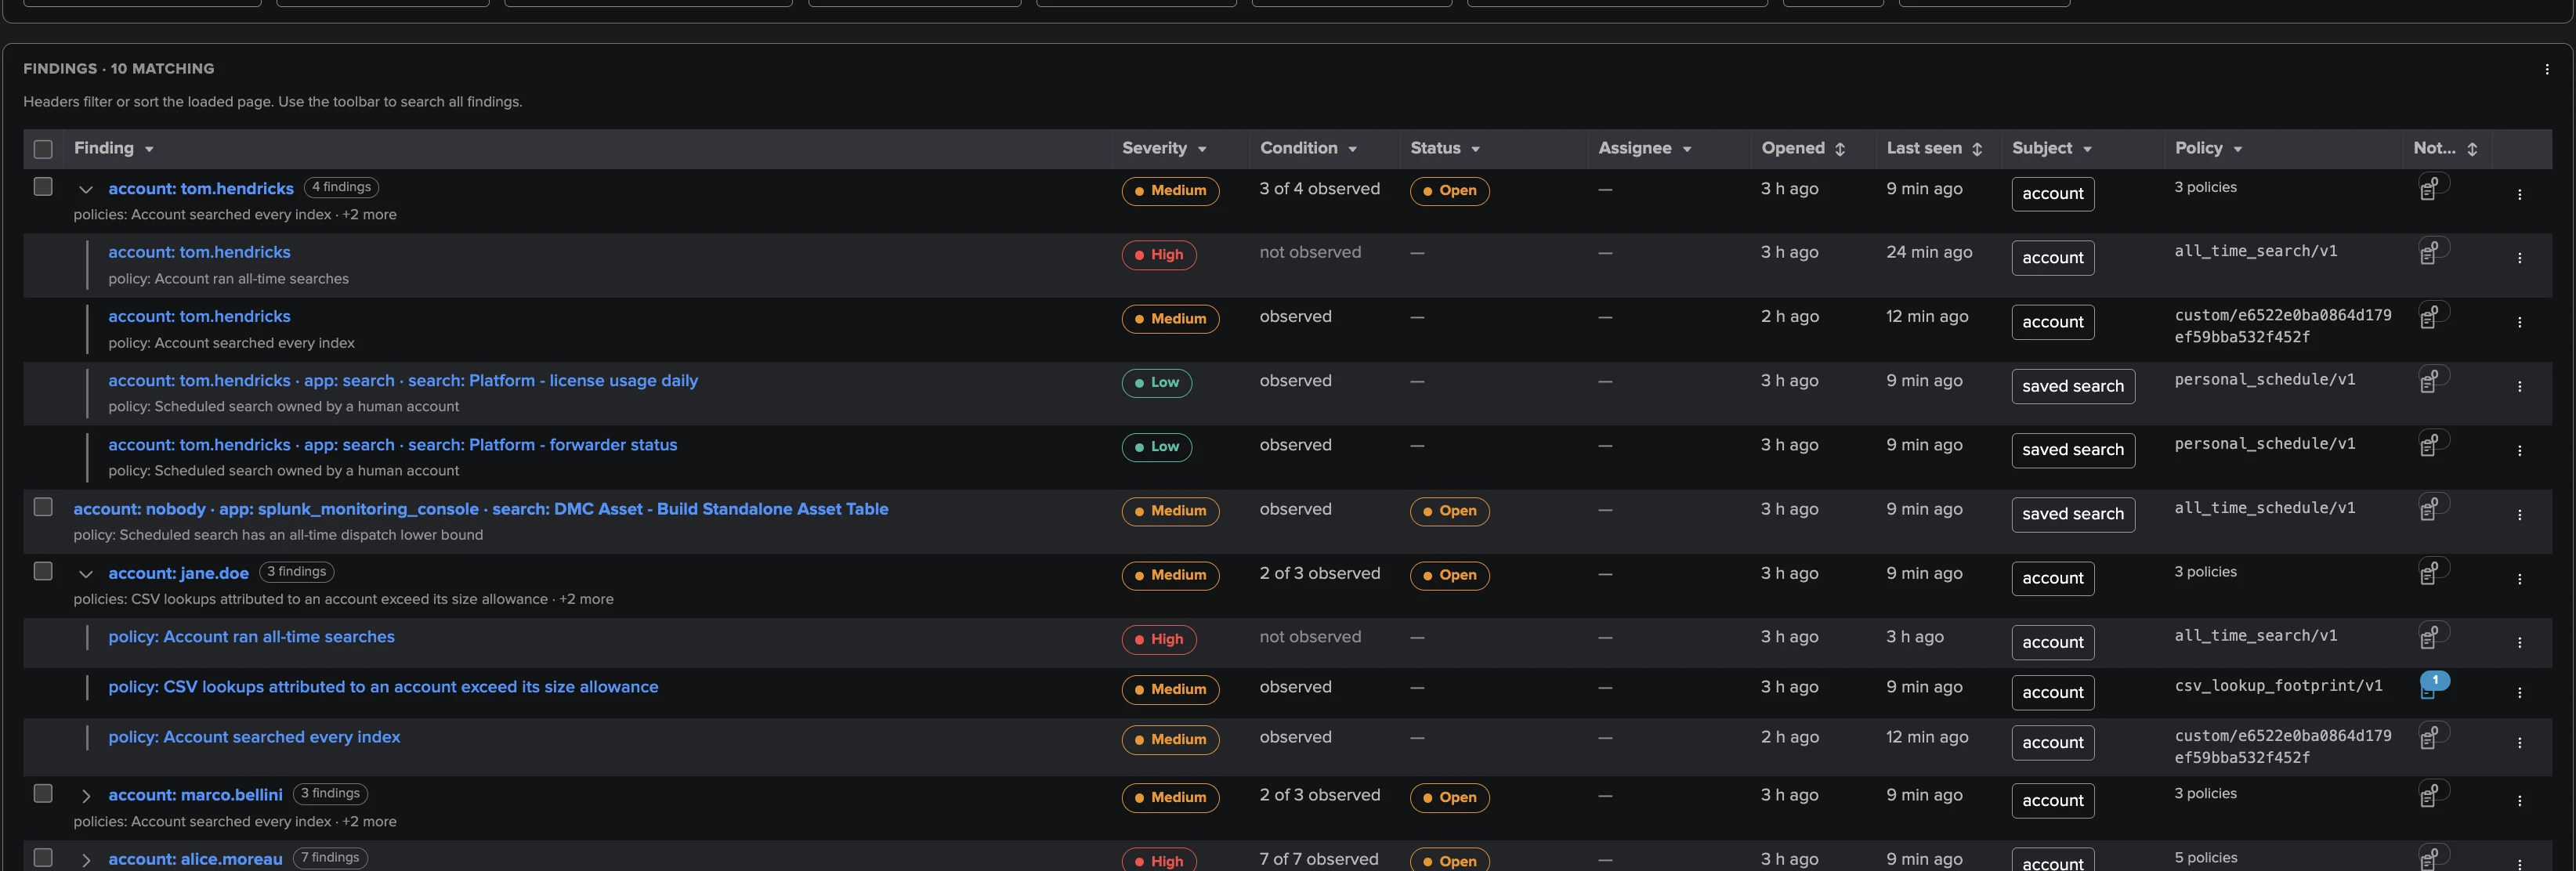
UAM is a dedicated tenant type, not an eighth entity component: a tenant is either an entity tenant (DSM, DHM, MHM, FLX, FQM, WLK, VOL) or a UAM tenant, never both. There is no decision maker, no impact score and no state colour behind it: what you work with are findings. UAM shares its findings model — Finding groups, triage, assignment, notifications, findings actions, the AI Agent — with Cribl Stream and Cribl Edge; those concepts are explained once in Findings, Finding groups and findings actions, and this page documents how they work in UAM.
Tip
This page is the task-oriented guide: set the tenant up, find your way in the workspace, triage, communicate and tune. Every setting with its default and bounds, the schedules, the indexed evidence, the REST API and the troubleshooting table are in User Activity Monitoring — reference.
What UAM watches
One UAM tenant monitors one indexing layer seen through one to ten search head tiers: the local search head and / or remote Splunk deployments reached through TrackMe remote accounts, on Splunk Enterprise or Splunk Cloud.
What |
What UAM knows about it |
|---|---|
Accounts |
Every account seen in the users inventory or in the search activity — people, service accounts and Splunk’s own system identities — with its class (human, service or system), its roles, the tiers it exists on and its email address when Splunk has one. |
Search activity |
One compact audit record per search and collection window, read from |
Resource usage |
The CPU time and peak memory of every search, on the search heads and on the indexers, and each account’s share of the environment’s search capacity. CPU follows Splunk’s own accounting where it exists. |
Saved searches |
The saved-search inventory of every tier: owner, app, schedule, dispatch time range, enablement, and every change (added, changed, removed). |
Other knowledge objects |
Dashboards, macros, event types, field extractions and transforms, field aliases and calculated fields, lookup definitions, automatic lookups, CSV lookup files (size, owner, modification time — never their contents) and tags, read from the Splunk REST API of each tier. |
Findings |
What the policies raise: twelve built-in policies and the custom policies you write in SPL. |
Note
What UAM claims, and what it does not.
An account in UAM is the account reported by Splunk: it is not a verified person. Shared credentials or an integration running as a person’s account look like that person.
Collection is bounded and resumable. Gaps and partial coverage are recorded and shown in Collection health, never hidden.
There is no machine learning in UAM: thresholds are explicit, and the daily CPU baseline is a percentile over the account’s recent days.
UAM never changes, dispatches or deletes anything it observes. A decision on a finding stays in TrackMe.
Before you start
A licence beyond Foundation. UAM is available with the Enterprise and Unlimited editions, the Unlimited trial and the Developer licence. It is not available on the Foundation edition or the Foundation trial. When a licence expires, the workspace stays readable while changes are refused, and scheduled collection continues until the licence enforcement ladder stops the tenants.
The Splunk sources. UAM reads _audit (search activity), _introspection (search
resource records and capacity) and the indexers’ search completion records (CPU accounting),
through one search head tier called the route account. Splunk Enterprise 10.4 and Splunk
Cloud 10.5 are qualified; other versions run as well and only add a soft diagnostic in
Collection health. Two things to know:
The automatic detection of service accounts relies on the classic
key=valueformat of the_auditlines. A deployment whose_auditonly contains the JSON format gets no automatic service detection (human detection and your own rules still work).What UAM can look back on is bounded by the retention of these indexes.
_introspectionis often kept for a shorter time than_audit, so resource history may end earlier than audit history.
Remote tiers. Each additional search head tier is a TrackMe remote account (Configuration → Remote accounts, see Remote Splunk deployments). The wizard tests each one. Live reads you make from the workspace as yourself — Fetch SPL, Fetch definition — also need your roles to be allowed on that remote account.
A tenant owner. Scheduled collection runs as the tenant owner. Prefer a dedicated
service account (svc-a in the examples of this page) over nobody: the scheduled UAM
AI Agent cannot run as nobody or splunk-system-user.
Who can use it. UAM evidence is audit data, so the workspace is for the TrackMe administrators of the tenant — accounts holding the TrackMe administrator capability and one of the tenant’s admin roles; Splunk administrators can do everything on every tenant. Power users of the tenant have read access through the REST API (and can send user communications and run findings actions through it); read-only users have no UAM access.
Email delivery (optional). Notifications and communications are sent through a TrackMe email delivery account (Configuration → Emails), or the local mail transfer agent when none is selected. The account’s allowed-domain rules apply.
Note
UAM indexes its evidence in the tenant’s summary index and its finding events in the
tenant’s notable index, as trackme:uam:* events. This evidence counts against your
Splunk licence like any TrackMe summary data; it is compact by design (one record per
search and window). Some indexed fields of these events take effect after the splunkd
restart that follows the app installation or upgrade; until then, reads fall back to
slower searches.
Create the tenant
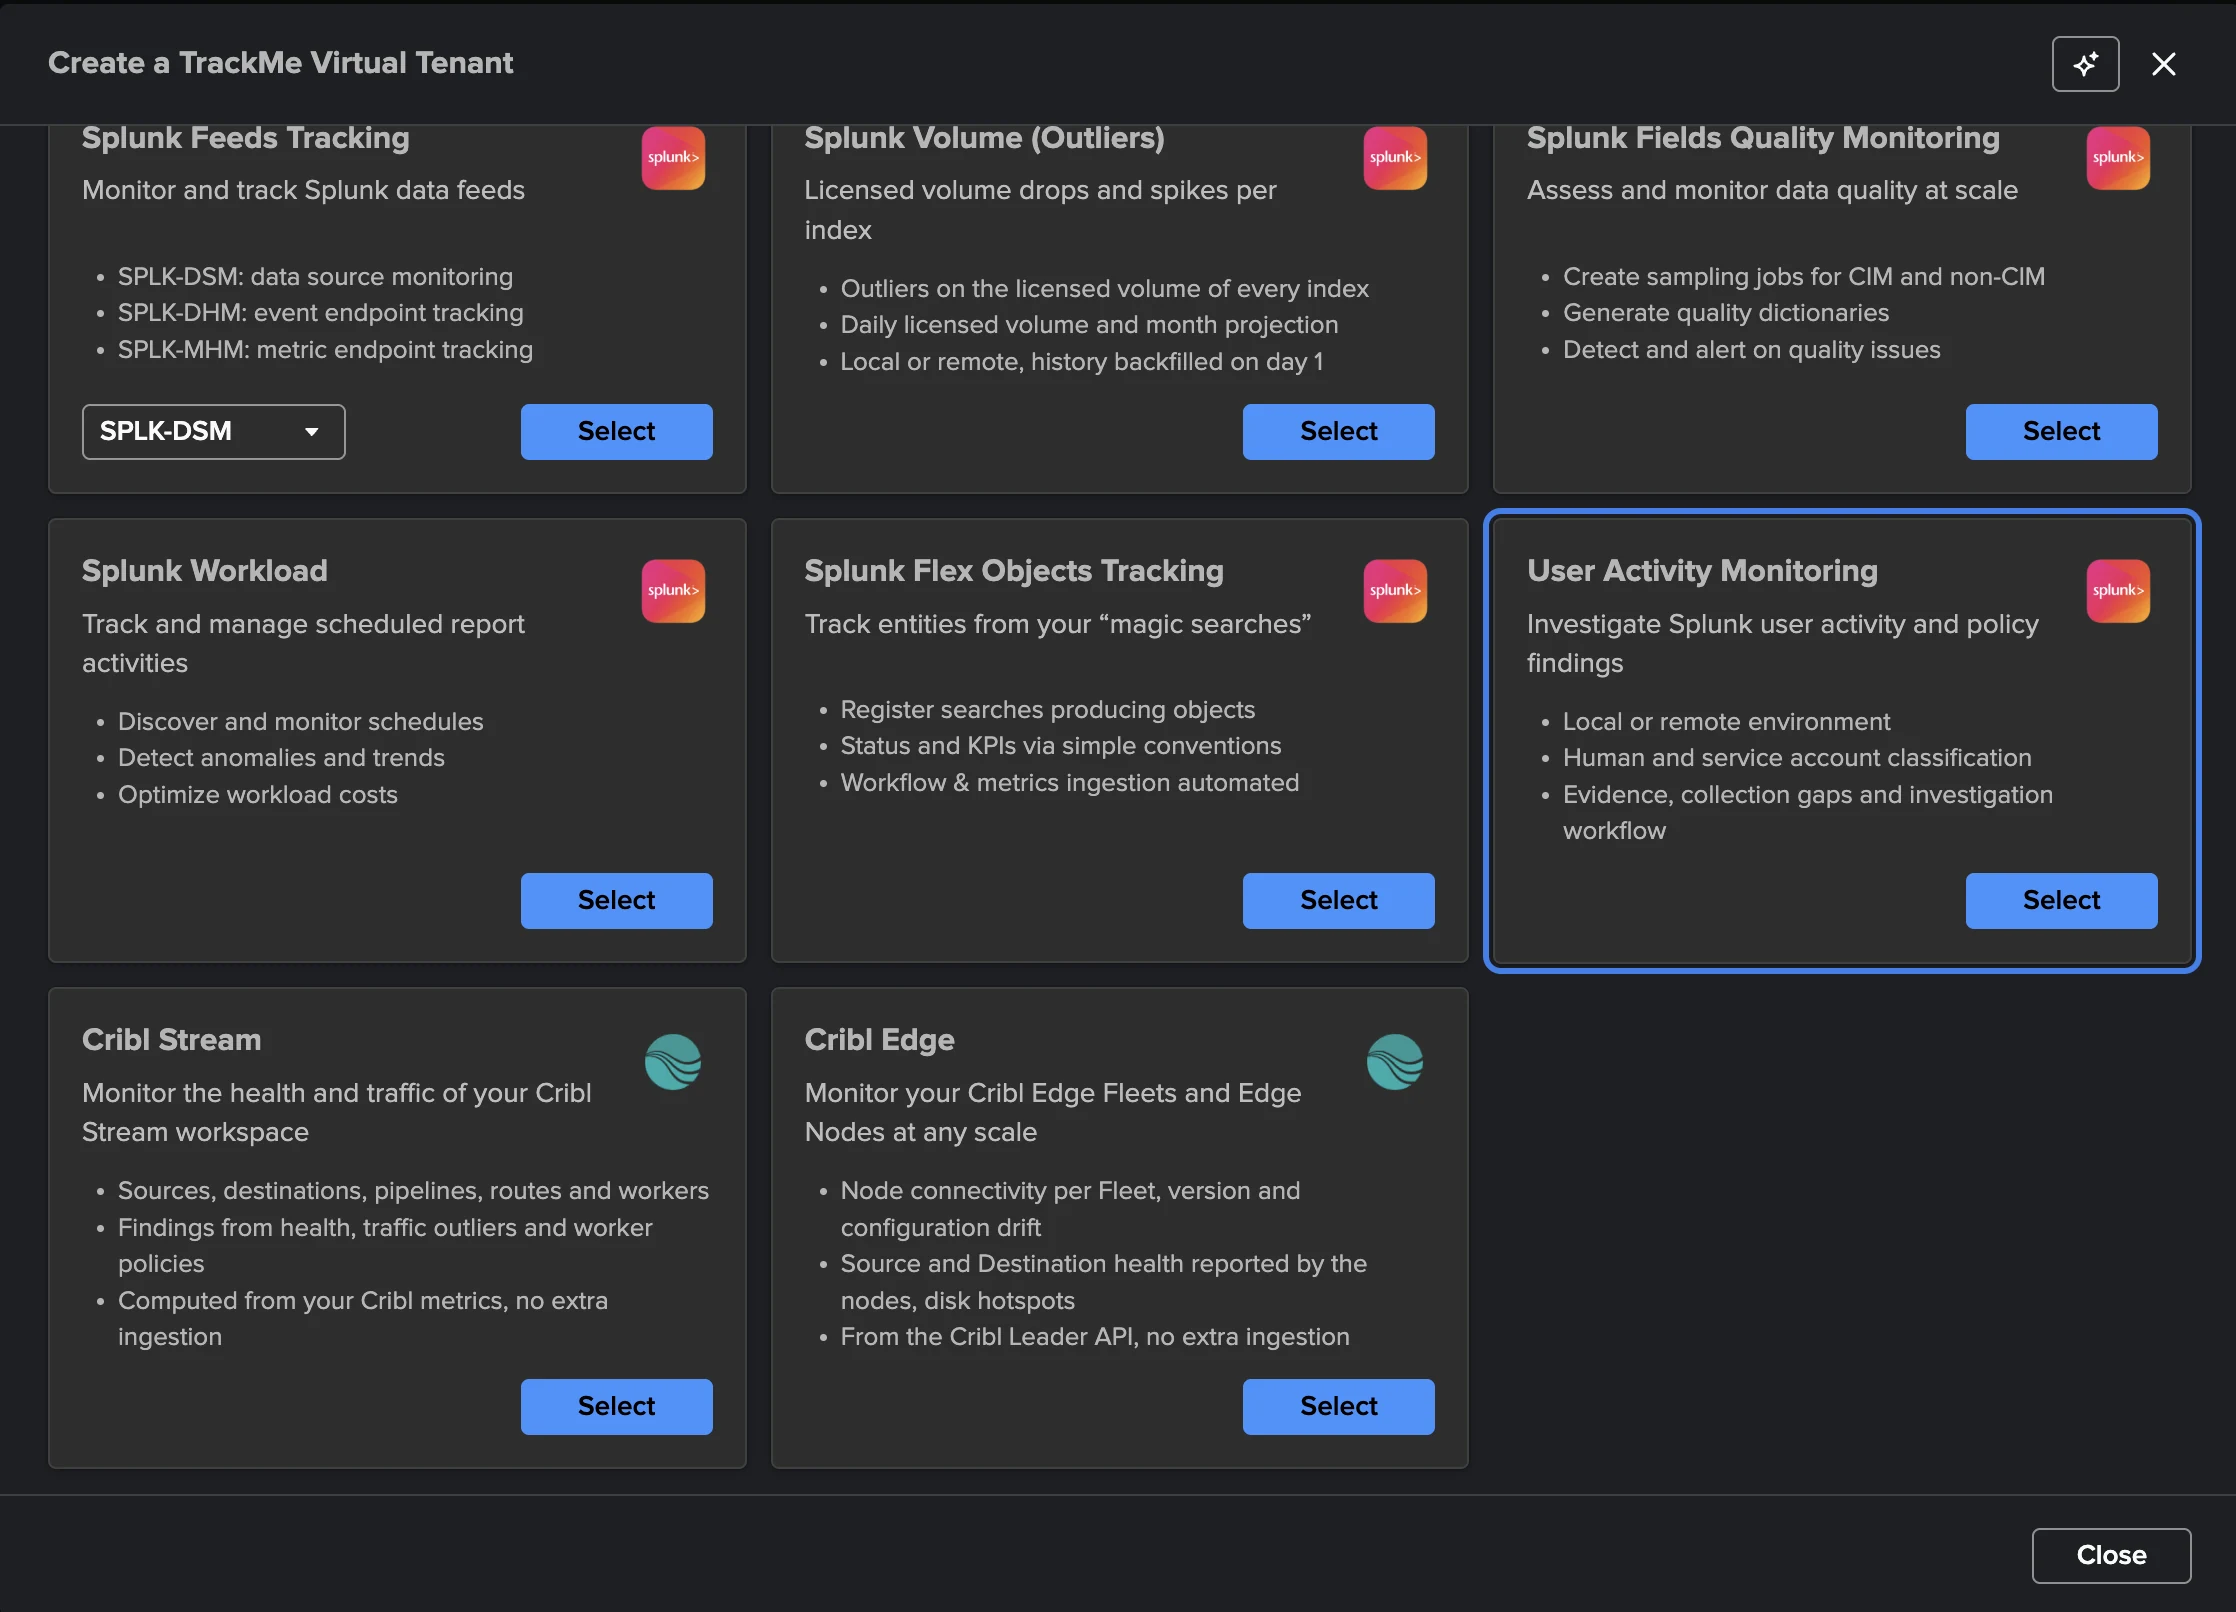
From the Virtual Tenants page, open Actions → Create a tracking tenant and choose the User Activity Monitoring card (Investigate Splunk user activity and policy findings). The wizard has four steps.
Step 1 — Basics
The tenant identifier (lowercase letters, digits and hyphens, up to 20 characters; it cannot change later), an optional alias shown on the tenant card and an optional description.
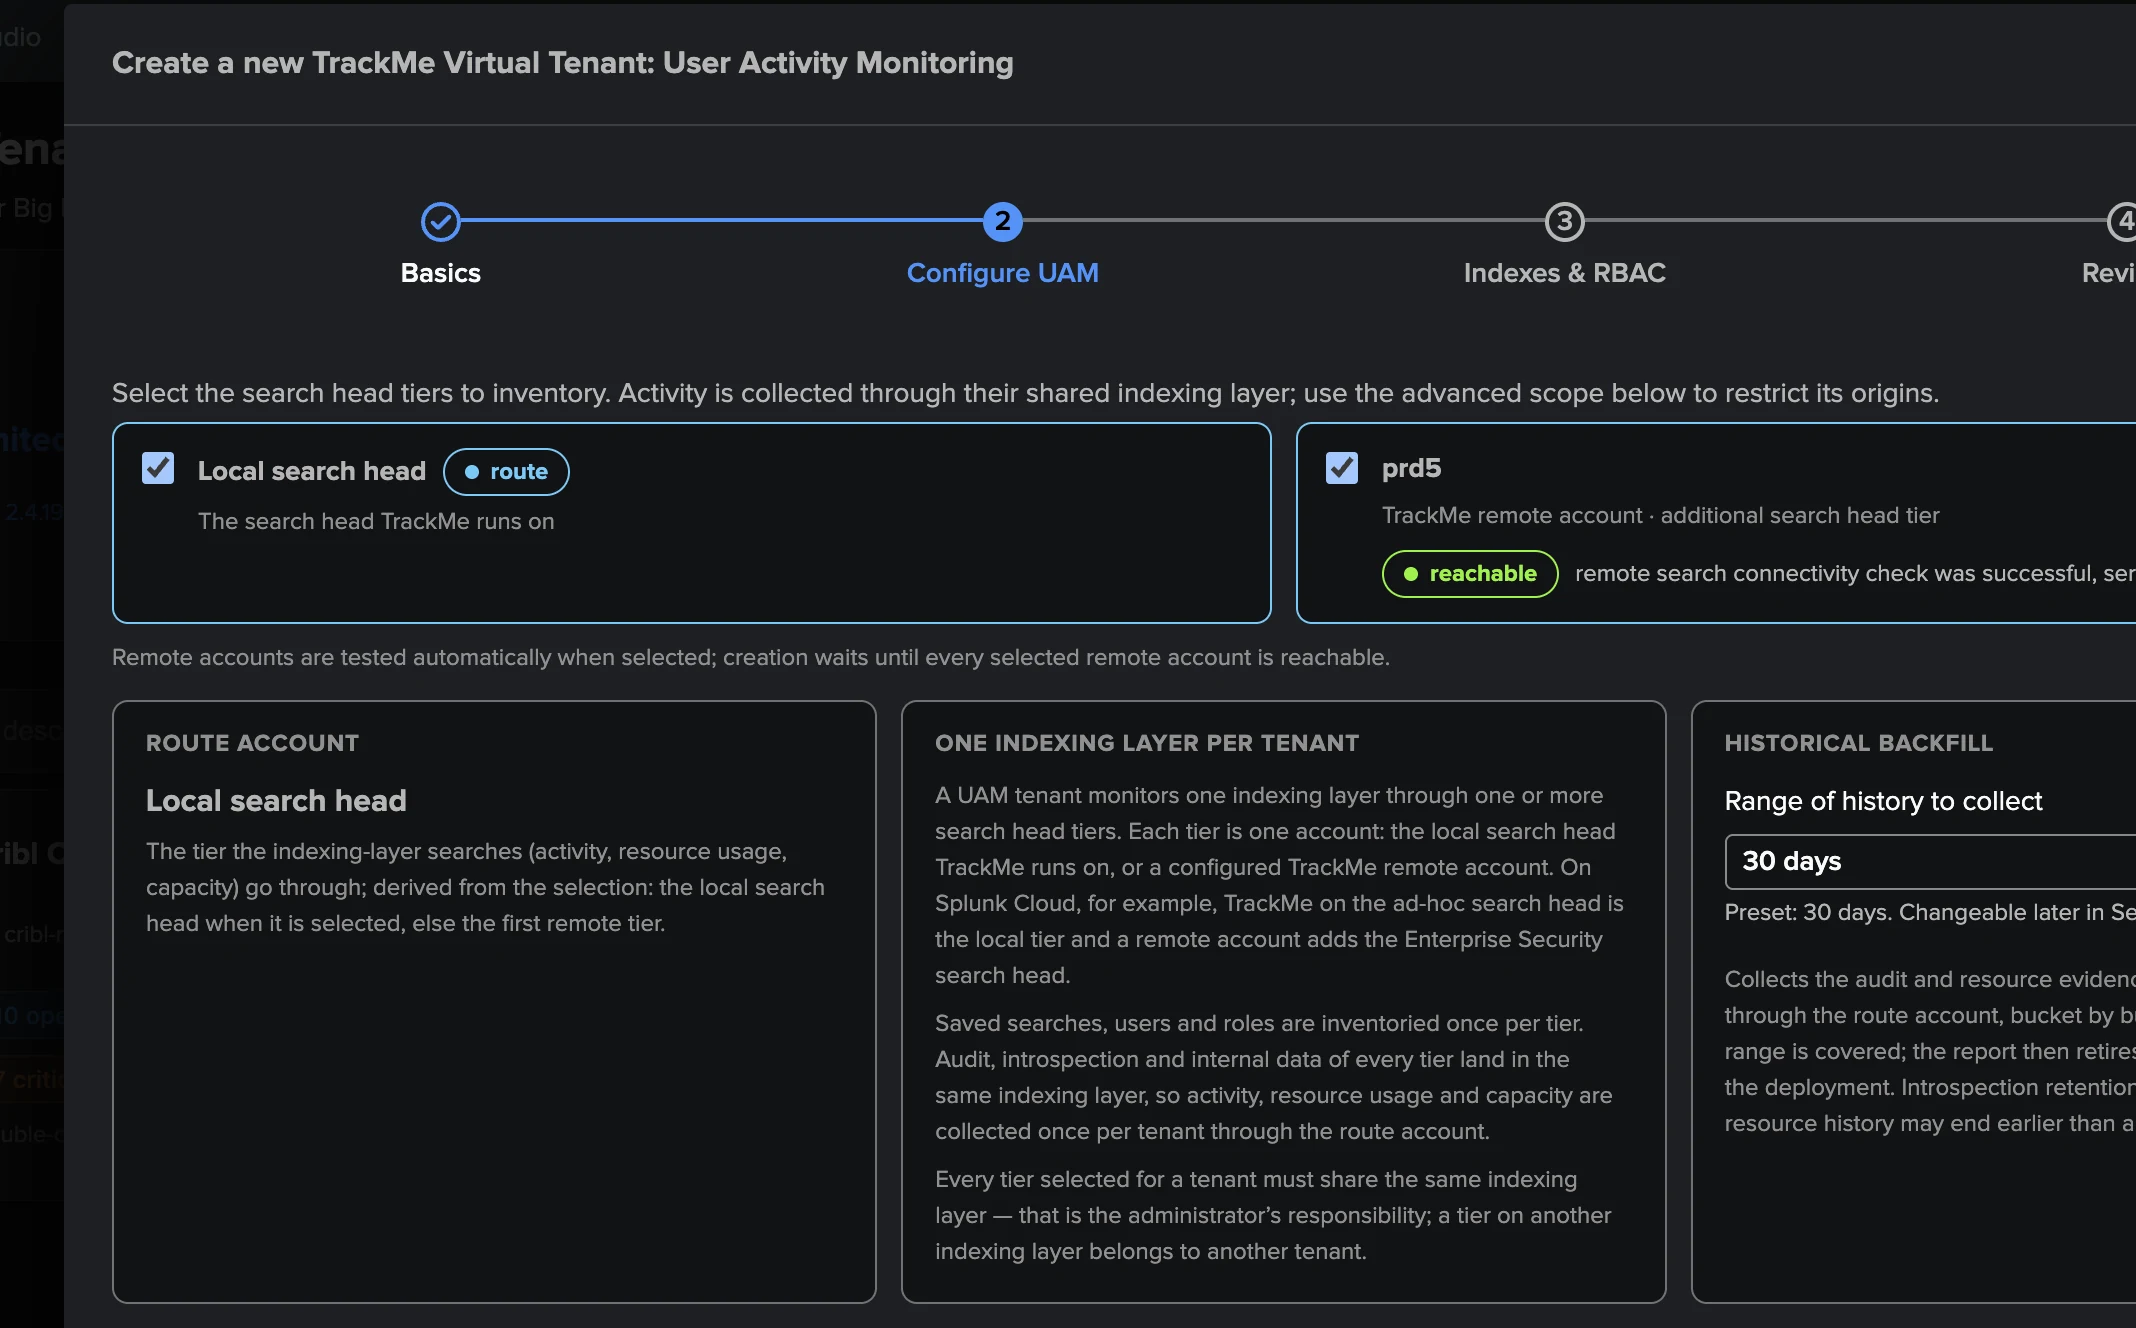
Step 2 — Configure UAM
Search head tiers. Local search head is selected by default; each TrackMe remote account can be added as another tier, up to ten. Select every search head tier that shares the indexing layer you want to monitor — for example an ad hoc search head cluster and an Enterprise Security cluster on the same indexers. Remote accounts are tested as soon as you select them, and creation waits until every selected one is reachable (Retry connection test if one fails).
Route account. Derived from your selection: the local search head when it is selected, otherwise the first remote tier. The indexing-layer searches — activity, resource usage, capacity — go through it, once for the whole layer, while the knowledge objects are read on every tier.
One indexing layer per tenant. All the tiers of a tenant must search the same indexers. Monitoring two independent deployments takes two tenants.
Historical backfill. How far back UAM collects the audit and resource evidence that existed before the tenant: No backfill, 7, 14, 30 (default), 60 or 90 days. The backfill runs hourly, newest history first, and retires itself once the range is covered or the retention of the sources is reached. It makes the account classification and the activity history useful from the first day.
Activity scope (advanced). Optional hostname patterns (* and ?, up to 20
include and 20 exclude patterns) that restrict which search heads’ activity is collected,
for example to leave out a test search head that shares the indexers. Exclusions win.
Step 3 — Indexes & RBAC
The TrackMe indexes of the tenant (summary, audit, metric and notable), the tenant owner and the admin, power and user roles. The summary index receives the evidence and the notable index the finding events; each family can be pointed at another index later in Settings → Indexes.
Step 4 — Review
Check the summary — the tiers with the route, the owner, the activity scope, the backfill — and create. Everything is provisioned and scheduled at once: the inventory and activity reports start within minutes, the policies follow, and each tier’s first full saved-search listing runs within the hour. If the creation result is incomplete, the wizard says so and the workspace offers Repair UAM workspace.
The step-by-step creation is also described in Creating a splk-uam tenant.
After creation
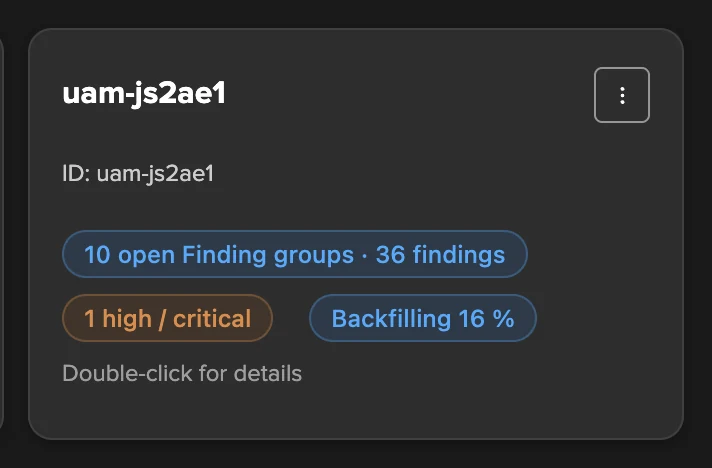
The tenant appears on the Virtual Tenants page with its open Finding groups and findings, the high or critical ones, and its collection status — here the historical backfill in progress. Selecting it opens the workspace; double-clicking it opens a read-only overview.
Your first hour with a new tenant:
Open Collection health and check that the first inventory, activity and policies runs succeeded on every tier.
Classify the monitoring accounts as system — the tenant owner, your administrator accounts — so that they never appear in findings (see Accounts and classification).
Review the Policies tab: the enabled policies, their severities and exclusions.
Come back to Findings after the next policies run (every 15 minutes).
The workspace
The workspace opens on the Findings tab. At the top, the status strip tells you that the tenant is working: the search head tiers (the route account marked · route), the age of the last Inventory, Activity and Policies runs, the activity checkpoint lag and coverage, the backfill progress, a Configuration changed since last run warning after a settings change, Refresh, and Collect now — which runs every tier’s inventory, then the activity and the policies with the current configuration, and every tier’s full saved-search listing alongside.

Nine tabs follow: Findings, Users, Activity, Scheduled searches, Policies, Audit changes, Collection health, AI Agent and Settings.
A few conventions apply everywhere, shared with the Cribl workspaces (The shared workspace conventions):
Column headers filter and sort the loaded page; the toolbar filters search everything.
Every panel has a ⋮ menu with Open in Search (the search behind the figure, ready to edit) and Refresh.
Three personal display preferences per tenant live in the Tenant Home settings panel, under Personal preferences for this tenant: Collection monitors (the status strip), Single stats and Charts. They change your view only.
Exclude TrackMe activity (Users, Activity and the account view) leaves out the searches run in the
trackmeapp — TrackMe’s own scheduled trackers (recognised by their search id) and your own use of TrackMe. An ad-hoc search that reports another app or none, such as the tracker searches TrackMe dispatches over REST, cannot be attributed and stays in. Findings are not affected. It is remembered per viewer.Notification emails link straight to a finding or a Finding group, opened in its investigation.
Findings
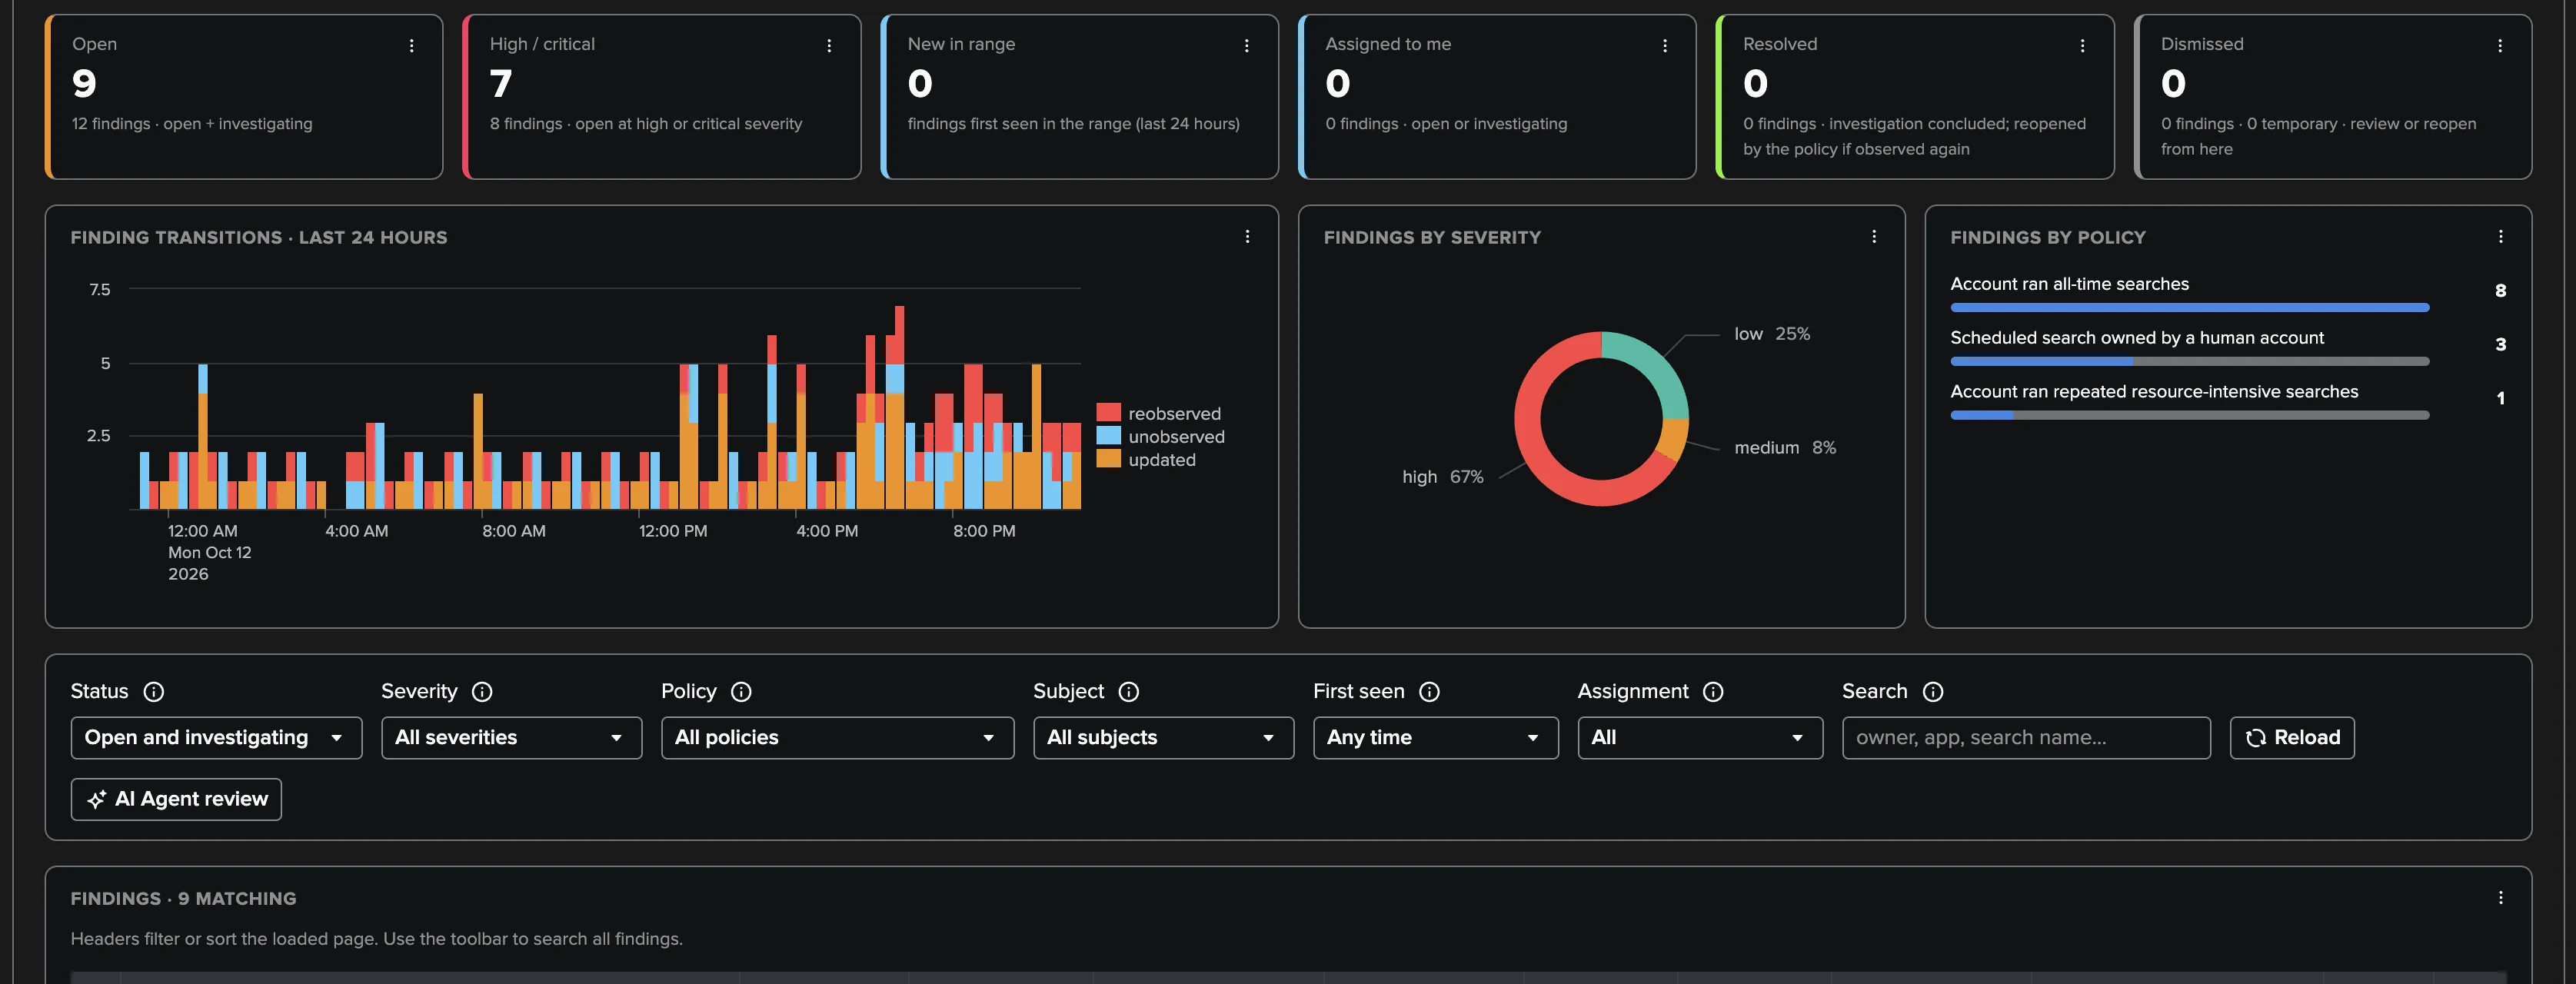
Your investigation backlog. Tiles count Open, High / critical, New in range, Assigned to me, Resolved and Dismissed — in Finding groups — and drive the filters; charts show the finding transitions over the time range (24 hours by default) and the open findings by severity and by policy. Filters cover the status, severity, policy, subject (accounts or saved searches), first seen, assignment (including assignment groups) and free text (owner, app, search name).
The table lists one row per Finding group: an account and the saved searches it owns. A group of several findings has an expander showing each member with its own policy, severity and whether the latest policies run still observed it. Selecting rows offers Merge into one Finding group, Add to the Finding group (a manual group), Run action, Assign to… and Bulk edit; AI Agent review asks the AI Agent to review the open and investigating findings.
Selecting a row opens the Investigate view: the subject, the findings of the Finding group, What happened in plain words, the suggested remediation, the evidence of the selected finding, Triage of the Finding group (status, dismissal, assignee, notification snooze, severity, investigation note), the notes and both histories — the finding’s and the group’s. From there, open the account view or the saved search view, or the record and its events in Search.
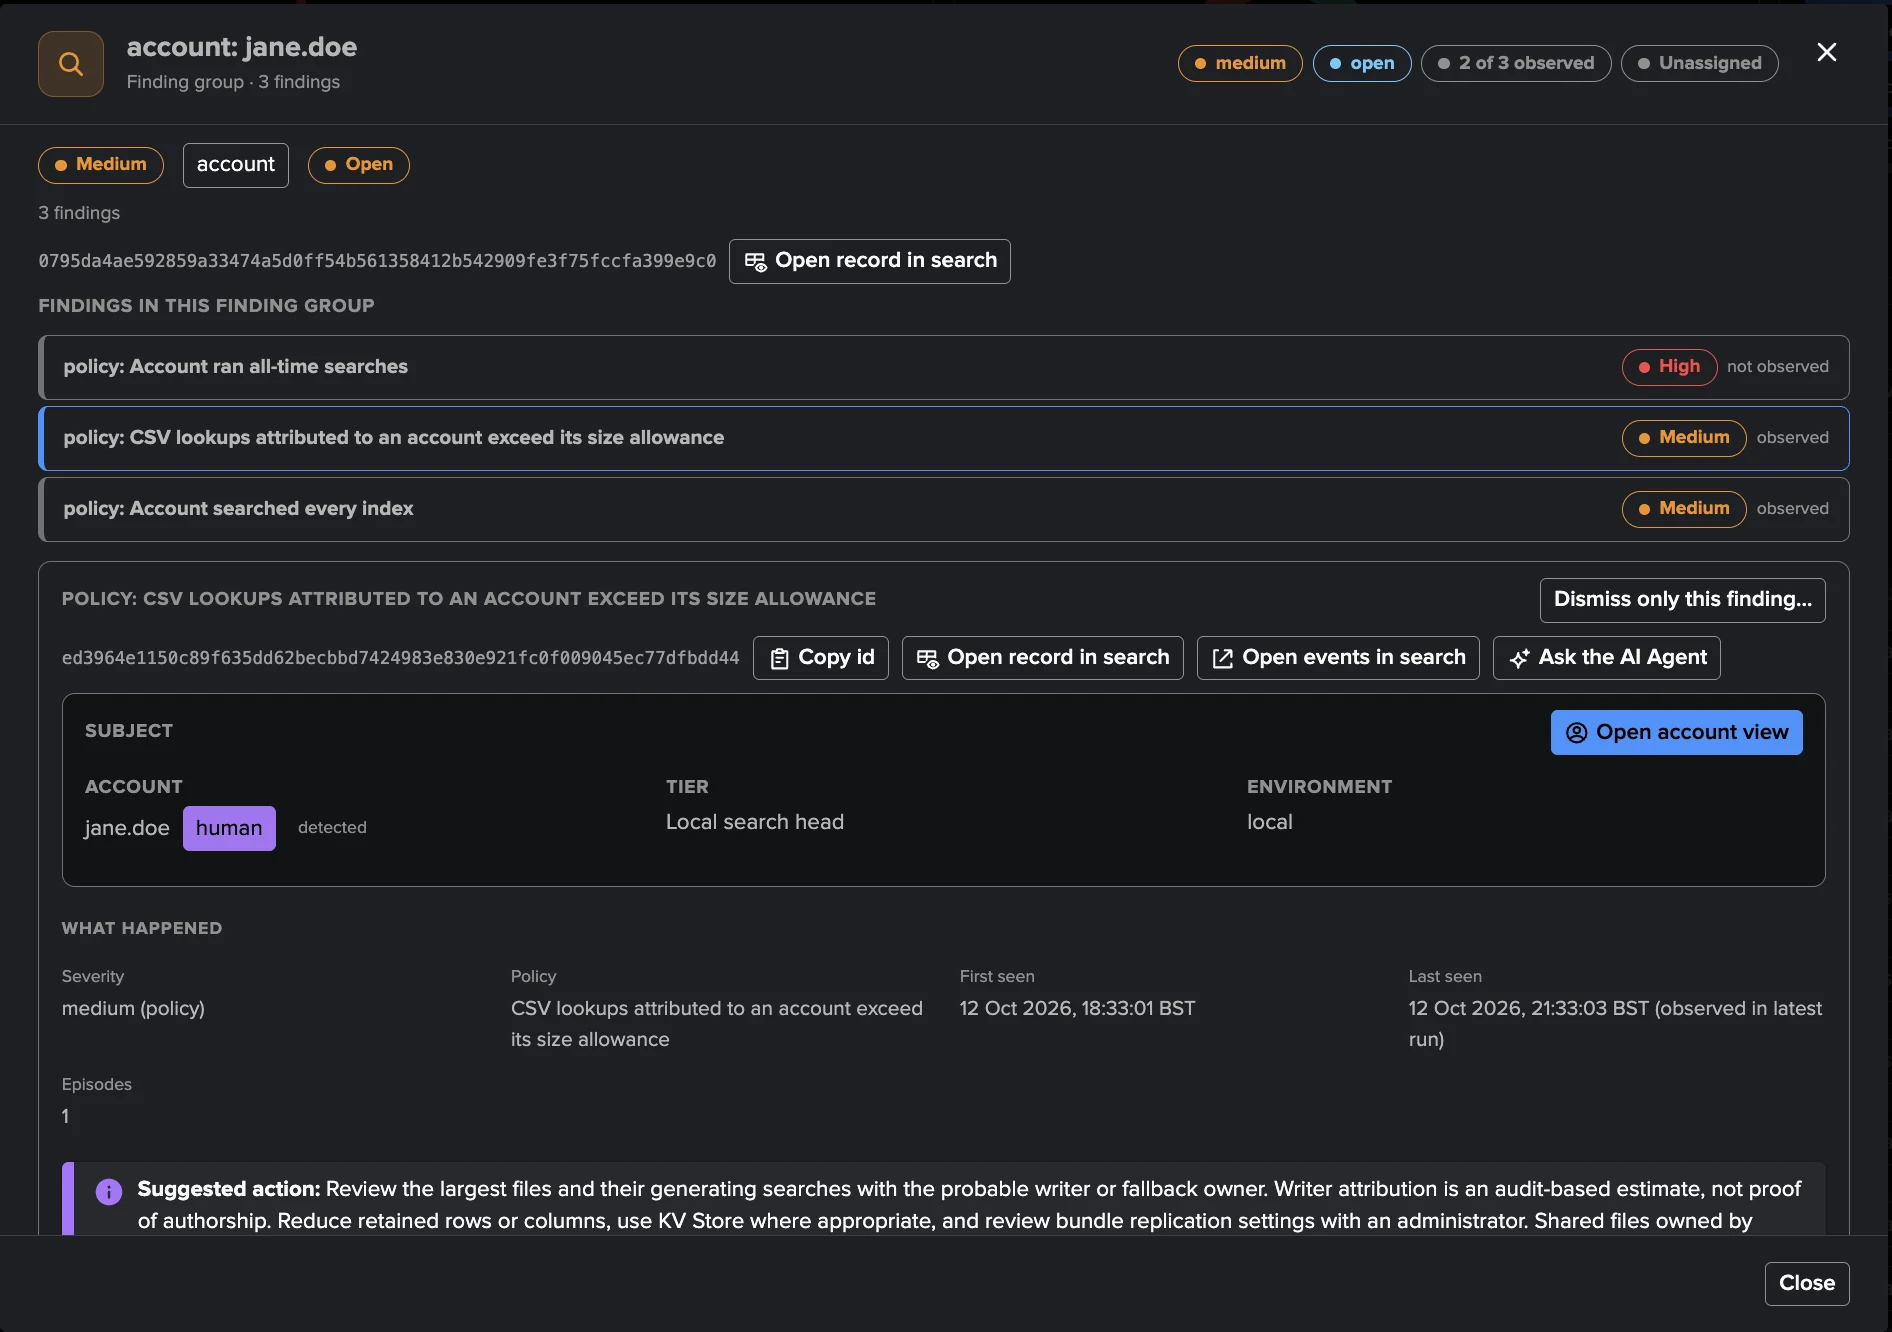
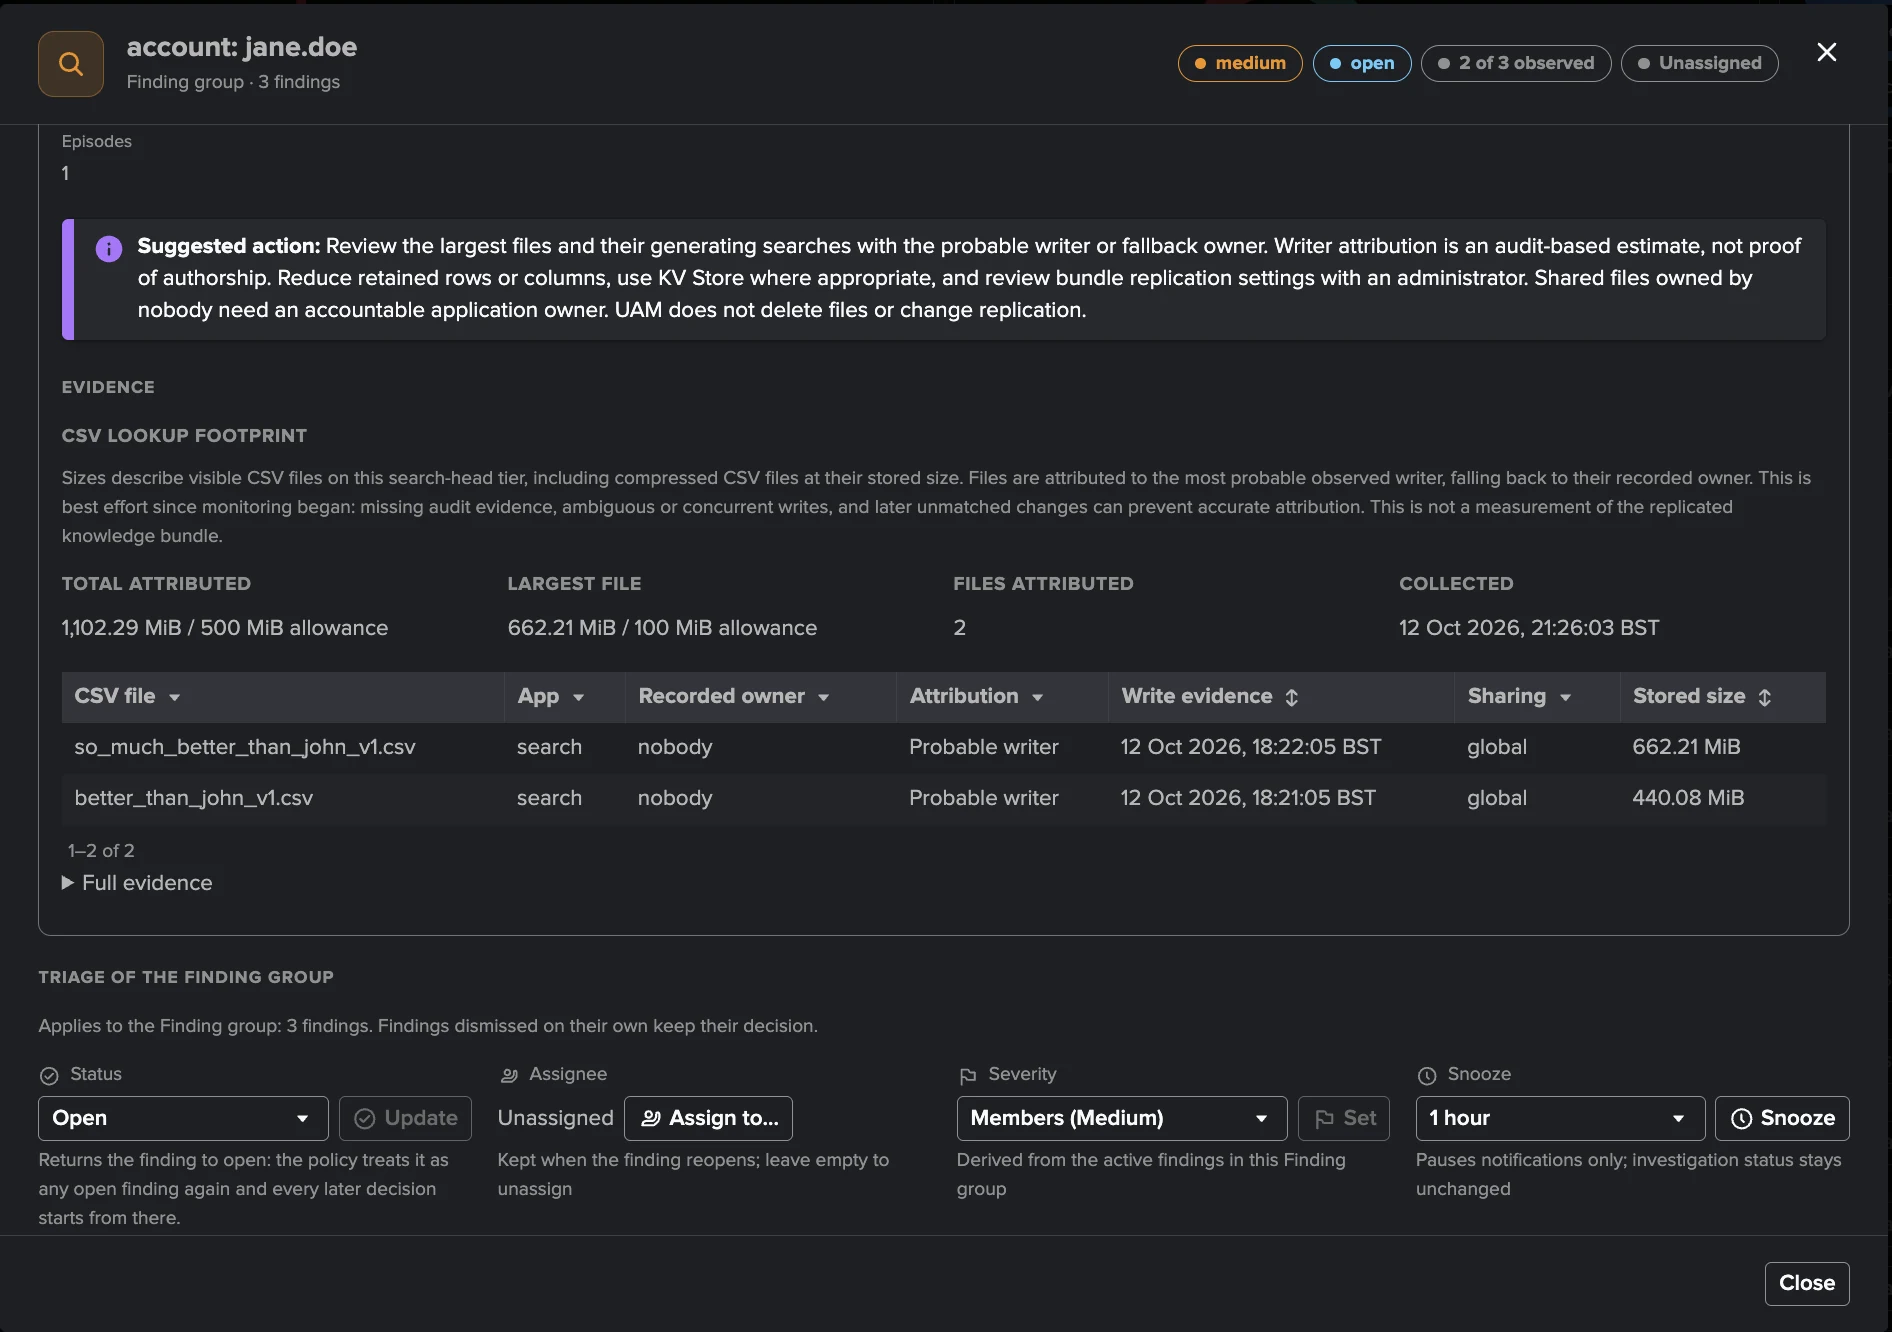
Each finding explains its own evidence. A CSV lookup footprint finding, for instance, lists the files attributed to the account, their size and how each was attributed: to its probable writer — the account whose searches wrote the file — or, when no writer could be identified, to its recorded owner.
Users and the account view
Every account across the tiers: tiles for the accounts in range, inventoried, classified and unclassified; filters by class, source and activity range; columns for email addresses, class (with a detected marker when a detection set it), roles, tiers, findings, audit records, executions, last seen and apps. The row menu sets the class or overrides the email address used for user notifications (Override email address…); a selection can be classified at once, or decided on as a whole (resolve, dismiss or mark investigating its open findings).
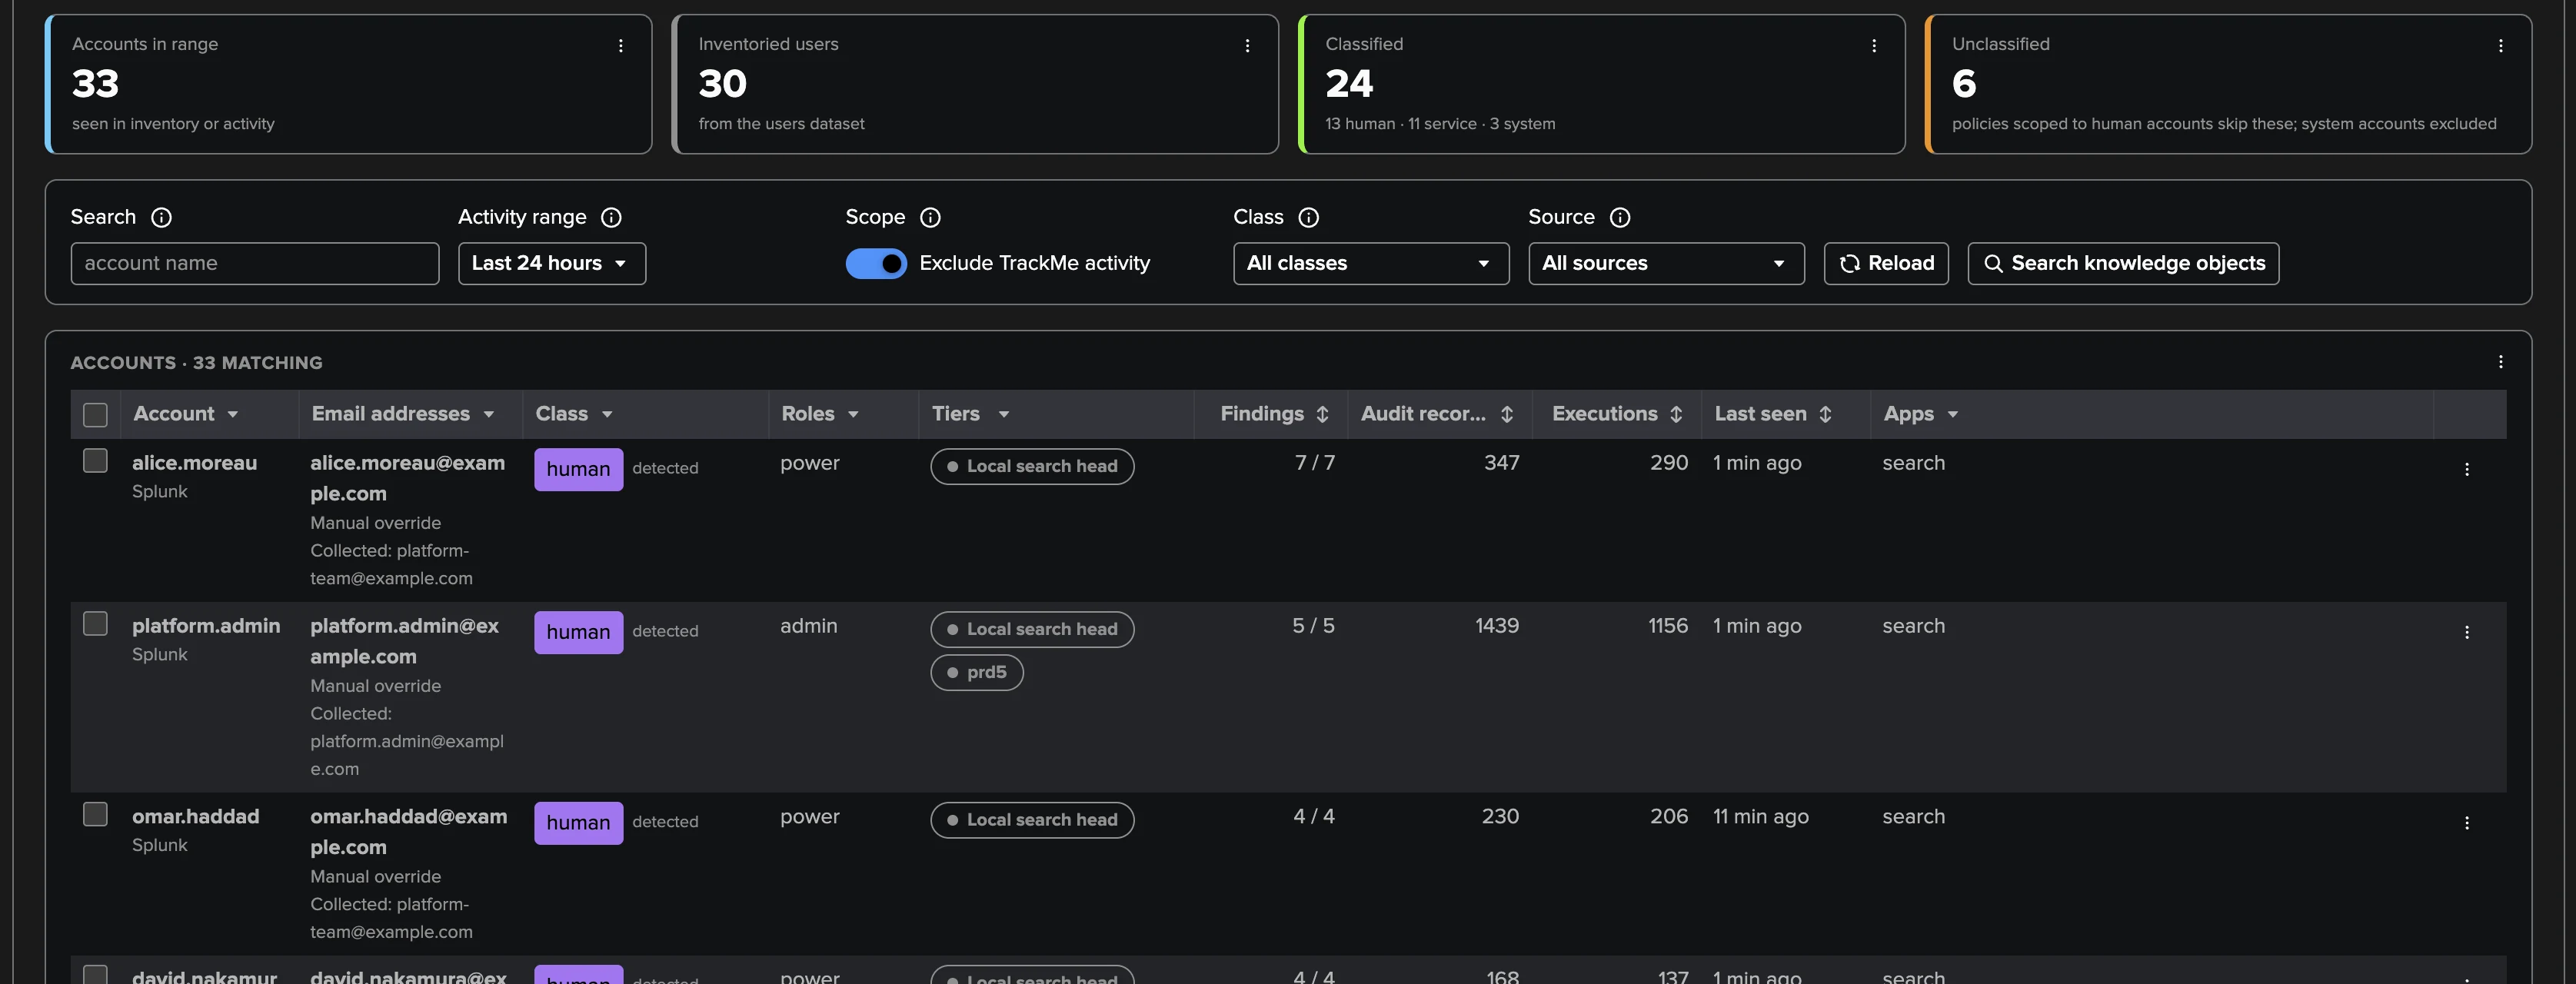
Selecting an account opens the account view:
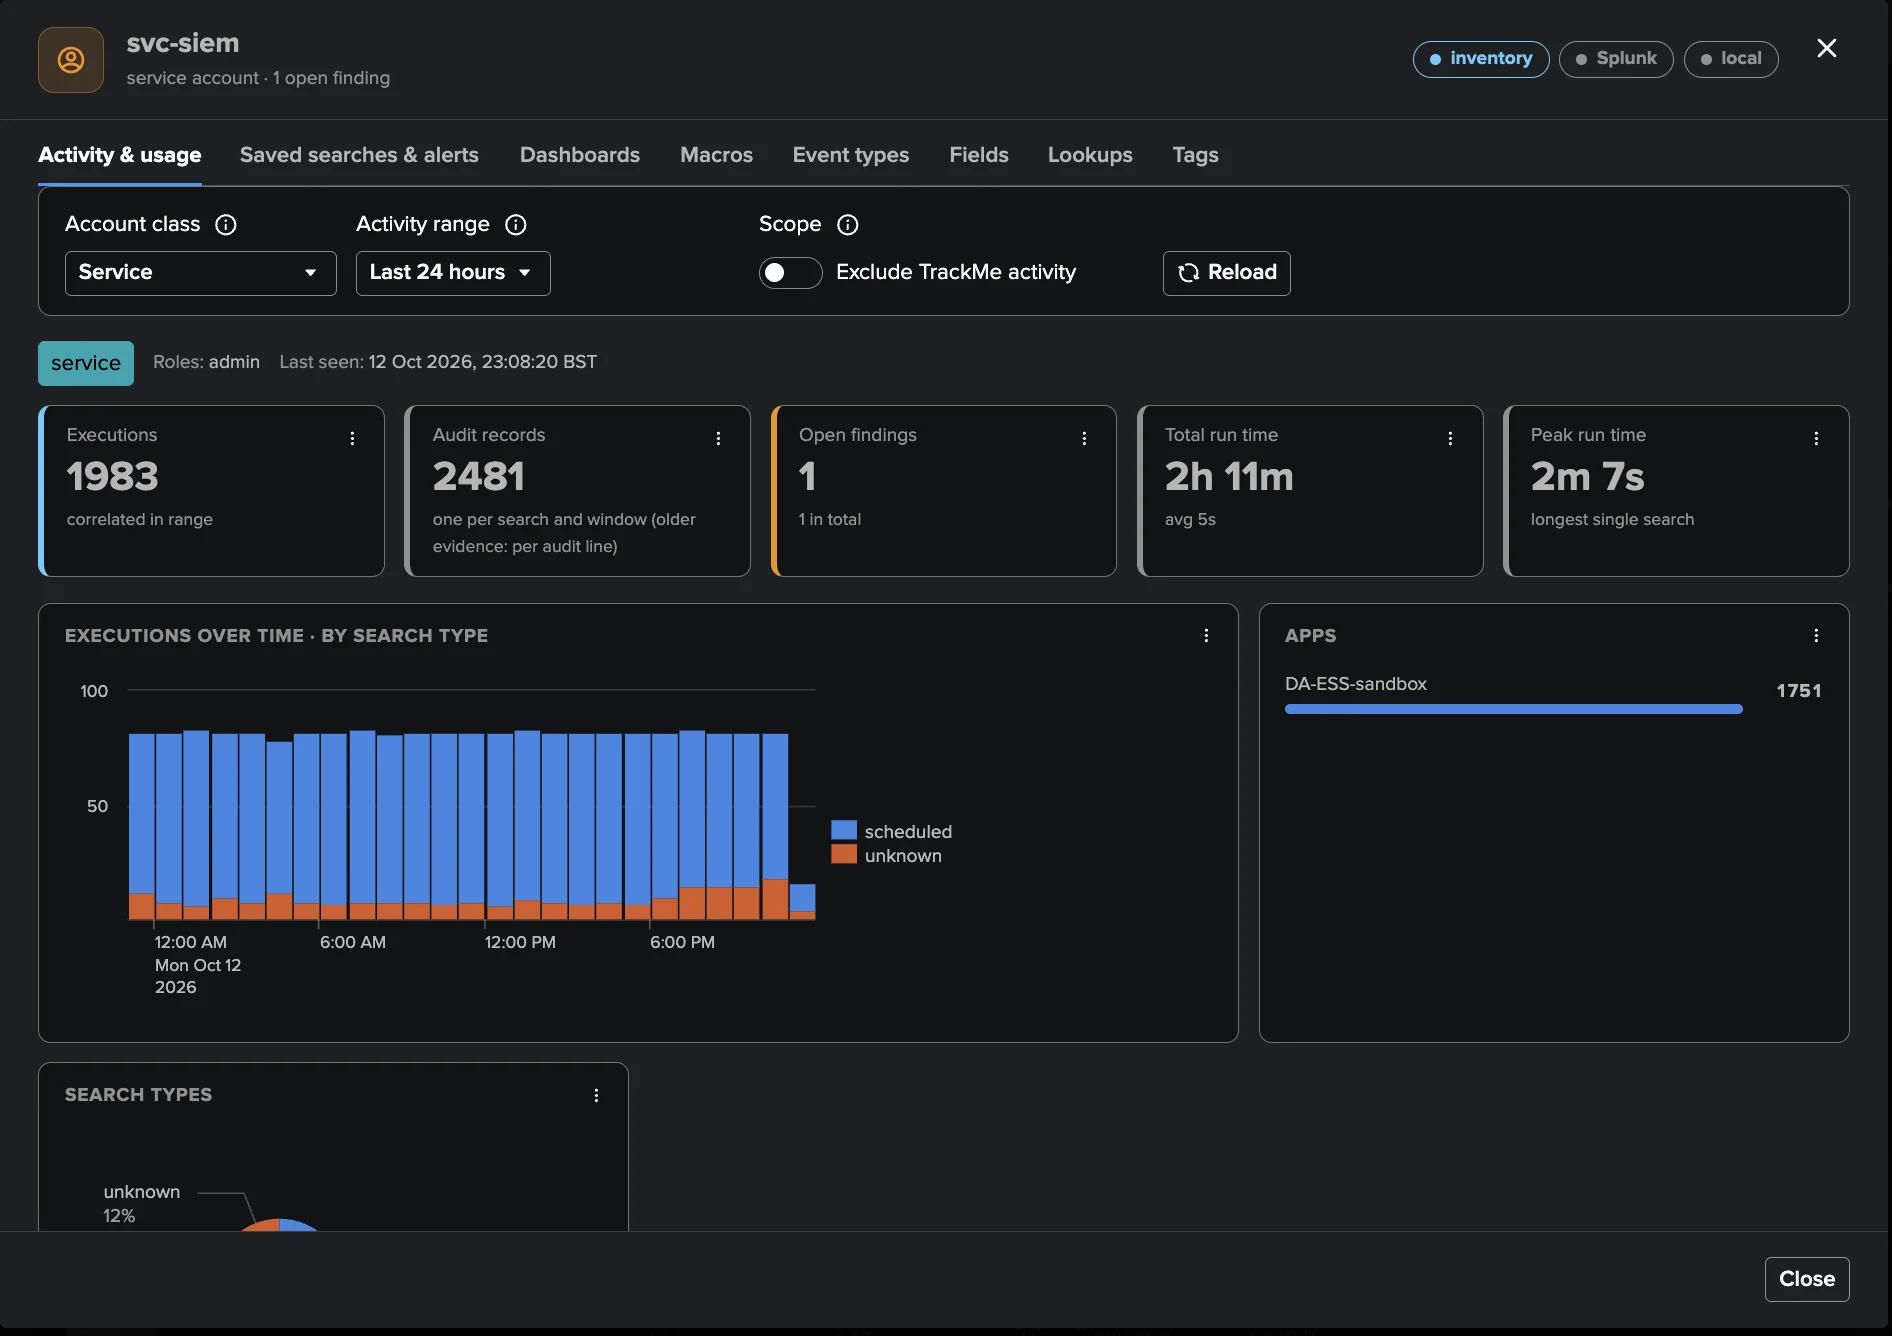
Activity & usage — executions and run time over time by search type, CPU over time, the daily CPU baseline, the resource usage (CPU time, peak memory, share of the environment), the most expensive and the most recent searches with Fetch SPL, the account’s findings and the scheduled searches it owns.
The account’s catalogs, one tab per family: Saved searches & alerts, Dashboards, Macros, Event types, Fields, Lookups and Tags — what this account owns on each tier.
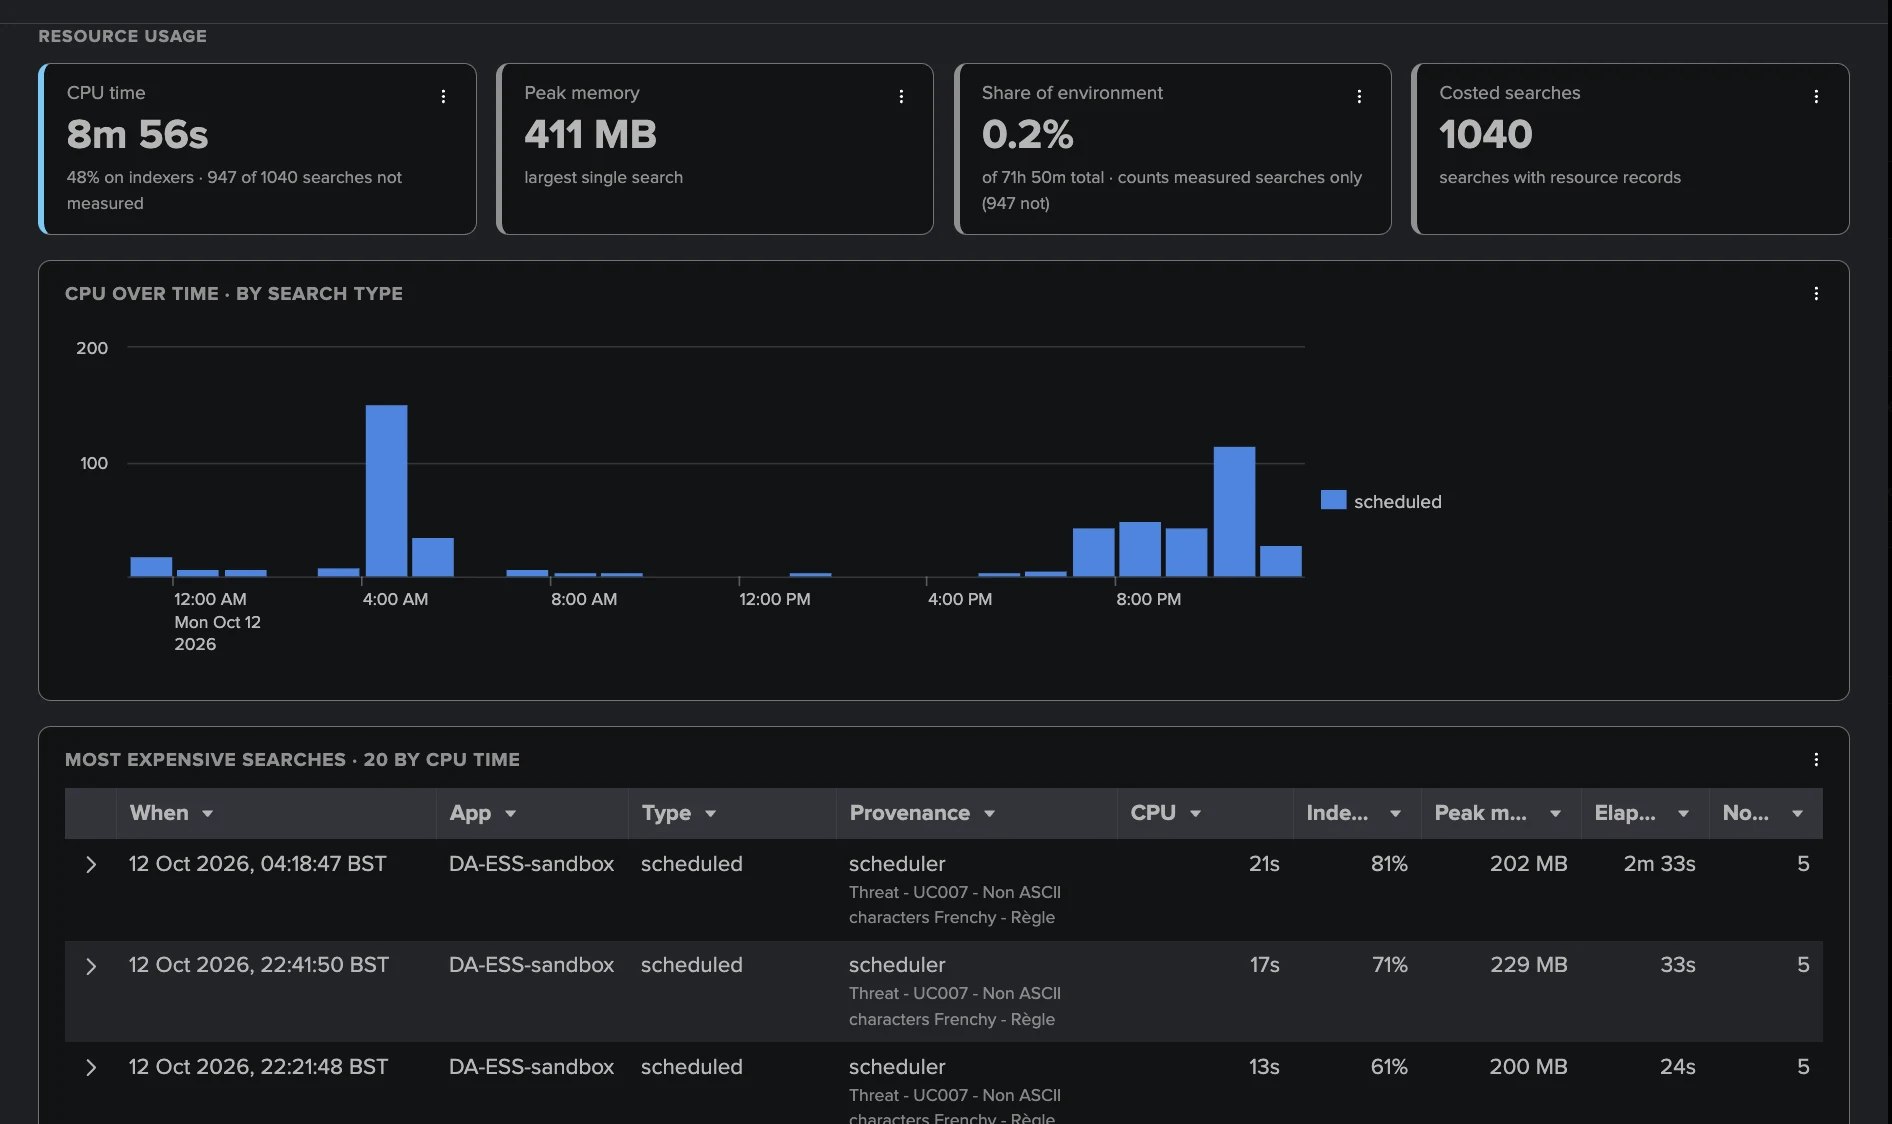
The resource usage tells what an account costs: here a service account whose scheduled detection searches use 0.2% of the environment’s search CPU over the day, with the most expensive runs listed first. Searches the resource records could not measure are counted and shown as such, never estimated.
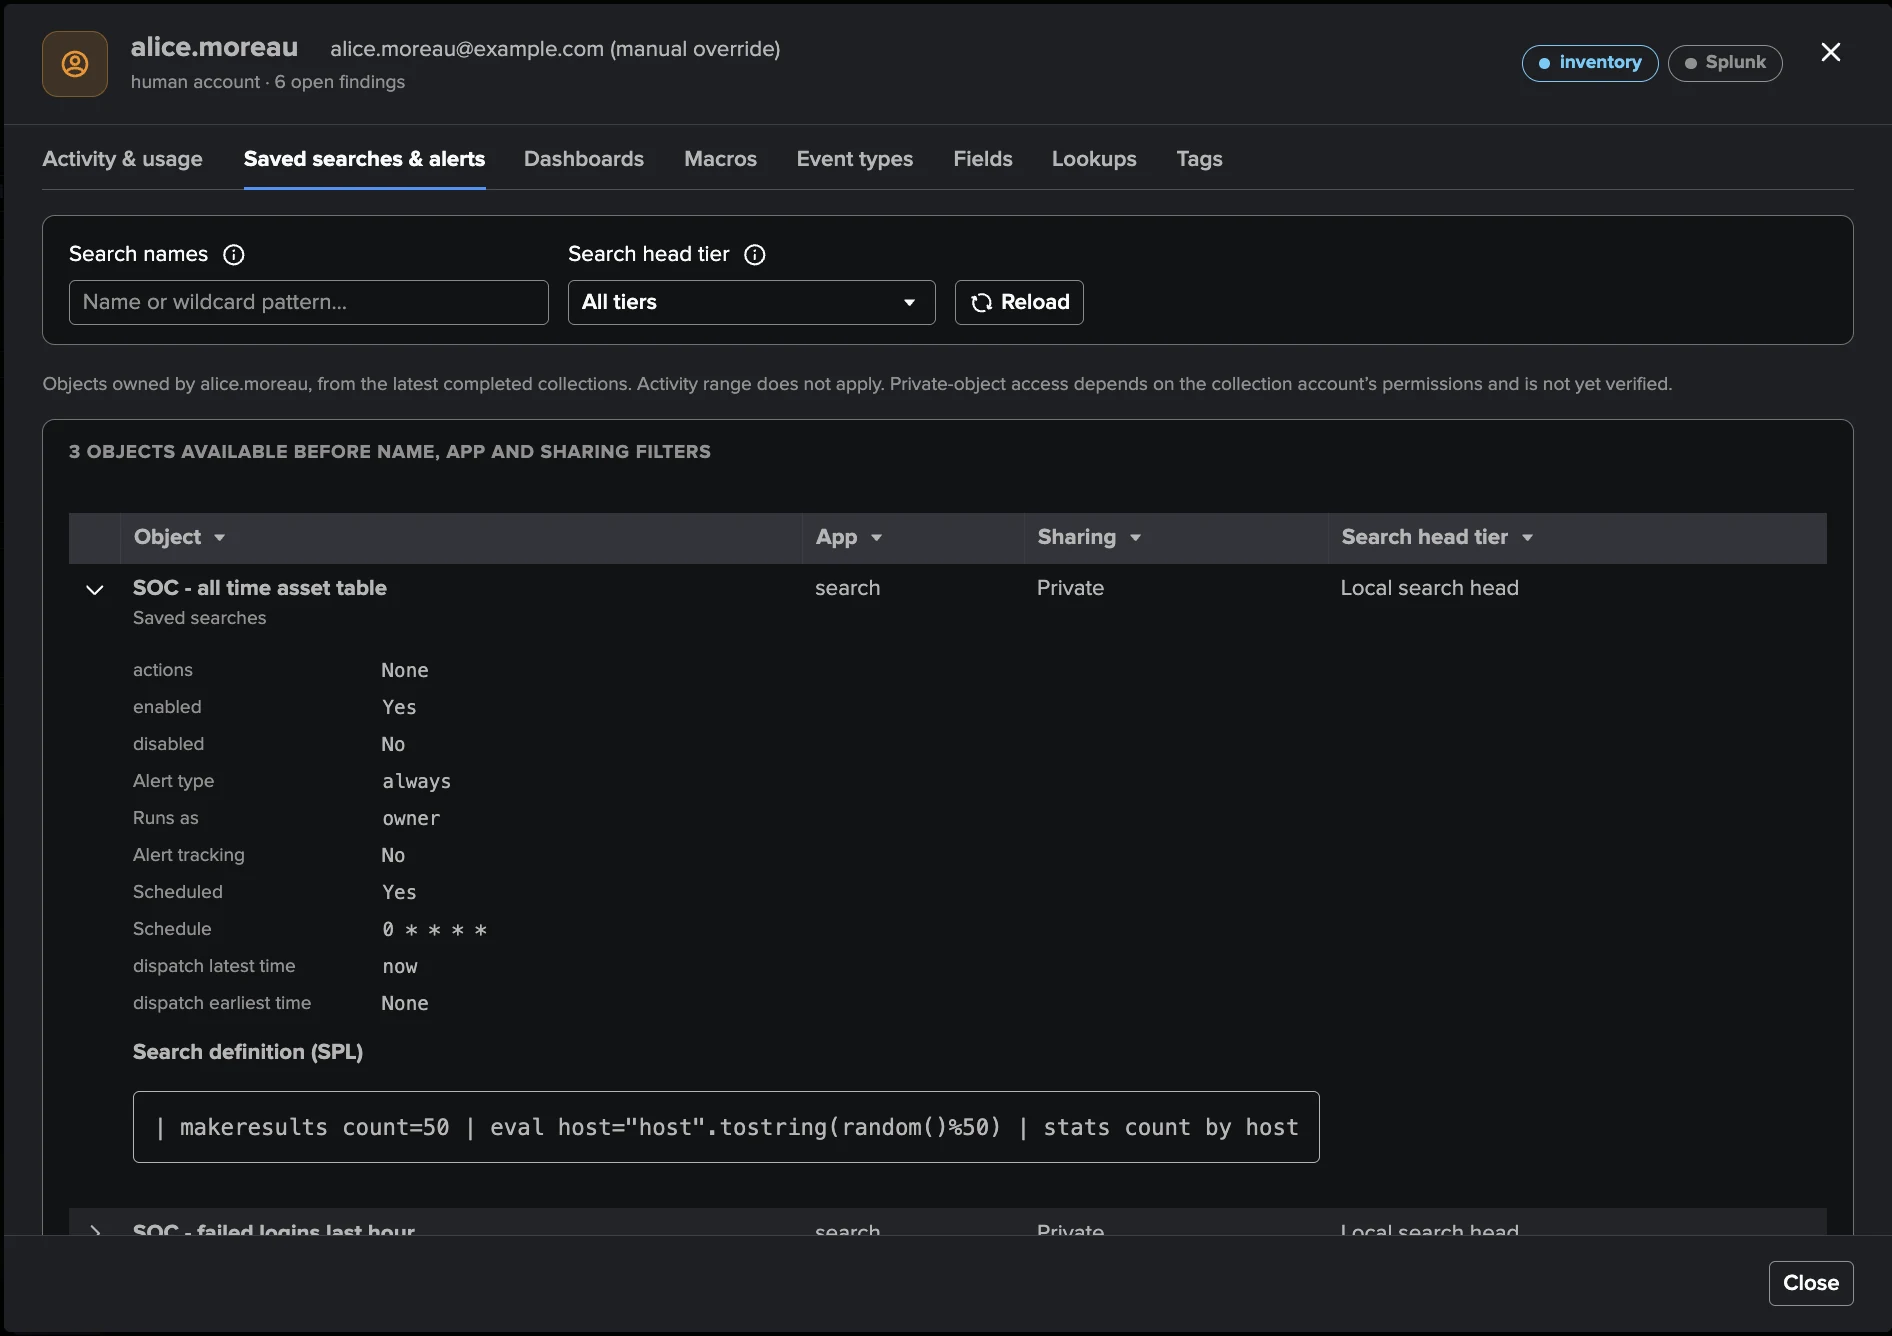
Fetch SPL shows the text of a search. By default UAM does not store search text: it reads
it live from _audit, as you, and stores nothing. If you switch on Store SPL search
(Settings → Collection, off by default), the text is indexed in its own record in the
search-text index — point that index at a restricted index first, since search text can
contain literals and secrets. When a text cannot be shown, the reason is given.
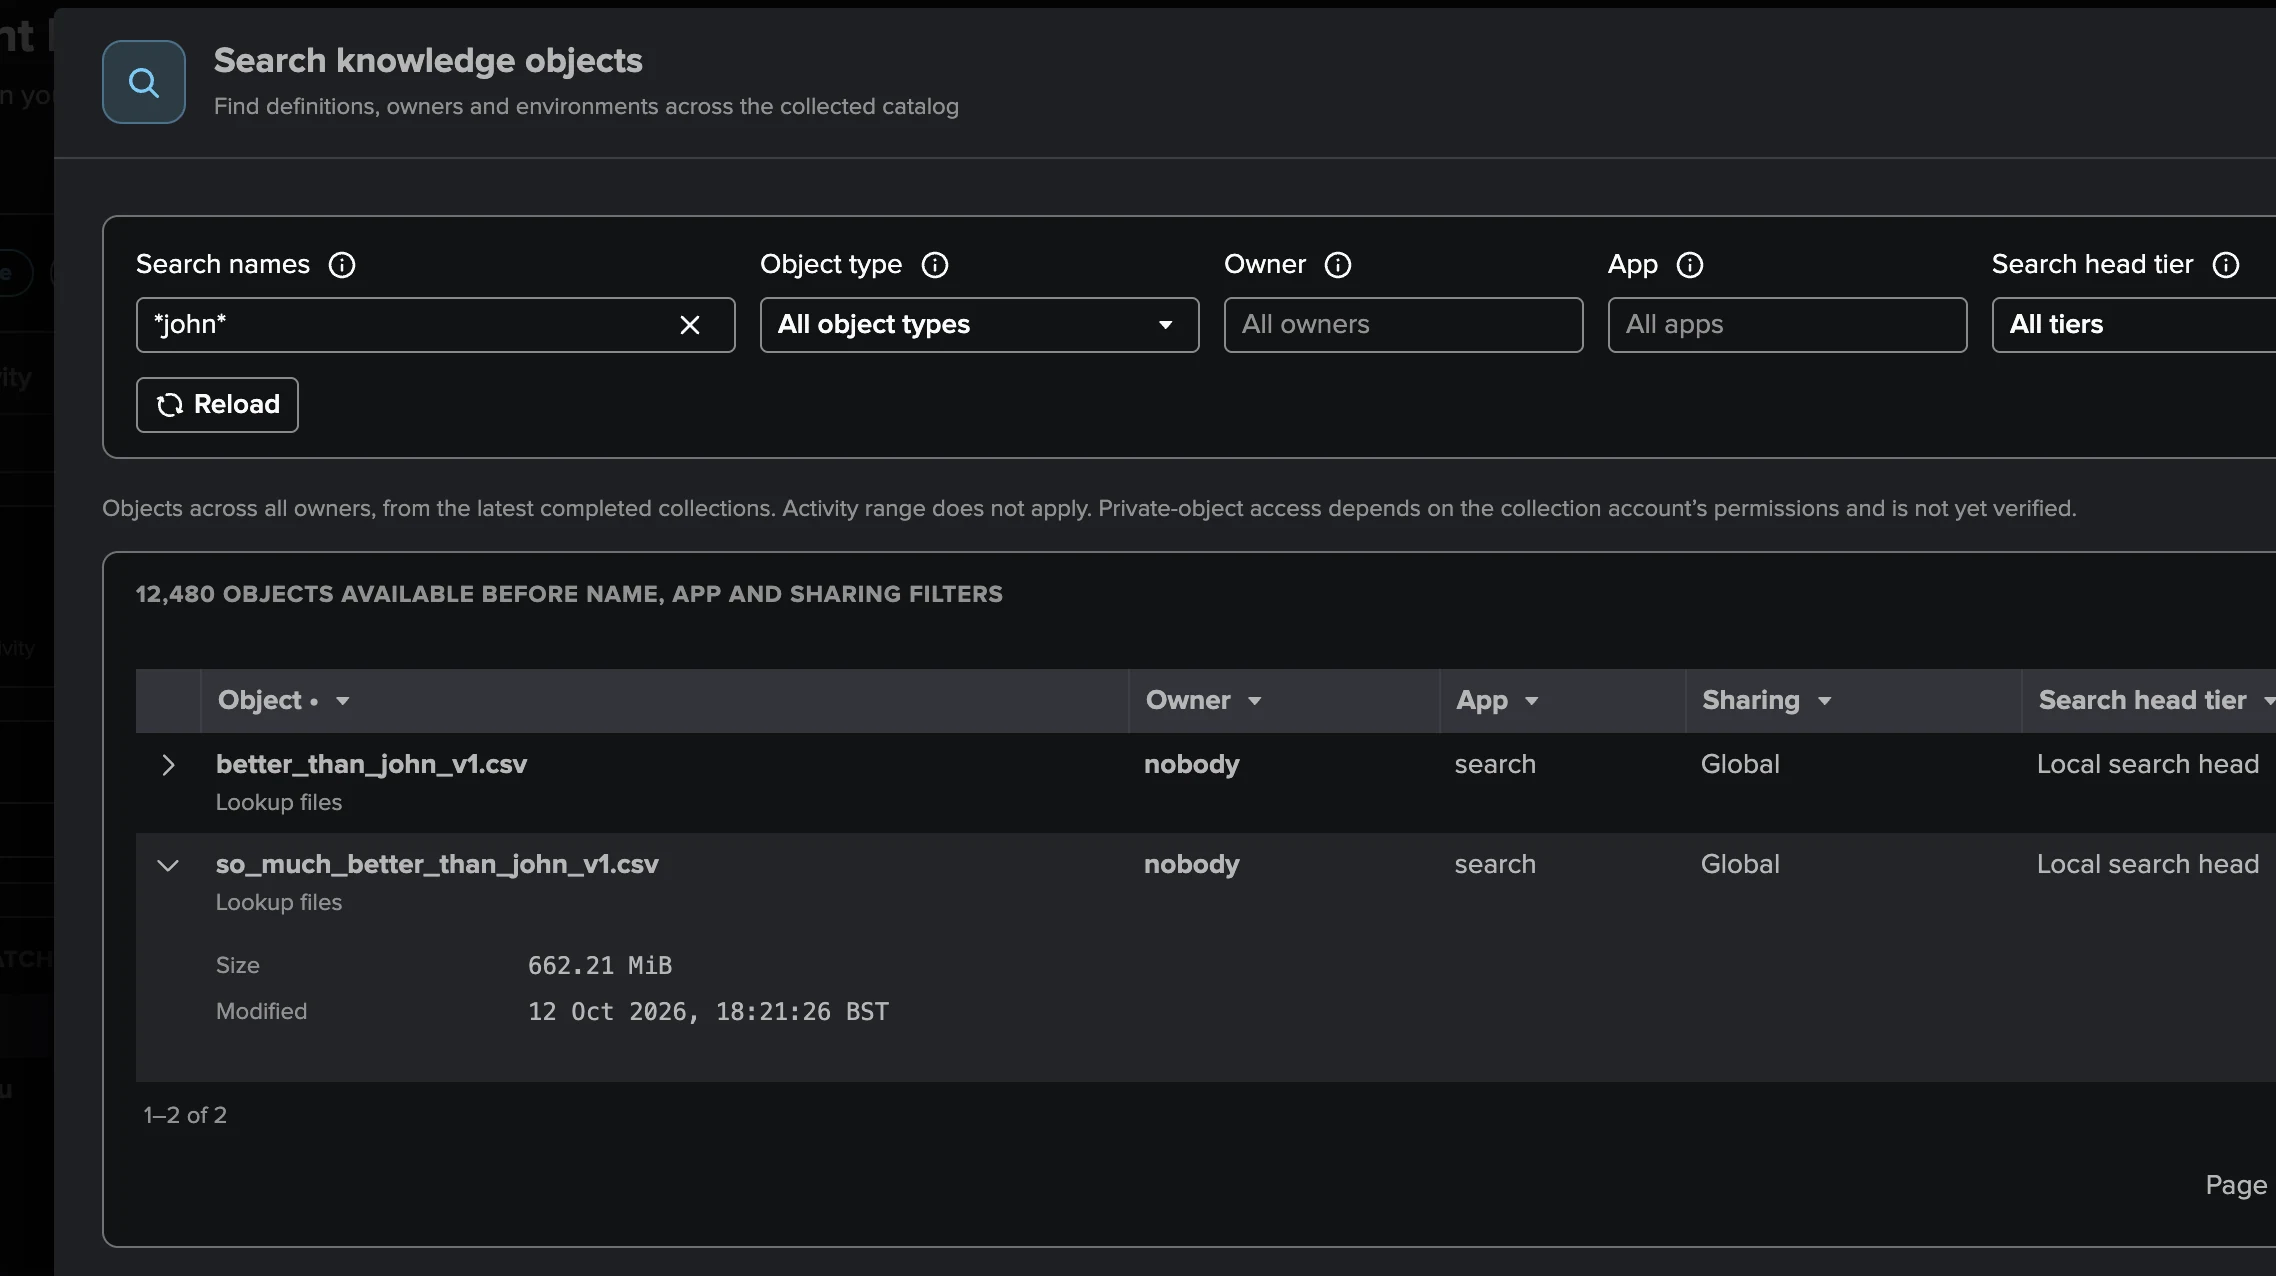
Search knowledge objects (on the Users tab) searches the collected catalogs across every
owner: a name or a wildcard pattern, filtered by object type, tier, app, owner and sharing.
Use it to answer “who owns the macro app_a_base?” or “which dashboards use this name on
which tier?”.
Note
The catalogs reflect what the collection account can see on each tier: the coverage of private objects depends on its permissions. They are collected on a cadence (daily in the off-peak window by default for most families, every 15 minutes for CSV lookup files, hourly for users and roles), not as atomic snapshots.
Activity
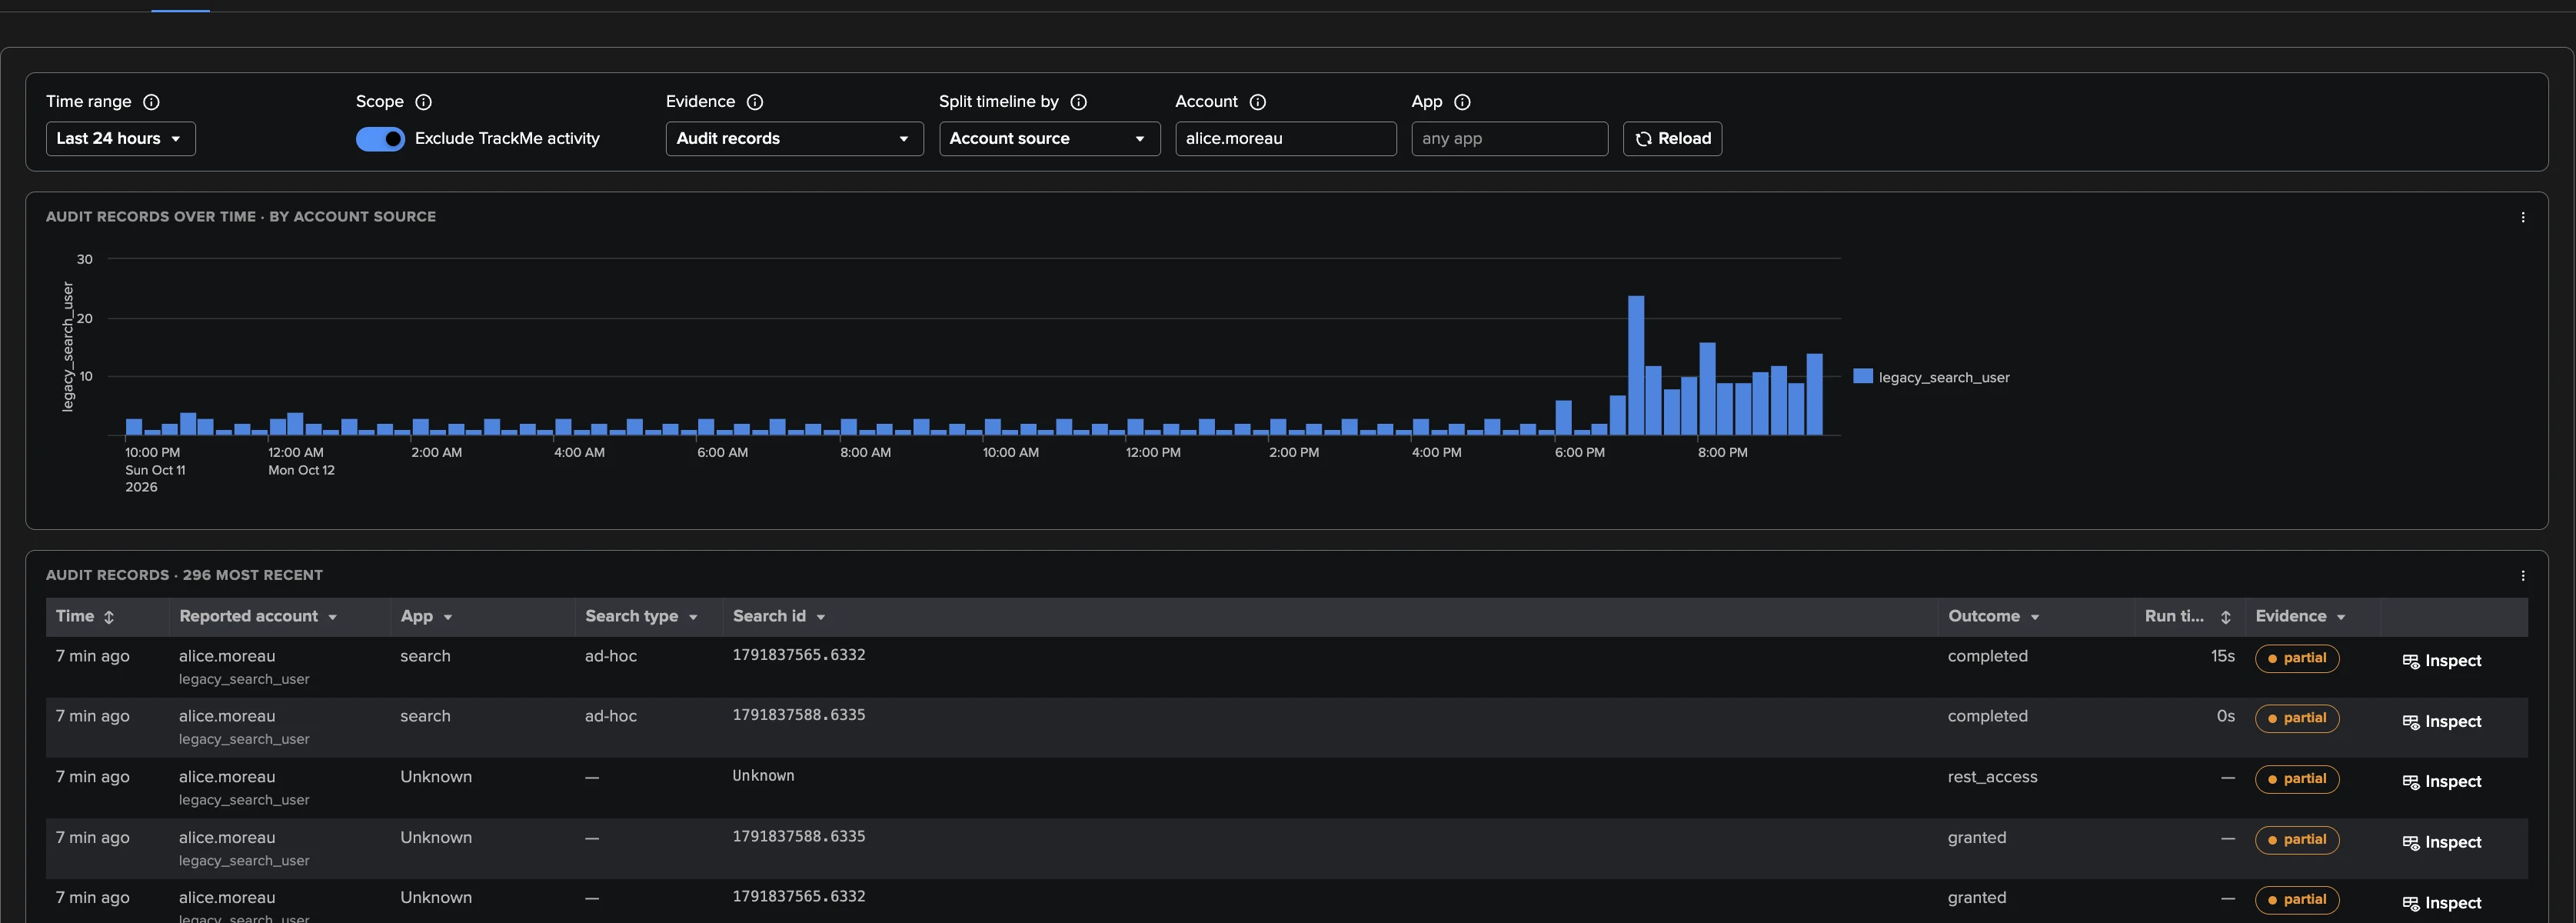
The raw evidence: Audit records or Correlated executions over a time range, a timeline split by account source, evidence status or account, account and app filters, and the 500 most recent records with an evidence inspector (Inspect).
Scheduled searches and the saved search view
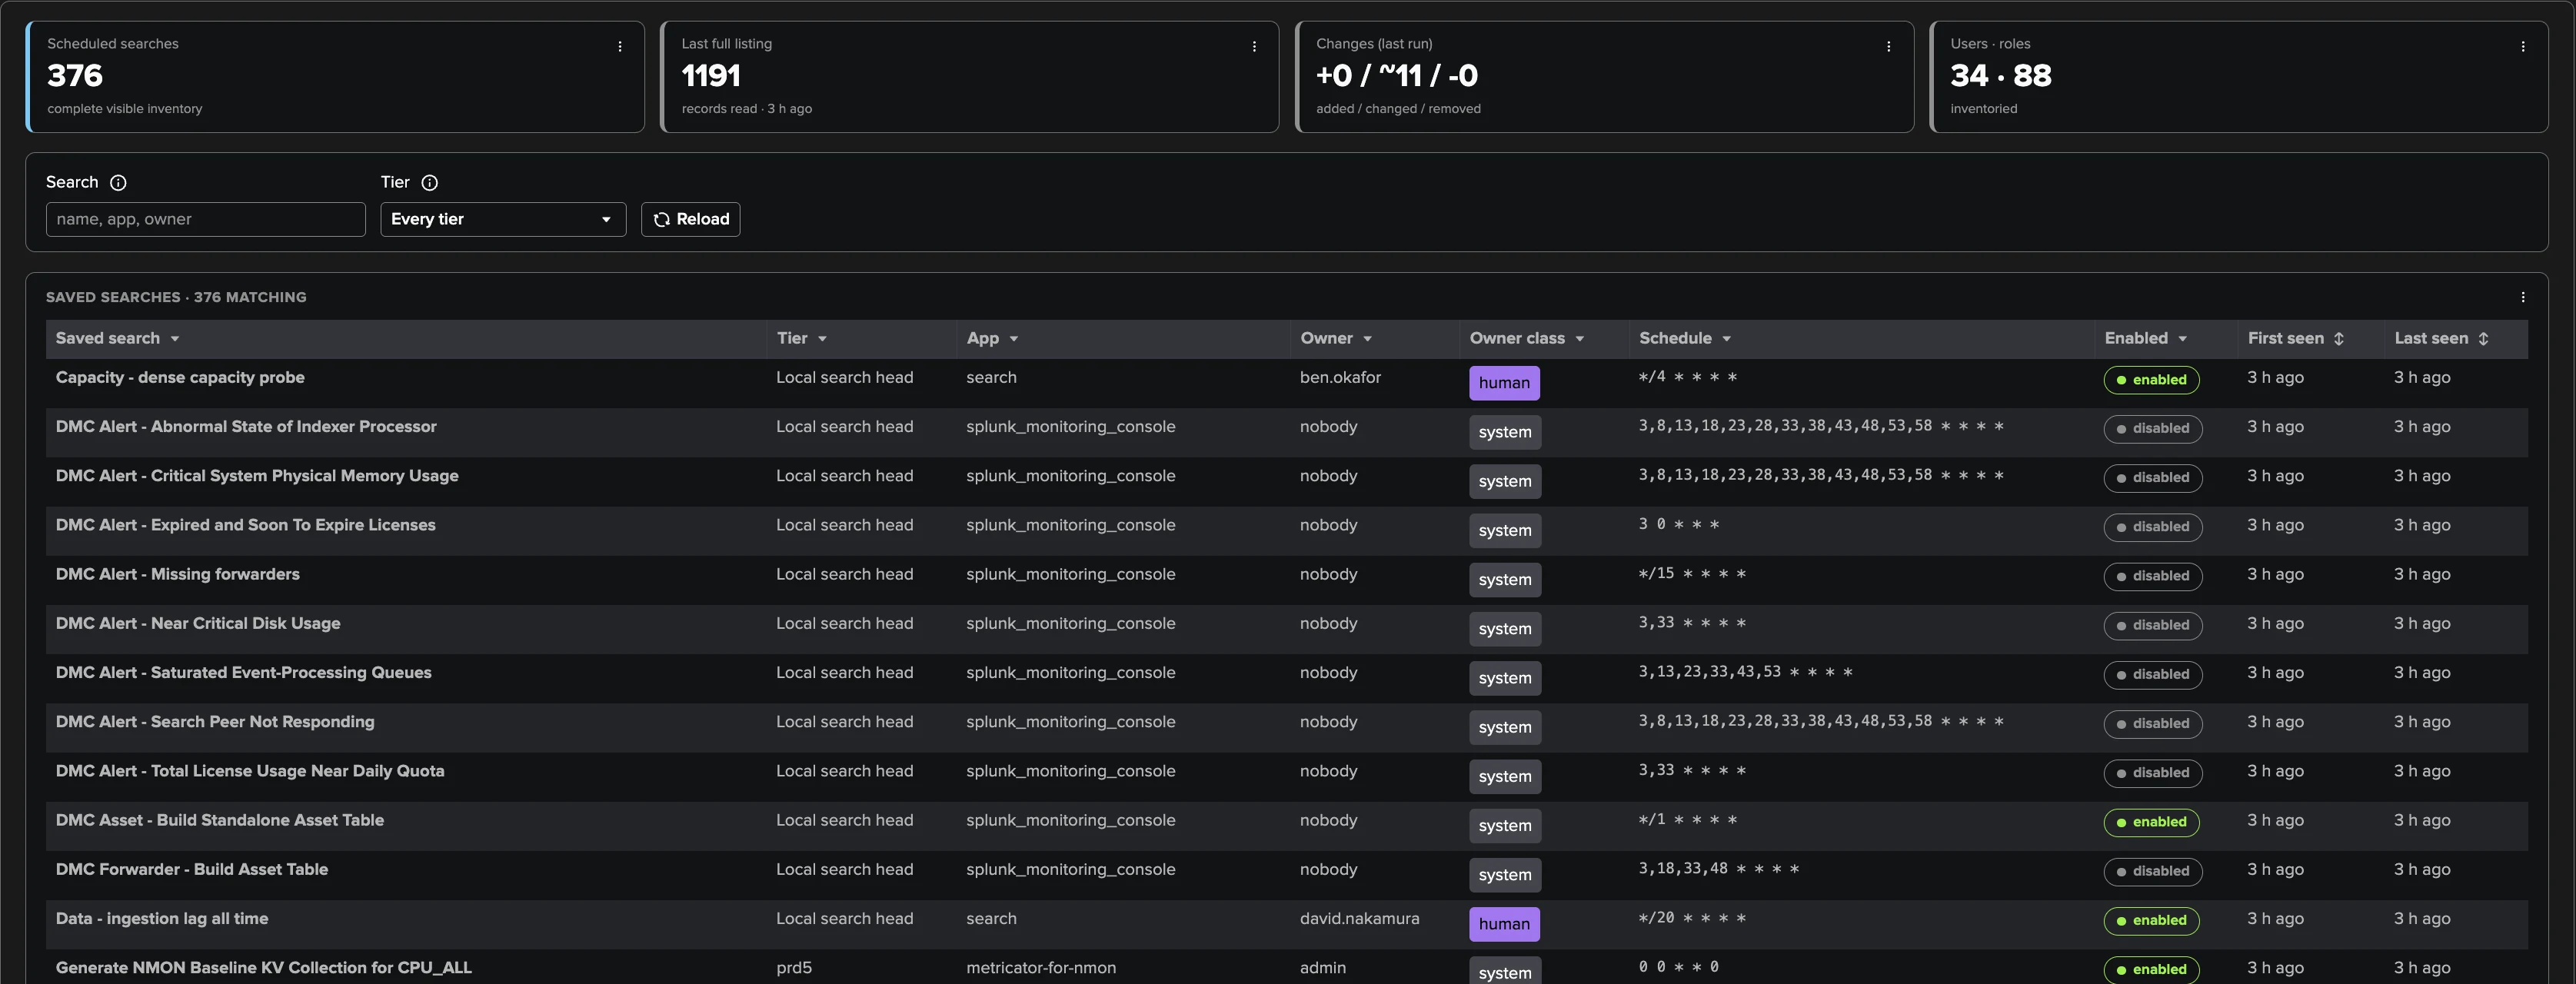
The saved-search inventory per tier: tiles for the scheduled searches, the last full listing, the changes of the last run and the users and roles counts; the table with owner, owner class, schedule, enablement and first and last seen. Selecting a name opens the saved search view: its definition from the inventory, Fetch definition for the live definition, its runs with run time, CPU and peak memory, its findings and its change history, and a way to the owner’s account view.
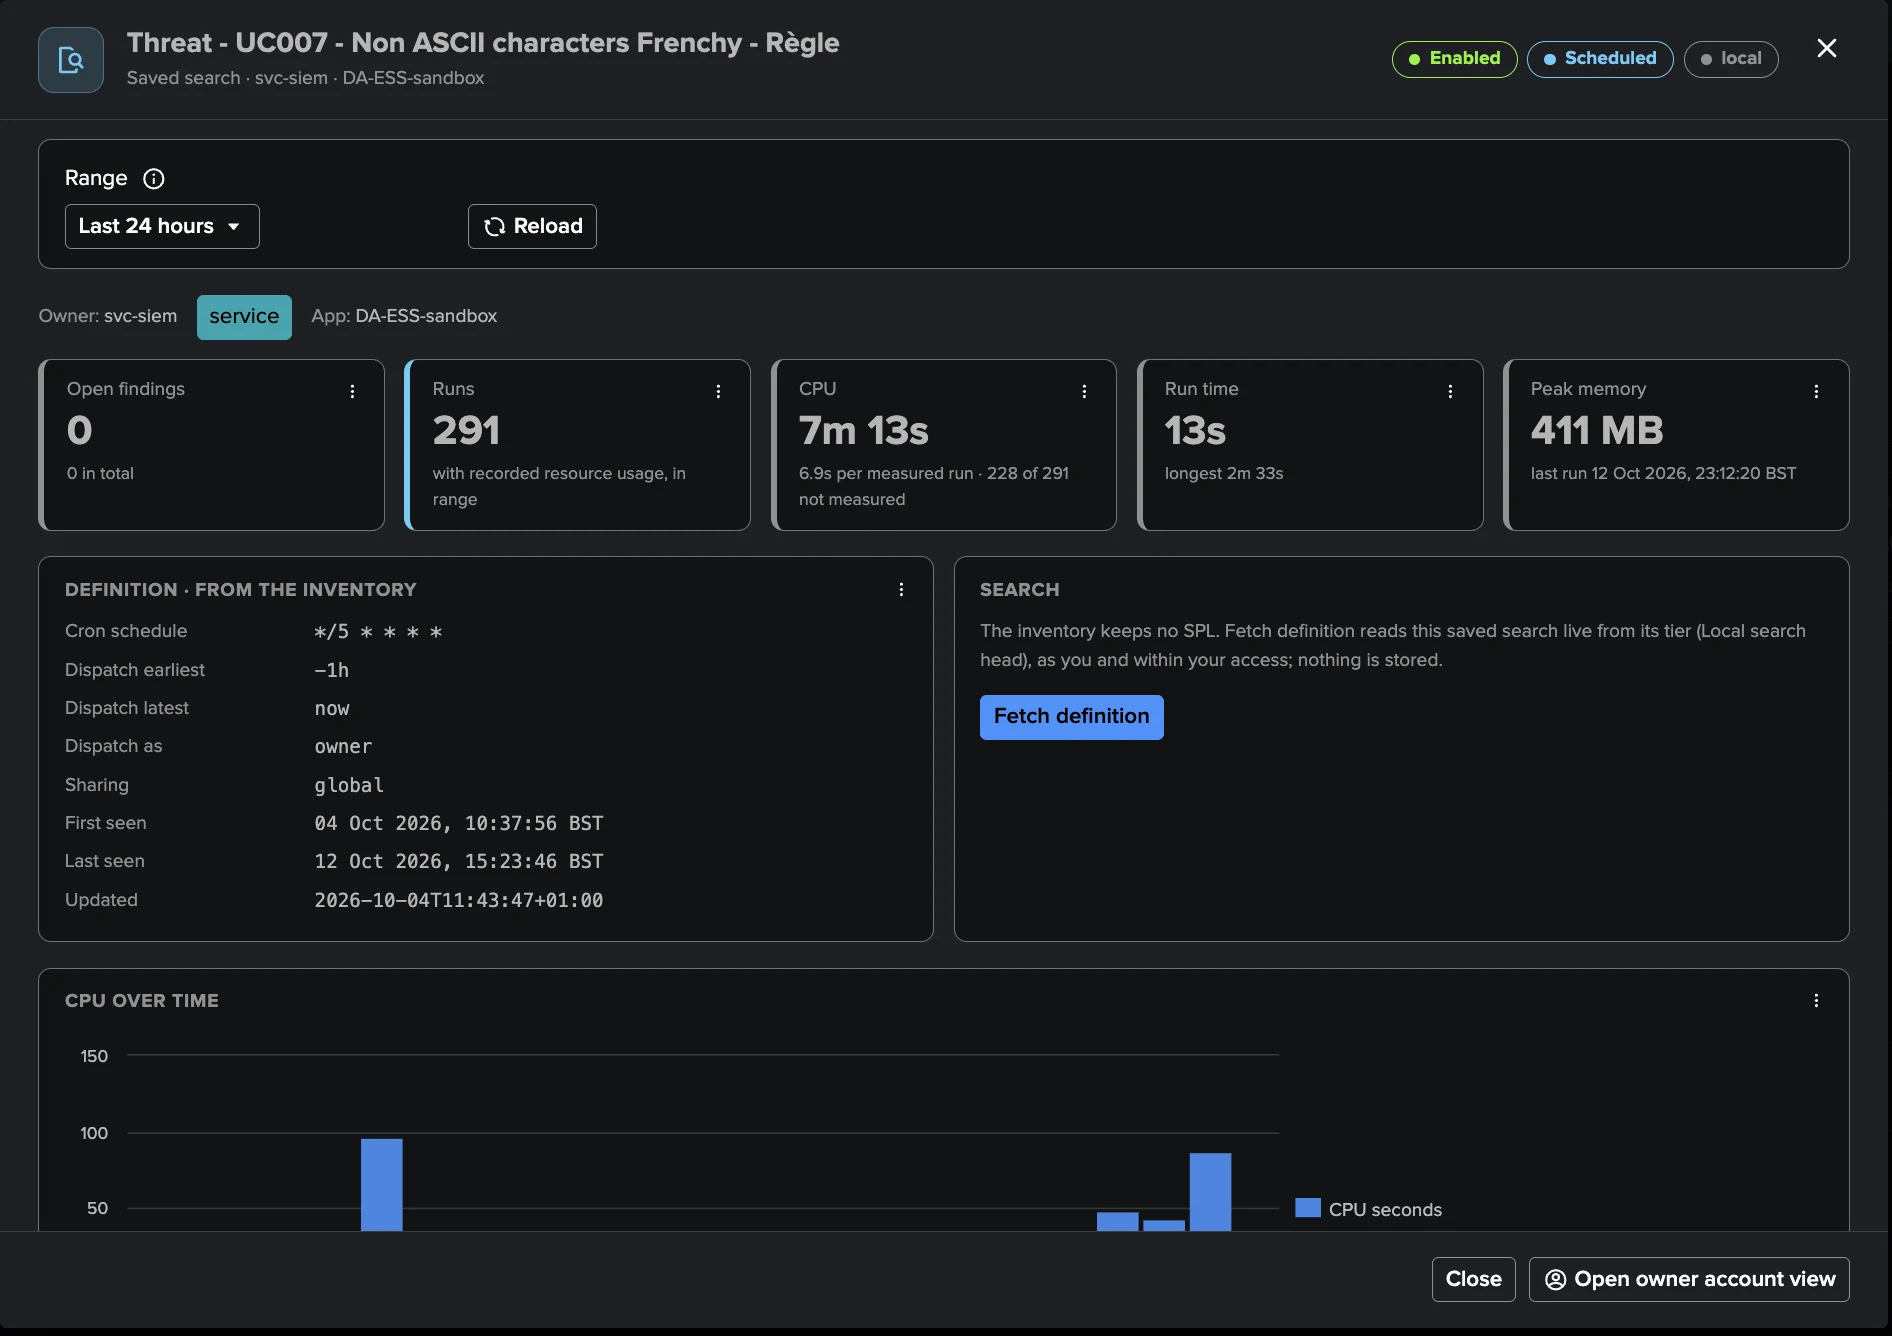
Peak memory can read not measured for short searches that Splunk’s resource records never sampled. A saved search with the same name, app and owner on two tiers shares one set of run figures.
Policies
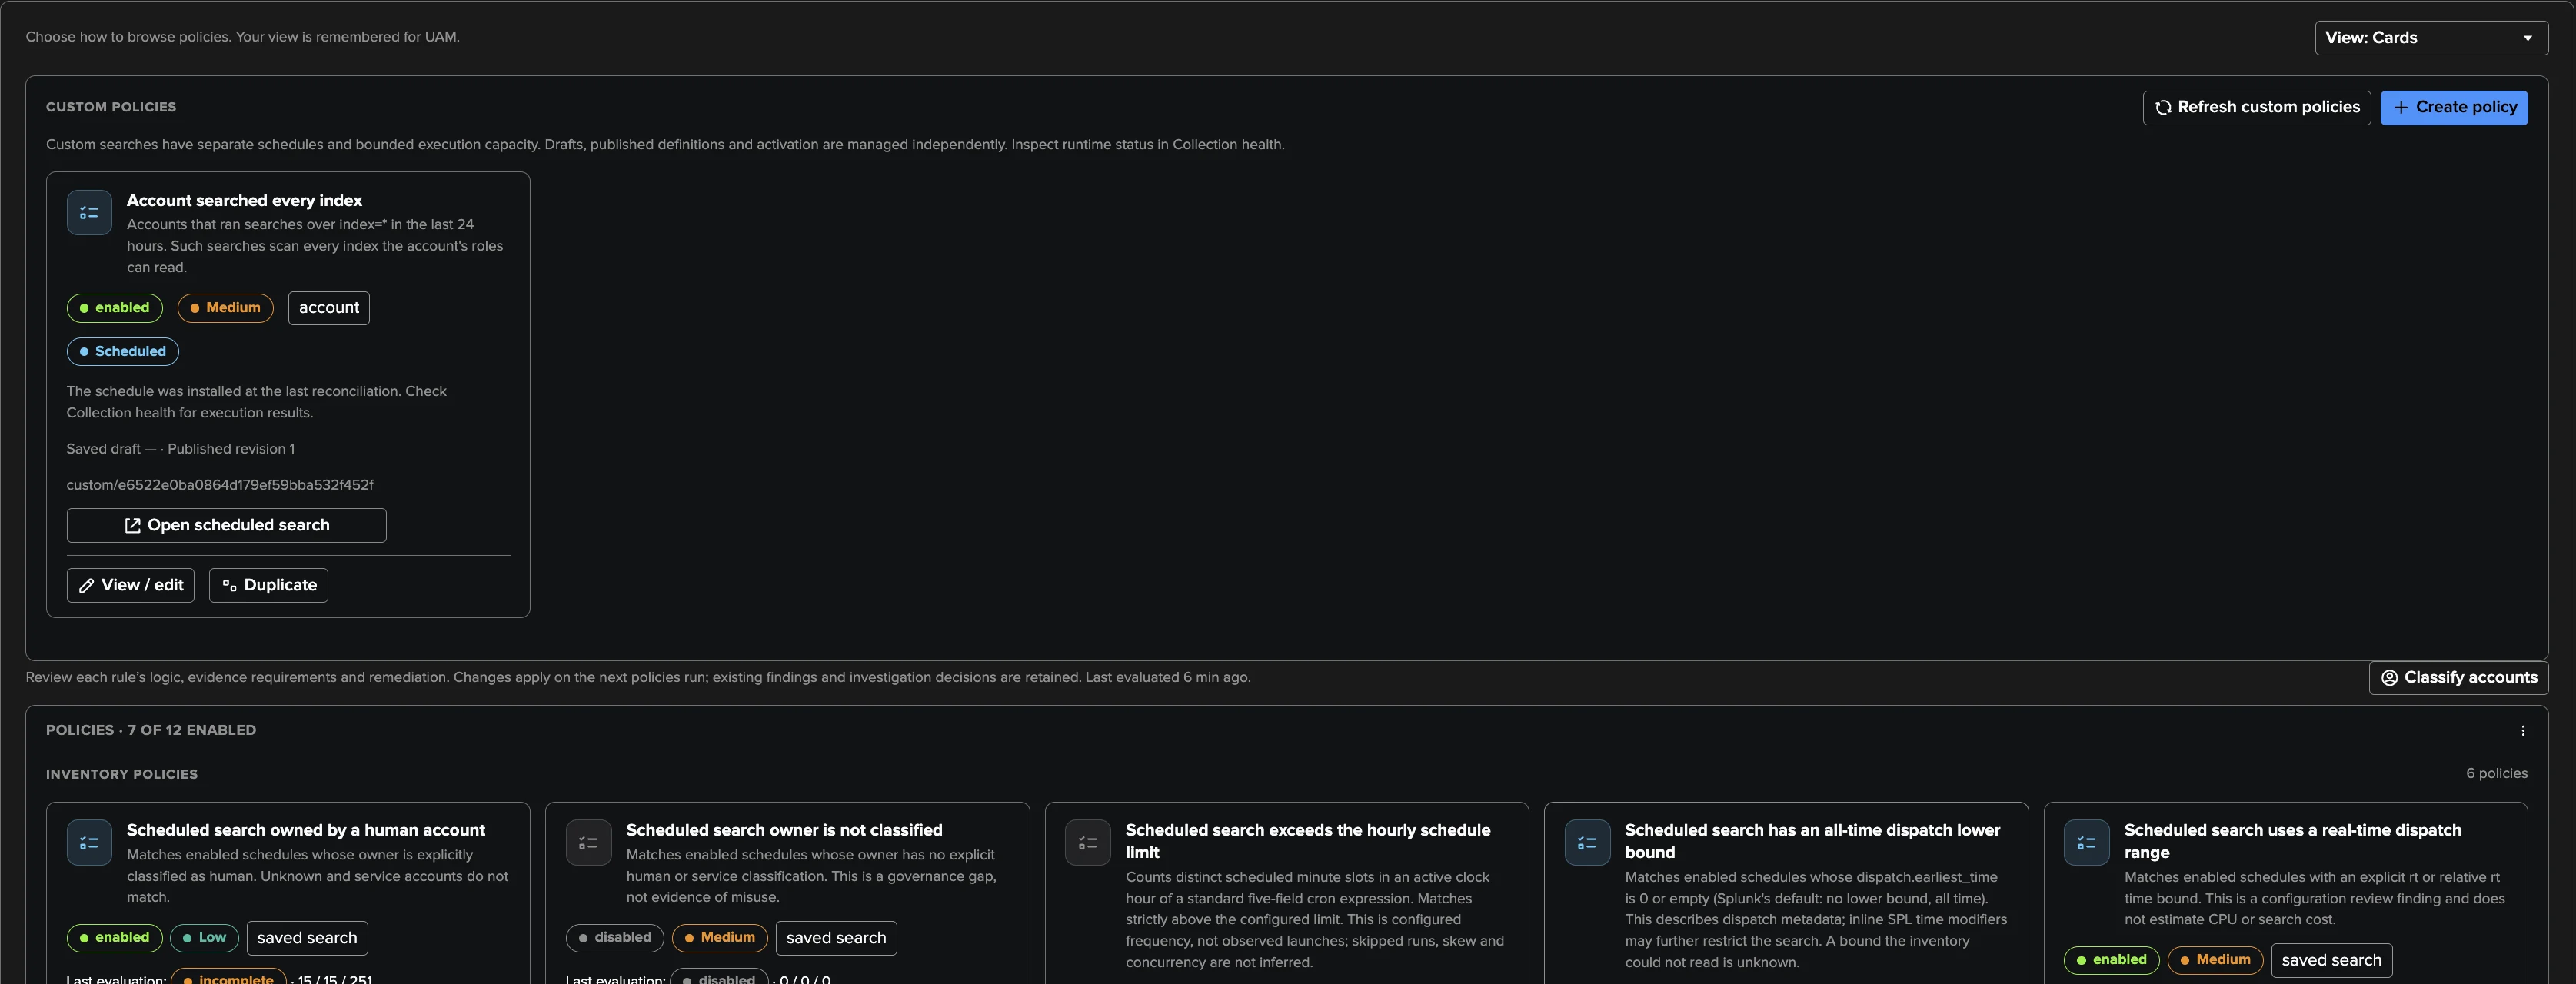
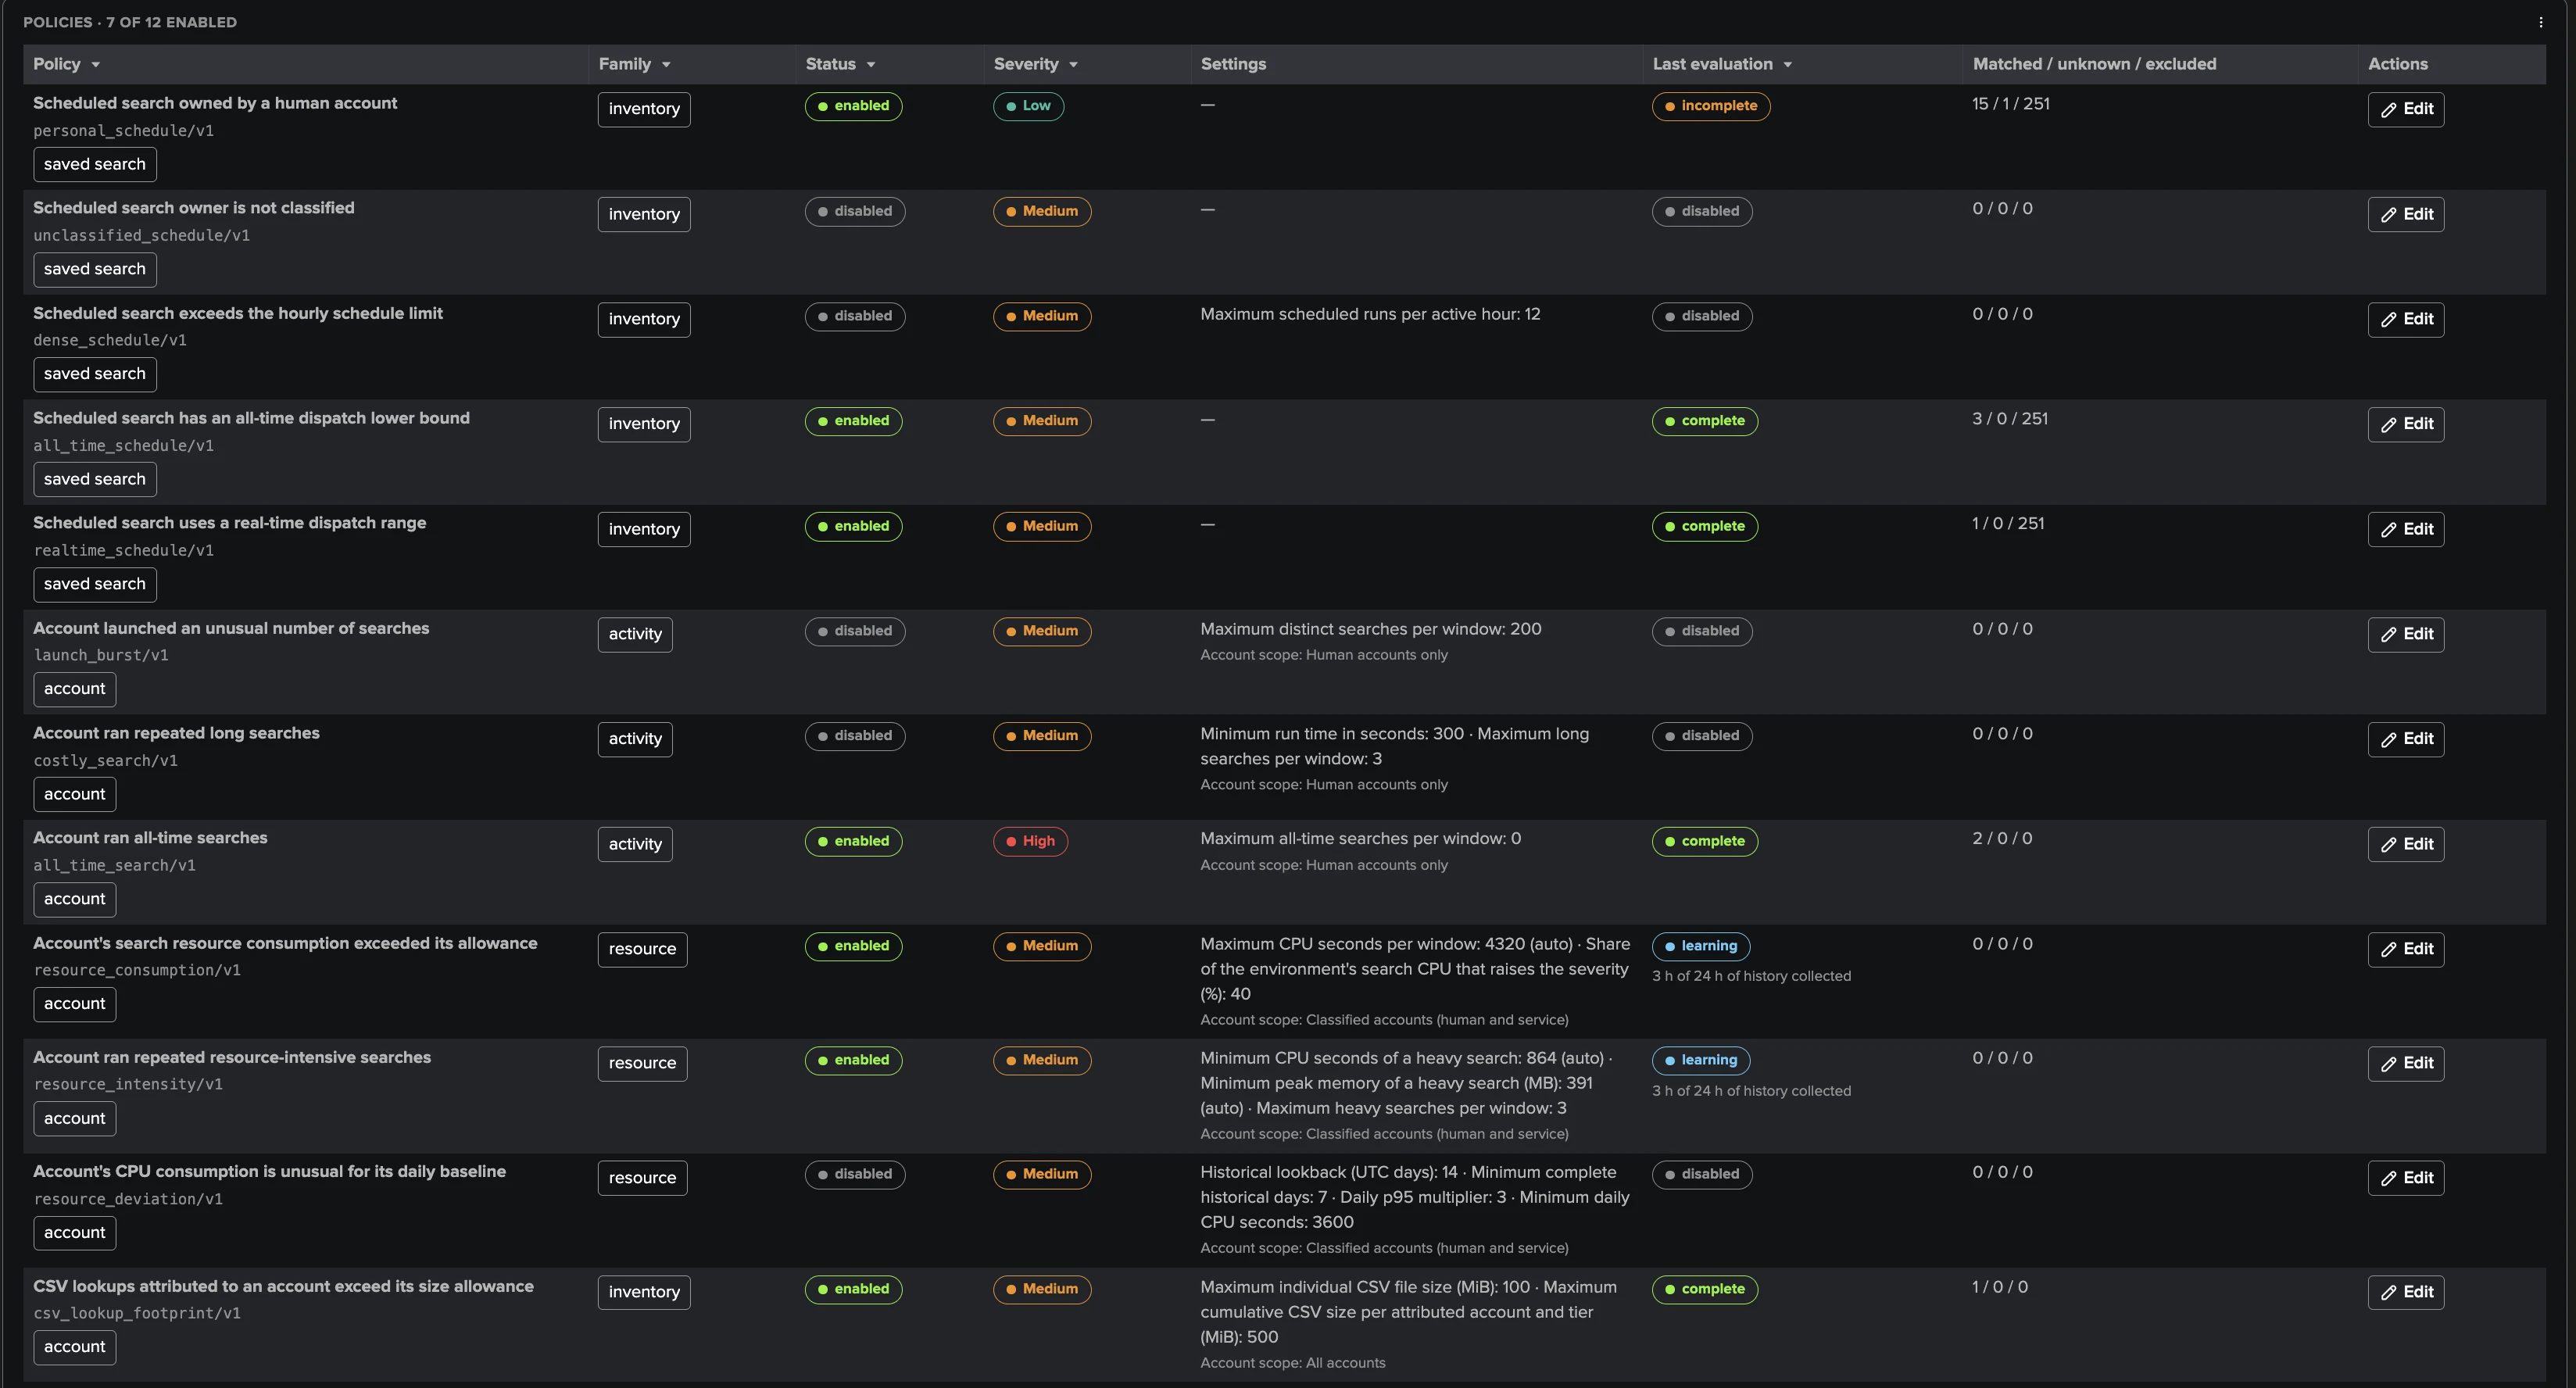
The built-in catalogue grouped by family (inventory, activity, resource) and your custom policies, shown as Cards, Compact cards or a List (remembered per user). Each policy shows its status, severity, account scope, thresholds (the effective values when they are derived from the capacity), exclusions, what it does on bank holidays and its last evaluation. Selecting the last evaluation opens the policy insight; Edit opens the policy editor. See Tuning the policies.
Audit changes
TrackMe’s own audit of this tenant: every configuration change, decision and collection request, with who did what and when — the same view every tenant type offers.
Collection health
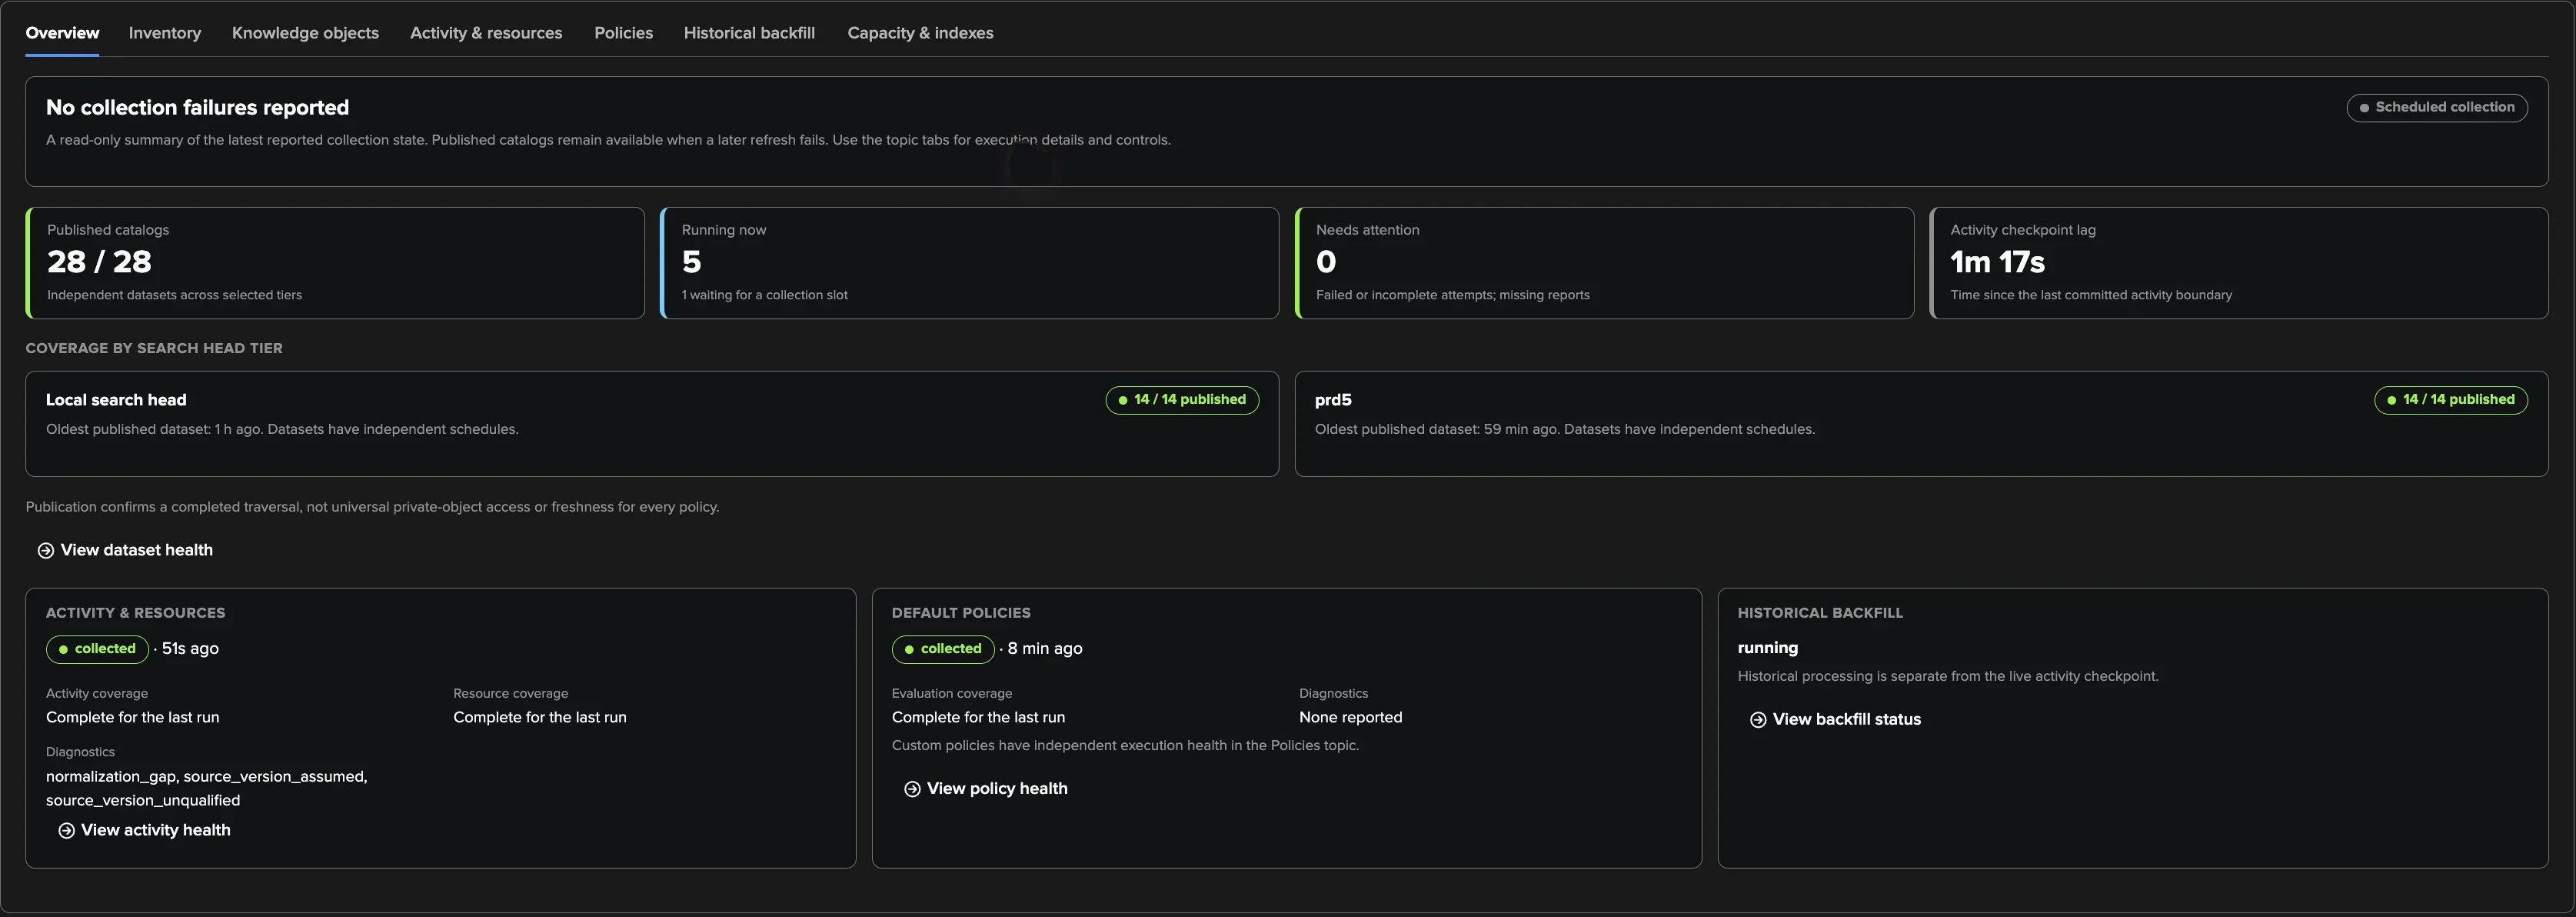
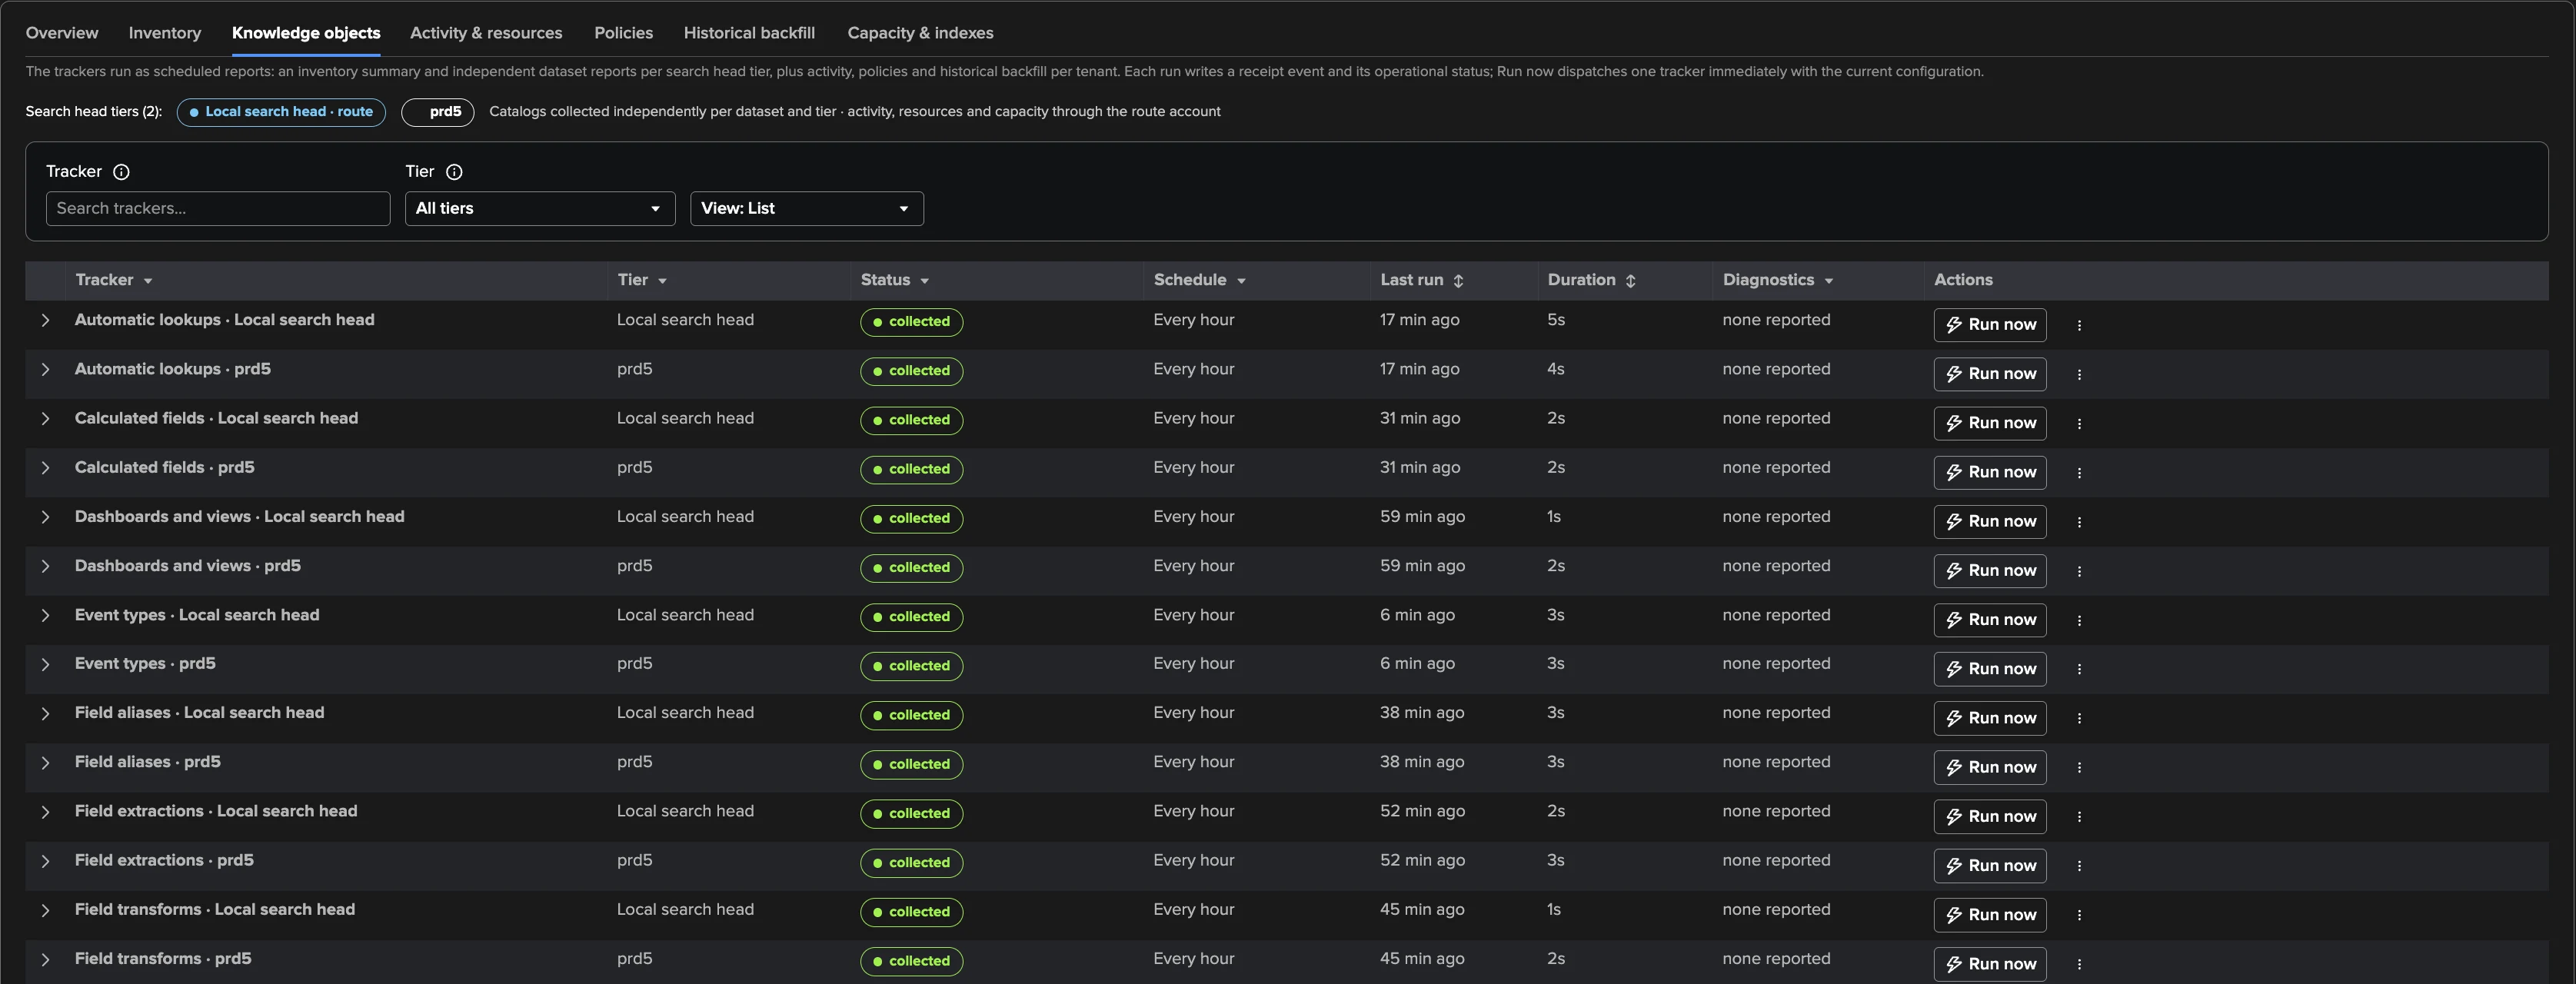
Is UAM collecting what it should? The Overview says what needs attention and the coverage by search head tier. Sub-tabs detail each area: Inventory, Knowledge objects (each catalog family per tier with its last complete collection and rows read), Activity & resources, Policies (default and custom), Historical backfill (progress, covered range, estimated time, Pause, Resume, Cancel backfill, Plan again) and Capacity & indexes.
Each report shows its schedule, last run, diagnostics in words and the events written, with Run now (List now for a full saved-search listing). Only one run of a report happens at a time; a run whose search provably stopped is recovered automatically after five minutes, otherwise Recover stopped run releases it. A lock is never taken over on age alone.
The Configuration Guardian check uam_collection_health warns when collection is not
running as configured — a missing or unscheduled report, missed schedules, repeated
failures, a stalled checkpoint, an overdue listing, failing notification delivery, a custom
policy that drifts from its schedule. See Configuration Guardian.
AI Agent
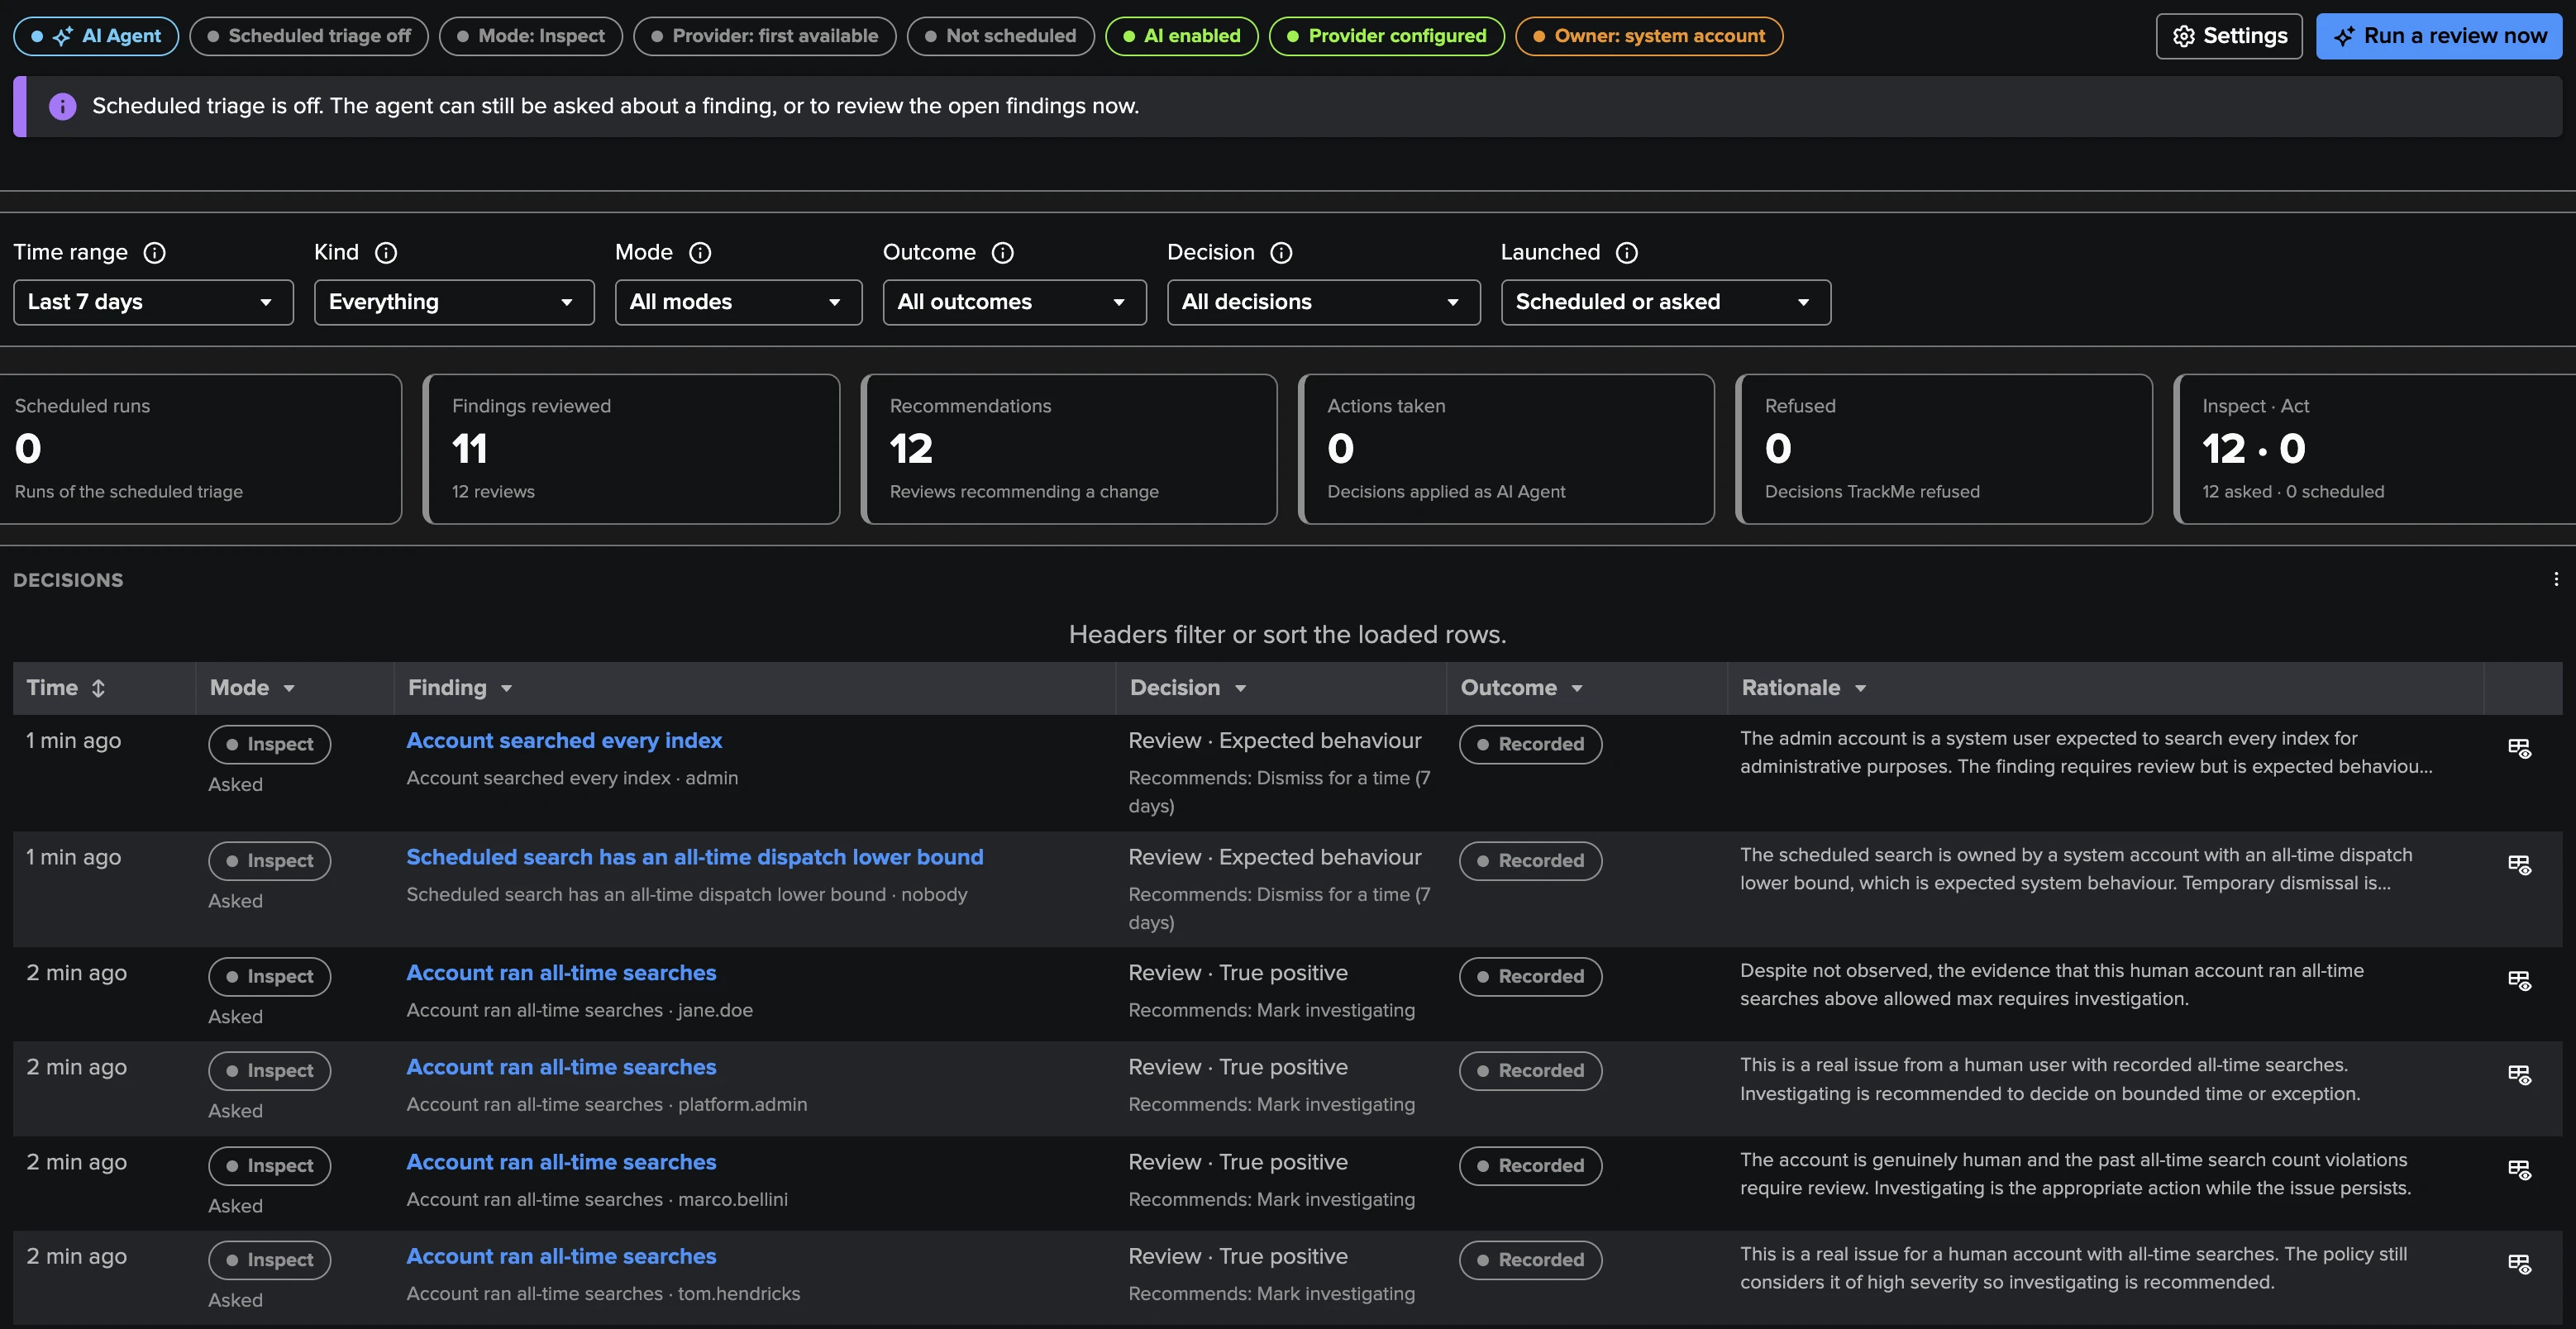
The UAM AI Agent: whether scheduled triage is on, its totals over 24 hours to 90 days, Run a review now, and the decision log with its filters (decision, mode, outcome, scheduled or asked). See The UAM AI Agent and the AI Assistant.
Settings
Every tenant setting in one page with one Save settings: Environment (the tiers and the route account), Activity scope (advanced), Collection (scheduled trackers, Store SPL search, resource collection), Indexes, Collection limits, Notifications to operators, Notifications to users, Account classification, AI Agent, Assignment and Finding actions. Changes apply from the next runs; Collect now applies them immediately. If someone else saved in the meantime, your save is refused and you are asked to reload. Every setting is described in Settings reference.
Accounts and classification
A finding about an account only makes sense once you know what the account is. UAM keeps three classes, and the class decides which policies apply:
human — a person. Detected automatically from interactive activity: a search run from Splunk Web (the Search app, a dashboard, a report opened by a person) or a browser login to Splunk Web. One is enough, and the class stays.
service — automation. Detected after seven distinct days of automation-only activity (API jobs, the scheduler, acceleration) and nothing a person does; withdrawn as soon as the account does what a person does. This detection needs the classic
key=value_auditformat, and the seven days must be inside the audit retention.system — Splunk’s context identities (
nobody,splunk-system-user) and the built-inadmin, preset. System accounts are never evaluated by the account policies and never receive email.
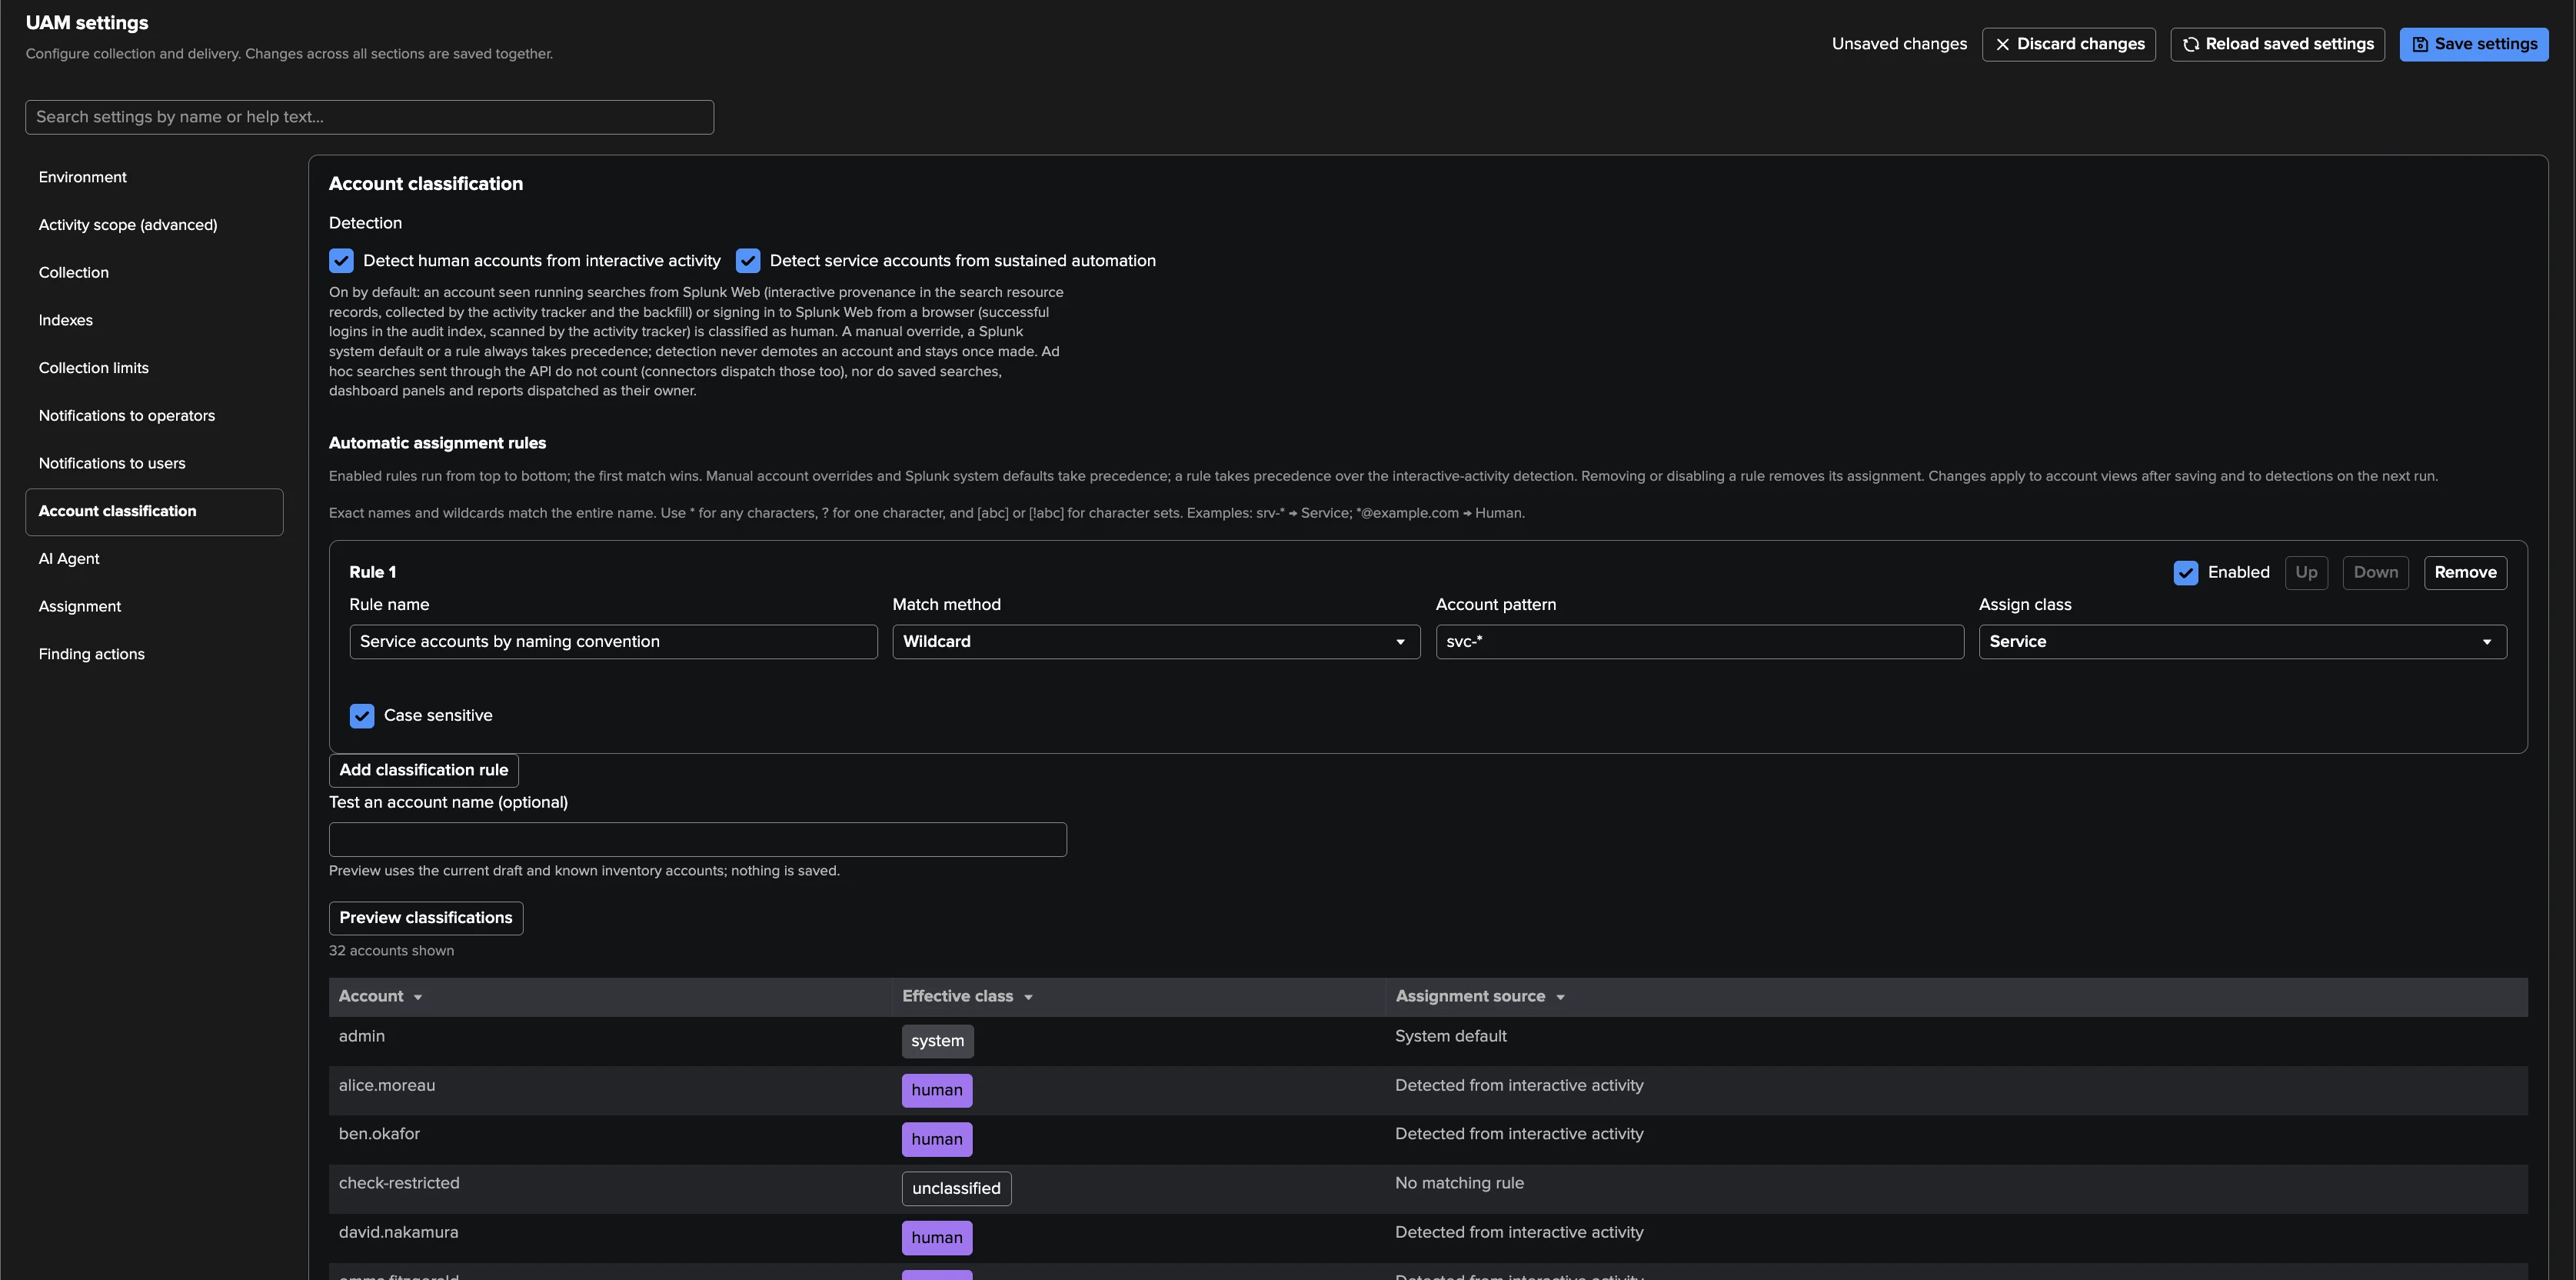
On top of the detection, set manual classes per account (Users tab or Settings →
Account classification) and ordered classification rules (exact names or wildcard
patterns such as svc-*), with a preview of the effective class before saving. Precedence
is always: manual class, system defaults, the first matching rule, human detection, service
detection. An account nothing classifies stays unclassified and is left out of the
policies scoped to human accounts.
Tip
Classify the monitoring itself first. Classify the tenant owner (svc-a), your
administrator accounts and other platform automation as system or service: they
run TrackMe’s collection and the platform’s housekeeping and should not fill the
findings. The trackme and Splunk_SA_CIM apps are excluded from the policies by
default for the same reason.
Triage findings
Observed, not observed, and the status
A finding has two independent axes:
Whether the policy still sees the condition. While it does, the finding is observed. After a complete policies run that no longer sees it, the finding reads not observed — UAM never resolves it for you: a configuration or a behaviour that disappears from one evaluation still deserves a human decision. A run that could not cover everything (an incomplete inventory, an activity gap) may add findings, never clear them.
Your decision, the status: Open, Investigating, Resolved or Dismissed.
A resolved finding that is observed again is reopened. A dismissed finding stays dismissed until its dismissal ends — then it returns to open, so you get another look. The lifecycle shared with the other findings tenants is described in A finding and its lifecycle.
Finding groups
All the findings about one account and the saved searches it owns form one Finding
group: the all-time searches and resource consumption of analyst-a together with the
personal-schedule and real-time-schedule findings of the searches analyst-a owns. A
saved search without an owner keeps a group of its own. You decide once, for the group:
status, dismissal, assignee, notification snooze and severity apply to every member, and a
finding that joins the group later takes its state.
Two UAM specifics:
Dismiss only this finding (member menu) sets one finding aside — for example a personal schedule you accept inside a group that also holds a real problem. It stays dismissed on its own while the rest of the group is decided on; Reopen this finding brings it back into the group’s state.
A new kind of finding on a dismissed group returns the group to open with the new finding, while the findings the dismissal covered stay dismissed: a dismissal never silences a new problem.
You can also group by hand — Merge into one Finding group (2 to 25 groups), Add to the Finding group (an existing manual group), Remove from the Finding group, Ungroup — for example to handle the accounts of one project together. The findings of one account always move together. See Finding groups.
Decisions
From the row, group and member menus, the selection toolbar (Bulk edit) and the Triage panel of the Investigate view:
Decision |
What it does |
|---|---|
Mark investigating |
Someone is on it. |
Resolve |
The investigation concluded. The policy reopens the finding if it observes the condition again. Nothing is changed on the saved search or the account. |
Dismiss |
No action needed: for 1, 7, 30 or 90 days, or until reopened by hand (permanent). A dismissed finding stays listed under the Dismissed tile. |
Reopen |
Back to open; on a dismissed finding, ends the dismissal now. |
Assign to me, Assign to…, Unassign |
To a Splunk user or an assignment group. The assignee is kept when the finding reopens. |
Snooze notifications |
Holds the operator emails (from 1 hour to 30 days) without changing the status; Clear notification snooze resumes them. It does not hold the notifications to users. |
Set severity |
Overrides the policy severity (Low, Medium, High, Critical); the override survives later runs. Choosing the derived severity again (Members on a Finding group, Use policy severity on a single finding) restores it. |
Notes |
Markdown notes on a finding or a Finding group, permanent or expiring, plus a short investigation note recorded with each decision. |
Exclude owner from this policy |
Adds the finding’s owner to the exclusions of its built-in policy (custom policies write their exclusions in their SPL). |
The row menu also has Send email communication, Send webhook… and your own actions under Custom actions, Ask the AI Agent…, the account view and saved search view, Copy finding ID and Open record / events in search.
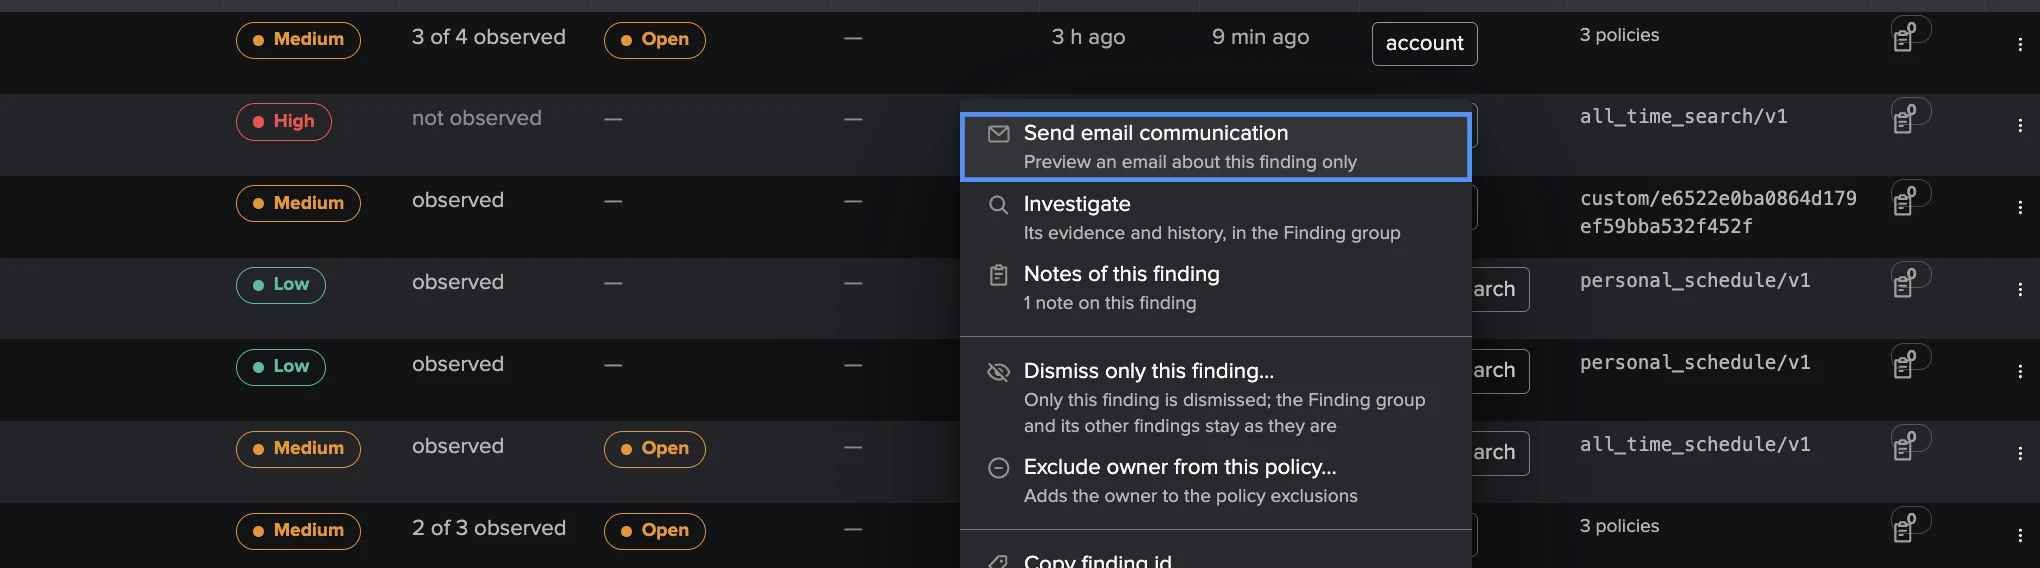
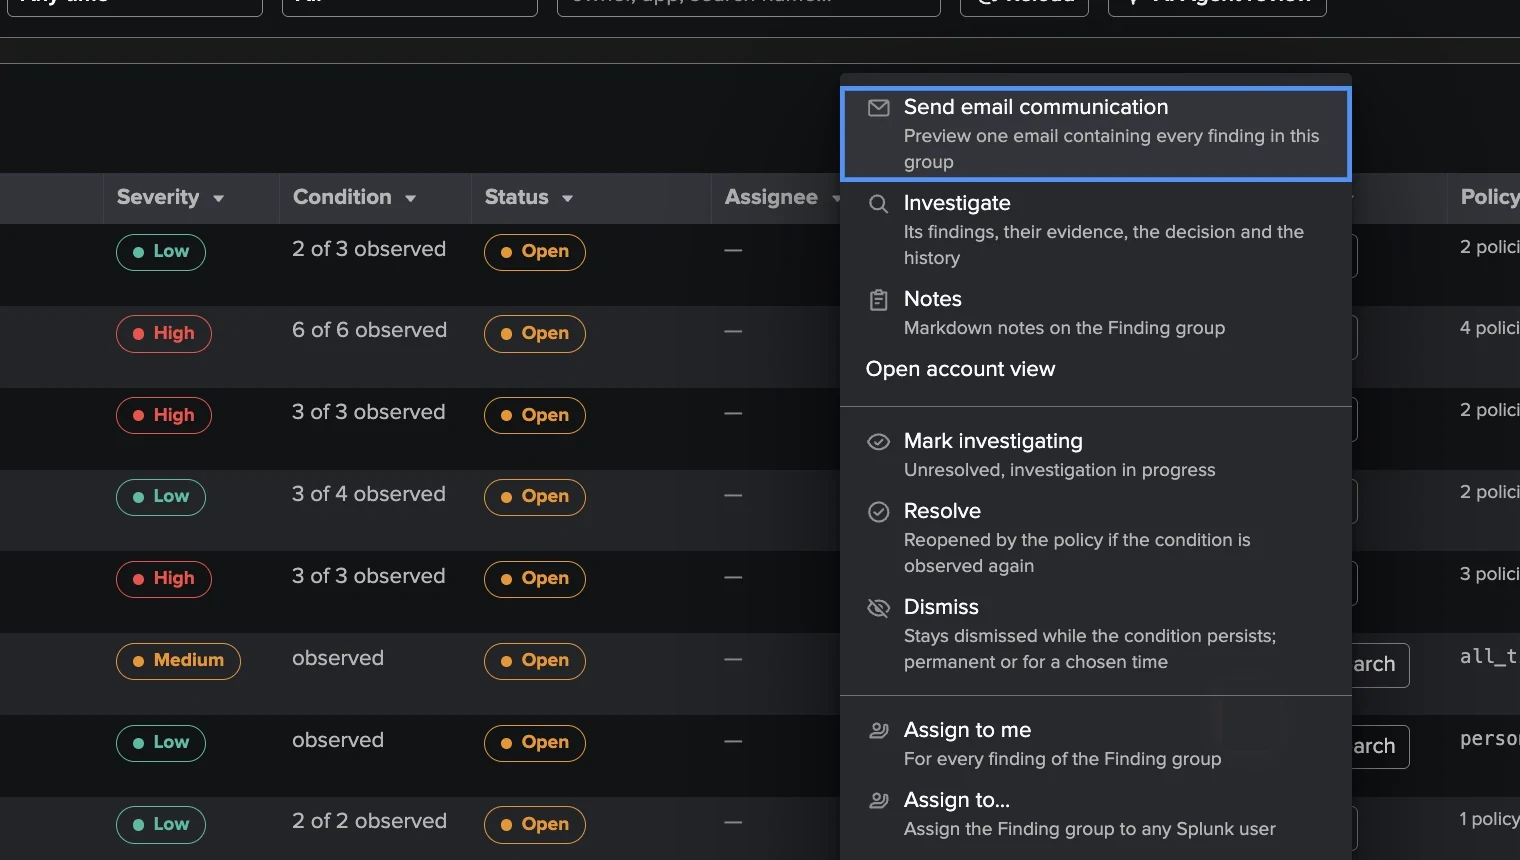
Every decision is recorded in the history of the finding and of its Finding group, with the actor, the time and the note. Decisions are protected against concurrent changes: if the Finding group changed since you opened it, your decision is refused and the table reloads.
Assignment and findings actions
Assignment groups — “Platform team”, “Security operations” — and ordered routing rules (by policy, severity, subject type, owner or account, app, environment) are set in Settings → Assignment; routing assigns new Finding groups automatically, never overriding an existing owner, and can email the assigned team. See Assignment and automatic routing.
Findings actions (Settings → Finding actions) add drilldown searches, links,
webhooks through system-wide Webhook accounts, and the email action to the finding
menus, by hand or through per-policy automation rules (policy editor → Automations).
UAM presets include Audit activity of this account, Scheduler runs of this saved search
and Finding transitions. Tokens such as $subject.account$, $subject.owner$,
$subject.app$ and $subject.name$ carry the finding’s values. See
Findings actions and Webhook accounts.
Every finding transition is also indexed in the tenant’s notable index as
sourcetype=trackme:uam:finding, ready for your own Splunk alerts, Enterprise Security
correlations or SOAR playbooks.
Communicating with users
UAM can talk to two audiences: the operators who triage, and the accounts the findings are about. The two are independent.
Notifications to operators
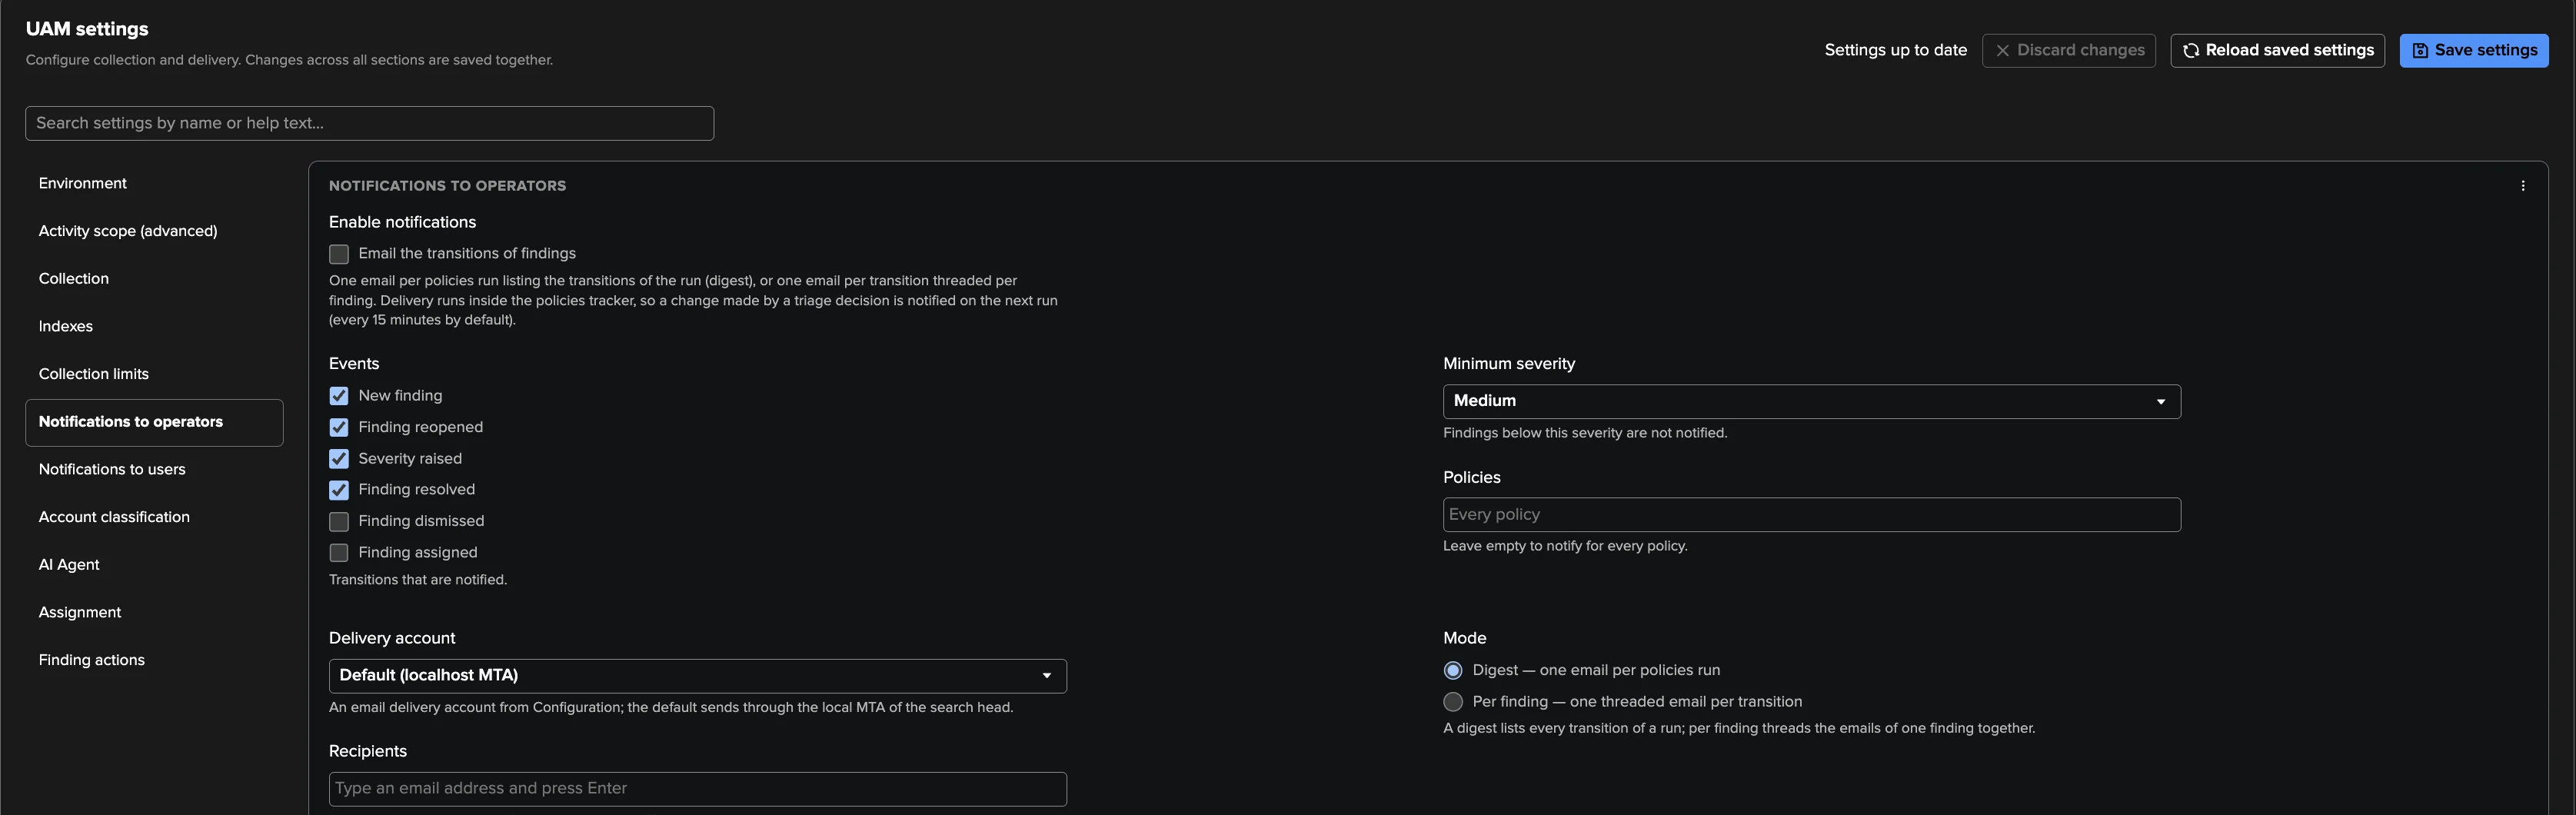
Settings → Notifications to operators (off by default): the events that send an email (New finding, Finding reopened, Severity raised, Finding resolved, and optionally Finding dismissed and Finding assigned), the minimum severity (Medium), the policies (all), the email delivery account, up to 50 recipients, and the mode: a Digest (one email per policies run) or Per finding (one thread per finding). Emails are sent at the end of the next policies run, within about 15 minutes, and link to the finding. Send test email uses the saved settings, even while notifications are off.
Notifications to users
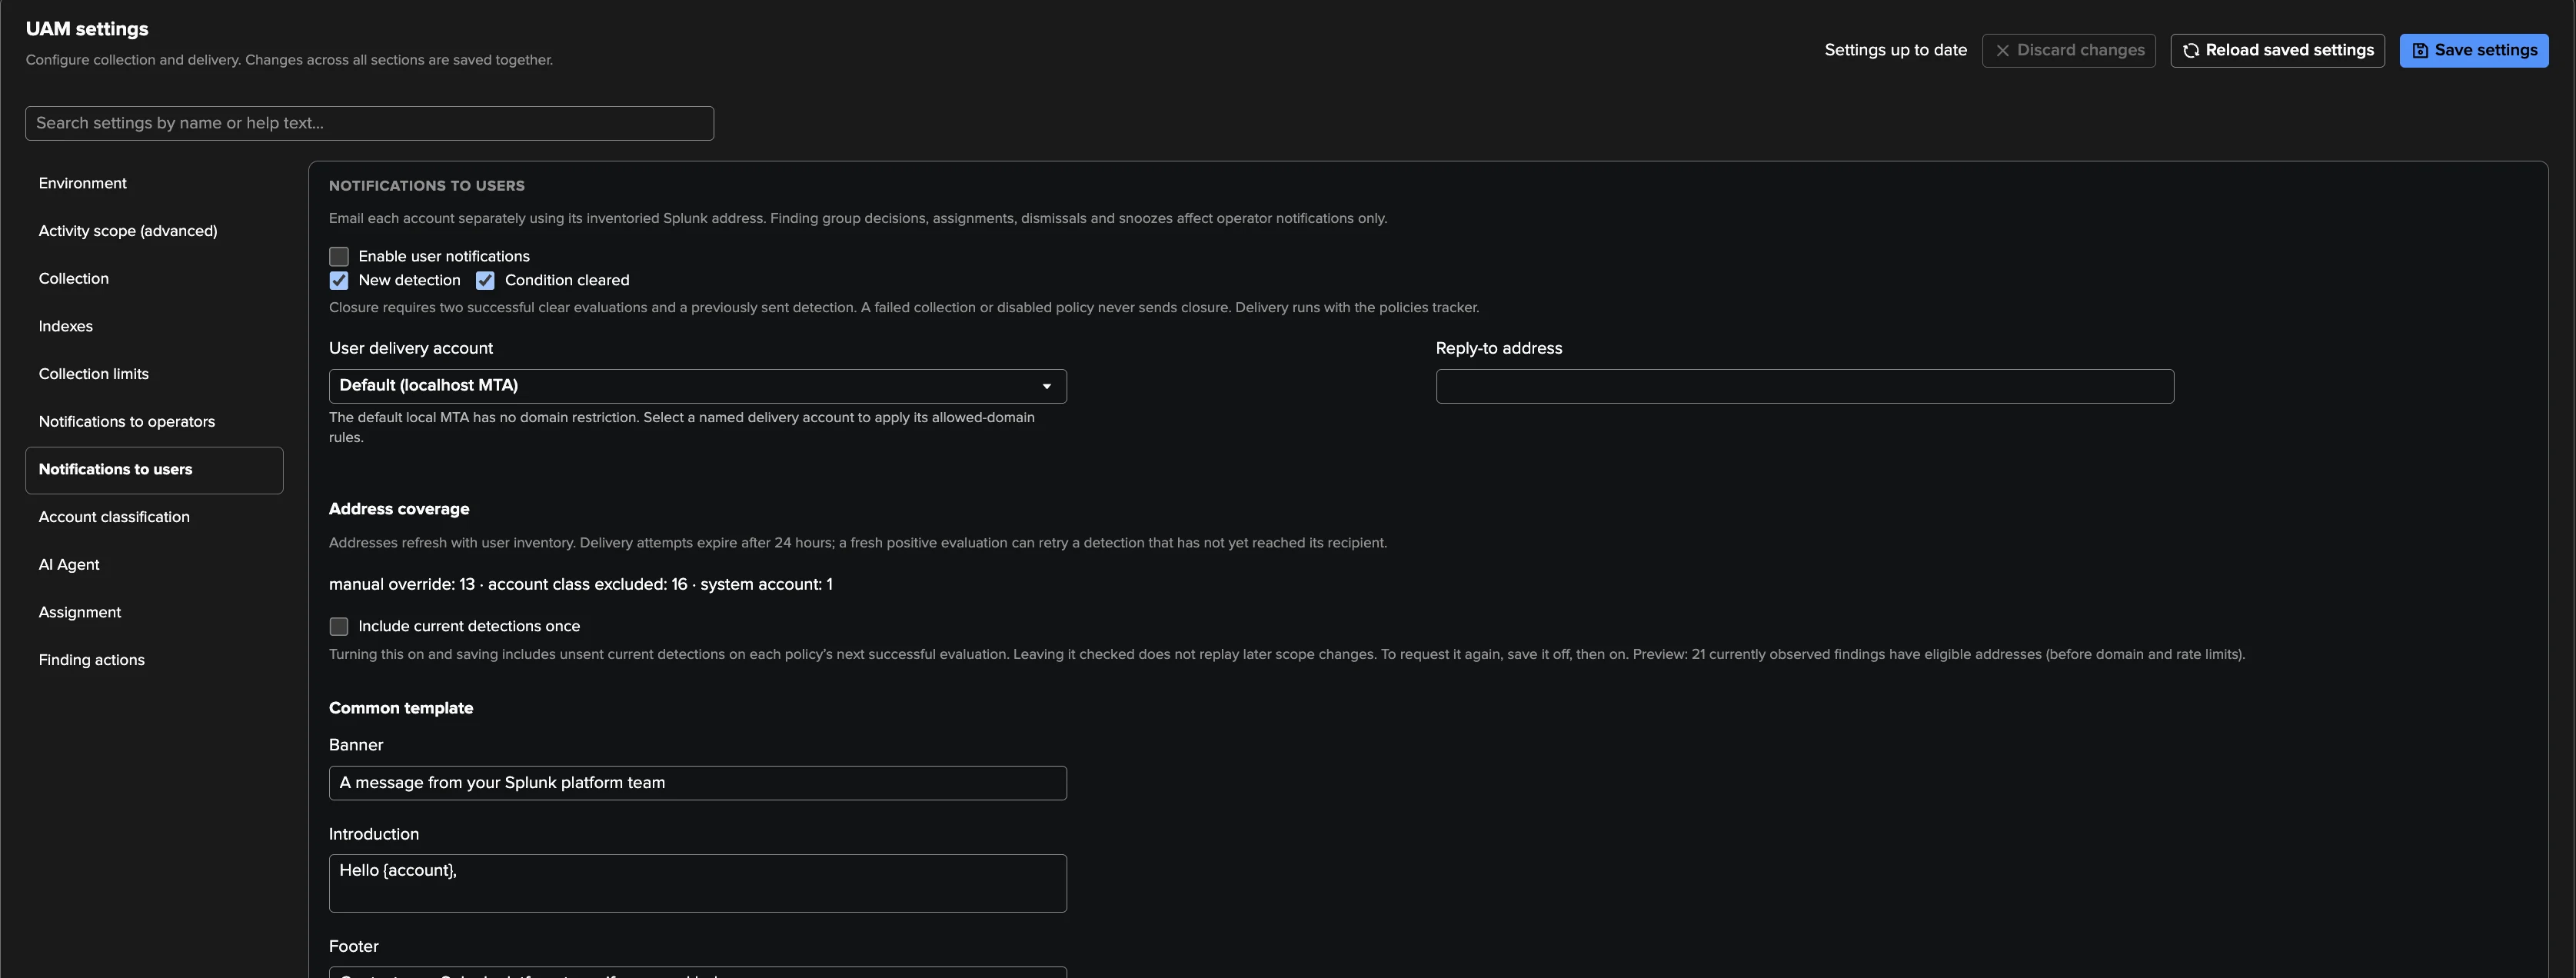
Settings → Notifications to users (off by default) emails the account a finding is about, so that people fix their own searches:
on a New detection, and when the Condition cleared (after two consecutive complete evaluations without it);
addresses come from Splunk’s user records on each tier, or from an administrator’s Override email address; system accounts never receive mail, human accounts do by default, service and unclassified accounts only if you opt in;
a common banner, introduction, footer, reply-to address and HTTPS support link, combined with each policy’s own subject and body (Policies → Edit → Email template);
limits: 50 emails per run, 3 per address per hour, 24 hours between repeat detections.
When you turn it on, UAM records the current findings as a baseline and only emails what is detected from then on, unless you choose Include current detections once. User emails follow the policy’s detection, not your triage: resolving, dismissing or snoozing a finding does not stop them.
Important
Before turning on notifications to users, check the address coverage shown in the section, set the reply-to address and the support link to your team, and preview the email template of each enabled policy. The people who receive these emails did not ask for them: make the first one clear and useful.
Send email communication
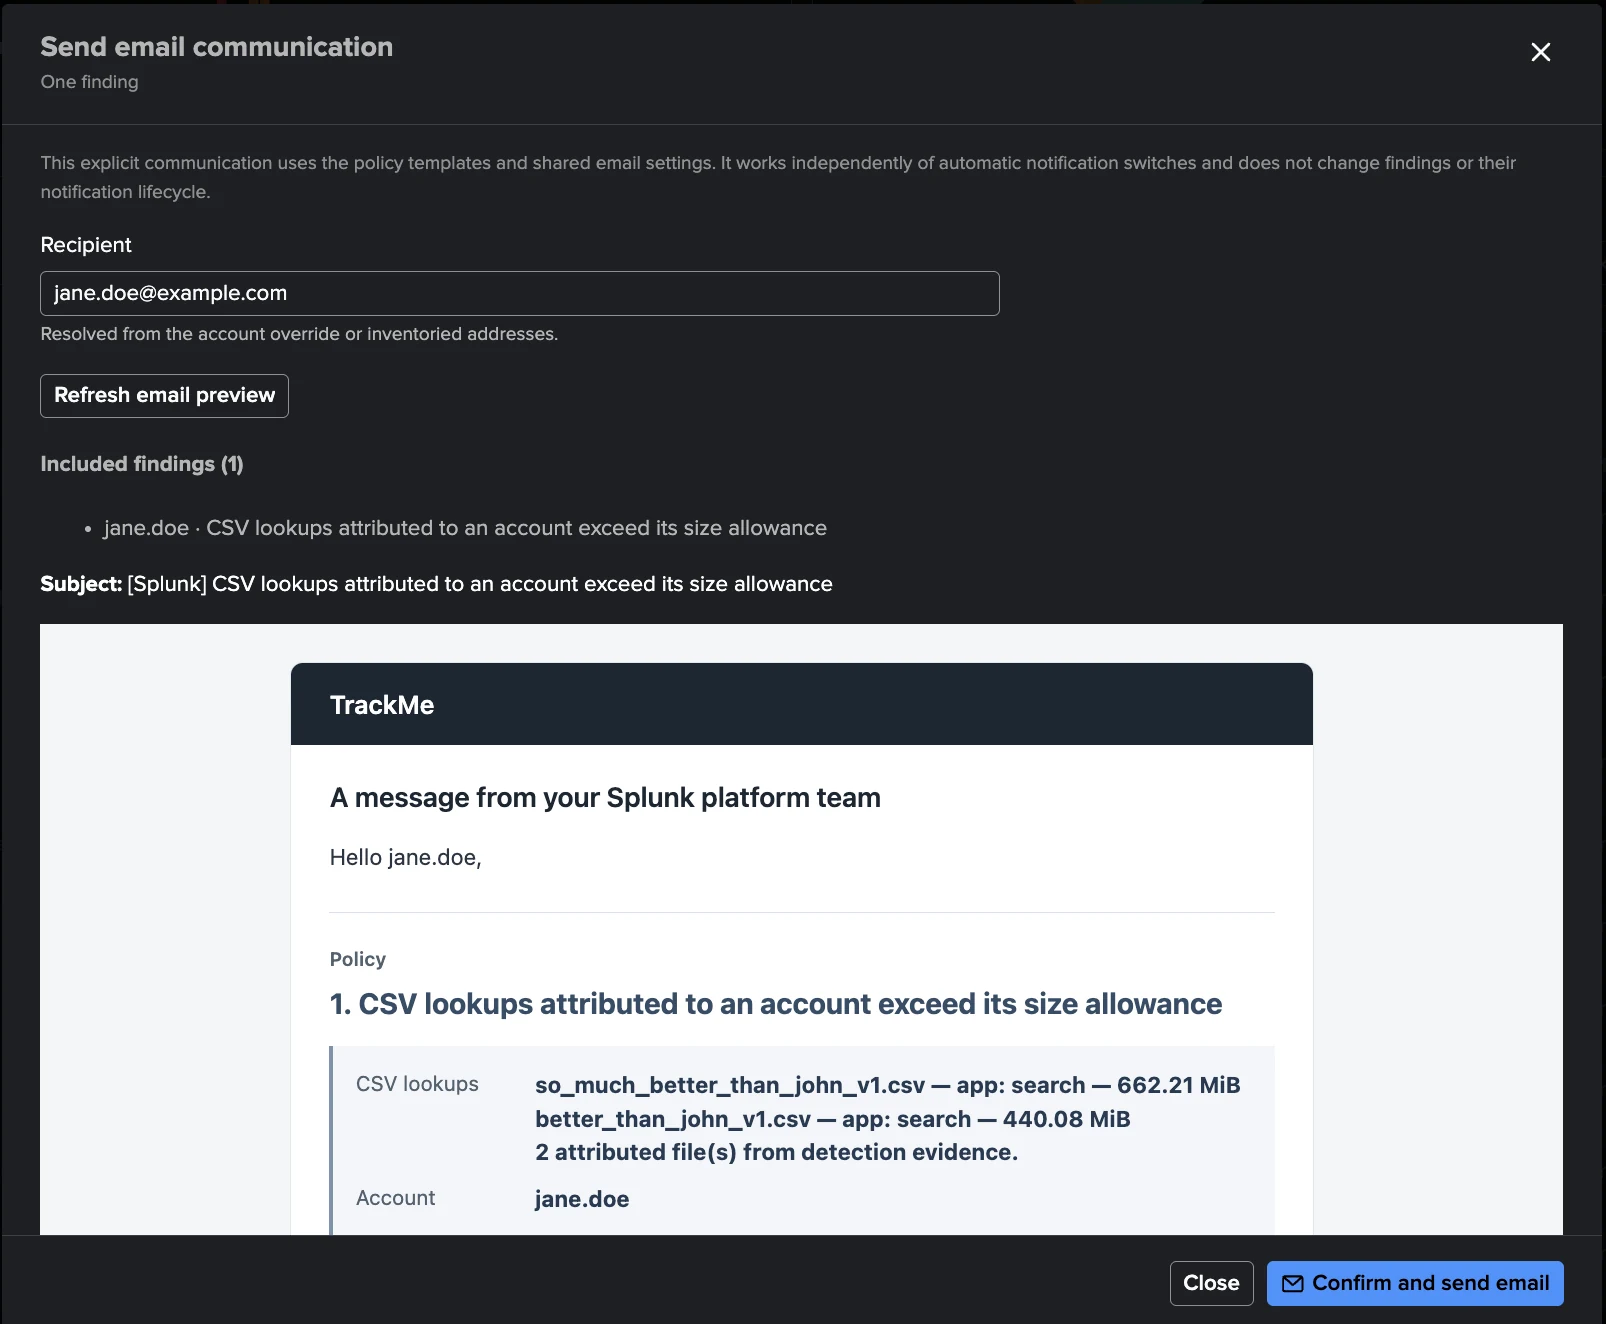
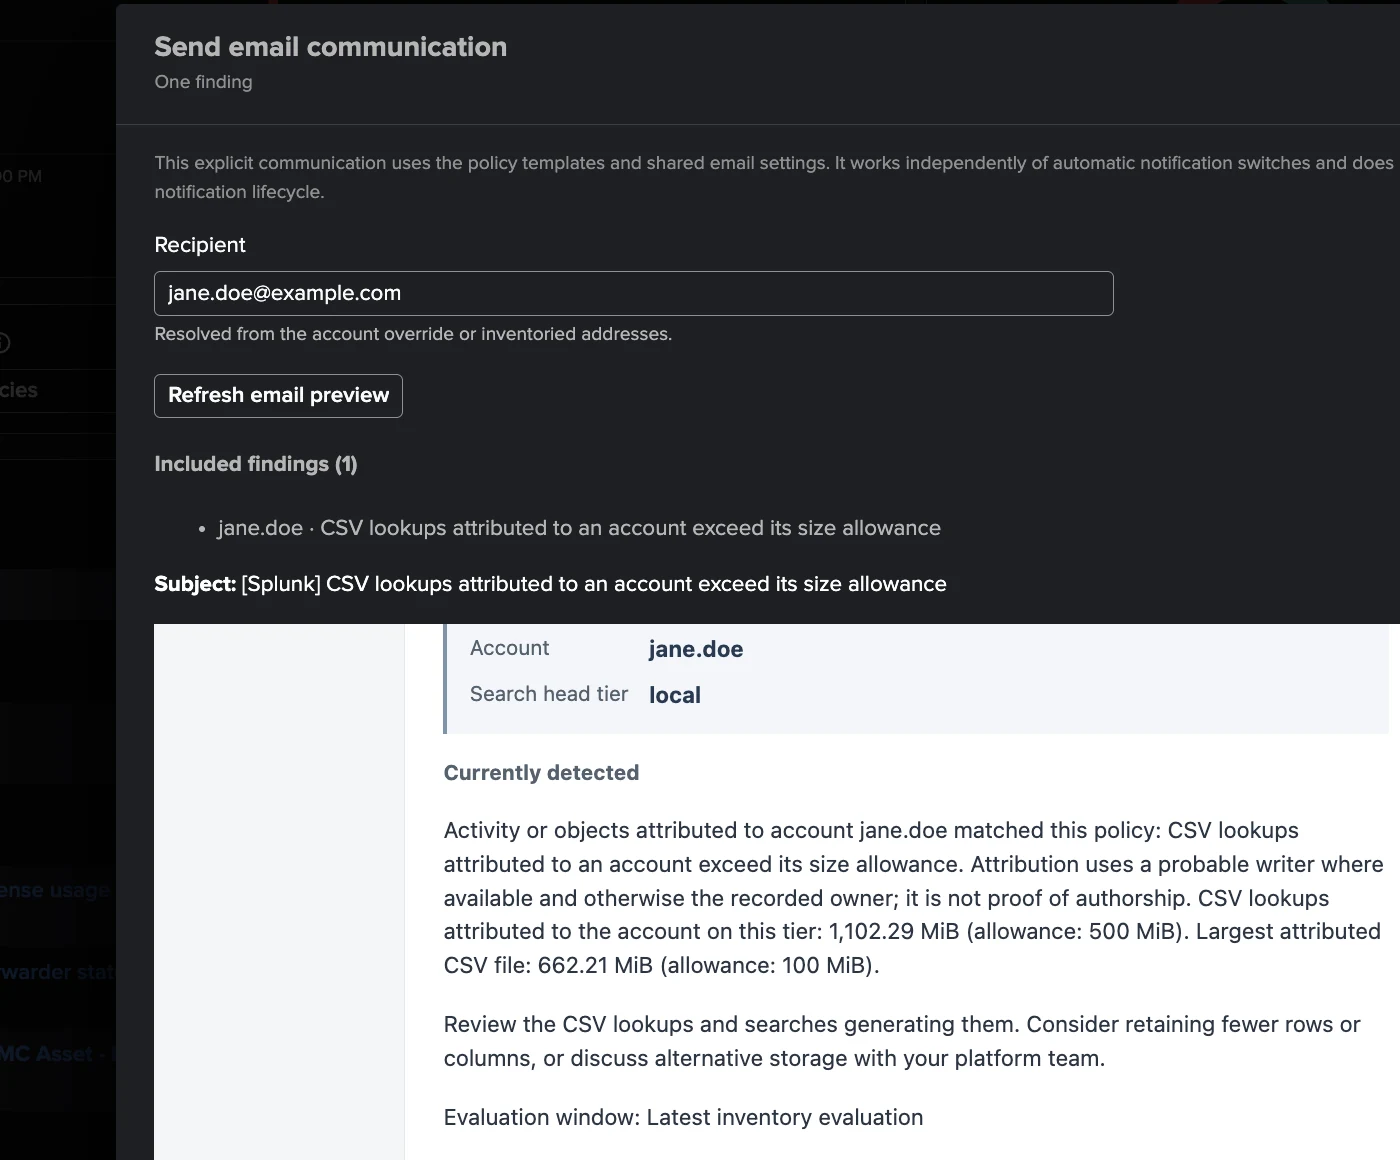
For a one-off message, Send email communication in a finding, member or Finding group menu prepares an email to the account concerned — one finding, or a whole group (up to 200 findings) in one email. You review the preview, can change the recipient once, and confirm explicitly. The email is sent by a TrackMe search job, never by the browser, and a delivery that could not be confirmed is reported, never resent blindly.
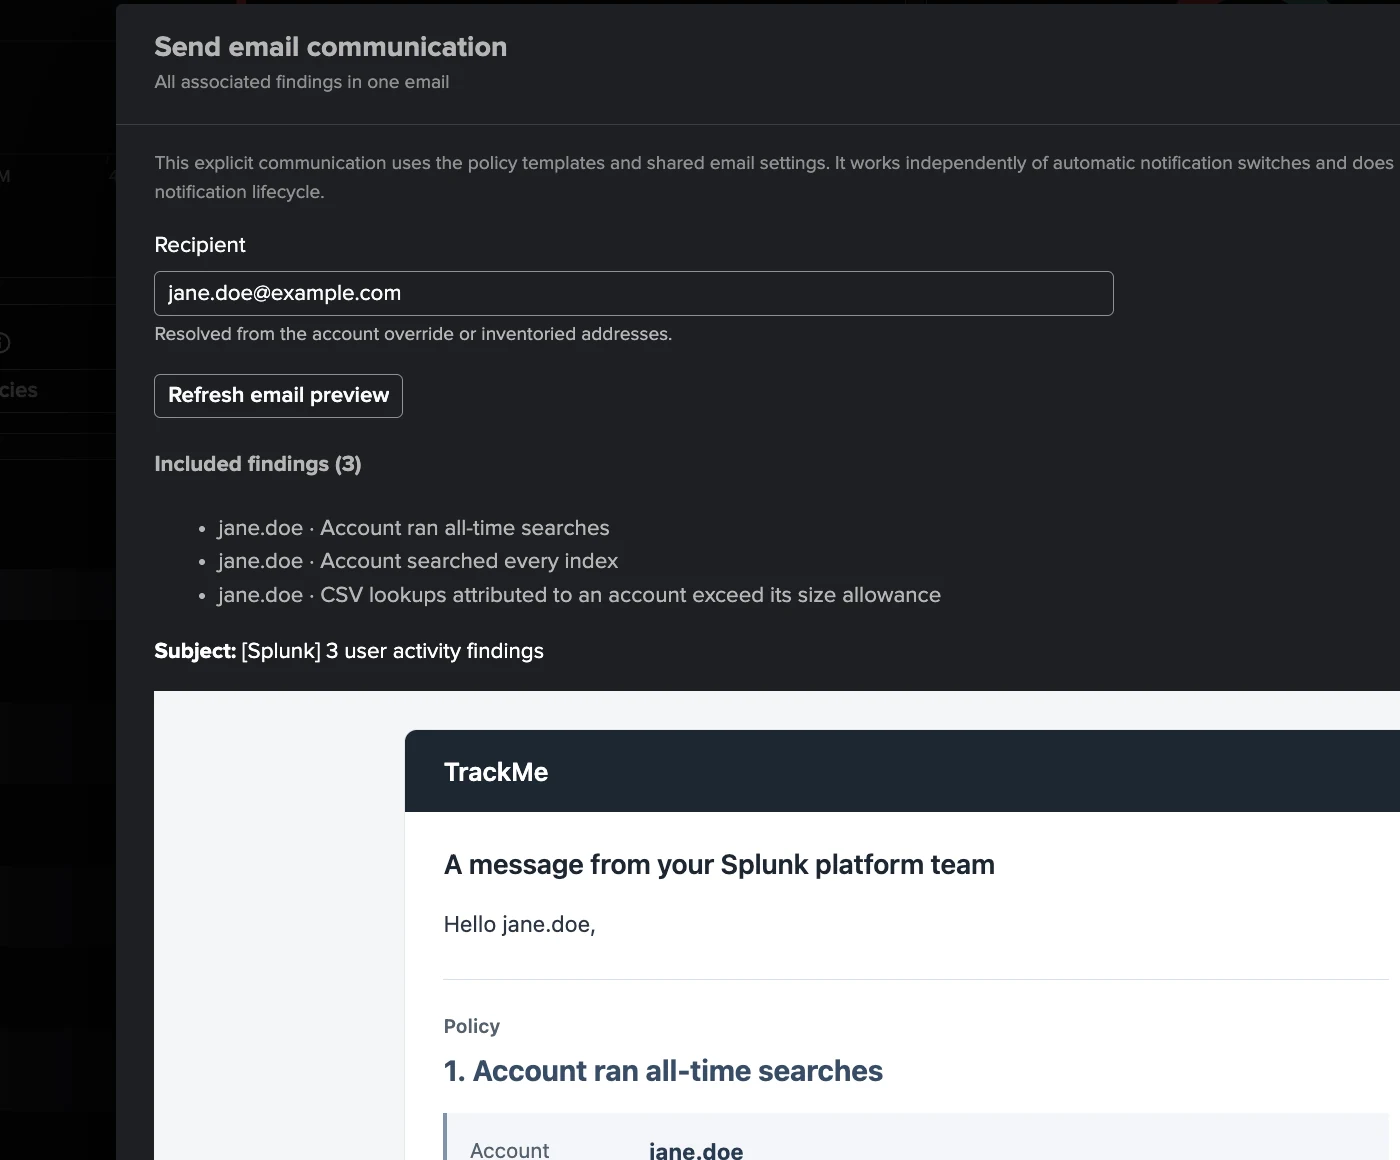
From a Finding group menu, the same dialog prepares one email for every finding of the group:
here the three findings of jane.doe — a built-in activity policy, a custom policy and the
CSV lookup footprint — under the subject 3 user activity findings.
The UAM AI Agent and the AI Assistant
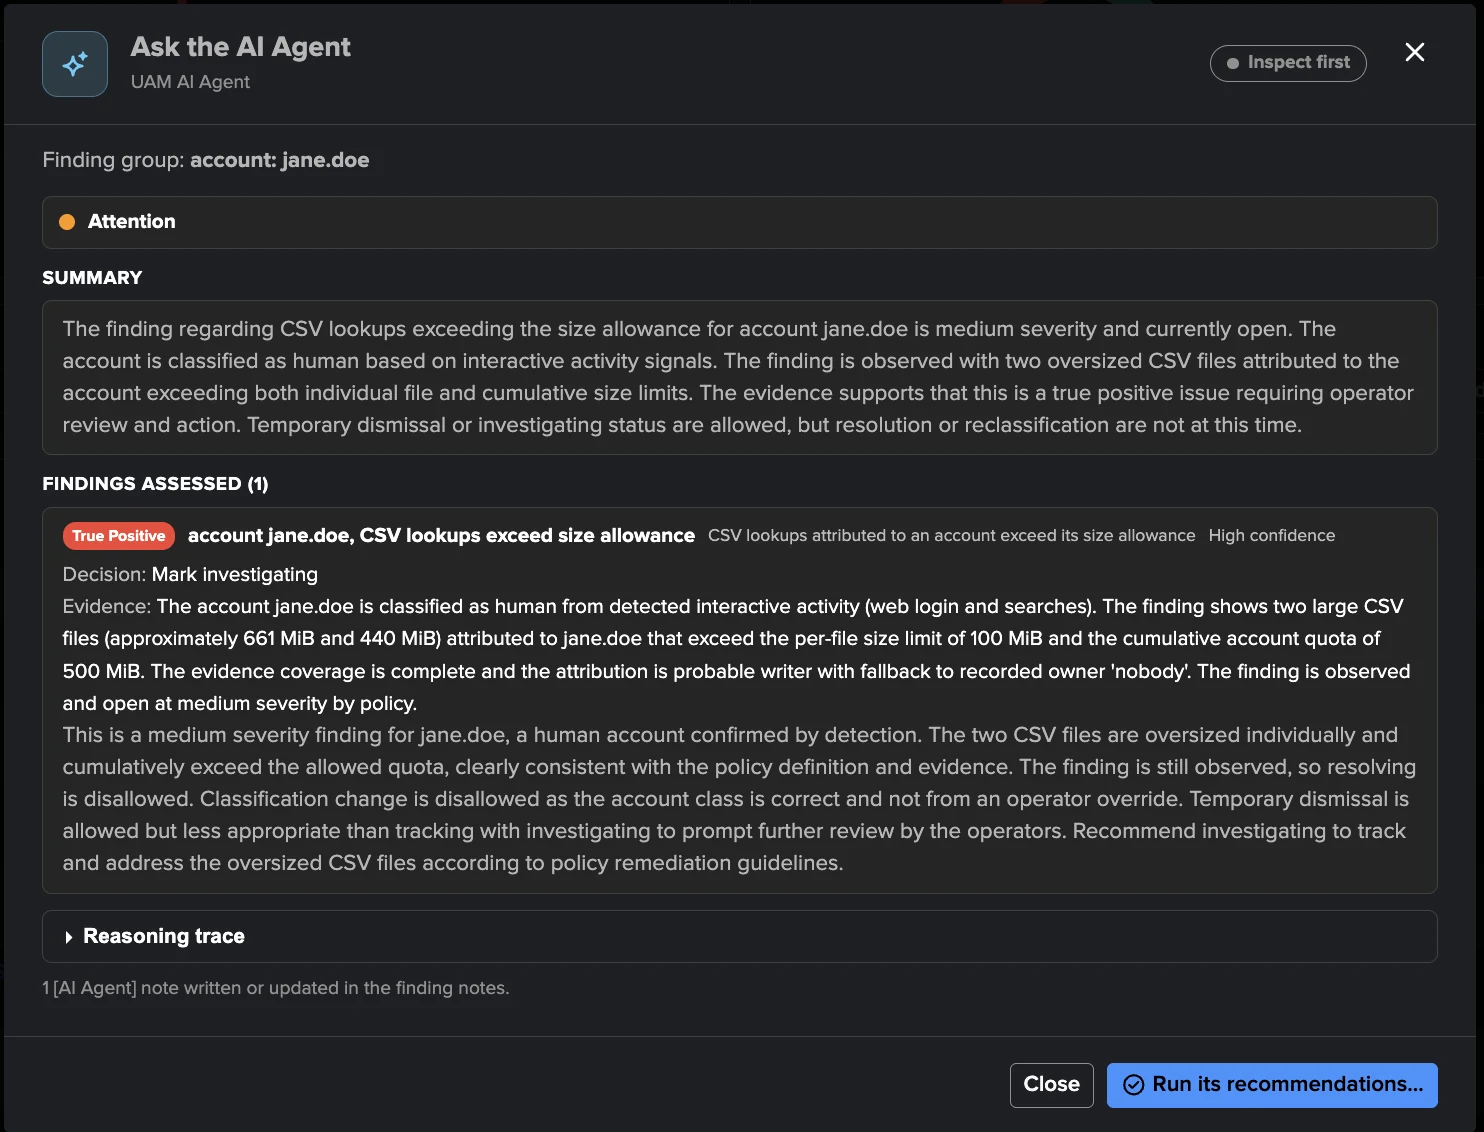
The UAM AI Agent reviews findings the way an operator would: it reads the evidence
TrackMe holds and writes its assessment as one current [AI Agent] note per finding.
Inspect changes nothing: assessment, confidence and recommendation.
Act also applies the decisions the tenant allows: mark investigating and dismiss for a time (on by default, never for a critical or high finding still observed), resolve a finding its policy no longer observes and classify an unclassified account (off by default). It never dismisses permanently, assigns, or changes a severity, a policy or a setting.
Ask the AI Agent… in a finding or group menu inspects one Finding group on demand; you
can then let it act on that inspection. Scheduled triage (Settings → AI Agent, off by
default) reviews up to 10 findings every hour — by default only critical and high ones,
one per Finding group — and never overrides a decision or an assignment made by a person.
Every decision appears under the actor AI Agent in the history and in the AI Agent
tab. The AI Agent needs the AI Assistant to be enabled with at least one AI provider; the
scheduled triage also needs a tenant owner other than nobody or splunk-system-user.
The UAM AI Agent replaces the UAM Findings Advisor of earlier releases. See
Findings AI Agents and AI Agents for findings.
Custom instructions. The tenant administrators can give the agent instructions in plain
English (Settings → AI Agent → Custom instructions, also in Manage AI Agents automation and
in the Configure tenant dialog): at most 4,000 characters, line breaks kept. Every run of
the agent follows them, asked or scheduled — for example, “The accounts named svc_* are
service accounts.” They never widen what the agent may do: the allowed decisions and
TrackMe’s checks before every decision still decide. The tenant’s shared Custom
Instructions of Manage AI Agents automation are different: they apply to scheduled runs
only.
Evaluate… tries the unsaved draft before you save it: the agent runs in inspect mode on
one open finding, or on a review of the open findings (at most 10, the most severe first),
optionally side by side with a run without custom instructions. An evaluation writes nothing
— no note, no decision, no review record — and is recorded with the status evaluation.
See AI Agents for findings.
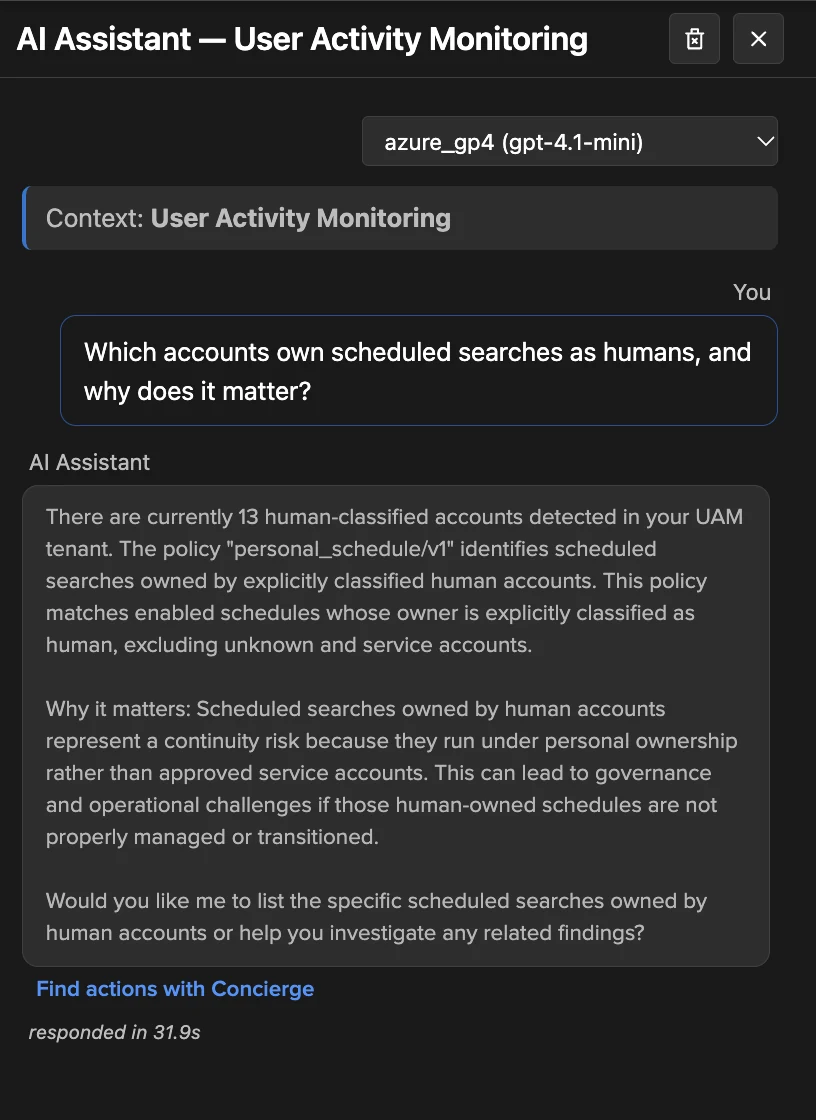
The AI Assistant of a UAM tenant knows the workspace, the policies and the open findings: ask it to explain a finding, compare accounts or suggest what to tune, and it can propose an AI Agent review or a triage action for you to confirm. See AI Assistant & Concierge.
Tuning the policies
The built-in catalogue
Twelve policies in three families. Seven are enabled on a new tenant.
Policy |
Family |
Default |
What it detects |
|---|---|---|---|
Scheduled search owned by a human account ( |
inventory |
on, Low |
An enabled schedule owned by a person: it stops when that account goes. |
Scheduled search owner is not classified ( |
inventory |
off, Medium |
An enabled schedule whose owner is neither human nor service. |
Scheduled search exceeds the hourly schedule limit ( |
inventory |
off, Medium |
A cron with more minute slots per active hour than the limit (12). |
Scheduled search has an all-time dispatch lower bound ( |
inventory |
on, Medium |
A schedule whose earliest time is |
Scheduled search uses a real-time dispatch range ( |
inventory |
on, Medium |
A real-time scheduled search. |
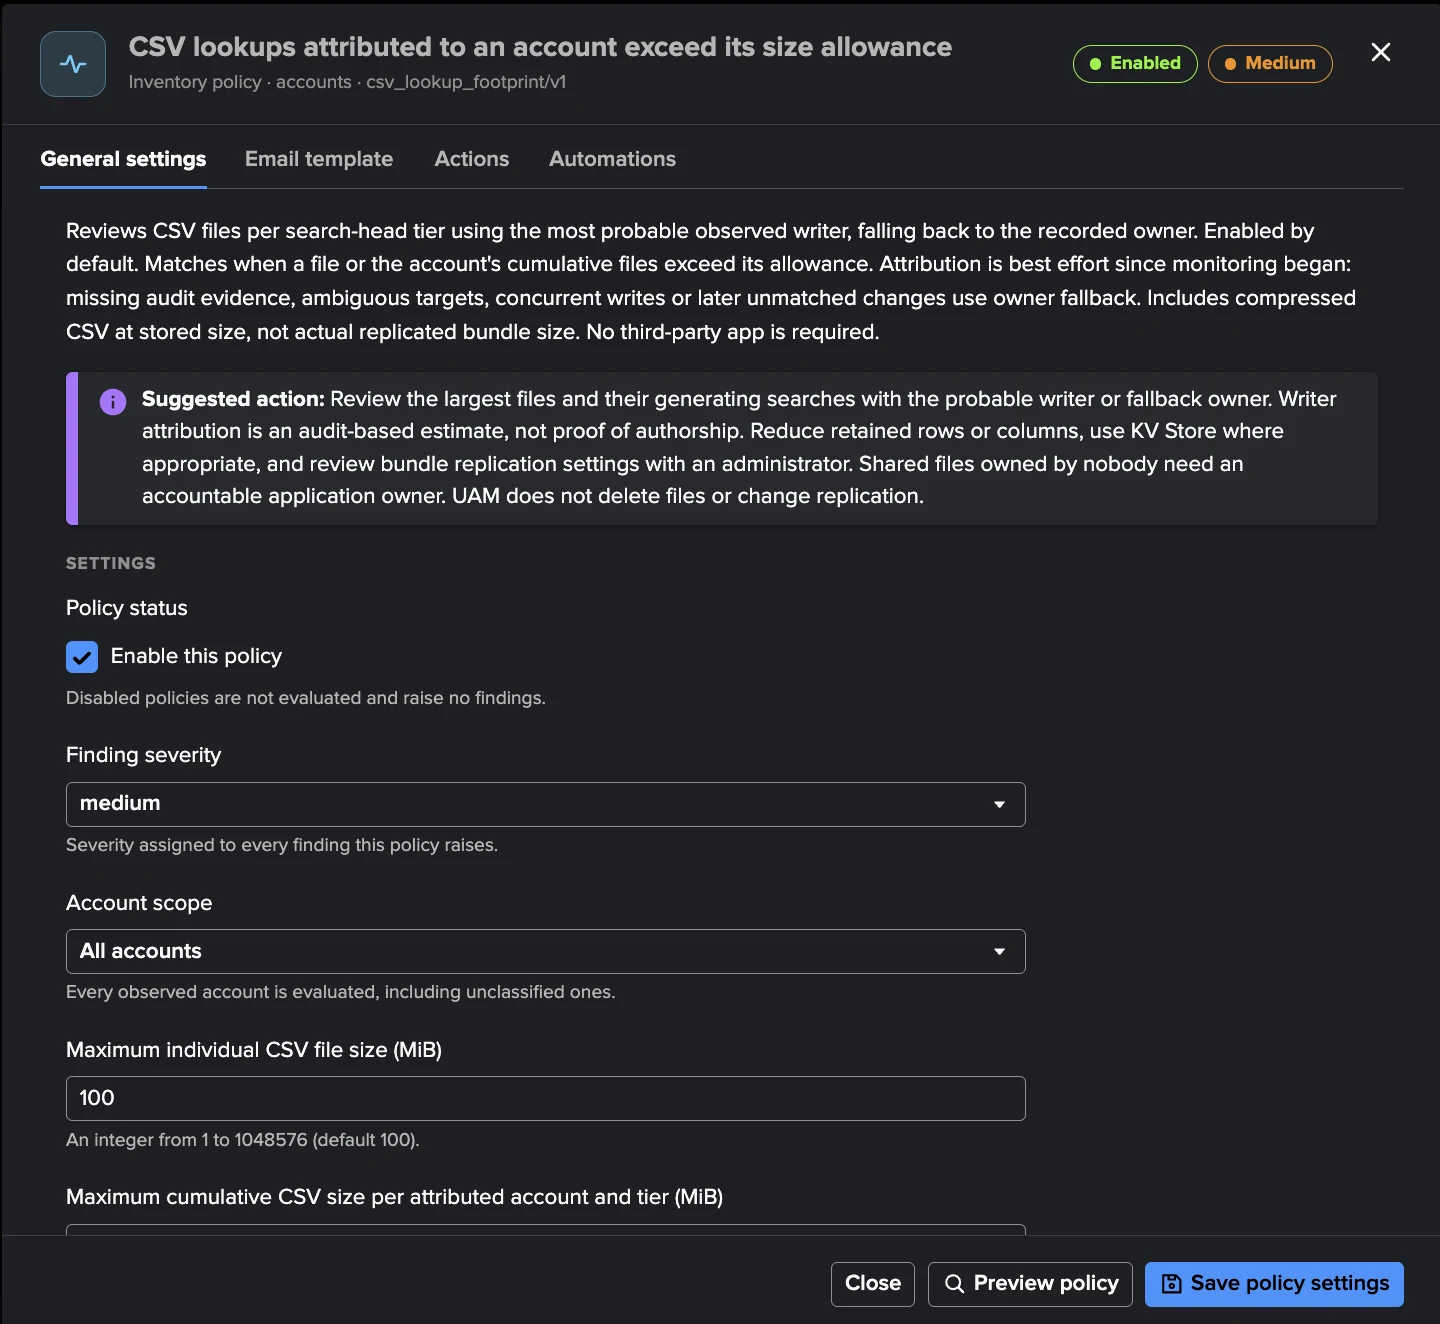
CSV lookups attributed to an account exceed its size allowance
( |
inventory |
on, Medium |
Per tier, one CSV lookup over the file limit (100 MiB) or an account’s CSV lookups over its total (500 MiB), attributed to the probable writer, else the recorded owner. |
Account launched an unusual number of searches ( |
activity |
off, Medium |
More distinct searches in the policy window than the limit (200). |
Account ran repeated long searches ( |
activity |
off, Medium |
More than 3 searches of at least 300 seconds. |
Account ran all-time searches ( |
activity |
on, High |
Any all-time search (the maximum is 0). |
Account’s search resource consumption exceeded its allowance
( |
resource |
on, Medium |
CPU over the allowance in the window (10 % of the search capacity by default); the severity is raised one level when the account dominates the environment (40 %). |
Account ran repeated resource-intensive searches ( |
resource |
on, Medium |
More than 3 searches heavy in CPU or memory. |
Account’s CPU consumption is unusual for its daily baseline
( |
resource |
off, Medium |
Today’s CPU above a multiple (3) of the account’s daily 95th percentile over 14 days. Ships in Preview mode: it shows what it would match, without raising findings or sending notifications, until you turn the mode off. |
The activity and resource policies judge the trailing 15 minutes by default; the inventory policies follow the catalog cadence (the full saved-search listing is daily by default). The resource policies stay learning — no finding, nothing cleared — until the tenant holds 24 hours of resource history and a measured capacity. The full catalogue, with every threshold and its bounds, is in The built-in policy catalogue.
Editing a policy
Edit opens the policy editor:
General settings — status, During bank holidays (see Bank holidays), severity, account scope (human accounts only, classified accounts, all accounts), thresholds (the resource policies can derive them from the measured capacity, auto thresholds), excluded owners and excluded apps (exact names, up to 500), and Preview policy to see what the draft would raise against the current data before you save.
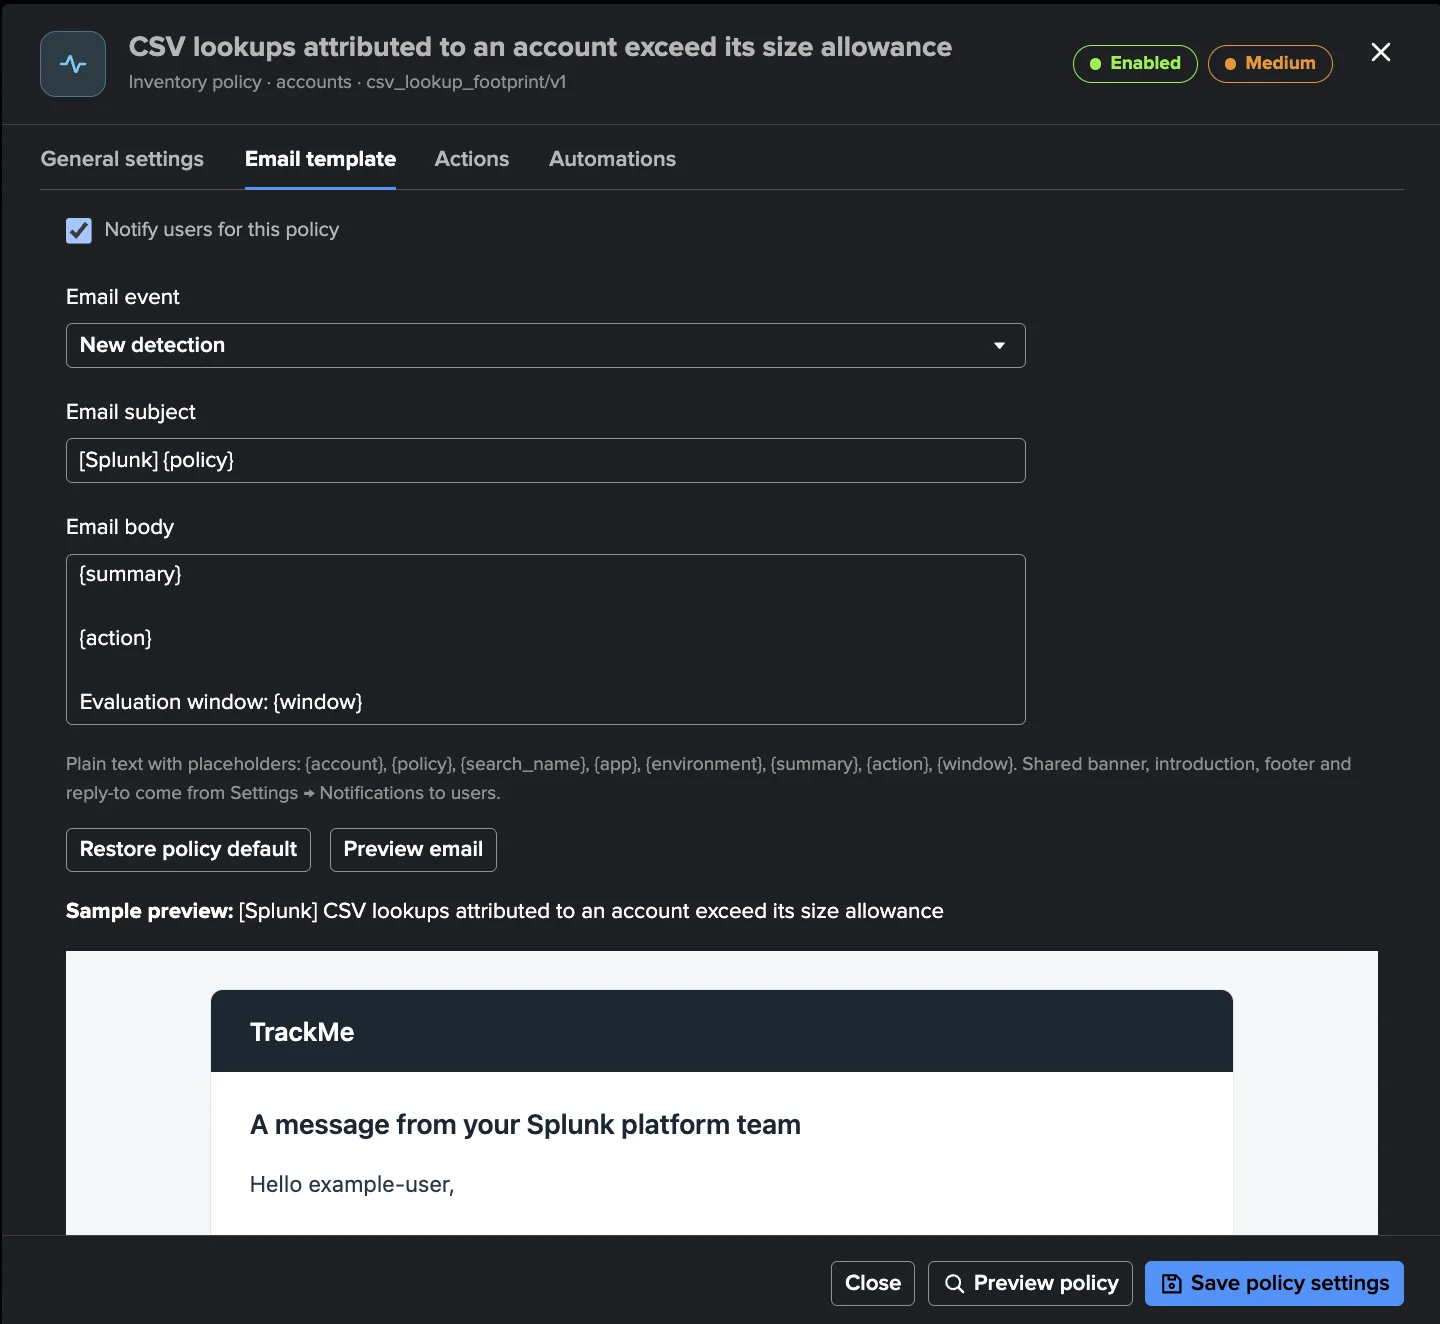
Email template — the subject and body of the user emails for this policy, for a new detection and for a cleared condition, with a preview and a test delivery; Restore policy default brings back the shipped text.
Actions and Automations — the findings actions offered on this policy’s findings, and the automation rules that run a webhook when they change.
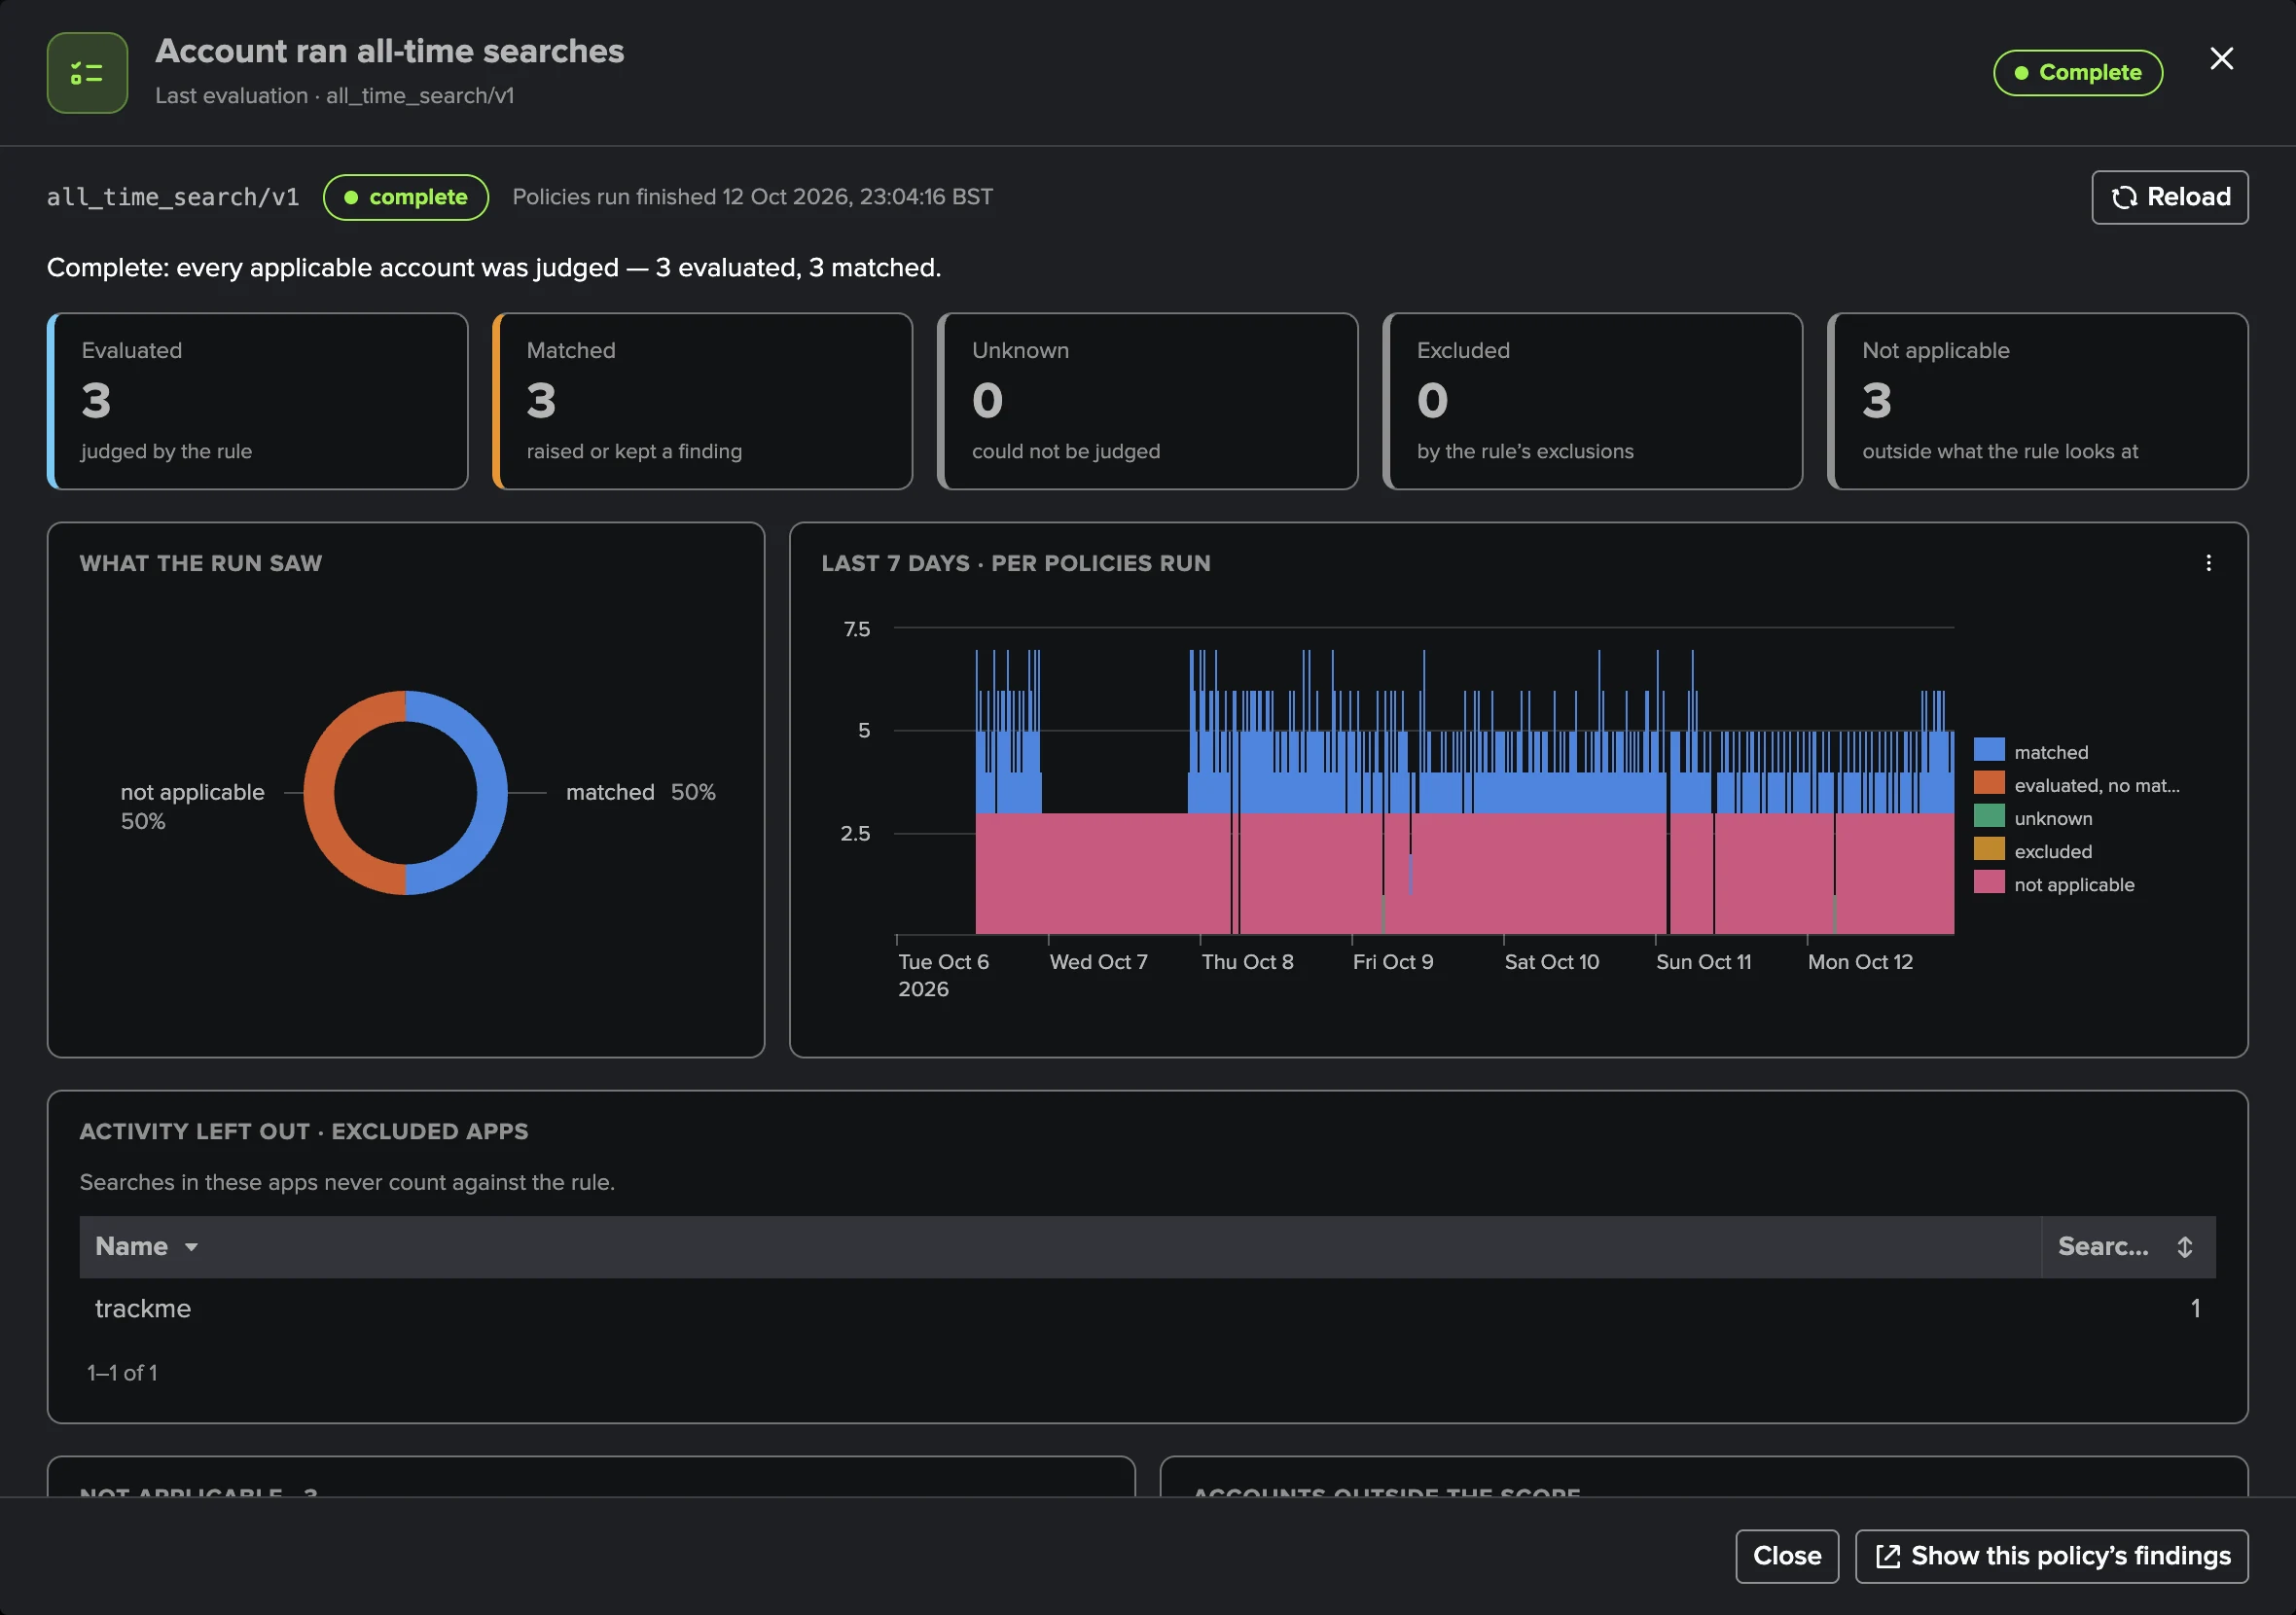
The policy insight (from the last evaluation of a policy) explains a run: the verdict, what the run saw, what was matched, excluded, not applicable or could not be judged and why, the owners behind the unknowns (classifiable in place), the exclusions and a seven-day history. It is the first place to look when a policy raises nothing, or too much.
Custom policies
When the catalogue does not cover a rule of your own, write it in SPL: Policies → Create policy (TrackMe administrators of the tenant).
Definition — title, description, default severity and remediation.
Search and schedule — the search source (an account policy reads through the route account), the app context, the SPL (up to 64 KiB), a relative window ending now (at most 31 days) and a five-field cron.
Map search results to findings — the subject type, Account or Saved search (owner, app, name), and which result fields carry the identity, dimensions, evidence, count and time.
Preview policy — runs the draft as you and shows up to 20 candidate findings. A preview with no results cannot verify the mapping.
Save draft, Publish (an immutable revision), Enable (a scheduled search for the published revision). Version history lets you load, compare, restore or delete versions; Disable, Archive and Delete permanently end a policy (its findings, evidence and notes remain).
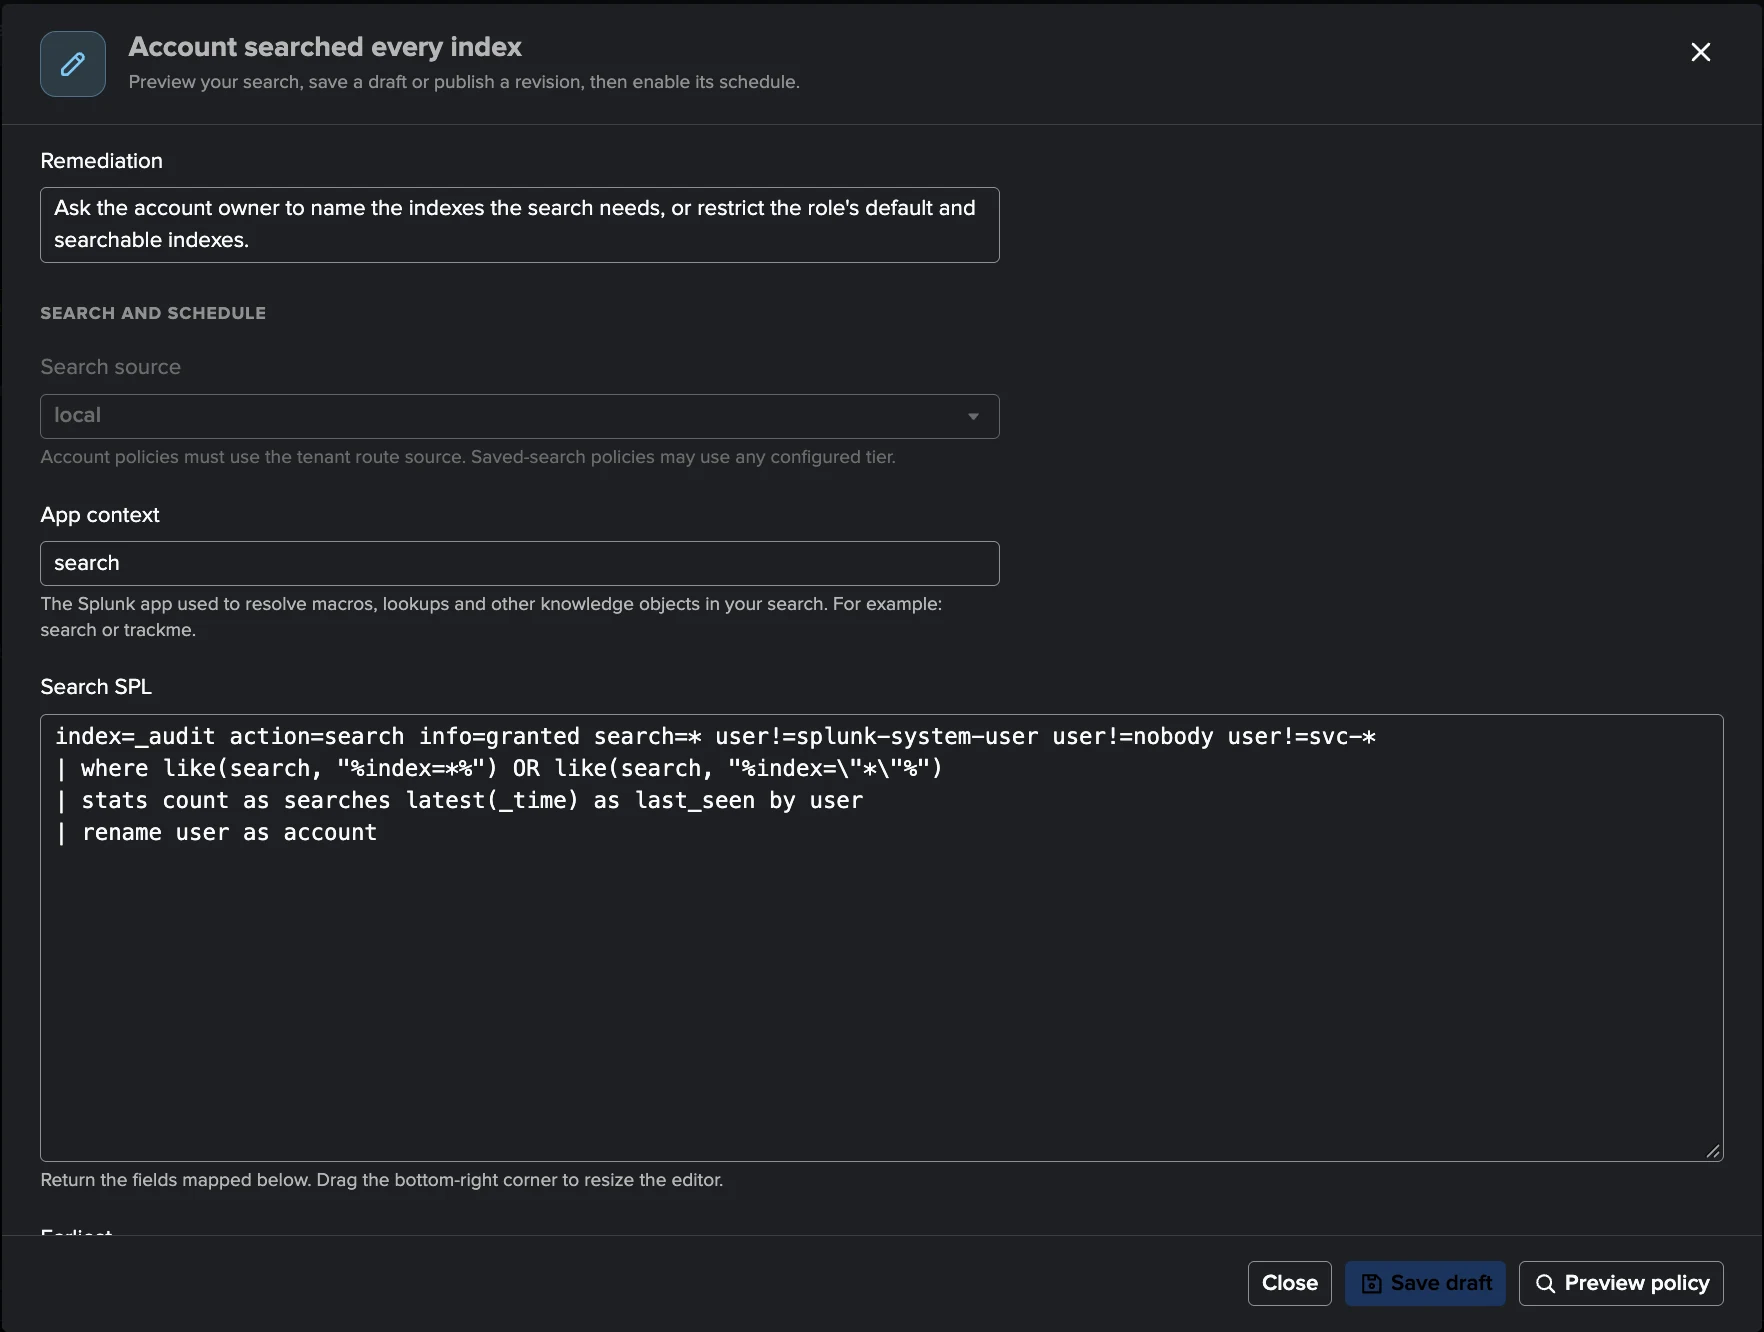
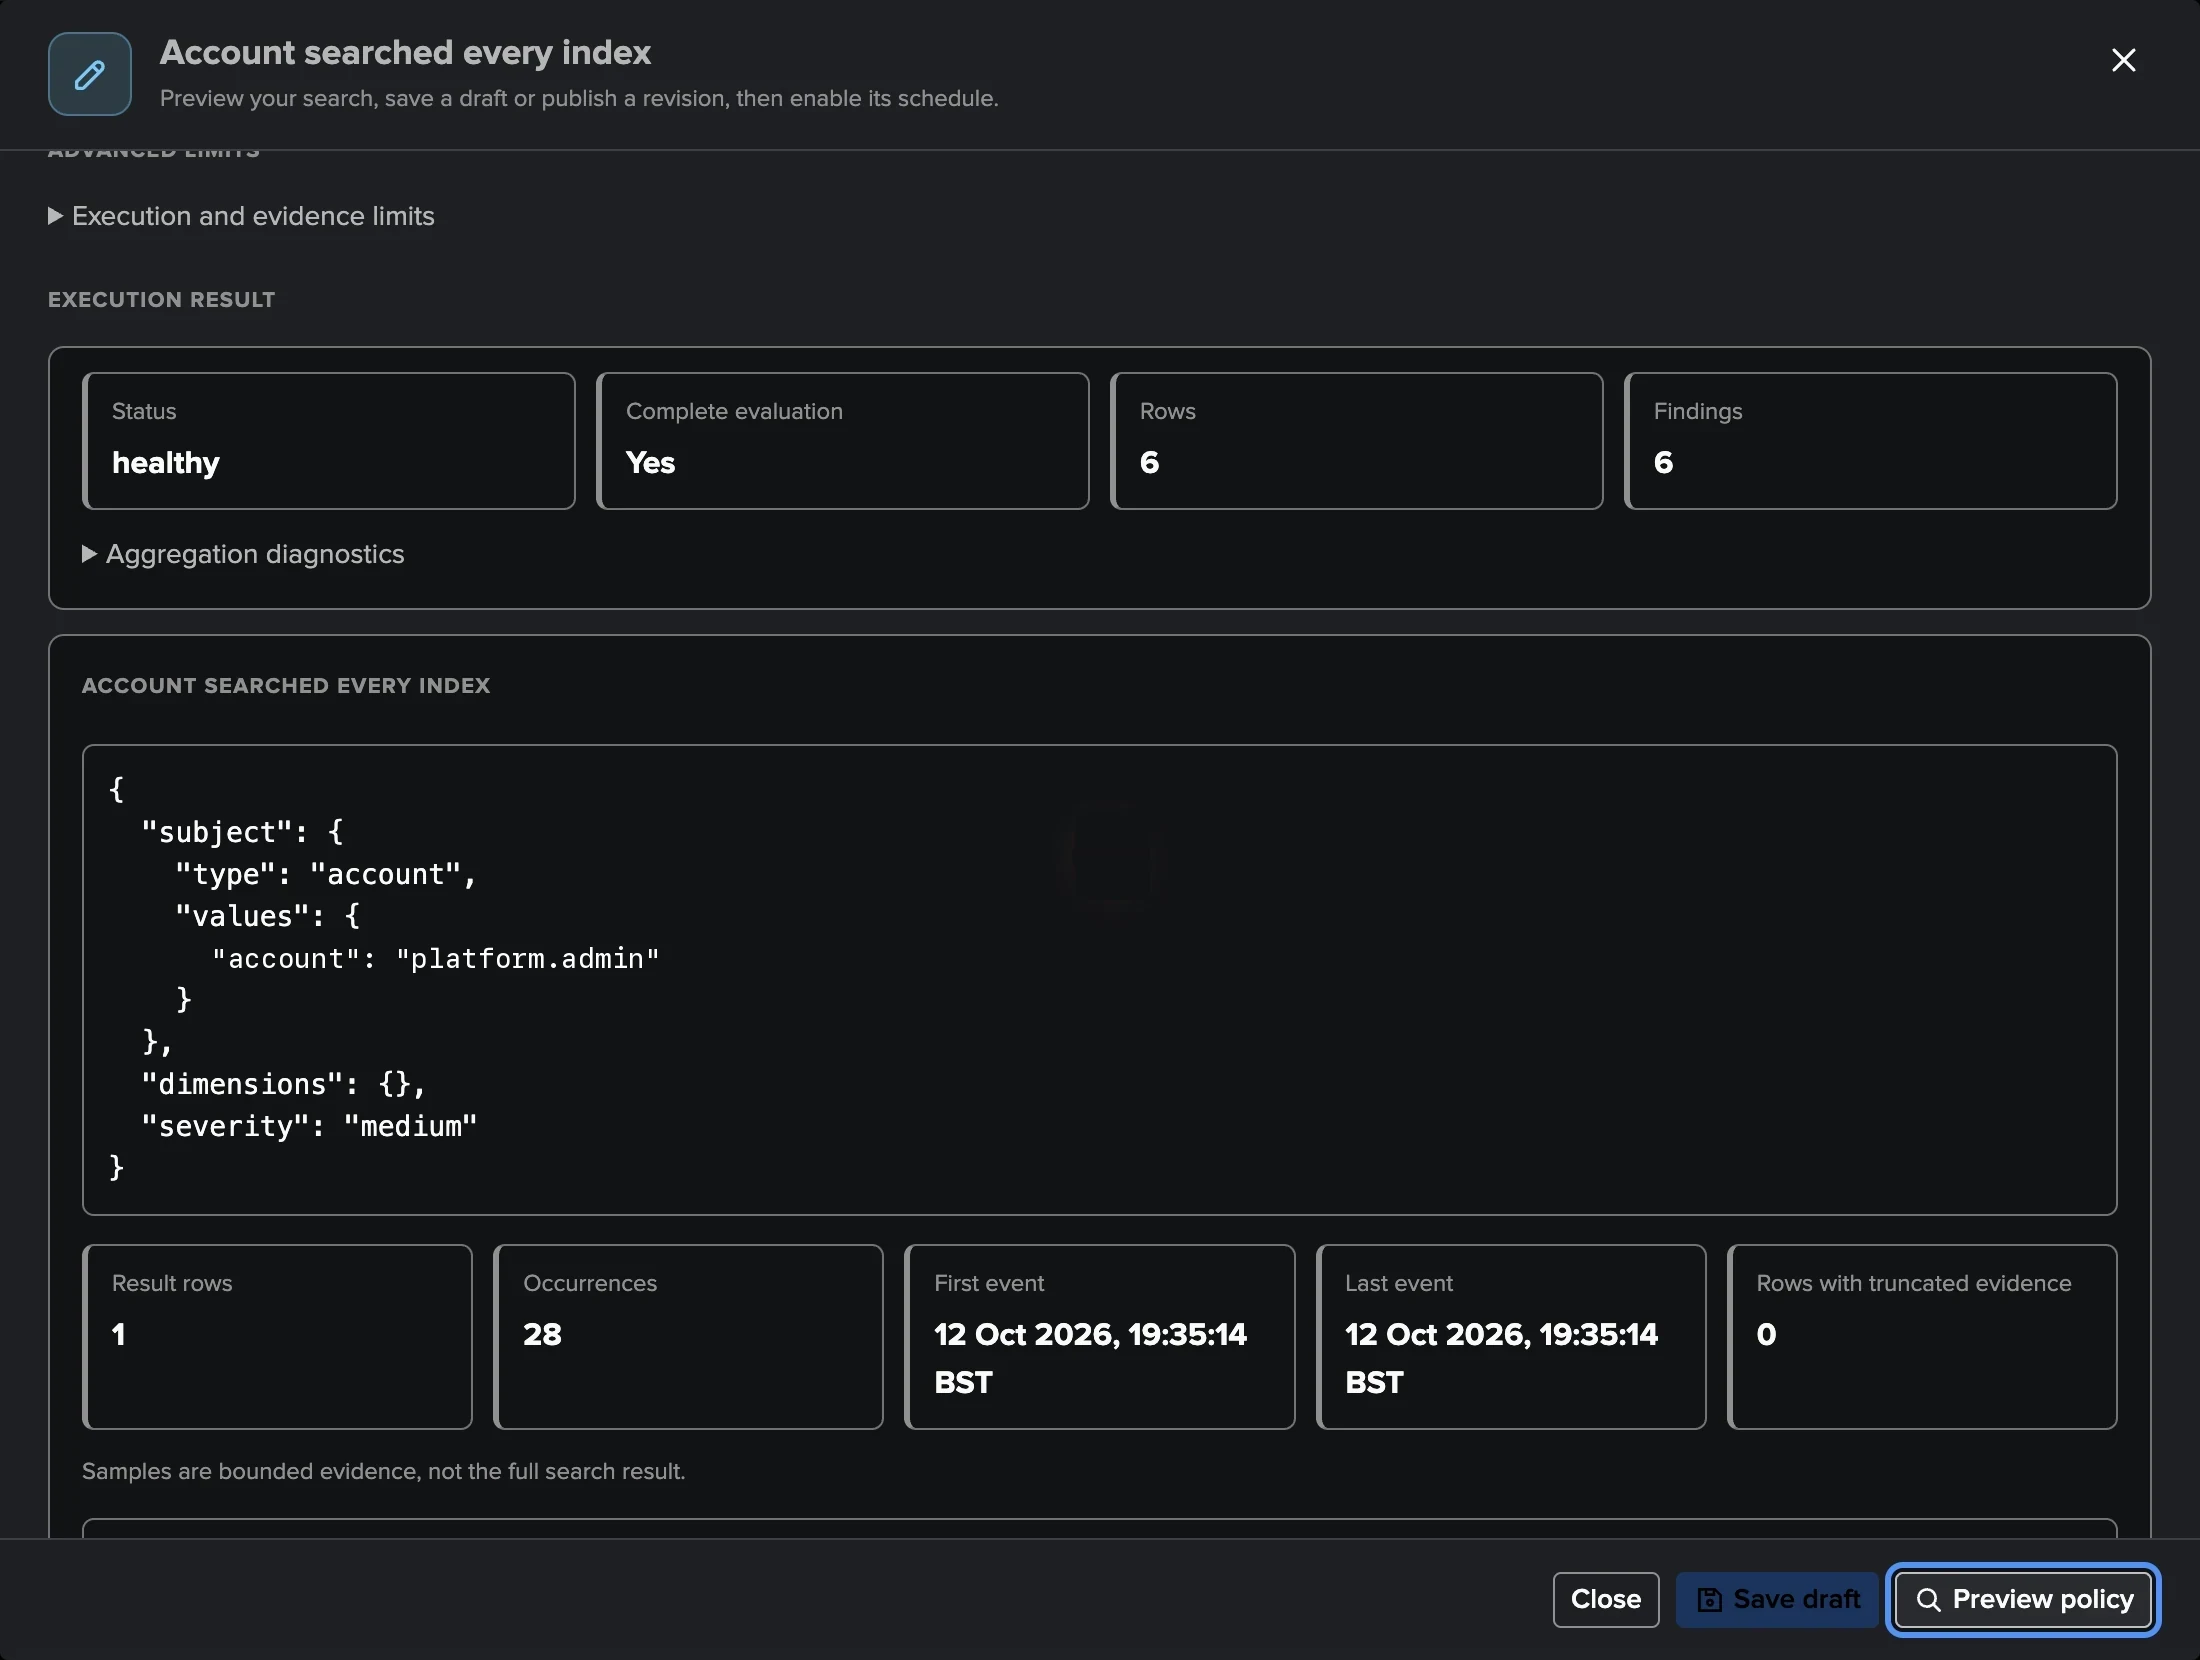
The definition also has a Bank holidays section (see Bank holidays). Custom findings appear with the built-in ones, join the Finding groups and are triaged the same way. In this release, operator and user notifications cover the built-in policies only, and a custom policy writes its exclusions in its SPL. A tenant holds up to 100 custom policies, 25 of them enabled; their execution health is in Collection health → Policies → Custom policies.
Bank holidays
A UAM tenant uses the bank holiday calendars like every tenant: the system default calendars, unless it selects its own or none (Manage Bank Holidays → Tenants & settings, or Configure tenant → Bank Holidays). One effect applies to it, Suppress new alerts, shown as Hold new findings and on by default: while a holiday of the tenant’s calendars is active, the policies set to hold open no new finding. SLA, monitoring windows and ML training do not apply to a UAM tenant.
Each policy chooses in its editor, under During bank holidays: Hold new findings or Keep opening findings. The defaults:
Holds new findings |
Keeps opening findings |
|---|---|
Scheduled search owned by a human account, Scheduled search owner is not classified, Scheduled search exceeds the hourly schedule limit, Scheduled search has an all-time dispatch lower bound, Scheduled search uses a real-time dispatch range, CSV lookups attributed to an account exceed its size allowance |
Account launched an unusual number of searches, Account ran repeated long searches, Account ran all-time searches, Account’s search resource consumption exceeded its allowance, Account ran repeated resource-intensive searches, Account’s CPU consumption is unusual for its daily baseline |
The inventory policies are configuration reviews: nobody reviews them on a day off, and they are still there the next working day. The activity and resource policies keep opening findings, because unusual activity on a day off is more telling, not less. A configuration saved before TrackMe 2.4.19 reads each policy’s default.
When a policy holds:
An inventory policy holds while a holiday is active at the time of the run; an activity or resource policy holds when a holiday overlaps its activity window, so a burst on the last evening of a holiday is still a holiday burst.
A held match writes nothing: no finding, no Finding group, no notification to operators or users, no findings action, and it uses none of the findings capacity. The first policies run after the holiday opens the finding if the condition is still there.
A finding already observed is evaluated as on any other day: updated, escalated, or no longer observed. A held match does not reopen a resolved or dismissed finding.
If the calendars cannot be read, nothing is held.
A custom policy keeps opening findings unless its definition turns the setting on (Bank holidays section of the custom policy editor; it takes effect when published). It holds while a holiday is active at the end of its search window.
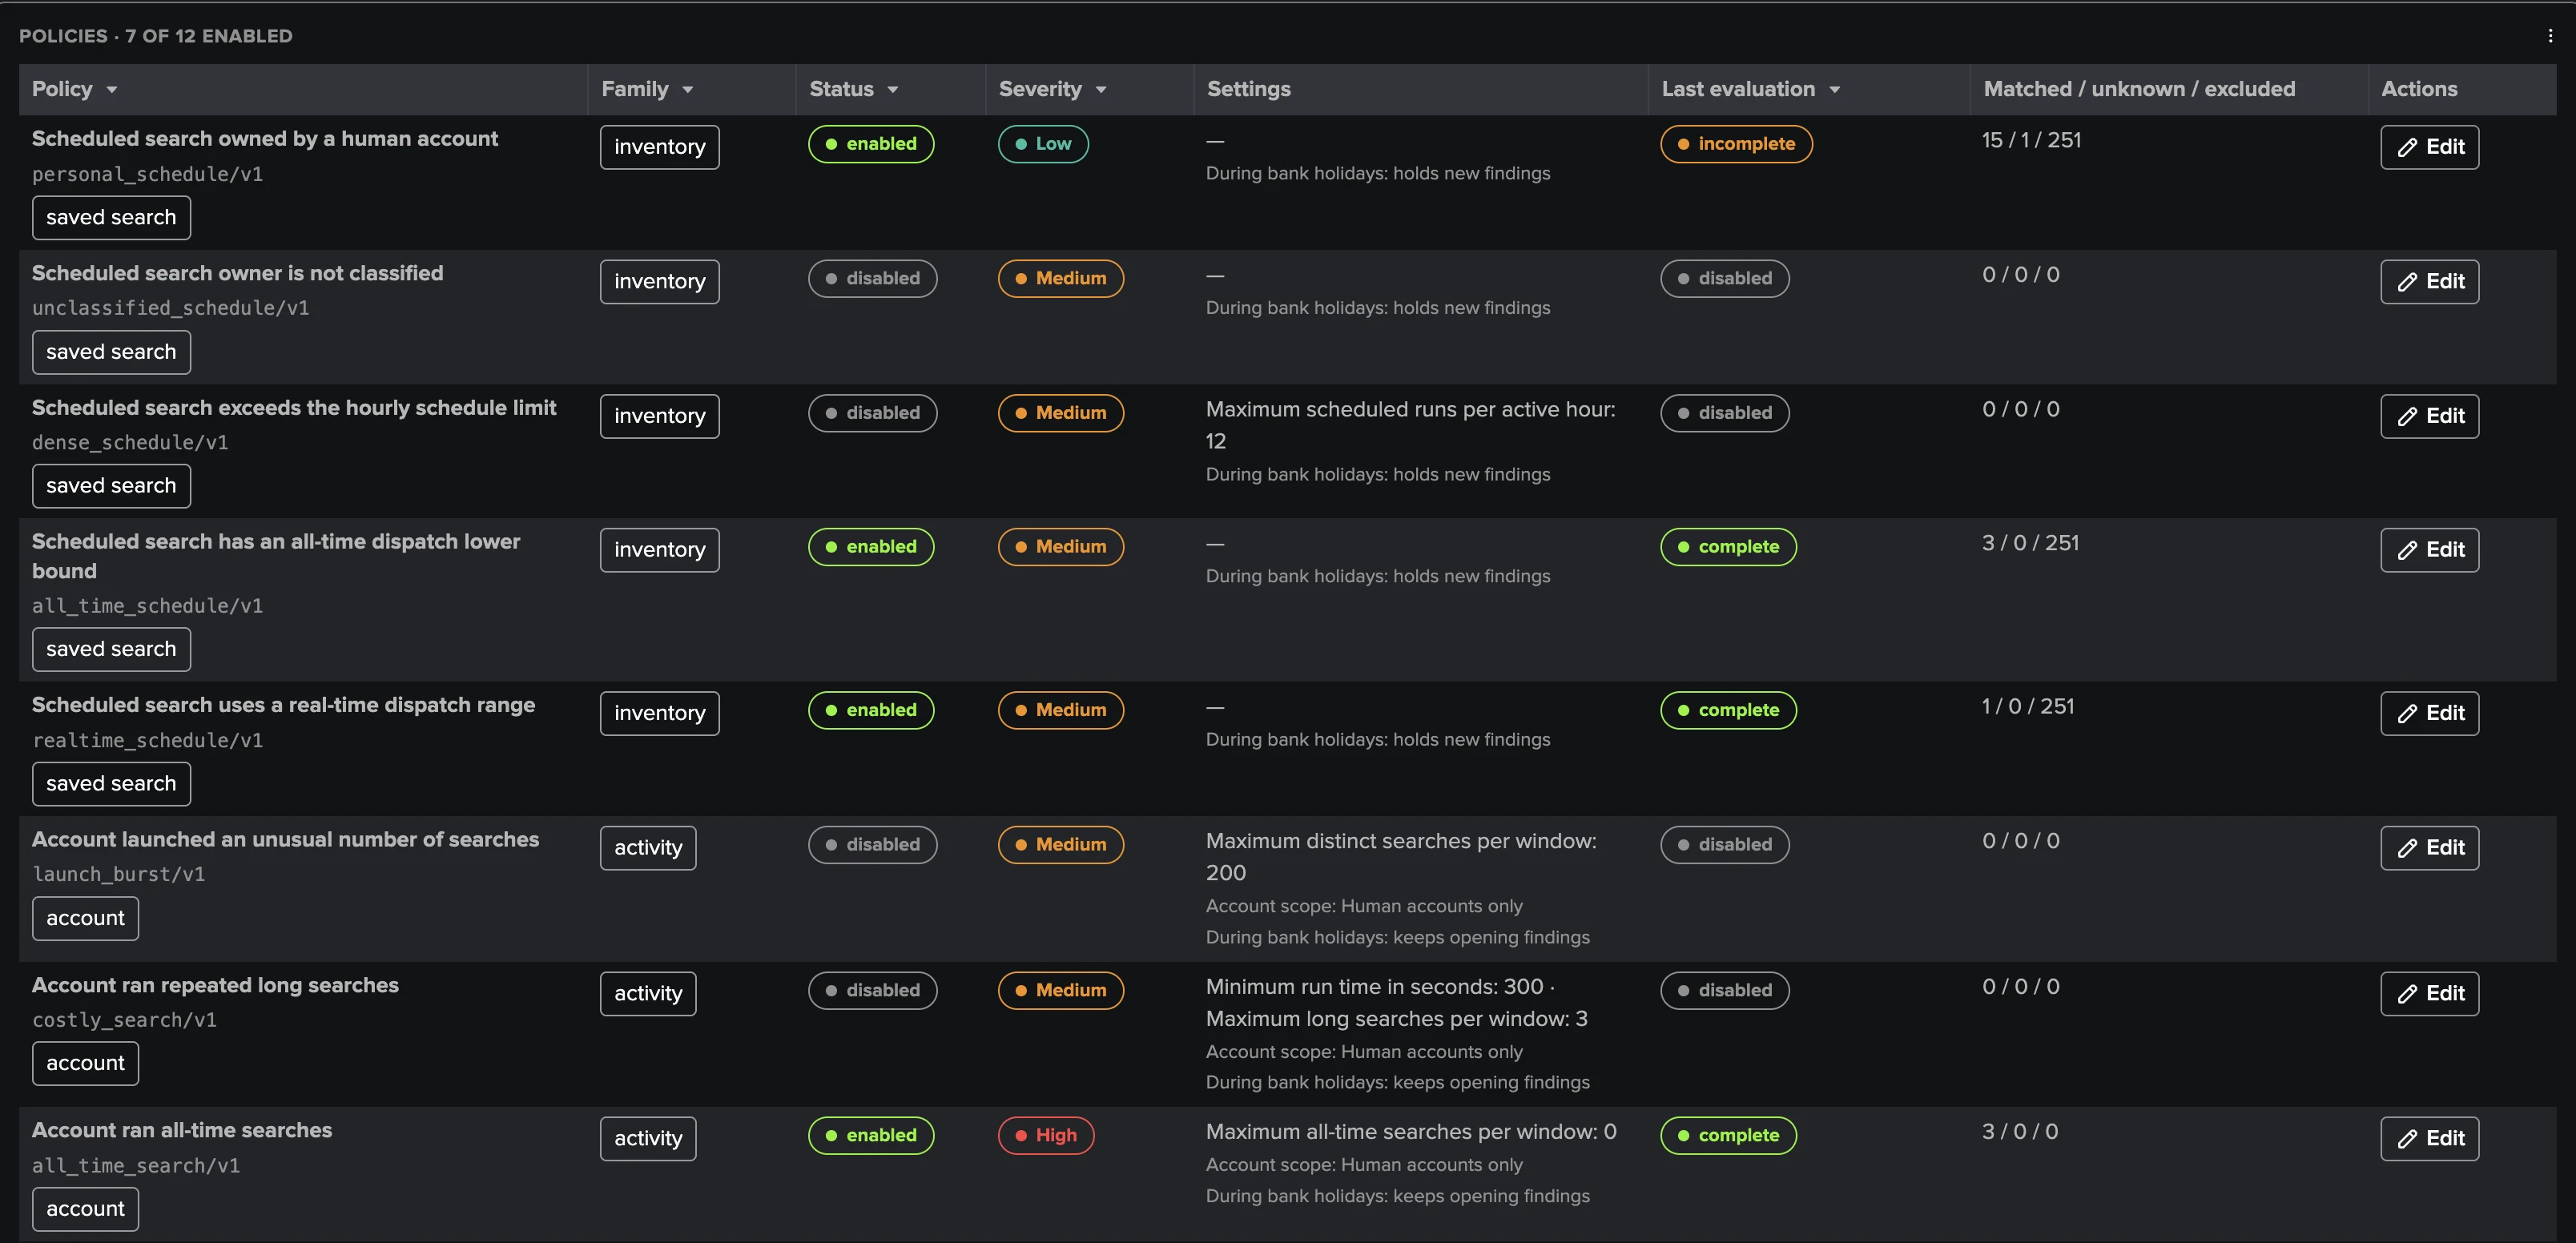
Where to see it. Each policy on the Policies tab says During bank holidays: holds new findings or keeps opening findings. A policy that held matches shows held N (bank holiday) under its last evaluation, and its policy insight says Held N (bank holiday: <names>) with a Bank holidays line for the run. The policies run receipt records the state (holding, off or unavailable), the holiday names, the matches held and the enabled policies set to hold; a custom policy run records what it held the same way.
Upgrading from TrackMe 2.4.18
The first policies runs gather the existing findings into Finding groups; decisions, notes and history are kept.
The inventory moves to the REST API catalogs: each tier gets its new knowledge-object reports, and its first full listing runs within the hour. The users and roles reports move from a 5-minute to a 15-minute schedule.
The UAM Findings Advisor is replaced by the UAM AI Agent; an enabled advisor’s settings are carried over once.
Where to go next
See also
User Activity Monitoring — reference — the reference: tiers, trackers and schedules, evidence, classification, the full policy catalogue (The built-in policy catalogue), every setting (Settings reference), REST and troubleshooting (Troubleshooting and known limits).
Findings, Finding groups and findings actions — findings, Finding groups, assignment, notifications, findings actions, Webhook accounts and the findings AI Agents, shared with Cribl Stream and Cribl Edge.
Creating a splk-uam tenant — the tenant creation wizard.
Who is doing what on your Splunk? User Activity Monitoring (UAM) — the white paper.
User Activity Monitoring — the hands-on deck.
Configuration Guardian — the
uam_collection_healthcheck.The AI Advisors and AI Agents automation — the AI Agents and their automation.