Part 3 — Stateful alerting
One alert on the tenant, scoped to critical and high; then an entity is broken on purpose and the incident is followed: opened, emailed, recorded, closed.
about 20 minutes · 16 slides. Each slide is followed by a description of what it shows — read top to bottom, this page is the walkthrough.
Overview
Part 3 of the hands-on walkthrough covers step 6 of the cycle, ALERT, on the secops tenant classified in Part 2. One stateful alert is created on the tenant, with emails restricted to critical and high priority entities. A healthy critical entity is then forced into red with a manual score influence, and the resulting incident is followed end to end: opened, emailed, recorded and closed.
Every screen in this part was captured live on TrackMe 2.4.18.
Incident lifecycle and its inputs
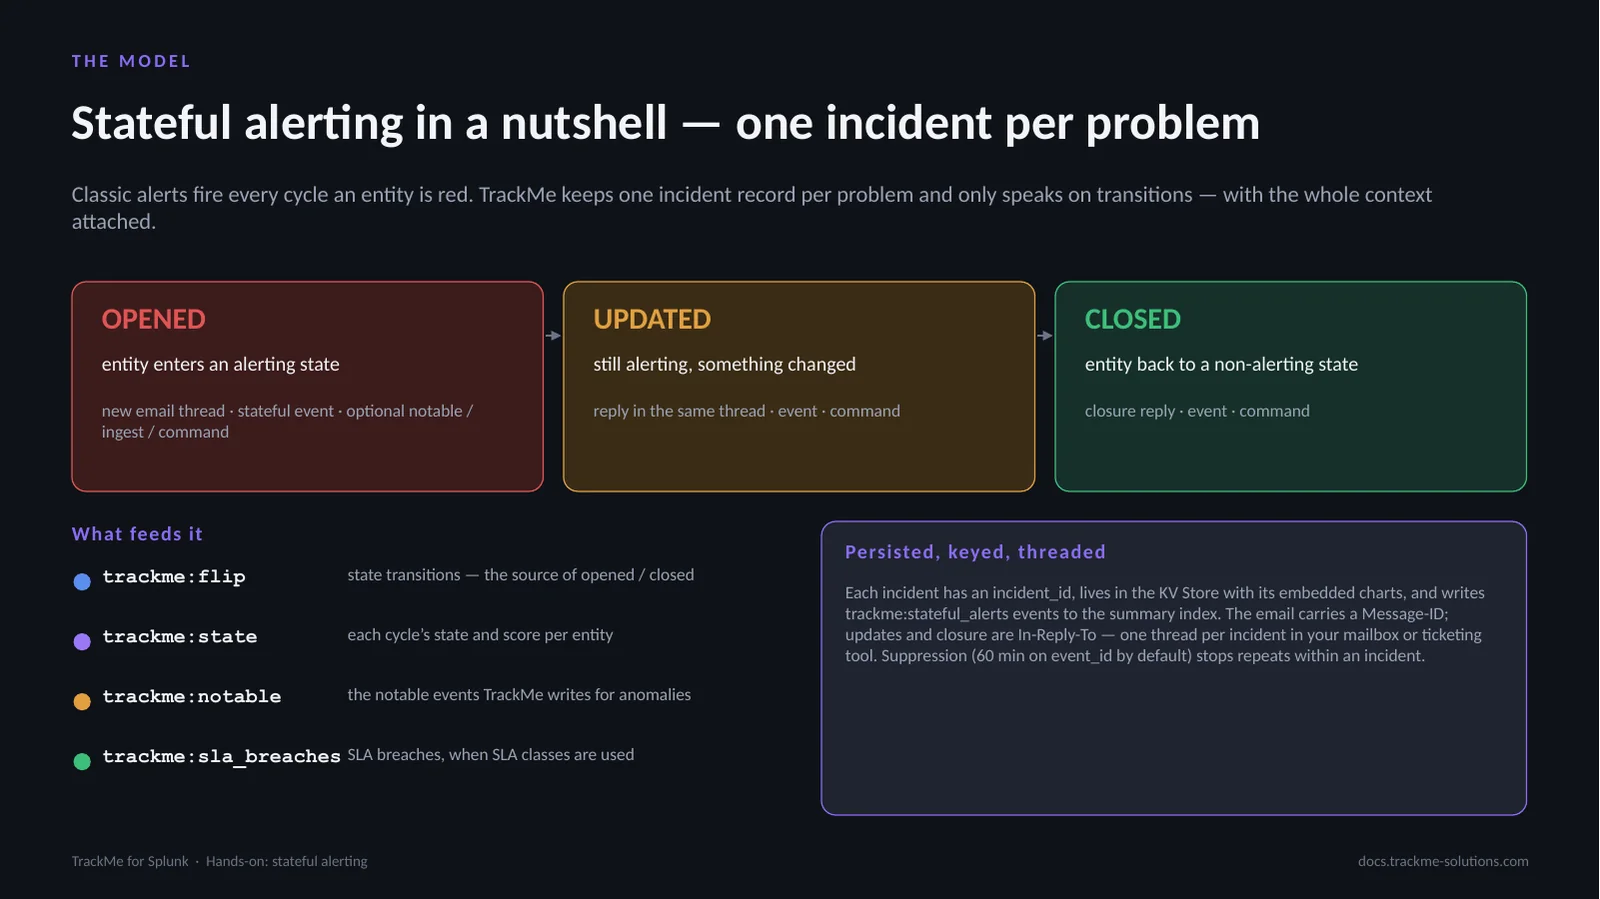
Classic alerts fire every cycle an entity is red. TrackMe keeps one incident record per problem and only speaks on transitions. An incident is OPENED when the entity enters an alerting state (new email thread, stateful event, optional notable / ingest / command), UPDATED when it is still alerting and something changed, and CLOSED when it returns to a non-alerting state.
Each incident has an incident_id, lives in the KV Store with its charts, and writes trackme:stateful_alerts events to the summary index. The email carries a Message-ID; updates and closure are In-Reply-To, one thread per incident. Suppression, 60 min on event_id by default, stops repeats within an incident. Inputs: trackme:flip (the source of opened and closed), trackme:state, trackme:notable, trackme:sla_breaches.
The Tracking Alerts tab
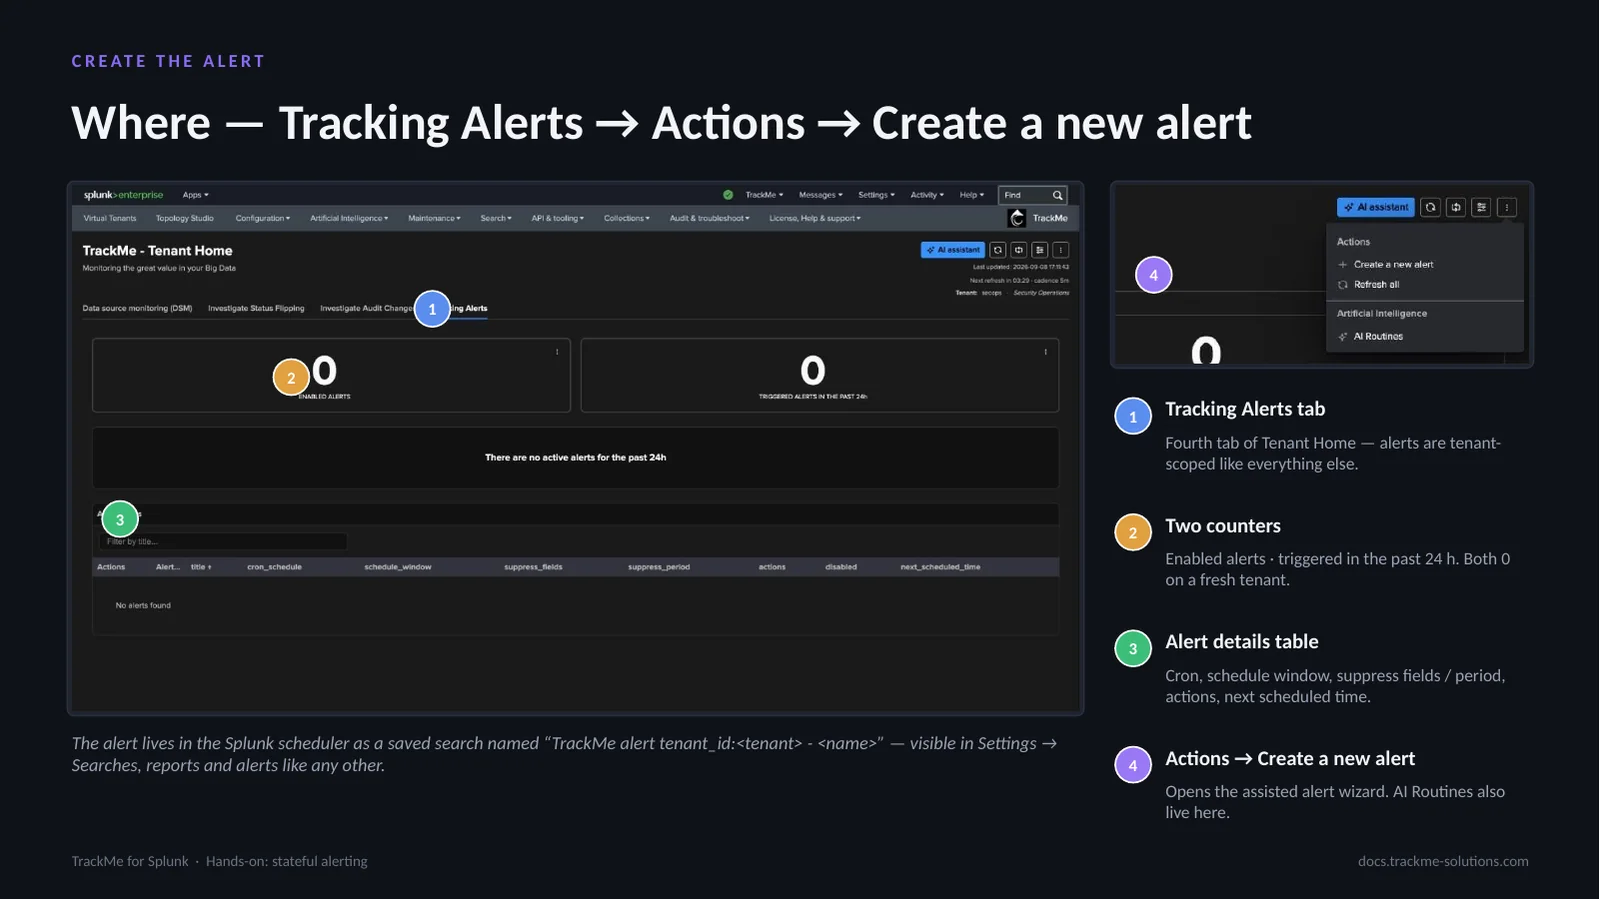
Alerts are created per tenant from the Tracking Alerts tab, the fourth tab of Tenant Home (callout 1). Two counters (callout 2) show enabled alerts and alerts triggered in the past 24 h, both 0 on a fresh tenant. The alert details table (callout 3) lists cron, schedule window, suppress fields and period, actions and next scheduled time. Actions → Create a new alert (callout 4) opens the assisted wizard; AI Routines also live here.
The wizard produces a normal Splunk saved search named “TrackMe alert tenant_id:<tenant> - <name>”, visible in Settings → Searches, reports and alerts, with TrackMe alert actions attached — nothing proprietary in the scheduler, which matters where saved searches are managed through CI/CD.
Alert type and identifier
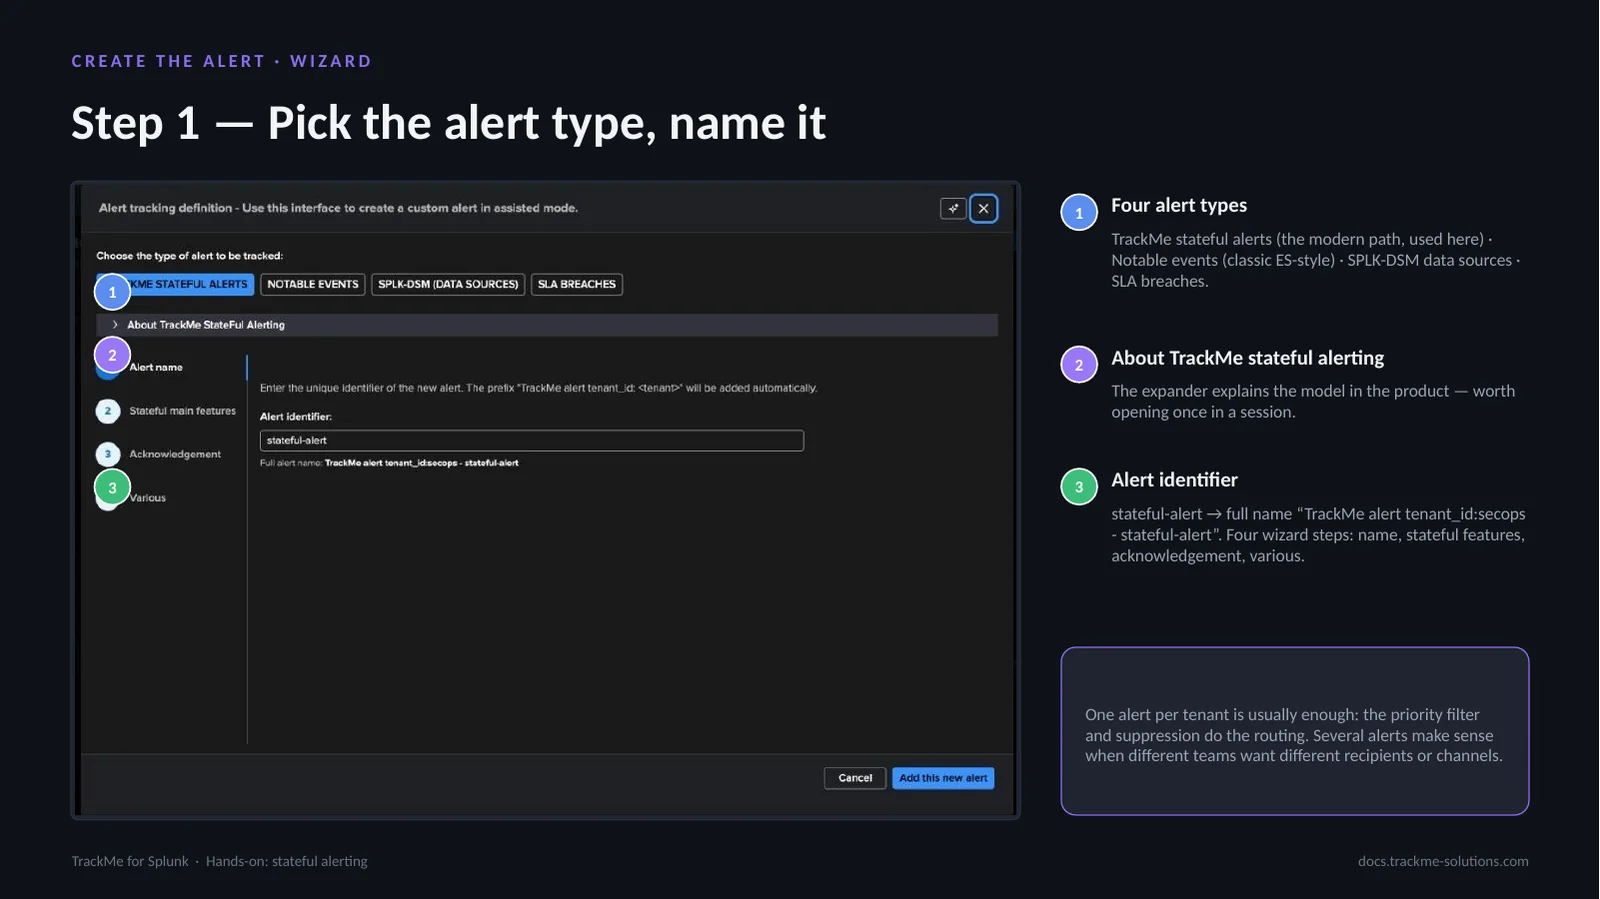
Step 1 offers four alert types (callout 1): TrackMe stateful alerts, the modern path used here; Notable events, the classic ES-style path where TrackMe writes notables and Enterprise Security correlates them; SPLK-DSM data sources; and SLA breaches. The About TrackMe stateful alerting expander (callout 2) explains the model inside the product. The alert identifier (callout 3), stateful-alert, is prefixed automatically with the tenant id, giving “TrackMe alert tenant_id:secops - stateful-alert”. The wizard has four steps: name, stateful features, acknowledgement, various.
One alert per tenant is usually enough, because the priority filter and suppression do the routing; several alerts make sense when different teams want different recipients or channels.
Delivery mode and email account
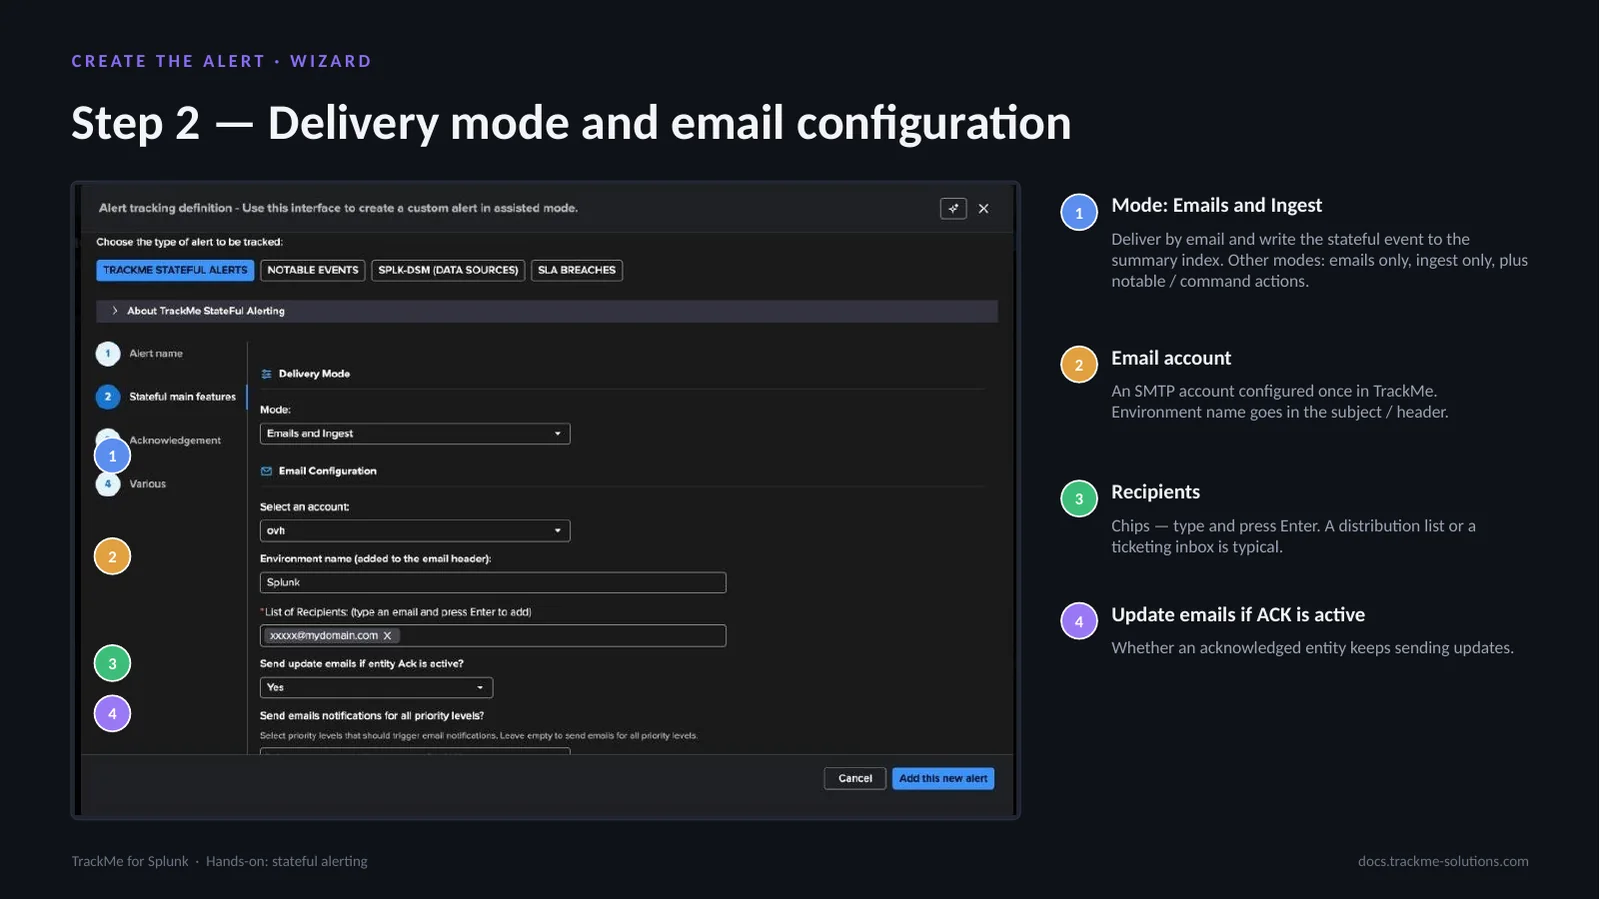
The mode (callout 1), Emails and Ingest, delivers by email and writes the stateful event to the summary index — the usual choice, since people get the thread and Splunk keeps the record; other modes are emails only, ingest only, plus notable and command actions. The email account (callout 2) is an SMTP account configured once under Configuration; the wizard only selects it, and its environment name goes in the subject and header, separating prod from preprod in a shared inbox.
Recipients (callout 3) are entered as chips, one per Enter; a distribution list or a ticketing inbox is typical. Update emails if ACK is active (callout 4) decides whether an acknowledged entity keeps sending updates.
Priority filter, charts and AI report
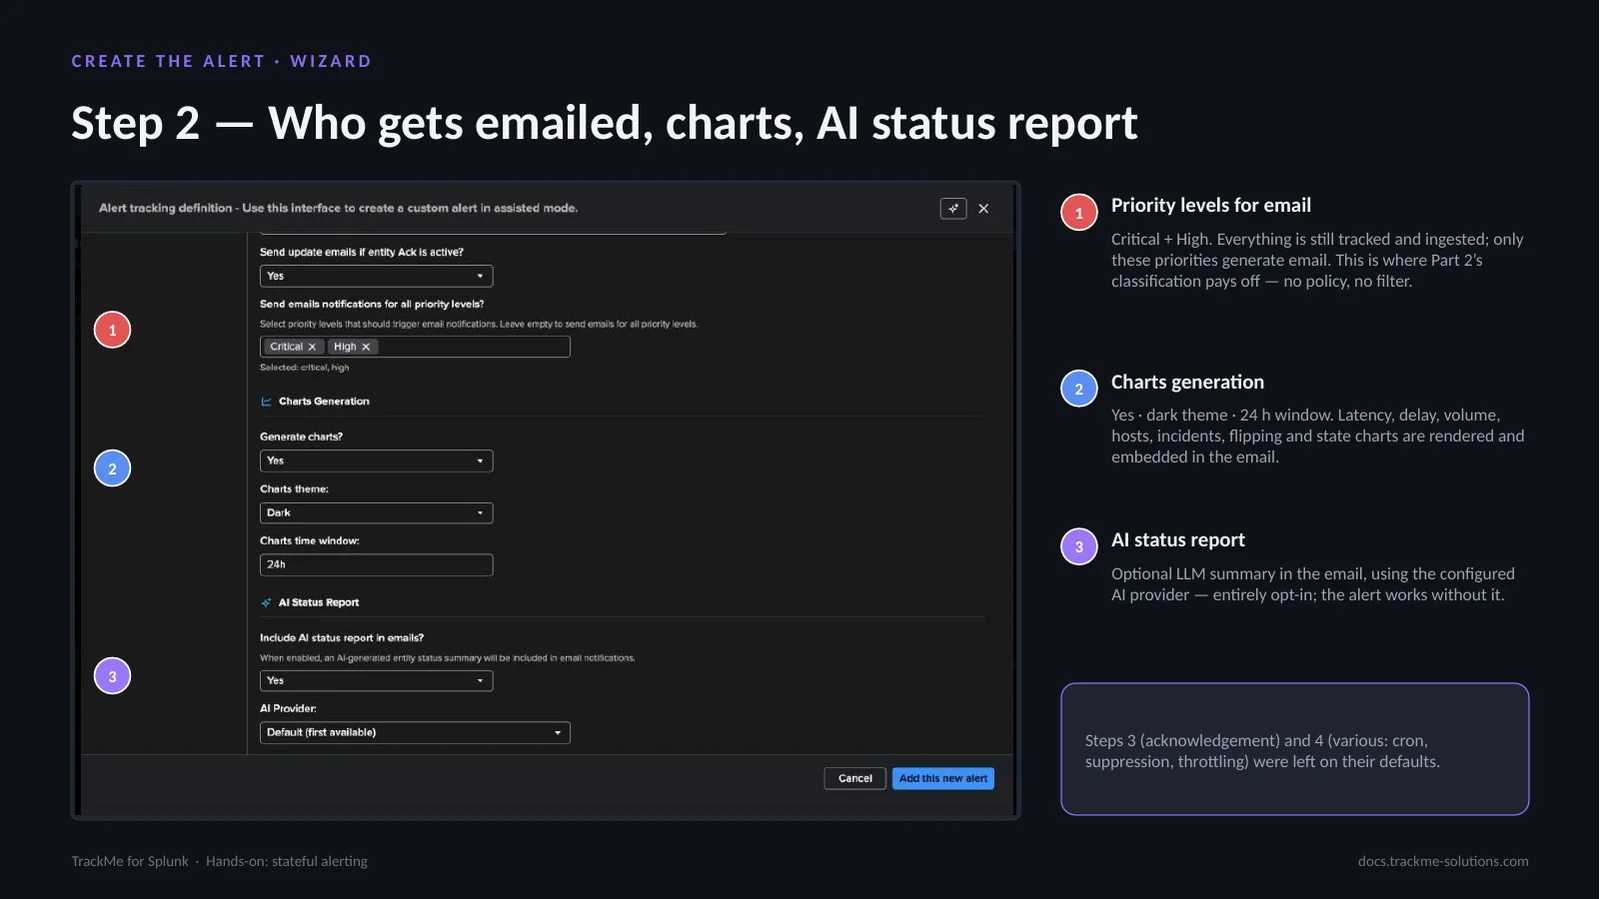
Priority levels for email (callout 1) is set to Critical + High: everything is still tracked and ingested, but only these priorities generate email. This is where the classification from Part 2 pays off and the key setting for a quiet on-call: low and medium feeds still get their incidents recorded, but nobody is paged for them.
Charts generation (callout 2) is Yes, dark theme, 24 h window: latency, delay, volume, hosts, incidents, flipping and state charts are embedded, giving the recipient 24 hours of context without opening Splunk. AI status report (callout 3) adds an opt-in LLM summary from the configured AI provider. Steps 3 (acknowledgement) and 4 (cron, suppression, throttling) keep their defaults.
The saved search behind the alert
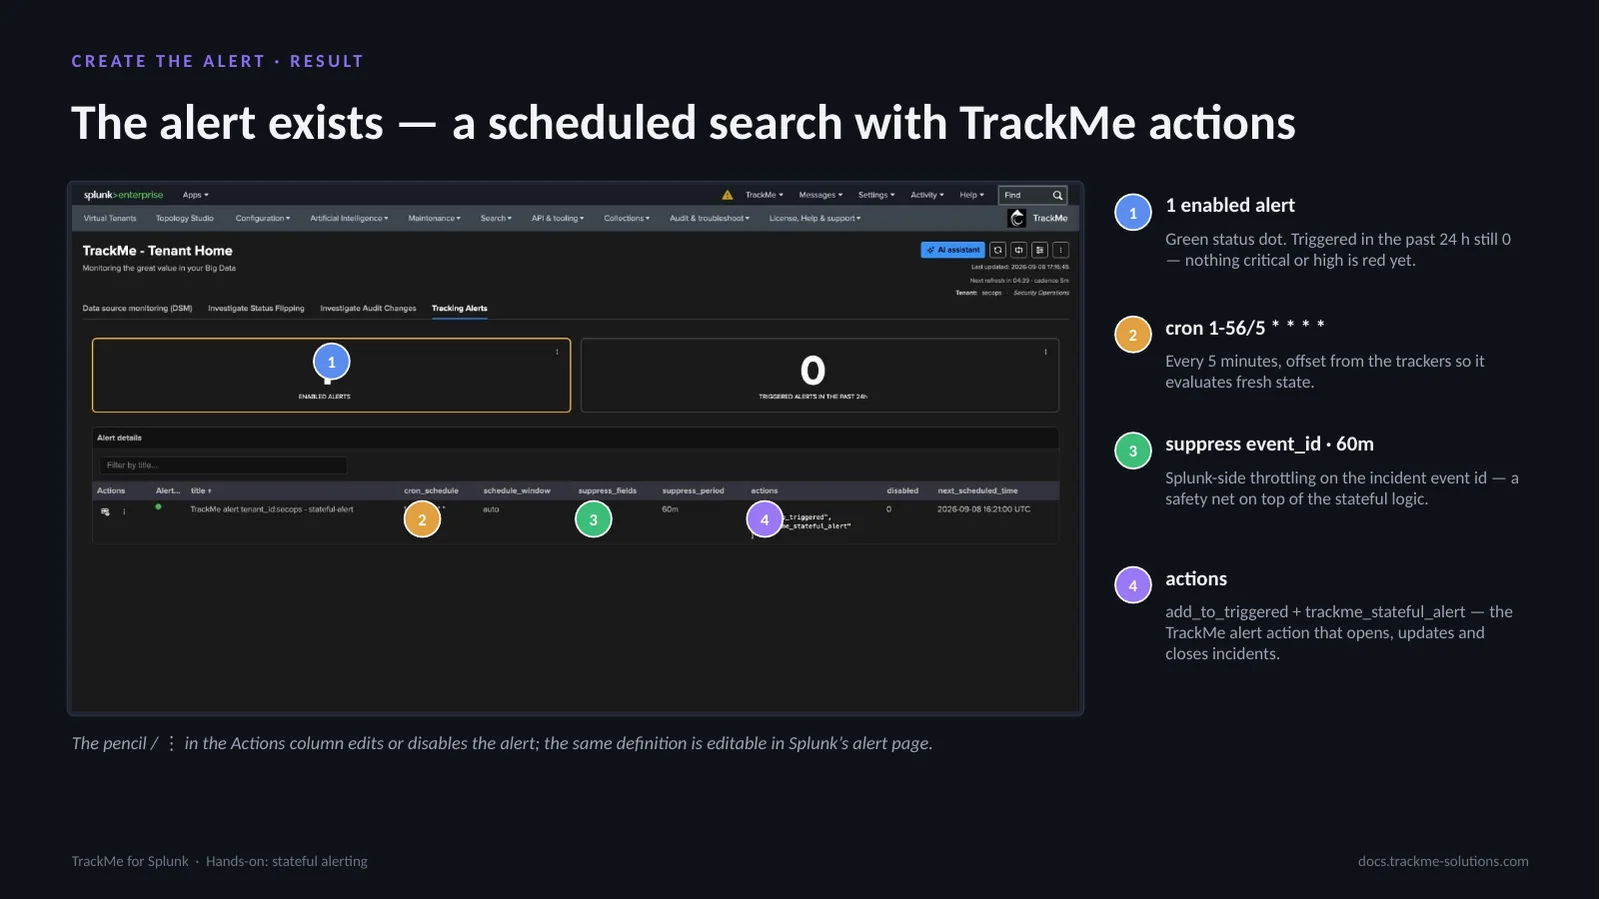
The Tracking Alerts tab now shows 1 enabled alert with a green dot (callout 1); triggered in the past 24 h is still 0, as nothing critical or high is red. The cron is 1-56/5 * * * * (callout 2): every 5 minutes, one minute after the trackers so it evaluates fresh state. Suppression is on event_id for 60m (callout 3), Splunk-side throttling on the incident event id, a safety net over the stateful logic.
The actions (callout 4) are add_to_triggered, keeping Splunk’s triggered-alerts list in sync, and trackme_stateful_alert, the TrackMe alert action that opens, updates and closes incidents. The pencil and ⋮ in the Actions column edit or disable the alert, also editable from Splunk’s alert page.
Adding a manual score influence
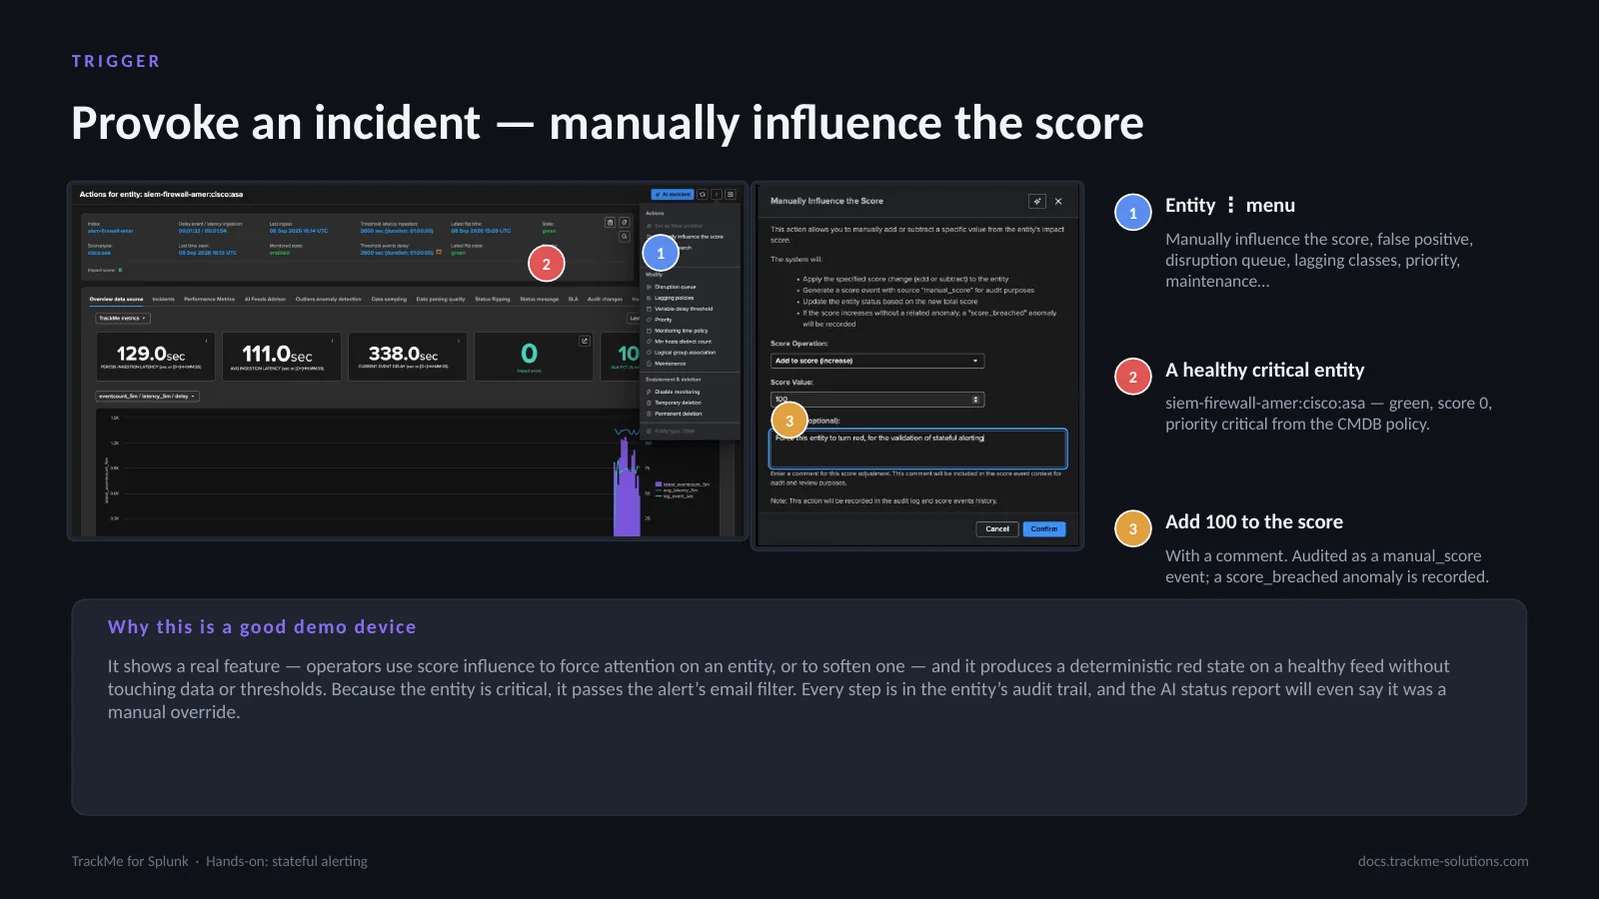
The entity ⋮ menu (callout 1) lists: manually influence the score, false positive, disruption queue, lagging classes, priority, maintenance. Callout 2 shows a healthy critical entity, siem-firewall-amer:cisco:asa — green, score 0, priority critical from the policy. Add 100 to the score (callout 3), with a comment: audited as a manual_score event; a score_breached anomaly is recorded.
Manual score influence adds or subtracts a value from the impact score; operators use it to force attention on an entity or soften one. Here it produces a deterministic red state on a healthy feed without touching data or thresholds. Being critical, the entity passes the alert’s email filter; the AI status report will name the manual override as the cause.
The entity header after the influence
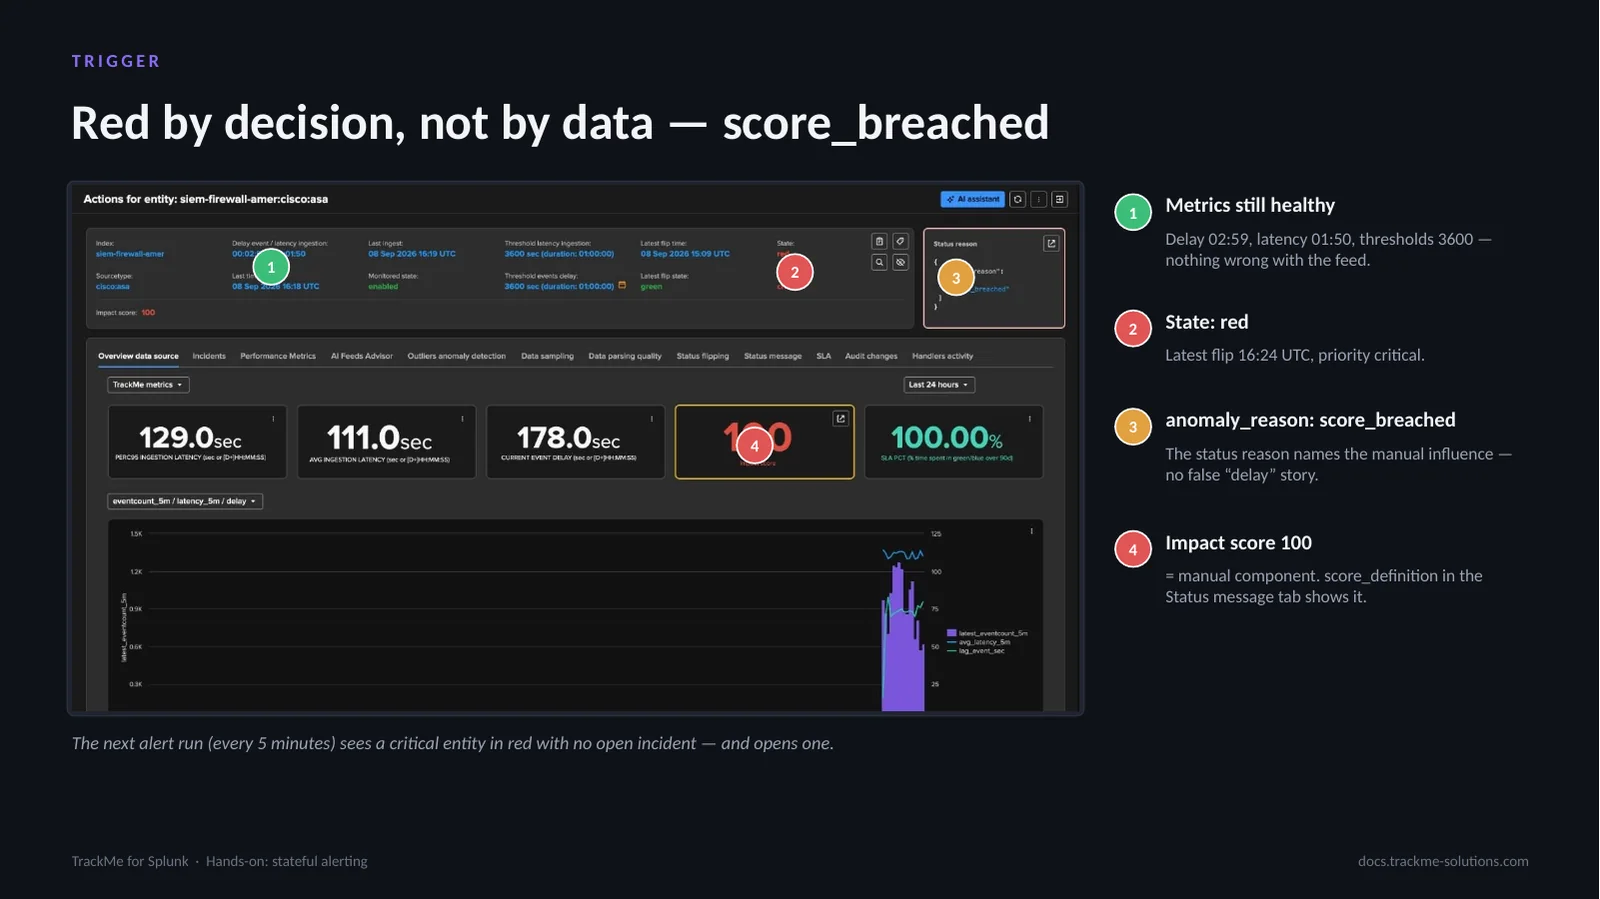
The metrics are still healthy (callout 1): delay 02:59, latency 01:50, thresholds 3600 — nothing wrong with the feed. The state is red (callout 2), latest flip at 16:24 UTC, priority critical. anomaly_reason is score_breached (callout 3): the status reason names the manual influence rather than telling a false delay story. Impact score is 100 (callout 4), entirely the manual component, and score_definition in the Status message tab shows it.
This is the honesty of the scoring model — the reason is always the real one. The next alert run, every 5 minutes, sees a critical entity in red with no open incident and opens one.
The incident record on the entity
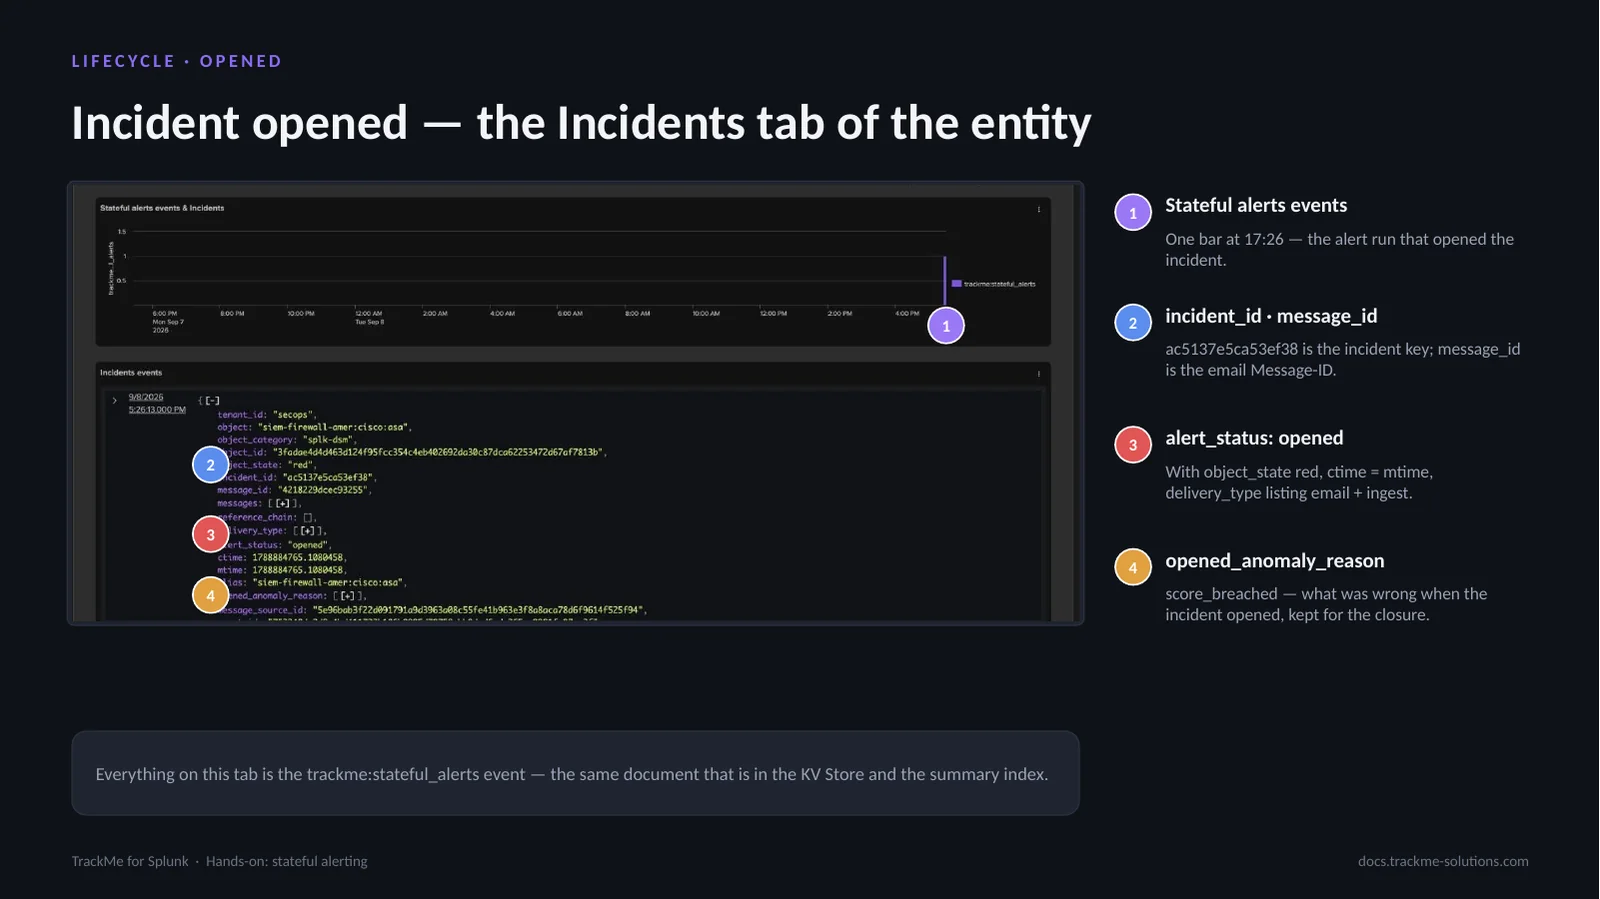
The Incidents tab of the entity shows the incident record as TrackMe stores it. The stateful alerts events chart (callout 1) has one bar at 17:26, the alert run that opened the incident. incident_id ac5137e5ca53ef38 is the incident key and message_id is the email Message-ID (callout 2); message_source_id points at the flip event that caused the incident. alert_status is opened (callout 3), with object_state red, ctime equal to mtime and delivery_type listing email and ingest. opened_anomaly_reason (callout 4) is score_breached — what was wrong when the incident opened, kept for the closure.
Everything on this tab is the trackme:stateful_alerts event, the same document held in the KV Store and in the summary index.
Anatomy of the notification email
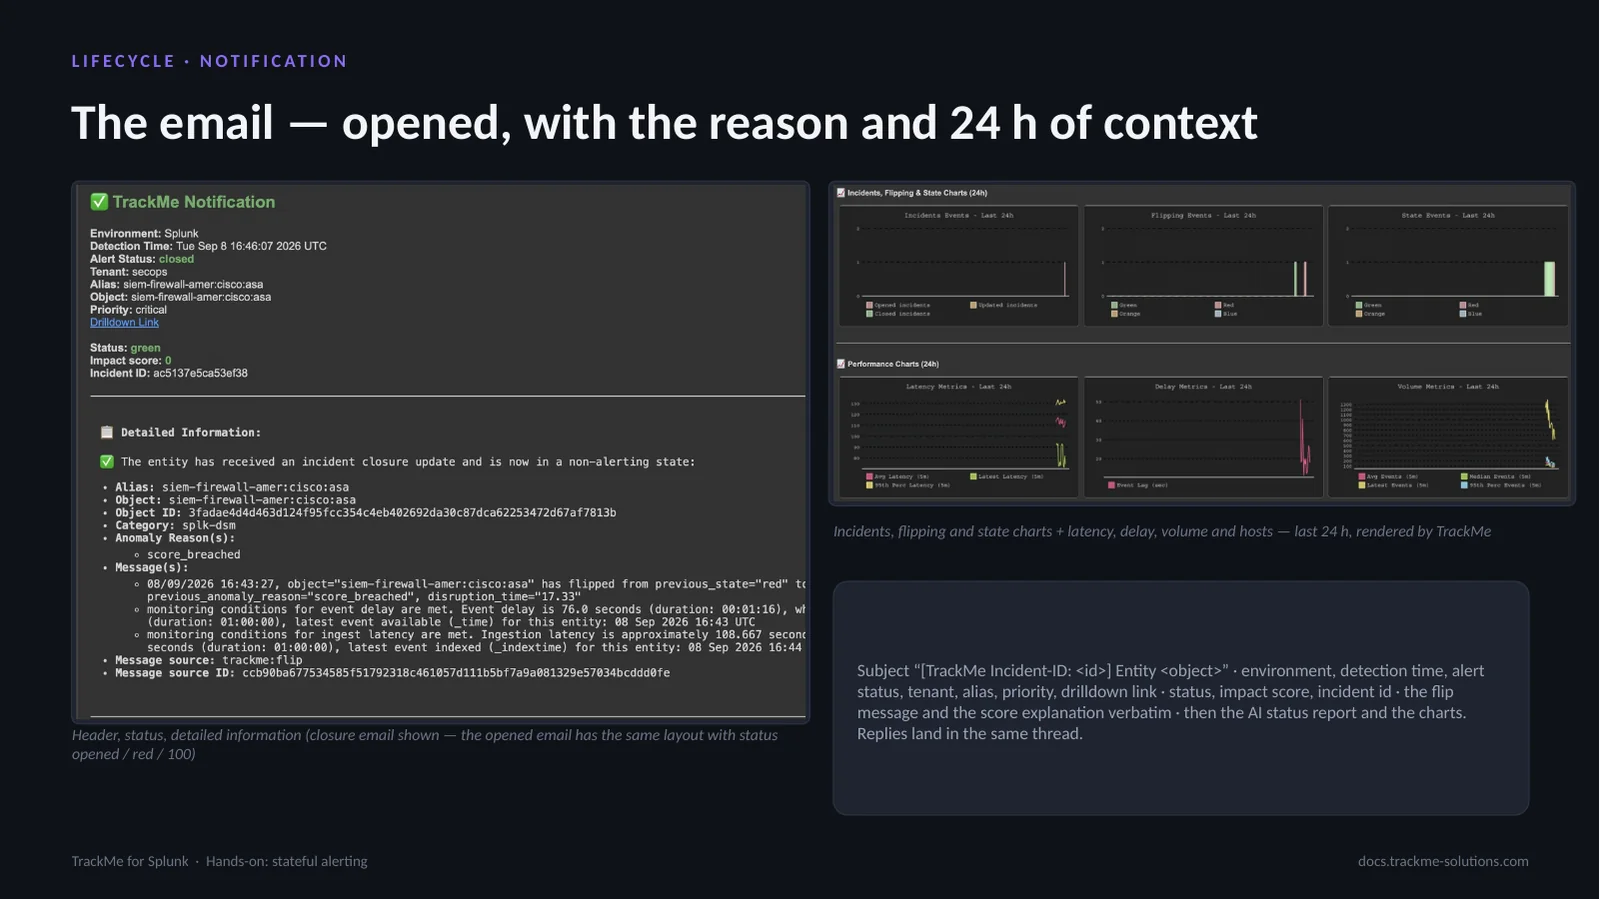
The email reads top to bottom: who, what, why, how bad, link to the entity. The subject is “[TrackMe Incident-ID: <id>] Entity <object>”. The header carries environment, detection time, alert status, tenant, alias, priority and the drilldown link; the status block gives status, impact score and incident id; detailed information quotes the flip message and score explanation verbatim. Then the AI status report, when enabled, and the 24 h charts rendered by TrackMe: incidents, flipping and state, plus latency, delay, volume and hosts.
The closure email is shown; the opened email has the same layout with status opened, red and impact score 100. Replies land in the same thread, and recipients need no Splunk access.
Reading the AI status report
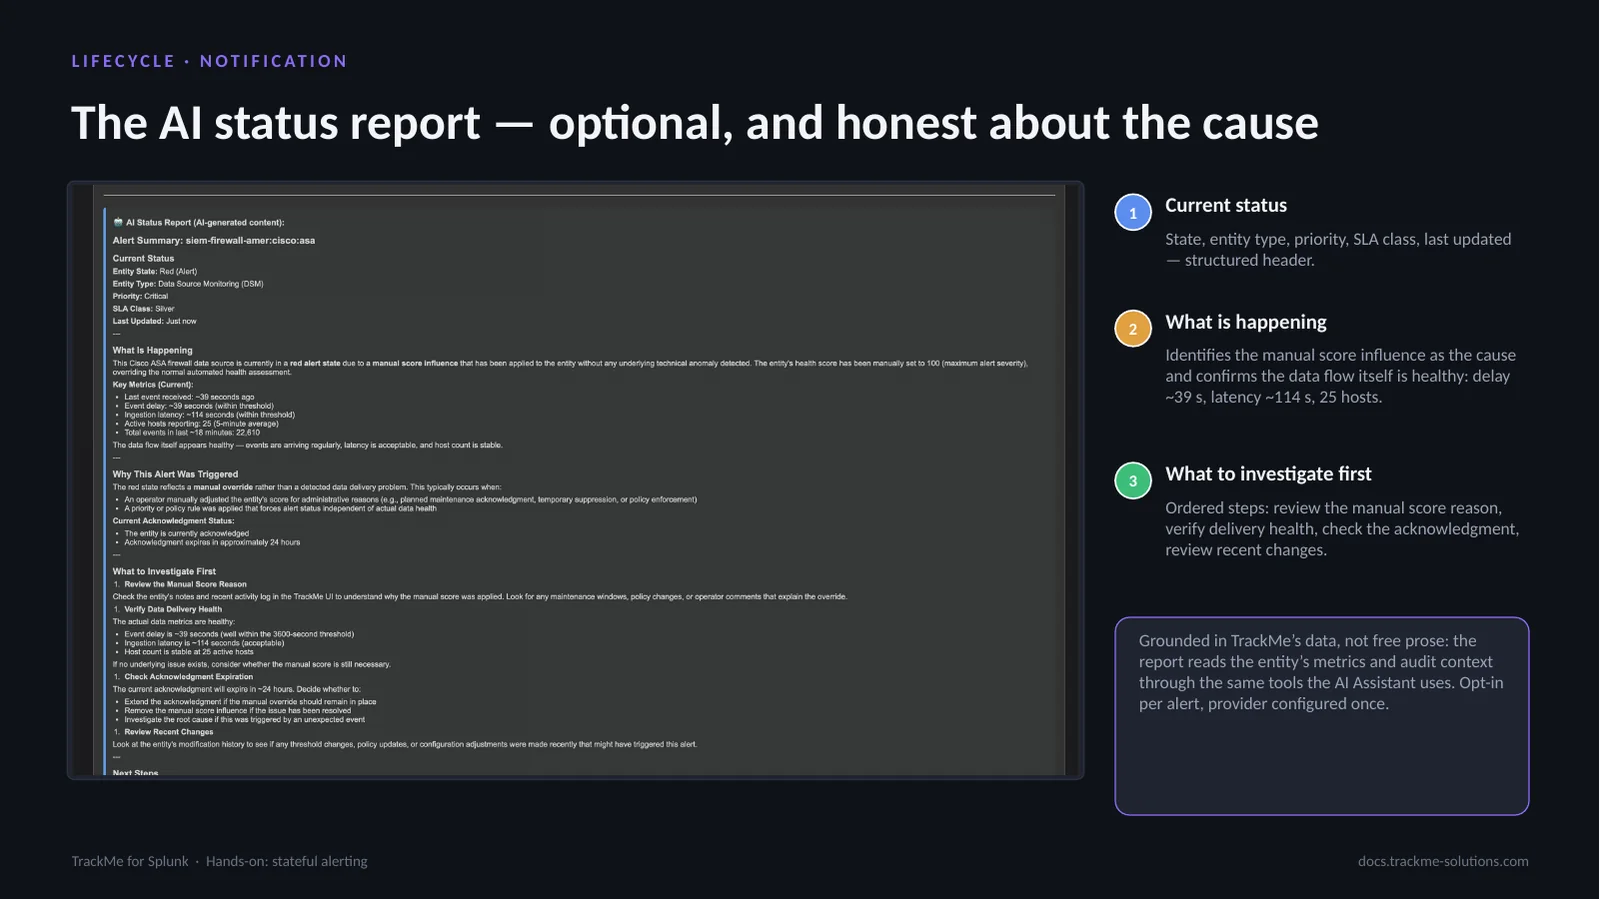
Current status (callout 1) is a structured header: state, entity type, priority, SLA class, last updated. What is happening (callout 2) names the manual score influence as the cause and confirms the data flow is healthy — delay ~39 s, latency ~114 s, 25 hosts. What to investigate first (callout 3) gives ordered steps: review the manual score reason, verify delivery health, check the acknowledgement, review recent changes.
The report is grounded in TrackMe’s data rather than free prose: it reads the entity’s metrics and audit context through the same tools the AI Assistant uses, hence the correct verdict of a manual override on a healthy feed. Opt-in per alert, provider configured once; the email is complete without it.
Flip events behind the incident
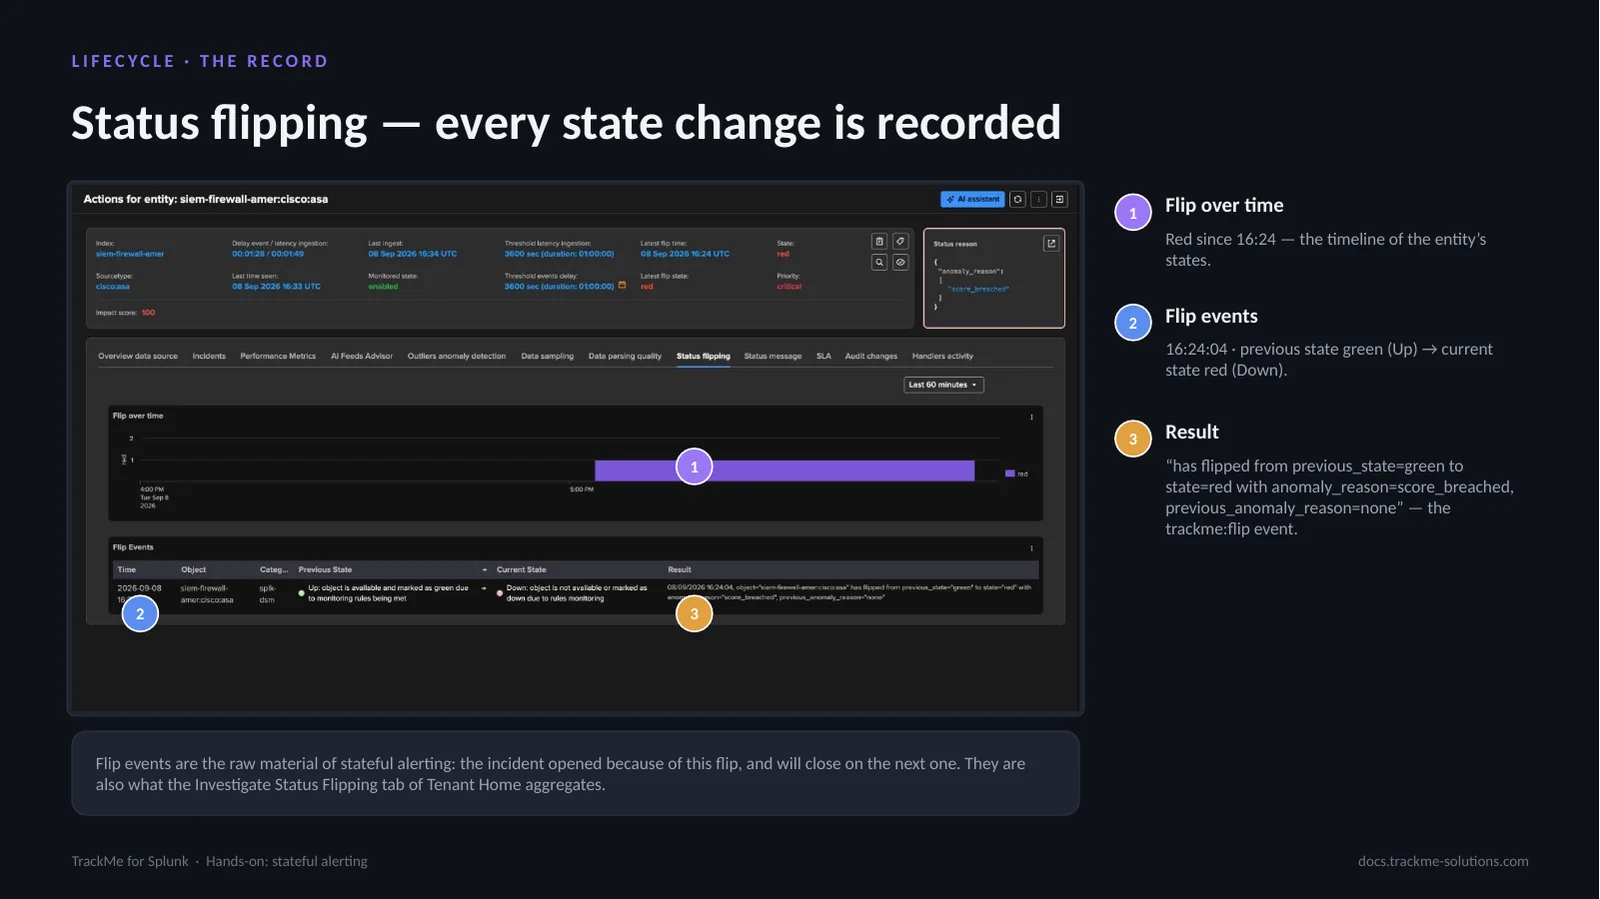
The Status flipping tab records every state change as an event with a history. Flip over time (callout 1) is the timeline of the entity’s states, red since 16:24. The flip events list (callout 2) shows 16:24:04, previous state green (Up) to current state red (Down). The result (callout 3) is the trackme:flip event itself: “has flipped from previous_state=green to state=red with anomaly_reason=score_breached, previous_anomaly_reason=none” — the same sentence quoted in the email.
Flip events are the raw material of stateful alerting: the incident opened because of this flip and closes on the next one. They are also what the Investigate Status Flipping tab of Tenant Home aggregates, which is how flapping entities are found later.
Closure record and closure email
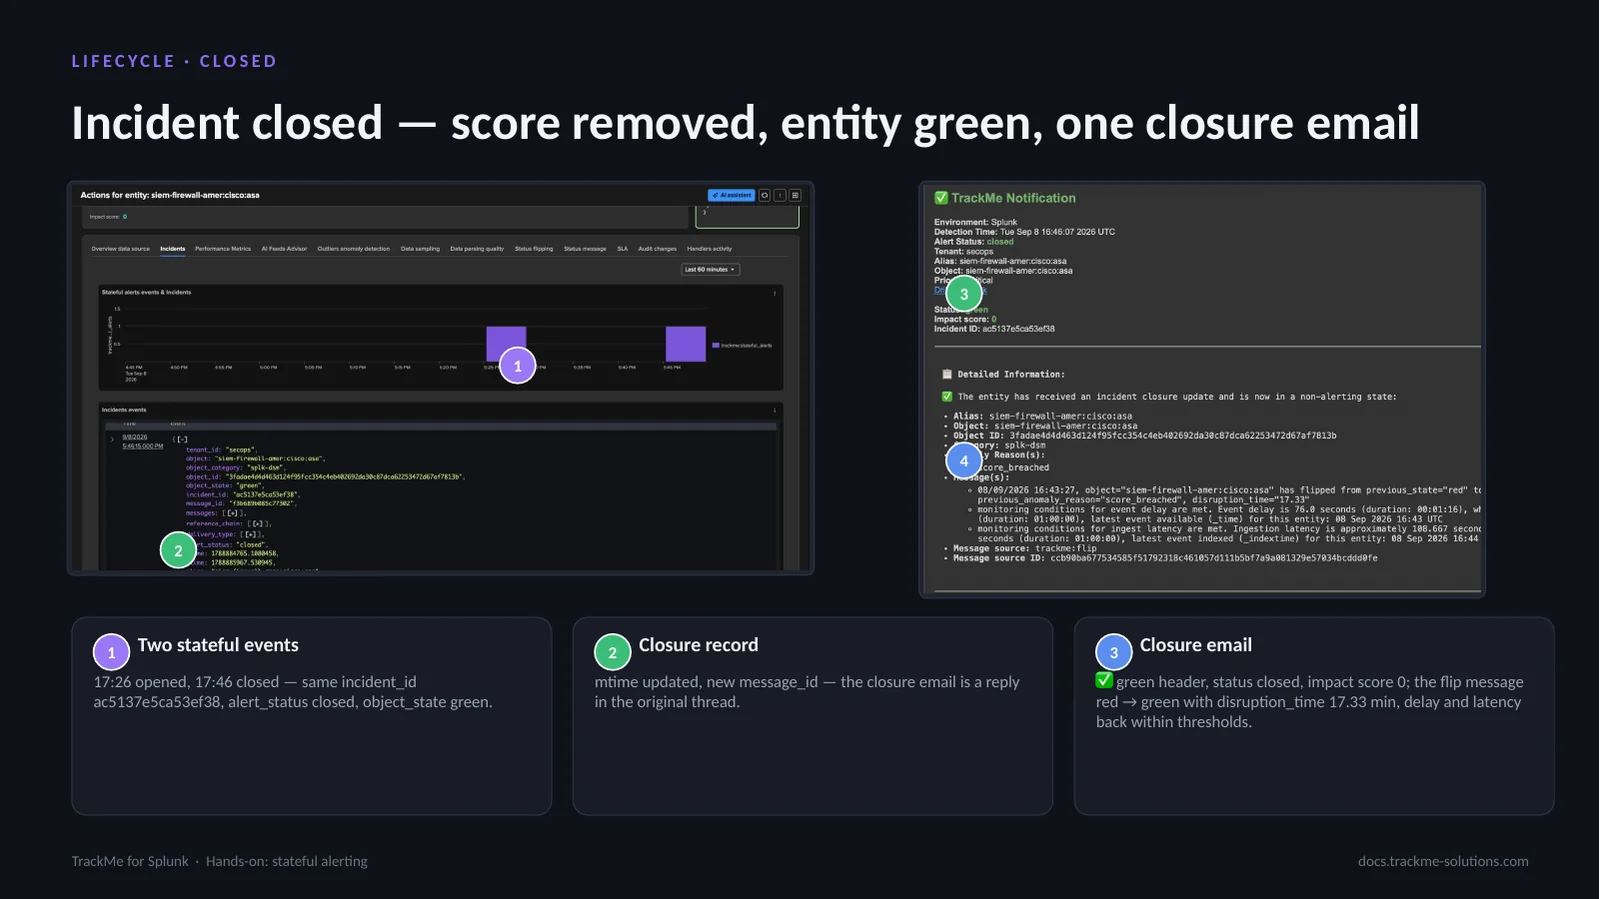
Removing the 100 points turns the entity green on the next tracker run; the alert’s next run finds an open incident and closes it. The Incidents tab shows two stateful events (callout 1): 17:26 opened, 17:46 closed, same incident_id ac5137e5ca53ef38, alert_status closed, object_state green. The closure record (callout 2) has an updated mtime and a new message_id, so the closure email is a reply in the original thread.
The closure email (callout 3) has a green header, status closed, impact score 0; it quotes the recovery flip red → green with disruption_time 17.33 min, delay and latency back within thresholds. SLA reporting uses the same disruption time; the AI recovery summary confirms the entity is healthy.
Searching the incident events
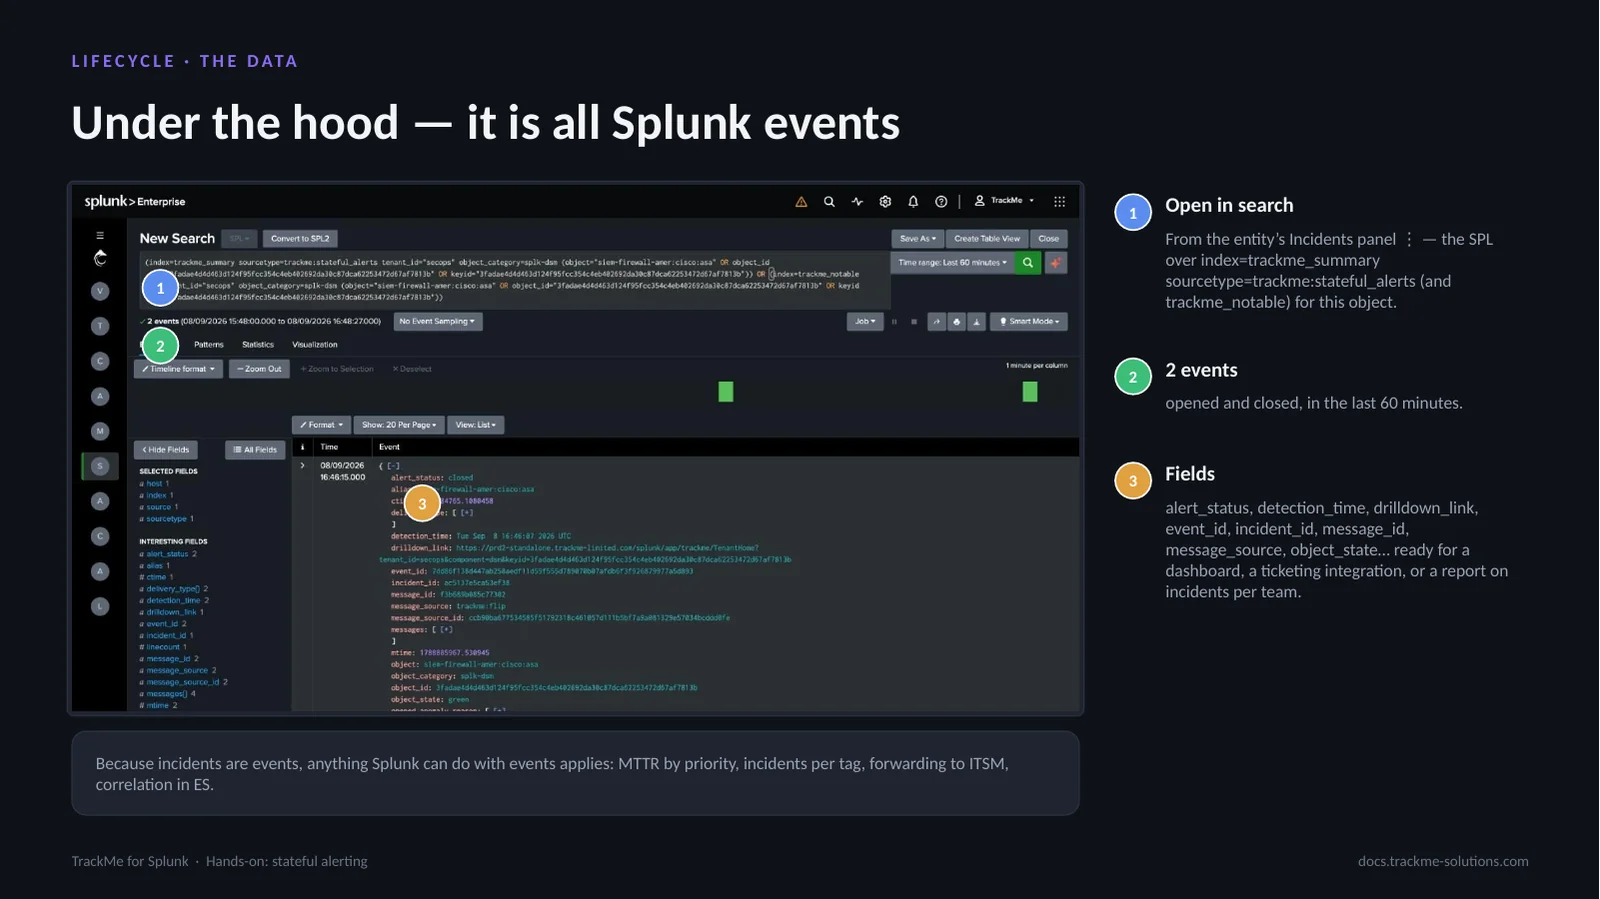
Open in search (callout 1), from the ⋮ of the entity’s Incidents panel, runs the SPL over index=trackme_summary sourcetype=trackme:stateful_alerts (and trackme_notable) for this object. It returns 2 events in the last 60 minutes (callout 2): opened and closed. The fields (callout 3) — alert_status, detection_time, drilldown_link, event_id, incident_id, message_id, message_source, object_state and more — are ready for a dashboard, a ticketing integration or a report on incidents per team.
Because incidents are events, anything Splunk can do with events applies: MTTR by priority, incidents per tag, forwarding to ITSM, correlation in Enterprise Security. There is no black box: one event per transition, with every id needed, and the drilldown_link brings a ticket back to the entity.
Where we are
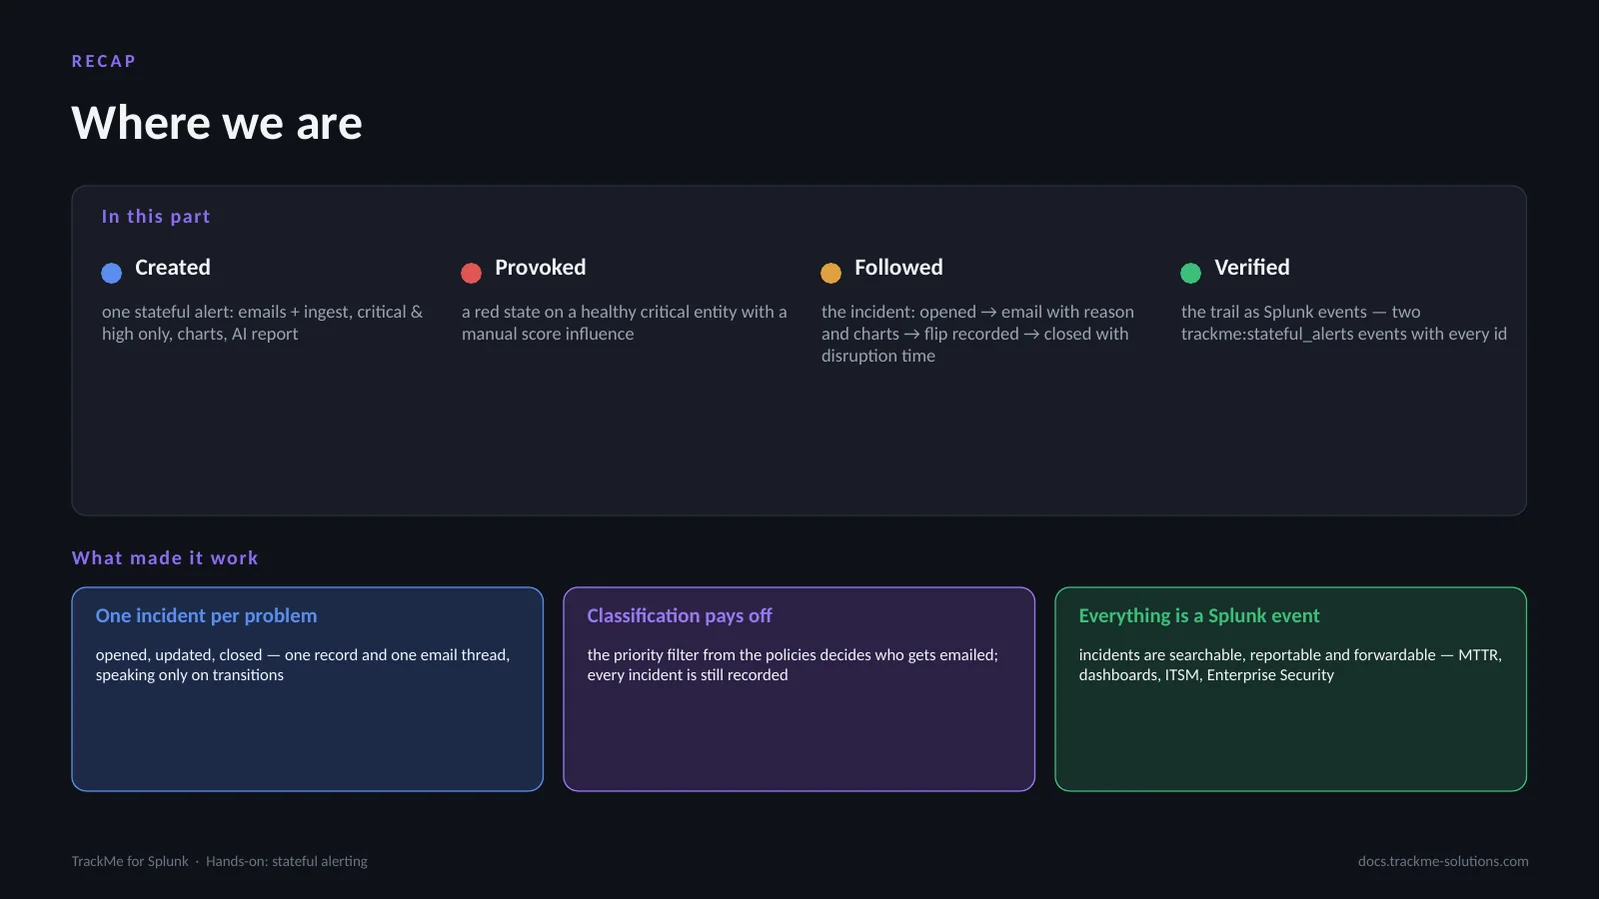
Discover, classify, alert: the cycle is complete. One stateful alert was created — emails and ingest, critical and high only, charts, AI report — and a red state provoked on a healthy critical entity by score influence. The incident was followed from opened, through the email with reason and charts, the recorded flip, to closed with its disruption time, verified as two trackme:stateful_alerts events with every id.
Key points: one incident per problem — opened, updated, closed, one record and one email thread, speaking only on transitions; the priority filter from the policies decides who is emailed while every incident is recorded; and everything is a Splunk event — searchable, reportable, forwardable to dashboards, ITSM or Enterprise Security.