Part 1 — Your first DSM tenant
From an empty TrackMe to monitored data sources: create a Virtual Tenant, let the hybrid tracker discover the feeds, and read the first entity in alert and why.
about 20 minutes · 16 slides. Each slide is followed by a description of what it shows — read top to bottom, this page is the walkthrough.
Overview
This walkthrough goes from an empty TrackMe to monitored data sources: a Virtual Tenant is created, the hybrid tracker discovers the feeds, and the first entity in alert is read together with the reason for its state. Everything shown was captured on TrackMe 2.4.18 on Splunk Cloud, starting from a tenant that did not exist.
The aim is to show the product doing what the introduction described, discover, measure and decide, on a fresh tenant with no configuration beyond an index pattern.
Six steps and the example tenant
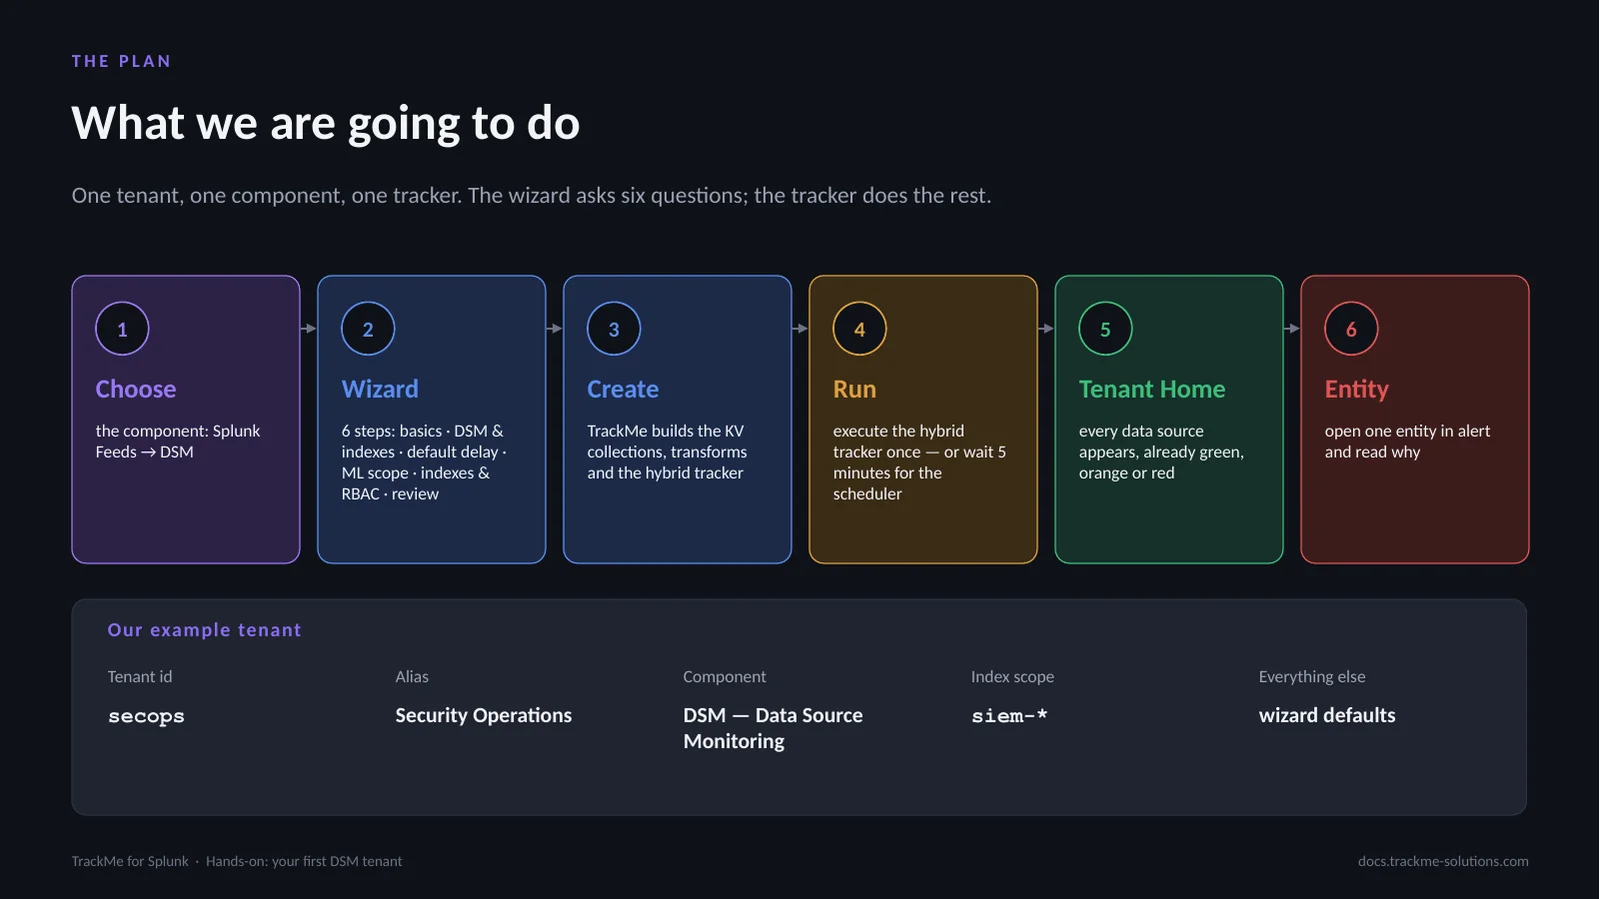
One tenant, one component, one tracker. Callouts 1 to 6 lay out the path: Choose the component (Splunk Feeds, then DSM); Wizard, six steps covering basics, DSM and indexes, default delay, ML scope, indexes and RBAC, and review; Create, where TrackMe builds the KV collections, transforms and the hybrid tracker; Run, executing the tracker once or waiting 5 minutes for the scheduler; Tenant Home, where every data source appears already green, orange or red; and Entity, opening one entity in alert to read why.
The example tenant uses the id secops, the alias Security Operations, the component DSM (Data Source Monitoring) and the index scope siem-*. Everything else keeps the wizard defaults, each revisitable from the Tenant Home later.
The tenant type chooser
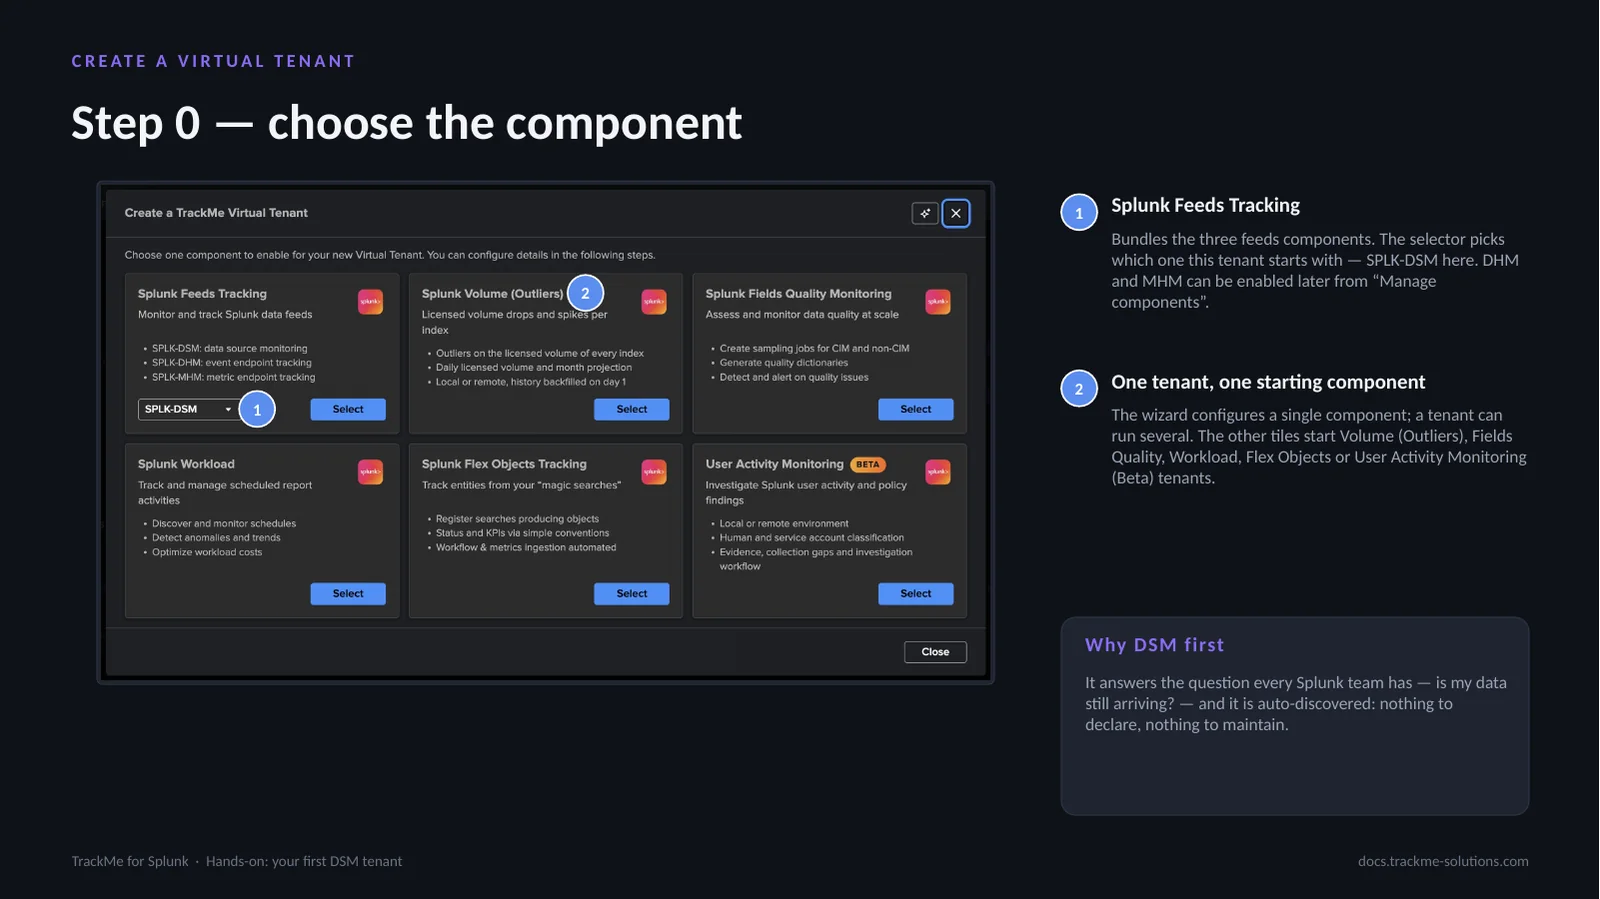
The chooser opens from Virtual Tenants, Actions, Create a tracking tenant, with eight tiles. Splunk Feeds Tracking (callout 1) bundles the three feeds components, DSM (index and sourcetype), DHM (host and sourcetype) and MHM (metric hosts); its selector picks the starting component, SPLK-DSM here, and DHM and MHM can be enabled later from Manage components. The other tiles start Volume (Outliers), Fields Quality, Workload, Flex Objects, User Activity Monitoring, Cribl Stream or Cribl Edge tenants.
The wizard configures a single component, although a tenant can run several (callout 2). DSM comes first because it answers whether the data is still arriving and is auto-discovered: nothing to declare, nothing to maintain. The AI icon at the top right opens the AI Assistant in context.
Tenant id, alias and description
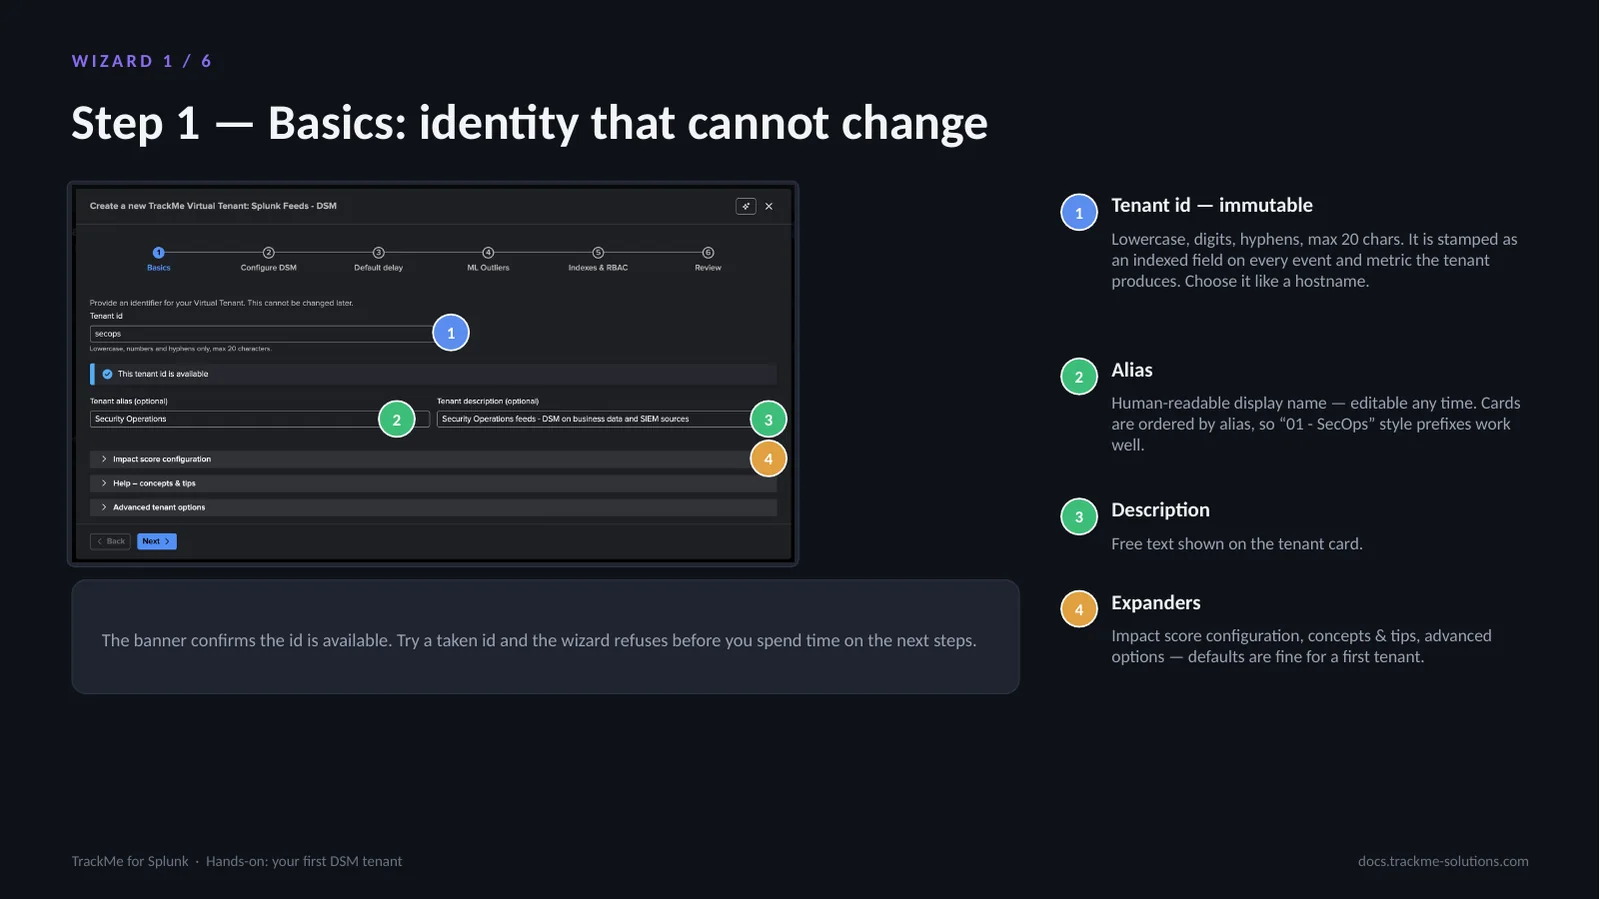
Step 1 of 6 sets identity. The Tenant id (callout 1) is immutable: lowercase, digits and hyphens, 20 characters at most. It is stamped as an indexed field on every event the tenant produces and is part of every KV collection and report name, so it should be chosen like a hostname. A banner confirms the id is available; a taken id is refused immediately.
The Alias (callout 2) is a human-readable display name, editable any time; cards are ordered by alias, so prefixes like 01 - SecOps work well. The Description (callout 3) is free text shown on the tenant card. The Expanders (callout 4) hold Impact score configuration, concepts and tips, and advanced options.
Impact score weights per tenant
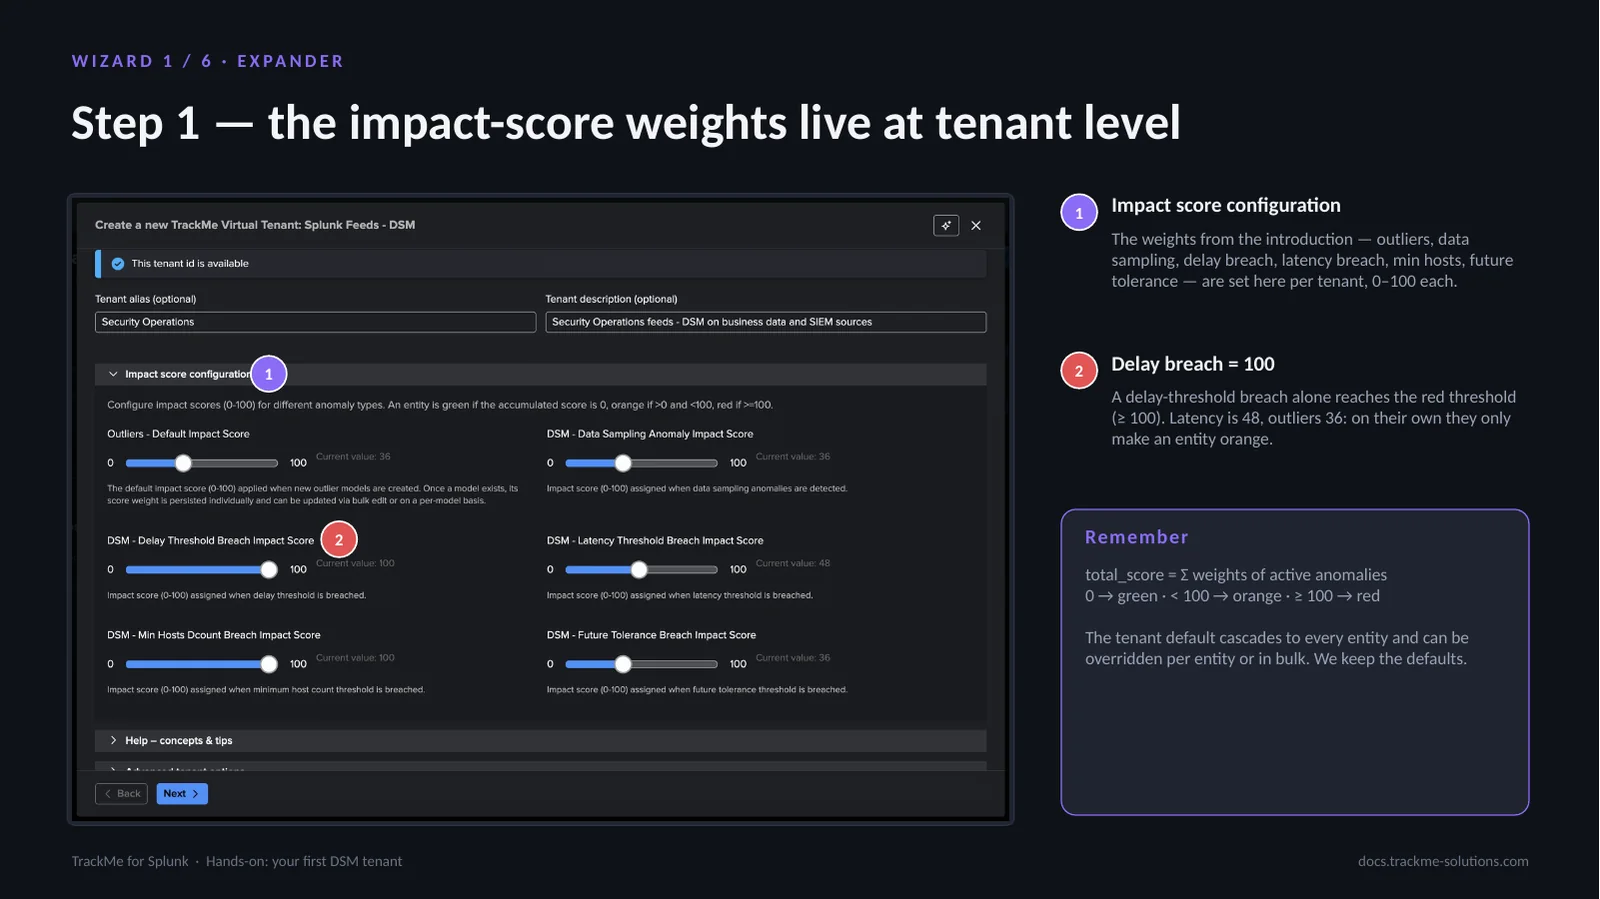
The Impact score configuration expander (callout 1) sets the weights of the scoring model, outliers, data sampling, delay breach, latency breach, min hosts and future tolerance, per tenant, from 0 to 100 each.
Delay breach carries 100 (callout 2), so a delay-threshold breach alone reaches the red threshold: a feed that stopped is by definition critical. Latency is 48 and outliers 36; on their own they only make an entity orange. The rule is total_score equals the sum of the weights of active anomalies: 0 is green, below 100 orange, 100 and above red. The tenant default cascades to every entity and can be overridden per entity or in bulk.
Discovery scope and tracker creation
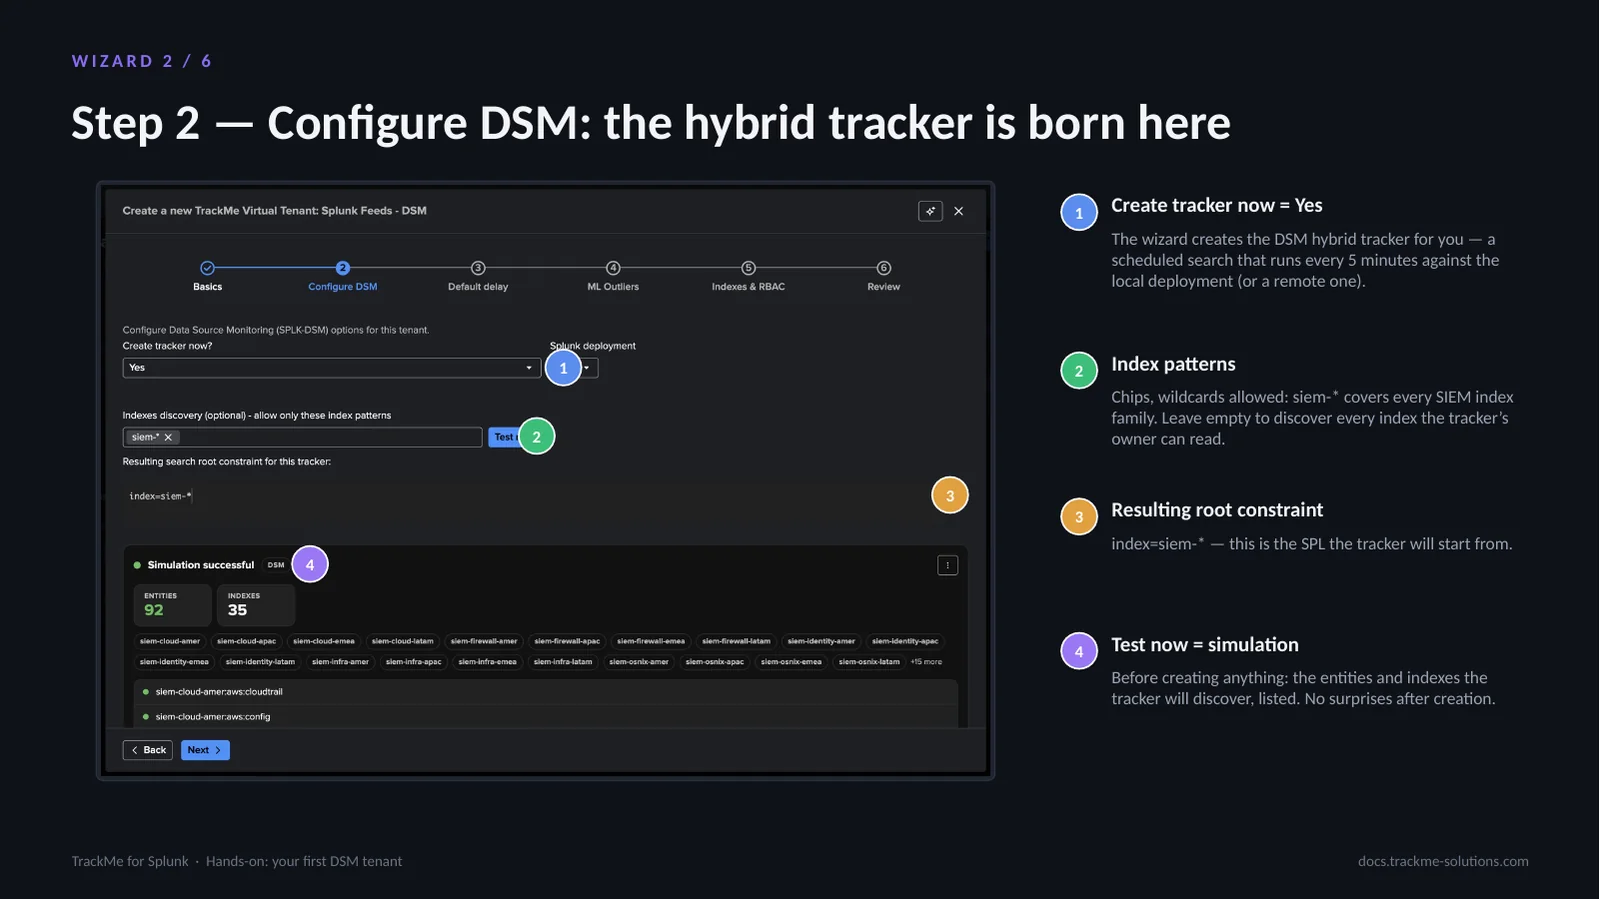
Step 2 of 6 scopes discovery and creates the tracker. Create tracker now set to Yes (callout 1) makes the wizard create the DSM hybrid tracker, a scheduled search that runs every 5 minutes against the local deployment or a remote one. Index patterns (callout 2) are chips with wildcards allowed: siem-* covers every SIEM index family, and an empty list discovers every index the tracker’s owner can read.
The Resulting root constraint (callout 3) shows the SPL the tracker starts from, index=siem-*. Test now (callout 4) runs the discovery search as a simulation before anything is created, listing the entities and indexes the tracker would discover. It is the fastest way to validate index patterns and permissions before committing.
Variable delay slots
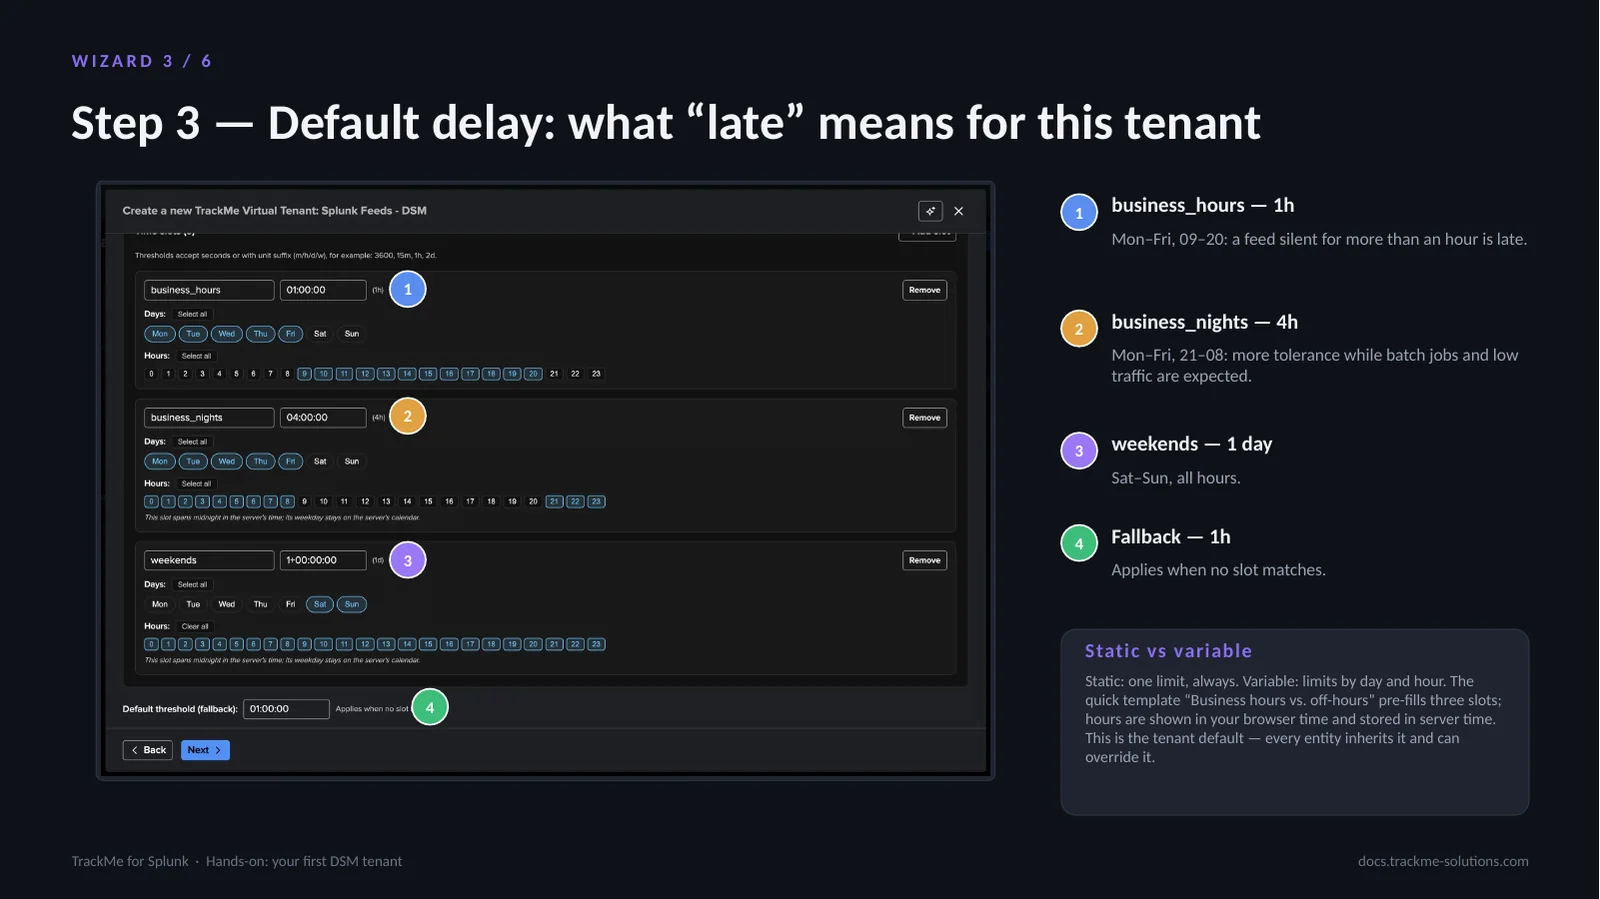
Delay is the core DSM metric: the time since the last event was indexed, compared to a threshold. A static threshold is one limit always; a variable one sets limits by day and hour. The quick template Business hours vs. off-hours pre-fills three slots: business_hours (callout 1), Monday to Friday 09 to 20, 1h; business_nights (callout 2), Monday to Friday 21 to 08, 4h; weekends (callout 3), Saturday and Sunday, 1 day. The Fallback (callout 4), 1h, applies when no slot matches.
Hours are shown in browser time and stored in server time. Every entity inherits this tenant default and can override it, which keeps TrackMe quiet at night and on weekends without a rule per feed.
ML outliers scope and the VOL recommendation
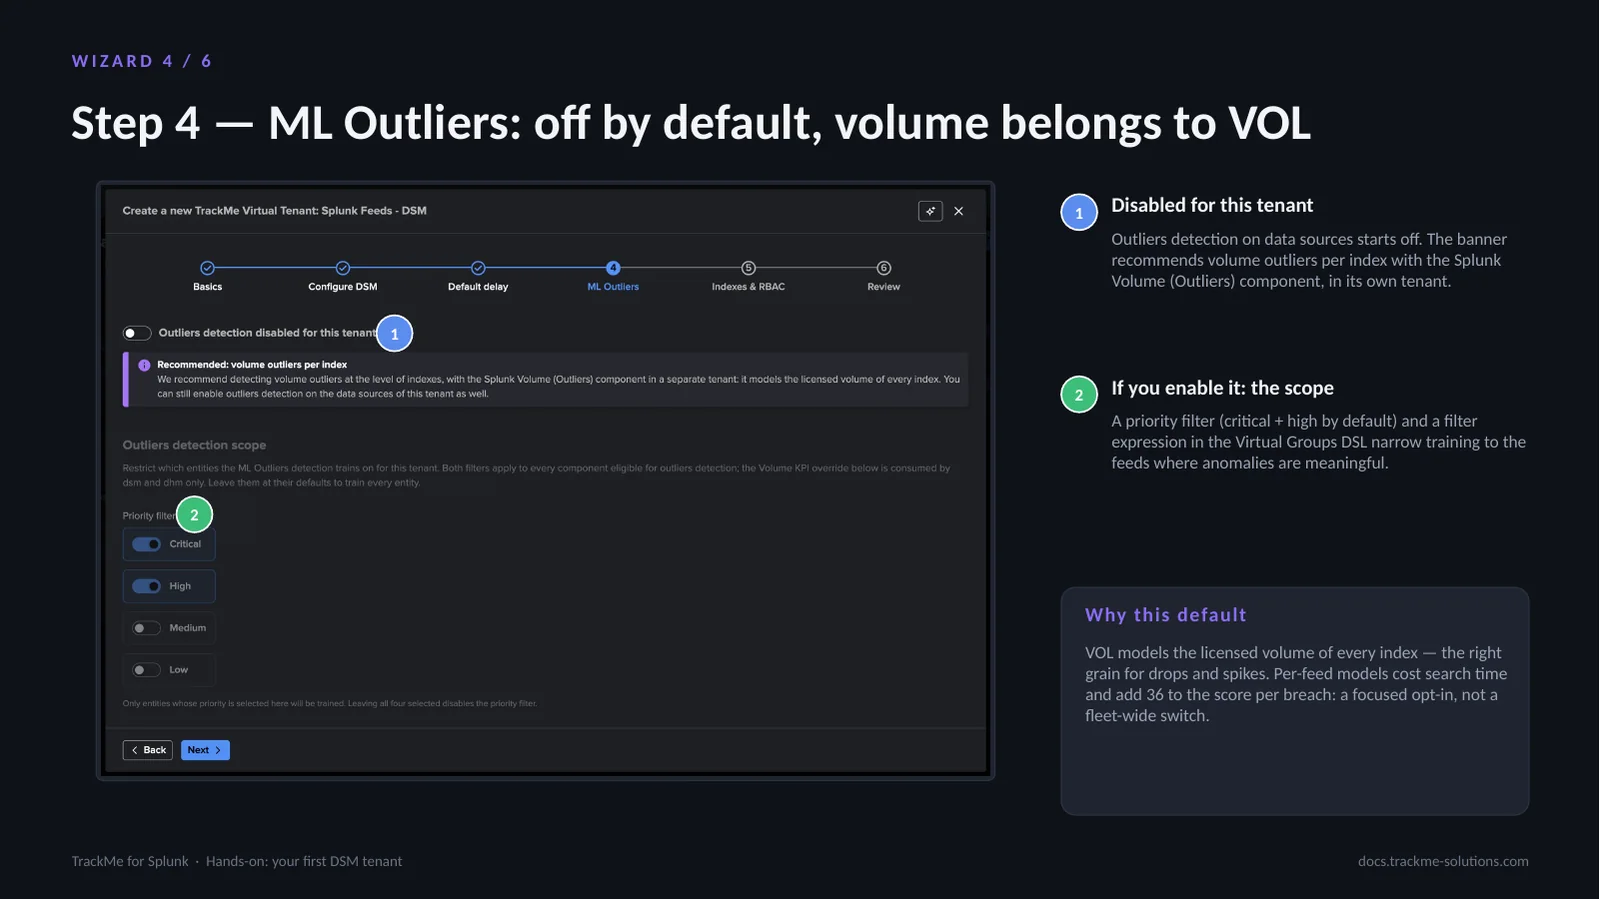
Step 4 of 6 covers ML outliers. Outliers detection on data sources starts disabled for the tenant (callout 1), and the banner recommends volume outliers per index with the Splunk Volume (Outliers) component in its own tenant. Nothing needs changing for a first tenant.
When enabled, the scope (callout 2) narrows training to the feeds where anomalies are meaningful: a priority filter, critical and high by default, and a filter expression in the Virtual Groups DSL. VOL models the licensed volume of every index, the right grain for drops and spikes, whereas per-feed models cost search time and add 36 to the score per breach. Outliers are a focused opt-in, not a fleet-wide switch.
Tenant indexes, owner and roles
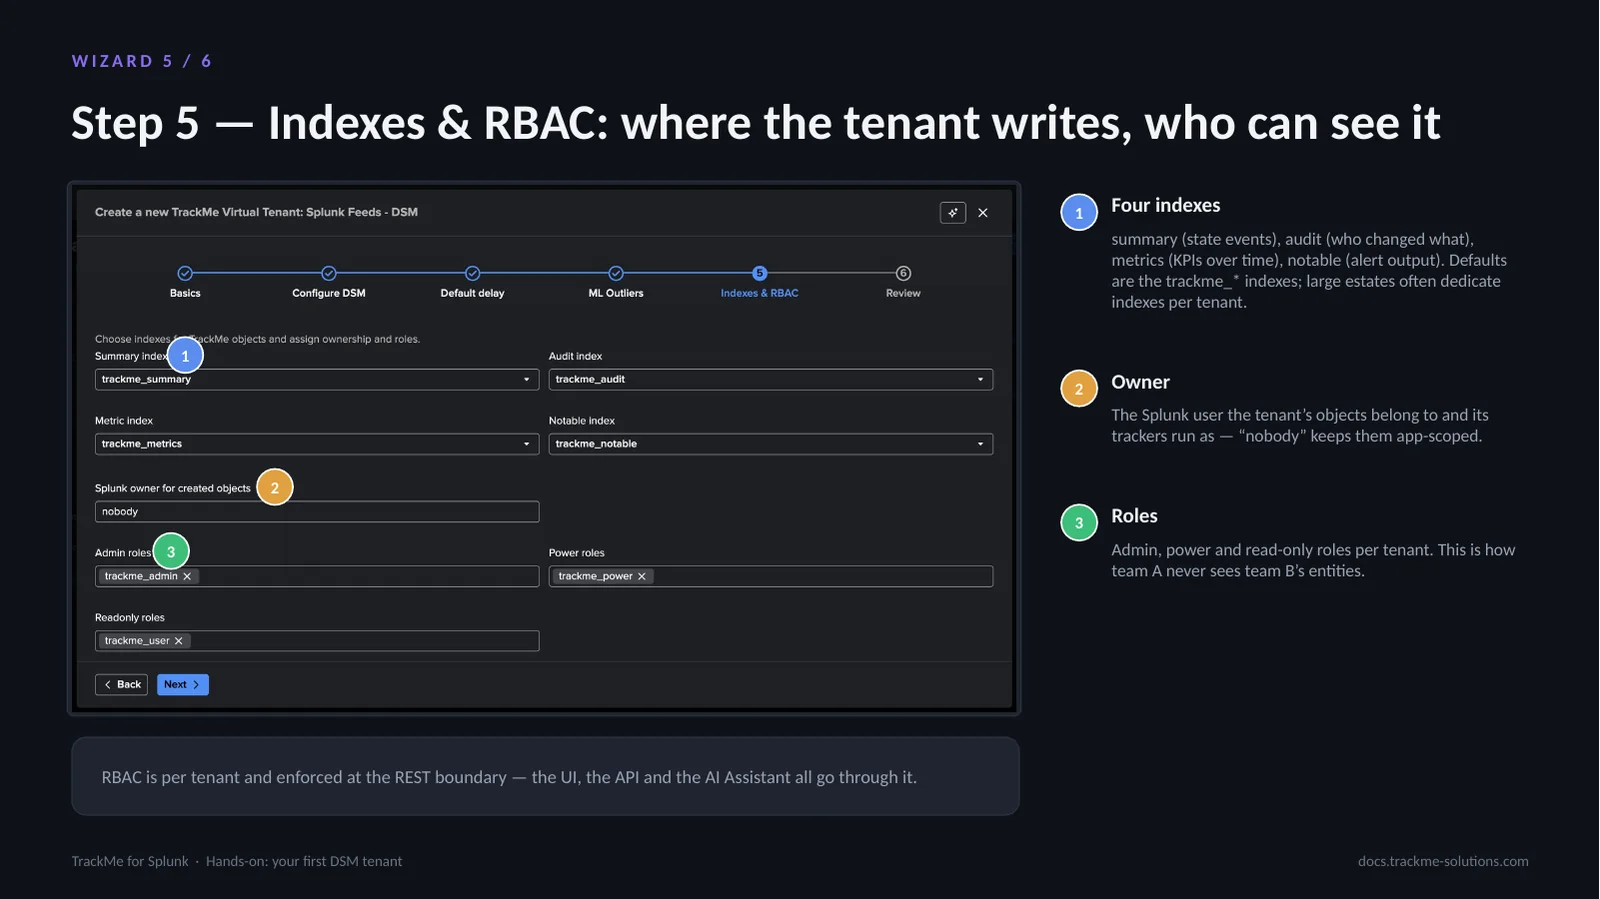
Step 5 of 6 sets where the tenant writes and who sees it. Four indexes (callout 1) receive its output: summary for state events, audit for who changed what, metrics for KPIs over time and notable for alert output. The defaults are the trackme_* indexes; large estates often dedicate indexes per tenant.
The Owner (callout 2) is the Splunk user the tenant’s objects belong to and its trackers run as; nobody keeps them app-scoped. Roles (callout 3) assign admin, power and read-only Splunk roles per tenant, so one team never sees another’s entities. RBAC is per tenant and enforced at the REST boundary: the UI, the API and the AI Assistant all go through it.
Creation log and resulting objects
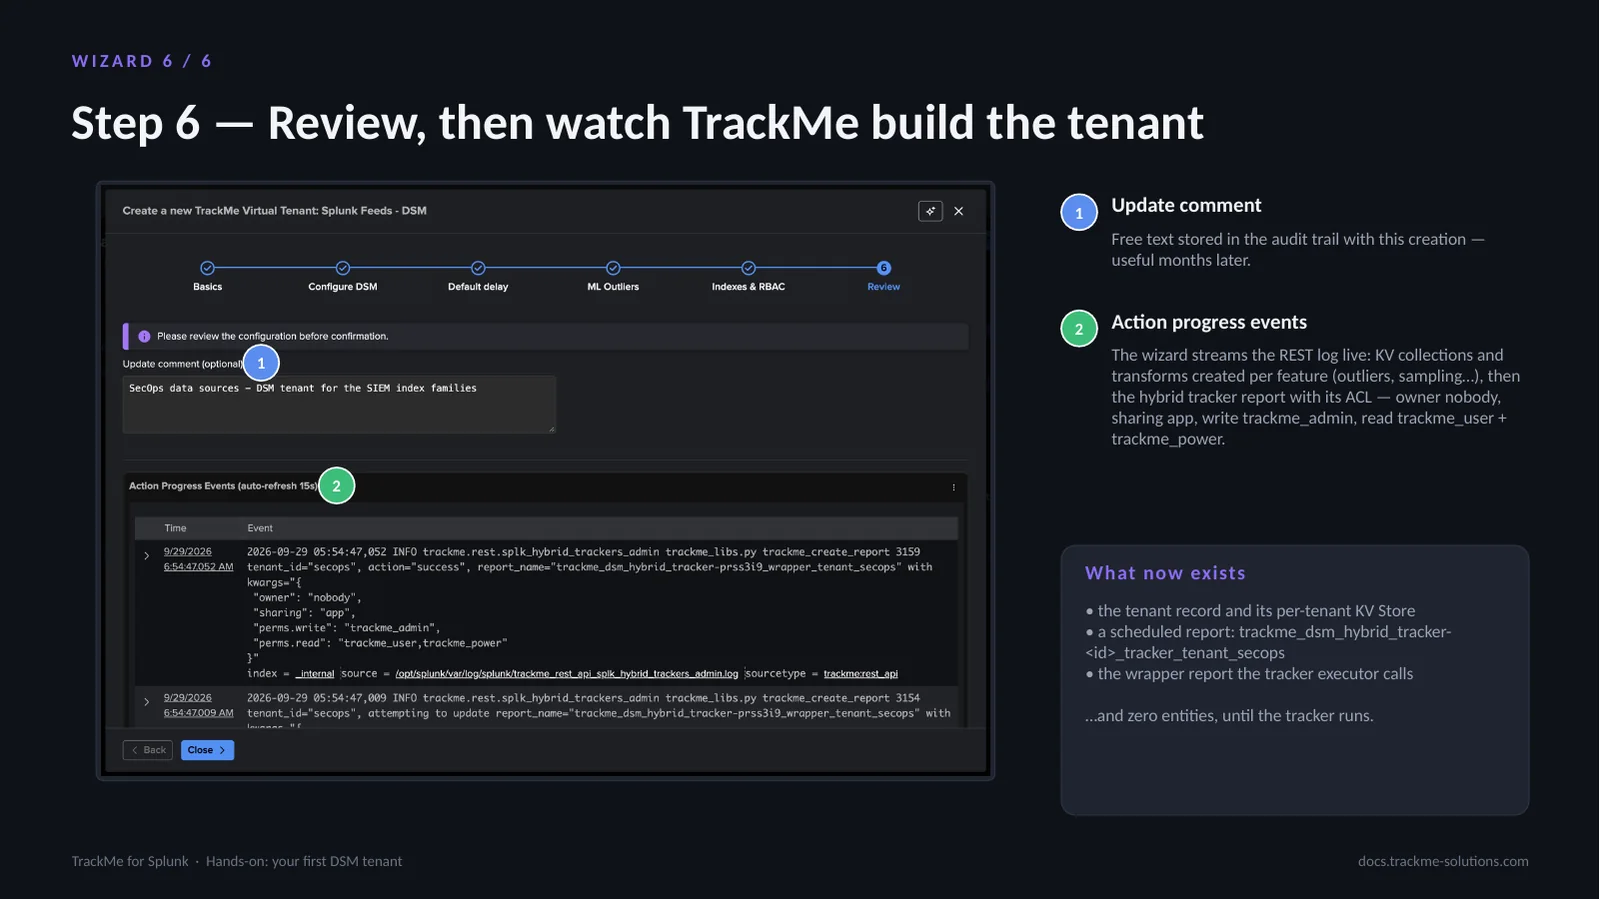
Step 6 of 6 reviews and creates the tenant. The Update comment (callout 1) is free text stored in the audit trail with this creation. The Action progress events panel (callout 2) streams the REST log live, the same log an administrator would read in the TrackMe REST API logs: KV collections and transforms created per feature (outliers, sampling and so on), then the hybrid tracker report with its ACL, owner nobody, sharing app, write trackme_admin, read trackme_user and trackme_power. Creation takes seconds.
What now exists: the tenant record and its per-tenant KV Store, a scheduled report named trackme_dsm_hybrid_tracker-<id>_tracker_tenant_secops, and the wrapper report the tracker executor calls. There are zero entities until the tracker runs.
Executing the tracker from Tenant Home
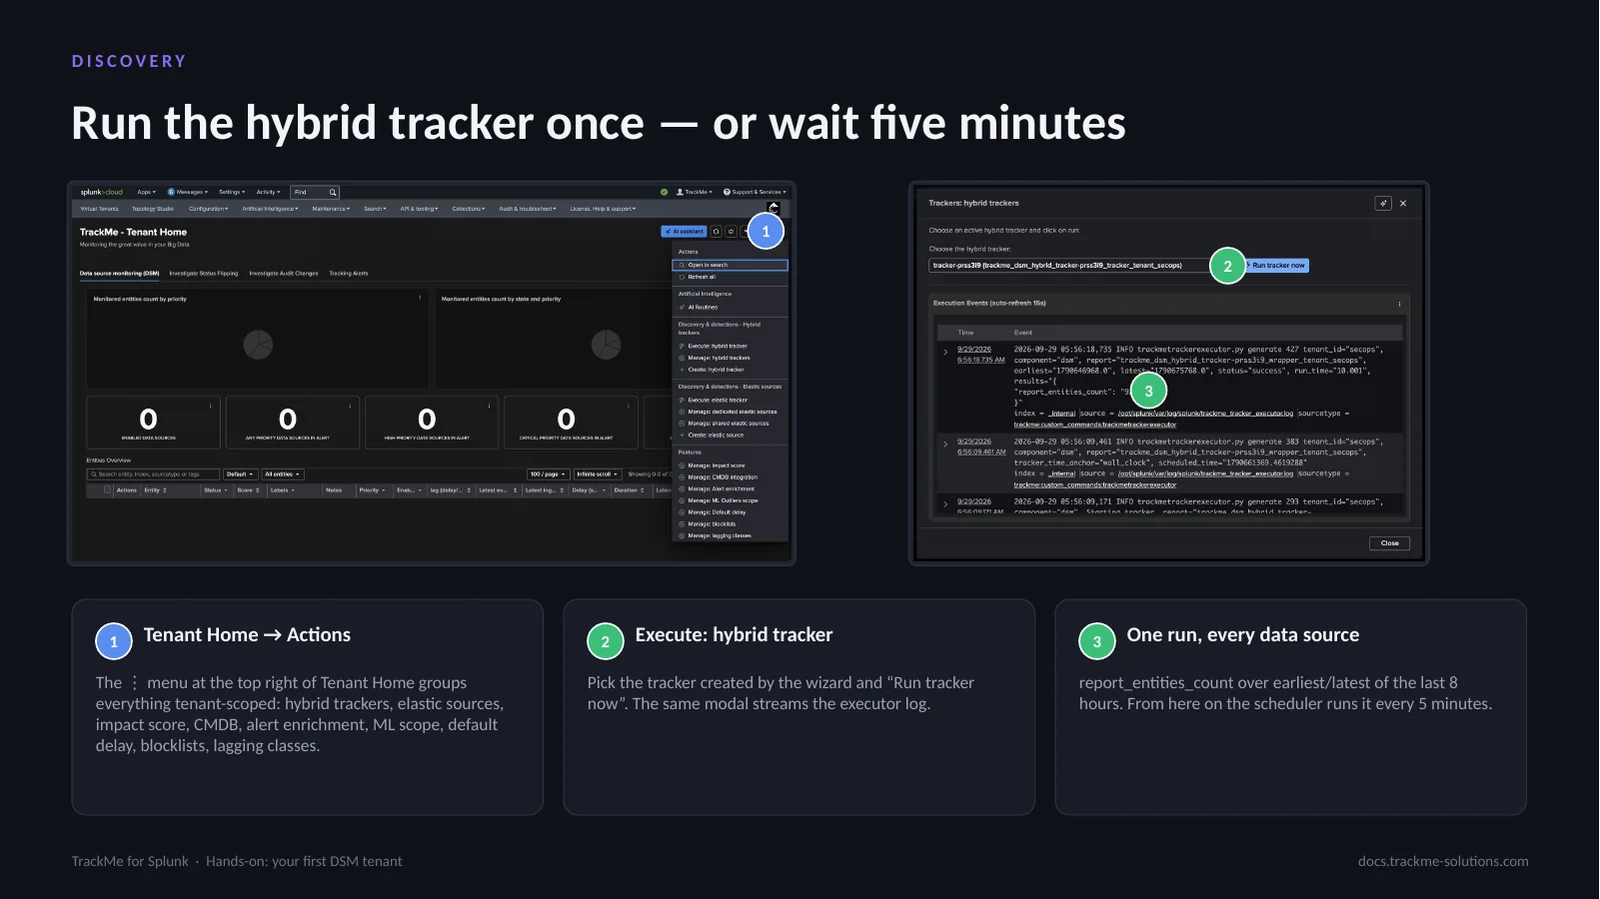
Nothing appears in Tenant Home until a tracker has run, because TrackMe is not a live dashboard. Rather than waiting for the 5-minute schedule, the tracker is executed from Tenant Home, Actions (callout 1): the menu at the top right groups everything tenant-scoped, hybrid trackers, elastic sources, impact score, CMDB, alert enrichment, ML scope, default delay, blocklists and lagging classes.
Execute: hybrid tracker (callout 2) picks the tracker created by the wizard and offers Run tracker now; the same modal streams the executor log. One run covers every data source (callout 3): the panel reports report_entities_count over the last 8 hours. From here on the scheduler runs it every 5 minutes.
Health strip, donuts and entities table
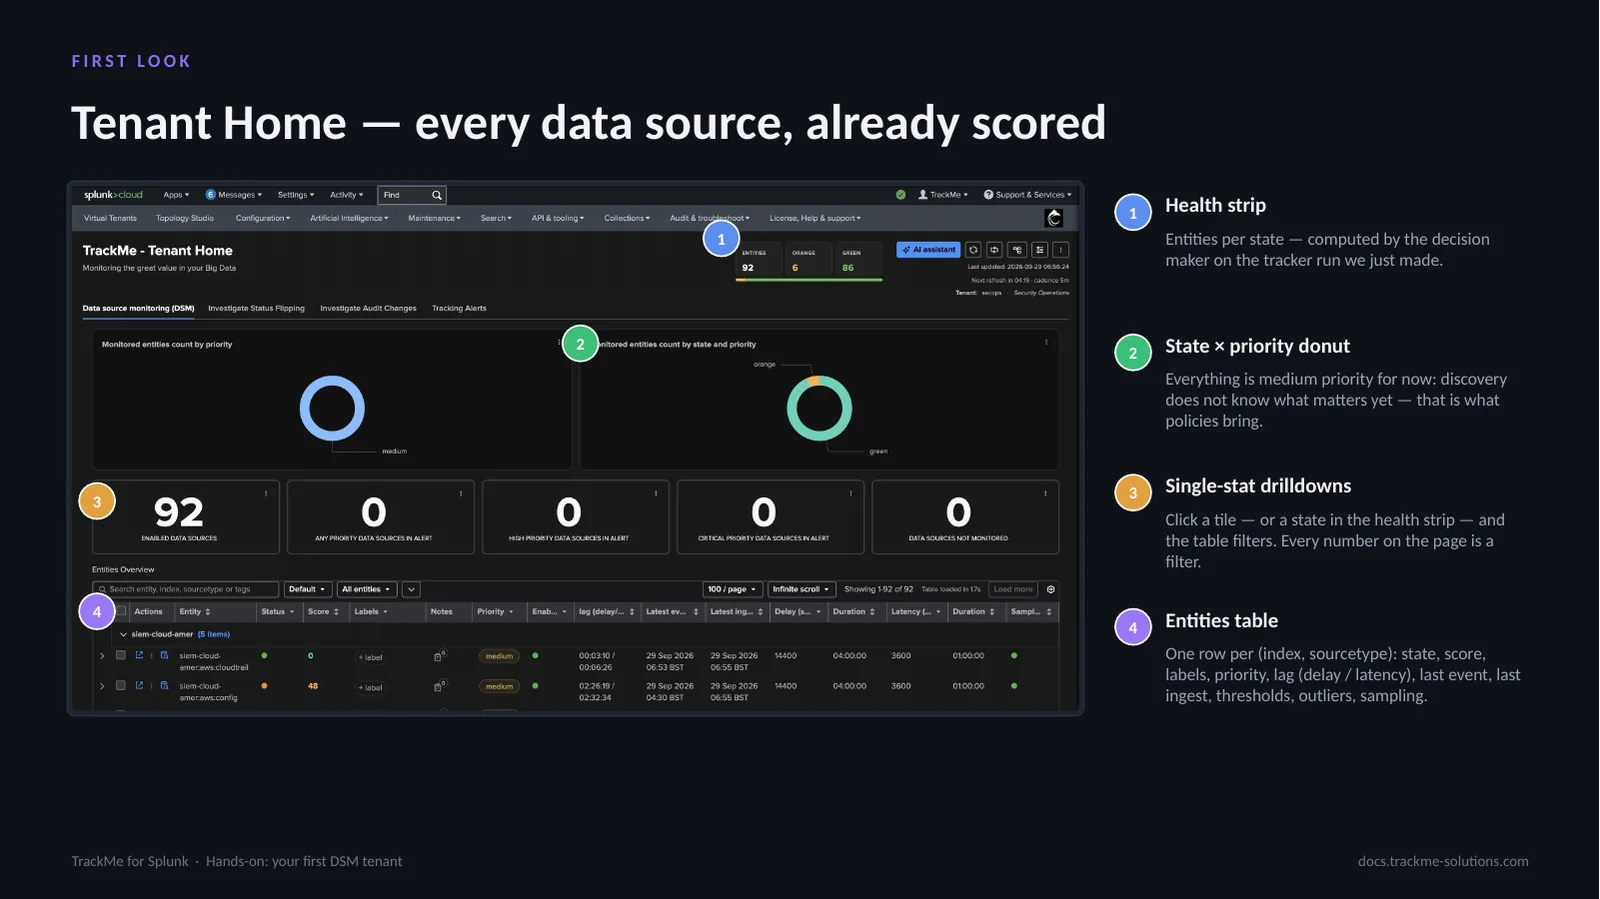
Four tabs run across the top of Tenant Home: the component view, status flipping, audit changes and tracking alerts. The Health strip (callout 1) counts entities per state, computed by the decision maker on the tracker run just made. The State by priority donut (callout 2) shows everything at medium priority: discovery does not yet know what matters, which is what policies bring.
The Single-stat drilldowns (callout 3) and every state in the health strip filter the table on click; every number on the page is a filter. The Entities table (callout 4) has one row per (index, sourcetype) with state, score, labels, priority, lag (delay and latency), last event, last ingest, thresholds, outliers and sampling.
Score, lag and thresholds in a row
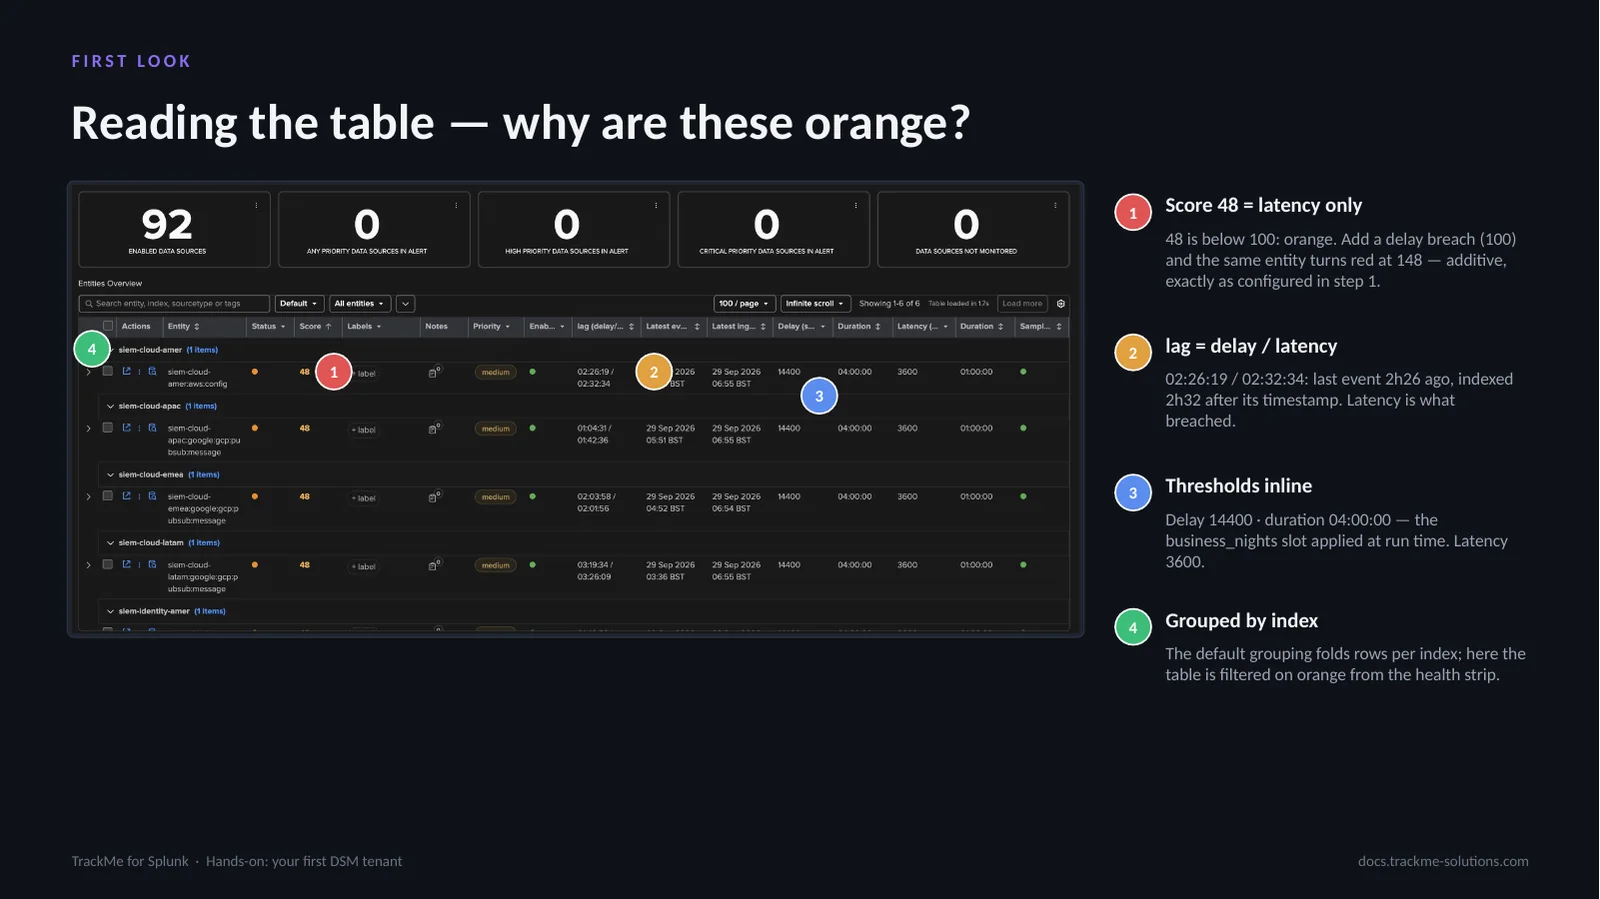
With the table filtered on orange from the health strip and grouped by index (callout 4), one row reads siem-cloud-amer:aws:config, orange, score 48, medium. Score 48 (callout 1) means latency only: 48 is below 100, hence orange. Adding a delay breach (100) would turn the same entity red at 148, additive exactly as configured in step 1. Sorting by score shows at a glance how many anomalies overlap.
The lag column (callout 2) shows delay and latency, 02:26:19 / 02:32:34: the last event is 2h26 old and was indexed 2h32 after its timestamp, so latency is what breached. The inline thresholds (callout 3) show Delay 14400 with duration 04:00:00, the business_nights slot applied at run time, and Latency 3600.
The entity view
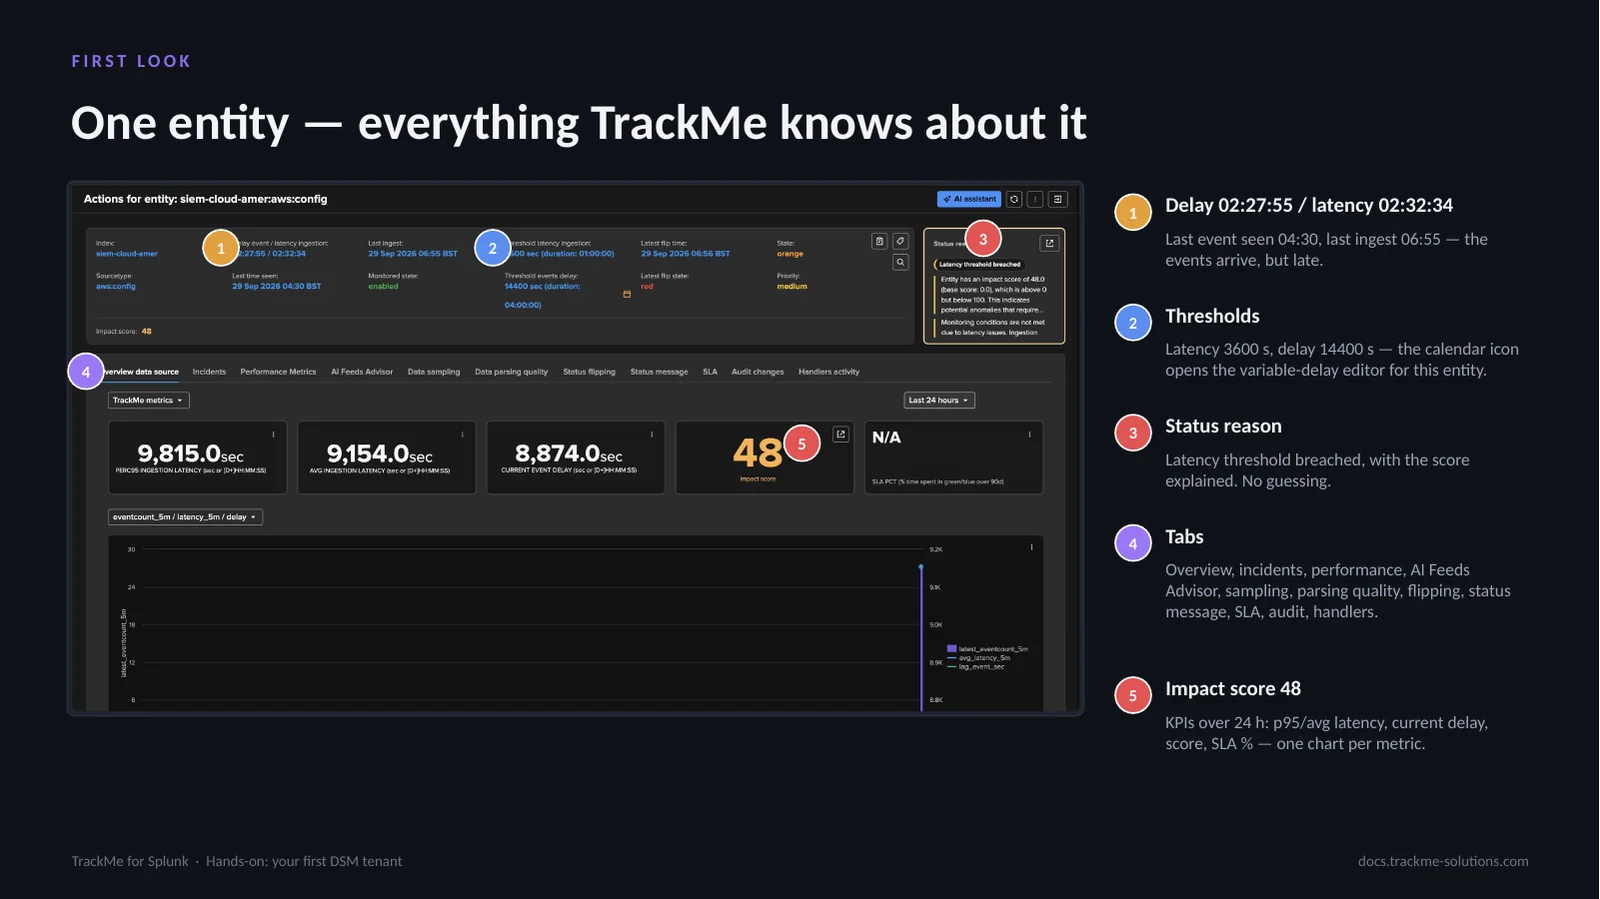
The view is the same for every component; only the KPIs differ. The header (callout 1) is the decision maker’s output: Delay 02:27:55 and latency 02:32:34, last event seen at 04:30, last ingest at 06:55, so the events arrive, but late. Thresholds (callout 2) show Latency 3600 s and delay 14400 s; the calendar icon opens the variable-delay editor. The Status reason (callout 3) states that the latency threshold is breached.
The Tabs (callout 4) are Overview, incidents, performance, AI Feeds Advisor, sampling, parsing quality, flipping, status message, SLA, audit and handlers. Impact score 48 (callout 5) heads the KPIs over 24 h, p95 and average latency, delay, score and SLA %, one chart per metric.
Status message and score breakdown
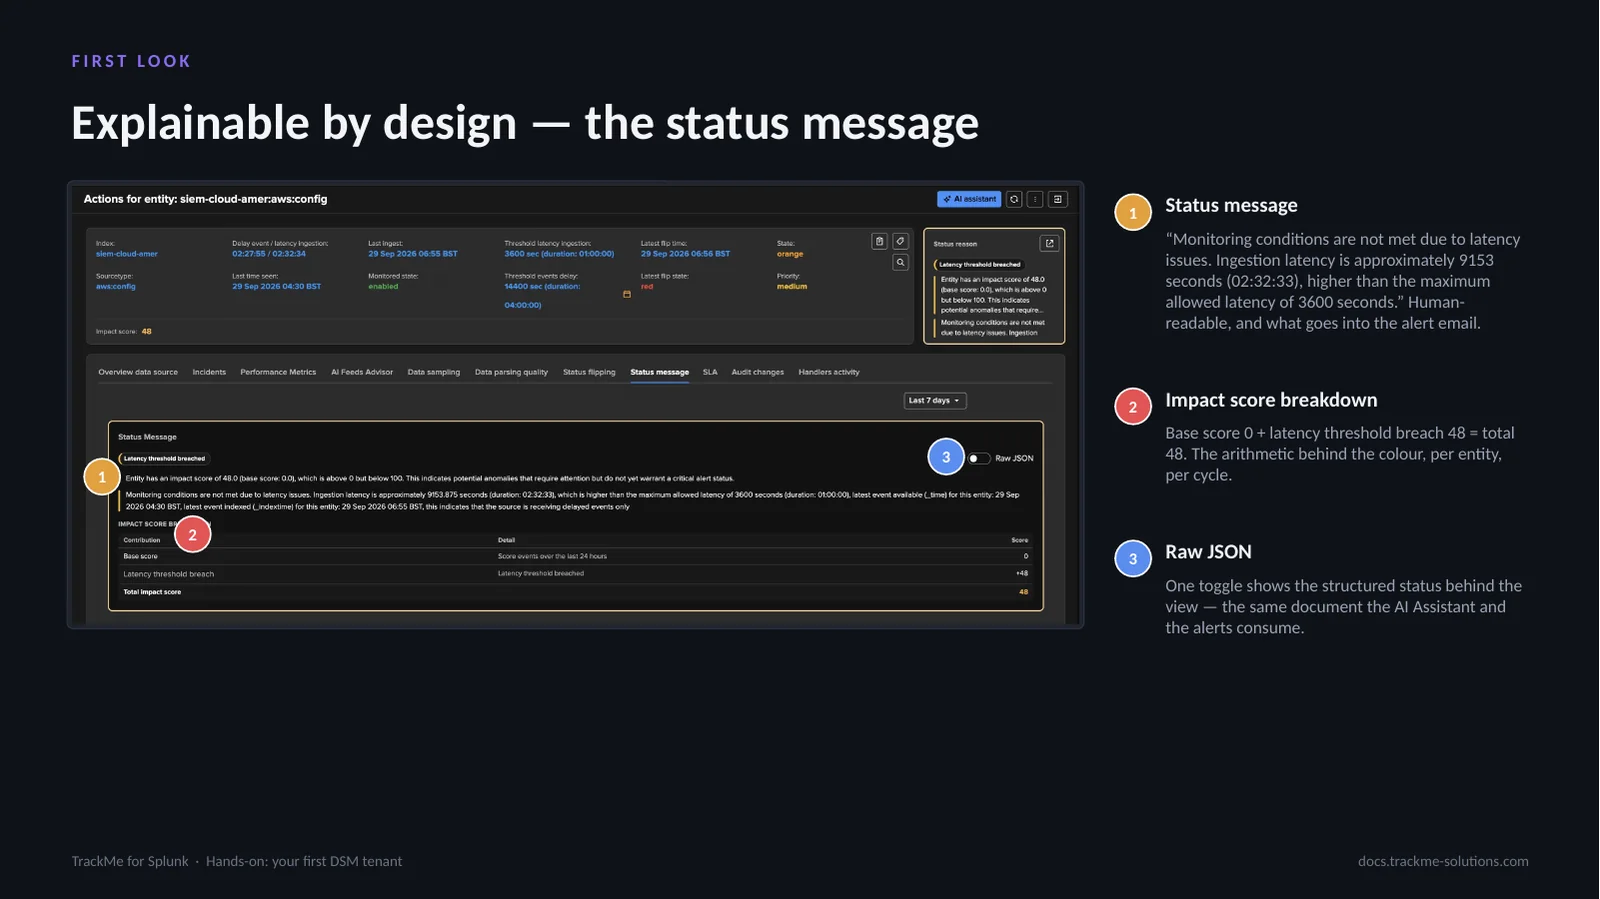
The Status message (callout 1) is human-readable and is the text that goes into the alert email: Monitoring conditions are not met due to latency issues. Ingestion latency is approximately 9153 seconds (02:32:33), higher than the maximum allowed latency of 3600 seconds. The Impact score breakdown (callout 2) gives the arithmetic behind the colour: base score 0 plus latency threshold breach 48 equals total 48.
The Raw JSON toggle (callout 3) shows the structured status behind the view, the same document the AI Assistant and the alerts consume. Nothing in TrackMe changes state without a reason string and a score breakdown. The 7-day timeline below is how flapping is spotted over weeks.
Where we are
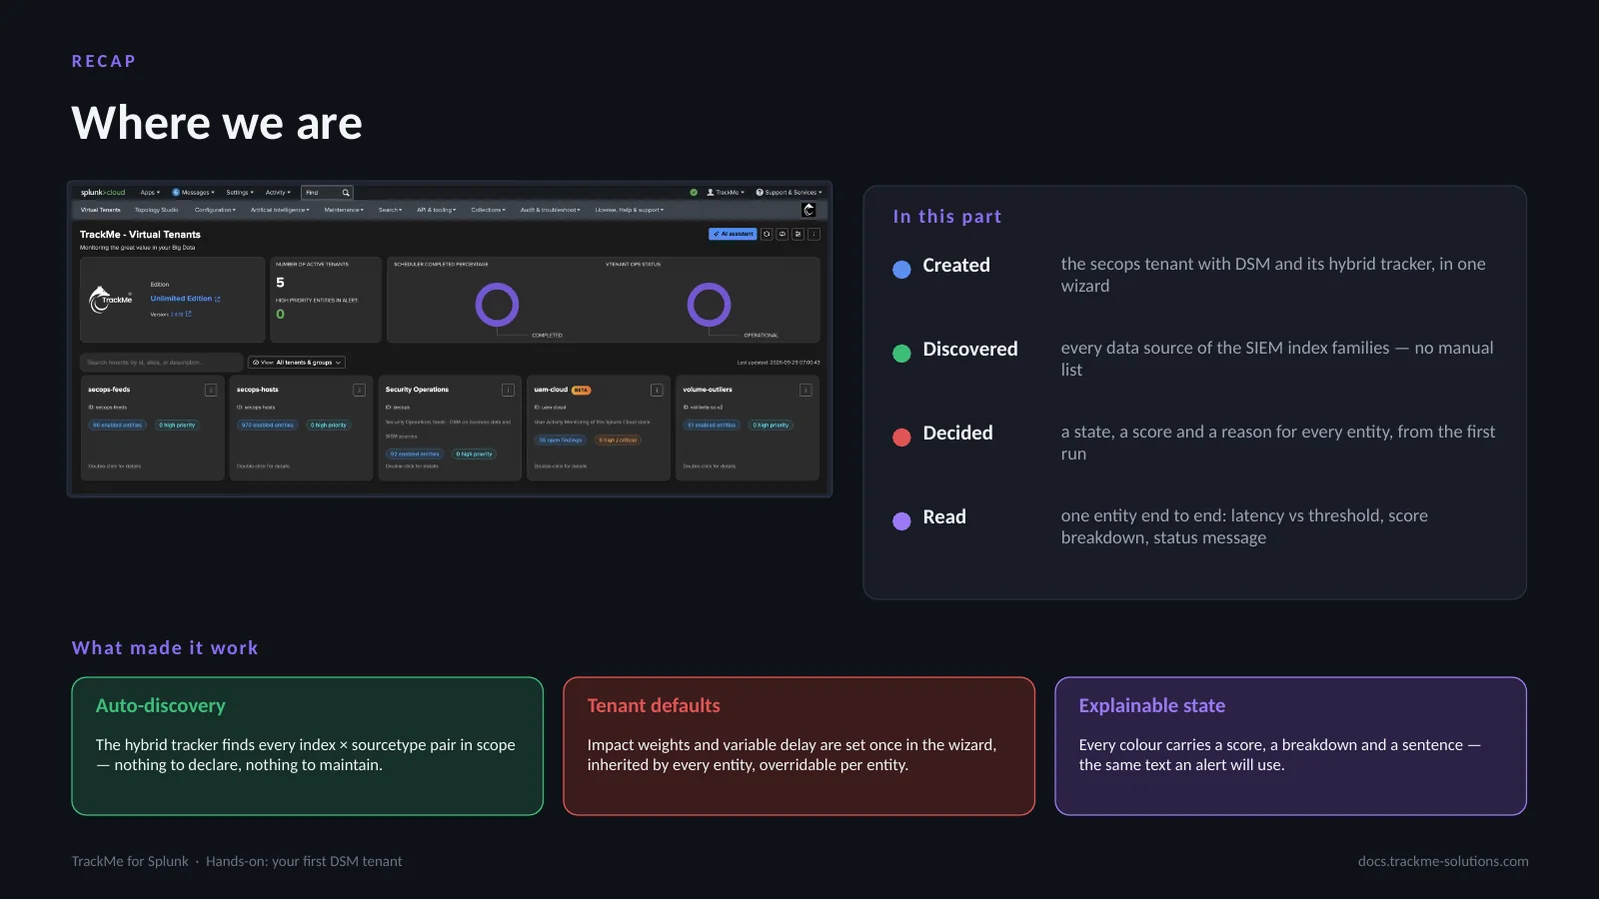
In this part the secops tenant was created with DSM and its hybrid tracker in one wizard, every data source of the SIEM index families was discovered without a manual list, and every entity received a state, a score and a reason from the first run.
Three things made it work. Auto-discovery: the hybrid tracker finds every index and sourcetype pair in scope, nothing to declare or maintain. Tenant defaults: impact weights and variable delay are set once in the wizard, inherited by every entity and overridable. Explainable state: every colour carries a score, a breakdown and a sentence, the same text an alert uses. Every entity is still medium priority; classification is what policies bring.