Volume Outliers — in depth
Tip
This is the in-depth reference for the Volume Outliers (splk-vol) component. For the readable overview of what VOL is and when to use it, start with VOL — Volume Outliers; for a guided, end-to-end walkthrough on a live deployment, read the Volume Outliers white paper. This page covers the collector, license days and time zones, the backfill, the outliers and inactivity policies, the projection, the Global license usage view and its configuration (scopes, working days, daily quotas, costs, chargeback), alerting, the REST endpoints, the metrics and troubleshooting.
The entity model
An entity is one Splunk index:
objectis the index name,object_categoryissplk-vol, and the entity’s group is its license pool (a single-pool deployment has one group; on Splunk Cloud, where a pool has no limit, the group isdefault).The state is green by default: collection never turns an index orange or red on its own. The state comes from ML outliers (a lower-bound breach is a drop, an upper-bound breach a spike) and from inactivity, through the same hybrid impact scoring as every component (Entity State & Scoring). The tenant impact keys are
impact_score_vol_outliersandimpact_score_vol_inactive(default 100: an inactive index turns red).Per index the analyst chooses the detection direction — Detect drops, Detect spikes, or both — with the inline Detect toggle of the VOL table, in bulk edit, or in the entity’s Volume & cost tab. The direction is stored on the index’s outliers model (
alert_lower_breached/alert_upper_breached); the tenant default isvol_default_direction(both).Everything generic applies: priority, tags, labels, SLA, logical groups, disruption queue, acknowledgments, notes, maintenance, monitoring time, enable / disable, deletion. An index deleted temporarily keeps its bucket history when it had licensed volume in its last 24 hours (it comes back with its true rolling volume); a permanent deletion drops it and the index is never collected again.
The collector
One report per tenant, trackme_vol_tracker_tenant_<tenant_id>, runs every 5 minutes
through the standard tracker executor (execution summary, licensing checks and the
scheduled-time anchor come with it). Each run:
Loads the checkpoint of the tenant — the
cursor(the end of the last finalized 5-minute bucket), the validated history start, the license manager’s UTC offset and the deployment type.Computes the window
[cursor, floor(now − settle)), aligned on 5-minute boundaries. The settle margin (vol_settle_seconds, default 300 s) leaves the license manager the time to write everyUsageevent of a bucket before the bucket is read (on a large deployment those events land within seconds; the margin covers the worst case). A run catches up at most 6 hours at a time; a gap above 24 hours re-seeds the history (see Validated history below).Runs one bounded search on the license usage log, local or on the tenant’s remote account:
search (index=_internal source="*/license_usage.log") type=Usage idx=* earliest=<cursor> latest=<end>
| bin _time span=300s
| stats sum(b) as b, latest(poolsz) as poolsz by _time, idx, pool
plus, once a day (and on every run around the license manager’s midnight), a cheap indexed probe on the
RolloverSummaryevent that returns the license manager’s UTC offset and the deployment type.Updates the ring of each index — the last 288 buckets (24 hours) kept in the tenant’s KV store: appends the new buckets (a bucket with no event is 0), recomputes the rolling sums at each bucket end, accumulates the current license day and closes any license day that ended.
Writes the metrics with explicit bucket timestamps, then advances the cursor — the cursor moves only once the metrics and the rings are persisted, so a run that dies mid-way is replayed, never skipped.
Emits one entity row per known index, carrying the latest rolling values, the daily figures (yesterday, month to date, 30-day average, trend, projection), the pool usage on Splunk Enterprise, the detection direction and the effective inactivity policy.
Note
Why a ring instead of querying the metrics index. The rolling volume must not depend on the metrics pipeline’s own indexing latency: a blocked queue would read as a drop and raise false lower-bound outliers. The rolling values are computed from the buckets TrackMe holds and then written as metrics.
Integrity rules
Validated history. Every ring and the tenant checkpoint carry the time from which the history is continuous. A rolling KPI is emitted only once its whole window lies inside the validated history, and a license day is reported only when it was observed from its start — the first run’s 24-hour seed writes the 5-minute volumes for every bucket, but the 24-hour trend only from the last seed bucket. No ramp-up or gap ever reaches the series the models train on.
Search errors fail the run. An error from the usage search — or a warning saying the results are incomplete (a peer down, a search process ended prematurely) — stops the run before anything is written; the cursor does not advance and the missing volume is never recorded as a drop.
One collecting run at a time. A lock protects the collection; an overlapping run (for instance run the tracker now during the schedule) rebuilds the entity rows from the stored rings without writing any metric point. A run that meets the lock of a tenant being seeded waits for it (up to 4 minutes) and then collects normally.
A new source re-seeds. Changing the target environment (
vol_account) or the license search constraint discards the rings and the checkpoint and re-seeds 24 hours from the new source, emitting only the points after the previous source’s cursor — a series never holds two points for the same bucket. The previous source’s indexes stop being updated, turn inactive and can be deleted.Fail-closed reads. The rings, the per-index directions and the permanently deleted indexes are read without a fallback: a failed read fails the run instead of resetting a direction or resurrecting a deleted index.
Squashed rows keep the index. When the license manager squashes
Usagerows (squash_threshold), it drops the host and source, neveridx— squashing never reads as a drop.
License days and time zones
Splunk measures the license on license days that roll at the license manager’s local midnight, whatever the time zone of your search heads or of your Splunk user. VOL follows the license manager:
The daily probe reads the license manager’s UTC offset from the
RolloverSummaryevent (its raw timestamp carries the offset, and its time is the true day boundary). On a deployment younger than a license day no rollover has been logged yet: the offset is then read from the raw timestamp of the latestUsageevent (every line of the license usage log carries it) and the Manage: volume collection screen says so. UTC is assumed only when there is no license event at all, and the open day is voided when the real offset turns out to differ.The probe runs on every run between 22:00 and 03:00 license-manager time, so a daylight-saving transition is caught within the run that follows it. The buckets between the old and the new day boundary move to the day they belong to, and a corrected closed day is re-emitted (a fall-back day lasts 25 hours, a spring-forward day 23 hours).
The
daily_volume_mbmetric of a license day is stamped in the middle of that day, so a chart binned by day places it on the right date whatever the viewer’s time zone.
The daily figures (yesterday, month to date, the trend and the projection) refer
to license days, and the Volume & cost tab says which license date “today” is for the
collector.
Backfill
At creation the tenant requests a backfill of its history (vol_backfill_days,
default 30) so the outliers models train as soon as it completes and the daily history, the
trend and the month projection are complete. The wizard offers No backfill, 7, 14, 30, 60
or 90 days, or Custom… for any whole number of days up to 400 — 13 calendar months,
the depth of the chargeback statements. It caps the depth to the retention of the license
usage log it can reach, shows the reachable span, and shows the estimated cost in metric
points before you confirm.
The backfill is a separate report,
trackme_vol_backfill_tracker_tenant_<tenant_id>, scheduled hourly while a plan is open and un-scheduled once complete. It walks forward in time (every rolling value needs the 24 hours before it) in day-sized chunks, each chunk replaying exactly the live collection with historical timestamps, and runs for at most 50 minutes per slot.The backfilled range ends where the live collection started: the live tracker and the backfill never overlap and no point is written twice. The first backfilled day is aligned on a license-day start, so it is complete; every complete license day of the range emits its
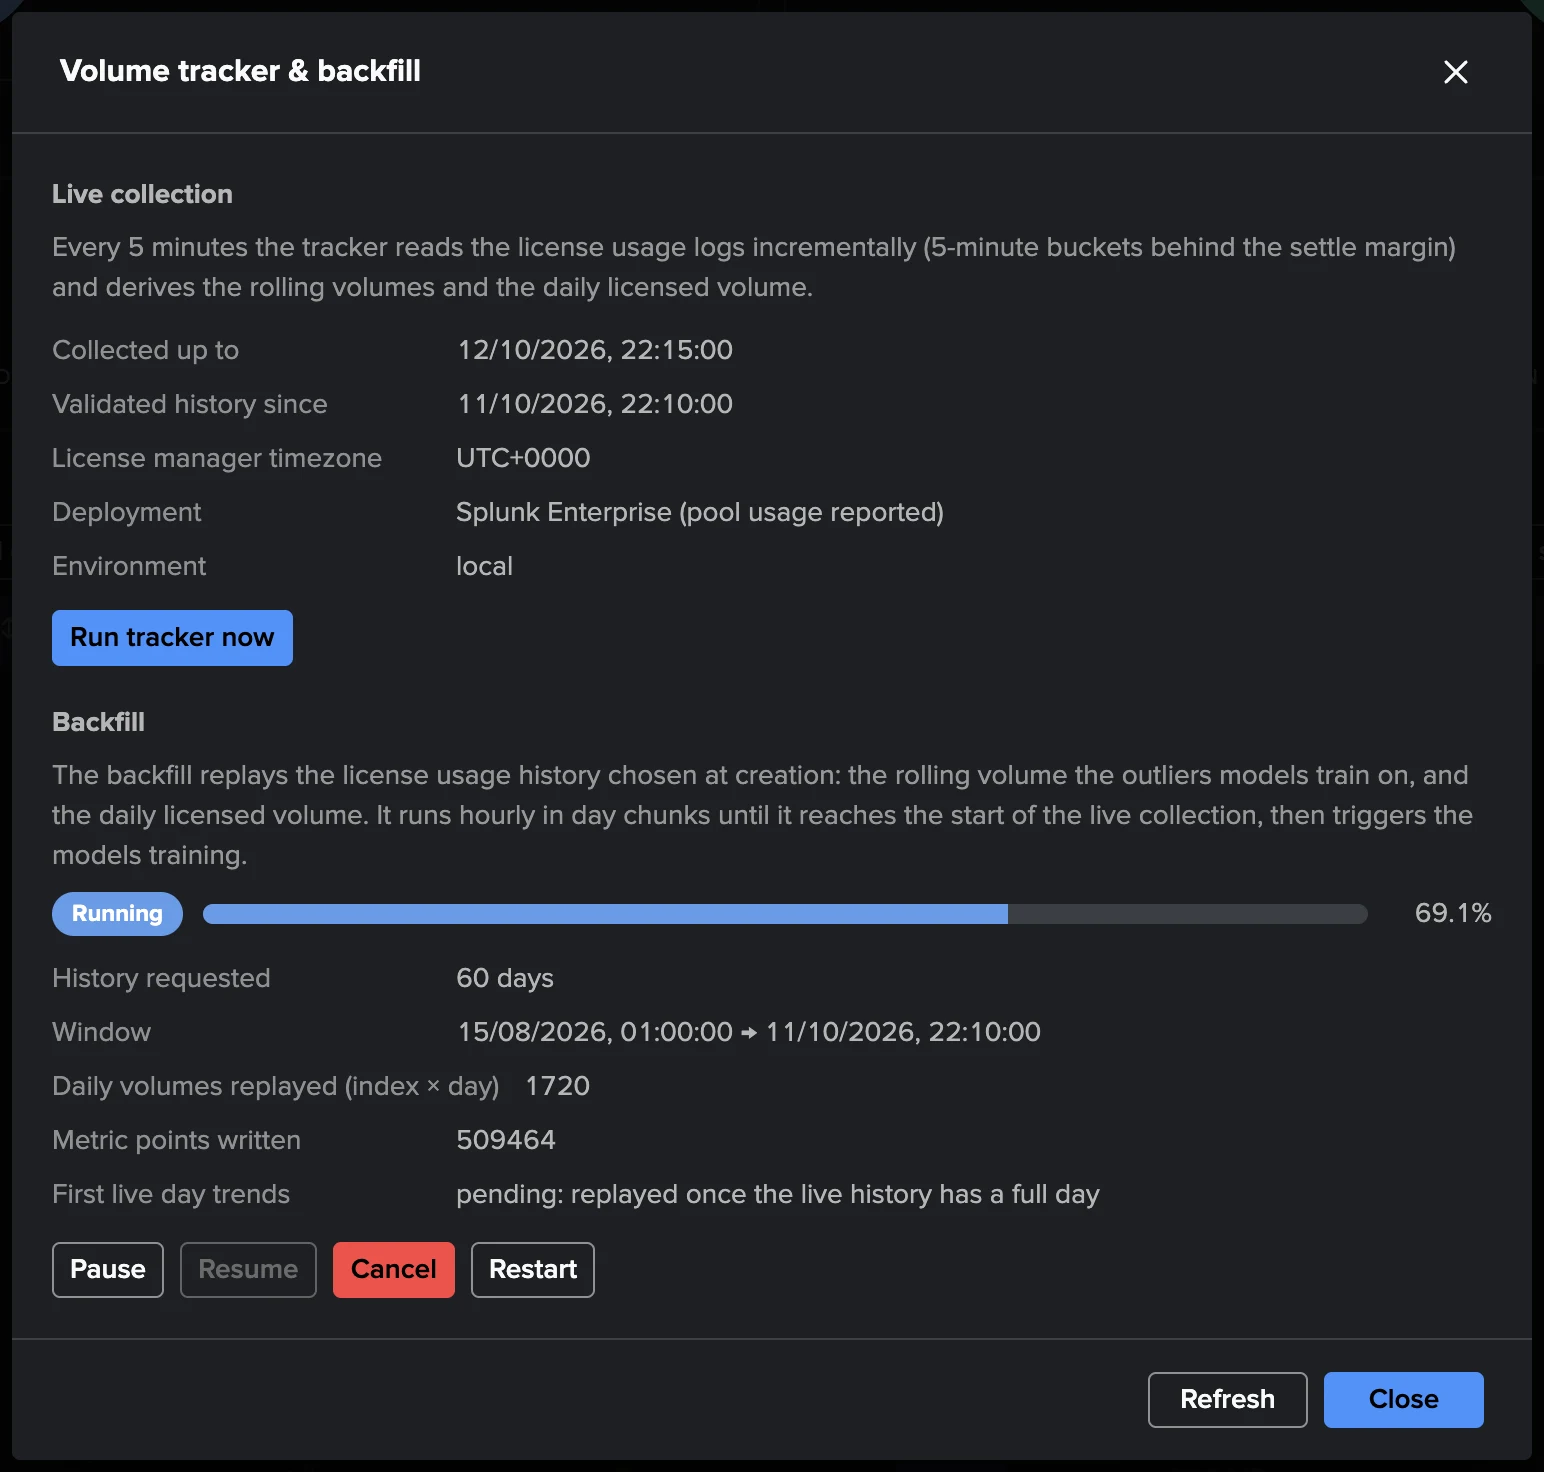
daily_volume_mb.The live collection emits a rolling value only once its whole window lies in its own history, so the first live day has no 24-hour value (and no 12-hour, 4-hour or 60-minute one for its first hours). About 24 hours after the live start, the hourly backfill job replays that day and writes the missing rolling values; until then the Manage: volume collection screen reads First live day trends: pending and the rolling chart shows a gap at the seam.
Daylight-saving transitions inside the range are replayed with the offset in effect at the time, from the
RolloverSummaryhistory.On completion the backfilled days are merged into each index’s live history (the entity figures reflect them at once), the seam day around the live start is completed, and a training of every VOL model is requested, so outliers are usable without waiting for the next training cycle.
Progress is visible in three places — the tenant card on the Virtual Tenants page
(Backfilling 42 %), the vignette in the Tenant Home header band, and the Manage: volume
collection screen (live cursor, validated history, license-manager offset, deployment type,
the backfill progress with pause / resume / cancel / restart, and run the tracker now).
From the creation until the backfill job’s first hourly run, the three read Backfill
pending with the requested depth and the job’s next run.

Note
A restart re-plans only the history before the earliest point already written: it extends the history backward and never rewrites it. A change of the target environment or of the license search constraint while a plan is open cancels the plan (the new source is re-seeded first); restart it once the live collection runs on the new source.
The license search constraint (advanced)
Every license search of the tracker, the backfill and the probes is formed from one
tenant-level constraint, vol_license_search. Its default targets the license usage log
of the deployment the tenant collects from:
index=_internal source="*/license_usage.log"
You normally never change it. The Advanced section of the wizard’s Volume step (and the
Configure tenant form afterwards) lets you point the tenant at another data set holding
events in the license_usage.log format — for instance a copy of the license usage events
forwarded to a dedicated index, or a deployment where _internal is not reachable under
that name. The constraint is a plain base search on indexed fields:
no pipe, subsearch (square brackets), macro (backtick), line break,
earliestorlatest— the tracker sets the time range;it must name an index as a real search term (
index=inside a quoted value does not count), and not every index: a bare wildcard (index=*) is refused,index=lic*is fine;every
ORalternative must be index-scoped (index=a OR index=bis fine,index=a OR source=xis refused) and parentheses must balance.
The wizard validates the constraint as you type, and it is validated again at every save.
Important
The data behind a custom constraint must have the license_usage.log key=value fields
extracted at search time — type, idx, b, pool, poolsz — since the
tracker filters on type=Usage idx=* and sums b. The real license_usage.log in
_internal (sourcetype=splunkd) is extracted out of the box; a copy stored under a
sourcetype with KV_MODE = none (stash, for instance) needs a props.conf
stanza with KV_MODE = auto for its source, or the tracker reads no usage row at all.
Changing the constraint on a running tenant re-seeds the collection from the new source (see Integrity rules above) and cancels an open backfill plan.
Outliers
VOL rides TrackMe’s native outliers engine (Machine Learning, Outlier detection — in depth) with component-specific defaults:
Every new index gets one model per default KPI —
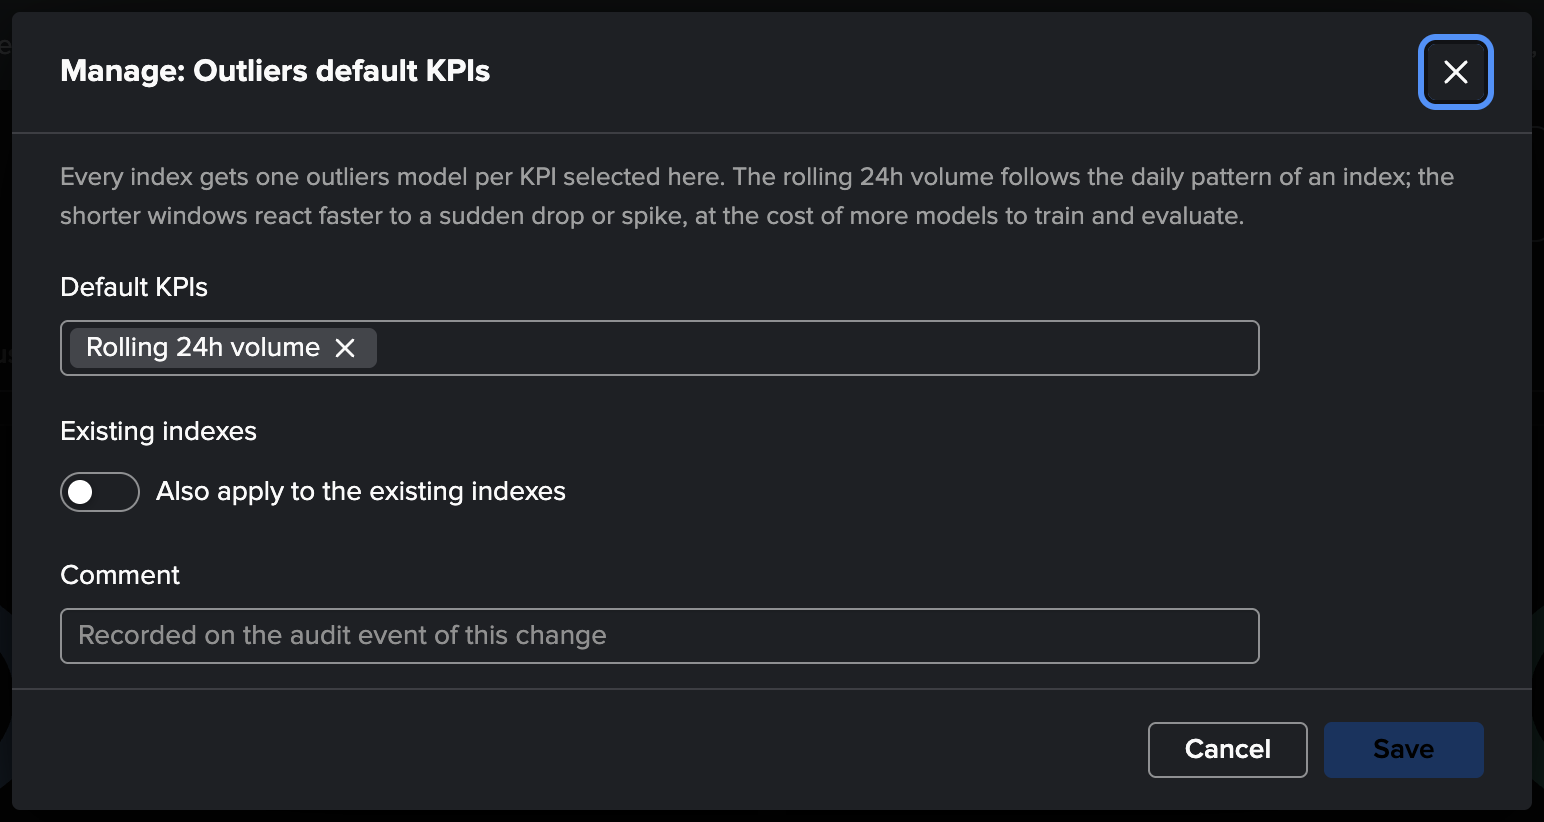
vol_outliers_kpis, defaultlast_24h_volume_mb, any subset of the four rolling KPIs. The rolling 24-hour volume follows the daily pattern and is the proven choice; the shorter windows (12 h, 4 h, 60 min) react faster to a sudden drop or spike and are noisier. One model per index is the deliberate default: several models per index multiply the noise. The models use the day-of-week × hour-of-day time factor over a 90-day calculation period.The default KPIs are set in the wizard and changed later in Tenant Home (Manage: Outliers default KPIs), with an opt-in apply to the existing indexes that adds the models of newly selected KPIs and removes the models of deselected rolling KPIs — models of kept KPIs and of non-rolling metrics are untouched. A model can also be added on, or switched to, any of the four KPIs from the entity’s Outliers tab.
Direction — a drop is a lower-bound breach, a spike an upper-bound breach; the per-index detection direction enables one or both bounds on the model.
Scope — VOL has its own scope:
vol_mloutliers_priority_filter(default: every priority — volume outliers are the point of the component) andvol_mloutliers_filter_expression(the TrackMe filter DSL onobject,priority,tags,labelsandpool). The tenant-widemloutliers_priority_filterandmloutliers_filter_expressiondo not apply to VOL entities. The Manage: ML Outliers scope modal edits the VOL pair on a VOL tenant, and the table’s Outliers column shows out of scope with the reason for an excluded index.Minimum history — the wizard exposes the tenant override of
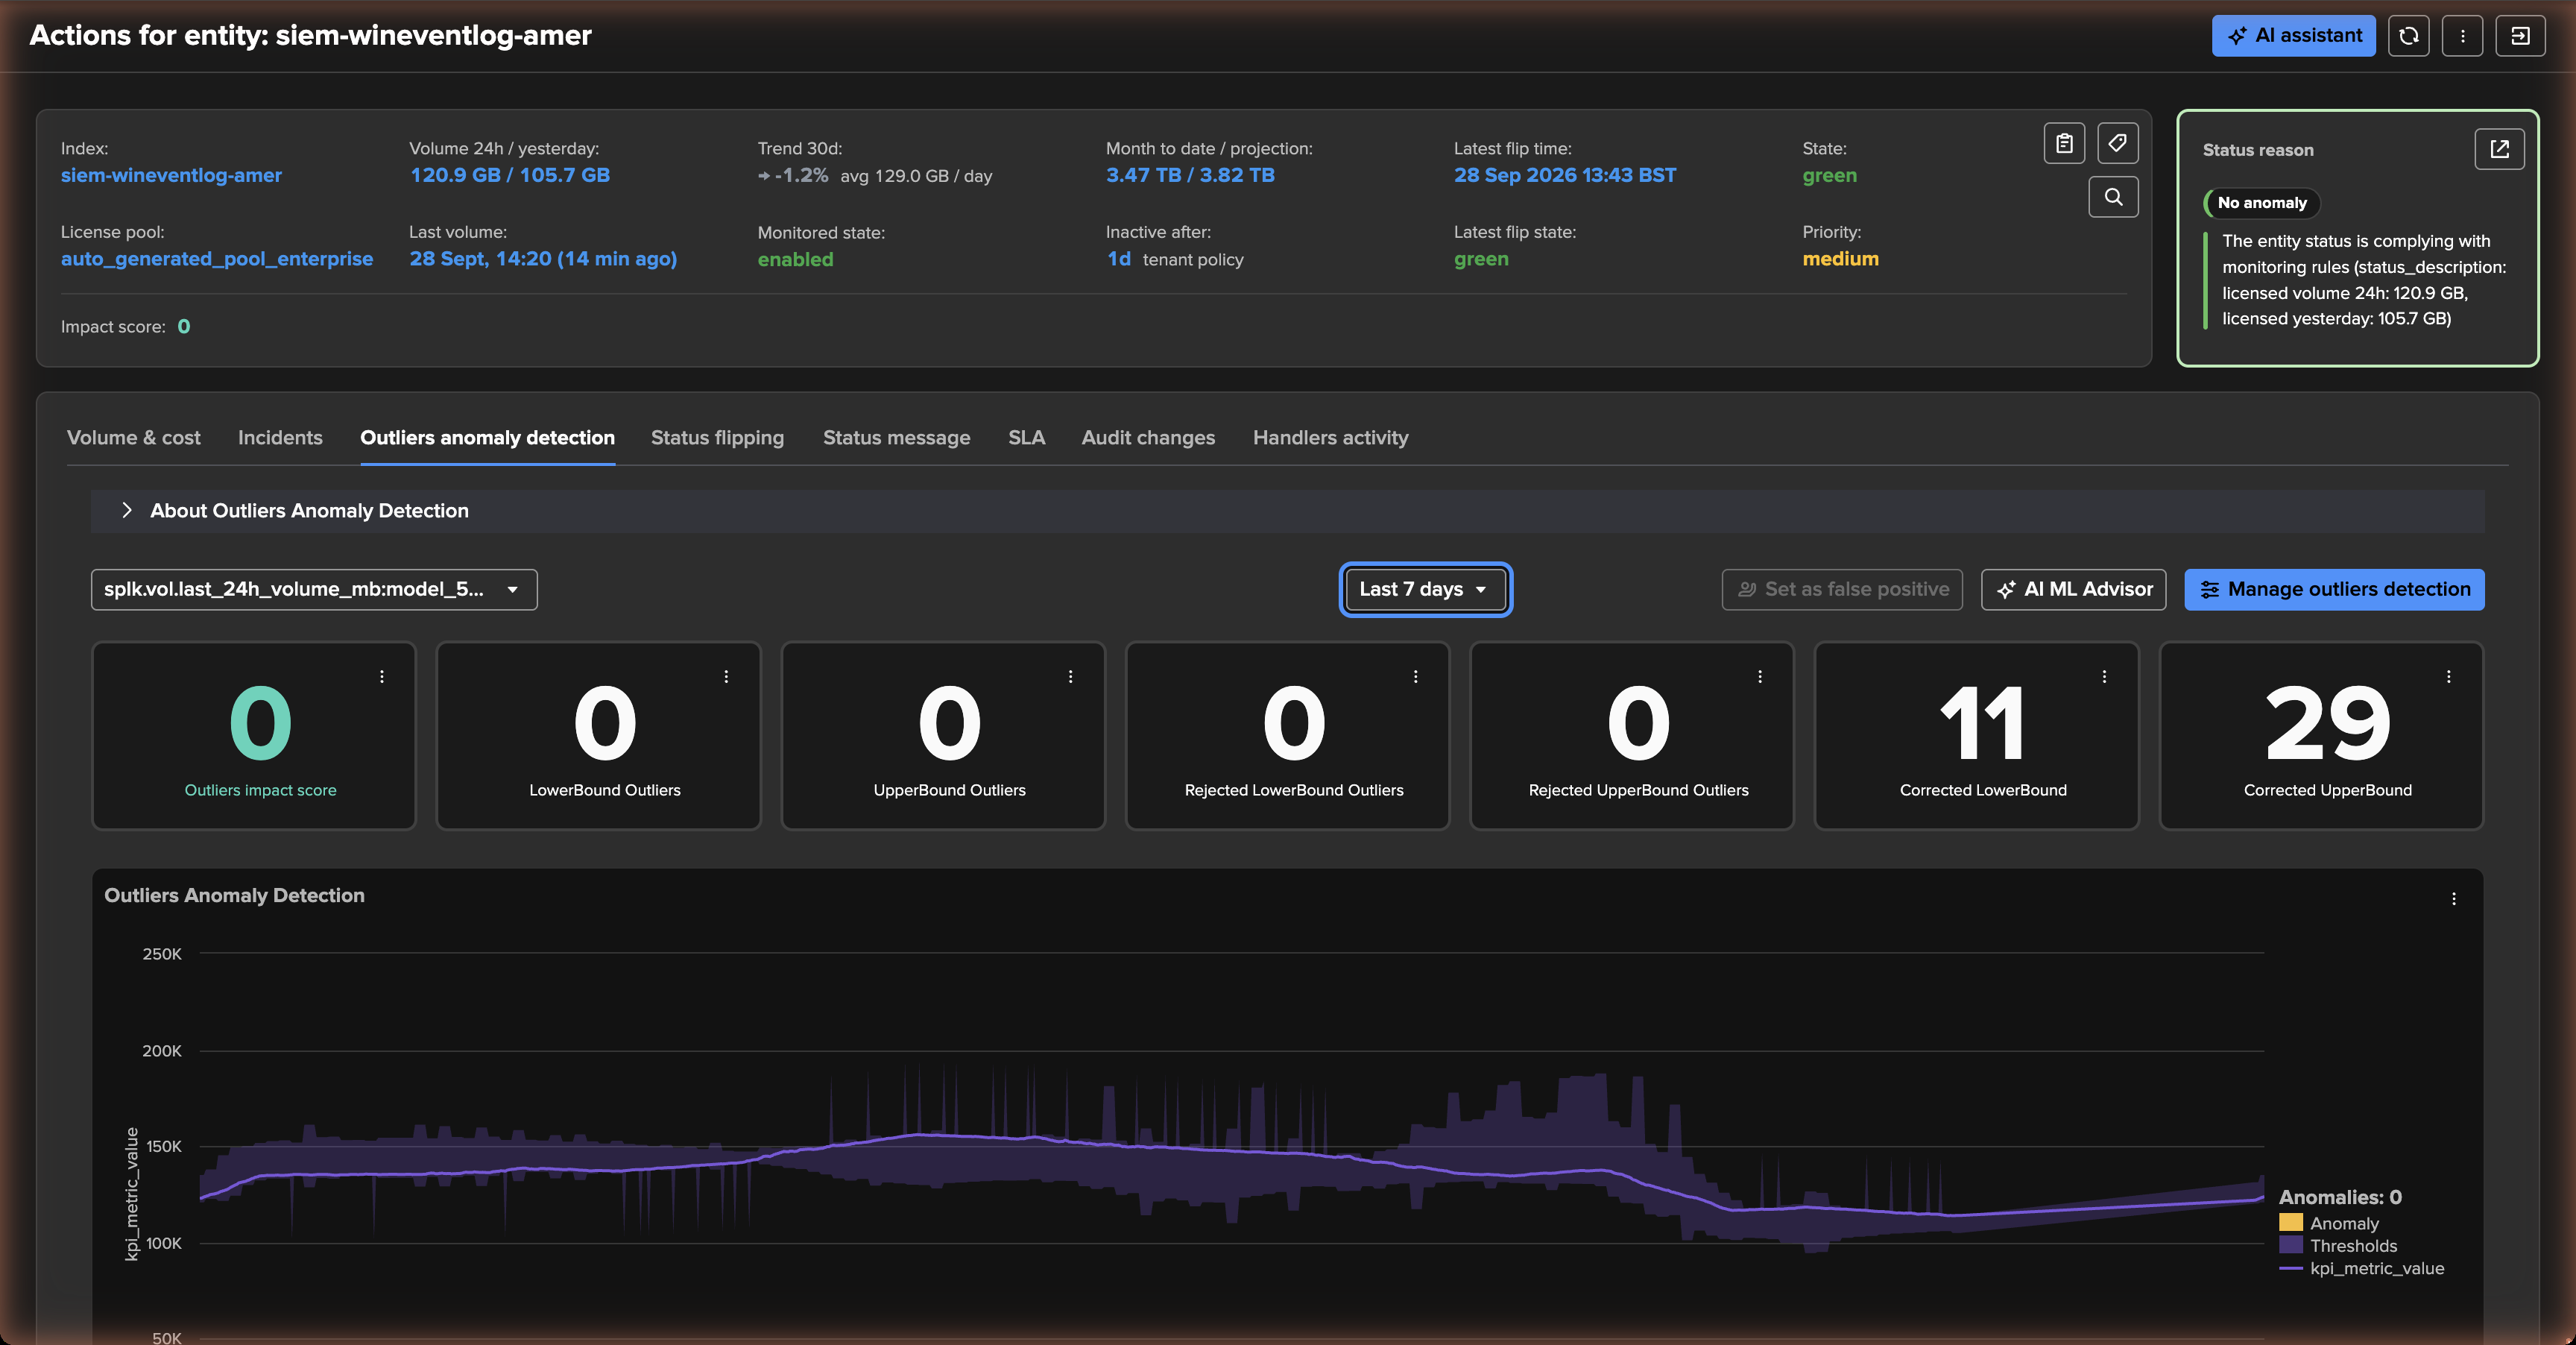
splk_outliers_min_days_history(15 days on a VOL tenant by default, against a system default of 30) and tells you whether the requested backfill covers it: with 30 days of backfill, the models reach normal confidence once the replay completes.Reading a model — the entity’s Volume & cost tab draws one outliers chart per enabled model, each with its own History slider, from 24 hours (the default) to 90 days. The chart reloads once, when you release or leave the slider, and its subtitle gives the number of anomaly windows over that range with their points (for instance 5 anomaly windows (36 points): consecutive anomalous points form one window, as the chart’s legend counts them) and the model’s confidence.
ML is always on for VOL. A tenant where ML is off for the other components because it only runs DHM / MHM keeps ML on for VOL alone (
mloutliers_allowlist=vol).The AI ML Advisor — interactive and its automated batch — covers VOL models like any other (AI ML Advisor).
Note
A one-off spike right after a short backfill. The models use the day-of-week × hour time factor over a 90-day period. Trained on a short history, a model learns a single spike as a weekly pattern: its bounds widen on that weekday and hour until the day ages out of the calculation period. To remove it sooner, add a period exclusion on the entity’s Outliers tab and retrain, or let the AI ML Advisor in act mode do it.

Inactivity policy
An index whose last licensed volume is older than the threshold in force turns red
(anomaly_reason=inactive, impact_score_vol_inactive). Two policy shapes exist:
static — one threshold (
vol_max_sec_inactive, default 7 days);variable — slots by day of week and hour of day, the DSM / DHM variable-delay model:
{slot_name, days (0 = Monday .. 6), hours (0-23), max_sec_inactive}; the first matching slot applies, the default (vol_inactive_default) outside every slot.
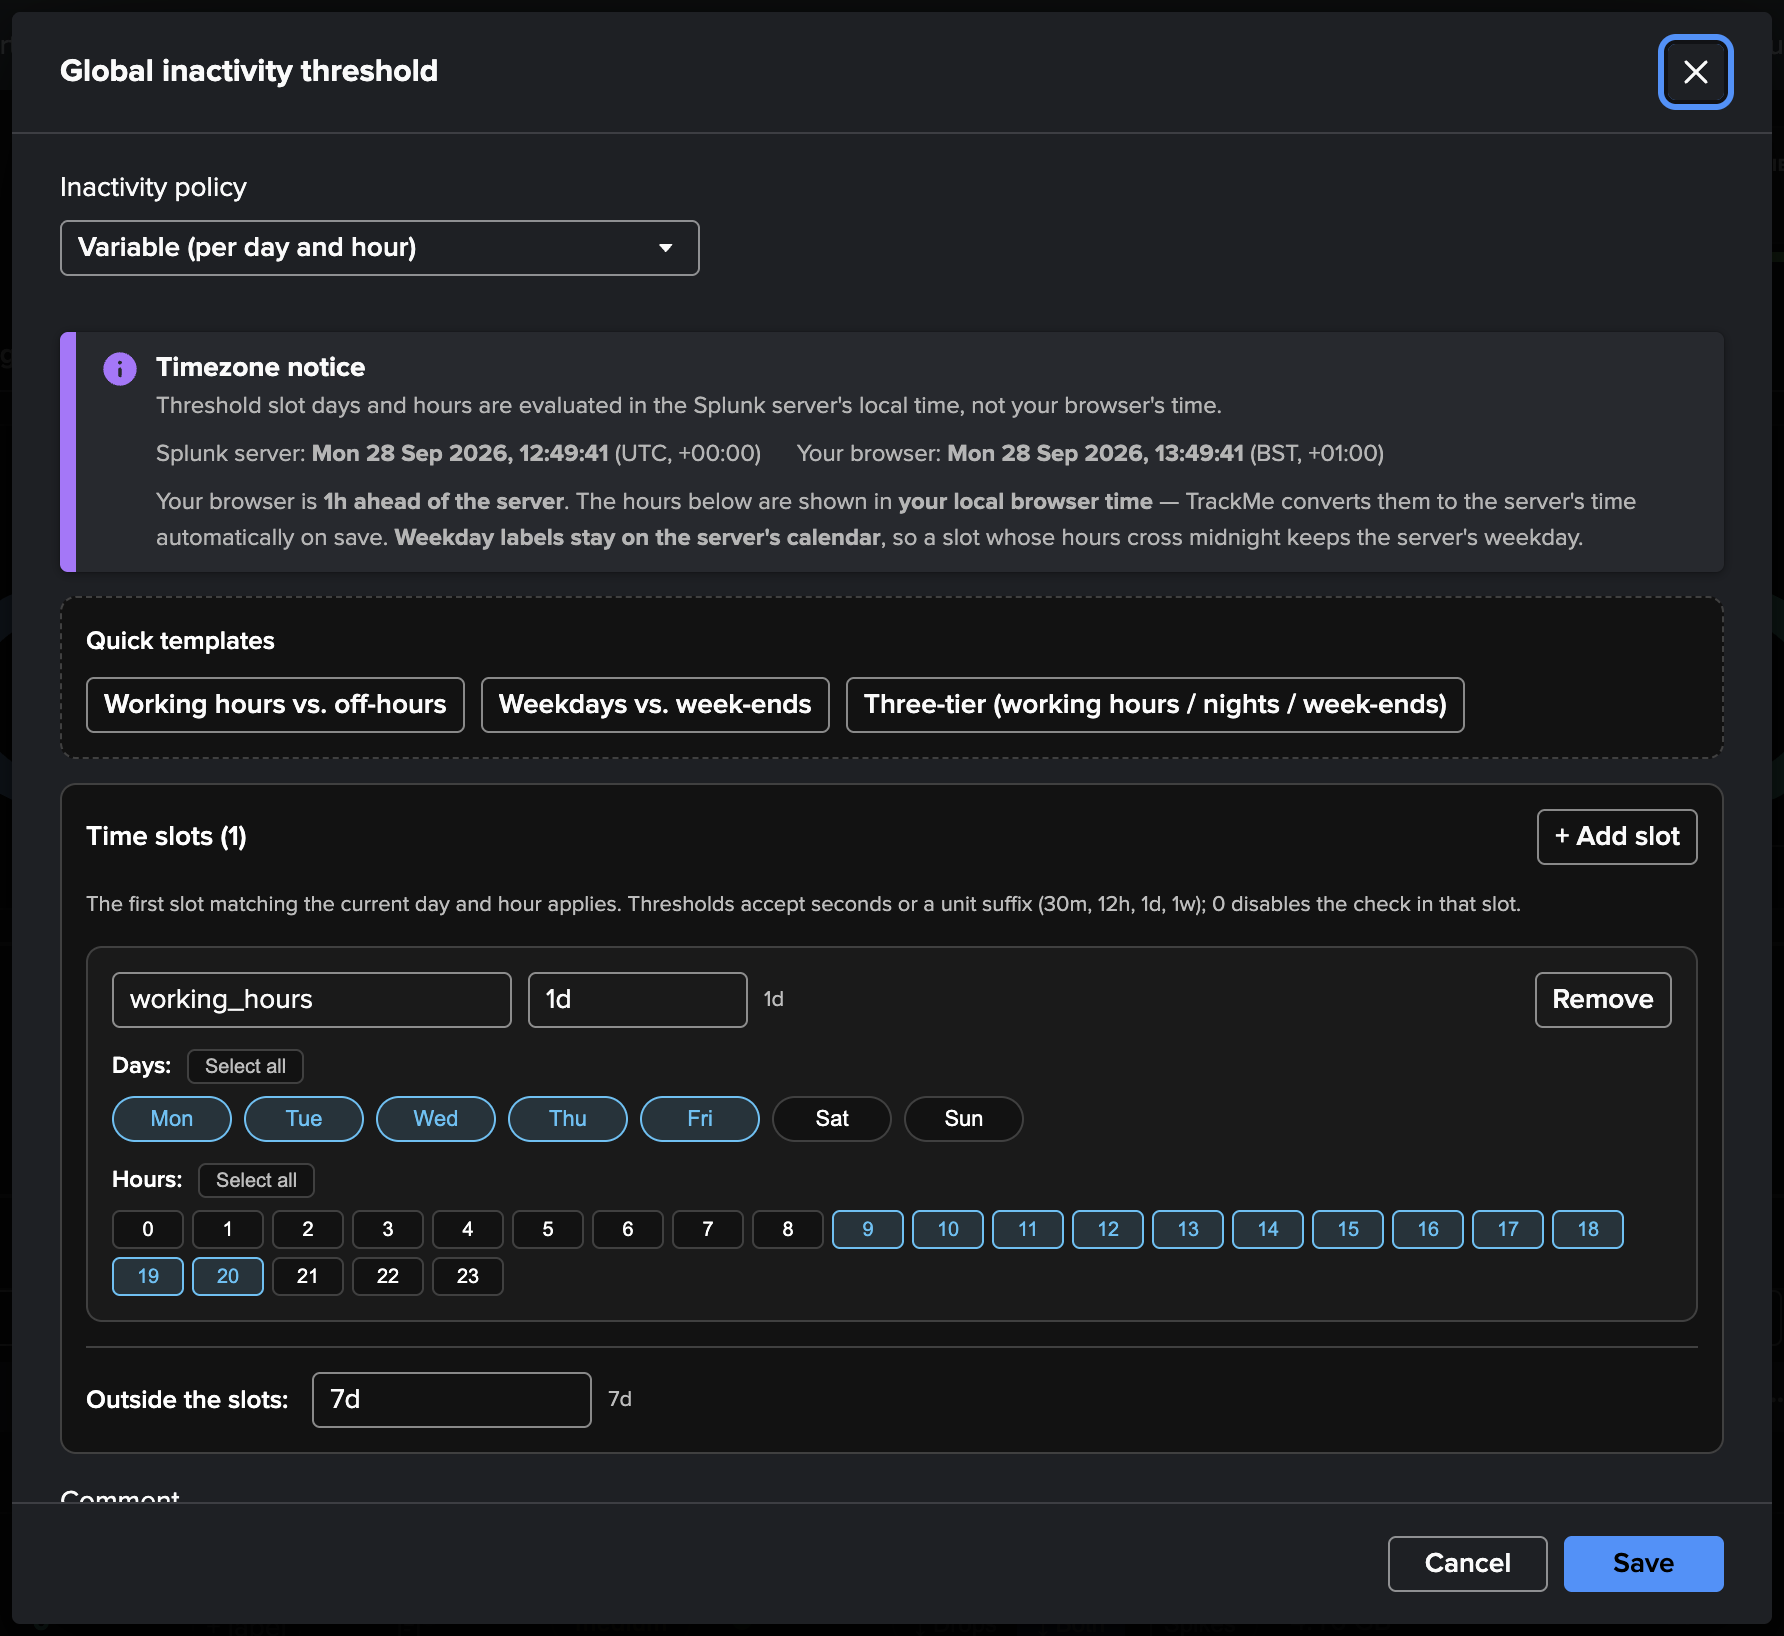
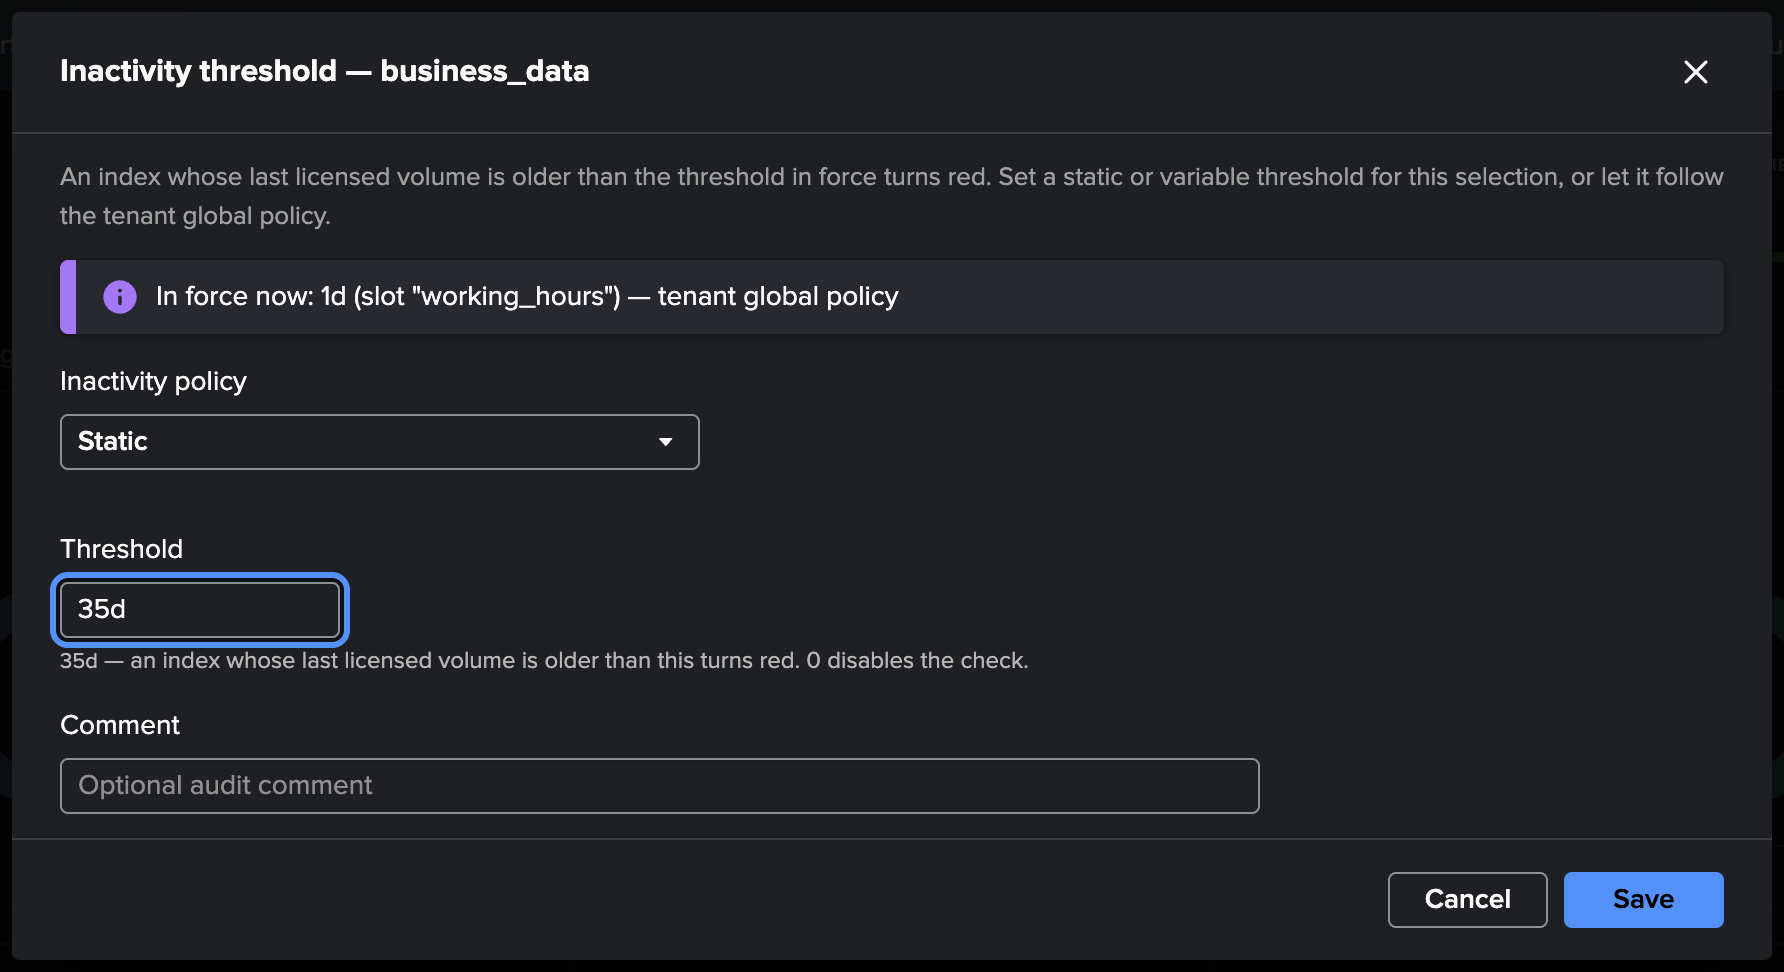
The tenant policy (vol_inactive_policy, variable by default: 1 day during working
hours, Monday to Friday 08:00–19:59, and 7 days for nights and week-ends) applies live to
every index without its own override. A per-index override — static or variable — is set
from the entity menu (Modify → Inactivity threshold), from the bulk edit category
Inactivity Threshold, or by clicking the Inactivity column, and can be sent back to the
tenant policy. A threshold of 0 disables the check (the whole static policy, or one slot);
otherwise it runs from 300 seconds to 90 days. Durations accept seconds, a unit suffix
(30m, 12h, 1d, 1w) or [D+]HH:MM:SS.
Note
The slot clock is splunkd’s system time zone — the frame the editor’s hour grid is drawn in (the editor shows the server time and converts your browser hours). It is not the time zone of the user running the tracker or viewing the page, so the scheduled tracker, a Tenant Home refresh and an inactivity save all pick the same slot.
The red status message names the slot in force (and says set for this index when an override applies); the table’s compact Inactivity column shows the threshold in force, with the slot and the source in its tooltip.
Trend and projection
The collector computes, per index and on every run, from the closed license days it holds:
yesterday_volume_mb,mtd_volume_mb(month to date),avg_daily_30d_mb;trend_30d_pct— a robust (Theil–Sen) slope over the last 30 closed days (the median of the slopes between every pair of days), as a percentage of their median, never below −100 % (a volume cannot fall by more than all of it), from 7 days of history;projected_month_mb— the month to date plus, for each remaining day, its expected rate: the median of the same weekday over the last 28 license days once two samples exist, else the mean of the last 7 days. The open day counts for the larger of its volume so far and its expected rate. No projection before 7 closed license days: a day or two of history gives no sensible monthly estimate. A day missing inside the index’s history (a collector outage past the catch-up) is estimated at its rate; the days before the index’s first recorded day are not.
Both figures use medians on purpose: a single outlier day cannot dominate them. A one-off spike or outage inside the 28 days is not repeated on every remaining same weekday of the month, and does not turn a flat index into a steep trend. With only two samples of a weekday, the median is their mean.
The Volume & cost tab draws the daily licensed volume of the last 60 days with the per-day
projection to the end of this month or of next month (a switch remembered per
viewer), scaled to the collector’s figure so the chart and the card agree; Open in search
carries the same rule in SPL. There is deliberately no predict: a weekday-weighted rate is
what the license bill follows.
Global license usage (VOL)
A Tenant Home tab next to the VOL component tab: the license consumption of the whole
environment, with an opt-in configuration layer (named scopes, working days, daily quotas,
costs and chargeback). It reads what the tenant already keeps (one daily point per index and
closed license day, and the entity figures), so there is no monitoring, no alerting and no
search on the license usage log: a few mstats searches, the same for a remote
deployment. It is as deep as the tenant’s history, live collection plus backfill.
Principles
Closed license days only, in the license manager’s time zone. Today, the open day, is never in a chart; the month figures (month to date, month projection) come from the entities.
One value per index and license day, placed in the middle of the day, so any viewer within 12 hours of the license manager sees it on its own date.
Period: 30 (default), 60 or 90 closed license days. A banner says when a backfill is still filling the history in, or where the history starts when it is shorter than the period.
Every chart draws its volumes in one unit — MB, GB or TB — picked from its largest value (GB from 1024 MB, TB from 1024 GB); tables and tiles follow the same rule.
Sub-tabs and deep links
Two rows of sub-tabs: the views on the first — Overview, Scopes, Working days & holidays, Over quota, Chargeback, Configuration — and, under Scopes only, one tab per enabled scope on a second row. Each view has a deep link:
TenantHome?tenant_id=<tenant>&component=vol&tab=license_usage&view=<view>
where <view> is overview (the default), scopes, scope-<scope id>,
working-days, over-quota, chargeback or configuration. A link to a scope that
no longer exists, or is disabled, opens the overview.
Overview
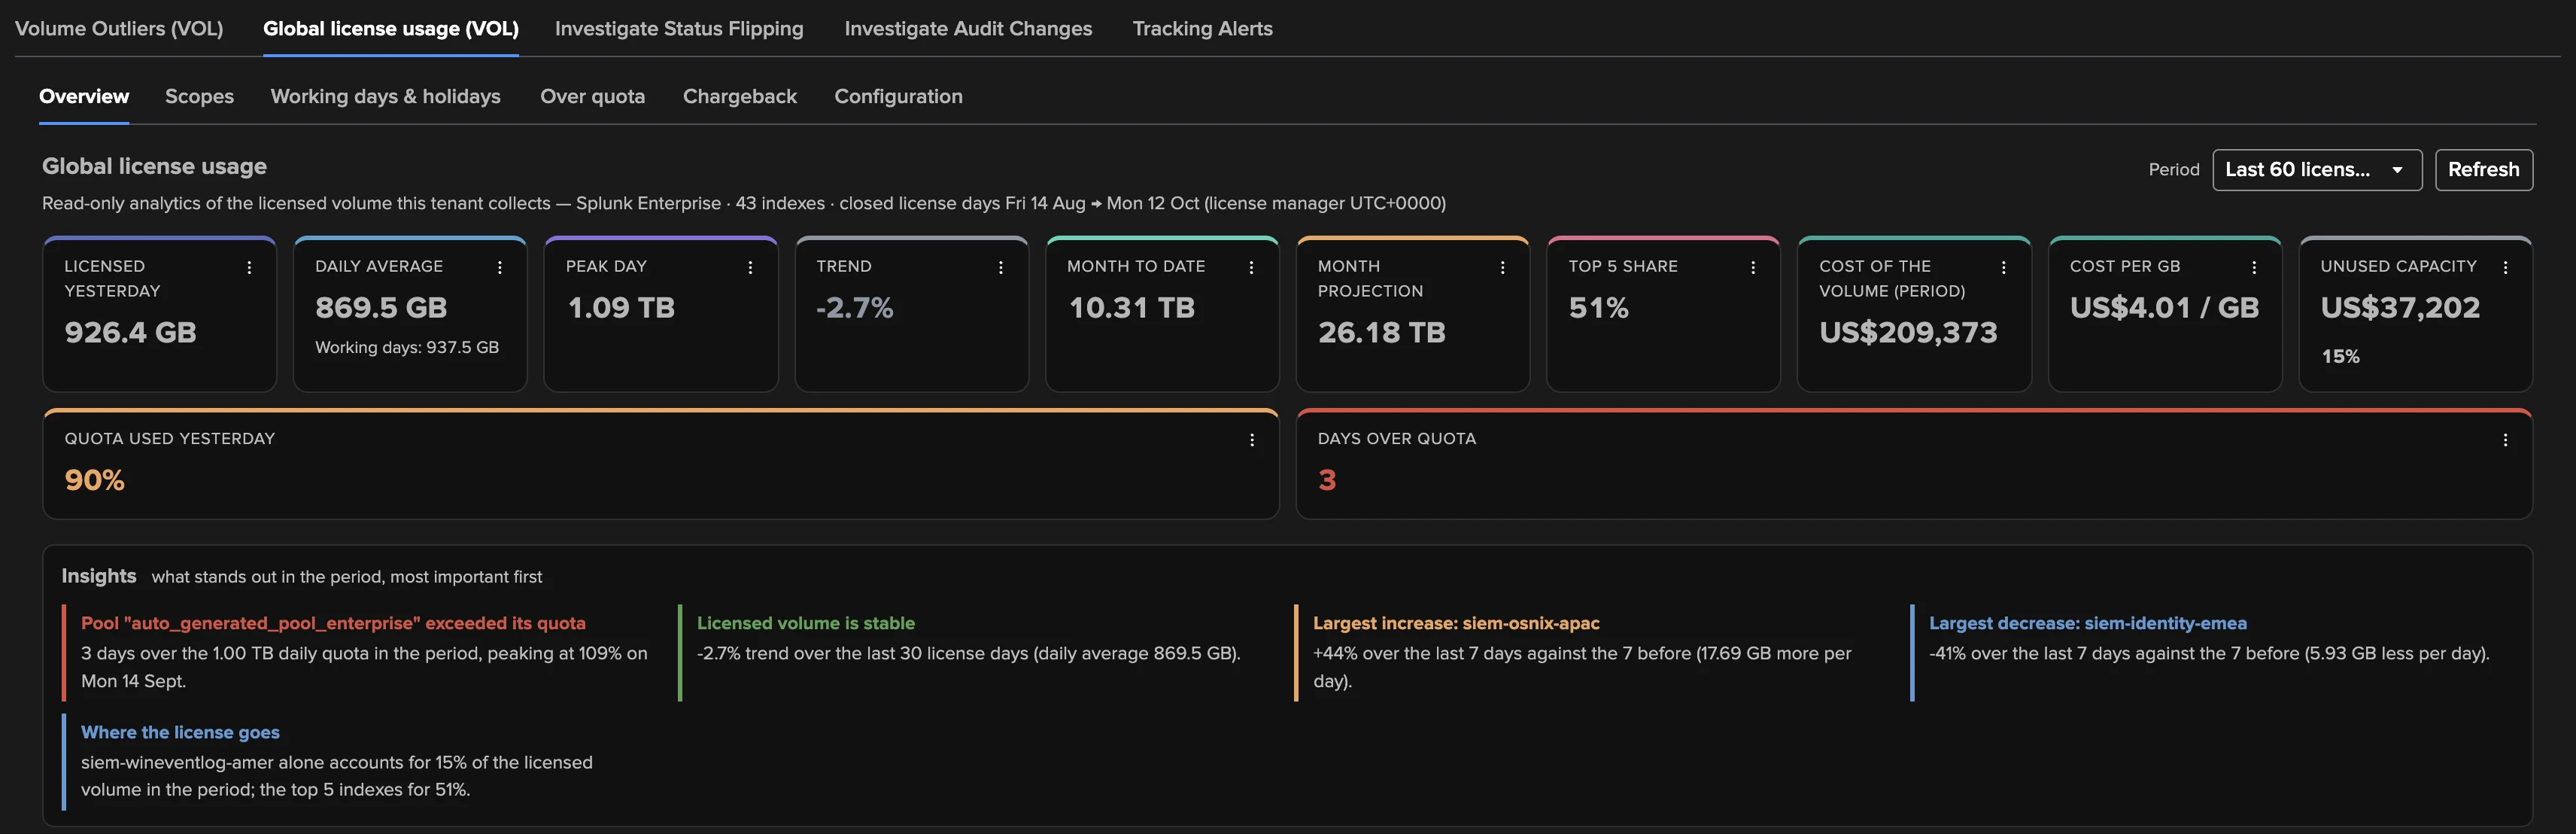
Key figures — Licensed yesterday, Daily average (with the working-day average once working days are classified), Peak day, Trend (the 30-day rule of the entities, over the environment), Month to date, Month projection (the sum of the per-index projections, with the number of indexes that have one), Top 5 share. With costs on: the Licence cost or the Cost of the volume of the period (see How costs are computed), the Cost per GB, and the Unused capacity (or Over the licence). With a quota in force: the Quota used yesterday and the Days over quota of the period.
Insights in plain words, most important first: days over quota and pools close to it, the trend, the largest increase and decrease, indexes that stopped consuming, new consumers, the concentration, the weekly pattern and the licensing model.
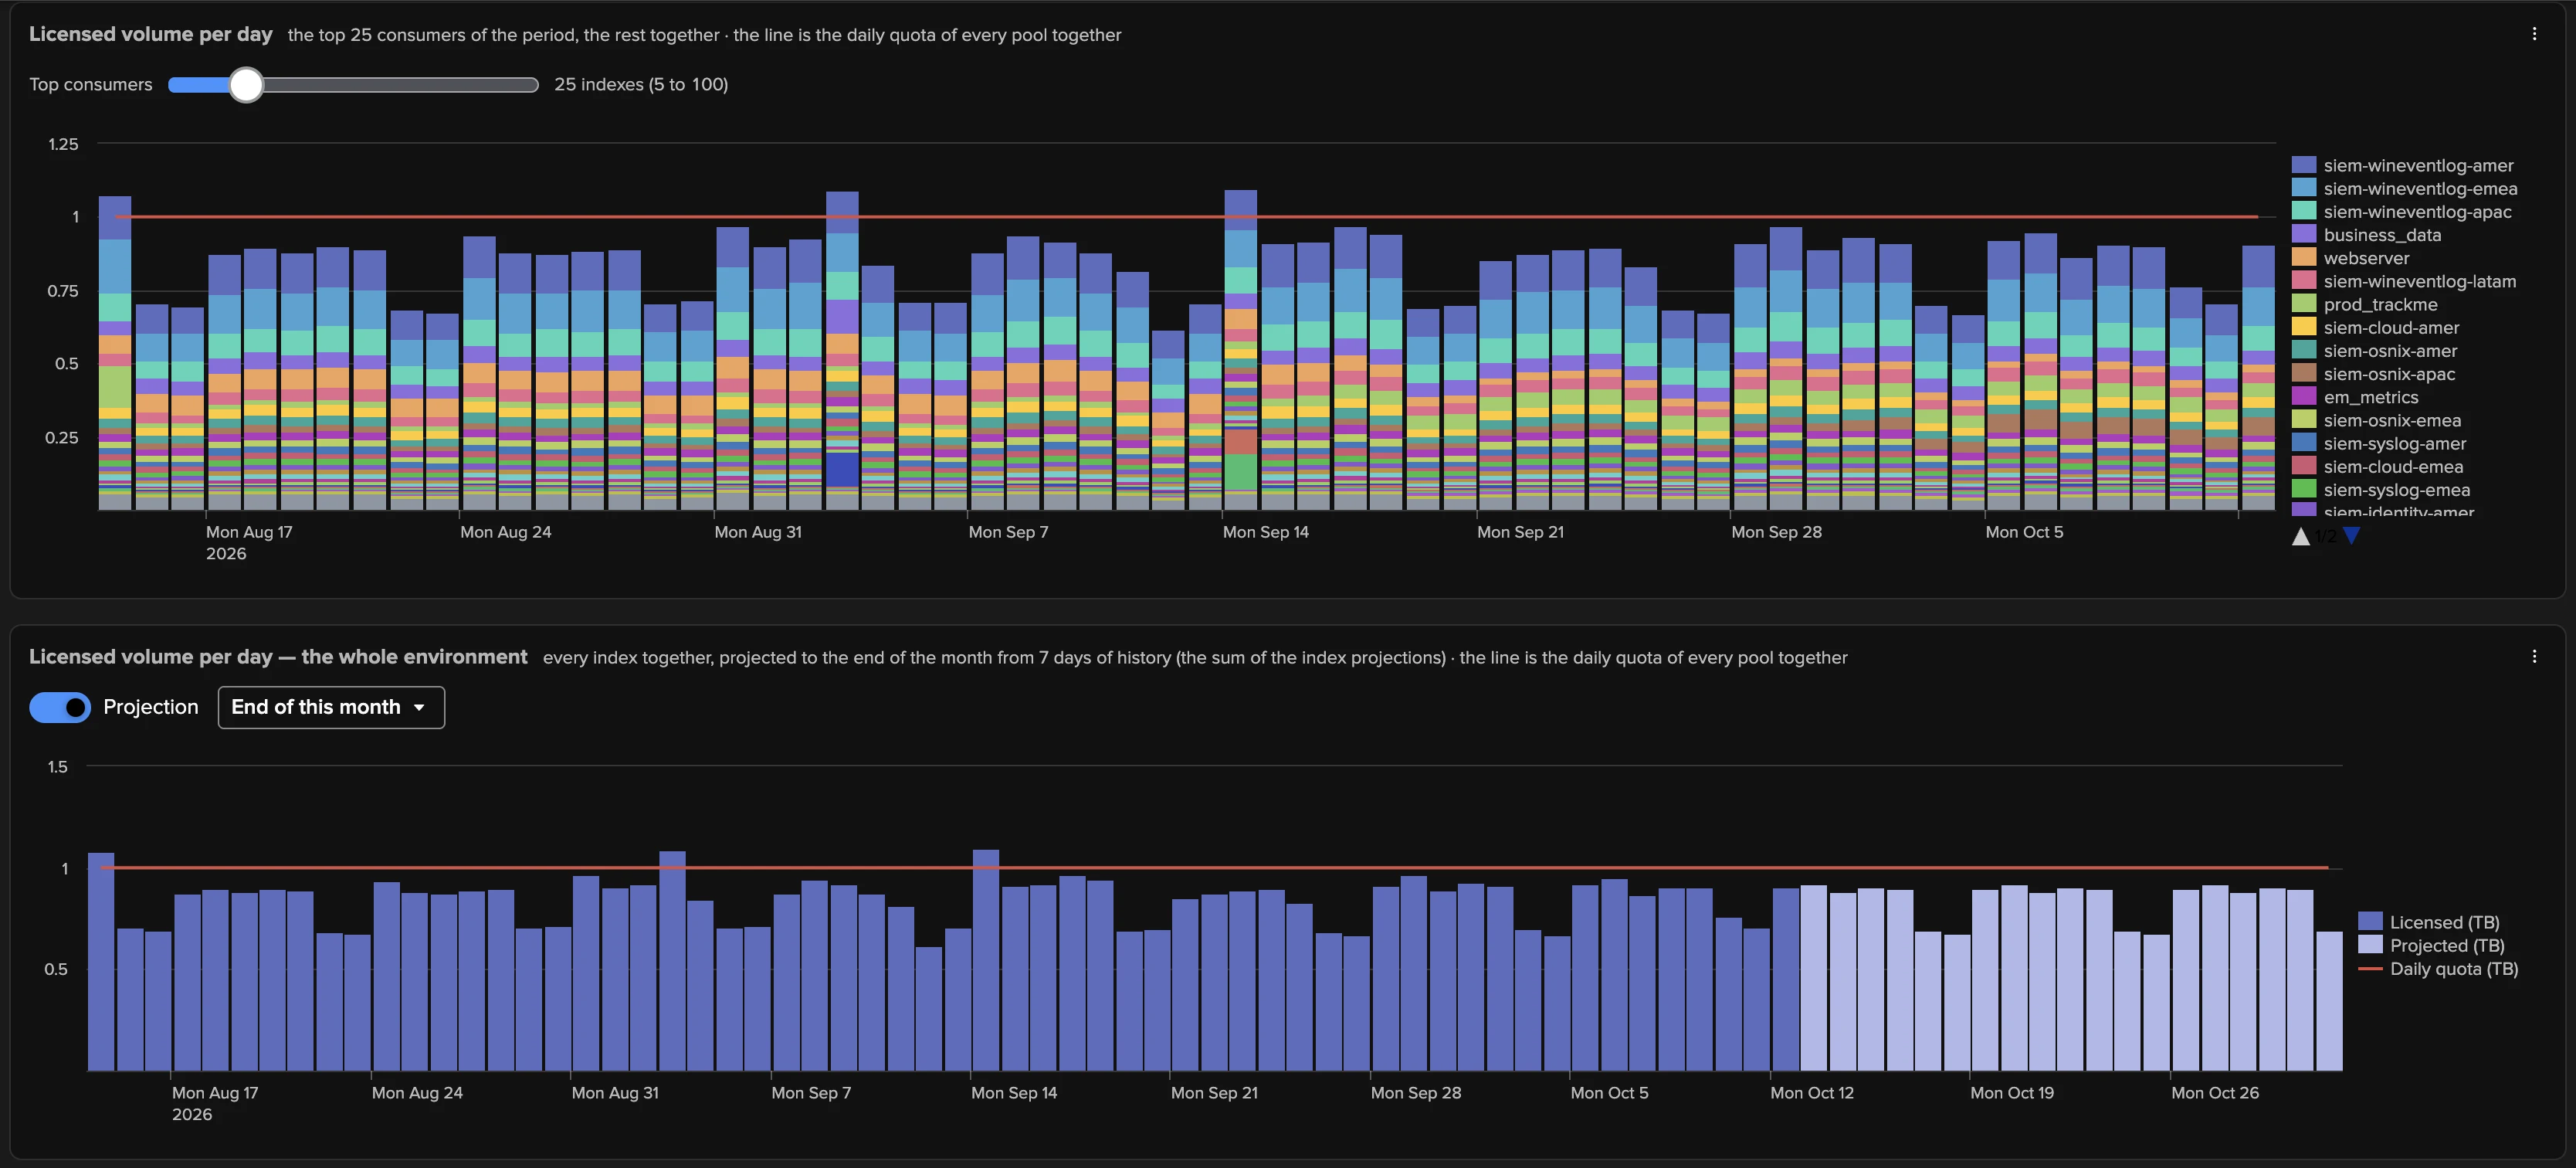
Licensed volume per day — stacked by top consumers, with a Top consumers slider from 5 to 100 (remembered per viewer; the rest is All others) and the daily quota as an overlay line when a quota is in force.
The whole environment per day — the daily total with the projection to the end of this month or of next month, the same rule as the entity chart.
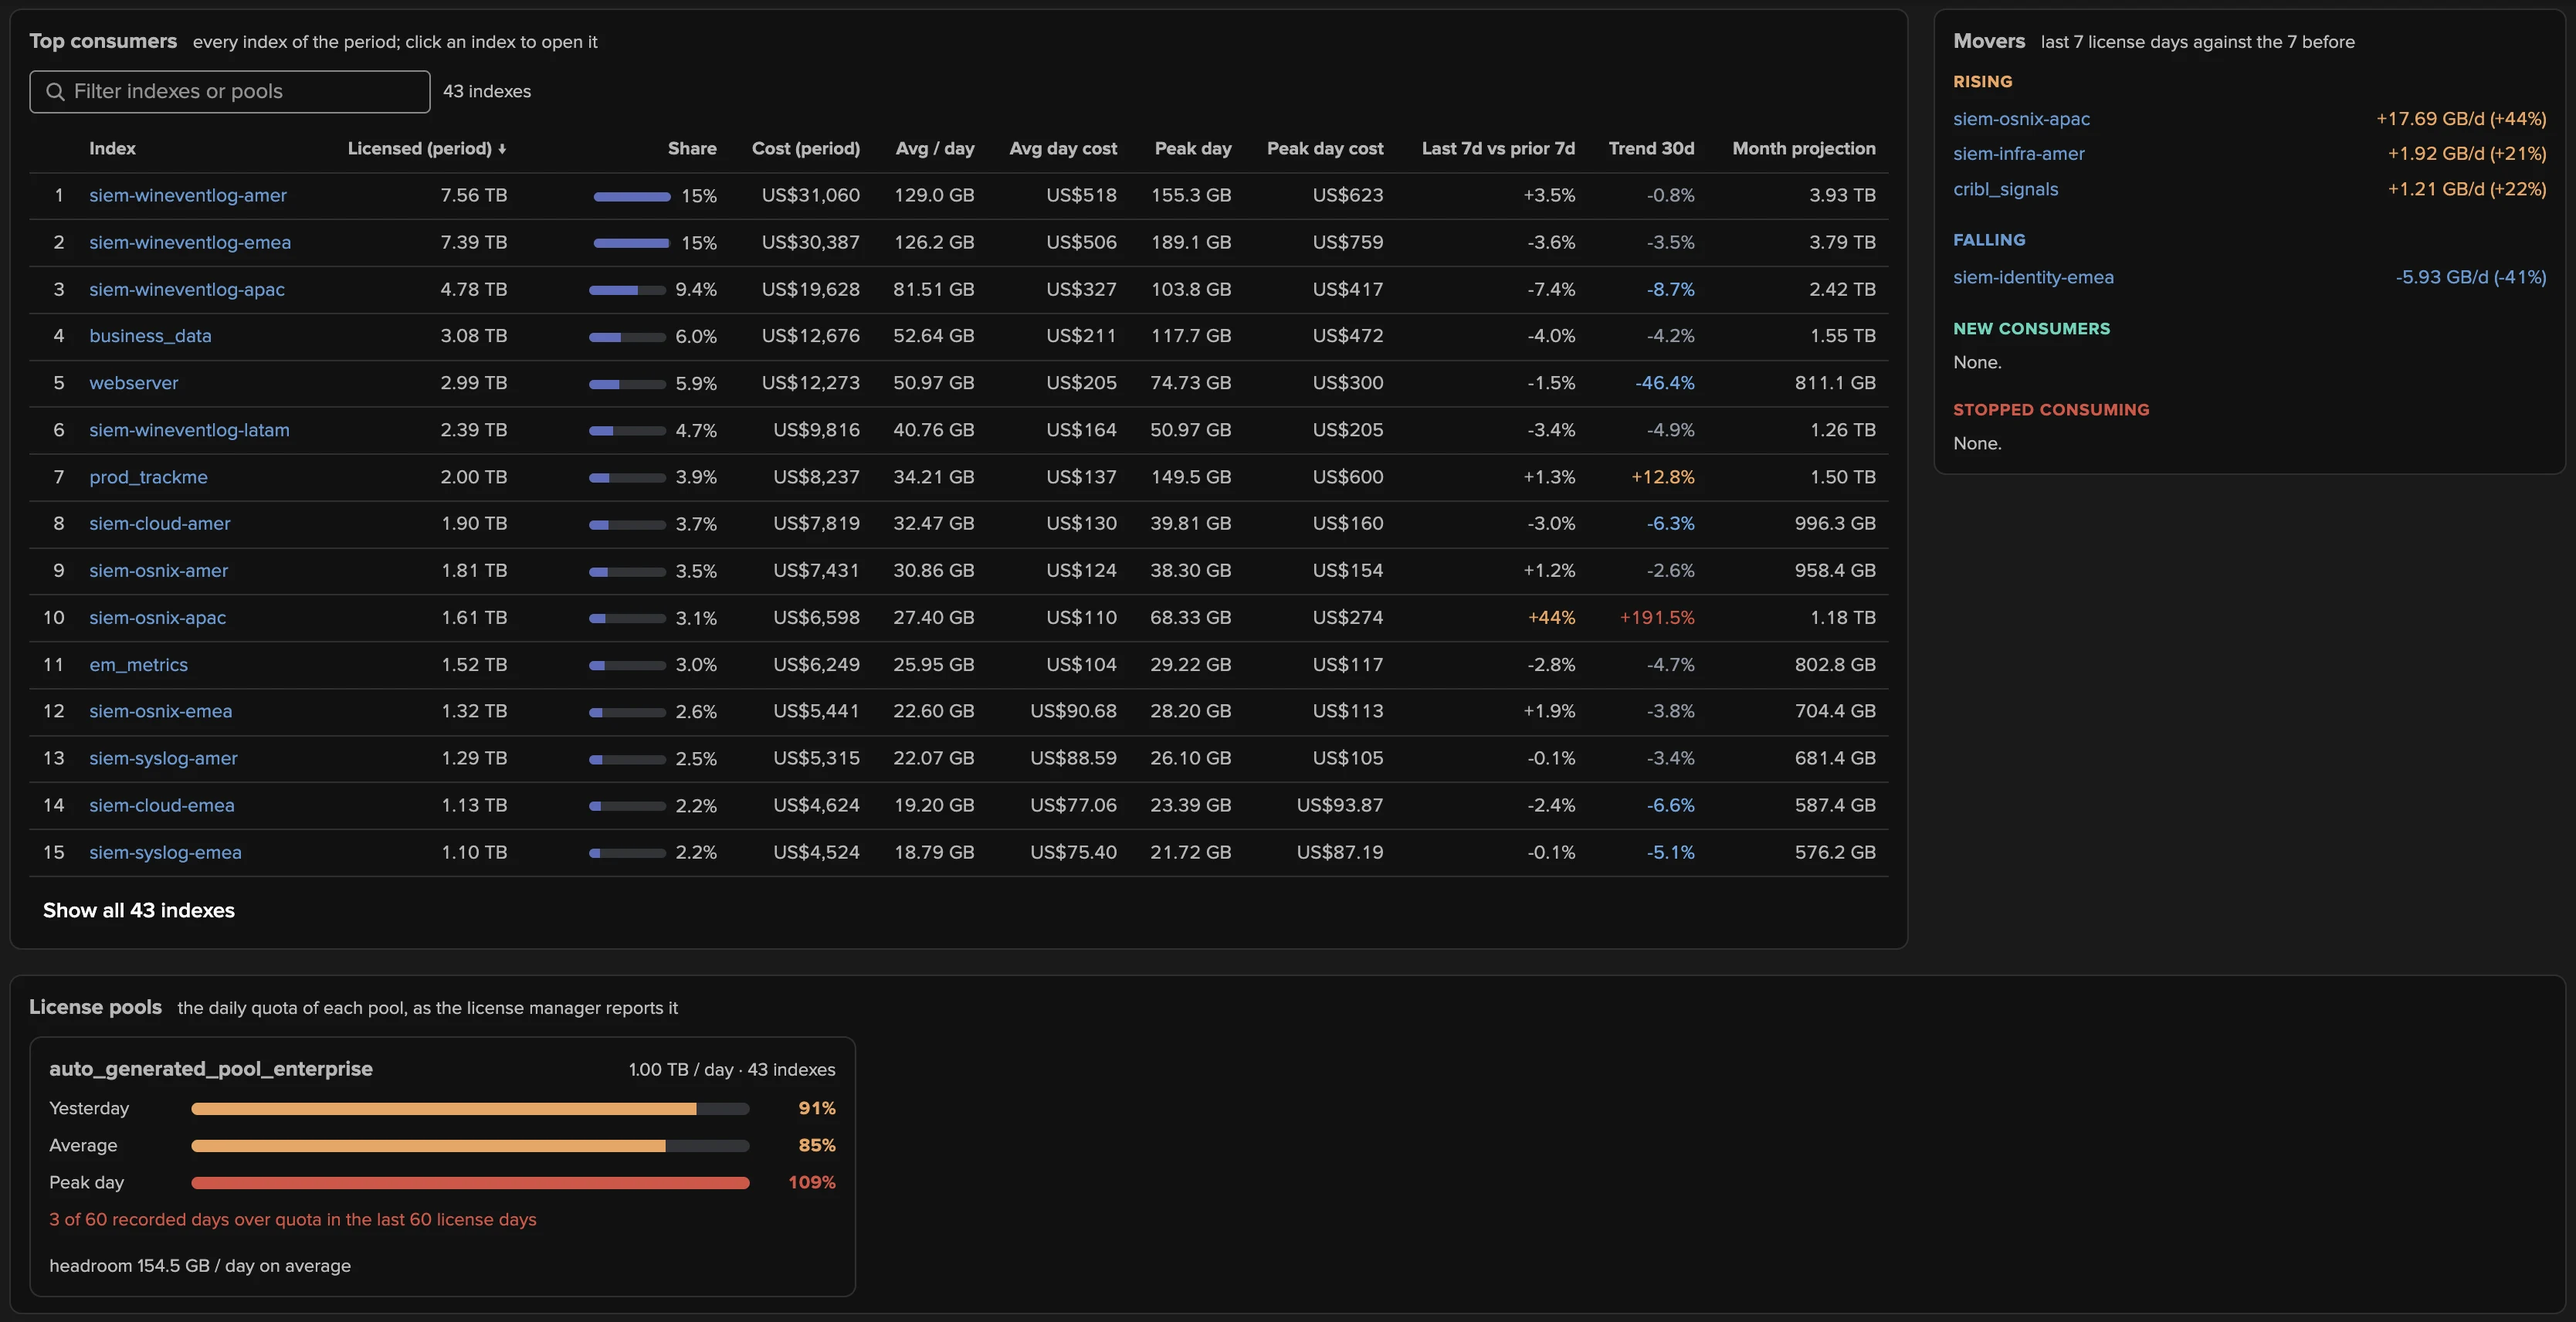
Top consumers — every index, sortable and filterable: rank, share, total, average, peak, the last 7 closed days against the 7 before, pool, projection and 30-day trend, plus the cost columns when costs are on. A click opens the entity.
Movers — rising, falling, new consumers and stopped consuming, last 7 closed days against the 7 before. They need 14 recorded days: on a young tenant the card says so instead of calling every index new.
License pools — one card per pool with its meters (yesterday, average, peak day), the number of recorded days over quota and the headroom; (configured) marks a quota set in the configuration.
Scopes
A named scope is a set of indexes analysed together: a team, a use case, the data of Enterprise Security. Up to 50 scopes; an index may belong to several (overlaps are allowed and shown). Two sources:
Index patterns — include and exclude patterns,
*and?as the only wildcards, case-insensitive.CIM datamodel macros — the scope follows the
cim_<datamodel>_indexesmacros of the search head TrackMe runs on. A macro left at its default()is unconstrained and is left out, never read as every index; a macro that is not a plain list of index terms joined byORis unreadable and left out too. Datamodels can be excluded, and exclude patterns apply on top. The macros must reflect the search head tier where Enterprise Security runs; when every macro is at its default the scope is empty and the tab says so.
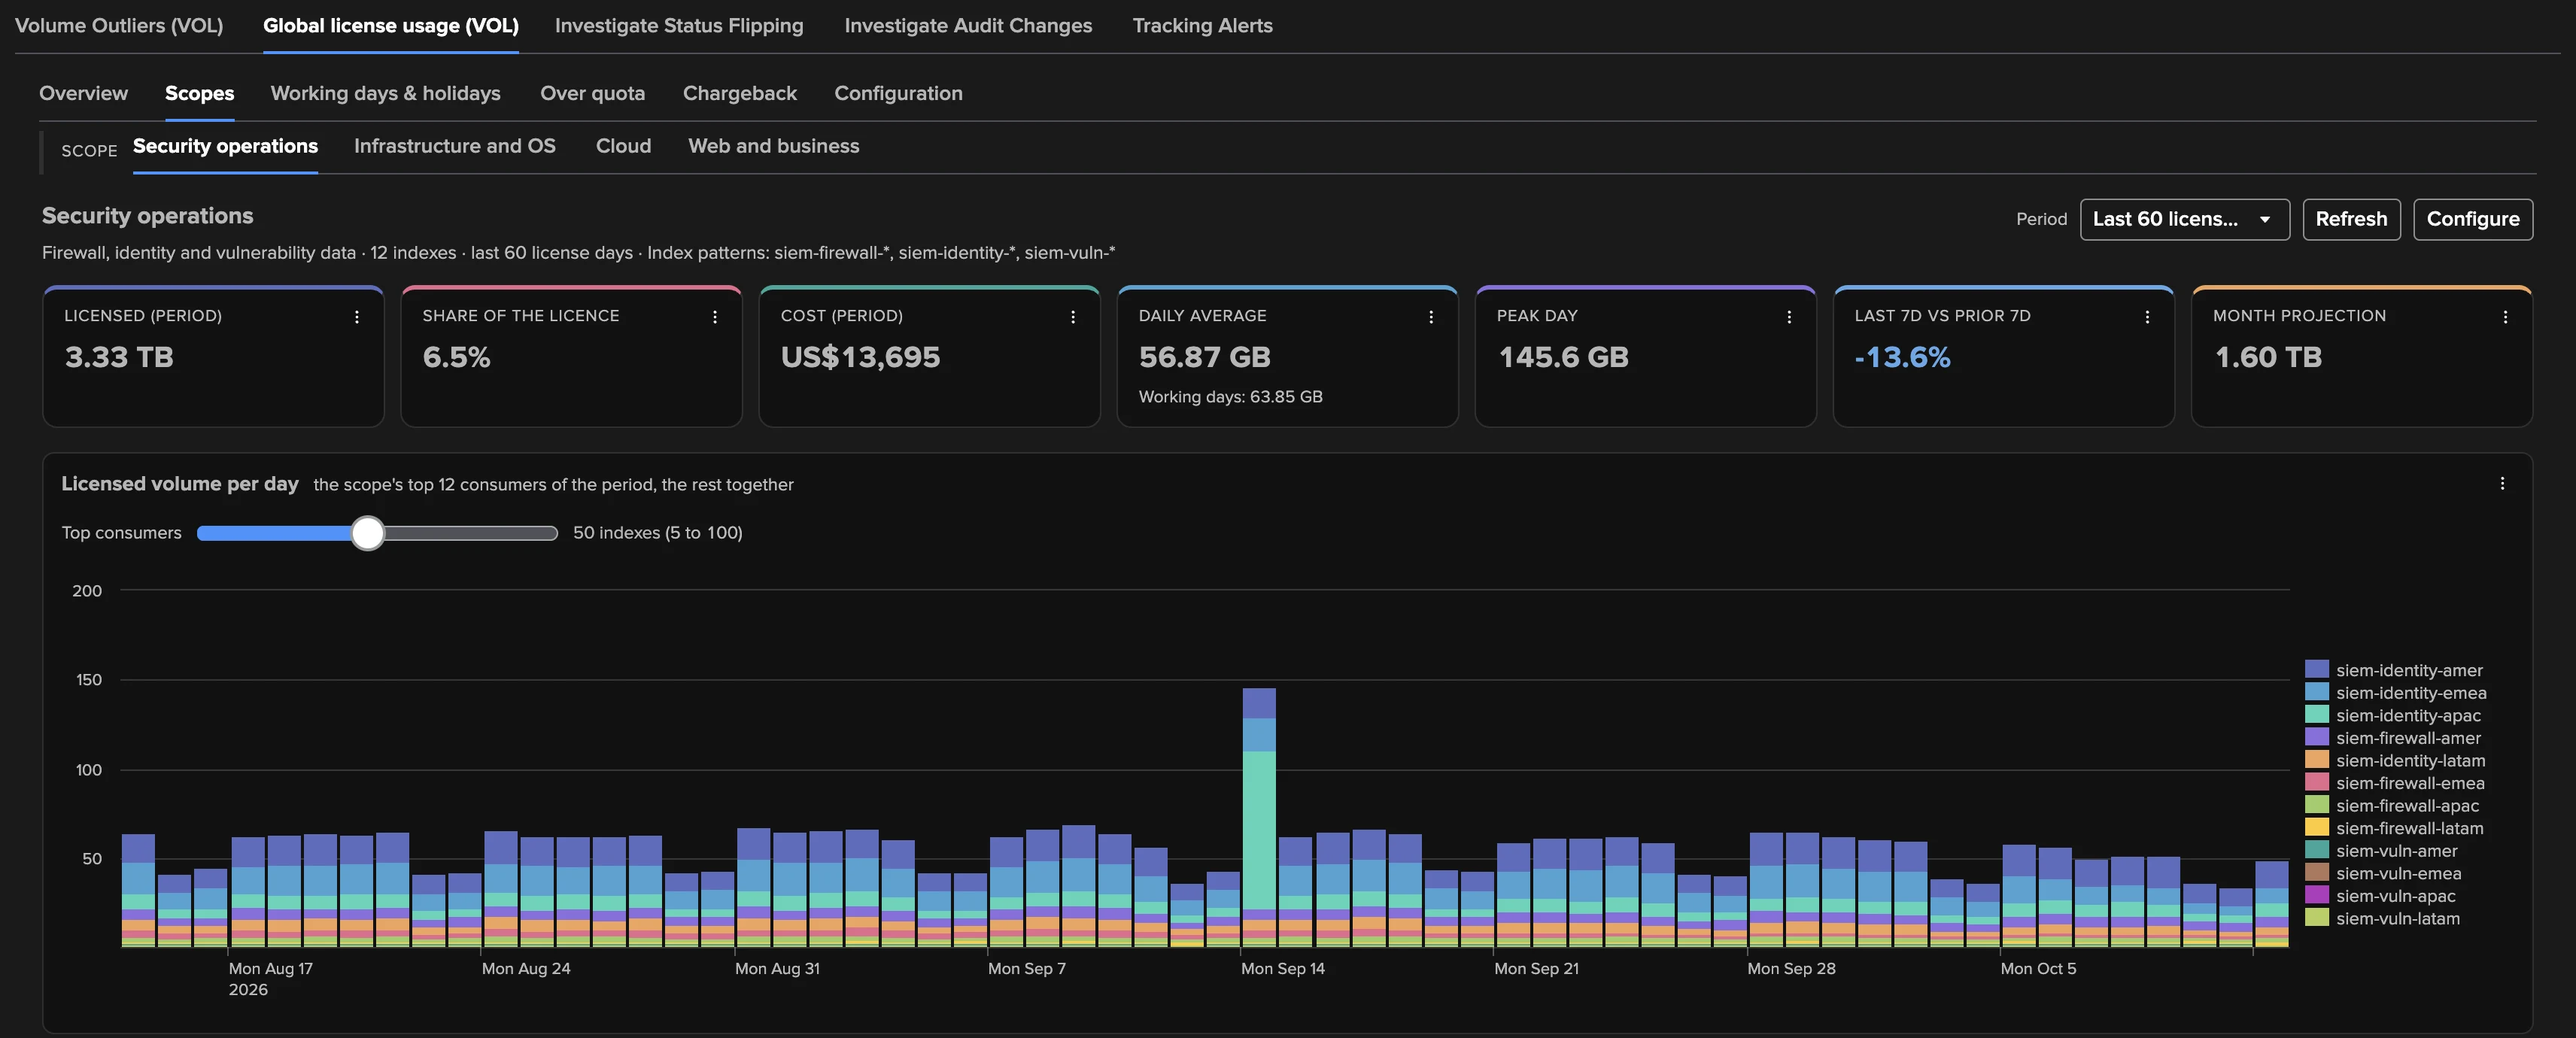
A scope tab shows Licensed (period), Share of the licence (or Cost (period)), Daily average, Peak day (the peak of the scope’s own daily series, not the sum of its indexes’ peaks), Last 7d vs prior 7d and Month projection; the daily volume stacked by index with its own top consumers slider (50 by default); the scope per day with its projection; and its Indexes table.
Working days & holidays
Weekends and public holidays pull a daily average down, so the view gives a working-day average everywhere and a dedicated sub-tab: Working-day average, Weekend average, Bank holidays (the license days of the period that fall on a holiday, shown when holiday calendars apply), Holiday average, Working vs non-working, Peak working day and Quota used on a working day; the daily volume coloured by kind of day; the average per weekday (holidays left out); the top consumers and the license pools on a working day; and the holidays of the period.
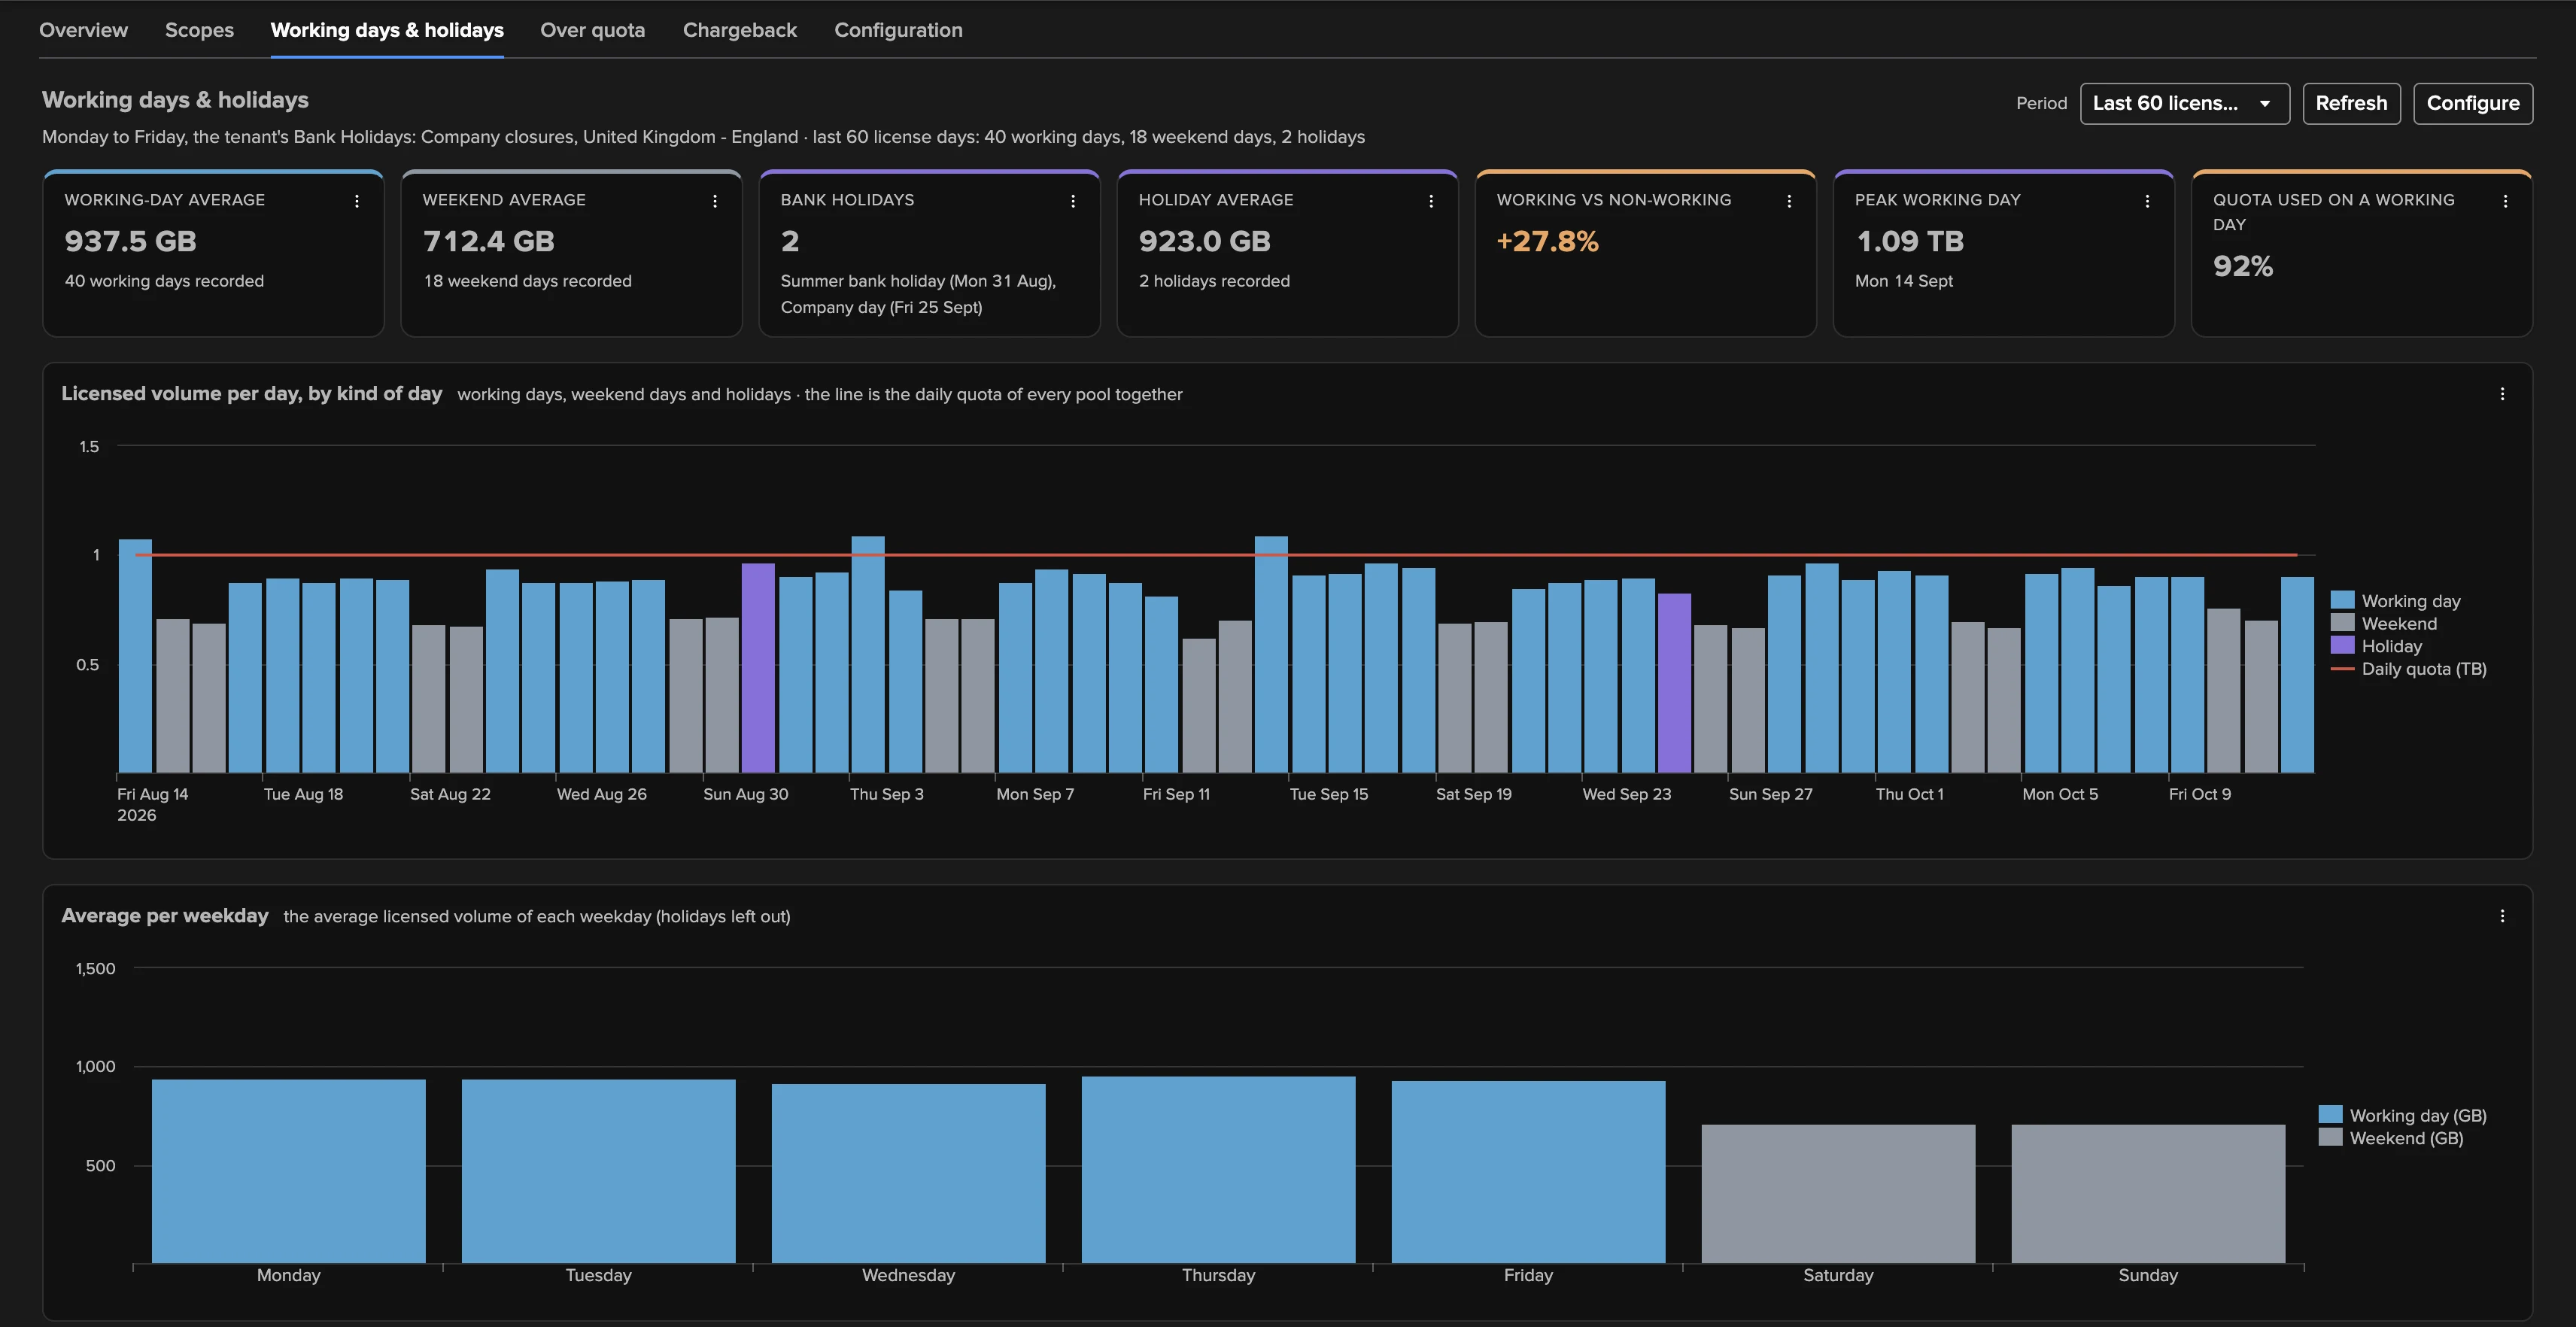
A license day is a holiday when its date is covered by a holiday of the calendars in use, else a working day or a weekend day from the working weekdays (Monday to Friday by default). The holidays are either not counted (default), those of the tenant’s Bank Holidays calendars, or those of calendars you select. Only the holidays that count in a calendar are used, with their exact date every year (Easter Monday, Thanksgiving…). Working days follow the tenant’s calendars, not the four Bank Holidays effects.
Over quota
The days a license pool went over its daily quota. It needs a quota in force: the license manager’s pool size (Splunk Enterprise) or a daily quota configured per pool (any deployment, Splunk Cloud included). Without one, the tab offers Configure the daily quota.
Window — 3, 6 (default) or 12 calendar months, ending with the last closed day.
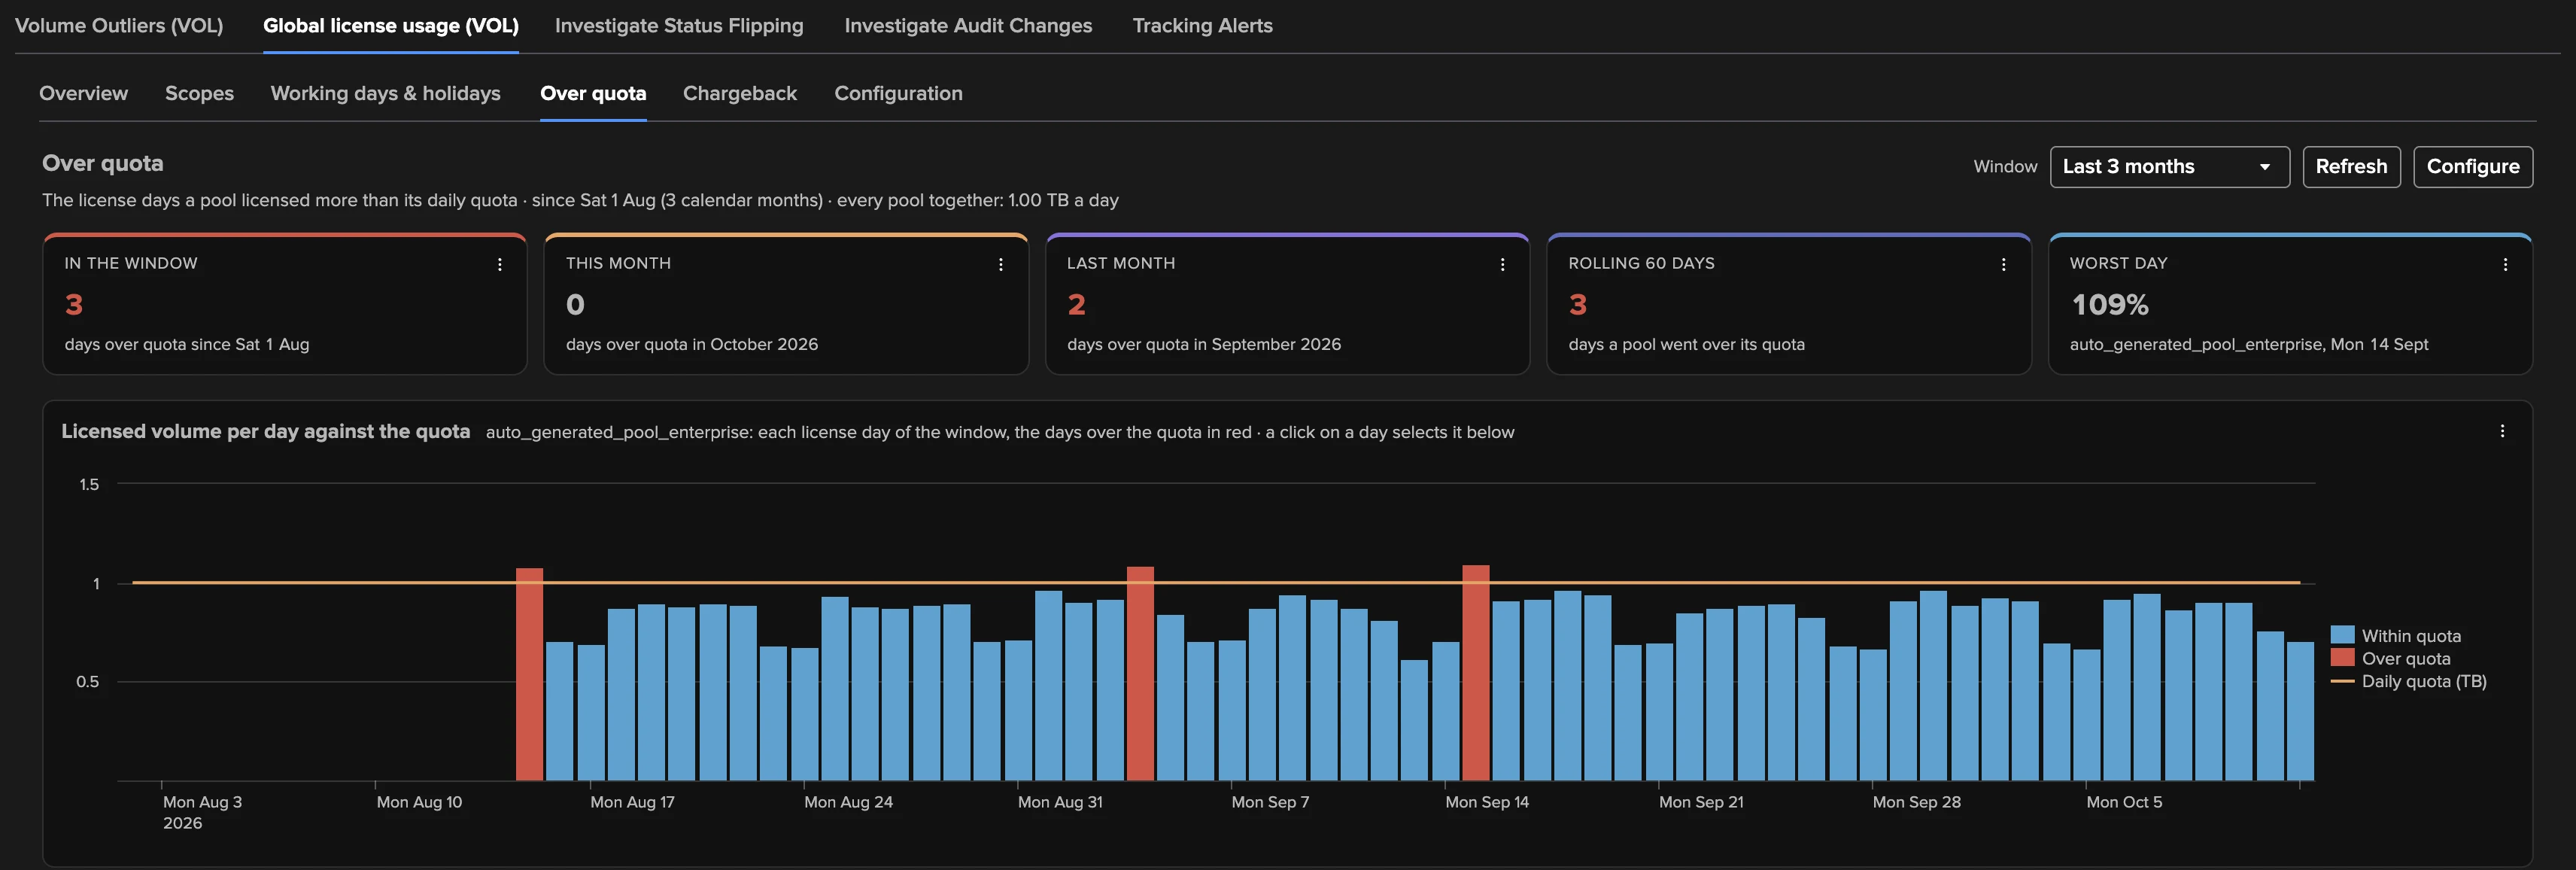
Tiles — In the window, This month, Last month, Rolling 60 days and Worst day.
Licensed volume per day against the quota — one column per day, blue within the quota, red over it, with the quota line; a pool selector when several pools have a quota (the one most often over by default).
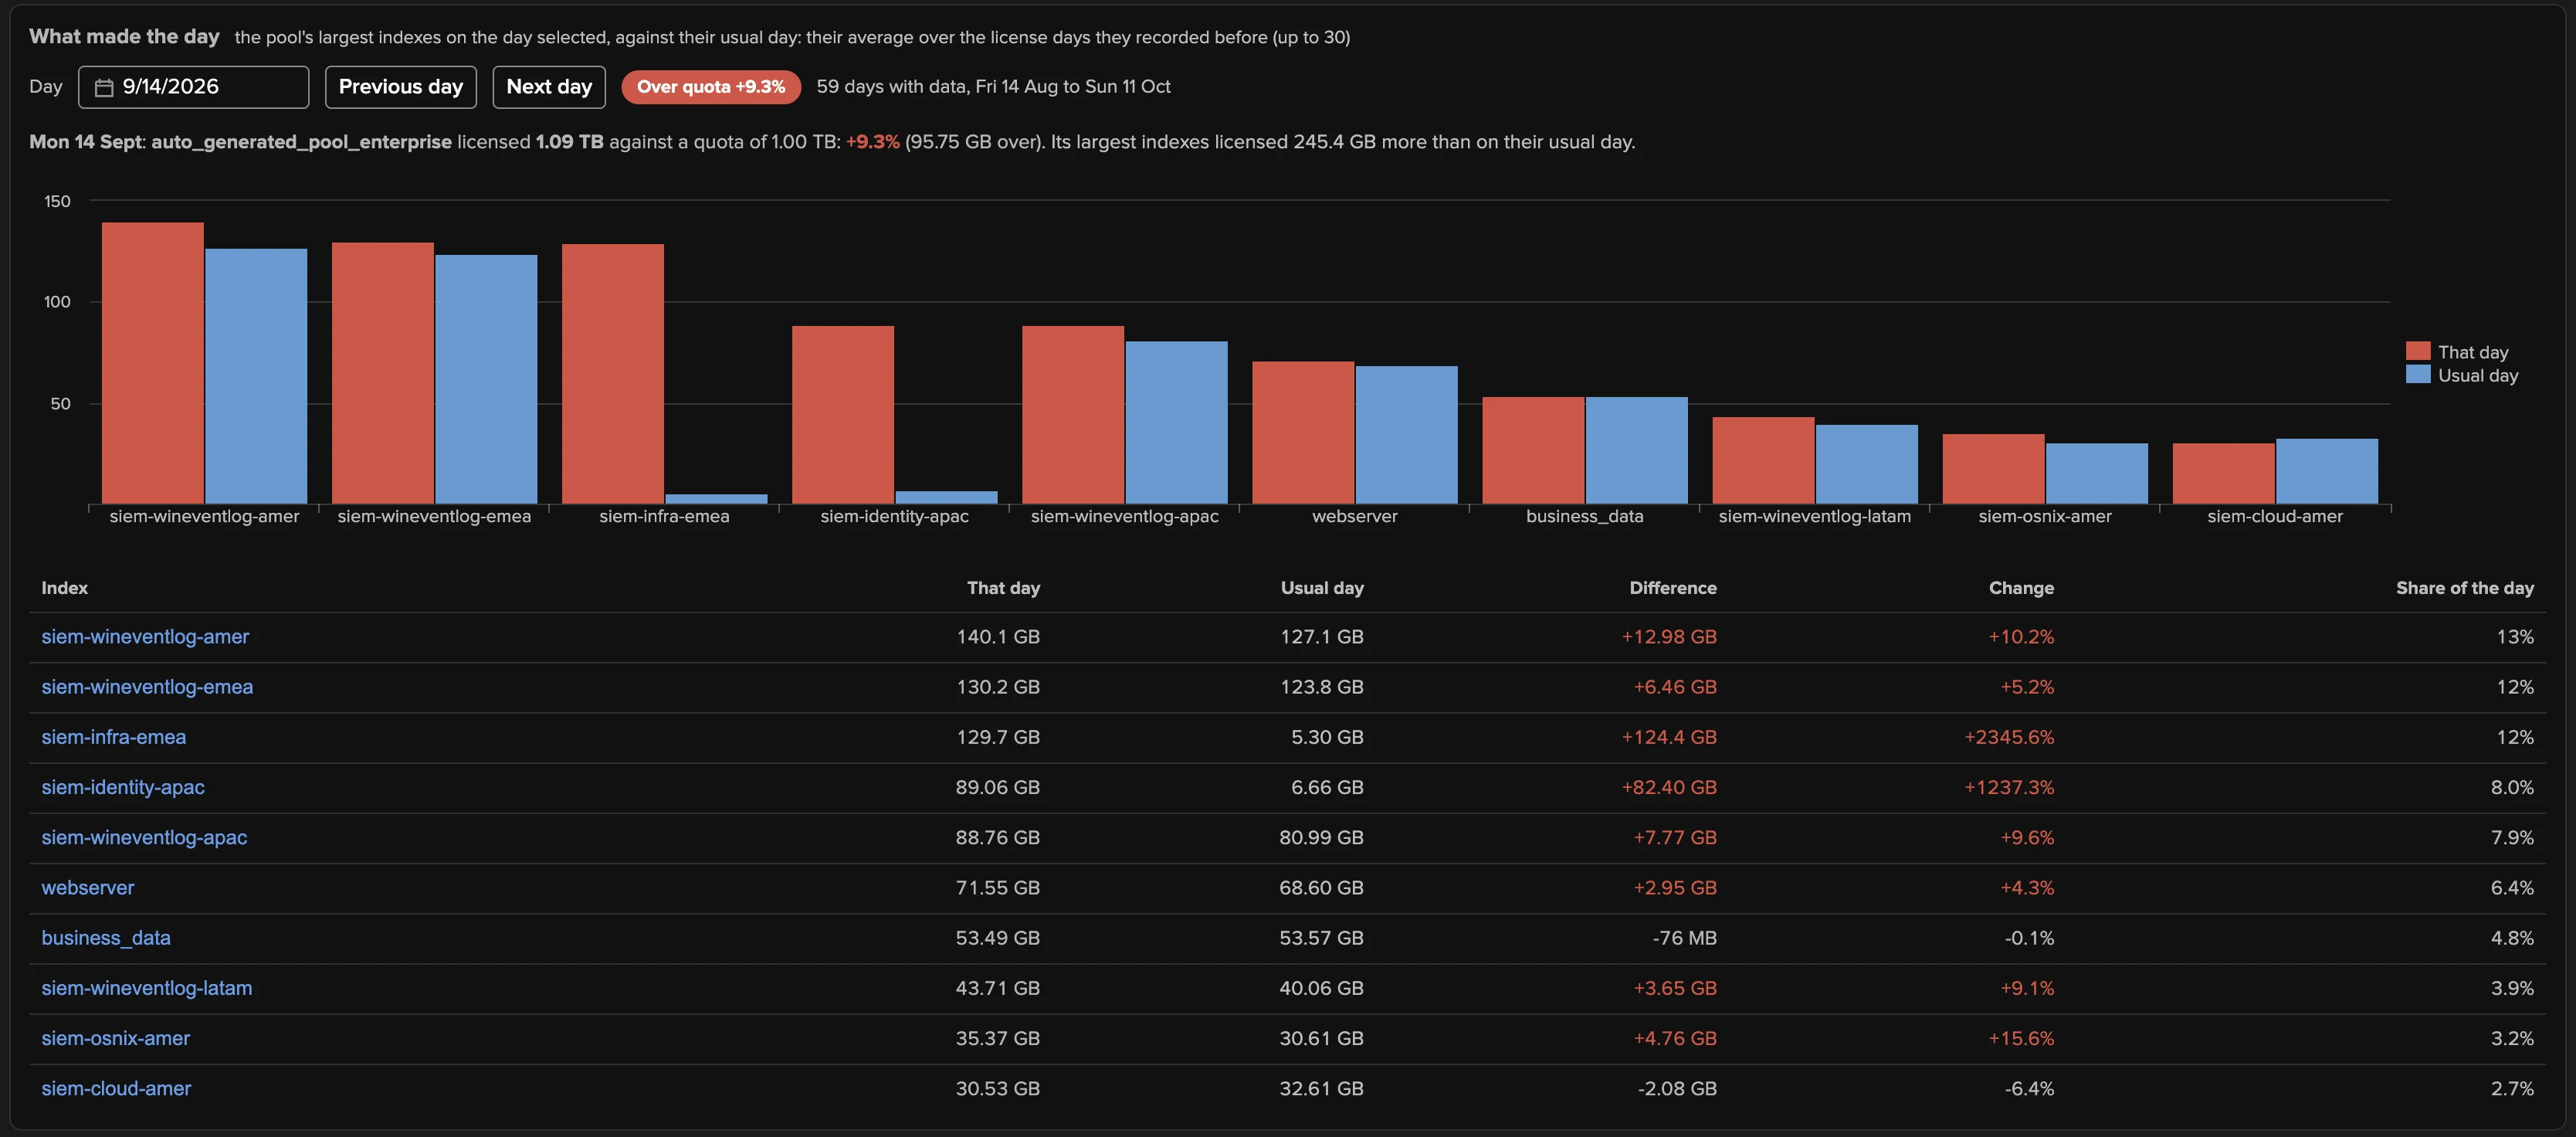
What made the day — pick a day with the date selector or Previous day / Next day (a badge says Over quota +N% or Within quota): the pool’s 10 largest indexes that day against their usual day, the average of their previous recorded days (up to 30). Each index links to its entity. Clicking a column of the chart presets the selector.
Days over quota — the list, with the three largest indexes of each day and their change; Per calendar month; and Splunk license warnings for context.
Note
Days over quota are not Splunk license warnings. Splunk counts one warning per pool and license-manager day over the pool’s quota. A stack under 100 GB/day has search disabled for a pool after 45 warnings in a rolling 60 days; from 100 GB/day, warnings are issued but search is not disabled. TrackMe does not know the size of the stack (a pool is a slice of it), so the view states both rules and never claims which applies. Its warning count uses the license manager’s quota only: a configured quota never raises one. Past days are measured against today’s quota.
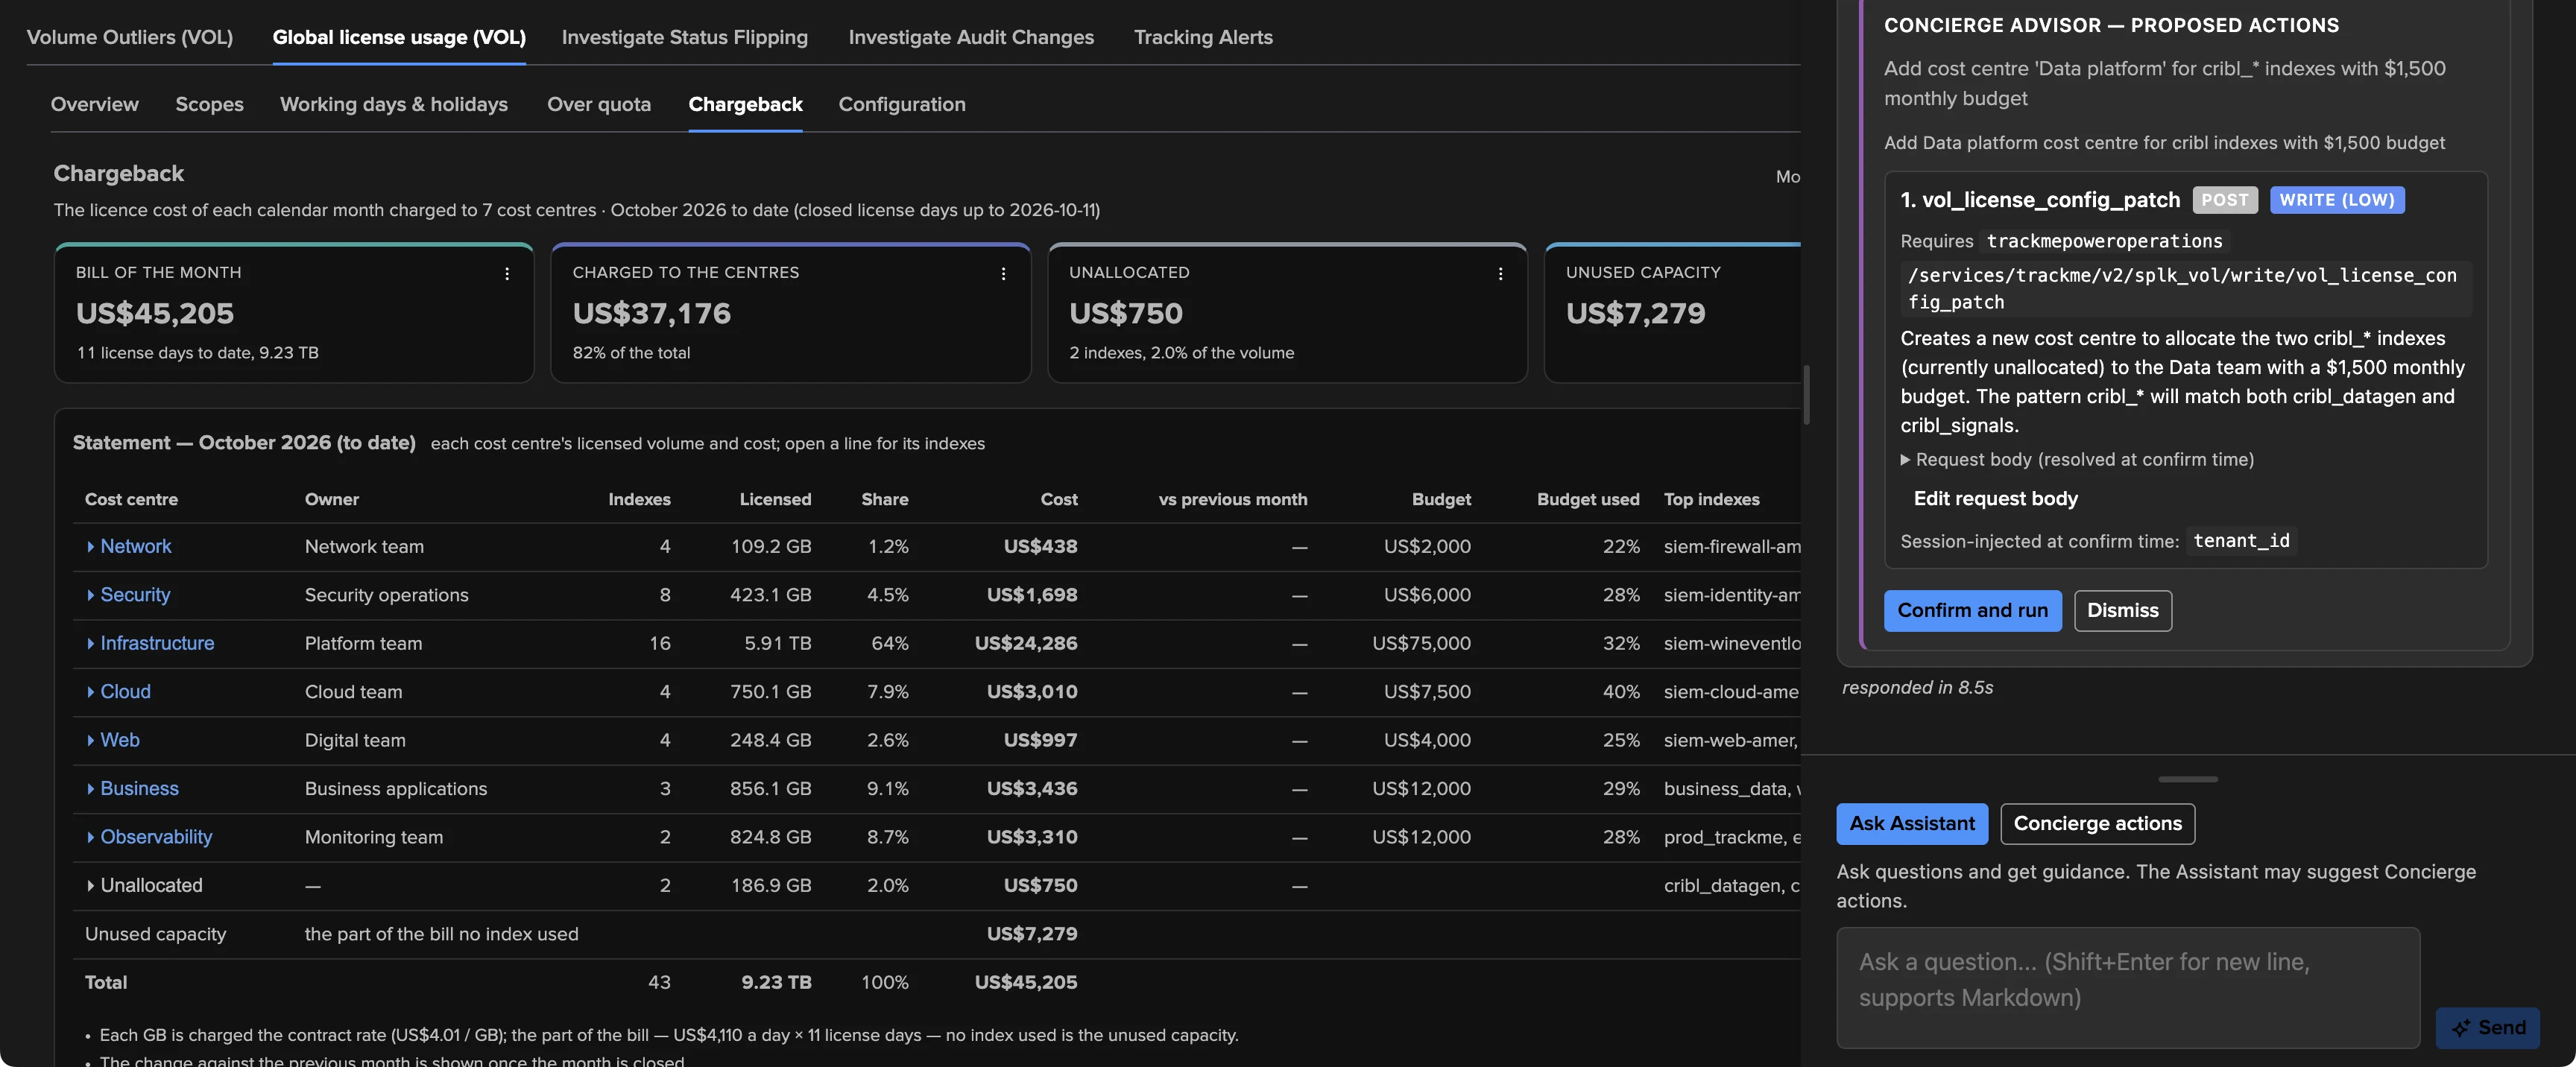
Chargeback
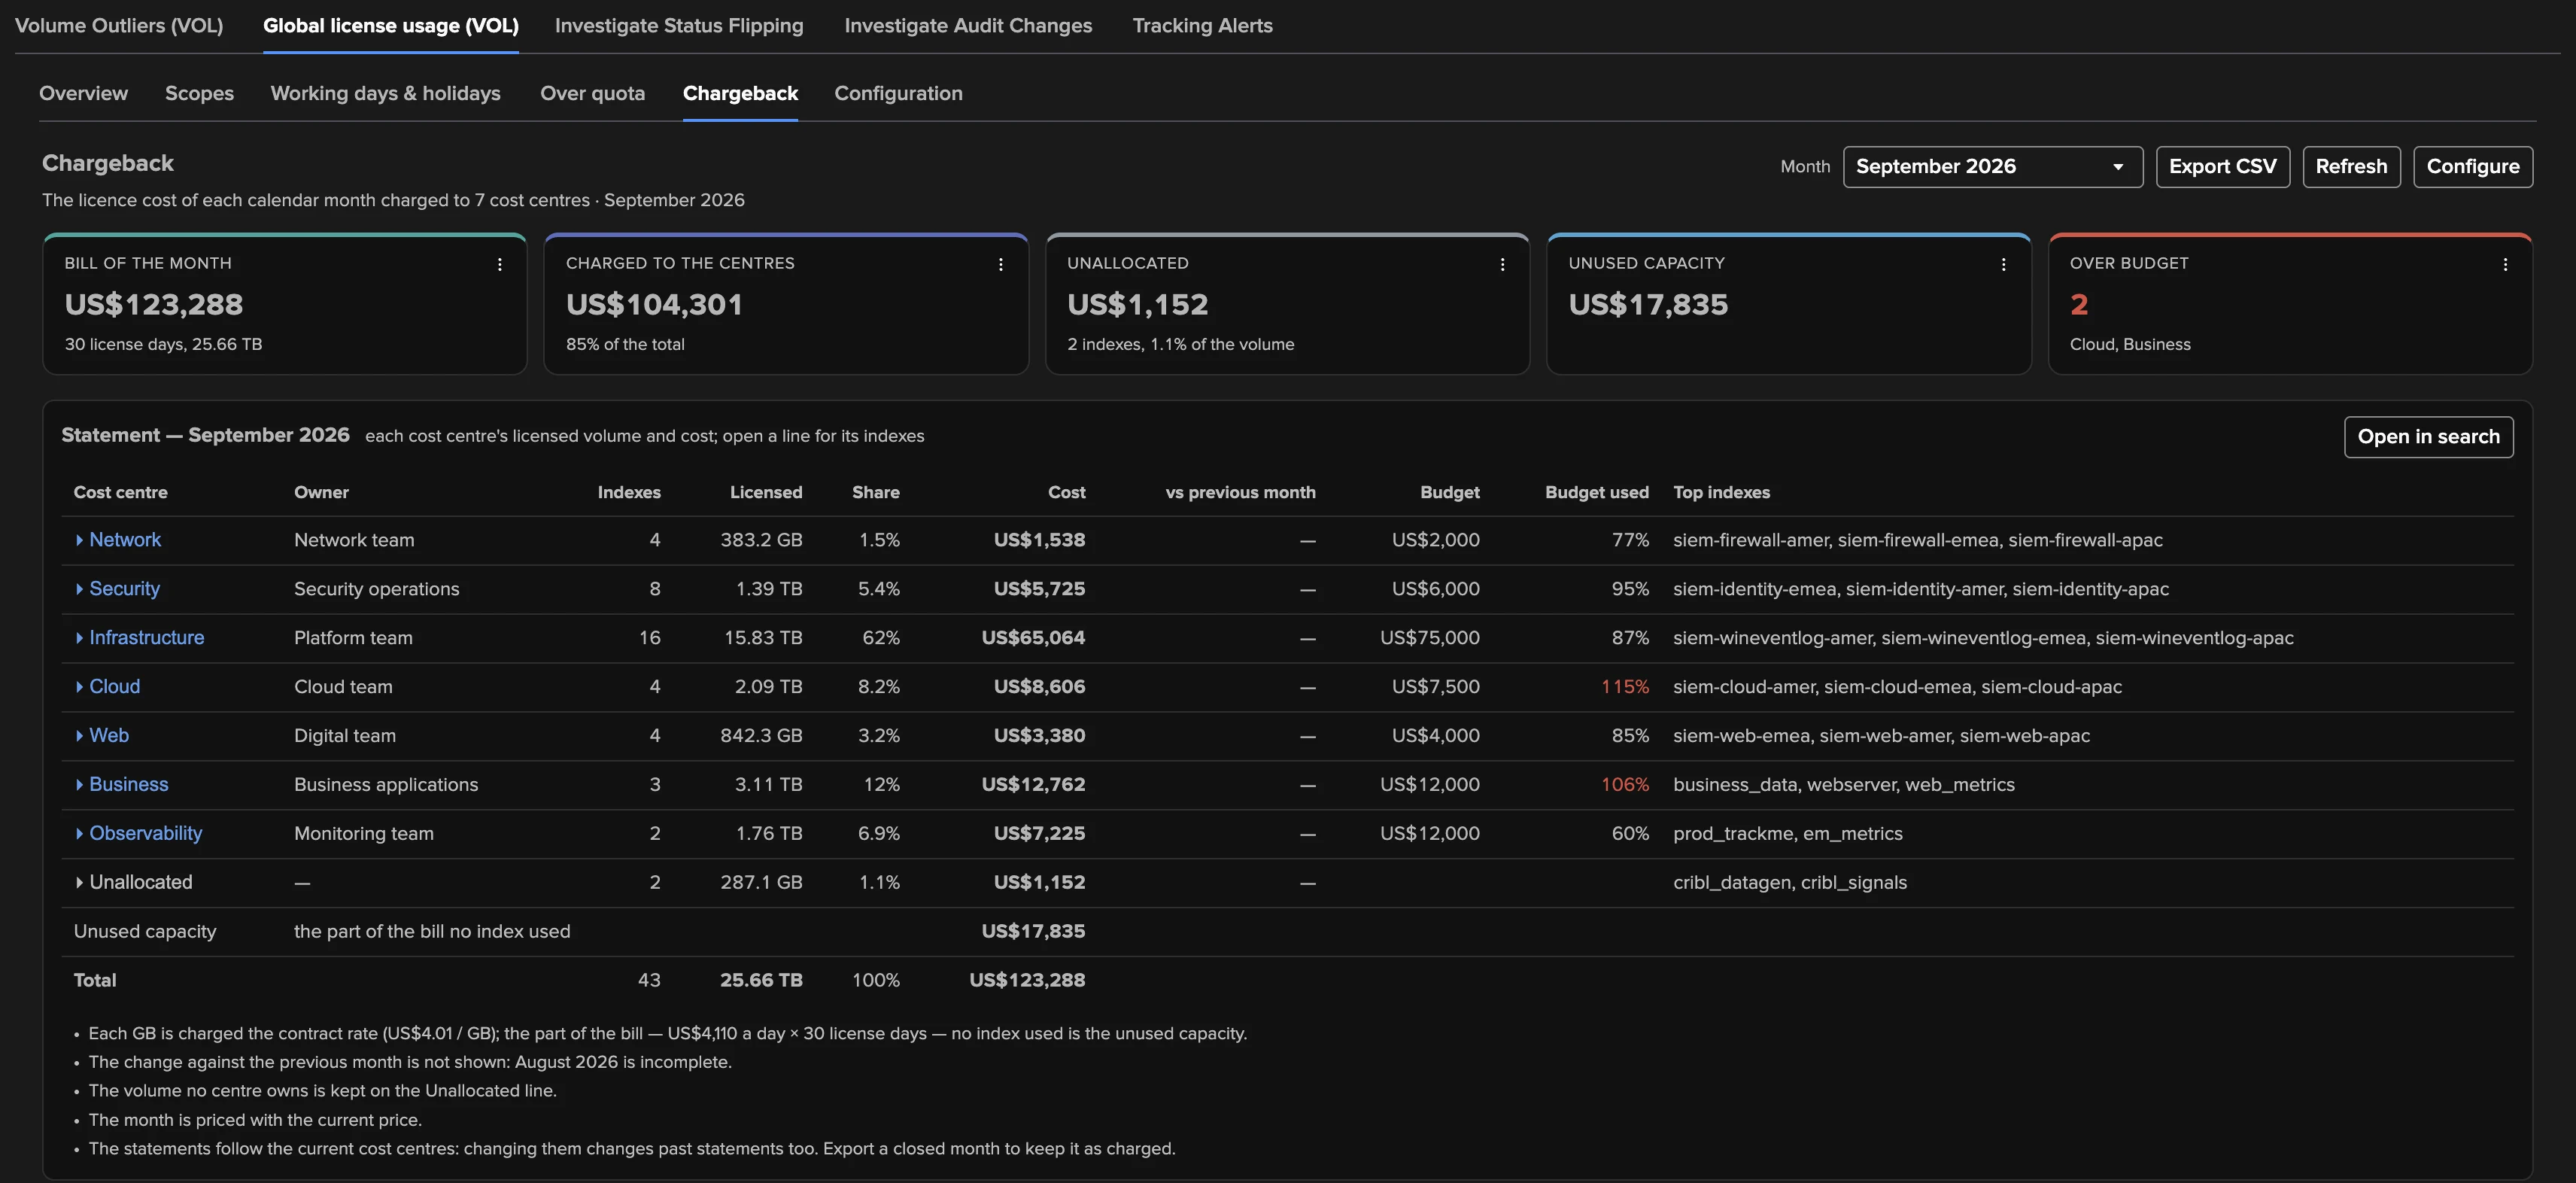
The license cost of each calendar month, charged to cost centres. It needs costs (a price) and at least one centre; otherwise the tab says what to configure.
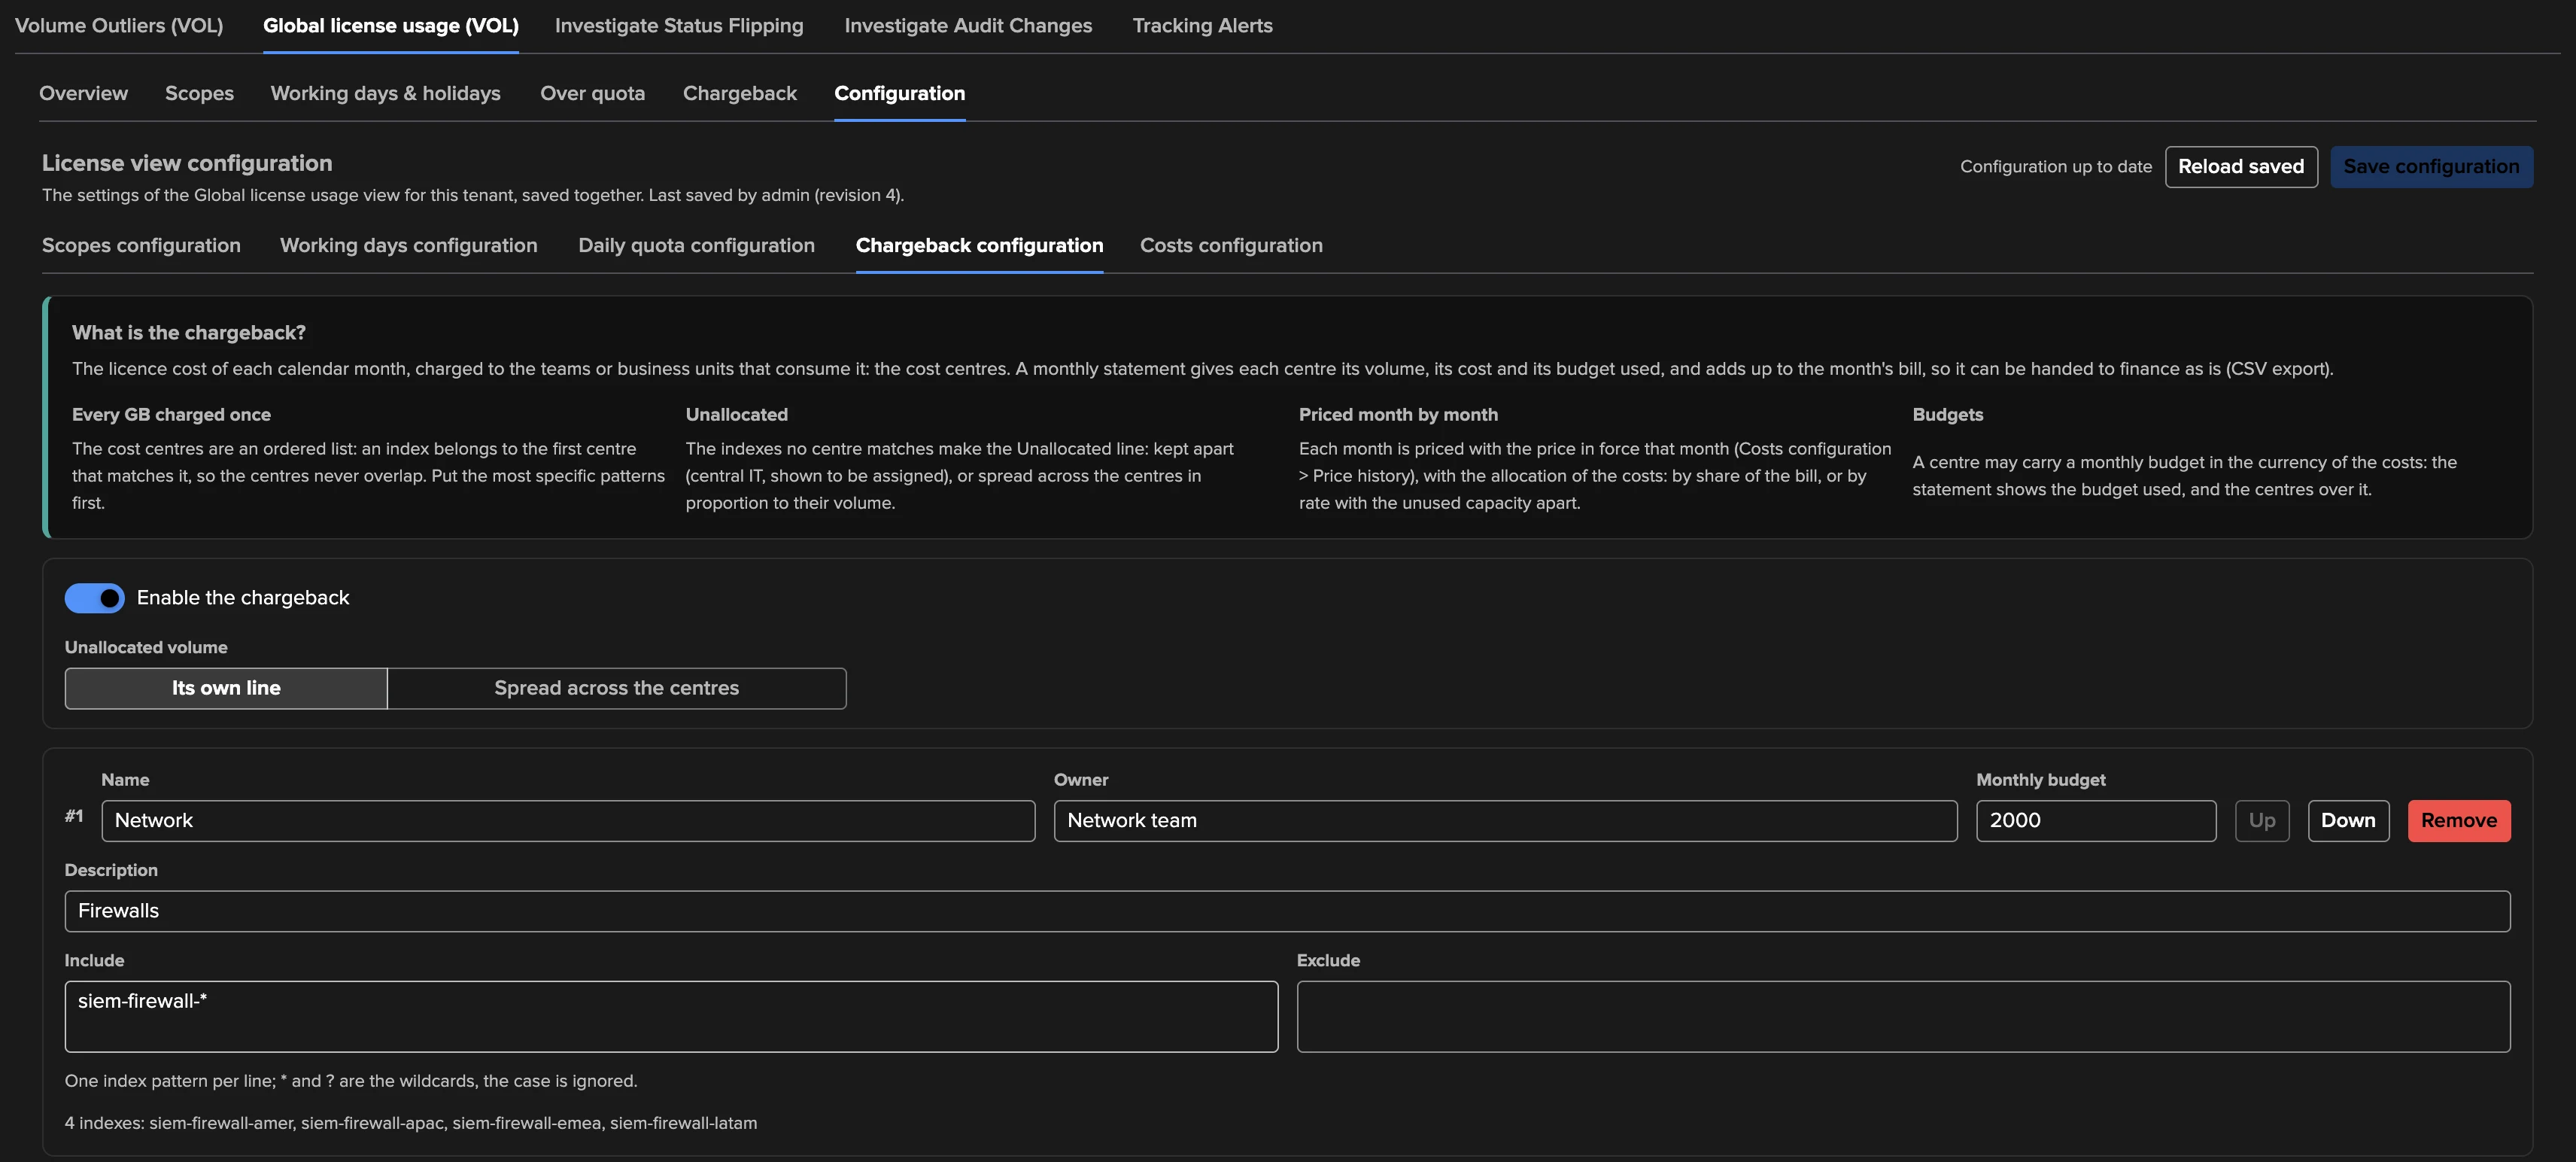
Partition — the centres are an ordered list, each with include and exclude index patterns. An index belongs to the first centre that matches it, so every GB is charged once; the configuration shows the indexes an earlier centre already took, so you can check the order. Indexes no centre matches form the Unallocated line, or are spread across the centres in proportion to their volume.
Statement — for the month you pick among the last 13: the Bill of the month (the calendar days of the month; the closed days so far for the current month, marked to date), Charged to the centres, Unallocated, Unused capacity or Over the licence, and Over budget. Per centre: volume, share, cost, budget used and the change against the previous month, shown only between two complete months. Each line opens on its indexes. A 13-month trend chart and Export CSV complete it.
Prices with an effective date — a renewal does not reprice the past: each previous price applies up to the month you give it, on its own basis (annual or per GB).
A collection gap never shrinks the bill: the days are flagged and the rules under the statement say how each basis treats them.
Important
Statements are computed live from the current cost centres and price history: no statement is frozen. To keep the statement of a closed month as it was, export it to CSV.
Configuration
The Configuration sub-tab holds five sections, saved together with Save configuration (an optional comment goes to the audit trail), with live previews as you type. The sub-tab keeps an unsaved draft while you visit the other sub-tabs; Reload saved discards it.
Section |
What you set |
|---|---|
Scopes configuration |
Add, remove, enable or disable a scope; its name, description, source (Index patterns or CIM datamodel macros), include and exclude patterns, excluded datamodels. The preview lists the indexes each scope resolves to. |
Working days configuration |
The working weekdays and the holidays: Not counted, The tenant’s calendars or Selected calendars (with this year’s holidays of each). The preview classifies the last 30 license days. |
Daily quota configuration |
One row per pool with the license manager’s quota and an optional daily volume in GB. A configured quota becomes the view’s reference (or gives a Splunk Cloud stack the volume it was sized for); it never changes Splunk’s own warnings. Pools no longer reported stay listed so you can clear them. |
Chargeback configuration |
Enable the chargeback, choose what happens to unallocated indexes (Its own line or Spread across the centres), then the ordered cost centres (Up / Down) with a name, an owner, a monthly budget, a description and the patterns. Seed from scopes creates one centre per enabled pattern scope. The preview shows the partition. |
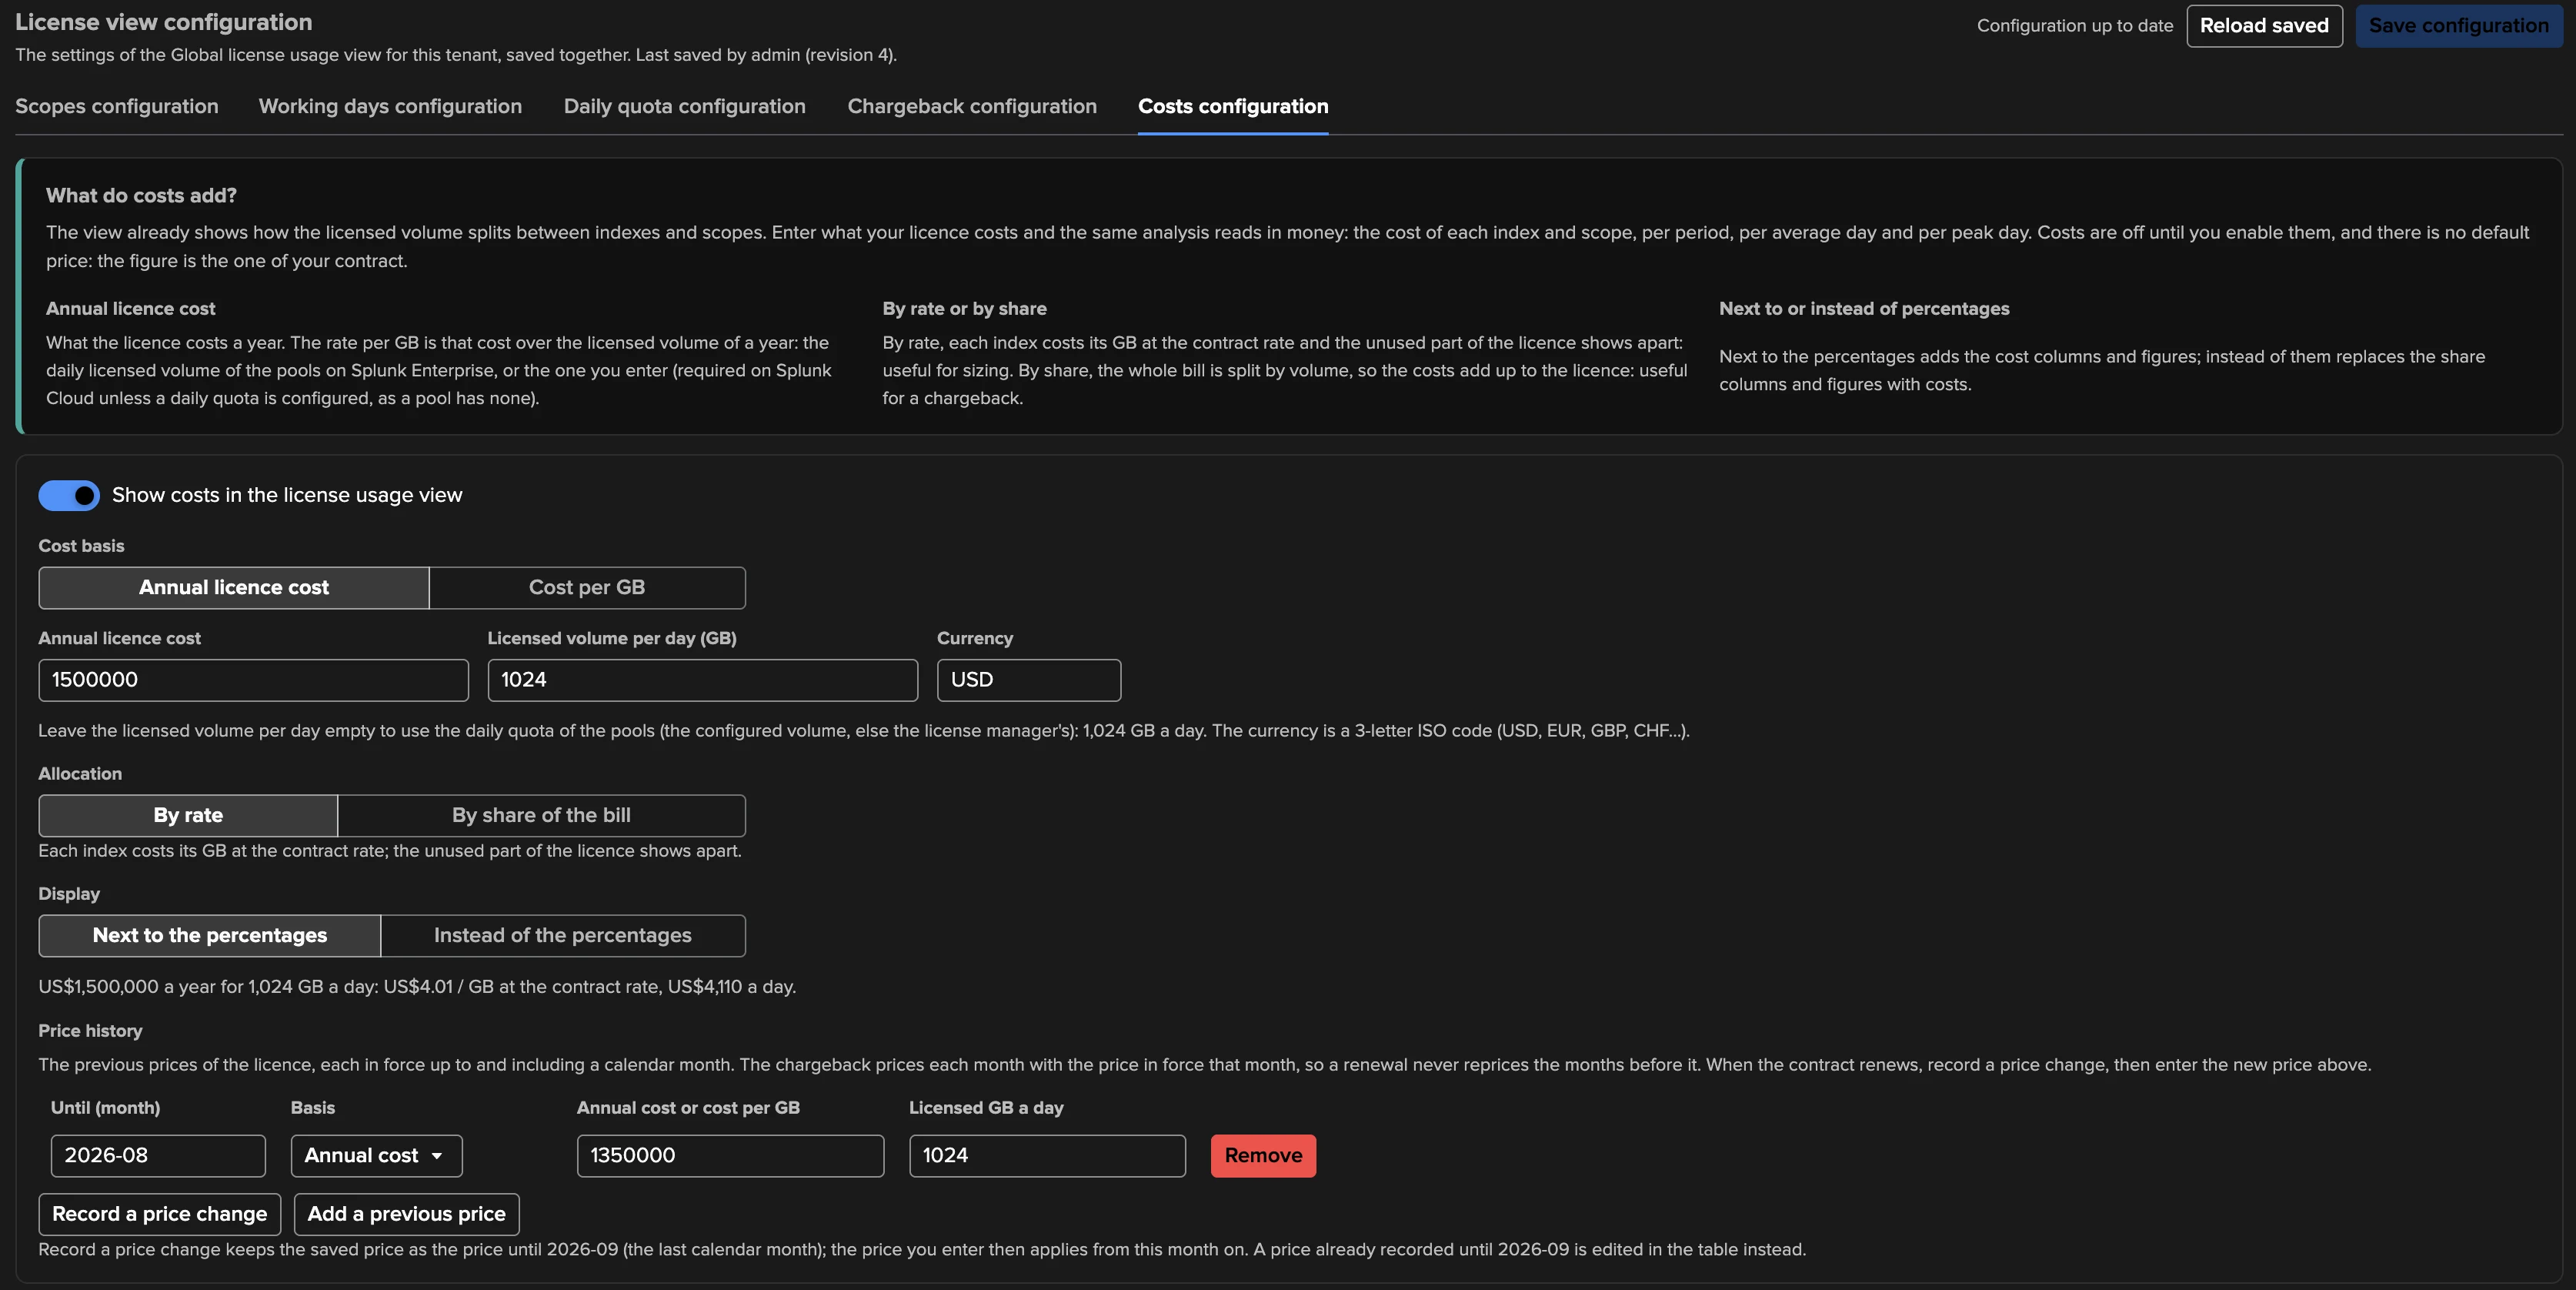
Costs configuration |
Enable the costs; the basis (Annual licence cost, with the licensed volume per day, or Cost per GB); the currency (ISO code, USD by default); the allocation (By rate or By share of the bill); the display (Next to the percentages or Instead of the percentages); and the Price history: Record a price change copies the saved price to last month before you enter the new one, Add a previous price enters an older one. |
The configuration is one document per tenant with a revision: a save based on an older revision is refused, so two people editing at once never overwrite each other silently. It is backed up with the tenant. Nothing is configured by default.
How costs are computed
Every figure uses one effective rate per GB:
Annual licence cost, by rate — the annual cost divided by 365 and by the licensed GB per day (the configured value, else the pools’ quota in force). Each GB costs the contract rate, and the Unused capacity is the bill of the recorded days minus the cost of the volume used (negative: Over the licence).
Annual licence cost, by share of the bill — the bill of the recorded days split across the indexes by volume, so the costs add up to the bill. It needs no licensed volume per day: the natural choice on Splunk Cloud.
Cost per GB — that cost, always by rate.
Amounts are never rounded, so a small per-GB price never turns into zero.
Permissions
Action |
Who |
|---|---|
Open the tab and every sub-tab |
Every TrackMe user who can open the tenant ( |
Change the configuration (in the page or through the AI Assistant) |
|
Every saved change is audited (update license view configuration).
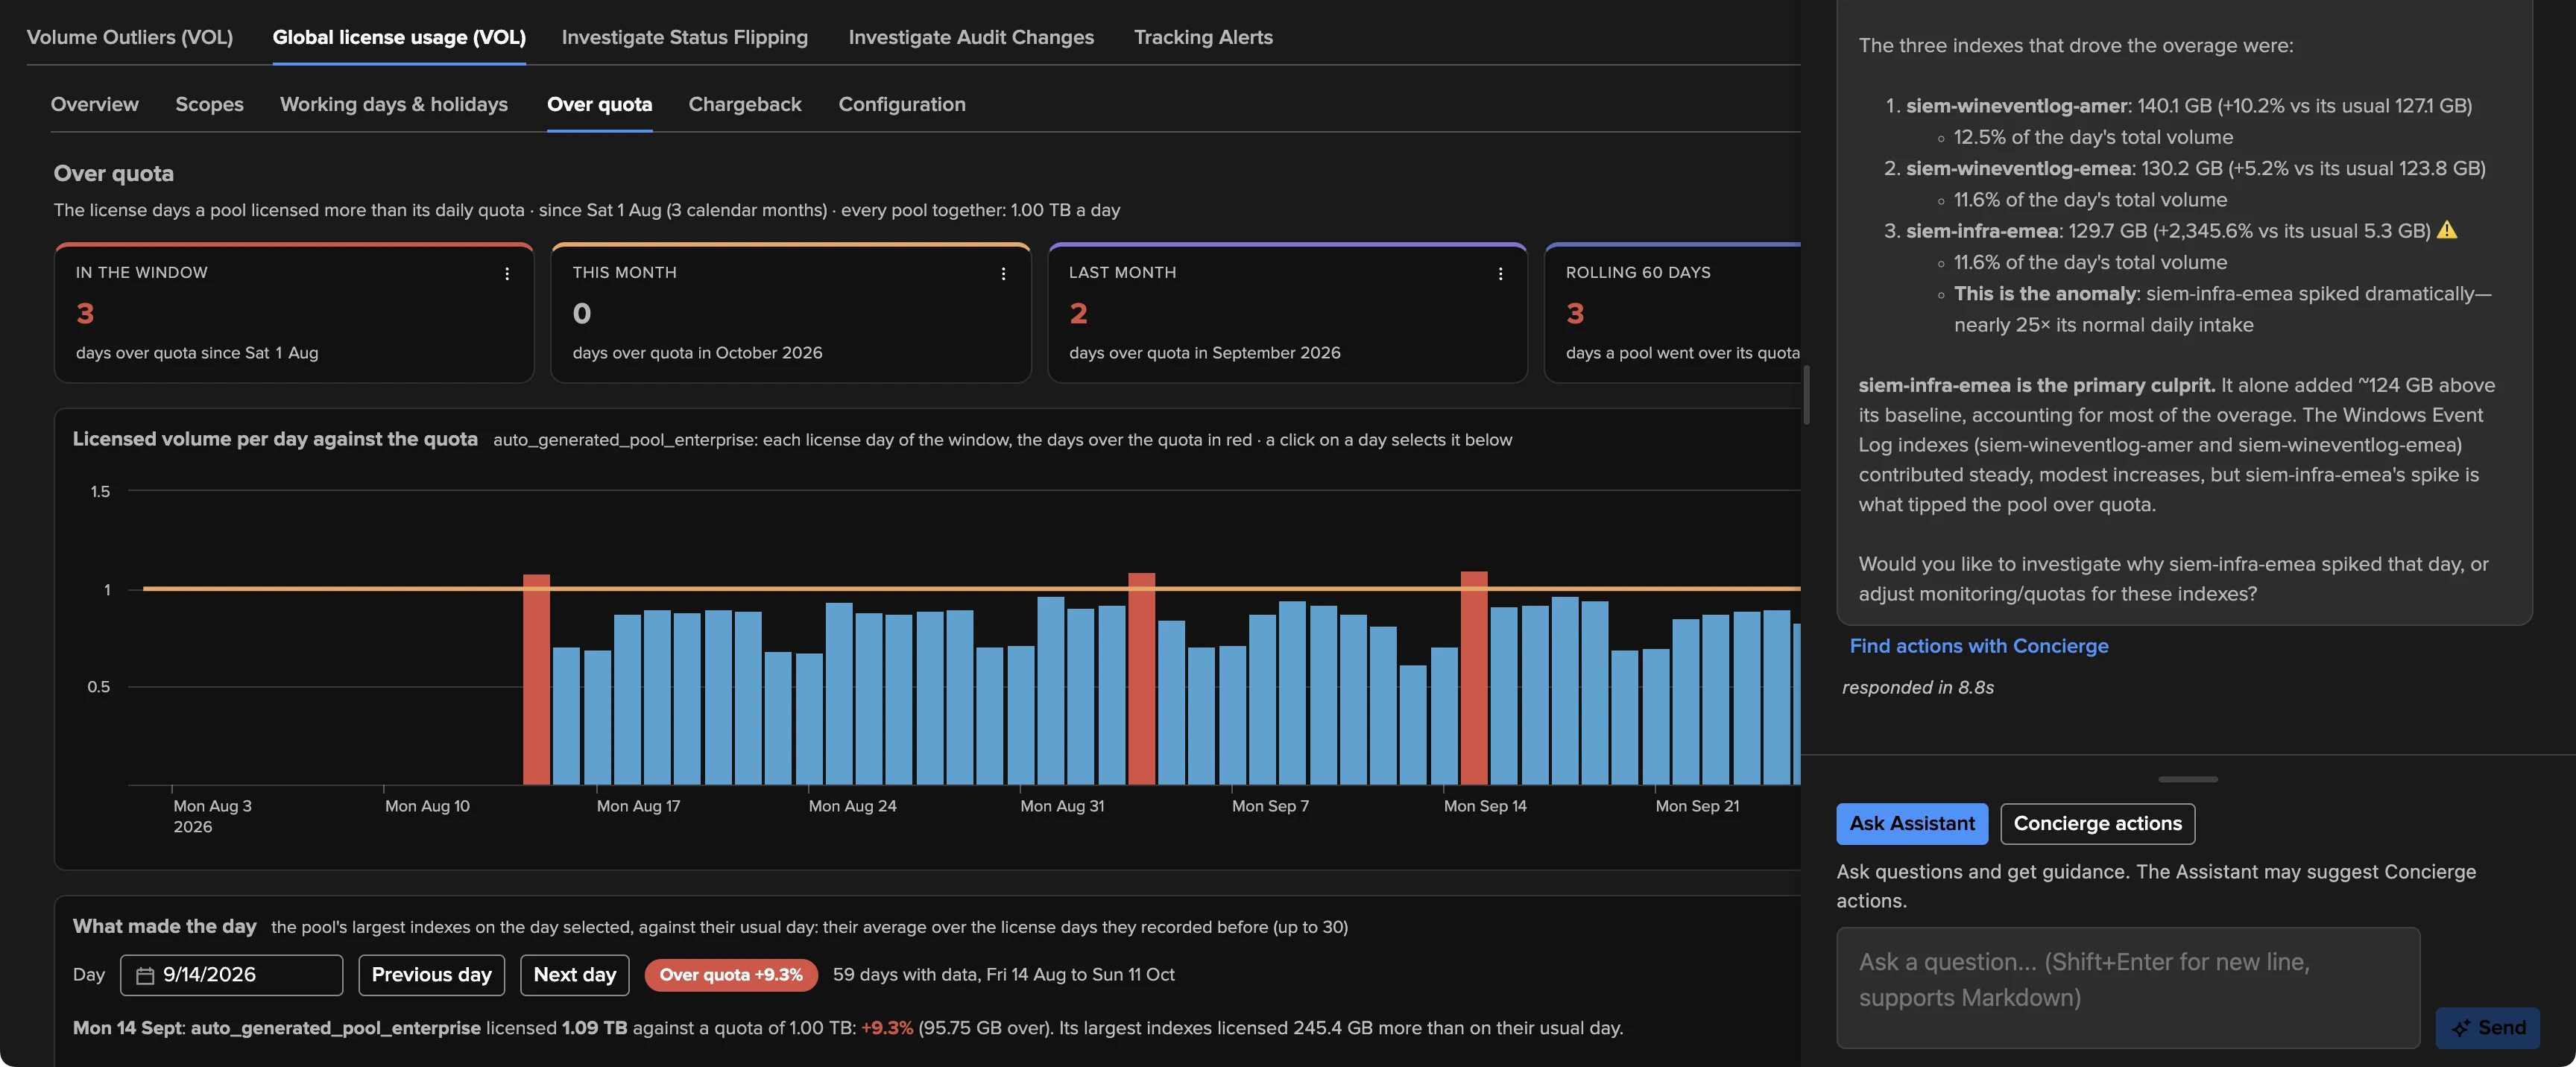
AI Assistant on the license view
While the Global license usage tab is open, the Tenant Home AI Assistant works on this view: it knows the view, its configuration and the figures of the sub-tab on screen (the period, the day selected in Over quota, the statement month…), offers suggested questions per sub-tab, and keeps one conversation across sub-tabs.
With your consent it can change the configuration through the Concierge: add, change, remove or reorder scopes and cost centres, set the costs, record a price change or edit the price history, set the working days, set or clear a pool’s quota, enable the chargeback. Each change is applied to the latest saved configuration, audited, and the view reloads it (an unsaved draft of your own is kept). The same permissions apply as in the page.
Known limits
As deep as the recorded history: live collection plus backfill, up to 400 days within the retention of the license usage log. The movers need 14 recorded days, a month projection 7 closed days per index.
Past days are measured against today’s quota (there is no quota history).
Statements follow the current cost centres and prices (see above).
CIM scopes read the macros of the search head TrackMe runs on.
The periods (30 / 60 / 90 days), the over-quota windows (3 / 6 / 12 months) and the chargeback depth (13 months) are fixed choices.
Alerting
VOL entities flow through stateful alerting like every component. What is VOL-specific:
The Create Alert wizard offers the
SPLK-VOLtechnical alert type (a filter onobject_category=splk-vol); the outliers trigger stays on by default, the outliers being the VOL state. VOL is selectable in the stateful email component filter and in the SLA breaches alert.Stateful alert emails embed the rolling volume charts (24 h / 12 h / 4 h / 60 min over the alert’s chart window), the outliers chart of each model, and a daily licensed volume bar chart over the last 30 license days.
AI status reports run the ML outliers investigation for the index.
Auto-acknowledgment, notable events, the free-style REST call, maintenance mode, CMDB and alert enrichment (
splk_general_vol_cmdb_search,splk_general_vol_alert_enrichment_search) and the drilldown (TenantHome?component=vol&keyid=…) need nothing special.
See Alerting — in depth for the alert types and the email anatomy.
REST endpoints
Resource group splk_vol (browse it with API & tooling → TrackMe REST API Reference,
every endpoint supports describe=true):
Endpoint |
Purpose |
|---|---|
|
The VOL entity table of a tenant. |
|
One index: its figures, direction, inactivity policy in force and the entity searches. |
|
The collector state (cursor, validated history, license-manager offset, deployment type) and the backfill progress. |
|
The Global license usage context and searches ( |
|
The license view configuration with its resolved scopes, cost-centre partition,
calendars and working-days preview, and whether the caller can change it; with a
|
|
Save the whole configuration ( |
|
Targeted changes on the latest saved configuration ( |
|
The detection direction of one or more indexes ( |
|
The inactivity policy of one or more indexes: |
|
|
|
The generic entity operations, as for every component. |
|
The tenant inactivity policy (dispatches the tracker so the indexes apply it within a
minute); read it in the |
|
The default outliers KPIs, with the opt-in reconcile of the existing indexes. |
The tenant is created with tenant_vol_enabled (see Creating a tenant); every
vol_* option below can be set in the same call.
Tenant options
Stored in the tenant’s vtenant_account and editable from Configure tenant:
Option |
Default |
Meaning |
|---|---|---|
|
|
This Splunk, or the remote account the license usage is collected from. |
|
|
The license search constraint (advanced, see above). |
|
|
Settle margin (60–3600 s) before a 5-minute bucket is read. |
|
|
Days of history replayed at creation (0 disables, max 400). |
|
|
Default detection direction of new indexes: |
|
|
The rolling KPIs every new index gets a model on. |
|
|
Minimum history before a model’s confidence is normal (the wizard’s value on a VOL tenant; the system default is 30). |
|
every priority |
Priorities in scope for outliers. |
|
empty |
Filter expression restricting the indexes in scope. |
|
|
The tenant inactivity policy shape. |
|
|
Static policy threshold (7 days). |
|
working hours |
Variable policy slots (Mon–Fri 08:00–19:59 at 1 day). |
|
|
Variable policy threshold outside every slot (7 days). |
|
|
Impact score of an inactive index. |
The Global license usage configuration (scopes, working days, quotas, costs, chargeback) is
not a tenant option: it lives in its own document, edited in the view’s Configuration
sub-tab or through vol_license_config_update / vol_license_config_patch.
Metrics
Written to the tenant’s metric index under trackme.splk.vol.*
(object_category=splk-vol, dimensions tenant_id, object, object_id):
Metric |
Meaning |
Unit |
|---|---|---|
|
Licensed volume of the 5-minute bucket (the base series; the hourly profile is
|
MB |
|
Rolling volume ending at the bucket end — the outliers inputs. |
MB |
|
Share of the license pool over the last 24 hours (Splunk Enterprise only). |
percent |
|
Licensed volume of a closed license day, stamped mid-day. |
MB |
|
Decision-maker status. |
status code |
Every point costs 150 bytes of metric-index licensing: about 288 buckets × 5 measures per index per day live (≈ 216 KB per index per day); the backfill writes the same series over the requested depth, and the wizard shows that estimate before you confirm.
The entity searches (Open in Search on every chart) read those metrics:
| mstats latest(trackme.splk.vol.daily_volume_mb) as daily_volume_mb
    where index=<metric_index> tenant_id="<tenant>" object="<index>" span=1d
| timechart first(daily_volume_mb) as daily_volume_mb span=1d
| eval daily_volume_gb=round(daily_volume_mb/1024, 3)
Troubleshooting
Symptom |
What to check |
|---|---|
The tracker succeeds but the tenant has no entity |
The license search returns no |
The daily chart shows no bar, or a bar a day early |
No closed license day yet (a day sits mid-day; the entity overview chart carries its own 30-day window) — or your Splunk user’s time zone differs from the license manager’s: the daily point is placed on its license date, check the user preferences. |
Every index turned red at once |
Inactivity in force: the collection stopped (a failed usage search, the tracker disabled, a remote account failing) — the Manage: volume collection screen shows the cursor; the execution summary shows the run errors. Fix the source, the next run catches up 6 hours at a time. |
No projection on the Volume & cost tab |
Fewer than 7 closed license days, or the backfill has not merged its days yet (wait for the plan to complete). |
The movers card says it needs 14 recorded days |
Expected on a young tenant: the week-over-week comparison needs both weeks recorded. |
A CIM scope is empty |
The |
Over quota is empty on Splunk Cloud |
A Splunk Cloud pool has no quota: set a daily quota per pool in the Daily quota configuration section. |
The Chargeback tab only explains what to configure |
Costs are off, or no cost centre is defined. |
Saving the configuration is refused |
Someone saved since your draft started (reload, then reapply your change), you have no power or admin role on the tenant, or the TrackMe license is read-only. |
A backfill plan is cancelled (live_history_reset) |
The live collection re-seeded (a gap above 24 hours, a source change) while the plan was open; restart the backfill from the Manage: volume collection screen once the live cursor advances again. |
See also
VOL — Volume Outliers — the overview.
Volume outliers on the Splunk license usage with Volume Outliers (VOL) — the end-to-end walkthrough.
Outlier detection — in depth — the outliers engine reference.
Alerting & third-party integration — in depth — alert types and emails.
Metrics reference — the TrackMe metrics catalogue.