Product introduction
What TrackMe is and what it watches, from your data to the licensed volume, the people and the Cribl pipelines around it; the two ways of watching — entities and findings — how it decides and how it tells you: the vocabulary and the mental model before the live product.
about 25 minutes · 26 slides. Each slide is followed by a description of what it shows — read top to bottom, this page is the walkthrough.
Overview
This introduction sets the vocabulary and the mental model of TrackMe 2.4.19. Everything here maps one to one to the Product Guide on docs.trackme-solutions.com. TrackMe started with the data — is it arriving, is it good — and 2.4.19 covers the platform around it too: the licensed volume of every index, the people and service accounts using Splunk, and the Cribl pipelines in front of it.
What breaks silently
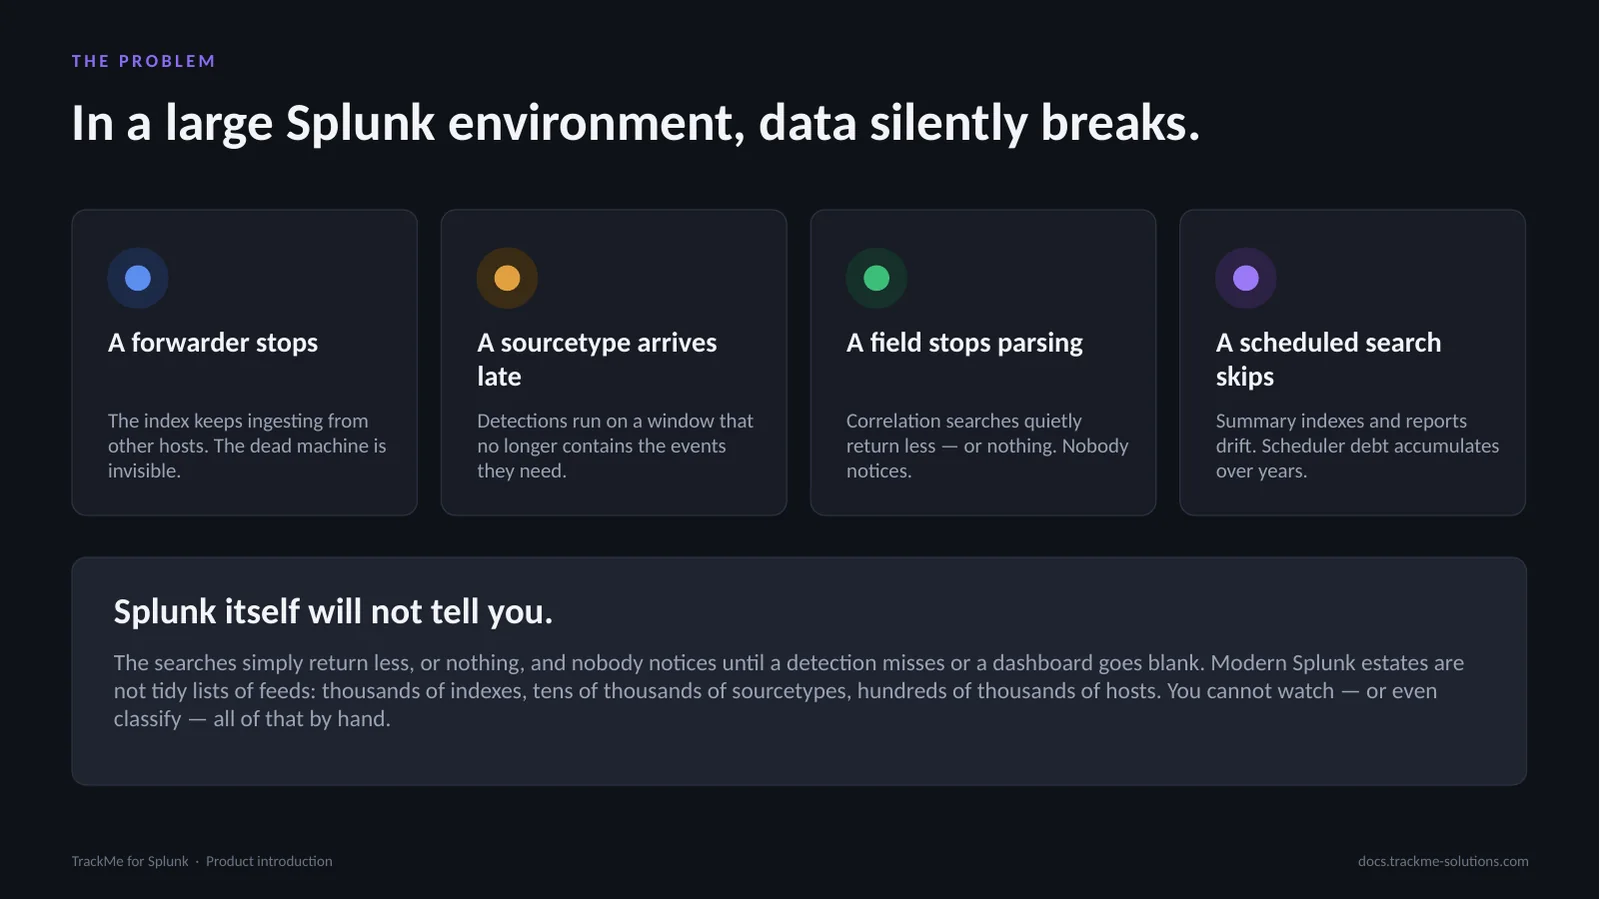
Most teams come to TrackMe because of one specific pain: a critical feed died hours ago and nobody noticed; a host went silent while the index still looked busy; a field extraction drifted and a detection stopped firing; scheduled searches started skipping. And the platform around the data fails just as quietly: an index doubling its licensed volume, an account running all-time searches on a schedule nobody owns, a Cribl Destination in backpressure in front of Splunk. One root cause: Splunk does not monitor itself, and you cannot watch or classify all of it by hand.
What TrackMe is
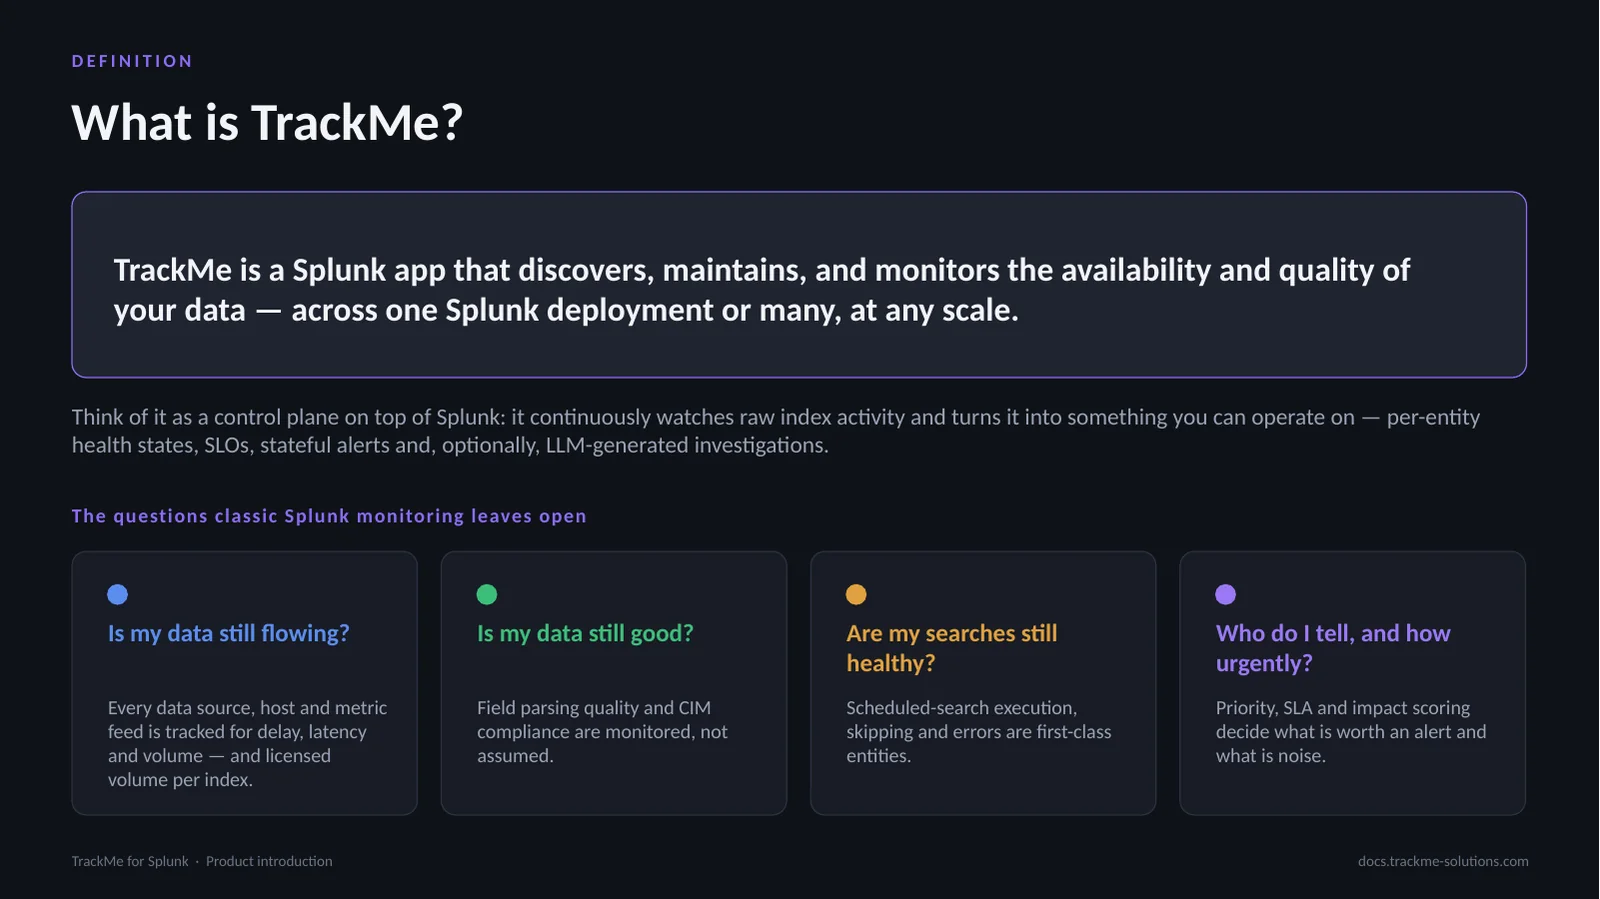
One sentence: TrackMe discovers, maintains and monitors the availability and quality of your data. It is a control plane on top of Splunk that runs entirely inside Splunk — on-premises, Splunk Cloud or hybrid — with no outbound SaaS. It answers the questions classic Splunk monitoring leaves open, from the data itself to the platform around it, and decides who to tell. Who it is for: Splunk administrators proving the platform is healthy, SOC and detection engineers who depend on complete, well-parsed data, platform owners who answer for the licence and the usage, service owners reporting SLA attainment, and managed service providers.
The big picture
On the left, what TrackMe reads: your Splunk data, the Splunk platform itself, and Cribl. In the middle, two ways of watching. Entity monitoring is the historical core: seven components turn data feeds, hosts, metrics, the licensed volume of each index, field quality, scheduled searches and any SPL into entities with a state and an impact score. Findings monitoring is the second model, used by three dedicated tenant types — User Activity Monitoring, Cribl Stream and Cribl Edge: policies raise findings, grouped per object into Finding groups that you triage. Both live in Virtual Tenants. On the right, what you get from both: alerting and notifications, live maps in Topology Studio, the AI layer, and the REST API.
The vocabulary
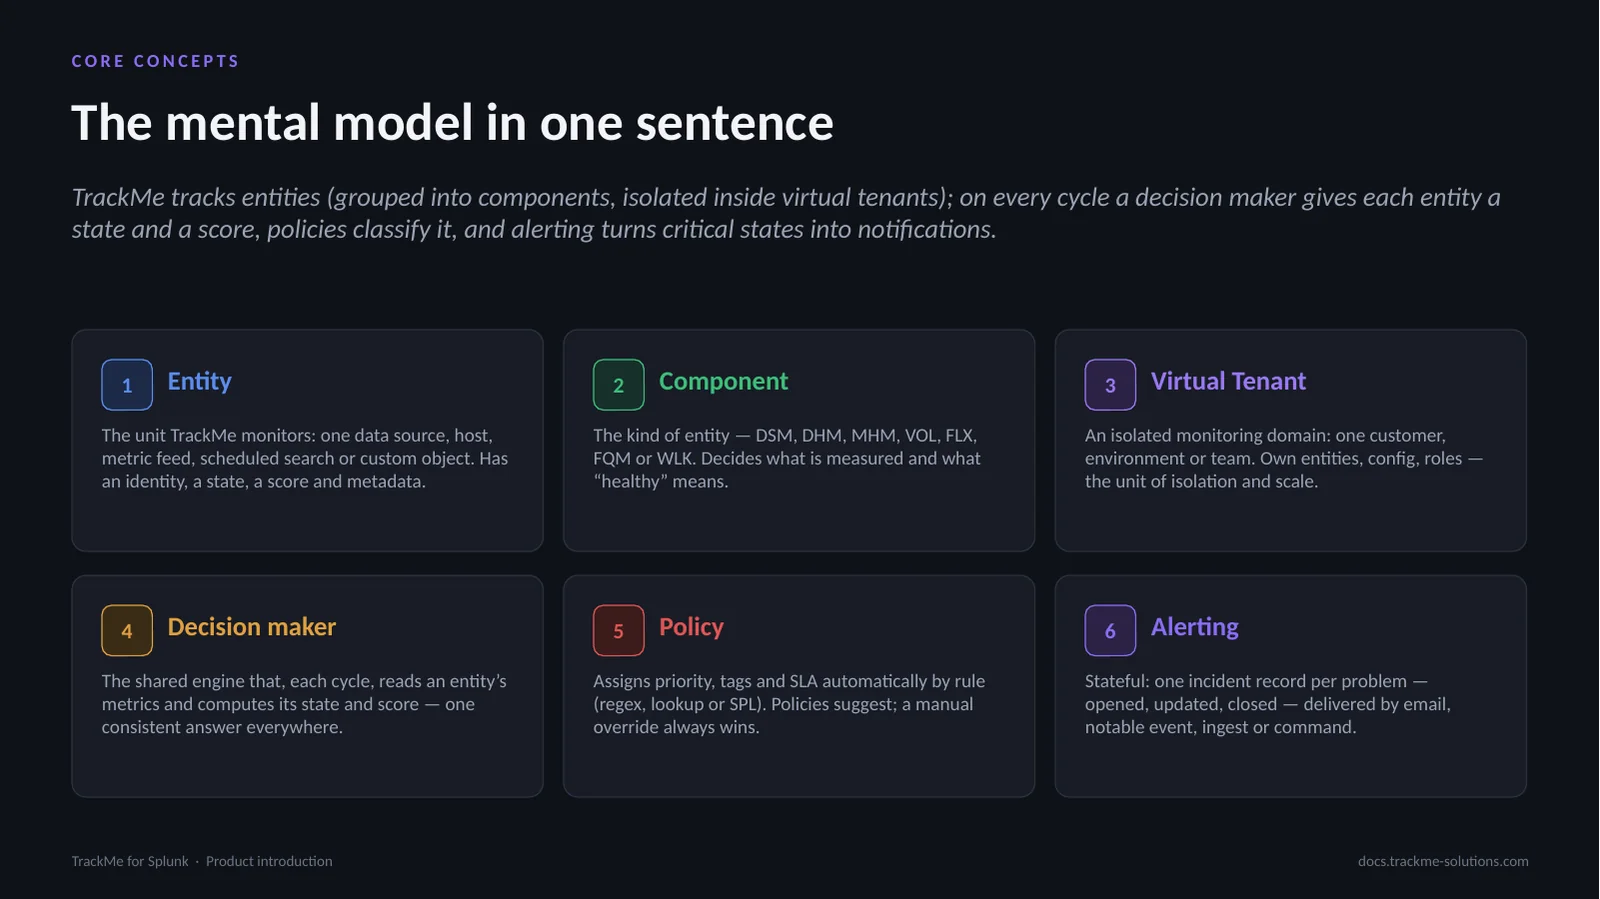
TrackMe has a small, consistent vocabulary that appears on every page of the guide and in the UI. Entity monitoring: an entity belongs to a component, lives in a virtual tenant, gets its state from the decision maker; policies classify it and alerting turns critical states into notifications. Findings monitoring adds two words: a finding, raised by a policy about one object, and the Finding group that gathers an object’s findings into one decision. There is no global list of entities: everything lives inside exactly one tenant.
What TrackMe monitors
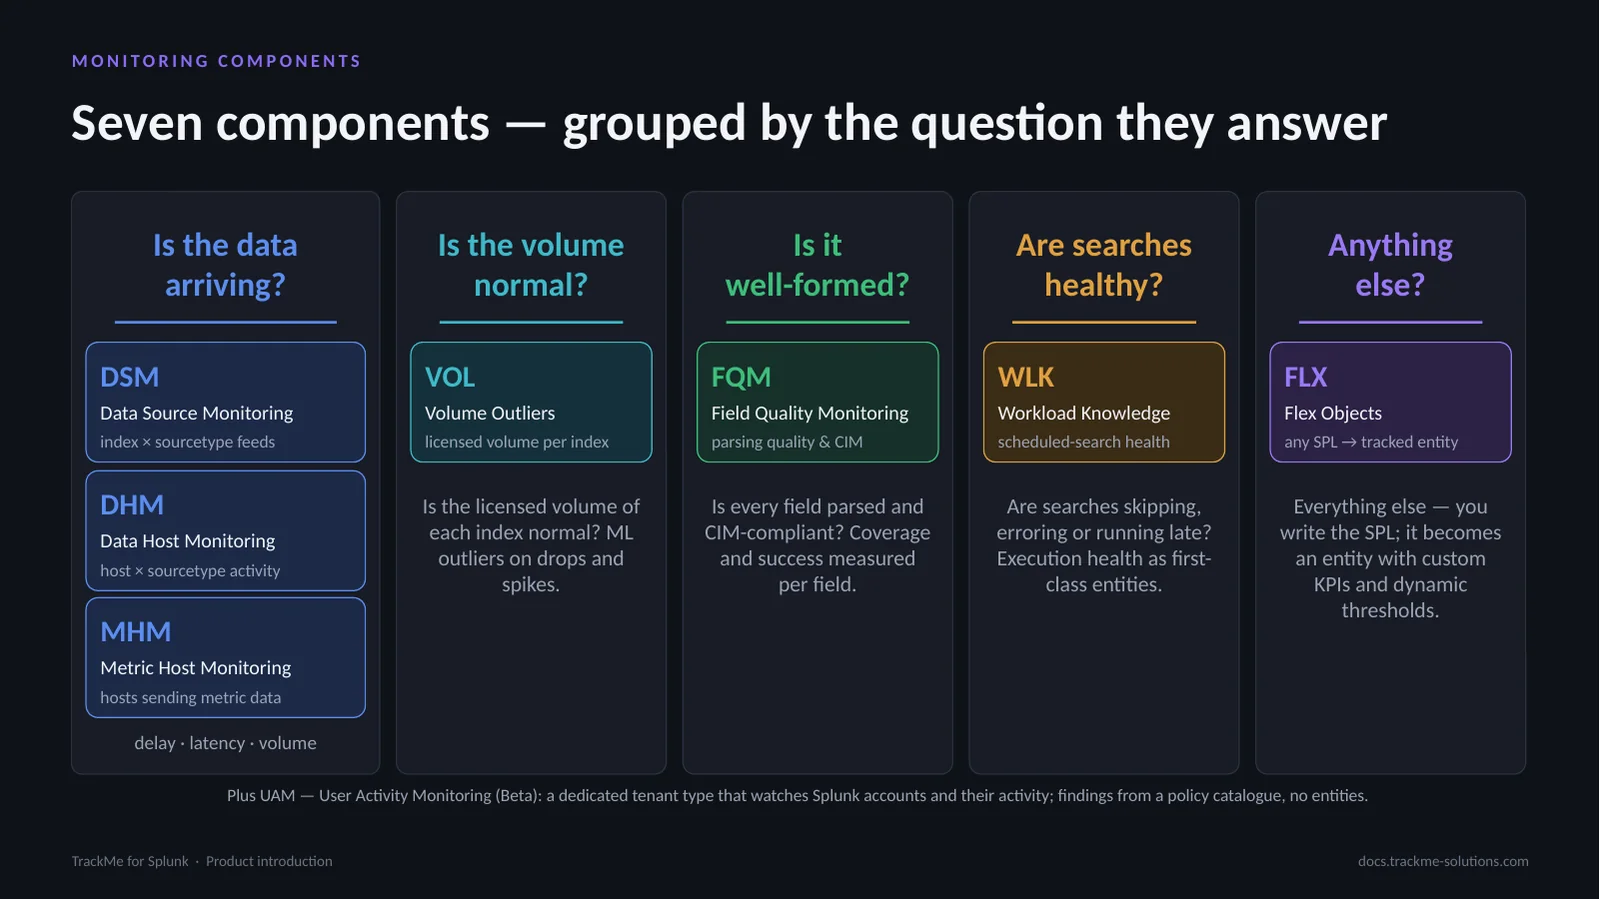
TrackMe monitors two families, grouped by the question each answers. Seven entity components: DSM, DHM and MHM answer whether the data is arriving, VOL whether the licensed volume of each index is normal, FQM whether the data is well-formed, WLK whether the scheduled searches are healthy, and FLX monitors anything else from the SPL you write.
Beside them, three dedicated tenant types raise findings and Finding groups instead of tracking entities: User Activity Monitoring answers who is doing what on Splunk, Cribl Stream whether the Cribl pipeline in front of Splunk is healthy, and Cribl Edge whether every Edge Node is where it should be. Almost every deployment starts with DSM.
One entity model
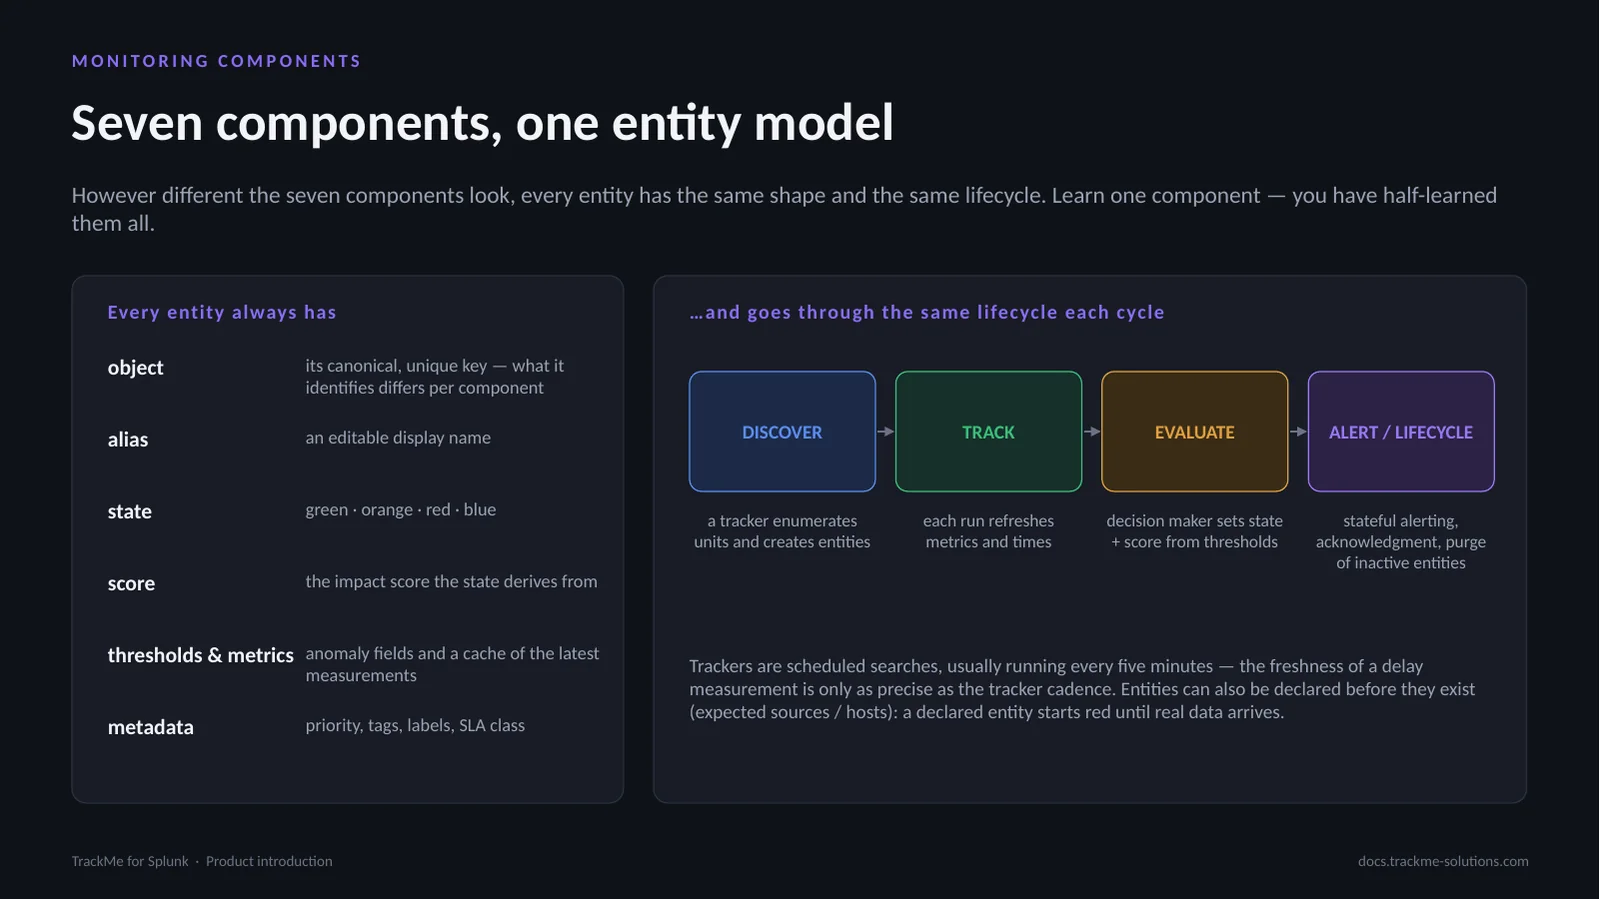
The shared entity model is what makes TrackMe consistent: the same object, alias, state and score shape, the same lifecycle. Classification, protection, stateful alerting, scoring and ML outliers are documented once and apply to all seven components. Where they differ: variable delay and lagging classes are DSM and DHM; data sampling and elastic sources are DSM; dynamic thresholds are FLX and FQM; versioning and orphan detection are WLK; VOL has one entity per index, fed incrementally from the license usage log, with ML outliers as its state.
Entity monitoring in practice
Tenant Home lists every data source the hybrid tracker discovered, already scored: the counts by state and priority on top, then the entities with their status, impact score, priority, delay and latency against their thresholds. Here several feeds are orange with a score of 48.
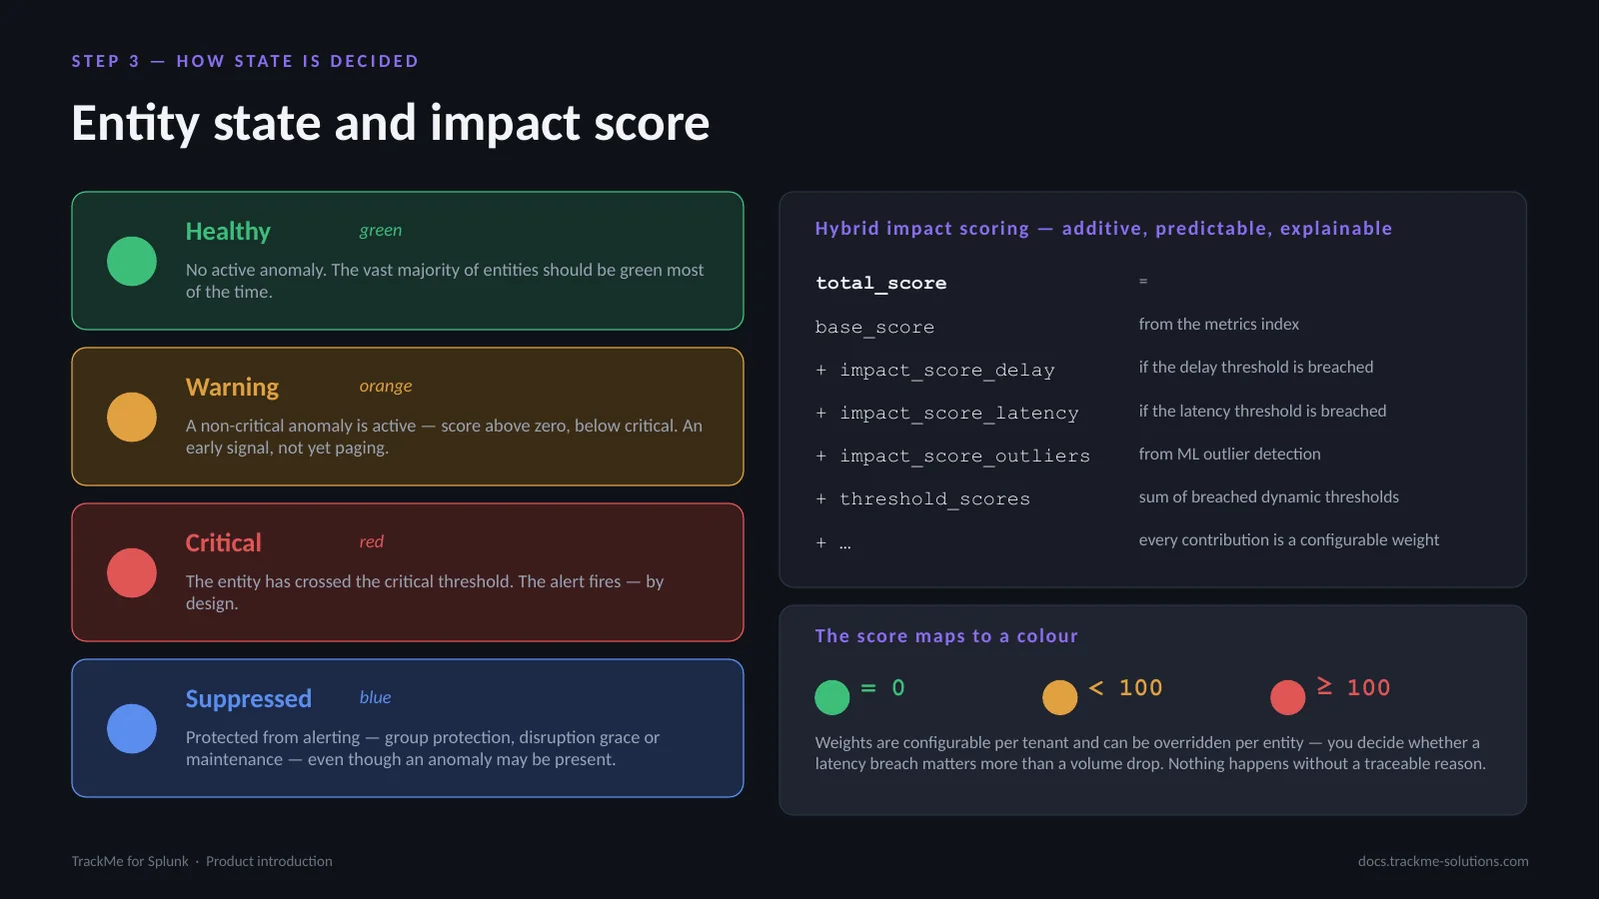
The status message of one of them explains why in plain words: its ingestion latency breached the threshold, which adds 48 to the impact score, above zero and below 100, so orange. The breakdown lists every contribution line by line: every state traces back to a measured reason and a configurable weight.
Volume Outliers
Volume detection has always been part of TrackMe — DSM volume outliers, FLX licence-usage use cases. VOL is its standardised, first-class form at scale: one entity per Splunk index, the licensed volume read incrementally from the license usage log with one search over a single source every five minutes, never a 24-hour rescan; ML outliers on drops and spikes, one model per index; trend and month projection. The Global license usage view answers the licence questions people otherwise build dashboards for: who consumes, the trend, days over quota, working-day averages, costs and chargeback. VOL is part of the Foundation edition.
The findings model
Some things are not entities with a health score: an account that runs all-time searches, a Cribl Destination in backpressure, an Edge Fleet left on an old version. For those, three dedicated tenant types — User Activity Monitoring, Cribl Stream and Cribl Edge — share one findings model. A policy evaluates a condition and raises a finding about one object, with its evidence and a severity on the TrackMe scale from Informational to Critical. All findings about one object form a Finding group: one status, one assignee, one severity, one notification thread. Findings recover by themselves when the condition clears; a person decides the rest. It also brings assignment rules, webhooks and notifications; all three add the AI Agent.
User Activity Monitoring
User Activity Monitoring is a dedicated tenant type for one indexing layer seen through one to ten search head tiers. The Findings tab groups the findings about an account and the saved searches it owns into one Finding group; the account view in front shows one person’s activity over the last 24 hours, its executions by search type, run time and the apps used, next to the catalogs of what the account owns.
Twelve built-in policies and custom policies in SPL raise the findings. UAM can email the account concerned, and the UAM AI Agent reviews findings on demand or on a schedule. It never changes anything on the platform.
Cribl Stream
A Cribl Stream tenant watches one Cribl Stream deployment end to end, from the metrics the Workers already send to a Splunk metric index and from the Leader API, read-only within a shared request budget. On the left, the Worker topology of a self-managed deployment, each Worker with its CPU and memory, live. On the right, a traffic ML model of a Route: what it learned over two weeks, its expected band and the spikes above it.
Sixteen built-in policies raise findings: backpressure, reported health, Pipeline errors, Workers that stop or drift. The Cribl Stream AI Agent reviews findings from checked facts. TrackMe never changes anything in Cribl.
Cribl Edge
A Cribl Edge tenant follows the Fleets of one Cribl Edge Leader, the Edge Nodes enrolled in them and the Sources and Destinations they run. It reads the Leader’s node directory in bulk, so its cost does not grow with one call per node and there is no node limit. Fleets are judged as a share of their nodes: one laptop going to sleep opens nothing, a fifth of a Fleet dropping does. Version drift after a rollout, configuration drift after a deploy, failing inputs and outputs and full disks become findings. Any node opens with its system activity read live through the Leader. Edge has no machine learning by design; its AI Agent reviews the findings.
Virtual Tenants
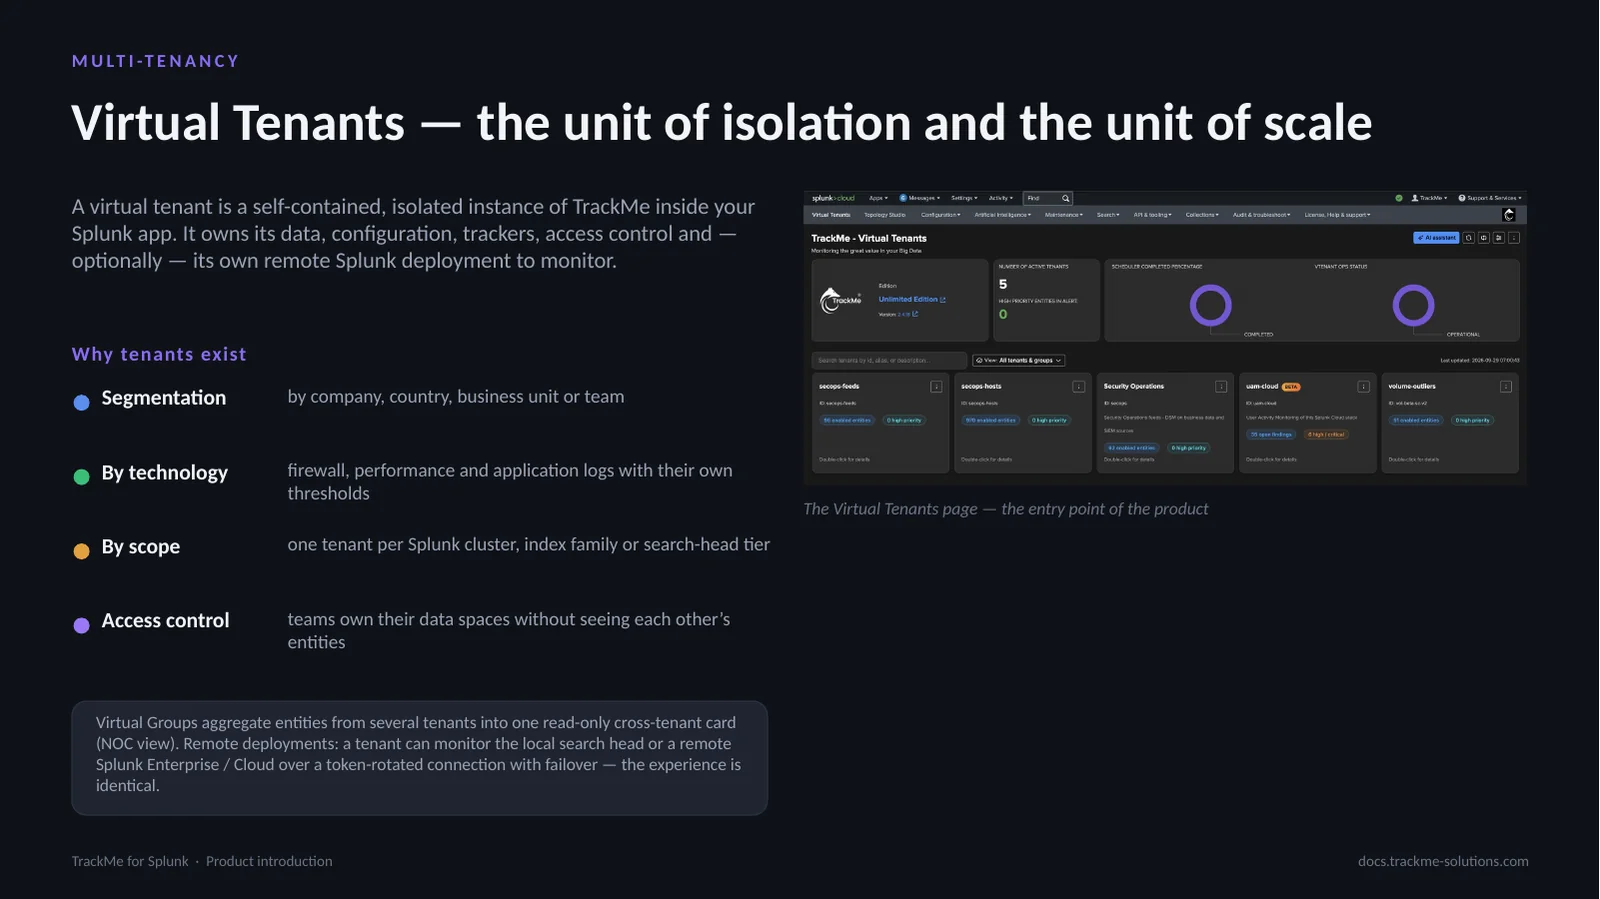
A single flat monitoring space does not survive contact with a real Splunk estate. Tenants carve the estate into domains that match how the organisation works. Everything — entities or findings, policies, thresholds, alerts — is scoped to a tenant. An entity tenant enables one or more components: splk-feeds for DSM, DHM and MHM, splk-vol, splk-wlk, splk-flx, splk-fqm. User Activity Monitoring, Cribl Stream and Cribl Edge are dedicated tenant types. RBAC is per tenant through Splunk roles, Virtual Groups aggregate several tenants into one read-only card, and Saved Views let a team land on its own tenants.
The monitoring cycle
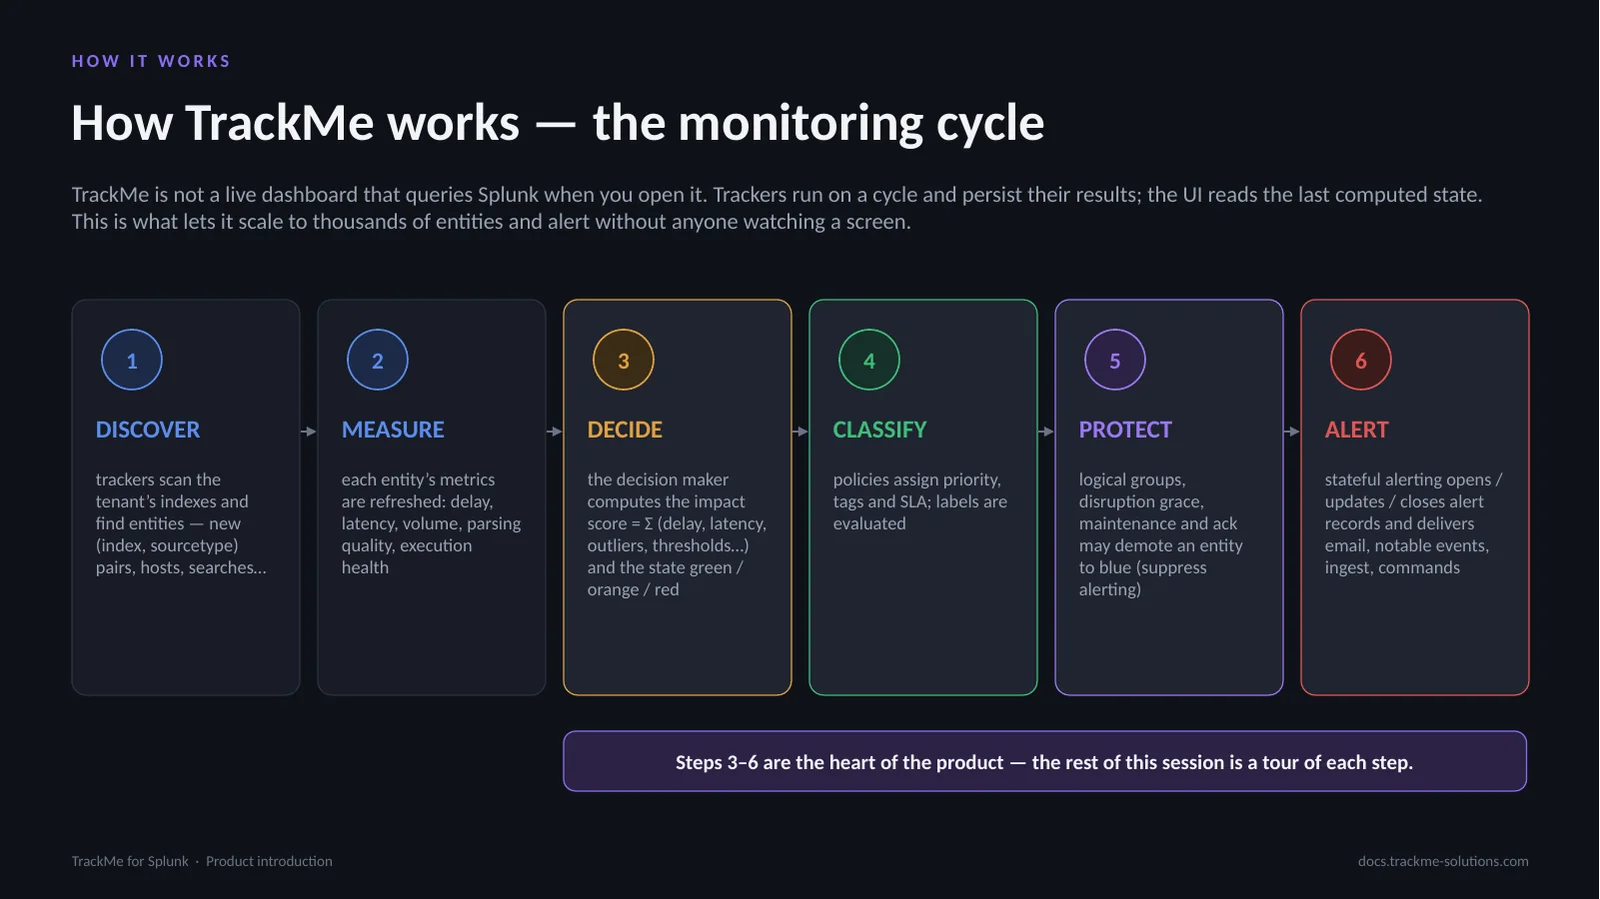
Each cycle, for every tenant: discover, measure, decide, classify, protect, alert. The deliberate separation between what state an entity is in, step 3, and whether to tell you, steps 5 and 6, is why TrackMe is quiet in practice despite tracking so much. Findings tenants run the same idea with their own jobs: collect, evaluate the policies, raise or recover findings, notify. Trackers are scheduled searches, typically every five minutes.
State and impact score
Every cycle each entity gets one of four colours. The state derives from a numeric impact score: TrackMe adds up everything currently wrong with an entity into one total score — 0 is green, below 100 orange, 100 and above red. Because every contribution is a number with a configurable weight, you control exactly what makes an entity critical: one major breach trips red, several small ones accumulate. Blue is not a fifth severity — it means “I see this, but I am not waking you up”.
Classification and protection
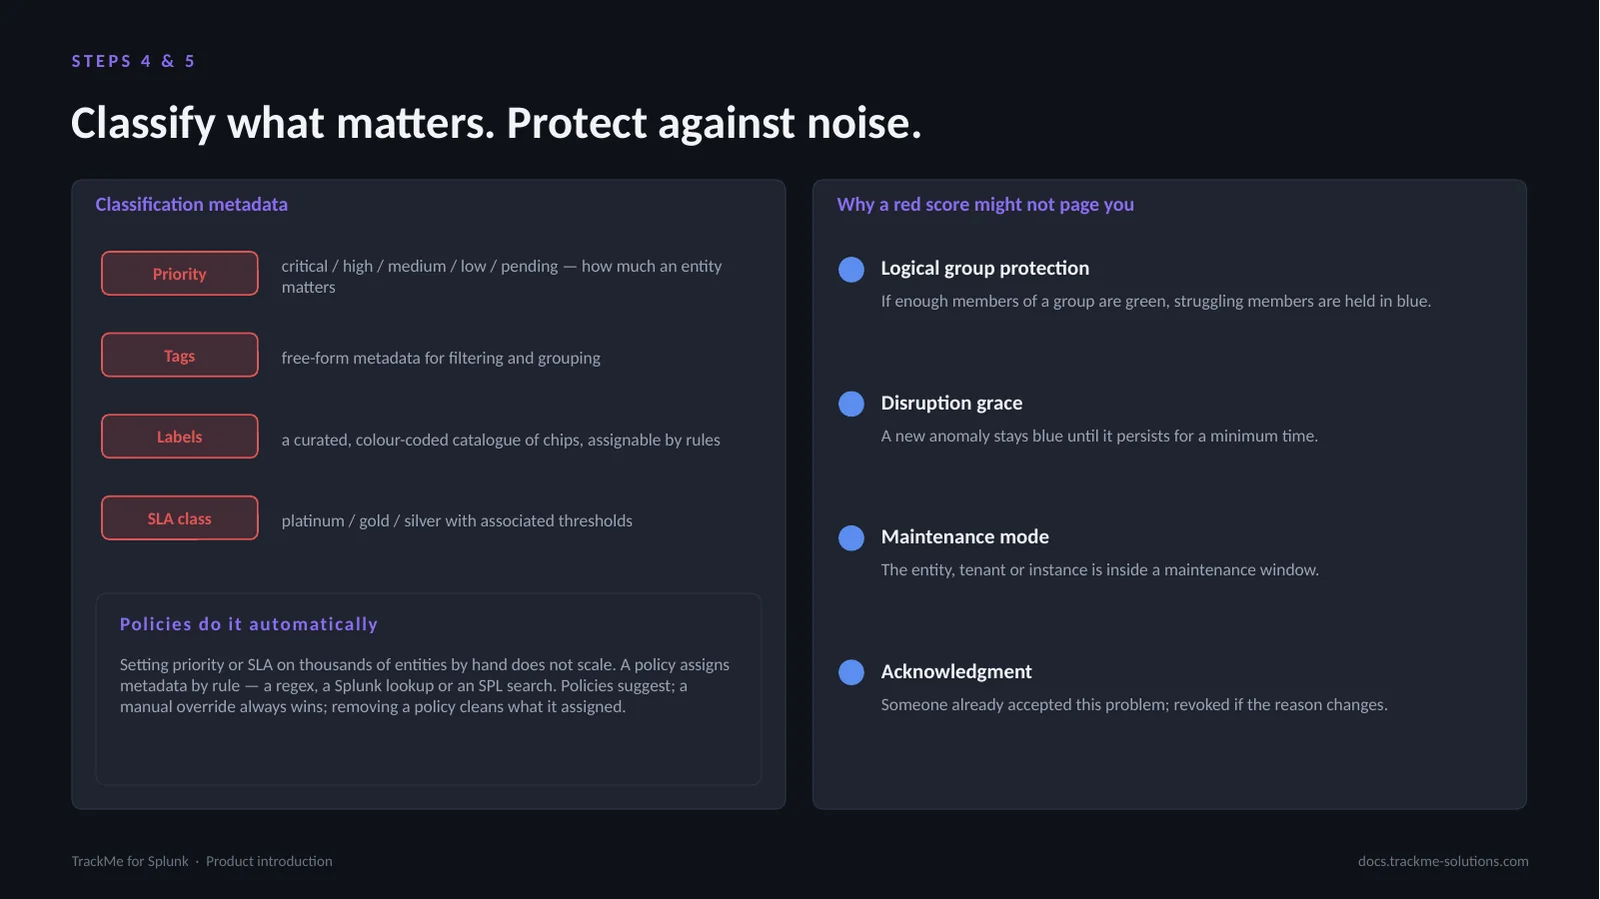
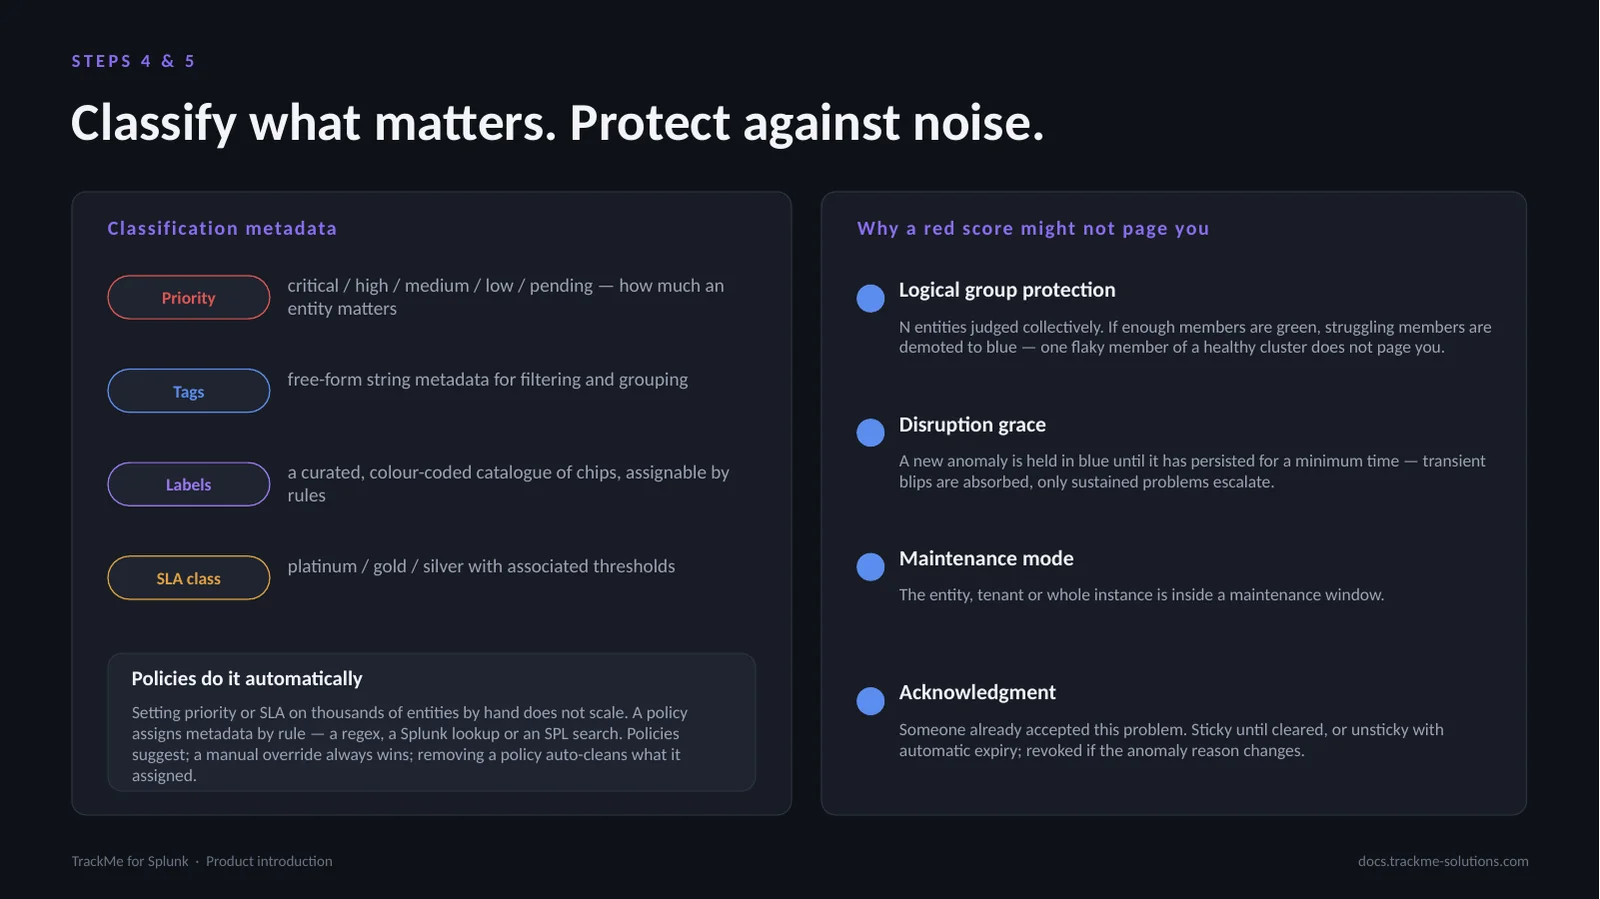
Step 4, classification: priority, tags, labels and SLA are the four kinds of metadata attached to entities. Tags are free-form strings, labels come from a managed coloured catalogue. Three policy families assign them by rule — priority, tags and SLA. Step 5, protection: four mechanisms can hold an entity in blue instead of red. This separation between what state and whether to tell you is deliberate.
Stateful alerting
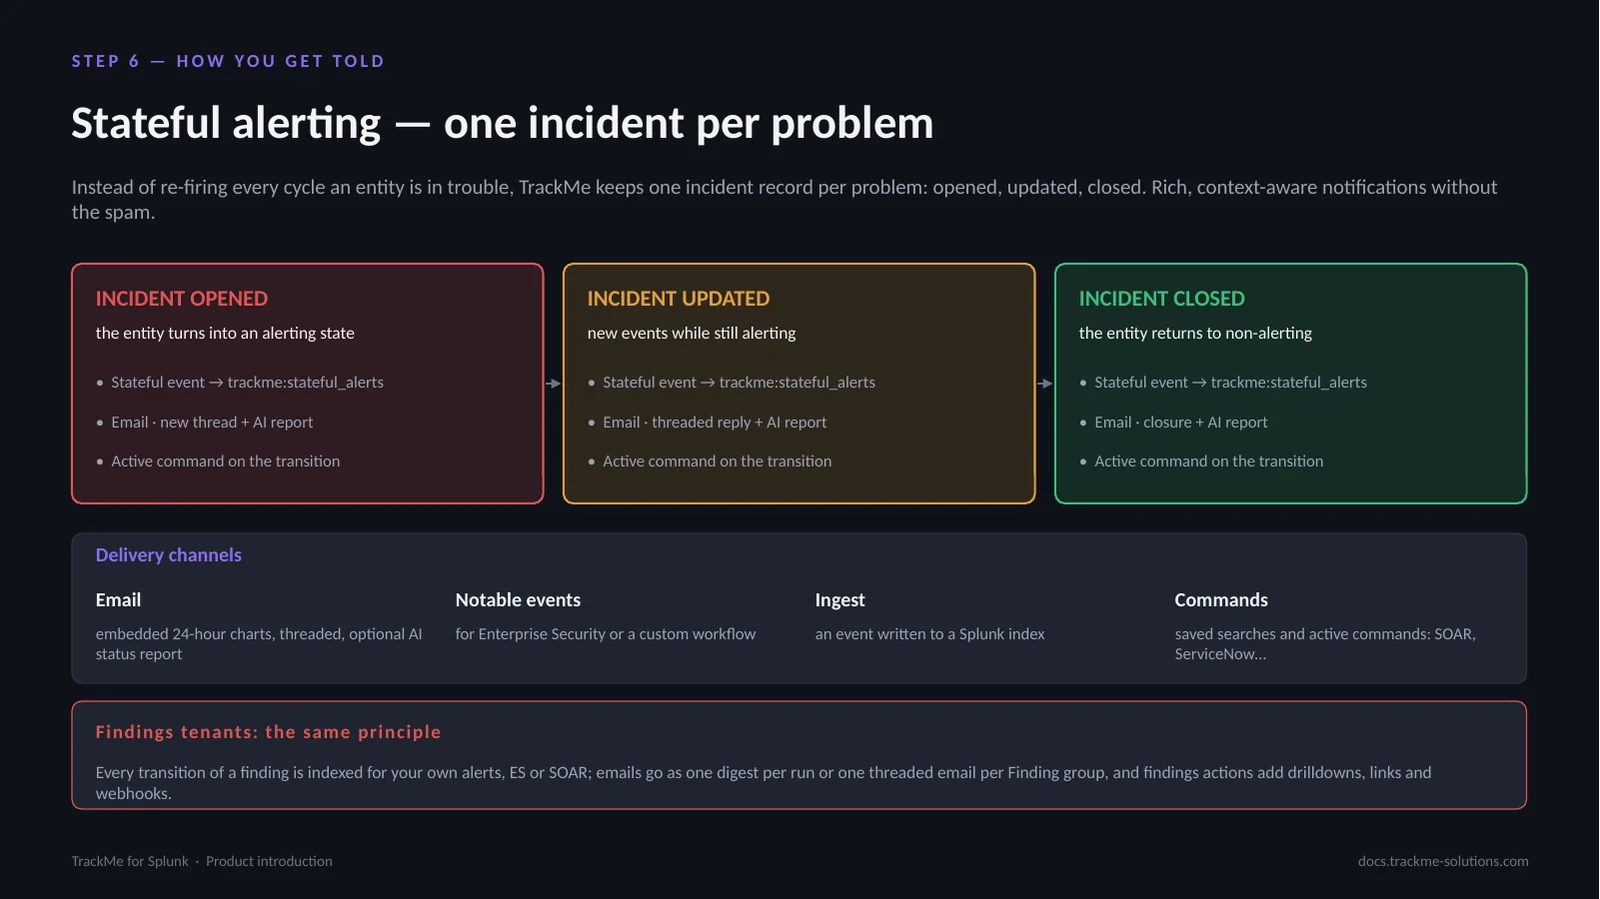
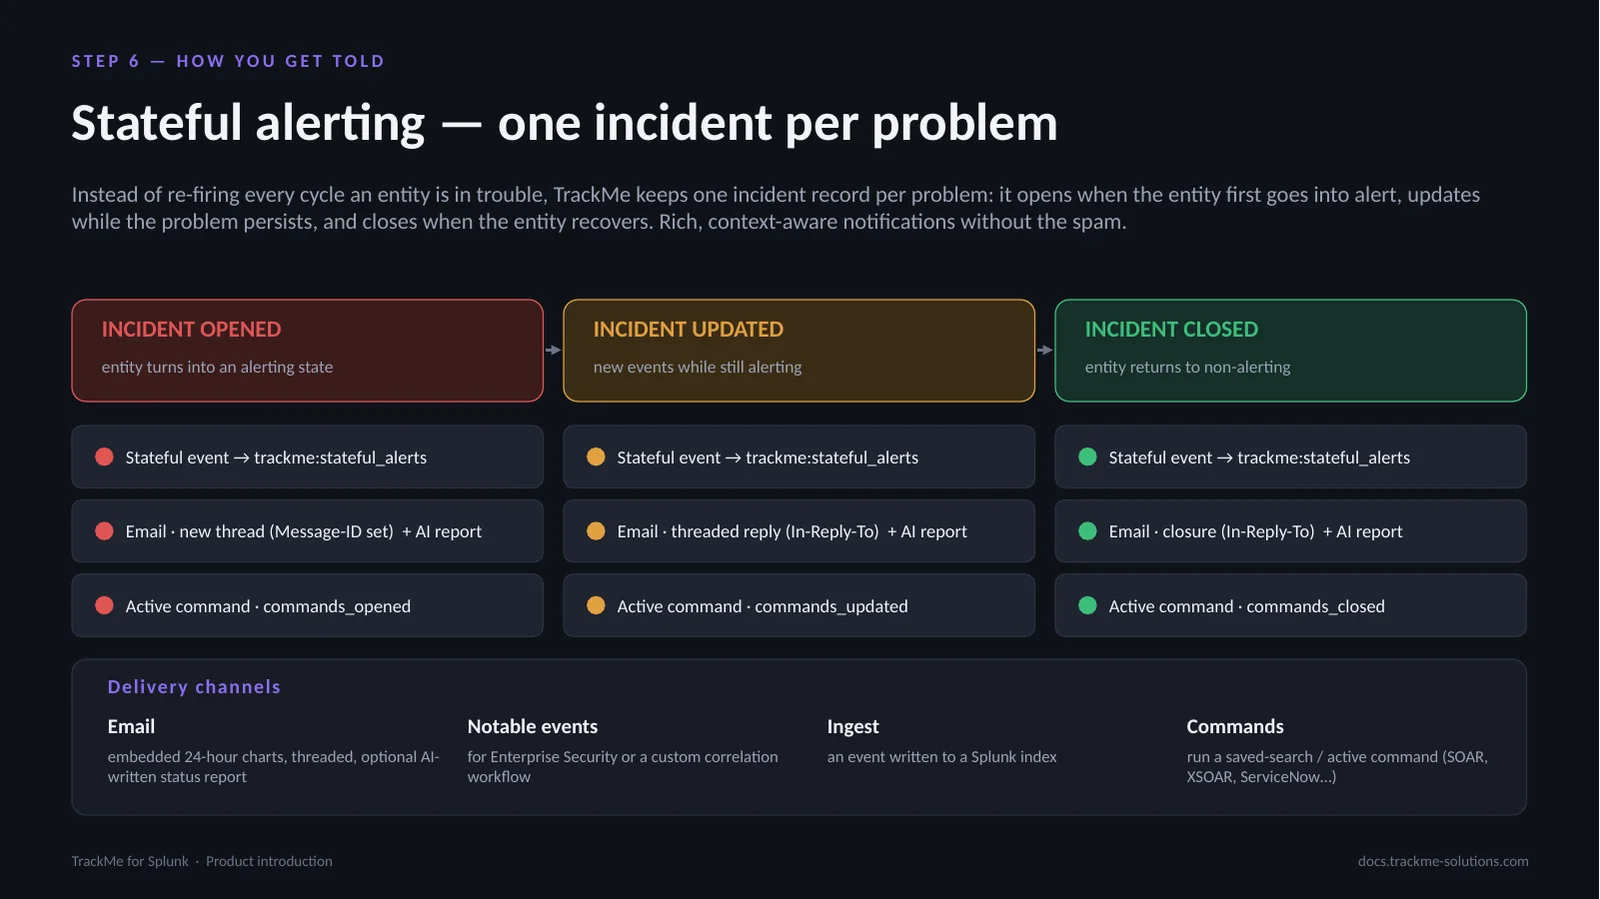
Instead of re-firing every cycle, TrackMe keeps one incident record per problem: it opens when the entity first goes into alert, updates while the problem persists, and closes when the entity recovers. On those transitions it can deliver an email with embedded charts and optionally an AI-written status report, write a notable event, ingest an event and run a command. Findings tenants follow the same principle: every transition of a finding is indexed, and email notifications go one per run or one thread per Finding group.
Topology Studio
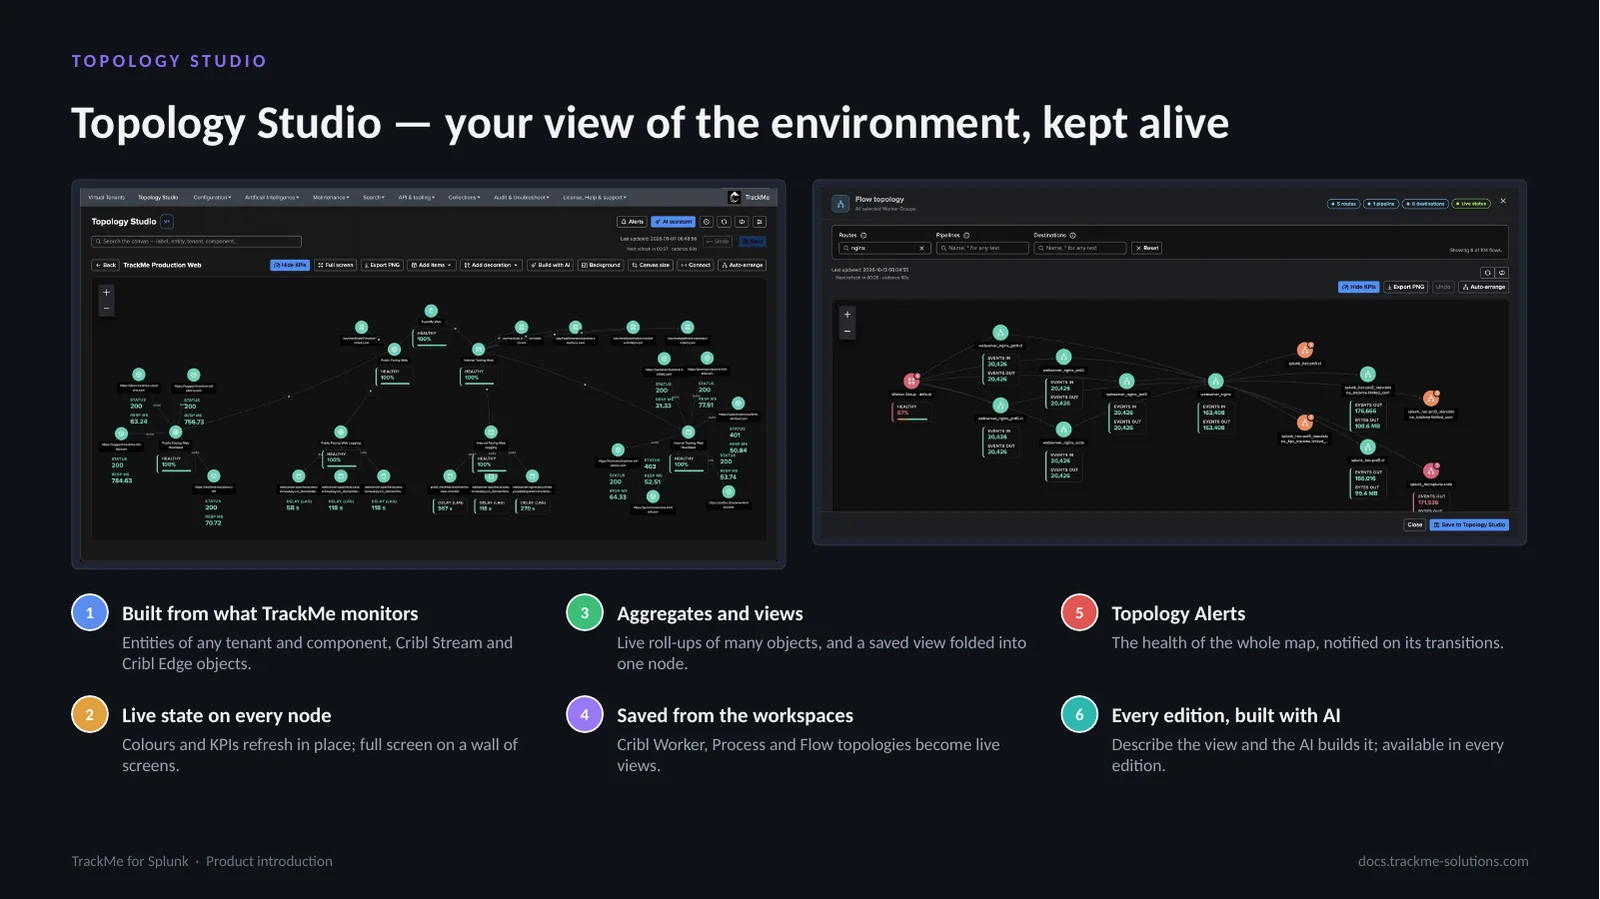
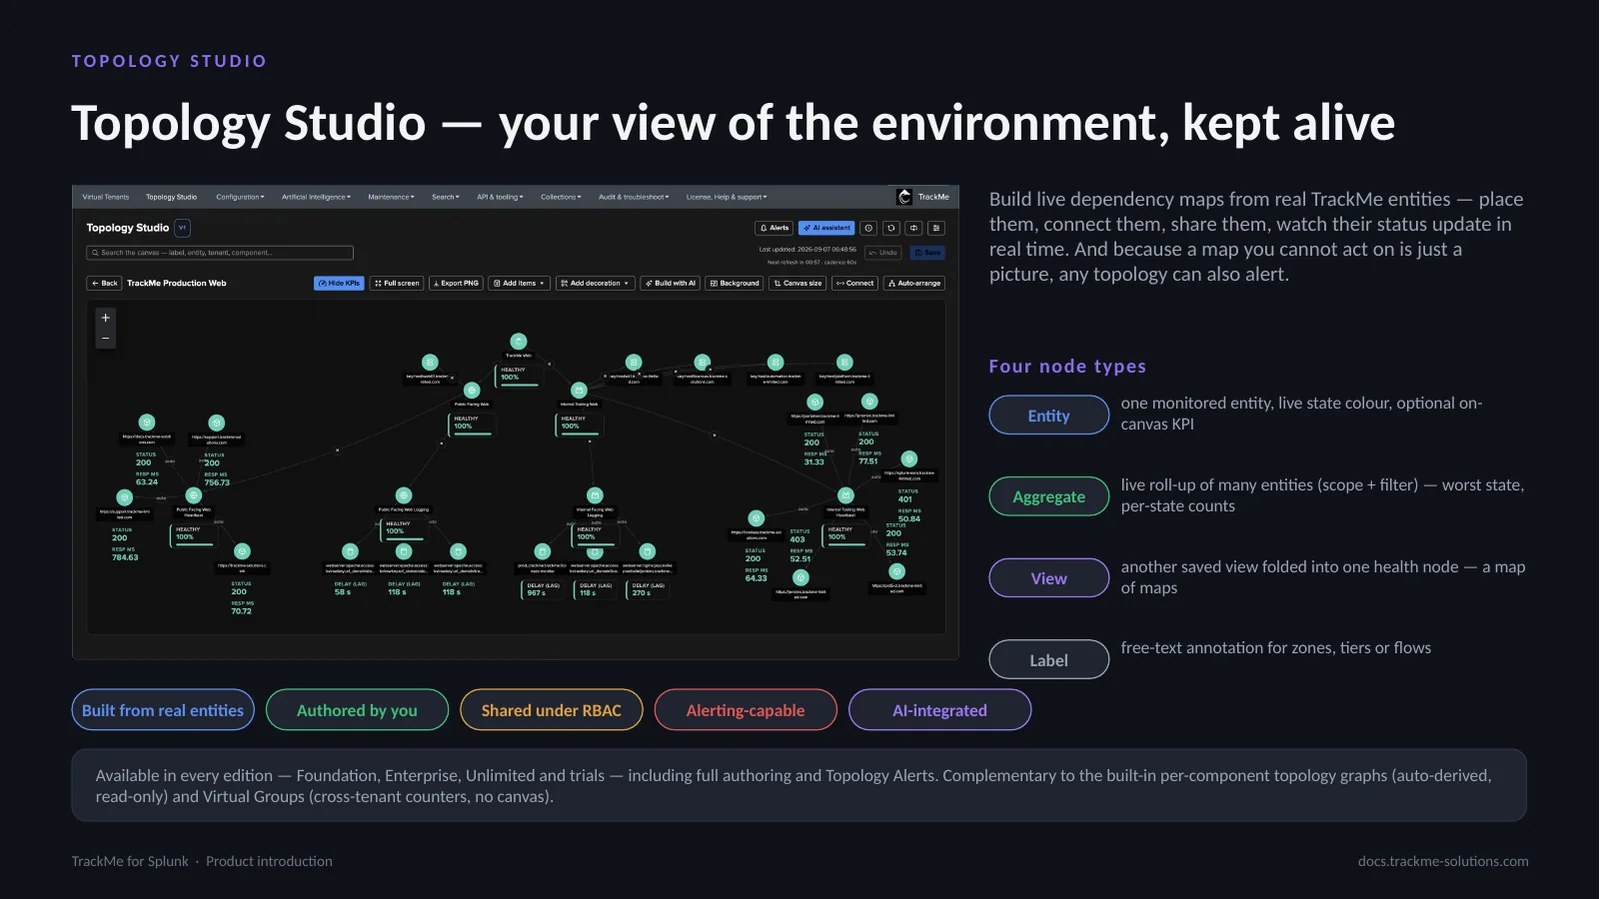
Topology Studio is the canvas for a view of the environment: a payment flow, a data centre, an ingestion pipeline, a business service. On the left, a map of web services built from TrackMe entities, feeds, hosts and heartbeat checks, with their live state and KPIs. On the right, the flow topology of a Cribl Stream deployment filtered on its nginx Routes, with three Destinations coloured by their findings, ready to save as a live view.
Views are shared under RBAC, aggregates roll many objects into one node, Topology Alerts notify on the health of a whole map, and the AI Assistant can build a view from a sentence. Available in every edition.
The AI layer
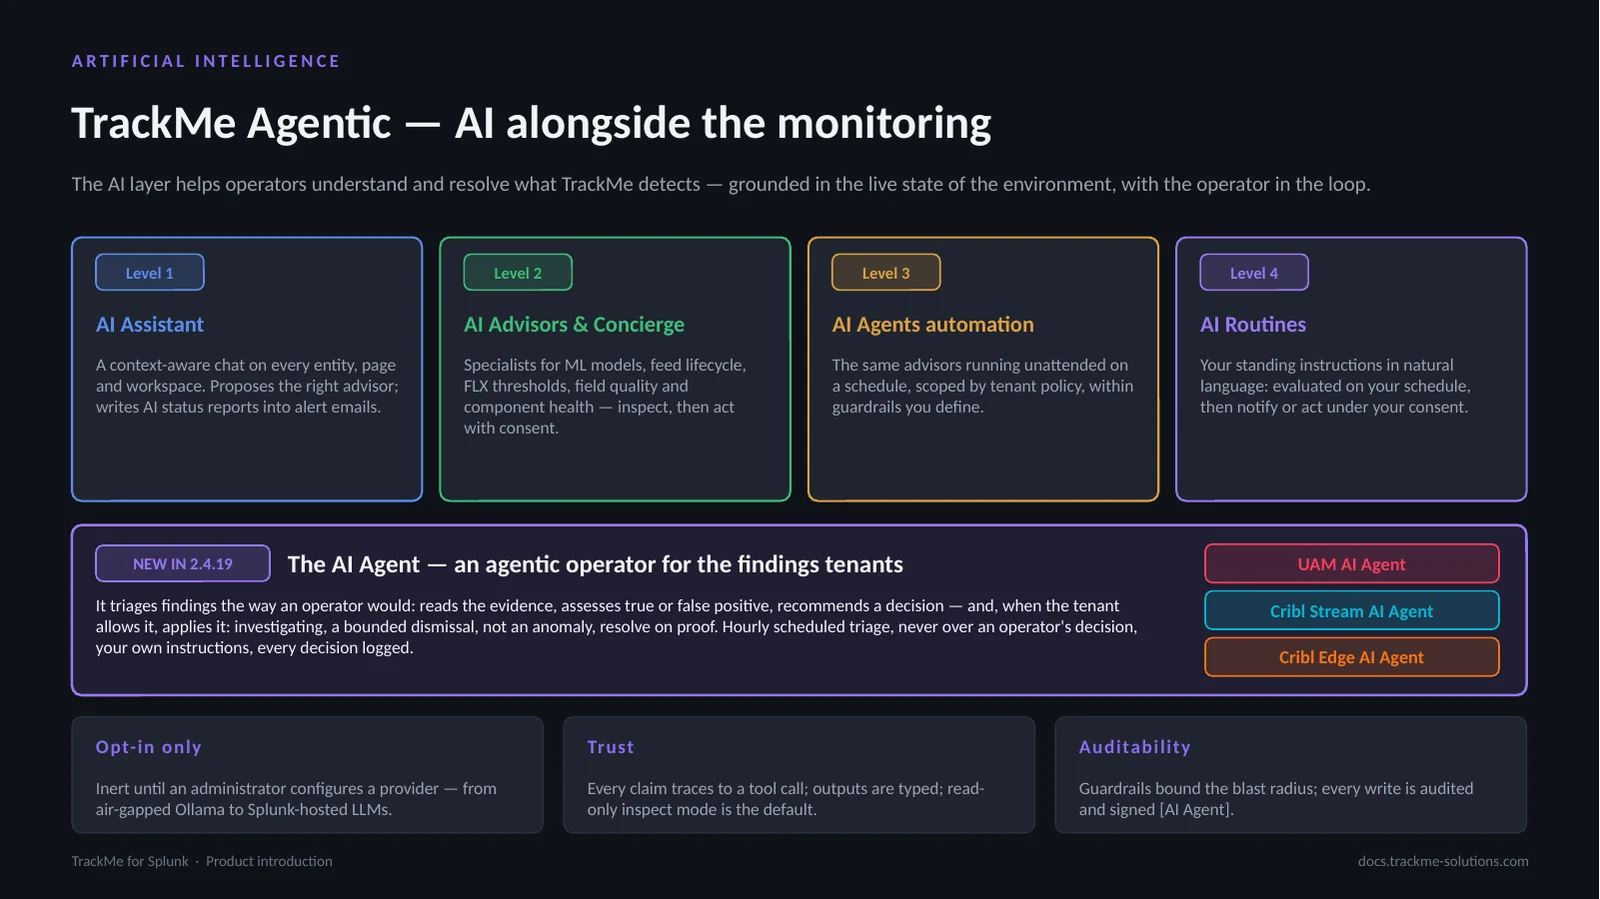
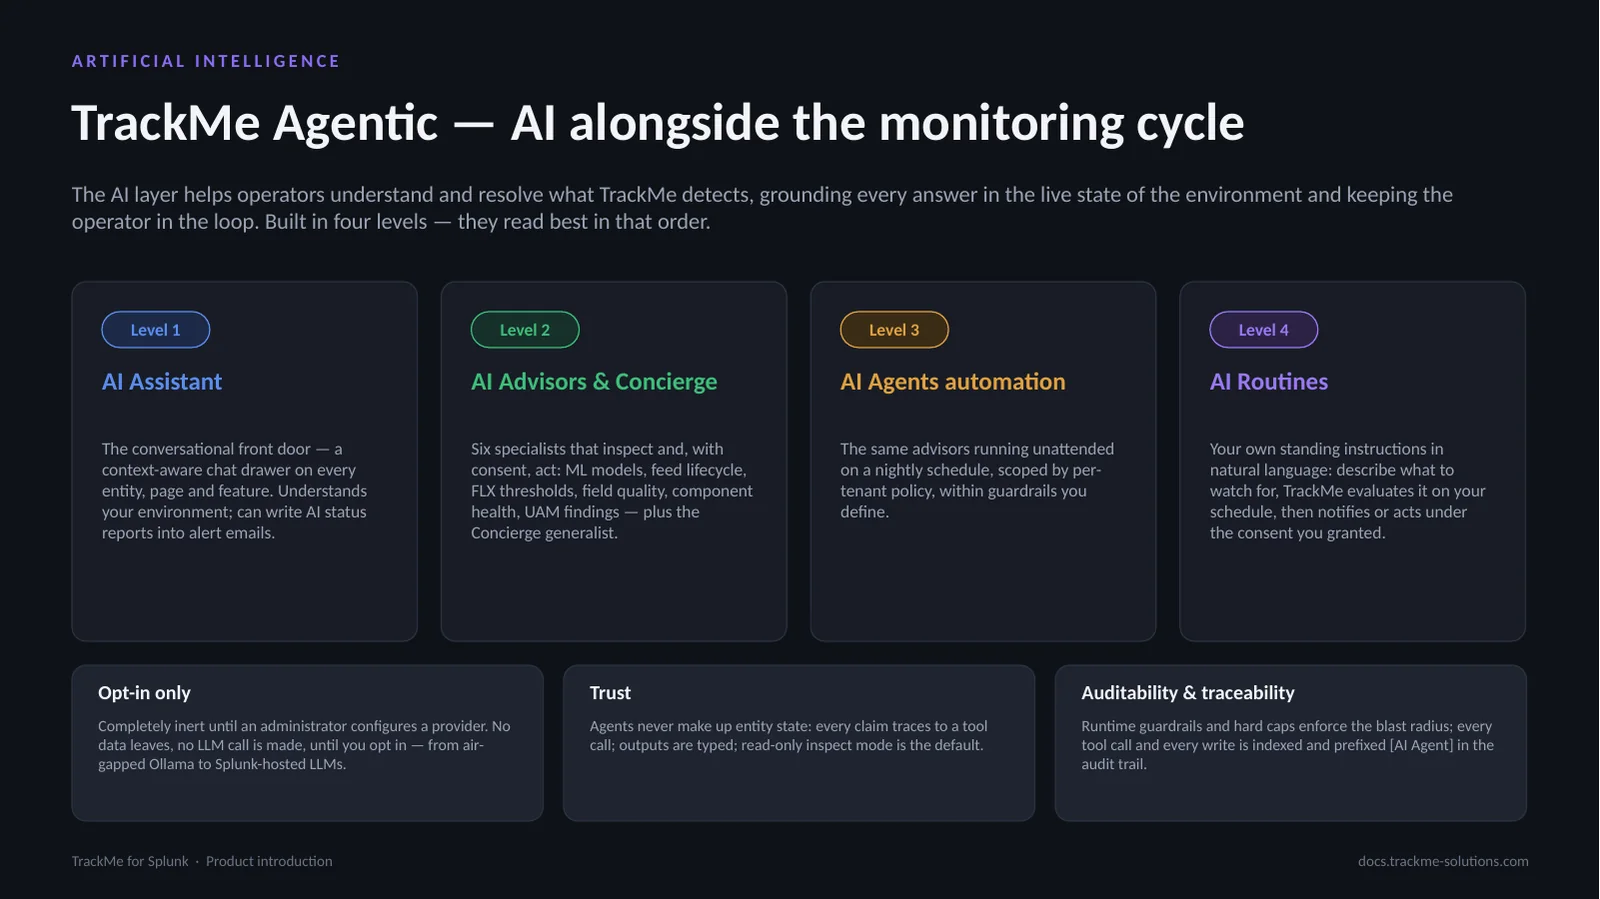
The AI layer helps operators understand and resolve what TrackMe detects, grounded in the live state of the environment and keeping the operator in the loop. It grew in four levels: the AI Assistant on every page; the AI Advisors and the Concierge, which inspect and, with consent, act; AI Agents automation, running the advisors unattended within guardrails; and AI Routines, your own standing instructions. New in 2.4.19, User Activity Monitoring, Cribl Stream and Cribl Edge add the AI Agent, an agentic operator that triages findings, applies the decisions the tenant allows and follows custom instructions. The whole layer is opt-in and inert until an administrator configures a provider.
From a question to a fix
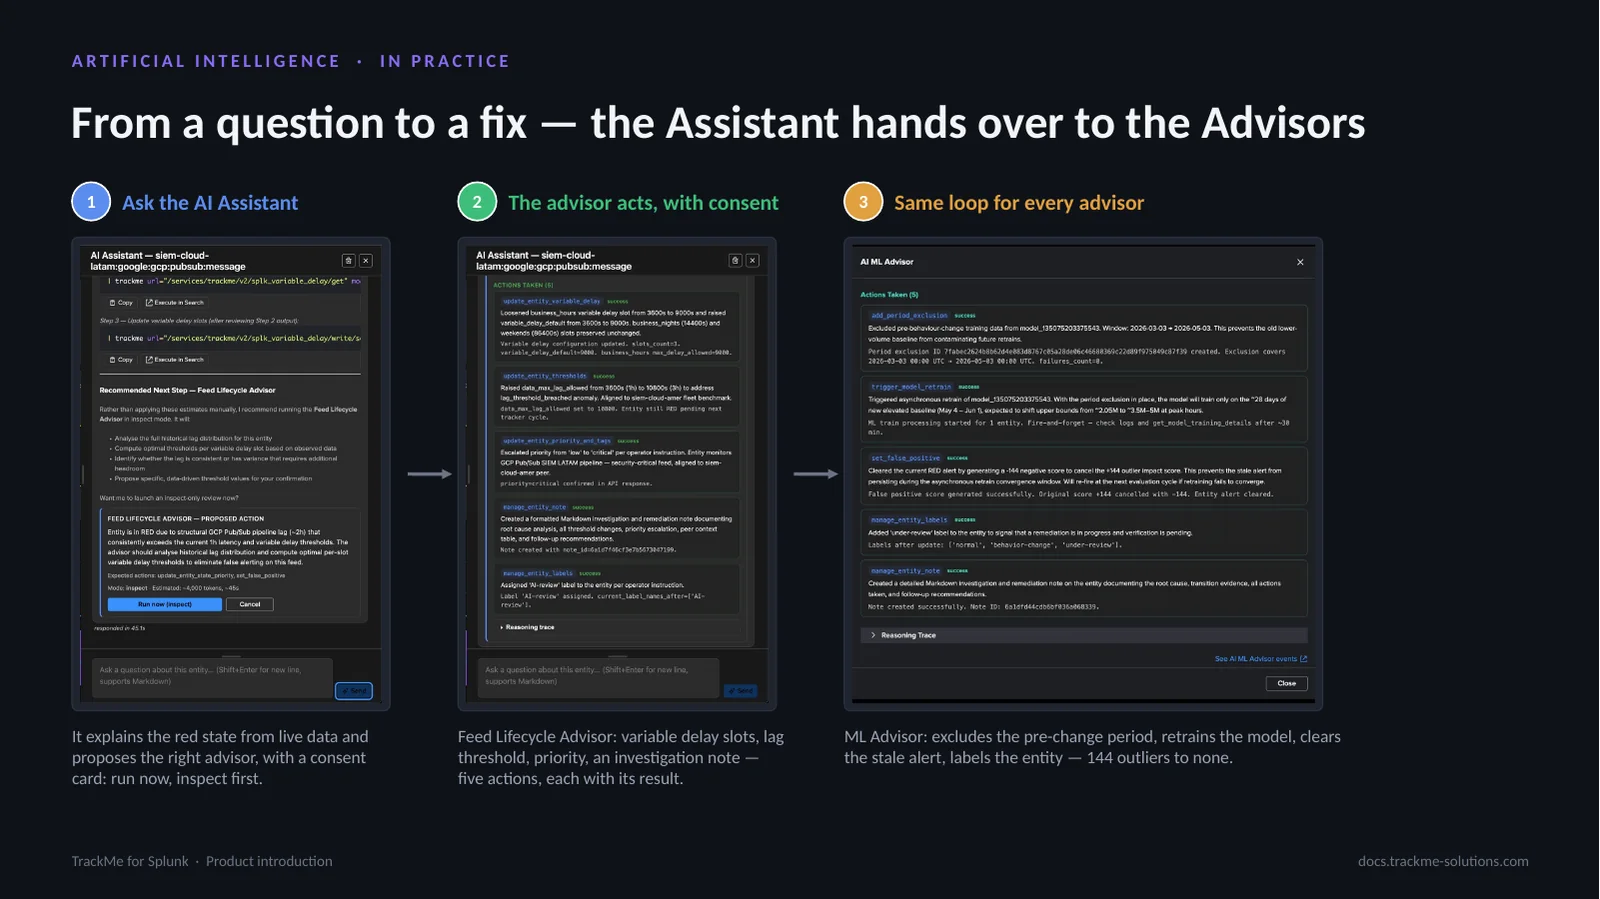
A feed is red and the operator asks the AI Assistant why. The Assistant reads the entity, explains the lag and, rather than guessing values, proposes the Feed Lifecycle Advisor with a consent card. The advisor inspects first; on request it acts: it widens the variable delay slots, raises the lag threshold, escalates the priority and documents everything in a note. Every advisor follows the same loop. The ML Advisor, facing a permanent change of baseline, excludes the old period, retrains the model, cancels the stale alert and labels the entity under review: 144 outliers become none. Each action is a typed tool call with its result, audited.
The AI Agent for findings
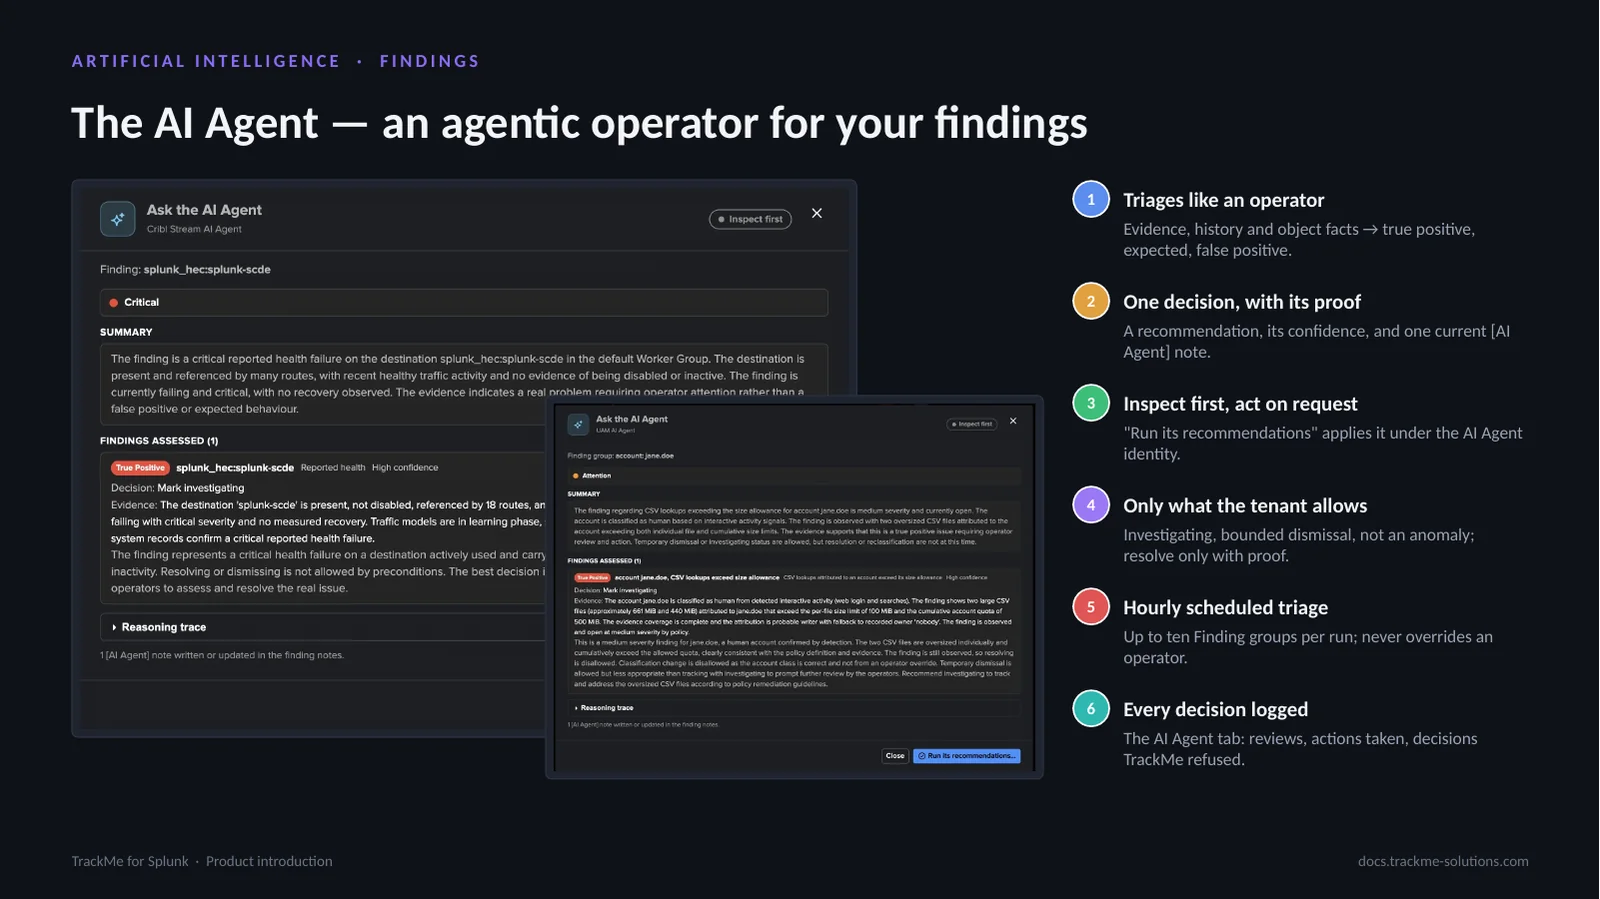
User Activity Monitoring, Cribl Stream and Cribl Edge share one AI Agent. Asked about a finding, or during its hourly scheduled triage, it reads the evidence, the history and the facts about the object, assesses the finding and recommends one decision with its confidence. On the left, the Cribl Stream agent confirms a real health failure on a busy Destination; on the right, the UAM agent confirms oversized CSV lookups on a human account. In act mode it applies only what the tenant allows, resolves only with proof, never overrides an operator, keeps one [AI Agent] note per finding and logs every decision.
Custom instructions, evaluated
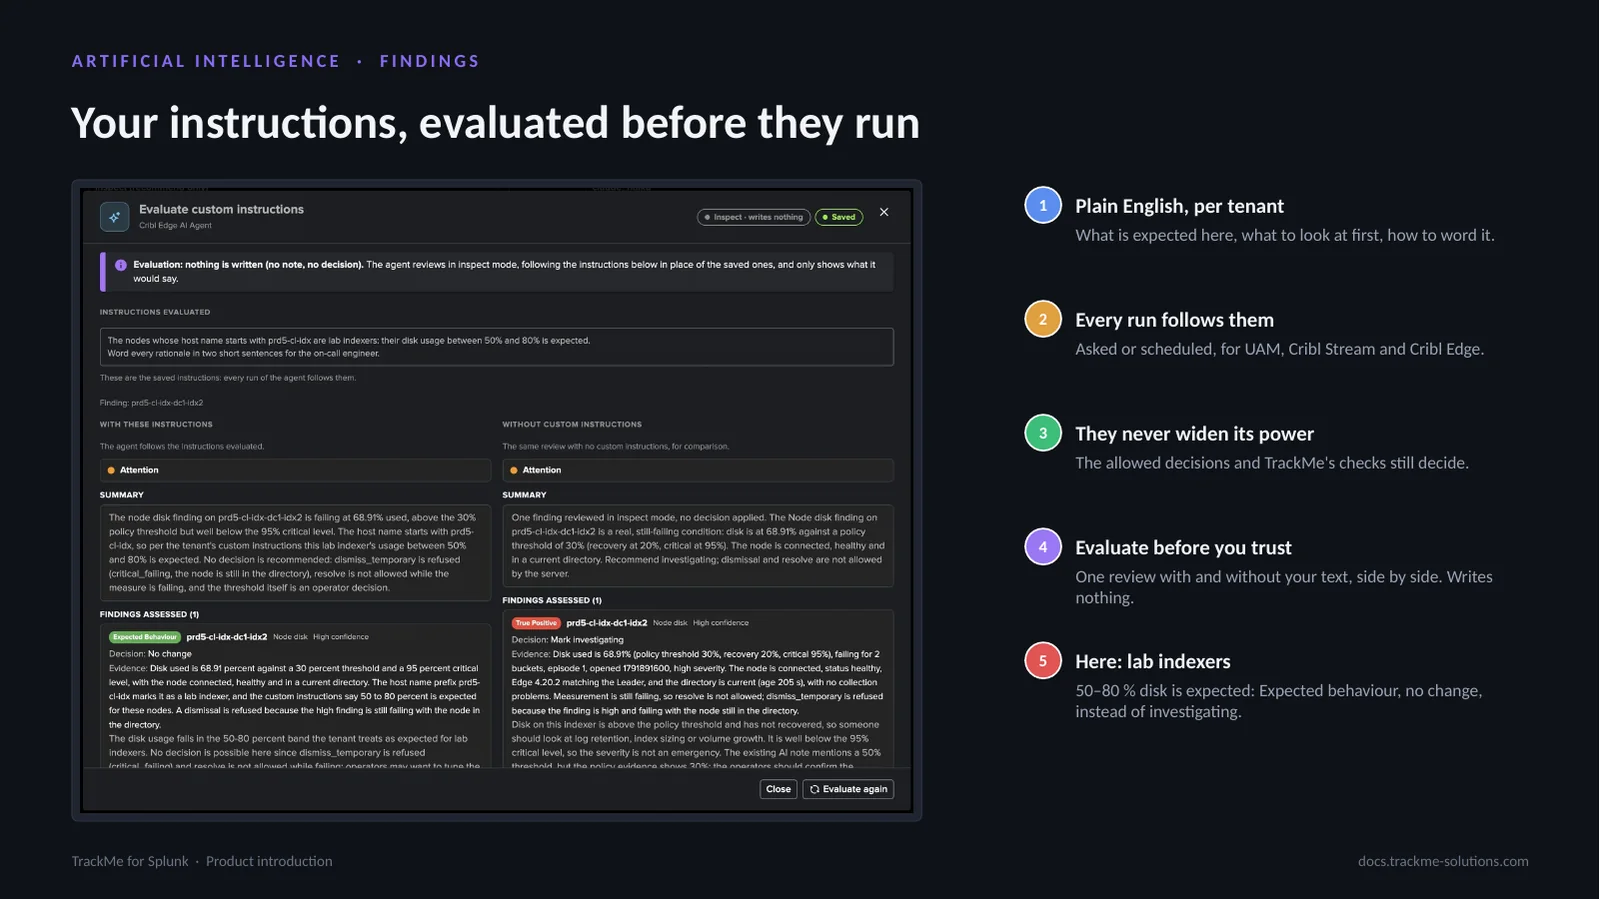
Administrators give the AI Agent of a findings tenant custom instructions in plain English: what to treat as expected, what to look at first, how to word its recommendations. Every run follows them, asked or scheduled, and they never widen what the agent may do. Evaluate runs the agent in inspect mode with the text, saved or not, and shows the same review with and without it, side by side, writing nothing. Here the Cribl Edge agent learns that lab indexers between 50 and 80 percent disk are expected: the same finding reads Expected behaviour instead of a true positive to investigate.
Architecture and editions
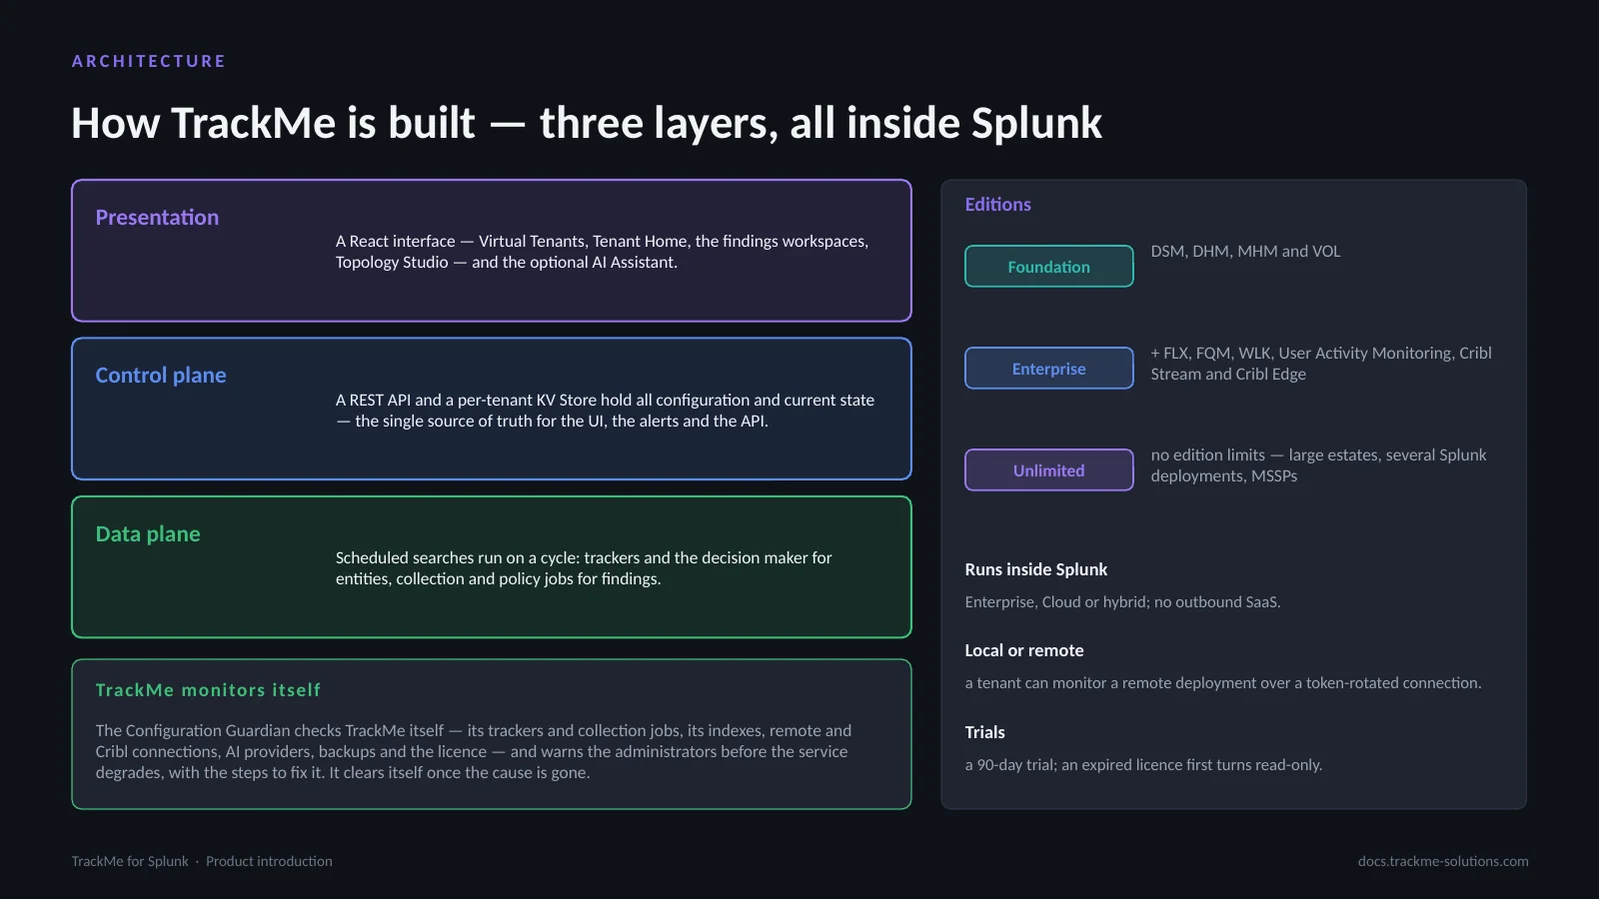
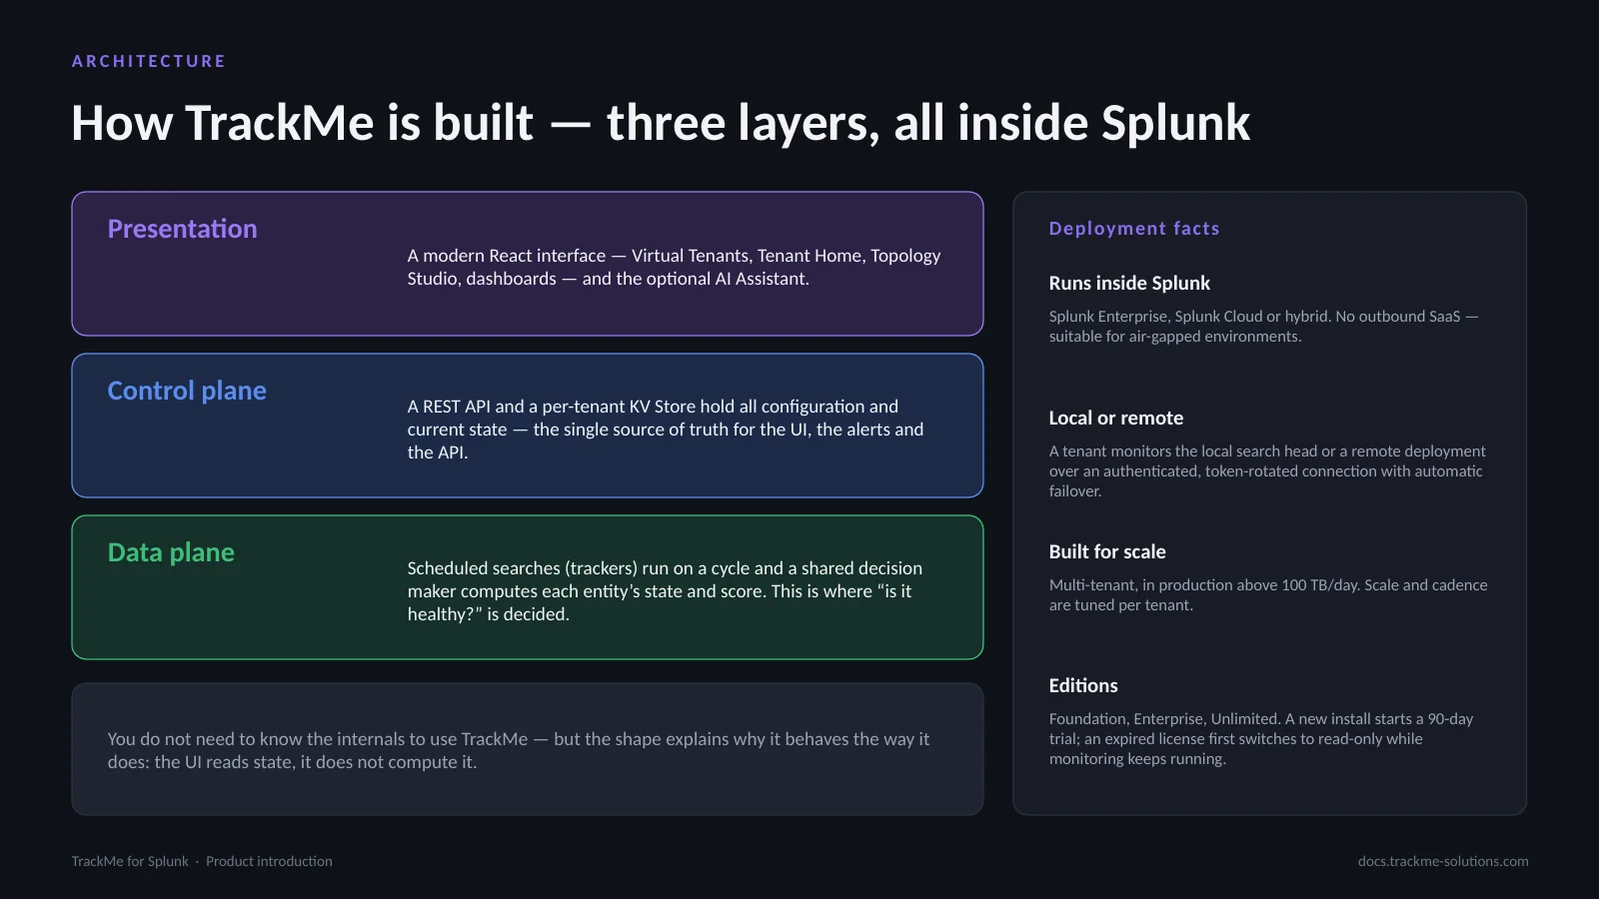
Three layers: the data plane, trackers and the decision maker or the findings jobs; the control plane, a REST API and per-tenant KV Store; the presentation, a React interface and the AI Assistant. Everything runs inside the Splunk environment, and TrackMe monitors itself: the Configuration Guardian checks its own trackers, connections, indexes and licence and warns the administrators before the service degrades. Editions: Foundation covers the feeds components and Volume Outliers — DSM, DHM, MHM and VOL. Enterprise adds FLX, FQM and WLK and the dedicated tenant types: User Activity Monitoring, Cribl Stream and Cribl Edge. Unlimited removes the edition limits. Topology Studio is available in every edition. An expired licence first switches to read-only while monitoring keeps running.
The adoption journey
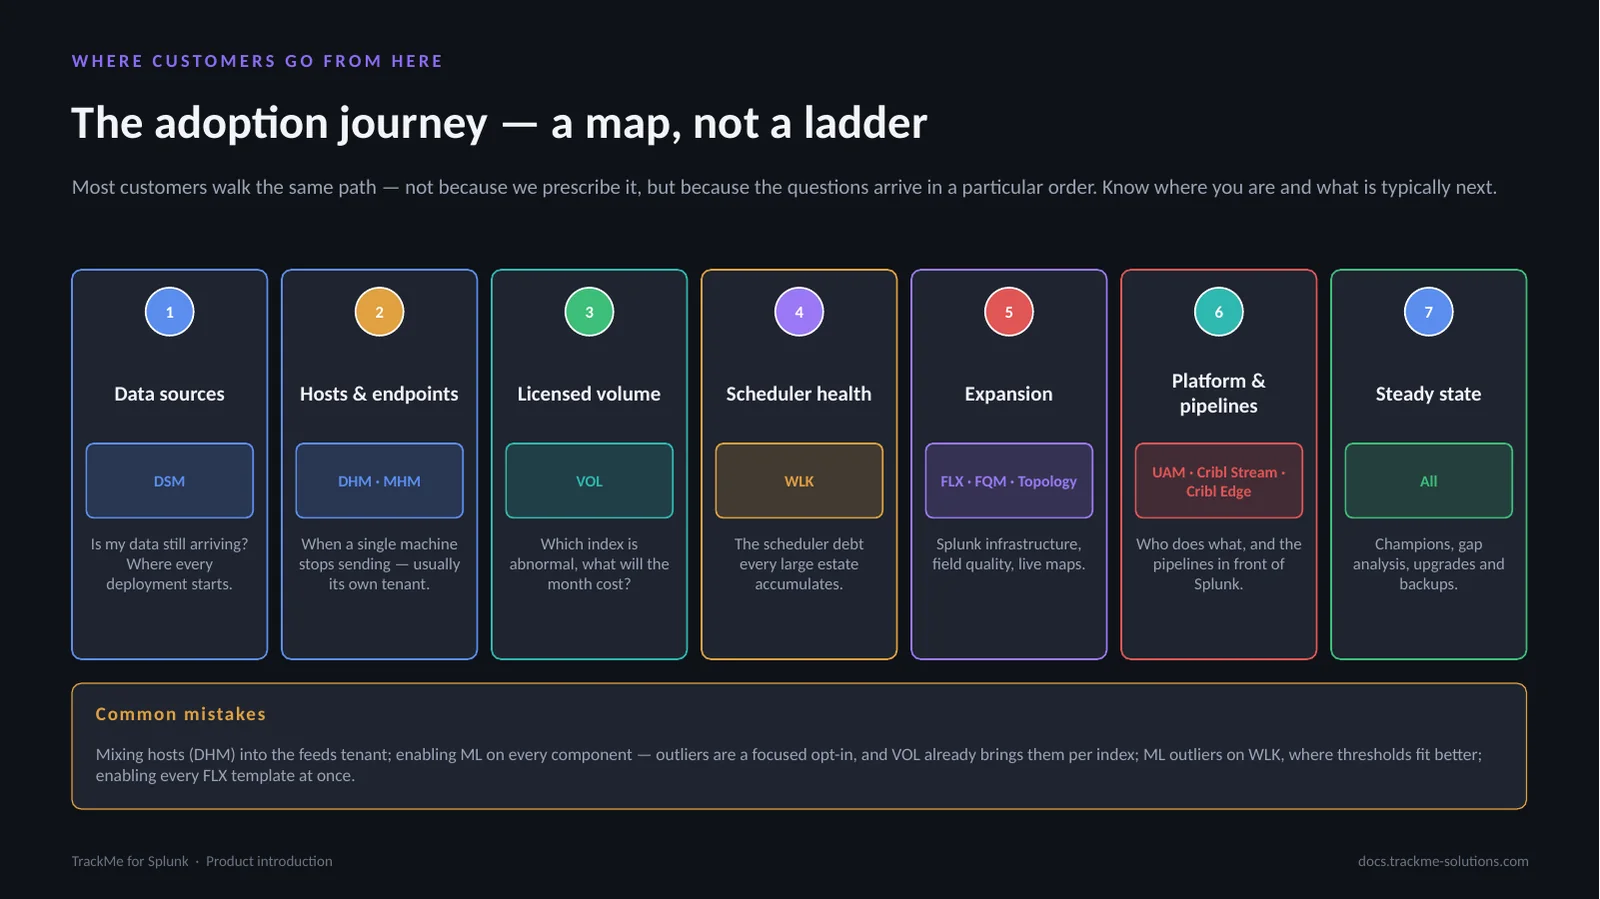
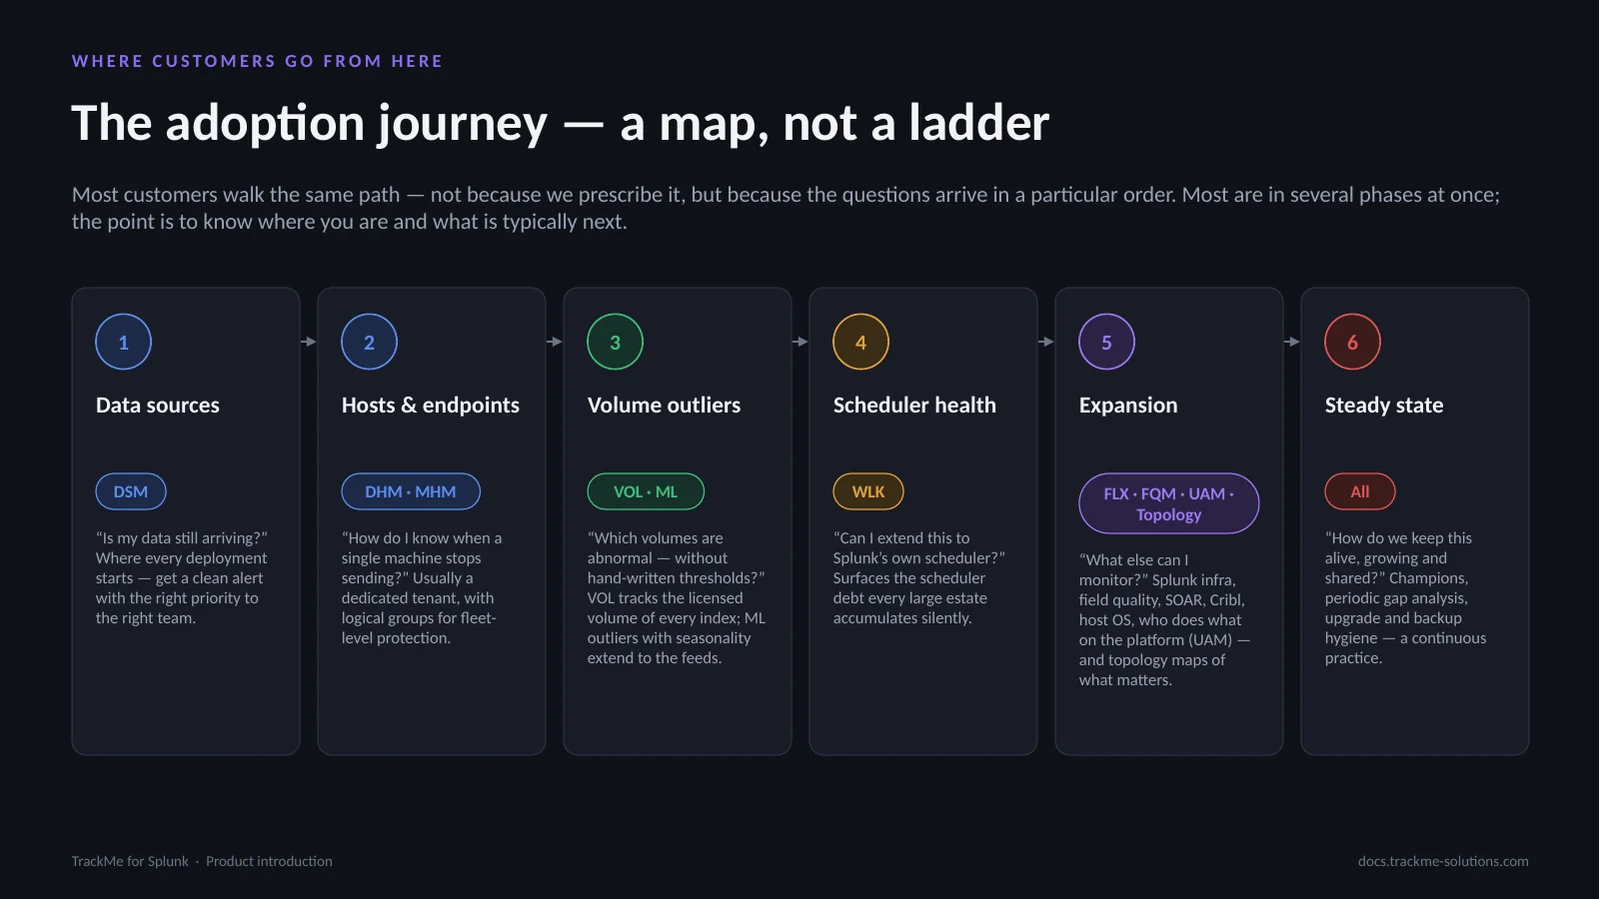
This journey is a map, not a ladder: the questions arrive in a particular order and most teams are in several phases at once. Phase 1, data sources with DSM, is where every deployment starts. Phase 2 covers hosts and endpoints with DHM and MHM, usually in a dedicated tenant. Phase 3 is the licensed volume of every index with VOL. Phase 4 is the scheduler with WLK. Phase 5 expands with FLX, FQM and Topology Studio. Phase 6 goes beyond the data: who does what on the platform with User Activity Monitoring, and the Cribl pipelines with Cribl Stream and Cribl Edge. Phase 7, the steady state, is a continuous practice.
Where we are
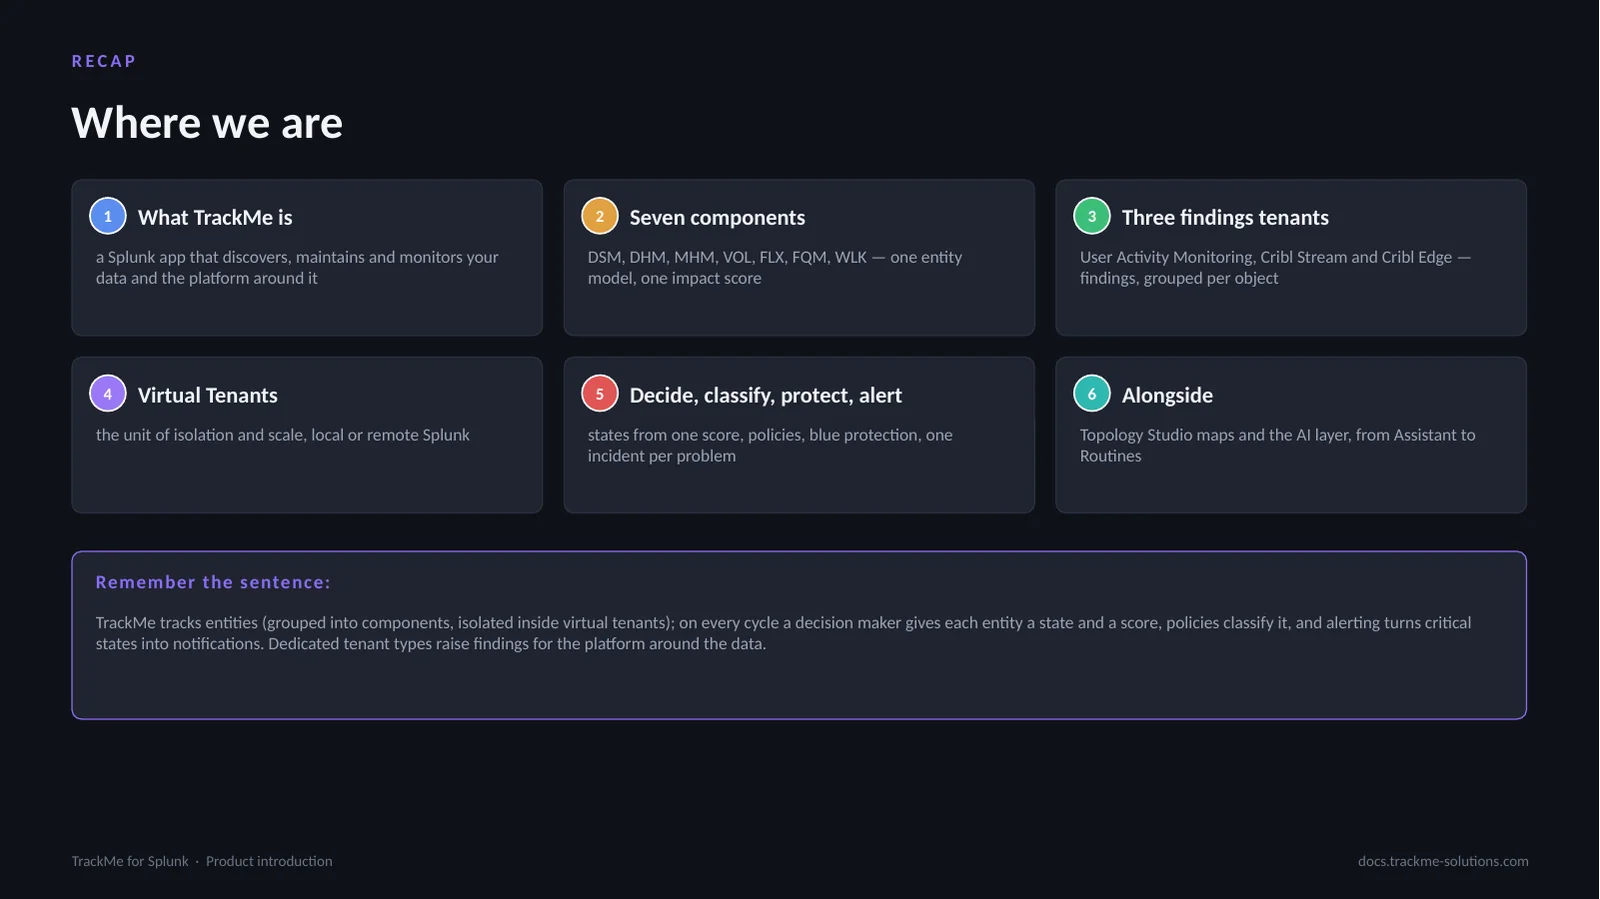
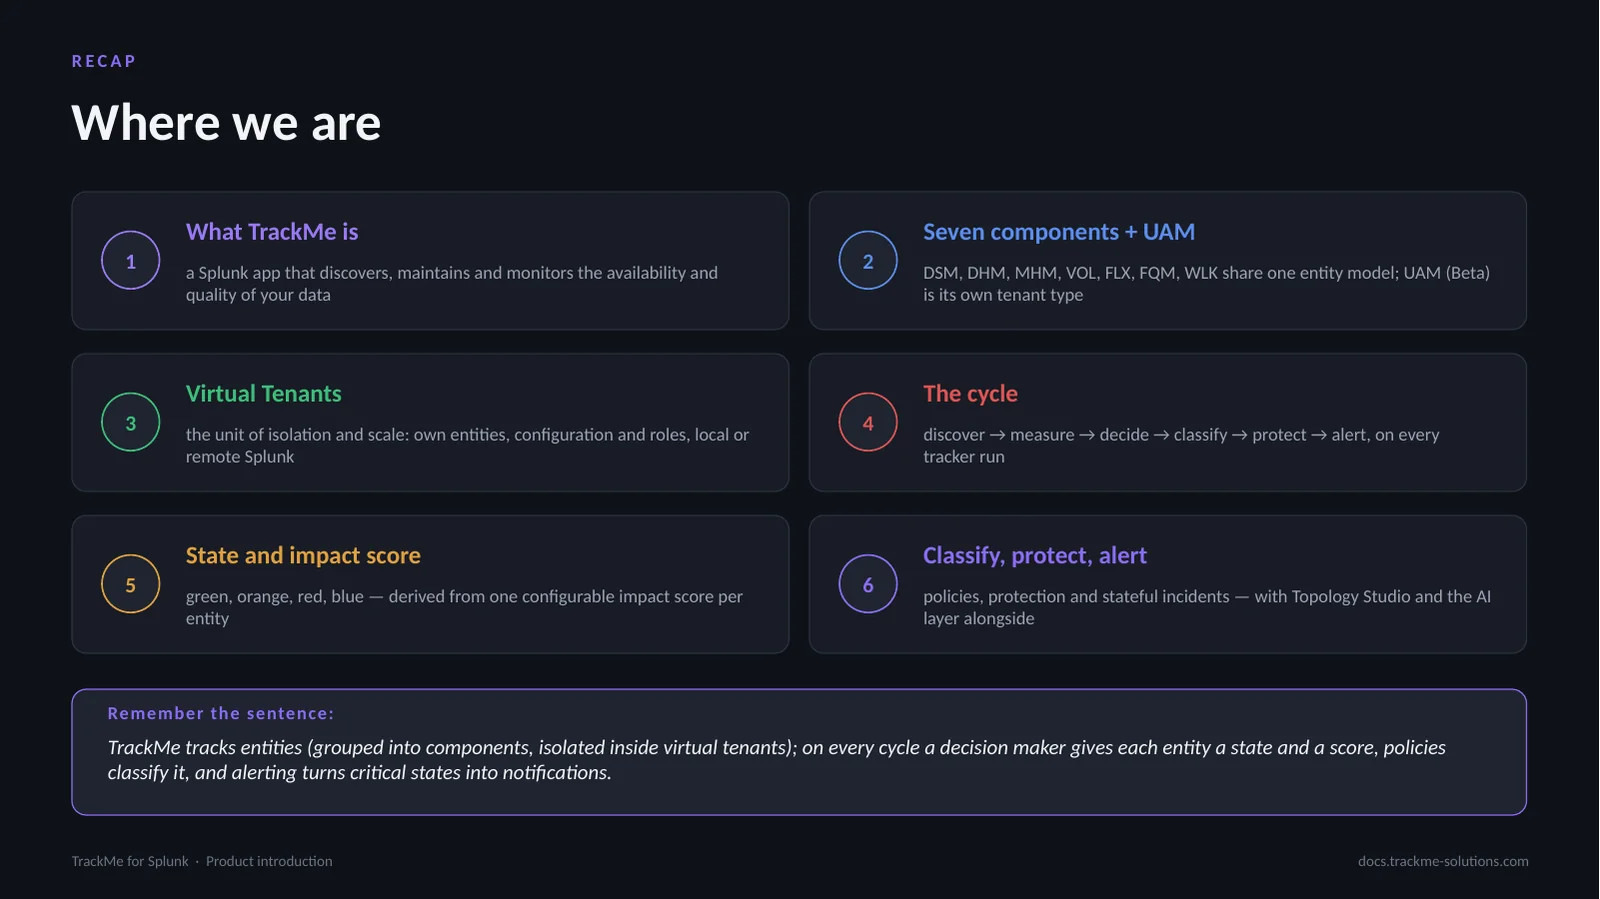
TrackMe is a Splunk app that discovers, maintains and monitors the availability and quality of your data and of the platform around it. Entity monitoring: seven components — DSM, DHM, MHM, VOL, FLX, FQM and WLK — share one entity model, with a state from one impact score, policies that classify, protection that holds noise in blue and stateful alerting. Findings monitoring: User Activity Monitoring, Cribl Stream and Cribl Edge raise findings, grouped per object and decided once. Everything is isolated in virtual tenants, with Topology Studio and the AI layer alongside.