Topology Alerts
A topology map answers “what depends on what”. Topology Alerts answers the next question: “tell me the moment this picture degrades”. Any topology view can carry one or more alerts — the topology itself becomes an alerting object, correlating the health of everything the map covers.

Why alert on a topology?
Classic per-entity alerting tells you an entity broke. A topology alert tells you your service broke — because you already encoded which entities constitute the service when you drew the map. One alert covers the payment flow end to end; the notification embeds the rendered map, so the recipient sees at a glance which part of the flow is red.
The state-aware engine
Topology Alerts are state-aware, not fire-and-forget. Each evaluation compares the current health of the covered nodes with the alert’s stored state and only acts on transitions:
Open — the covered scope degrades (red by default; orange optionally counts): a new alert cycle opens and notifies.
Update — the situation changes while open (more nodes affected, fewer, different ones): an update is recorded. No change → no re-notification. No spam by design.
Resolve — everything covered returns to health: the cycle closes, and the resolve notification reports how long the incident lasted.
Further semantics keep the engine honest:
Missing nodes (the underlying entity was deleted, or, since TrackMe 2.4.15, its tenant was deleted or disabled or its component removed) are reported as such rather than treated as healthy or broken.
Unavailable data (a tenant’s collections temporarily unreachable) freezes the alert’s state instead of transitioning — an evaluation that cannot see clearly never fabricates a resolve or an open.
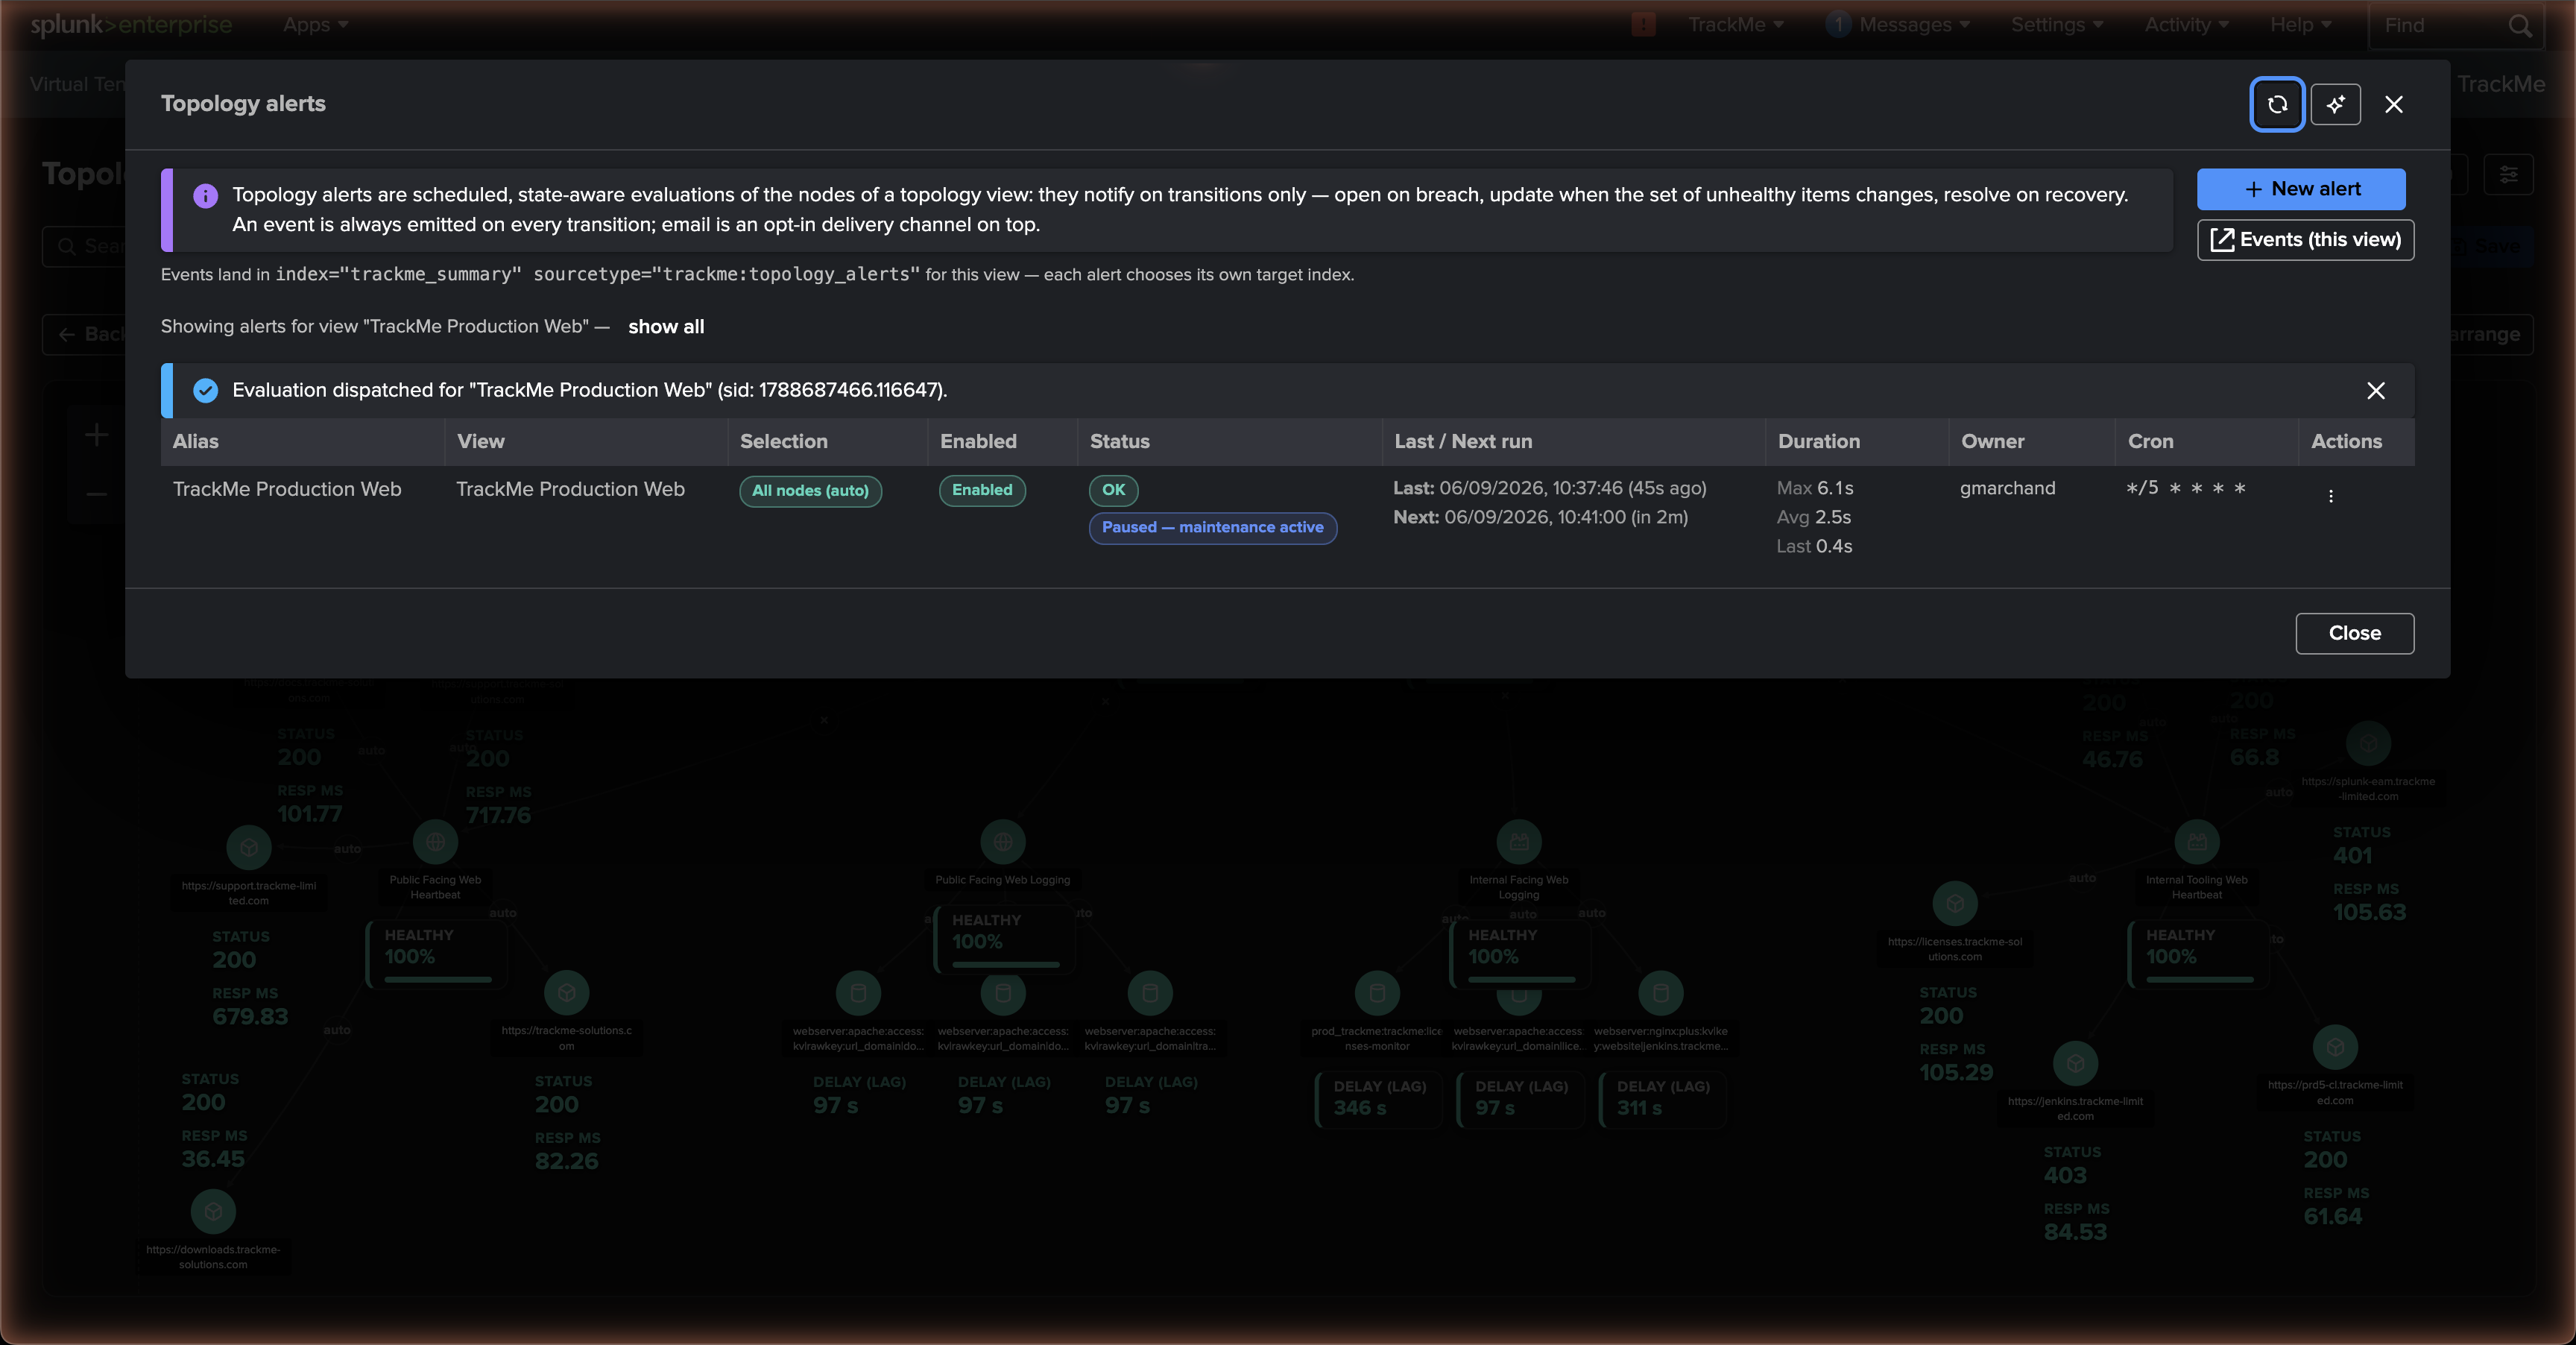
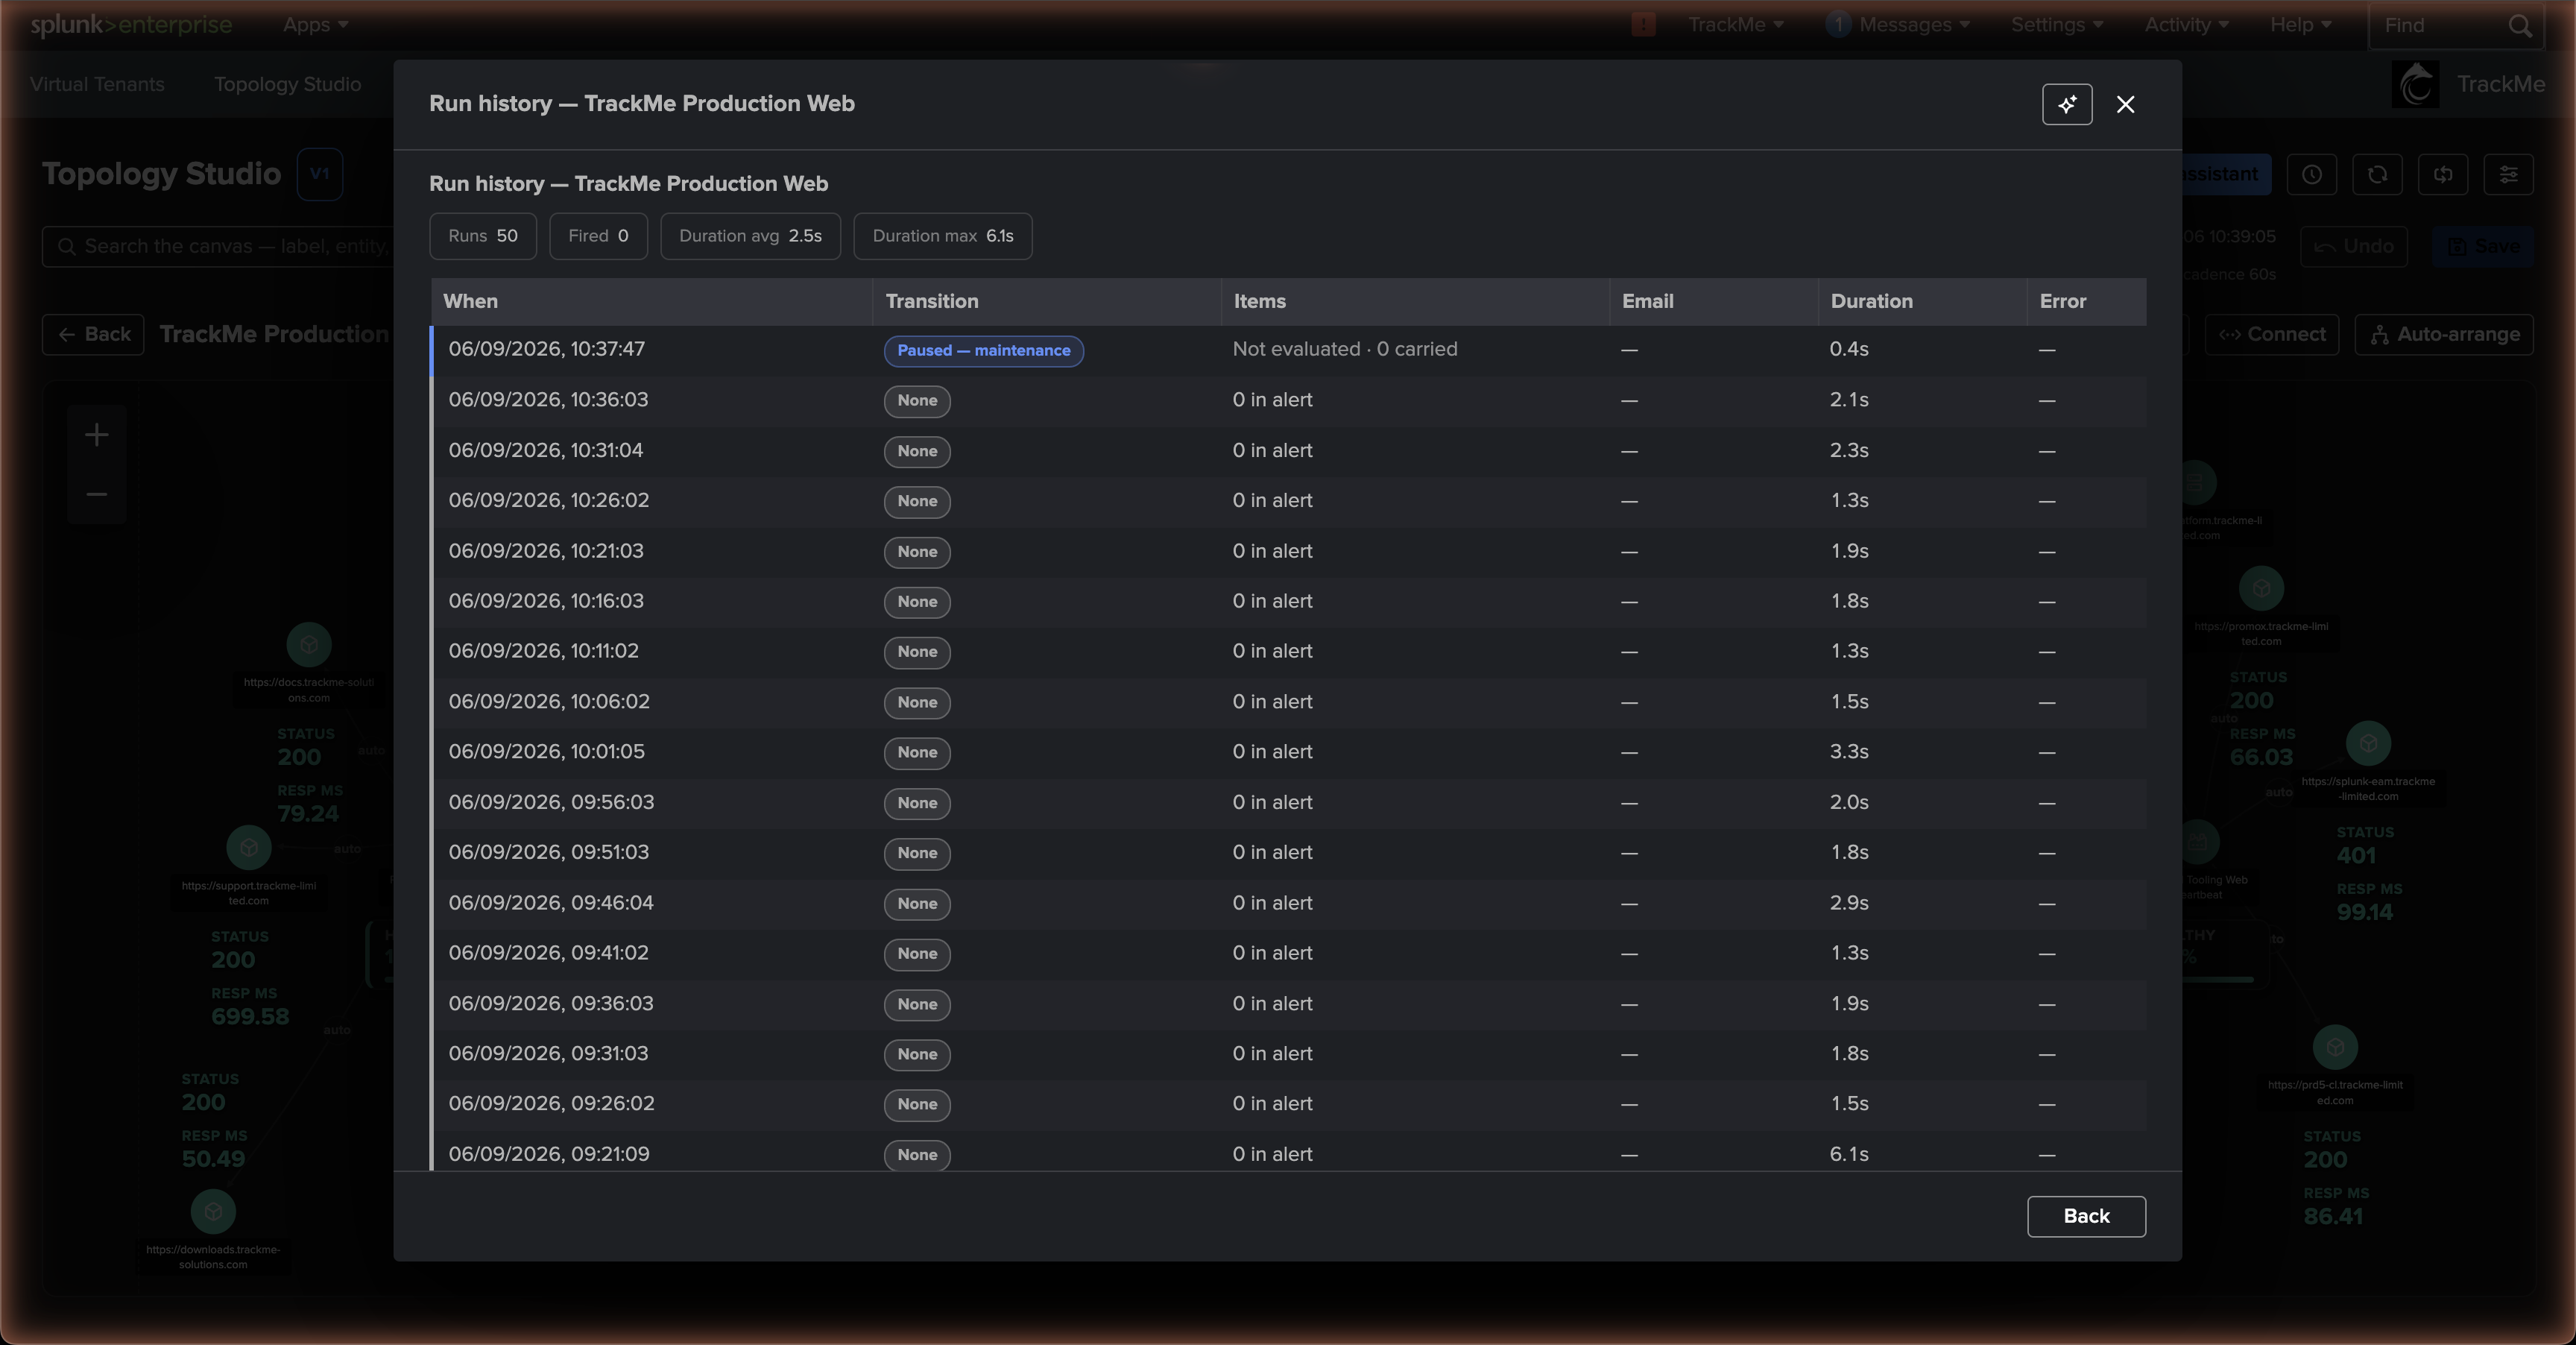
Maintenance freezes too (TrackMe 2.4.15). When TrackMe’s global maintenance mode is active — immediate or scheduled, for every tenant or for a scope — and that scope covers any tenant the alert’s selection touches, the evaluation is paused: no tenant is read, the alert’s current state carries forward untouched, and no open, update or resolve transition, event or email is produced. Maintenance scoped to other tenants evaluates normally. The run history records the run as paused, not failed, and the alert list and the History view show a blue Paused — maintenance chip for as long as the window lasts. Treating maintenance as healthy would resolve every open alert the moment a window starts; evaluating anyway would open phantom incidents on the entities a window turns red — the freeze avoids both. Should the maintenance status itself be unreadable, evaluation proceeds normally rather than silencing alerting indefinitely.
If your map uses impact propagation, the alert engine honors it: a node repainted by an upstream failure counts as degraded — the alert fires on the same picture the canvas shows, and the notification names the upstream cause.
Note
From TrackMe 2.4.15, view integrity checks flag stale tenant/component references and alert configuration issues through Configuration Guardian and Topology Studio. An alert whose entire selection becomes missing can resolve; the integrity check highlights that lost coverage. The Alerts modal also shows a per-view integrity chip for alert-level findings.
What an alert covers
Per alert, you choose:
the nodes — an explicit selection of nodes on the view, or all nodes — which dynamically includes nodes added to the view later. Entity nodes, scoped aggregates, auto aggregates and, since TrackMe 2.4.15, view nodes are all alertable: a view node counts as one item, judged by the referenced view’s effective health, and the tenants it reaches through any depth of nesting count towards the maintenance scope described above. The referenced view’s own alerts stay independent — the parent never runs them;
the trigger states — red always alerts; orange optionally;
the schedule — each alert runs on its own cron schedule (default: every 15 minutes), visible with next-run and run-now controls.
An auto aggregate counts as one alertable item, evaluated from its worst effective contributor state. The canvas and alert evaluator share the same composition rules. Its dependency tenants count towards permission and maintenance checks; temporary unavailability freezes an existing alert rather than reporting a false recovery. The healthy-entity KPI is an entity-level percentage, not the number of alertable nodes.
The create/edit panel gathers everything in one place: identity and schedule, the orange-as-alerting toggle, the event index, the delivery options — and the node selection, where automatically select all covers every alertable node of the view including nodes added later, while unticking it hands you a filterable per-node checklist:


Notifications
Notable events (always)
Every transition (open / update / resolve) emits a notable event with
sourcetype=trackme:topology_alerts — searchable, dashboard-able, and available to
any downstream pipeline you already run on TrackMe events. Each alert chooses its own
event index; leaving it on the deployment default targets TrackMe’s summary index.
Finding the events
You never have to guess where the events landed — the UI takes you straight to them:
the Alerts modal banner states the exact
indexandsourcetypesearch scope for the current view, and the Events (this view) button opens a pre-scoped Splunk search across all of the view’s alerts;per alert, the Actions menu → Alert events opens the same search narrowed to that alert (
alert_id="<alert>").


Each event is a structured JSON record carrying the full context of the transition:
transition (open / update / resolve), status, alert_id and alert_alias,
view_id, a stable event_id, and the per-node detail — items_in_alert (with
component, state and anomaly reason per node), plus the items_ok_count,
items_missing and items_unavailable breakdowns — everything a downstream
correlation or ticketing pipeline needs without re-querying TrackMe.
Email (opt-in)
On top of the events, an alert can deliver email through any TrackMe email delivery account:
branded HTML in dark or light theme, up to 50 recipients;
the topology itself, rendered server-side as an image — with the same node icons as the canvas, colored by the state that triggered the notification, and including the auto-populated members of expanded aggregates with their KPI displays: the recipient sees the same map the canvas shows, not a table. Because an email is a fixed-size picture, the members drawn per expanded aggregate are capped by the deployment-wide email image member ceiling (50 by default, worst state first) and the rest are summarised by an exact +N more note on the aggregate’s KPI card; a view node is drawn as one node with its underlying entity count;
a deep link back to the live view. The link root is auto-resolved from your Splunk Web configuration and can be overridden per alert — for reverse proxies and custom domains;
resolve emails report the incident duration.


Managing alerts
The Alerts modal on each view is the management surface:
create, edit, enable/disable and delete alerts;
run now for immediate evaluation;
run history — the recent runs with status, duration and outcome, so you can see the engine working (and prove a schedule is firing);
Ask AI per alert — hand the alert and its recent runs to the AI Assistant for interpretation.
Hint
Creating and managing alerts on a view requires write access to that view (see Administration). If a view is deleted, its alerts are deactivated and remain inspectable by administrators and the alert’s creator for cleanup.
