Hybrid trackers — in depth
Tip
This is the in-depth reference for hybrid trackers. For the readable overview, start
with Hybrid trackers. This page gives the full creation
wizard, the search-mode tradeoffs (tstats / raw / lookups), the break-by and
time-quantifier mechanics, deletion semantics, and the REST delete endpoint.
Introduction to Hybrid Trackers
Hybrid Trackers are created and managed through TrackMe. These are scheduled backend jobs that orchestrate entity discovery and management for TrackMe splk-feeds components:
Hybrid Trackers are scheduled reports that involve various TrackMe backend tools depending on the TrackMe component
A single Hybrid Tracker can discover and manage a few or many entities according to the needs
Hybrid Trackers integrate into a main application workflow, which involves concepts such as registering their execution statuses and run time performance
Hybrid Trackers can be created at any time through guided user interfaces or TrackMe REST endpoints
In the context of Splunk feeds tracking, Hybrid Trackers can also be created during the initial creation of the Virtual Tenant
When creating trackers, the related knowledge objects will be owned by the owner defined at the Virtual Tenant level
TrackMe keeps records of the knowledge objects related to the Hybrid Trackers; therefore, you need to manage their lifecycle through TrackMe
How a hybrid tracker executes: the composite chain
A hybrid tracker is a composite chain, not a single search. Understanding it explains both what you see in the Splunk scheduler and where the knobs live:
The scheduled tracker calls the
trackmetrackerexecutorcommand, which runs a wrapper report.The wrapper calls an abstract report via
| savedsearch.The abstract report holds the root
| tstatssearch inline (its constraint comes from a per-tracker root-constraint macro), and finishes with the shared post-processing macro —trackme_dsm_tracker_abstract(<tenant>, tstats)for DSM (the DHM equivalent for hosts).
To validate any tracker’s mode, open its …_abstract… / …_wrapper… report definition,
or the Job Inspector’s normalizedSearch — you will see the | tstats root and the
index-time bounds.
The default window is narrow — wide windows are custom
By default, TrackMe creates DSM / DHM hybrid trackers with earliest = -4h,
latest = +4h, and matching _index_earliest = -4h / _index_latest = +4h. The
index-time bounds mean each run reads only roughly the last four hours of indexed data,
regardless of the configured event-time window.
Trackers with wider ranges (say -48h) are therefore deliberately created customs, not
the default. Creating them is legitimate and supported — for example to catch feeds with a
permanent high-latency pattern the default 4-hour window would miss — they just need to be
designed with intent, balancing the monitoring value against the extra scan cost.
Also remember TrackMe already maintains state for entities that fall outside the main window, automatically, through the delayed-entities inspector — it re-checks late / high-latency feeds over progressively wider windows (24h, 7d, then longer), so they do not require a permanently wide main tracker (see DSM — Data Source Monitoring). On long-lived deployments it is worth reviewing whether legacy wide-window custom trackers are still needed at all.
The span is the main cost dial — and it does not affect delay
The generated tstats search buckets data by a time span. A larger span means fewer
buckets — a faster, cheaper search; a smaller span gives finer resolution. What matters is
what the span affects:
span changes the accuracy of the latency metric only (latency =
_indextime − _time, measured per bucket);span has no effect on delay detection (delay =
now() − _time), which depends only on the latest event time.
Early TrackMe versions generated a very granular span (1s); the current defaults are
DSM 30s, and DHM 5m via the UI wizard (1m via the REST API). Reviewing the
span= in your trackers is worthwhile: increasing it improves performance at only a small
cost to latency resolution — you still catch the meaningful latency peaks.
The UI also supports span = none when creating a tracker. This produces a tracker that
does not bucket by _time at all (one snapshot per run): a substantial performance and cost
win, with no effect on delay, but only a coarse, high-level latency figure. That trade is
often ideal for host / endpoint (DHM) tracking, where delay is usually the priority —
precise latency generally matters more for data-source (DSM) feeds than for endpoints.
See Delay vs latency for the two KPIs themselves, and Large-scale environments for the broader scaling guidance.
Creating an Hybrid Tracker for splk-feeds
These instructions are related to the splk-dsm component. Options for splk-dhm/splk-mhm may differ, but the underlying logic is similar.
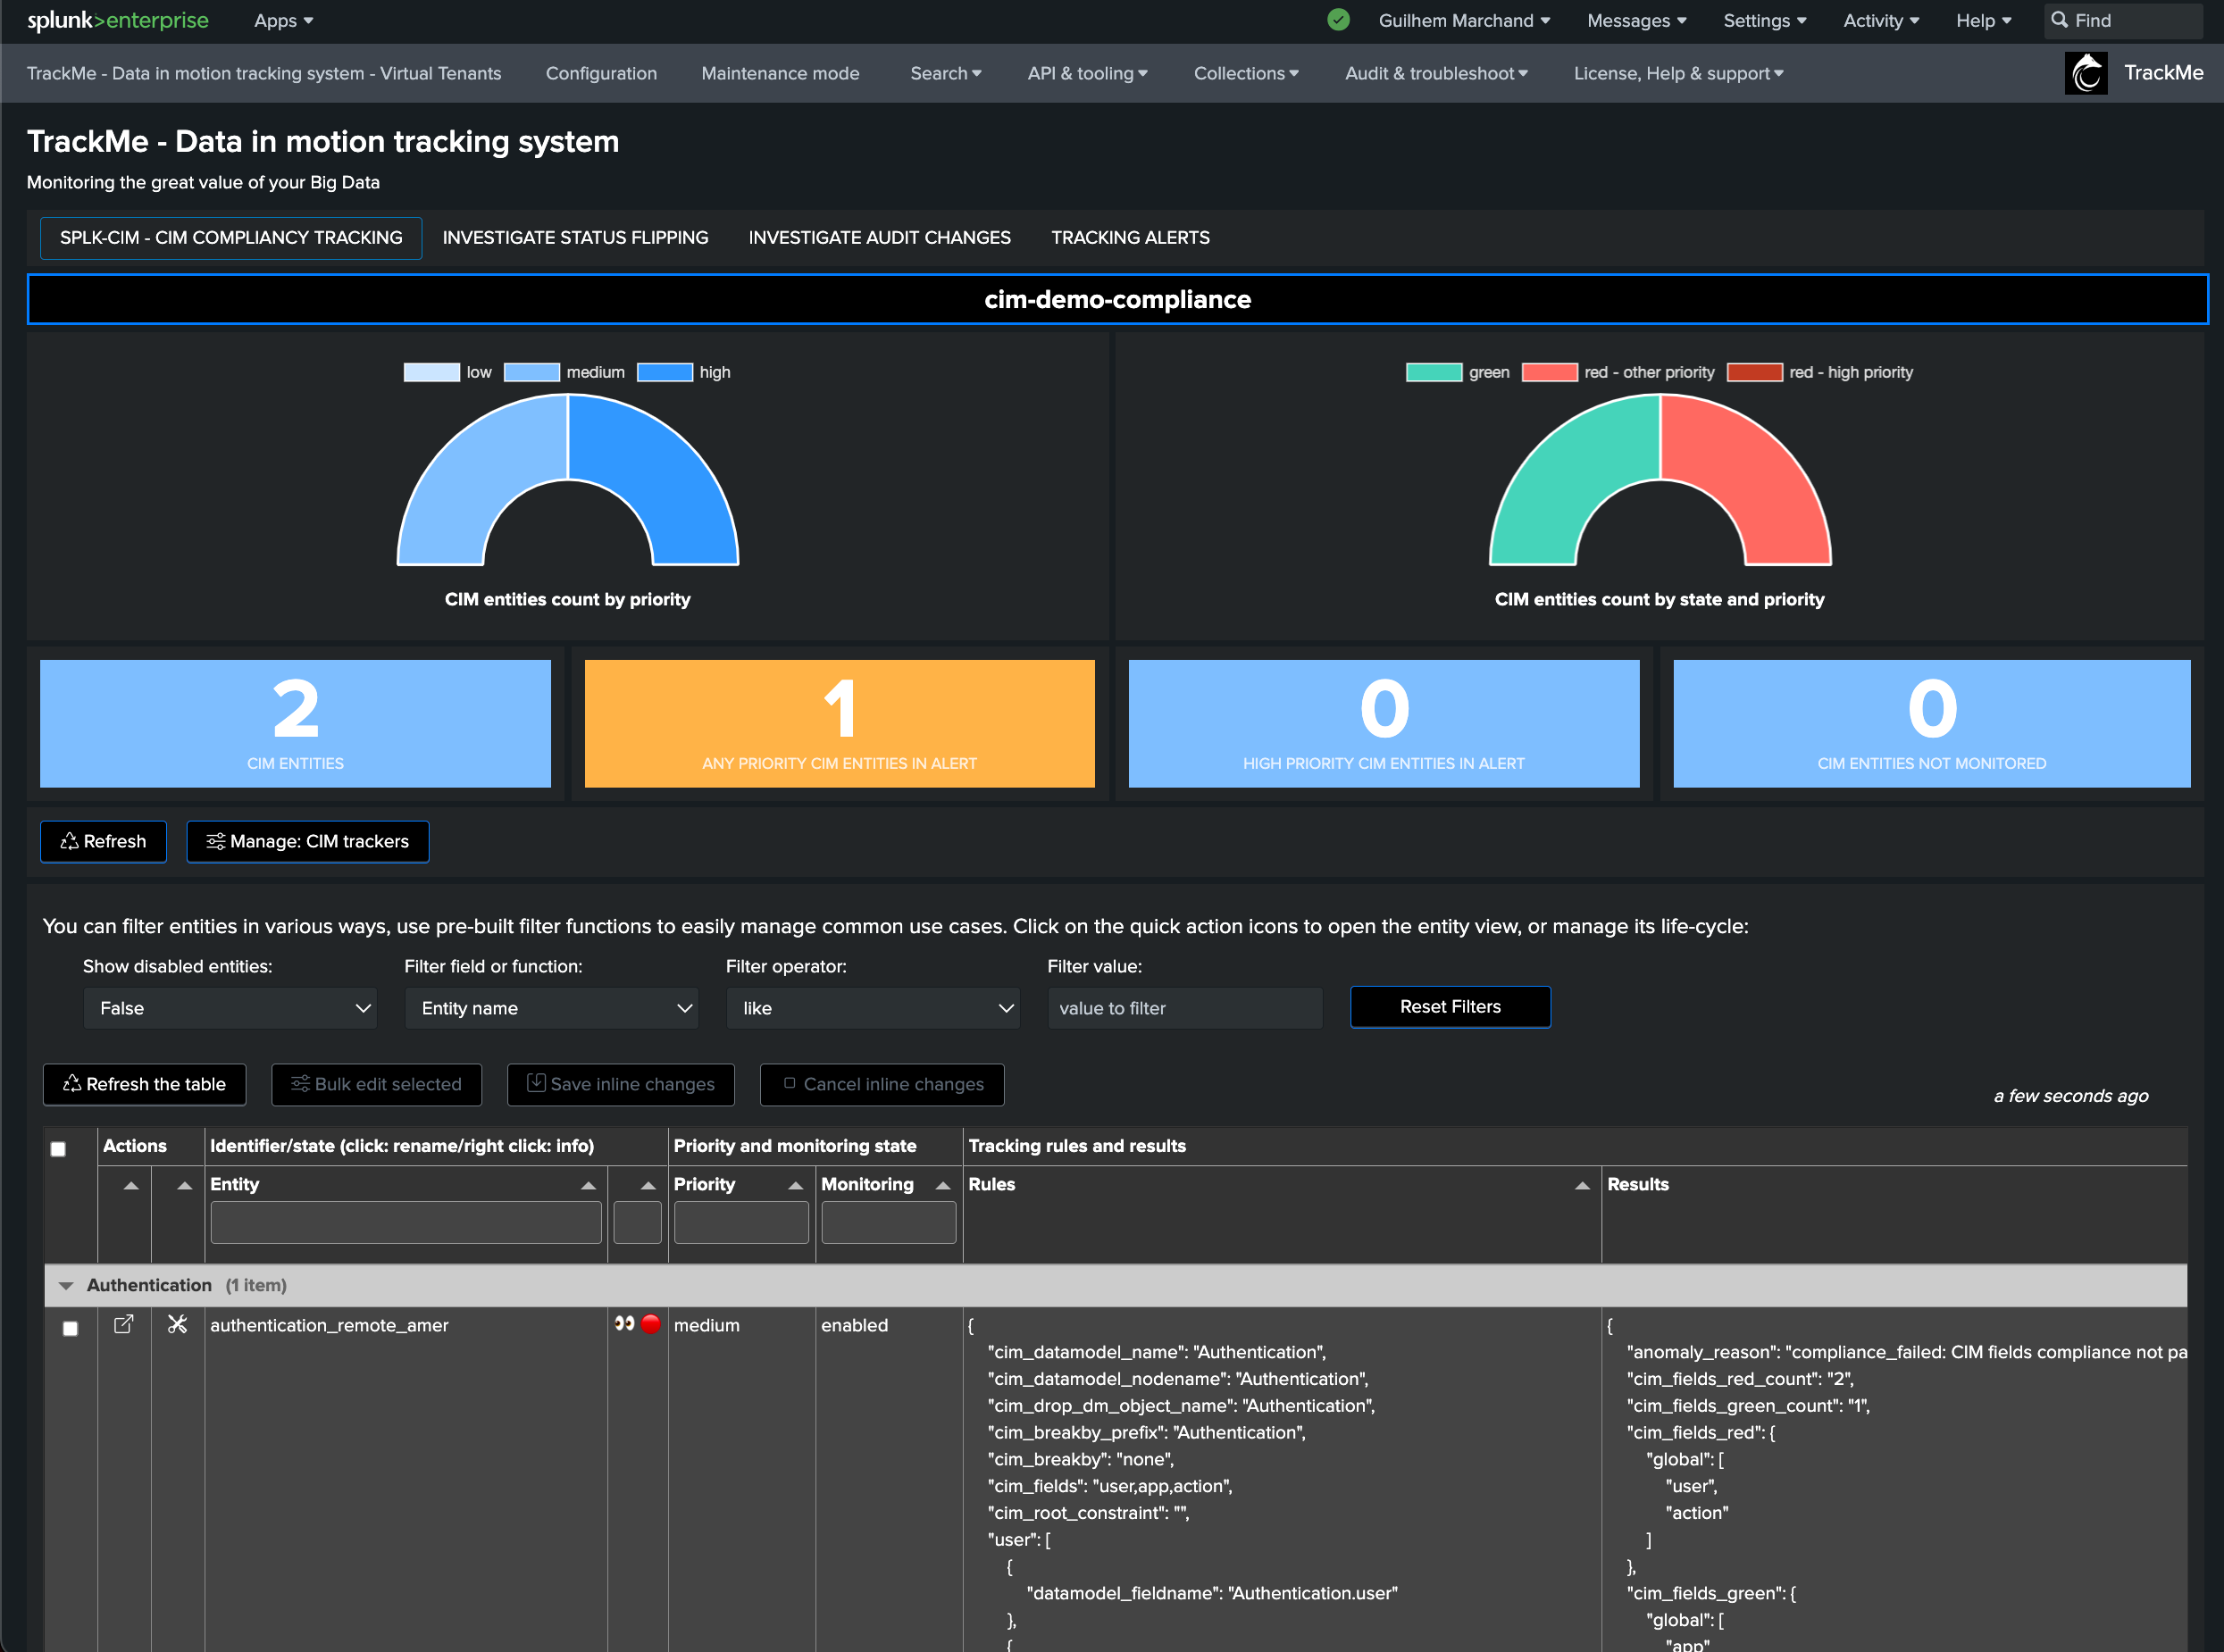
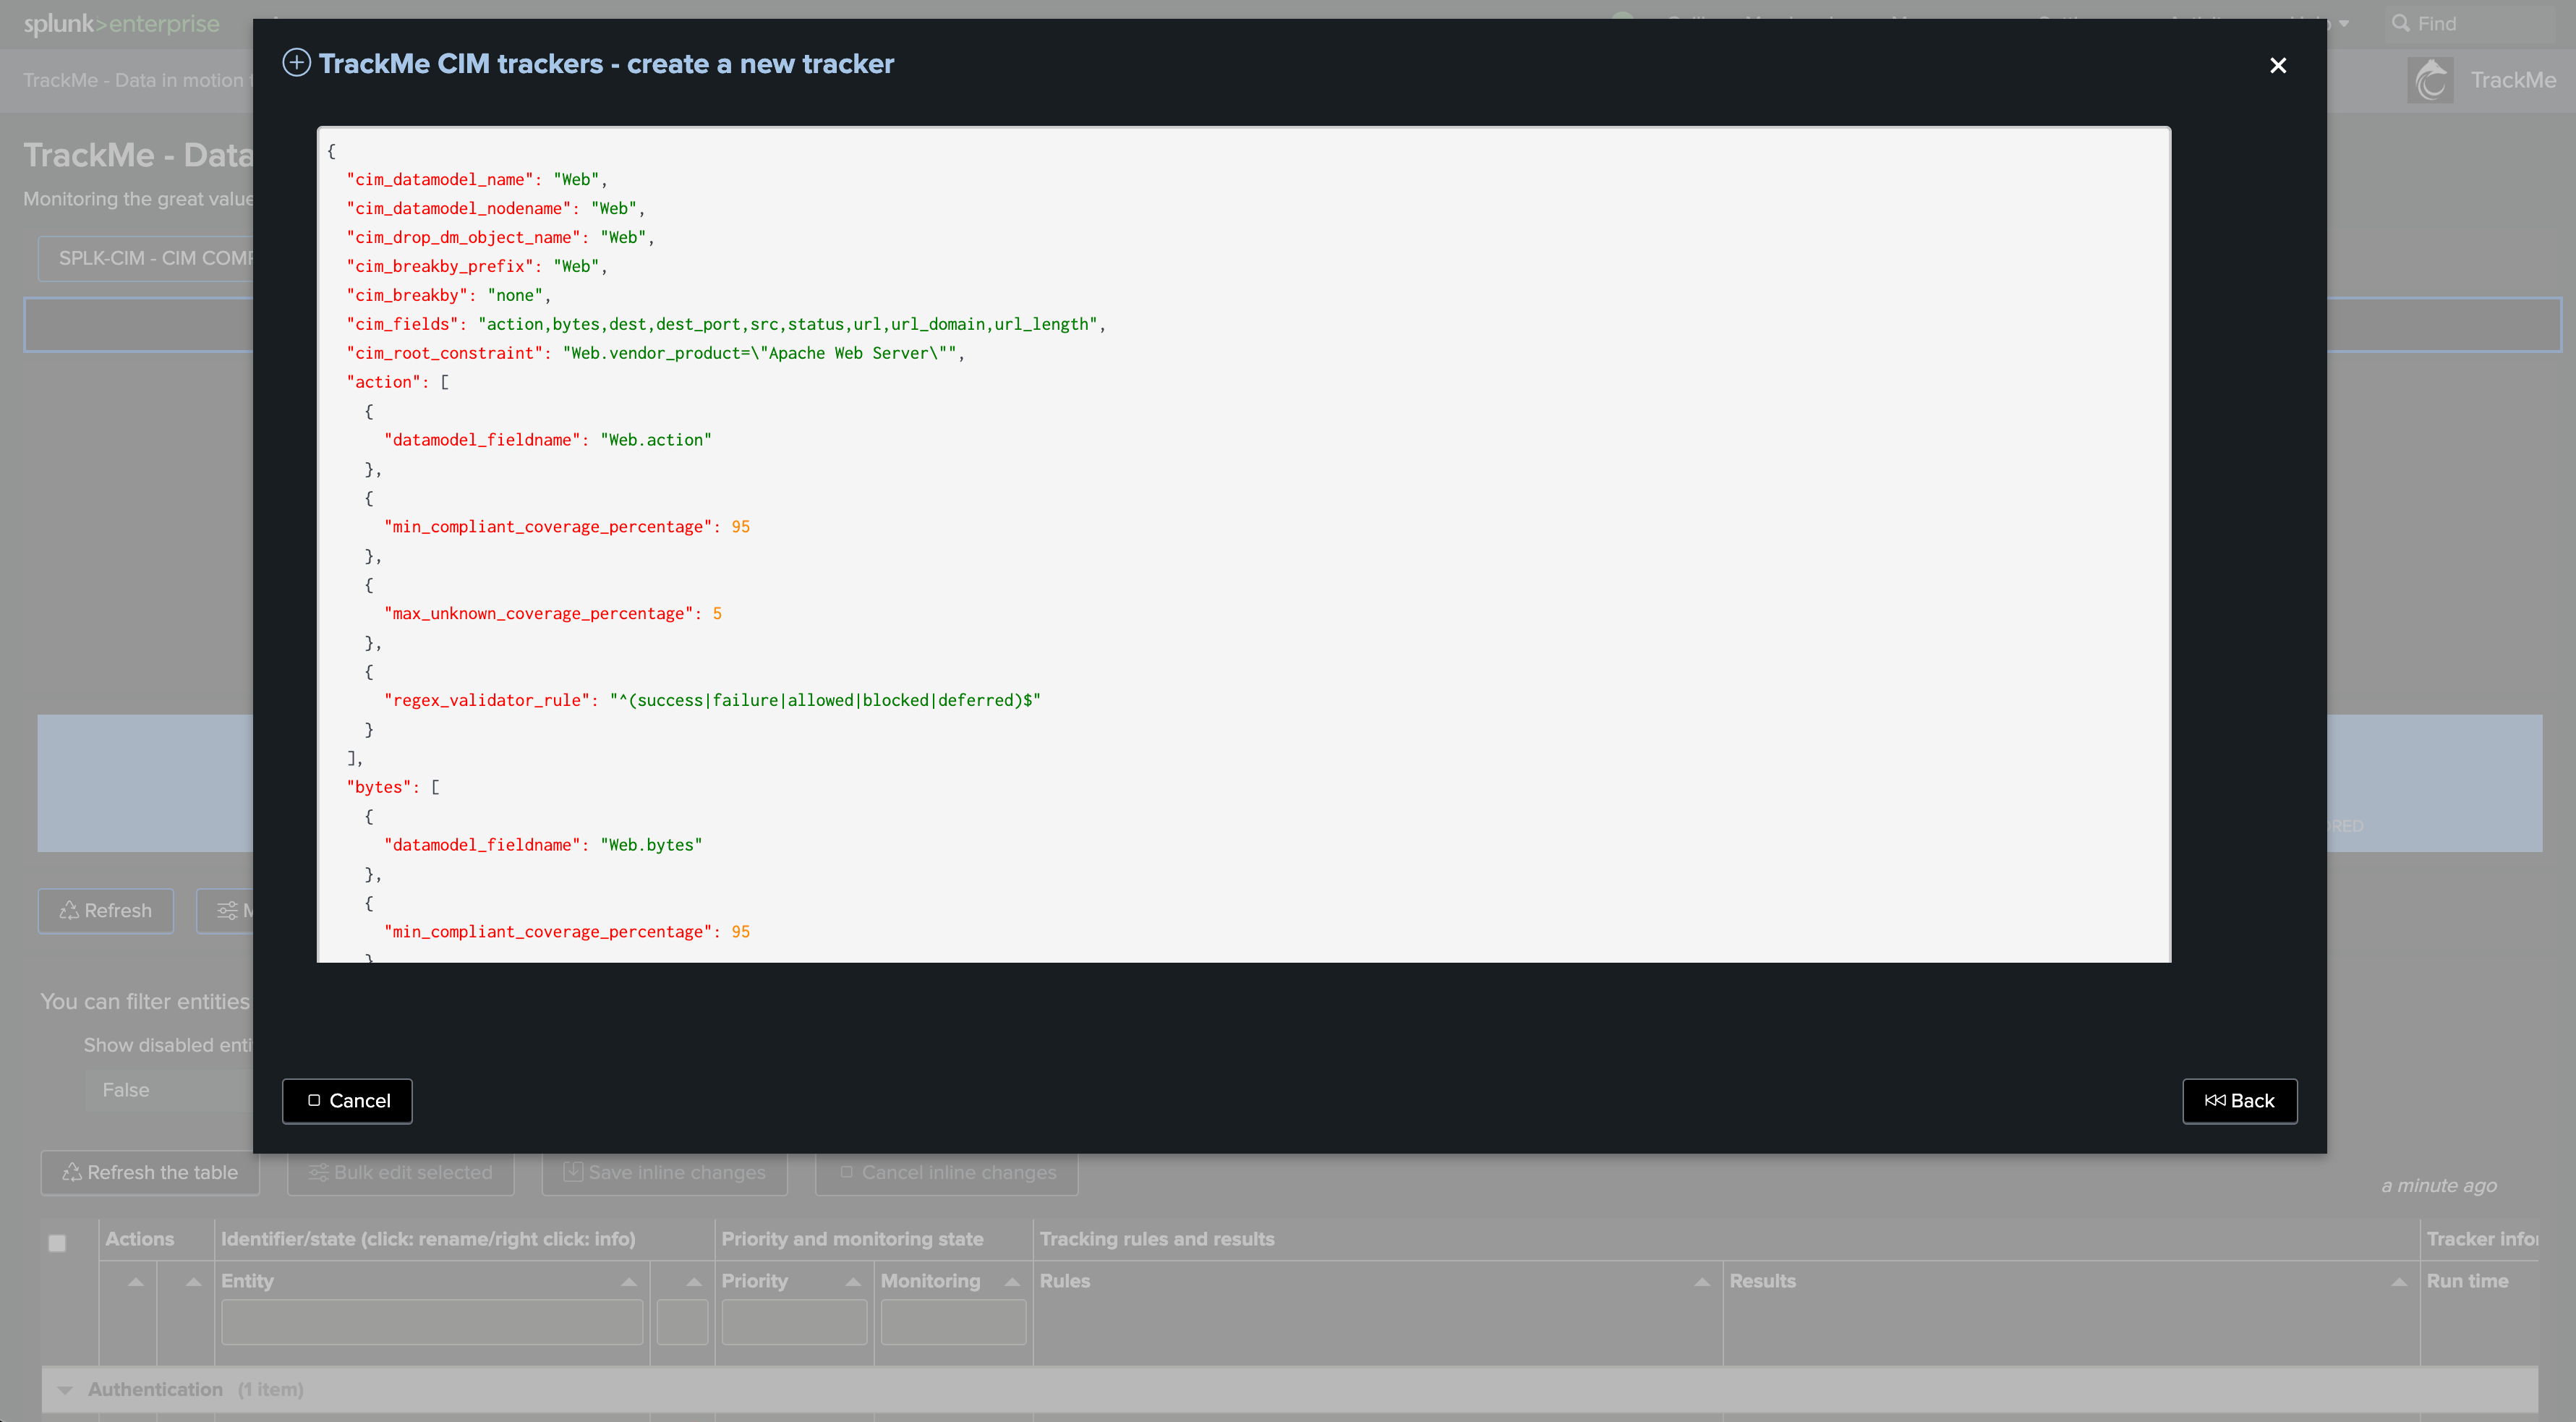
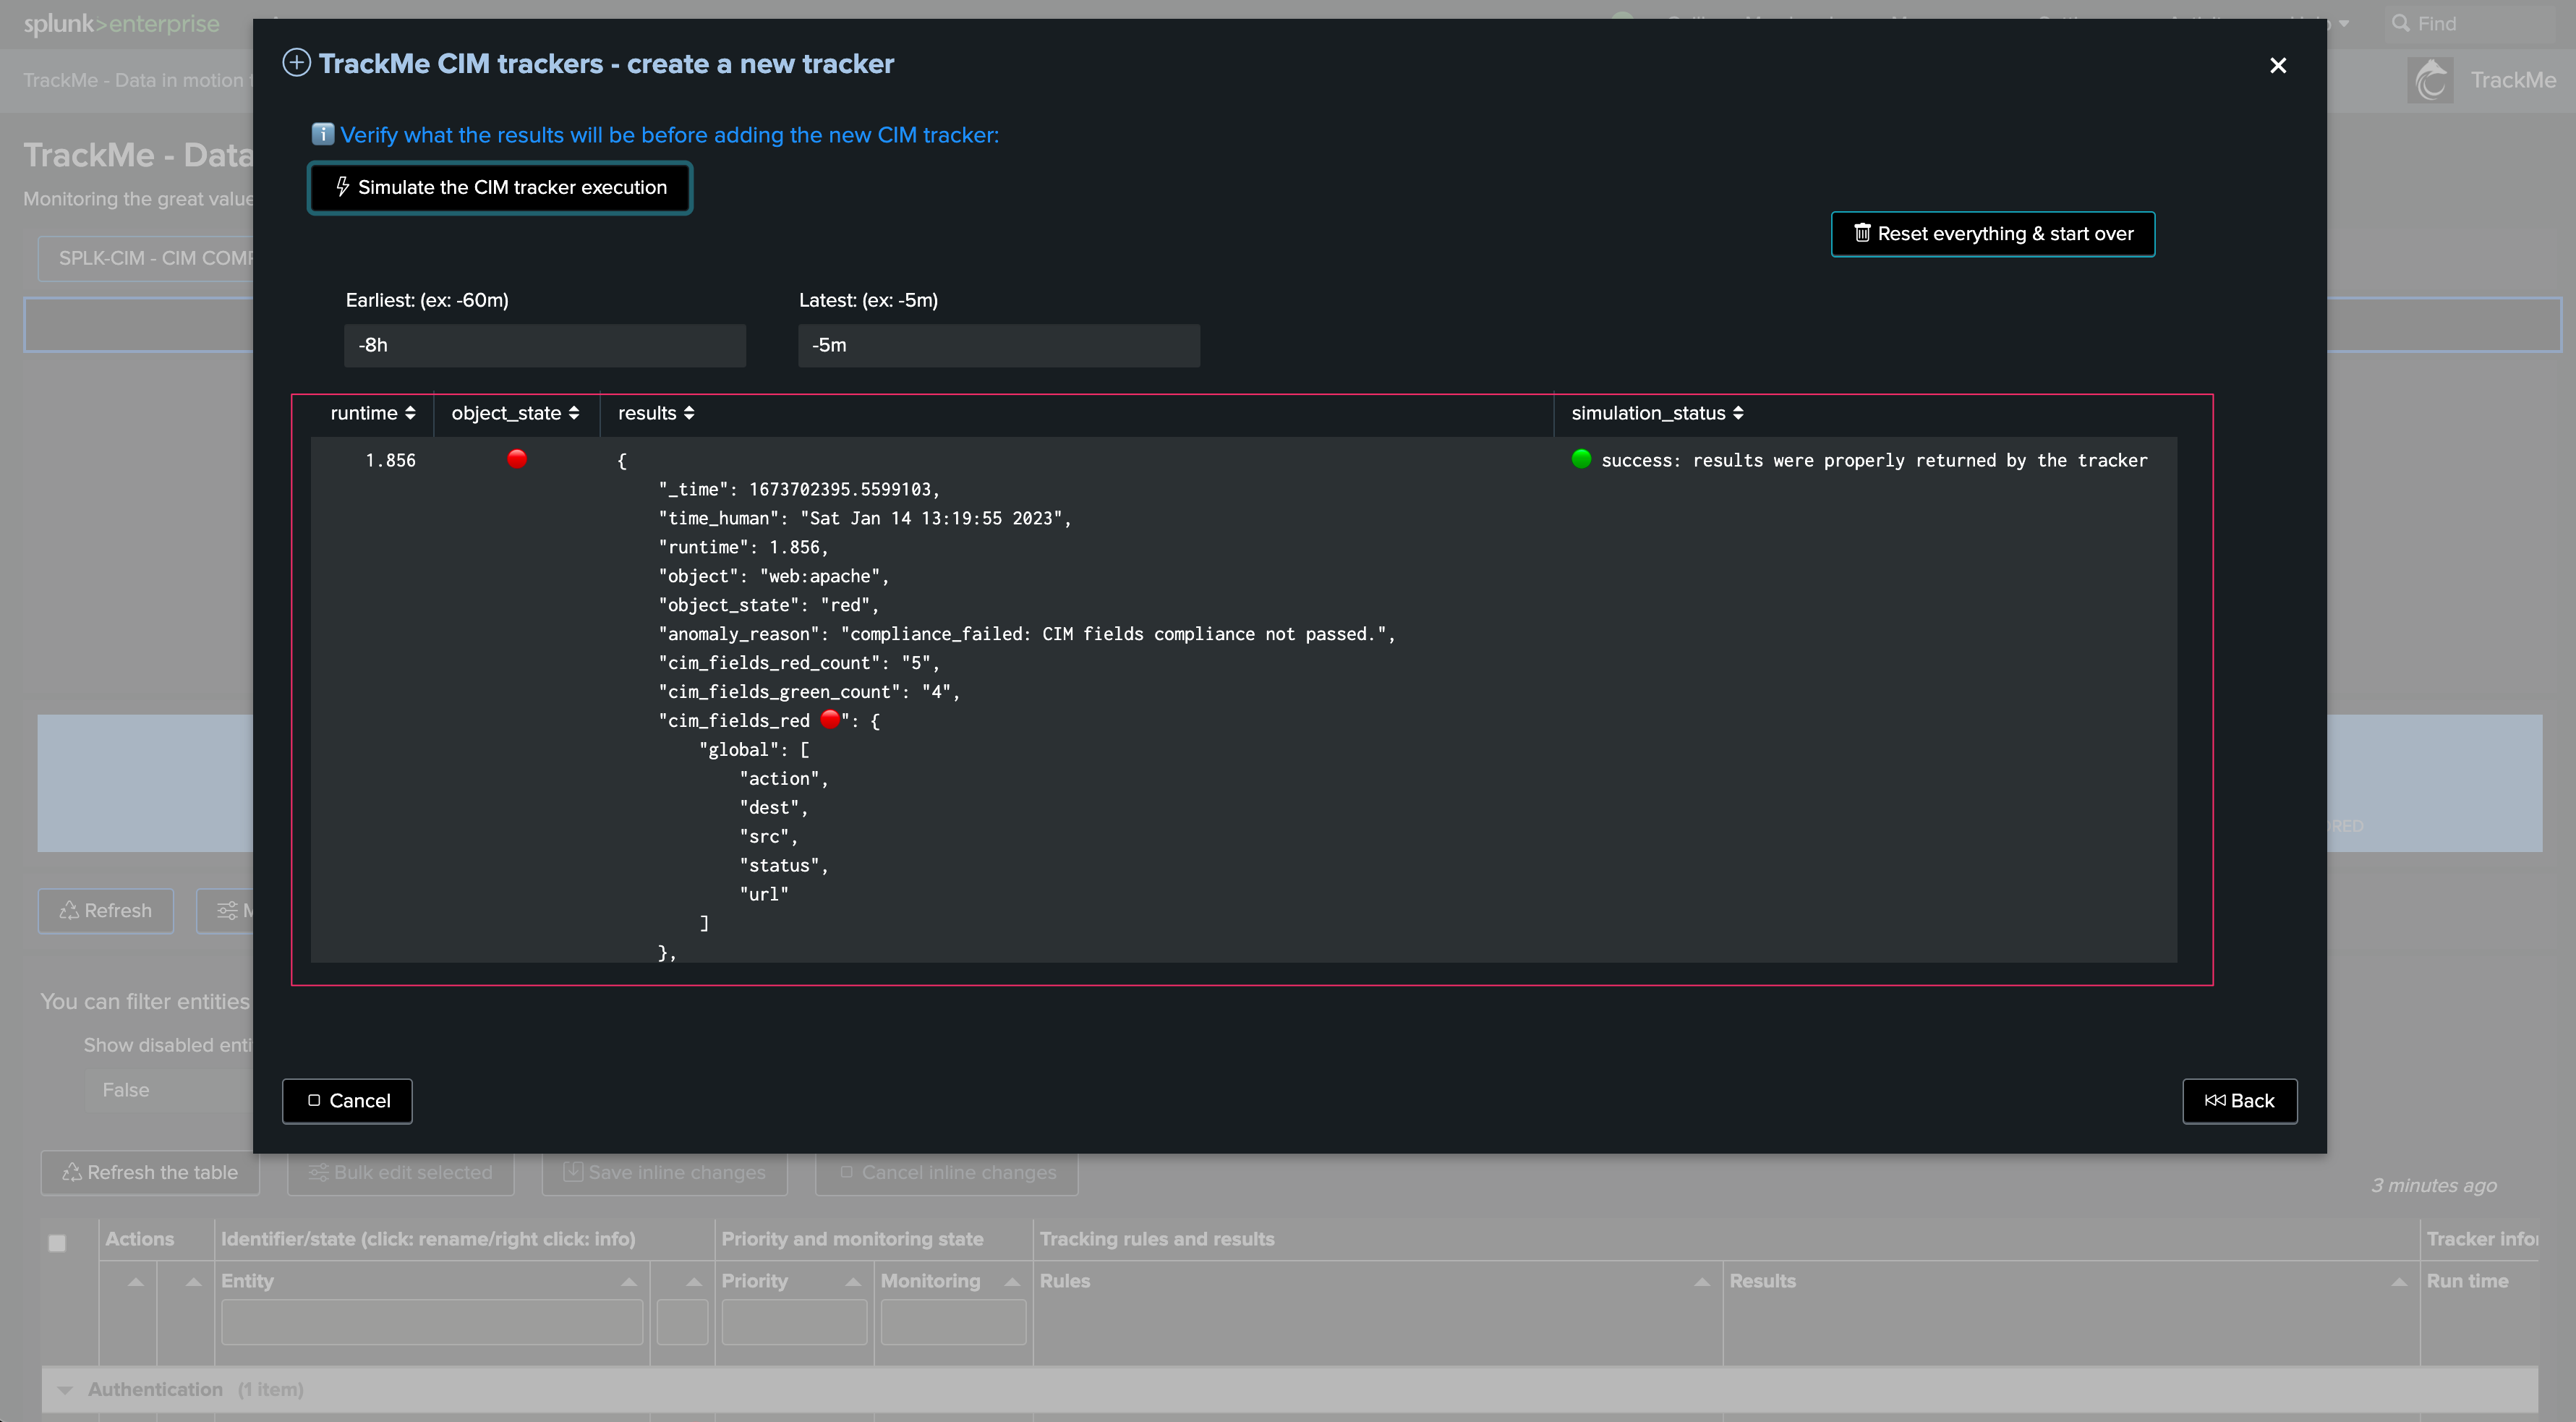
To create a new Hybrid Tracker, access the tenant and click on “Manage: Hybrid Trackers”:
splk-dsm Hybrid Tracker creation wizard:
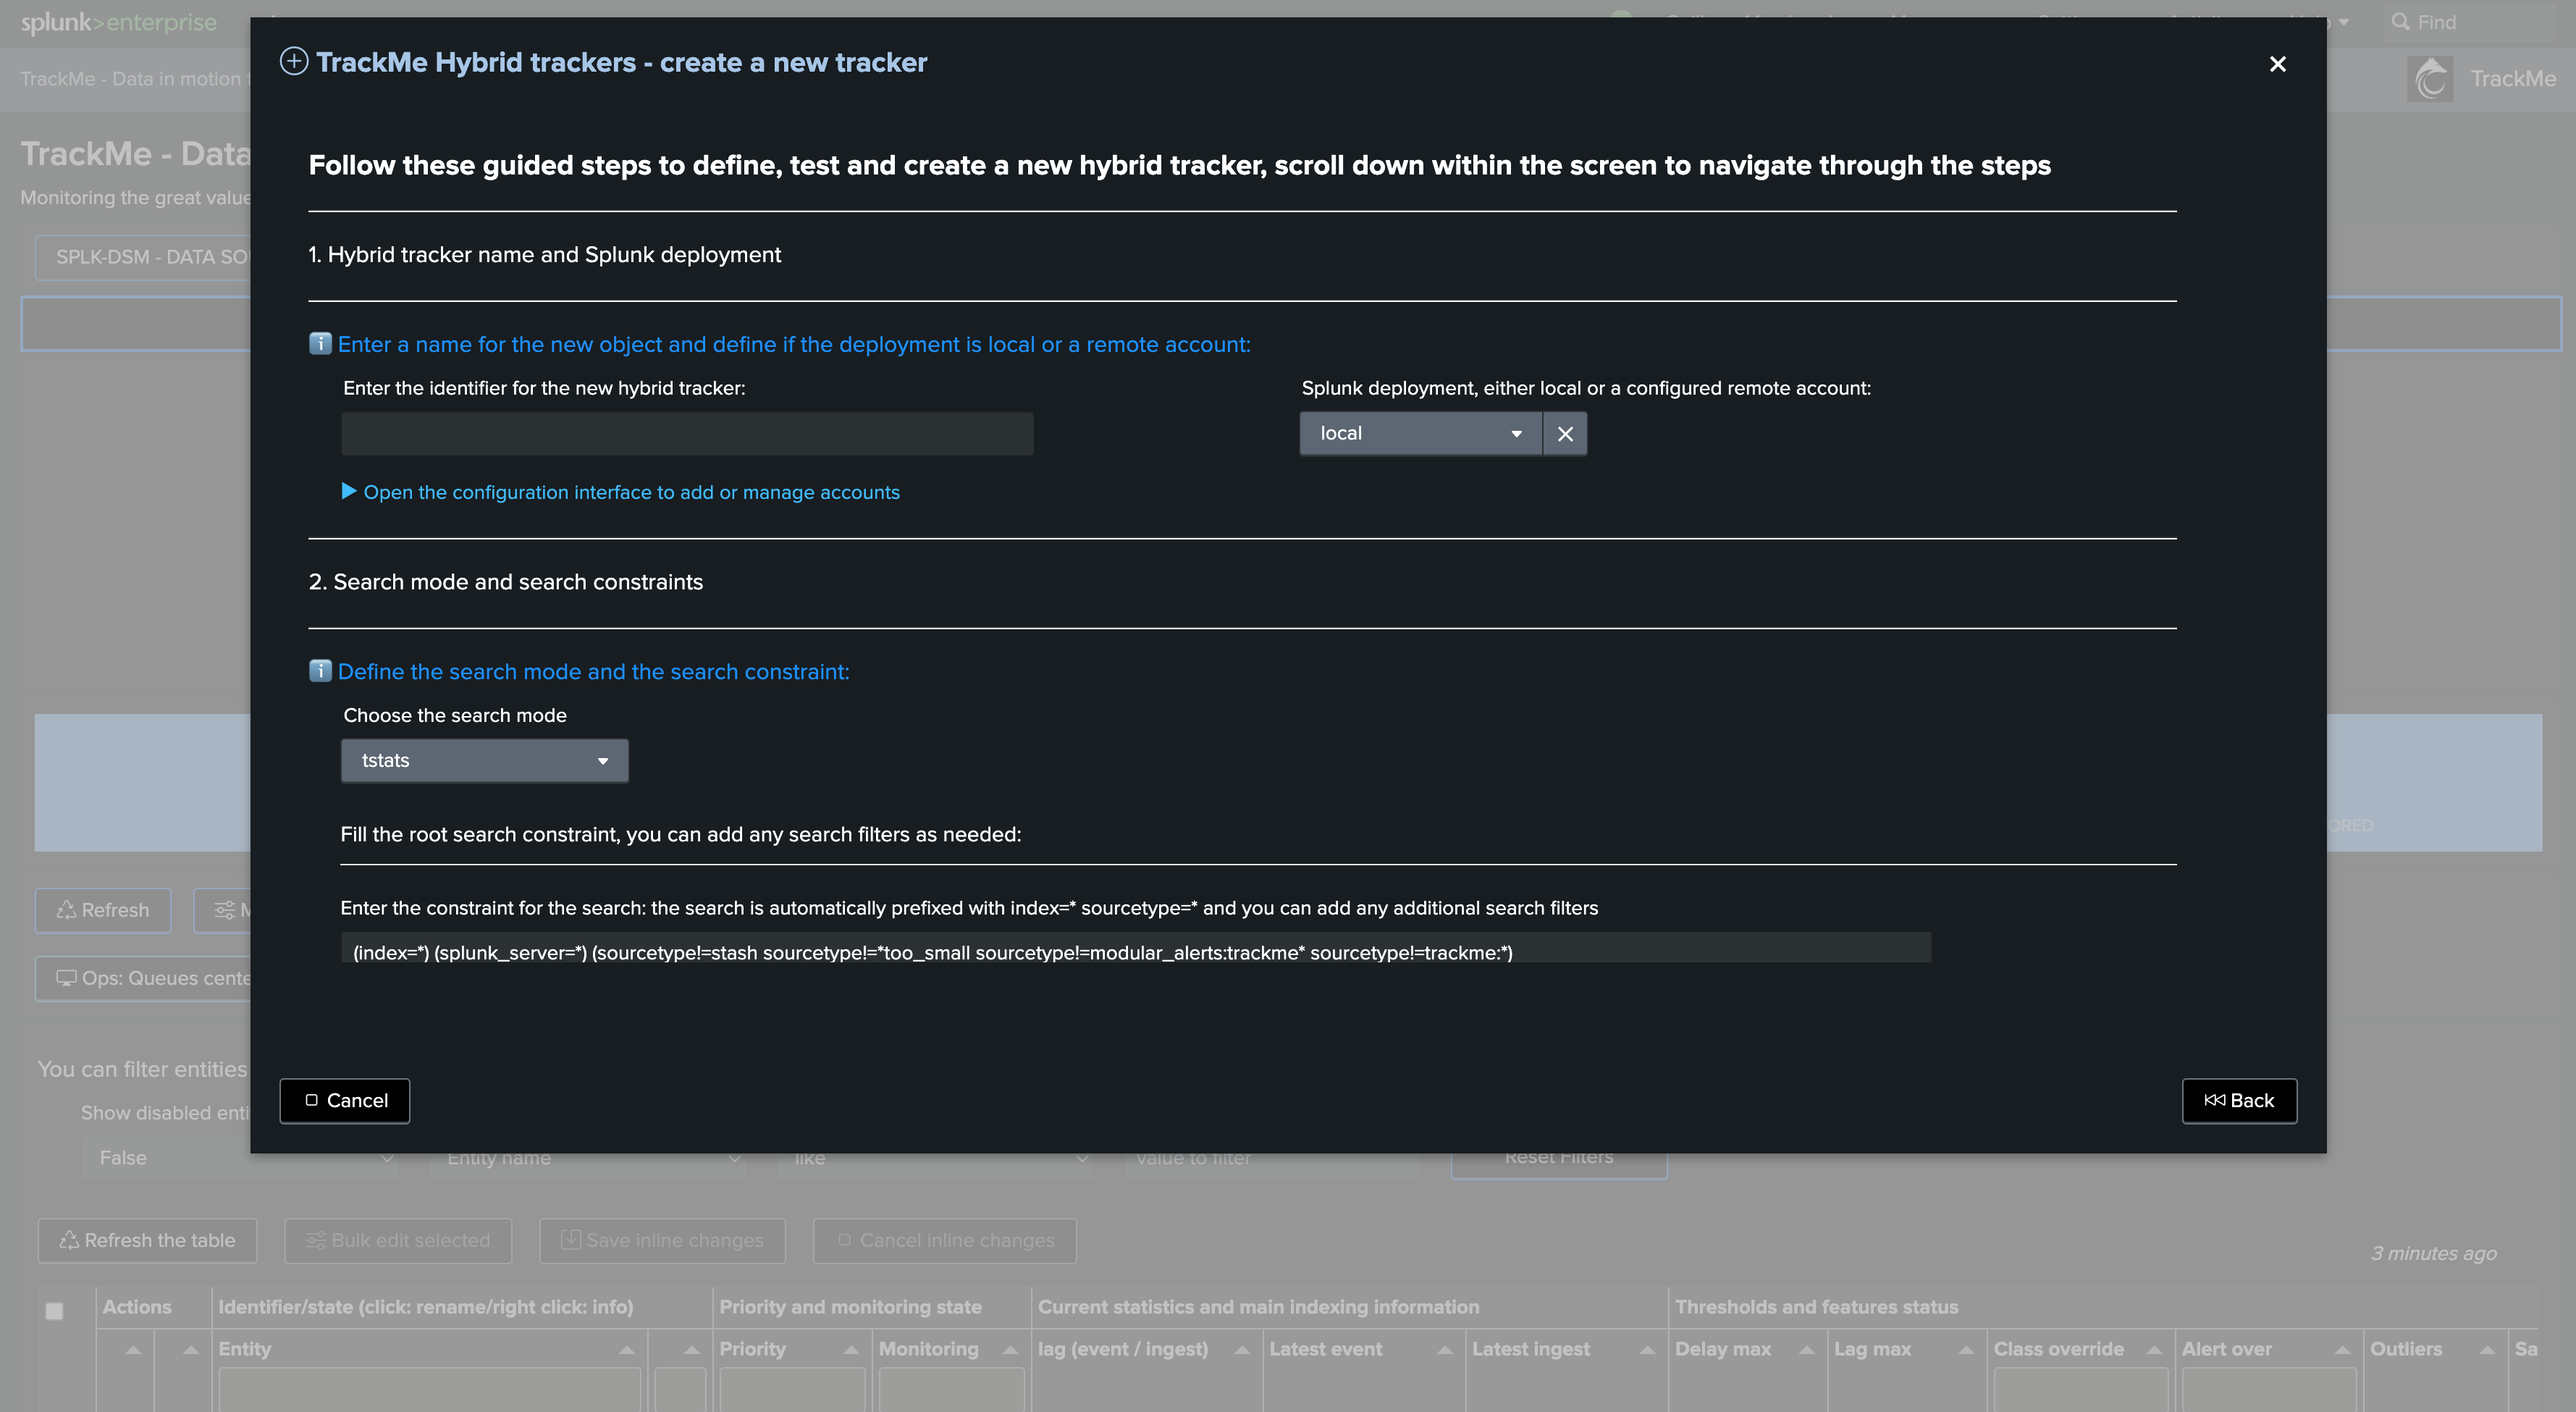
Once in the creation wizard, follow the guided steps:
Hybrid Tracker identifier:
Provide a name for the Hybrid Tracker. This will be included in the name of the Splunk Knowledge Objects related to this tracker
In the example below, we will name our tracker “endpoints_os_data” as it deals with events originating from Operating Systems
Target Splunk deployment:
Specify whether the data is searchable locally on the Splunk deployment or if the trackers deal with a remote Splunk deployment
If a remote Splunk deployment is selected, TrackMe performs a connectivity check to that environment first
Search mode and search root constraint:
tstats versus raw versus lookups
Then, define the search mode. You can choose between
tstats,rawand (for splk-dsm only)lookupststatsis generally recommended as it provides much faster and more efficient searches relying on Splunk tsidx filesHowever, tstats requires all fields to be indexed fields, while a raw search can deal with search-time extracted fields
Therefore, raw search provides much more flexibility, but the cost is also much higher
Depending on your context, raw searches may be fully valid, but if a tstats search can be used equally, use tstats
lookupsis a dedicated search mode for monitoring CSV files and KVstore collections as DSM entities — see the dedicated guide: Lookup monitoring. The wizard hides the SPL constraint editor when this mode is selected and replaces Steps 3/4 with lookups-specific inputs (app namespace glob, lookup name regex, lookup type, KVstore time fields, delay threshold).
root search constraint:
Define the Splunk root search constraint. The constraint comes pre-filled with normally expected constraints which require valid data, exclude TrackMe related items, etc.
Add your own search filters according to your needs. In our example, we add an index filter “(index=linux* OR index=win*)”
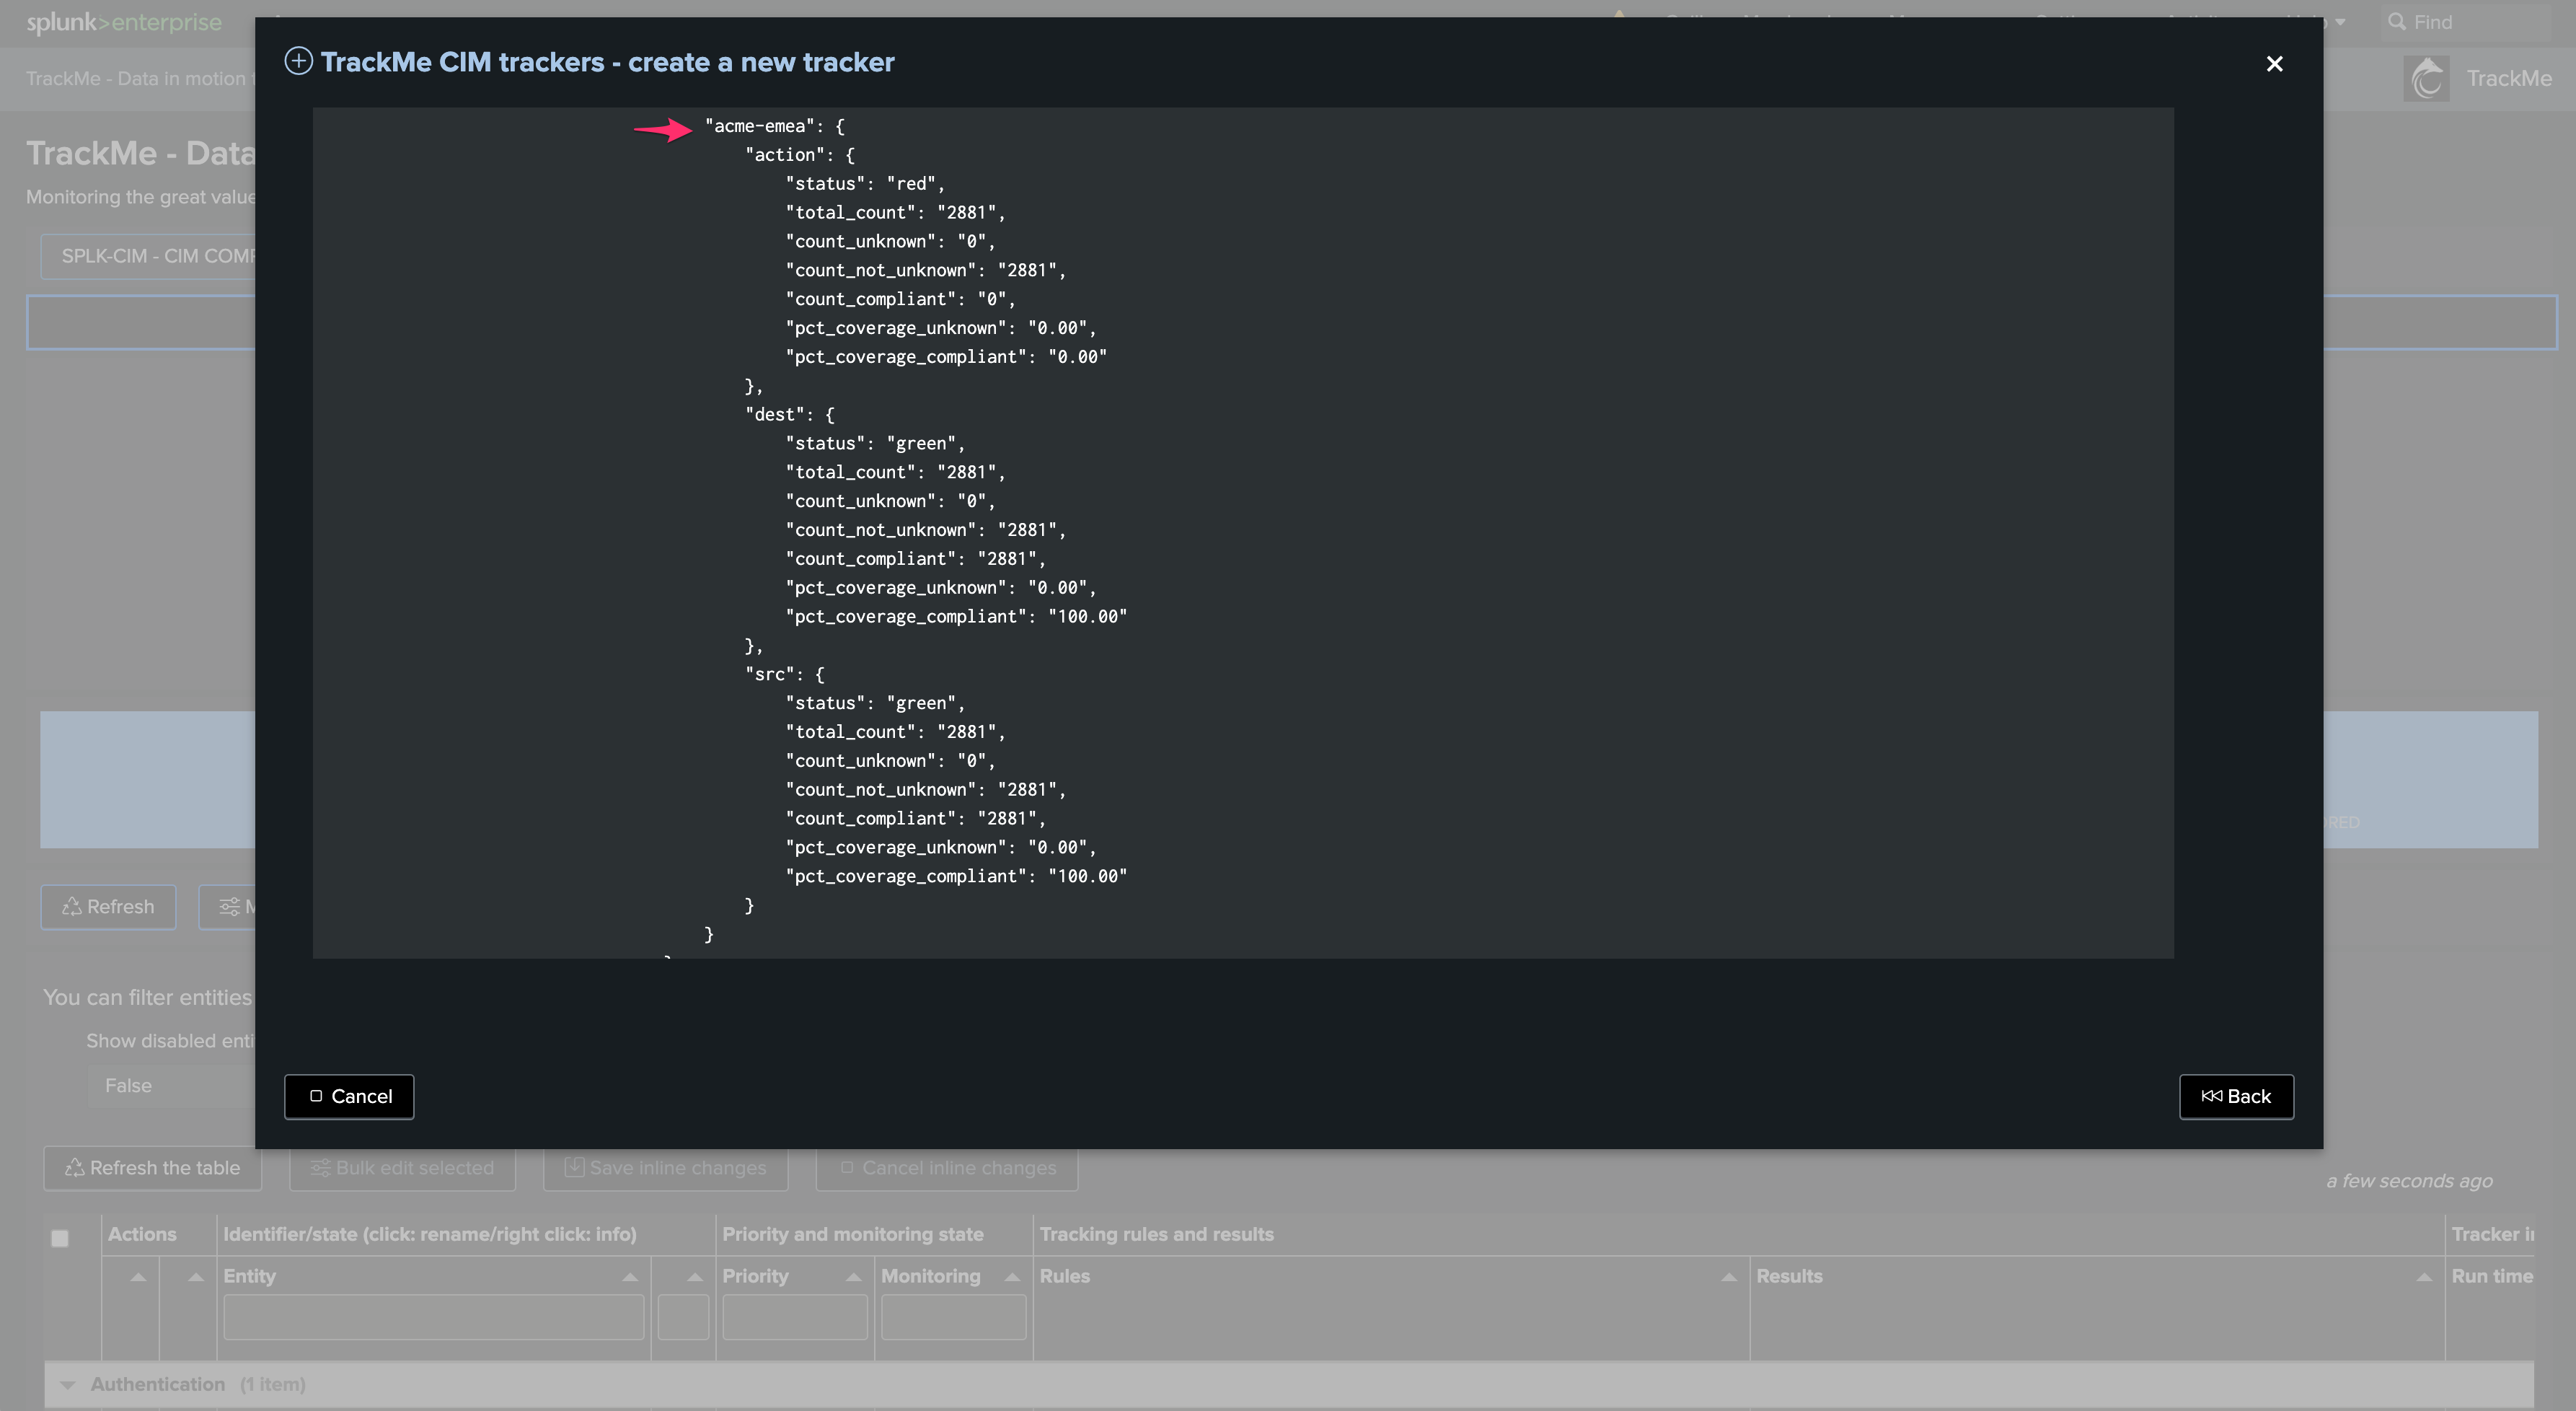
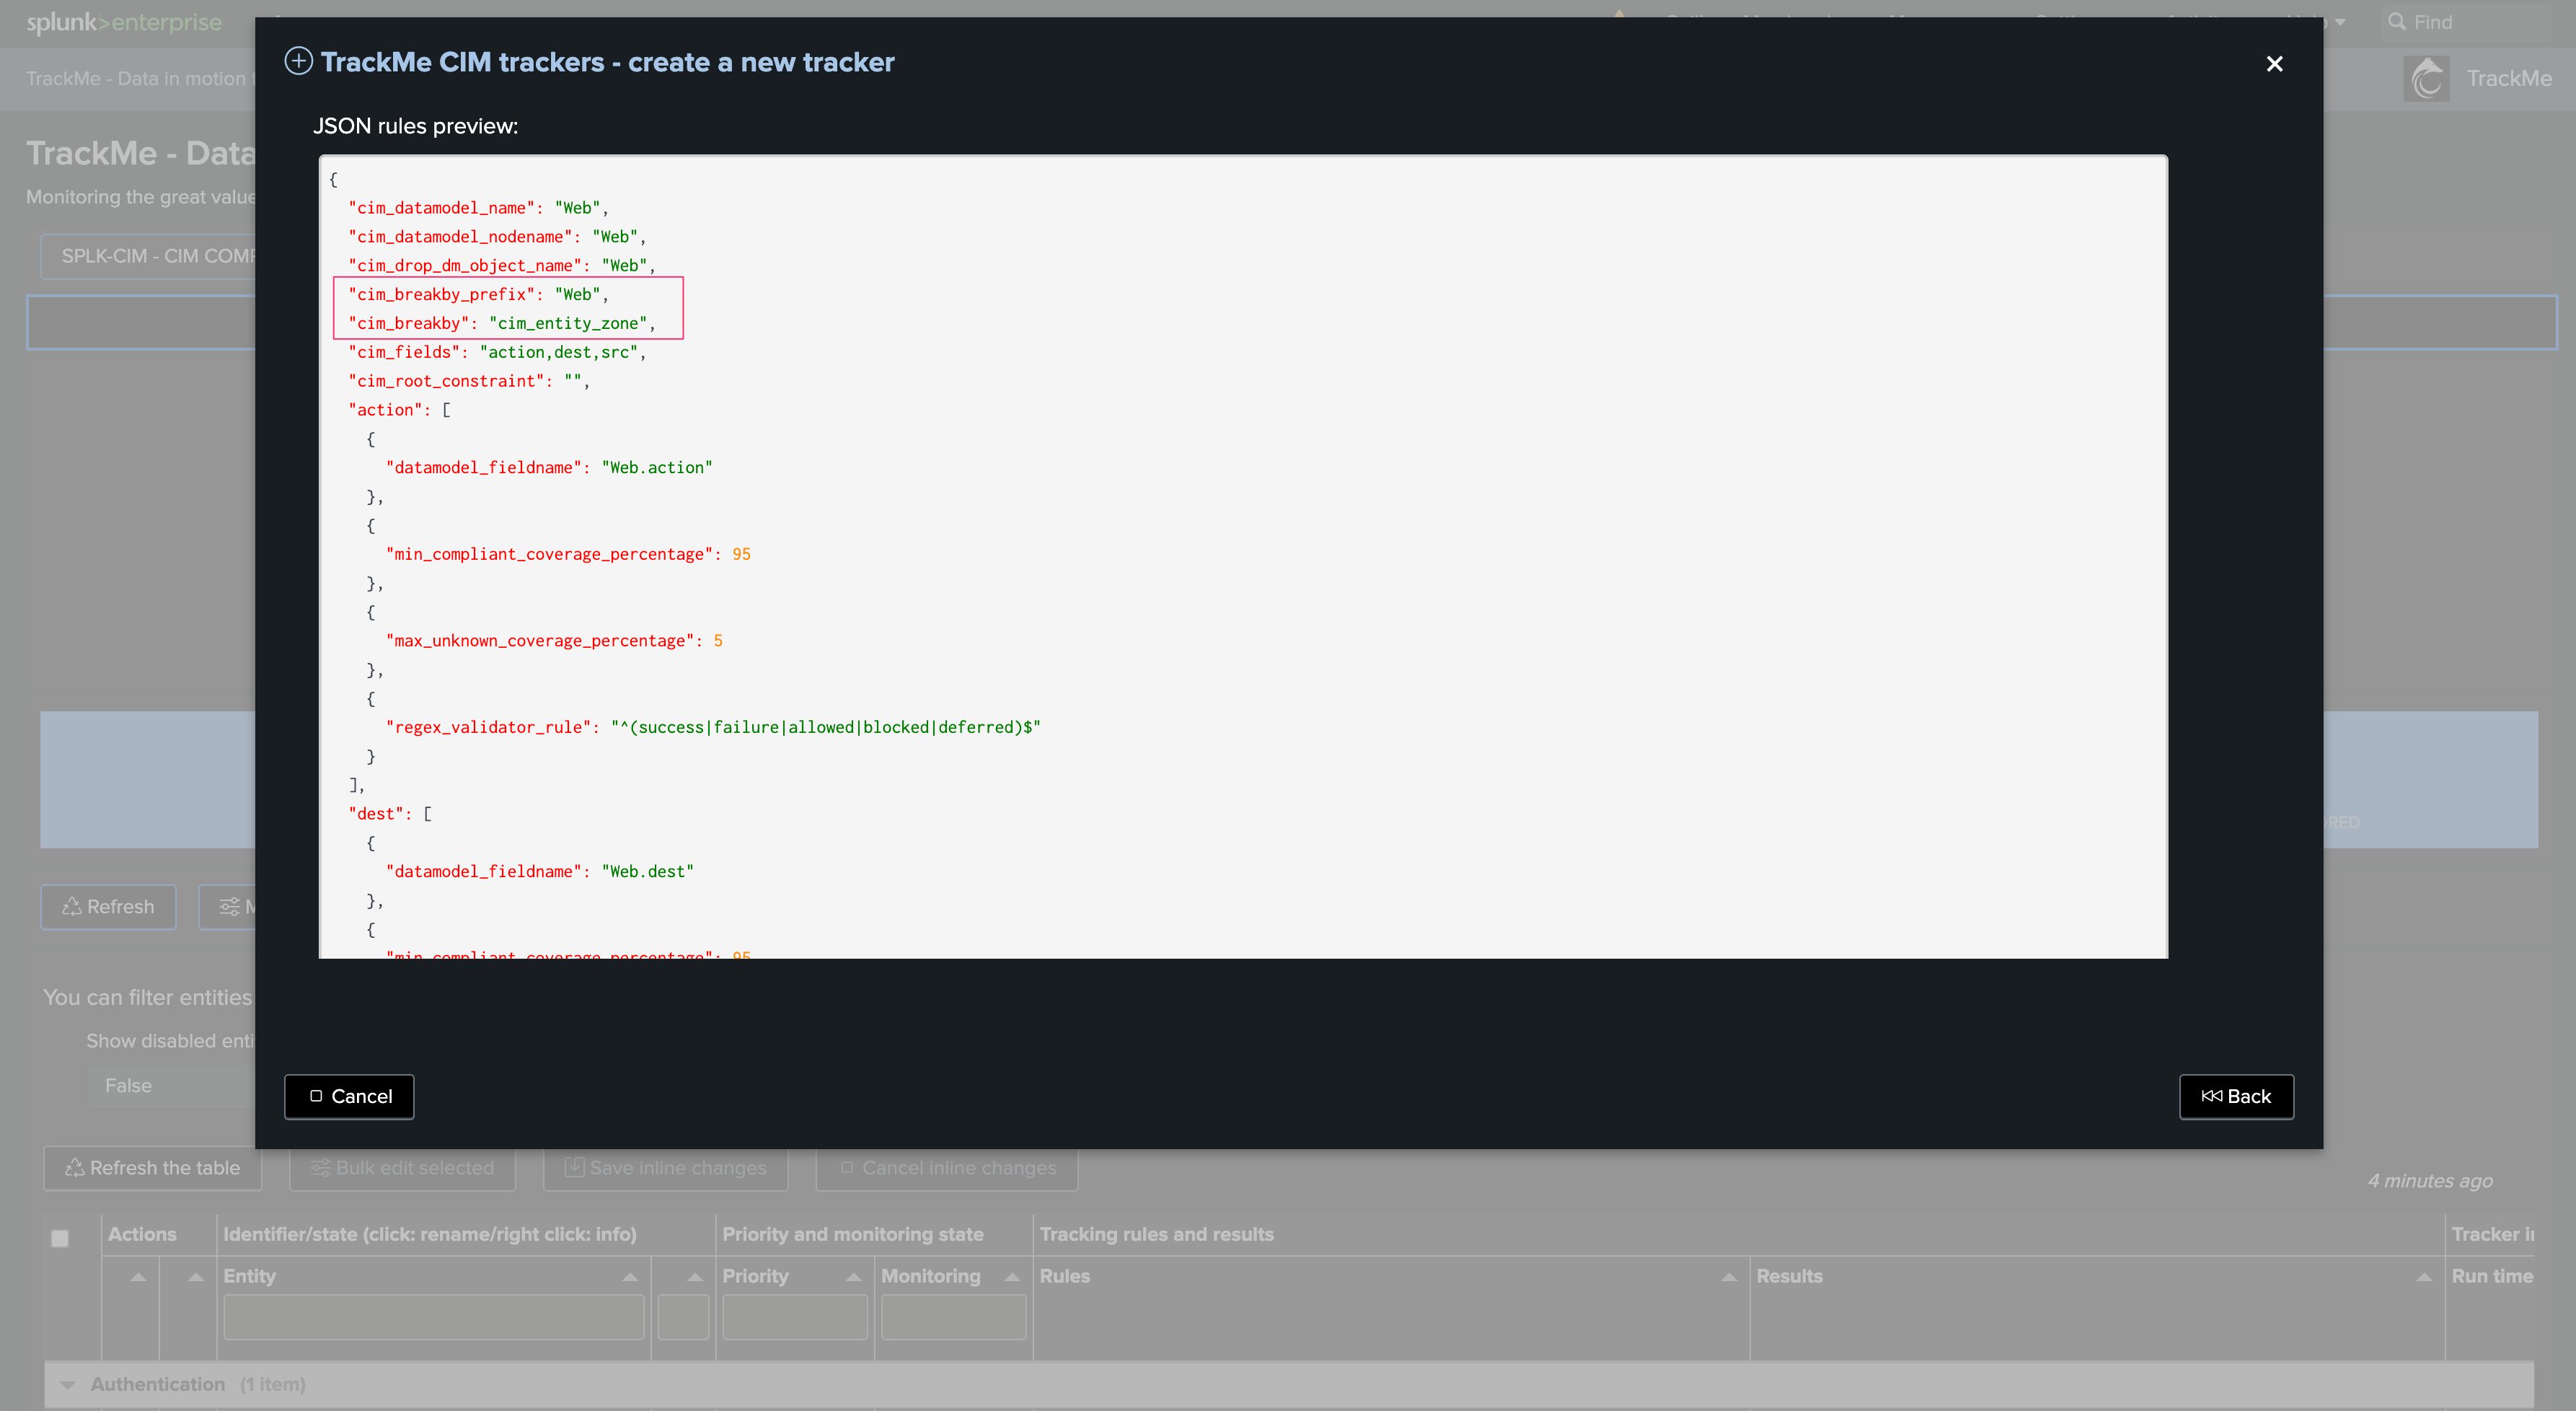
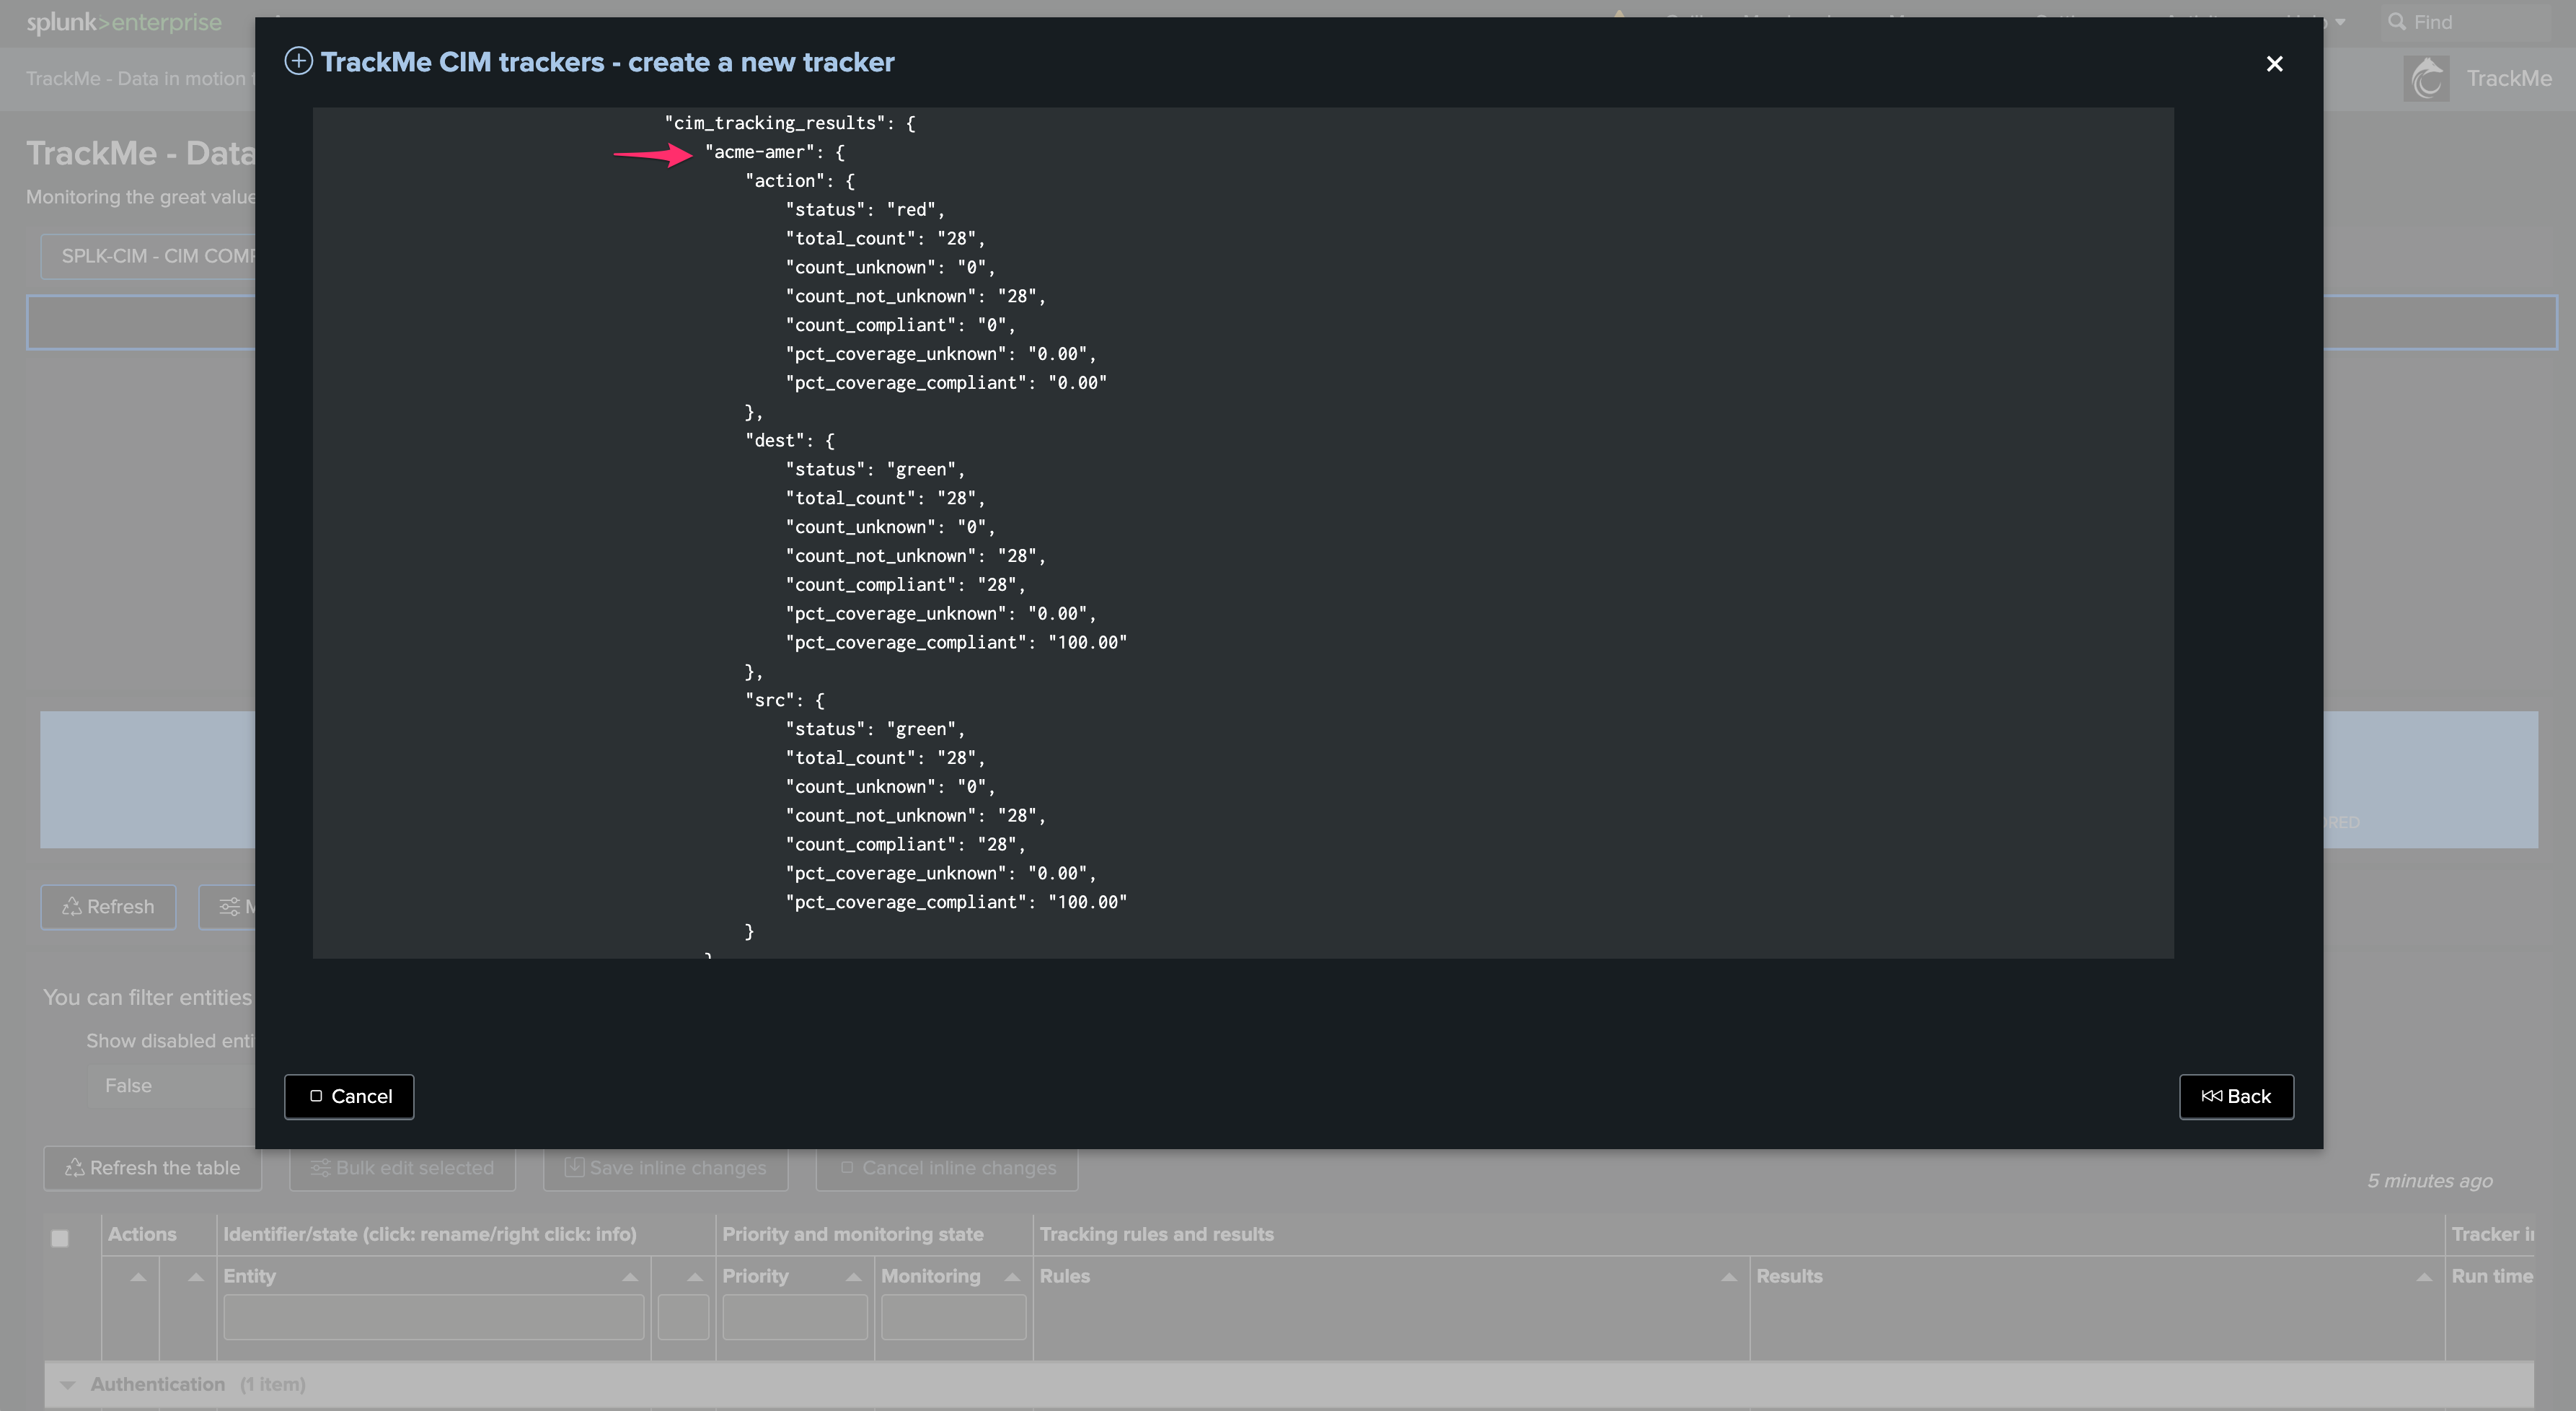
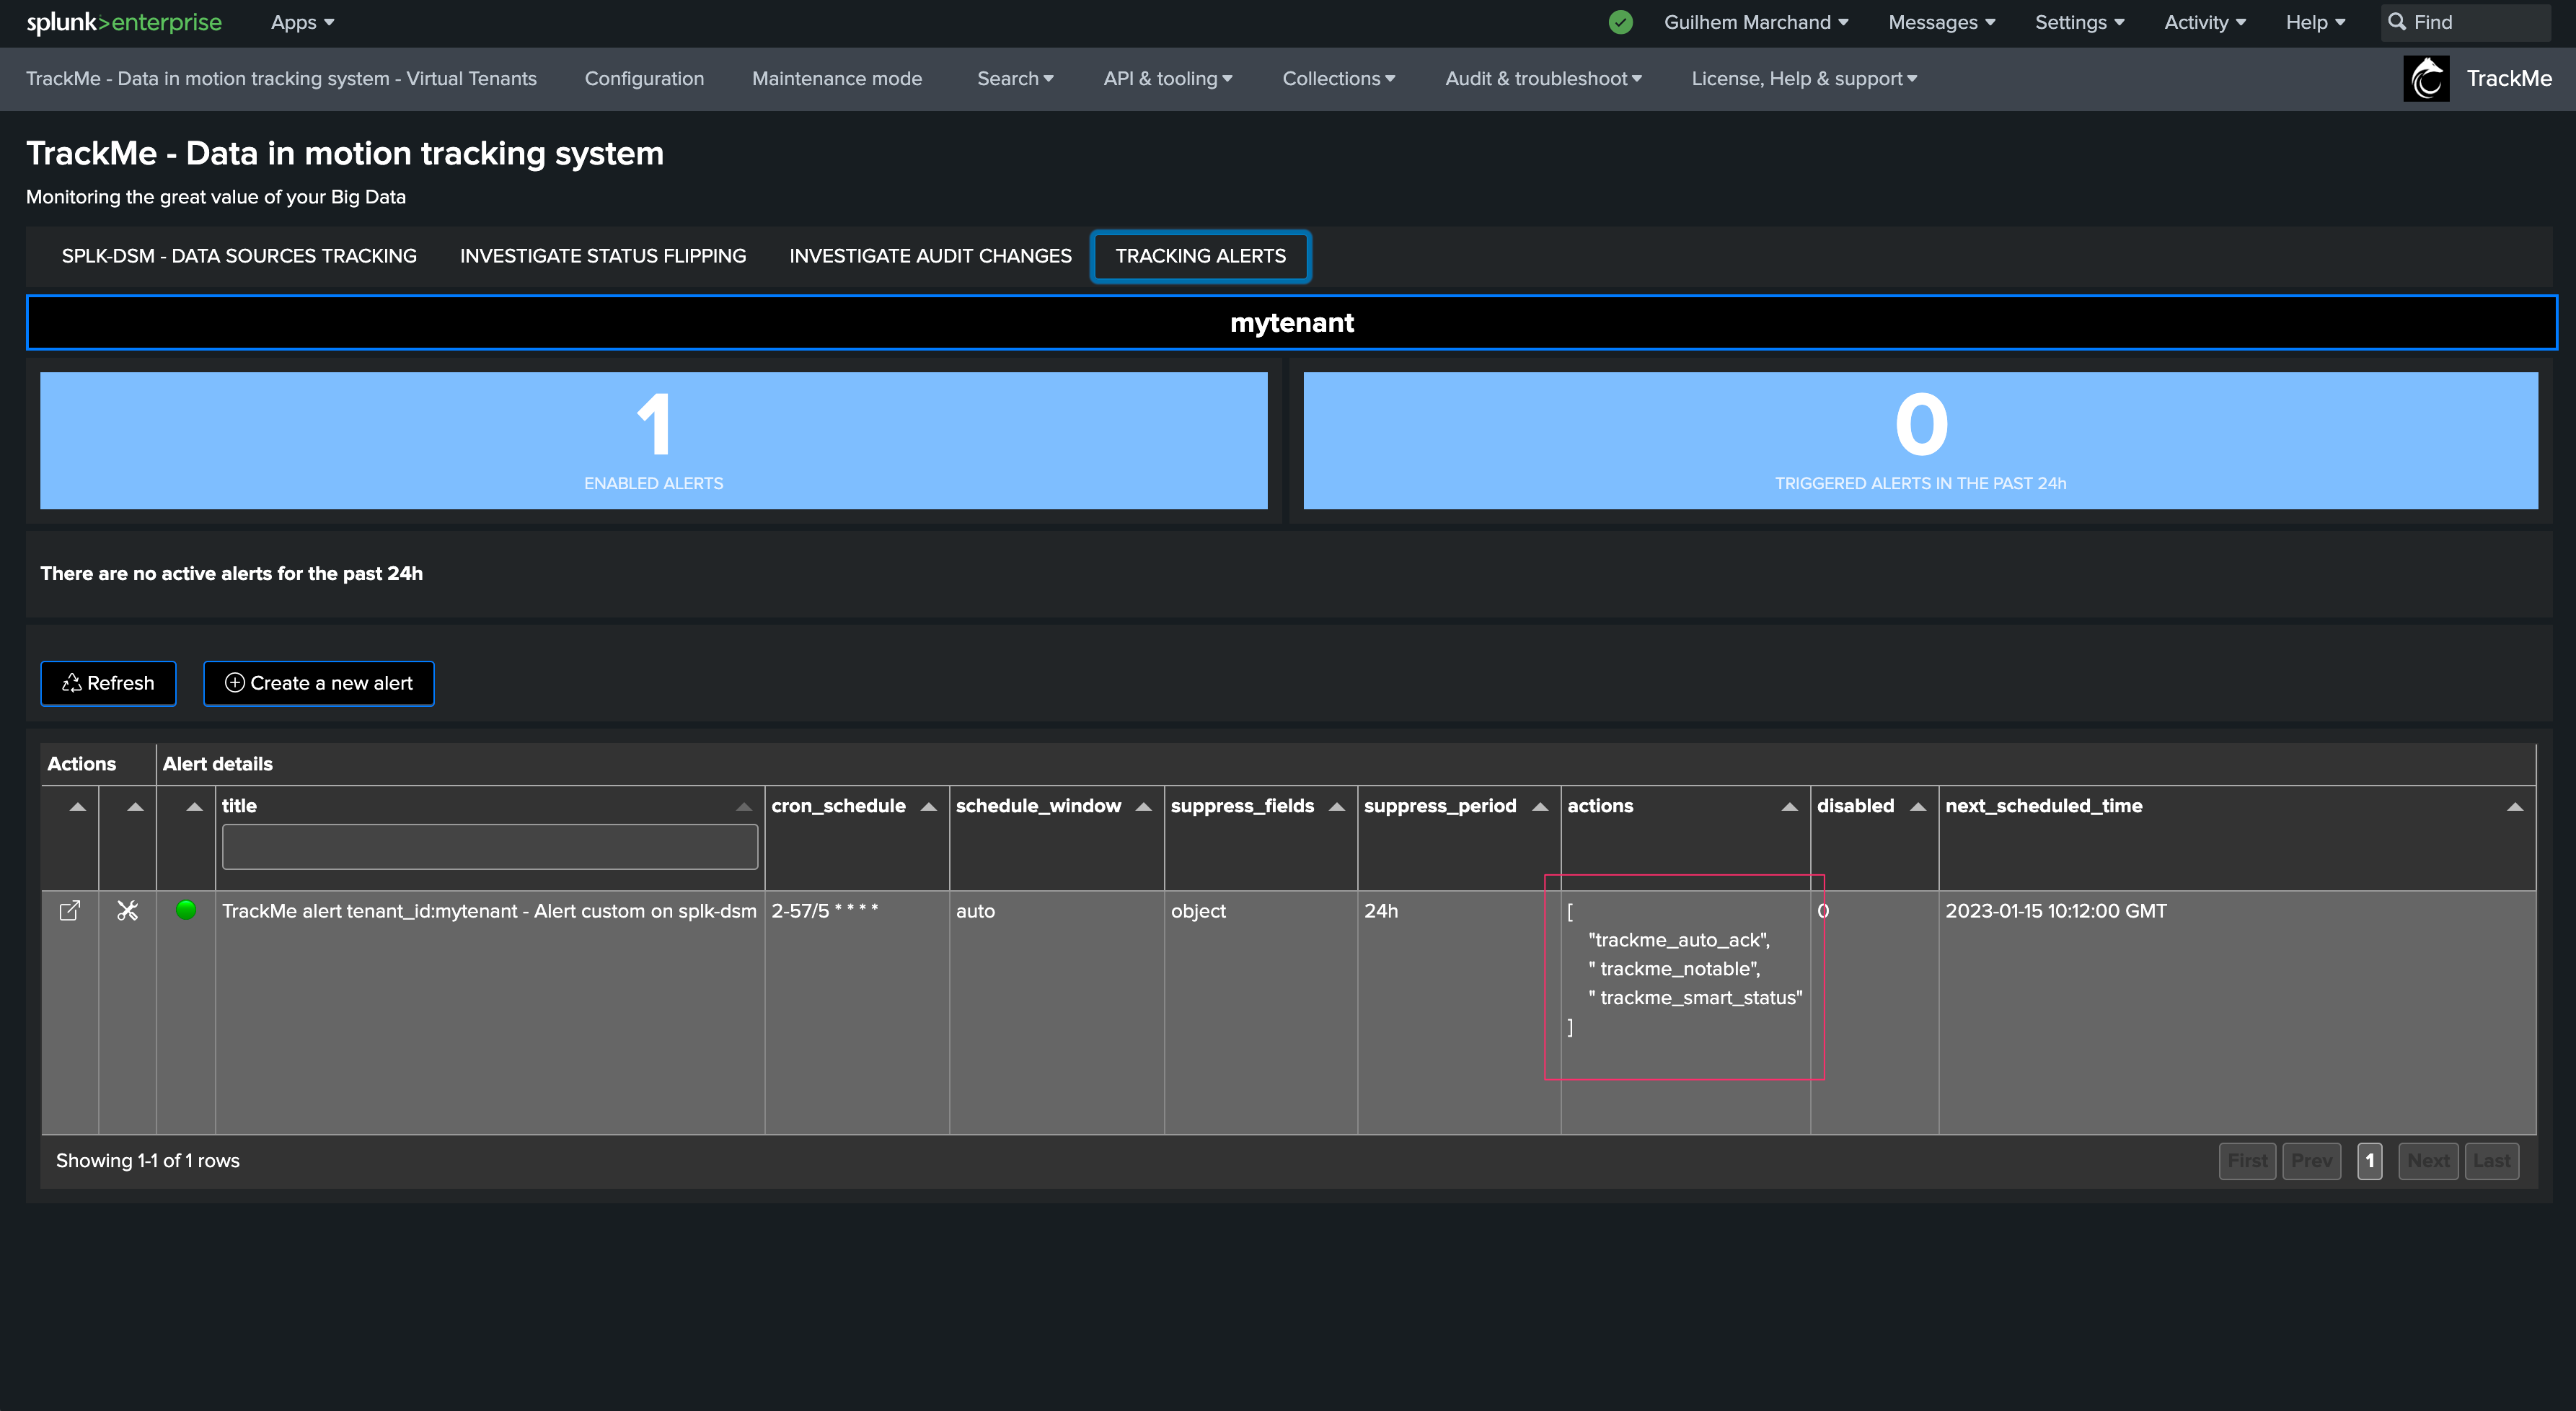
break by logic:
You can optionally add an additional break by logic field
This defaults to “none,” which means entities are going to match the combo
index + ":" + sourcetypeFor instance, if we have an indexed field
region, we can leverage it here to distinguish entities per region. Our entity creation logic becomesindex + ":" + sourcetype + ":" + region
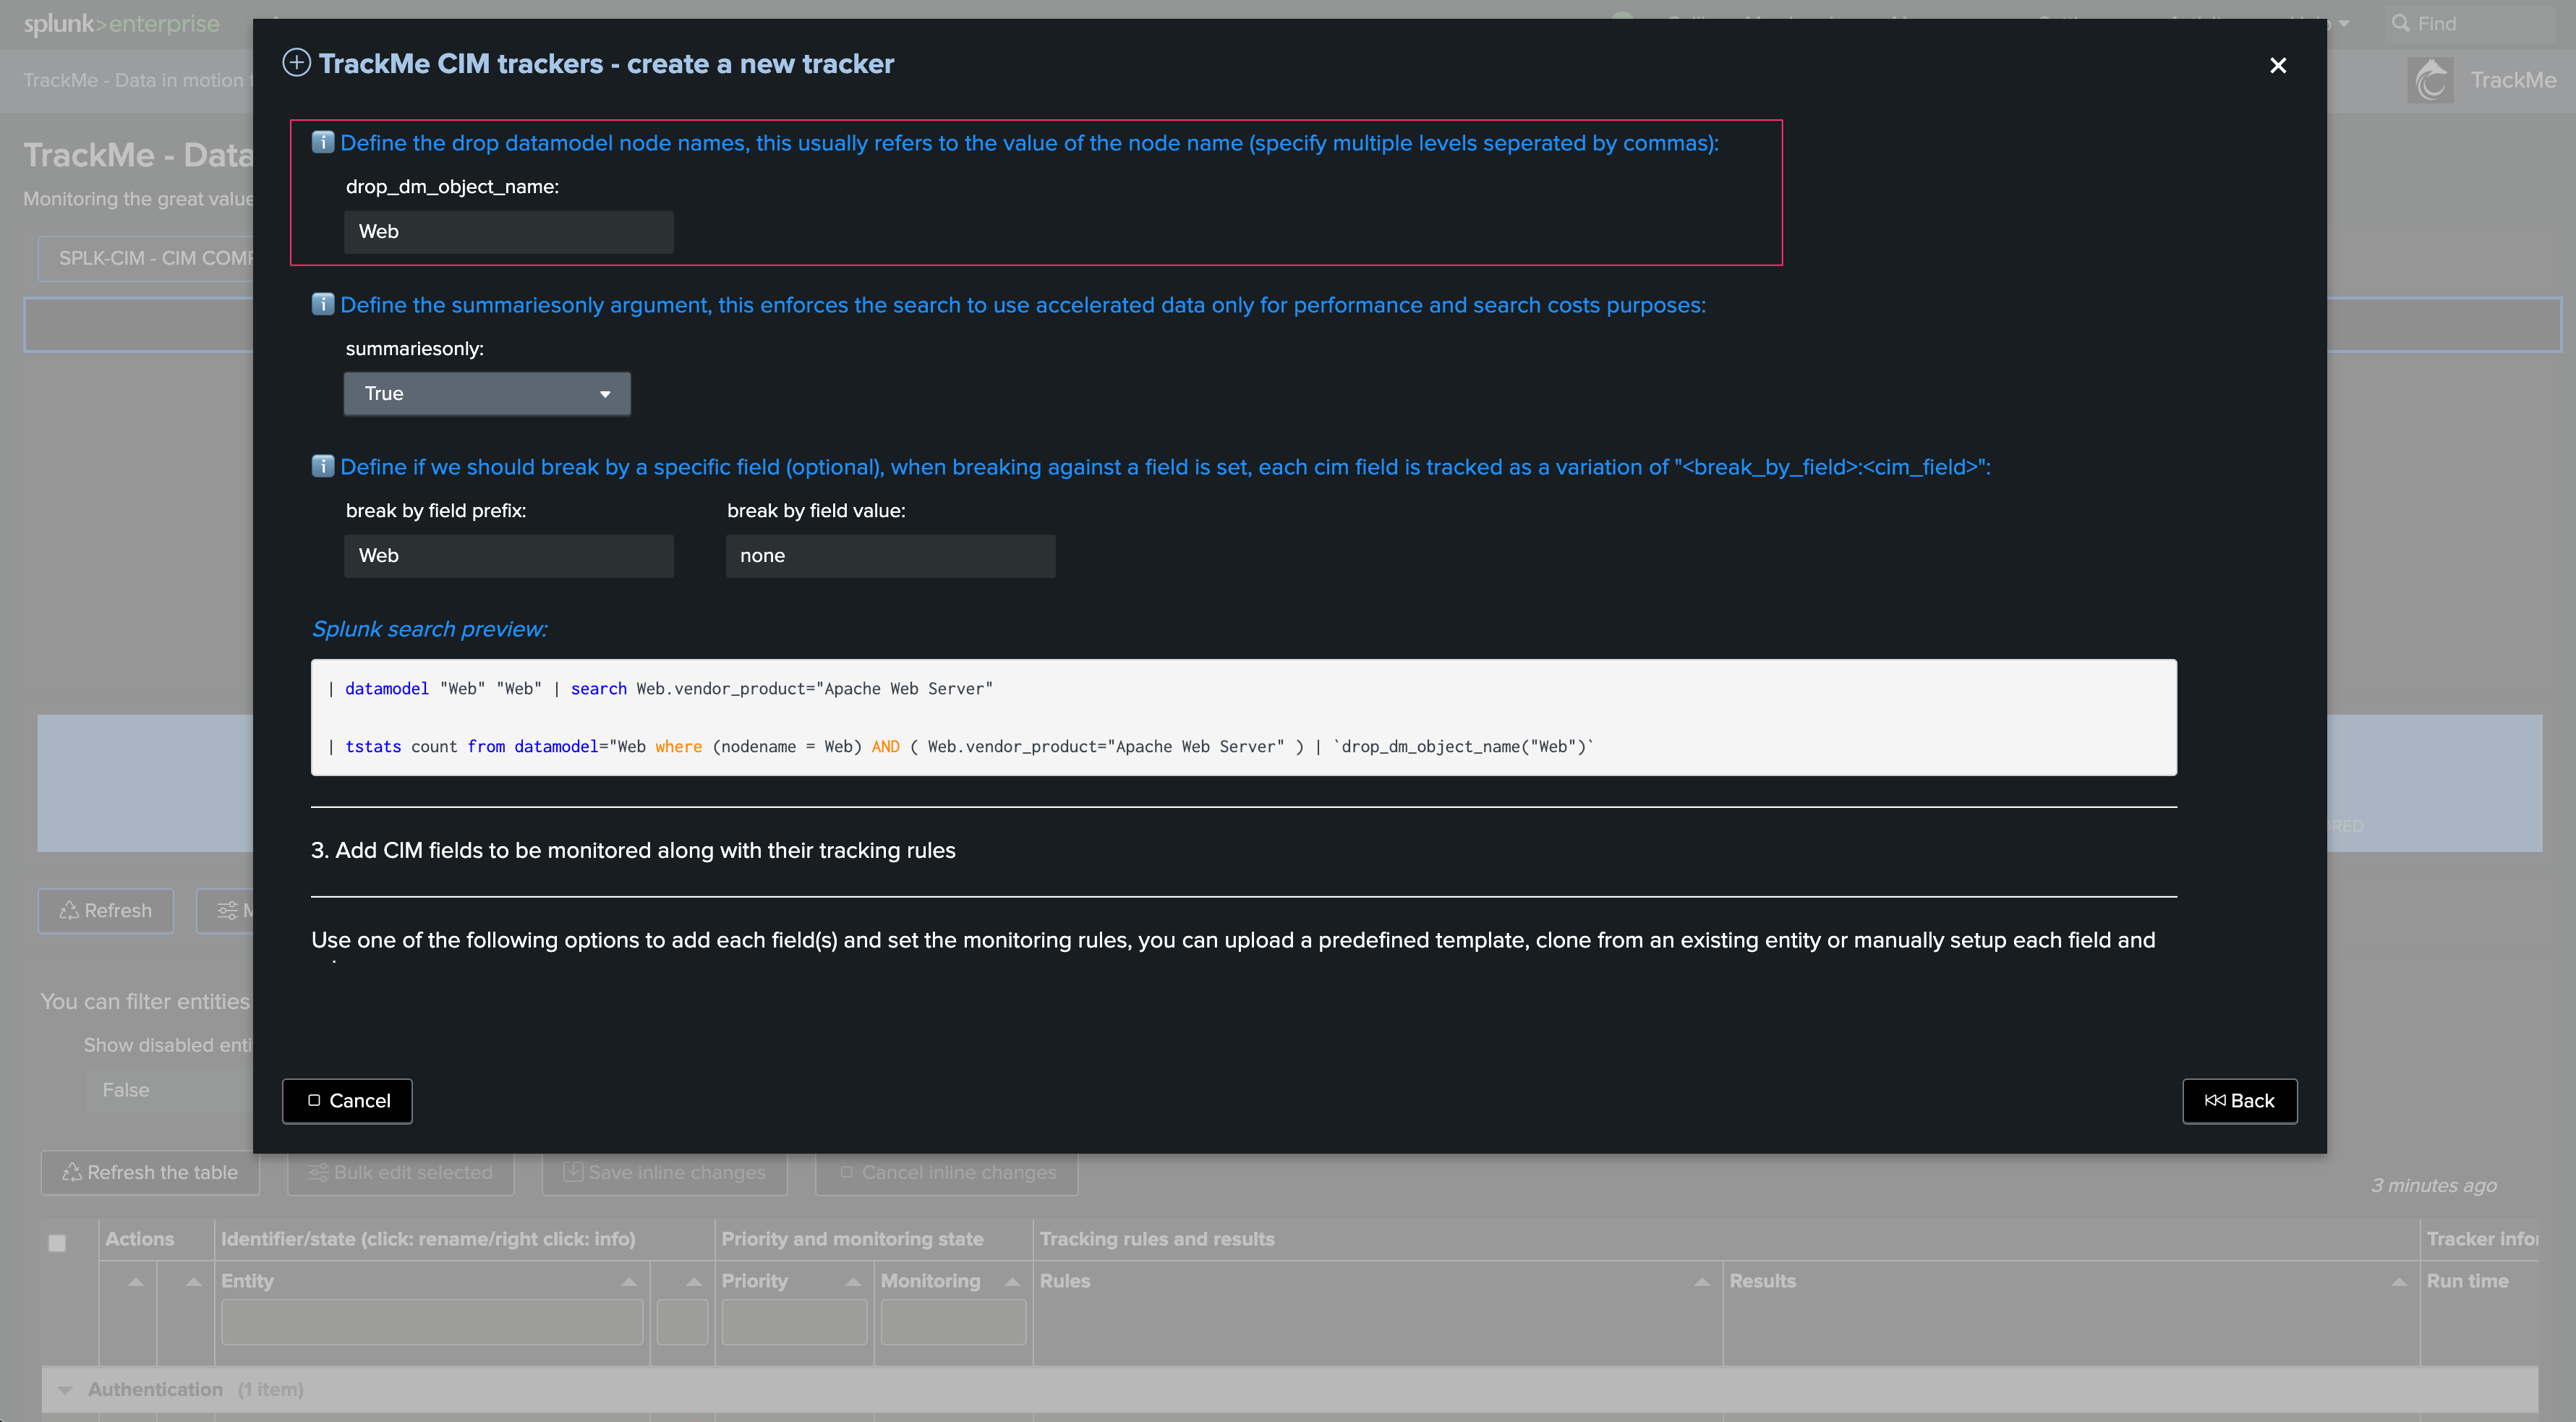
Time quantifiers:
Review and update if necessary the indexed time earliest and latest, as well as time range earliest and latest
These time quantifiers drive the period of data that the tracker is going to cover
Generally, you will want to have a large event time range period to cover data with high latency, while the period for indexed time range can be more restricted for performance optimization purposes
What will work best and be the most efficient depends a lot on your context and environment. Start with these values, review and adapt if necessary
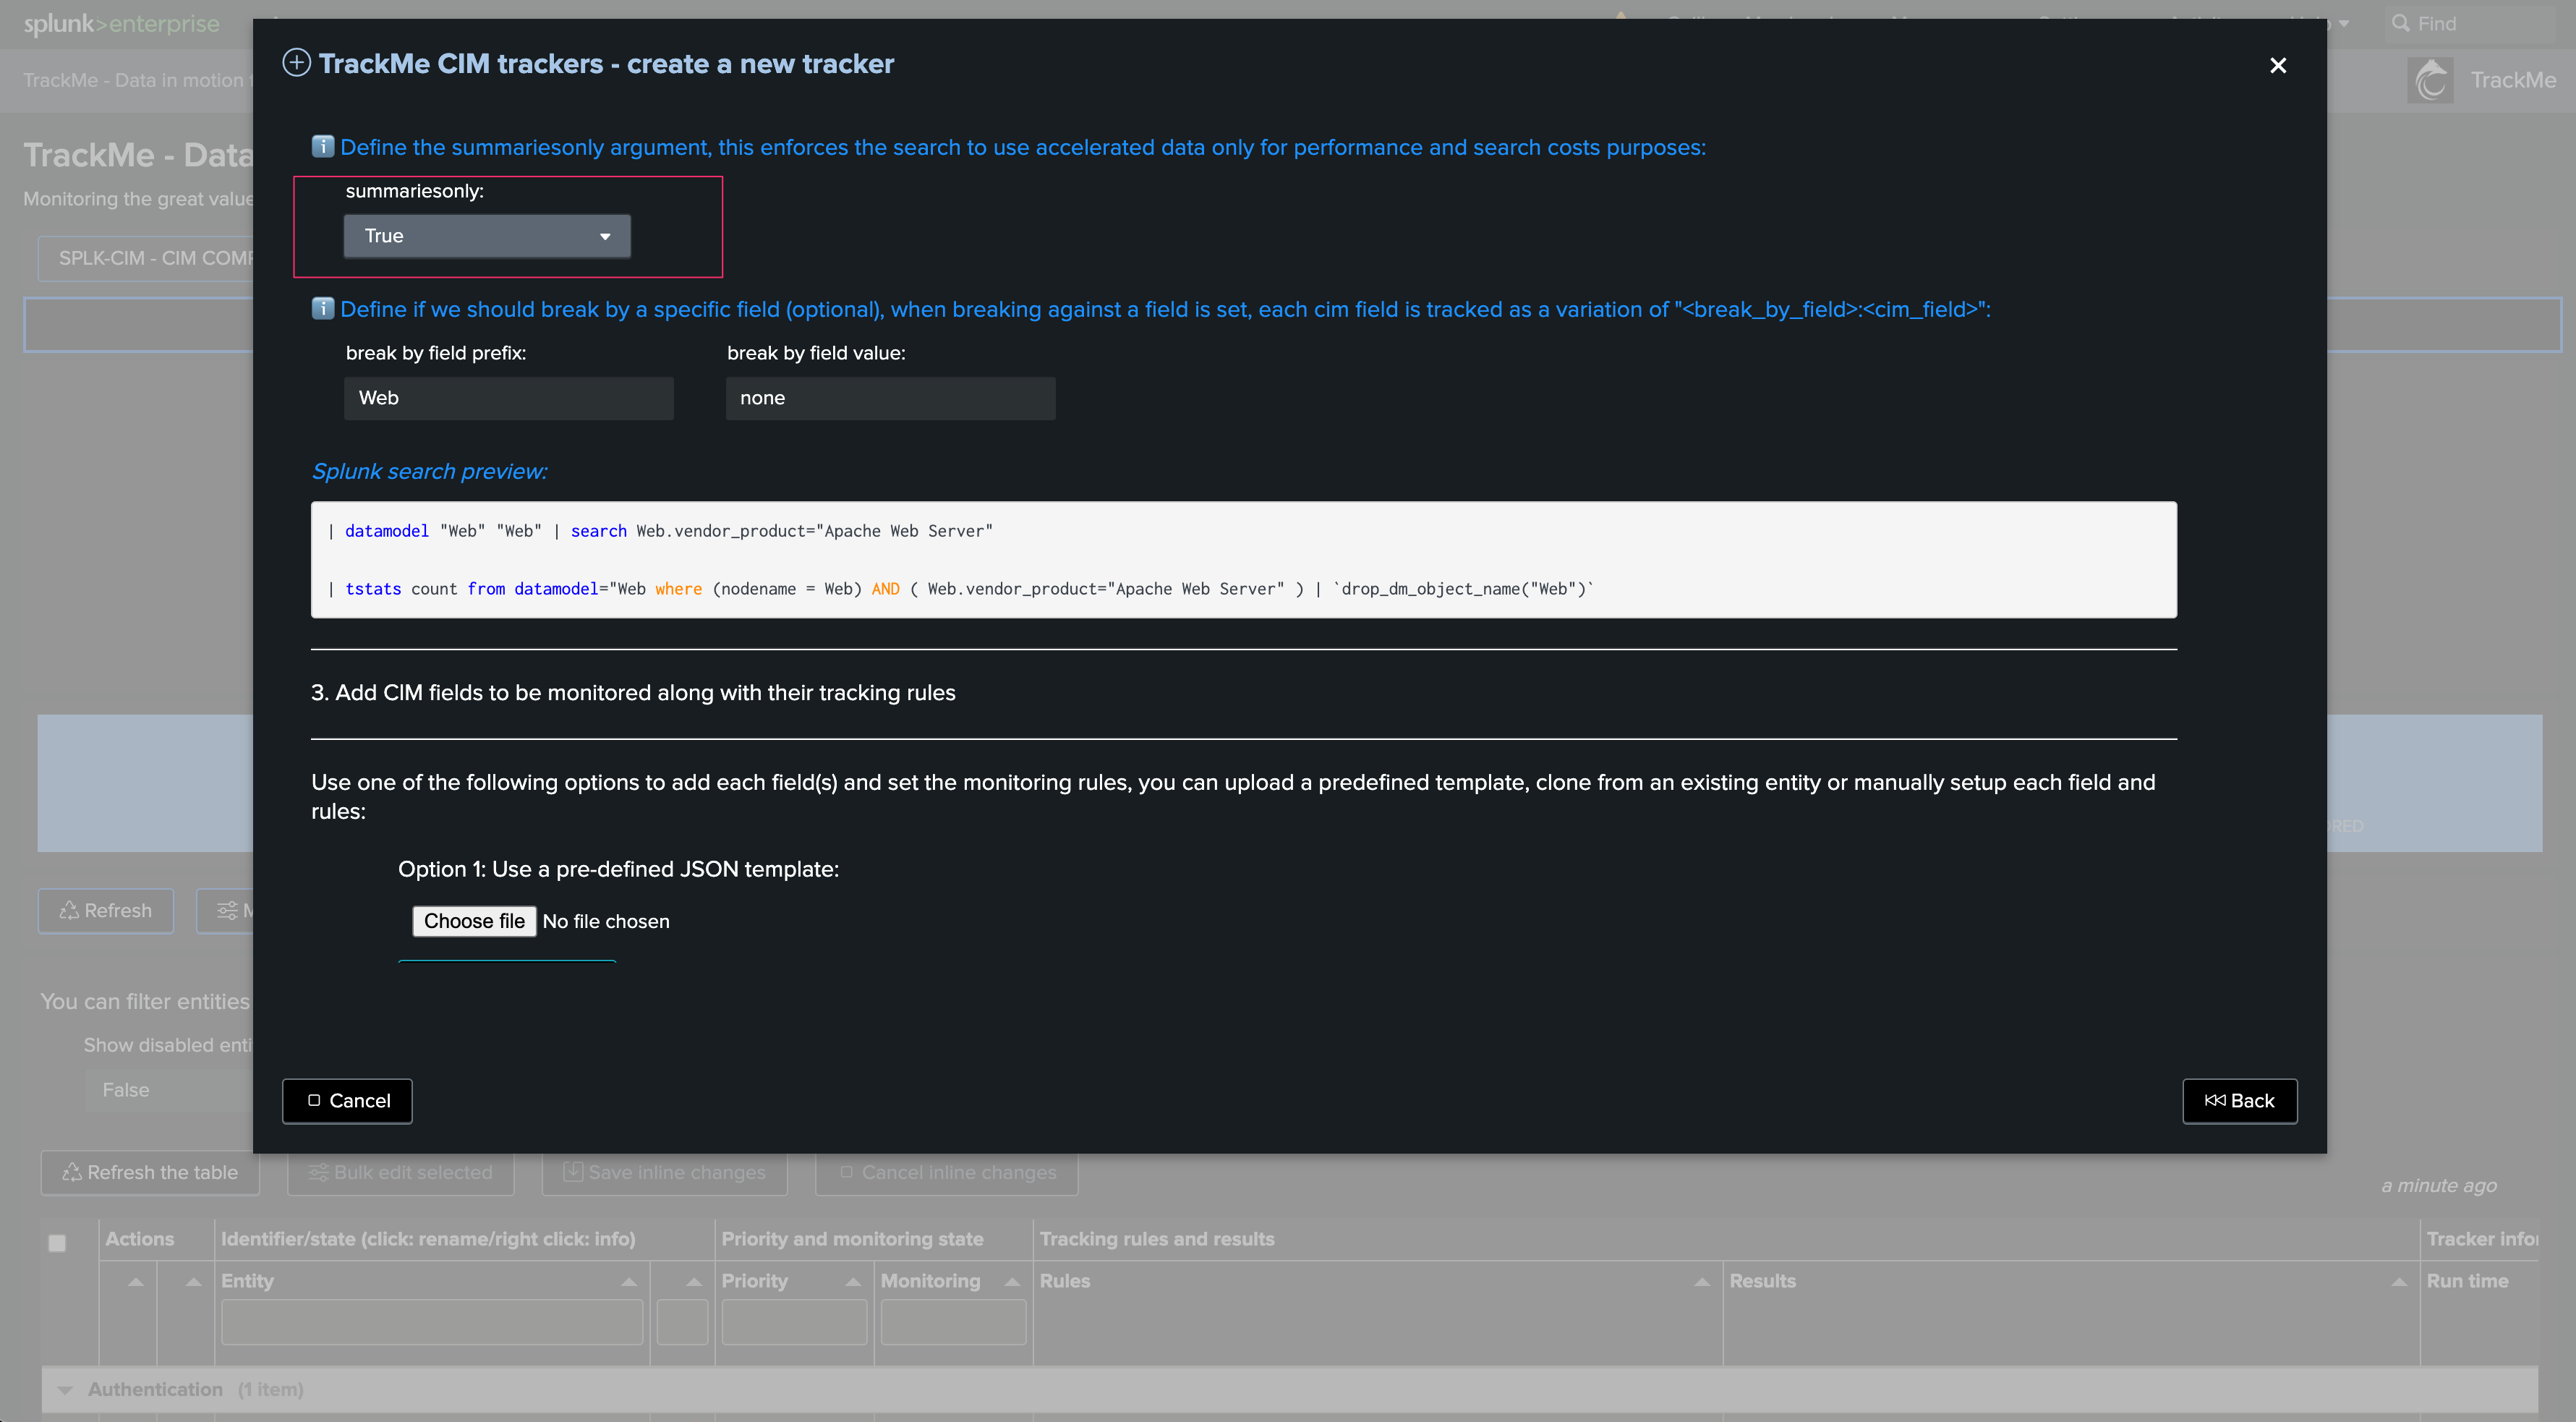
Cron schedule:
Define the cron schedule for the Hybrid Tracker
It defaults to every 5 minutes. Note that TrackMe will automatically dispatch cron schedules for optimization purposes
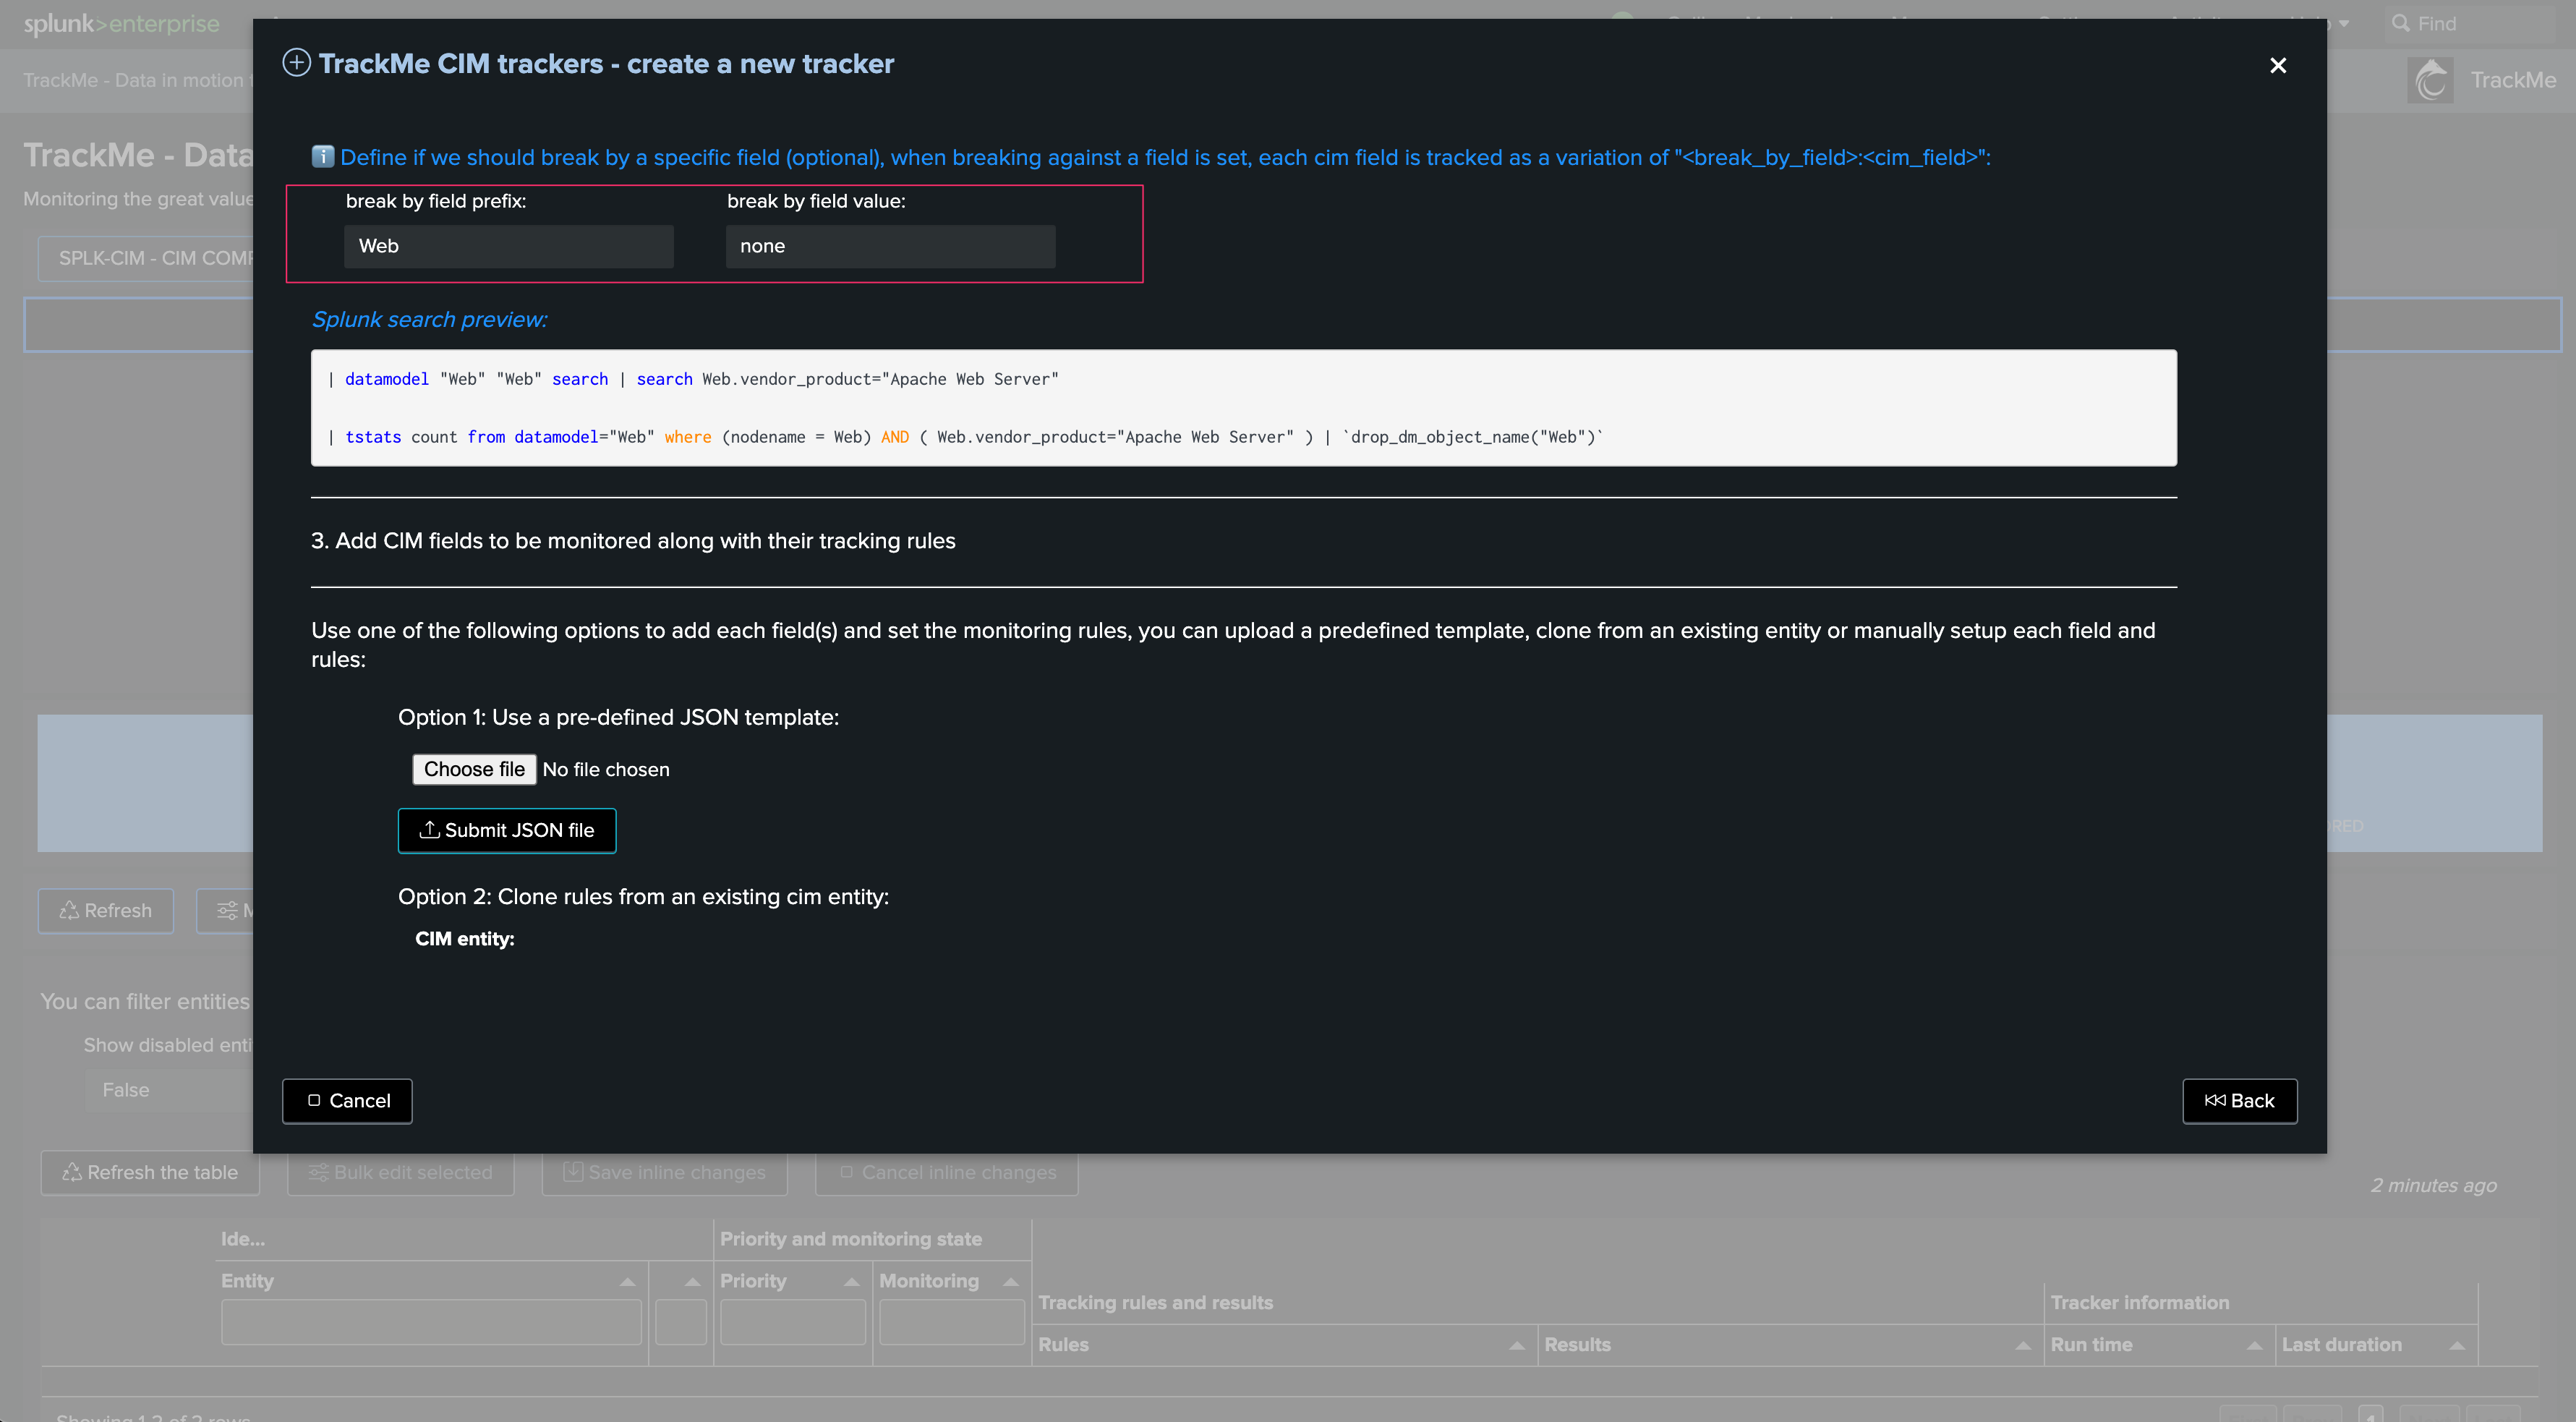
Test and review:
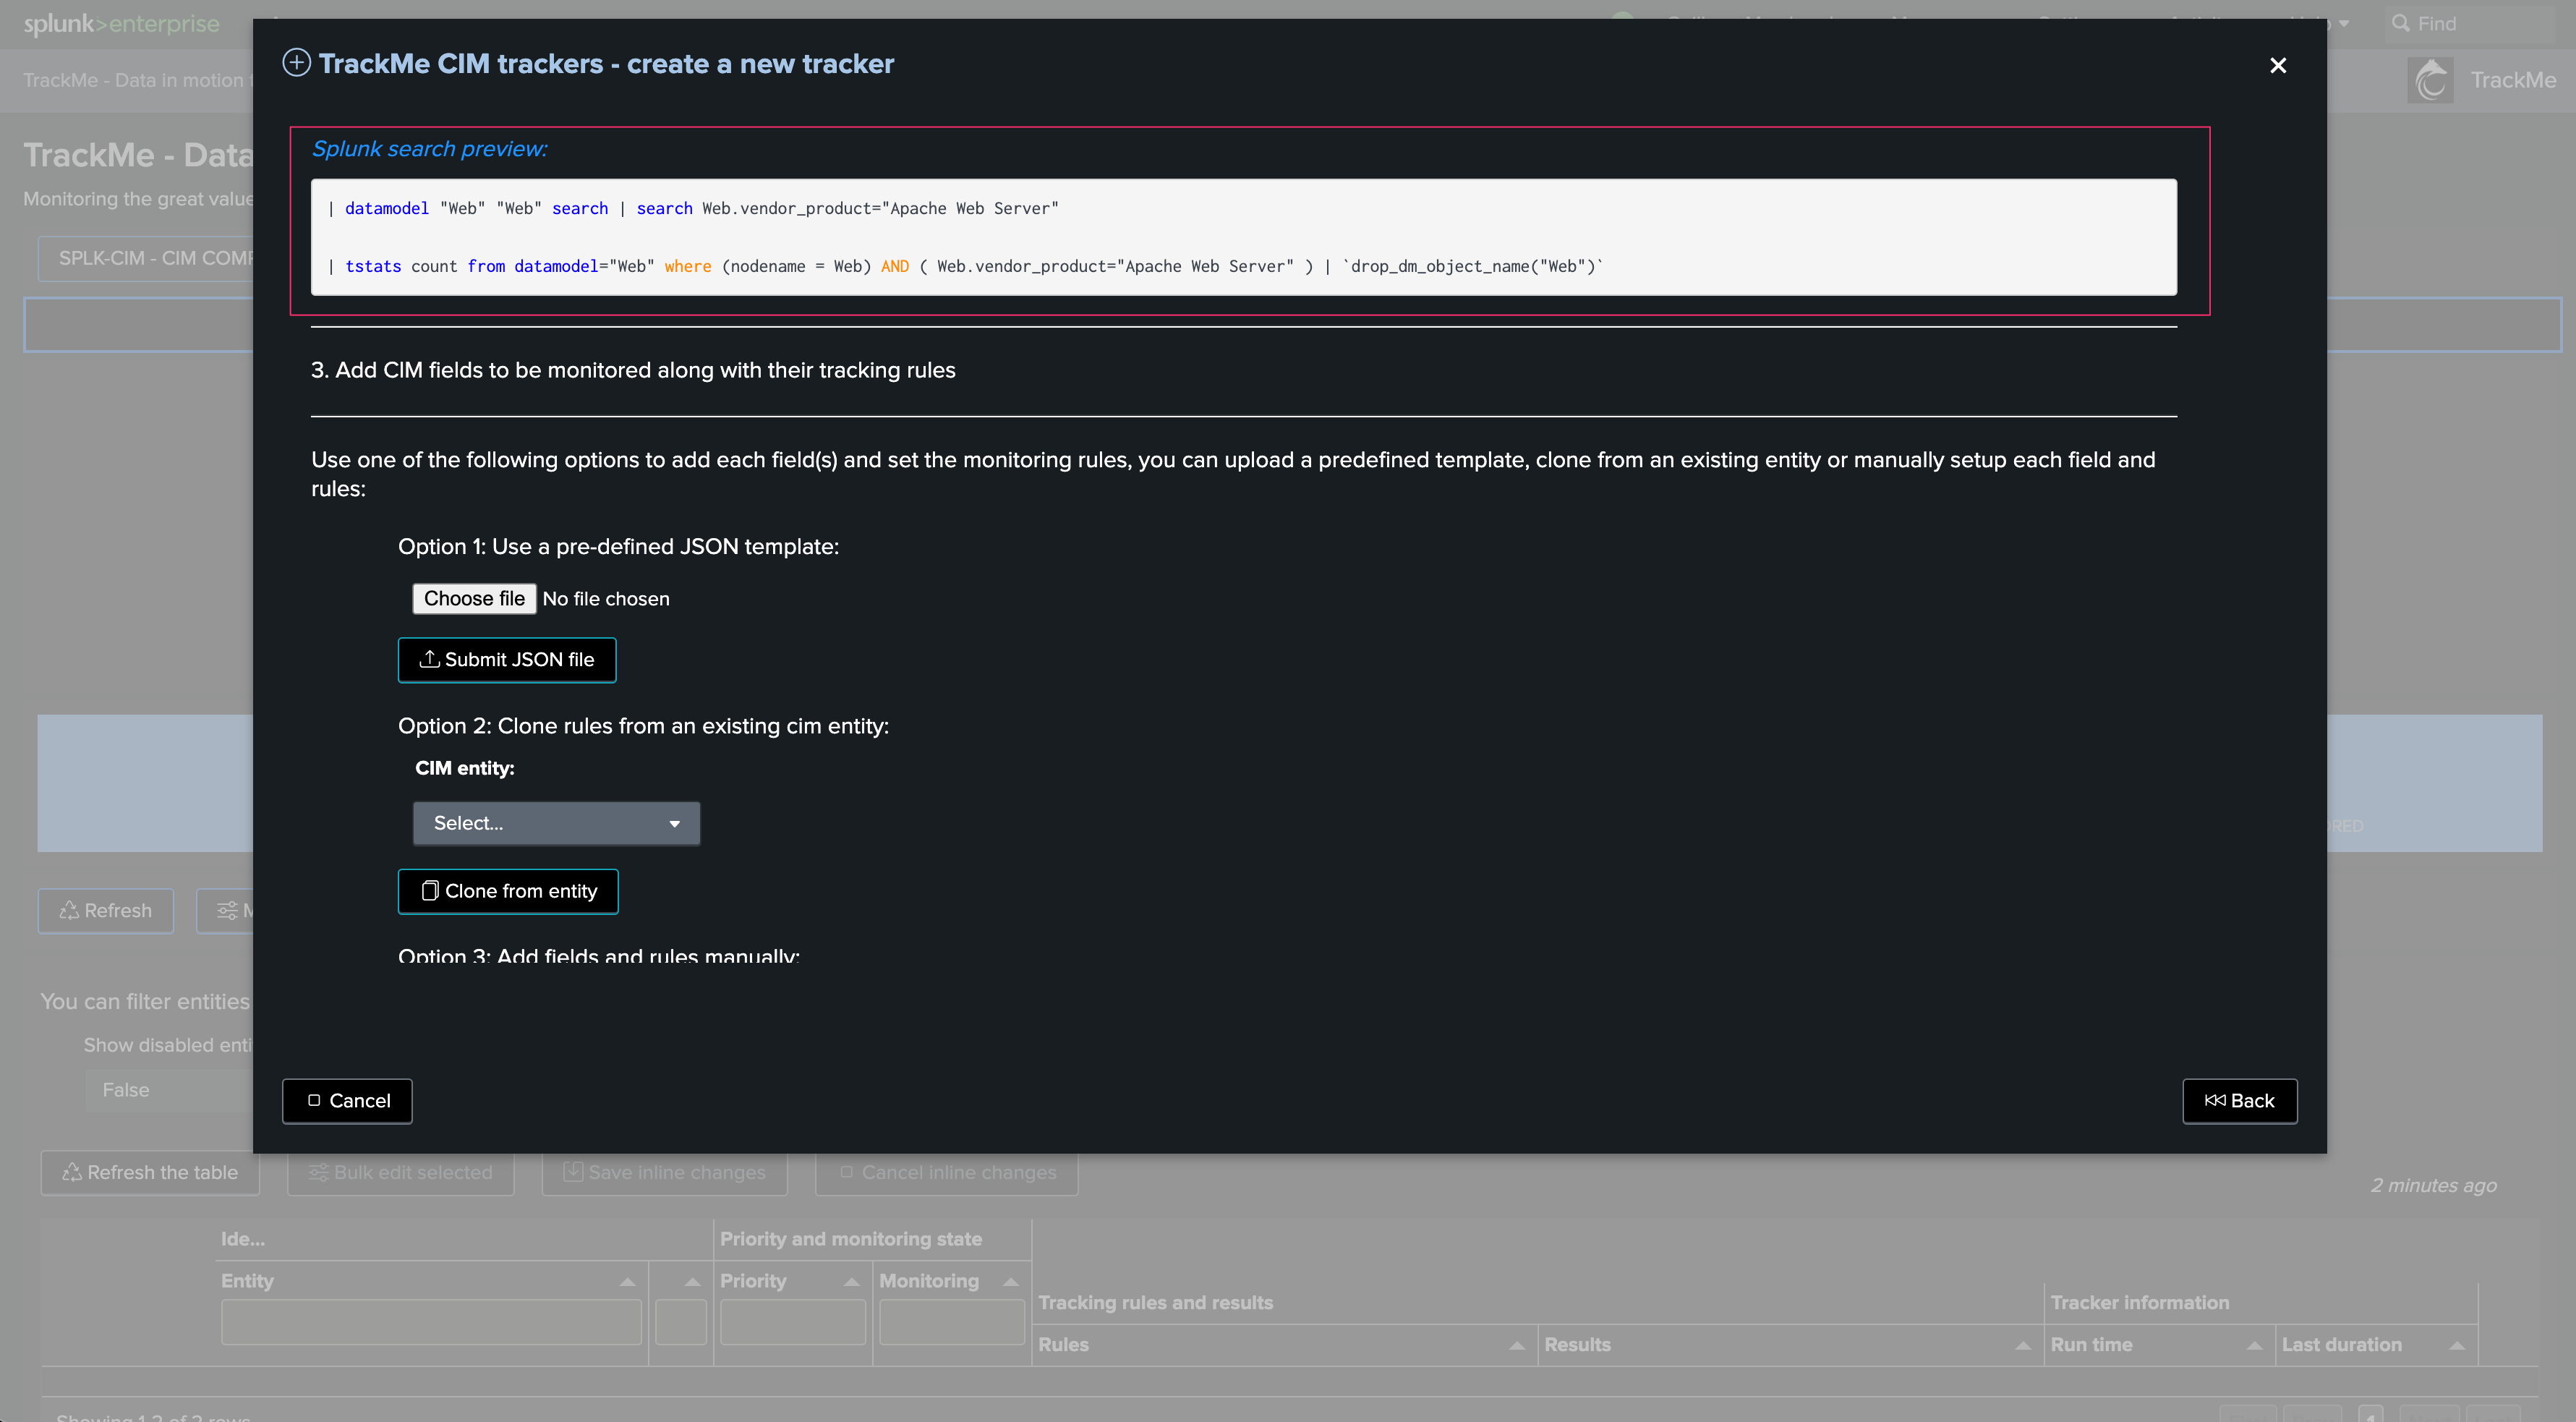
Click on the button to execute the Hybrid Tracker in preview
Finally, validate the Hybrid Tracker creation:
Once created, you can choose to run the Tracker immediately to discover and create entities in the Virtual Tenant:
Managing Hybrid Trackers for splk-feeds
Deleting an Hybrid Tracker through the UI
If you want to delete an existing Hybrid Tracker, this operation must be done via TrackMe.
The reason is that the application keeps track of all knowledge objects that were created for a given tenant to honor various features such as managing the lifecycle of the tenant (enabling/disabling, etc.) or the lifecycle of the tracker itself.
To manage Hybrid Trackers, click on:
The user interface shows available trackers and their related objects:
Select one or more trackers to be deleted:
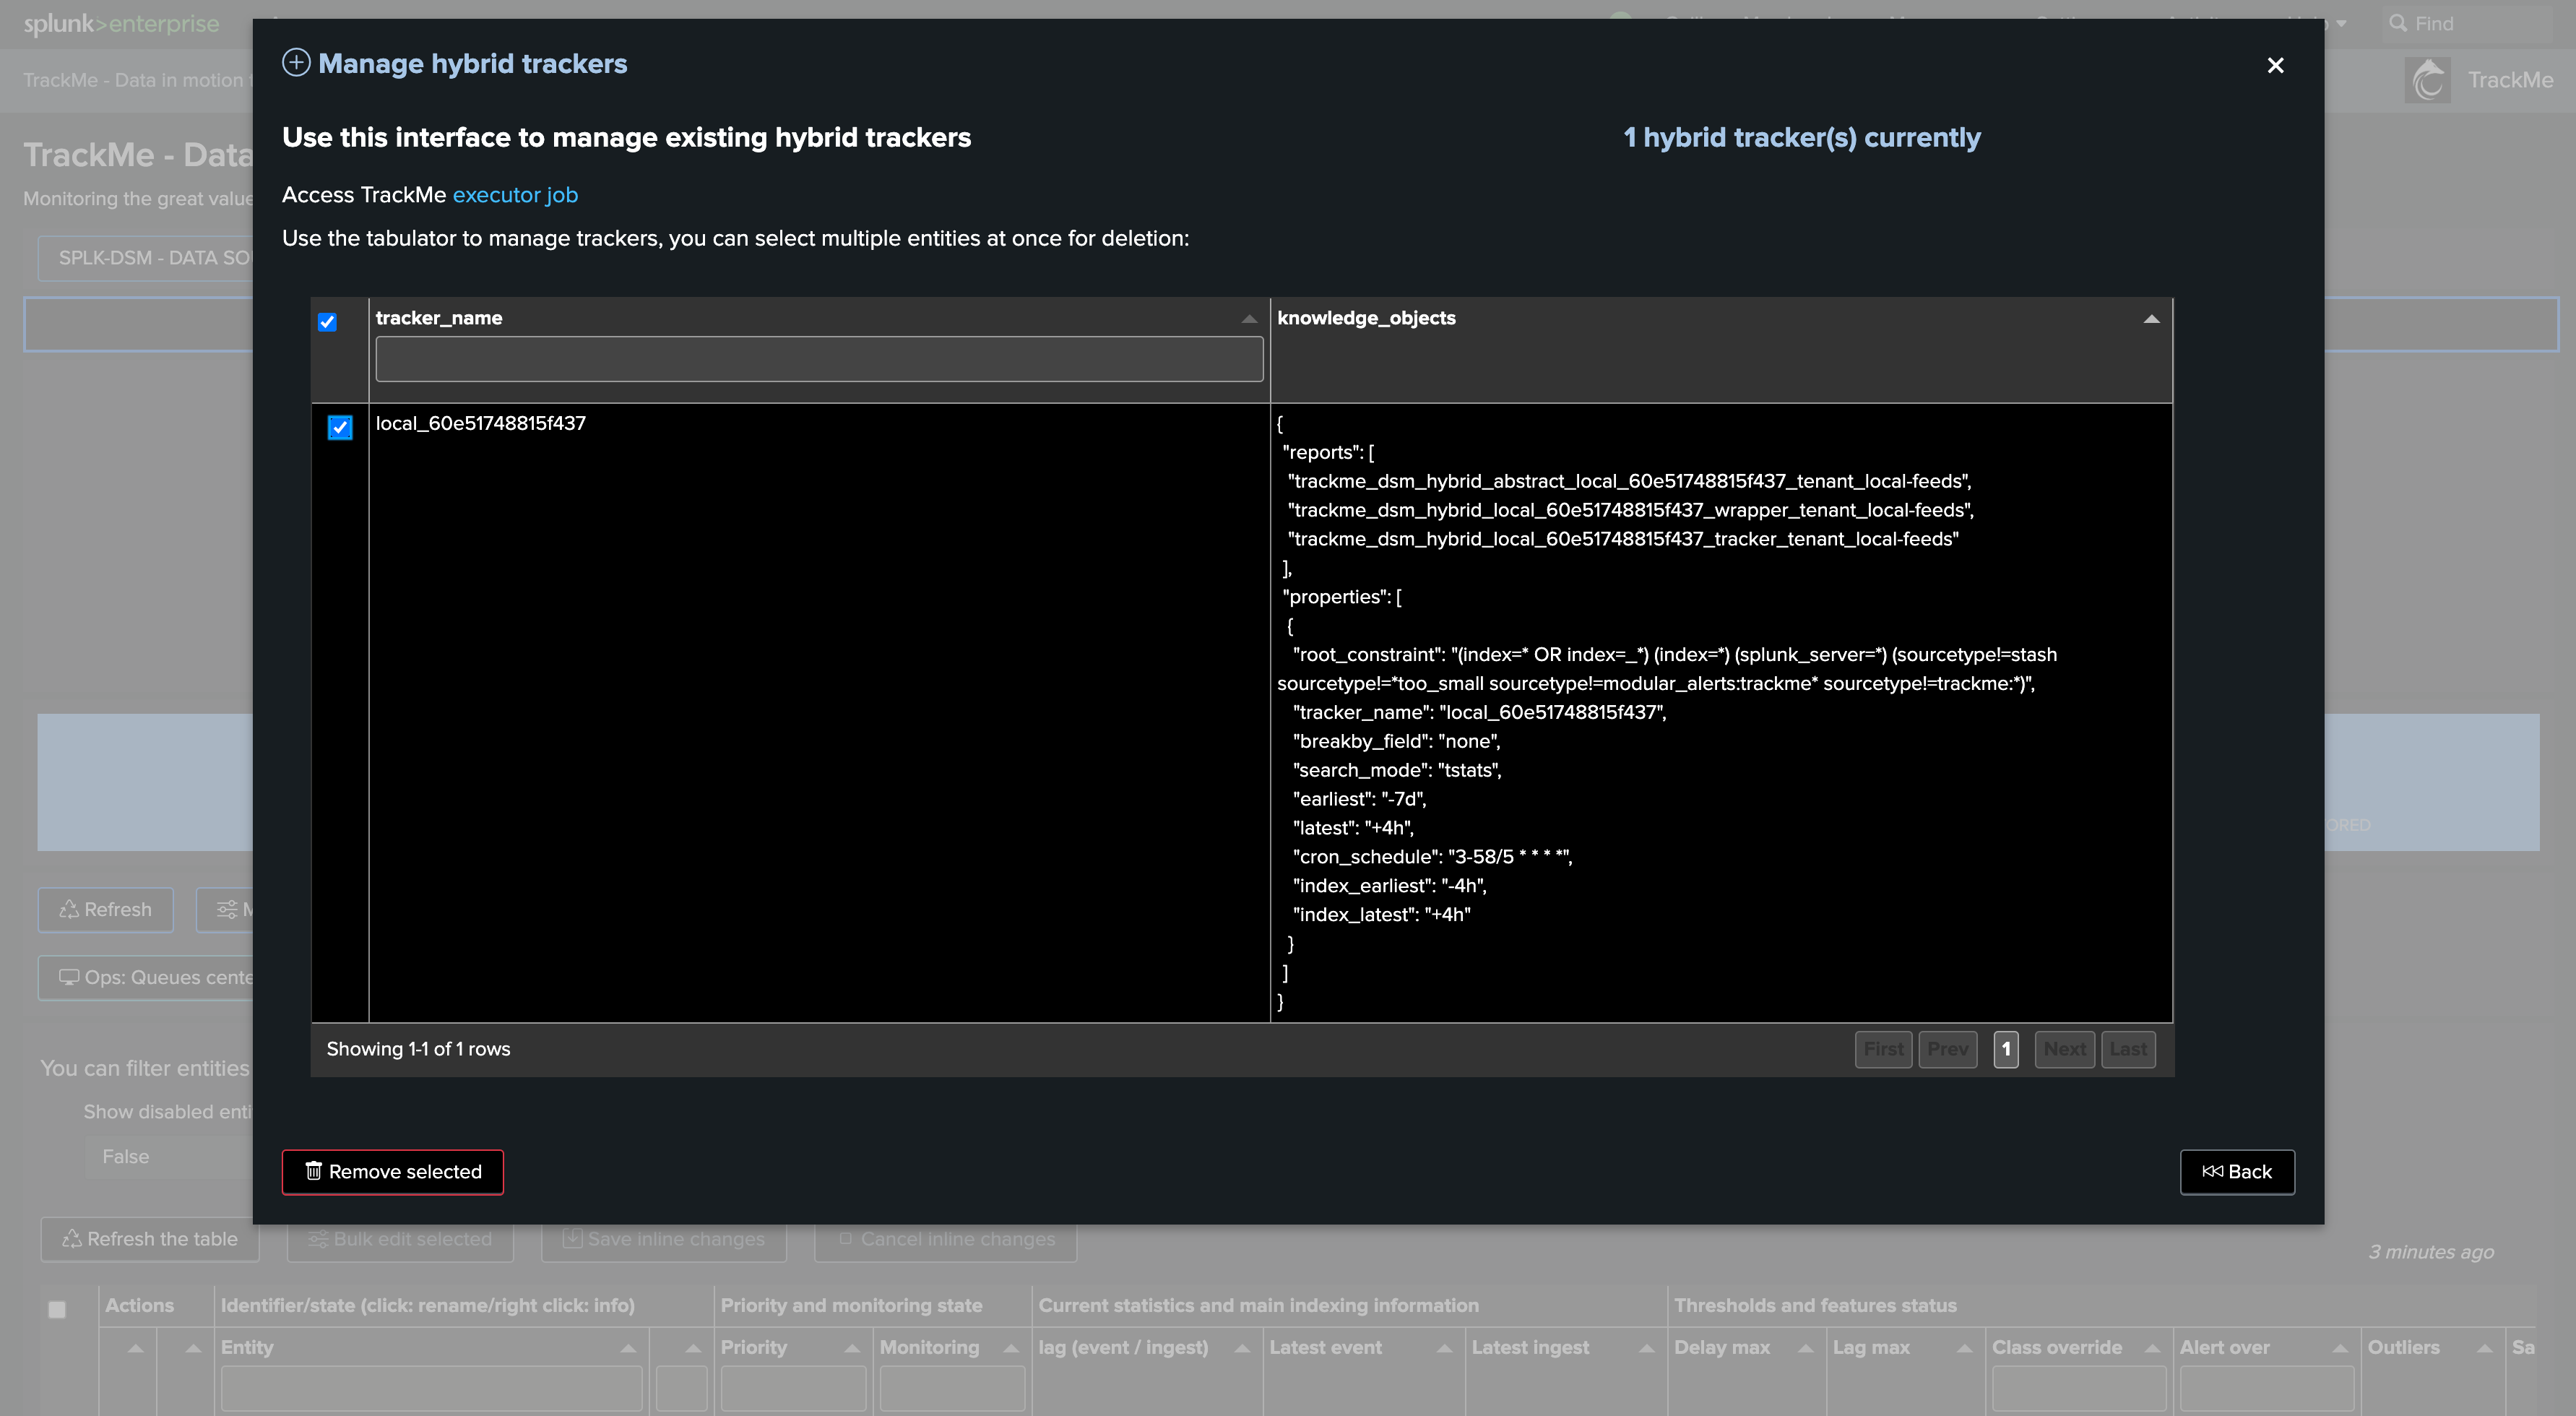
The related knowledge objects will be deleted, and the Virtual Tenant record will be cleaned up automatically.
For splk-feeds, the entities that were created through these Hybrid Trackers will not be deleted. (However, unless another Tracker is created, these will not be maintained anymore)
Deleting an Hybrid Tracker through REST
You can delete a Tracker through the following REST endpoint, example in SPL:
| trackme mode=post url="/services/trackme/v2/splk_hybrid_trackers/admin/hybrid_tracker_delete" body="{'tenant_id': 'mytenant', 'component': 'dsm', 'hybrid_trackers_list': 'test:001,test:002'}"