Overview
What Topology Studio is
TrackMe knows a great deal about your environment: every monitored entity, its health, its priority, its metrics. Topology Studio lets you arrange that knowledge the way you think about your environment — as a dependency map. A payment flow, a datacenter, an ingestion pipeline, a business service: you decide what belongs on the map and how it connects, and TrackMe keeps the map alive.
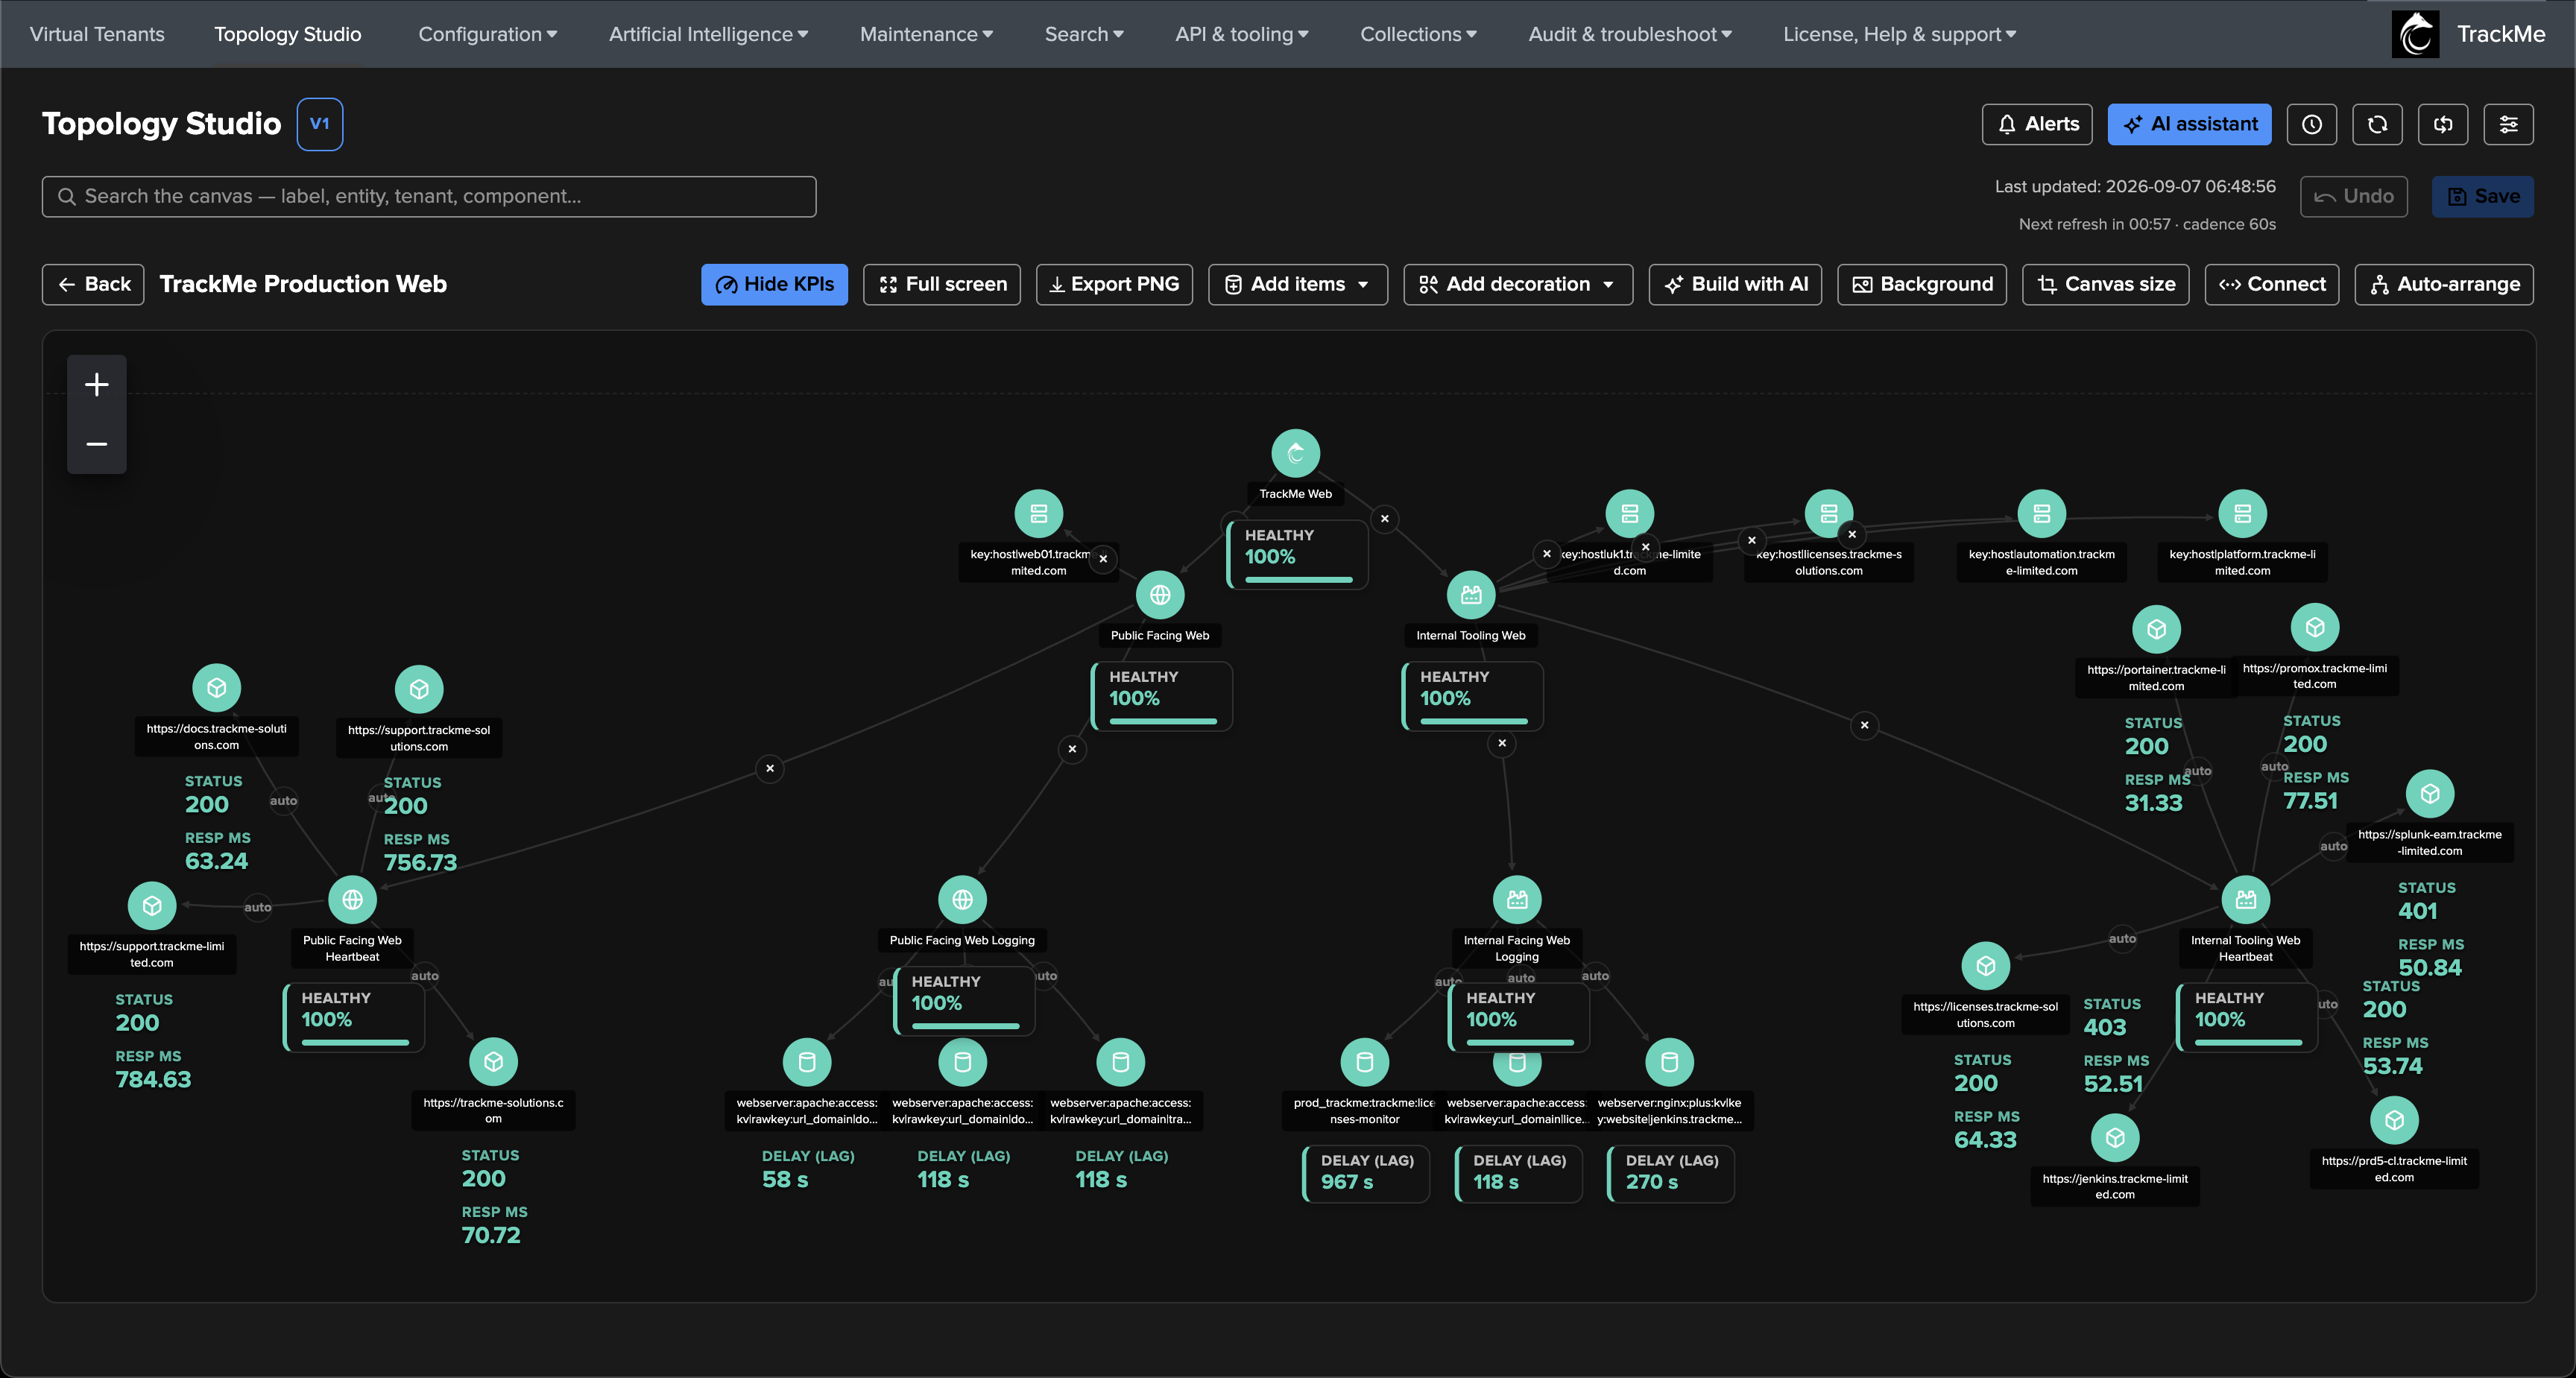
A topology view is:
Built from live health. Health nodes represent monitored entities, scoped aggregates, auto aggregates of connected nodes, or saved views rolled up as one node. Labels and decorations add context without health calculations. When an entity turns red, so does its node.
Authored or generated from Tenant Home. Place nodes, draw edges and choose the icons and layout yourself, or, since TrackMe 2.4.16, generate a live preview from a Virtual Tenant and save it as your starting point. Refine the map to reflect your understanding of dependencies.
Shared. Views are stored centrally and shared under role-based access control, with separate read and write permissions — author once, consume everywhere, including full-screen on a wall of screens.
Alerting-capable. Any view can carry Topology Alerts — a state-aware engine that correlates the health of the map and notifies on transitions, with the rendered topology image embedded in the notification email.
AI-integrated. The AI Assistant understands your views and alerts in context — and can create or modify topologies for you through consented, audited actions.
Core concepts
Views
A view is one topology map: an identifier (view_id, lowercase, up to 40 characters),
a display alias, an optional description and category (views sharing a category are
grouped together in the list), the canvas content itself, and the role-based access
lists. Views are global objects — they are not owned by a tenant, they reference
entities across tenants.
Node types
Five kinds of items live on the canvas:
Entity nodes — a single monitored entity, referenced by tenant, component and identity. The node carries the entity’s live state color, and up to five KPIs displayed on the canvas (delay, latency, volume, skip rate… — or, for Flex Objects, FQM and WorkLoad, any of the entity’s own metrics).
Scoped aggregate nodes — a live roll-up of many entities: one or more tenant/component scopes plus an optional filter (the same filter grammar as Virtual Groups). The node folds to the worst state of everything it matches and shows per-state counts — or, by opt-in, classifies by a healthy-percentage policy with your own thresholds. Aggregates can also auto-populate: their current members appear as linked satellite nodes around them, following membership dynamically.
Auto aggregates (TrackMe 2.4.18+) — health parents whose membership comes from incoming connections to entities, aggregates or view nodes. Children keep their scopes and policies; the parent follows their worst effective state and counts unique underlying entities for its KPI. No duplicated filters or independent parent policy are needed. See Auto aggregates for creation, label conversion and nesting.
View nodes (TrackMe 2.4.15+) — a reference to another saved topology view, placed on this canvas as a single health node. The referenced view keeps ownership of its graph, its aggregate policies and its own alerts; the parent stores only the identifier, never a copy, so saving the child is reflected at the parent’s next refresh. The node folds to the worst effective state of the child’s health nodes — nested views and impact propagation included — while its KPI counts the unique underlying entities across the child’s aggregates, direct entities and nested views (an orange child with 12 green and 4 orange entities reads 75% healthy, 16 entities and stays orange). Open the referenced view in a new tab from the node’s inspector: the parent canvas, viewport and unsaved edits stay put. Views inside views turn a map into a map of maps — an estate modelled as layered, independently owned views with one roll-up. A view node is a first-class alertable item, and it travels with history, duplication and export like any other node.
Label nodes — free-text annotations with color control, for naming zones, tiers or flows on the map.
Live status
Open a view and it polls live status on a fixed cadence (with an honest countdown, a
manual refresh, and a pause/resume toggle). Entity nodes colorize by object_state;
scoped aggregates fold their scopes server-side; auto aggregates combine their
incoming contributors; view nodes resolve the referenced view
server-side on every refresh, checking your read access to the view and to every tenant
it reaches at each hop. Nodes whose underlying entity was deleted are flagged as
missing (with a one-click cleanup); nodes referencing tenants outside your
permissions render neutrally as restricted — see
tenant isolation. A referenced view that is missing and one
you are not allowed to read look the same, so a guessed identifier reveals nothing; and
a reference whose health cannot be fully evaluated — a cycle, an incomplete child read,
an exhausted nesting or size budget — never reports healthy.
Auto aggregates likewise remain unavailable when their contributors are empty
or incomplete, rather than showing a partial roll-up as healthy.
How it compares
Feature |
Purpose |
|---|---|
Topology Studio |
Live maps across tenants and components, authored directly or generated from Tenant Home. Saved views are persistent, shared under RBAC and alerting-capable. |
Tenant Home Studio preview (2.4.16+) |
A temporary live canvas generated from the current selection, with configurable grouping, filtering, inspection and layout. Save explicitly to keep it as a normal Studio view. |
Link graph and Network graph |
The existing per-component relationship graphs, available as alternate Tenant Home topology tabs with their detailed breakdowns. |
Virtual Groups |
Read-only aggregation cards in the Virtual Tenants grid — counts across tenants, no canvas, no edges, no alerting. |
Hint
Use the Tenant Home preview to discover structure and start a saved Studio view, the Link graph and Network graph for their component breakdowns, and Virtual Groups for quick cross-tenant counters.
Where to find it
Click Topology Studio in the TrackMe navigation bar.
You can also start from the topology icon in any Virtual Tenant’s Tenant Home and save the generated preview into Studio.
The landing page — the views browser — lists every view your roles can see, with a text search and a category filter, in the layout you prefer: Cards (grouped by category), Compact cards (denser tiles) or List (a sortable table). Your choice is remembered per browser; administrators set the deployment-wide default. From there you create, open, duplicate, export or import views. On a fresh install there is nothing to list yet, so the page invites you to create your first view — or to Import one exported from another instance. See Authoring topologies to build the first one.