Cribl Stream
Cribl Stream sits in the middle of your data path: every Source, Route, Pipeline and Destination it runs is a place where data can slow down, back up, be dropped or stop. A Cribl Stream tenant watches one Cribl Stream deployment end to end and tells you, in a Cribl operator’s words, what needs attention: a Destination under backpressure, a Source whose traffic fell outside what it usually sends at this hour, a Pipeline raising errors, a Worker that stopped answering, runs another version than the Leader or an old configuration, a Leader whose disk is filling up.
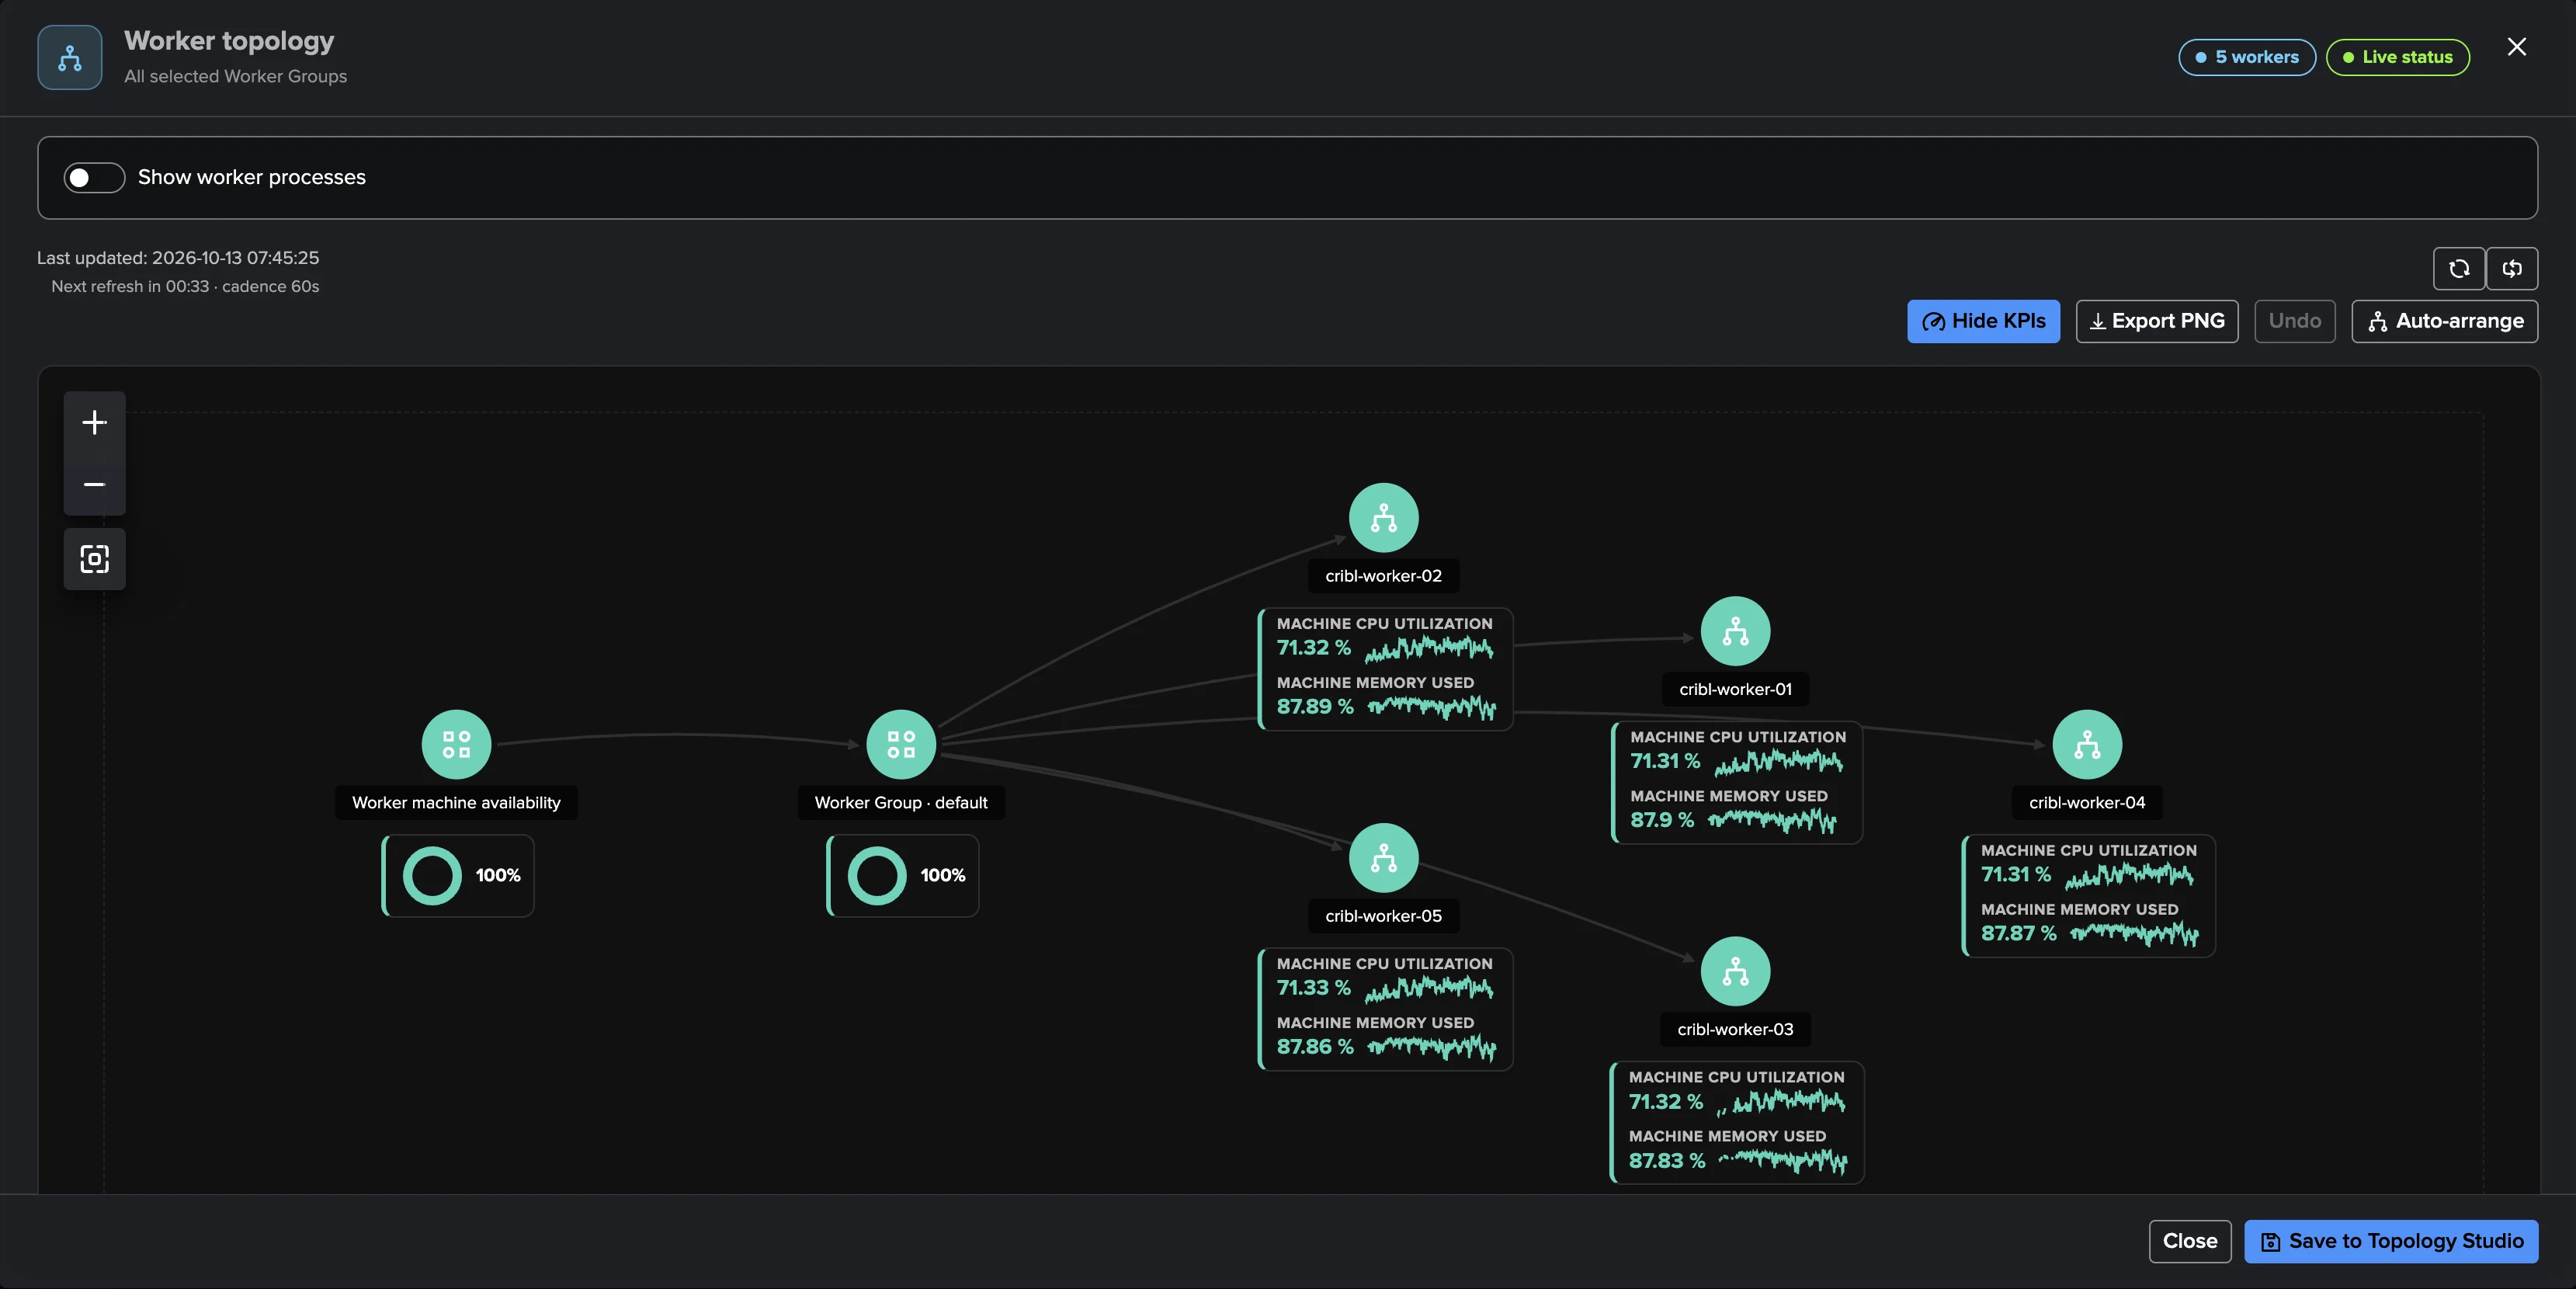
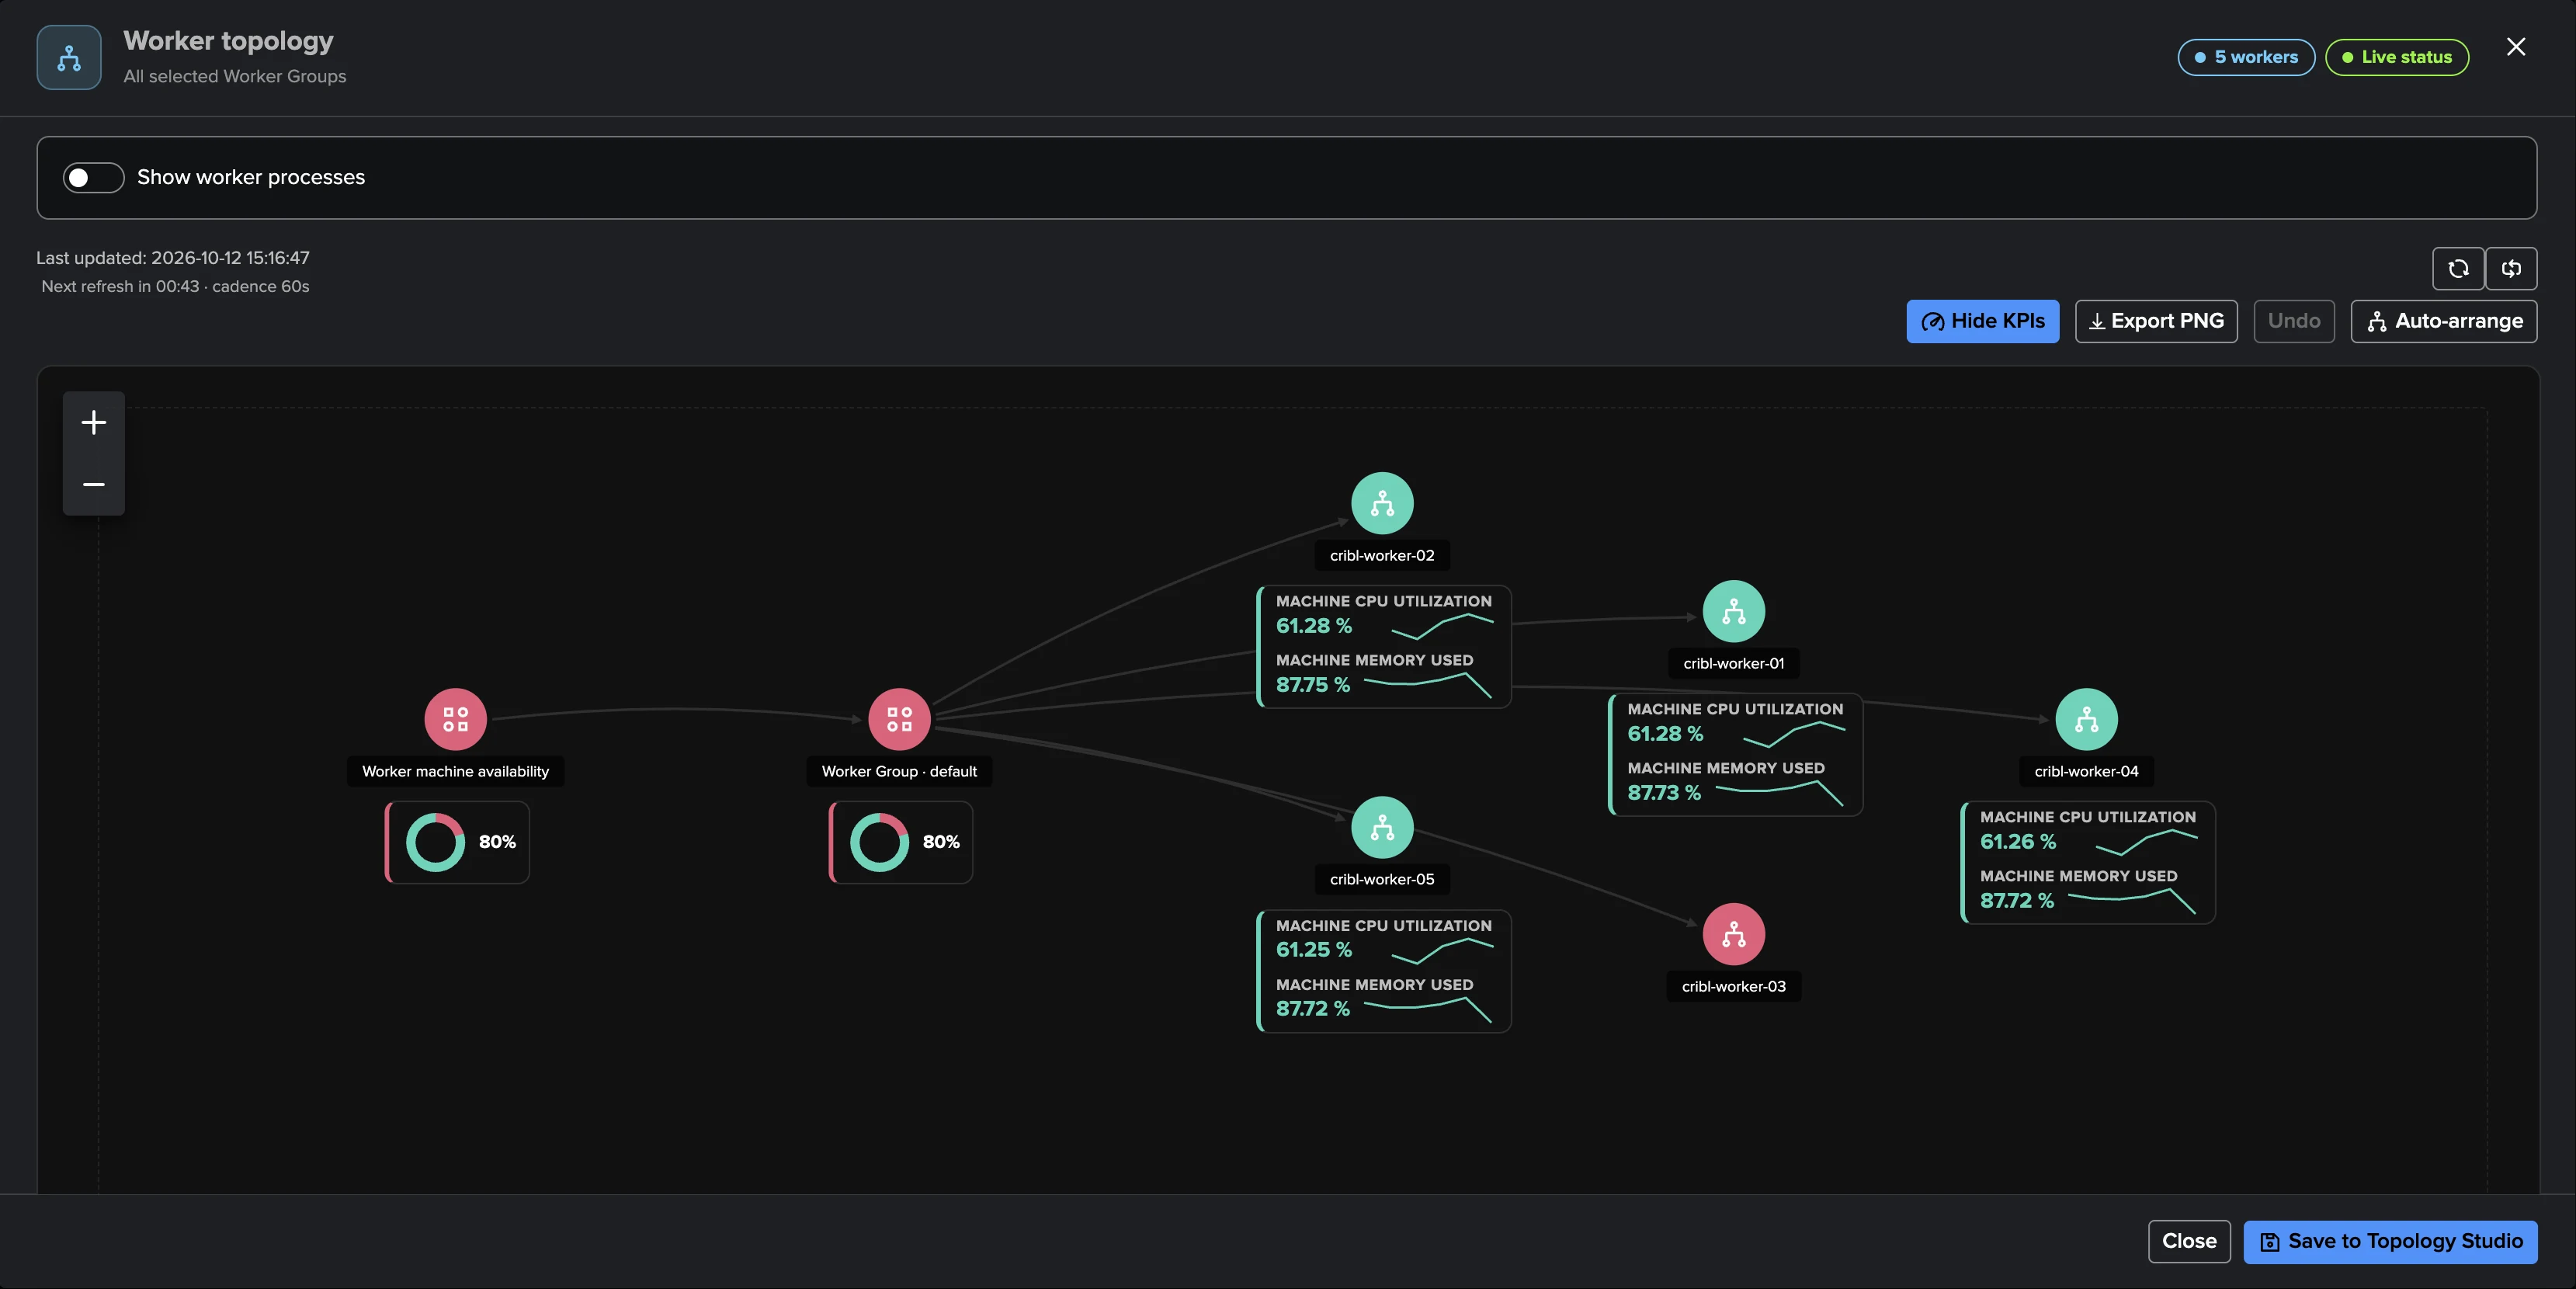
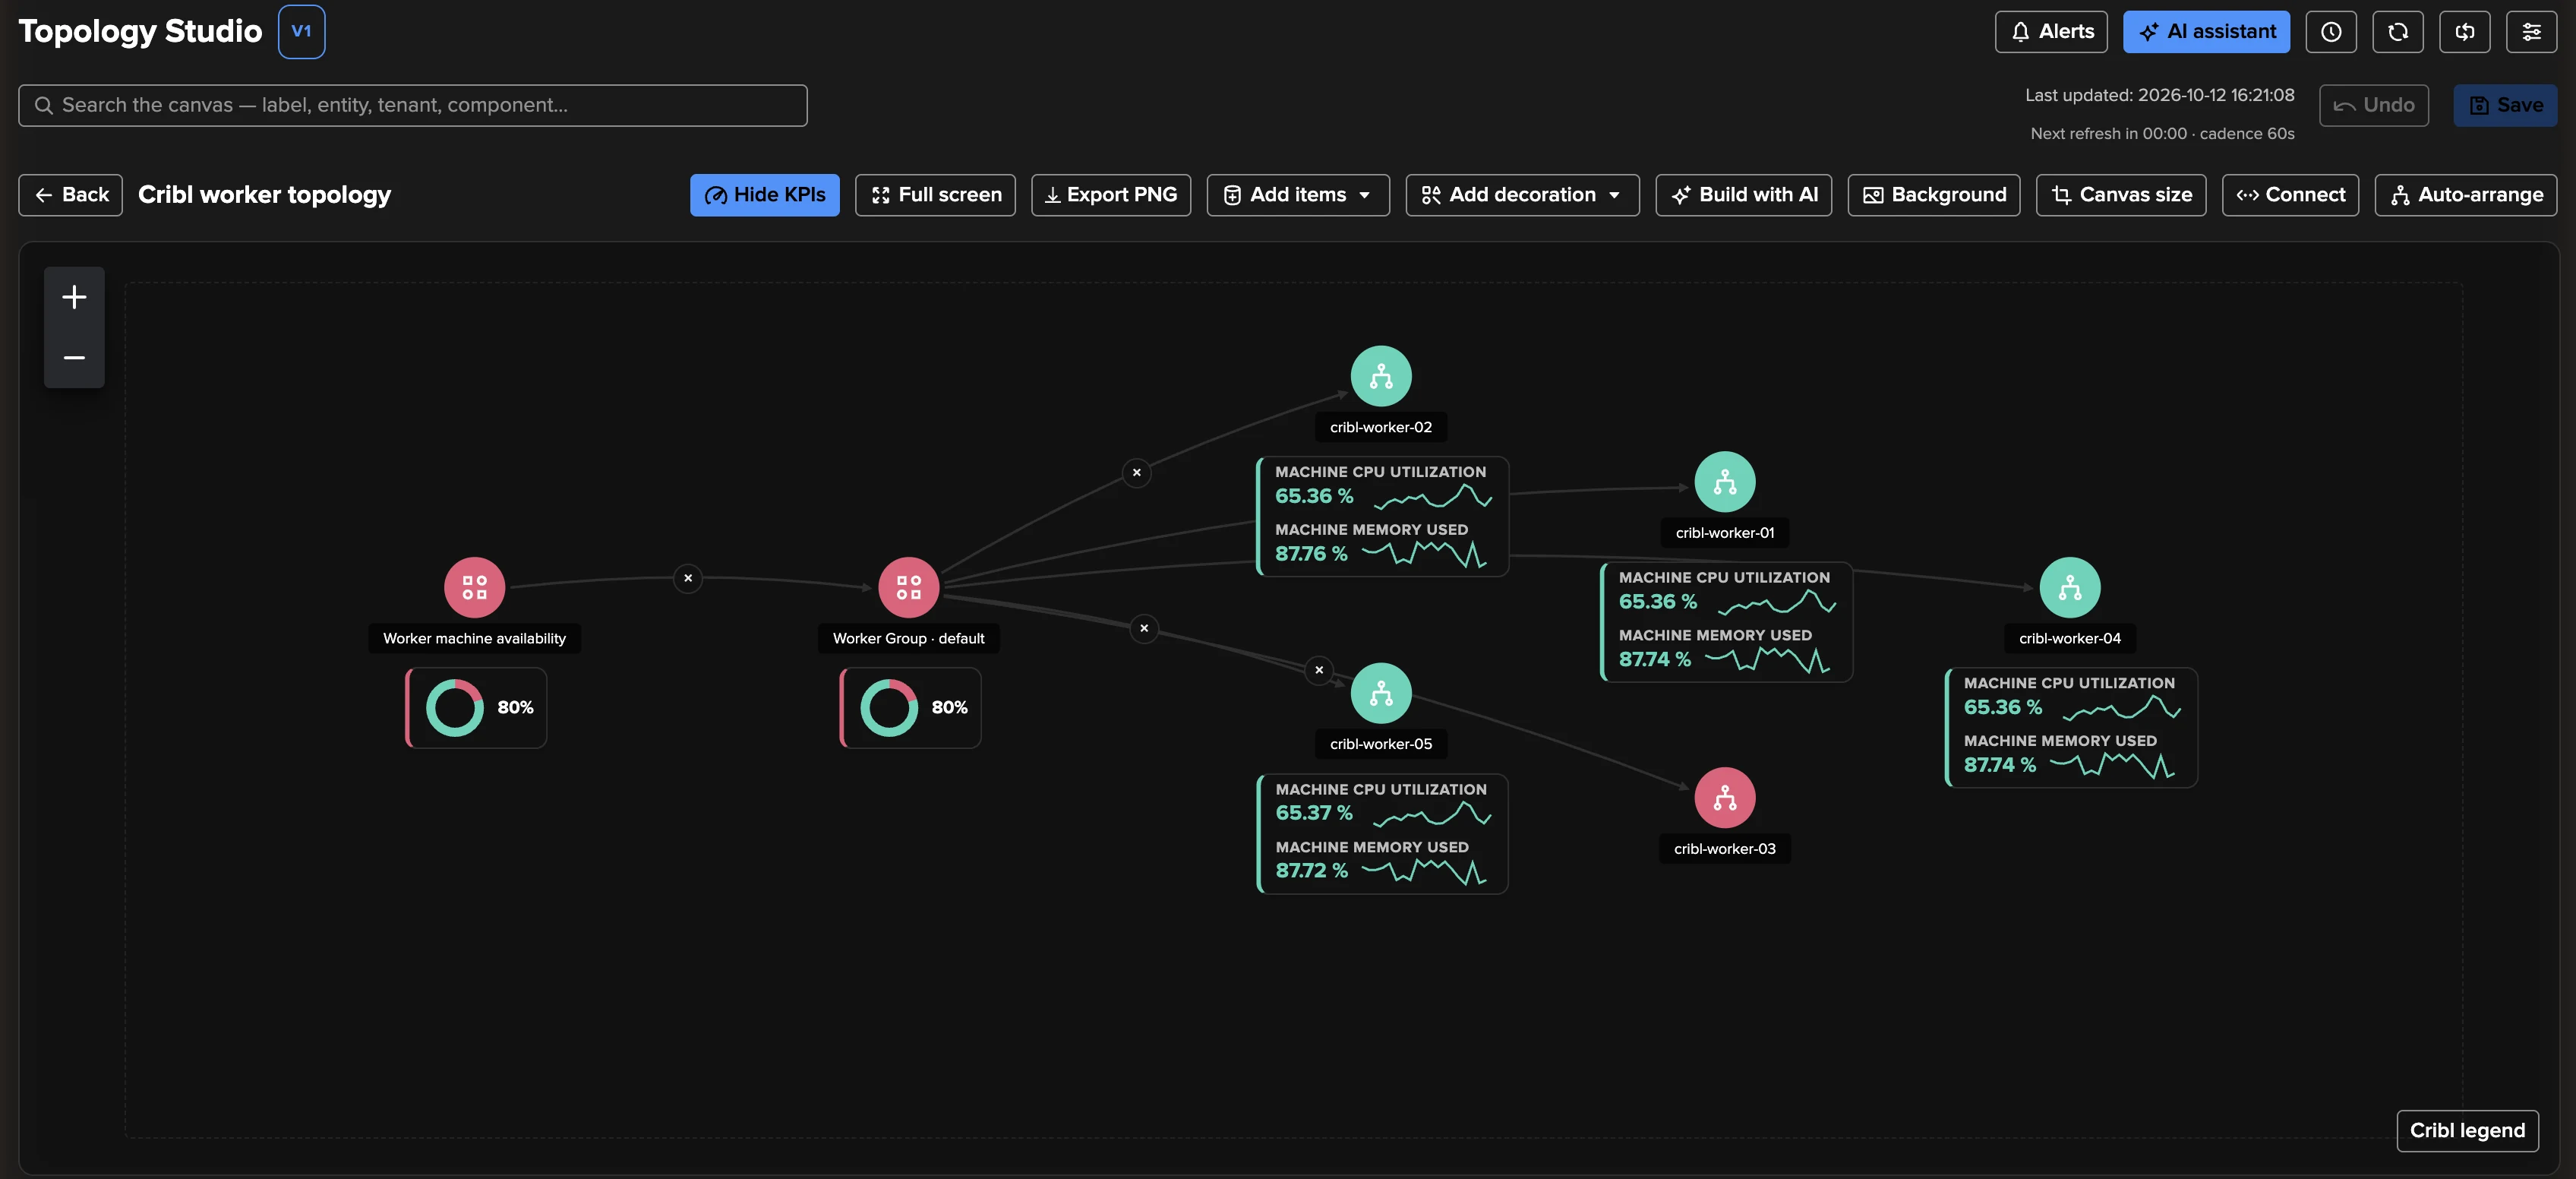
The view above is the Worker topology of a self-managed lab deployment: the Worker Group, its five Workers with their machine KPIs and their live status, drawn from what TrackMe already knows, refreshed in place and ready to be saved to Topology Studio. It is one of the views this page walks you through.
A Cribl Stream tenant reads two things you already have, and changes nothing in Cribl:
the Cribl internal metrics that your Workers send to a Splunk metric index (read where they are: nothing is copied, no licence is consumed by the metrics);
the Cribl Leader API, read-only and within a shared request budget, for the configuration (Worker Groups, Sources, Destinations, Pipelines, Routes, Packs), the Workers and the Leader itself.
On top of that, a catalogue of 16 built-in policies raises findings, traffic ML models learn what normal traffic looks like for every object and every hour, and a purpose-built workspace gives you the investigation and triage workflow.
A Cribl Stream tenant is a dedicated tenant type: it has no entities, no decision maker and no health score, and none of the DSM, DHM, MHM, FLX, FQM, WLK or VOL components. Its objects are Cribl objects and what it raises are findings. It shares its findings model — findings, Finding groups, triage, notifications, assignment, findings actions, AI Agent — with User Activity Monitoring and Cribl Edge: the concepts are explained once in Findings, Finding groups and findings actions, and this page documents what is specific to Cribl Stream.
Tip
Looking for the catalogue of policies, every setting and its default, the schedules, the REST endpoints or the troubleshooting table? They are in Cribl Stream reference. Monitoring Cribl Edge Fleets is a different tenant type: see Cribl Edge.
What it monitors
One tenant monitors one Cribl connection — a Cribl.Cloud workspace or a self-managed Leader — and the Worker Groups you choose in it.
Cribl object |
What TrackMe watches |
|---|---|
Leader |
Whether its API can be reached and used (network, certificate, credentials, service), and the CPU, memory and disk of each Leader node. |
Worker Groups |
The scope of the tenant: every other object belongs to a Worker Group. The metrics of a Worker Group that sends none are reported in Collection health. |
Workers |
Connected or not and the age of their heartbeat, their Cribl version against the version of the running Leader, their configuration against their Worker Group’s, and the CPU, memory, load and disk of the machine. |
Worker processes |
CPU and resident memory of every worker process, per Worker. |
Sources |
Events and bytes in, and the health Cribl reports for each Source. |
Destinations |
Events and bytes out, dropped events, the health Cribl reports, backpressure and the blocked state. |
Pipelines |
Events in and out, dropped events and errors. |
Routes |
Events in and out, tied to the configured Route with its Pipeline and Destination. |
Packs |
Listed with their Routes, Pipelines, Sources and Destinations; the Routes of a Pack are measured and tied to their Pack. |
Every Source, Destination, Pipeline and Route gets its own traffic ML model.
Note
What is not monitored. TrackMe does not read the events flowing through Cribl, does not monitor Cribl Edge Fleets from a Stream tenant (that is a Cribl Edge tenant), and does not measure filesystems other than the one Cribl reports for each Worker and each Leader node (separate queue, log or shared-storage mounts are not measured). It never changes anything in Cribl: every action you take in TrackMe — dismissing a finding, turning monitoring off for an object — stays in TrackMe.
Before you start
You need four things.
1. A licence that includes Cribl Stream. A Cribl Stream tenant needs the Enterprise or Unlimited edition (the Unlimited trial and the Developer licence included). It is not available on the Foundation edition or the Foundation trial: the tenant creation card reads Restricted component there.
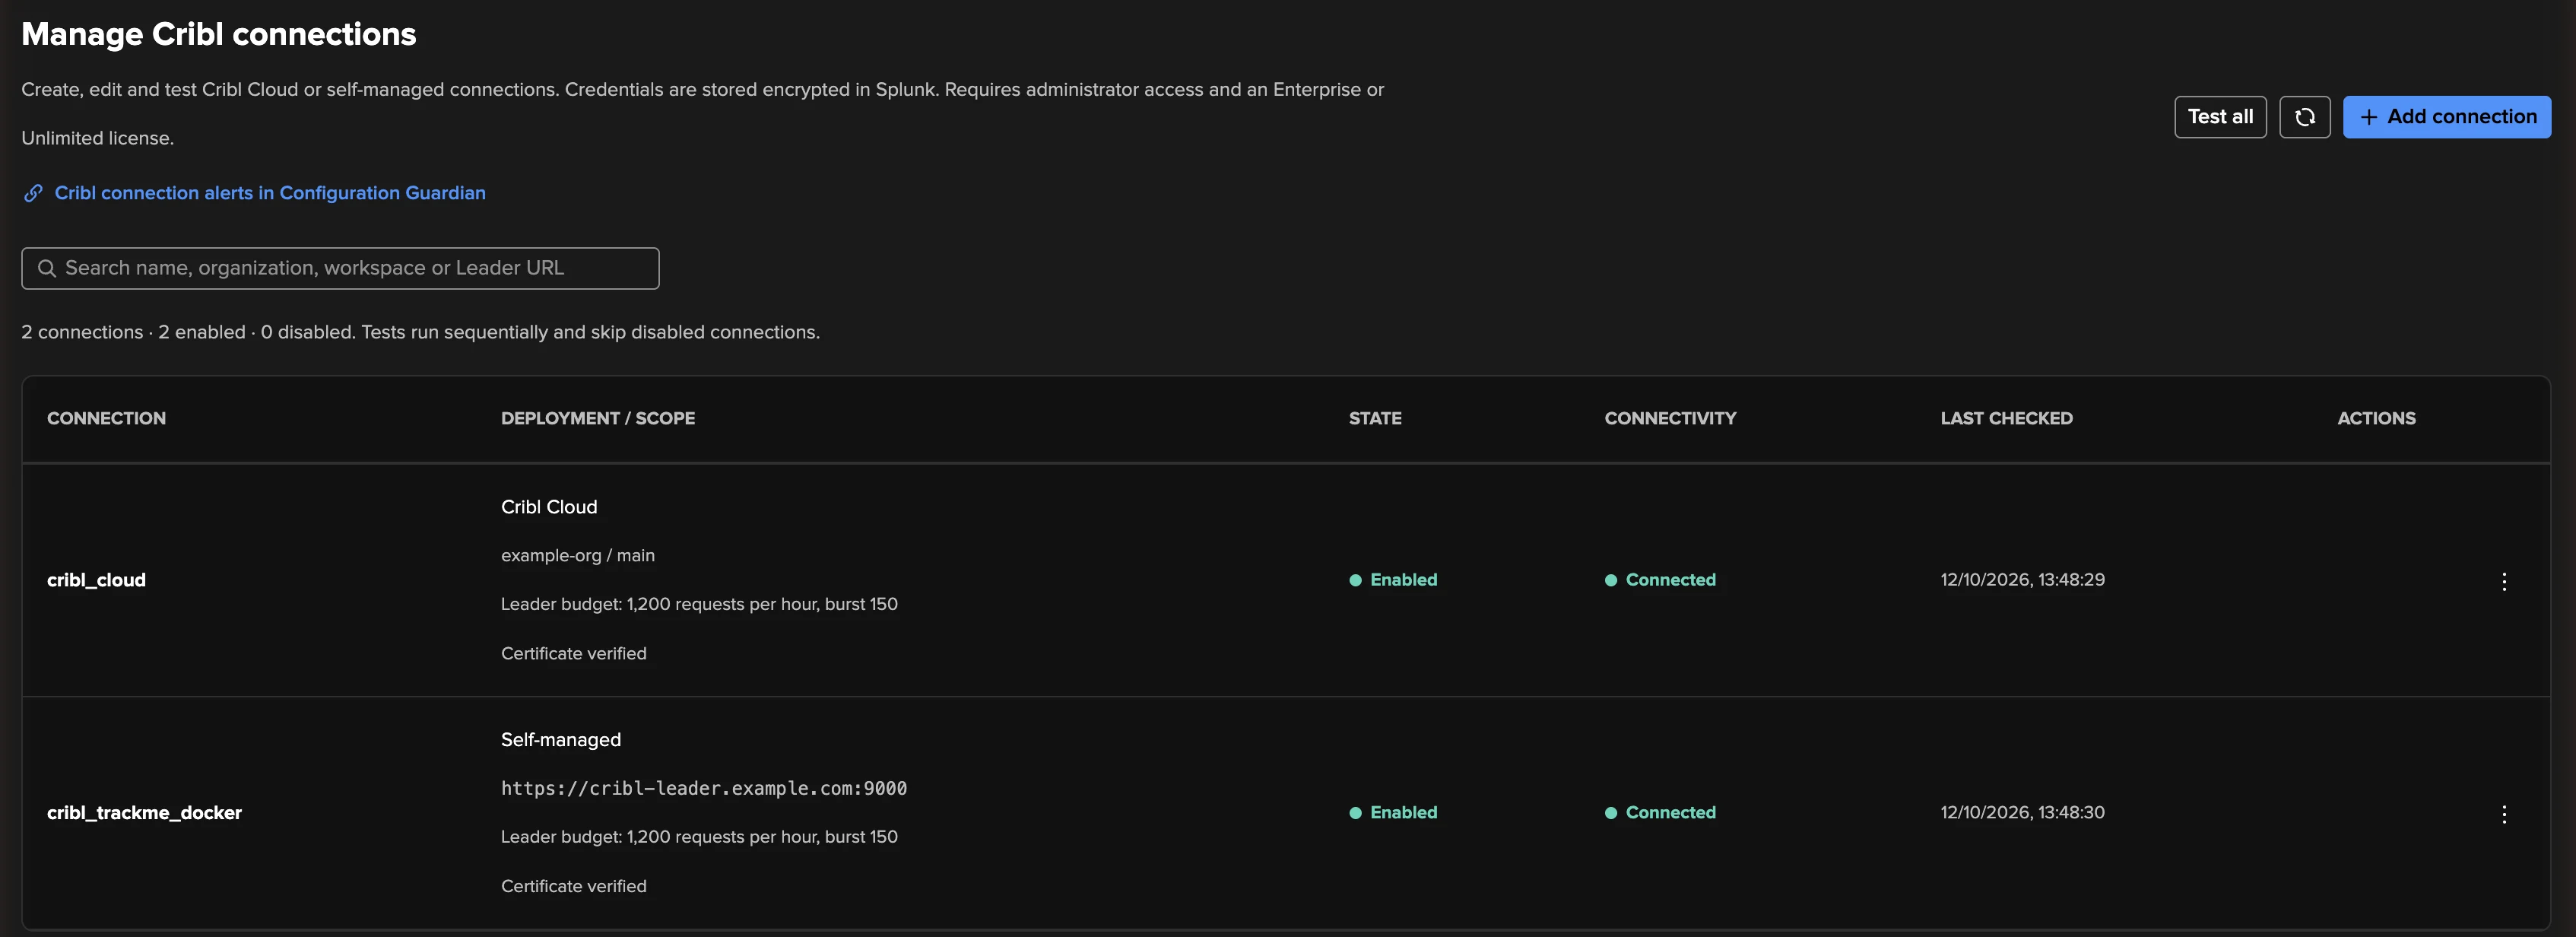
2. A Cribl connection. Declare it once in Configuration → Cribl connections: a Cribl.Cloud organization and workspace with an API client ID and secret, or a self-managed Leader URL with a user name and password, plus its TLS settings and the Leader request budget. The account only needs read access to Cribl Stream’s configuration and Workers: TrackMe never writes to Cribl. See Cribl connections.
3. Cribl’s internal metrics in a Splunk metric index. Cribl Stream produces internal
metrics (cribl.logstream.* by default) about every Source, Destination, Pipeline, Route
and worker process. Send them to a Splunk metric index searchable from the TrackMe search
head: in Cribl, enable the built-in Cribl Internal Source for its metrics and route them to
a Splunk Destination that writes into a metric index, on every Worker Group the tenant will
monitor. If your deployment renames them,
note the metric prefix: the wizard asks for it (cribl.logstream. by default). TrackMe
reads the metrics in place.
Tip
You do not need to know the index name in advance: the wizard looks at your metric indexes, finds the ones where this connection’s Workers report, and proposes them with a Use this index button.
4. The right roles. Every role of the tenant reads the workspace; the tenant’s power and admin roles triage findings; a TrackMe administrator of this tenant — an account holding the TrackMe administrator capability and one of the tenant’s admin roles — edits policies and settings and runs jobs. Splunk administrators can do everything on every tenant. The full table is in Cribl Stream reference.
Create the tenant
From the Virtual Tenants page, open Actions → Create a tracking tenant and choose the Cribl Stream card. The wizard has four steps.
Step 1 — Basics
The tenant identifier (lowercase letters, digits and hyphens, up to 20 characters; it cannot change later), an optional alias shown on the tenant card — for example Cribl Stream - Cloud — and an optional description.
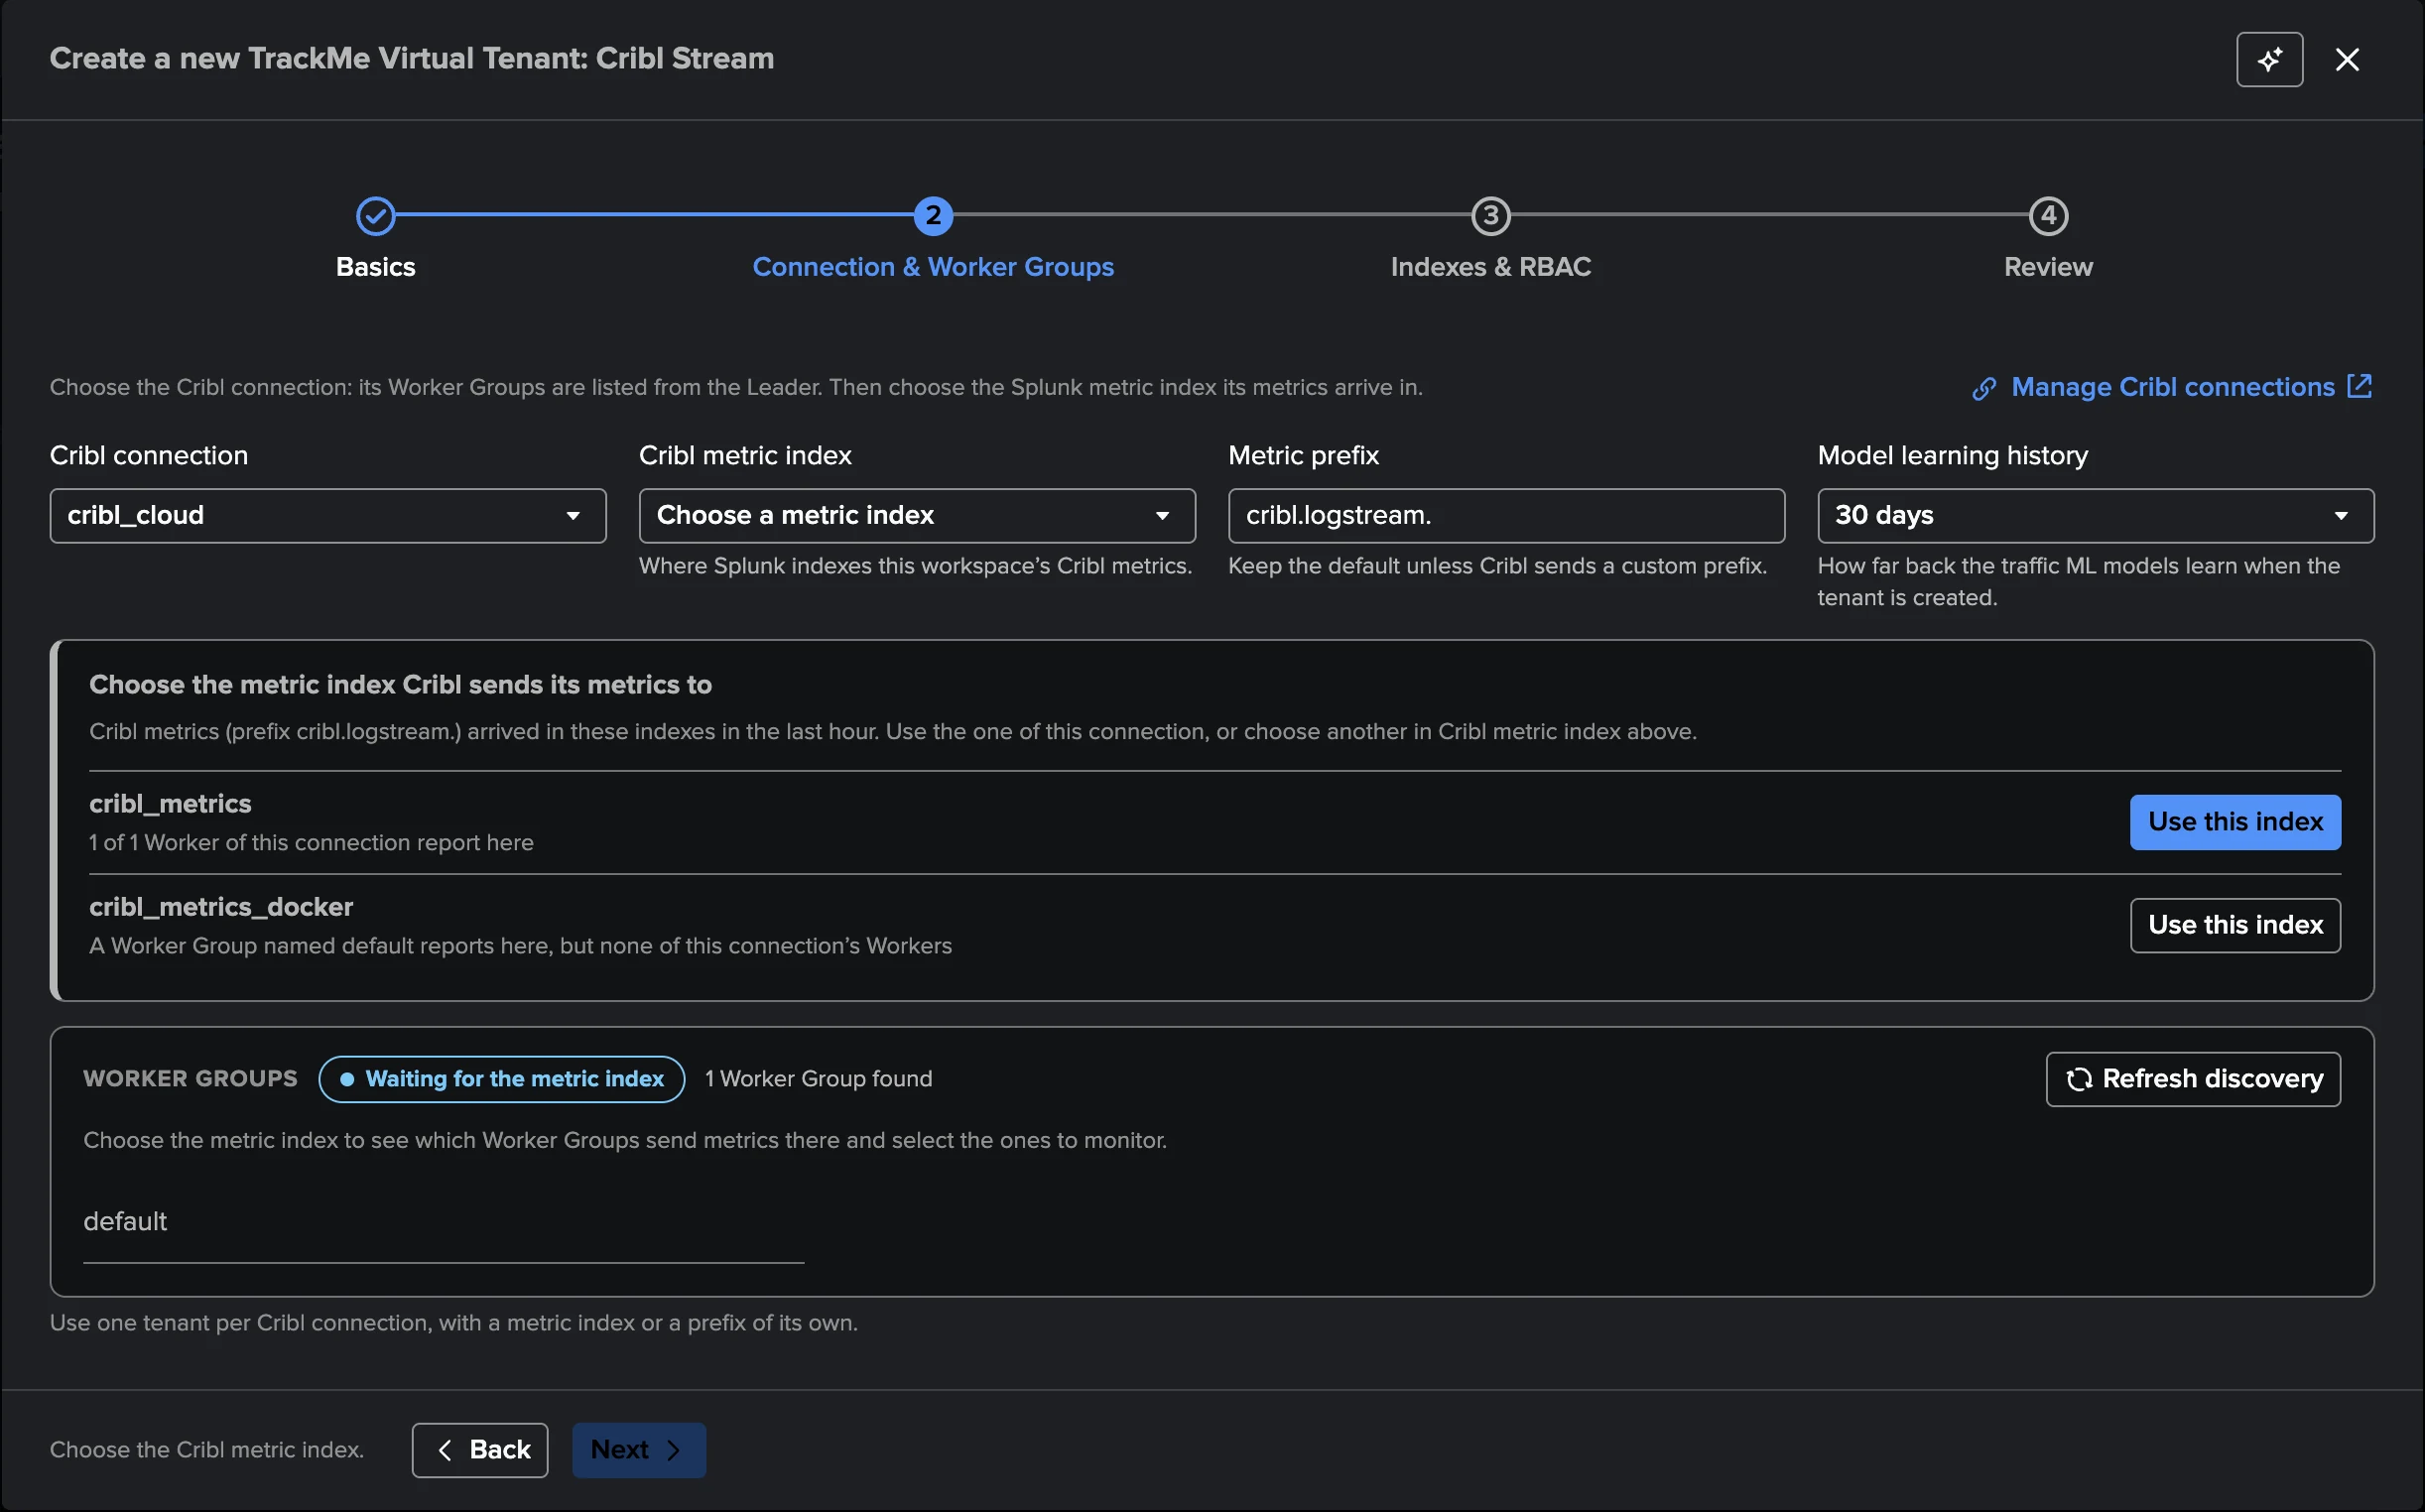
Step 2 — Connection & Worker Groups
This is where TrackMe meets your Cribl deployment:
Cribl connection — choose the connection. Its Worker Groups are listed from the Leader at once. If the Leader refuses the credentials or asks TrackMe to slow down, the wizard says what to do next and offers Refresh discovery.
Cribl metric index — under Indexes with Cribl metrics, TrackMe lists the metric indexes where this connection’s Workers report (up to five), each with Use this index. It warns you when an index also carries Worker Groups of the same name from another deployment, so two deployments never mix.
Metric prefix —
cribl.logstream.unless your Cribl deployment renames its metrics.Model learning history — how far back the traffic ML models learn when the tenant is created: From today on, 7, 14, 30 (default), 60 or 90 days. With history already in the metric index, the models can detect on the first day; with From today on, they need about a week before they open findings.
Worker Groups — all are selected; keep the ones this tenant should monitor (1 to 100).
A disabled Next always says why (a connection to choose, discovery still running, no Worker Group selected).
Tip
Use one tenant per Cribl connection. A very large deployment (more than about 20 000 monitored objects) is split across several tenants by Worker Group.
Step 3 — Indexes & RBAC
The TrackMe indexes of the tenant (summary, audit, metric, notable — the notable index
receives the finding events), the tenant owner (nobody or an account holding the
capabilities the wizard lists) and the admin, power and user roles of the tenant.
Step 4 — Review
Check the summary and create. The first collection starts at once: the live metrics, the inventory of the Leader and the model training all run within minutes, so the workspace fills without waiting for the schedules.
The workspace
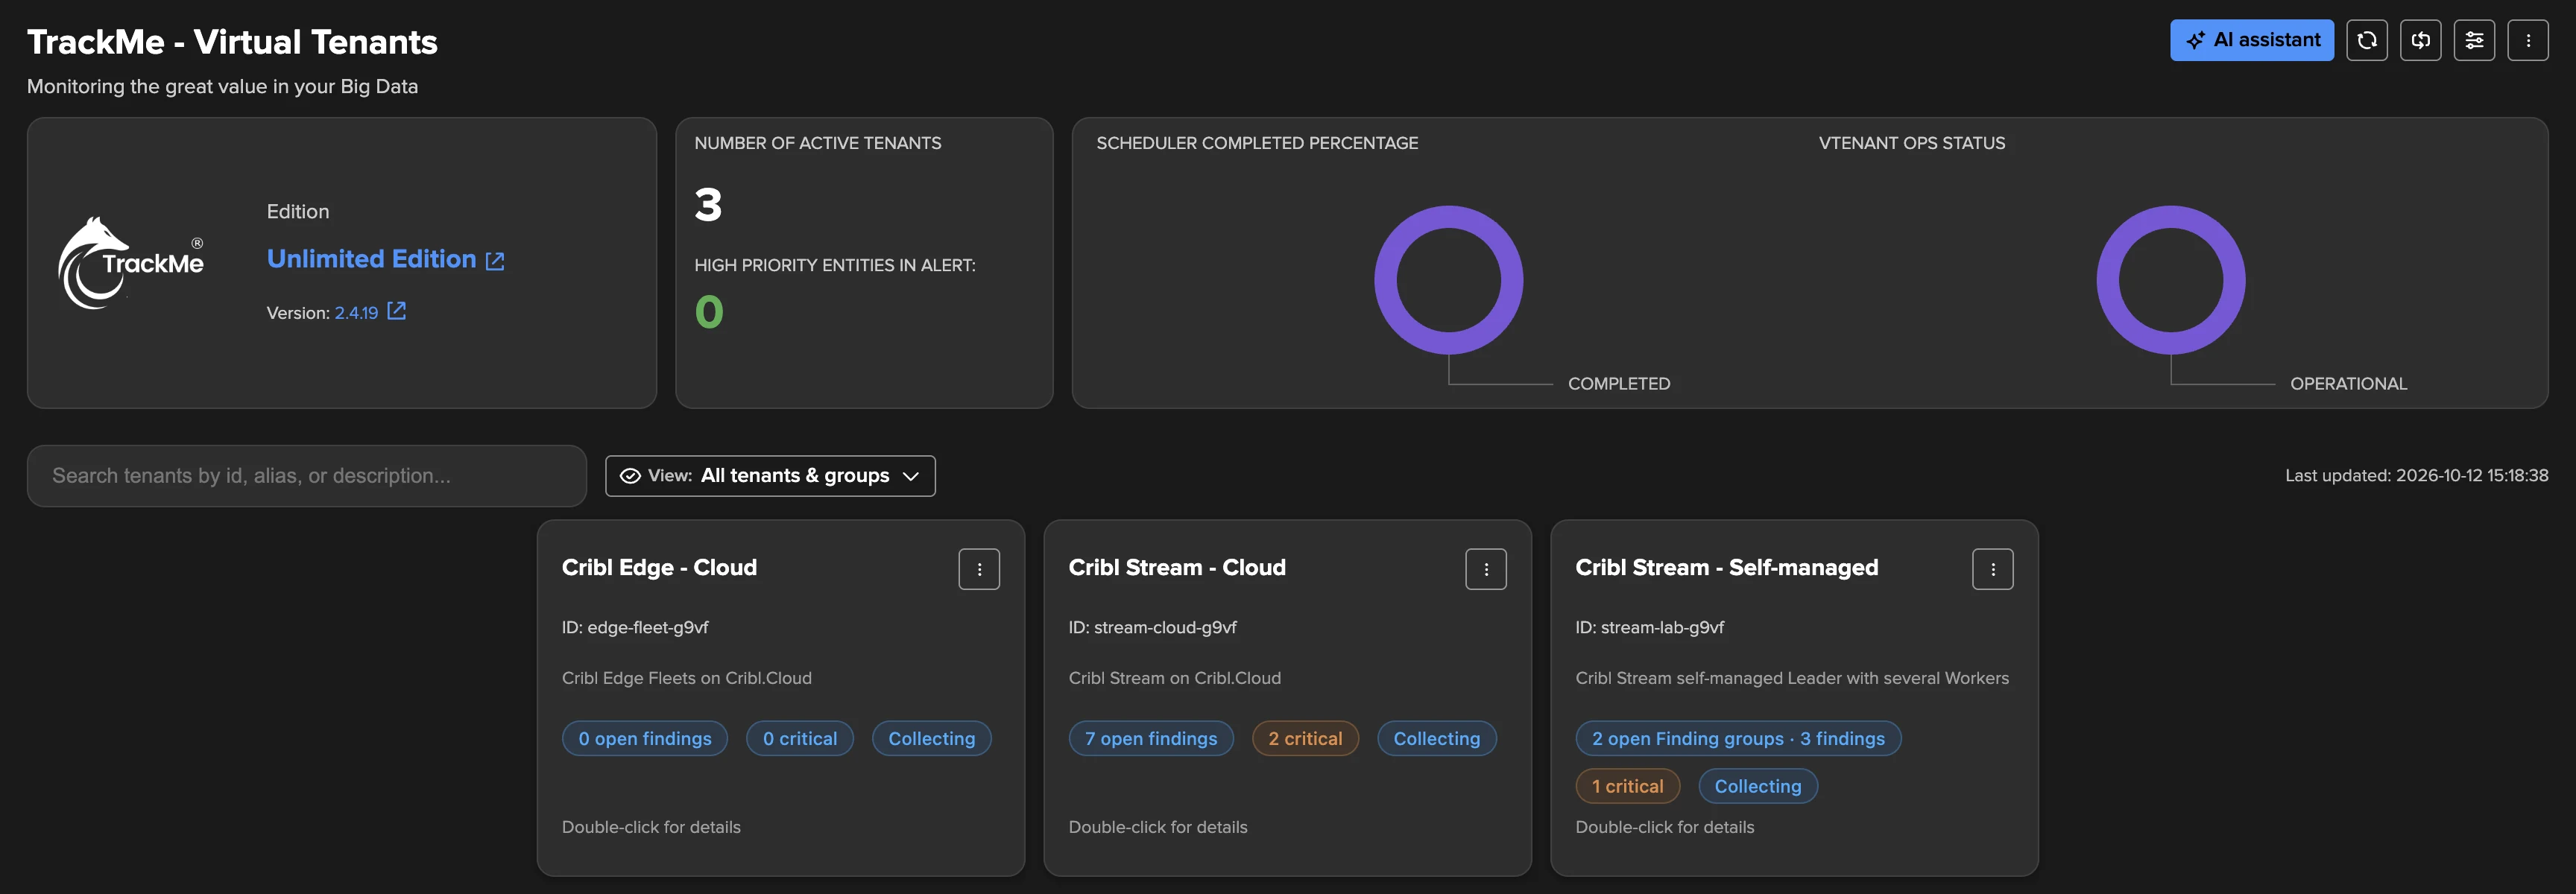
A Cribl Stream tenant appears on the Virtual Tenants page with the Cribl Stream logo, its unresolved and critical findings and its collection status. Selecting it opens its workspace.
The status strip. At the top of the workspace, a strip tells you at a glance that the tenant is working:
Connection — the Cribl connection this tenant monitors;
Leader — reachable, unavailable, rate limited or unknown, from the last Leader API check (hover for the reason and when it was checked);
Worker Groups — the Worker Groups monitored;
Inventory, Live metrics and Traffic ML models — the last run of each job, and how many models are learned;
Refresh, and for a TrackMe administrator of the tenant Collect now (read the newest metrics and evaluate the policies now).

Eleven tabs follow, in this order: Findings, Monitoring, Traffic ML models, Infrastructure, Deployment, Routes & pipelines, Inventory, Policies, Collection health, AI Agent and Settings. Every table is sorted, filterable from its column headers and paged on the server, so it stays fast at any size. Every figure has a ⋮ menu with View chart data, Open in Search (a plain, editable search on your metric index or on the tenant’s data that reproduces the figure) and Refresh.
Findings
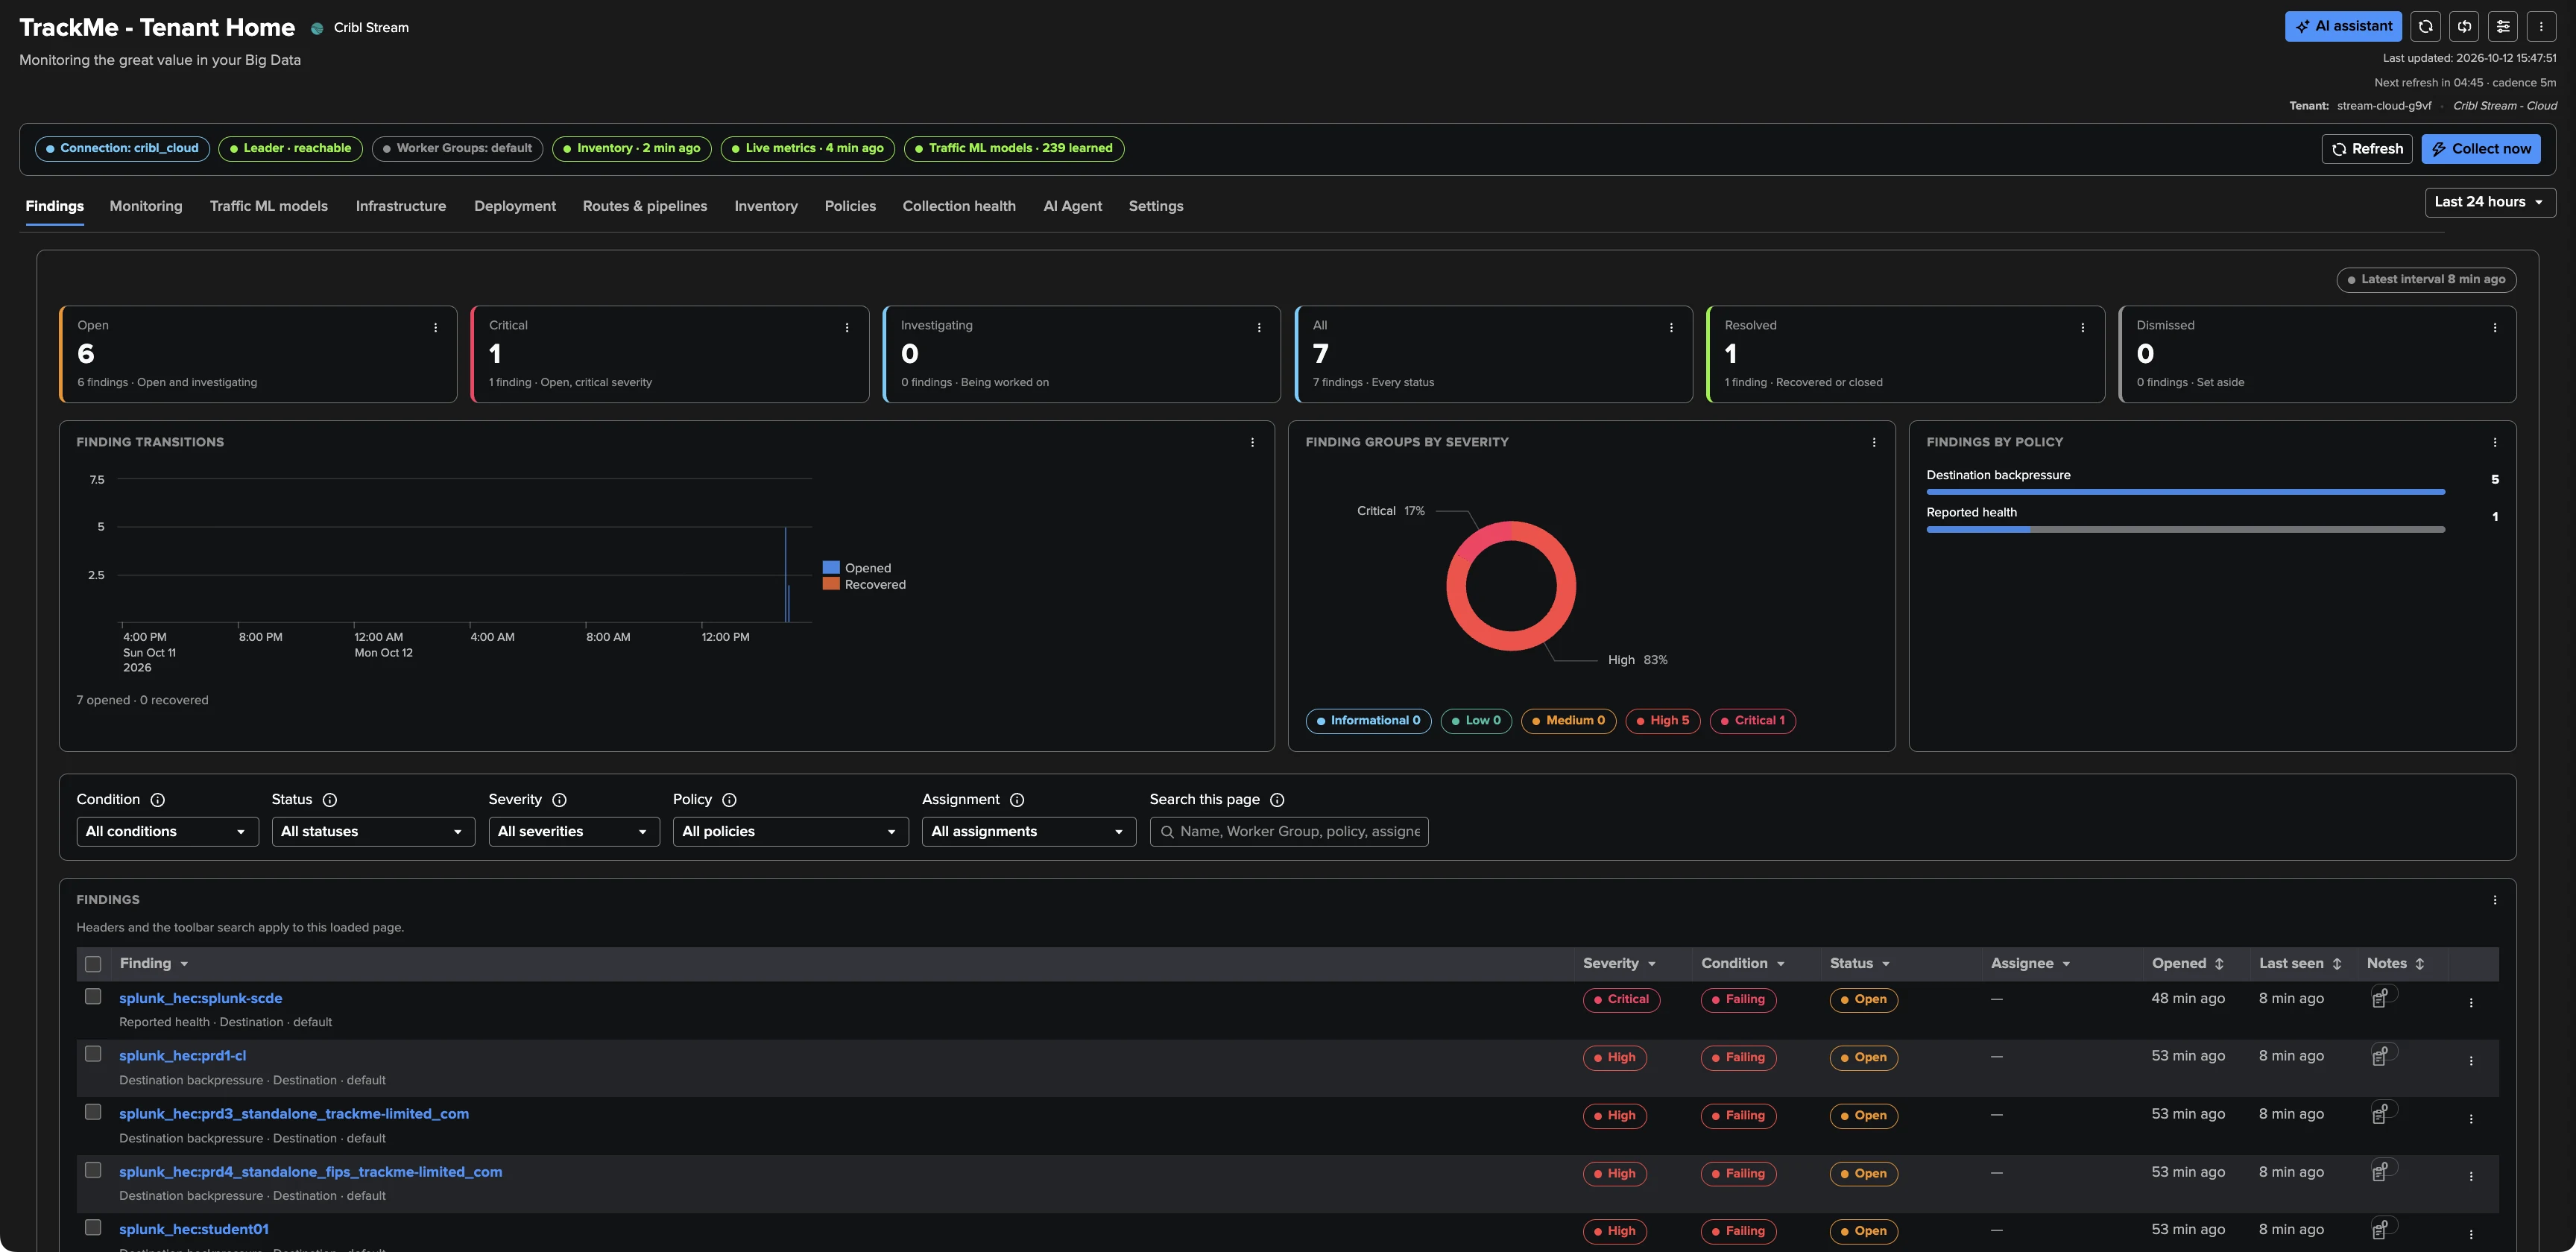
Your investigation backlog, and the tab the workspace opens on. Tiles count what needs attention, charts show the finding transitions over the selected time range and the open findings by severity and by policy, and the table lists one row per Finding group — usually one object with all its findings — with its condition, status, severity, policy, assignee and last measurement. Filters cover the condition, status, severity, policy and assignment, and a search box finds an object, a Worker Group or an assignee.
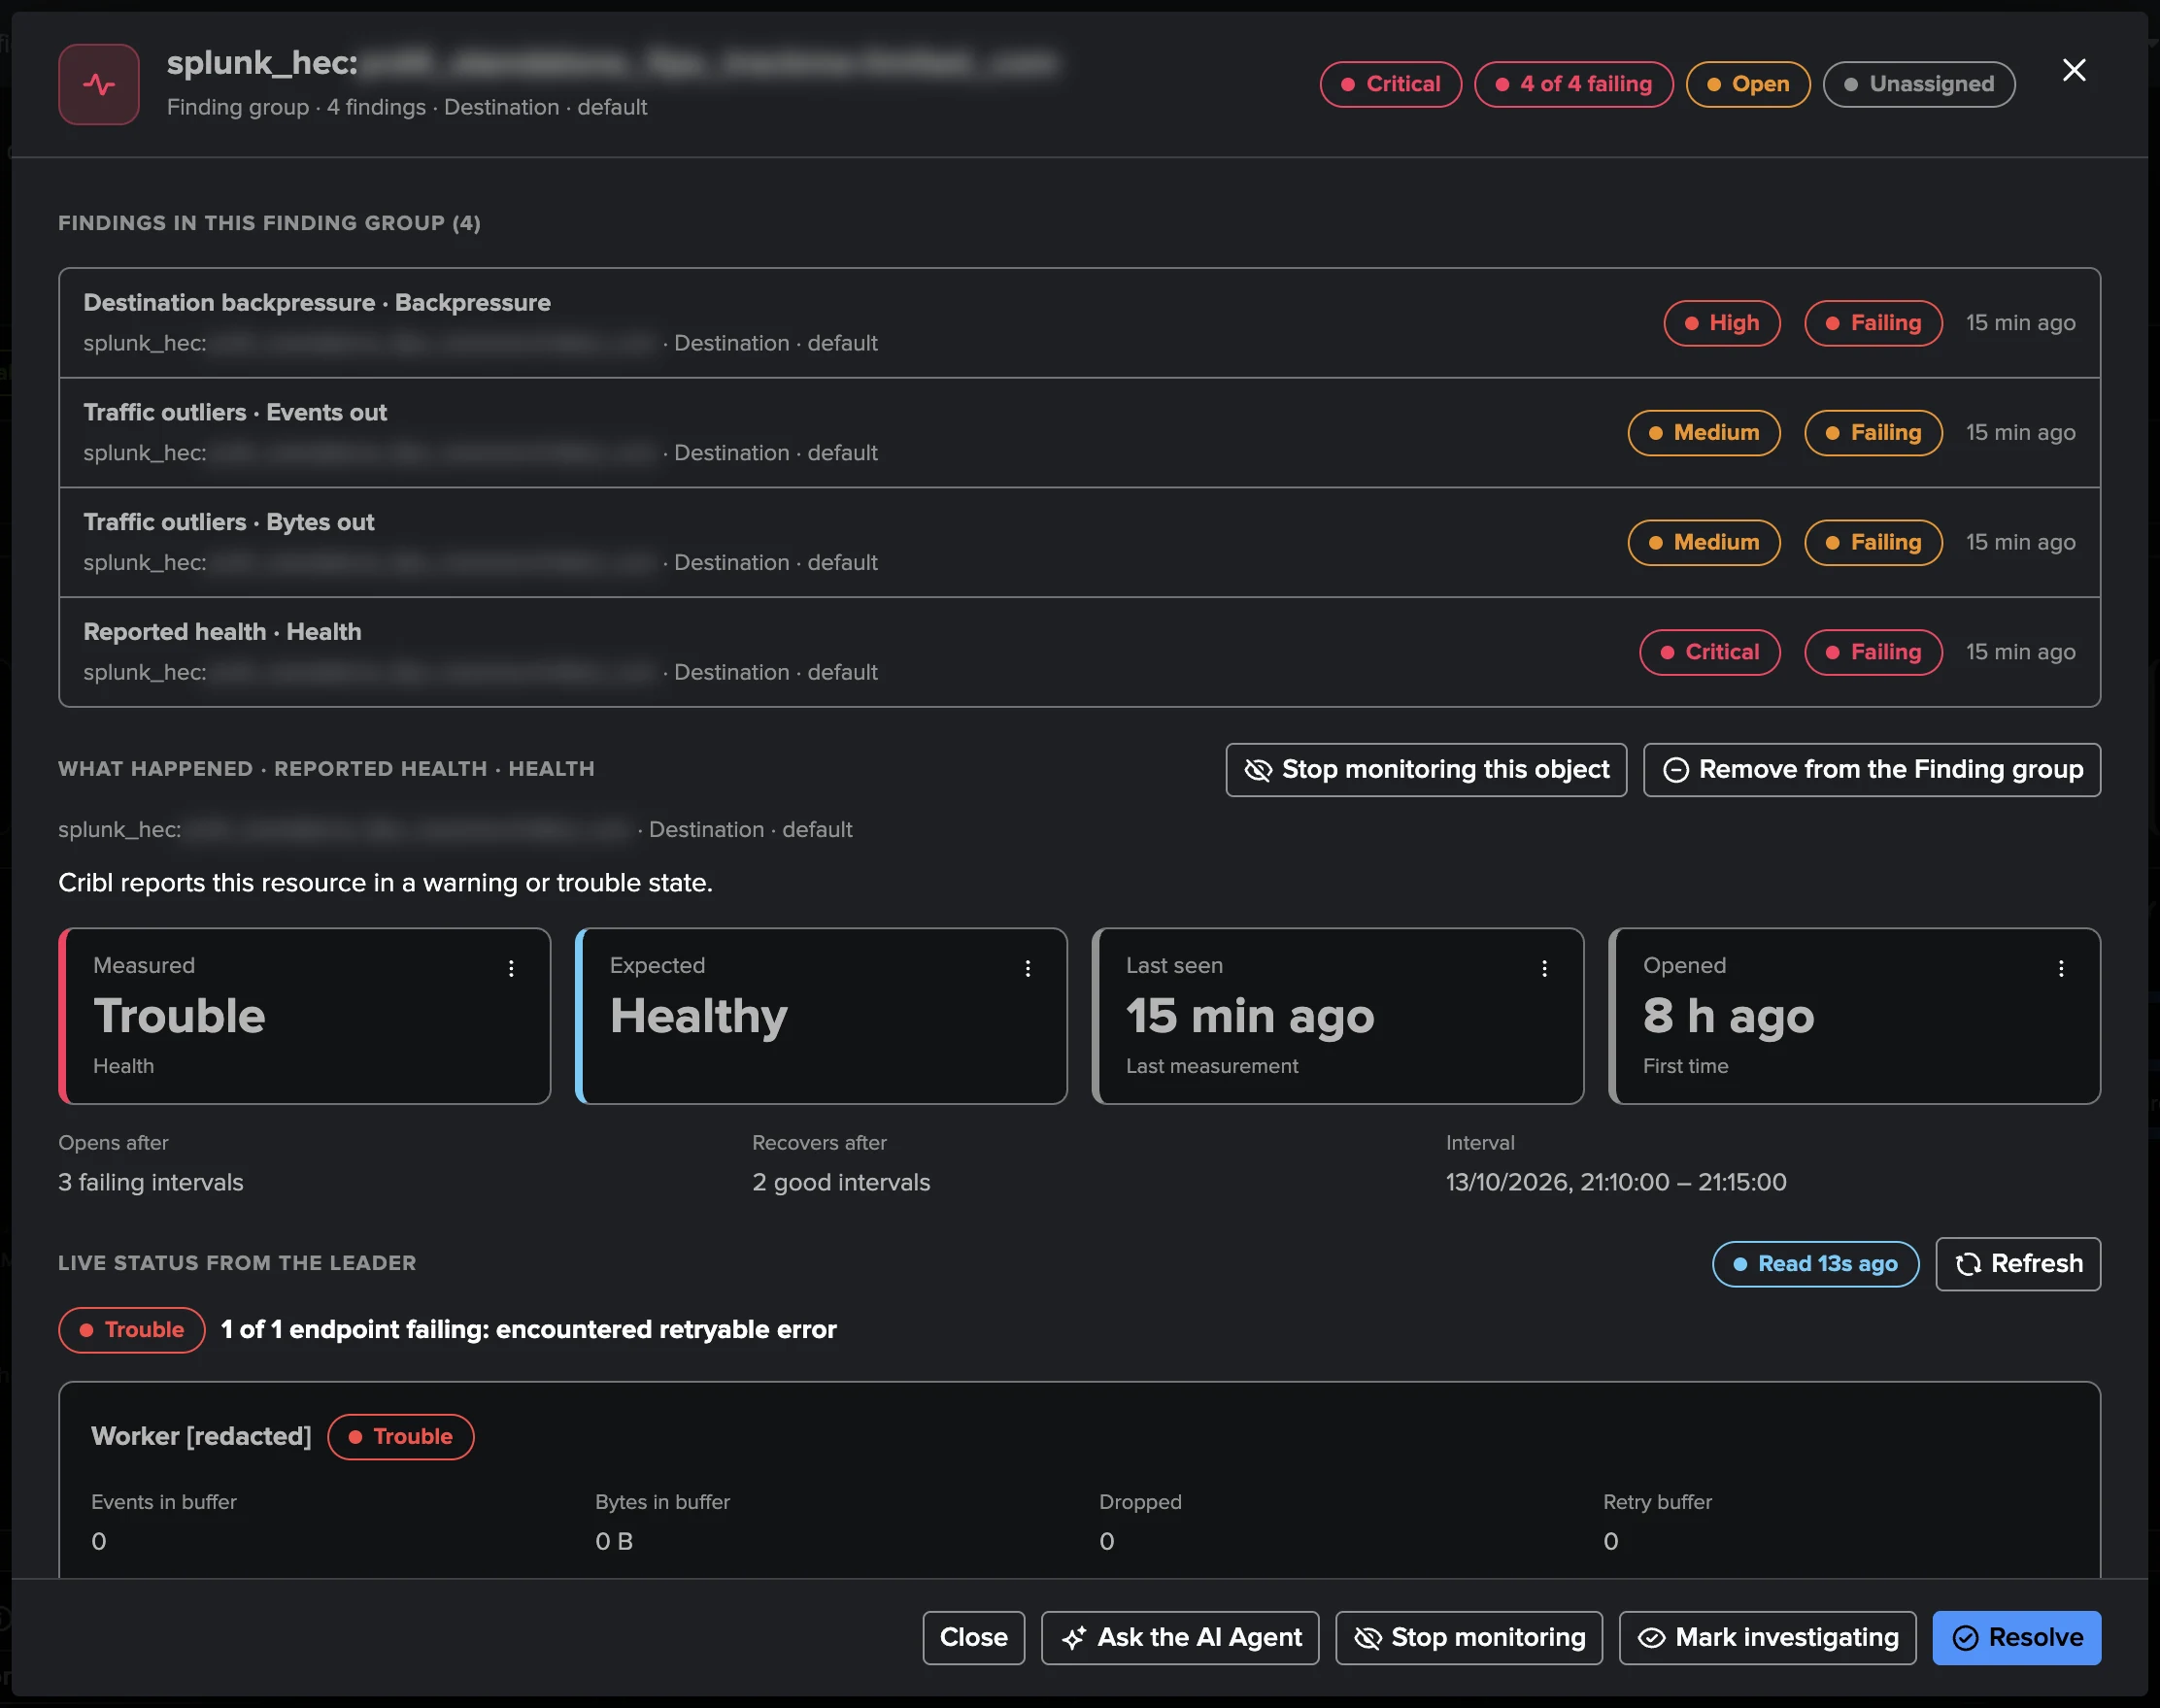
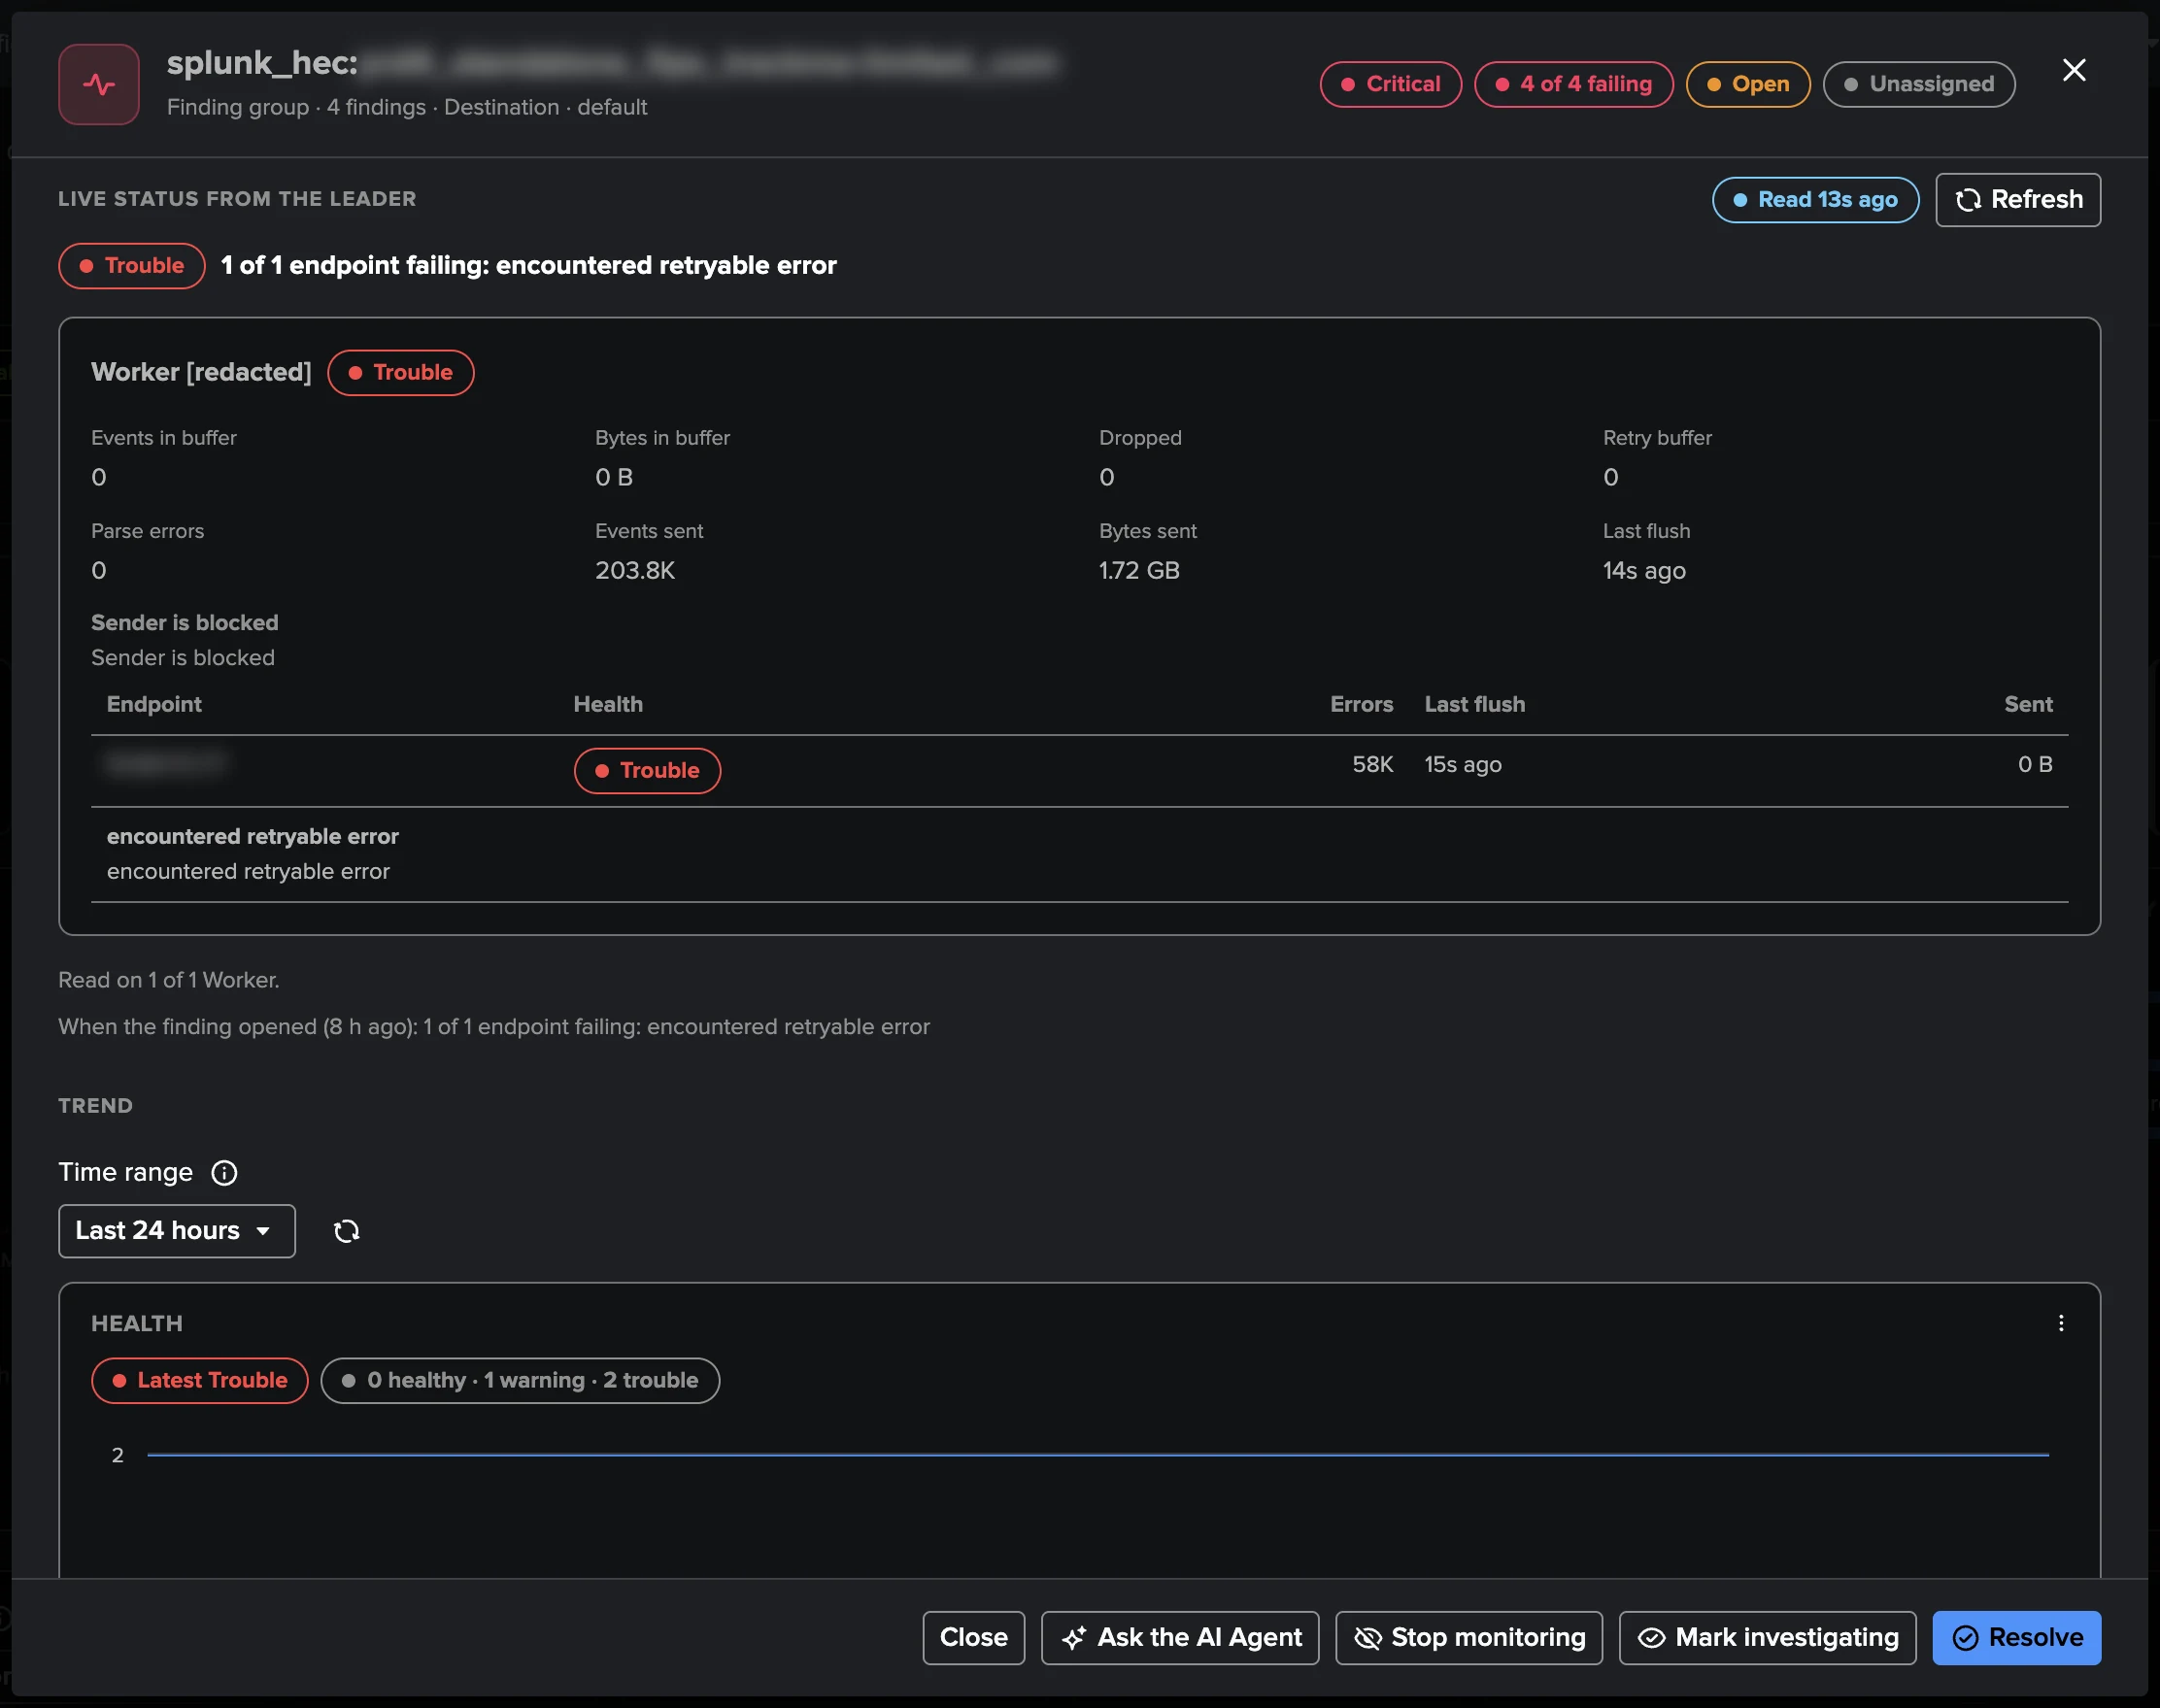
Selecting a row opens the investigation drawer: what happened in plain words, the chart of the measurement with its expected range (or the policy’s threshold and recovery lines for a Worker or the Leader), the live status the Leader reports for a Source or Destination, the object’s state in the Inventory, the notes and the full history. A Finding group lists its findings first: select one to see what happened and its measurement, and the triage below applies to the whole group.
Monitoring
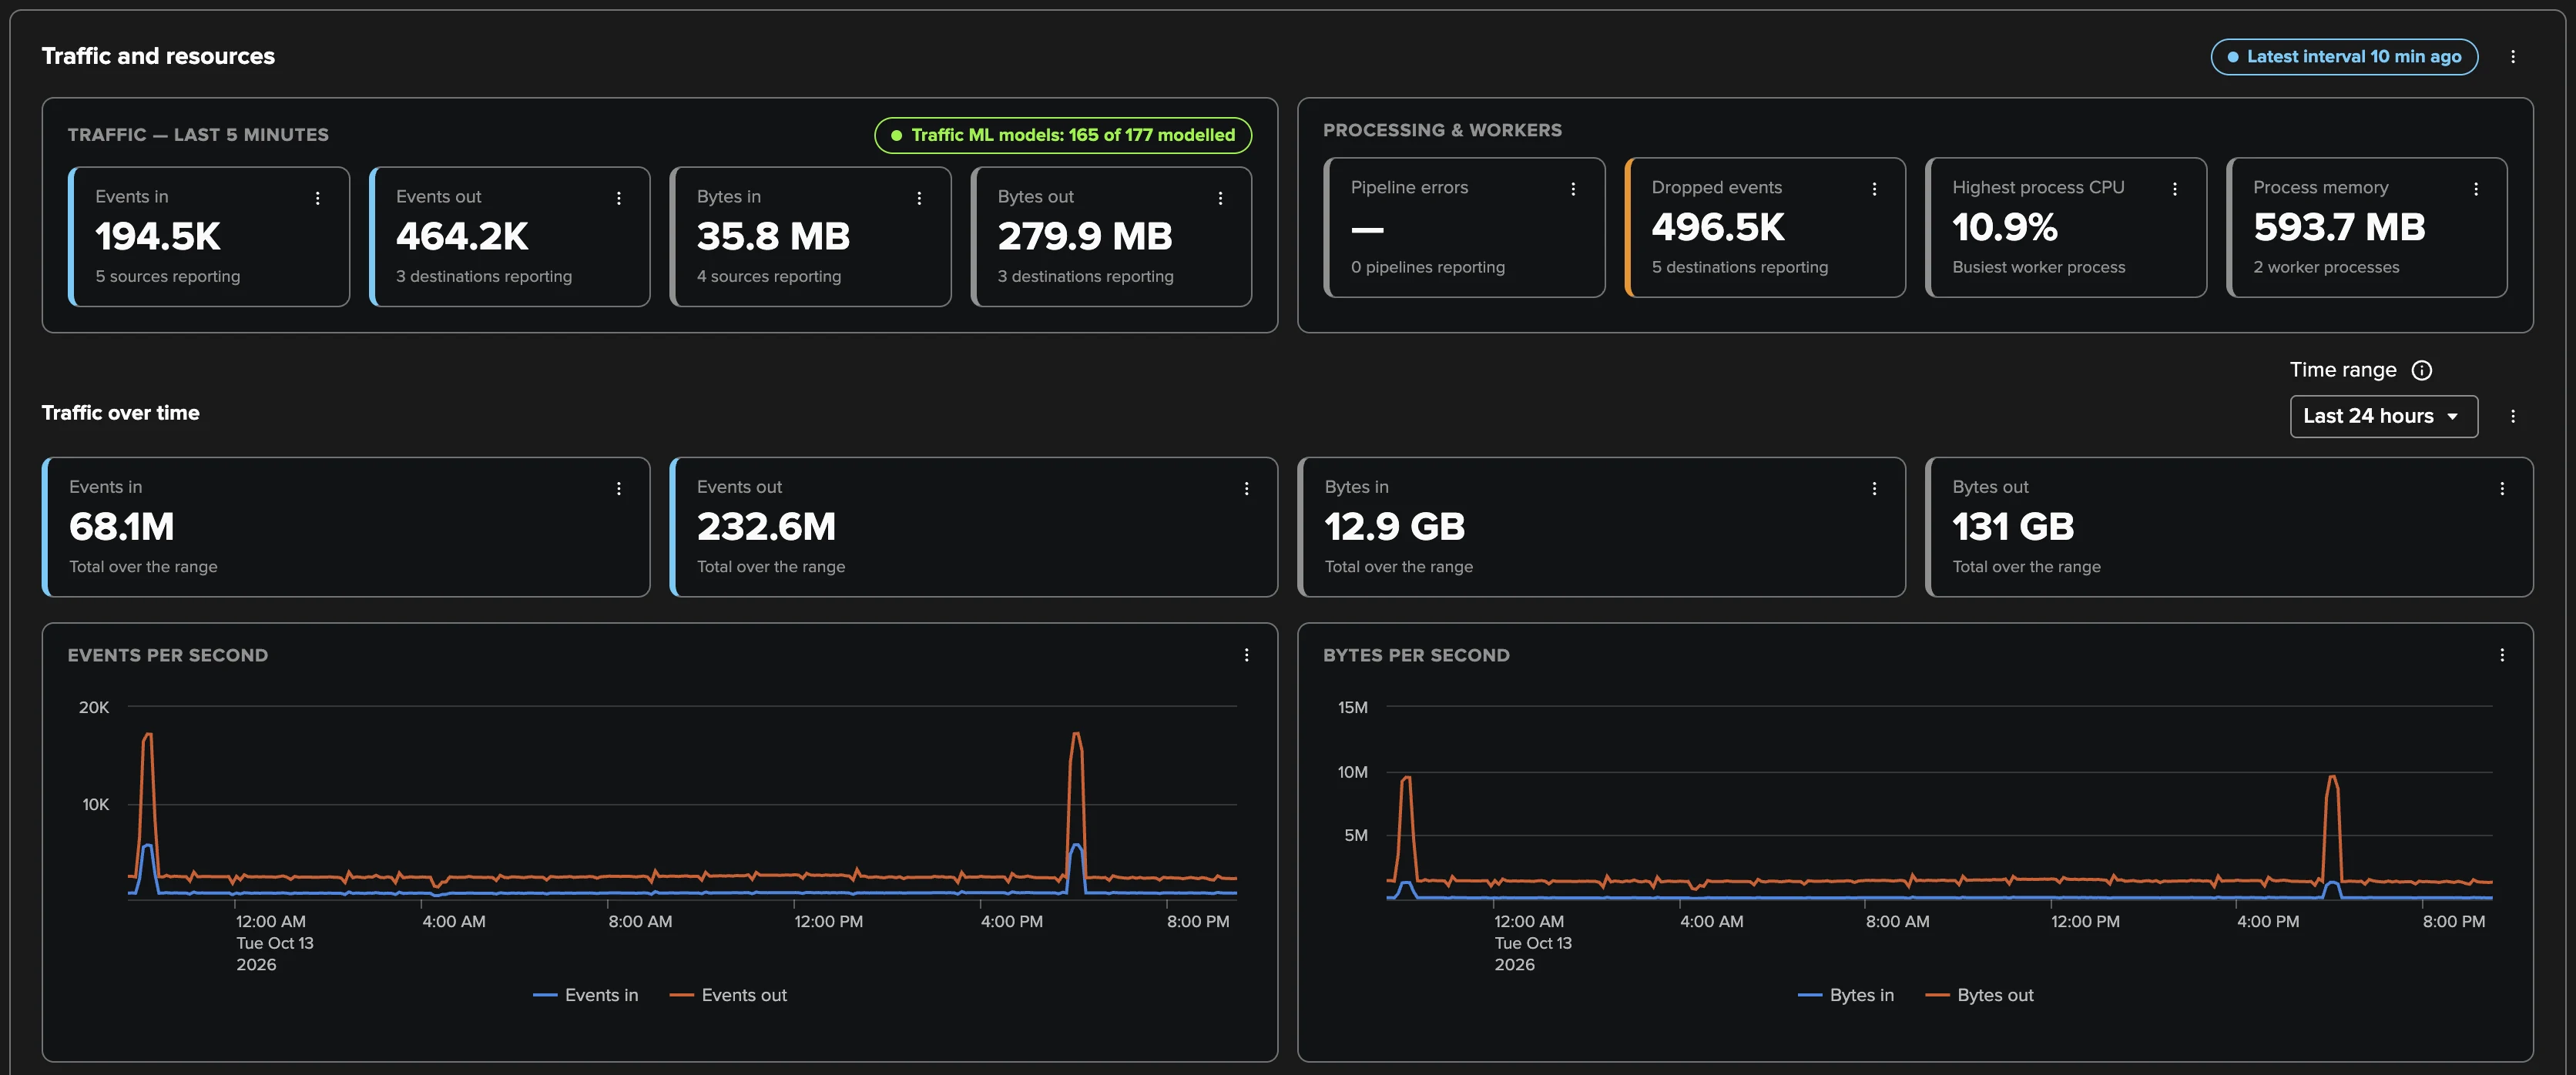
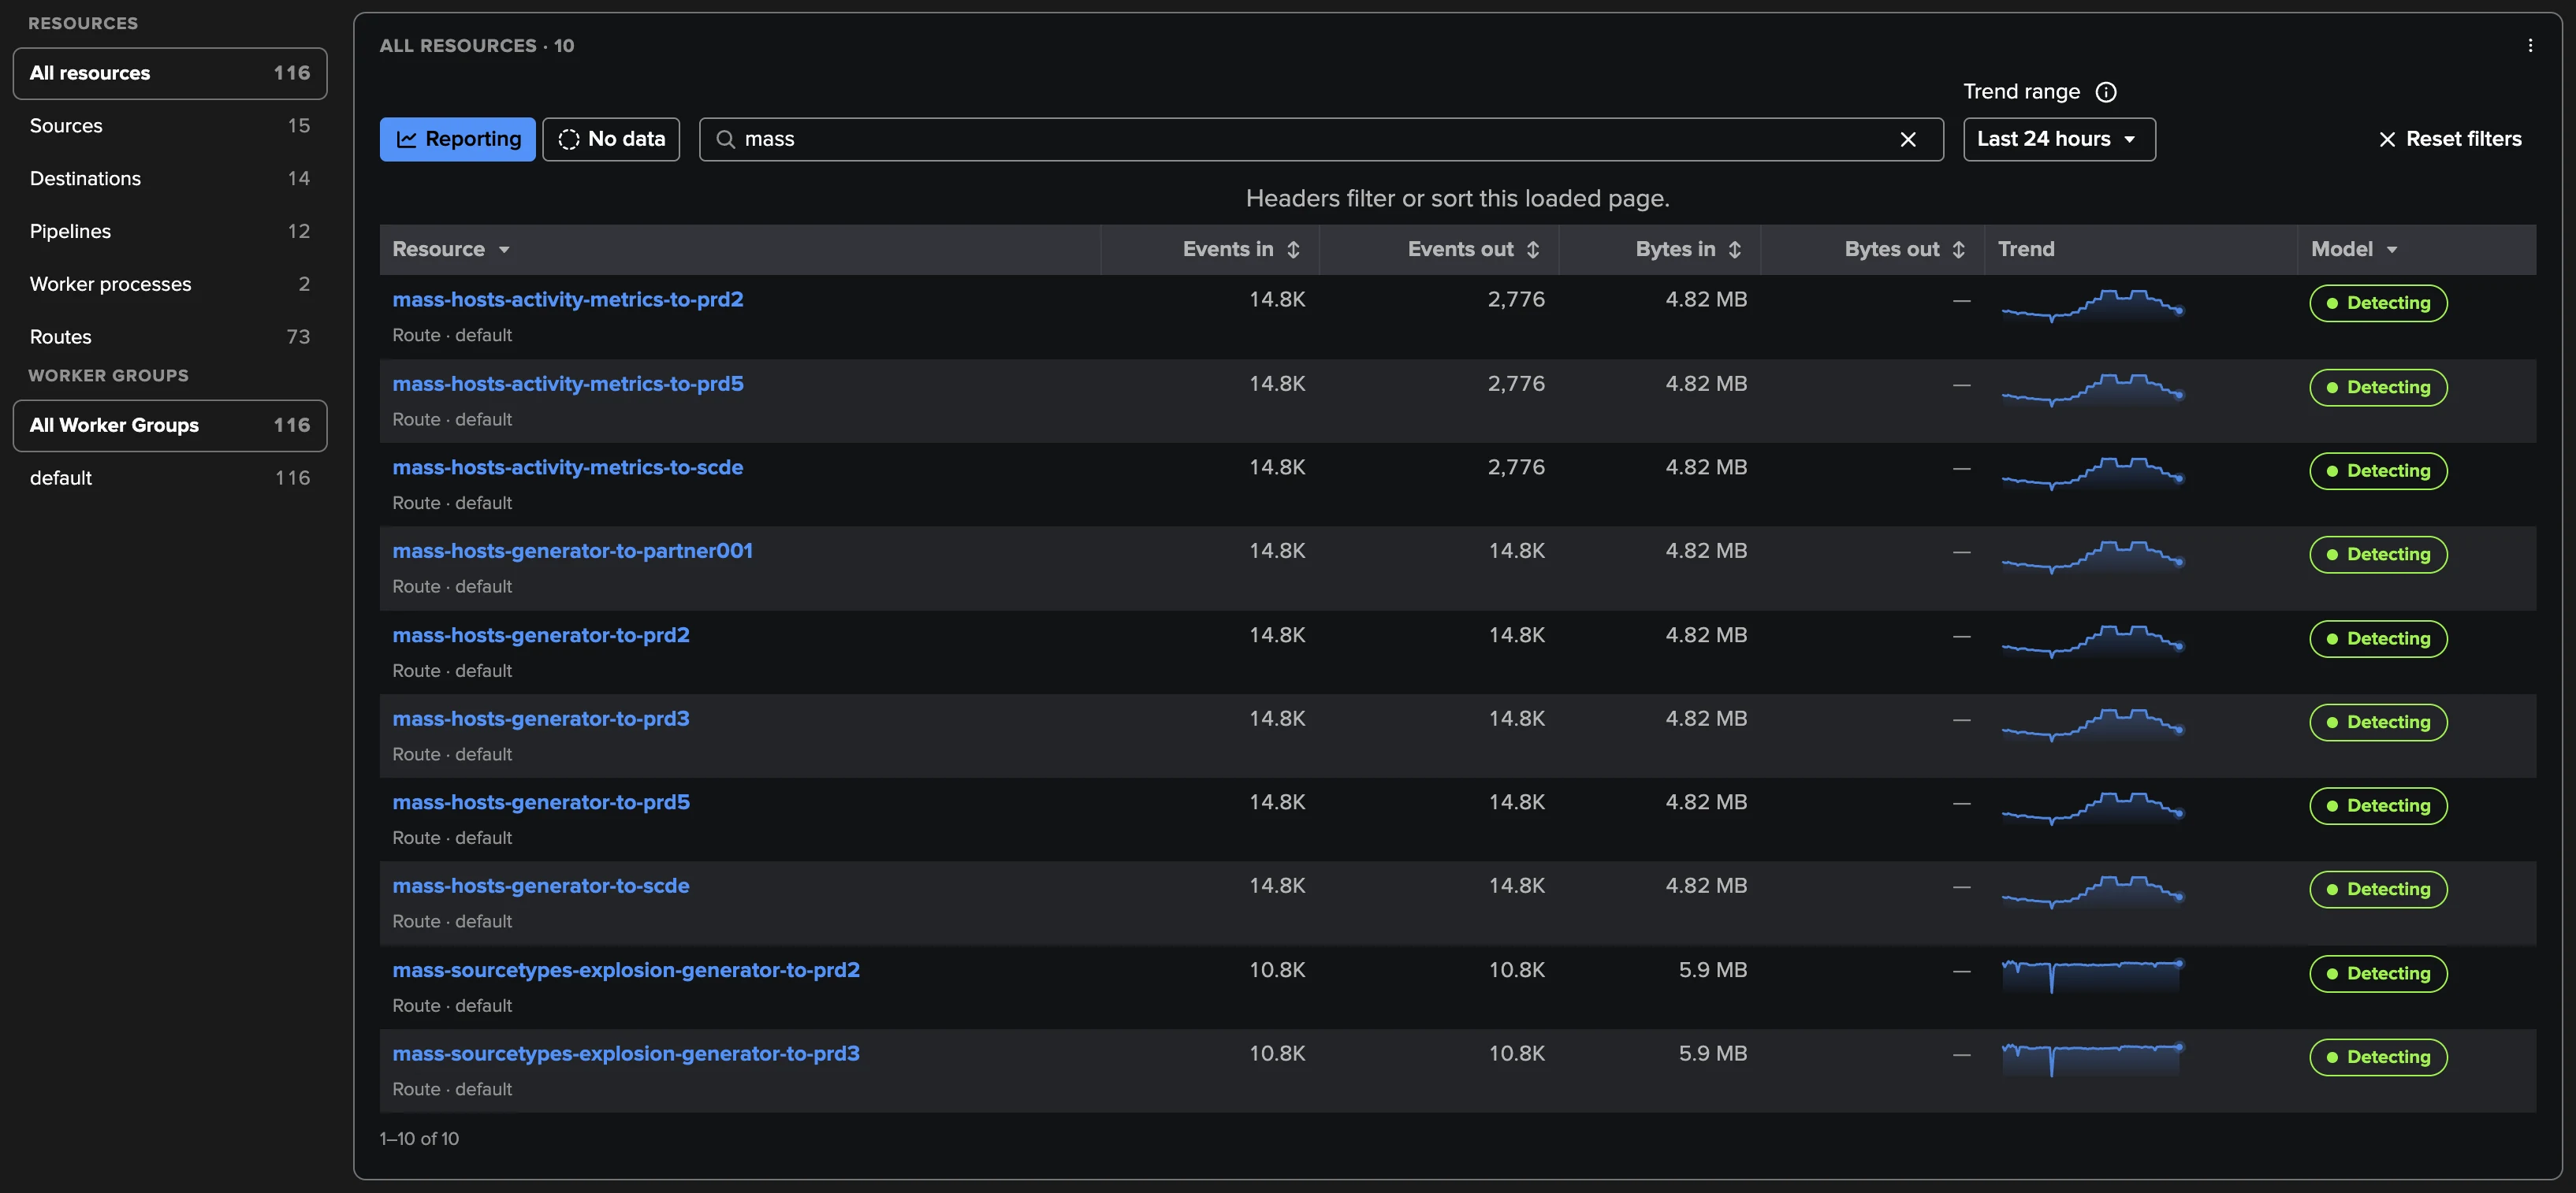
The newest five-minute interval of every object. Tiles summarise the deployment (events and bytes in and out, dropped events, Pipeline errors, process CPU and memory), Traffic over time charts the flow over the selected range, and the resource tables list each Source, Destination, Pipeline, Route and worker process with its latest values, its health, its traffic ML model and a trend. A row opens the resource details: its charts with the expected range, the measurements to show, the way into its traffic ML model and, for a Source or Destination, its live status from the Leader.
A Reporting / No data switch shows either the objects measured in the latest interval or the objects that stopped reporting (see Objects that stop reporting).
Traffic ML models
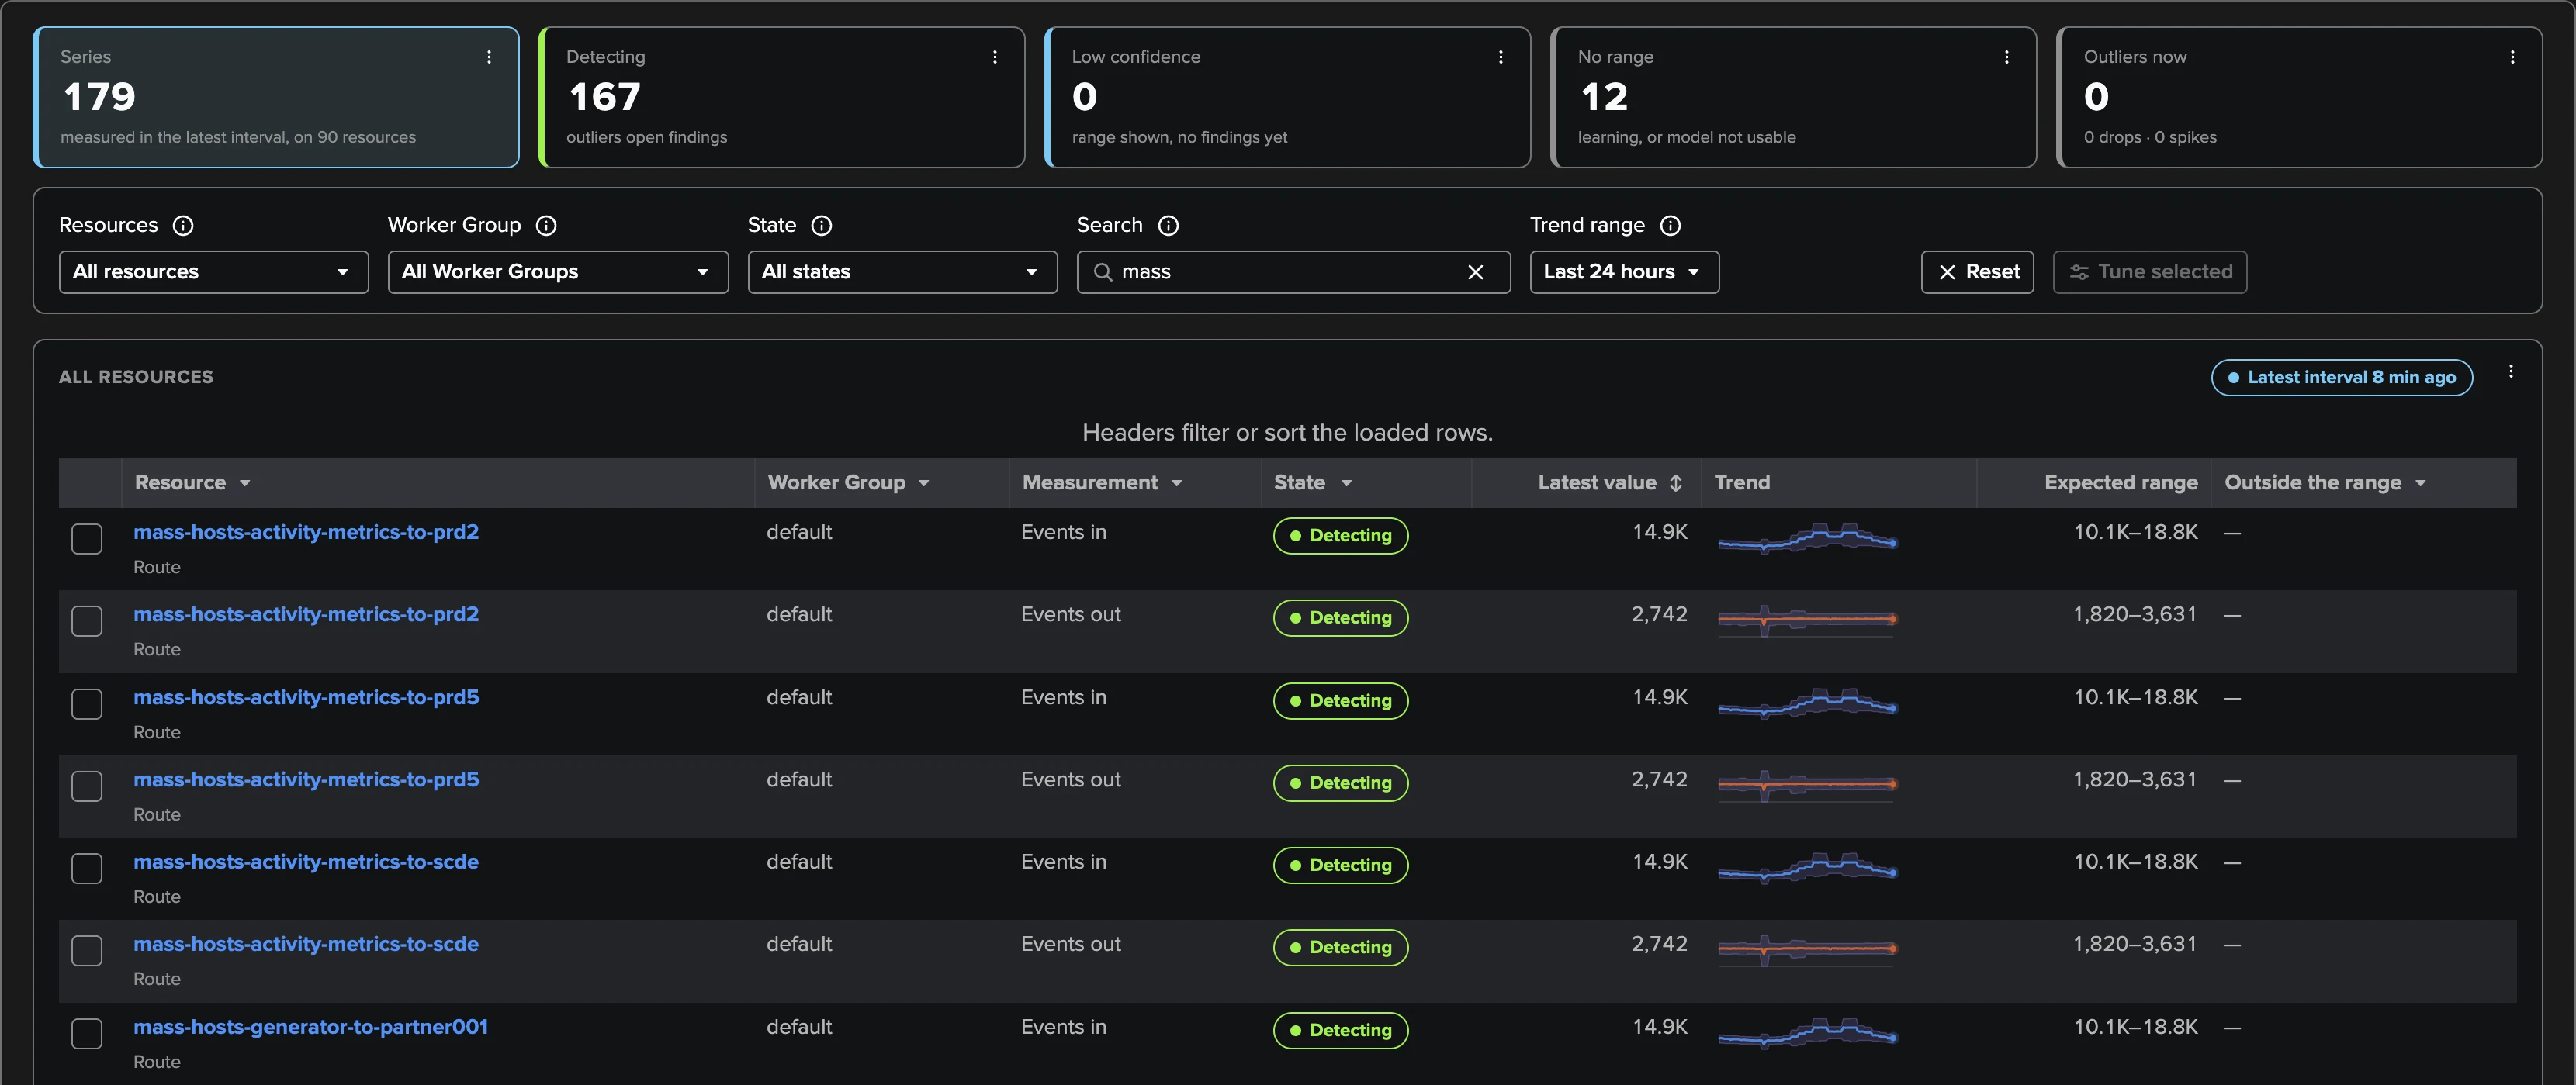
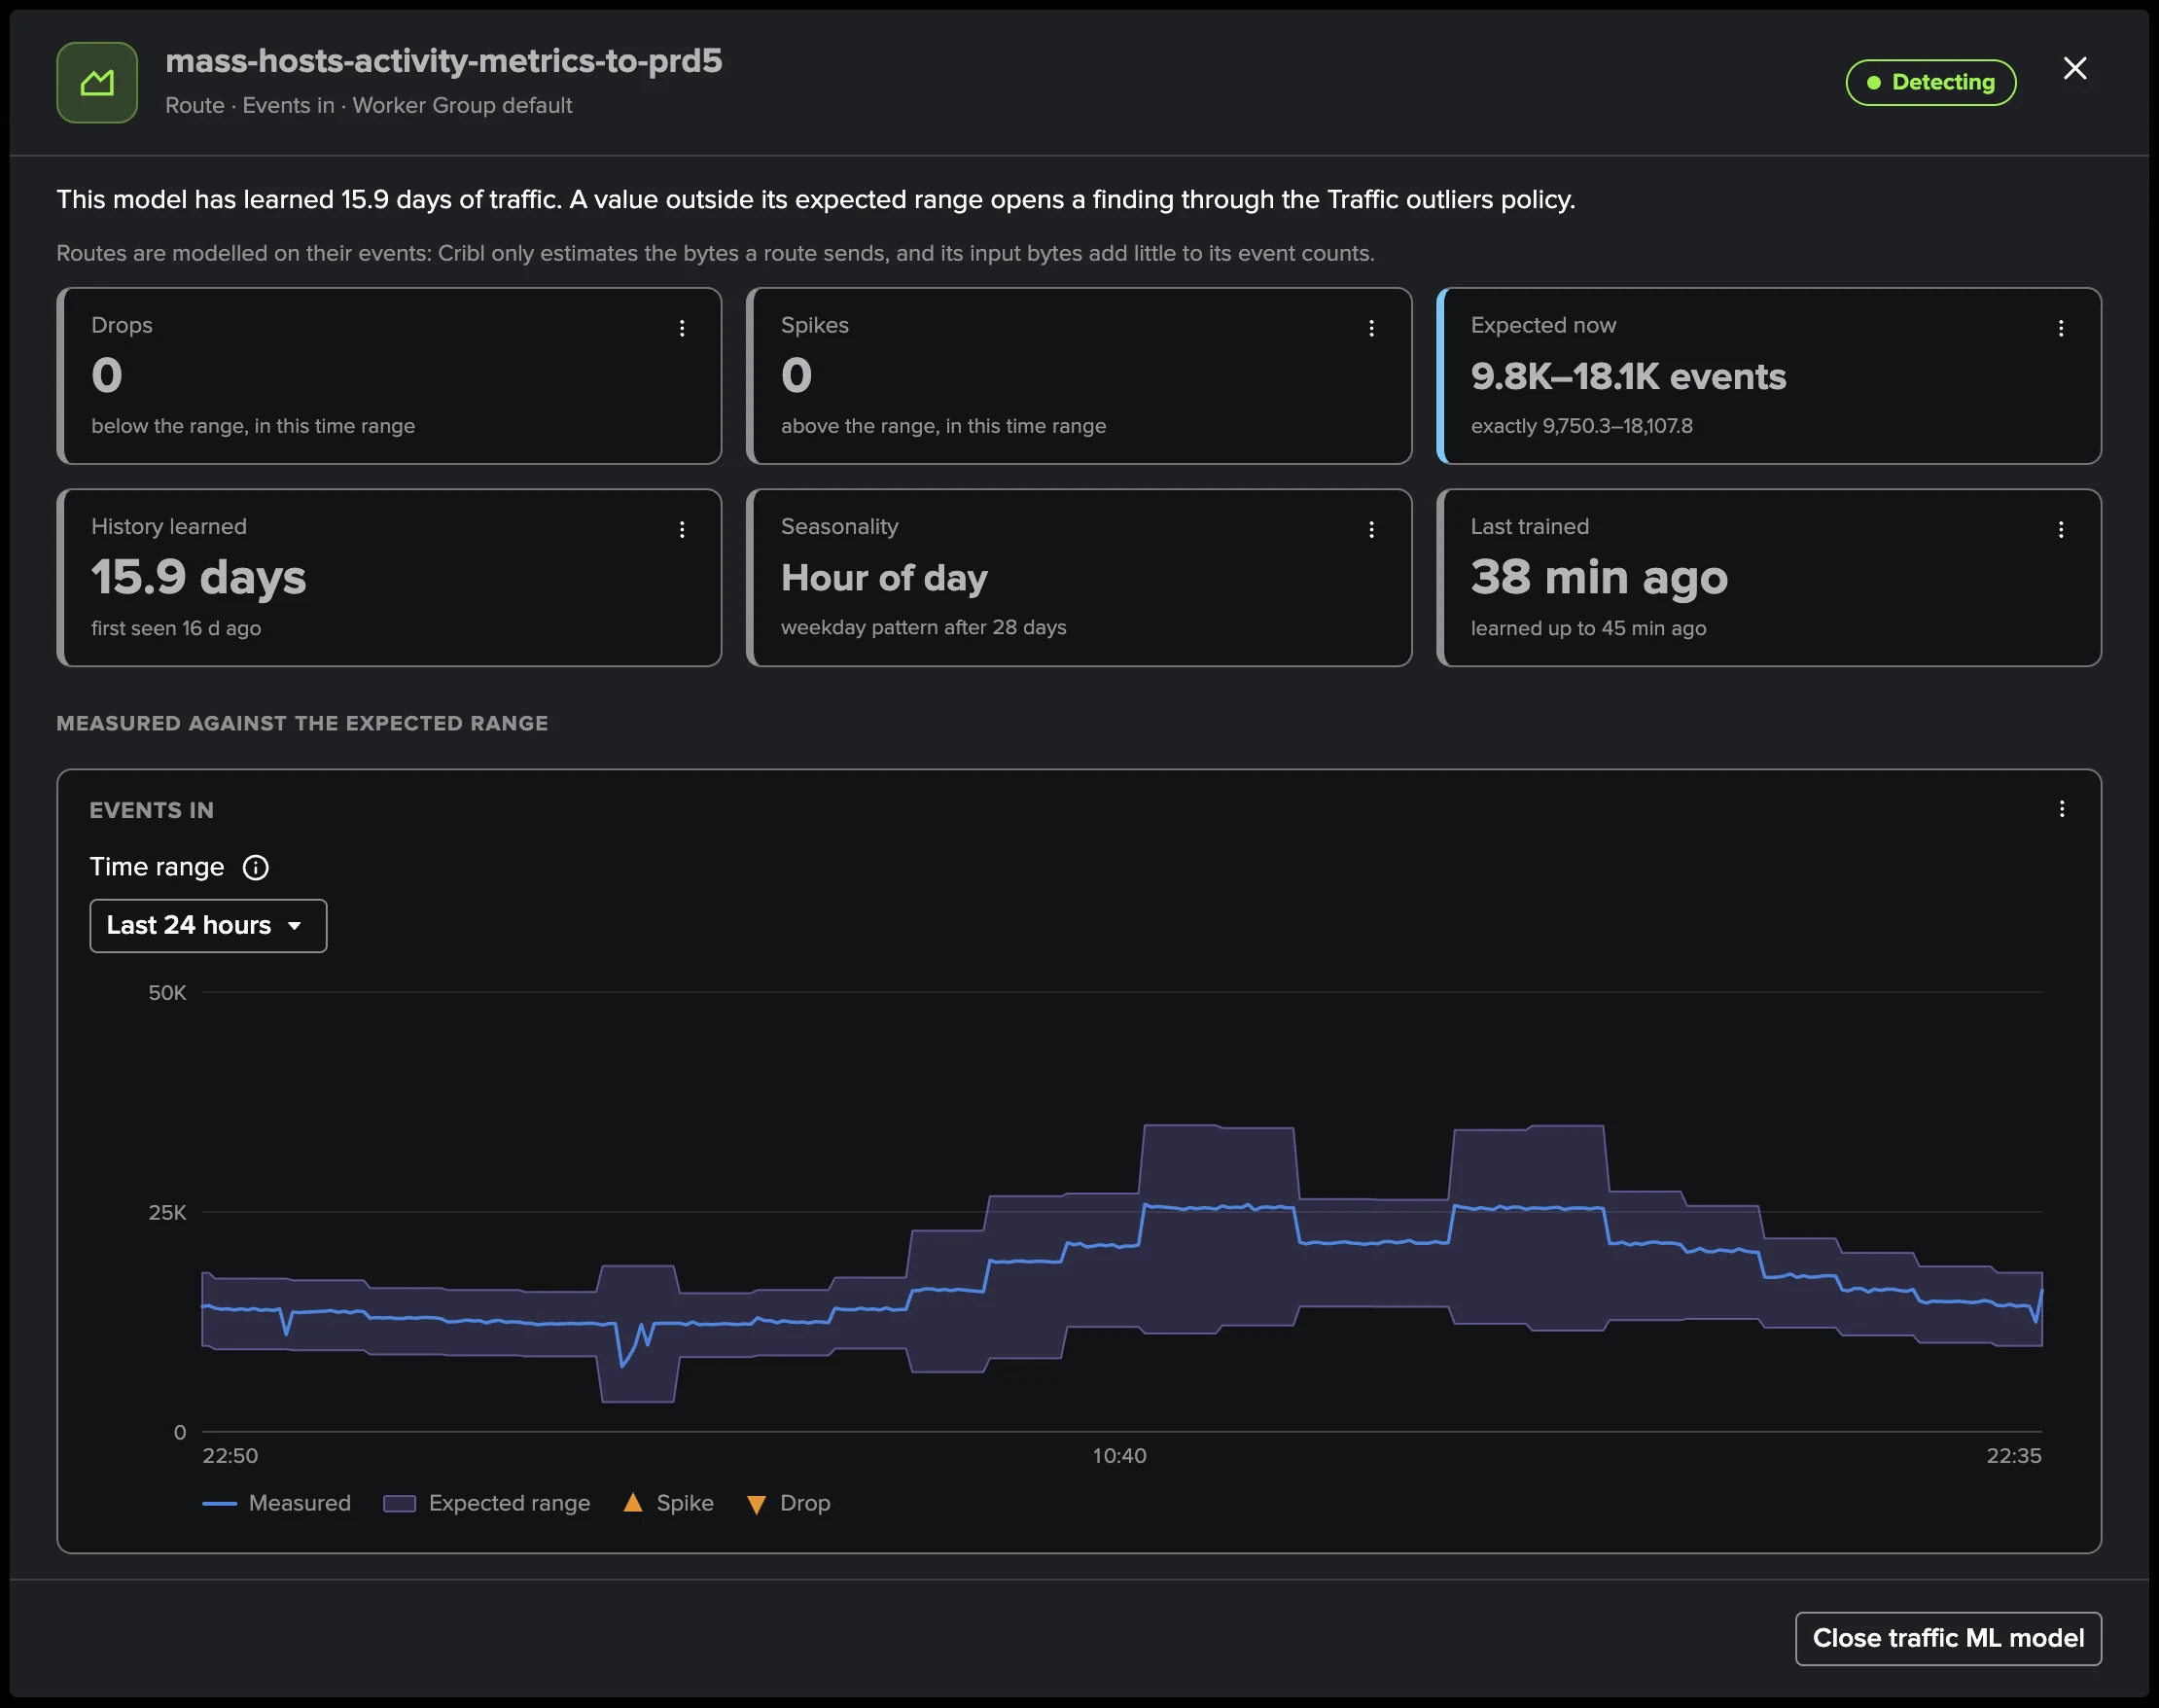
One row per model — an object and one of its traffic measurements — the models outside their expected range first. Each row shows the model’s state, the latest value, a trend with the expected range as a band and Drop or Spike when the value is outside it. A row opens the model: what it learned, its drops and spikes, its expected range, the history learned and its seasonality, with Tune model and Relearn for a TrackMe administrator of the tenant. See Traffic ML models and Expected traffic.
Infrastructure
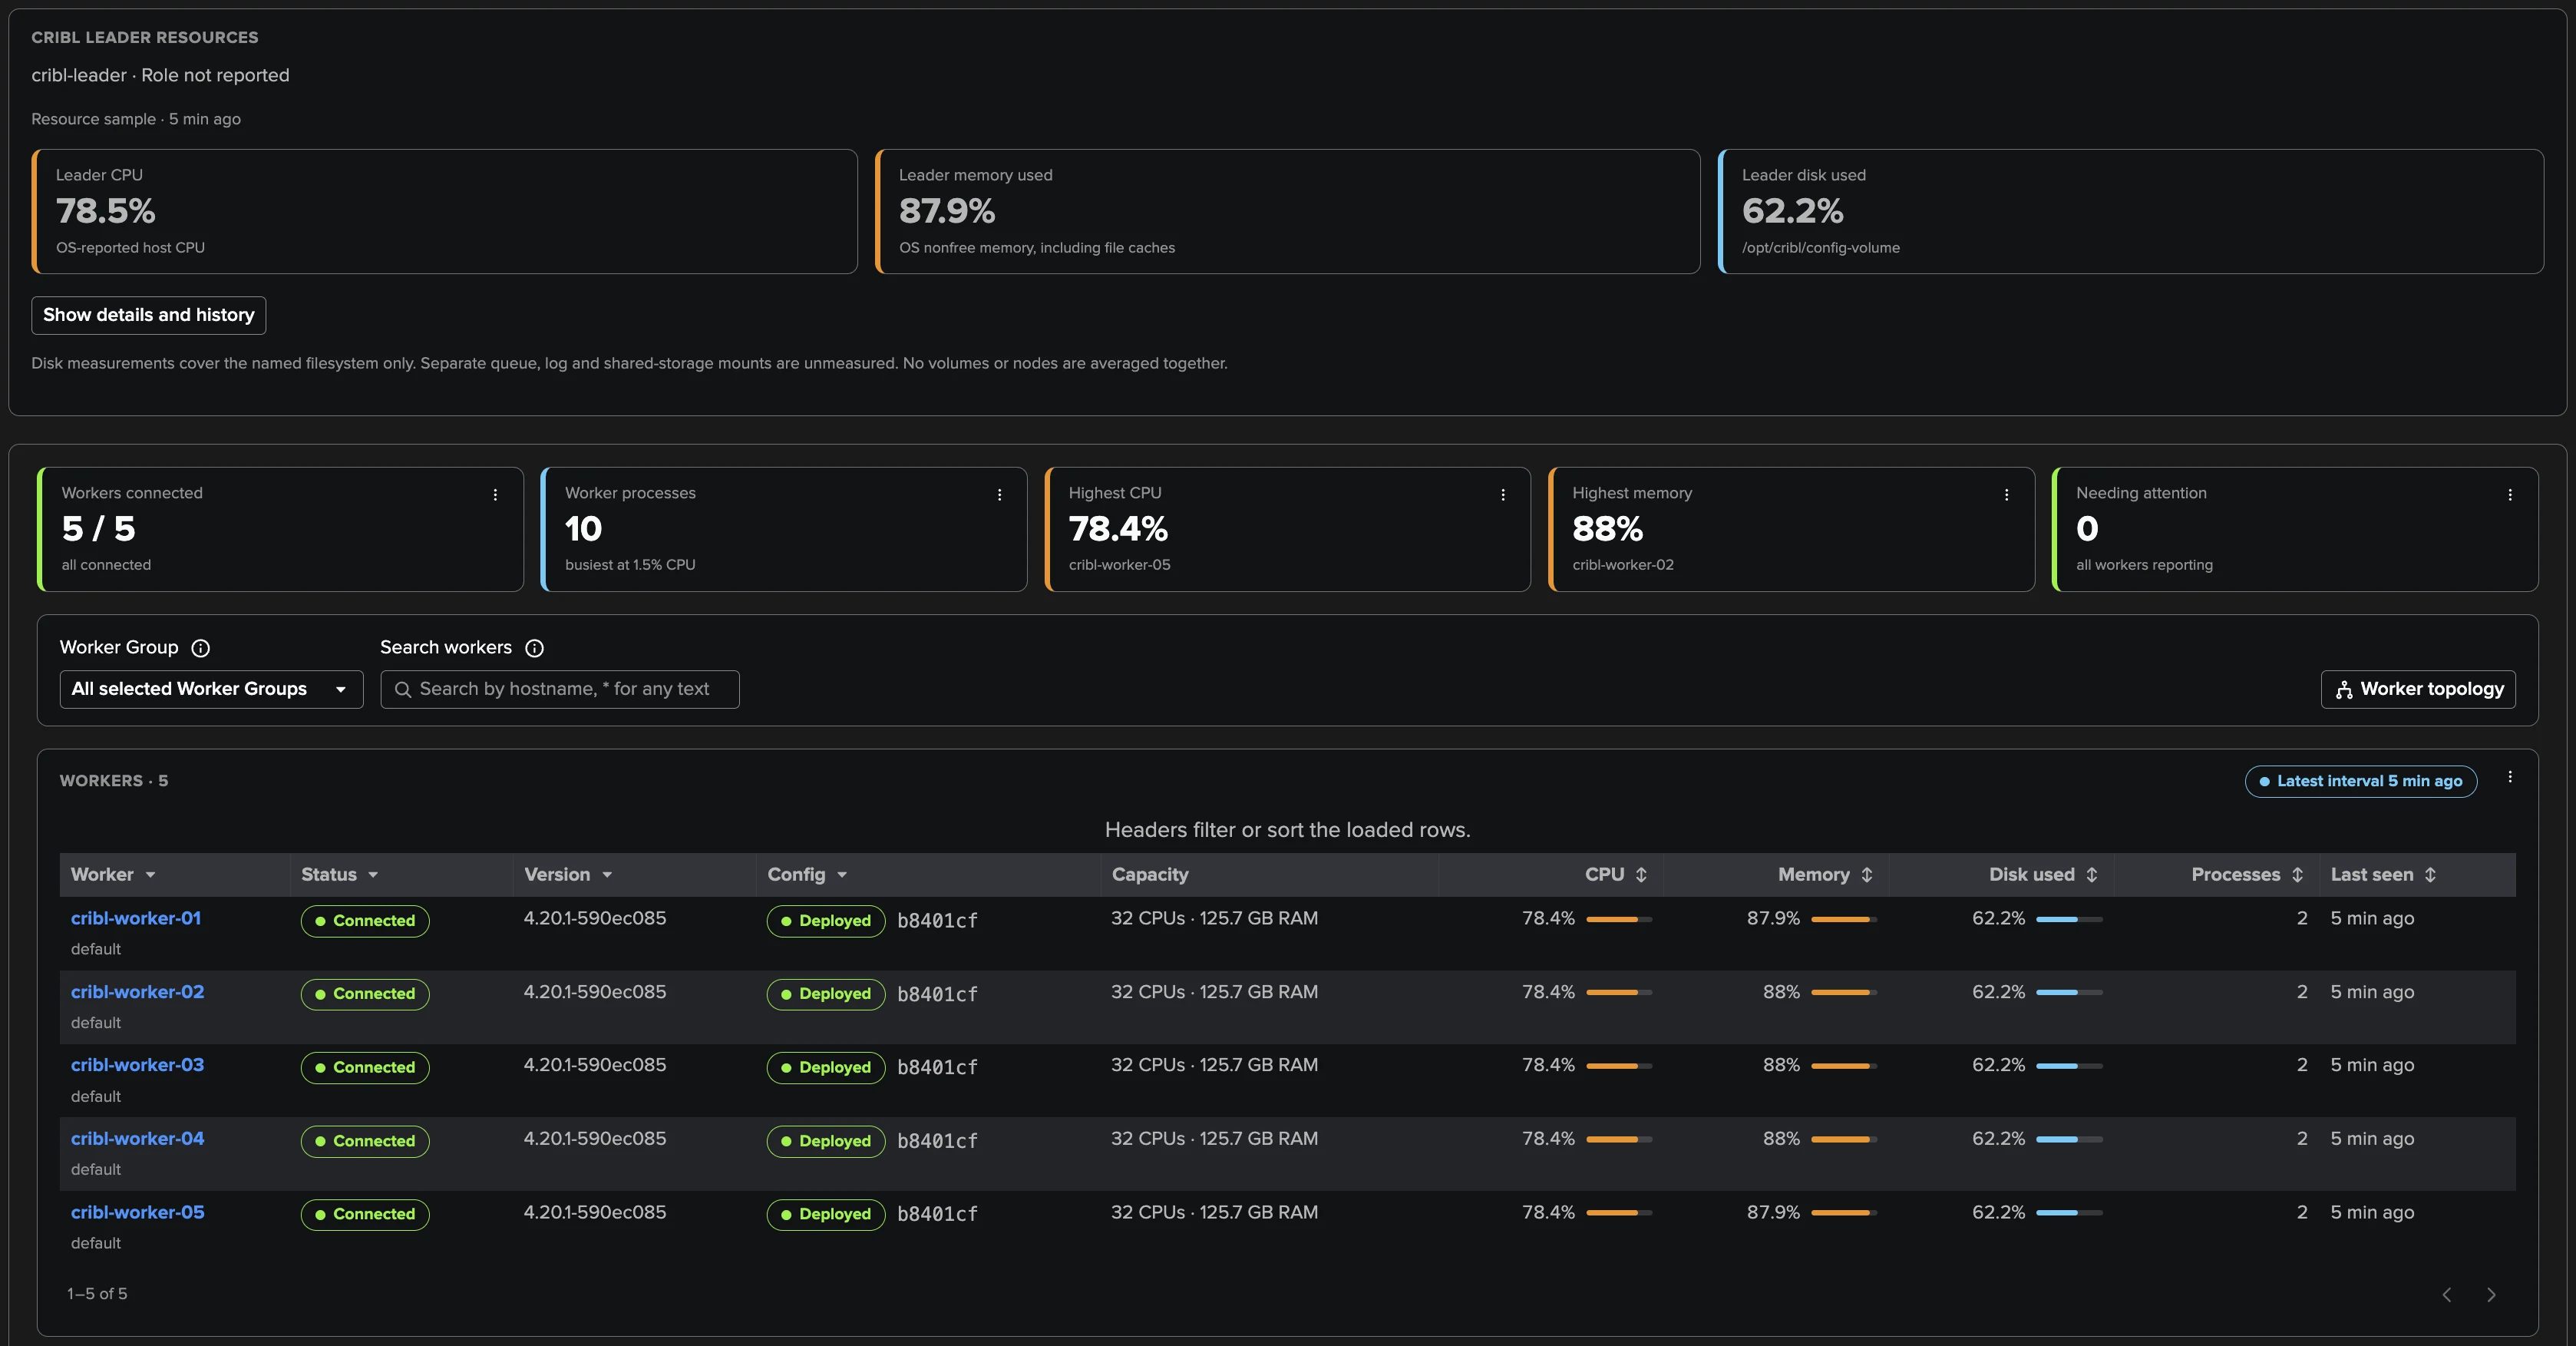
The machines behind Cribl Stream:
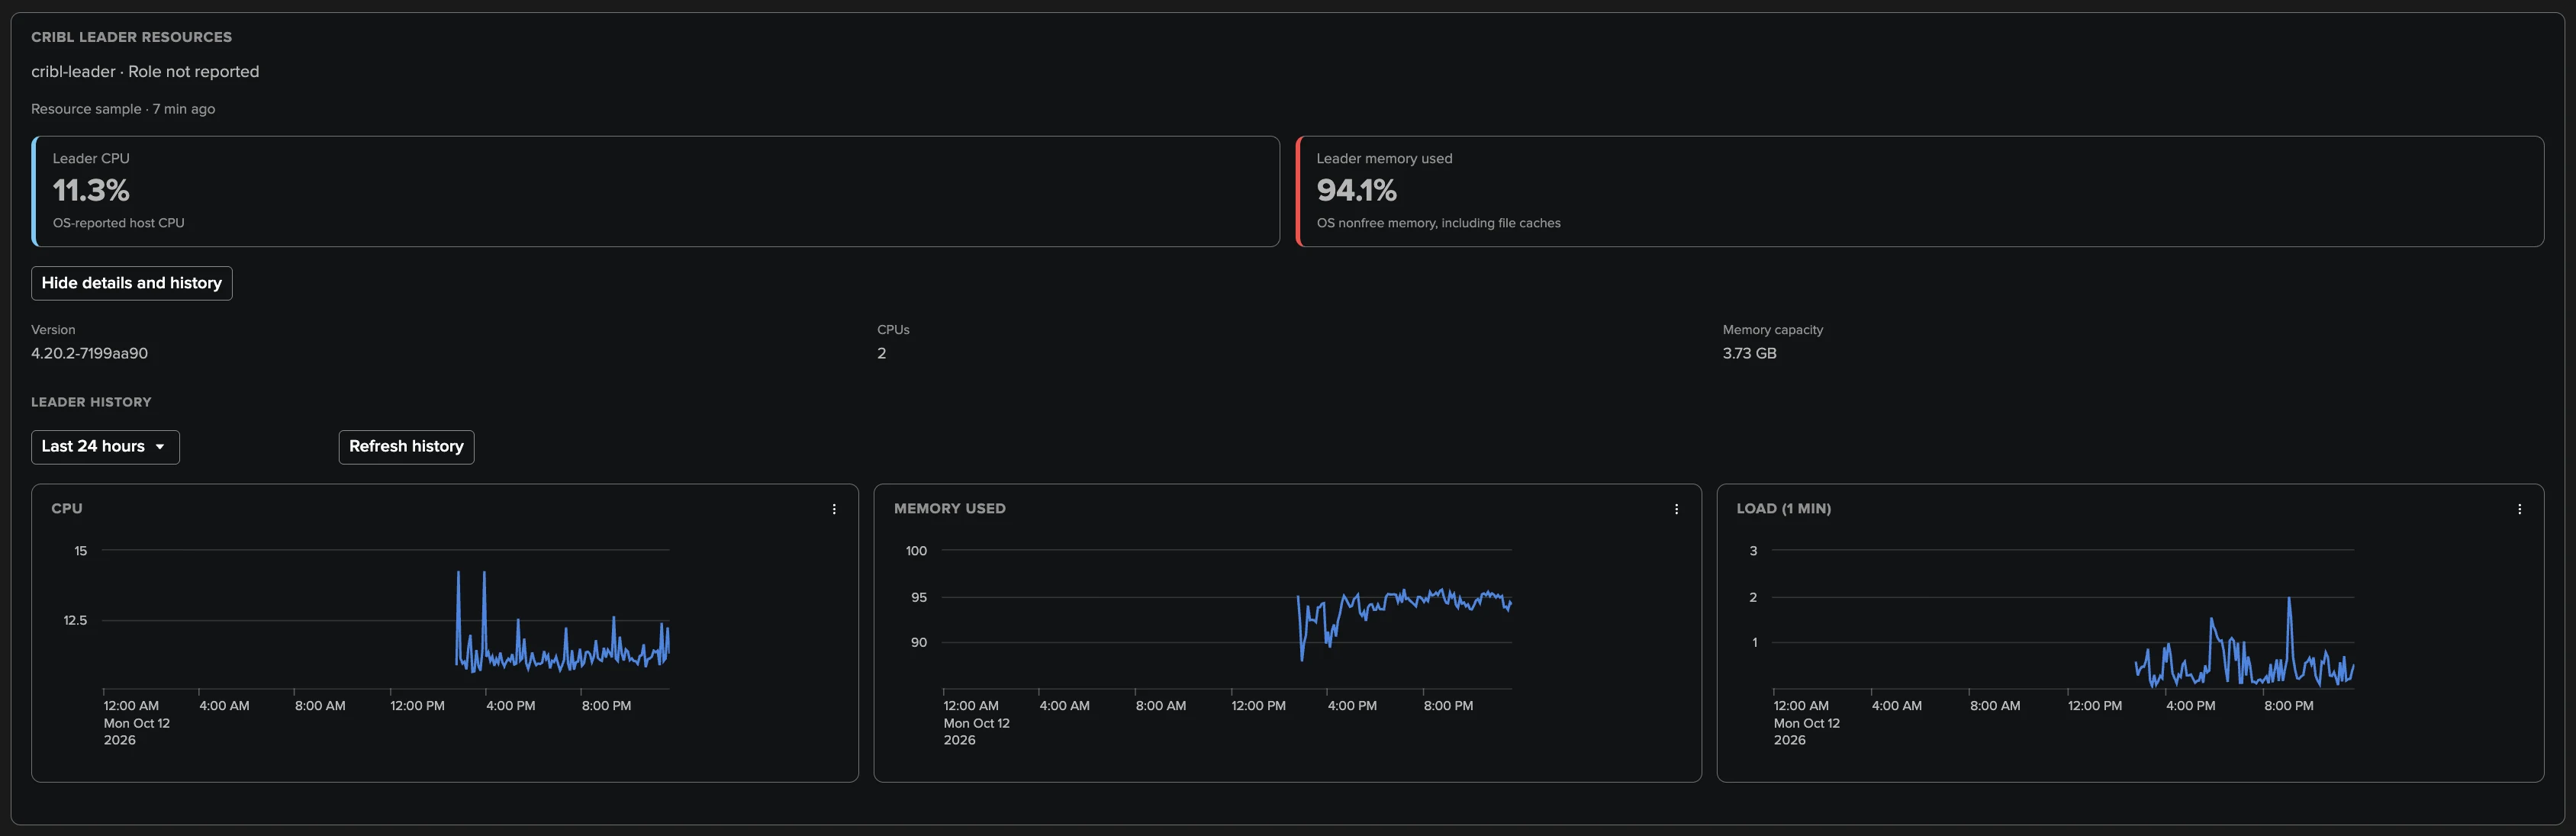
Cribl Leader resources — each Leader node with its role, version, CPU, memory, load and the disk of its named filesystem, with their history;
Workers — every Worker the Leader lists: connected or not, last heartbeat, CPU, memory, load and disk, with a trend and the machine’s capacity; a Worker opens its machine charts and its processes;
Worker processes — CPU and resident memory per worker process, and the memory used by all worker processes.
The Worker topology and Process topology buttons draw these machines as a live map (see Worker topology).
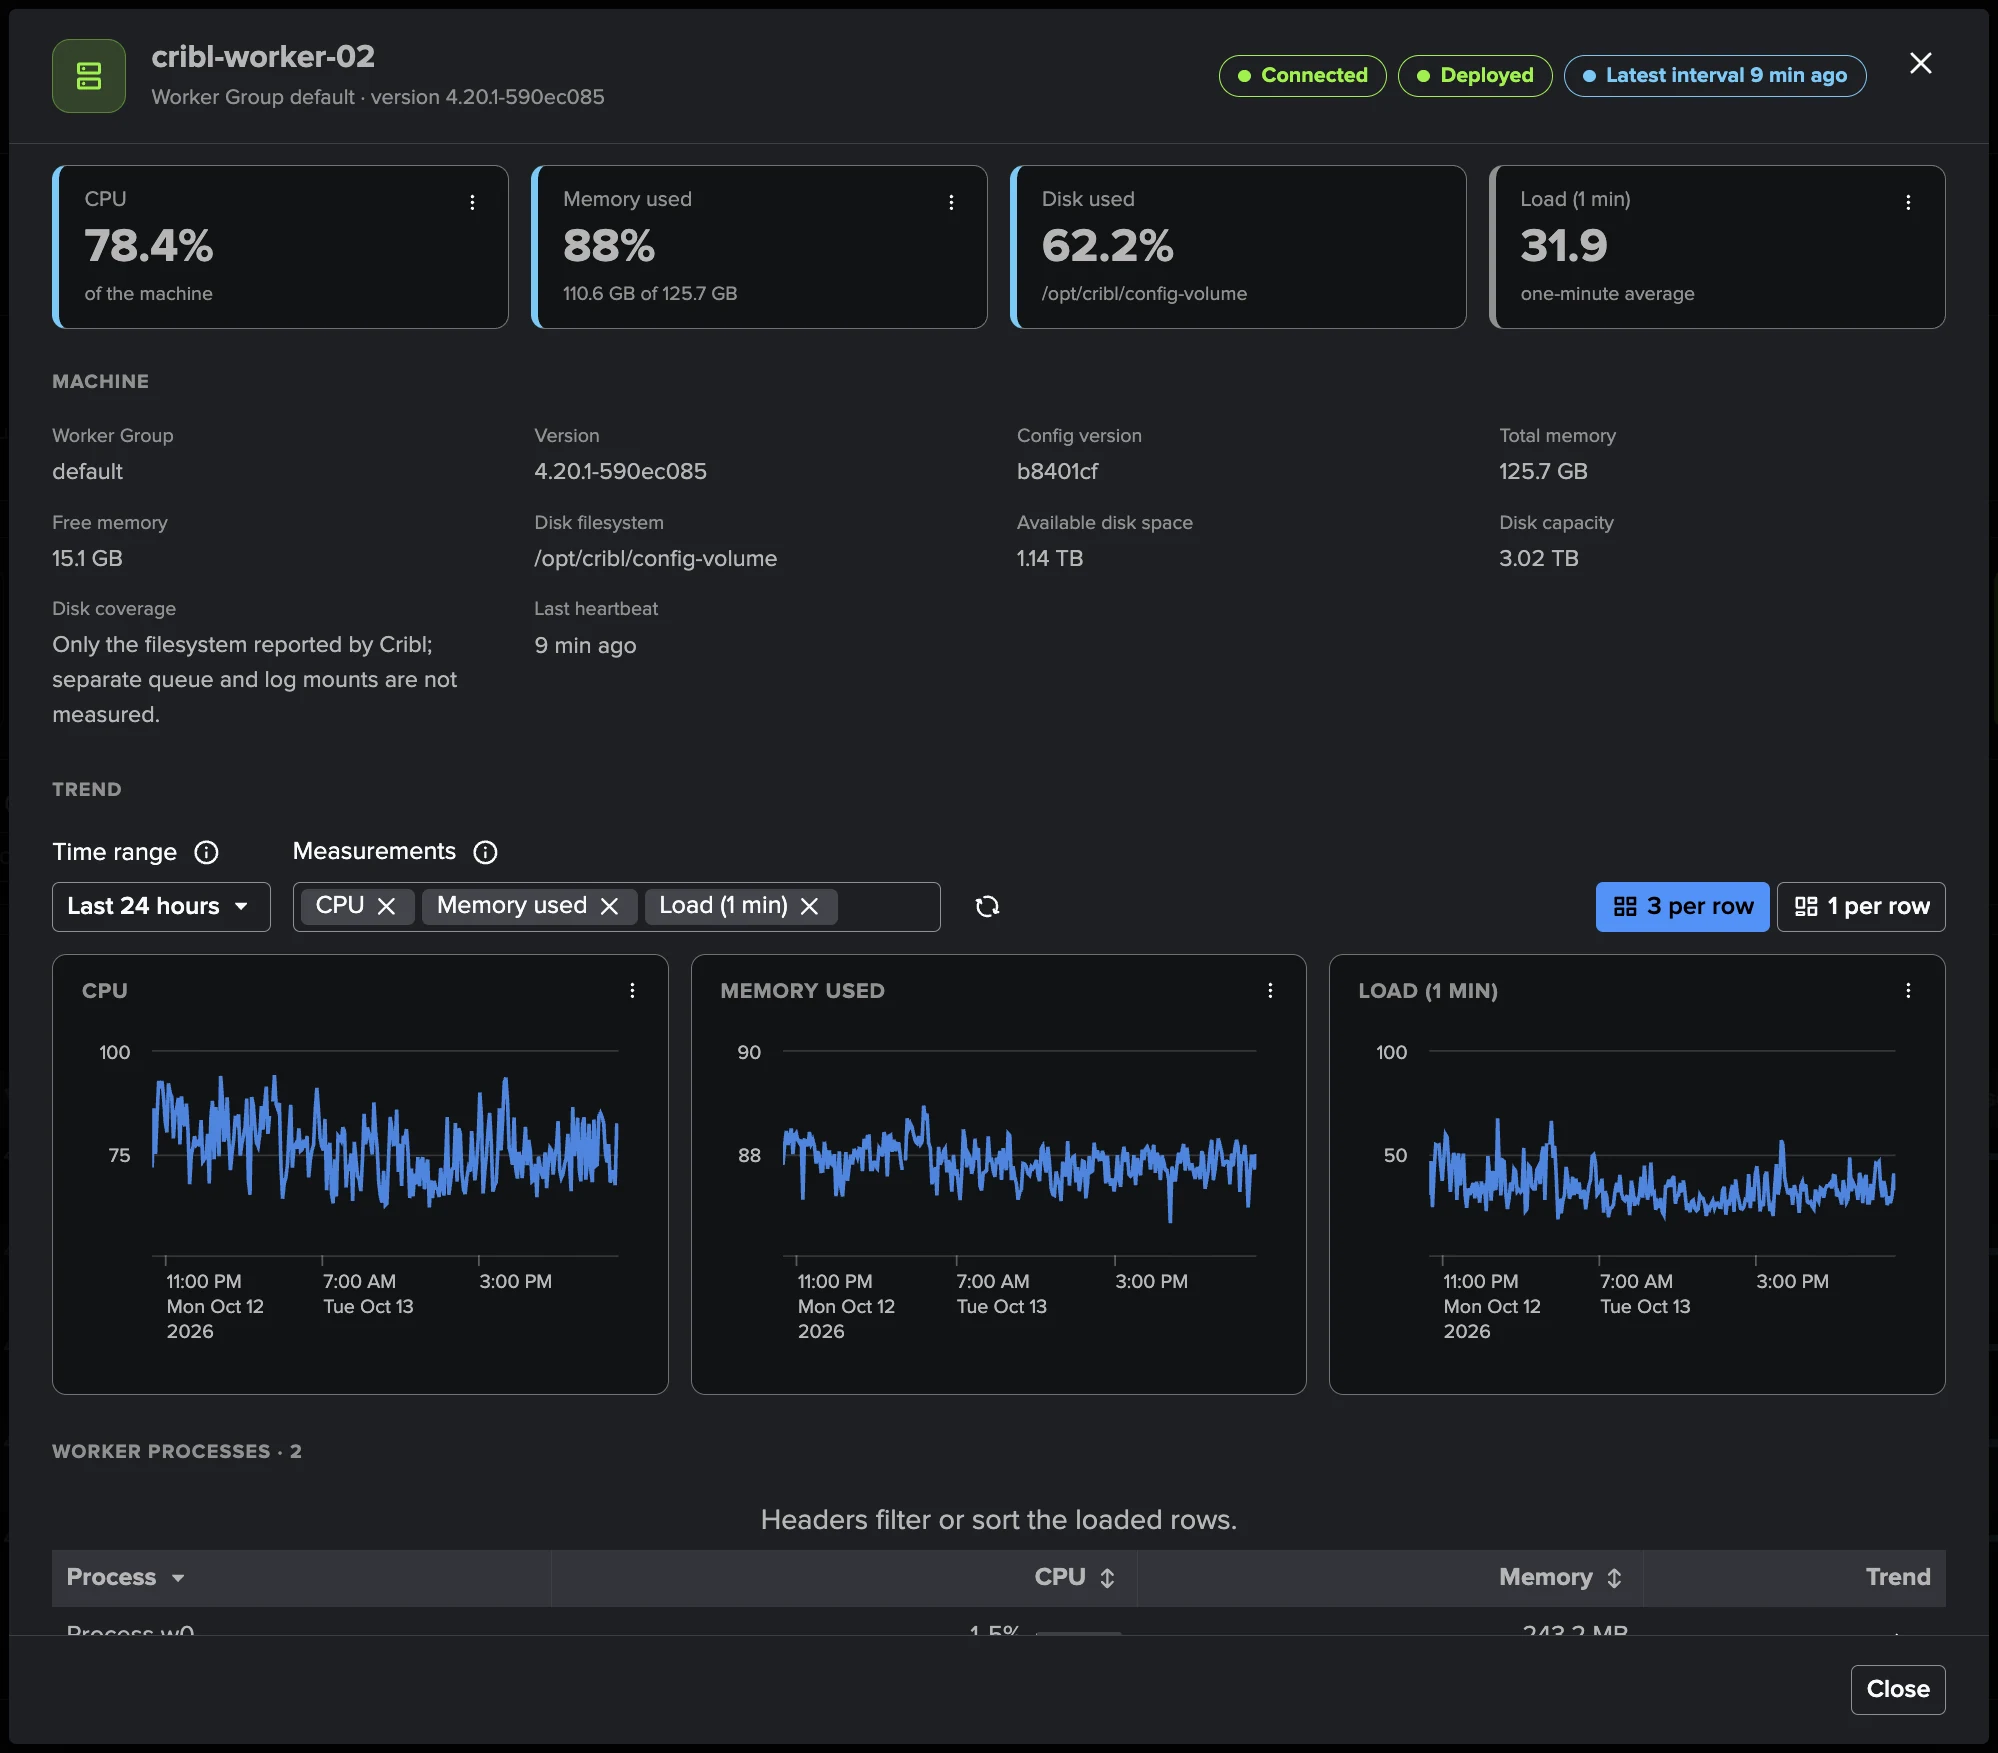
A Worker opens its own view: its CPU, memory, disk and load, the machine (Worker Group, version, configuration version, memory and disk capacity, last heartbeat) and its trend over the selected range, with the measurements to chart and one or three charts per row, then its worker processes.
Deployment
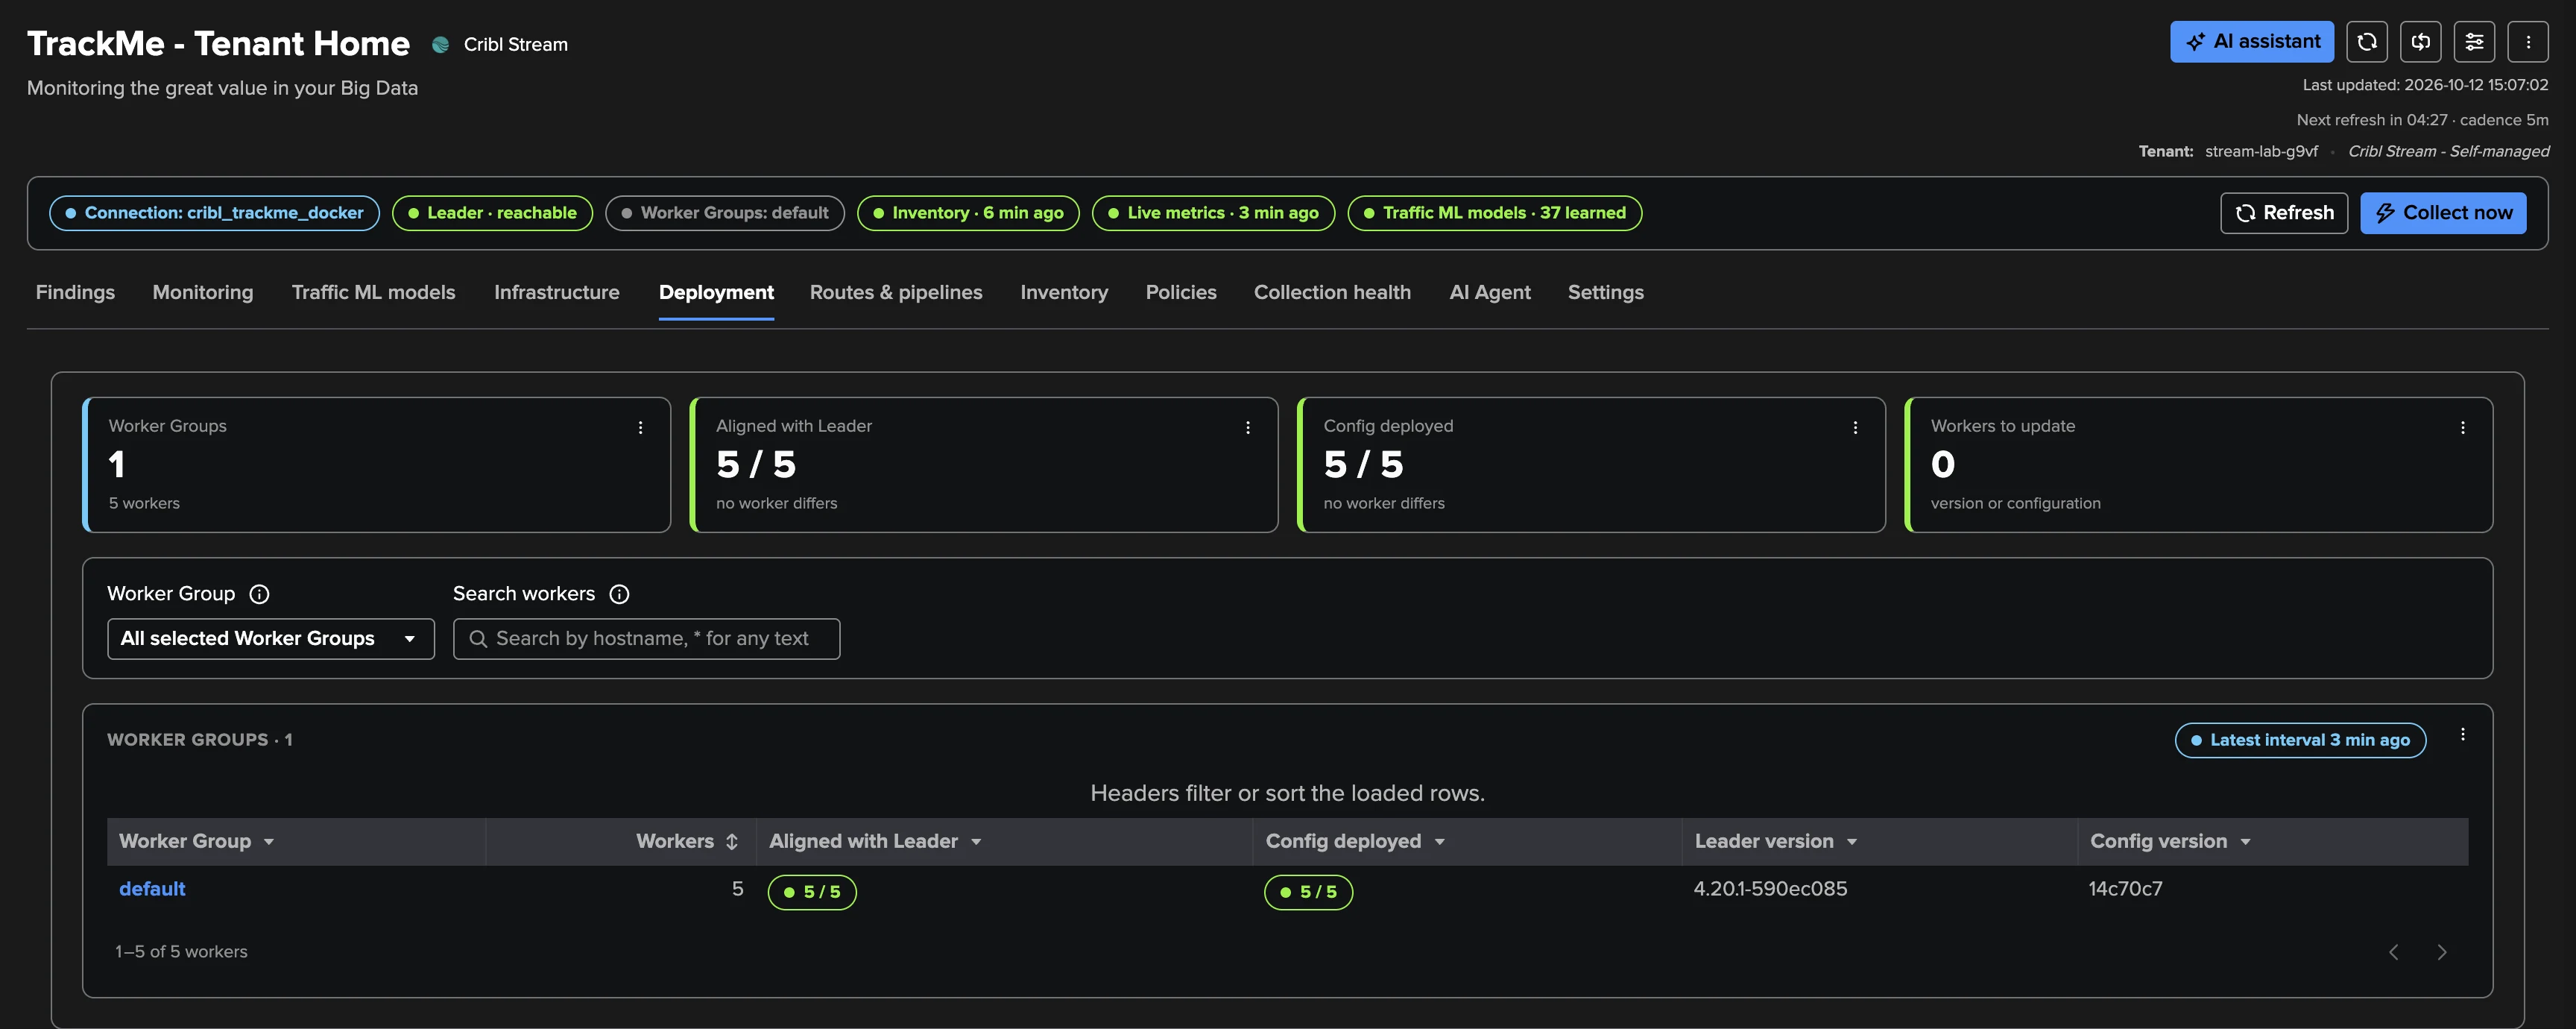
Per Worker Group, how far your Workers are from where they should be: the Cribl version of each Worker against the version of the running Leader, and the configuration each Worker runs against its Worker Group’s configuration, with the Workers to update.
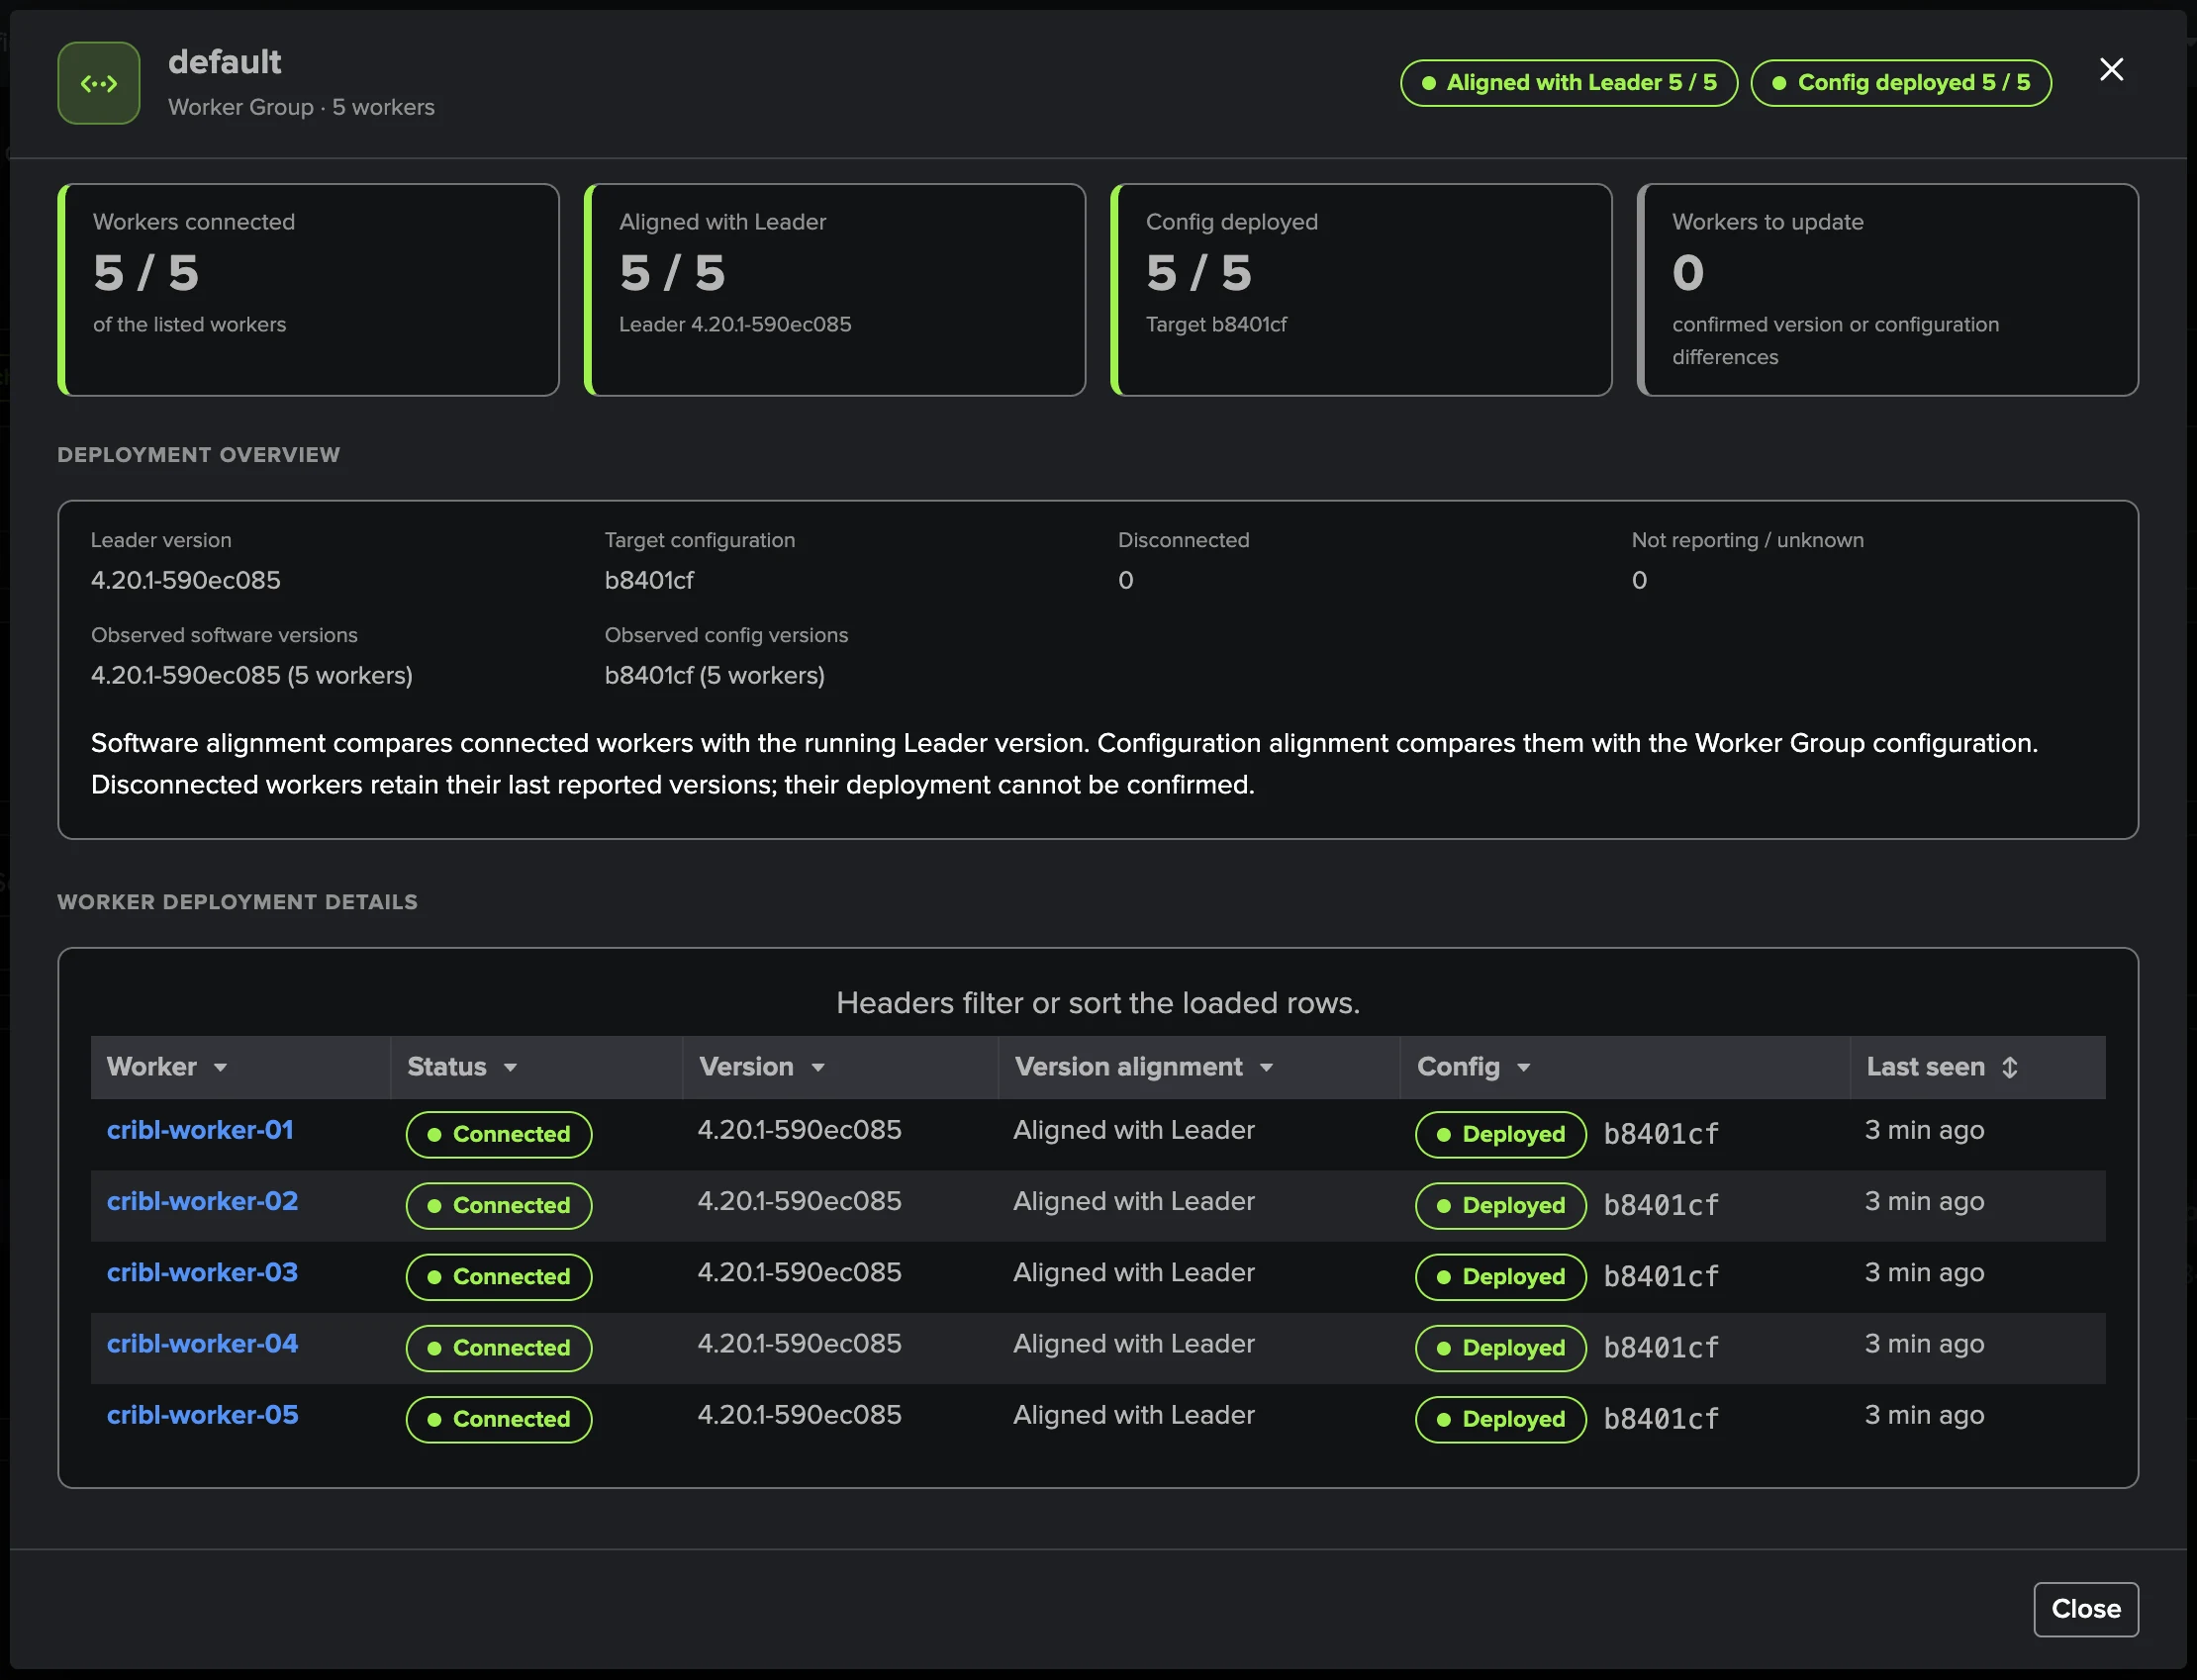
A Worker Group opens its deployment view: the Workers connected, aligned with the Leader’s version and running the deployed configuration, the Workers to update, the versions and configurations observed, and each Worker’s version alignment and configuration.
Routes & pipelines
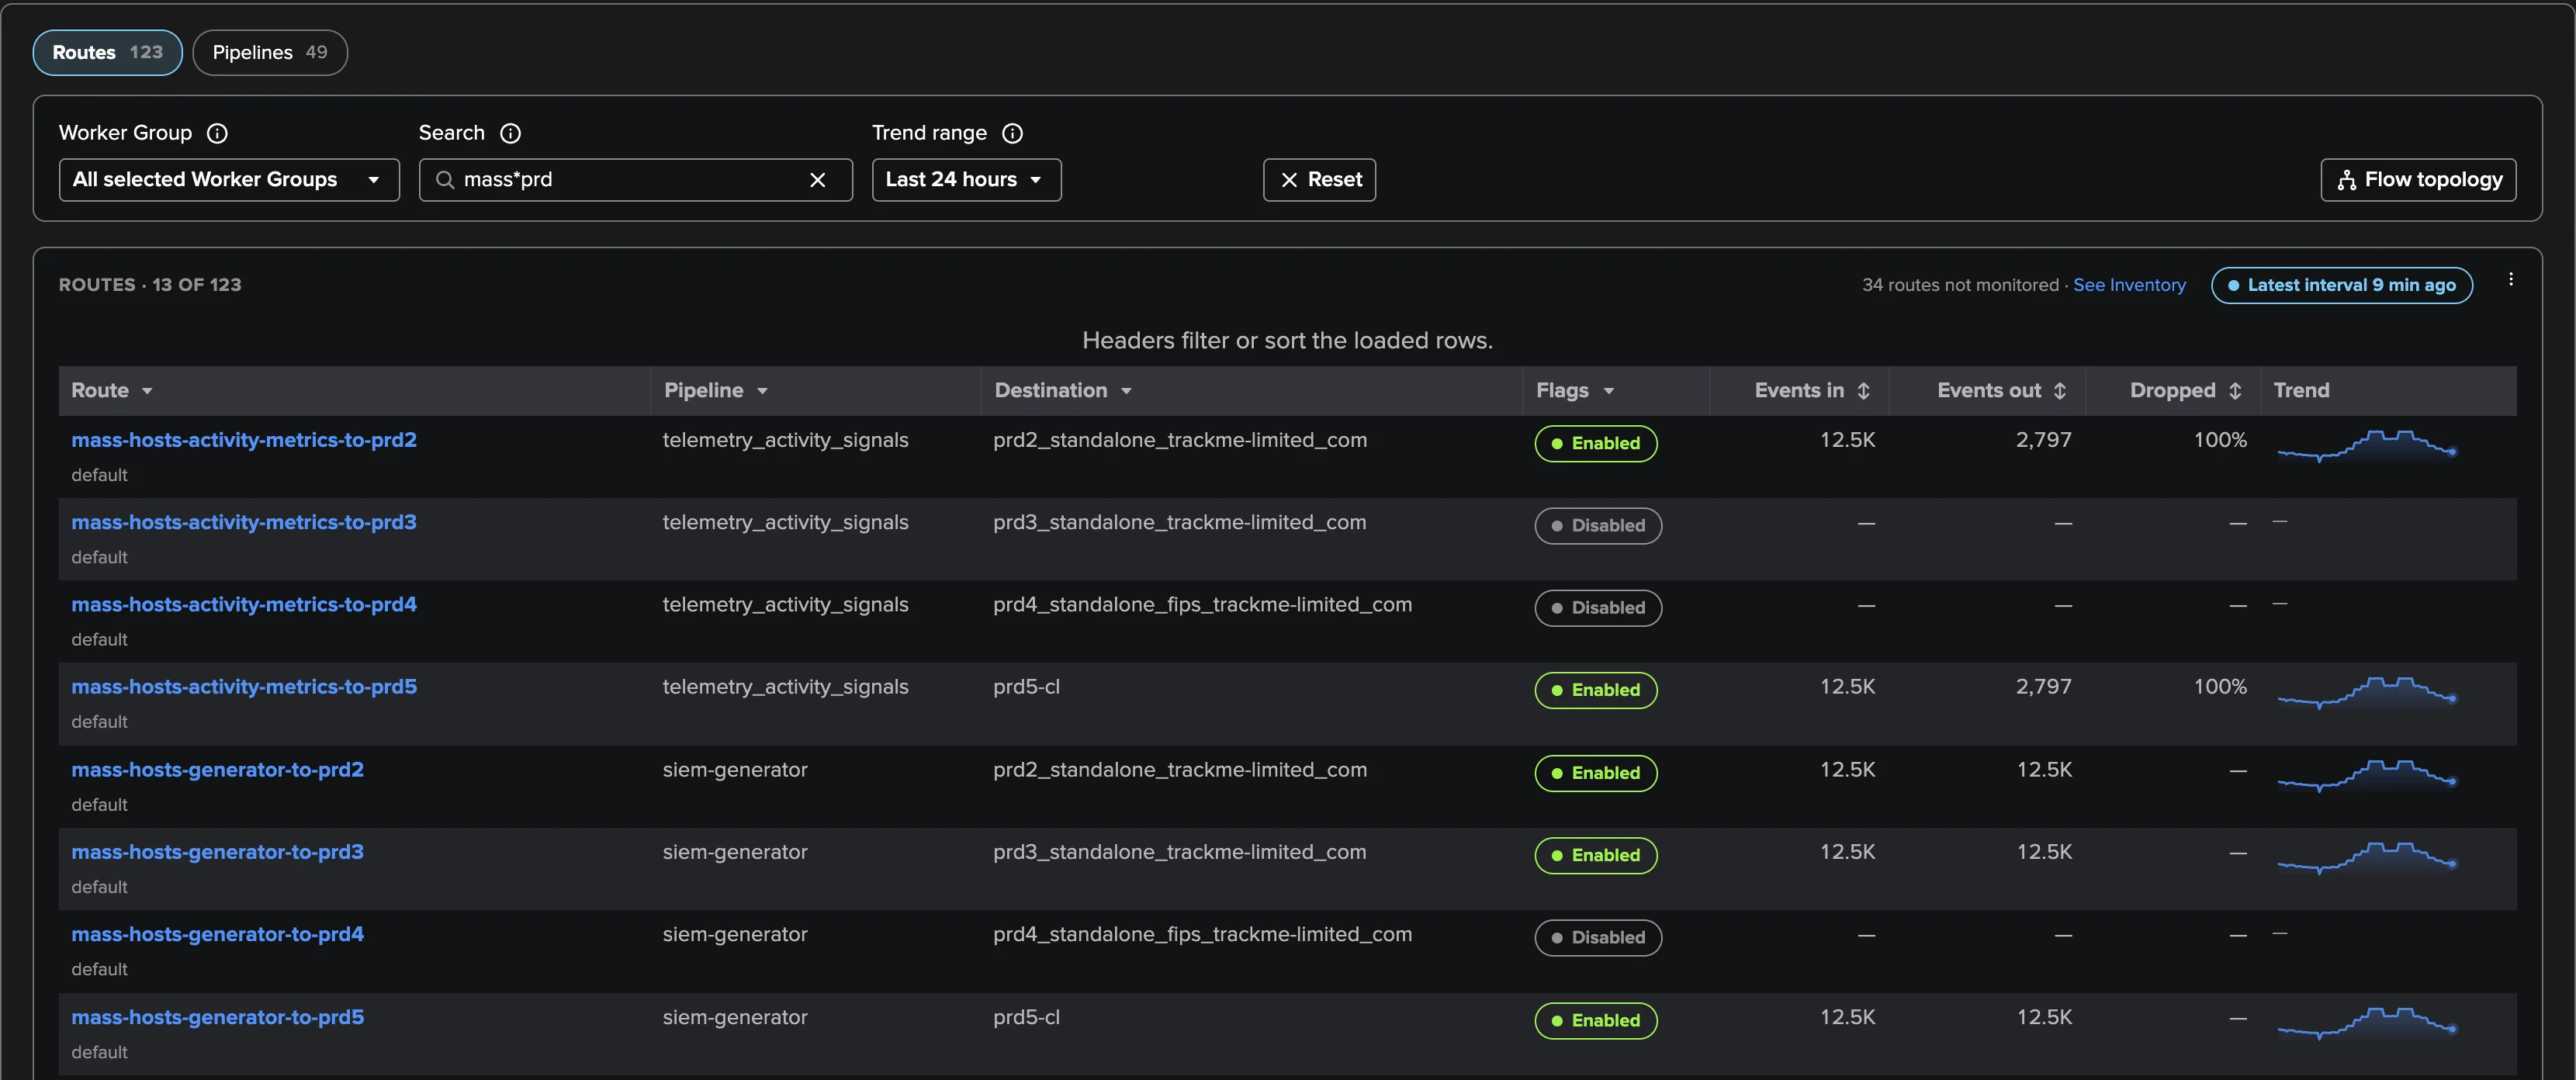
How data flows. The Routes table lists each Route with its Pipeline and Destination,
whether it is final, and its measured events in and out, dropped events and trend; the
Pipelines table lists each Pipeline with its functions, its traffic, errors and drops.
Filter by Worker Group or search by name (* stands for any text). A Route or Pipeline
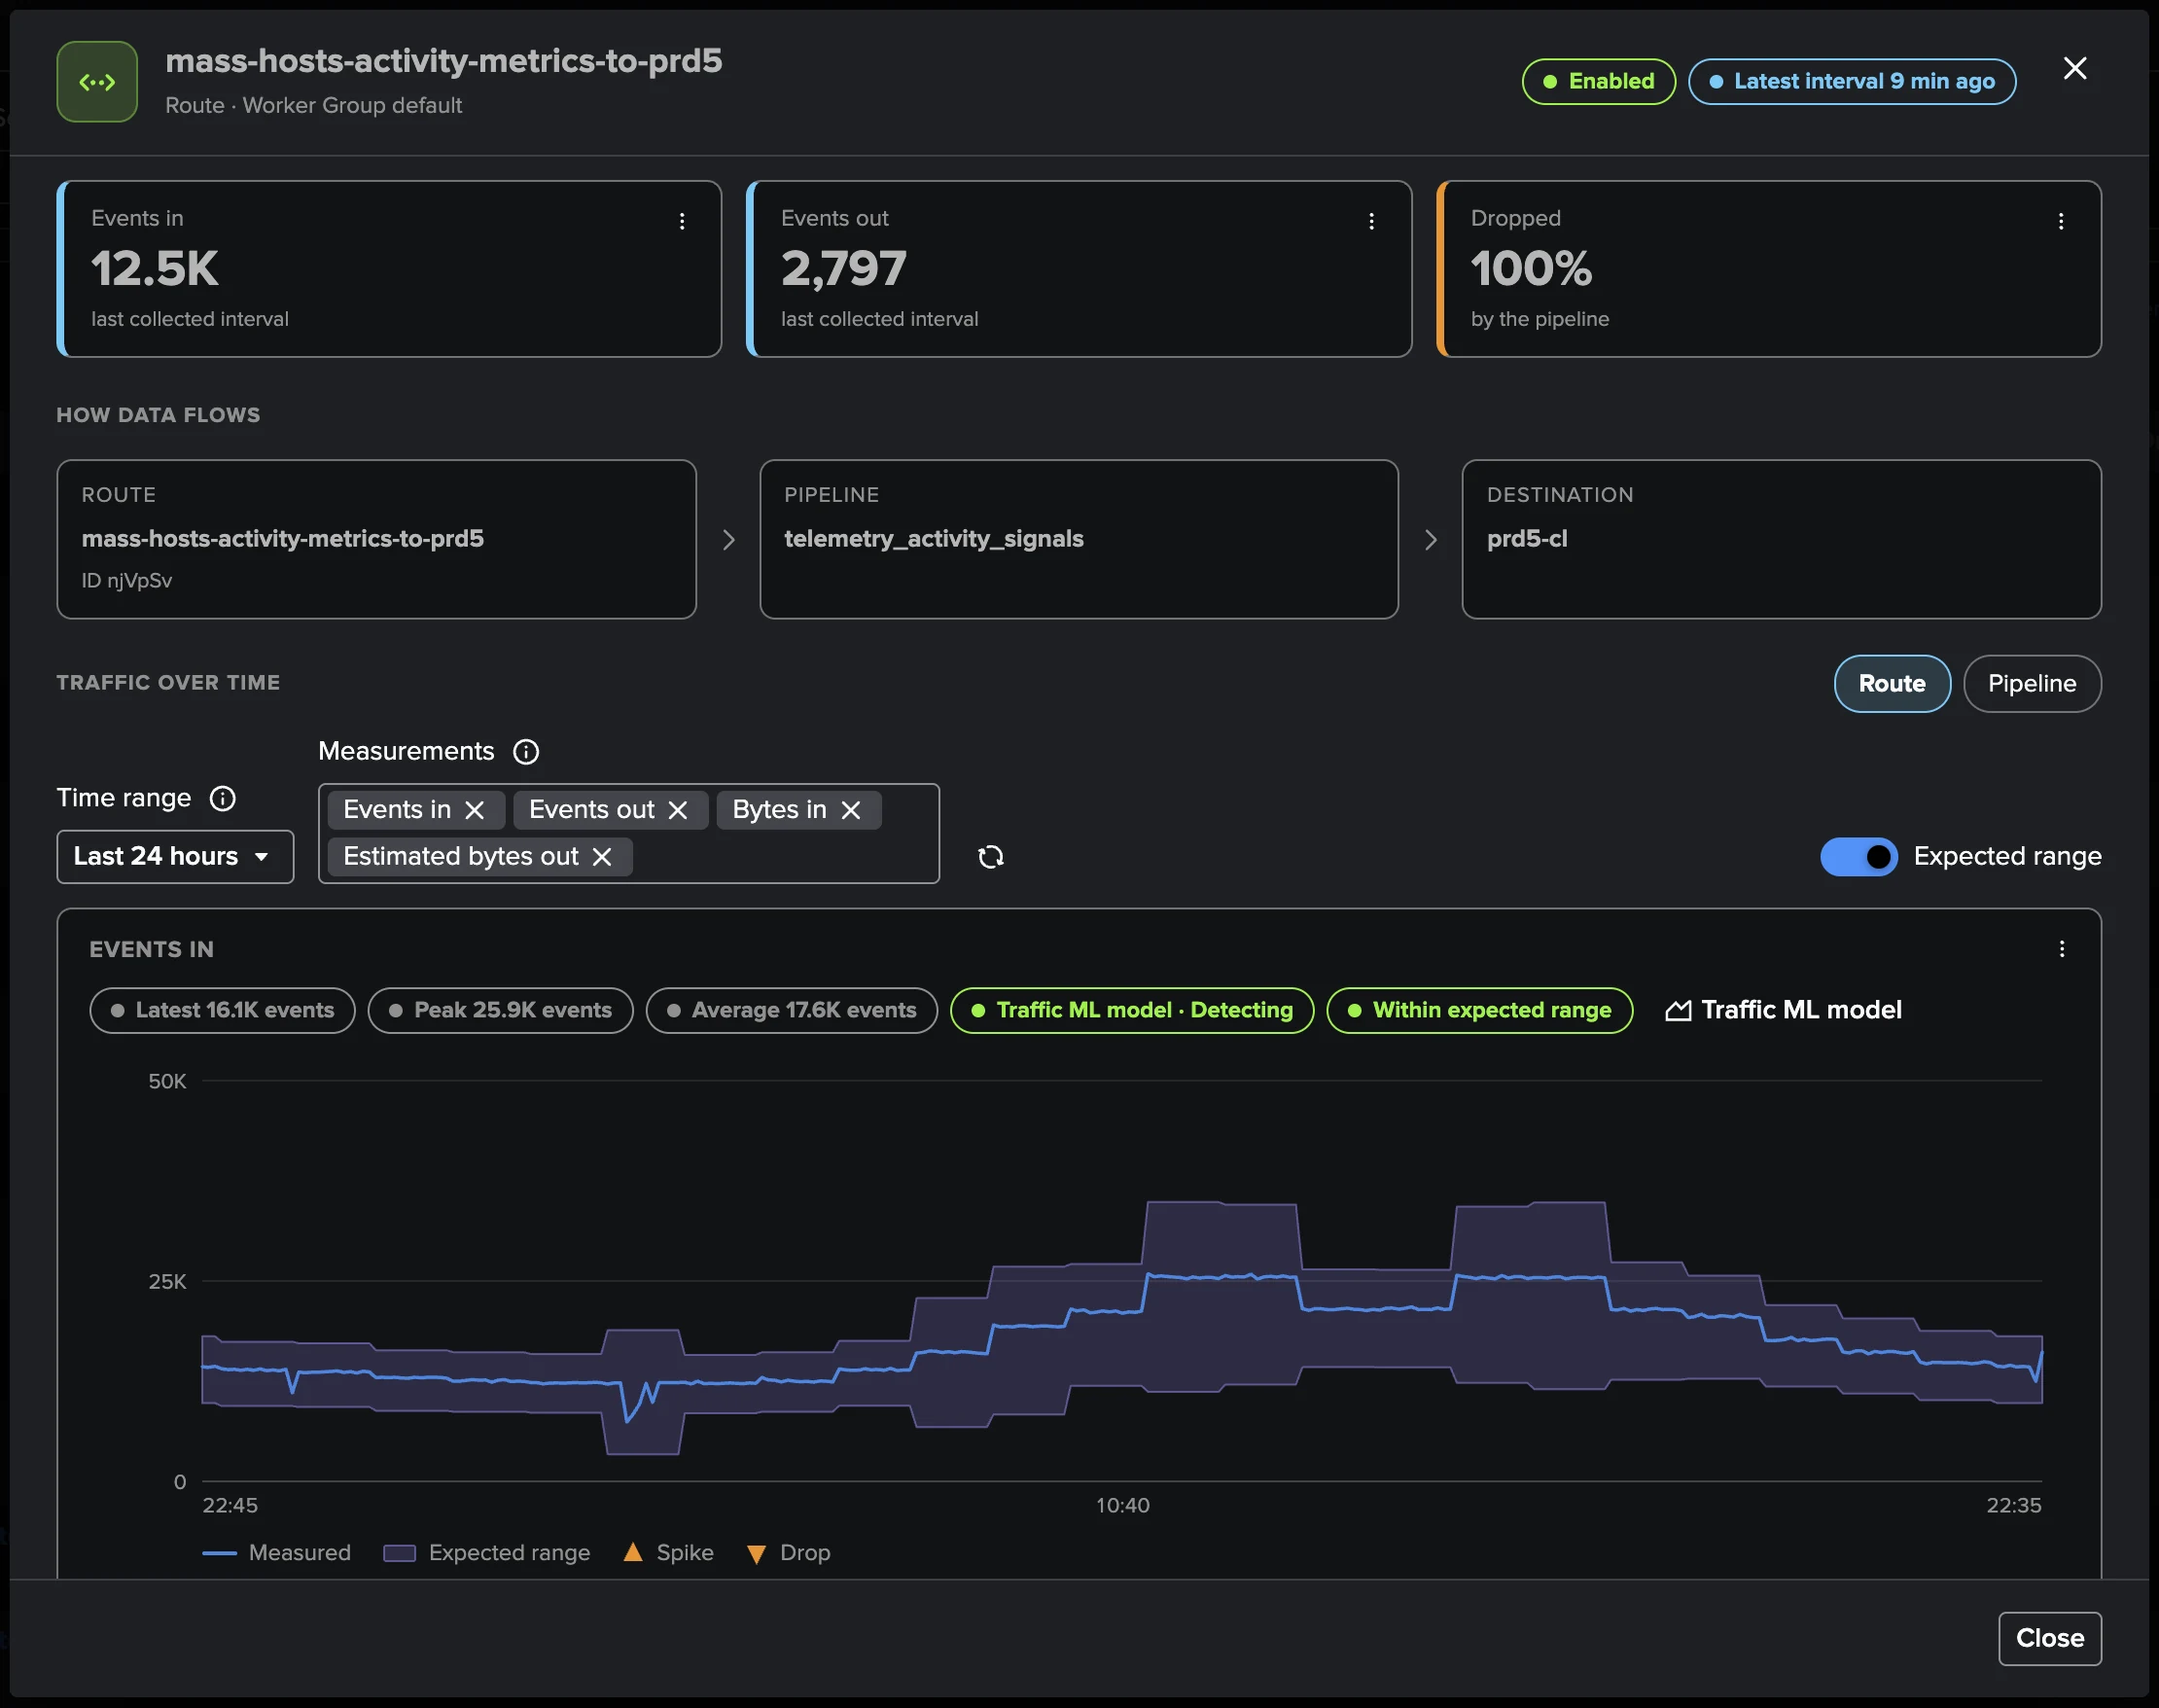
opens Traffic over time with its configured processing path beside it.
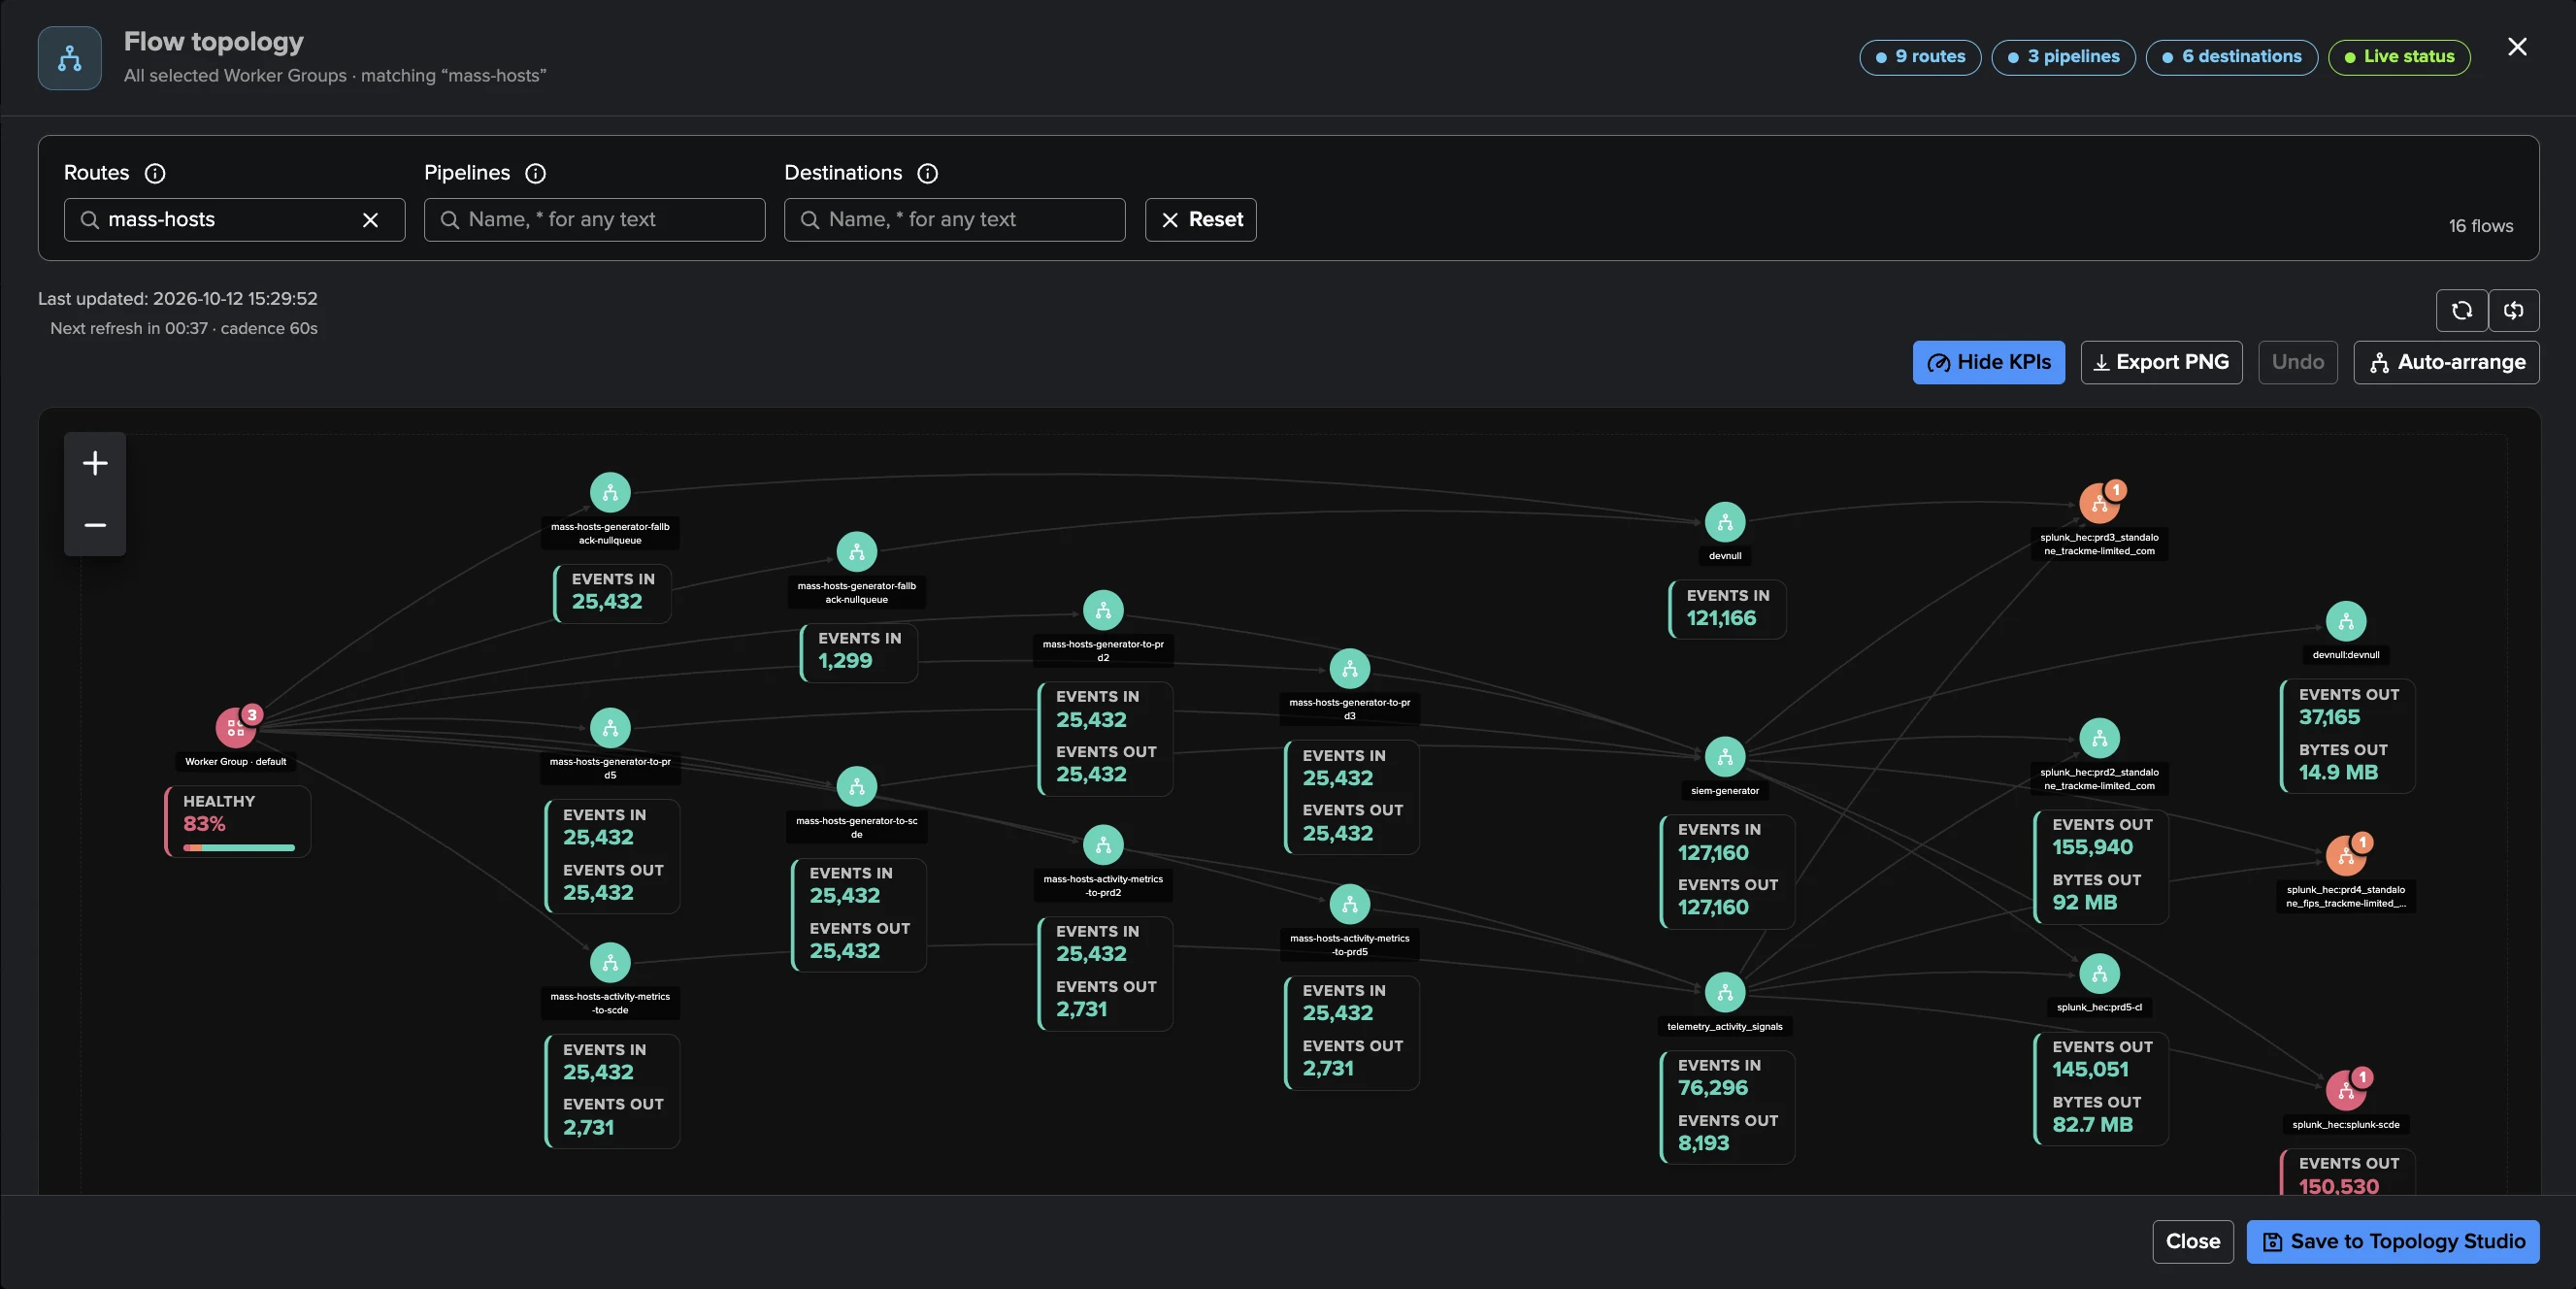
Flow topology: your data paths, drawn for you. Select Flow topology on this tab and TrackMe draws the Routes the table selects as flows, left to right: Worker Group → Route → Pipeline → Destination. You configure nothing: TrackMe reads each Route’s Pipeline and Destination from the Leader configuration and joins them with the traffic it measures, so every Route is connected to where its data goes, and every node carries its live KPIs — events in and out, bytes out, the health Cribl reports — and its findings. A Destination that several Routes feed shows once, with all its incoming flows, so you see at a glance which Routes depend on a Destination under backpressure. Nothing is invented: a link is drawn only when both of its ends are measured. While the topology is open, Live status refreshes the states and KPIs every minute.
The topology opens with the search of the table and has its own Routes, Pipelines and
Destinations filters (* stands for any text) to narrow a large deployment to one
group of flows. Export PNG saves the picture; Save to Topology Studio keeps it as a
view that stays live, with the same colours as the workspace.
Tip
The flow topology covers up to 200 Routes at a time. On a larger deployment, choose a Worker Group or search first, or use the filters of the topology.
Inventory
Every object the Leader reports, per type (All, Sources, Destinations, Pipelines, Routes, Packs, Workers, Worker Groups, Not monitored) and Worker Group, with its configuration, when it was first and last seen, whether it is still present in Cribl, and its monitoring state. This is where you turn monitoring off and back on for objects you do not care about (a test Route, a retired Destination, a lab Worker), one by one or with Exclusion rules, and where a TrackMe administrator of the tenant can Forget this object for an object removed from Cribl.
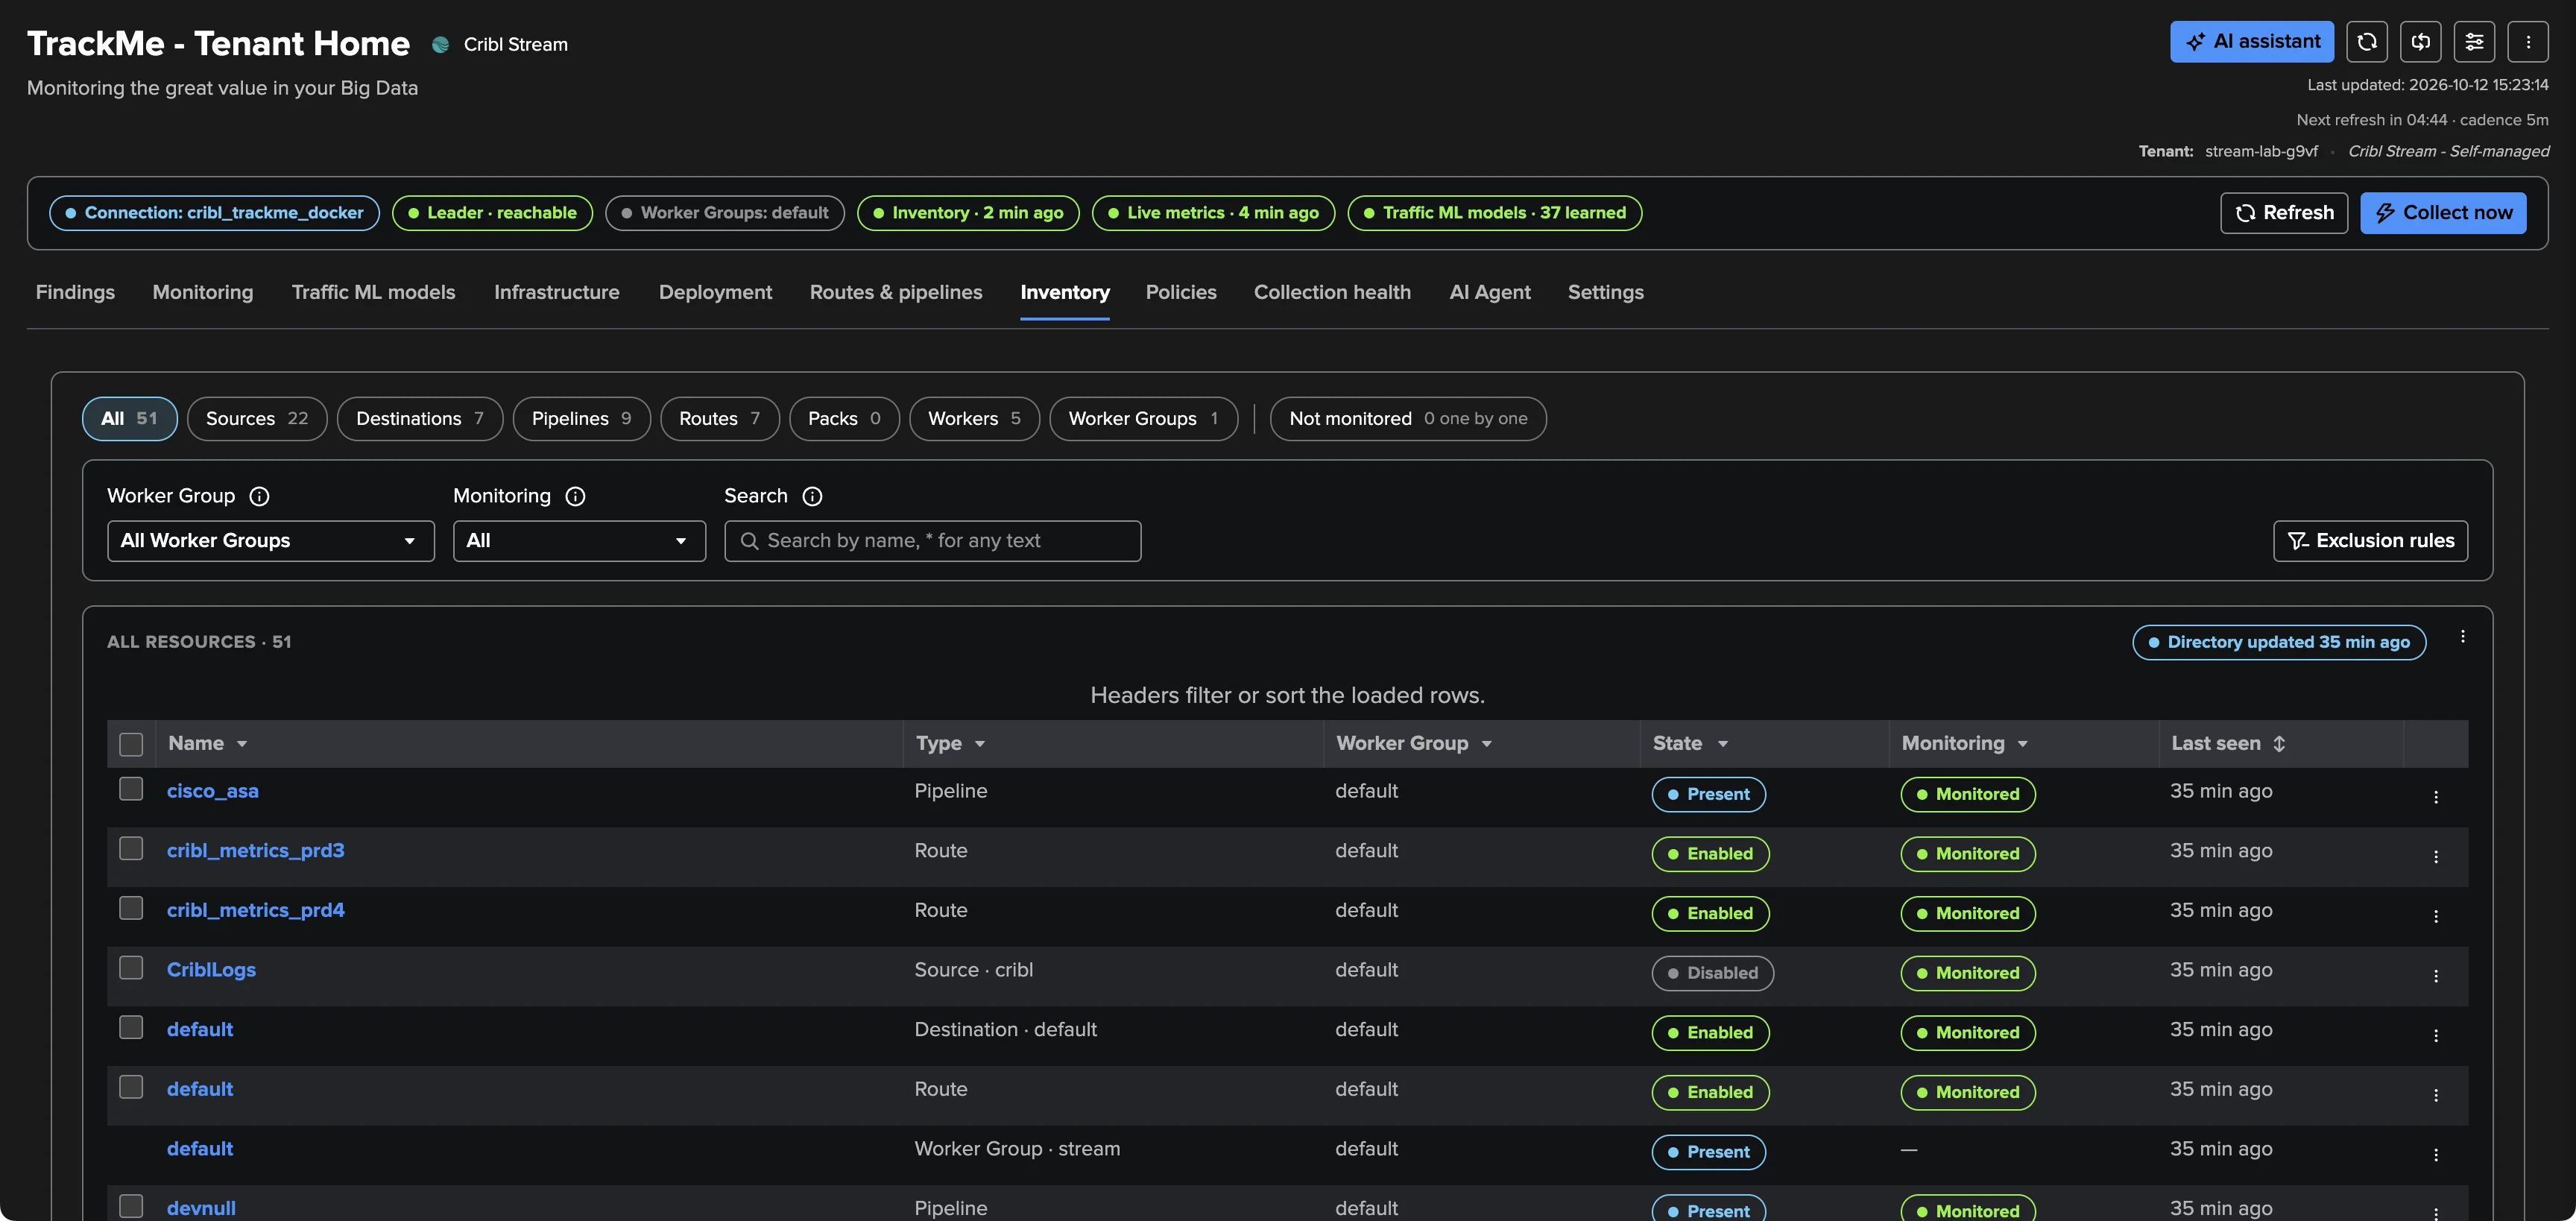
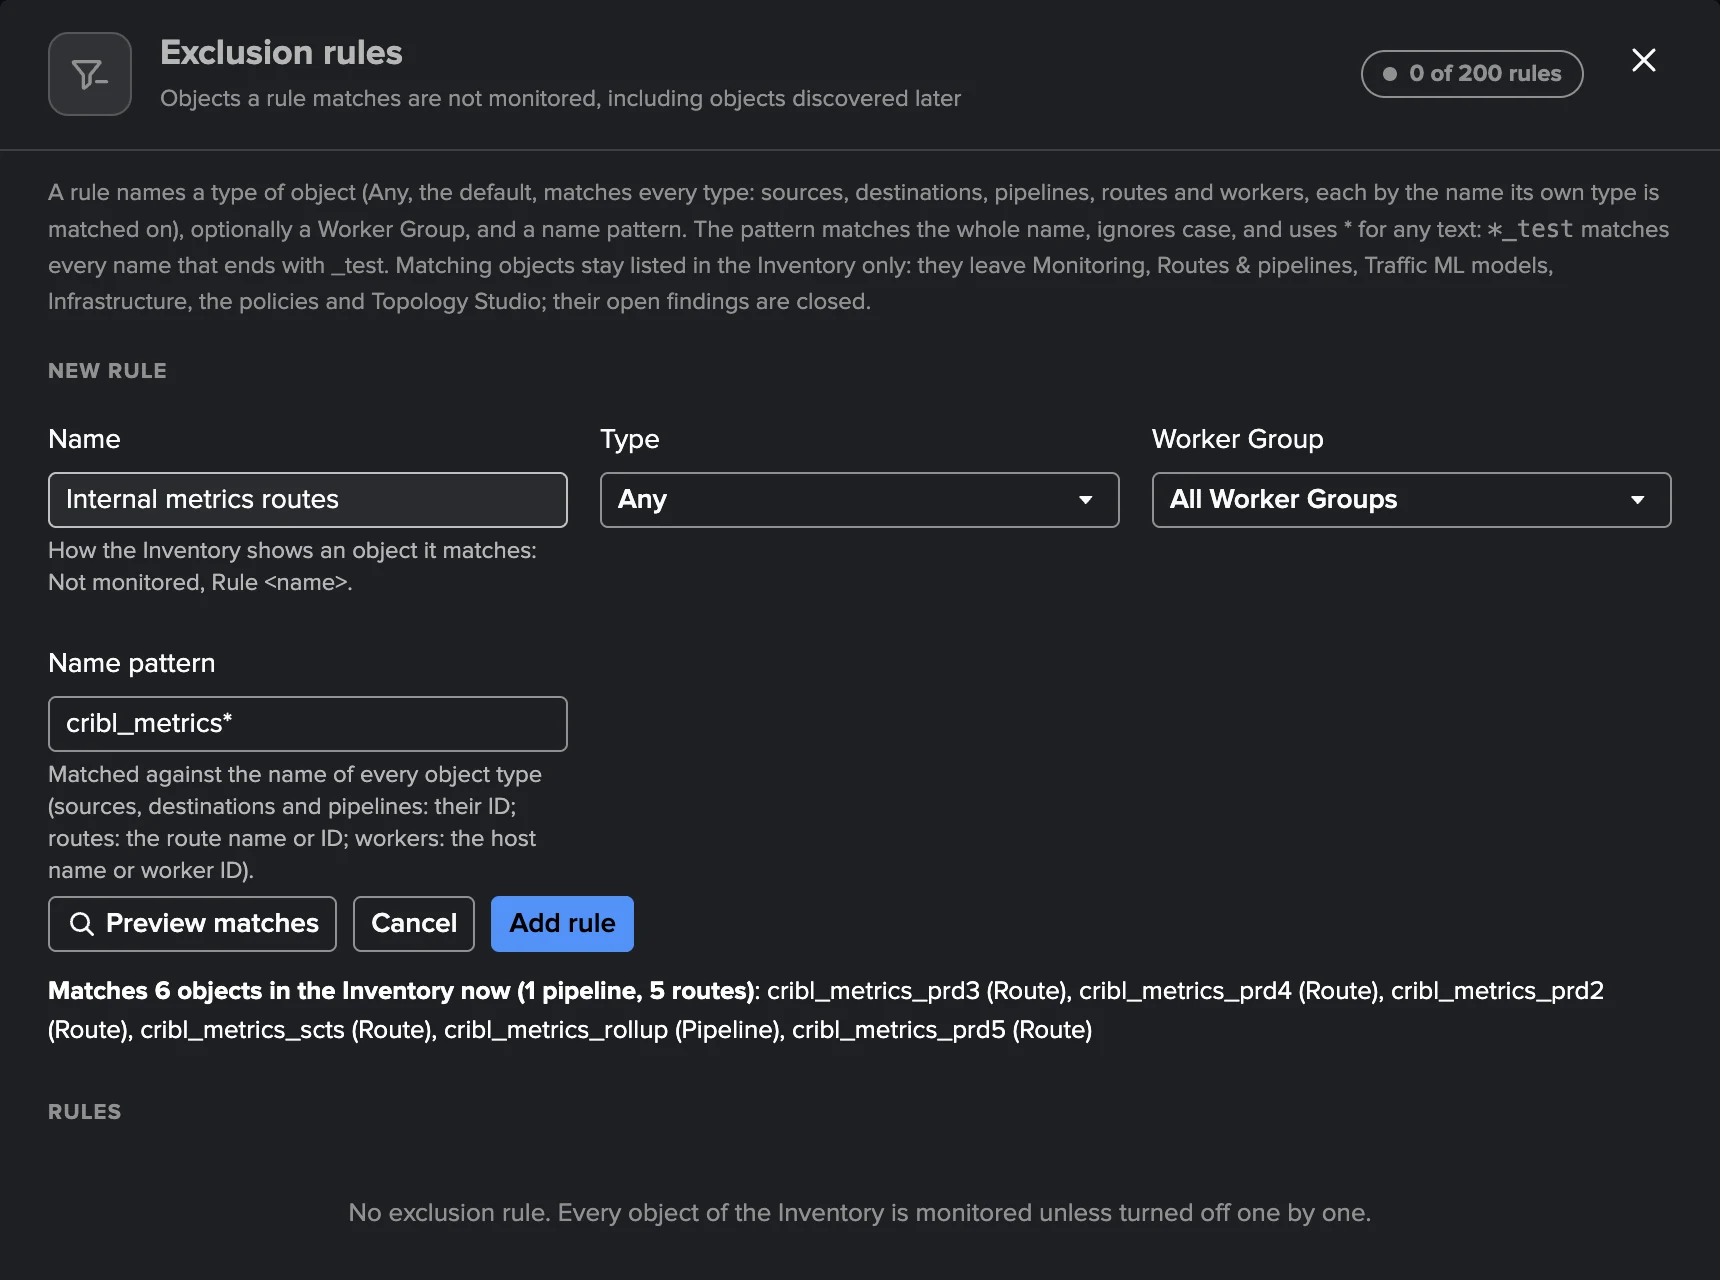
An object turned off appears only in the Inventory (Disabled by <user> on <date> or Disabled by rule <name>): it leaves the other tabs, the policies, the model training and Topology Studio, and its open findings close.
Policies
The 16 built-in policies in four groups — Cribl Leader, Data flow, Worker processes and Worker machines — shown as cards, a compact list or a table. Each policy has its enablement, its severity, how many consecutive checks open and recover a finding, its thresholds, and its scope (Worker Groups and selected objects), with a preview of what it would select. The editor has three tabs: General, Actions (drilldowns, links and webhooks offered on its findings) and Automations (rules that run an action automatically). A saved change applies from the next collection interval.
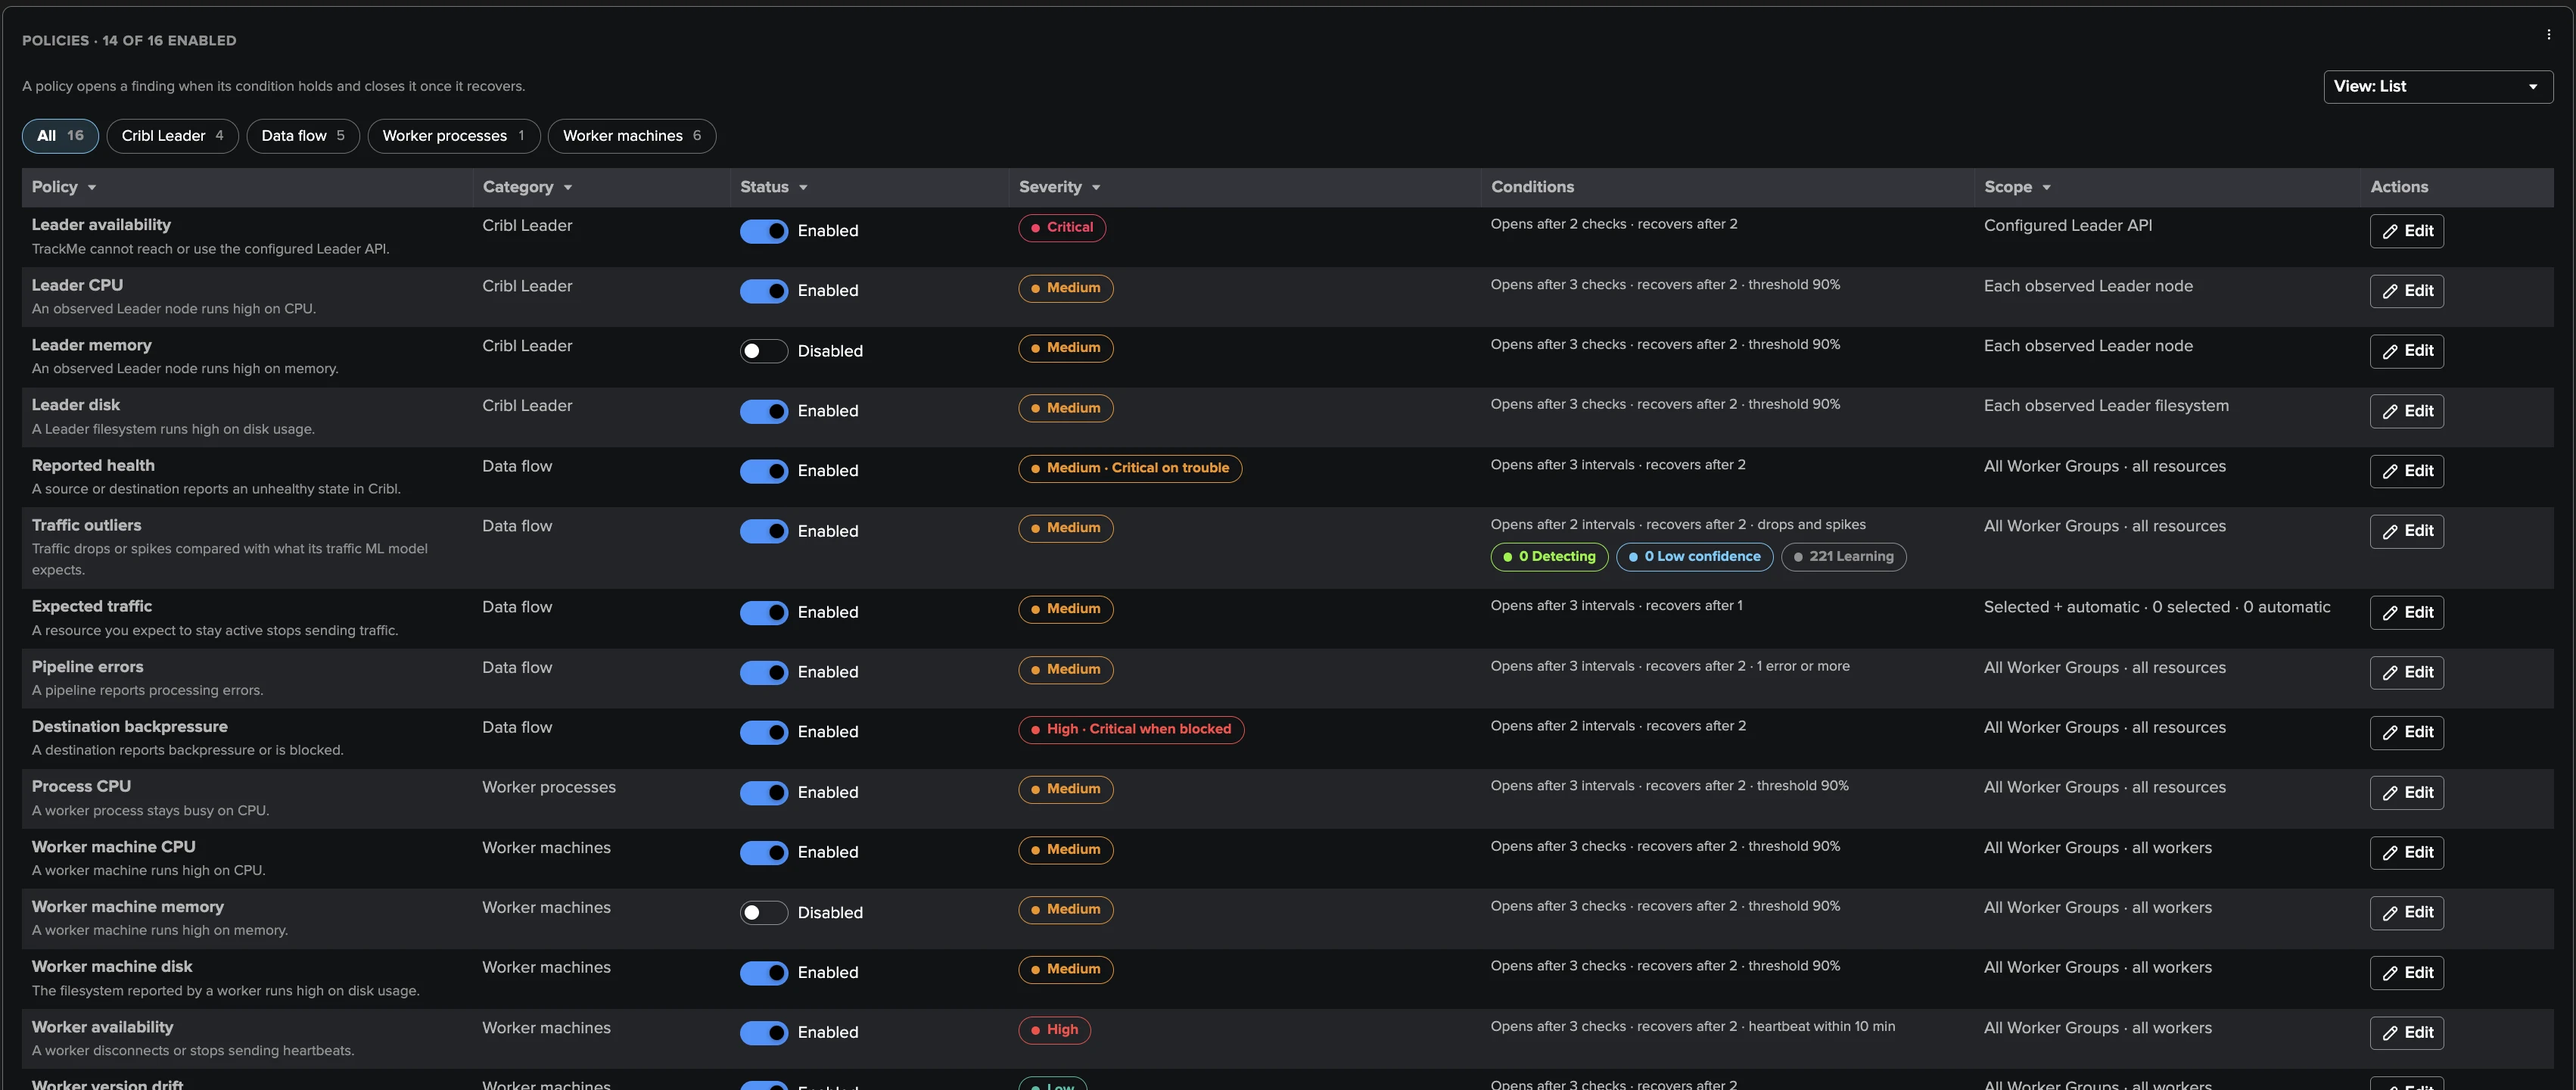
The full catalogue is in Policy catalogue.
Collection health
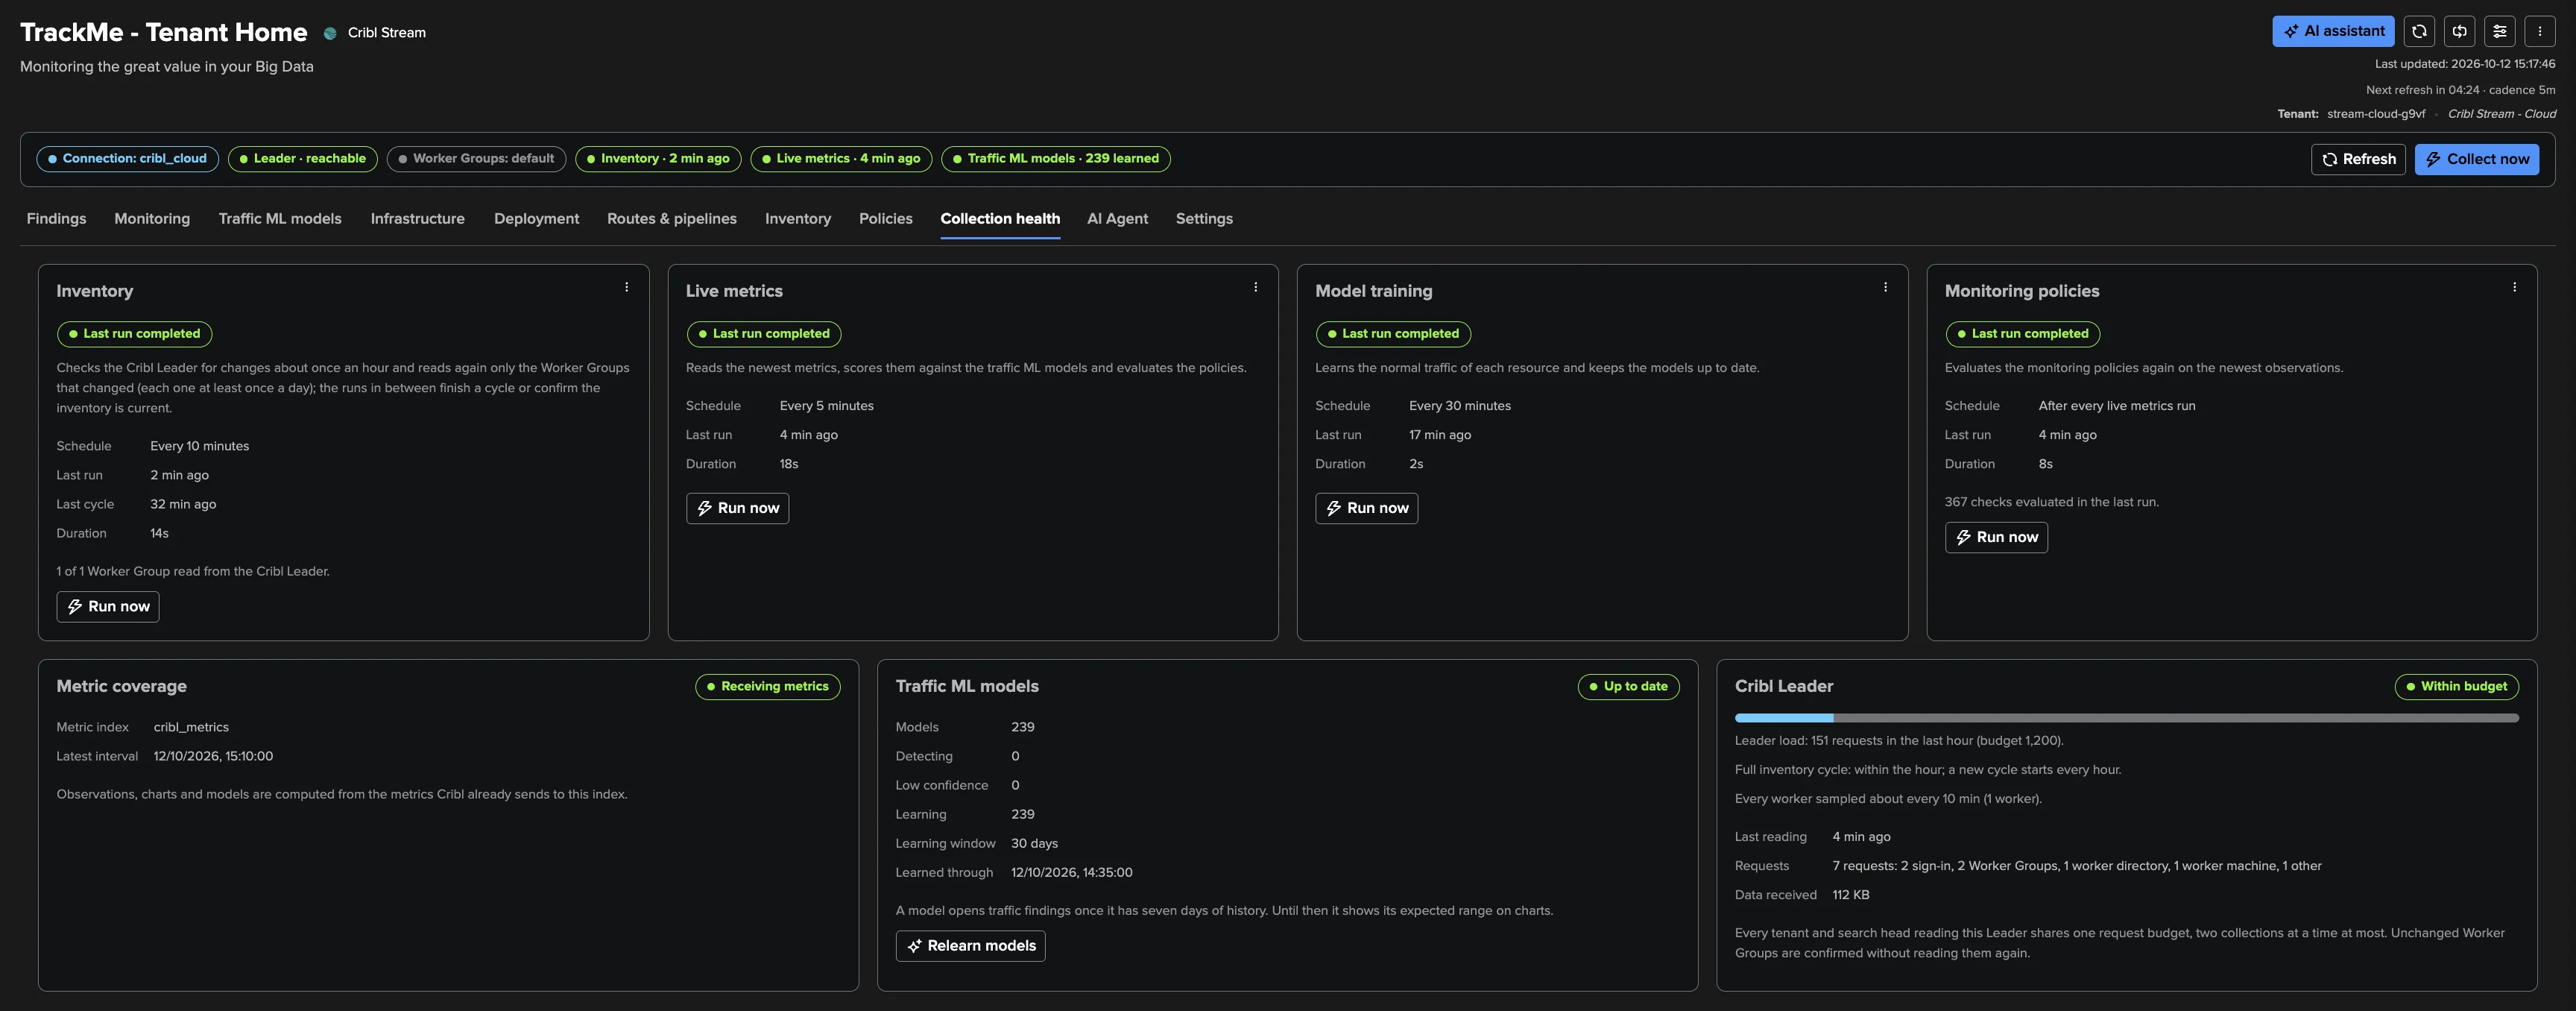
Is TrackMe collecting what it should? One card per job — Inventory, Live metrics, Model training, Monitoring policies — with its last run, its outcome in words, View last run, Open last run in search and Run now; the metric coverage with any Worker Group that sends no metric; the traffic ML models with their learning progress and Relearn models; and the Cribl Leader card with the requests of the last hour against the budget, any slow-down the Leader asked for, the inventory cycle progress and Read every Worker Group again.
AI Agent and Settings
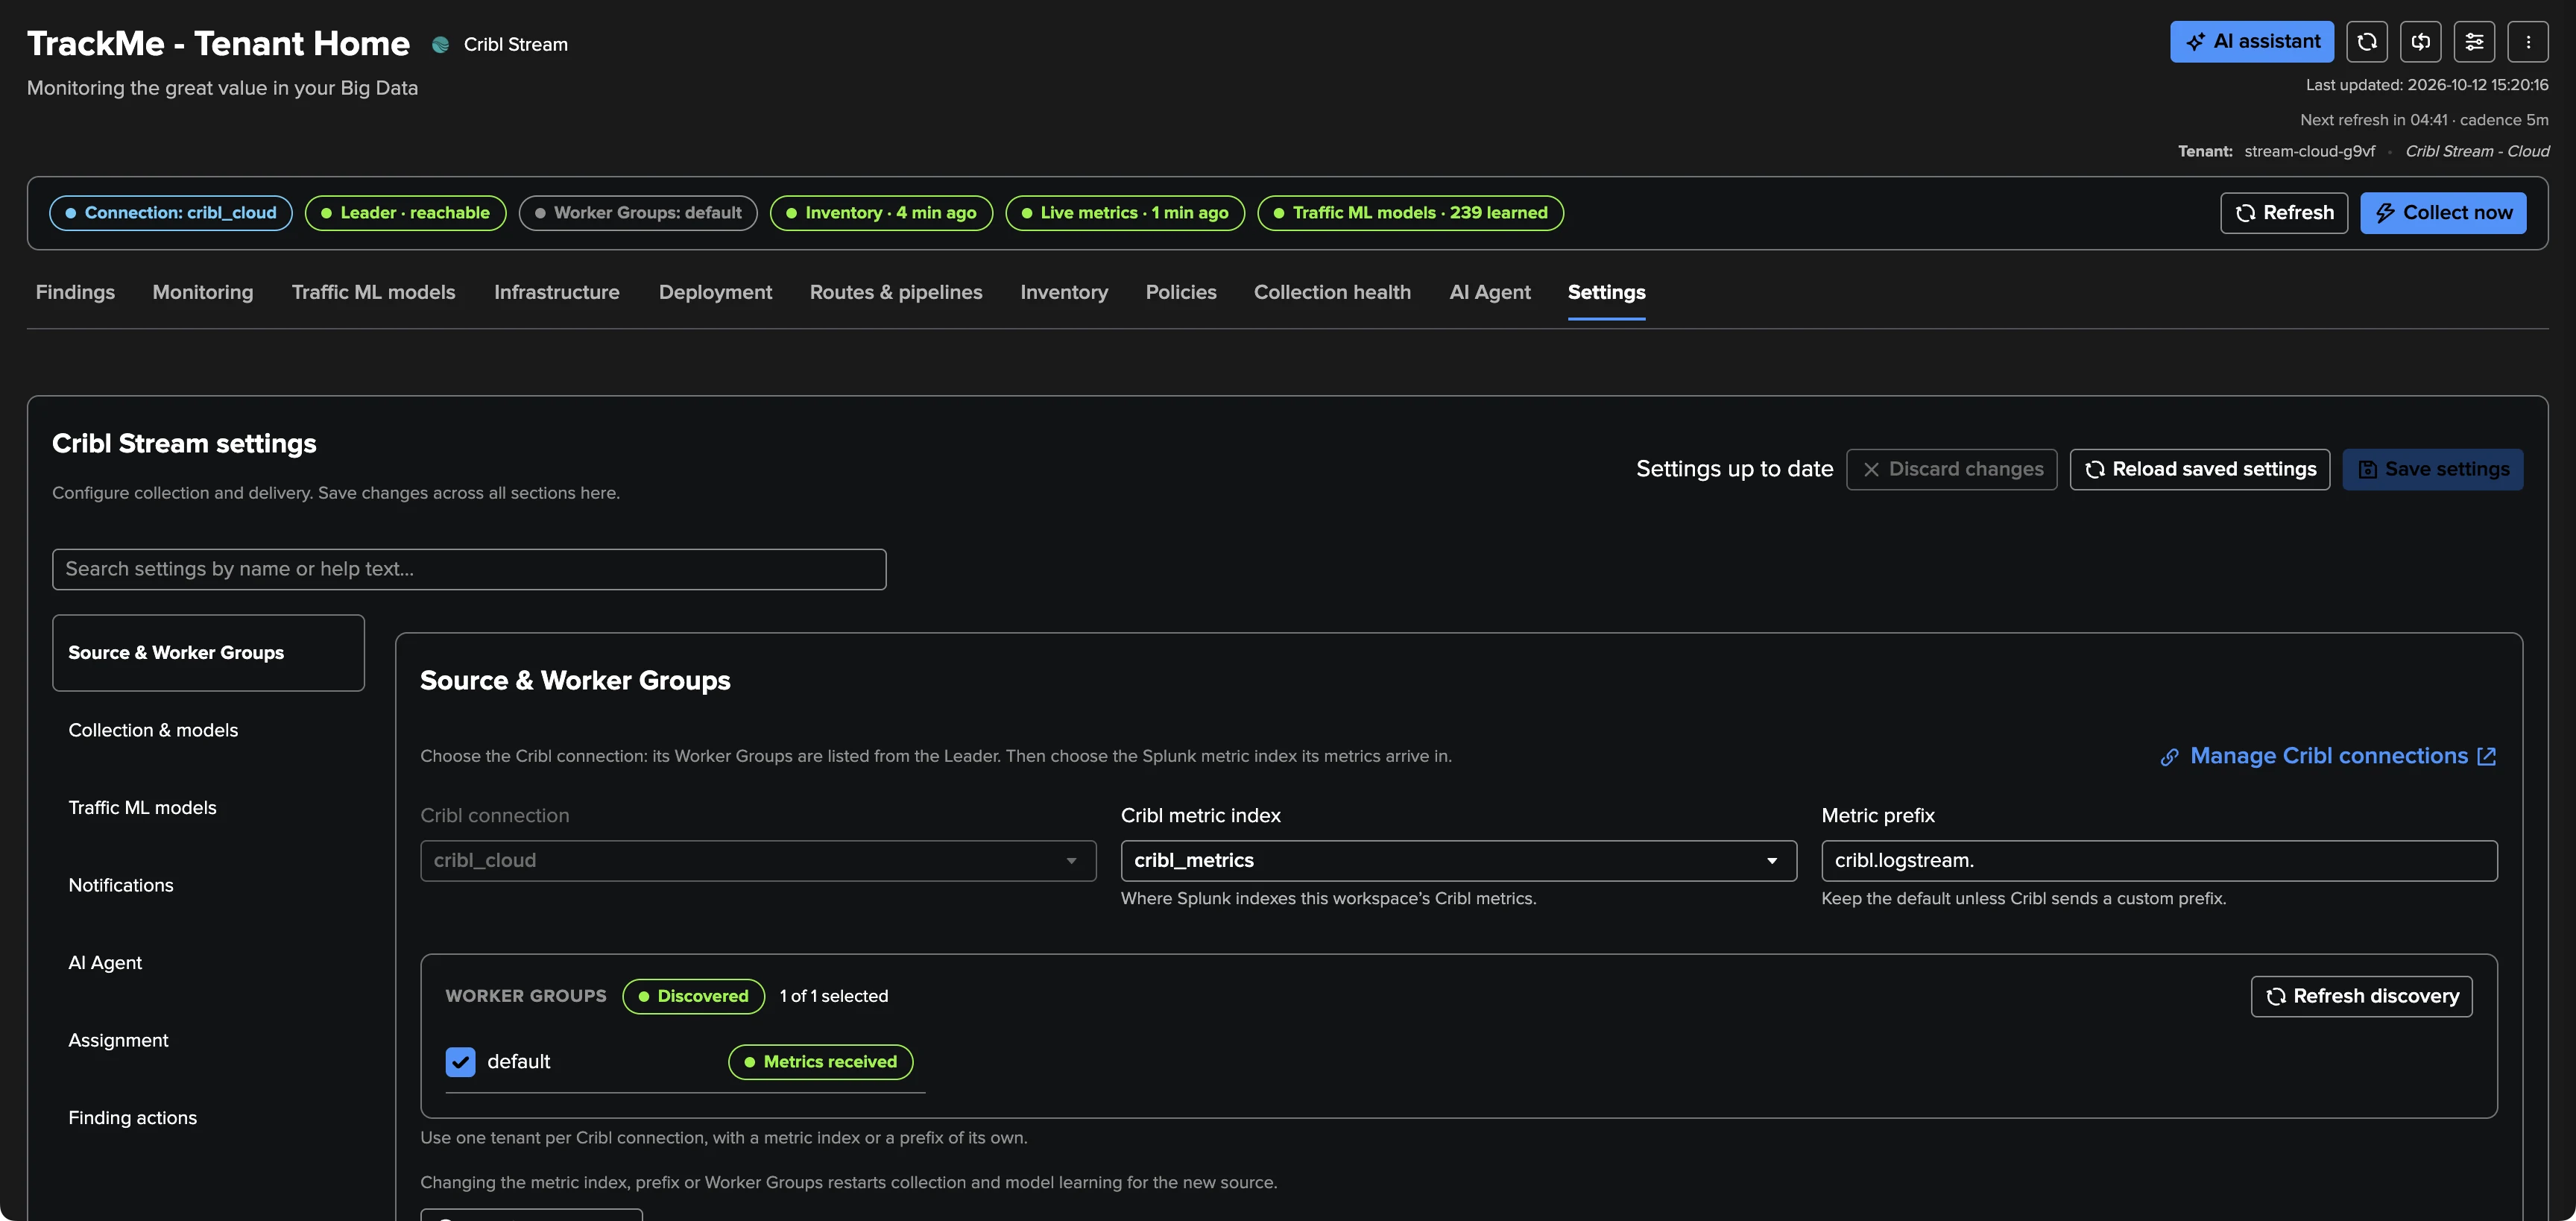
AI Agent shows the Cribl Stream AI Agent: whether it can run, its totals and its decision log (see The Cribl Stream AI Agent). Settings gathers every tenant setting in one searchable page with one Save: Source & Worker Groups, Collection & models, Traffic ML models, Notifications, AI Agent, Assignment and Finding actions. Changing the metric index, the prefix or the Worker Groups starts a new source: collection and model learning restart and the findings of the previous source close. Changing the schedule or the learning history keeps everything.
Findings in practice
A finding is one policy applied to one measurement of one object: Destination
backpressure on the Destination splunk_hec, Traffic outliers · Events in on a Source,
Worker availability on a Worker. It opens once its condition held for the policy’s
consecutive checks and recovers after the recovery checks; a measured recovery resolves an
open or investigating finding by itself, and a new failure reopens it.
Each finding shows two things side by side: its condition — what the newest evaluation measures (Failing, Recovered, Awaiting data) — and its status, your decision (Open, Investigating, Resolved, Dismissed). Its severity is on the TrackMe scale, Informational, Low, Medium, High, Critical: each policy sets it (a Source Cribl reports unhealthy or a fully blocked Destination is critical) and you can override it.
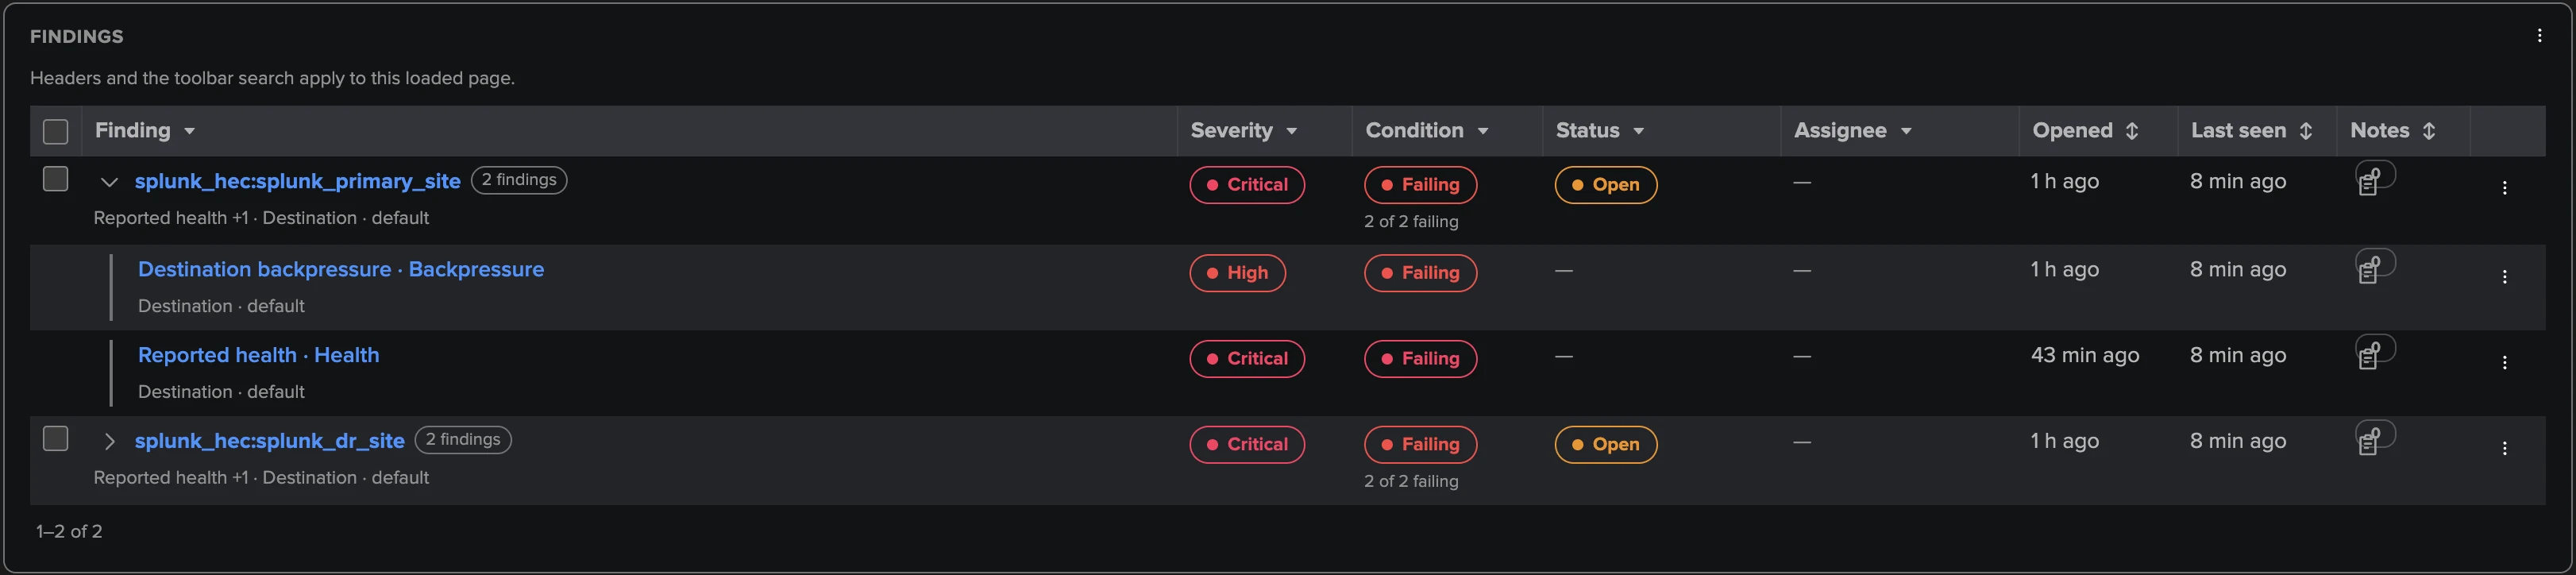
Finding groups. One object can fail several policies at once — a Worker whose machine CPU, memory and processes all run hot. TrackMe groups the findings of one object automatically into a Finding group, so you see one row and make one decision: status, assignee, snooze, dismissal and severity override live on the group, and its severity is the highest of its failing members. You can also merge groups, add or remove findings, or ungroup by hand.
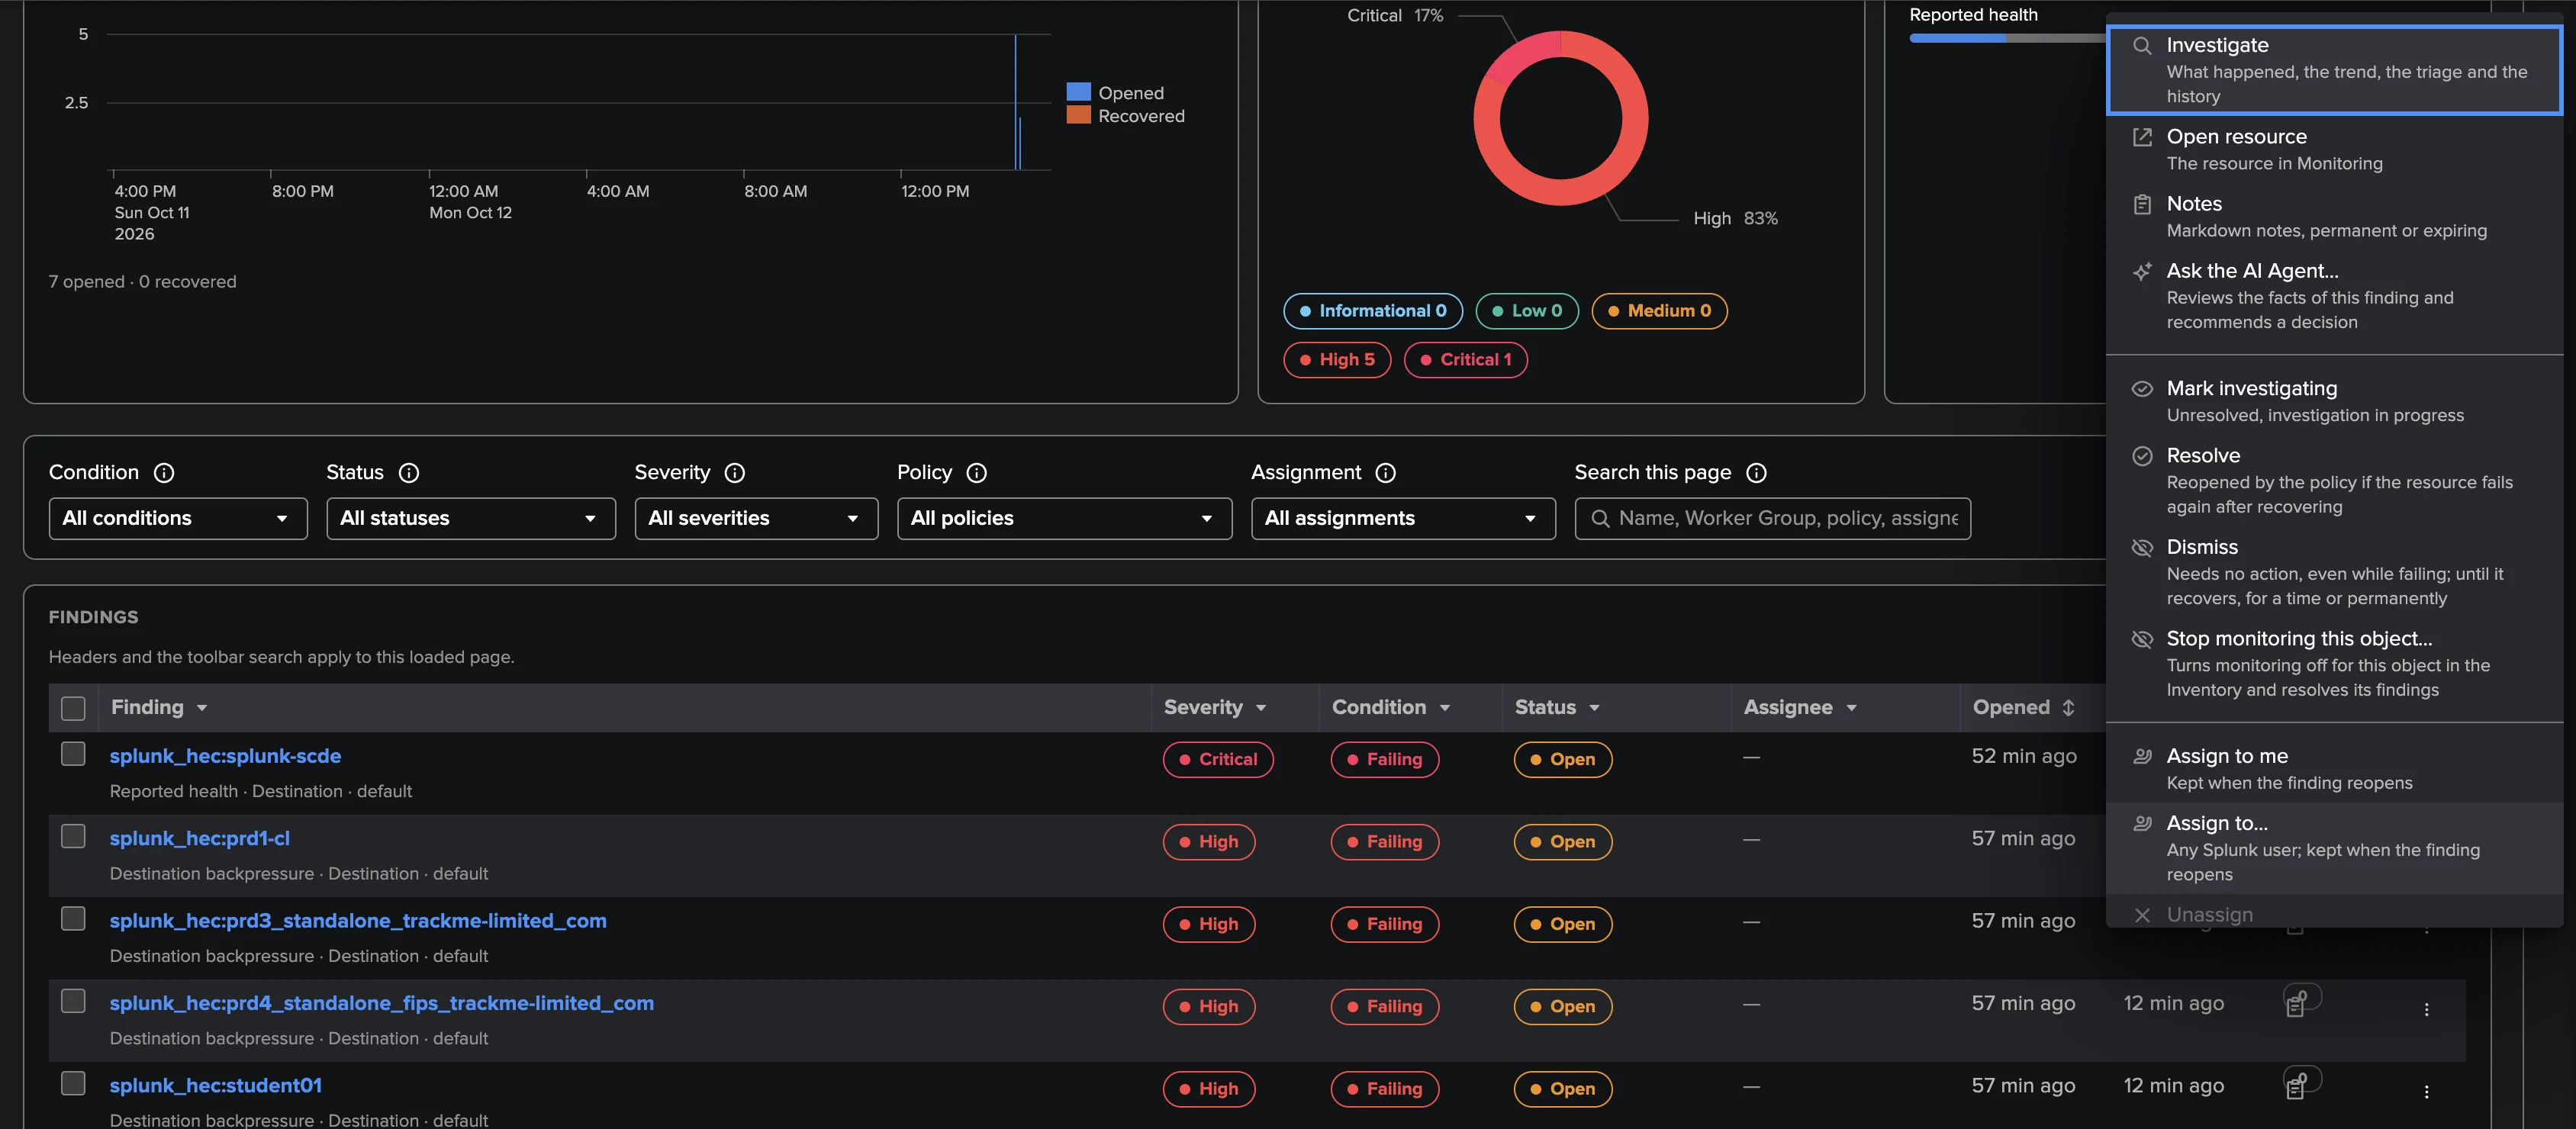
Triage. From the row menu, the drawer or a bulk selection: Mark investigating, Resolve, Dismiss (until it recovers, for 1, 7, 30 or 90 days, or permanently), Reopen, Assign or Assign to me, Snooze (stops notifications and colours the object blue in Topology Studio without changing the status), Set severity, Notes, and on a Traffic outliers finding Not an anomaly. Two Cribl-specific actions:
Stop monitoring this object turns monitoring off for the object in one step and resolves its open findings — for a Source you retired on purpose.
Forget this object (a TrackMe administrator of the tenant) removes an object that stopped reporting or was removed from Cribl at once, instead of waiting for its retention.
Assignment and findings actions. Assignment groups and rules route new findings to the
right team automatically (Settings → Assignment). Findings actions add drilldown searches,
links and webhooks to your findings, run by hand or by automation rules, through
system-wide Webhook accounts — for example the webhook_demo account posting a new
critical finding to a chat channel.
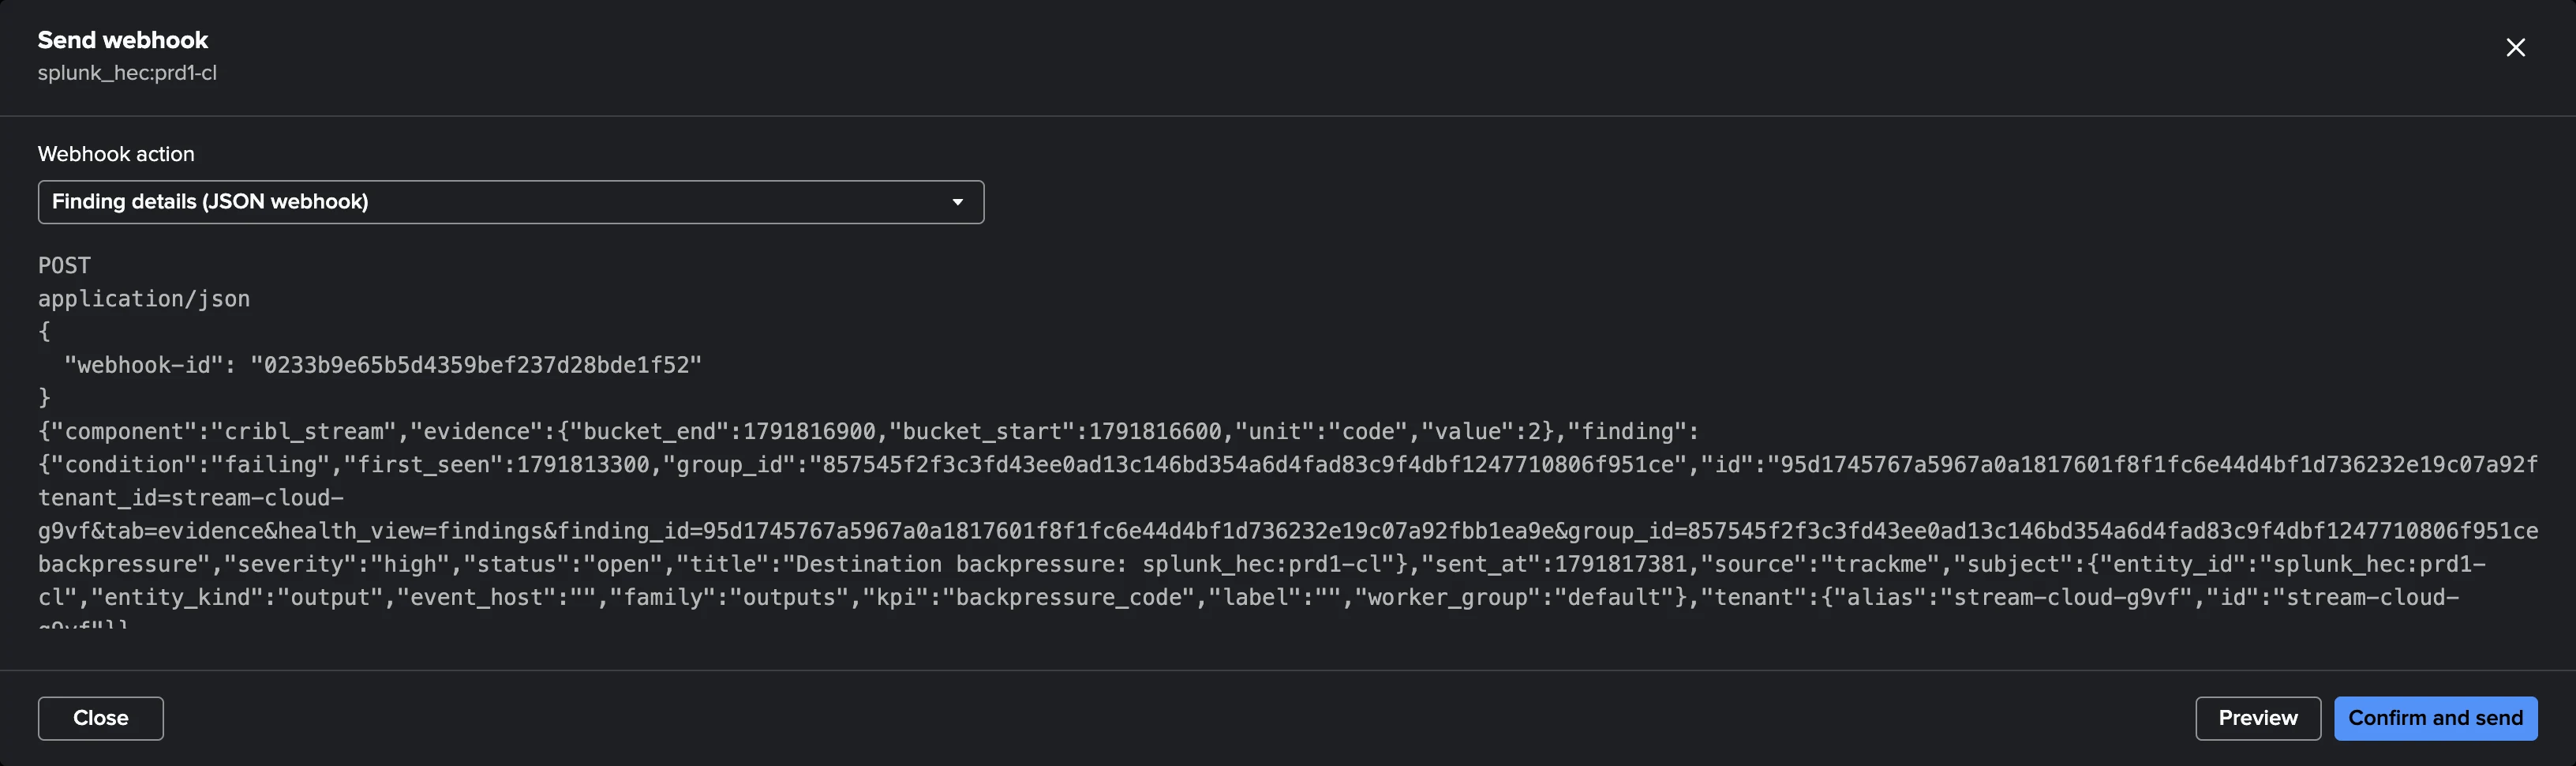
The concepts — Finding groups, triage, assignment, findings actions and webhooks — are shared with the other findings-based tenants and explained once:
Findings, Finding groups and findings actions — findings-based monitoring;
Finding groups — Finding groups;
Assignment and automatic routing — assignment groups and rules;
Findings actions — drilldowns, links, webhooks and automation rules;
Webhook accounts — Webhook accounts.
Traffic ML models and Expected traffic
How a model learns. Every Source (events and bytes in), Destination (events and bytes out), Pipeline and Route (events in and out) gets its own model. A model learns the expected range of its traffic per hour of the day, then per weekday and hour once it has four weeks of history, with recent days counting more. It learns from the history already in your metric index (the Model learning history of the wizard), then keeps learning a few times a day from the newest intervals only: there is no periodic full retrain.
A model is in one of these states:
State |
Meaning |
|---|---|
Learning |
Less than a day of history, or hours not covered yet: no expected range. |
Low confidence |
From a day of history: the range is drawn on the charts, but it opens no finding. |
Detecting |
From seven days of history: the Traffic outliers policy opens a finding when the traffic stays outside the range. |
No data |
The object stopped reporting (see Objects that stop reporting). |
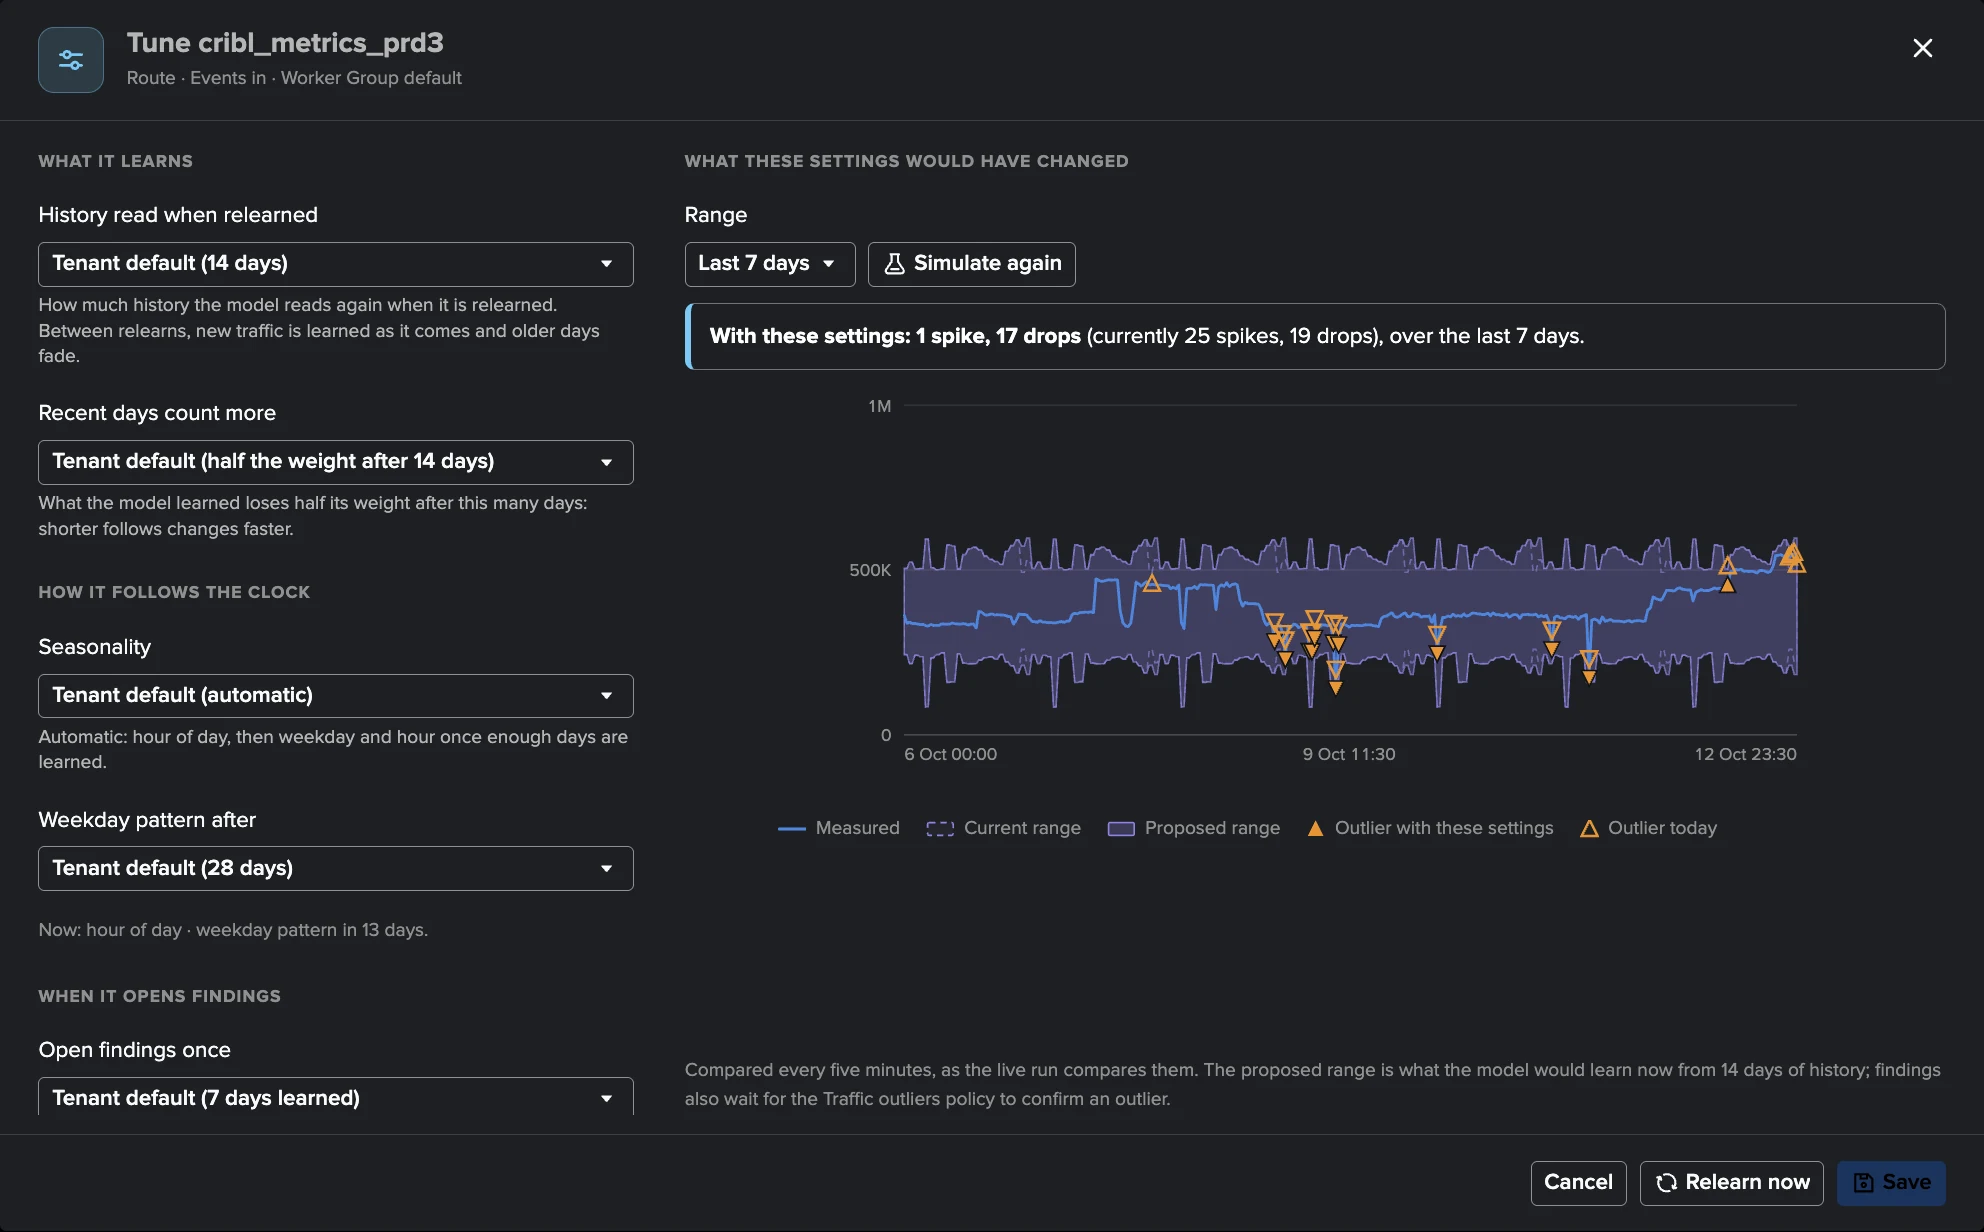
Tuning. A TrackMe administrator of the tenant sets the tenant defaults in Settings → Traffic ML models (sensitivity, seasonality, when the weekday pattern starts, how much more recent days count, when findings open, the smallest deviation that counts) and can give a model — or a selection of models — its own settings with Tune model: the same settings plus the training days, the direction (drops, spikes or both), a pause, and excluded periods the model must not learn from. The tuning screen runs a live simulation: the current band and the proposed one over the last 24 hours, 7 or 30 days, with the drops and spikes each would have raised, before anything is saved.
Not an anomaly. When a Traffic outliers finding was expected — a maintenance window, a load test, a planned migration — a power or admin role of the tenant marks it Not an anomaly: the episode is excluded from what the model learns, the model relearns without it at the next training run, and the finding is dismissed with your reason as its note.
Bank holidays. A Cribl Stream tenant uses the bank holiday calendars like every tenant: the system default calendars, unless it selects its own or none (Bank Holidays → Tenants & settings, or Configure tenant → Bank Holidays). Two of the four holiday effects apply to it, each on by default:
Exclude from ML training — the traffic models do not learn the hours of the tenant’s holidays, so a quiet holiday does not become normal traffic. This applies from the next training run on; a model that learned a holiday before keeps it until it fades or is relearned (nothing is relearned automatically). The Traffic ML models card and the tuning simulation say how many holidays were left out.
Suppress new alerts — while a holiday is active, the policies set to hold open no new finding. Each policy chooses it in its editor, section Bank holidays: Hold new findings or Keep opening findings. By default Traffic outliers holds (traffic is expected to change on a holiday) and every other policy — Expected traffic, Reported health, backpressure, Pipeline errors, the Worker policies — keeps opening findings, so an infrastructure failure on a holiday still opens its finding. The Leader policies have no setting. The policies list says held on bank holidays in the conditions of a policy that holds. A finding already open is still evaluated and can recover and close; a resolved or dismissed finding is not reopened by a held condition; a calendar that cannot be read holds nothing. The policies run and its details report the holiday, its name and how many failing checks were held.
SLA and monitoring windows have no effect on a Cribl Stream tenant. Cribl Edge tenants take the Suppress new alerts effect, with their own defaults (see Cribl Edge).
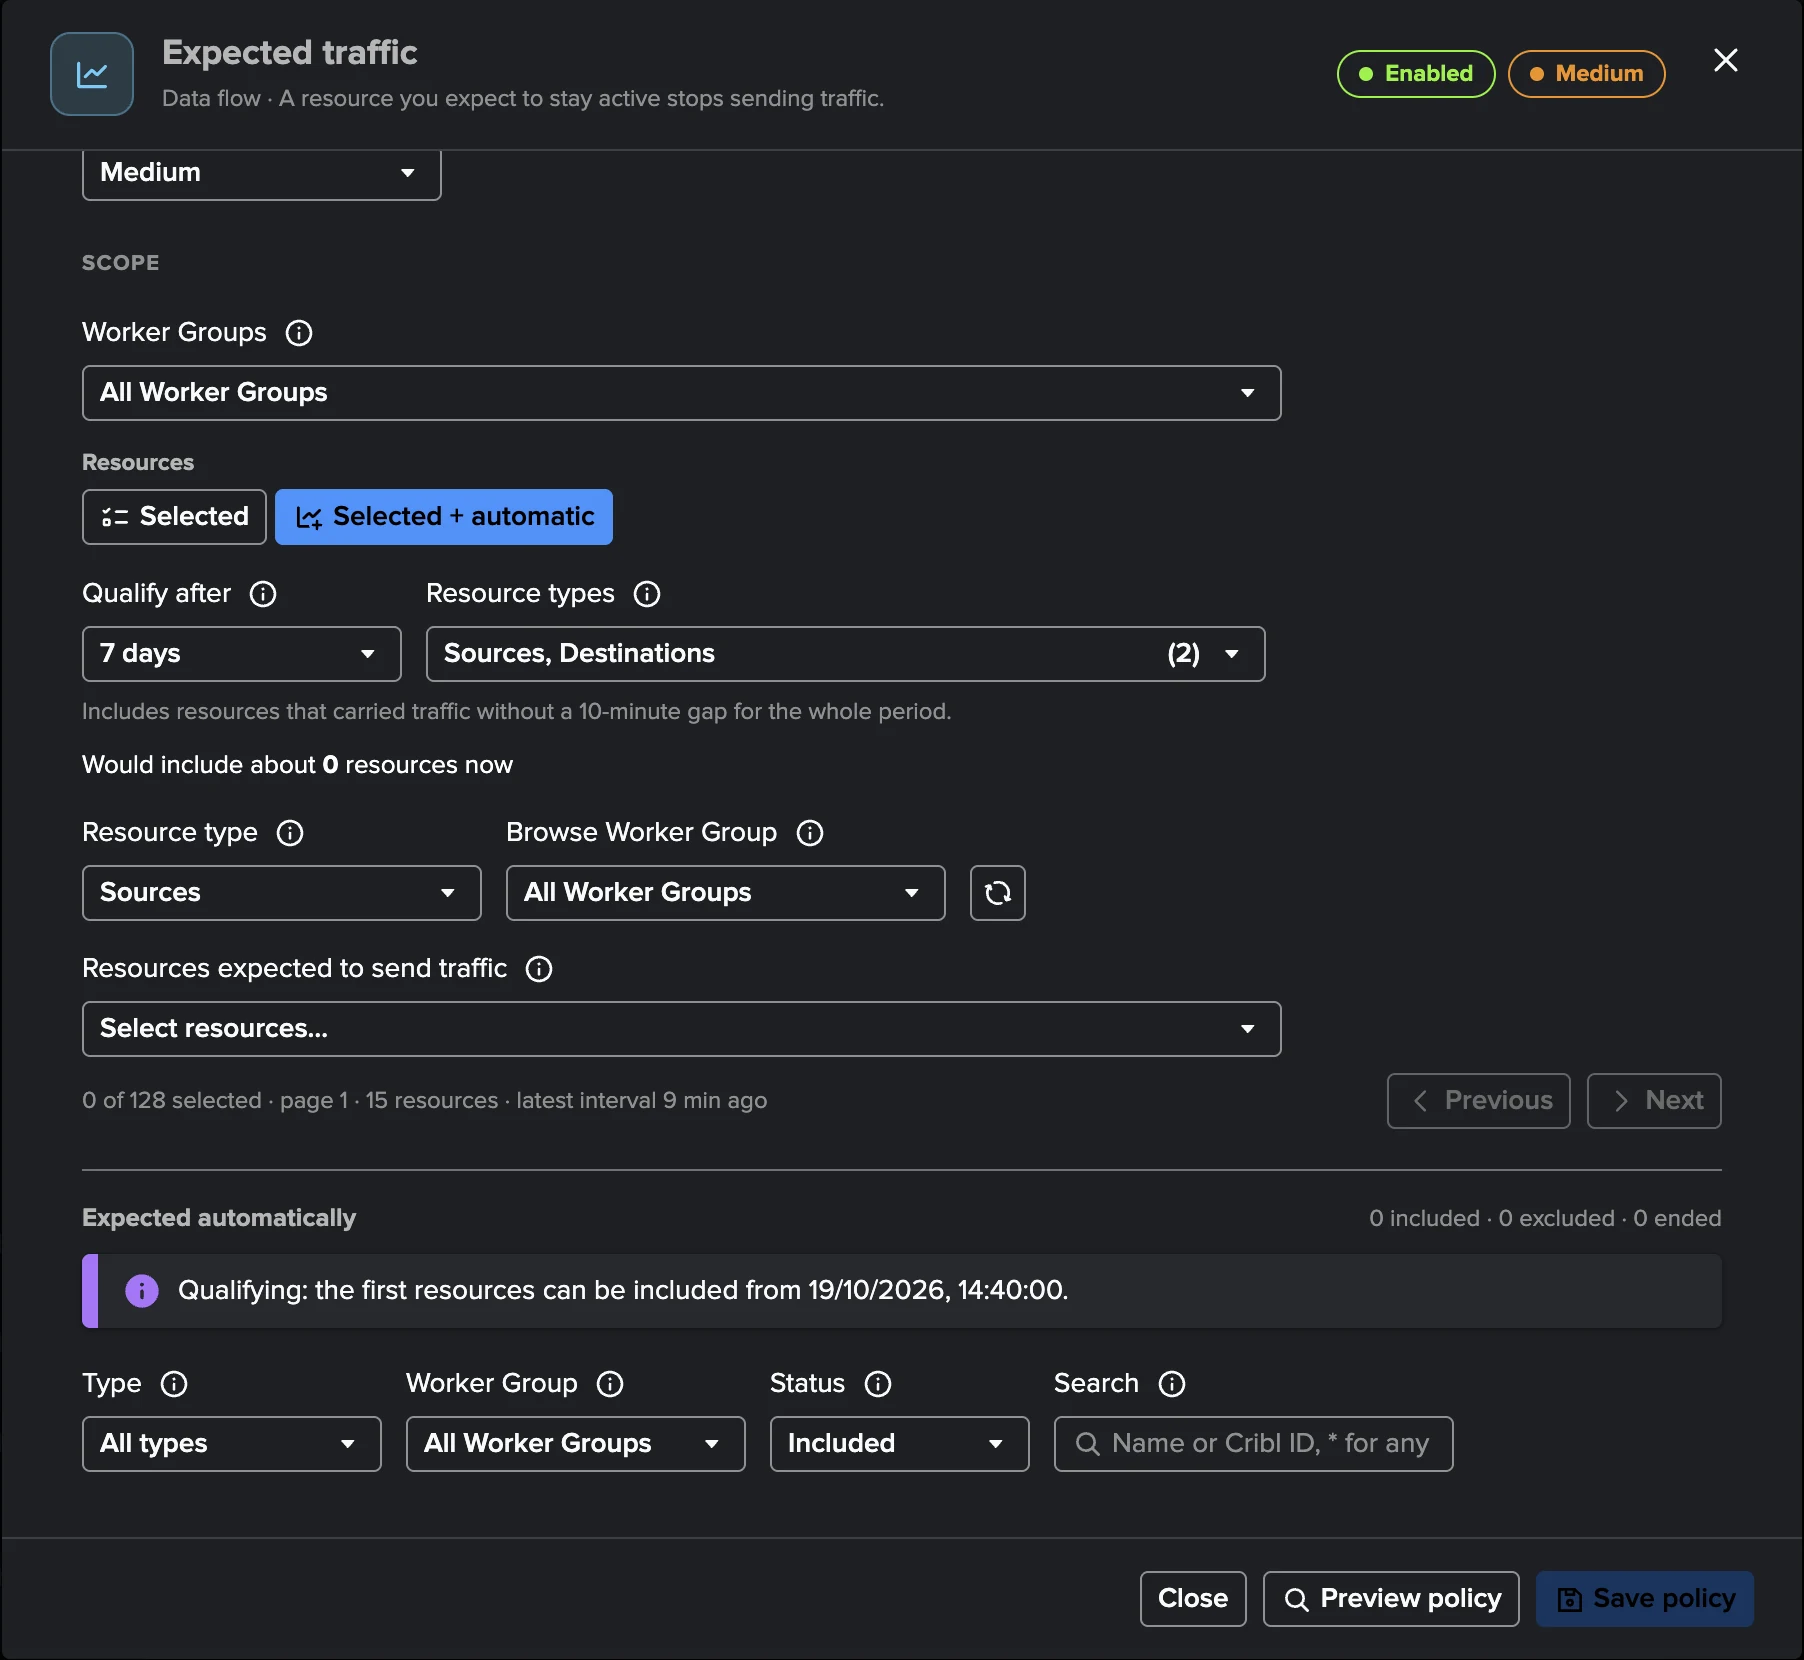
Expected traffic. Some objects must never go quiet — a Source fed by a critical application, a Destination to your SIEM. The Expected traffic policy opens a finding when an expected object carries no traffic. In Selected + automatic mode (the default of a new tenant), TrackMe expects, on top of the objects you select, every object that carried traffic steadily — with no gap of more than ten minutes — for the whole qualifying window (2 or 7 days, 7 by default) among the resource types you choose (Sources and Destinations by default; Pipelines and Routes optional). It stops expecting an object after 7 days of silence, when it is removed from Cribl or when it leaves the scope. In the policy, the list of objects expected automatically lets you Exclude one, Include again, or Keep as selected.
Objects that stop reporting, and objects removed from Cribl
Objects that stop reporting
TrackMe remembers every object it ever measured. When an object stops sending metrics, it is not silently forgotten: from its second missing interval it appears under Monitoring → No data (and Traffic ML models → No data) with the time it last reported and last carried traffic, and it keeps its name in findings, events and emails.
A silence can matter: a Source that stops is often exactly what you want to know. The Traffic outliers policy counts the silence of an object as zero traffic, but only when TrackMe is sure the silence is real — the Inventory is current and still lists the object, its monitoring is on, its Worker Group is still reporting, it carried traffic within the last 24 hours, its model is Detecting, and most of its Worker Group did not stop at the same time. A silence can open or keep a finding; it never recovers one. When many objects stop together, Collection health says so instead of raising a finding per object.

Objects removed from Cribl
When the Inventory reports an object missing in two consecutive complete readings, TrackMe treats it as removed from Cribl: its findings close at once, its silence is never counted, it leaves No data and it is purged after 7 days. If more than half of a Worker Group’s objects of one type (at least five) disappear at once — a Leader glitch more often than a real removal — TrackMe holds them and notes it in Collection health.
Forget this object (a TrackMe administrator of the tenant, up to 100 objects at a time, audited) purges a silent or removed object at once, from the No data list, the Inventory or a finding.
Leader availability and Leader resources
Leader availability. Collecting metrics from Splunk can succeed while the Cribl Leader is unreachable, so TrackMe checks the Leader API on its own at every live run: a sign-in and one small read. The status strip shows Leader · unavailable after a failed check, with the reason (network, certificate not trusted, host name mismatch, credentials refused, service unavailable, unexpected answer). Two failed checks in a row open a Critical Leader availability finding; two successful checks recover it. A Leader asking TrackMe to slow down (rate limited) is neither a failure nor a recovery.
Leader resources. The same live run reads each Leader node’s CPU, memory and disk — on a high-availability Leader, each node separately — and keeps their history. The Leader CPU and Leader disk policies open a finding above 90 % (recovering below 80 %); Leader memory is available but off by default, because the memory the operating system reports as used includes its file cache.
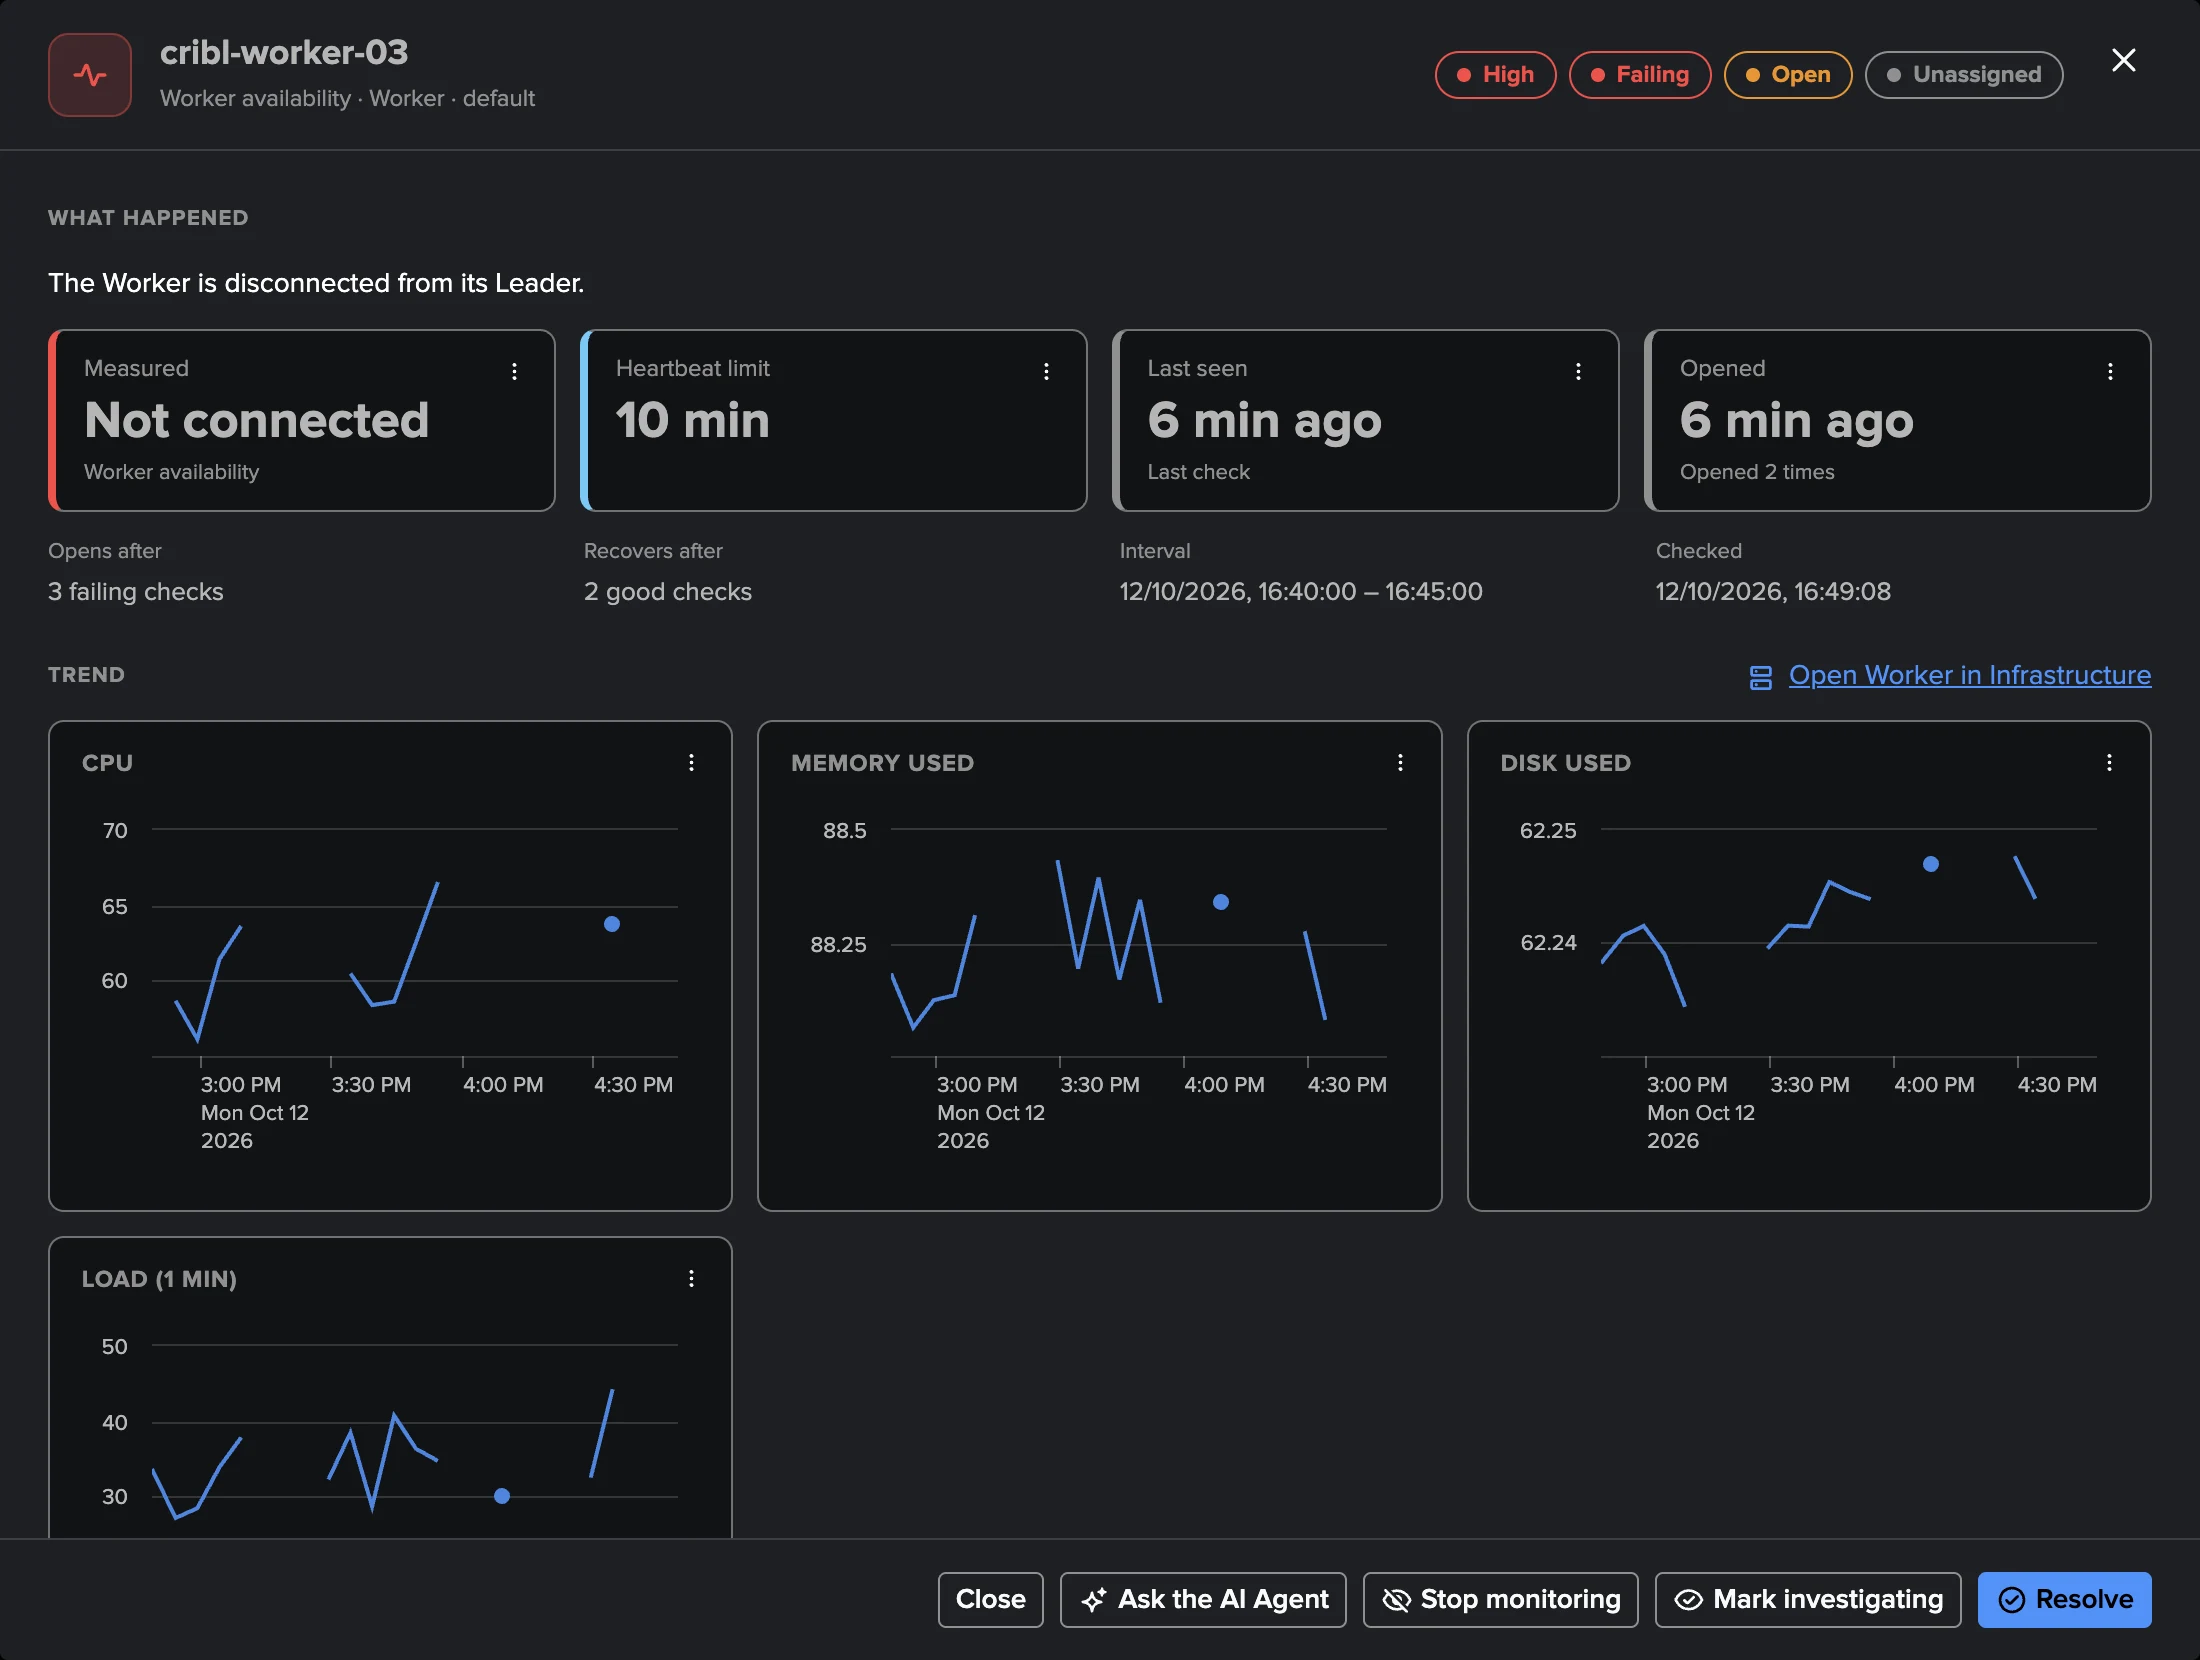
Workers, drift and machine resources
From the Leader, TrackMe knows every Worker and how it should look:
Worker availability (High) — the Leader lists the Worker as disconnected, or its heartbeat is older than 10 minutes.
Worker version drift (Low) — a connected Worker runs another Cribl version than the running Leader, typically during an upgrade that did not finish.
Worker configuration drift (Low) — a Worker does not run its Worker Group’s current configuration: a deploy that did not reach it.
Worker machine CPU and Worker machine disk (Medium, above 90 %); Worker machine memory is available but off by default, for the same reason as the Leader’s.
Process CPU (Medium) — a worker process above 90 % CPU, on average or at its peak.
Worker topology
Infrastructure → Worker topology draws the Worker Group and its Workers as a live map, each Worker with its KPI cards (CPU, machine memory used, disk) and its live status: a Worker with a finding turns orange or red, a healthy one green. Show worker processes adds each Worker’s processes under it. Live status refreshes the states and KPIs every minute; Export PNG saves the picture and Save to Topology Studio keeps it as a view that stays live. Process topology draws the worker processes alone.
Notifications
Every transition of a finding or a Finding group is written as an event in the tenant’s
notable index (sourcetype=trackme:cribl:finding and trackme:cribl:finding_group),
whatever the notification settings, for your Splunk alerts, Enterprise Security or SOAR.
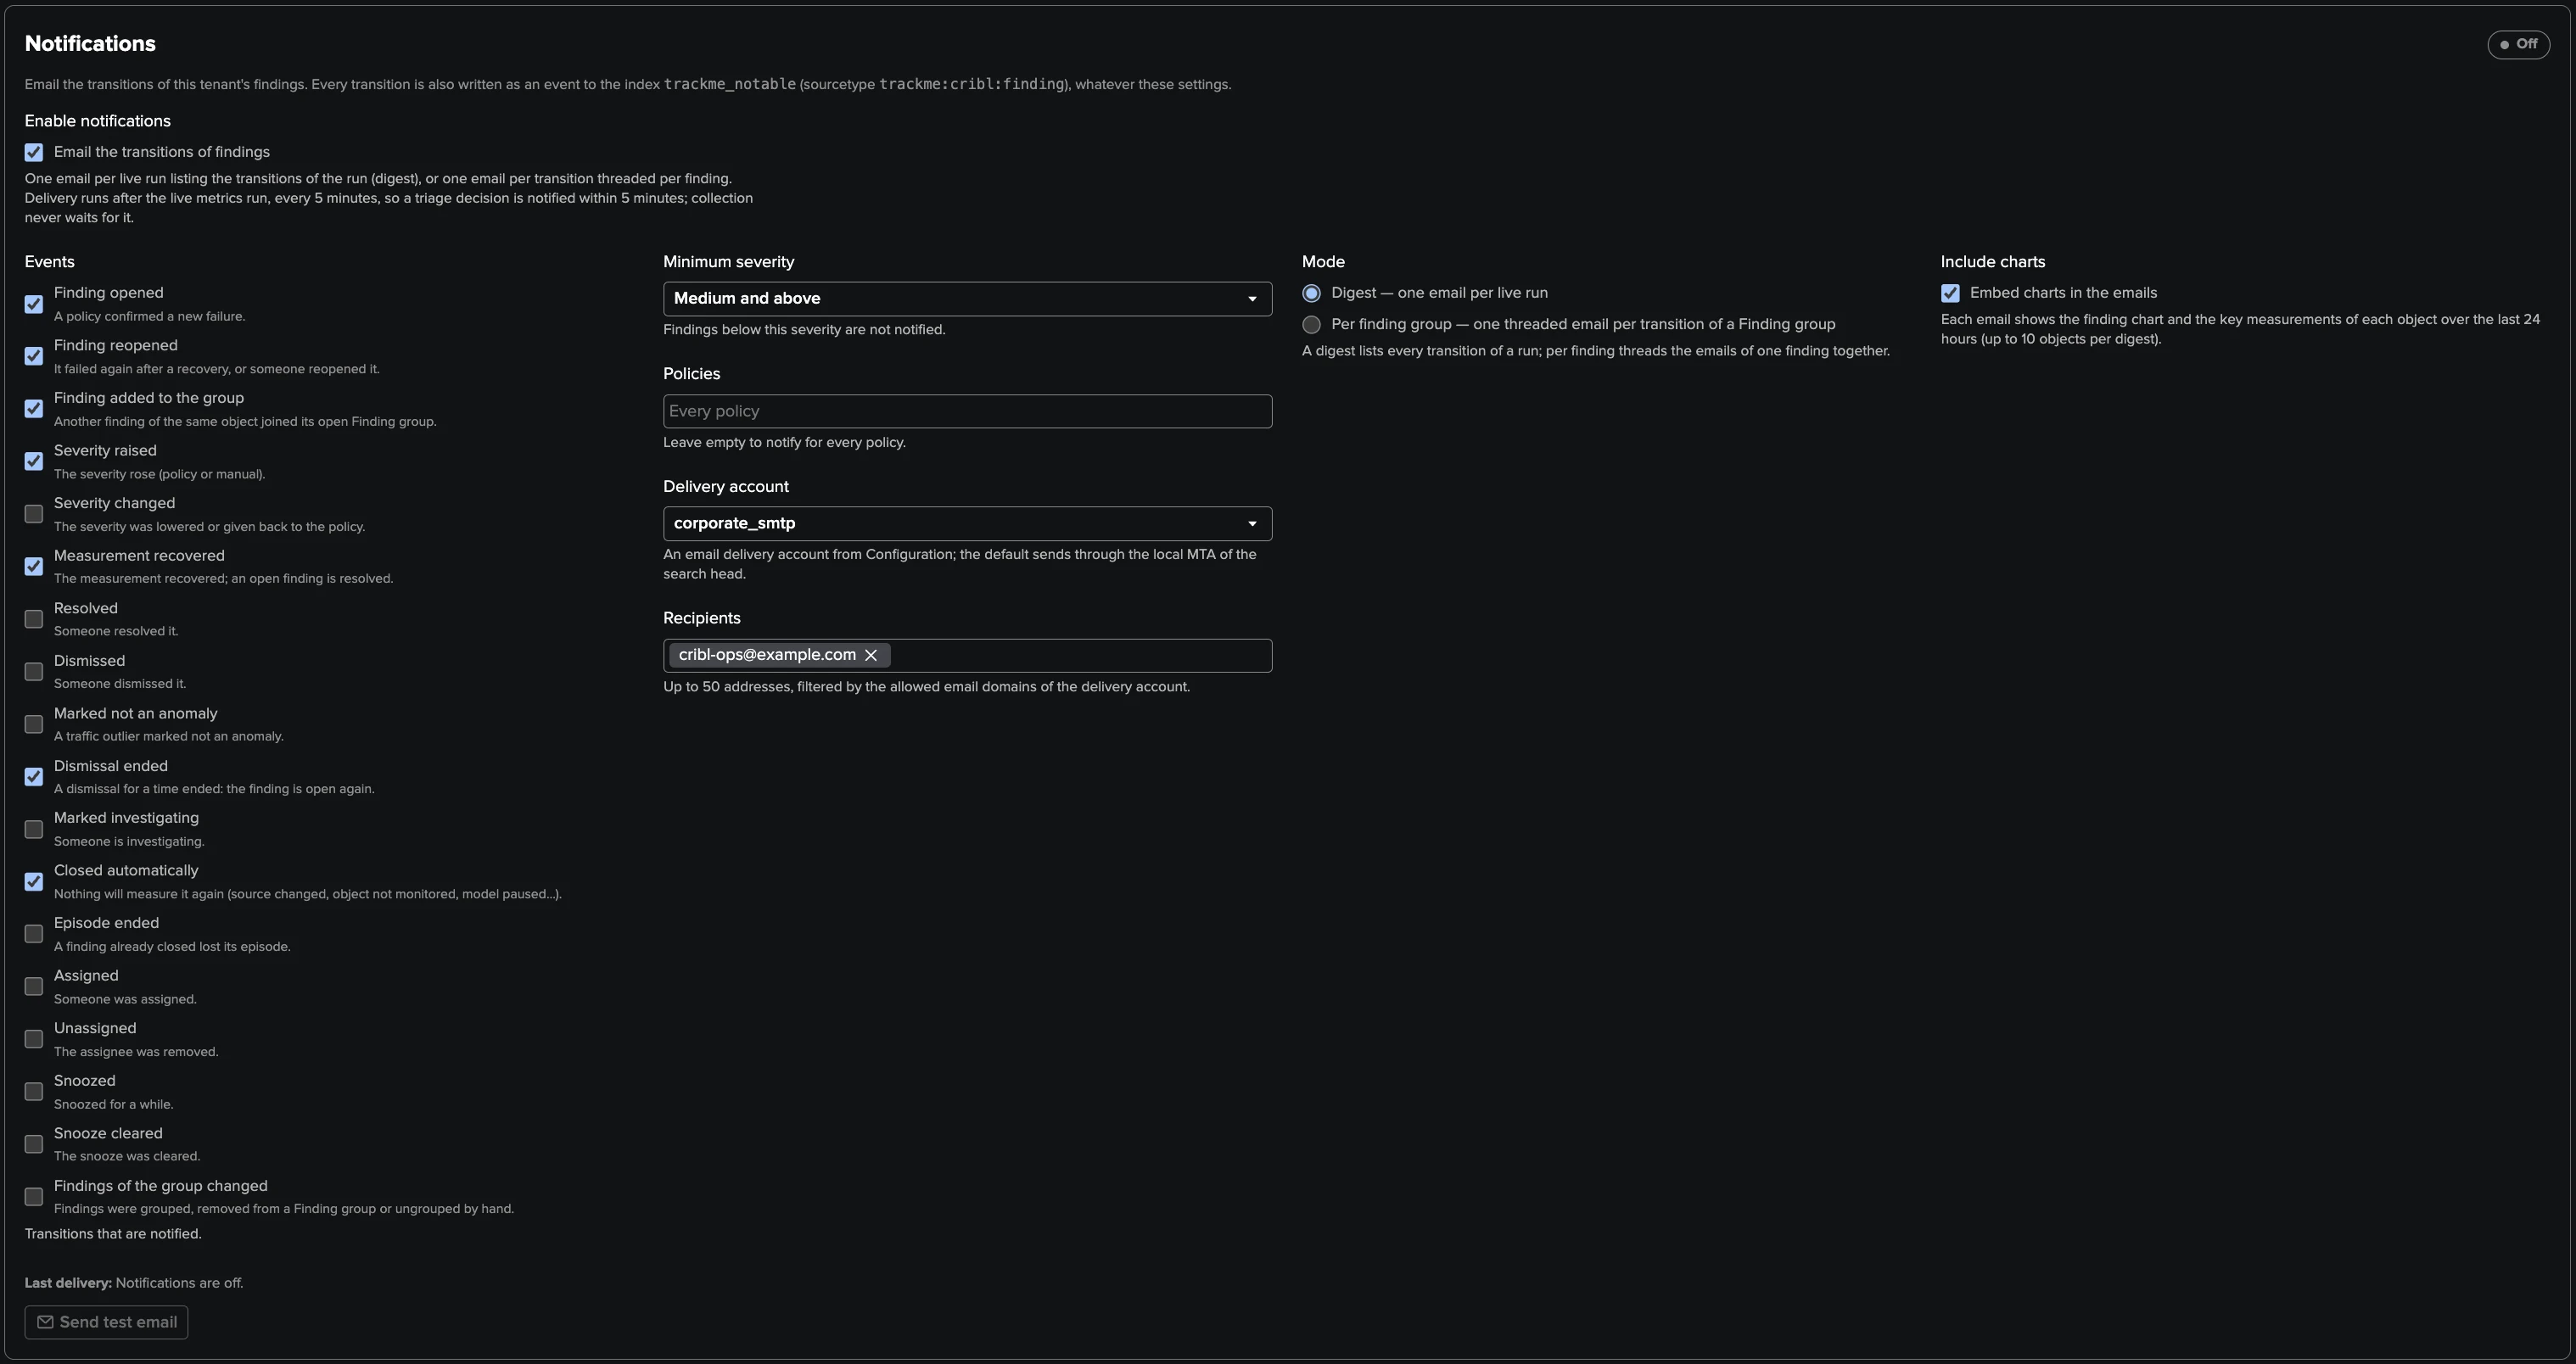
Email notifications are off by default. In Settings → Notifications, a TrackMe administrator of the tenant chooses the events (opened, reopened, added to the group, escalated, recovered, dismissal ended and closed by default), the minimum severity (Medium and above by default), the policies, the email delivery account and up to 50 recipients, and whether to send one digest per run or one threaded email per Finding group, with the charts of the objects inline. Send test email checks the saved settings. Emails leave after each live run and link straight to the finding.
The Cribl Stream AI Agent
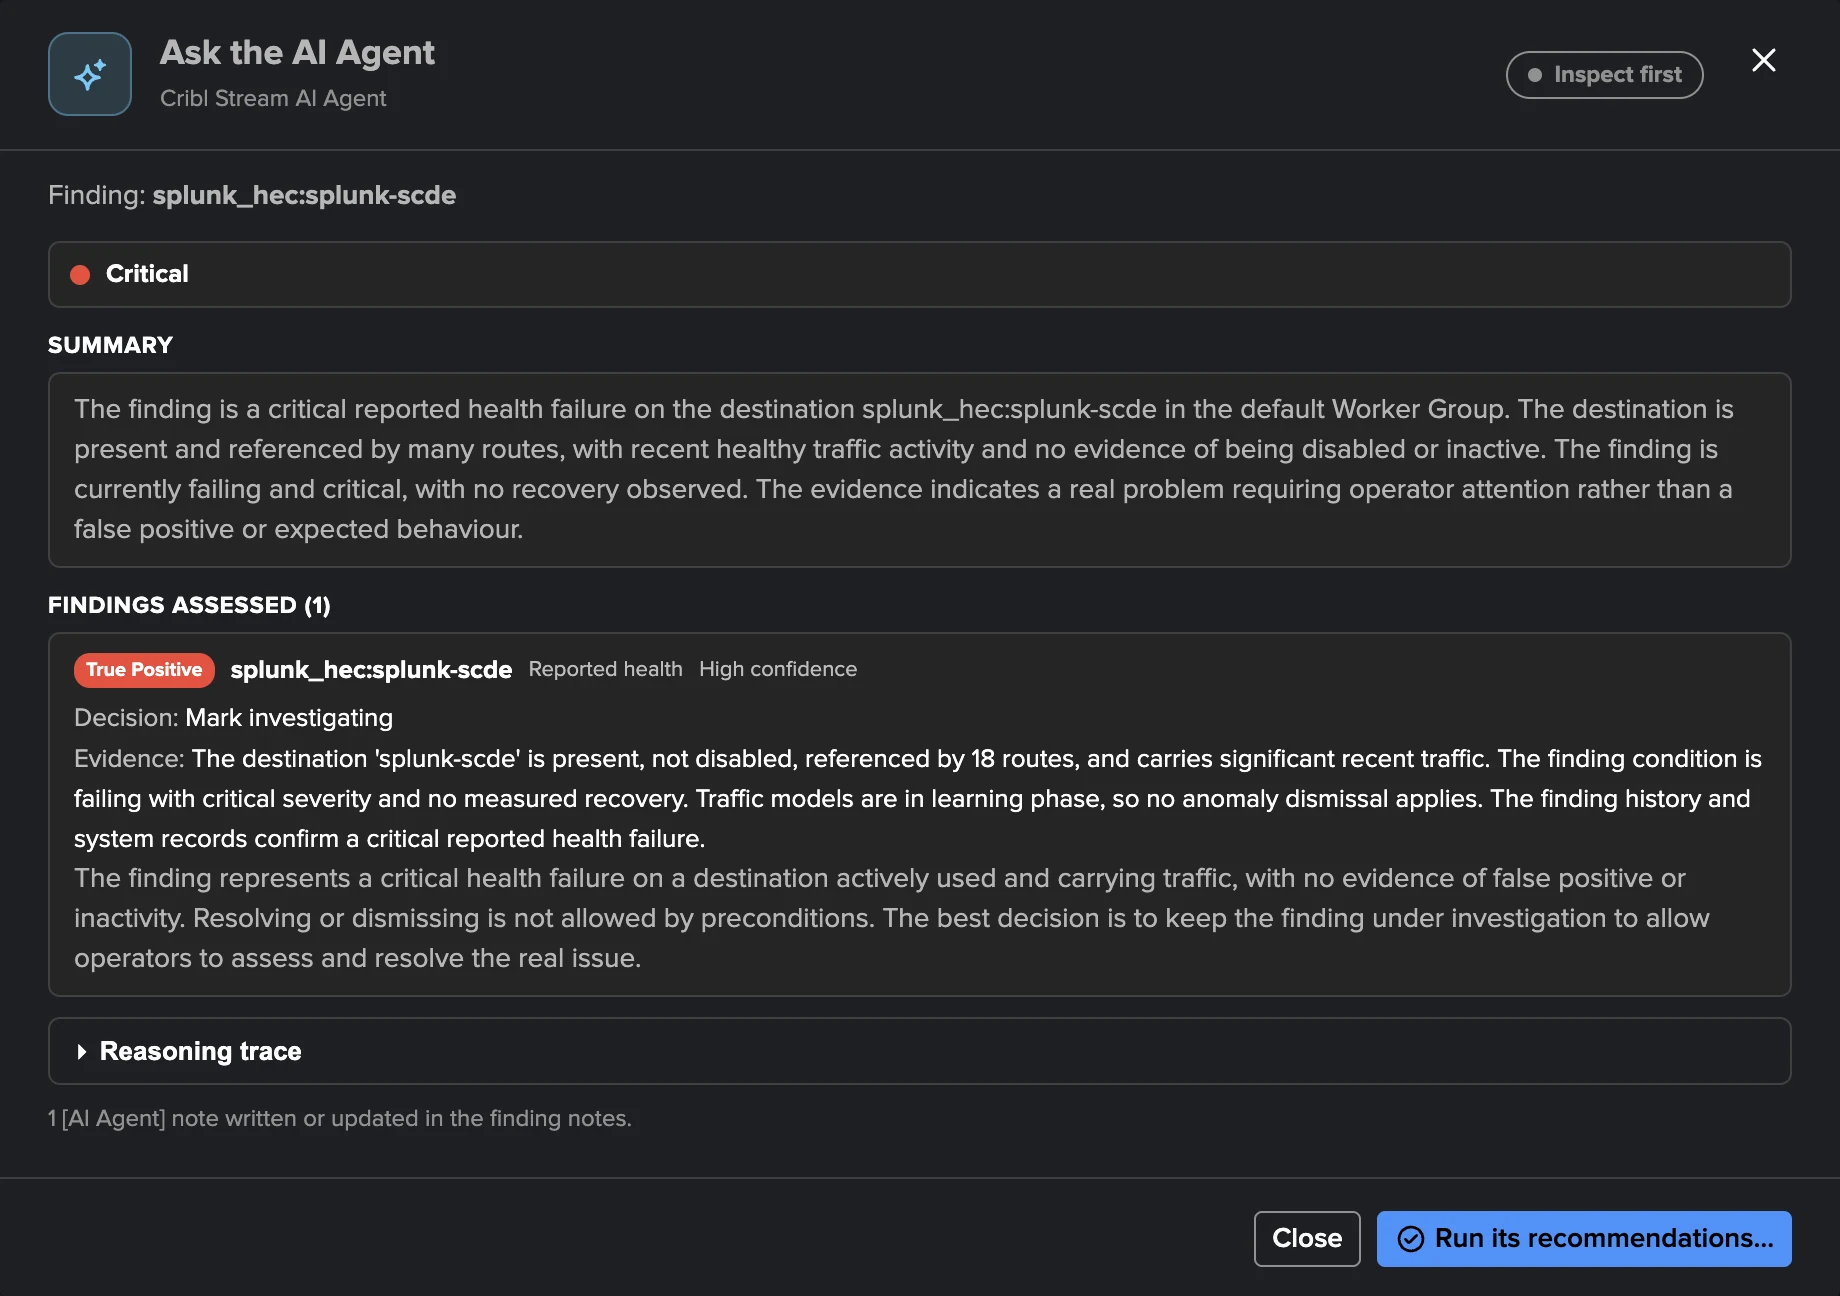
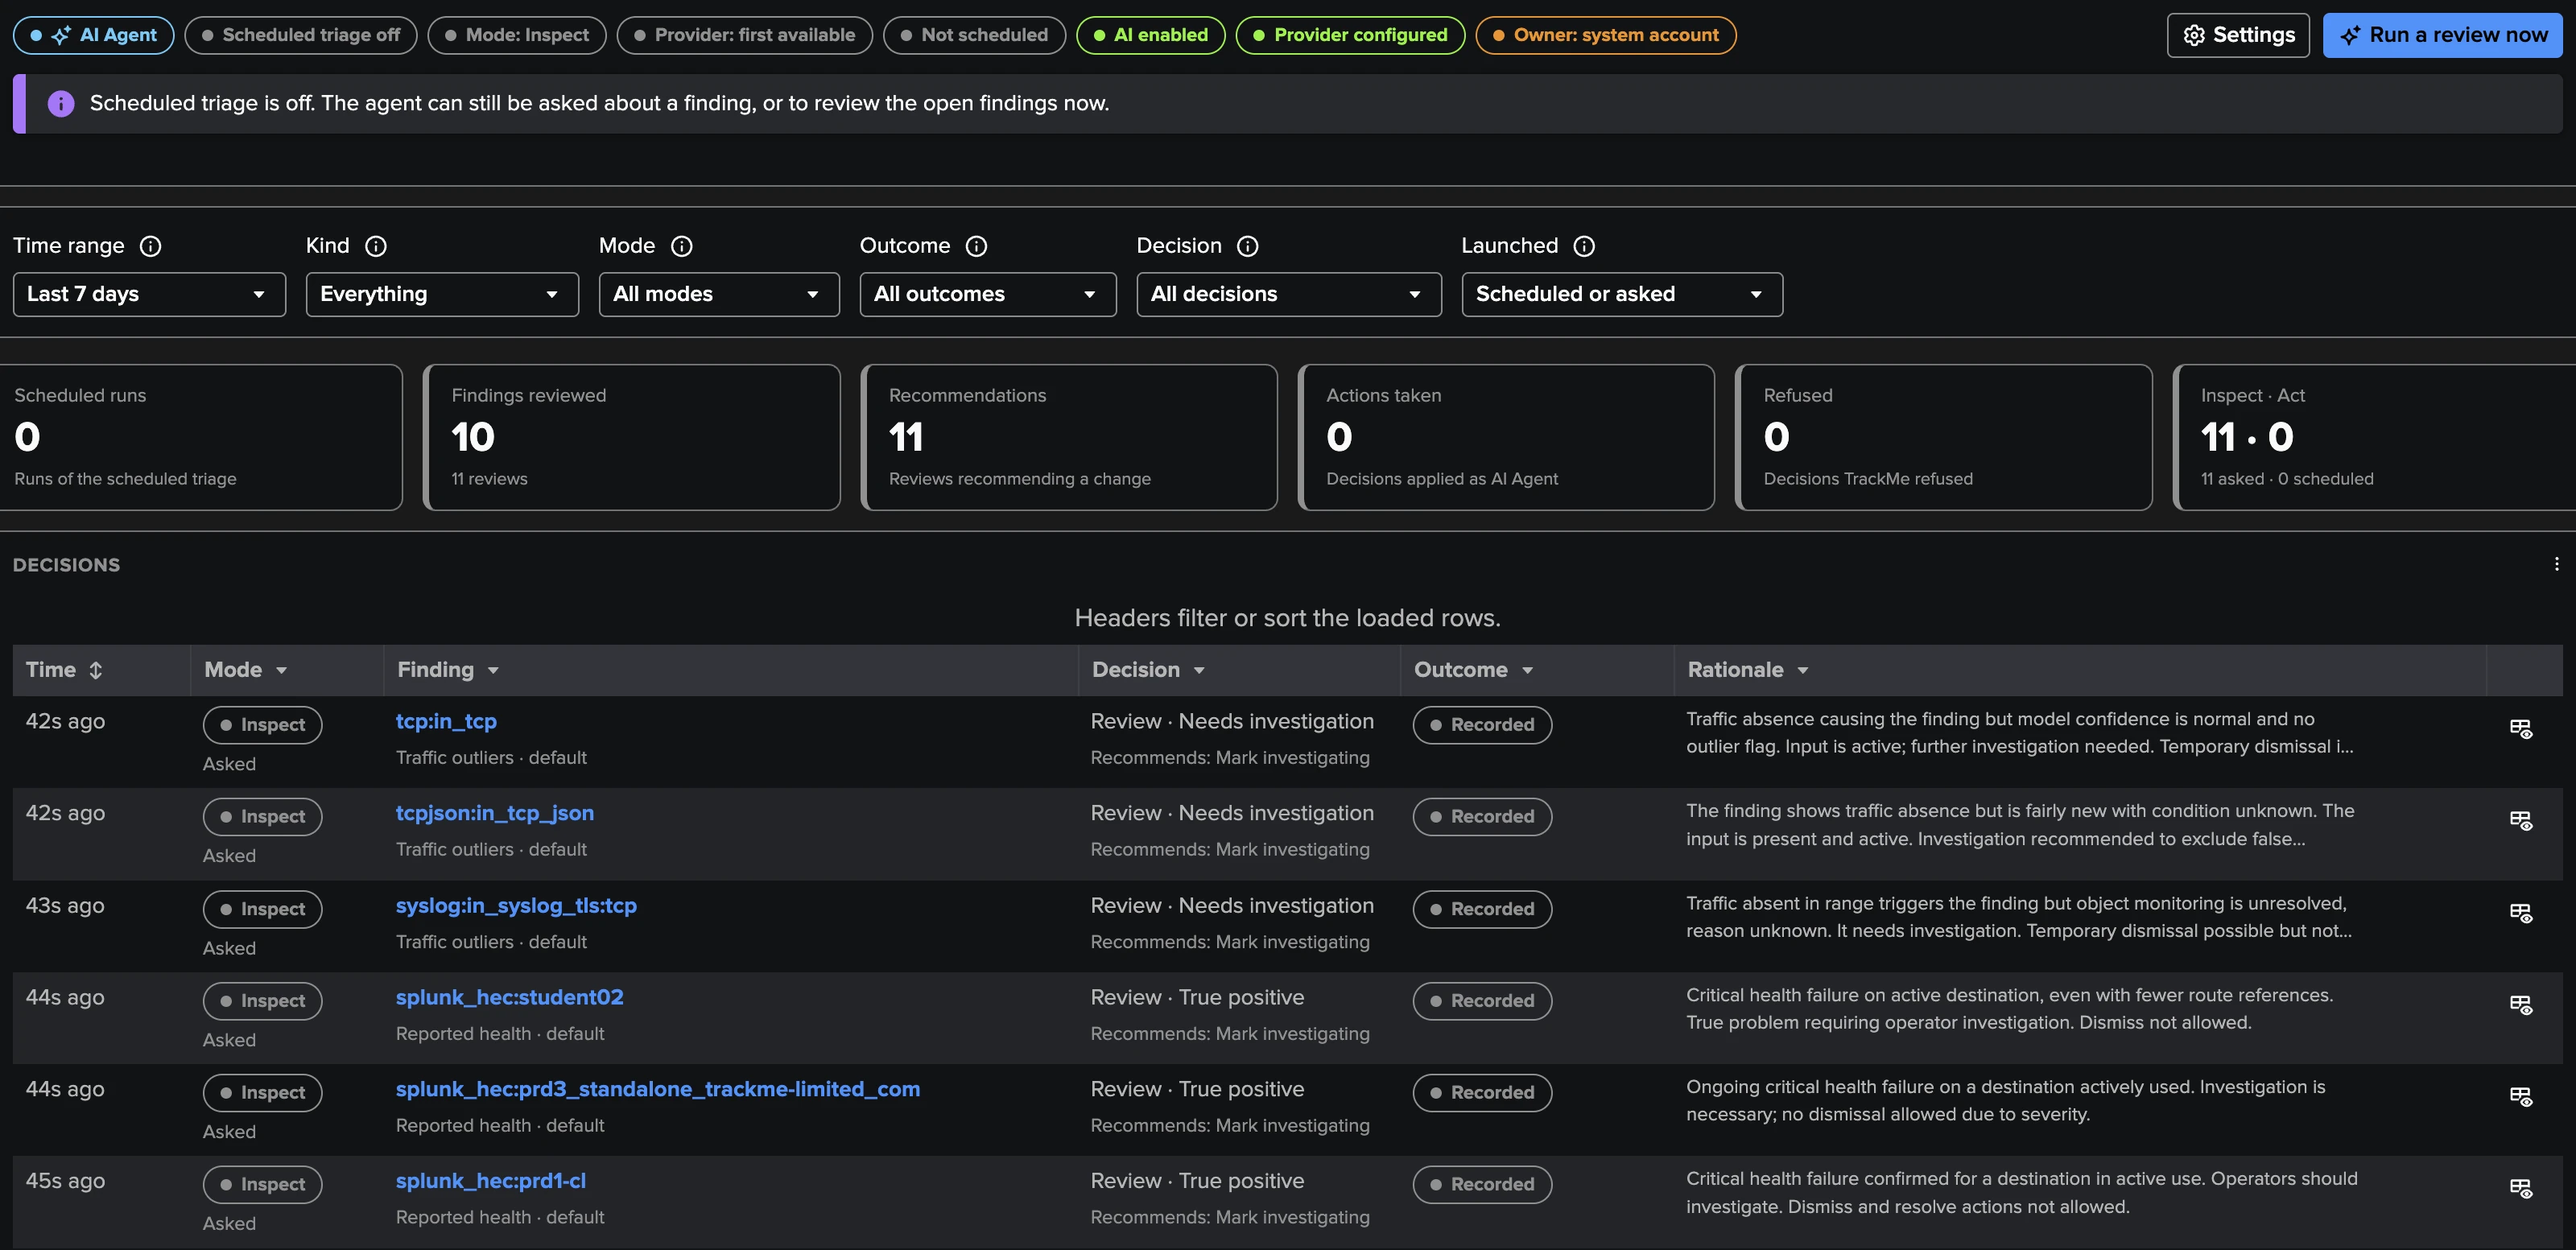
The Cribl Stream AI Agent reviews findings the way an operator would, from facts TrackMe checks rather than from guesses: when the object was first seen, whether it is disabled in Cribl or gone from the Inventory, which Routes reference it, its traffic and its traffic ML model. It assesses each finding (true positive, likely false positive, object not in use, expected behaviour, needs investigation), recommends a decision, and keeps one current [AI Agent] note on the finding.
Inspect only recommends: nothing changes but the note.
Act applies the recommendation, but only what the tenant allows: by default Mark investigating, Dismiss for a time (7 days at most) and Not an anomaly. Resolve and Stop monitoring are off by default and need a proof (for example the object is disabled in Cribl or gone from the Inventory). The agent never dismisses permanently, assigns, changes a severity, a policy or a model, and never forgets an object (it may recommend it to an administrator).
Ask the AI Agent from a finding, a Finding group, the row menu or the AI Agent tab: it inspects first, and you confirm before it acts. Asking and applying need a power or admin role of the tenant.
Scheduled triage is off by default. A TrackMe administrator of the tenant turns it on in Settings → AI Agent: hourly, up to 10 findings per run, a finding reviewed again after a day unless a new episode started. It needs the AI Assistant enabled, an AI provider and a tenant owner that is a Splunk administrator account. The agent is also listed in Manage AI Agents automation (AI Agents automation).
Custom instructions (Settings → AI Agent) are plain English the agent follows on every
run, asked or scheduled: for example, that the Destinations named test_* are test outputs
whose backpressure is expected. At most 4000 characters; they never widen what the agent may
do. Evaluate… tries an unsaved draft in inspect mode, on one finding or a short review,
optionally side by side with a run without instructions, and writes nothing.
The concepts shared with the other findings AI Agents are explained in Findings AI Agents, and the AI side of the agent in AI Agents for findings.
Topology Studio
Cribl objects are first-class citizens of Topology Studio:
From the workspace — the Flow topology of Routes & pipelines and the Worker and Process topologies of Infrastructure are saved as live views.
In the Studio — Add entities picks Sources, Destinations, Pipelines, Routes, Workers and worker processes of a Cribl Stream tenant; dynamic Cribl groups follow a selection (a type, Worker Groups, a name pattern, optionally only the objects with a finding) as objects come and go (Example — Cribl Logstream with a priority filter); five templates build a block in one step: Flow of a Worker Group, Worker fleet, Destinations wall, Problems wall and Deployment overview.
Live state — a Cribl node is red when one of its findings is critical, orange otherwise, blue when its findings are only snoozed, green when measured without a finding, and grey when not measured or not monitored. Nodes carry their KPIs and 24-hour sparklines.
Alerts and AI — Topology Alerts work on Cribl nodes, and Build with AI and the Topology Studio assistant name your Cribl objects.
AI Assistant and Concierge
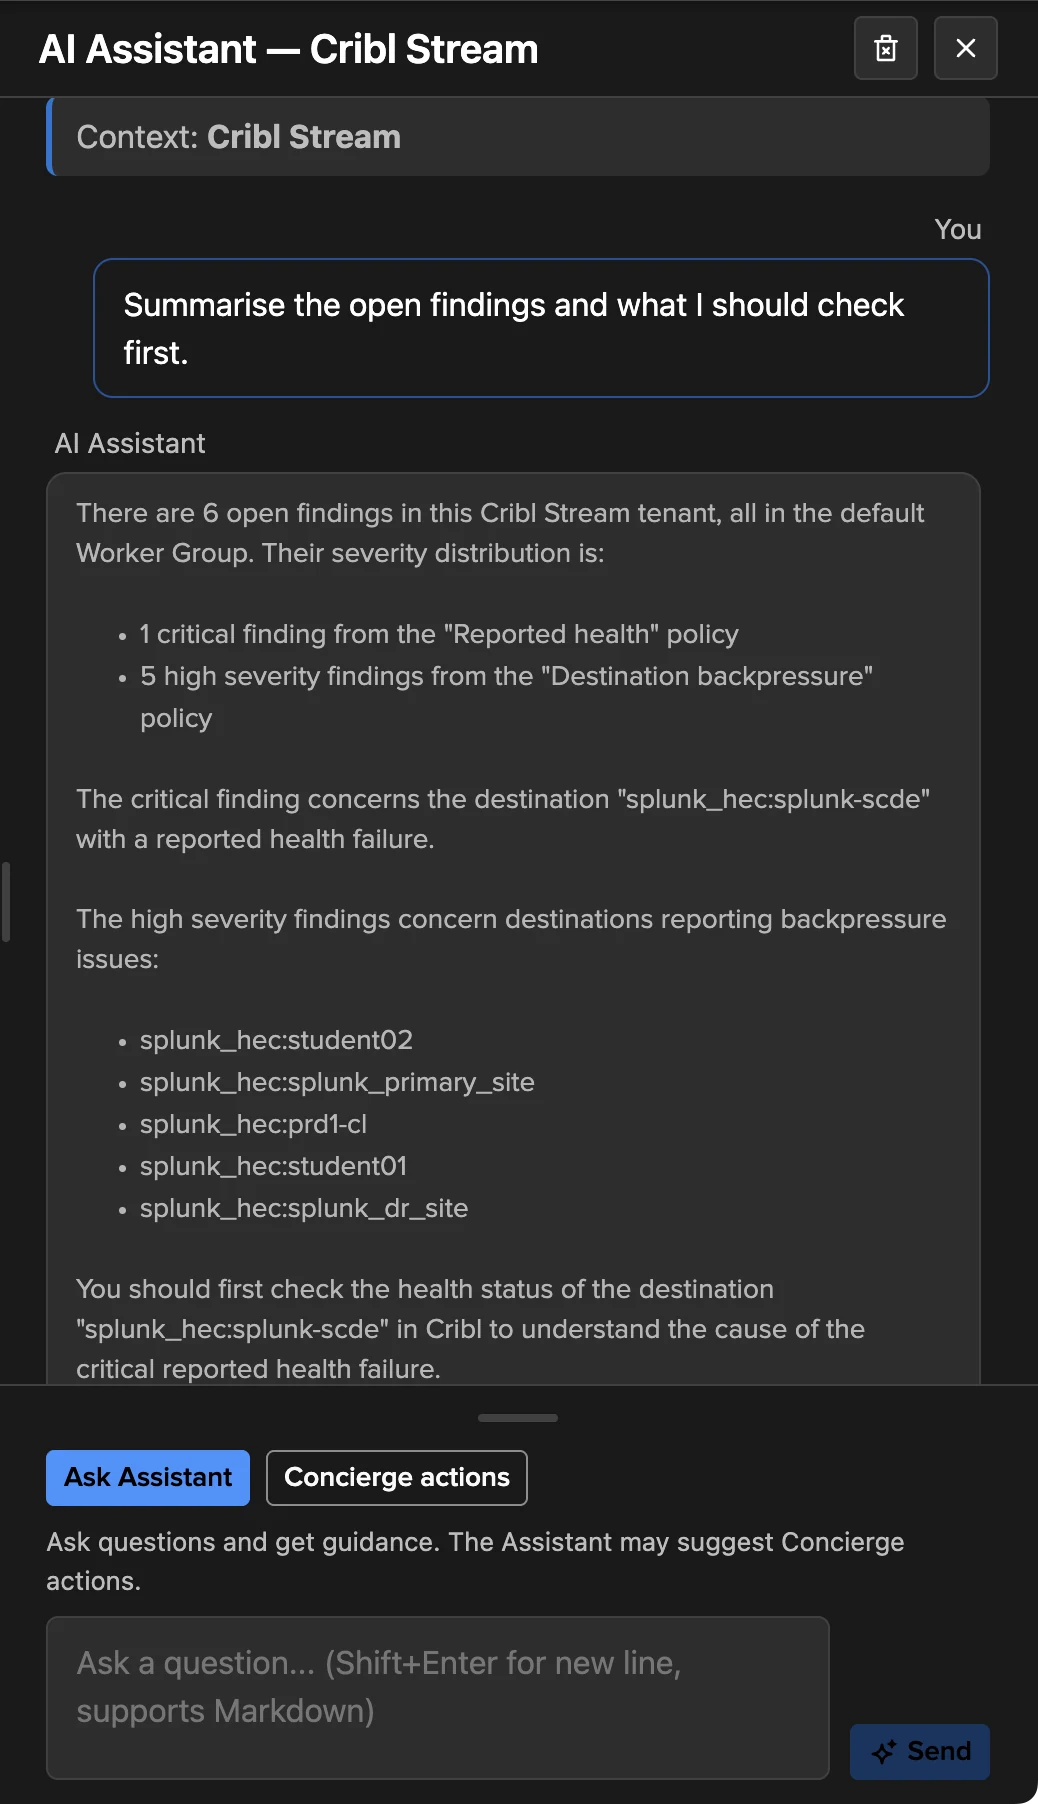
The AI Assistant of a Cribl Stream tenant (AI Assistant — Cribl Stream on the workspace) is grounded in the tenant: its findings, traffic ML models, collection health, monitoring state and Leader load. Ask it why a finding is open, what to check in Cribl, or when a model will be ready.
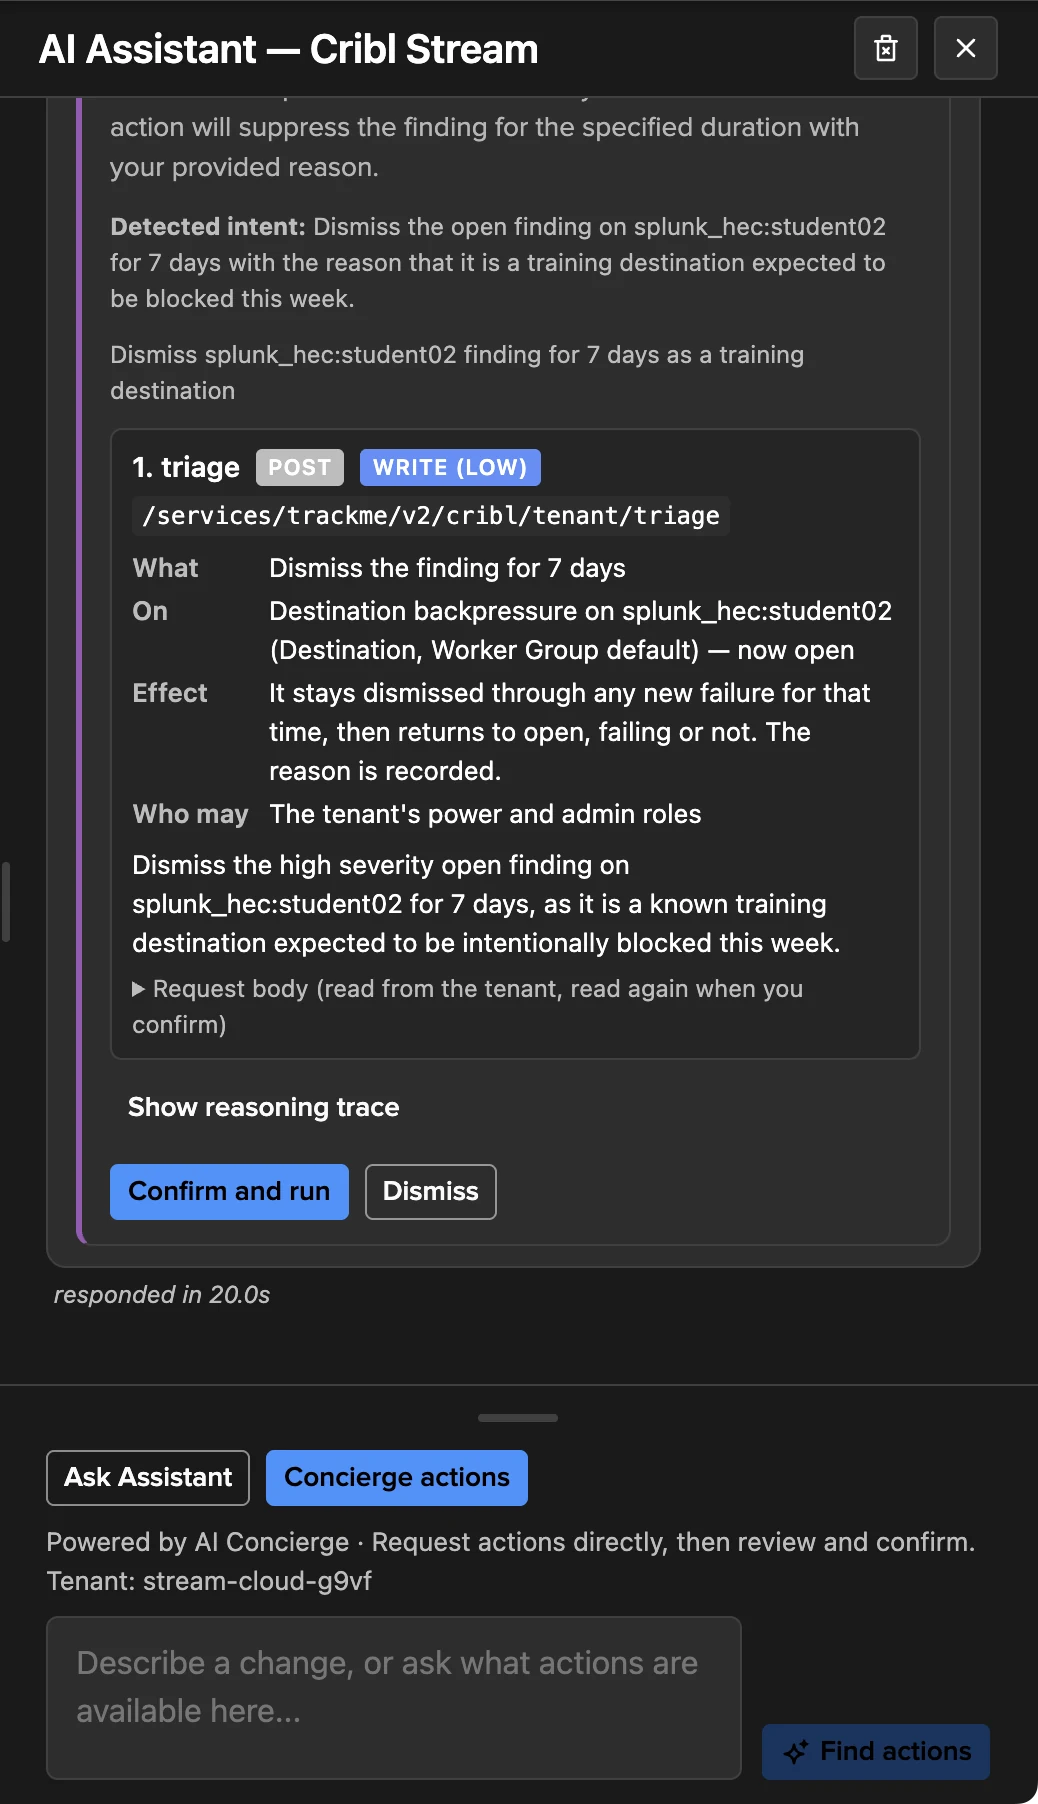
When you ask for a change it can make, it proposes an AI Concierge consent card that you confirm before anything runs: a decision on a finding or a Finding group, Not an anomaly, monitoring on or off for named objects, Stop monitoring, running a collection job, or relearning one model or all of them. Each action keeps the role it requires; policies, exclusion rules, tuning and settings stay in the workspace.
Collection health and the Configuration Guardian
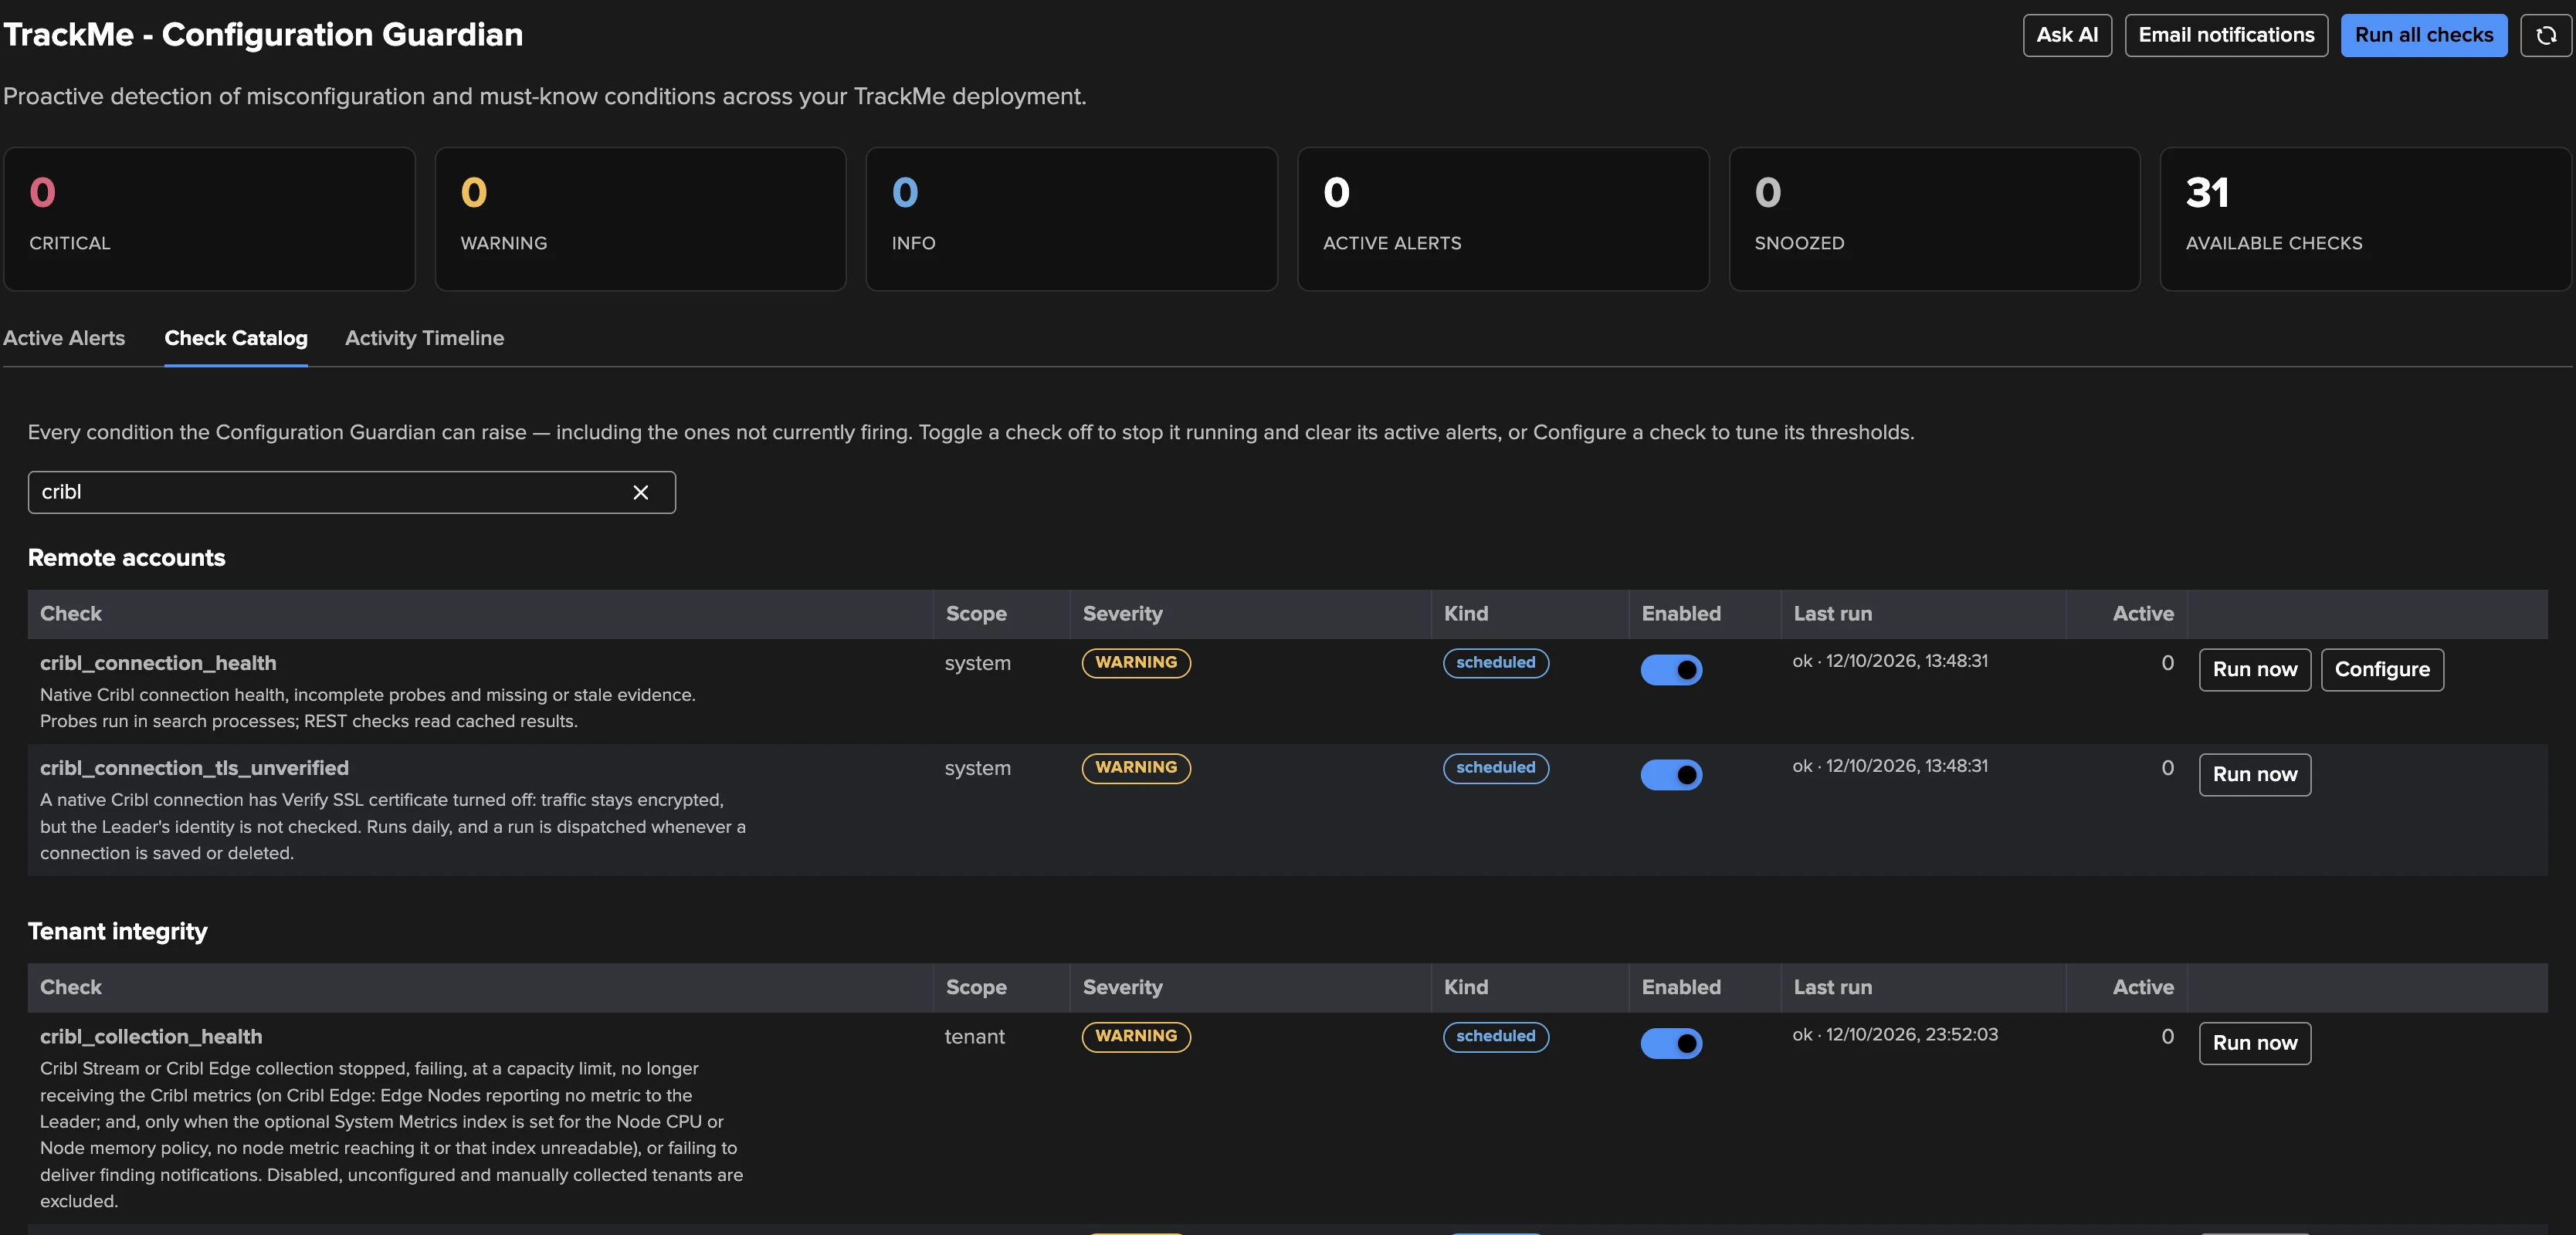
Collection health keeps you from trusting a silent tenant. Besides the tab, the
Configuration Guardian check cribl_collection_health raises a warning when a job is not
running or keeps failing, when metrics stop arriving or a Worker Group sends none, when the
inventory cycle or the worker sampling slows down under the Leader budget, when many objects
stop together, or when notification emails fail. Each problem carries its next step. A
disabled tenant or a tenant on manual collection reports nothing. The Guardian also checks your
Cribl connections (cribl_connection_health, cribl_connection_tls_unverified). Every
problem code is listed in Cribl Stream reference.
See also
Cribl Stream reference — the policy catalogue, schedules, settings, events, RBAC, Guardian checks, REST endpoints, capacity and troubleshooting.
Cribl Stream — the Cribl Stream hands-on walkthrough.
Cribl connections — Cribl connections.
Findings, Finding groups and findings actions — findings-based monitoring, shared with User Activity Monitoring and Cribl Edge.
Cribl Stream & Cribl Edge — the Cribl API add-on and Flex Objects use cases.
Next: the reference
Continue with Cribl Stream reference for every policy, setting, schedule and limit.