Splunk UF Fleet
The Splunk UF Fleet tenant follows the forwarding agents of one Splunk deployment and the Deployment Servers that manage them. It answers the questions a Splunk administrator asks about a fleet of universal forwarders: how many agents do I have, on which versions, platforms and types? which are connected, disconnected or dormant, and since when? which agents that must stay connected are not? which are blocked, throttled, failing their destinations, restarting in a loop, not phoning home or failing their app deployments? and per Deployment Server: its clients, its phonehome pace against its usual, its deployment failures, the restarts it asked for, the requests it refused and how fast it answers? The answers are findings, raised by built-in policies, with the same triage, Finding groups, notifications, assignment and findings actions as the other dedicated tenants, and a findings AI Agent of its own, the Splunk UF Fleet AI Agent.
A Splunk UF Fleet tenant is a dedicated tenant type: it has no entities and no state colour, and one tenant follows the fleet of one Splunk deployment. It reads what Splunk already writes: the receivers’ connection lines, the agents’ own internal logs when they forward them (the default of a universal forwarder), and the Deployment Server indexes. TrackMe never polls an agent, never calls an agent’s REST API and never installs anything on it: the tenant only reads.
Connected comes from the data path itself. An agent is connected when a Splunk receiver saw a connection from it within the tenant’s connected window (15 minutes by default). The receivers describe the whole fleet, whatever its size, with no heartbeat to deploy.
Mass events are one finding. When many agents disconnect together — a network cut, a receiver tier down, a bad outputs push — one Mass disconnect finding on the fleet or on the group says it; the agents’ own disconnection findings are held, never opened one by one.
The Splunk UF Fleet tenant is generally available since TrackMe 2.4.22. The receiving side of the same deployment (the intermediate forwarders, the indexers and their pools) has its own tenant type, Splunk S2S.
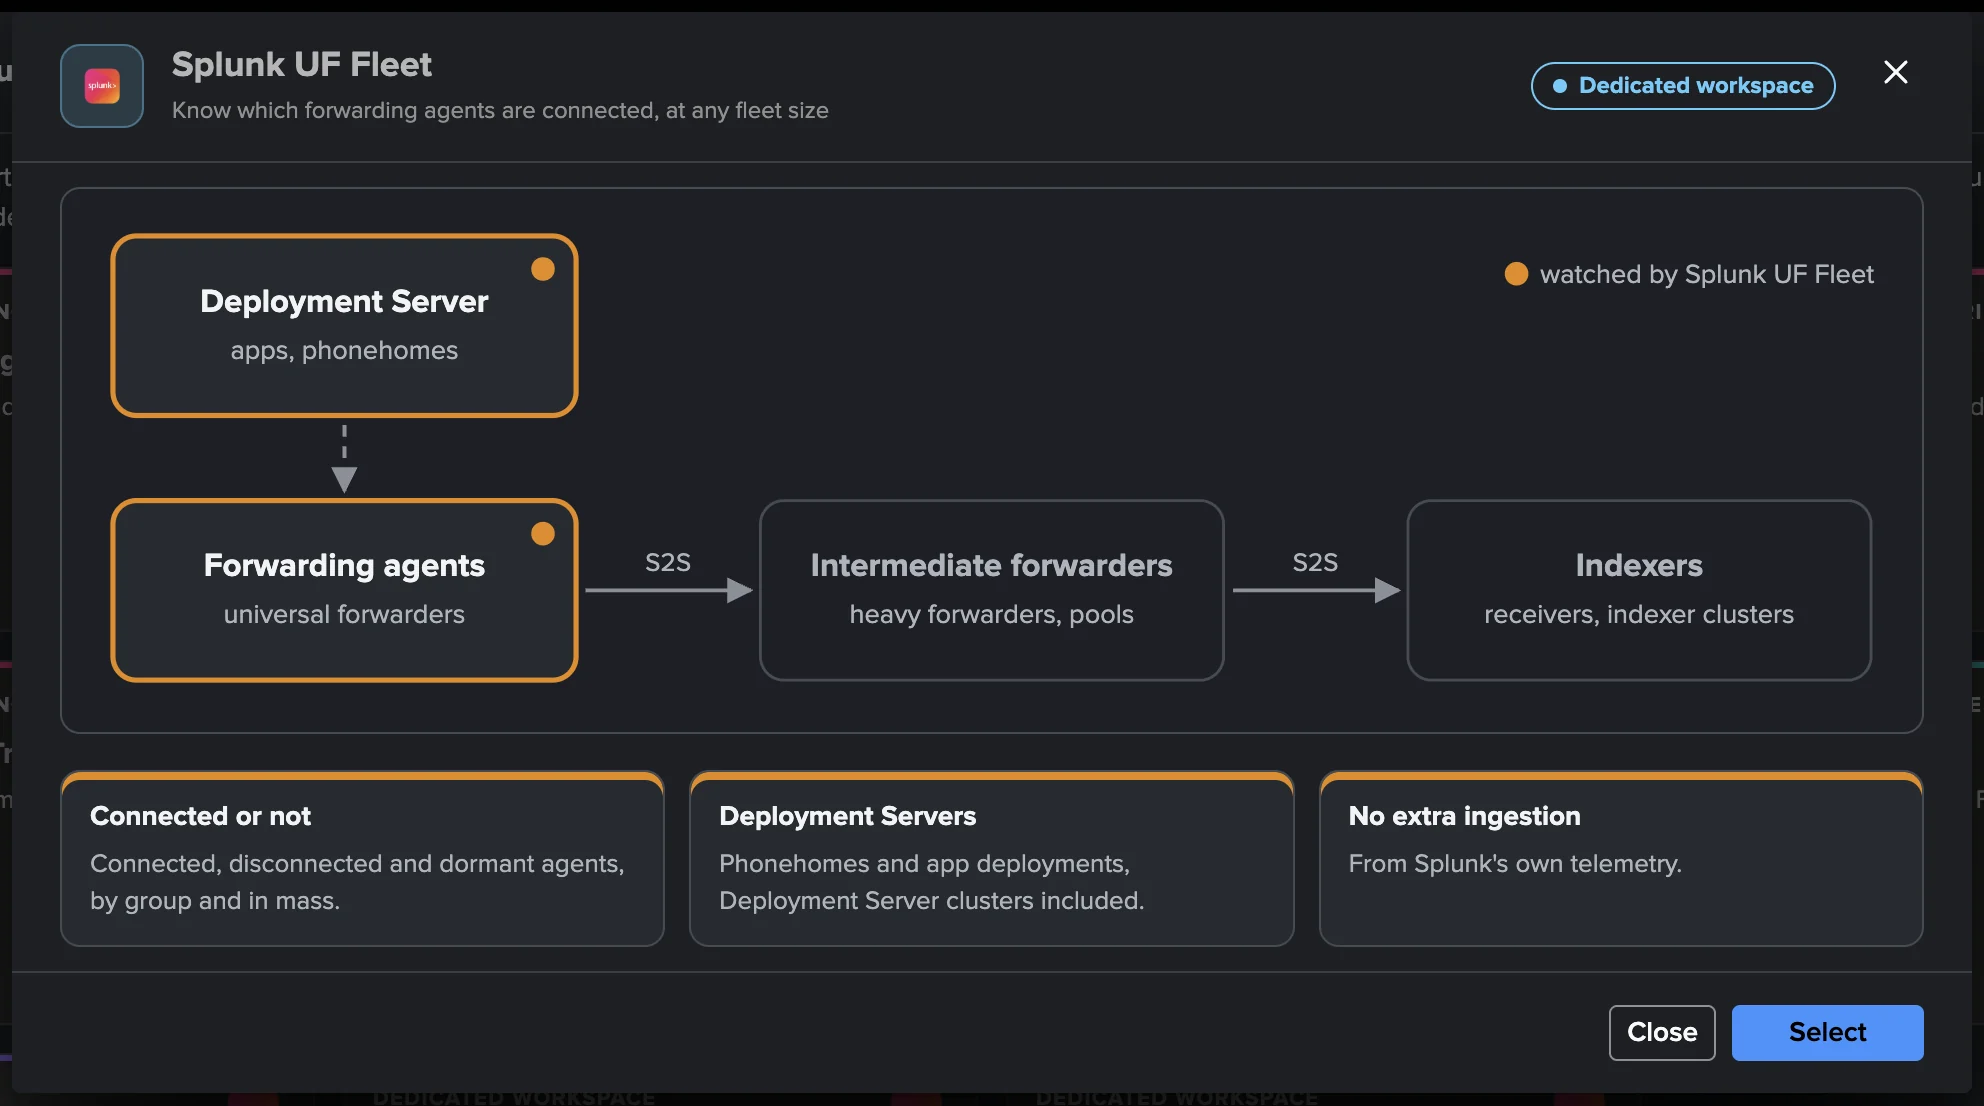
For a guided tour on a live fleet, see the hands-on walkthrough Splunk UF Fleet. Every policy, setting, job and command is described in the Splunk UF Fleet reference.
What it monitors
Object |
What TrackMe watches |
|---|---|
Agents |
Every forwarding agent: its connection (connected, disconnected, dormant, removal candidate), whether it is one of the expected agents that must stay connected, its own troubles from its logs (output blocked, destinations failing, throttled, ingestion latency, input errors, restart loop), its identity (one GUID on several hosts, cloned images), its version (unsupported, newer than its receivers), and its Deployment Server client (not phoning home, handshake failing, app deployment failed). |
Fleet and groups |
The fleet as a whole and every group you define (by Deployment Server, server class, lookup table, enrichment value, host-name pattern or output group): mass disconnect, coverage against a minimum or the learned daily peak, version drift, and cloned images deployed without clearing their identity. |
Deployment Servers |
Every Deployment Server serving the fleet: silent, phonehome drop against its usual for the hour, deployment failures, restart storms (clients restarted again and again), the errors of its latest configuration load, requests rejected and response slow. |
Destinations |
A receiver that many agents fail to reach without a break: one finding on the receiver listing the agents, never one per agent. |
How it works
An agent is a leaf forwarder. A sender seen on a receiver that is not itself a receiver, an intermediate forwarder or a Deployment Server. By default only universal forwarders are agents: a heavy forwarder cannot be told apart from a search head or a cluster manager without reading each host, so full instances are counted apart (“Left out: full instances”); Settings → Source can count them as agents.
Identity. The GUID first (the receivers’ guid, the Deployment Server’s clientId), the
host name for display and as the key of an agent without a GUID. The receivers’ connection lines
(24 hours), the Deployment Server’s phonehomes (a day) and its client records (30 days) are merged:
an agent known only to a Deployment Server is listed too.
Agent states.
State |
Meaning |
|---|---|
Connected |
A receiver saw a connection line from it within the connected window (15 minutes by default, 5 to 60). |
Connected (heartbeat) |
No receiver saw it, but its own internal logs arrive within the window: the agent sends behind a non-Splunk hop or over HTTP. Counted connected, shown with a cue. A heartbeat never creates an agent, and never keeps an older identity of a host connected: when the receivers see its host name under another GUID, the logs are that instance’s (see Forgotten). |
Disconnected |
Neither, for less than the dormancy delay. |
Dormant |
No connection line for 7 days (1 to 90): it leaves every fleet count, and its disconnection finding closes as dormant, never as a recovery. |
Removal candidate |
No connection line for 30 days (1 to 365), counted from its last connection: opens Decommission candidate. |
Forgotten |
An operator Forgot it, or TrackMe did: a host rebuilt or reinstalled under its name comes back with a new GUID, and once that new identity is connected, its older identity is forgotten. Out of every count at once, and listed in the Agents tab only with Show forgotten; it comes back connected if it connects again. |
Built for any fleet size. Every fleet-wide read is an aggregation over indexed terms or metric
dimensions (tstats with TERM() and PREFIX(), mstats), never a search per agent. The
agent directory is paged and written only when an agent’s state or identity changes, and mass
events are one cohort finding. No per-agent history is written: an agent’s chart reads Splunk’s own
lines on demand.
Job (Collection health label) |
What it does |
|---|---|
Inventory (every 10 minutes; the directory is rebuilt about hourly, always on a manual run) |
Builds the agent directory from the three identity sources, the Deployment Servers and their clients, each Deployment Server’s hourly phonehome baseline (the last 7 complete days), the server class and output group members of the groups, the enrichment lookups, and a probe that chooses the telemetry form. |
Live (every 5 minutes) |
The connected set over the connected window, heartbeats, the agents’ own troubles, the Deployment Server reads (activity, late and absent clients, deployment failures, the last 15 minutes’ phonehomes, CPU and memory, the access log), the groups and their counts; publishes the fleet summary, writes the series, then evaluates every policy. |
Policies (on demand) |
Evaluates the policies again on the latest live publication. |
A Splunk UF Fleet tenant learns no traffic model: its baselines are plain statistics, the daily peak of connected agents and the Deployment Servers’ phonehomes per hour of the day.
Before you start
A licence. A valid Enterprise, Unlimited, Unlimited trial or Developer licence. The Splunk UF Fleet tenant is not available with the Foundation edition or the Foundation trial.
A source. The search tier that sees the receivers’ _internal (and _metrics /
_introspection when used): local, or a TrackMe remote account (Remote Splunk deployments)
to another deployment. The three index names are configurable.
The Deployment Server indexes (Splunk 9.2 and later on the Deployment Server):
_dsphonehome, _dsclient and _dsappevent, searched on the Deployment Server source
(local by default: a full instance forwards them to the indexers by default). On Splunk Cloud
those indexes stay on the Deployment Server: point the Deployment Server source at a remote account
on the Deployment Server itself.
Optionally, a Deployment Server API account per Deployment Server. A TrackMe remote account on
each Deployment Server gives the exact members of each server class group (its client
listing). Its user needs only list_deployment_server and rest_properties_get, never an
admin role. Without one, a server class group counts the clients with an app of the class
deployed in the last 60 days; every other view and policy is the same. In a Deployment Server
cluster one member’s account lists every client.
Least privilege. The tenant’s scheduled searches run as the tenant owner: every remote account the tenant reads (the source, the Deployment Server source, the API accounts, the lookup tables) must be usable by the owner. The wizard and the Settings check this before saving and name the fix (add one of the owner’s roles to the account in Configuration → Remote accounts, or choose another owner).
A tenant owner: nobody, or an account (typically a least-privilege service account) holding
the capabilities the wizard lists. The scheduled triage of the Splunk UF Fleet AI Agent needs an
owner that is not nobody.
The agents’ own logs (optional). Health, output pauses, throttle, input errors, restarts and
handshake retries come from each agent’s own splunkd.log. A universal forwarder forwards its
_internal by default; an agent whose internal logs are filtered out stays connected (from the
receivers’ lines) but has none of these signals.
Creating the tenant
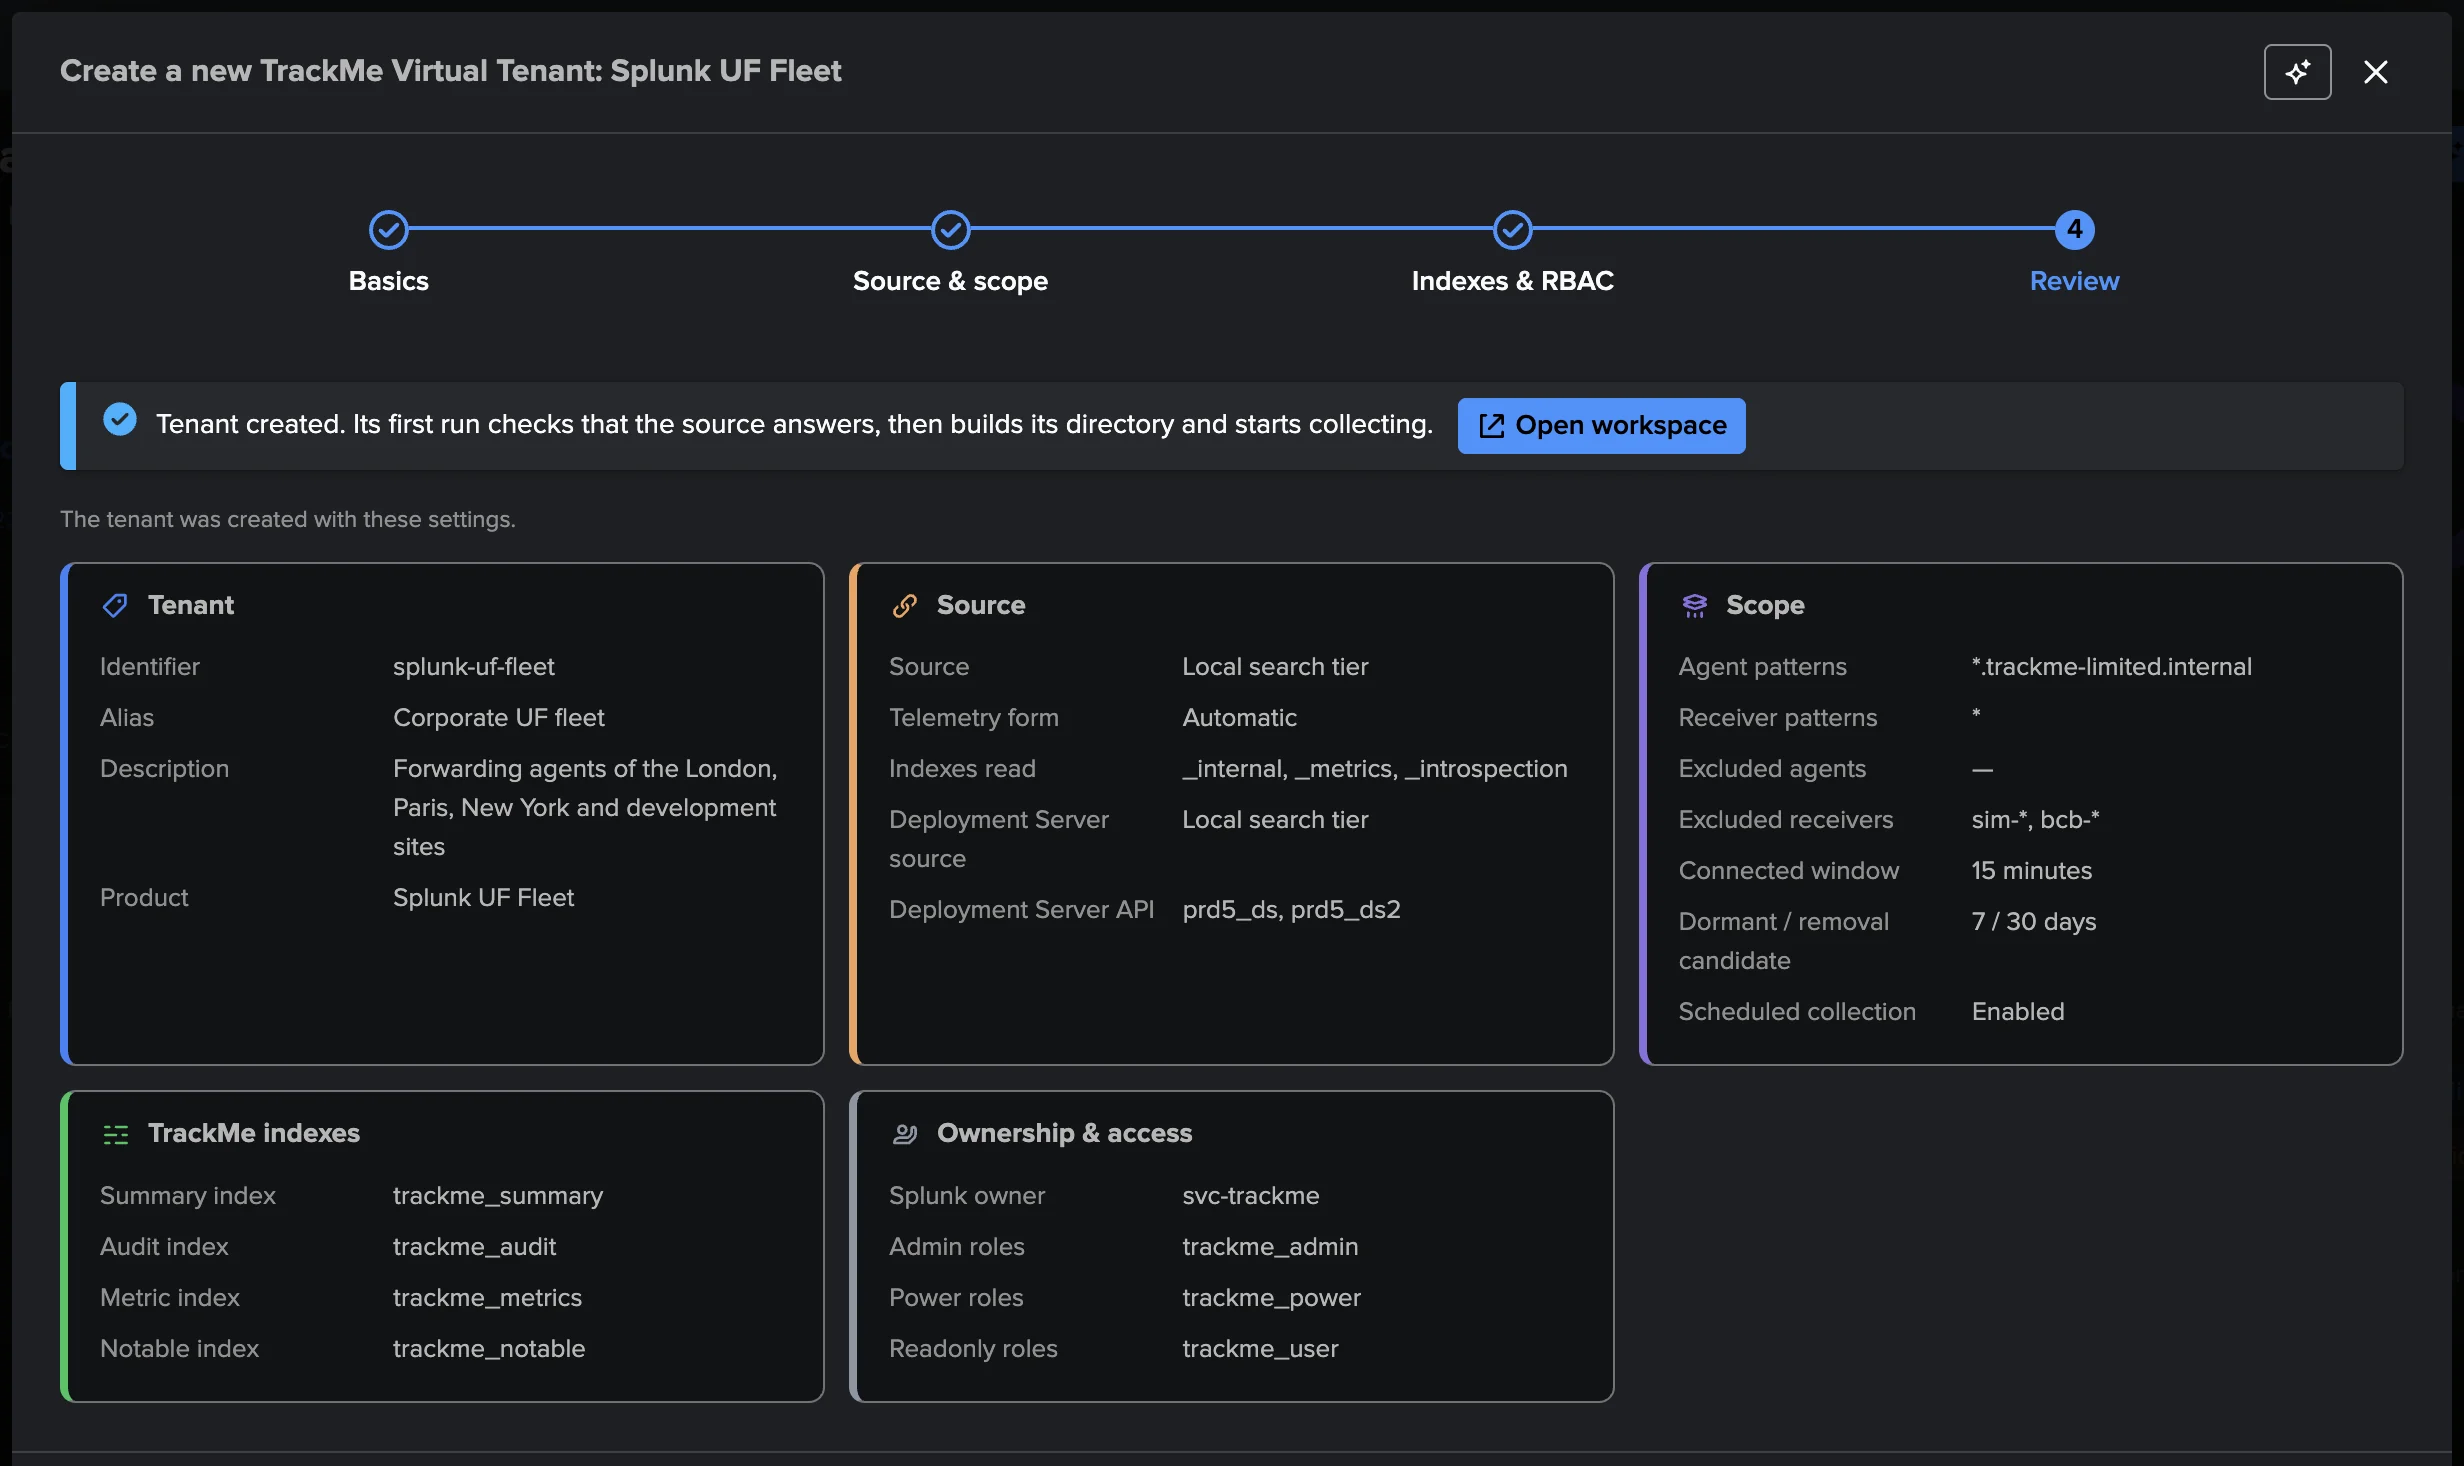
From the Virtual Tenants page, open Actions → Create a tracking tenant and choose the Splunk UF Fleet card (“Know which forwarding agents are connected, at any fleet size”). What it does opens the dialog shown at the top of this page.
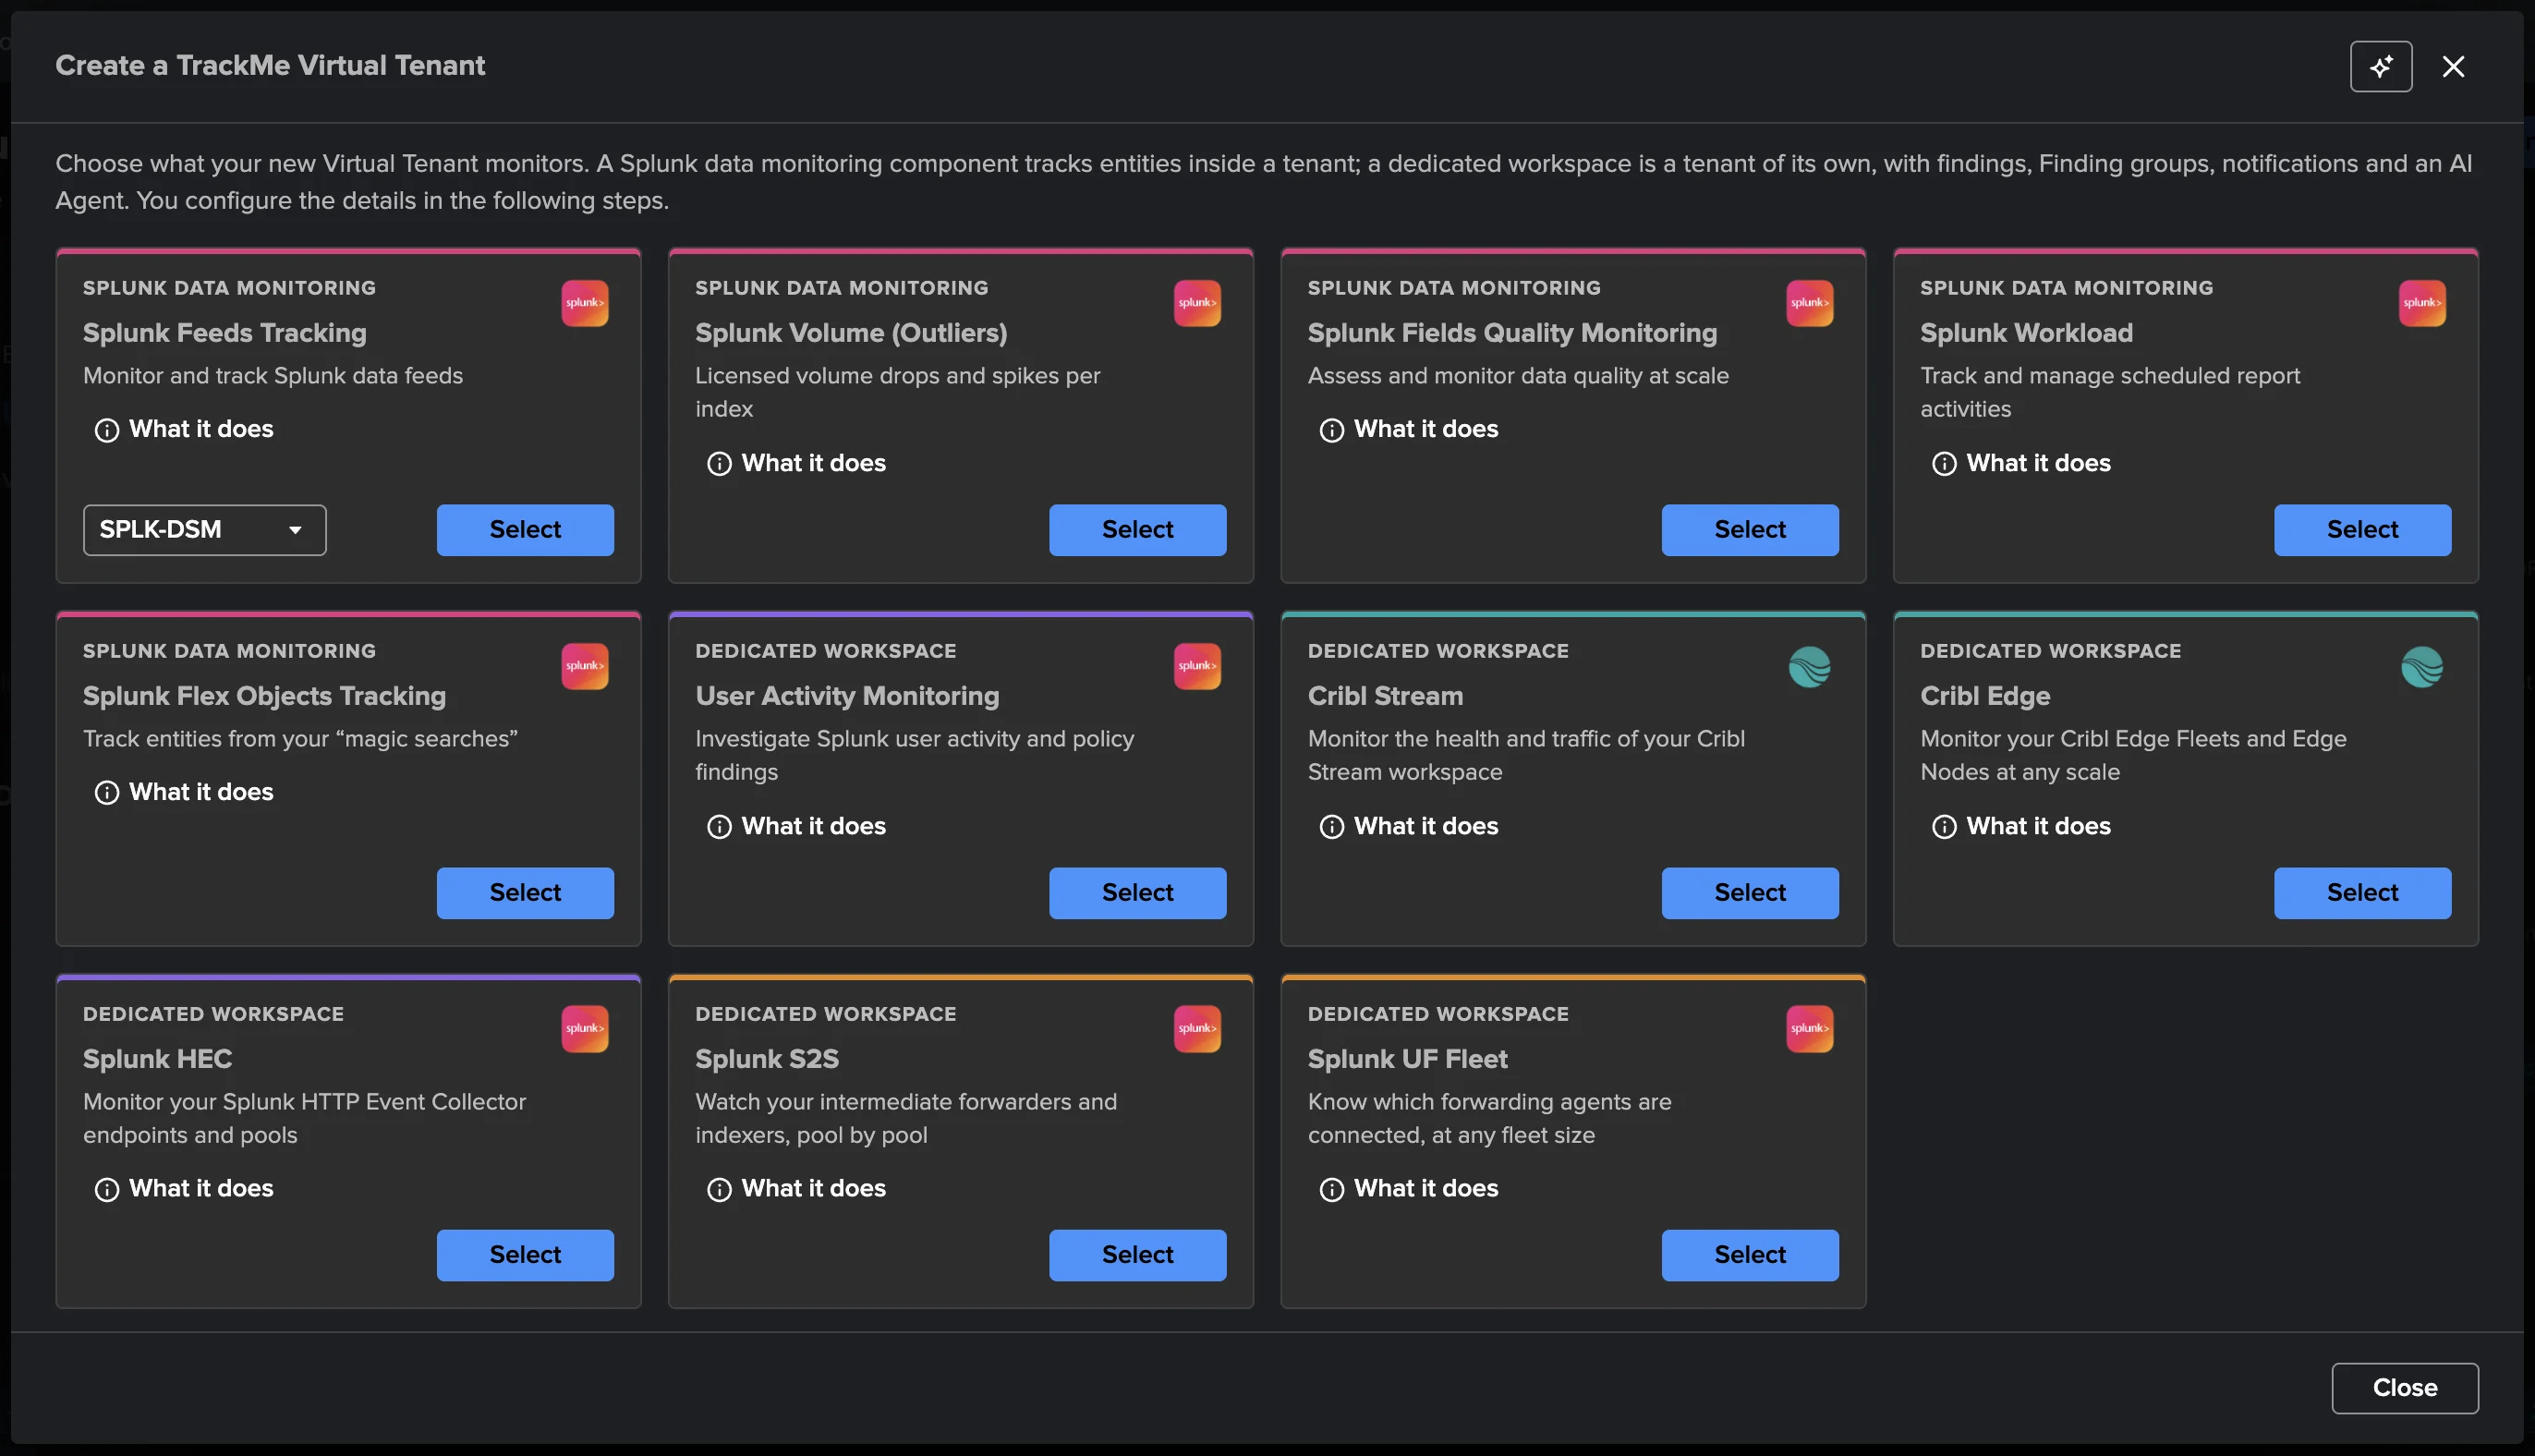
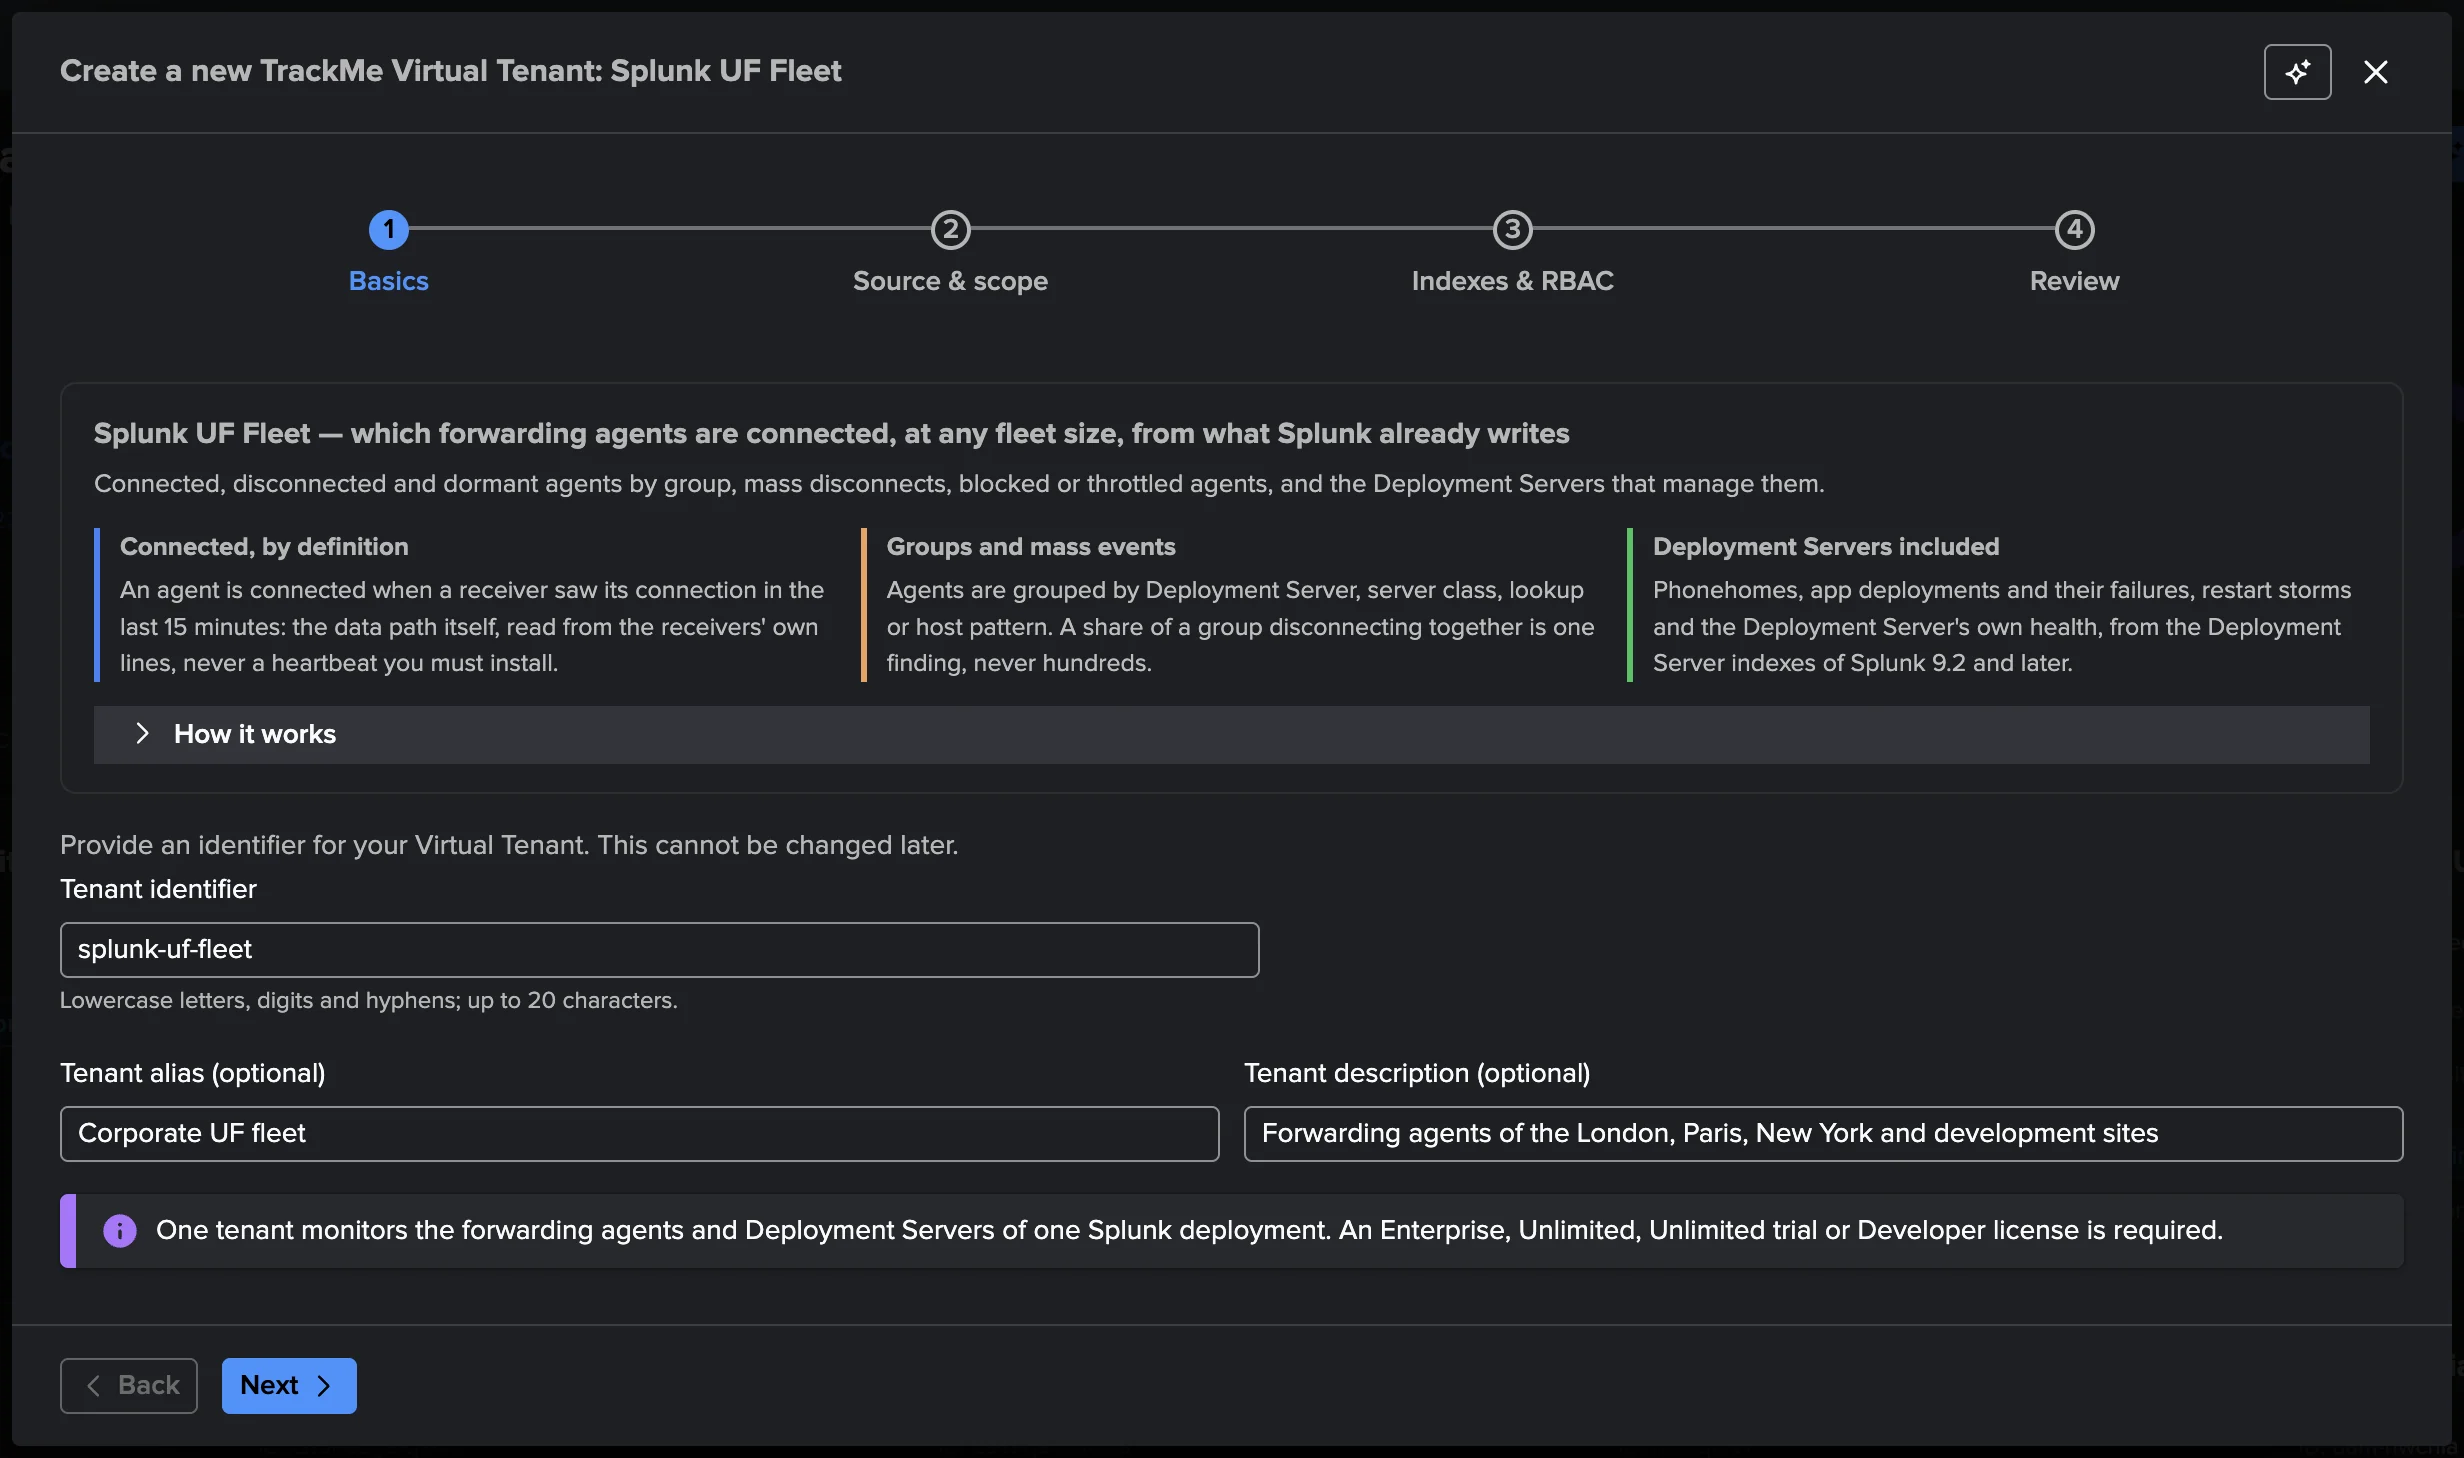
The wizard has four steps.
1. Basics — an introduction (connected by definition, groups and mass events, Deployment Servers included), then the tenant identifier (lowercase letters, digits and hyphens, up to 20 characters, fixed once created), an alias and a description. One tenant monitors the forwarding agents and Deployment Servers of one Splunk deployment.
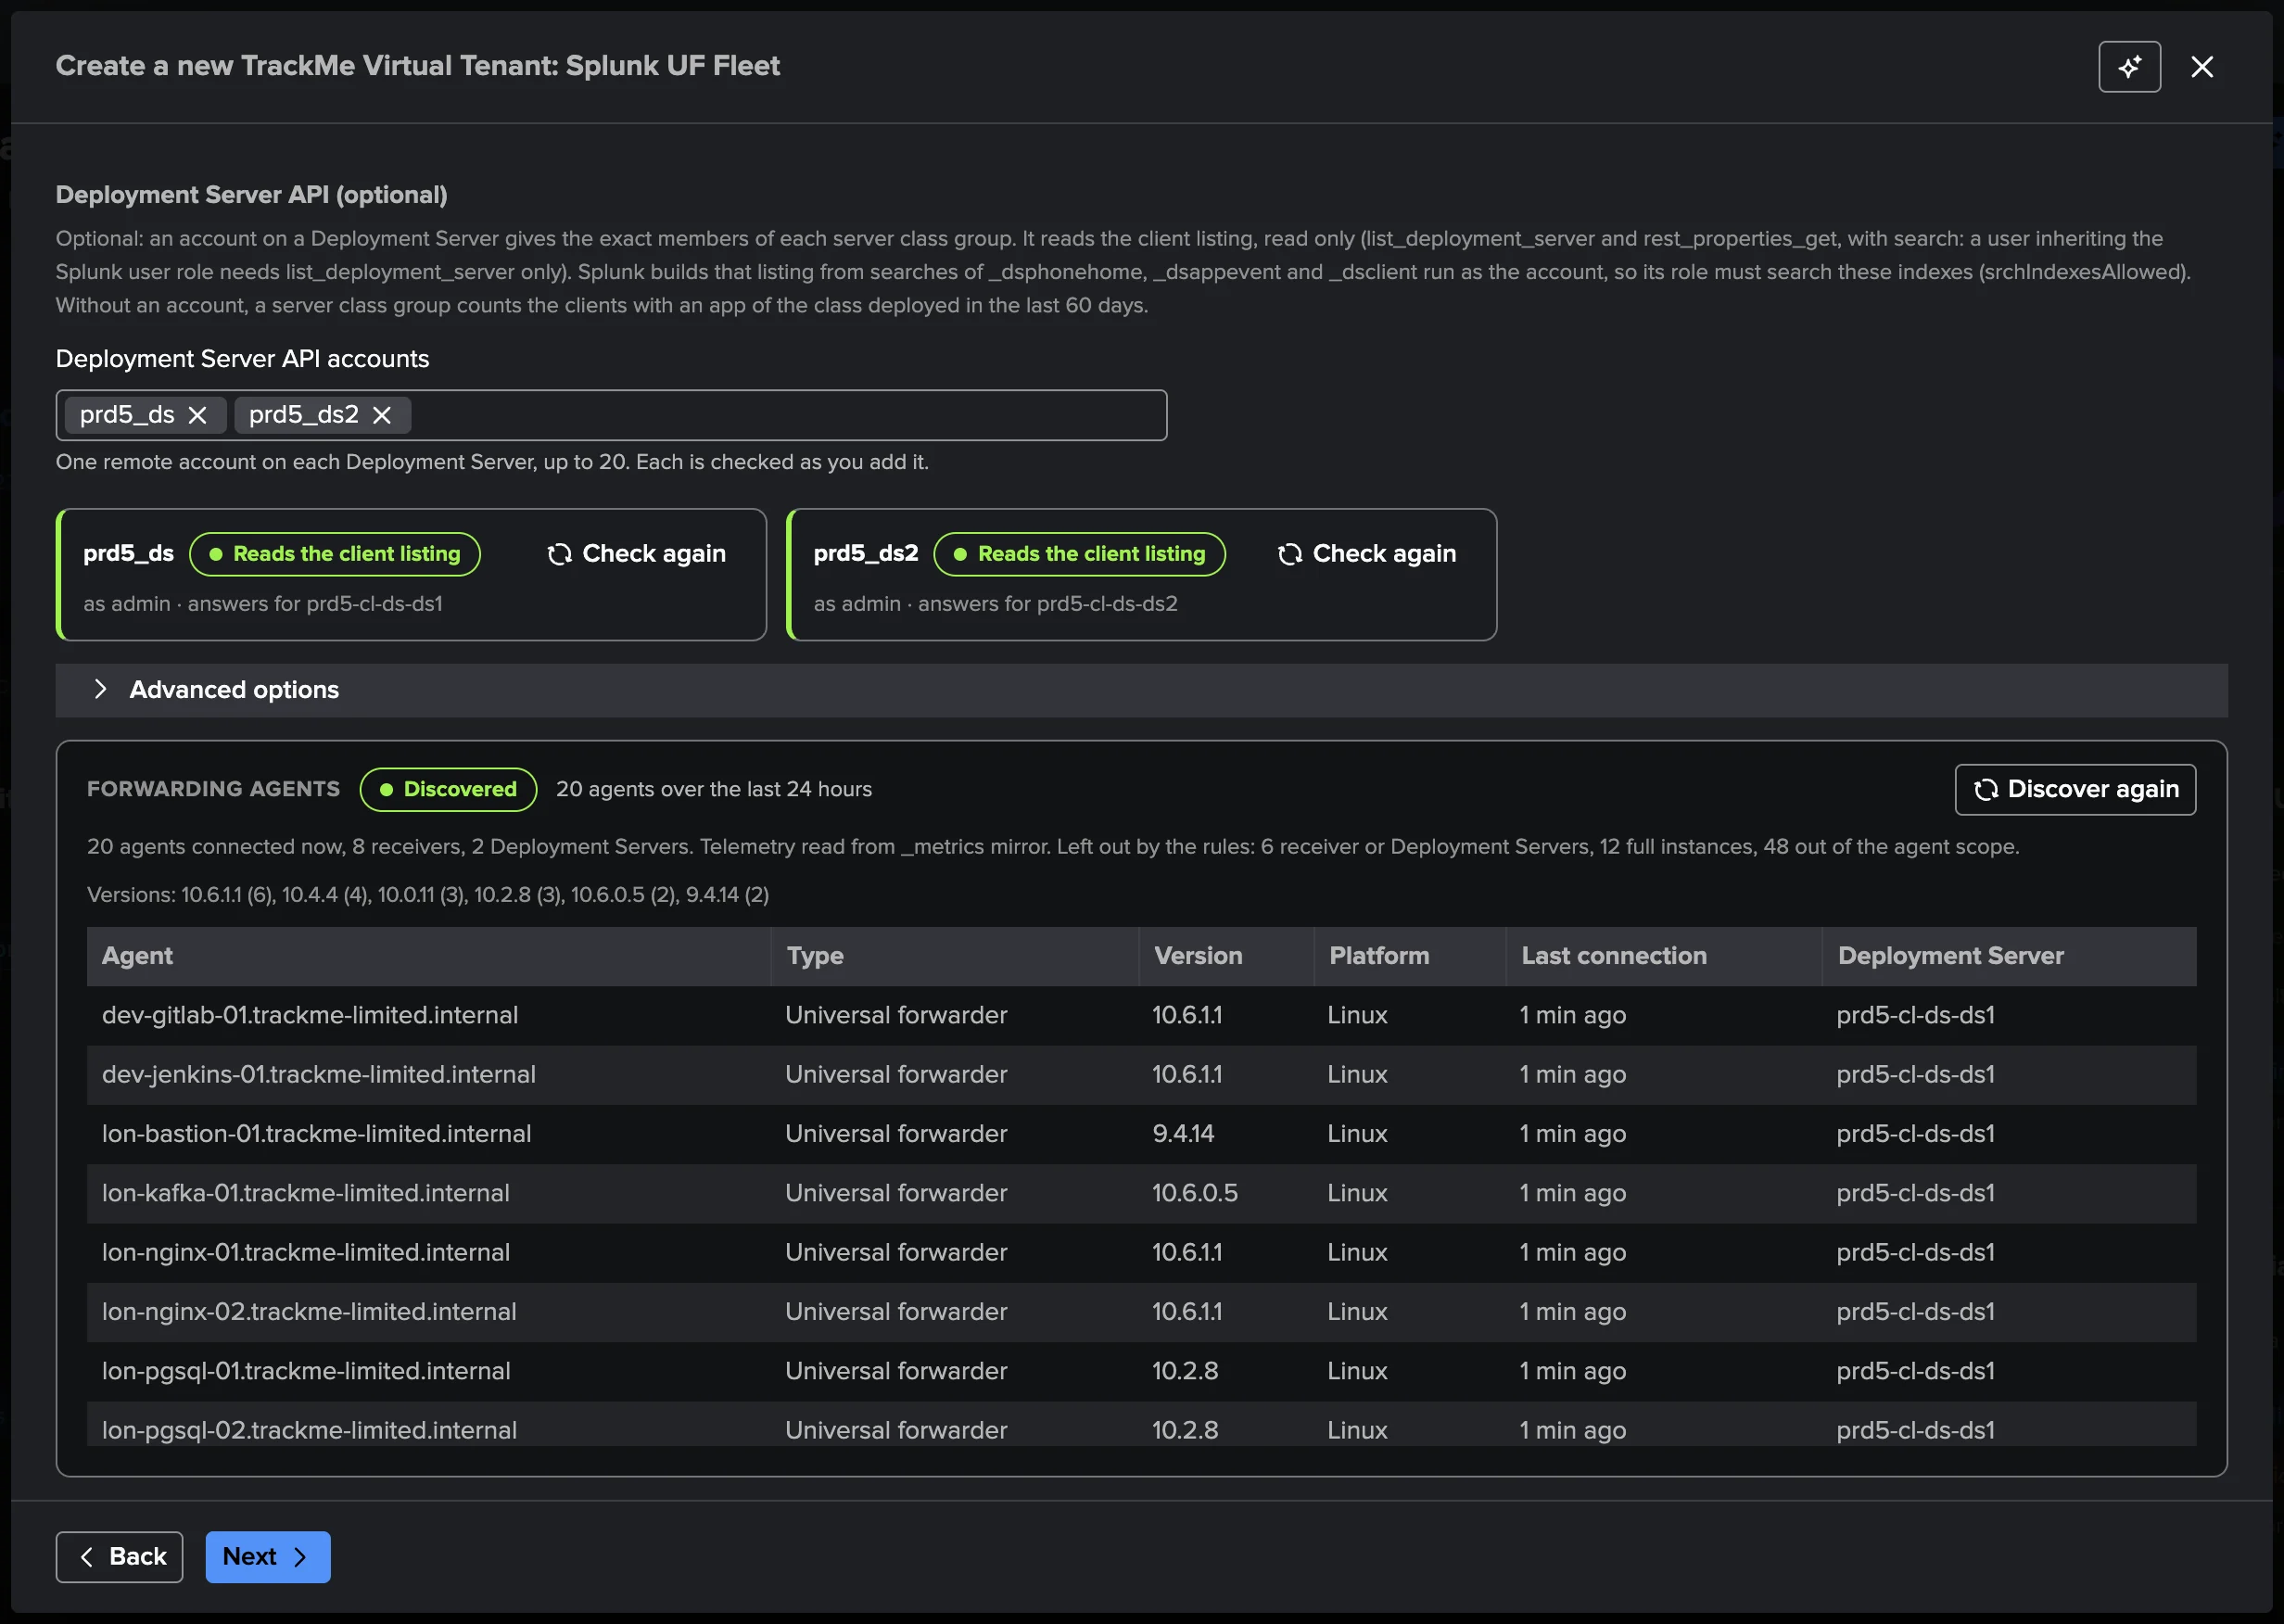
2. Source & scope — the Source, the Deployment Server source and the optional
Deployment Server API accounts. Each account is checked as soon as you add it: who it is,
whether it reads the client listing, and which Deployment Server answers (“Reads the client
listing”, “Lists no client”, “Cannot search the DS indexes”, “Listing refused”, “Unreachable”,
with What to do and Check again). Cannot search the DS indexes means the discovery sees
clients phoning home to that Deployment Server while the account sees none: Splunk builds the client
listing from searches of _dsphonehome, _dsappevent and _dsclient run as the account, so
its role must be allowed to search these indexes (srchIndexesAllowed).
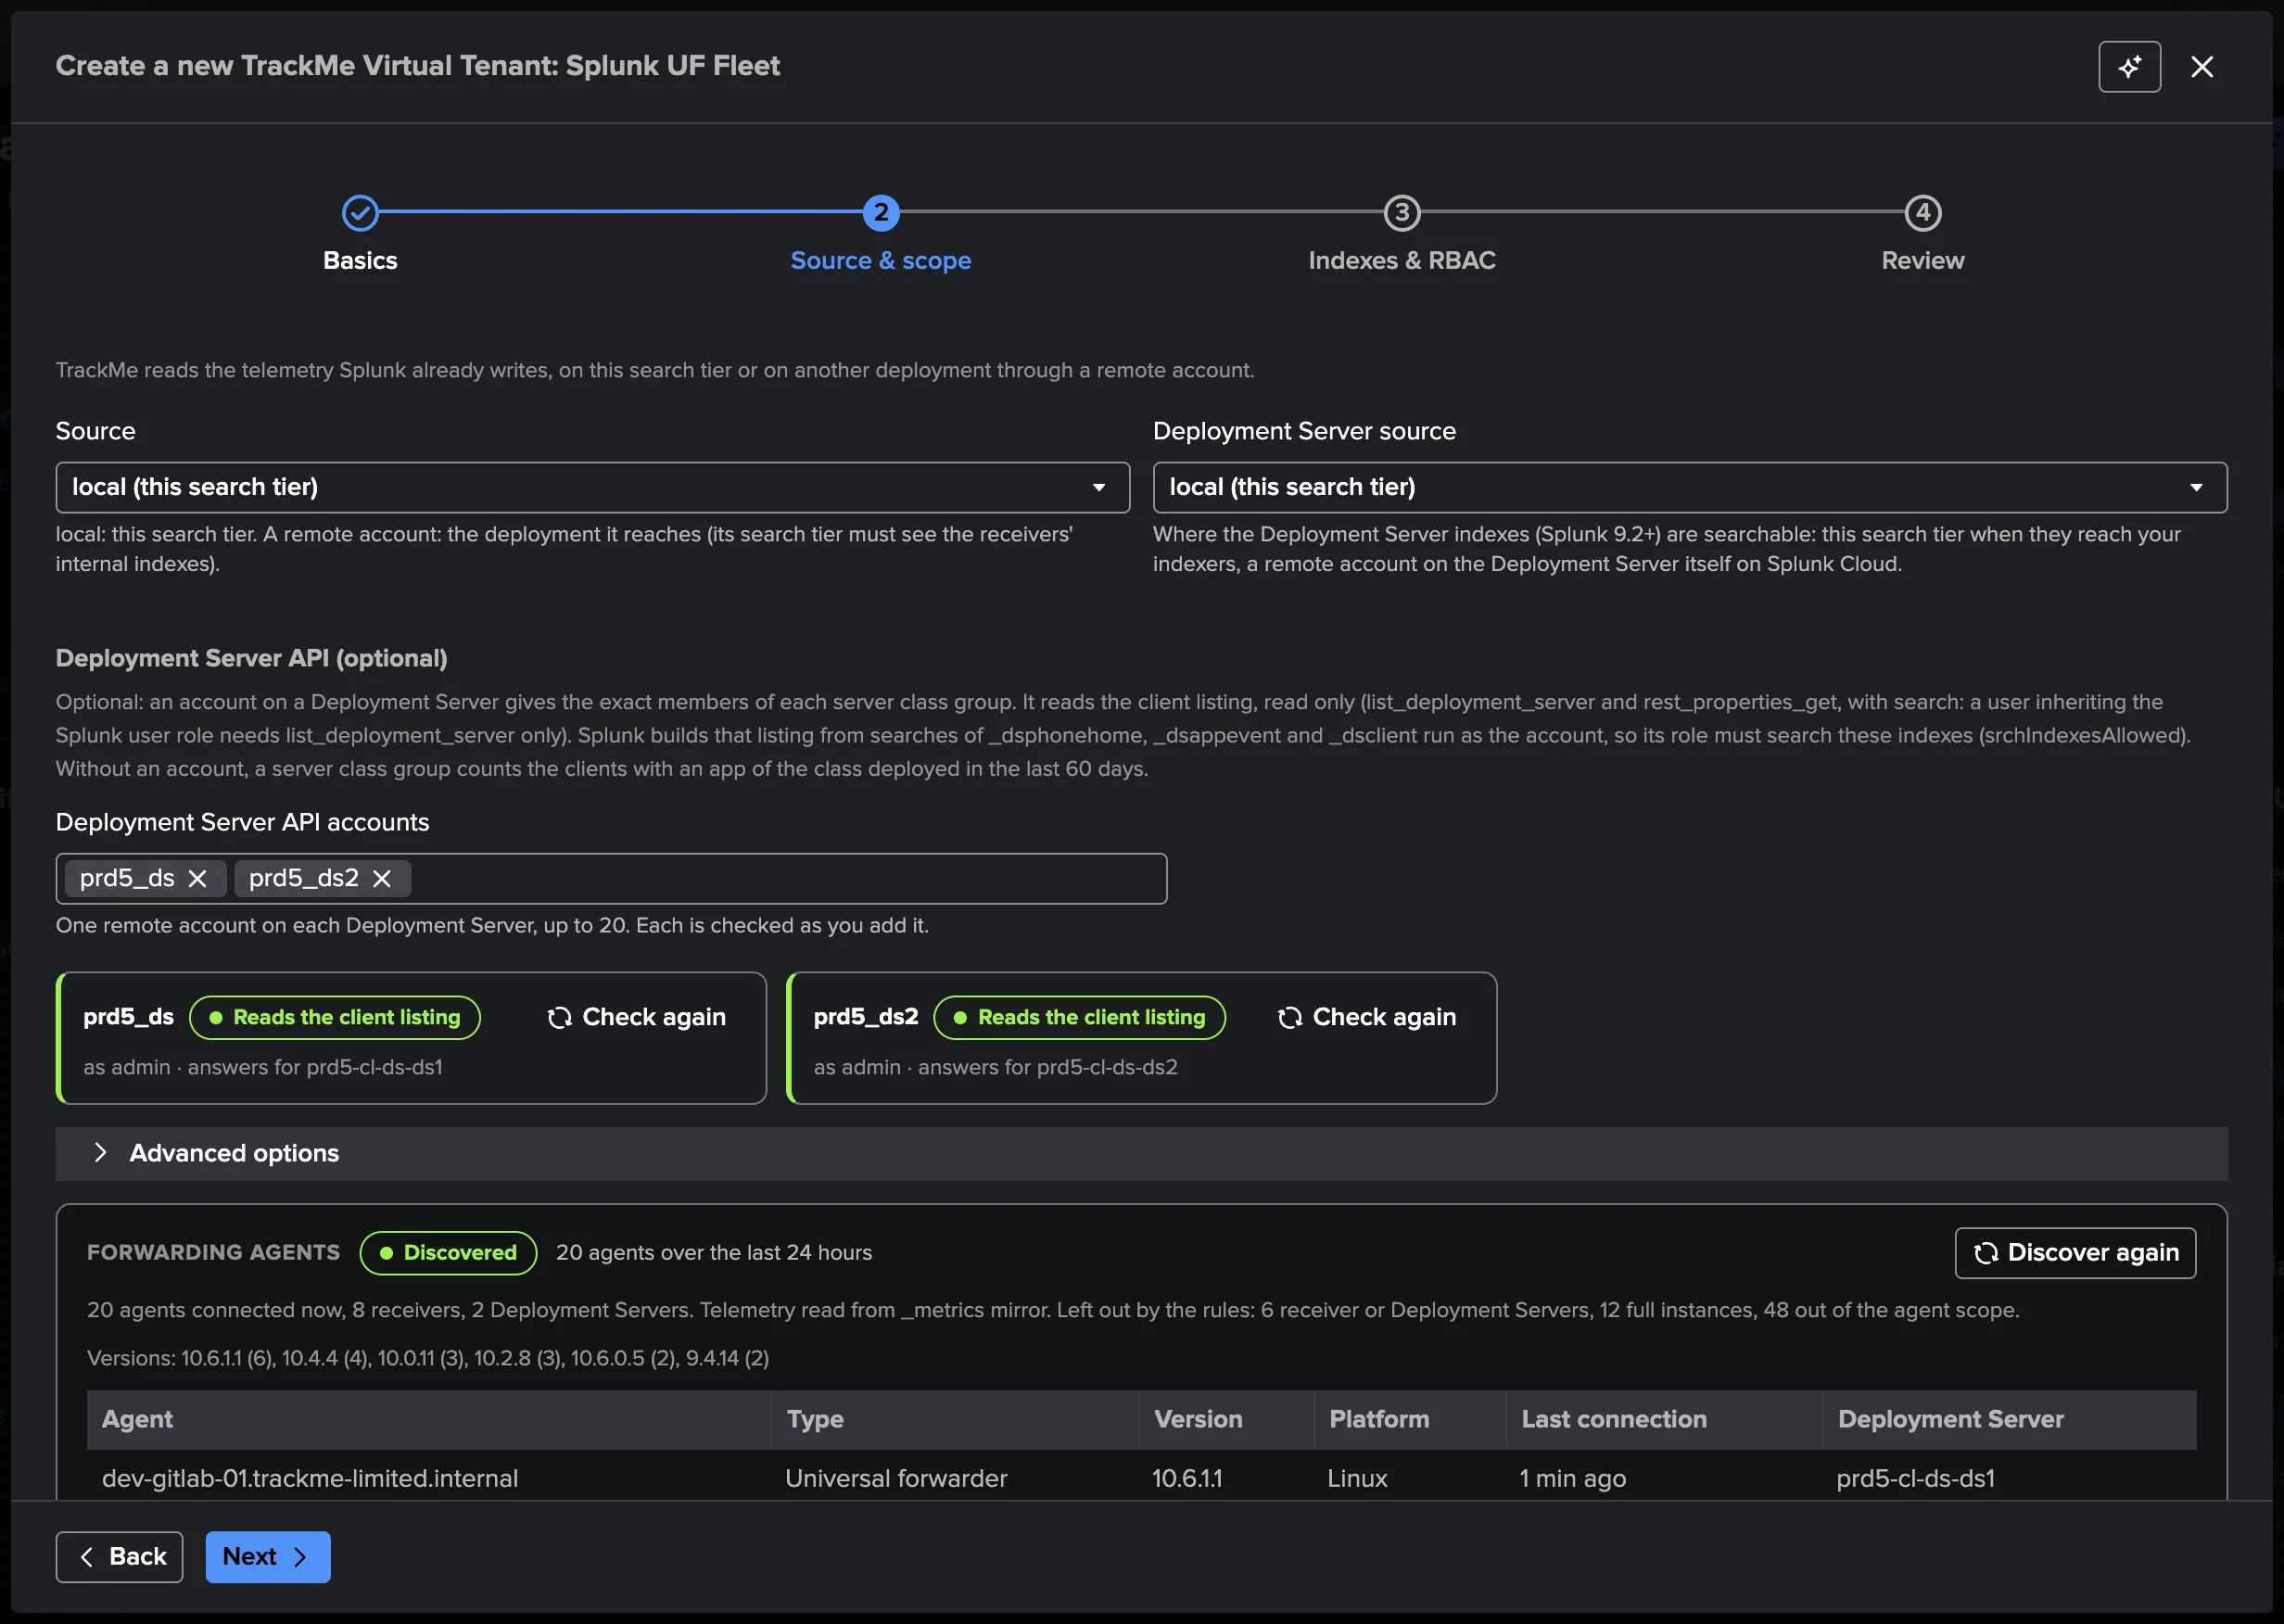
Here the two Deployment Servers form a cluster, one account on each member: each answers for its own Deployment Server. In a cluster whose members share their client listing, one member’s account may list every client while the other’s reads “Lists no client”: that is expected too.
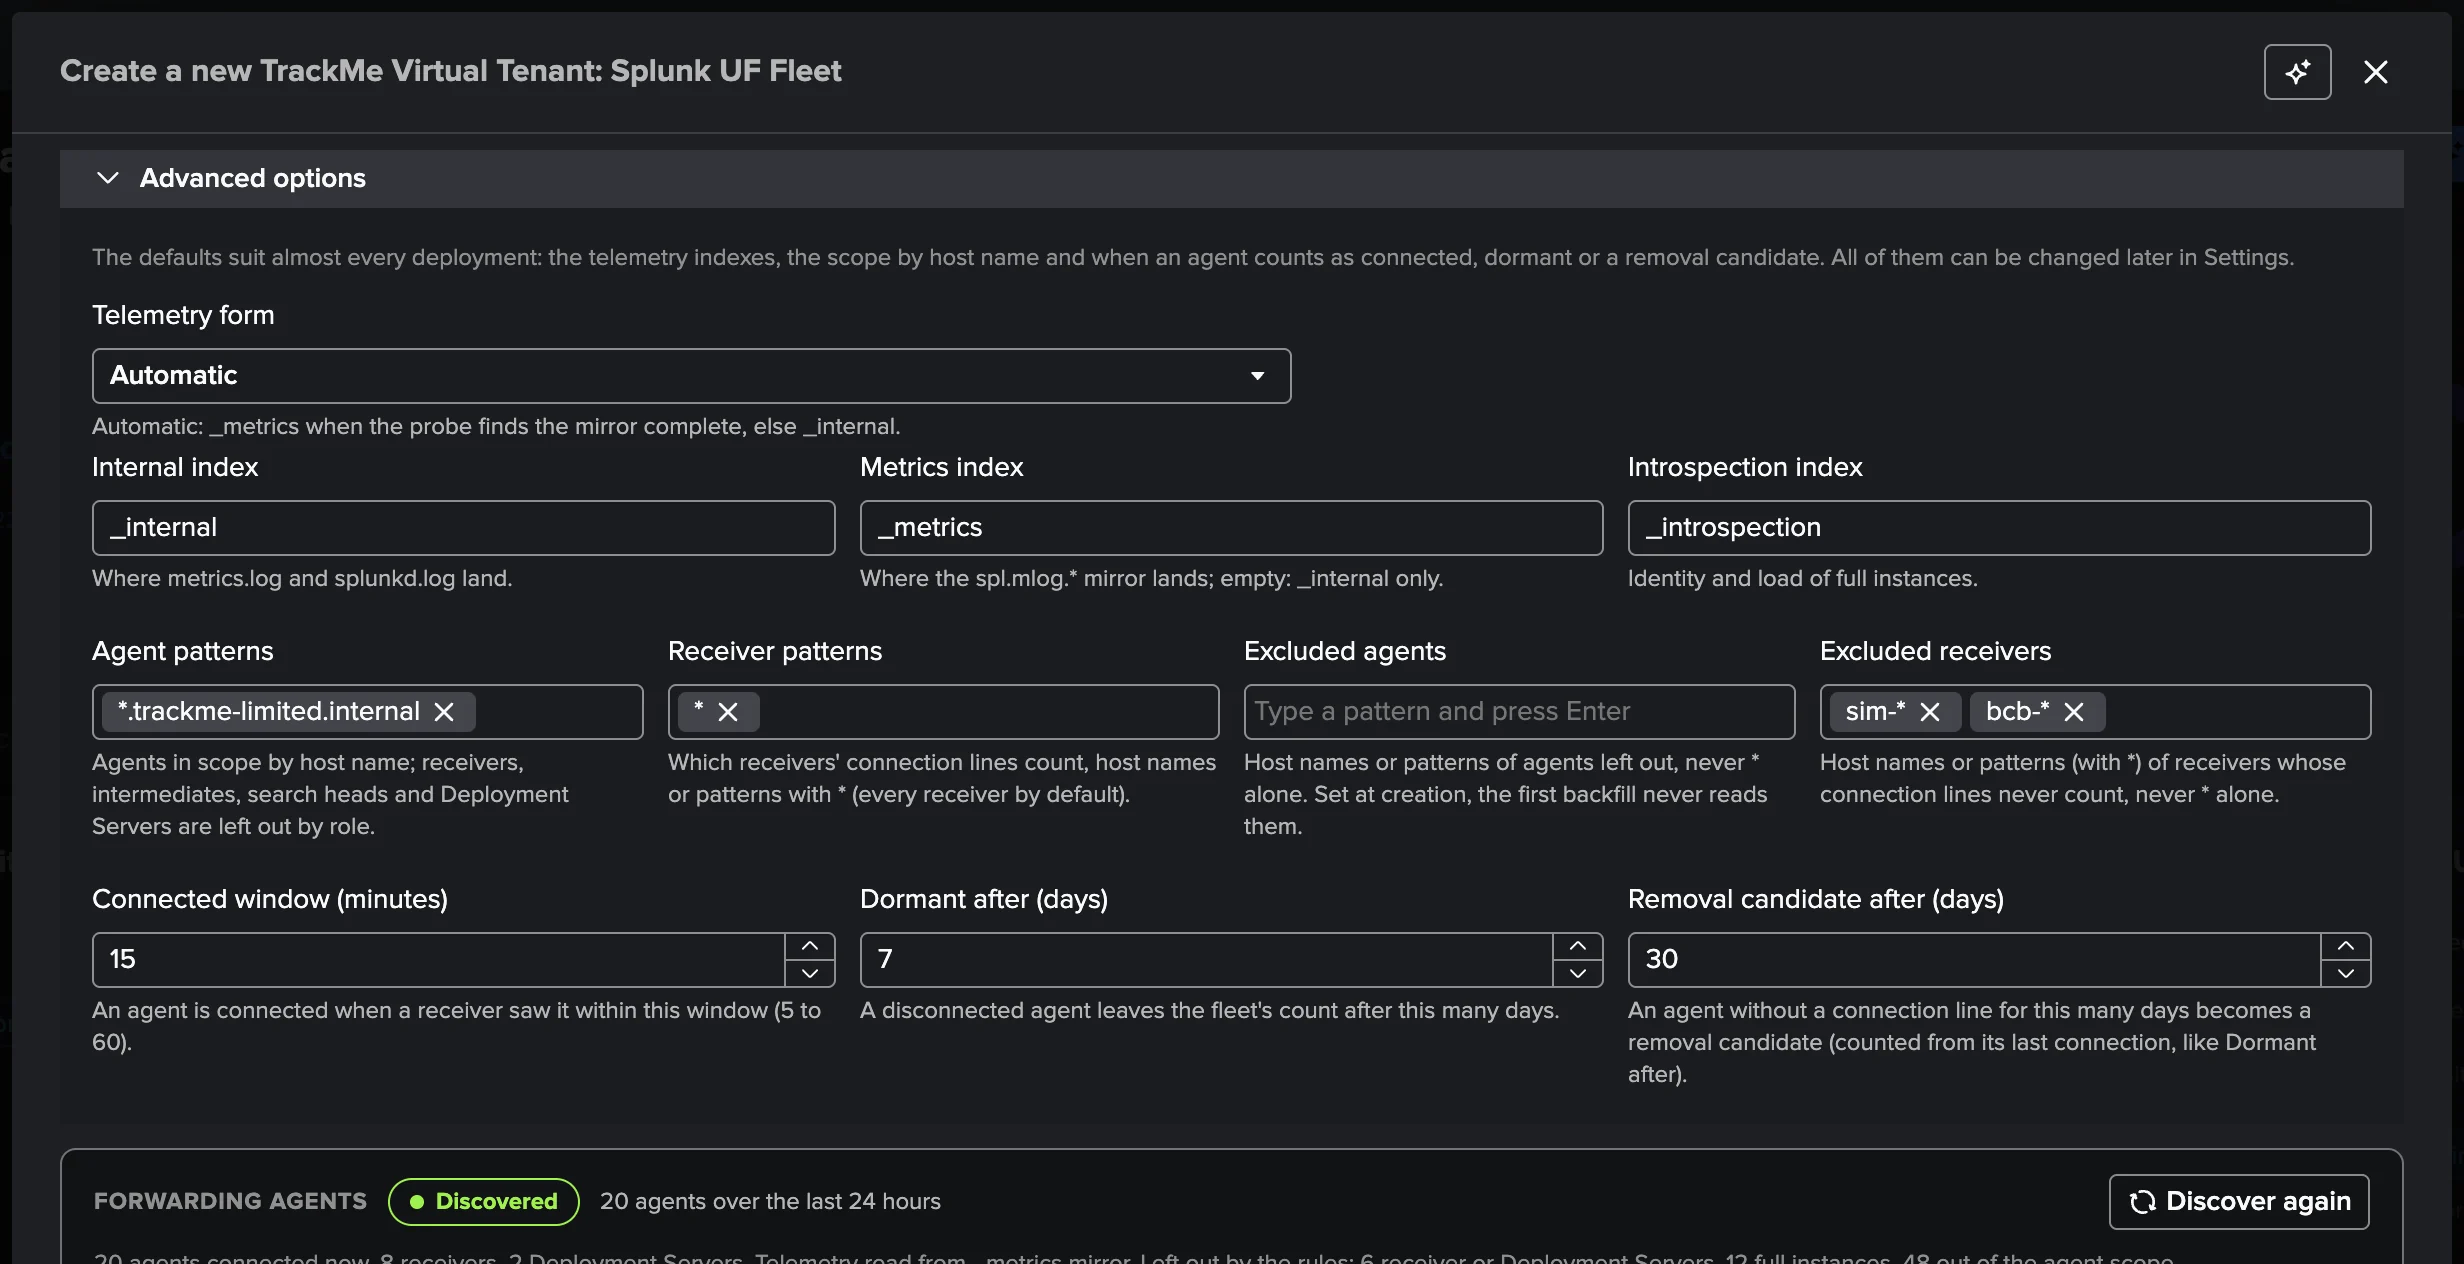
Advanced options (folded; opened when one of its settings needs a fix) hold the telemetry form,
the three index names, the Agent patterns (which agents are in scope, by host name), the
Receiver patterns (whose connection lines count), Excluded agents and Excluded receivers,
the connected window, Dormant after and Removal candidate after. Each pattern is a token:
type a host name or a pattern and press Enter (a pasted comma-separated list is split). Set the
exclusions here rather than later: the first backfill (14 days) never reads what they leave out, so
the new tenant’s history starts clean. Receiver patterns and exclusions take * as their only
wildcard.
Below, the scope is the corporate domain, *.trackme-limited.internal, and two families of test
receivers that share the same indexes are left out: sim-* and bcb-*.
The agent discovery shows what the tenant would collect, with its own rules, over the last day:
the agents, those connected now (and those connected by their heartbeat only: no receiver line,
their own splunkd lines arriving, such as agents sending through Cribl), the deployment clients
not seen forwarding with when each last phoned home, the receivers, the Deployment Servers, what the
rules left out (infrastructure, full instances, out of scope), the versions, and the first 500
agents. It is informational and never blocks the step.
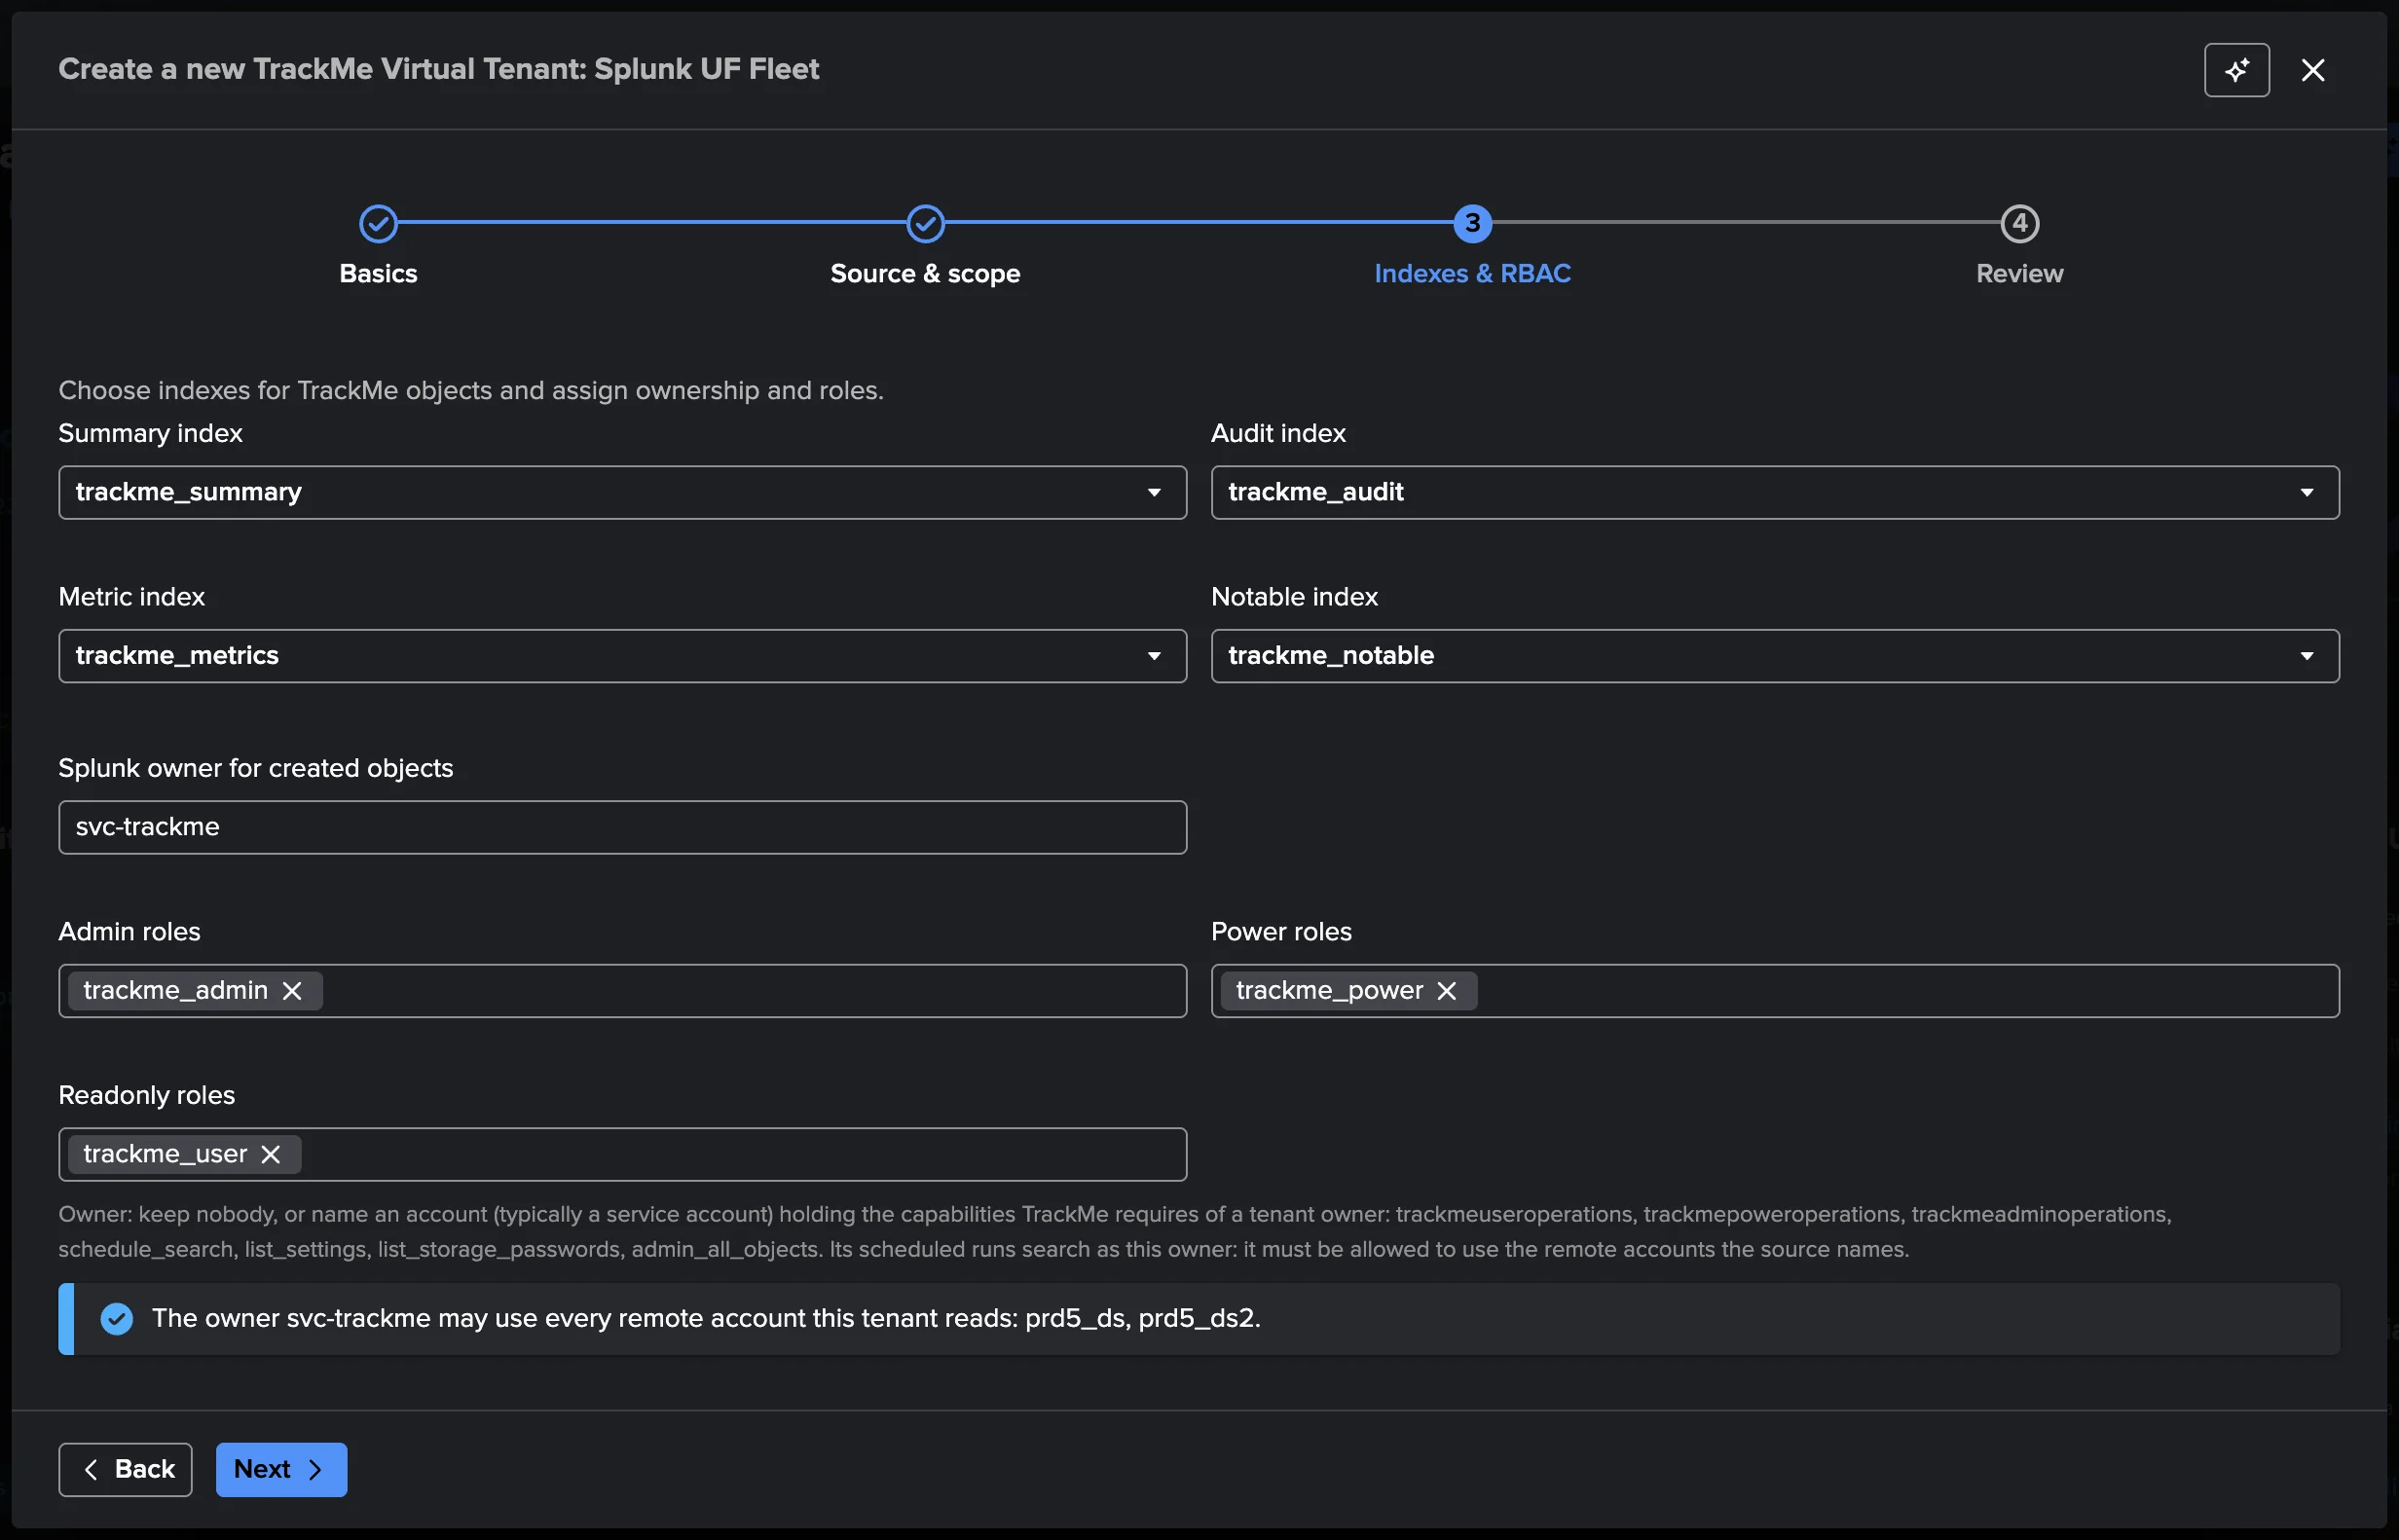
3. Indexes & RBAC — the tenant’s TrackMe indexes, the owner and the roles. The wizard checks that the owner may use every remote account the tenant reads.
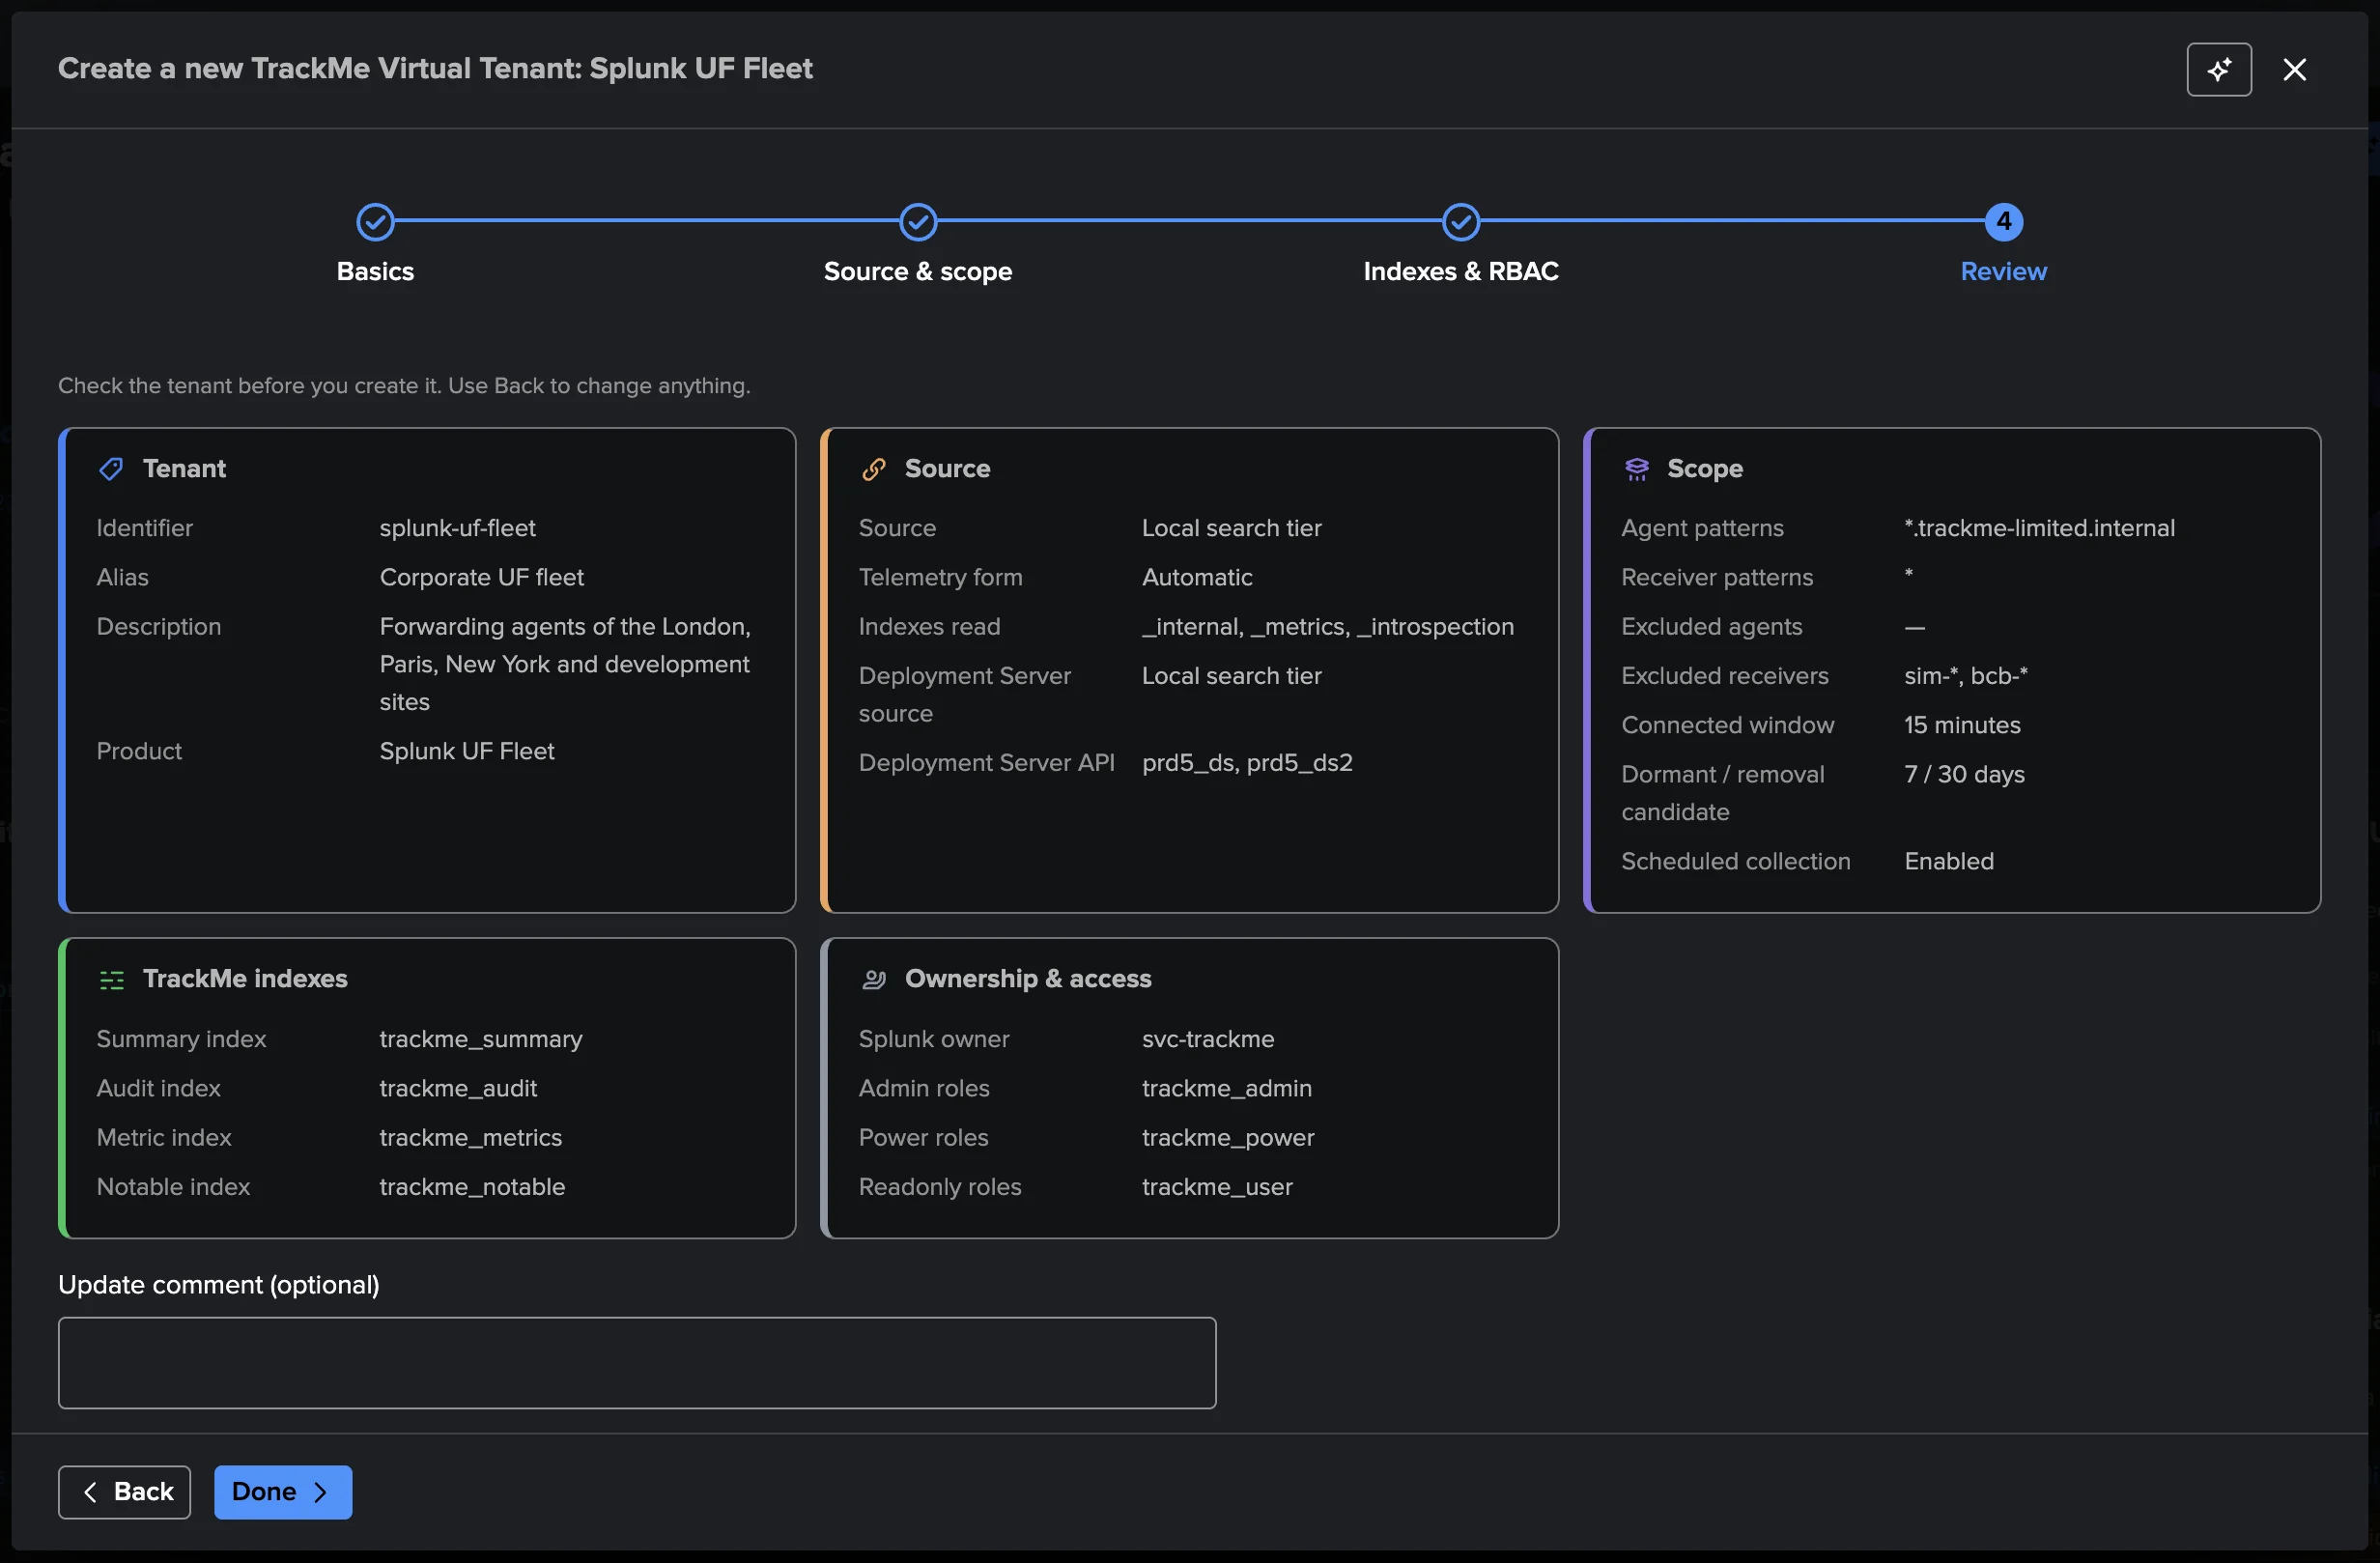
4. Review — then Done. The first live run starts at once: it checks that the source answers, then builds the directory and starts collecting. Expected agents and groups are set once the tenant exists (below).
Configuring the tenant
Three settings turn a list of agents into a fleet you can read: the enrichment from your own inventory, the groups, and the expected agents that must always stay connected. All of them are in the workspace once the tenant exists.
Enrichment
Settings → Enrichment carries fields from your own inventory (a CMDB export, an asset list, as
a CSV or KV store lookup, local or through a remote account) onto each agent, keyed on the agents’
host names or GUIDs (exact, or wildcard with *). Choose up to 5 lookups of up to 500,000 rows,
and up to 10 fields each.
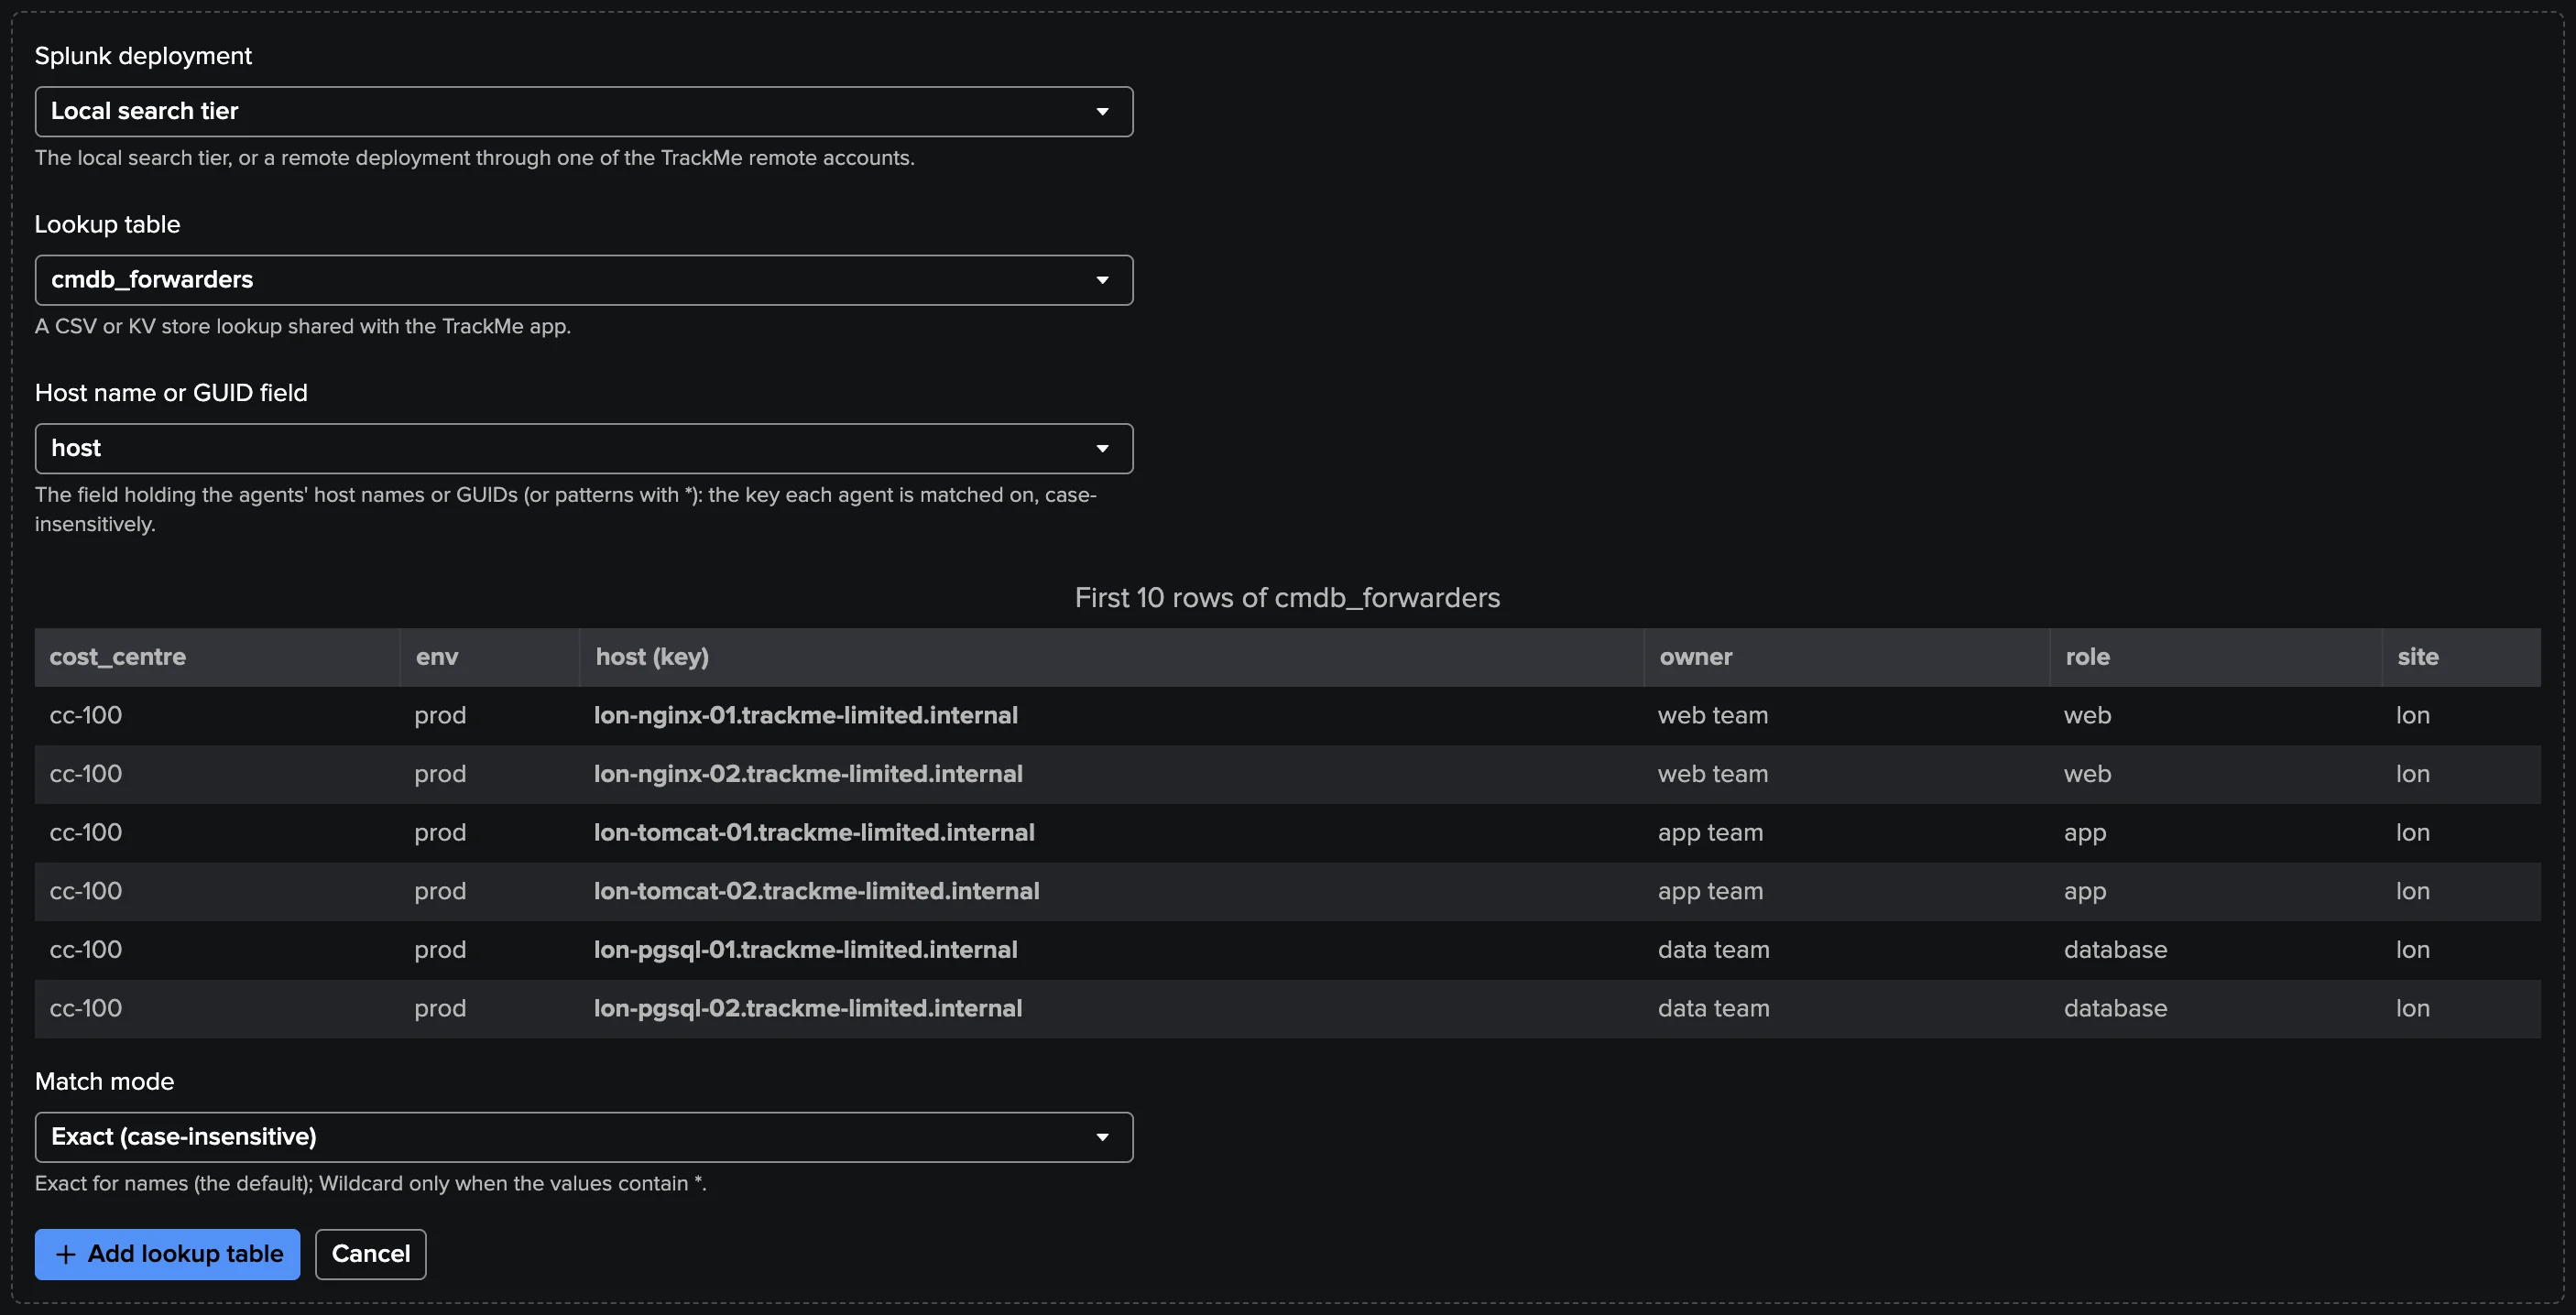
Then choose the fields to carry, in order: the first three are columns of the Agents table, and every field shows on the agent’s Identity and on its findings (notifications, assignment and the AI Agent read them). Once the next inventory has read the lookup, its card says Read with its rows and the agent keys it holds.
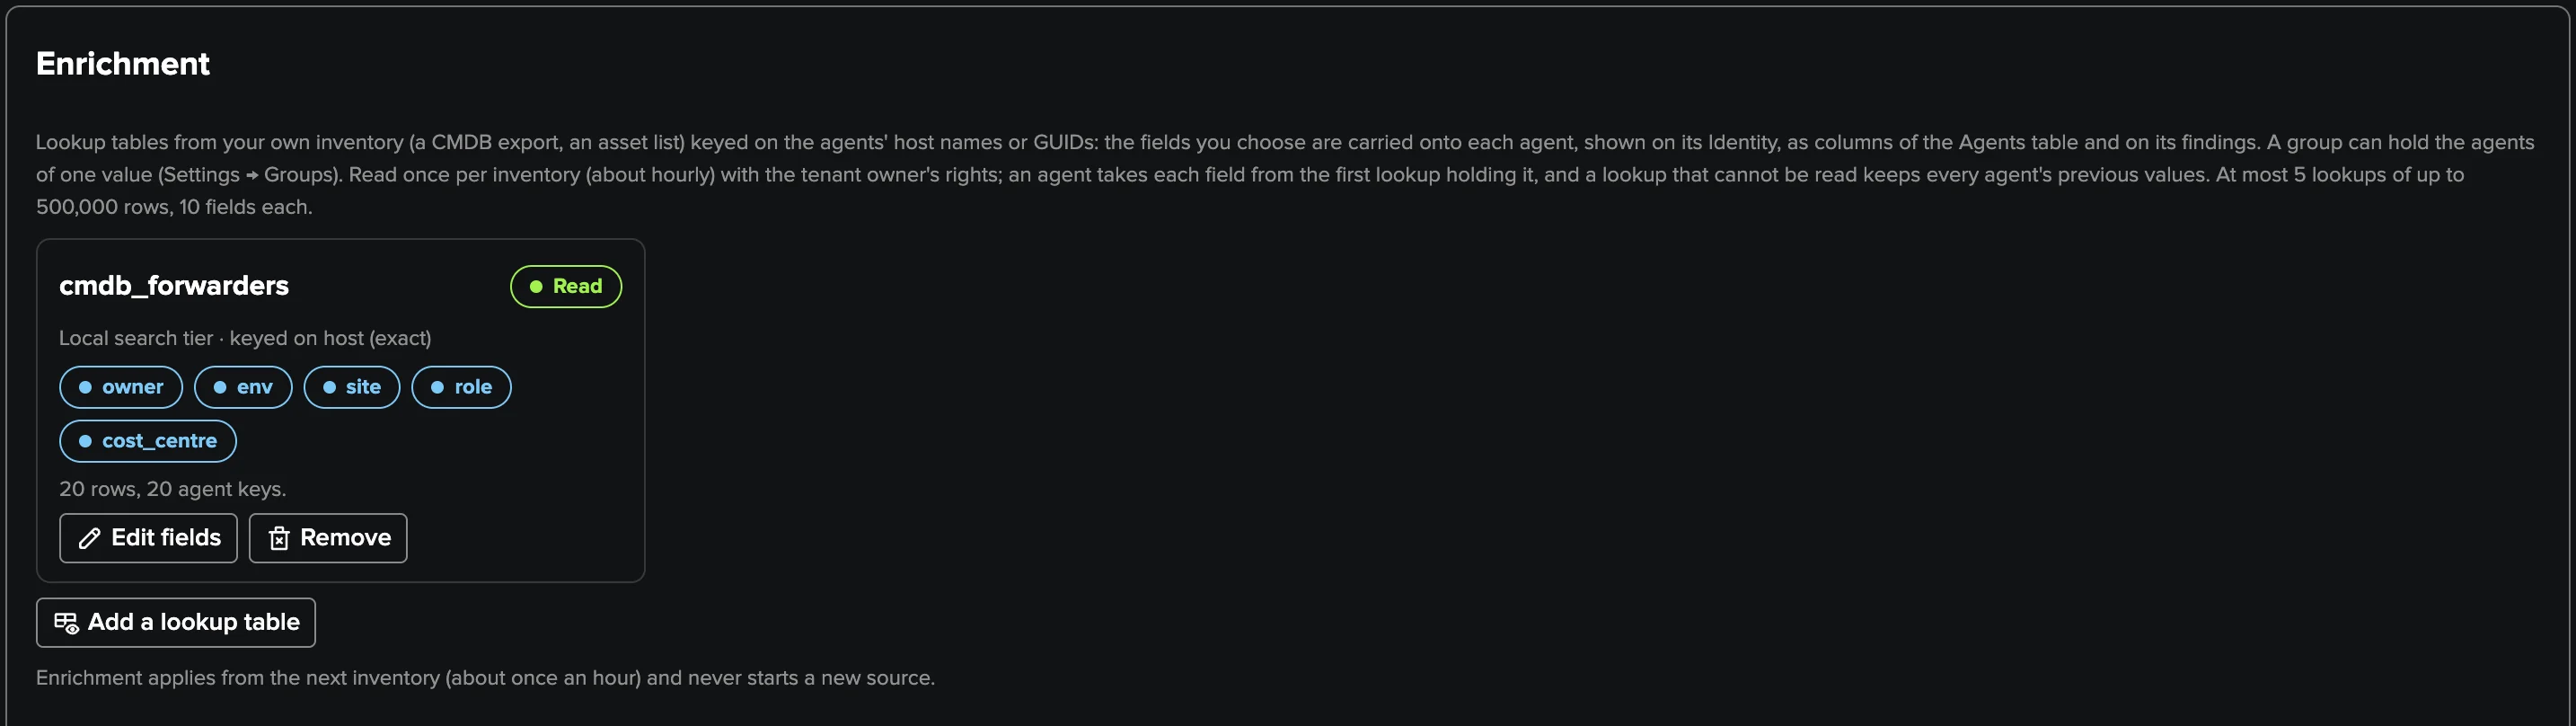
The enrichment is read once per inventory (about hourly) with the tenant owner’s rights. A lookup that cannot be read, or holds more rows, keeps every agent’s previous values, and its card says so. Enrichment never starts a new source.
Groups
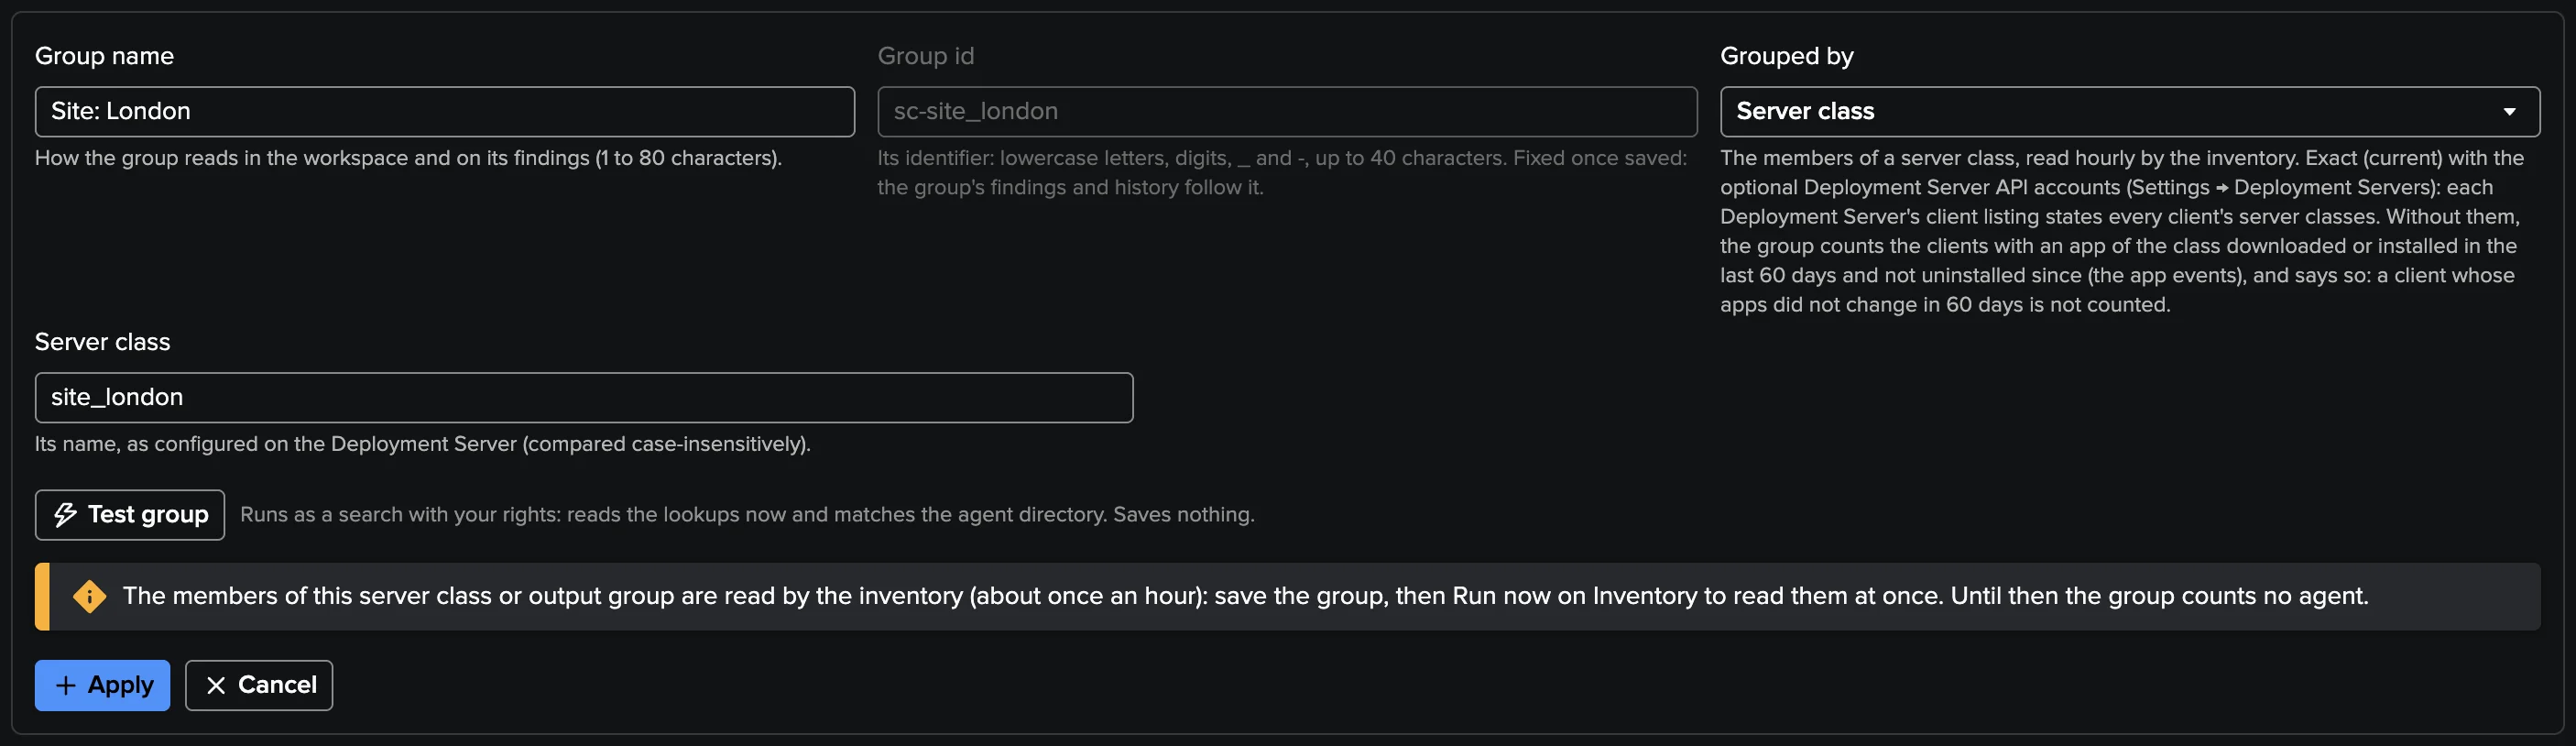
Settings → Groups reads a set of agents as one cohort: the Fleet tab counts each group, the fleet policies (Mass disconnect, Fleet coverage, Version drift) judge each group as they judge the fleet, a policy can be scoped to groups, and Topology Studio draws them. An agent may be in several groups (counted in each, once in the fleet); the agents in no configured group form the default group. Up to 200 groups, 20 of them by lookup table.
Group by |
An agent is a member when |
|---|---|
Deployment Server |
The Deployment Server it phoned last is the value. |
Server class |
It is a member of the class: exact with the Deployment Server API accounts (membership current), else the clients with an app of the class deployed in the last 60 days (app events). |
Lookup table |
A field of a lookup holds its host name or GUID (exact, or wildcard with |
Enrichment value |
Its enrichment field holds the value. |
Host-name pattern |
Its host name matches one of the patterns ( |
Output group |
It sent to the output group in the last hour. |
Propose groups runs the discovery with your rights and proposes one group per Deployment Server, per server class deployed and per output group sent to: add the ones that deserve a group. Its counts are the Deployment Servers’ own (every client of a class, whichever tenant follows it); Test group in the group editor shows the members this tenant counts.
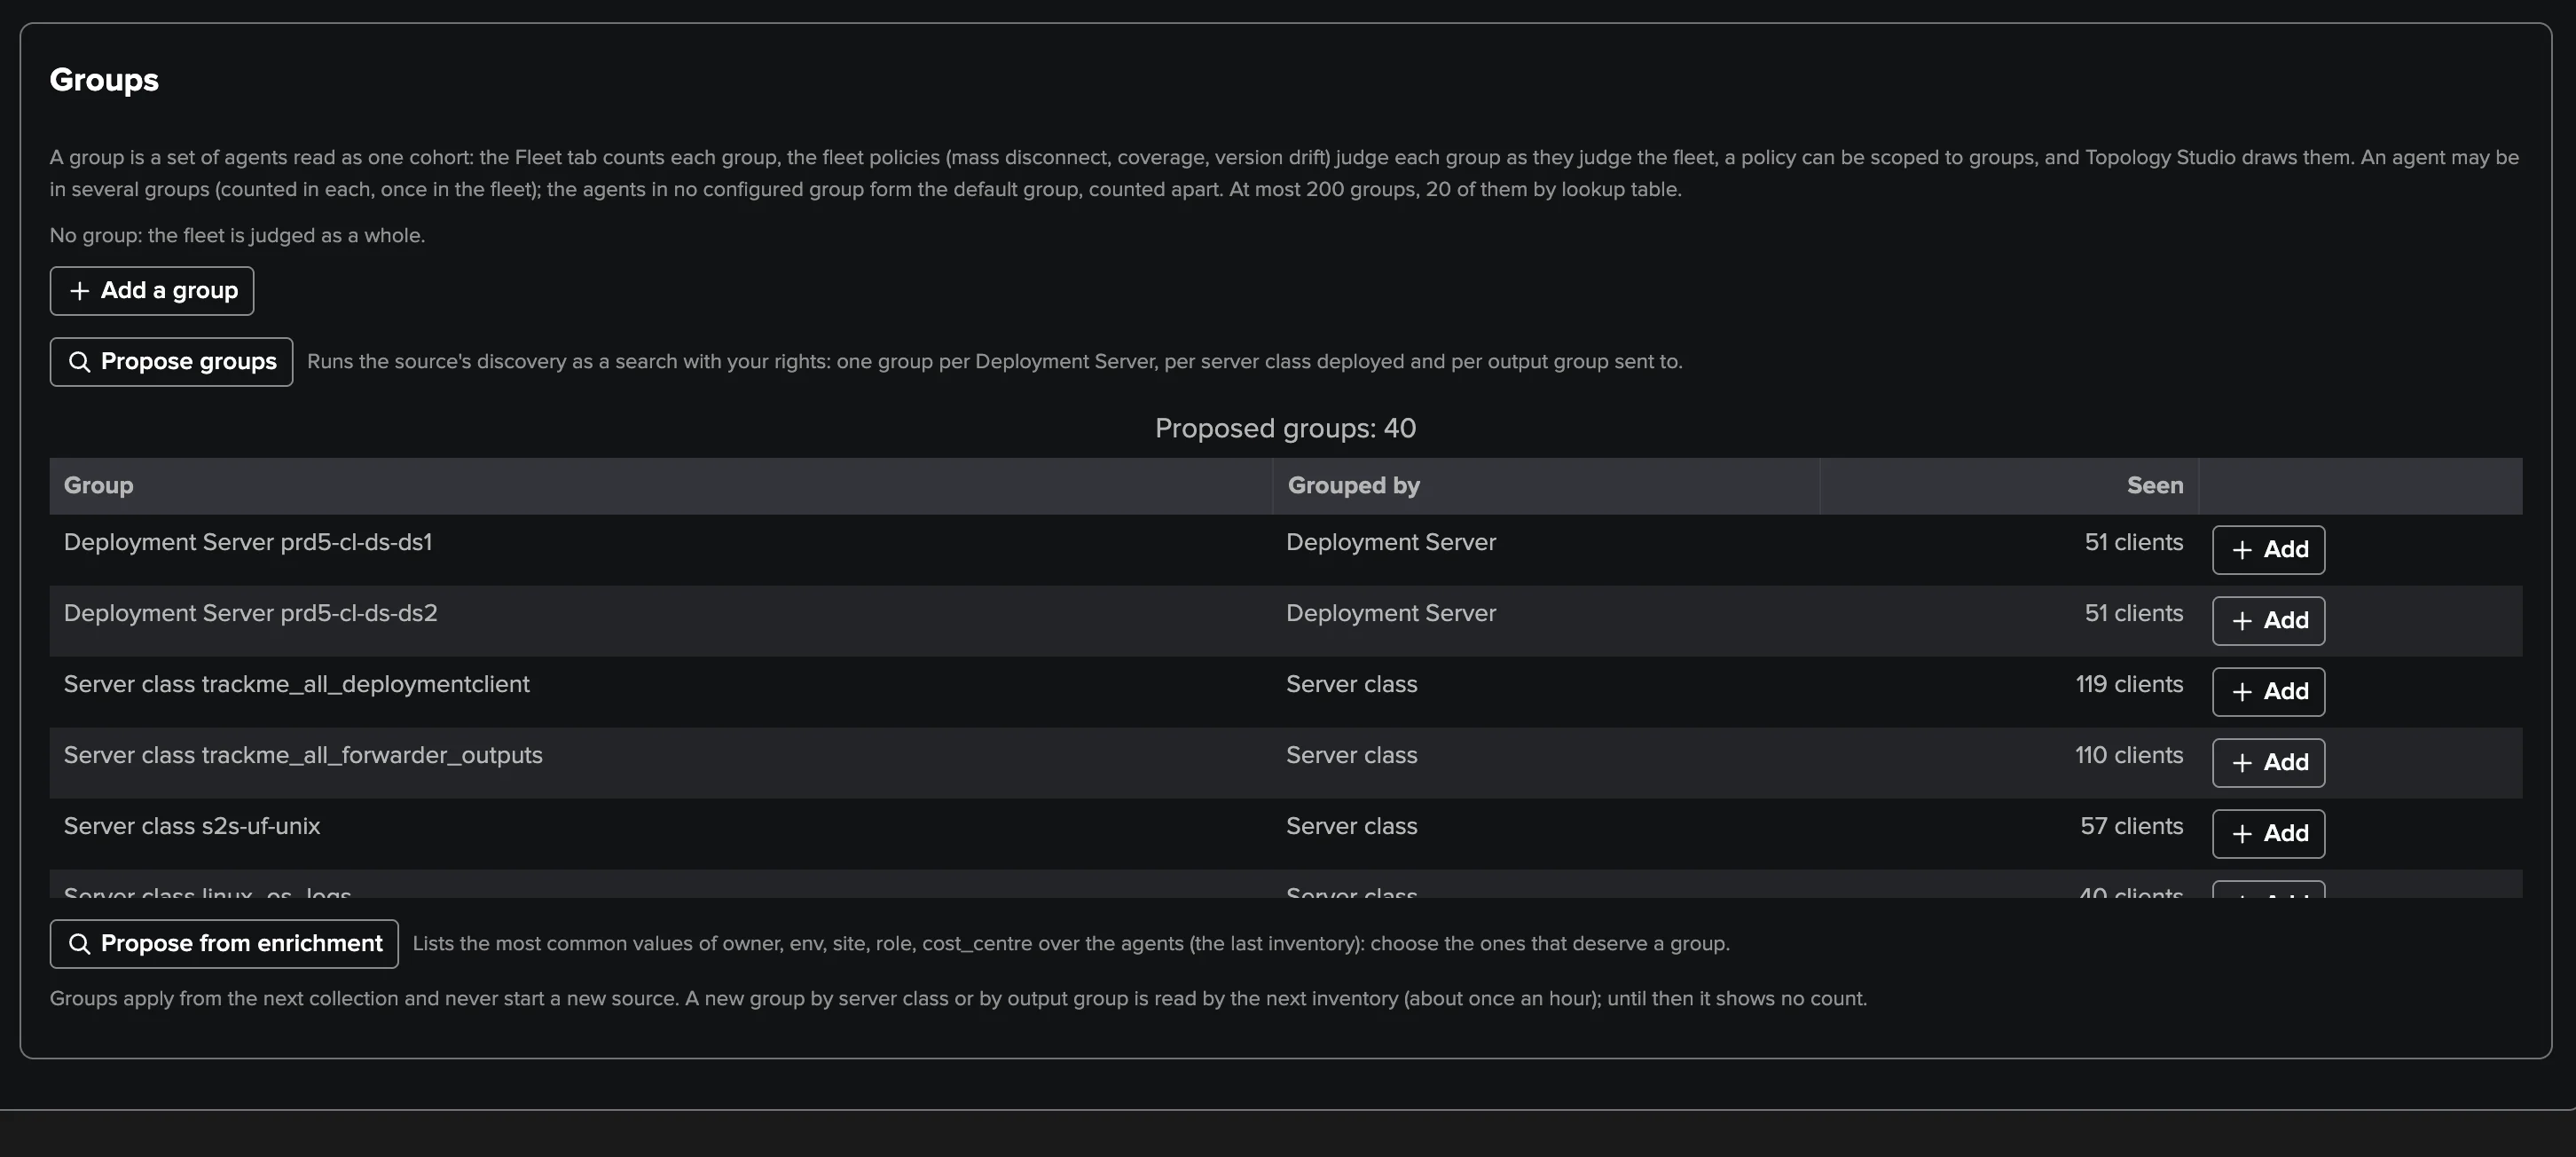
A group opens in its editor: its name, its id (fixed once saved: its findings and history follow it), how it is grouped, and Test group, which matches the agent directory now without saving.
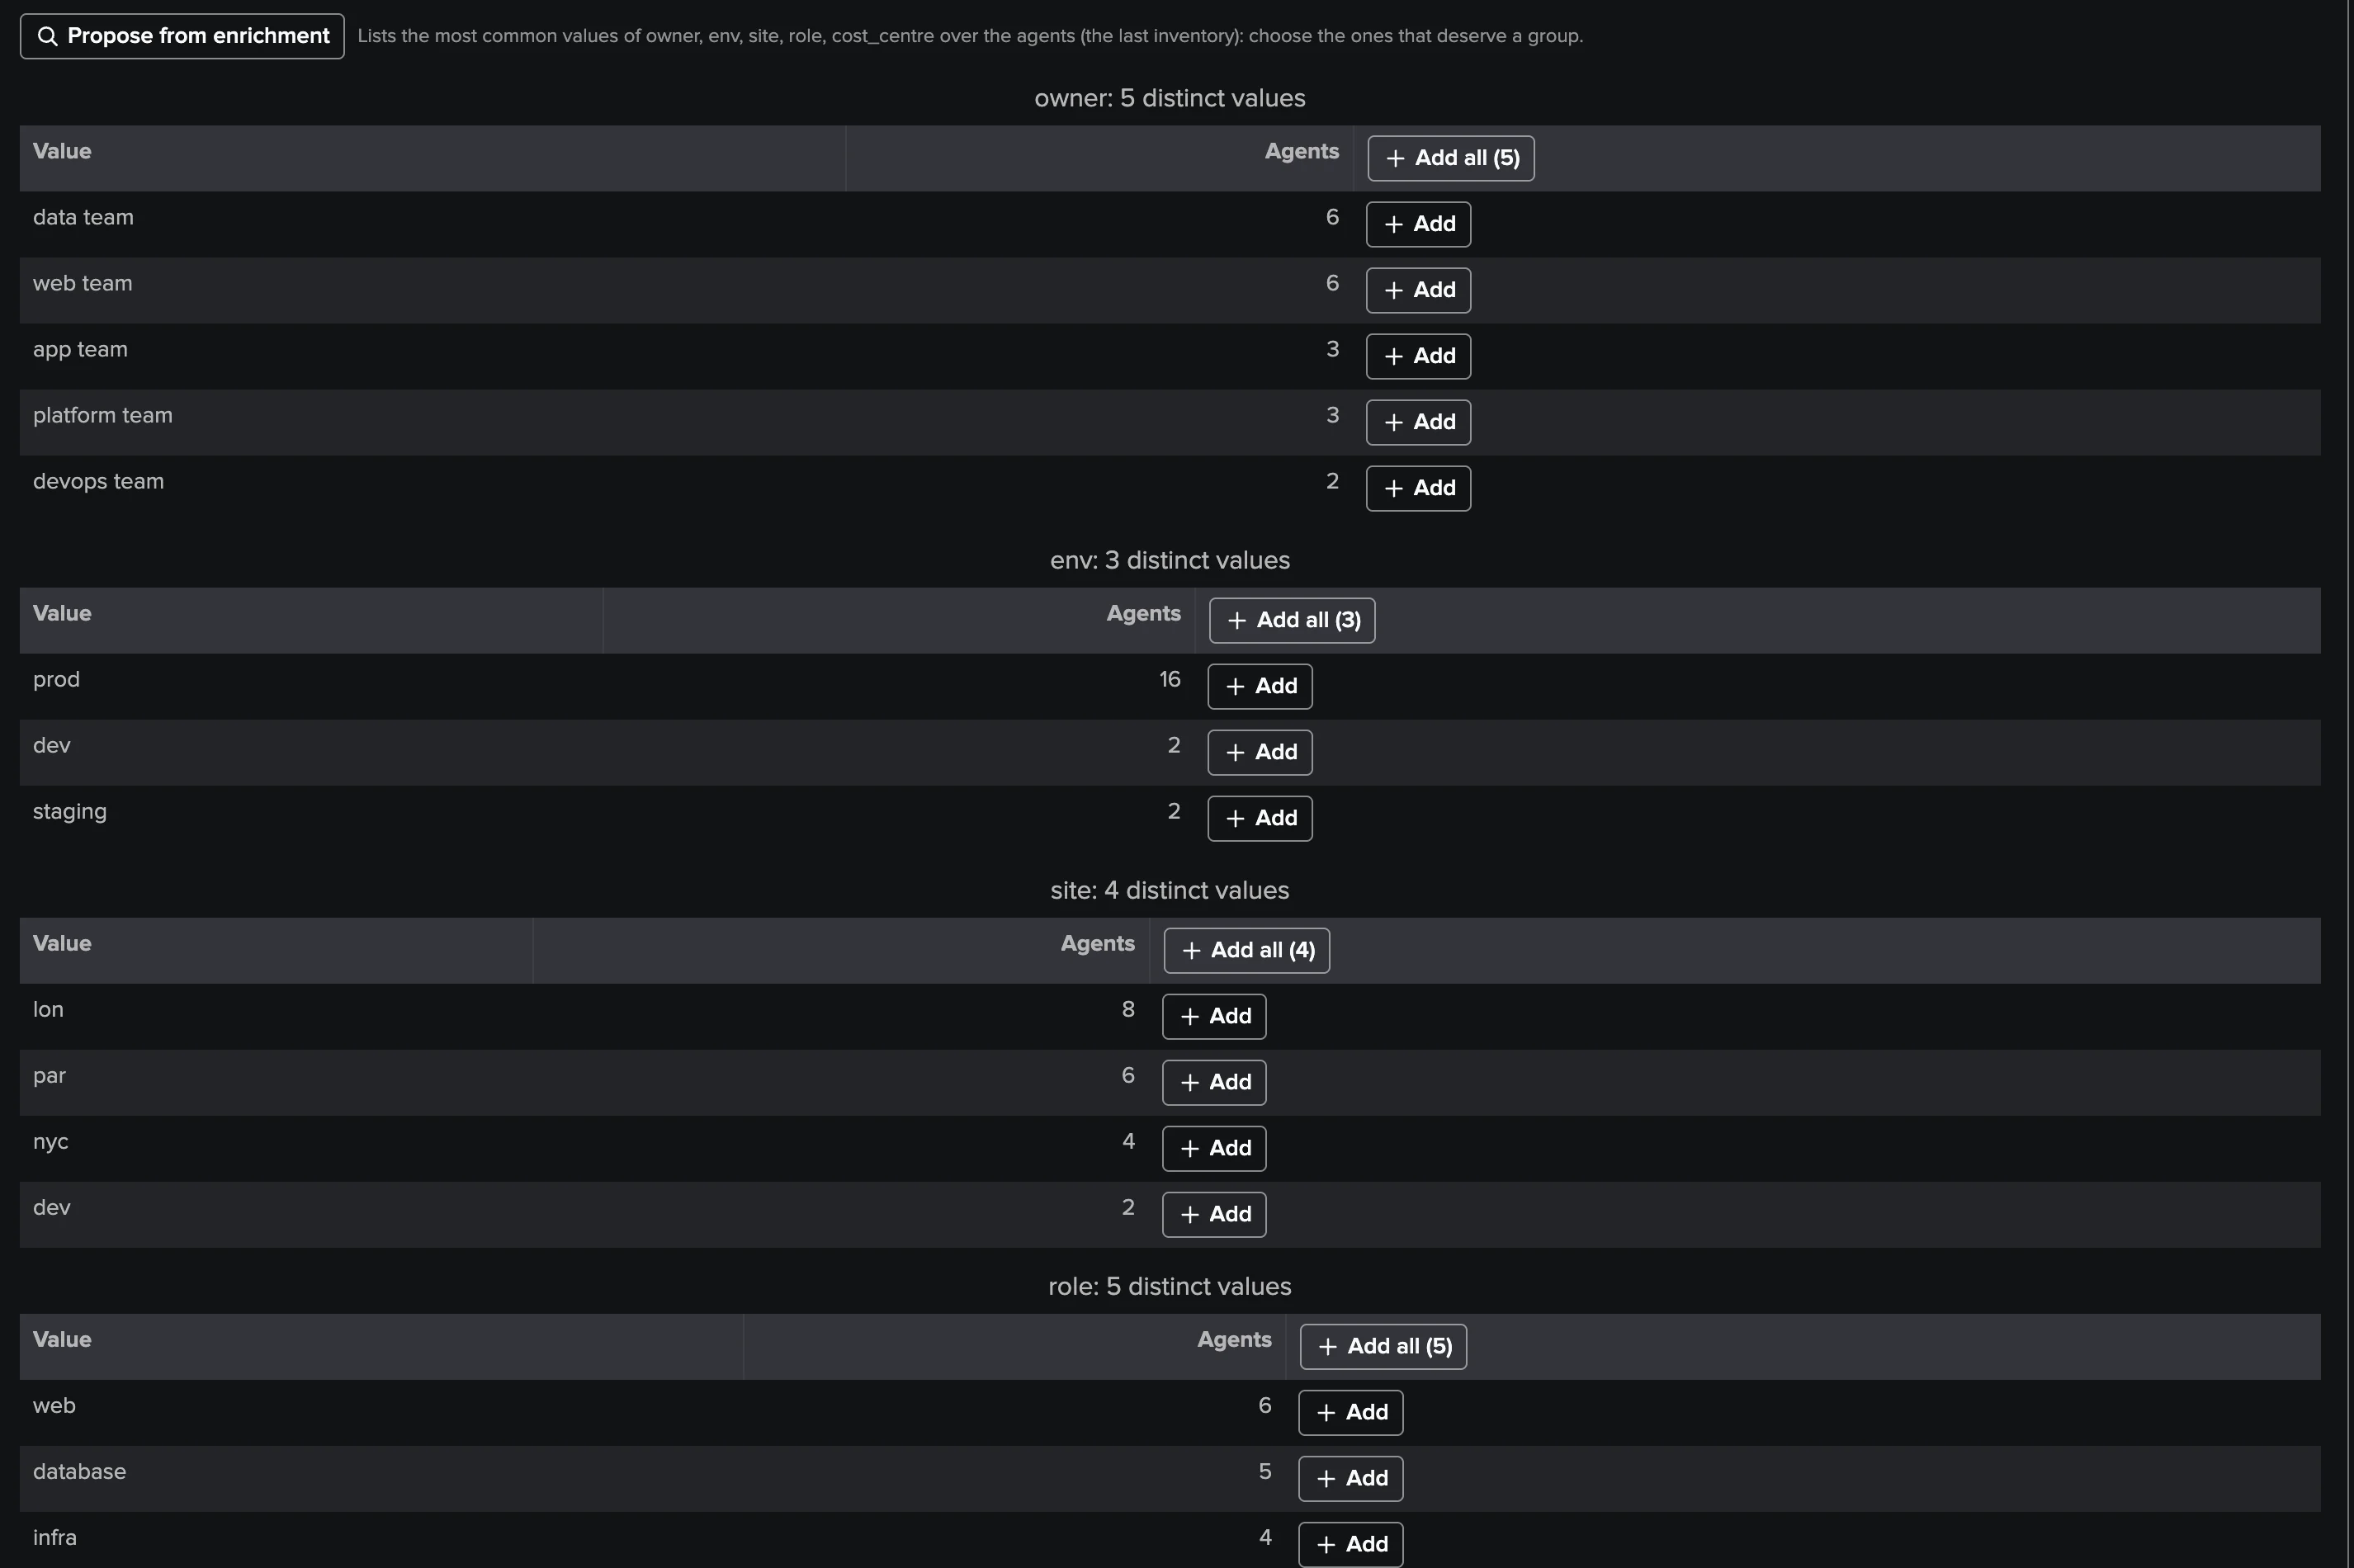
Propose from enrichment lists the most common values of each enrichment field with their agent counts: add a value, or every value of a field at once.
A new or edited group reads pending until the next collection computes it (a server class or output group group needs the next inventory). To see it at once, Run now the inventory in Collection health, then the live job. A group’s membership state is current, app events, pending or last known (a read failed: the members of the last computation; such a group never recovers a finding).
Expected agents
The agents that must always stay connected — the databases, the DNS, the bastions — are selected in
the Expected agent missing policy (Policies tab): typed host names or GUIDs (* allowed) and up
to 20 lookup tables. A name never seen is reported missing at once. Test selection runs as a
search with your rights and shows the selected agents by state, the names never seen and the
patterns selecting none; it saves nothing.
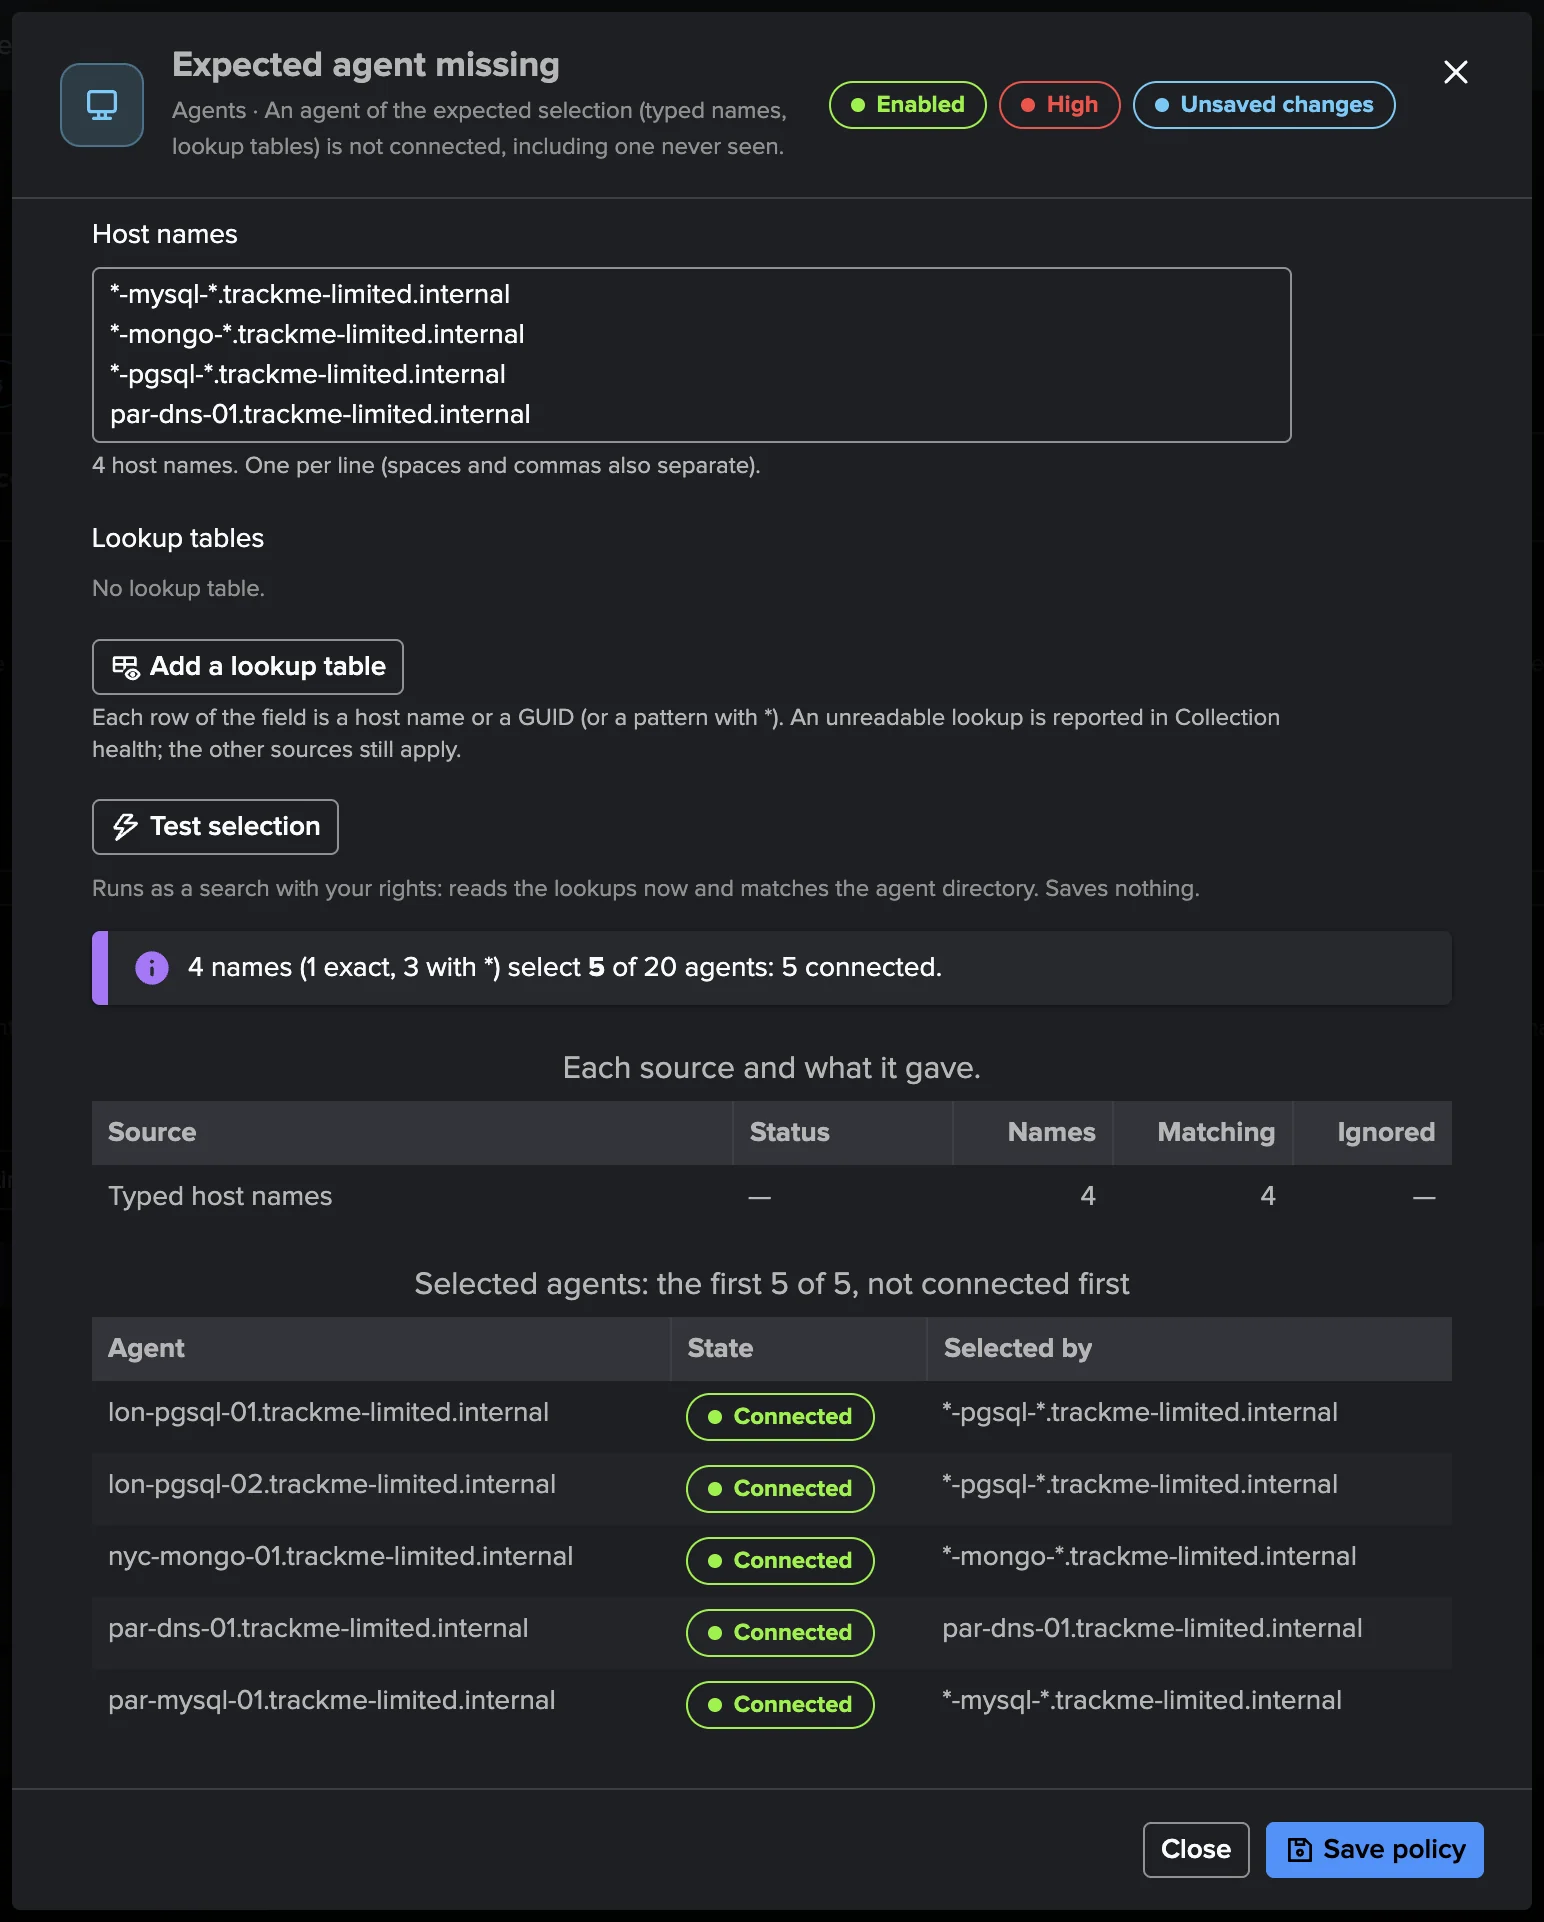
In the Agents tab, Add to expected adds the selected agents’ host names; the agents the policy selects carry a pin. The policy’s grace delays the finding when you need it.
Notifications
Settings → Notifications emails the transitions of the tenant’s findings: the events notified, the minimum severity, the policies, the email delivery account, the recipients, and the mode — one digest per live run, or one threaded email per transition of a Finding group — with the finding’s chart and key measurements embedded. In per Finding group mode, when more than 10 Finding groups have updates to send at once (agents of a whole site reconnecting, say), they go as one digest instead.
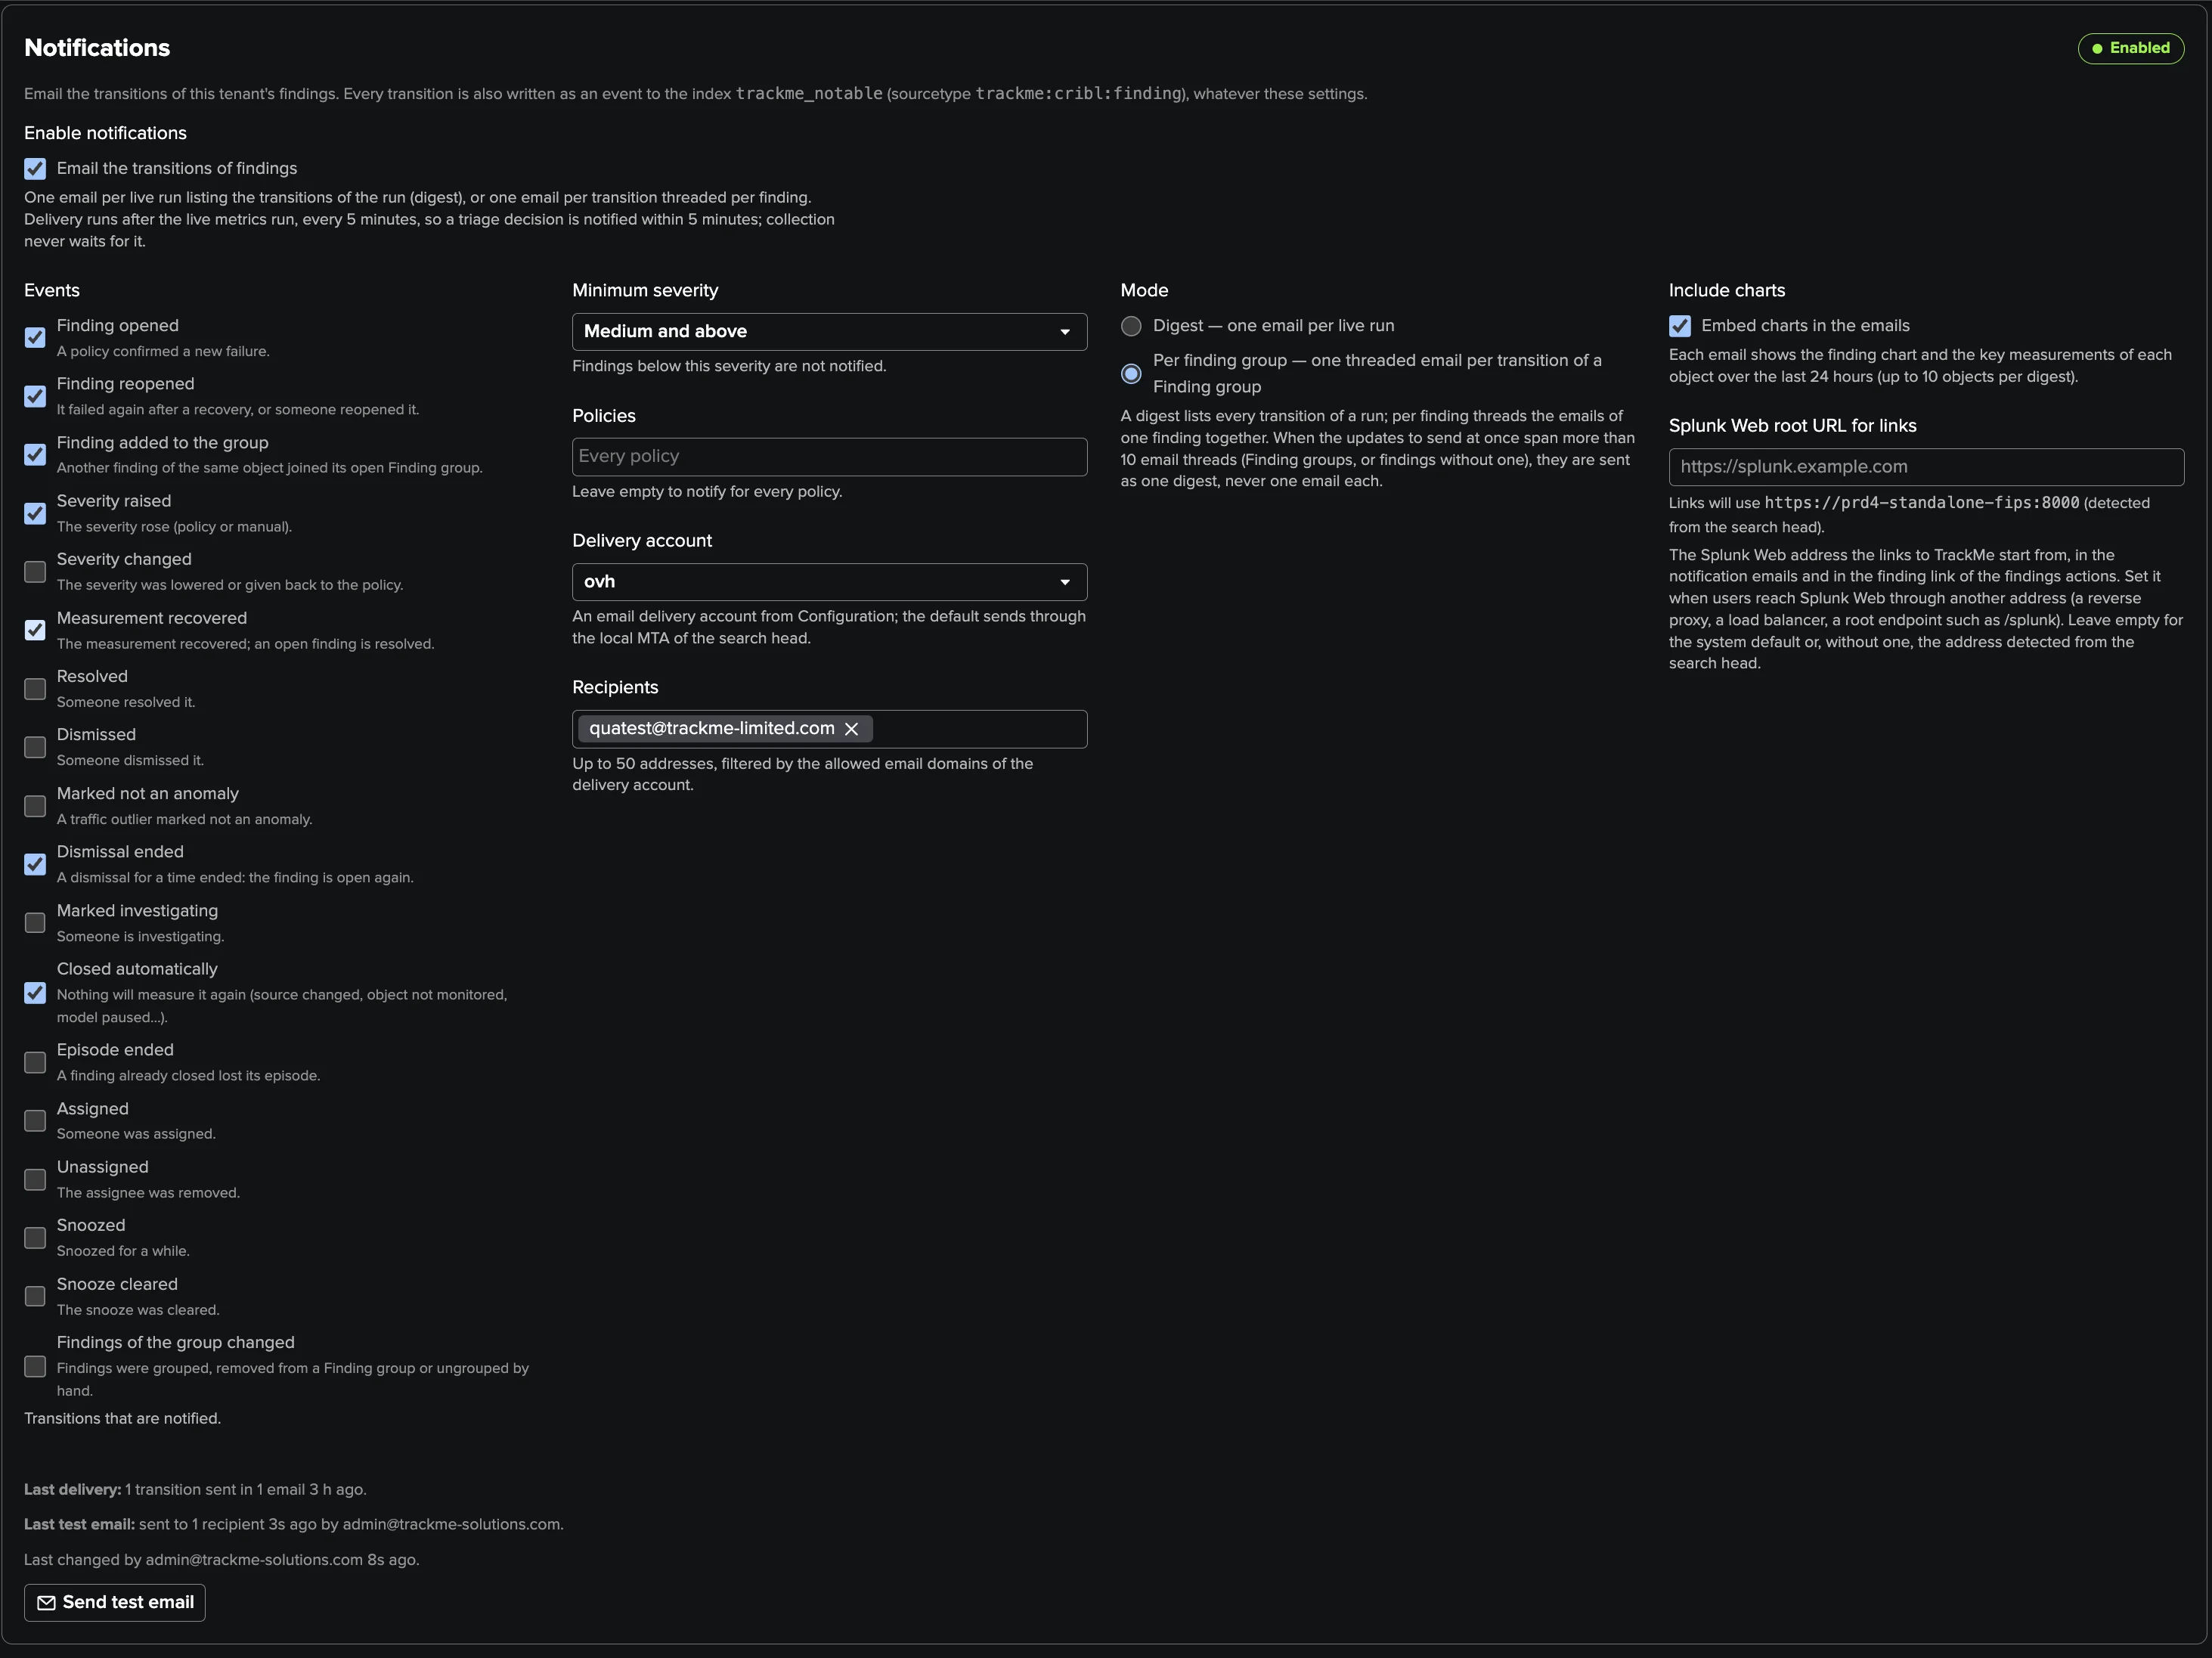
Every transition is also written as an event to the tenant’s notable index, whatever these settings. See Findings, Finding groups and findings actions.
The workspace
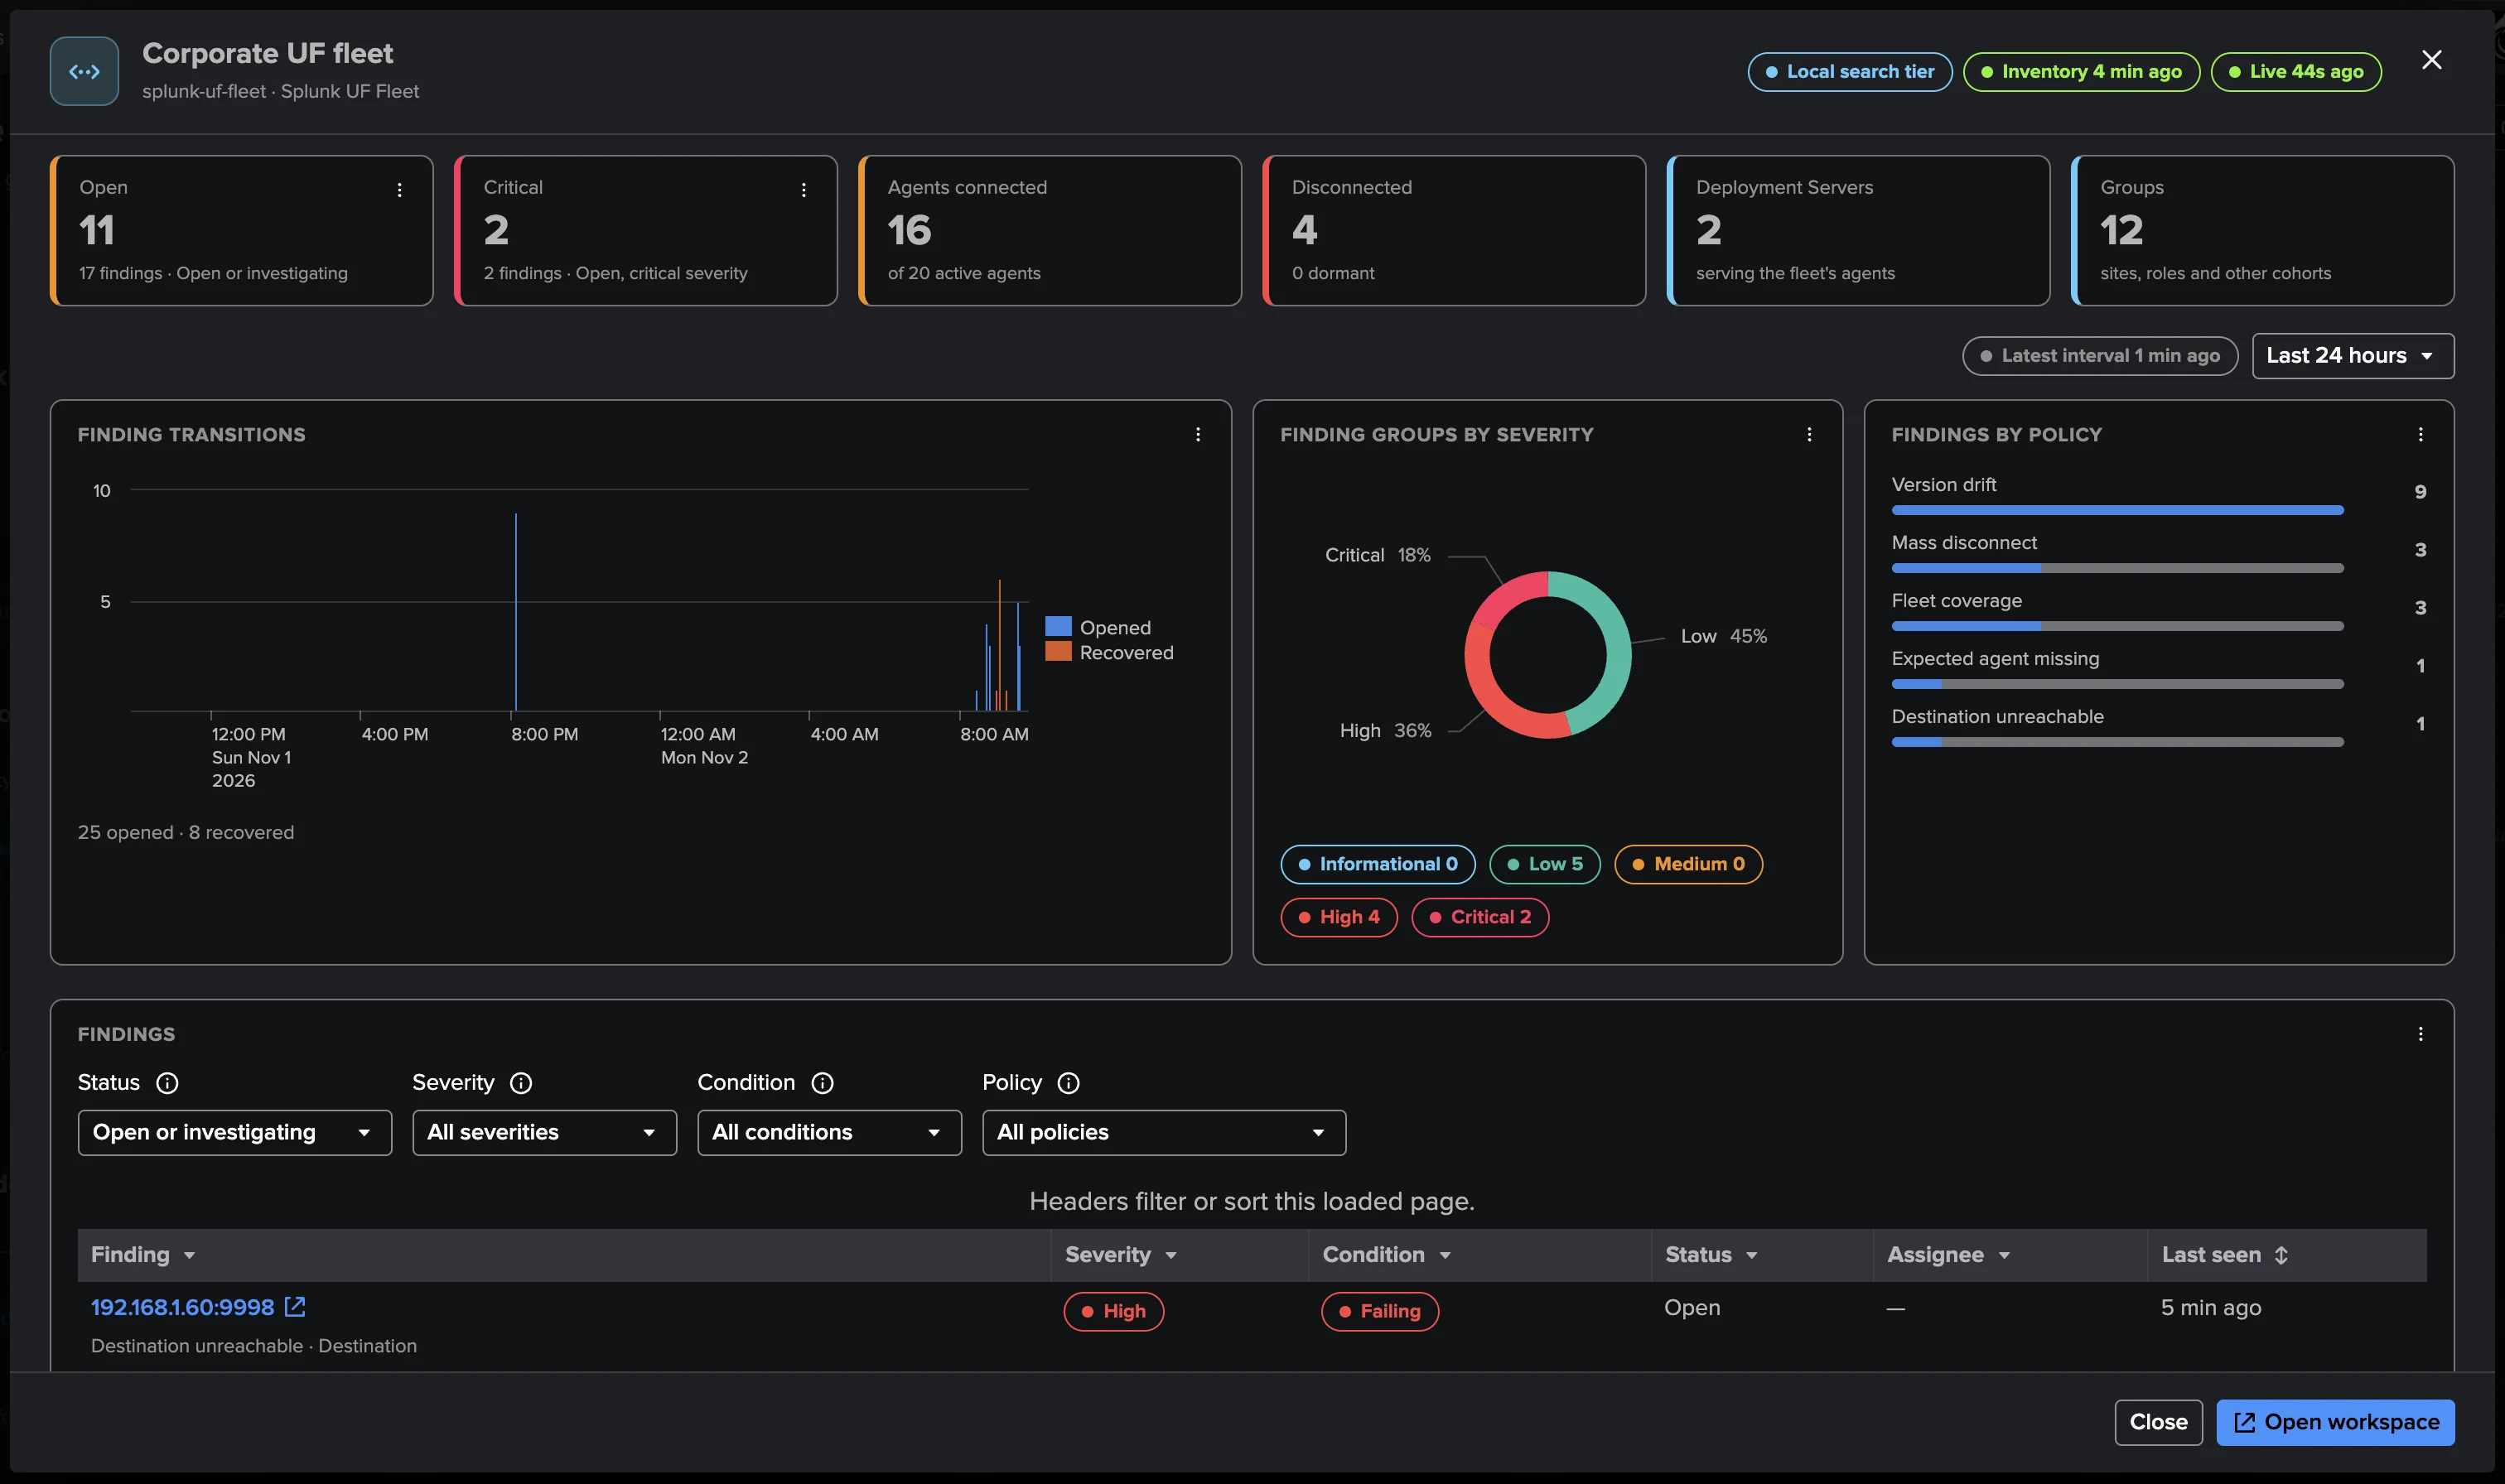
The preview. On the Virtual Tenants page, a double-click on the tenant card opens its preview before the workspace: the source and the collection pills, the Open and Critical figures, Agents connected, Disconnected (with the dormant agents), Deployment Servers and Groups, the finding transitions and severities of the last 24 hours, the findings by policy and the findings table, read-only. A finding opens in the workspace; Open workspace opens the tenant. Before the first live run, the figures read as dashes.
The workspace is the Tenant Home of the tenant. A status strip sits above the tabs: the source, “N of M agents connected” (opens the disconnected agents), “N dormant”, “N Deployment Servers”, the Inventory and Live job pills (each opens Collection health), Refresh and Collect now (runs the live job).
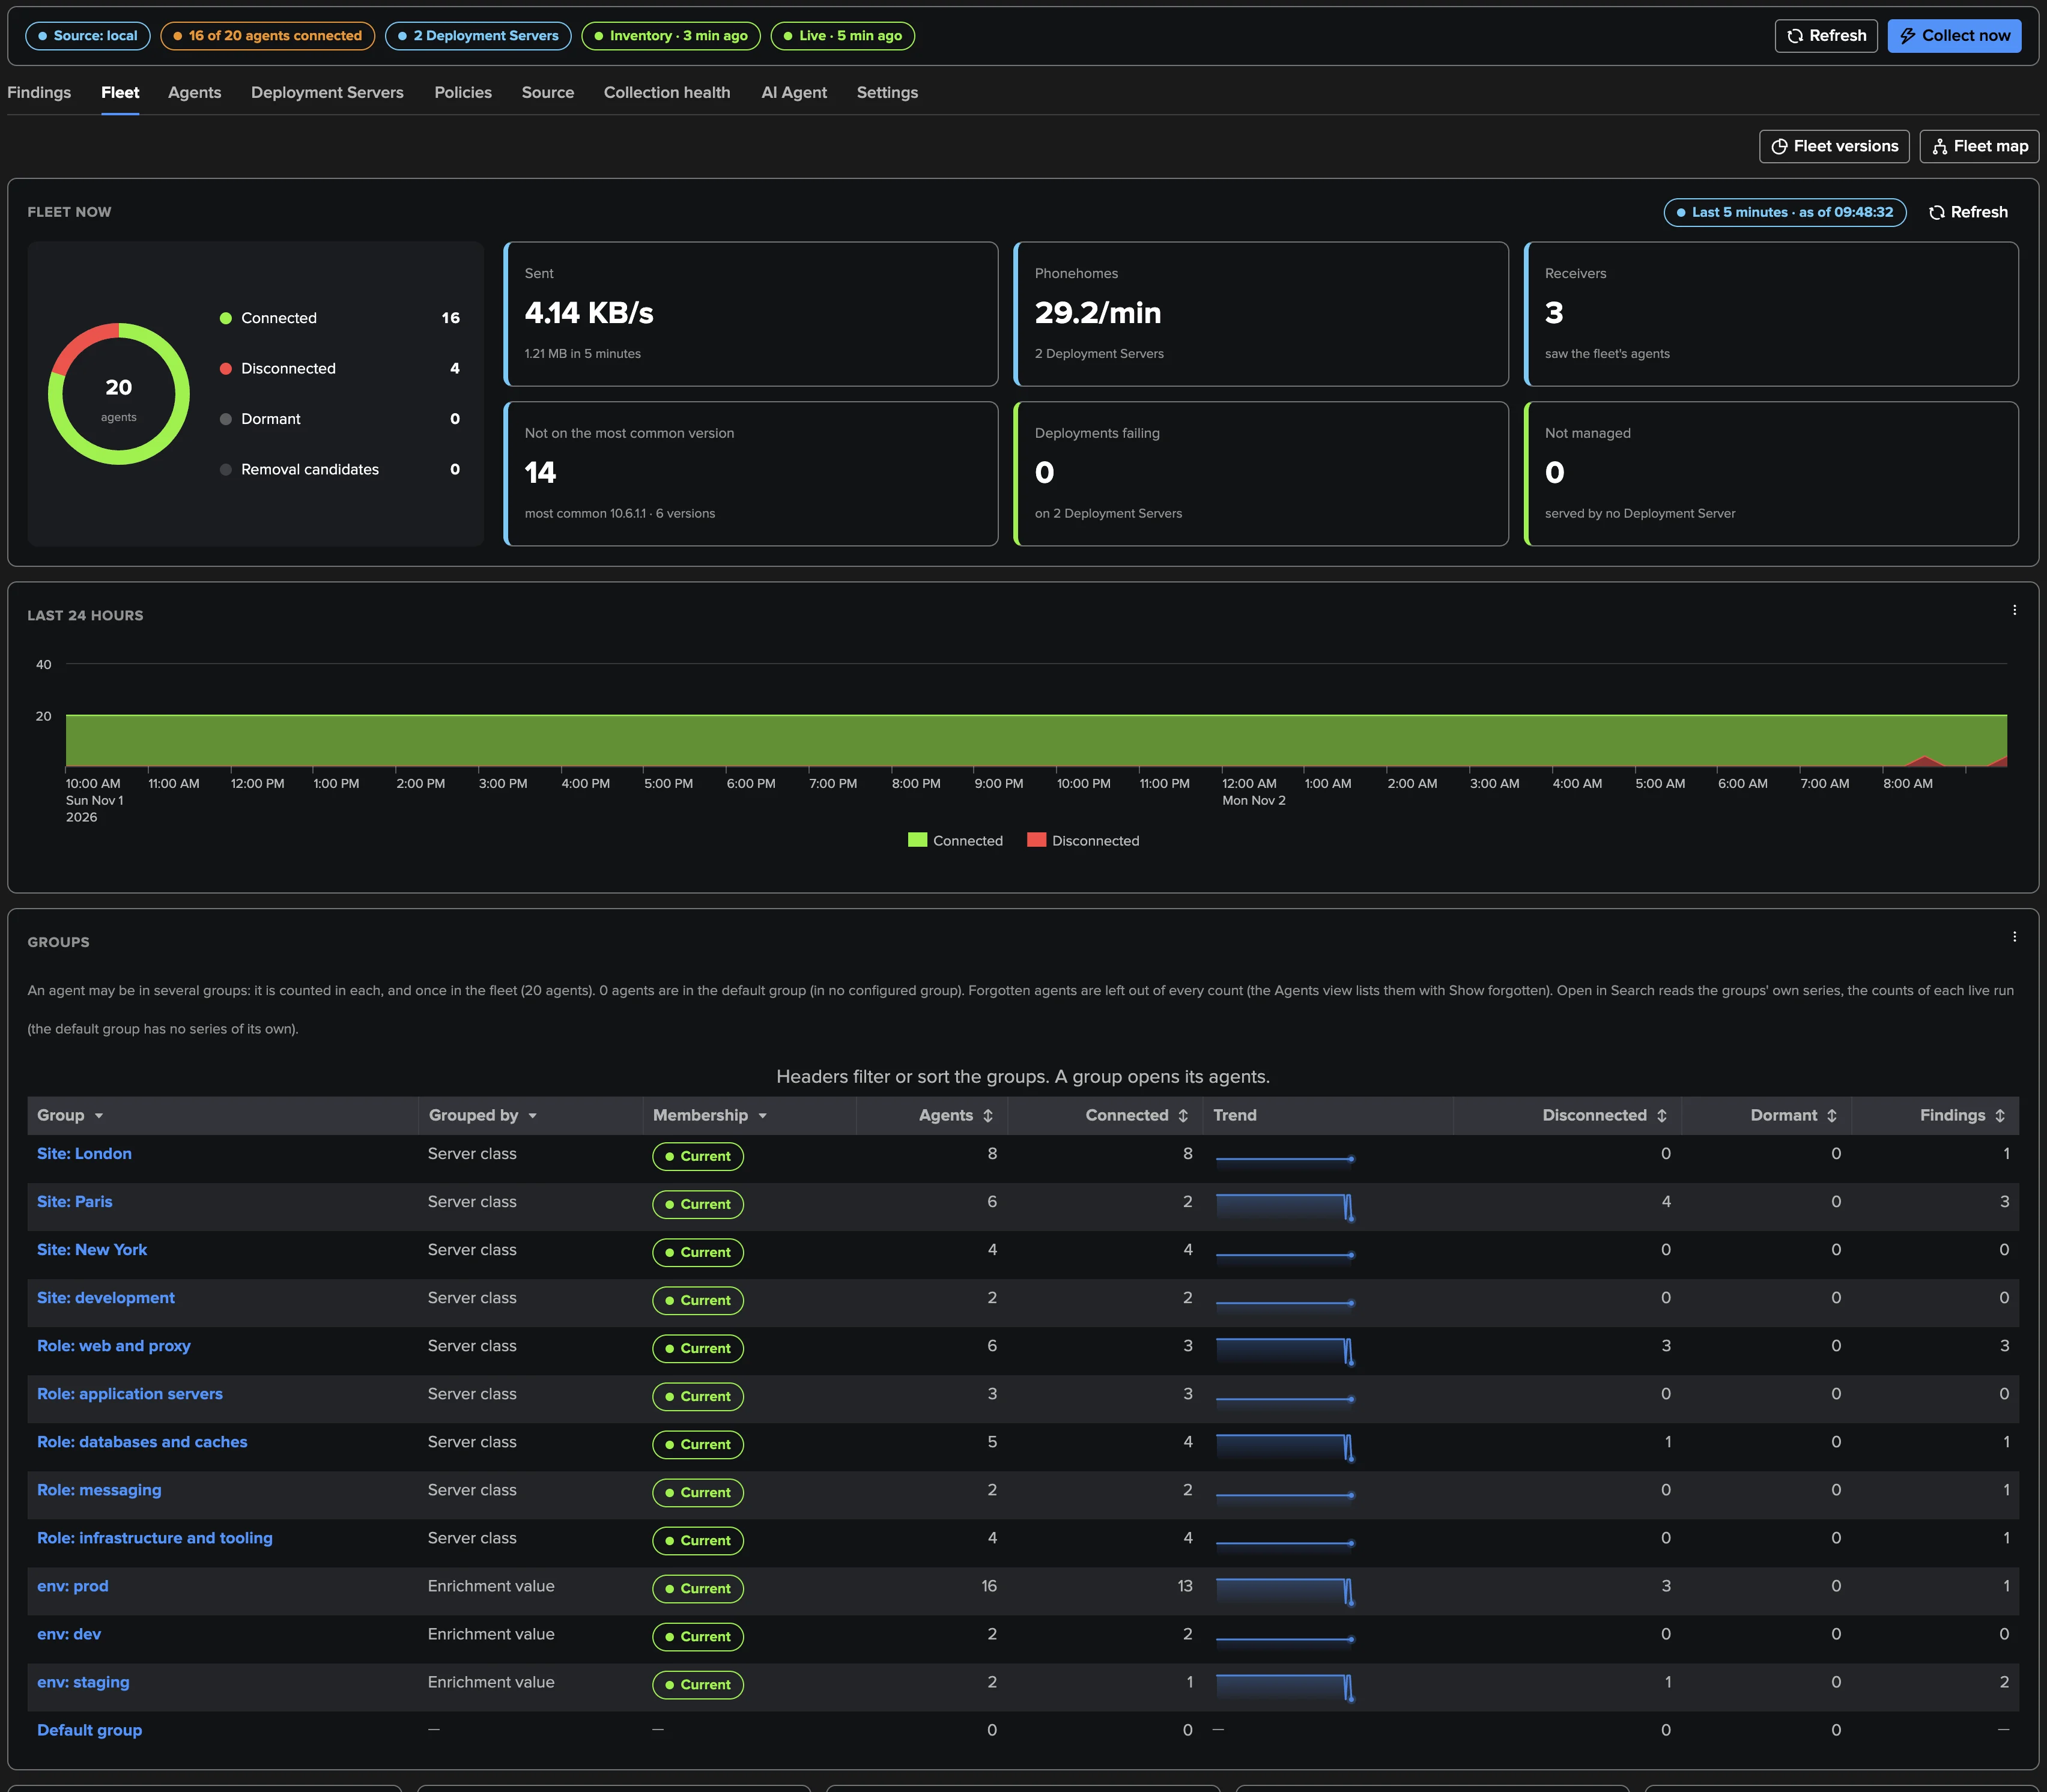
Tab |
What it shows |
|---|---|
Findings |
The findings centre shared by every dedicated tenant (see Findings, Finding groups and findings actions). Families: Agents, Agent groups, Fleet, Deployment Servers, Destinations. Open resource opens the agent, its Deployment Server or the Fleet tab in place. |
Fleet |
Fleet now: the agents by state (Connected, Disconnected, Dormant, Removal candidates, each opening the Agents tab on that state) and the agents connected by heartbeat only, beside two rows of tiles: the Last 5 minutes (sent per second, phonehomes per minute, the receivers that saw the fleet), then the fleet’s management (Not on the most common version, Deployments failing across the Deployment Servers, Not managed: served by no Deployment Server). Last 24 hours: the connected and disconnected agents over time; breakdowns (disconnection ages, versions, platforms, agent types, agents per Deployment Server, each opening the Agents tab filtered); the Groups panel (each group’s membership state, counts, a 24-hour line and its open cohort findings); the recently disconnected agents; and the Fleet map, a generated topology of the fleet, its groups and Deployment Servers. |
Agents |
Every agent of the fleet, paged on the server, with filters on state, type, phonehome, group, expected and host name; forgotten agents are listed only with Show forgotten (off by default). Columns: agent, state, heartbeat, type, version, platform, Deployment Server, groups, the first three enrichment fields, signals and state since. Signal pills open the facts and their evidence. Forget and Add to expected act on the selection; the footer’s Rows per page (25, 50 or 100) is your own preference for the tenant. |
Deployment Servers |
Every Deployment Server: clients, phonehomes, pace against its usual, failing deployments, restarts, CPU, memory, last phonehome. |
Policies |
The policy catalogue, custom policies, and How it is evaluated for every policy. |
Source |
The search tier, the qualification, the telemetry form, the receivers seen, what the rules left out, and the collection runs with their outcome and receipt. |
Collection health, AI Agent, Settings |
See below. |
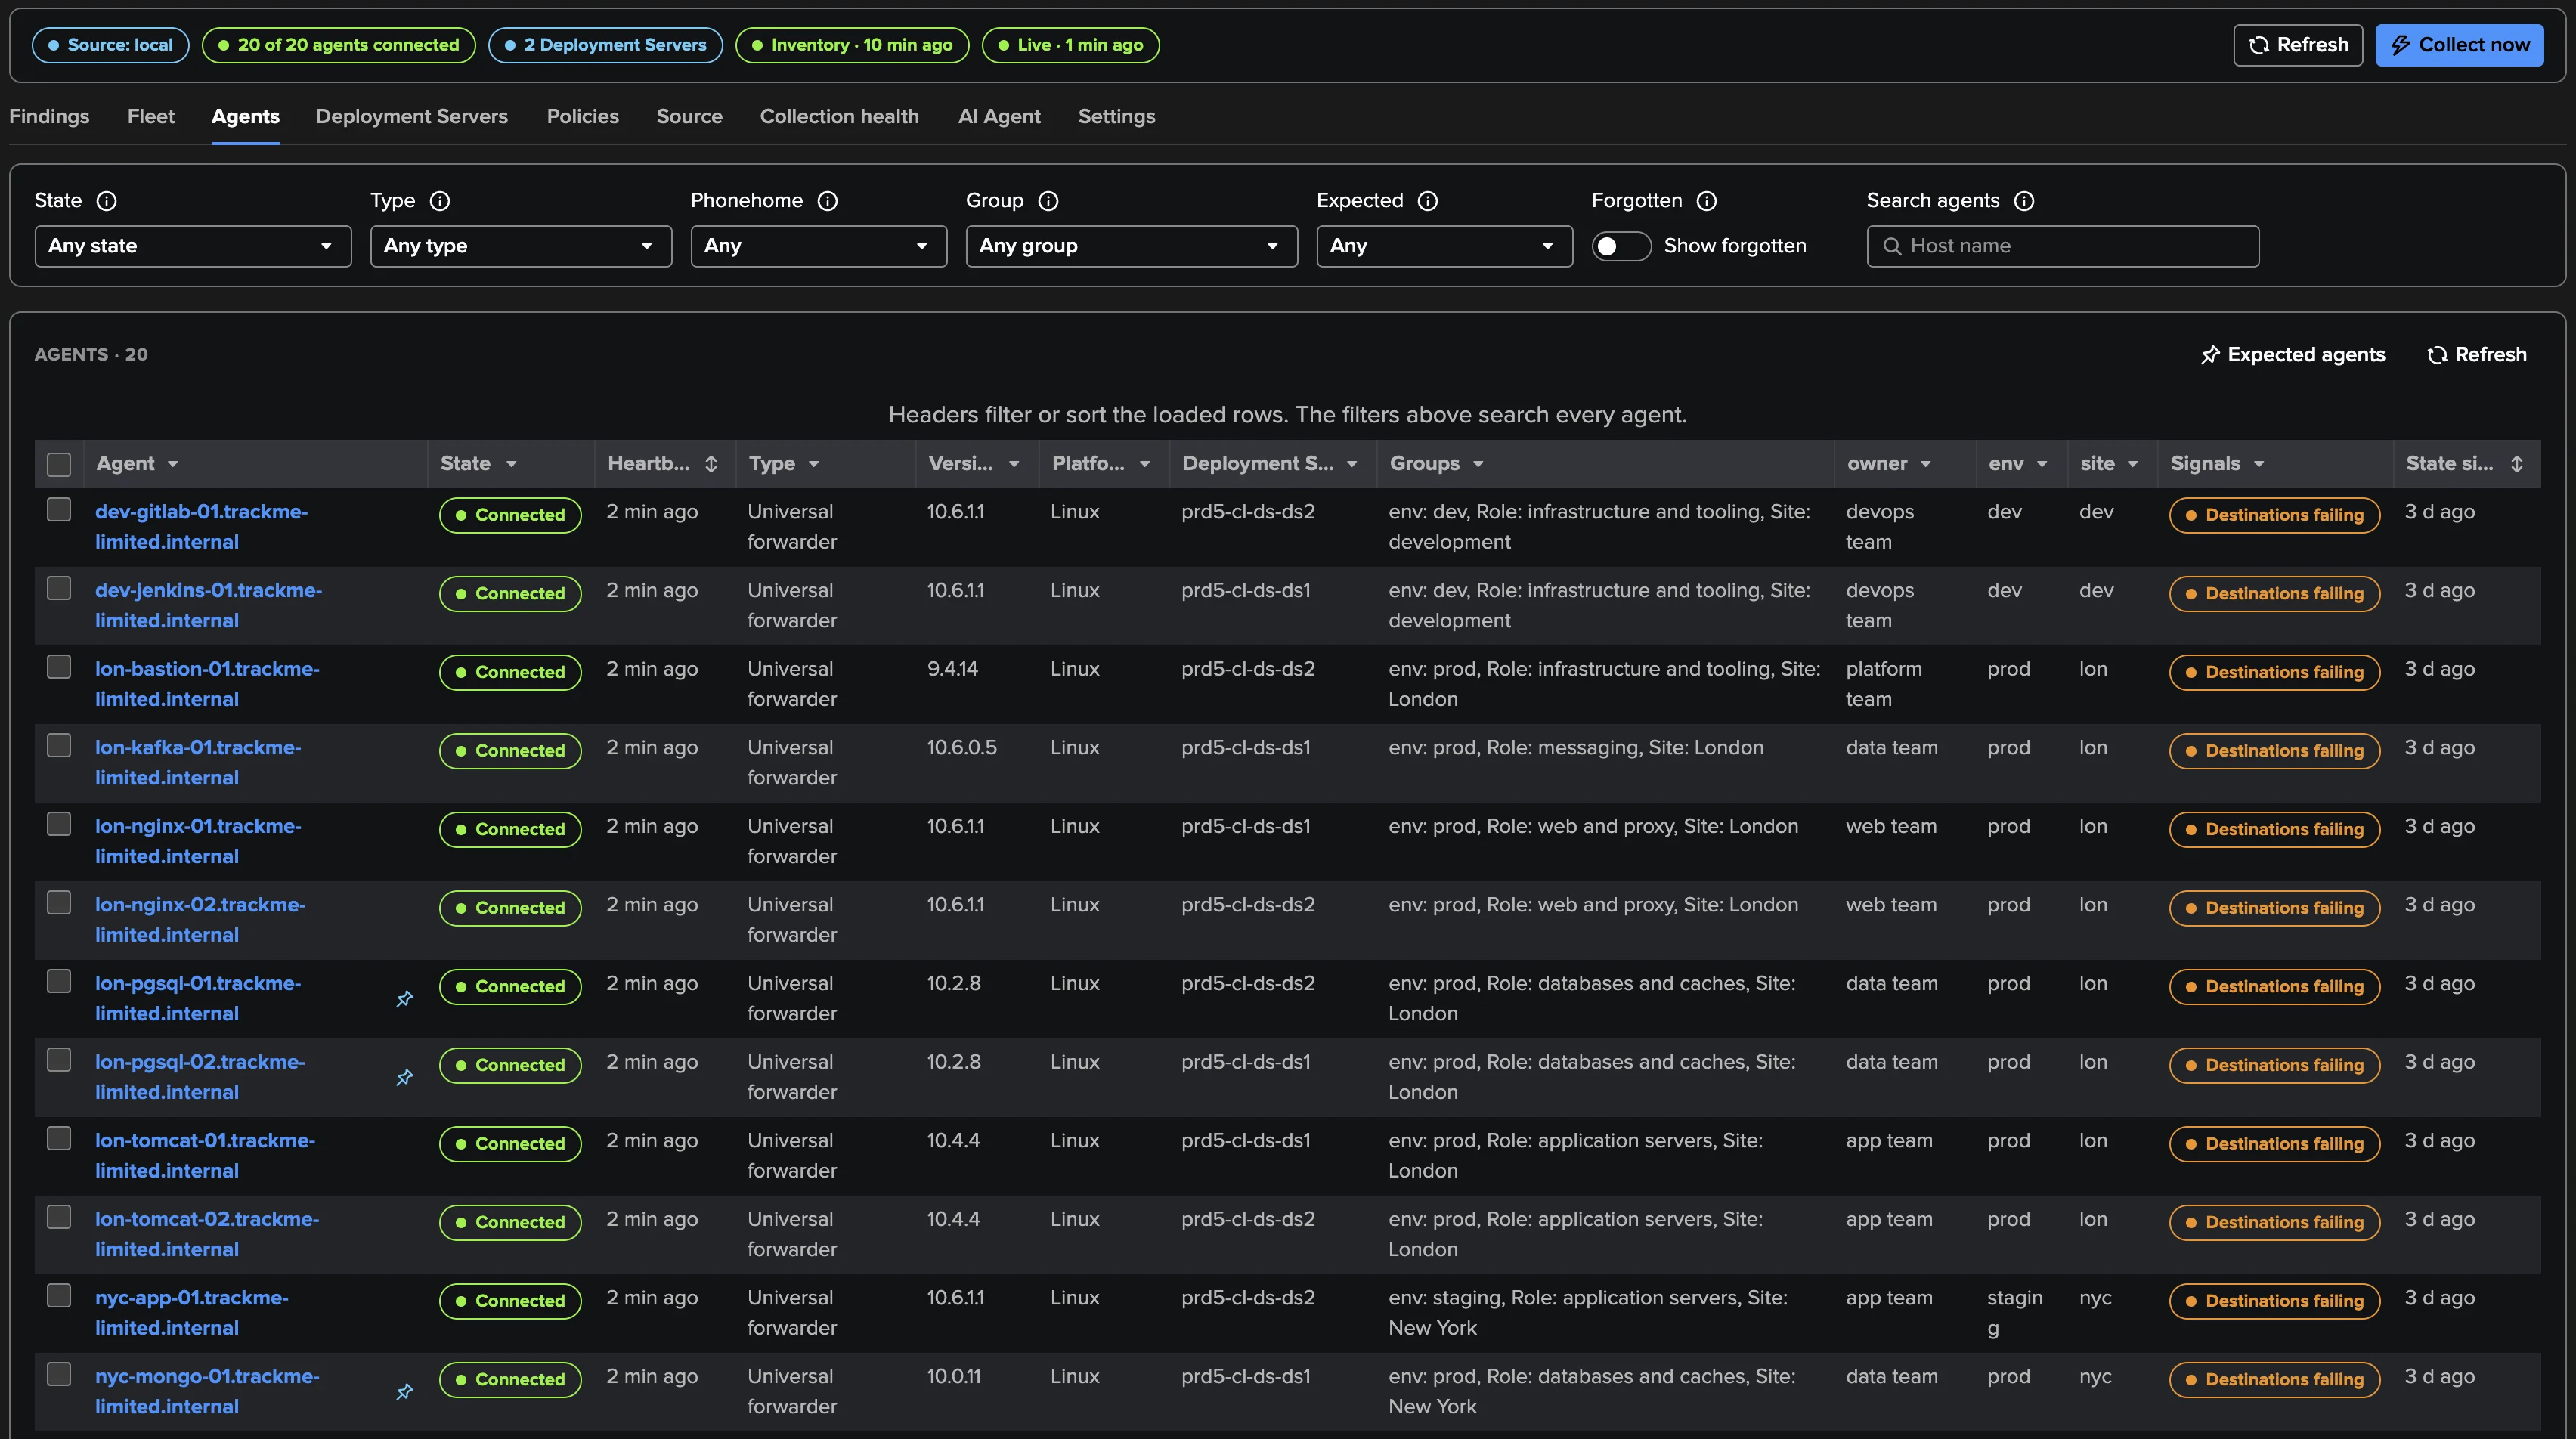
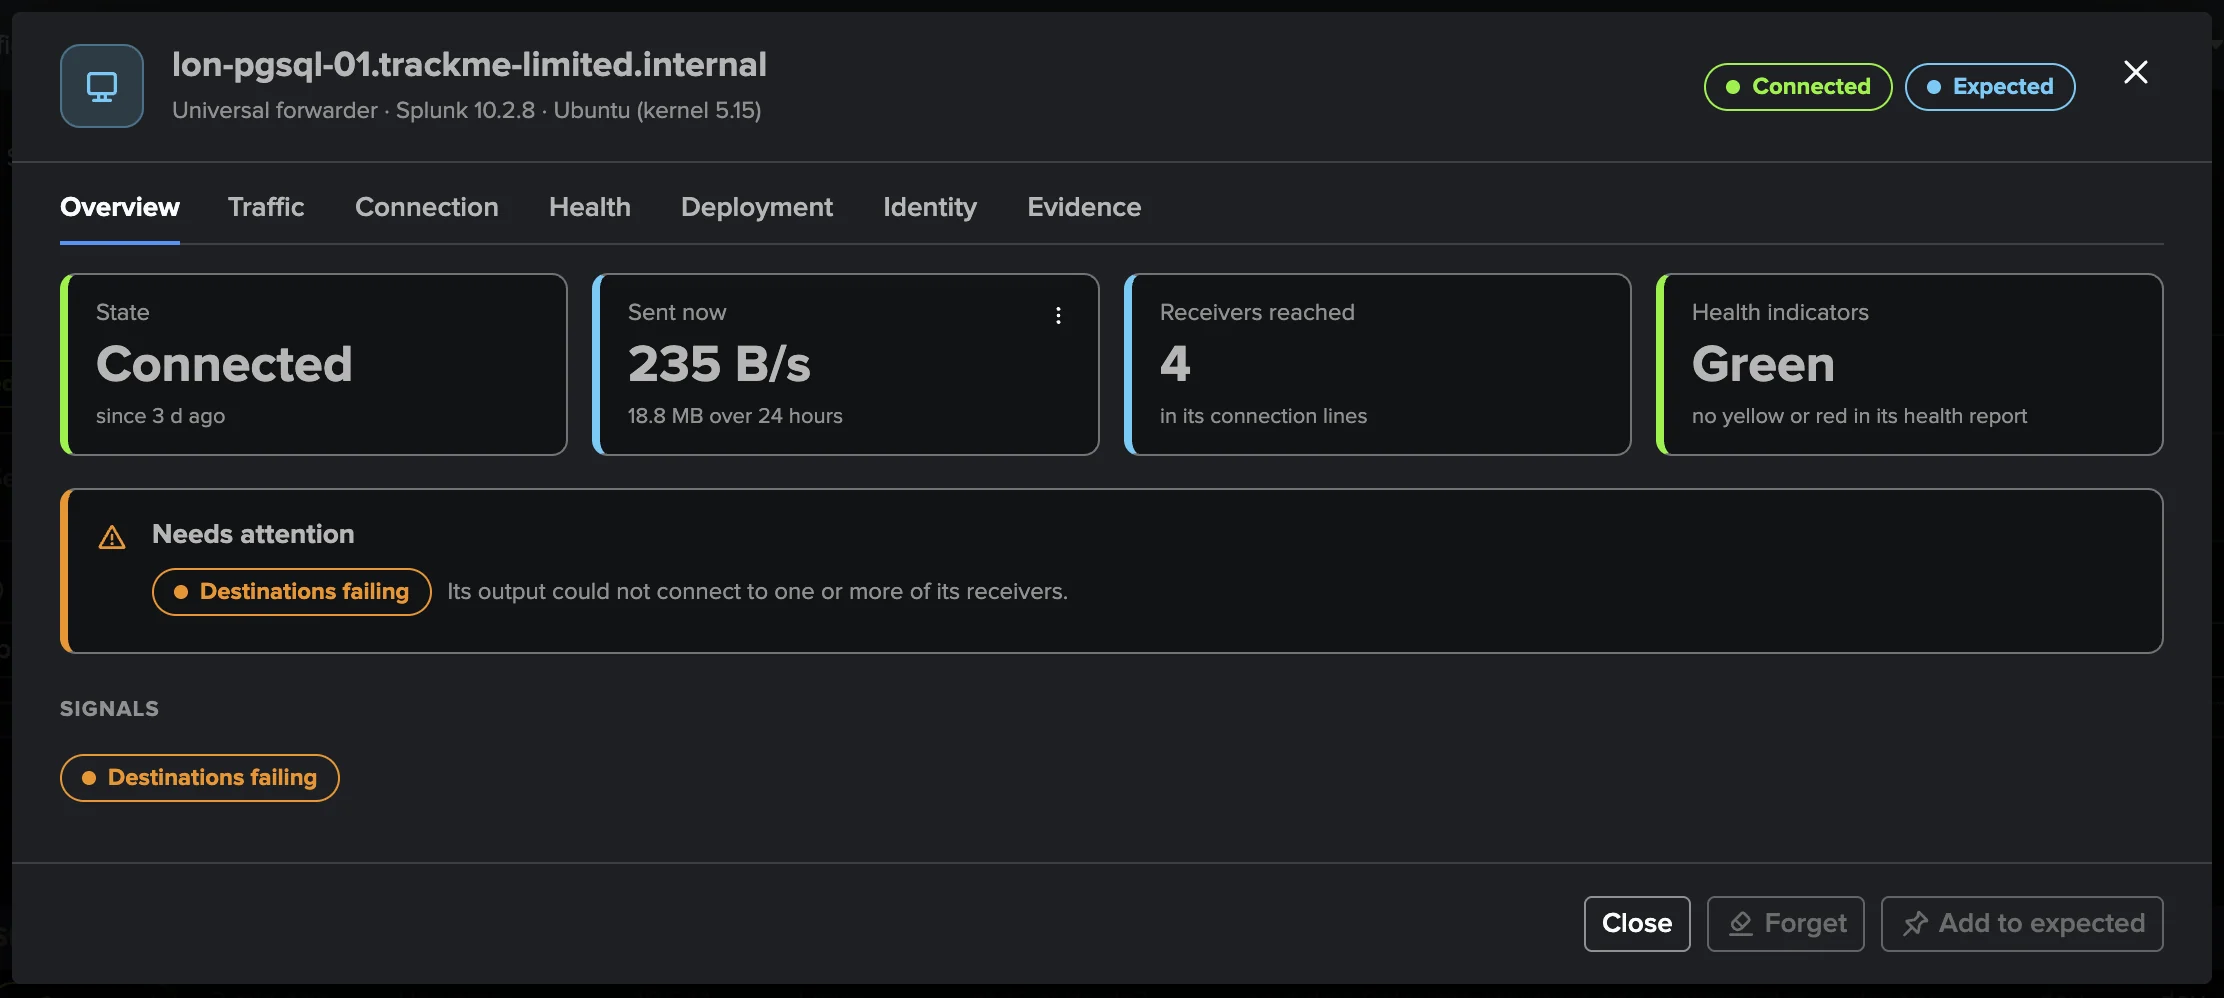
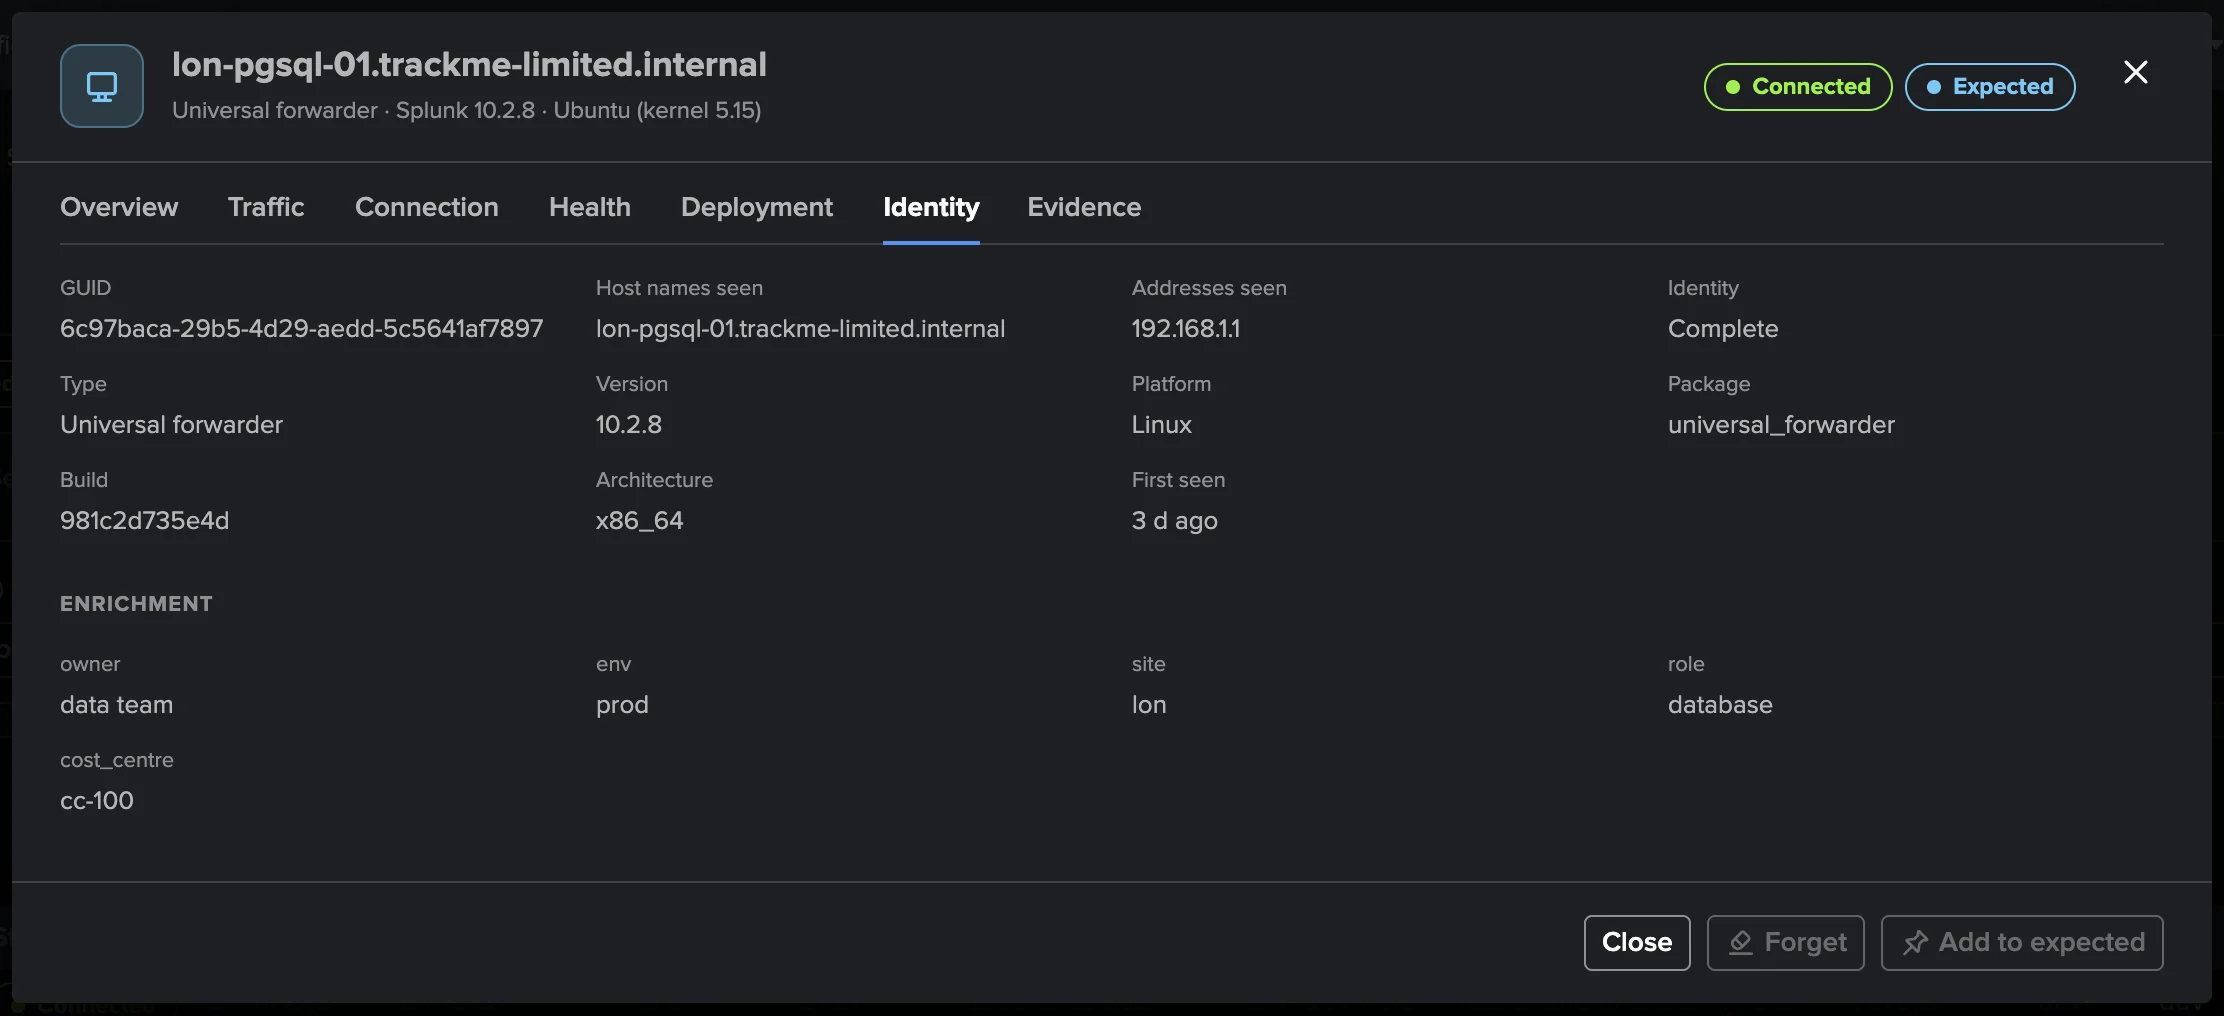
The agent modal has tabs Overview (state, sent now and over 24 hours, receivers reached, health, and what needs attention with its open findings), Traffic (data sent per second and the receivers reached, split per receiver), Connection, Health (its own logs’ signals), Deployment (its Deployment Server, phonehome cadence, failing deployments, app events), Identity (with its Enrichment) and Evidence. Forget and Add to expected are in its footer, disabled with the reason when they do not apply: a connected agent cannot be forgotten, and an agent the Expected agent missing policy already selects shows Expected and needs no adding.

The Deployment Server modal has tabs Overview (clients, failing deployments, restarts asked, the Load and Per client readings, the refused requests and the 95th percentile of the phonehome answer), Activity (phonehomes per 15 minutes against the usual at that hour, the clients phoning home over time), Deployments, Clients, Resources and Evidence.
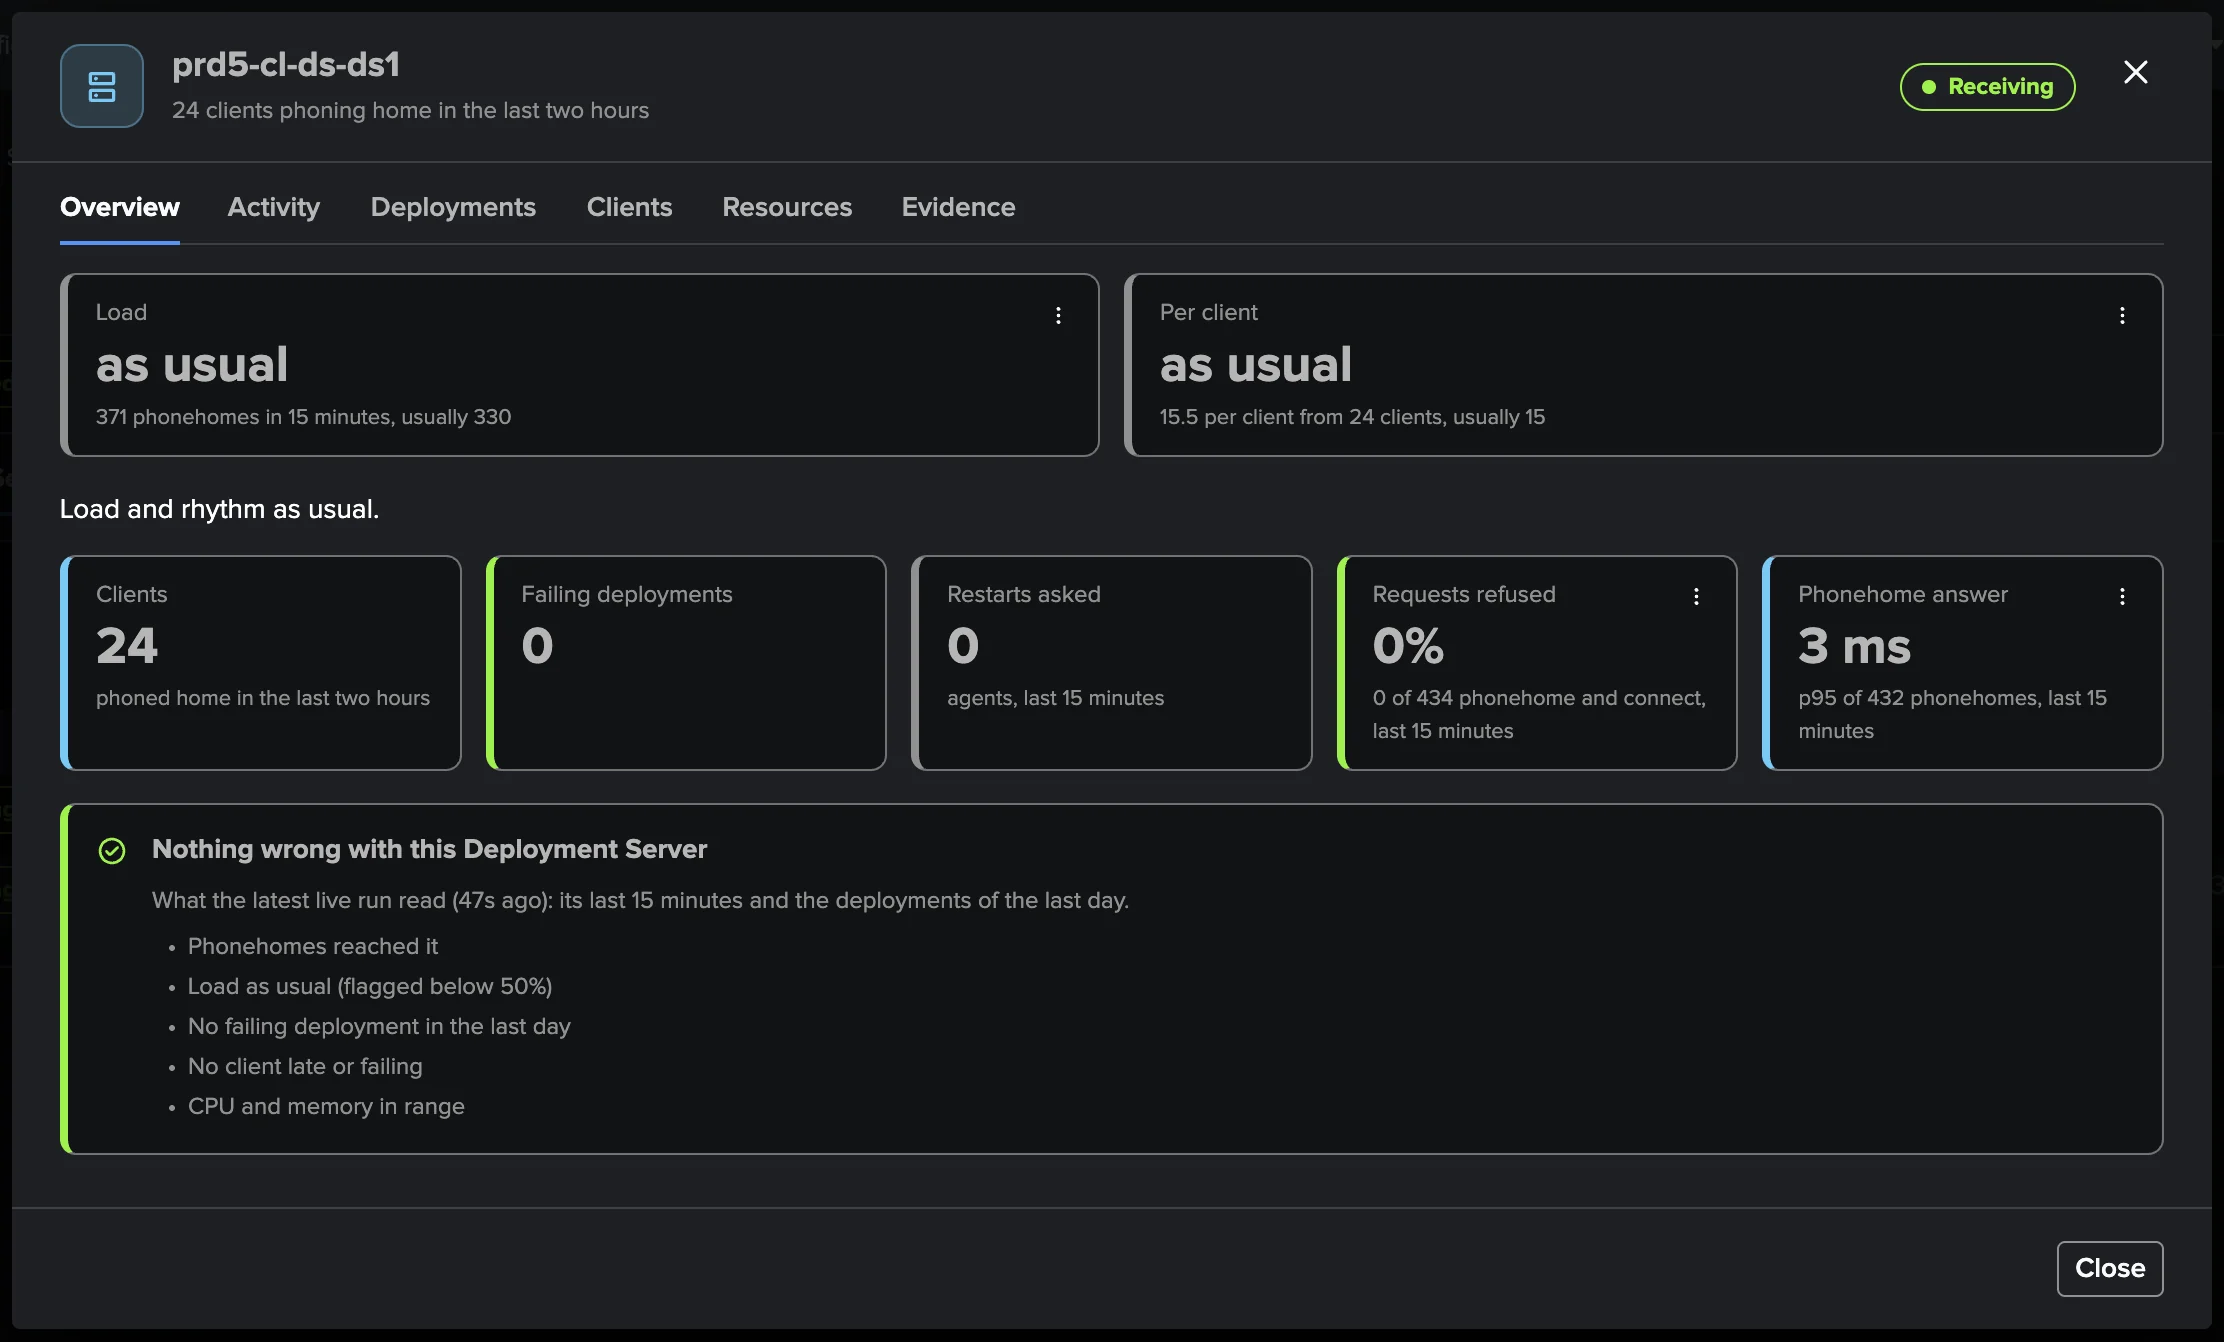
Load and Per client read together: Load compares the phonehomes with the usual for the hour (what the Deployment Server carries), Per client compares the phonehomes per client with the usual per client (the clients’ rhythm). Load up with a stable rhythm means more clients; both up, clients phoning home more often; load down with a stable rhythm, clients that left.
Policies
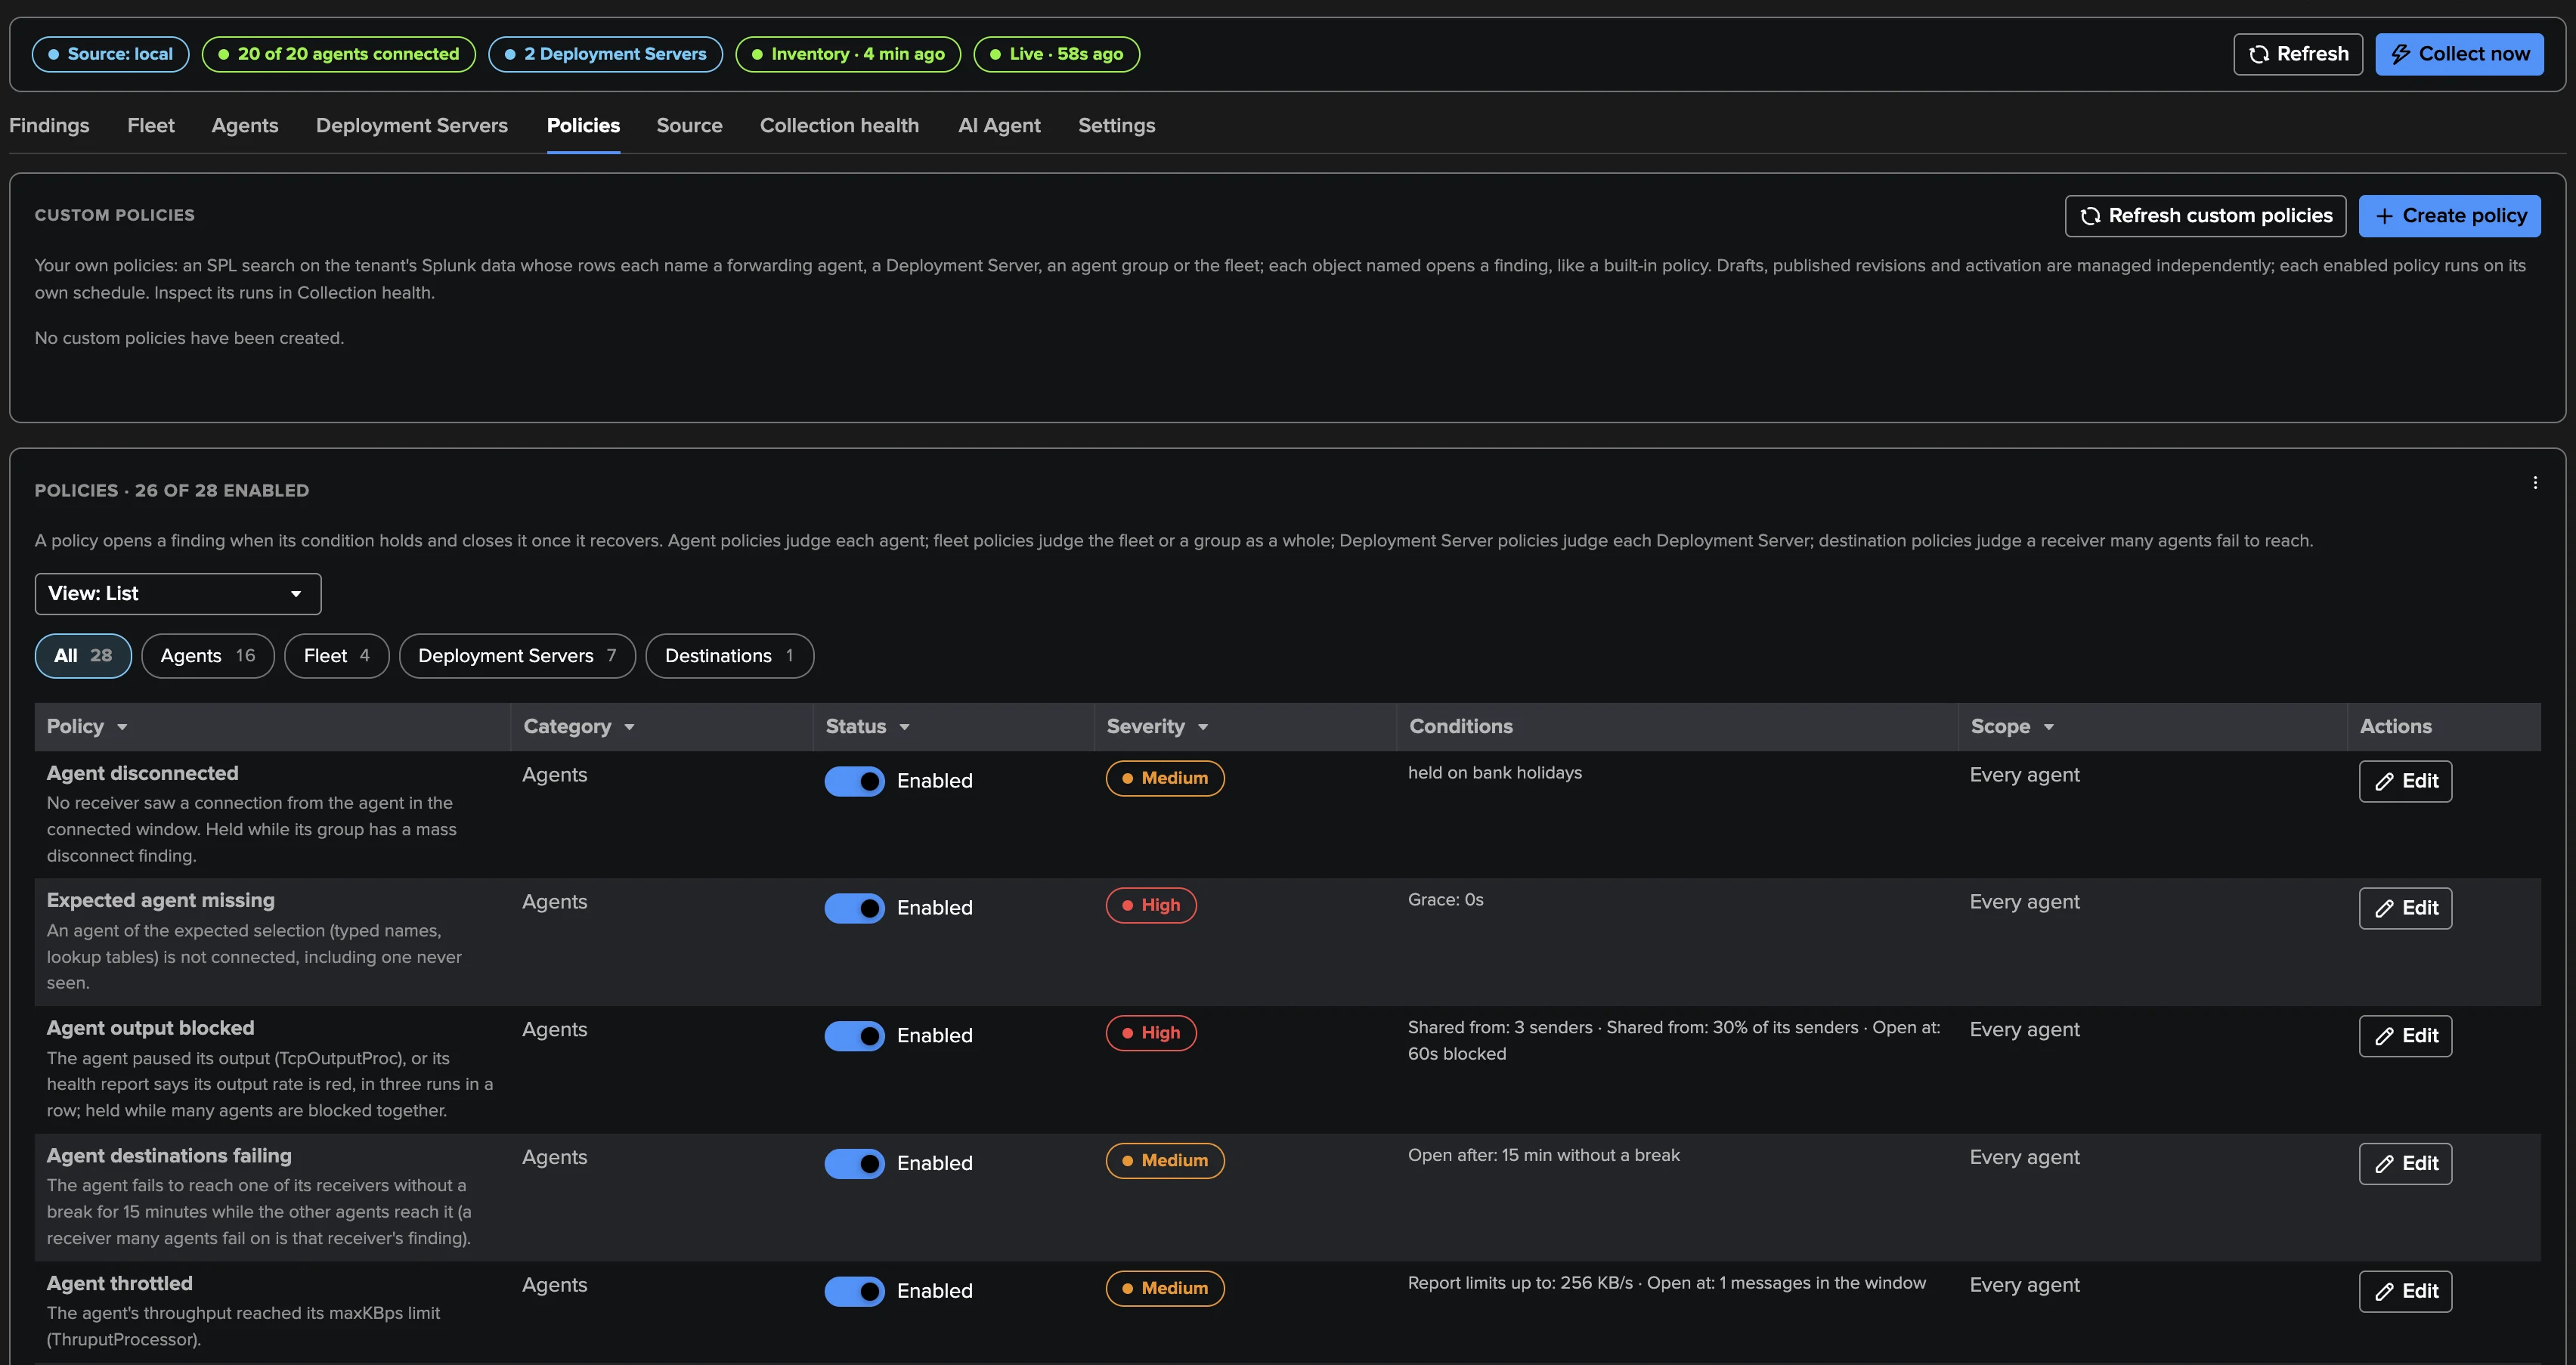
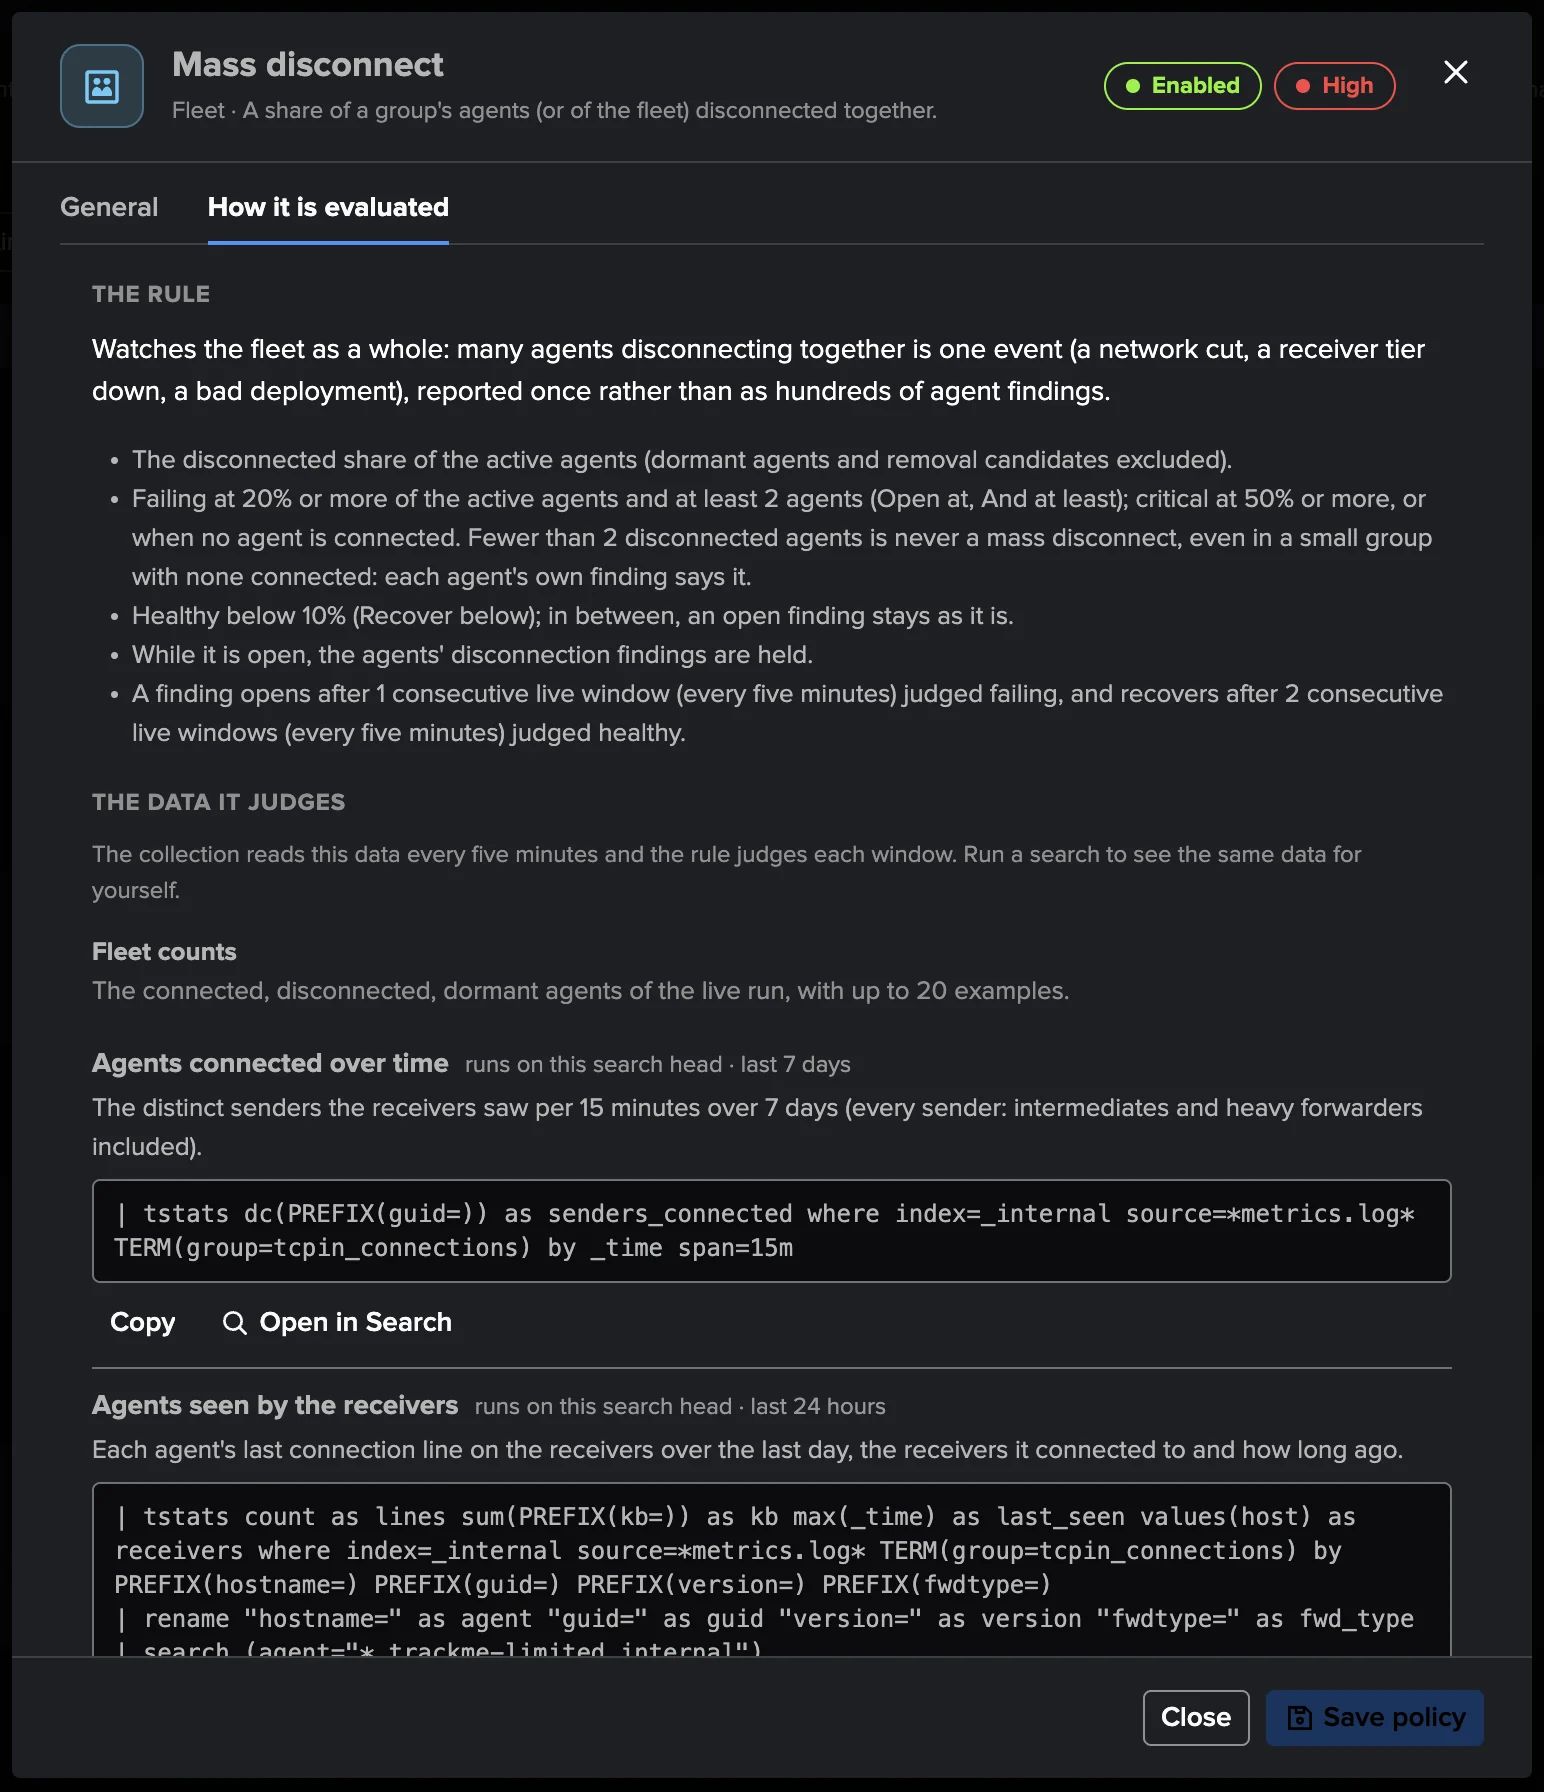
Twenty-eight built-in policies cover the agents, the fleet and its groups, the Deployment Servers and the destinations; every policy is evaluated. Each has its severity, the runs it needs to open and to recover, a scope (Groups: empty means every agent, the fleet and every group; chosen groups judge those groups and the agents they hold, never the fleet), a bank holiday hold, and a How it is evaluated tab: the rule as configured, the data it reads with ready-to-run searches on the tenant’s own source, how to investigate and how to resolve.
The most useful policies to know first:
Agent disconnected (medium) — no receiver saw the agent in the connected window. Held while the fleet or one of its groups has a Mass disconnect; becoming dormant closes it as dormant.
Expected agent missing (high) — an agent of the expected selection is not connected, a name never seen included. Dormancy never closes it.
Mass disconnect (high, critical at 50 % or none connected) — 20 % or more of a group’s (or the fleet’s) active agents, and at least 2, disconnected together: one finding holding the agents’ own findings.
Agent output blocked (high) and Agent destinations failing (medium) — from the agent’s own logs: its output paused, or one receiver unreachable for 15 minutes while the other agents reach it.
App deployment failed (high) and Deployment failures (high) — an app deployed to an agent failed to download or install; app downloads or installs failing on a Deployment Server.
Deployment Server silent (high) and Phonehome drop (high) — a Deployment Server with clients receives no phonehome, or far fewer than usual at this hour.
Agent version unsupported (off by default) — the agent runs below the minimum versions you set; it decides nothing until a minimum is set.
Every policy, its defaults and its settings are in Built-in policies.
Custom policies. Above the catalogue, TrackMe administrators of the tenant write their own SPL:
each result row names an agent (agent), a Deployment Server (ds), a group (group) or the
fleet, and opens a finding like a built-in policy. See Custom policies.
Findings in practice
A finding of a Splunk UF Fleet tenant reads like every finding of a dedicated tenant (see Findings, Finding groups and findings actions): one row per Finding group, the decision history, the policy’s measurements, triage (investigate, snooze, dismiss, resolve), assignment, notes, findings actions and Ask the AI Agent. Open resource opens the agent, its Deployment Server or the Fleet tab in place.
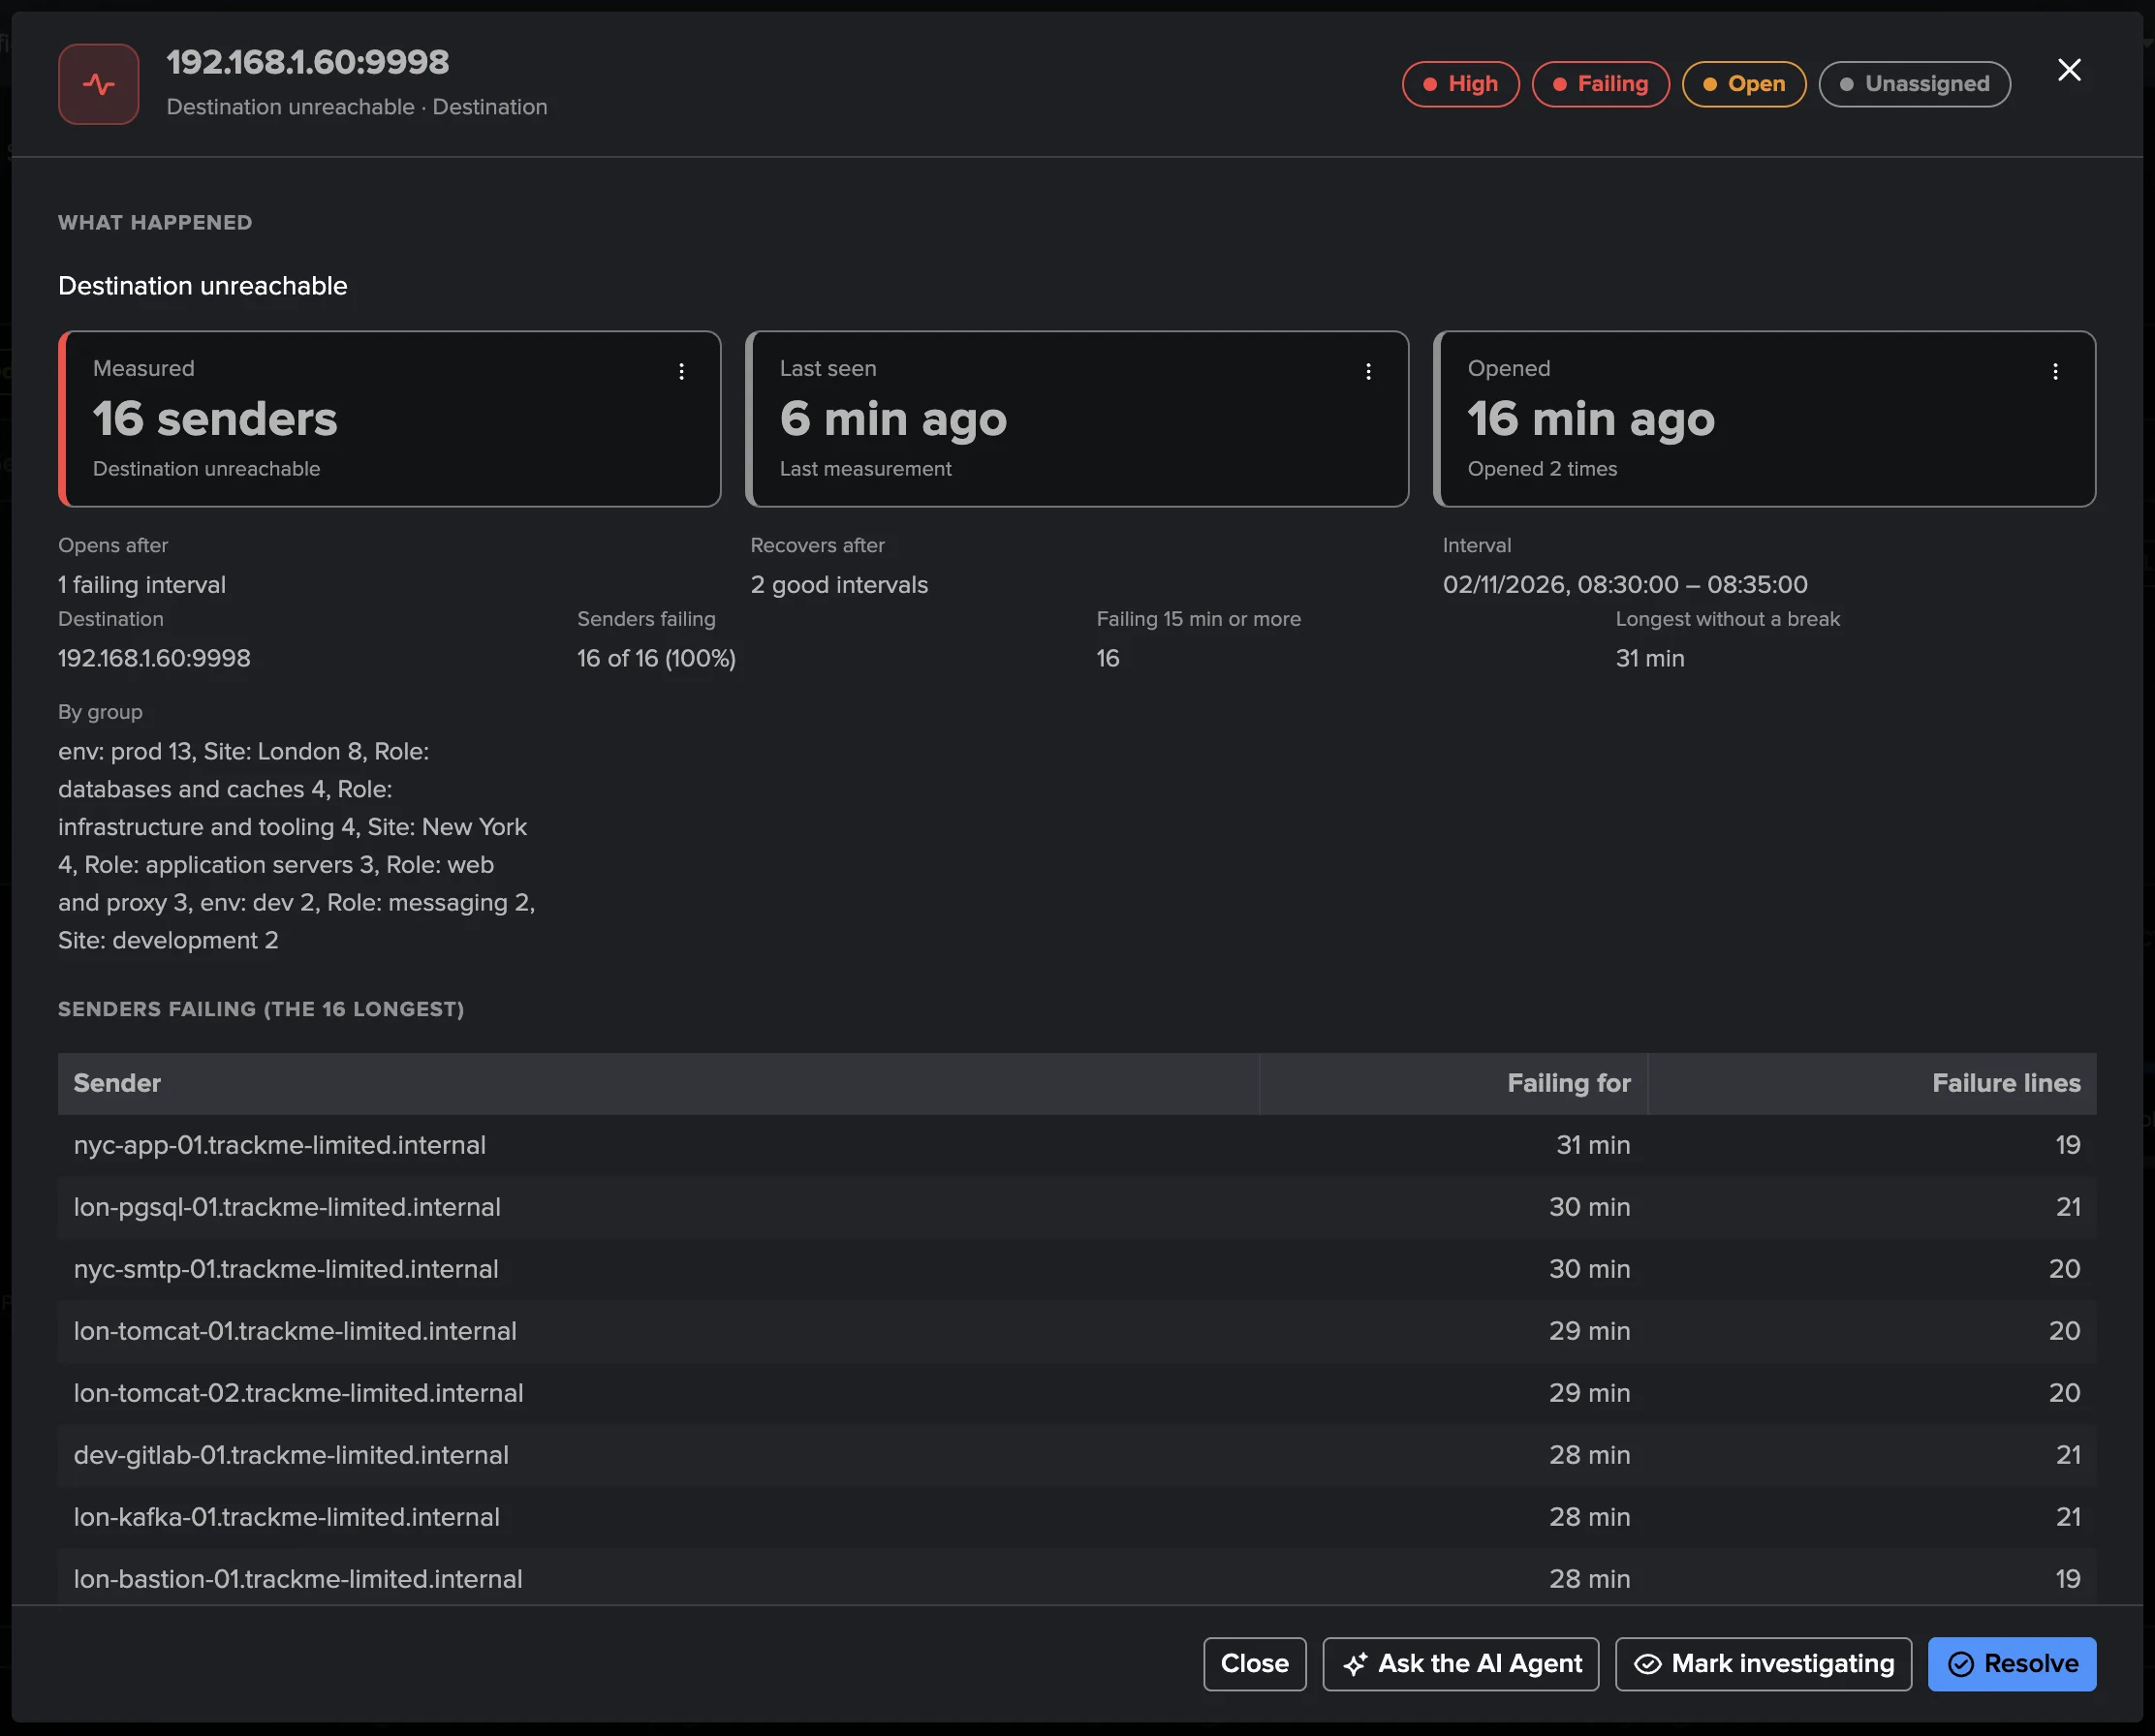
A site goes dark. Four of the six agents of the Paris site were stopped together. Mass disconnect opened on each cohort they are a large share of: the Site: Paris group (66.7 %, critical from 50 %), the Role: web and proxy group (critical) and the fleet (20 %, high). Each joined the Finding group of its cohort, beside the cohort’s Version drift finding. Their own Agent disconnected findings were held, never opened one by one. par-mysql-01 is an expected agent: Expected agent missing opened for it whatever the cohort. At the same time a heavy forwarder of the receiving tier was stopped for the Splunk S2S walkthrough: the agents that send to it opened one Destination unreachable finding on its receiving port, never one per agent.
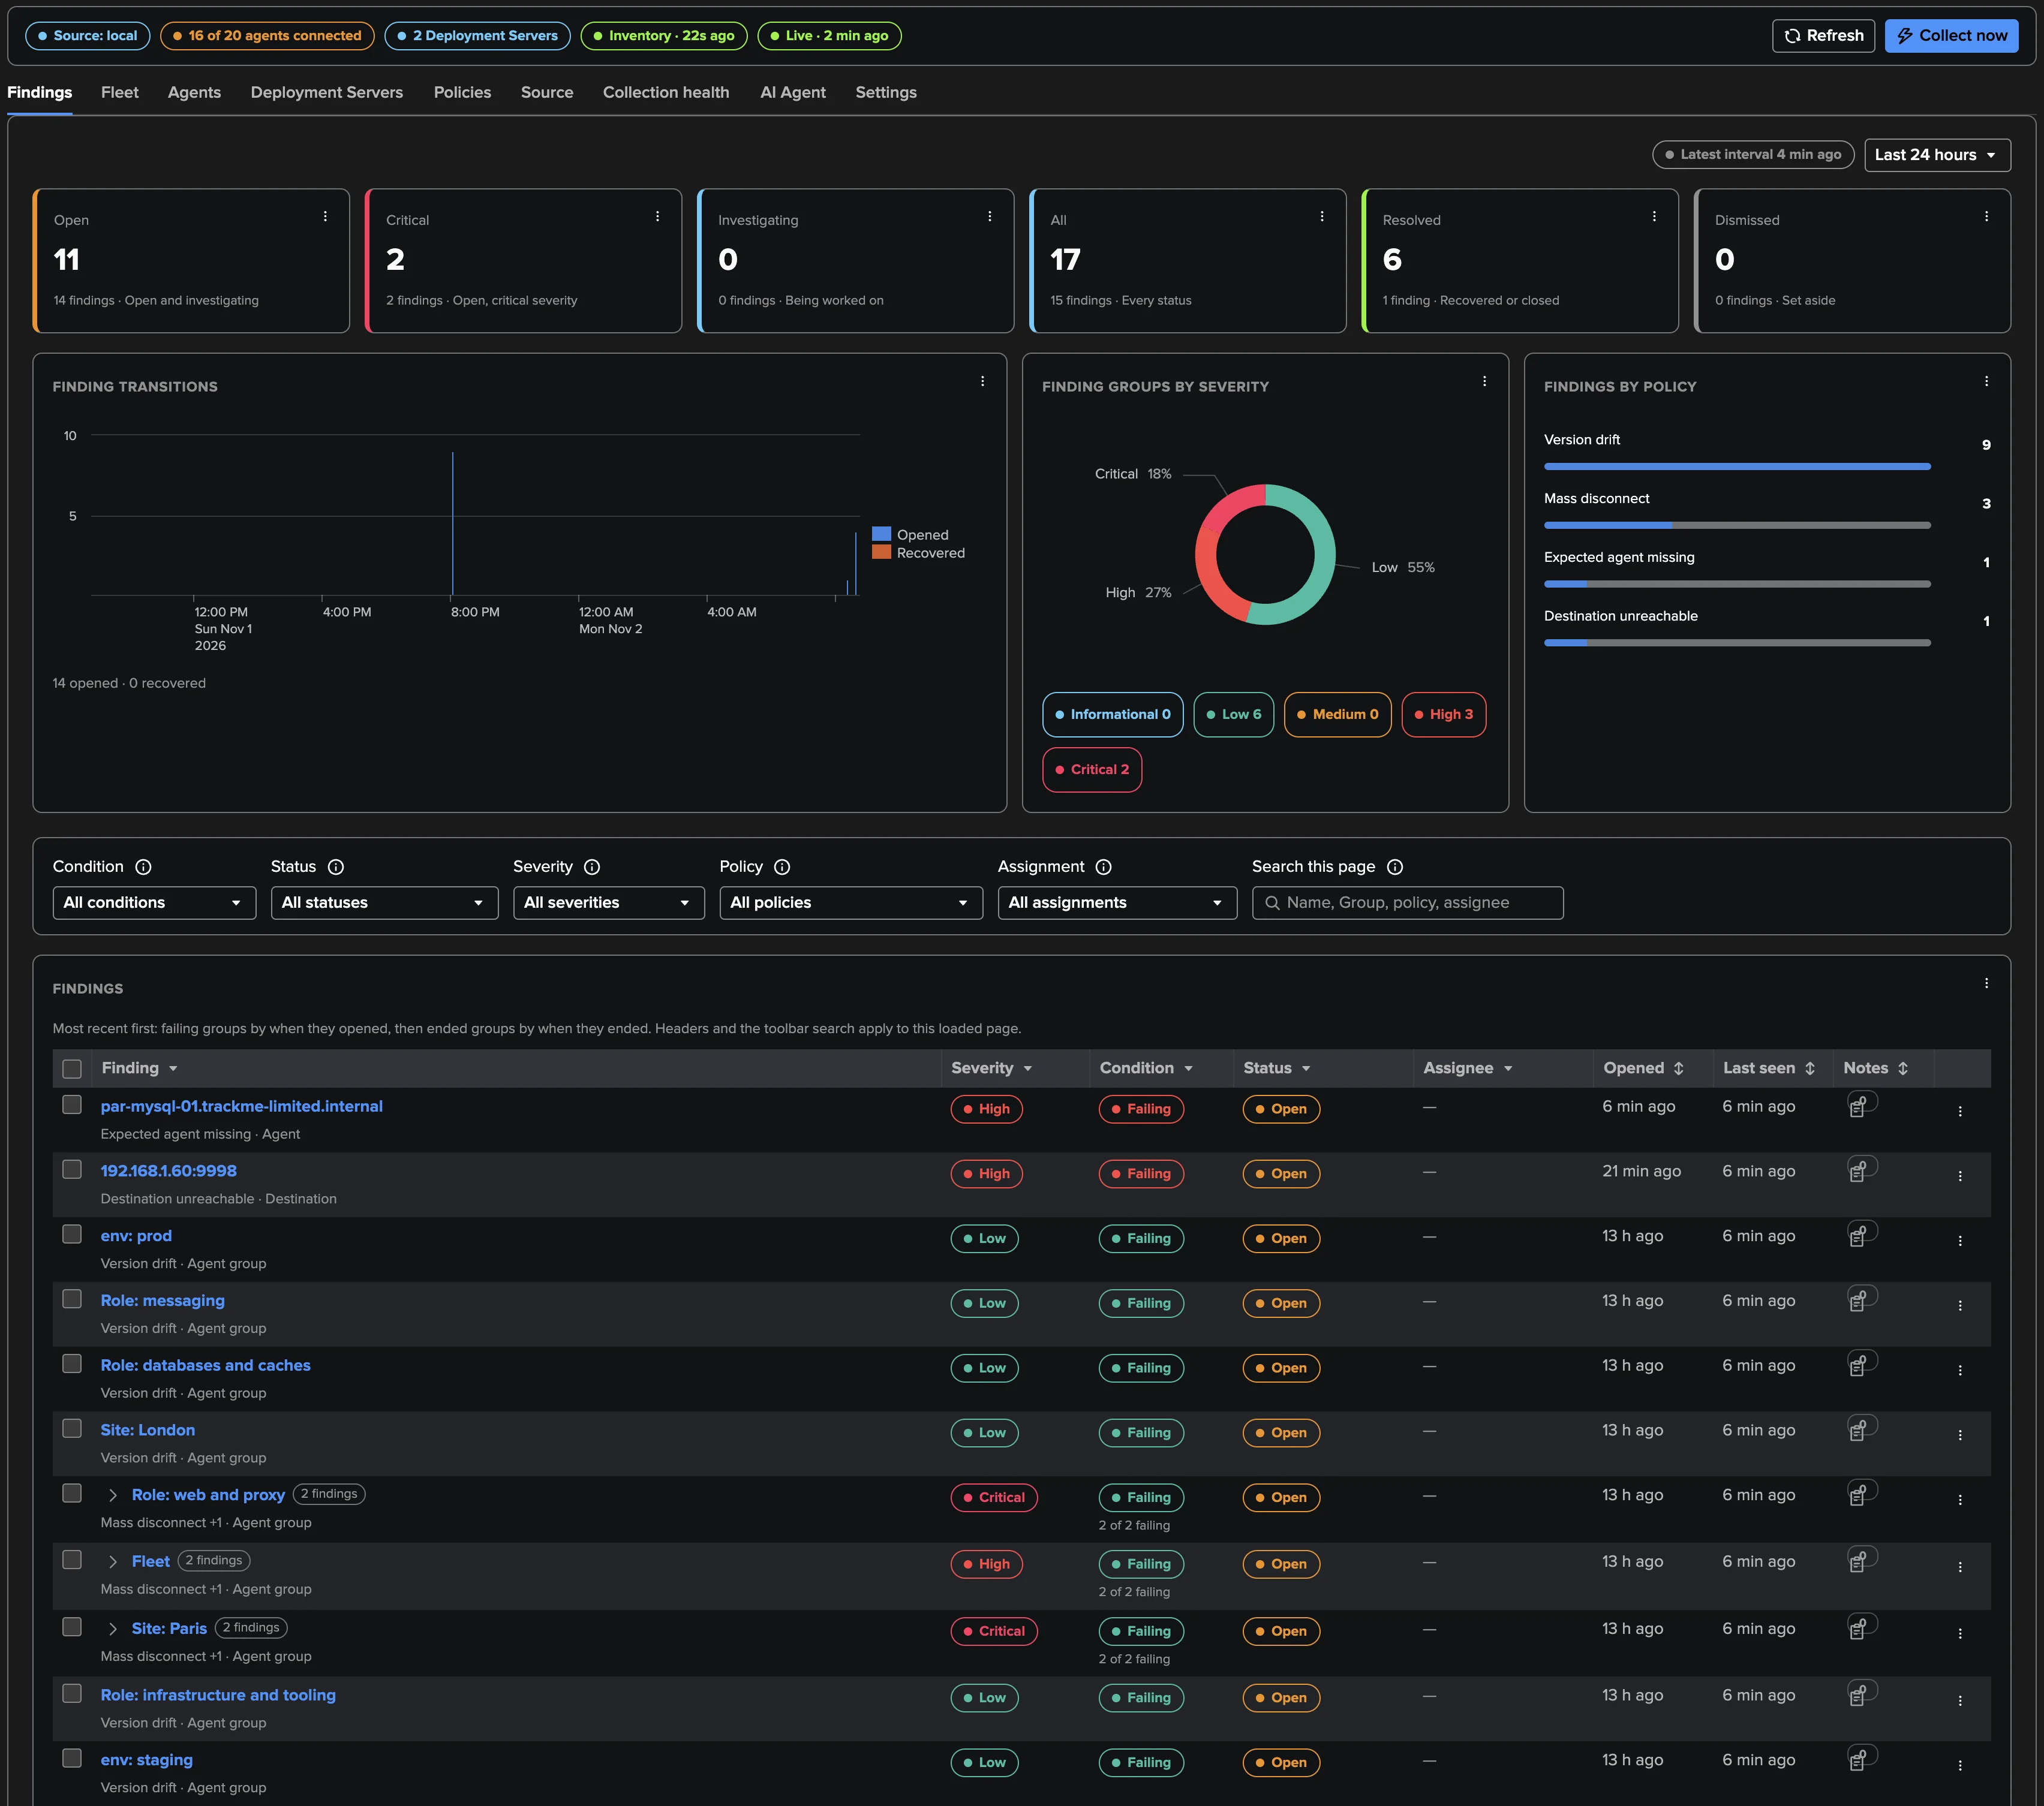
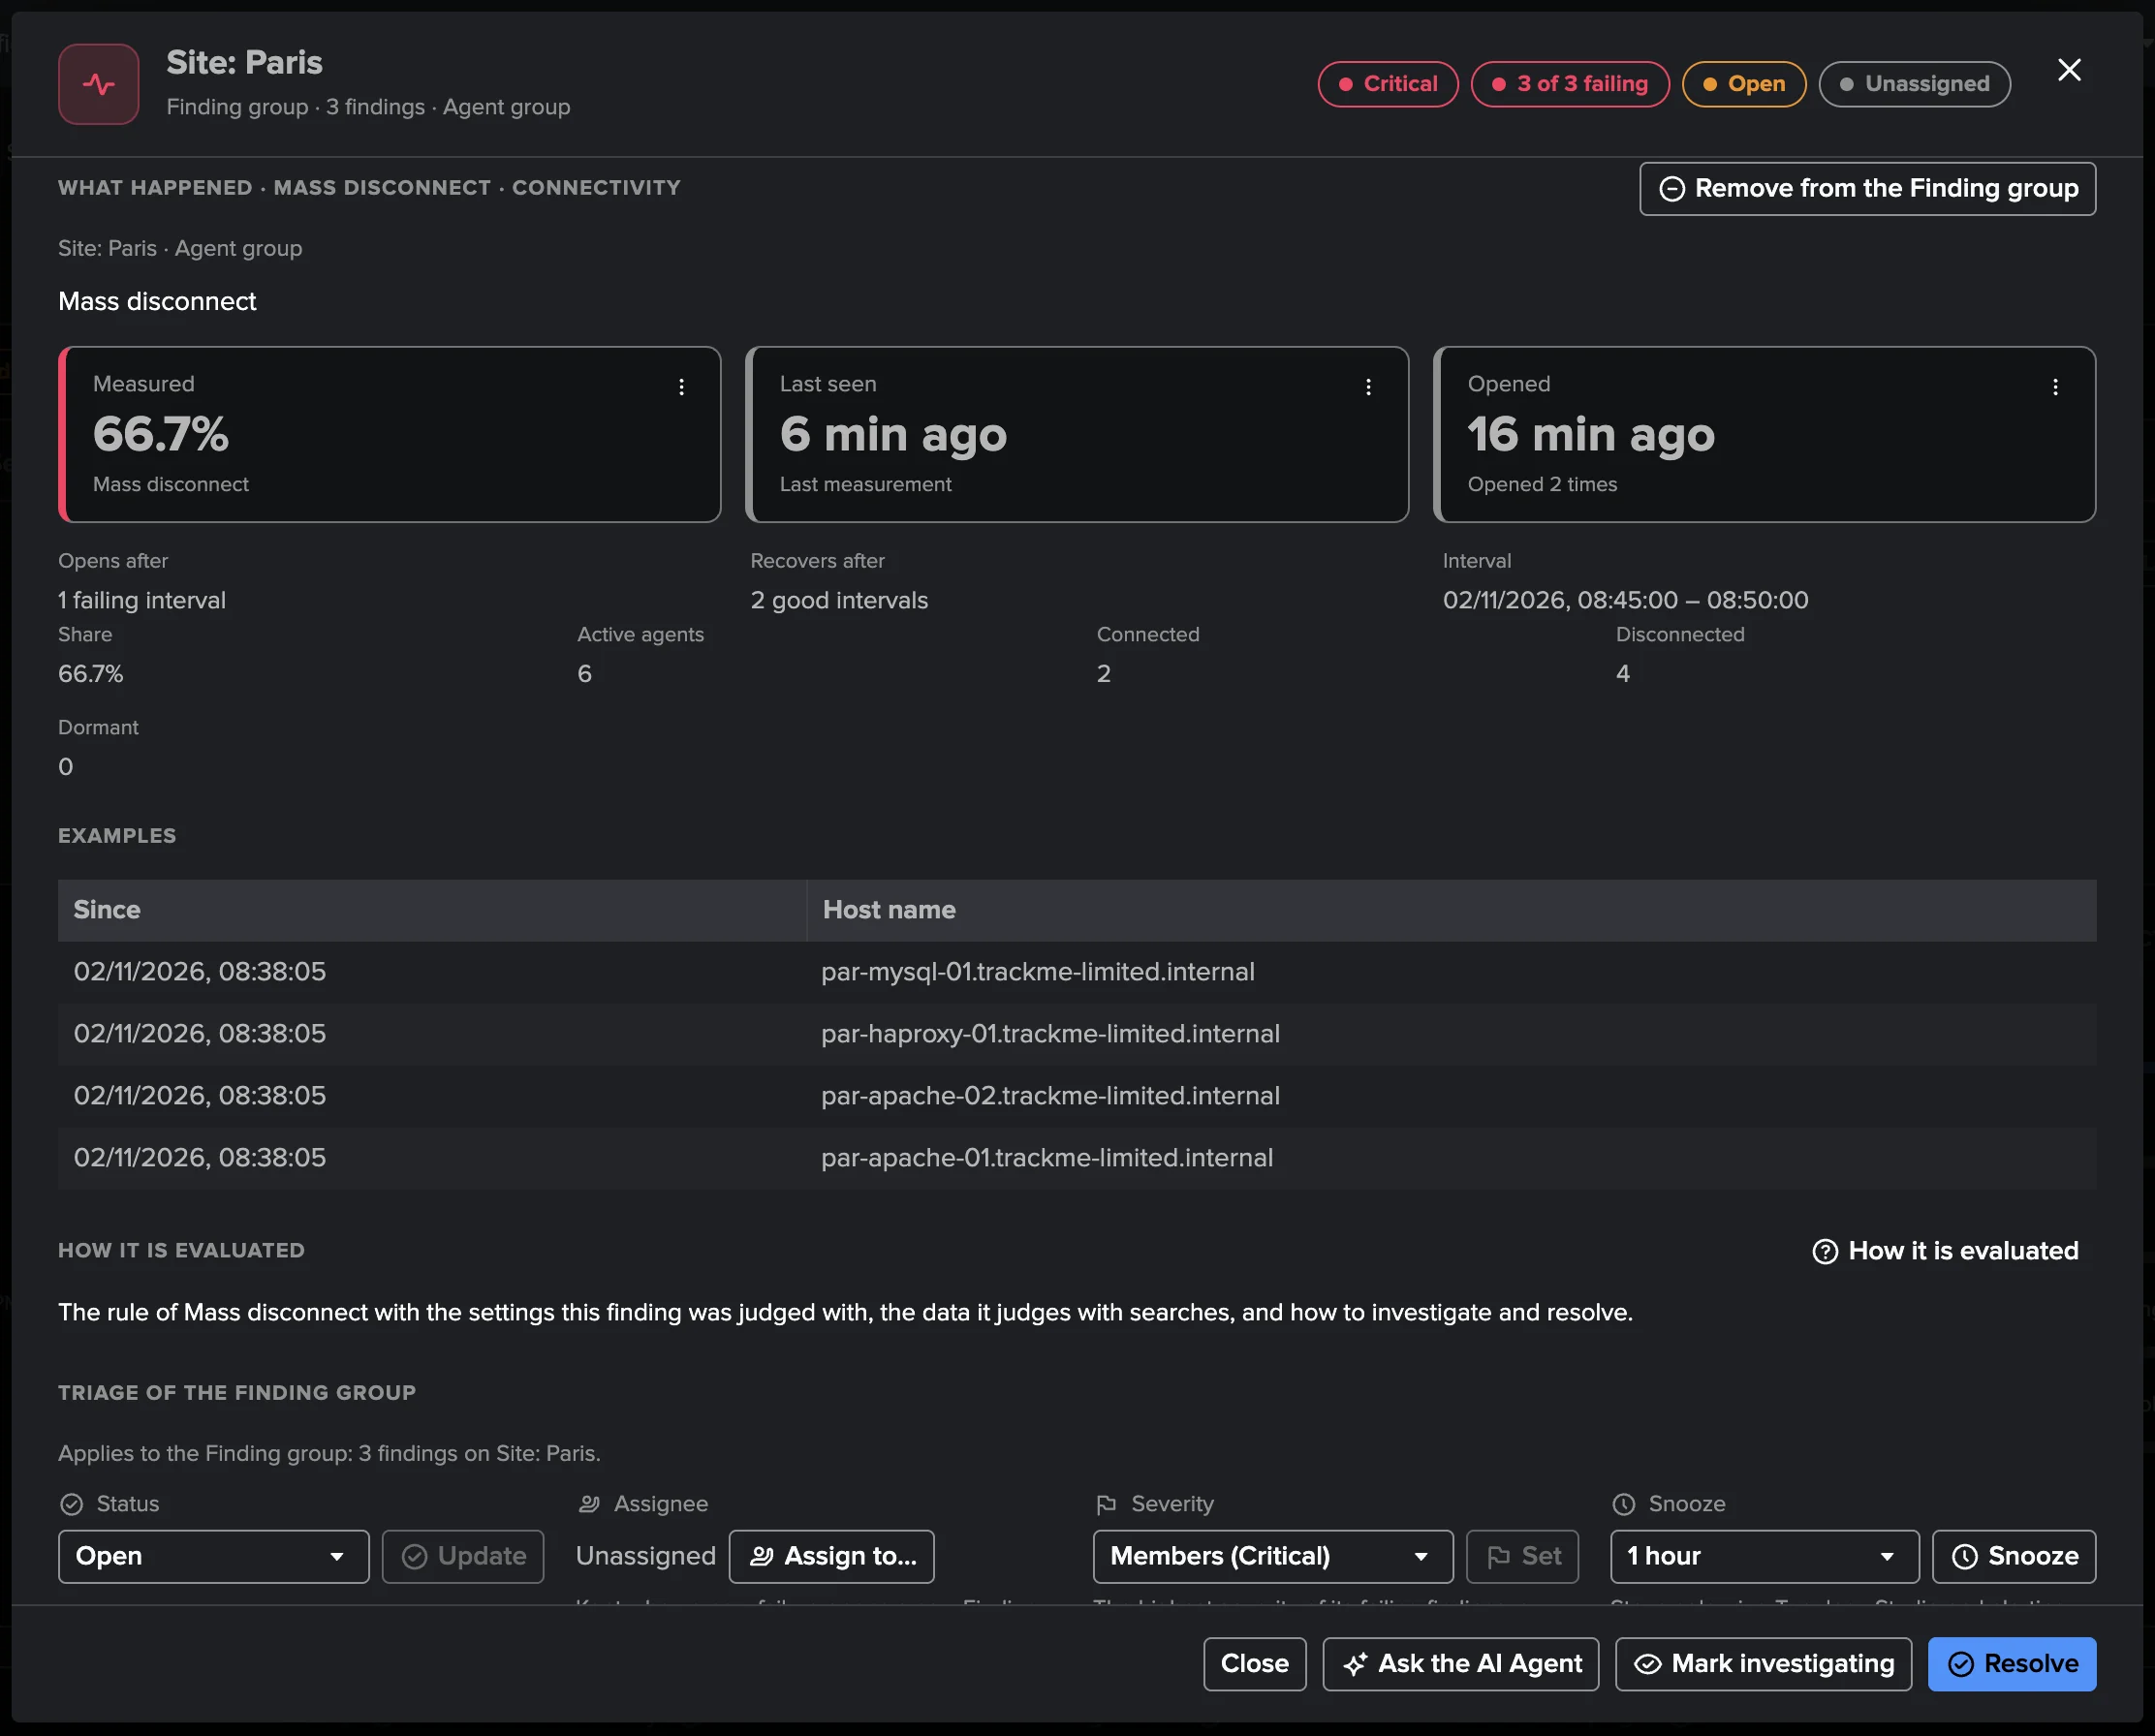
When the agents reconnect, a mass disconnect recovers once the share falls below its recovery percentage for two runs; an agent still disconnected then opens its own finding.
A destination many agents fail to reach is one finding on the receiver, never one per agent: its measurement is the number of agents failing to reach it for 15 minutes or more, with every agent failing, how long, and the groups they belong to.
Forget (Agents tab and agent modal, the tenant’s power and admin roles) removes from the fleet an agent that is not connected — disconnected, dormant or a removal candidate — so an instance replaced or decommissioned is retired at once, without waiting for the dormancy delay: 1 to 100 agents per request, never an agent the enabled Expected agent missing policy selects. A connected agent, by its connection lines or its heartbeat, is refused: it would come back on its next line. Forget resolves the agent’s open findings first, and the agent leaves the counts at once: the Fleet tab, the groups and the status strip no longer count it, without waiting for the next collection. Forgotten agents are listed in the Agents tab only with Show forgotten, without signals: the live facts of a host name belong to the instance that carries it now.
A rebuilt host’s older identity is forgotten by TrackMe. A host rebuilt, re-imaged or reinstalled under its name comes back with a new GUID: once a receiver sees that new identity connected and the older one no longer connects, TrackMe forgets the older identity as Forget would. It leaves every count, its findings close, and Show forgotten lists it as Replaced by a new identity; its Identity tab names the new GUID. It comes back only if its own GUID connects again. The Expected agent missing policy follows the host by its name: the host is expected under its new identity. TrackMe never forgets an older identity the policy names by its own GUID, and decides only on a complete read of the receivers’ connection lines.
Topology Studio
Splunk UF Fleet objects are first-class in Topology Studio: the fleet, its groups, the Deployment Servers and the agents, in the entity picker and as dynamic groups (agents by state, by Deployment Server, by host name, with open findings); agents are drawn as groups past 50. Their status comes from their findings first; without one, a connected agent is green, a disconnected agent a quiet grey (an agent’s colour comes from its own finding only), a Deployment Server measured green. The templates Fleet by group, Deployment Servers and Problems wall build a view in one click, and the AI Topology Builder knows the tenant (“Show my fleet by Deployment Server”). When a Splunk S2S tenant reads the same source, the Fleet map and the Fleet by group template draw its receiving nodes linked from the fleet. See Topology Studio.
The Splunk UF Fleet AI Agent
The Splunk UF Fleet AI Agent reviews findings on the shared findings AI Agent framework (see
AI Agents for findings). It reads what TrackMe holds about the finding — the agent’s directory row
(state, identity, version, receivers, Deployment Server, troubles and deployment facts), its
Deployment Server with its baseline and clients, the fleet summary, collection health, the Finding
group and past decisions — and may read further through its tools (the fleet overview, agents,
Deployment Servers, log evidence, trends, the last 5 minutes). It writes one [AI Agent] note per
review and, in act mode, applies only what the tenant allows: marking a finding investigating
(allowed by default), a temporary dismissal of at most 7 days (allowed), and resolving after a
measured recovery (not allowed by default). It never Forgets an agent and never adds one to the
expected agents: it recommends, an operator decides. It never changes anything on a Splunk instance.
Scheduled triage is off by default (Settings → AI Agent, or Manage AI Agents): hourly, up to
10 findings per run. It needs the AI Assistant enabled and an LLM provider; a scheduled run works with
a least-privilege tenant owner, not with nobody.
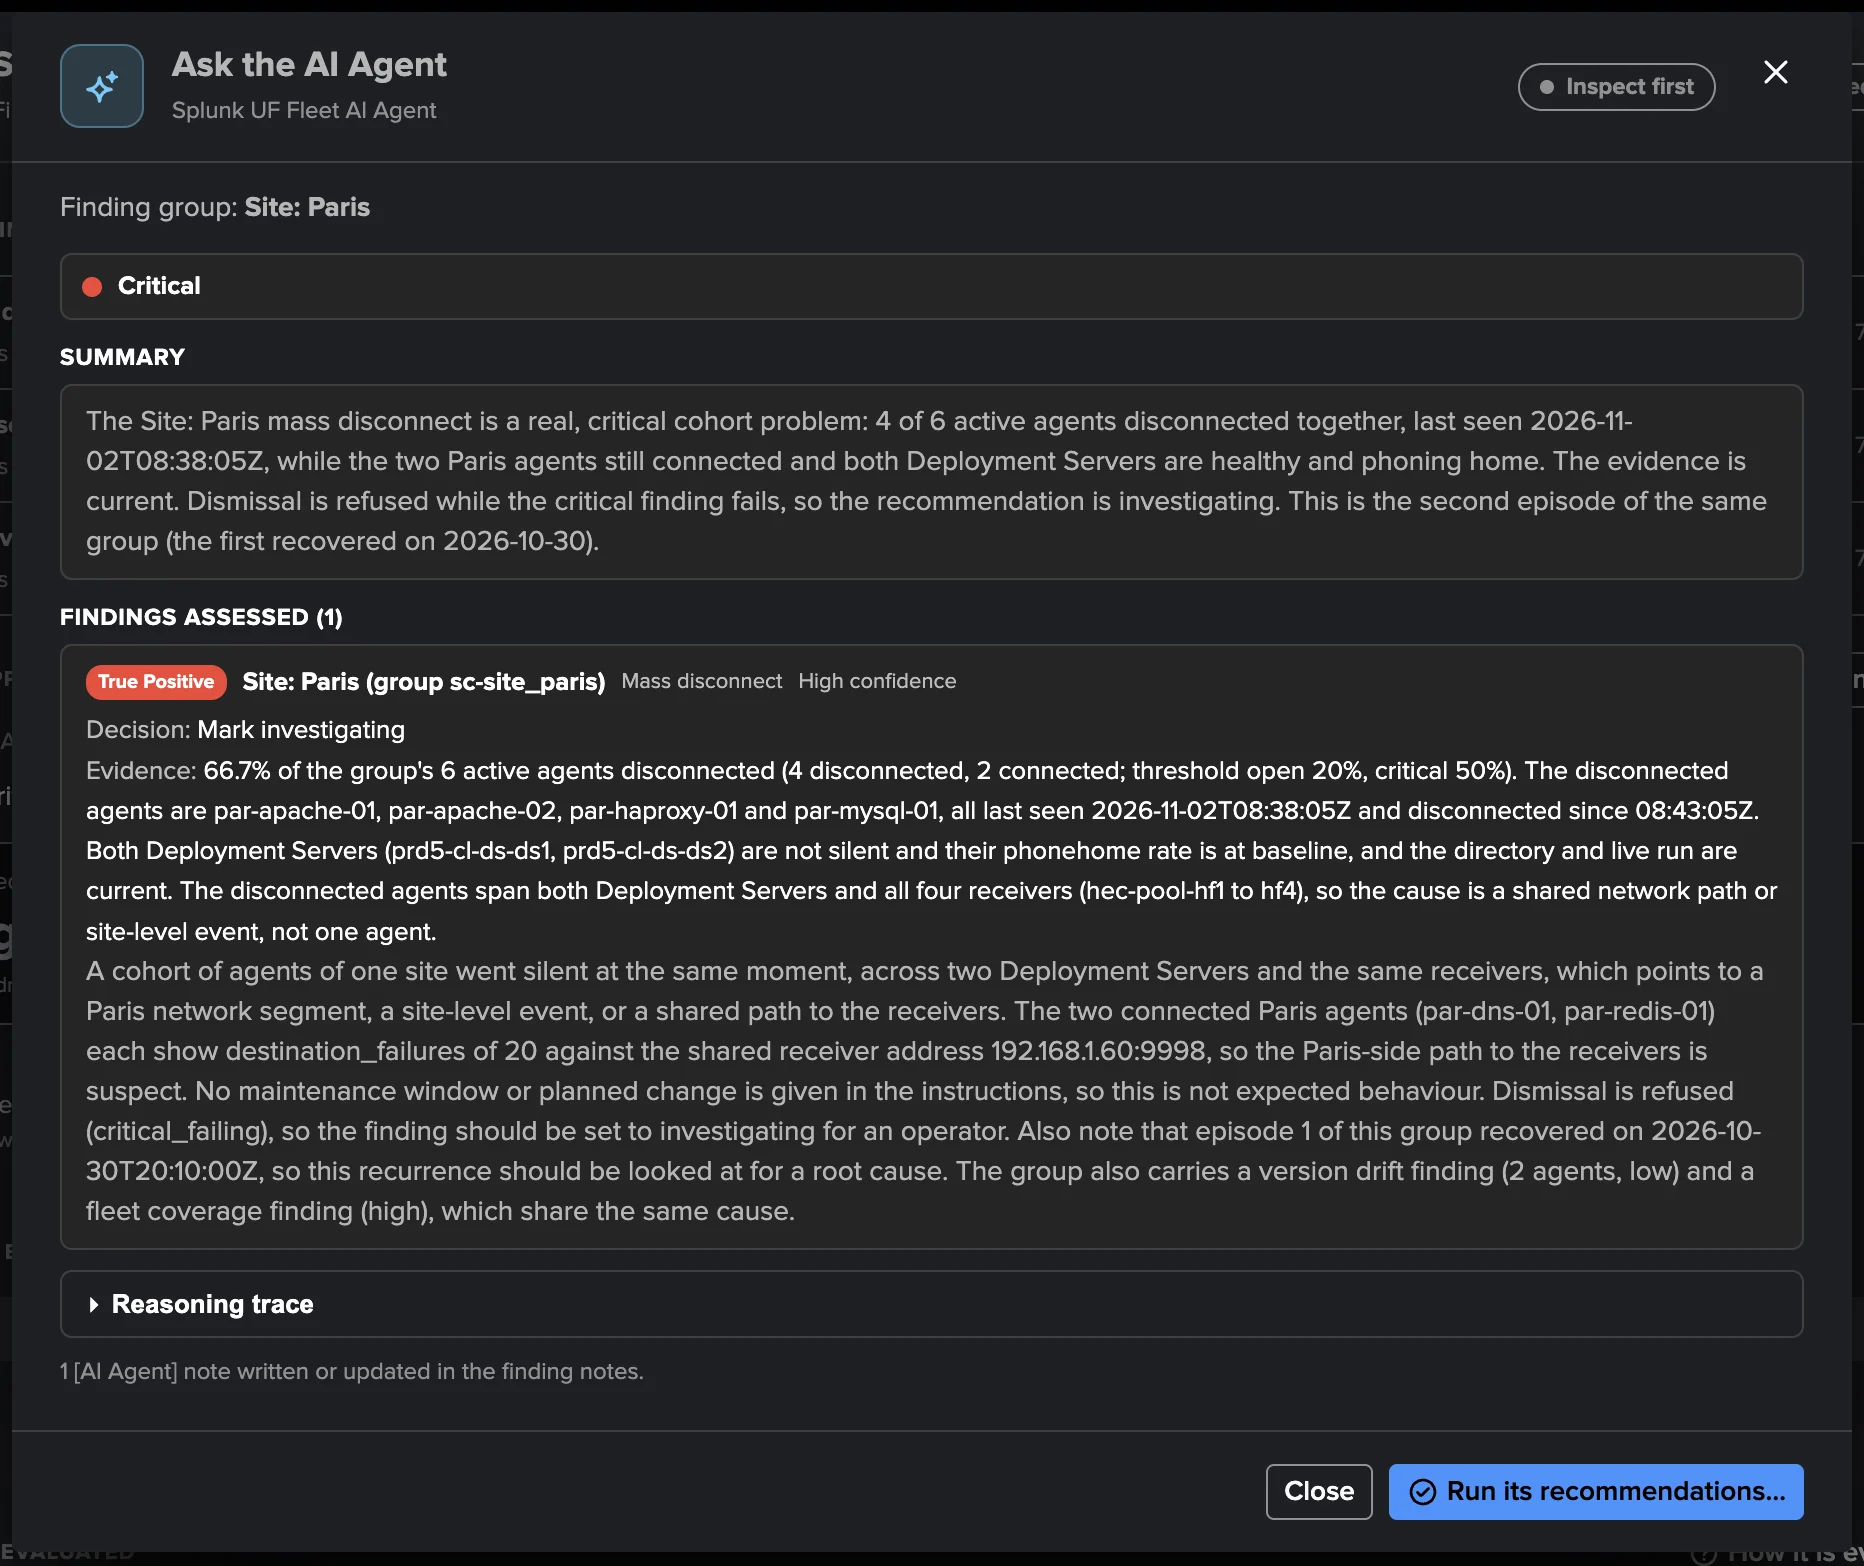
The Tenant Home AI Assistant knows the workspace, its policies, the fleet summary and the open findings: ask “Which agents are disconnected or dormant, and do they share a group or a Deployment Server?”.
Collection health
The Collection health tab shows whether the tenant collects as configured: the Status view
lists every problem with its meaning, source, causes and steps; Trackers shows each job’s last
run with the searches it sent, and Run now; Data & storage and Troubleshoot & help
complete it. The same assessment raises the Configuration Guardian check
cribl_collection_health. Every problem code is listed in Splunk UF Fleet reference.
Troubleshooting
Why does a heavy forwarder not appear as an agent? Full instances are left out by default (Settings → Source, Full instances); the Source tab counts them under Left out.
Hundreds of agents are disconnected, but there is only one finding. A mass disconnection is one cohort finding on the fleet or the group; the agents’ own findings are held while it is open, and open individually once it clears.
An agent stopped a week ago and its finding closed. It became dormant (7 days): the disconnection closes as dormant, not as a recovery. At 30 days without a connection it becomes a removal candidate (Decommission candidate). Expected agents never close on dormancy.
A server class group counts fewer agents than the Deployment Server shows. Without a Deployment Server API account, the group counts the clients with an app of the class deployed in the last 60 days only. Add one account per Deployment Server in Settings → Deployment Servers.
The wizard (or Settings) says the owner may not use a remote account. The tenant owner shares none of the account’s roles: add one of the owner’s roles to the account (Configuration → Remote accounts), or choose another owner.
Splunk Cloud: the Deployment Servers tab is empty. Point the Deployment Server source at a remote account on the Deployment Server itself.
Phonehome drop reads three times the usual, but nothing is wrong. The usual is a 7-day median per hour; a fleet that grew during the week reads above its usual until the median catches up. Only a drop is judged.
What the Splunk UF Fleet tenant does not do
It does not judge the receiving side (receivers, intermediates, pools): that is Splunk S2S.
It shows the CPU and memory of a Deployment Server, never judges them.
Agents behind a non-Splunk hop (Cribl Stream, for example) are not seen by the receivers as themselves: with the heartbeat fallback they read connected (heartbeat). Agents sending S2S over HTTP are not counted.
An agent whose
inputs.confsets a host name the receivers never see gets no trouble facts.A health indicator turns green up to 35 minutes late (Splunk’s report period).
The phonehome baseline needs 3 days of history at that hour;
_dsphonehomekeeps 7 days by default.It never removes an agent on its own, never changes anything on an agent or a Deployment Server.
Next: the reference
Every policy with its defaults and settings, the custom policy subjects, the jobs, the settings, the Collection health codes, the commands and the permissions are in Splunk UF Fleet reference.