Splunk S2S
The Splunk S2S tenant watches the Splunk-to-Splunk receiving side of one Splunk deployment: the receivers (indexers, standalone instances, Splunk Cloud indexers), the intermediate forwarders (heavy or universal forwarders that receive S2S and forward it) and the pools they form, and the data path between them. It answers the questions a Splunk administrator asks about forwarding: is every receiver accepting and keeping up? is my intermediate tier blocked, backed up, silent, or load balancing over fewer destinations than usual? when senders are held back, which tier is the bottleneck, and is the cause downstream, local or an upstream surge? how much flows into each pool, from how many senders of which type and version, with which TLS and acknowledgement posture? The answers are findings, raised by built-in policies, with the same triage, Finding groups, notifications, assignment and findings actions as the other dedicated tenants, traffic ML models on every receiver pool, and a findings AI Agent of its own, the Splunk S2S AI Agent.
A Splunk S2S tenant is a dedicated tenant type: it has no entities and no state colour, and
one tenant follows the S2S receiving side of one Splunk deployment. It reads the telemetry
Splunk already writes — the receivers’ and intermediates’ metrics.log connection lines,
queues and throughput, their splunkd.log input and output messages, their health report and
_introspection — on the local search tier or through a TrackMe remote account. Nothing is
installed on any Splunk instance, no new data is ingested, no forwarder is ever called: the
tenant only reads.
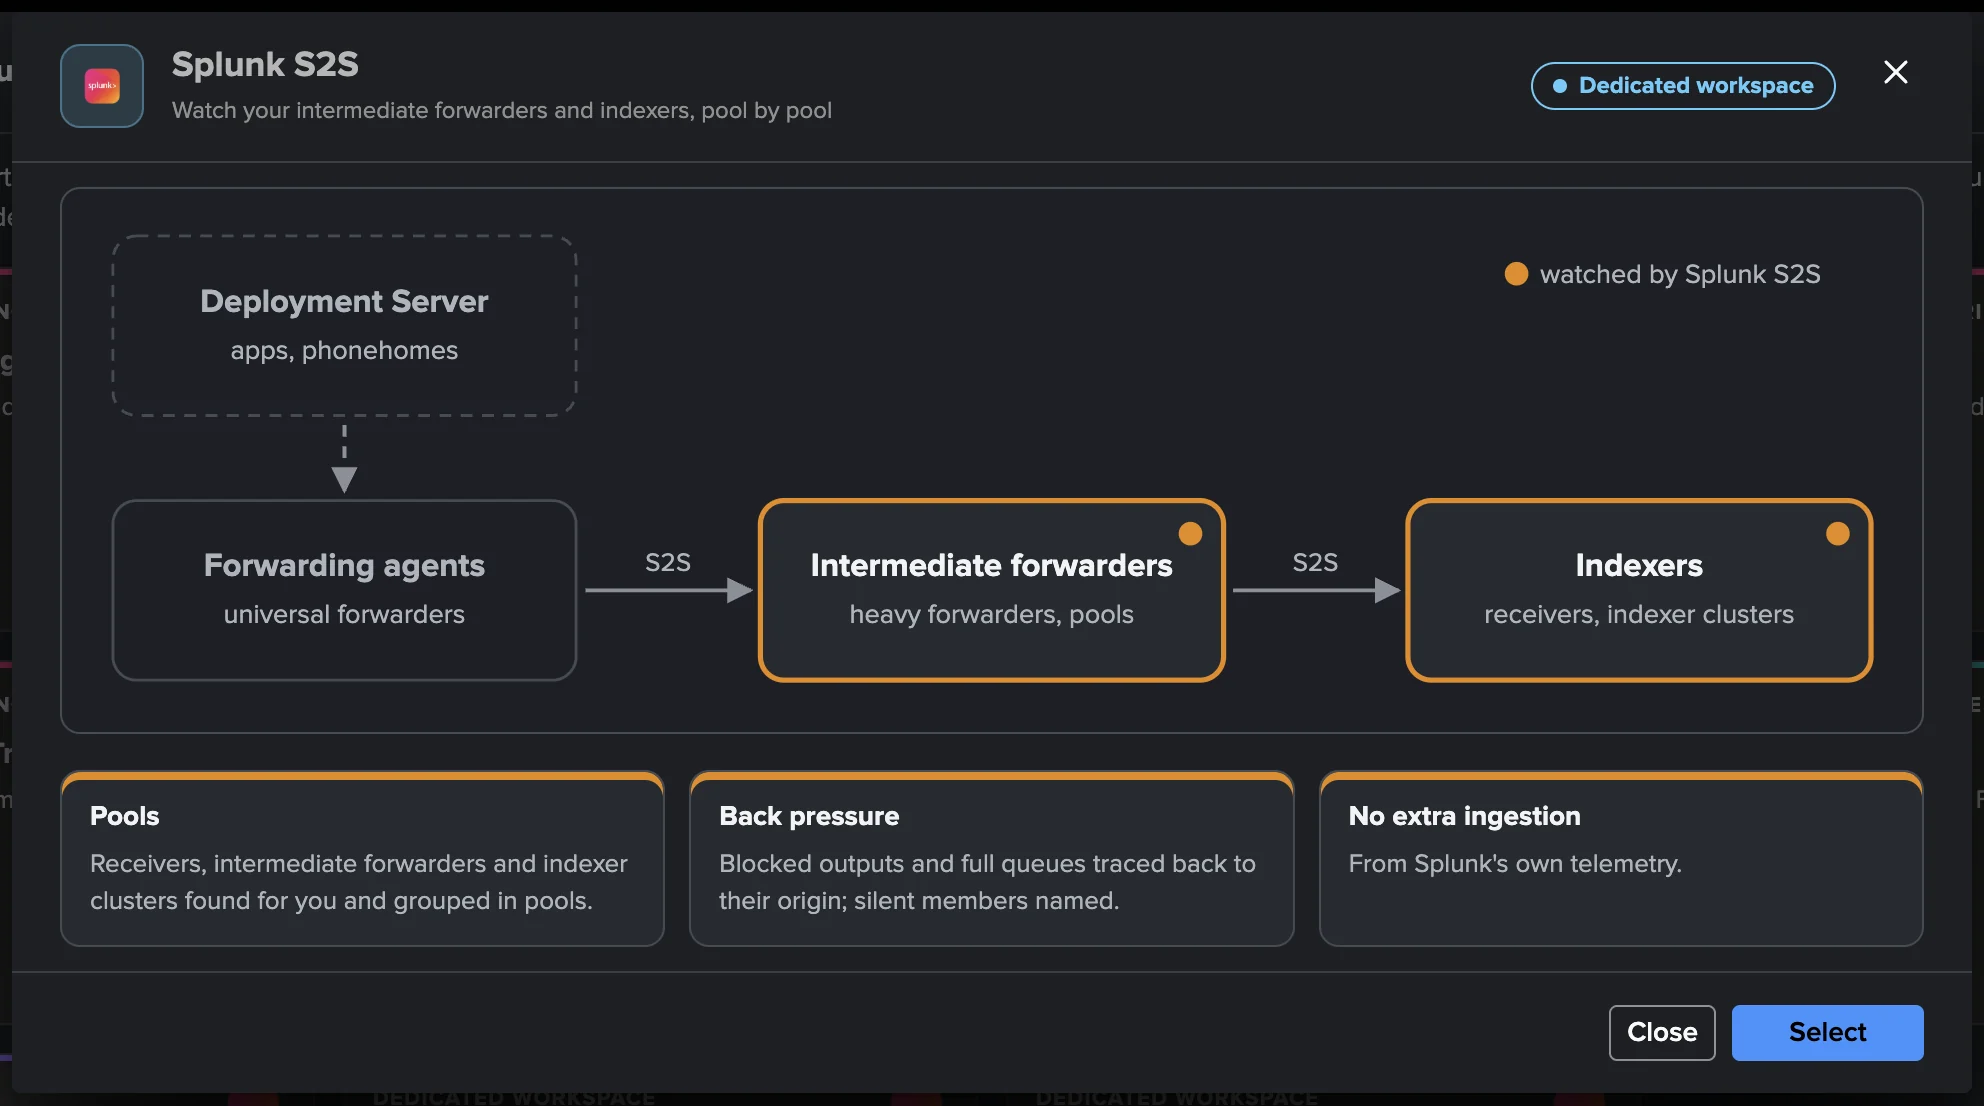
The senders (universal forwarders, heavy forwarders, search heads, Deployment Servers) are context here: counted, typed and versioned per receiver and pool, never findings. The forwarding agents and their Deployment Servers have their own tenant type, Splunk UF Fleet.
The Splunk S2S tenant is generally available since TrackMe 2.4.22.
For a guided tour on a live deployment, see the hands-on walkthrough Splunk S2S. Every policy, setting, job and command is described in the Splunk S2S reference.
What it monitors
Object |
What TrackMe watches |
|---|---|
Receivers |
Every host that receives S2S and indexes it. Whether it accepts its senders (a receiver whose queues stayed blocked stops its listening ports), whether it is silent while the other members of its pool report, back pressure along its ingestion path and the stage that cannot keep up, its share of the pool’s senders (imbalance), connection churn, and the TLS and acknowledgement posture and Splunk versions of its senders. |
Intermediate forwarders |
Every host that receives S2S and forwards it: a heavy forwarder tier, or a universal forwarder used as a relay. Its output paused (the senders behind it held back), back pressure and its origin (downstream, local or an upstream surge), silence, failing destinations, a single destination where it usually load balances over several, what it receives against what it forwards (in / out anomaly), the TLS posture of its senders, and a universal forwarder relaying universal forwarders. |
Pools |
The receivers of an indexer cluster, one pool per site of a multisite cluster (found without configuration), the intermediate forwarders grouped by host-name family (also automatic), or receivers and intermediates grouped by host patterns, output groups or hosts you assign. Capacity (members up against the expected size), not receiving (every member silent), a traffic drop against the same hour of the previous days, traffic outliers against a traffic ML model, and a back pressure cascade: one finding naming the receivers that back up and the intermediates paused towards them. |
Destinations |
A receiver that many senders fail to reach without a break: one finding on the destination listing the senders, never one per sender. |
Indexer clusters are found without configuration. Each indexer cluster the source search head
is attached to becomes a receiver pool, its members and expected size from the cluster. A
multisite cluster forms one pool per site, named <cluster>:<site> (idxc1:site1,
idxc1:site2): each site is judged on its own peers, so a site that loses its indexers is a
capacity finding even while the other site carries the load. A single-site cluster, or one whose
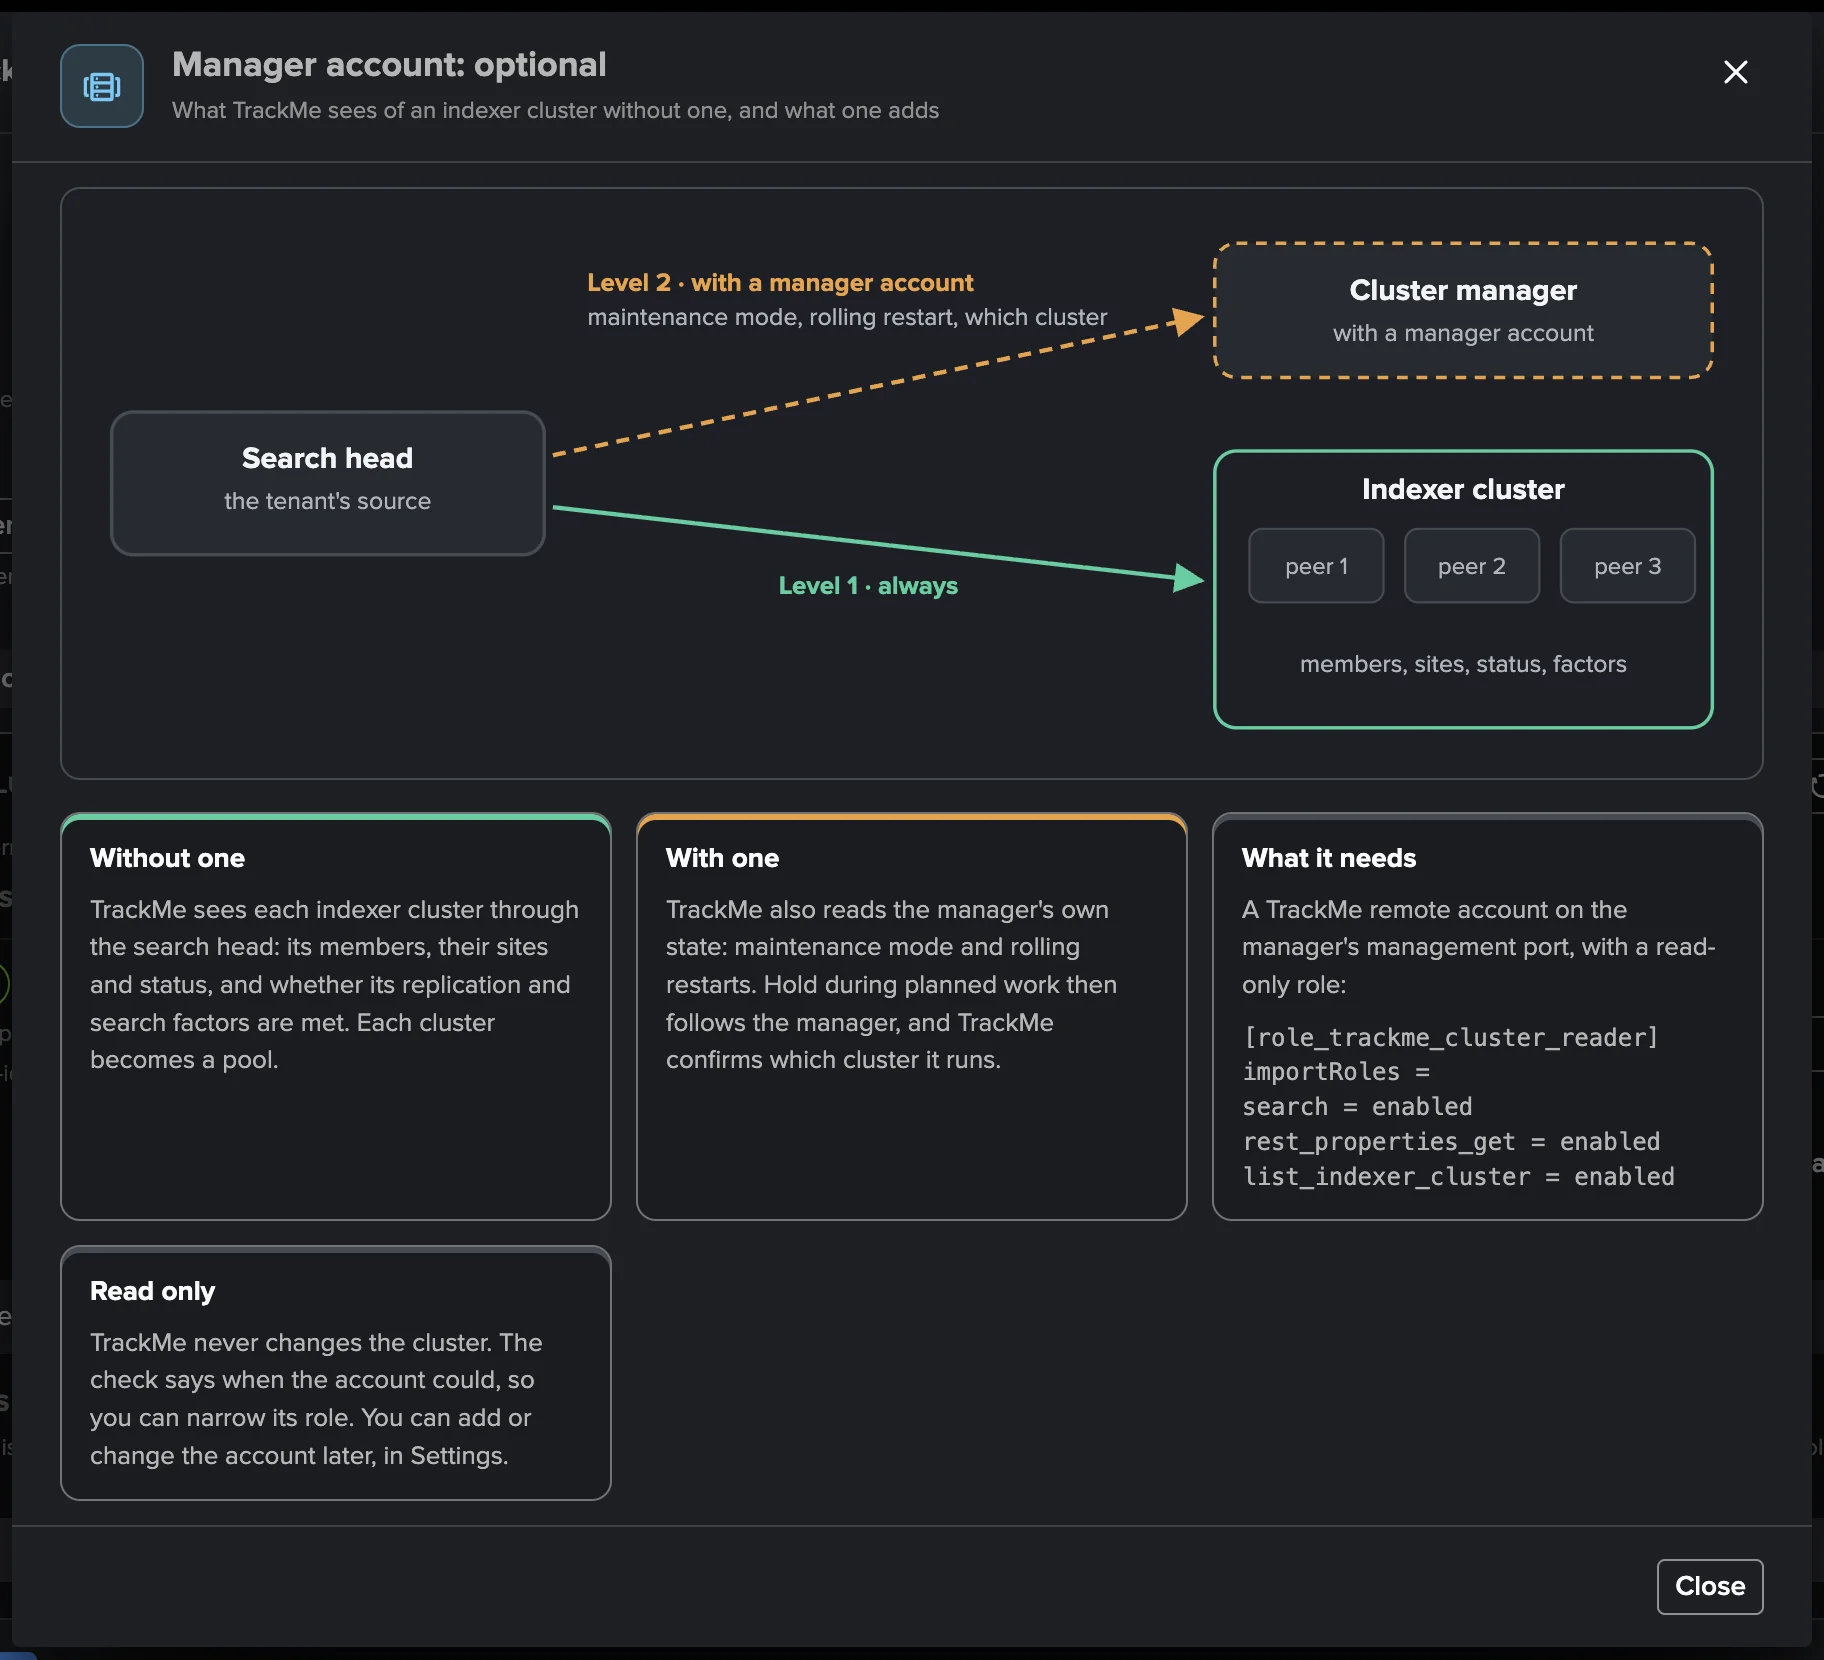
peers’ sites are not all known, stays one cluster-wide pool. An optional remote account on the
cluster manager adds its view of planned work: while a cluster is in maintenance mode or a
rolling restart, the availability, capacity, balance, churn and traffic findings of its pools wait.
A cluster’s own health (peers, replication and search factors, buckets) is shown in the workspace,
never judged here.
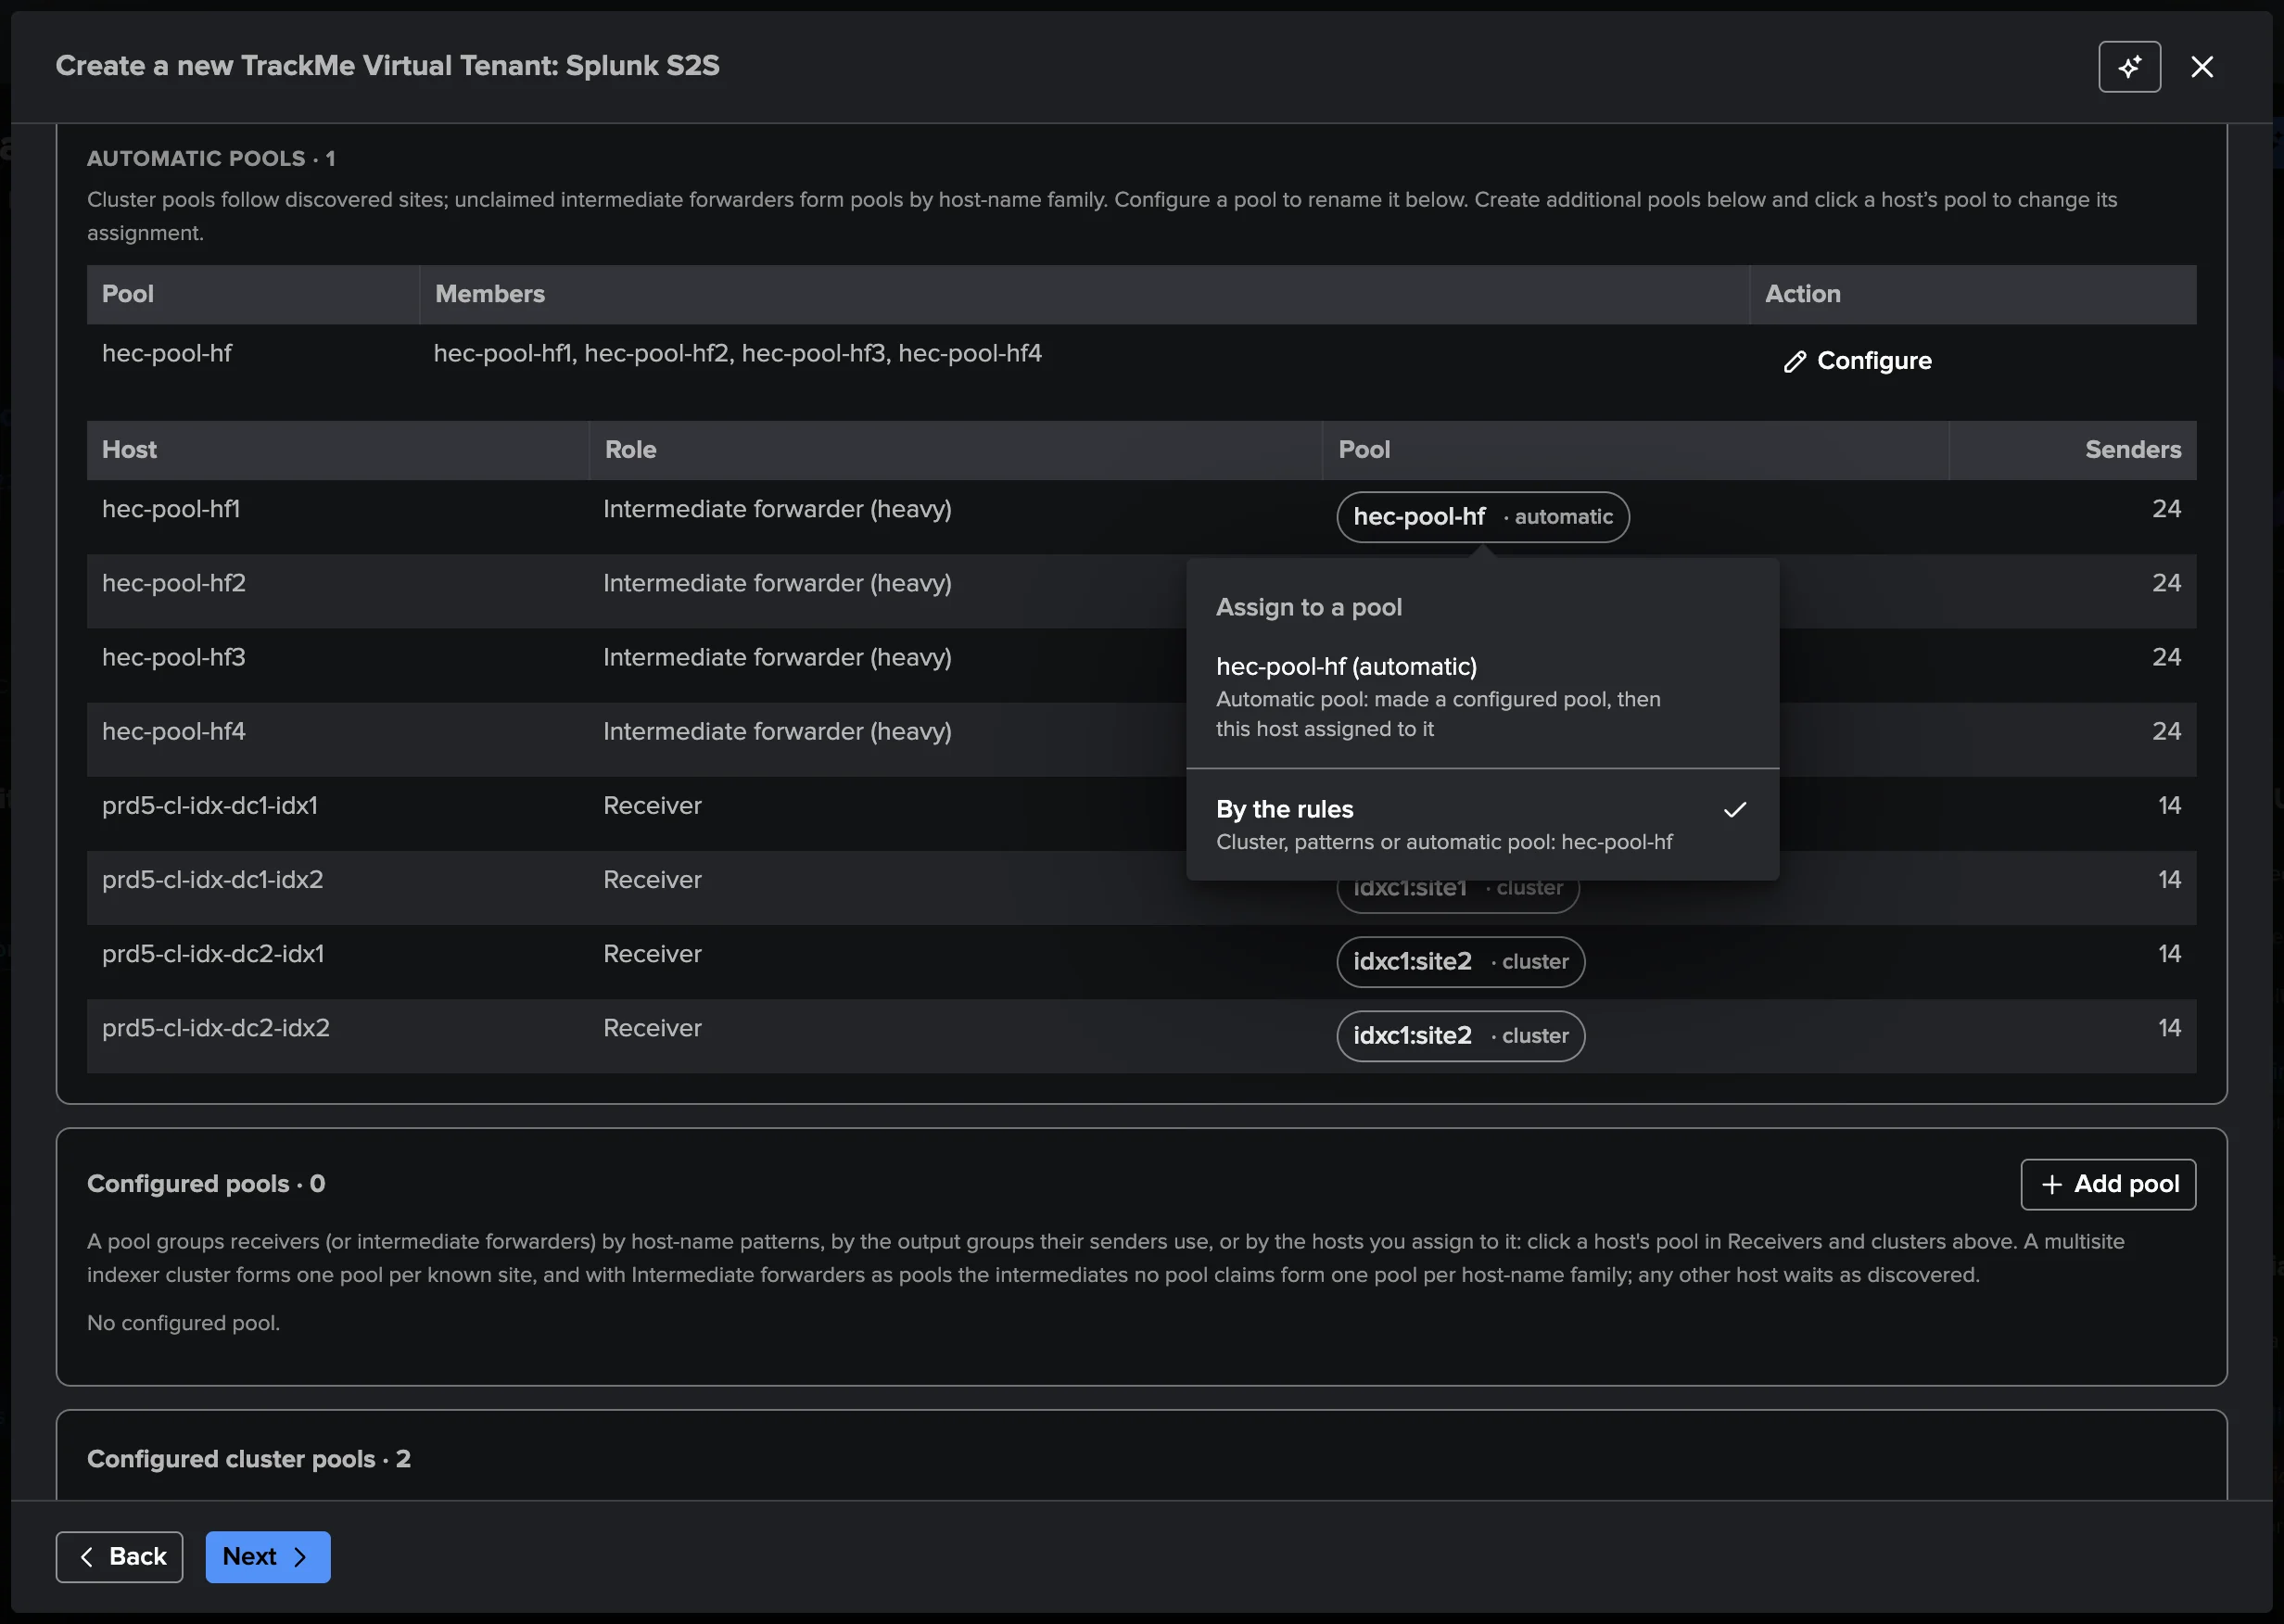
The intermediate tier is grouped for you too. The intermediate forwarders no pool claims form
one automatic pool per host-name family (hec-pool-hf1 to hec-pool-hf4 form
hec-pool-hf). Configure an automatic pool to rename it, give it its output groups and an
expected size: it becomes a configured pool and keeps its id, its findings and its history.
How it works
Roles are read from signatures, never configured. Over the last 24 hours, a host that
receives S2S (group=tcpin_connections lines) and indexes is a receiver; a host that
receives and forwards (group=tcpout_connections or cooked output) is an intermediate
forwarder. An intermediate’s type comes from how its own receivers see it: fwdType=full is a
heavy forwarder, uf a universal forwarder. Host patterns and excluded hosts bound which hosts
may be receivers or intermediates; they never apply to senders.
Bounded reads, whatever the deployment size. Every read is an aggregation over indexed terms or
metric dimensions (tstats with TERM() and PREFIX(), mstats on the _metrics
mirror), never a search per host. The live job reads index-time windows of five minutes with
catch-up (never the same window twice), and every view of a window is published under one id, so
two views never mix two windows.
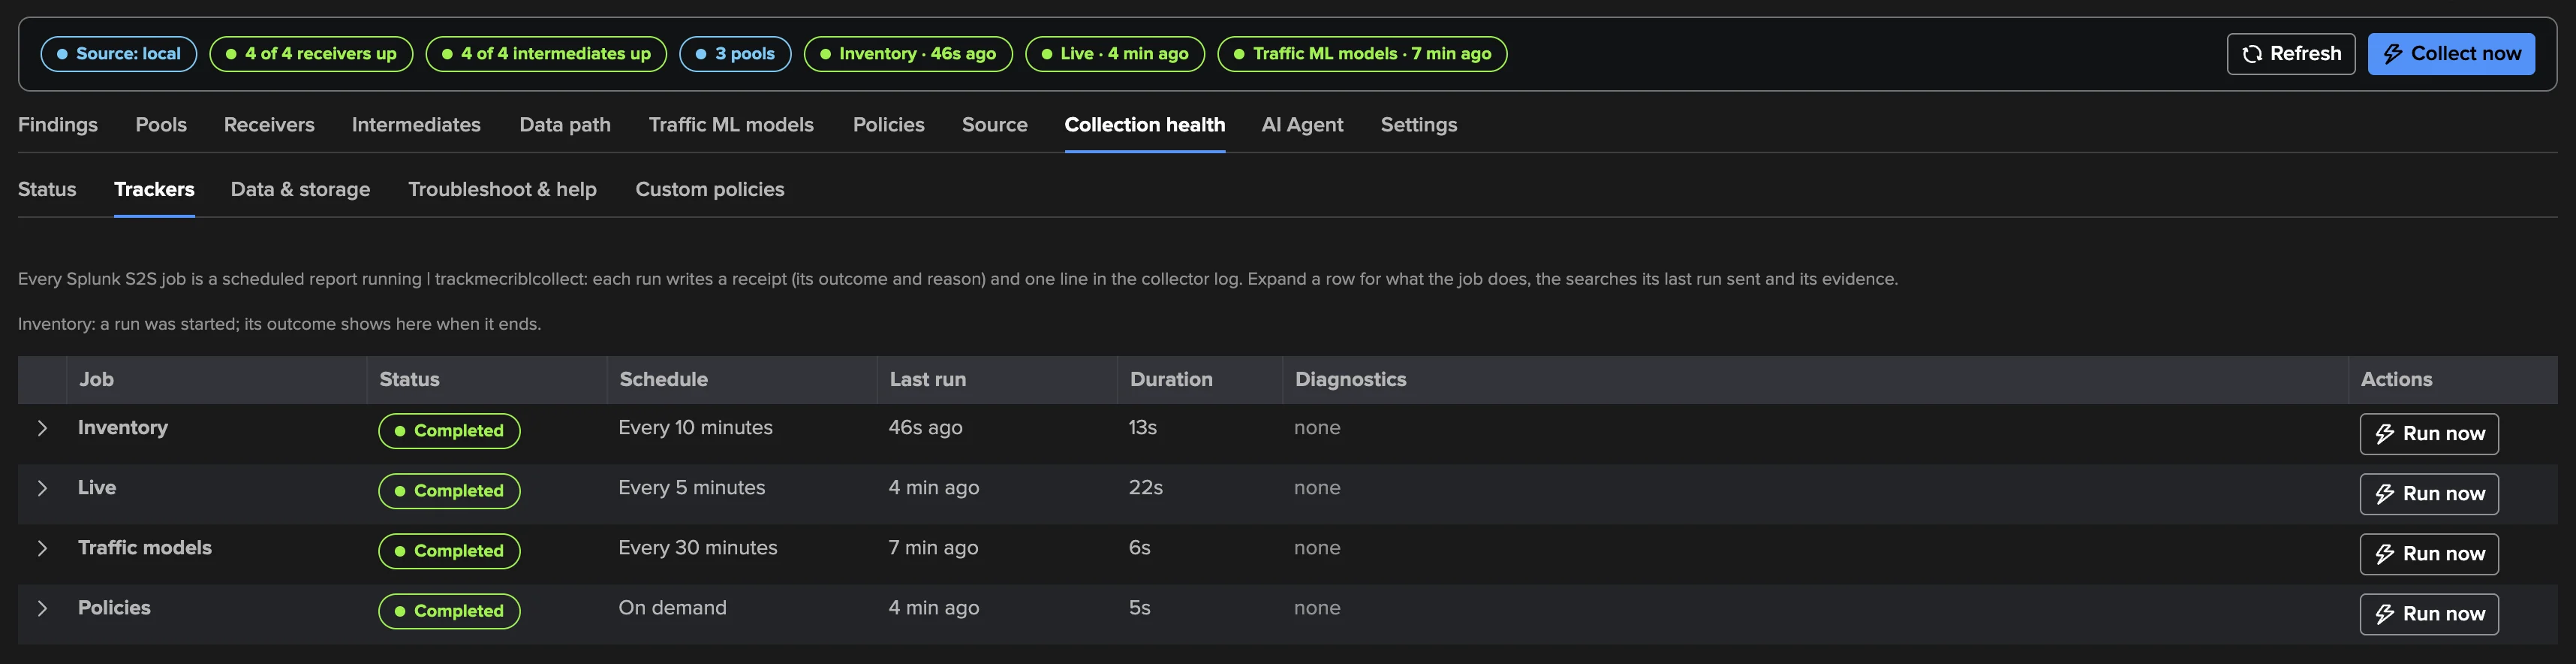
Job (Collection health label) |
What it does |
|---|---|
Inventory (every 10 minutes; the directory is rebuilt about hourly, always on a manual run) |
The roles over a day, the intermediates’ type, the indexer clusters (the search head’s view every run, the manager’s through its account), the pools, and a probe that chooses the telemetry form. Publishes the directory. |
Live (every 5 minutes) |
Per receiver and intermediate: the inbound connections (senders by type and version, TLS and acknowledgement mix, volume), an intermediate’s output groups and destinations, the pipeline queues and their threads, stopped listening ports, output pauses and connection failures, the health report, churn, CPU and memory. Per pool: the sums, the members up and the balance. Writes the series to the tenant’s metric index, then evaluates every policy. |
Traffic ML models (twice an hour) |
Learns each receiver pool’s models when due (see Traffic ML models). |
Policies (on demand) |
Evaluates the policies again on the latest live window (Run now in Collection health). |
Host statuses. In each window a host is not accepting (it stopped its listening ports), silent (no connection line in the live window), output paused (an intermediate), back pressure, or up — the first that applies.
Why senders are held back. A receiver writes every S2S connection into its input queue, then
into the ingestion pipeline (splunktcpin → parsingqueue → aggqueue → typingqueue
→ rulesetqueue for parsed data → indexqueue); a heavy intermediate adds its output queues
(tcpout_<group>). When a stage cannot keep up, its queue fills, then the queues before it,
until the receiver pauses its senders or stops its listening ports. The tenant reads every queue
of that path, names the bottleneck — the stage after the furthest-downstream saturated queue —
and whether that stage’s thread was busy (working at its limit) or waiting on the next stage. On an
intermediate it names the origin: downstream (its output paused, or a receiver pool it feeds
backs up), upstream surge (inbound above 1.5 times its learned volume) or local.
Note
An intermediate’s own tcpout count is compressed bytes on the wire, not comparable with
what its receivers count (uncompressed). The workspace labels it Sent on the wire
(compressed) and shows the receivers’ side as the relayed volume: never compare the two.
Before you start
A licence. A valid Enterprise, Unlimited, Unlimited trial or Developer licence. The Splunk S2S tenant is not available with the Foundation edition or the Foundation trial.
A source. The search tier that sees the receivers’ and intermediates’ internal indexes:
local, this search tier, when it searches the indexers that hold their
_internal(and_metrics/_introspectionwhen used);or a TrackMe remote account (Remote Splunk deployments) to the search tier of another deployment. The tenant’s scheduled searches run as the tenant owner, so the tenant owner must be allowed to use every remote account the tenant reads: the wizard and the Settings check it before saving and name the fix.
The three index names are configurable (defaults _internal, _metrics, _introspection).
Reading the indexer clusters. The cluster reads (/services/cluster/searchhead/generation and
each peer’s /services/cluster/peer/info, through | rest) need the read-only
list_indexer_cluster capability for the reader: the tenant owner on the local search tier, or
the source account’s user. Without it Splunk answers nothing, and Collection health reports
cluster_read_refused. A deployment with no indexer cluster can set Indexer clusters as pools
to Off.
Optionally, a manager account per indexer cluster. A TrackMe remote account on the cluster manager’s management port lets the tenant read the manager’s maintenance mode and rolling restarts, which Hold during planned work then follows. Give it a read-only role:
[role_trackme_cluster_reader]
importRoles =
search = enabled
rest_properties_get = enabled
list_indexer_cluster = enabled
The account is checked as soon as it is chosen, and an account that could change the cluster gets an advisory: TrackMe only reads, a read-only role is recommended.
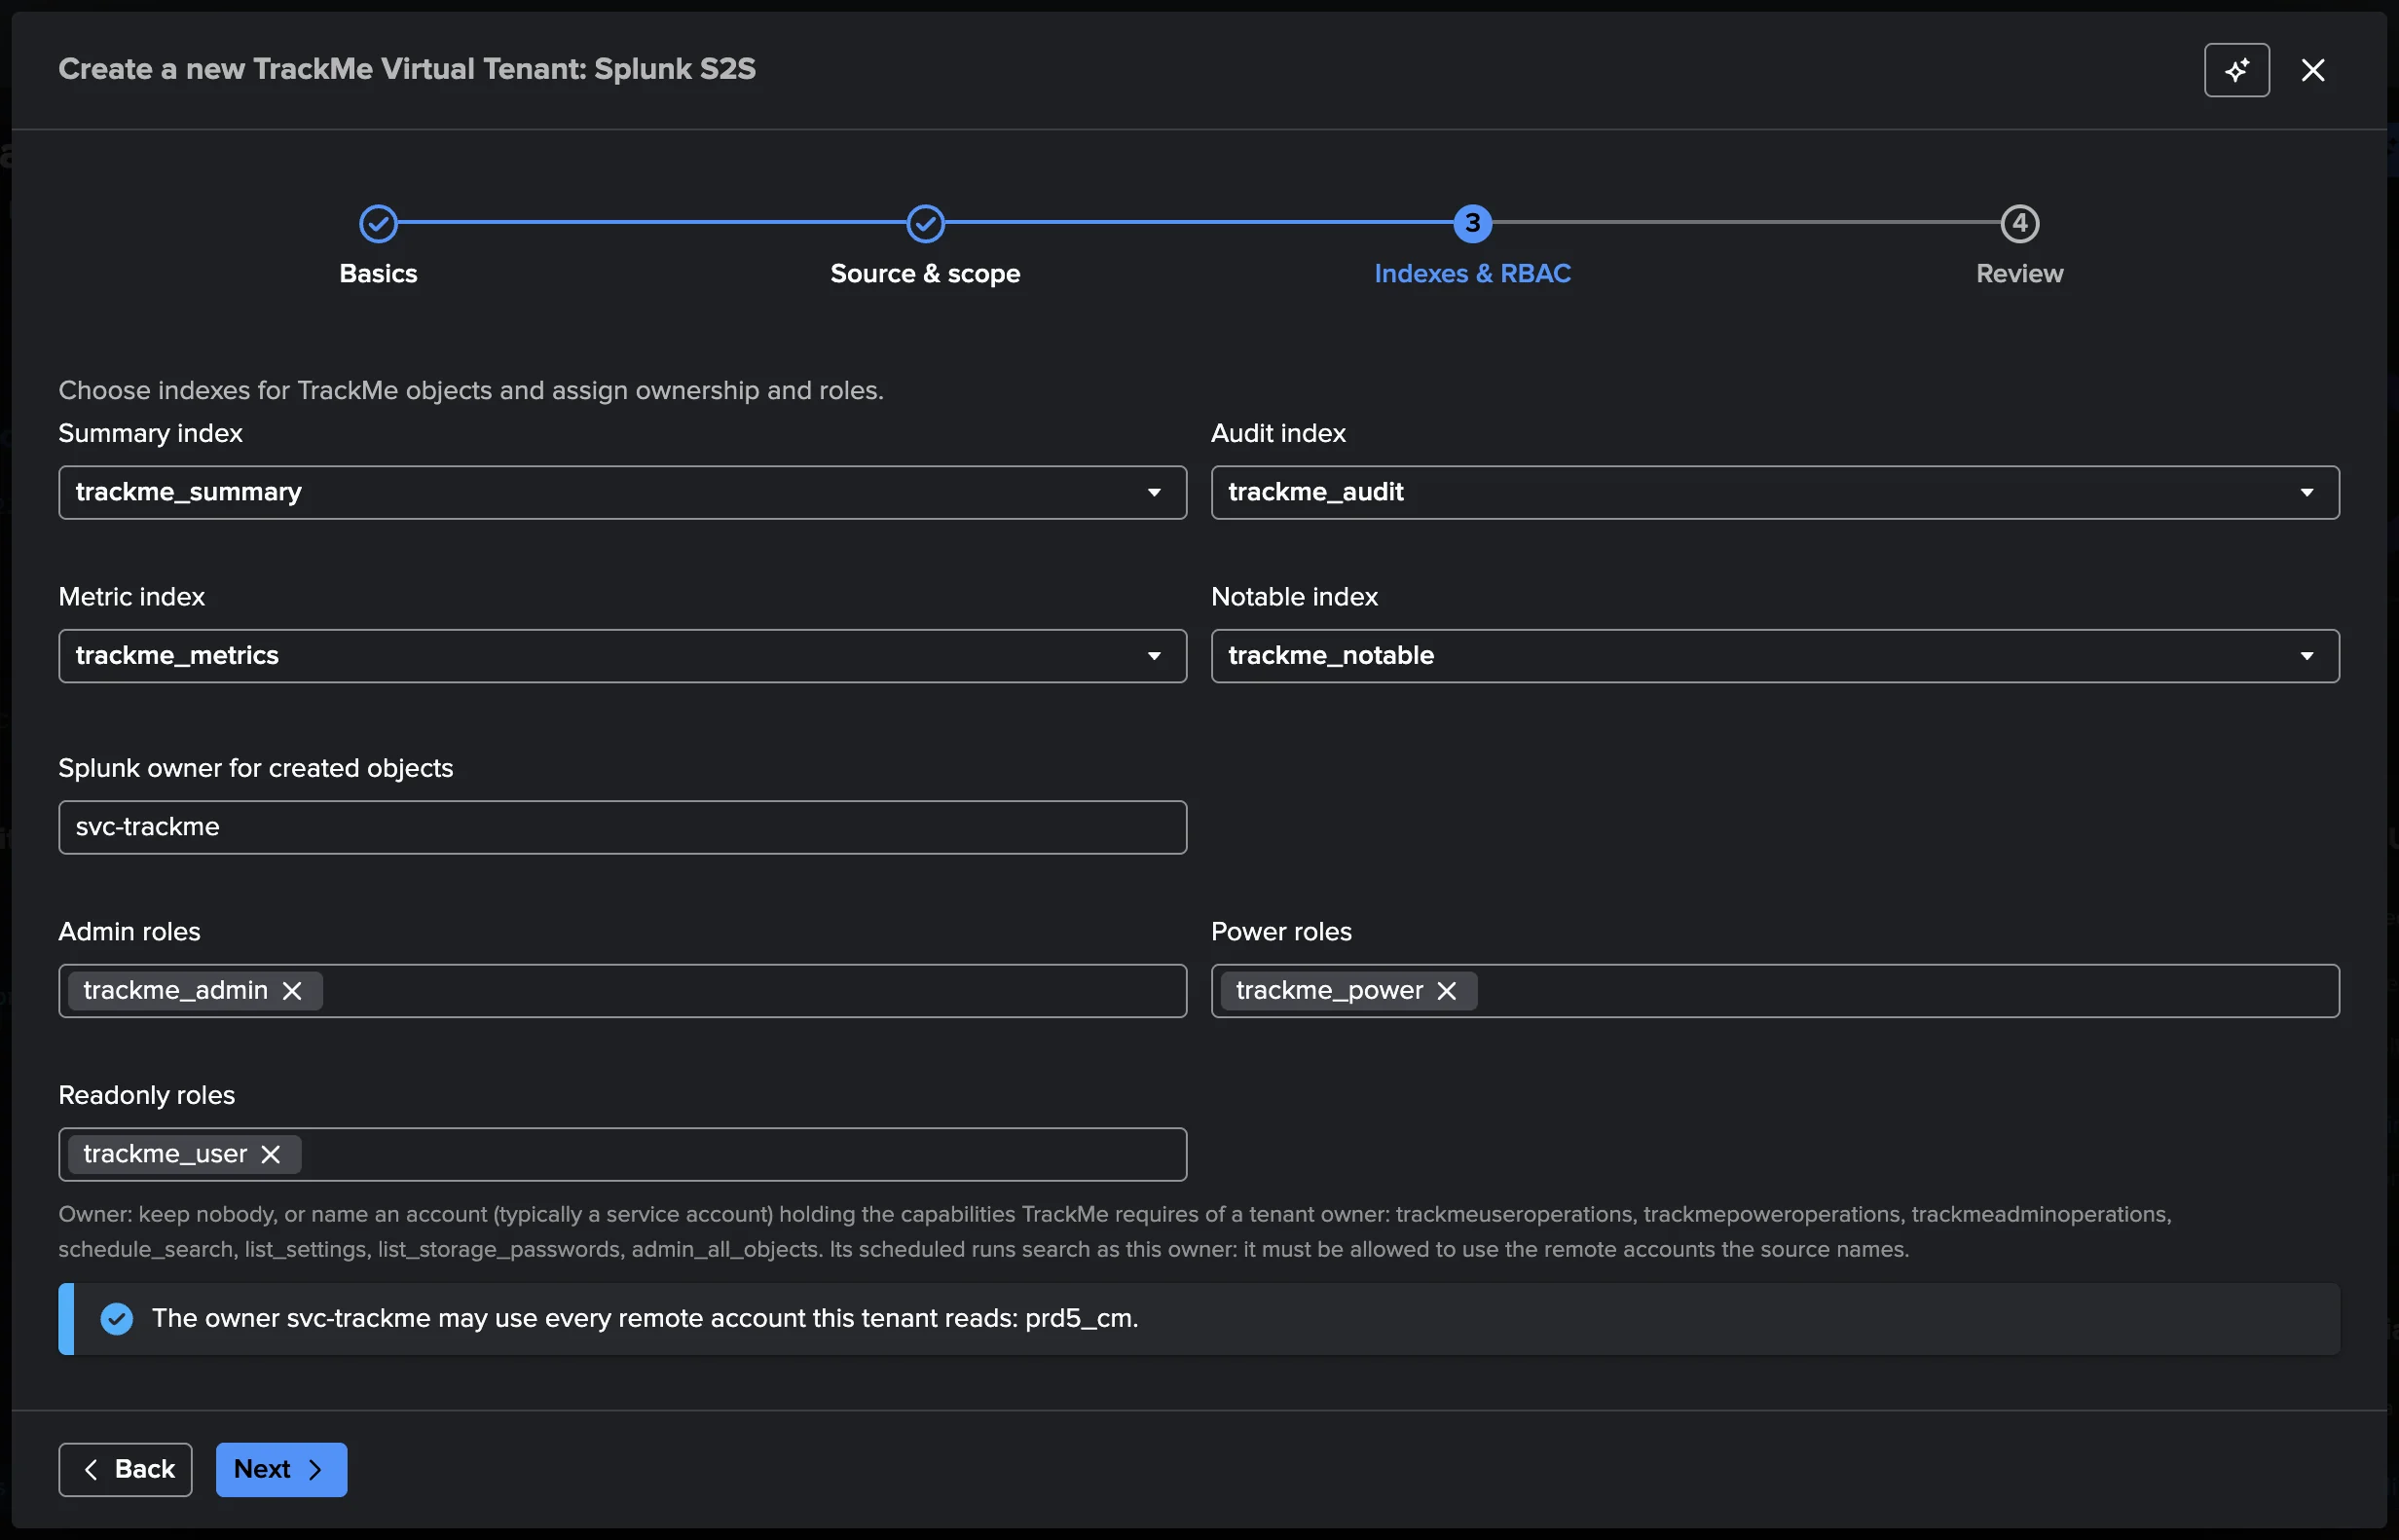
A tenant owner: nobody, or an account (typically a least-privilege service account) holding
the capabilities the wizard lists (trackmeuseroperations, trackmepoweroperations,
trackmeadminoperations, schedule_search, list_settings, list_storage_passwords,
admin_all_objects). The scheduled triage of the Splunk S2S AI Agent needs an owner that is not
nobody (see The Splunk S2S AI Agent).
Creating the tenant
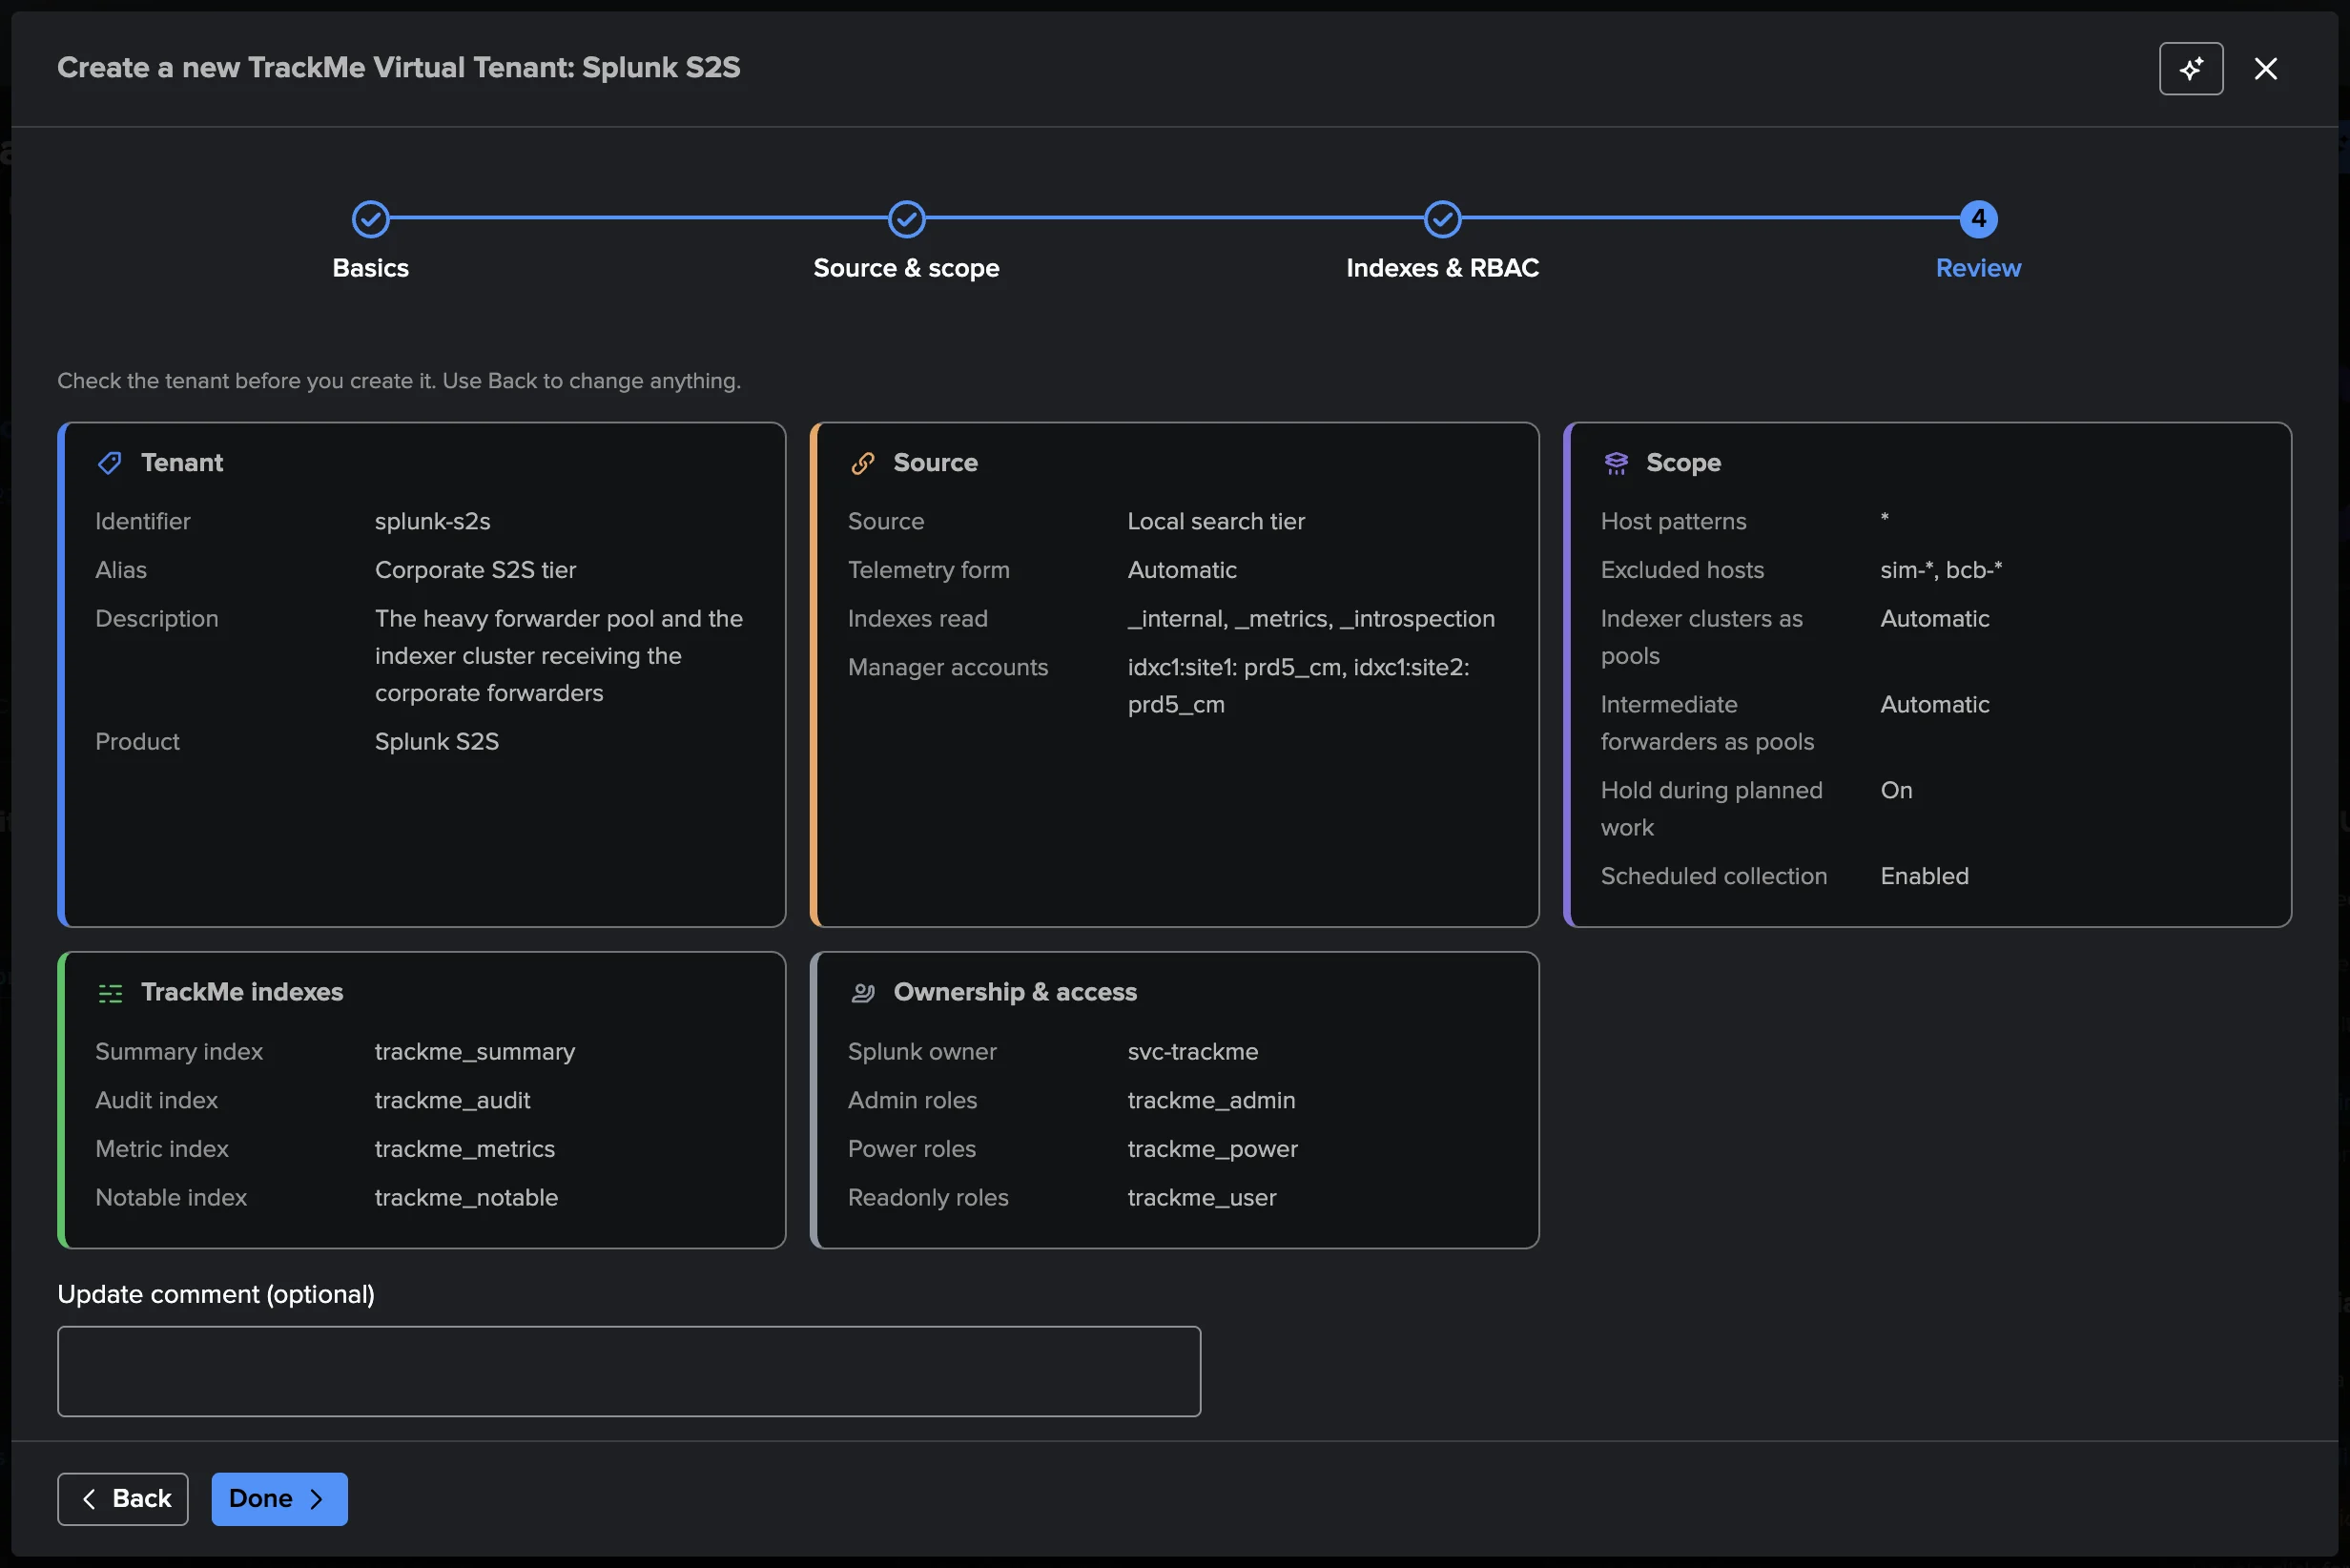
From the Virtual Tenants page, open Actions → Create a tracking tenant and choose the Splunk S2S card (“Watch your intermediate forwarders and indexers, pool by pool”). What it does opens the dialog shown at the top of this page.
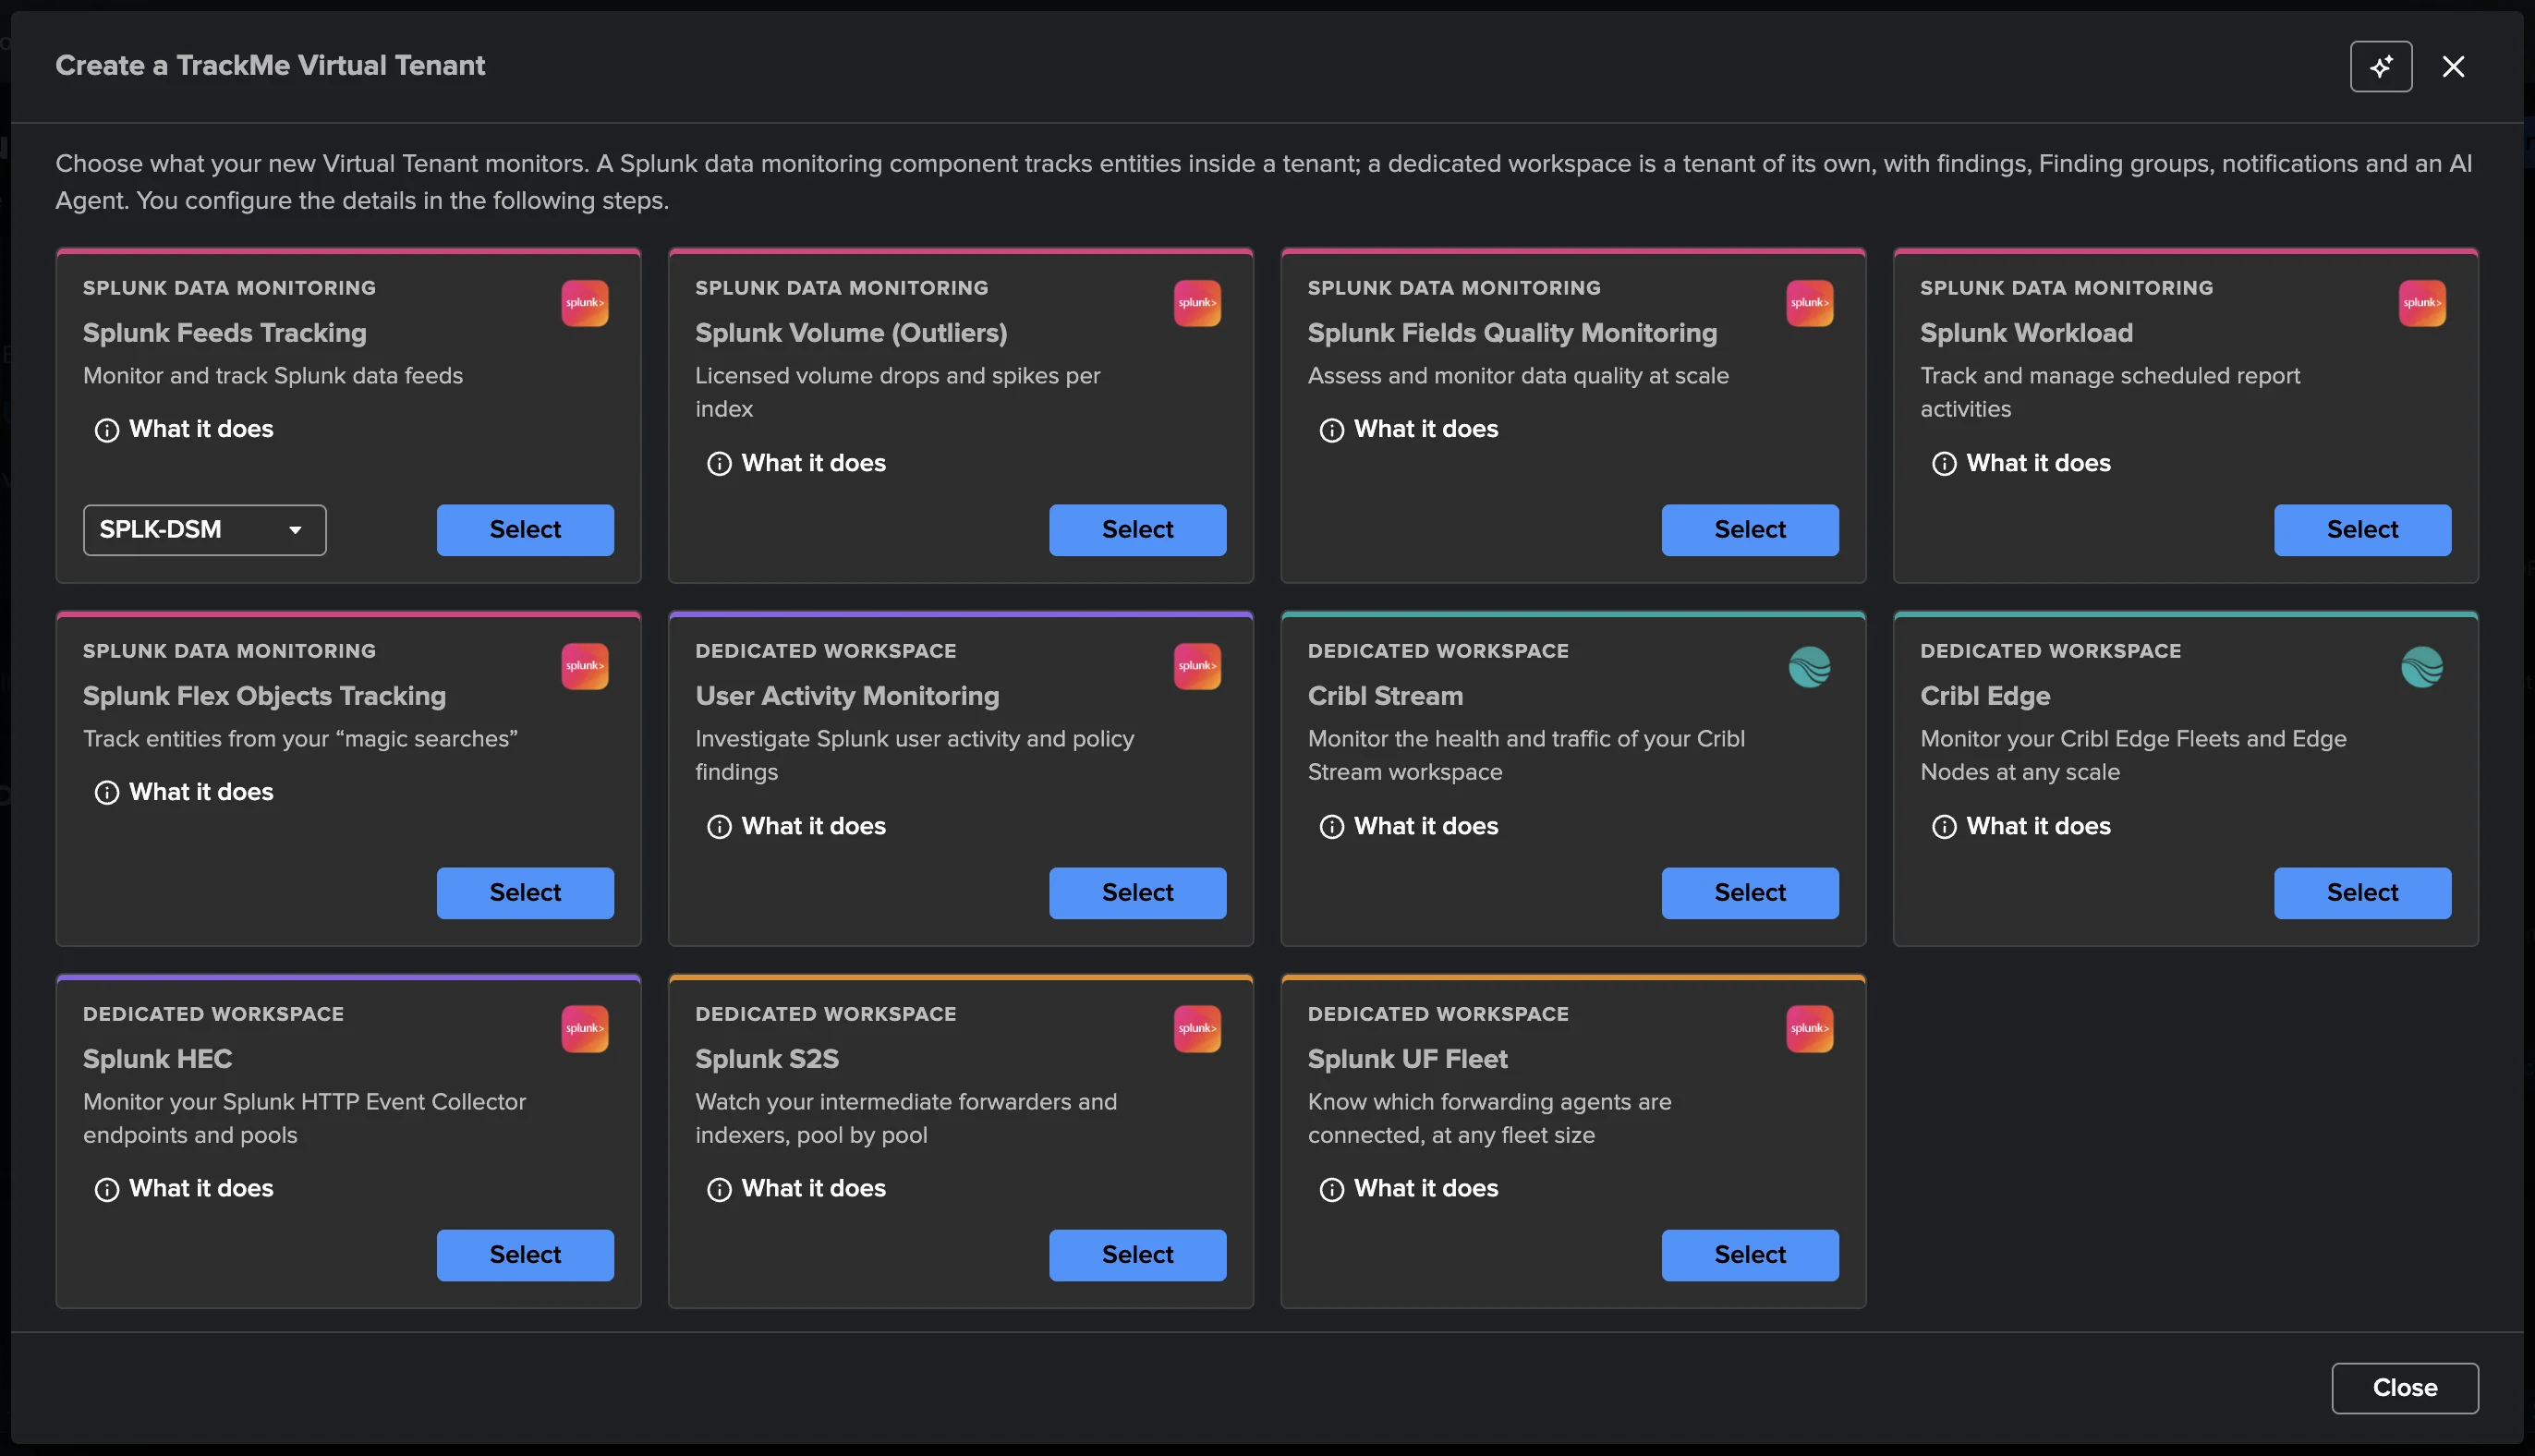
The wizard has four steps.
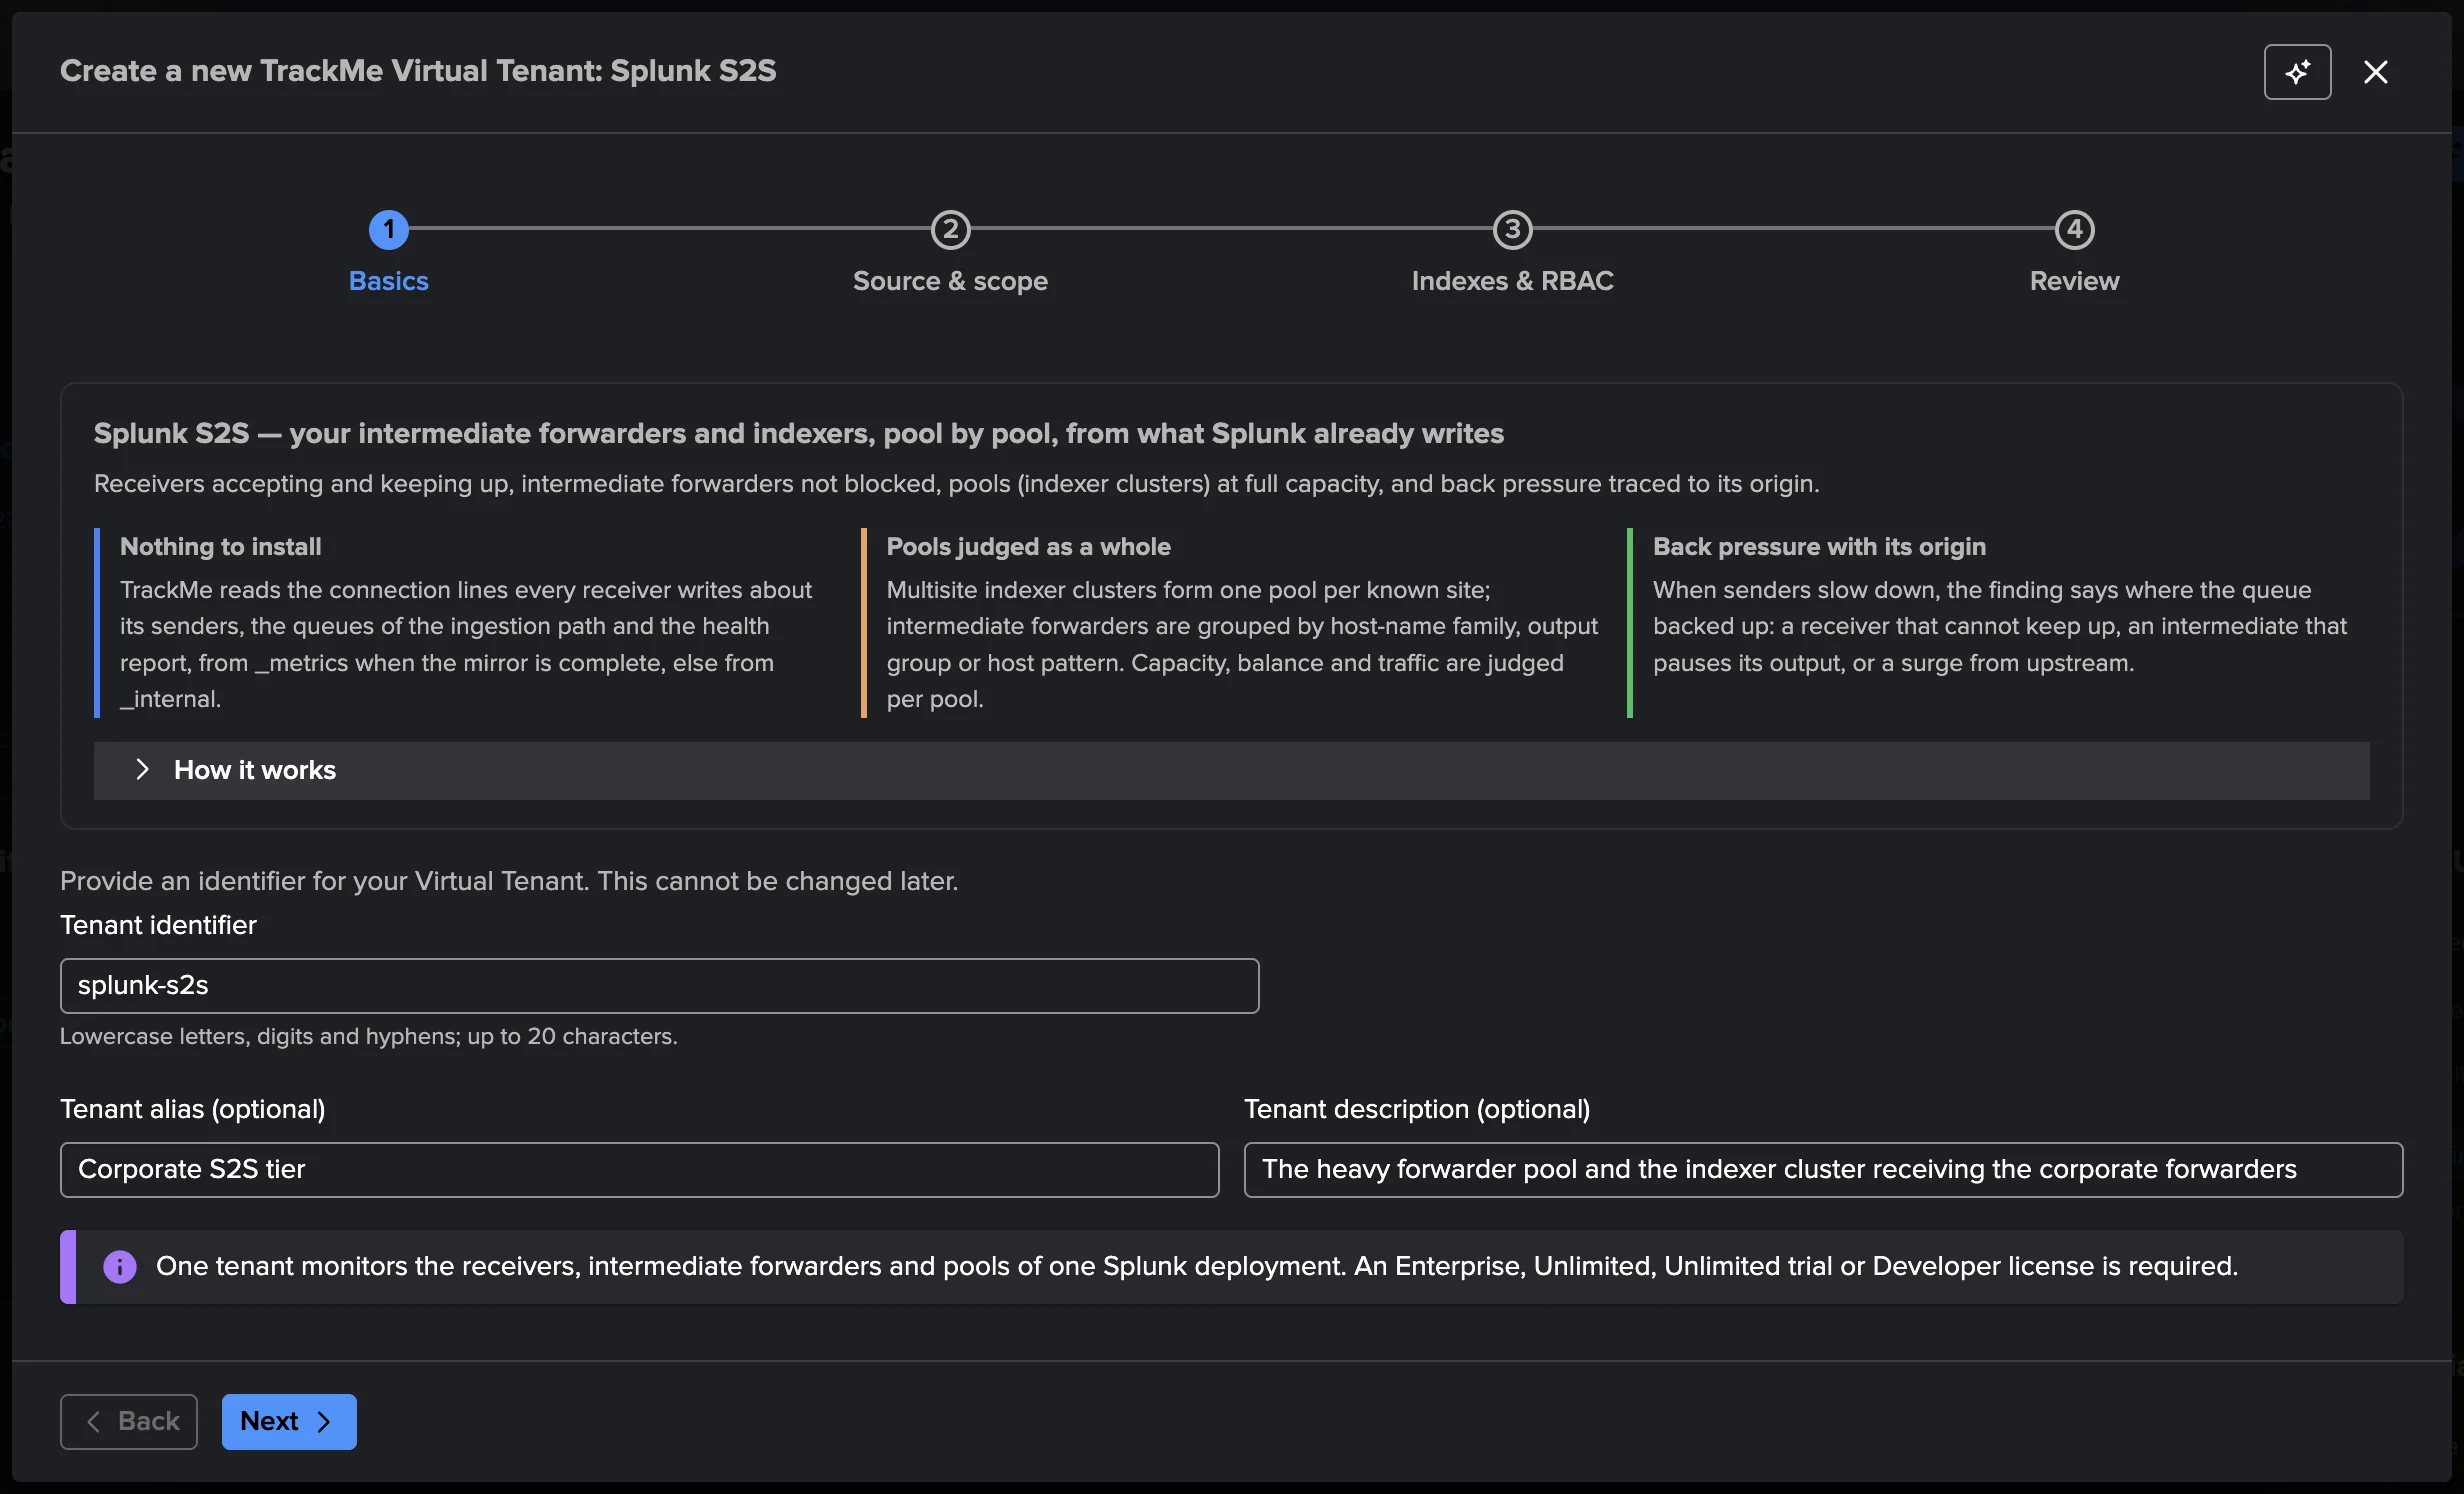
1. Basics — an introduction to what a receiver, an intermediate and a pool are, then the tenant identifier (lowercase letters, digits and hyphens, up to 20 characters, fixed once created), an alias and a description. One tenant monitors the receivers, intermediate forwarders and pools of one Splunk deployment.
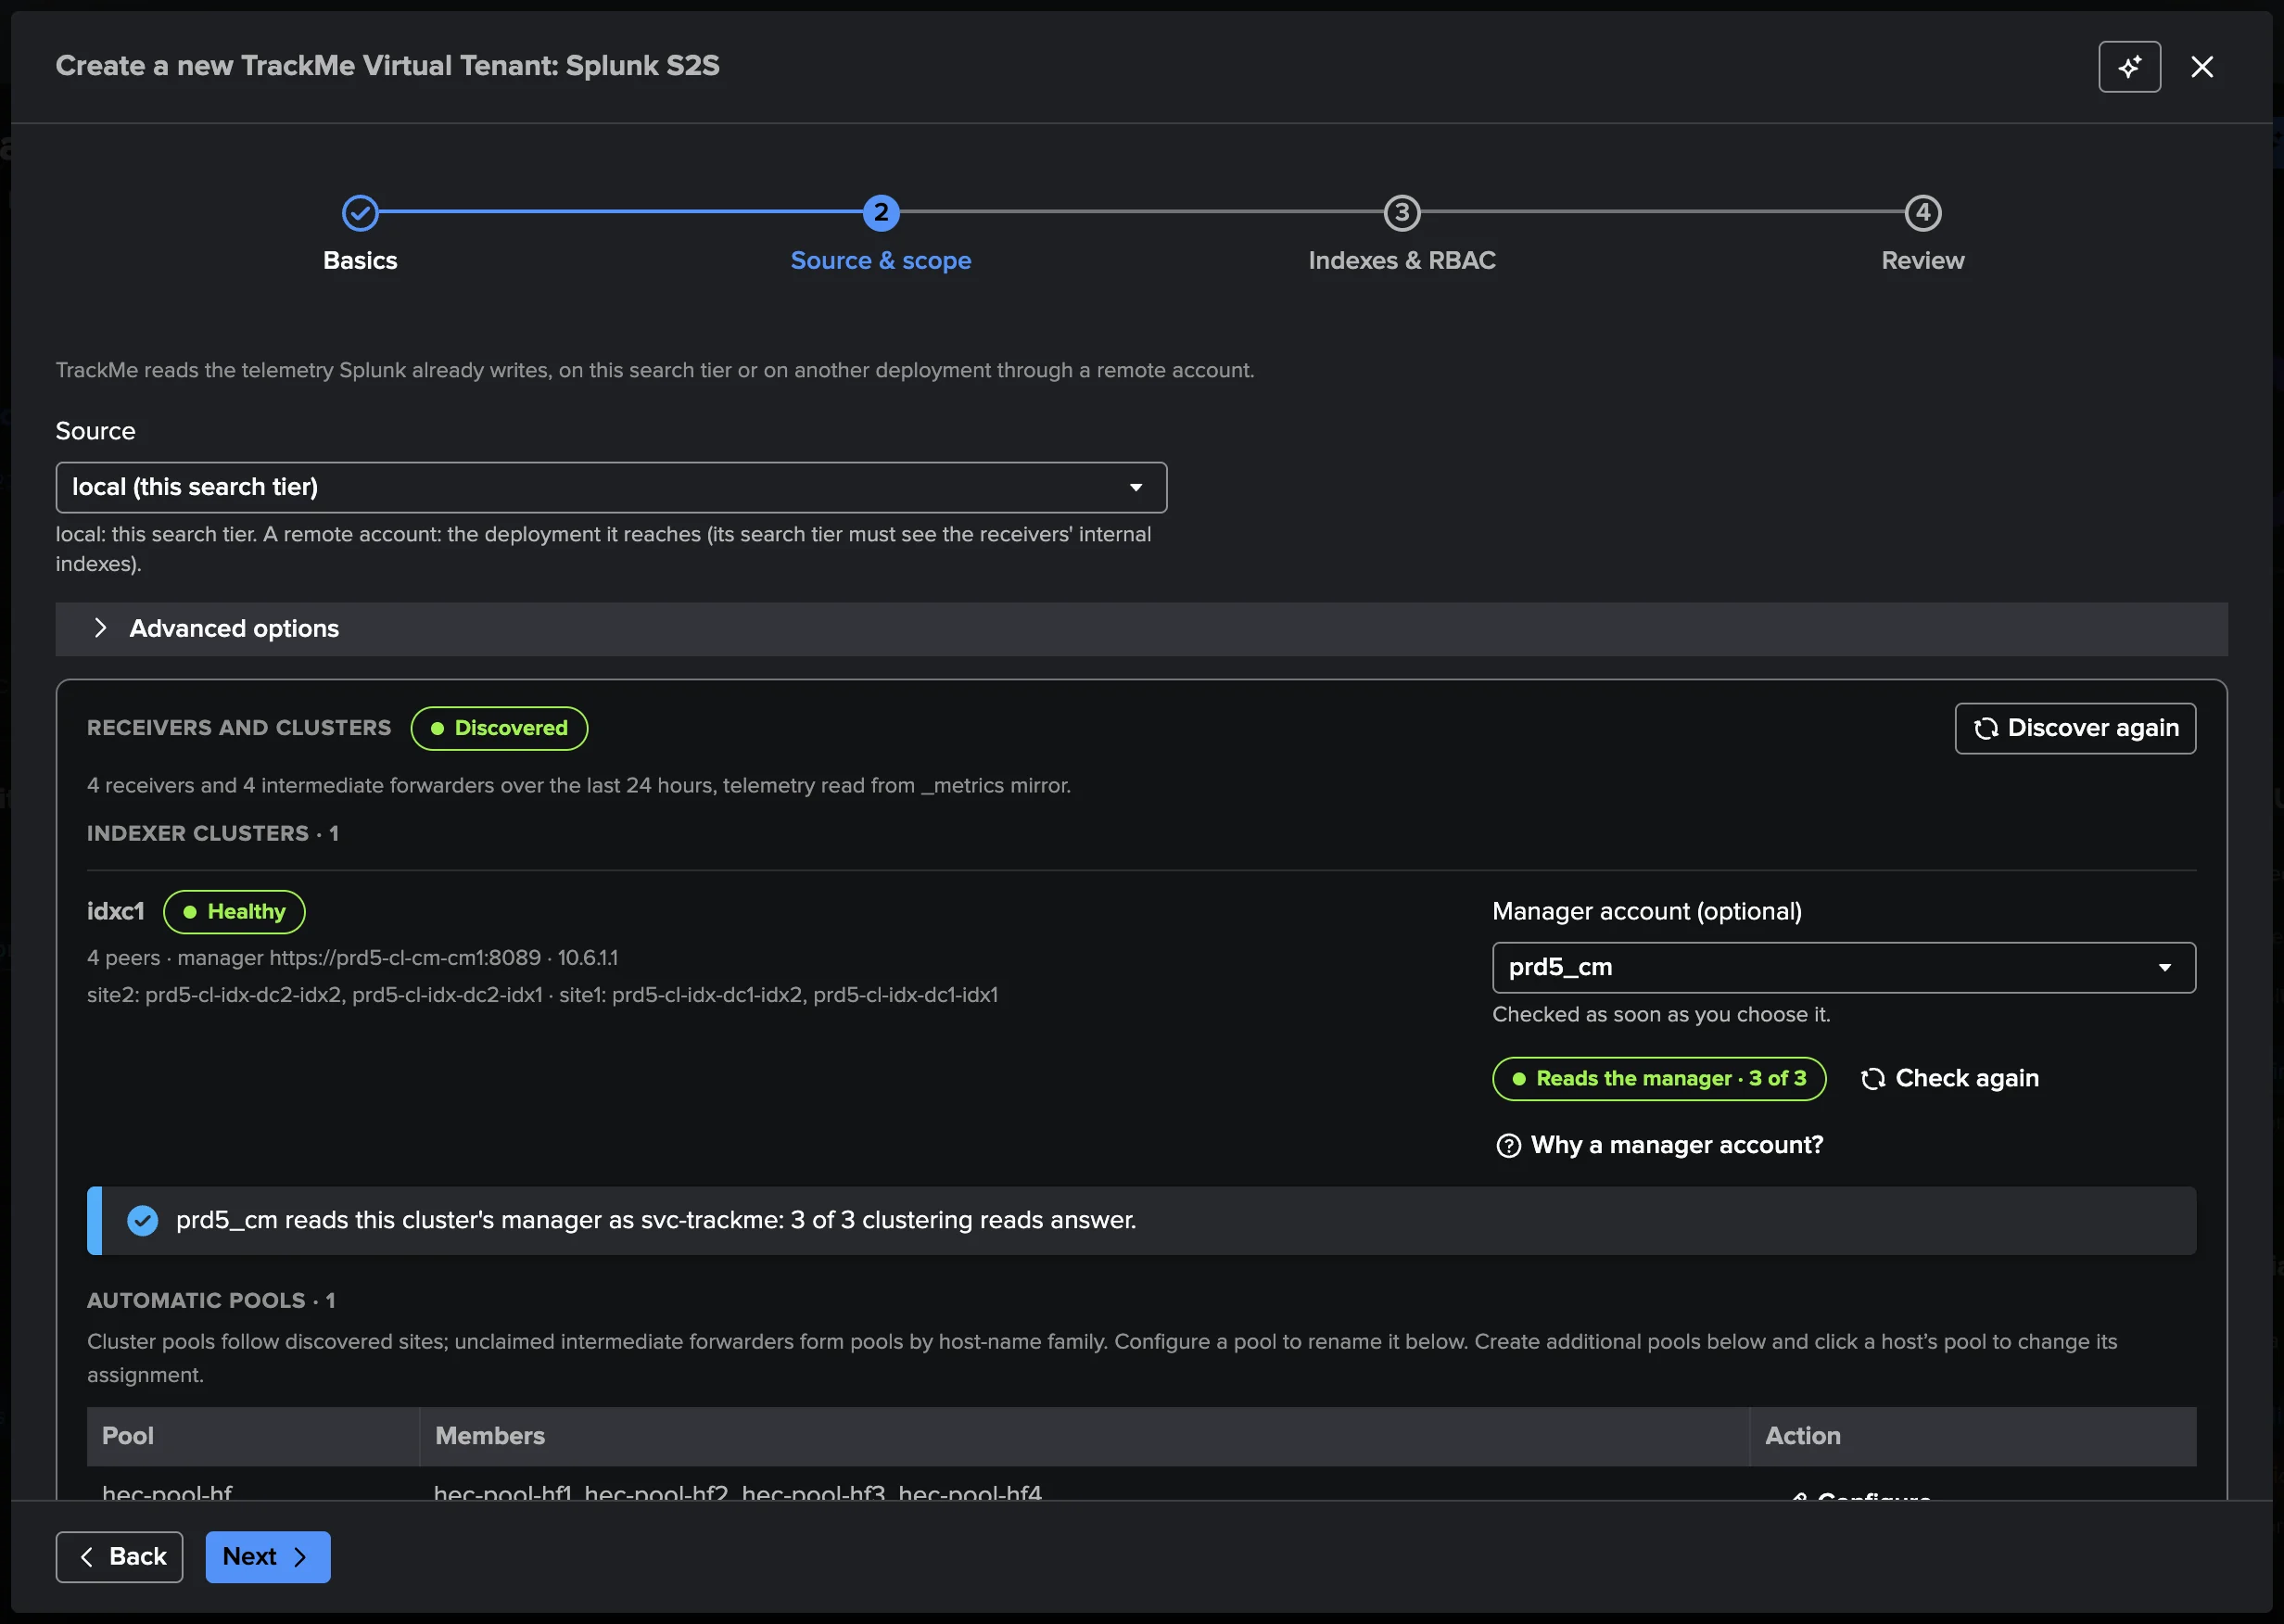
2. Source & scope — the Source (this search tier, or a remote account), then Receivers and clusters, the discovery of the receivers and intermediate forwarders found over the last 24 hours: each indexer cluster with its sites, its health and its peers, and beside it the cluster’s optional Manager account. The account is checked as soon as you choose it (“Reads the manager · 3 of 3”); each refused read says what TrackMe cannot read, what it costs and the role to create, and an account that could change the cluster gets an advisory recommending a read-only role. Why a manager account? explains the two levels.
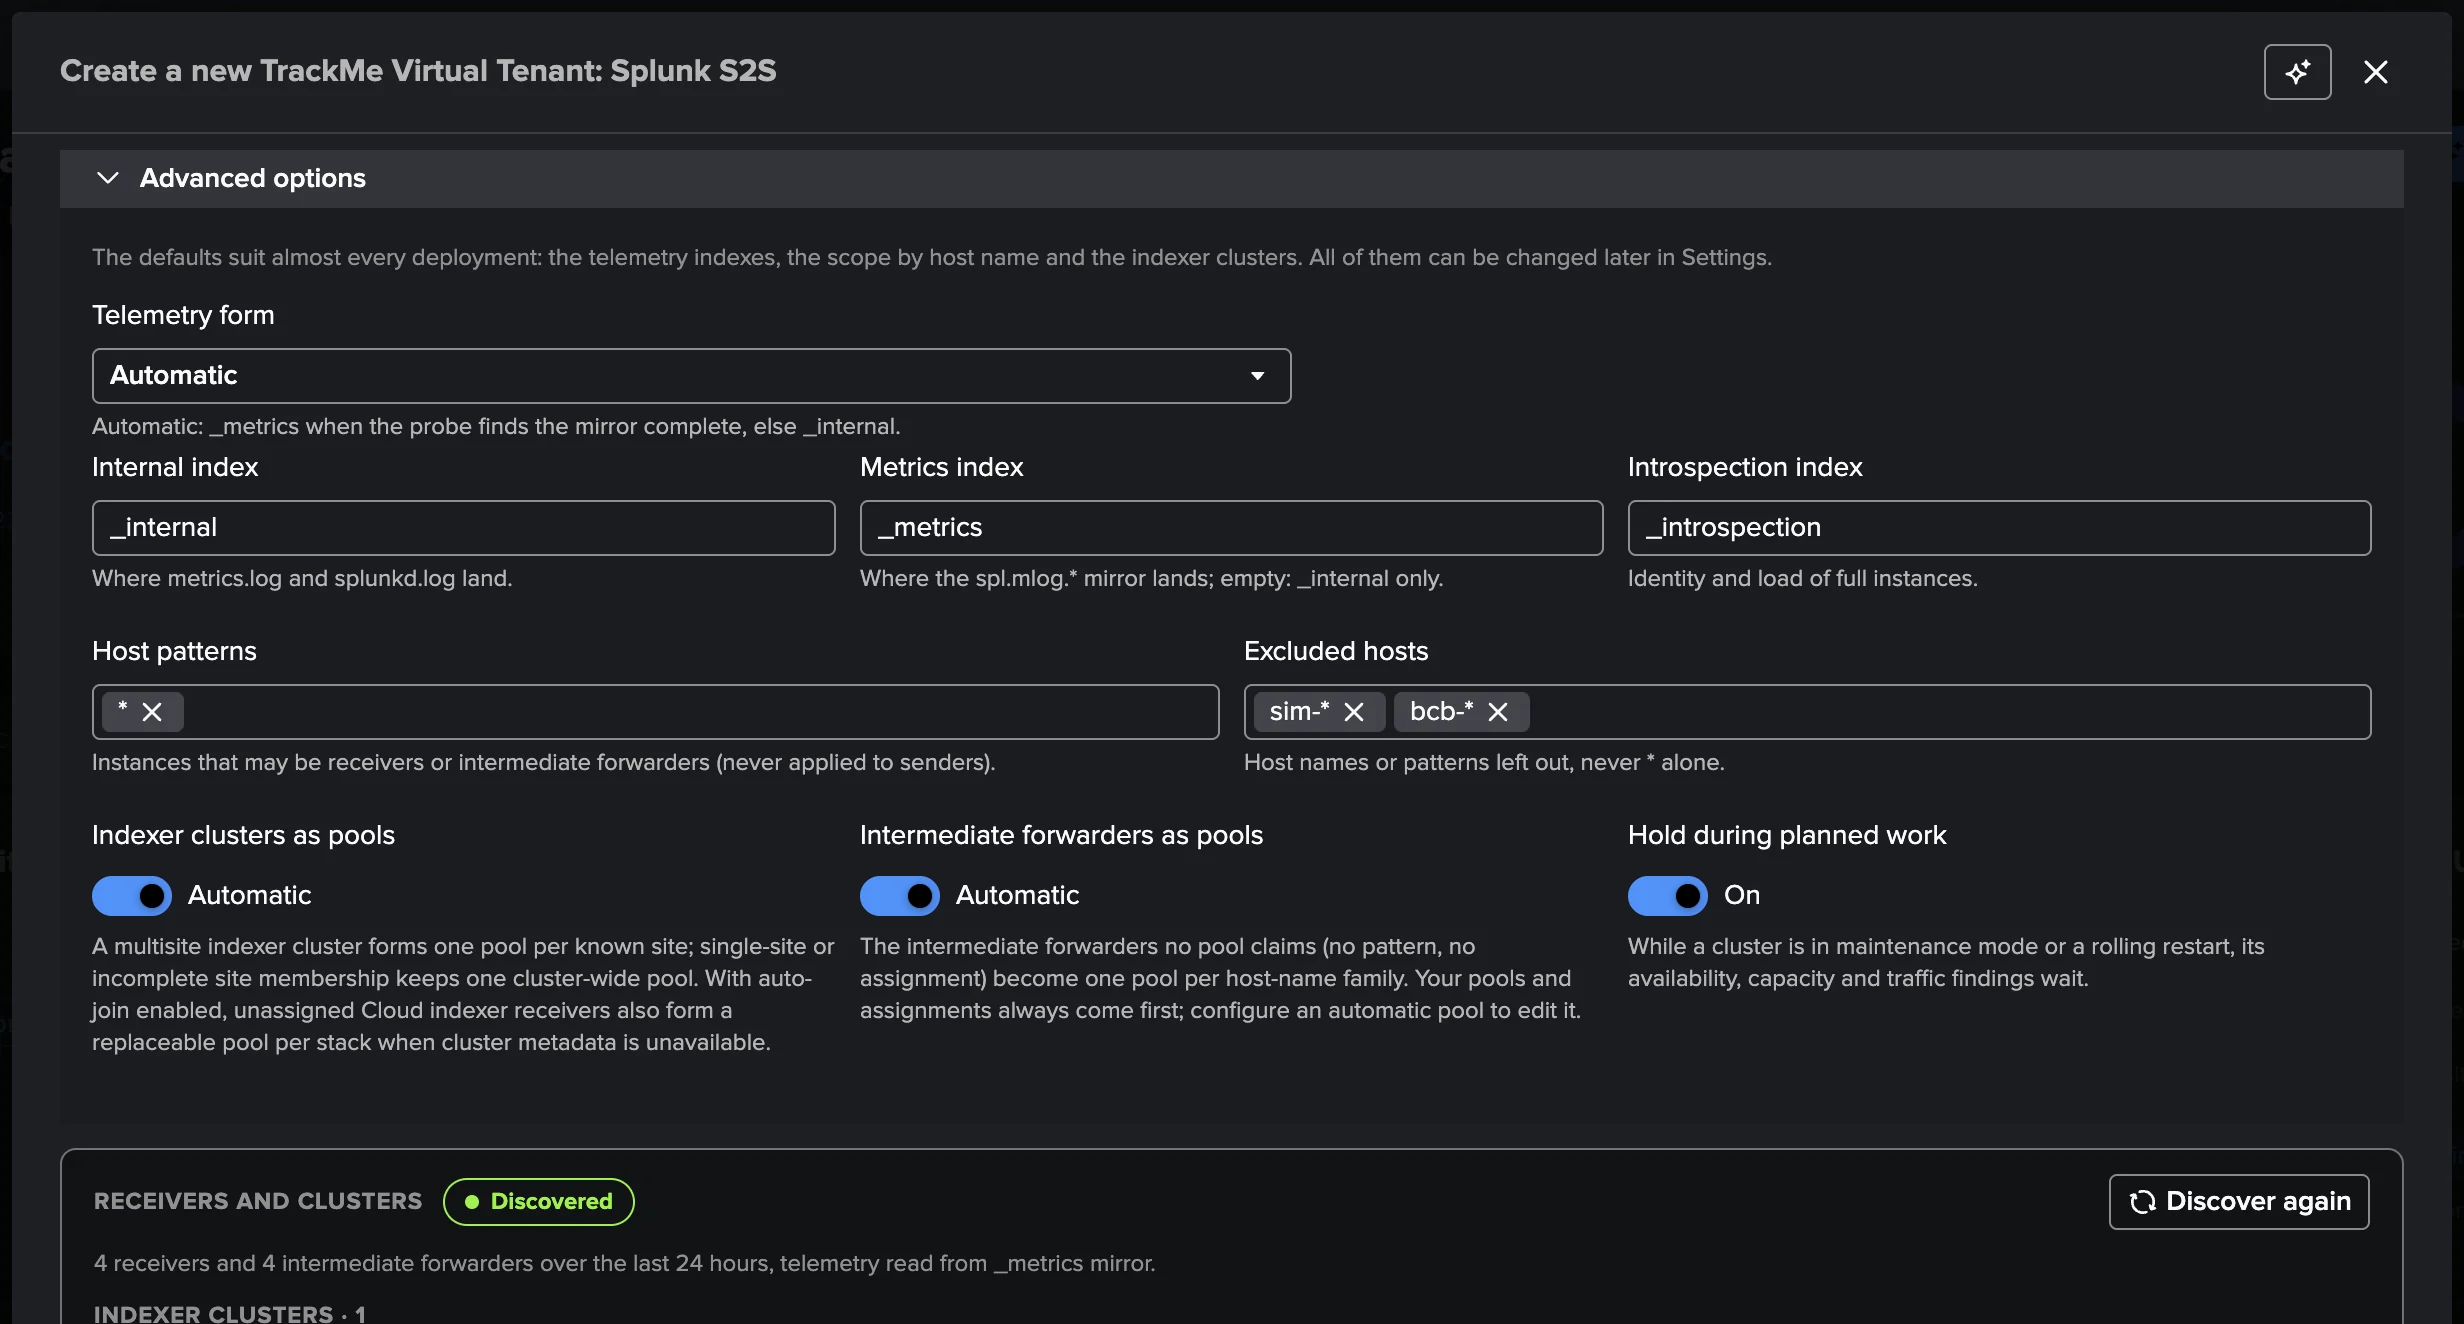
Advanced options (folded; opened when one of its settings needs a fix) hold the telemetry form
(Automatic: the _metrics mirror when the probe finds it complete, else _internal; or
forced), the three index names, Host patterns and Excluded hosts (type a host name or a
pattern and press Enter: each becomes a token; a pasted comma-separated list is split), Indexer
clusters as pools and Intermediate forwarders as pools (Automatic / Off) and Hold during
planned work (On / Off). The defaults suit almost every deployment. Set an exclusion here rather
than later: the first backfill (14 days) never reads the hosts it leaves out. Below, two families of
test receivers sharing the same indexes are left out: sim-* and bcb-*.
Below the clusters, the step shows the pools the tenant will start with, the same editor as Settings → Pools: the automatic pools (each site of a multisite cluster, and one pool per host-name family of the intermediates no pool claims, each with Configure), every host with its pool pill, and the configured pools. Click a host’s pool pill to assign it to a pool, or choose By the rules to give it back to the cluster, the patterns or its automatic pool. Nothing needs configuring here: the indexer cluster and the heavy forwarder tier below are pools from the first run.
3. Indexes & RBAC — the tenant’s TrackMe indexes (summary, audit, metric and notable), the owner and the admin, power and read-only roles. The wizard checks that the owner may use every remote account the tenant reads, the manager accounts included.
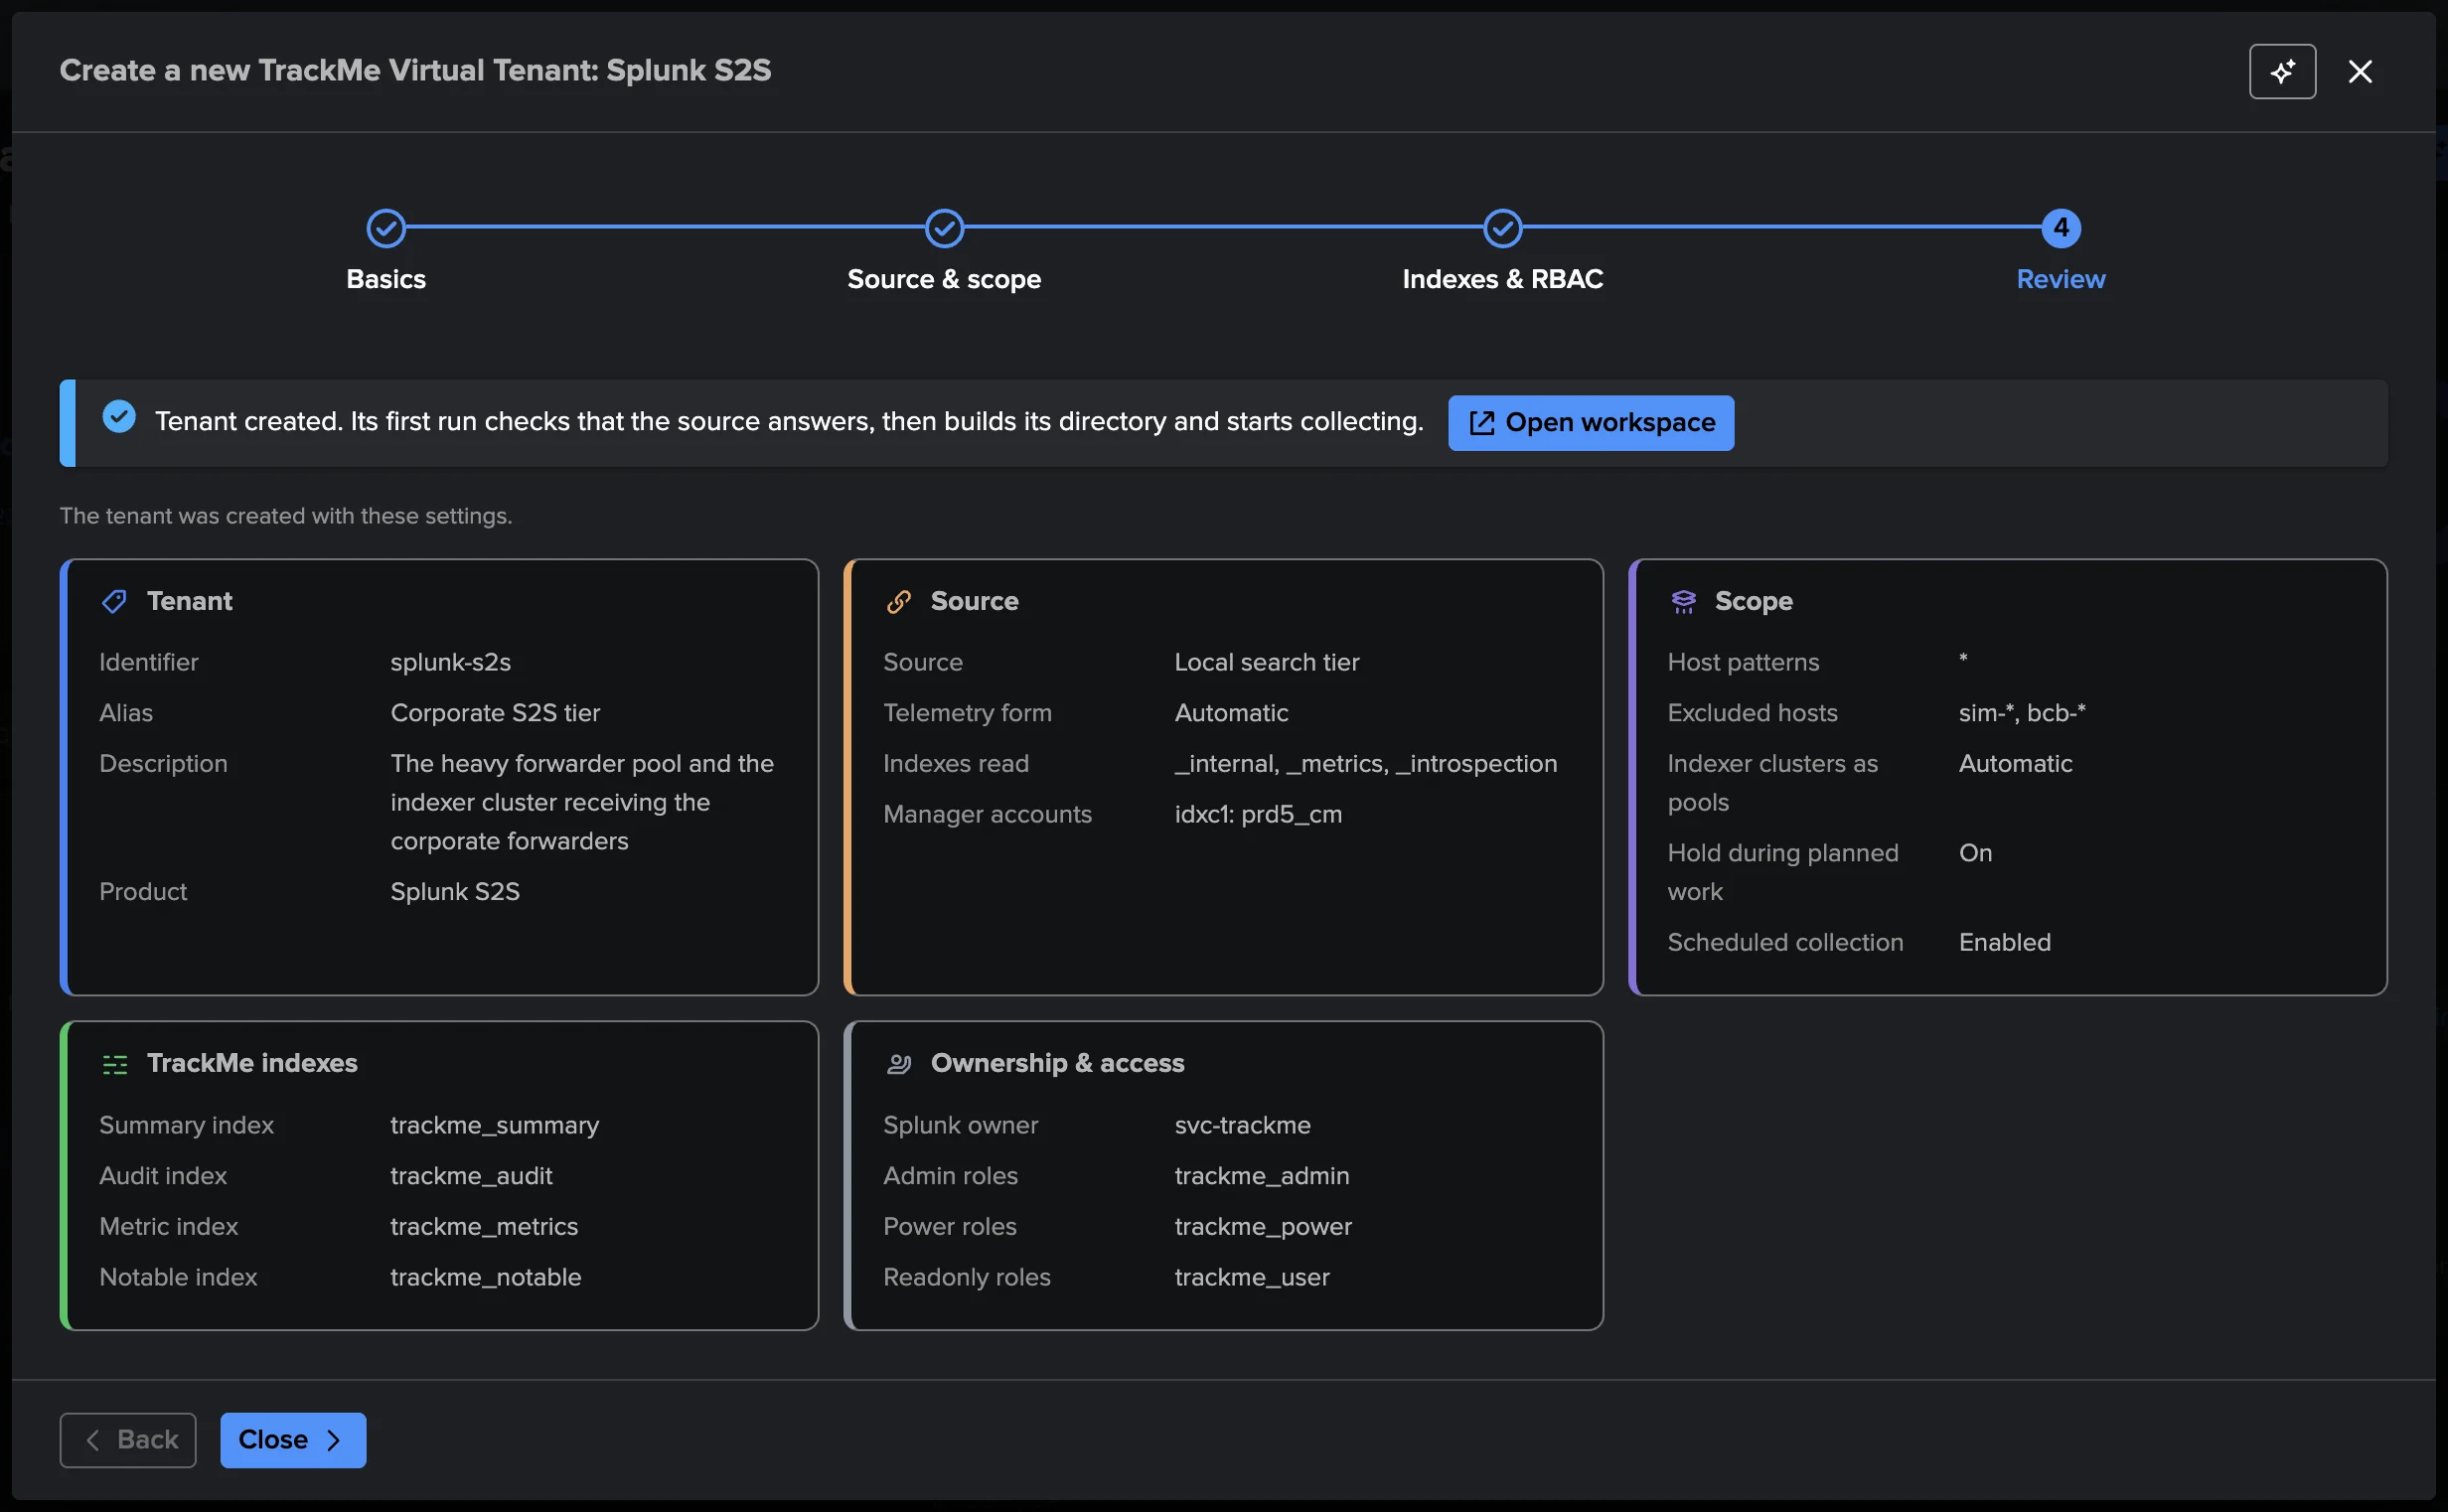
4. Review — the tenant, its source with the manager account of each site pool, its scope and its pool settings, then Done. The first live run starts at once: it checks that the source answers, then builds the directory and starts collecting. Open workspace opens the tenant.
Configuring pools
An indexer cluster (one pool per site of a multisite cluster) and the intermediate tier (one automatic pool per host-name family) are pools from the first run. Settings → Pools shows the same editor as the wizard: the automatic pools, every host with its pool pill, and the configured pools (up to 200 pools in all). Make a pool your own when it needs a name, its output groups or an expected size; group receivers no cluster claims (standalone indexers, Splunk Cloud indexers) in a configured pool of their own.
Configure on an automatic pool turns it into a configured pool with the same id, so its
findings and history continue; on the lab tenant, the automatic pool hec-pool-hf became the
Heavy forwarder tier. A configured pool has a name, an id (fixed once saved: its findings and
history follow it), its members (receivers or intermediate forwarders), host patterns, the
output groups that send to it, an optional expected size, and Replaceable members for a
tier whose members are replaced by new instances (an autoscaled tier, Splunk Cloud indexers): a
silent member then waits for its replacement before a finding opens. A site pool of an indexer
cluster can be renamed too (its members always come from the cluster); removing a configured pool
gives its hosts back to the automatic pools.
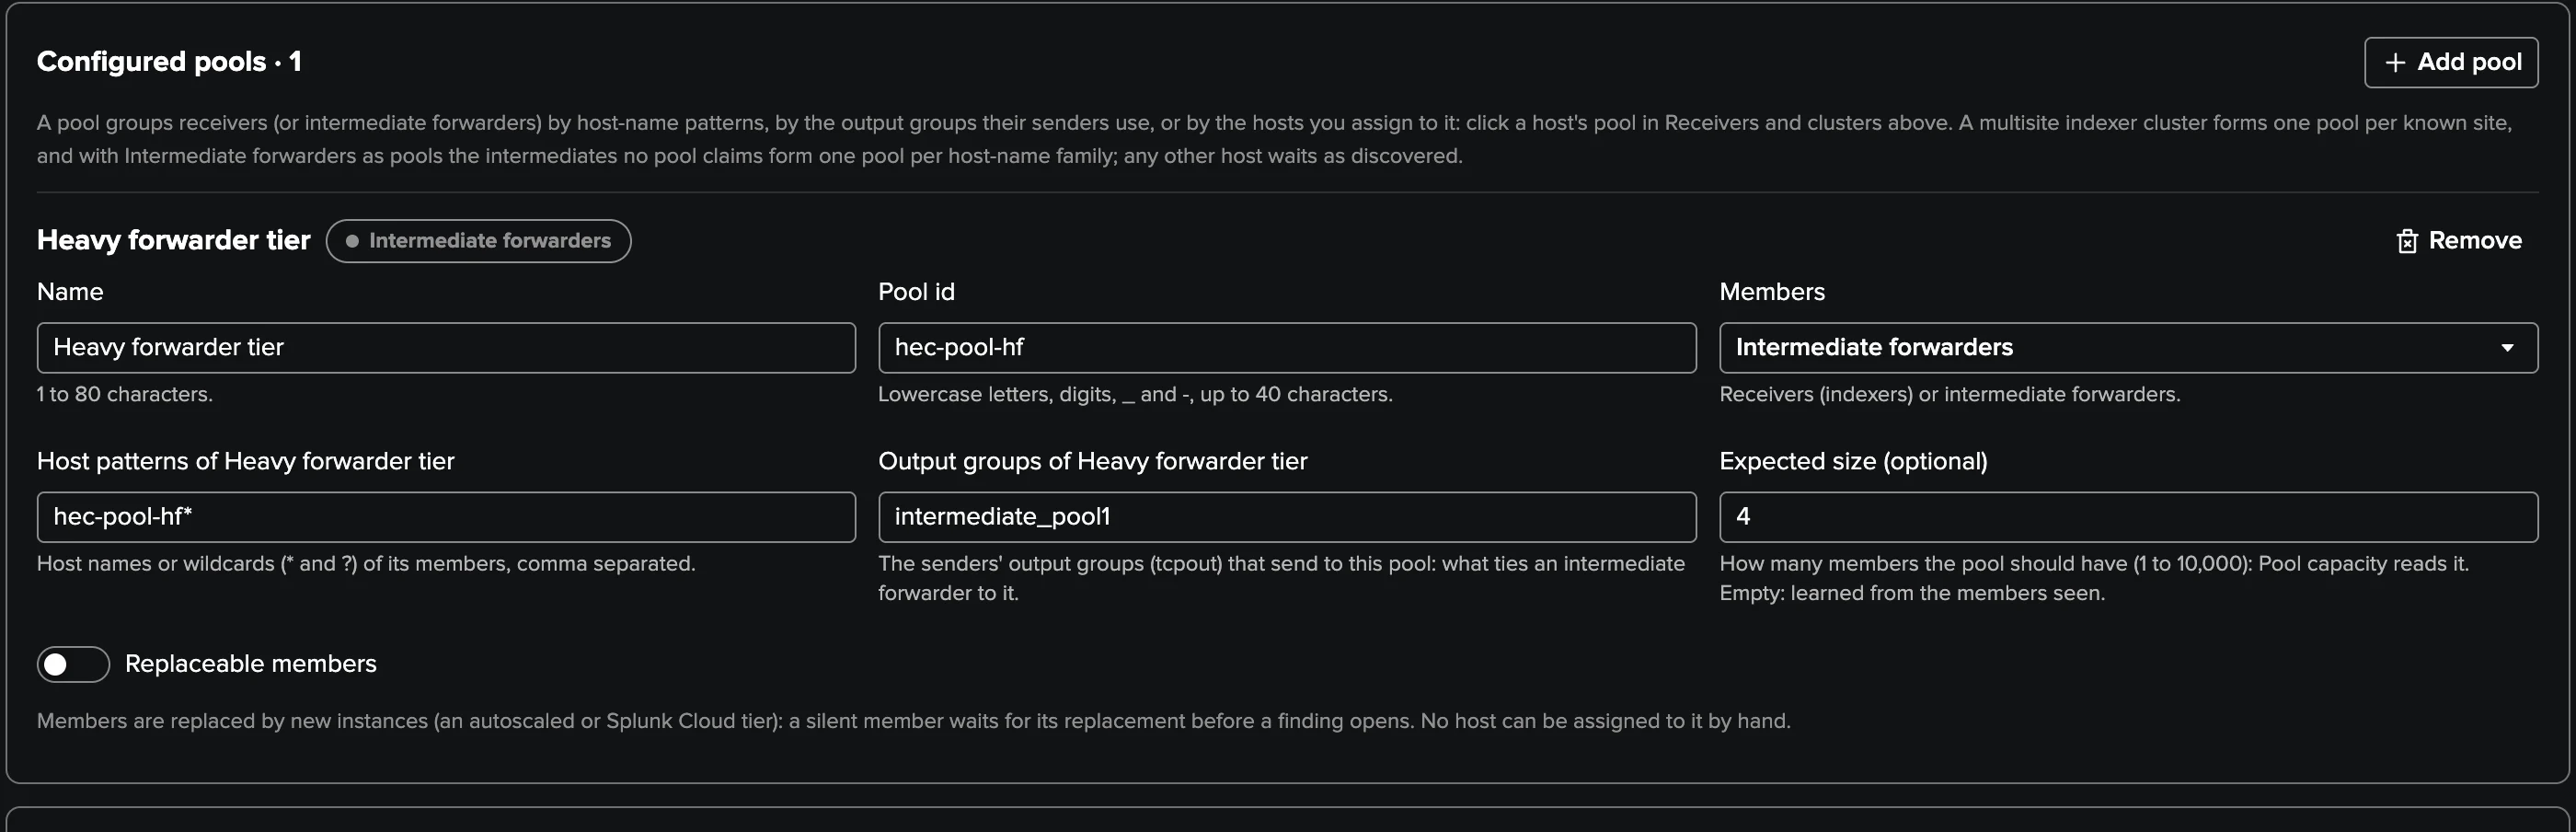
Output groups tie an intermediate tier to what it feeds. The output groups are the senders’
tcpout group names that send to the pool (here the forwarders’ intermediate_pool1). They
are how an intermediate is tied to the receiver pool it feeds, and how a sender’s traffic is placed
on the data path; an intermediate is never tied by guessing from a destination address.
A host is placed by the first rule that applies: a host assigned by hand (from its pool pill), then the indexer cluster it is a peer of (its site’s pool on a multisite cluster), then a configured pool whose patterns match (when Auto-join is on), then the automatic pool of its host-name family (an intermediate), else discovered (no pool). An intermediate never joins a cluster pool, and your pools and assignments always come before the automatic ones. A pool may hold hand-picked hosts only, with no pattern. A pool change applies from the next inventory; to see it at once, Run now the inventory in Collection health, then Collect now.
The workspace
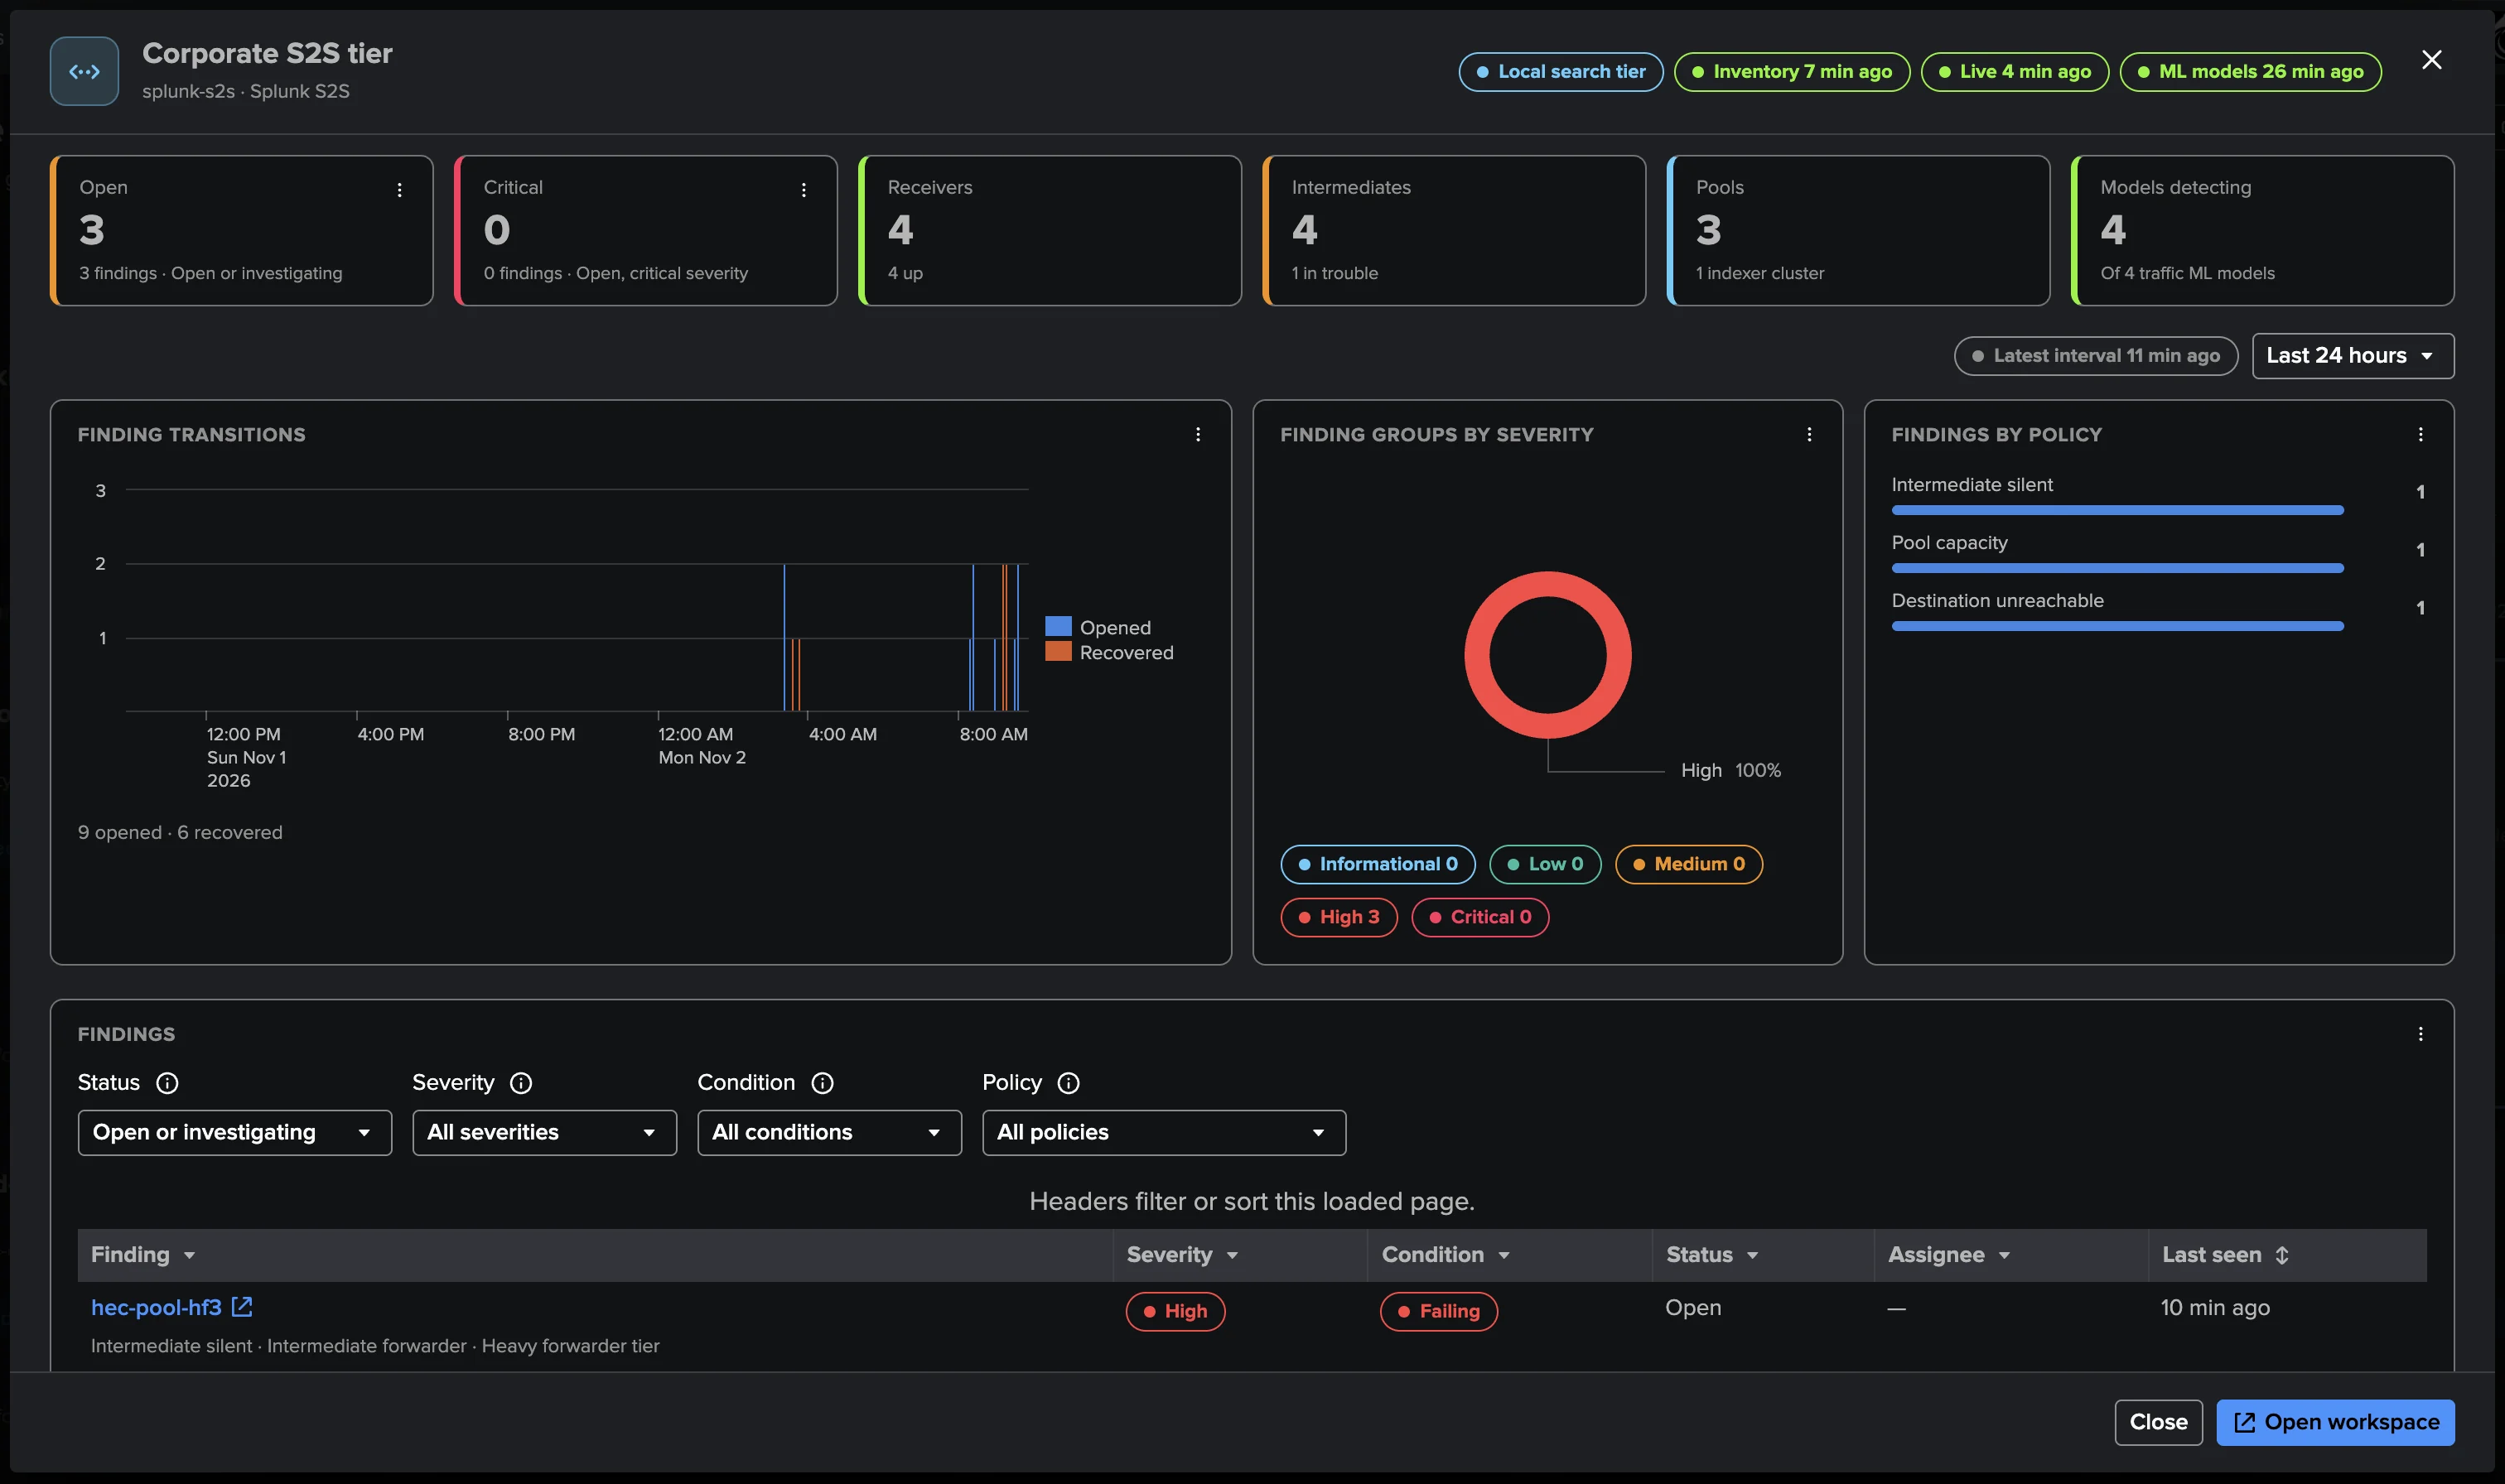
The preview. On the Virtual Tenants page, a double-click on the tenant card opens its preview before the workspace: the source and the collection pills, the Open and Critical figures, Receivers and Intermediates (with how many are in trouble), Pools and Models detecting, the finding transitions and severities of the last 24 hours, the findings by policy and the findings table, read-only. A finding opens in the workspace; Open workspace opens the tenant. Before the first live run, the figures read as dashes.
The workspace is the Tenant Home of the tenant. A status strip sits above the tabs: the source, “N of M receivers up”, “N of M intermediates up”, the pools, and the Inventory, Live and Models job pills (each opens Collection health), with Refresh and Collect now (runs the live job).
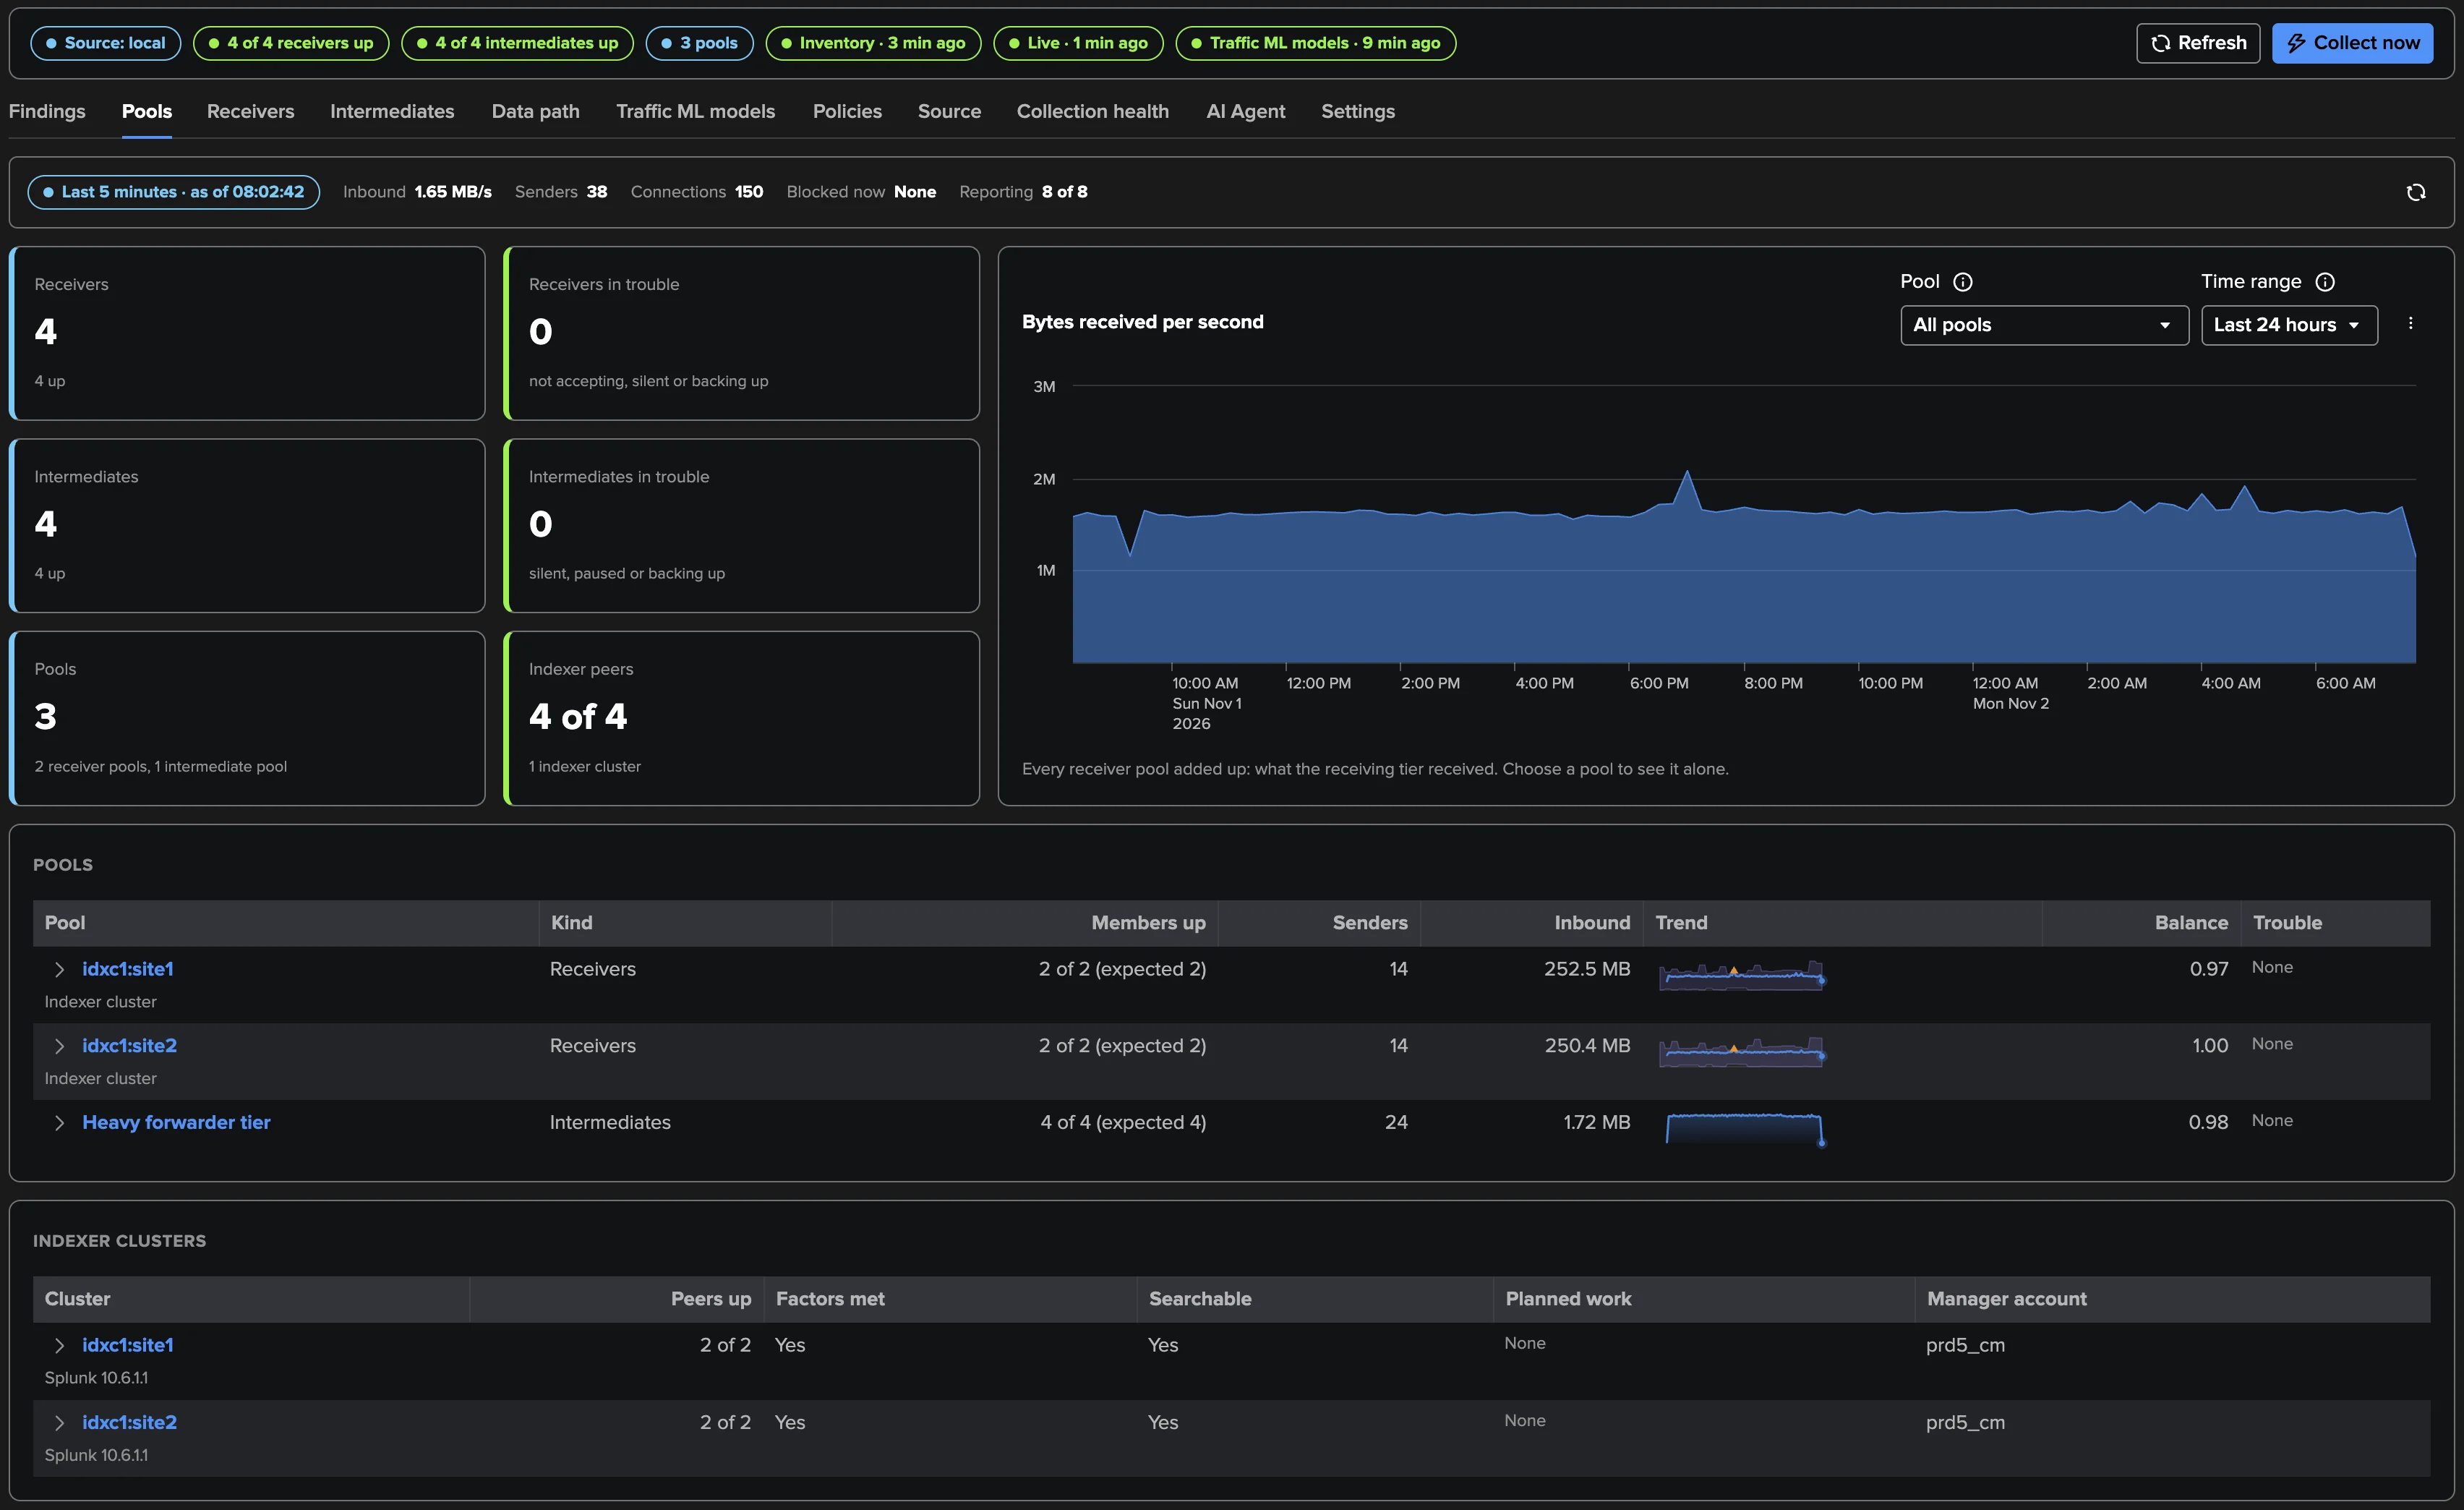
Tab |
What it shows |
|---|---|
Findings |
The findings centre shared by every dedicated tenant (see Findings, Finding groups and findings actions). Families:
Receivers, Intermediate forwarders, Pools, Destinations. The findings of one object (a
host, a pool, a destination) form one Finding group; the pool is the policy scope
( |
Pools |
The Last 5 minutes strip (inbound per second, senders, connections, Blocked now, hosts reporting), host tiles beside Bytes received per second (every receiver pool added up, or one pool alone, over the chosen time range), the pools table (each row expands to its members, an indexer cluster pool to its peers), the indexer clusters, one row per site pool (peers up, factors met, searchable, planned work, manager account), the Splunk versions of the hosts, the intermediate types, and the hosts needing attention. |
Receivers, Intermediates |
Every host, paged on the server, with filters on status, pool and name. Signal pills (back pressure and its bottleneck, destinations paused, origin, red or yellow health, without TLS) open the facts and their evidence. A host opens its modal. |
Data path |
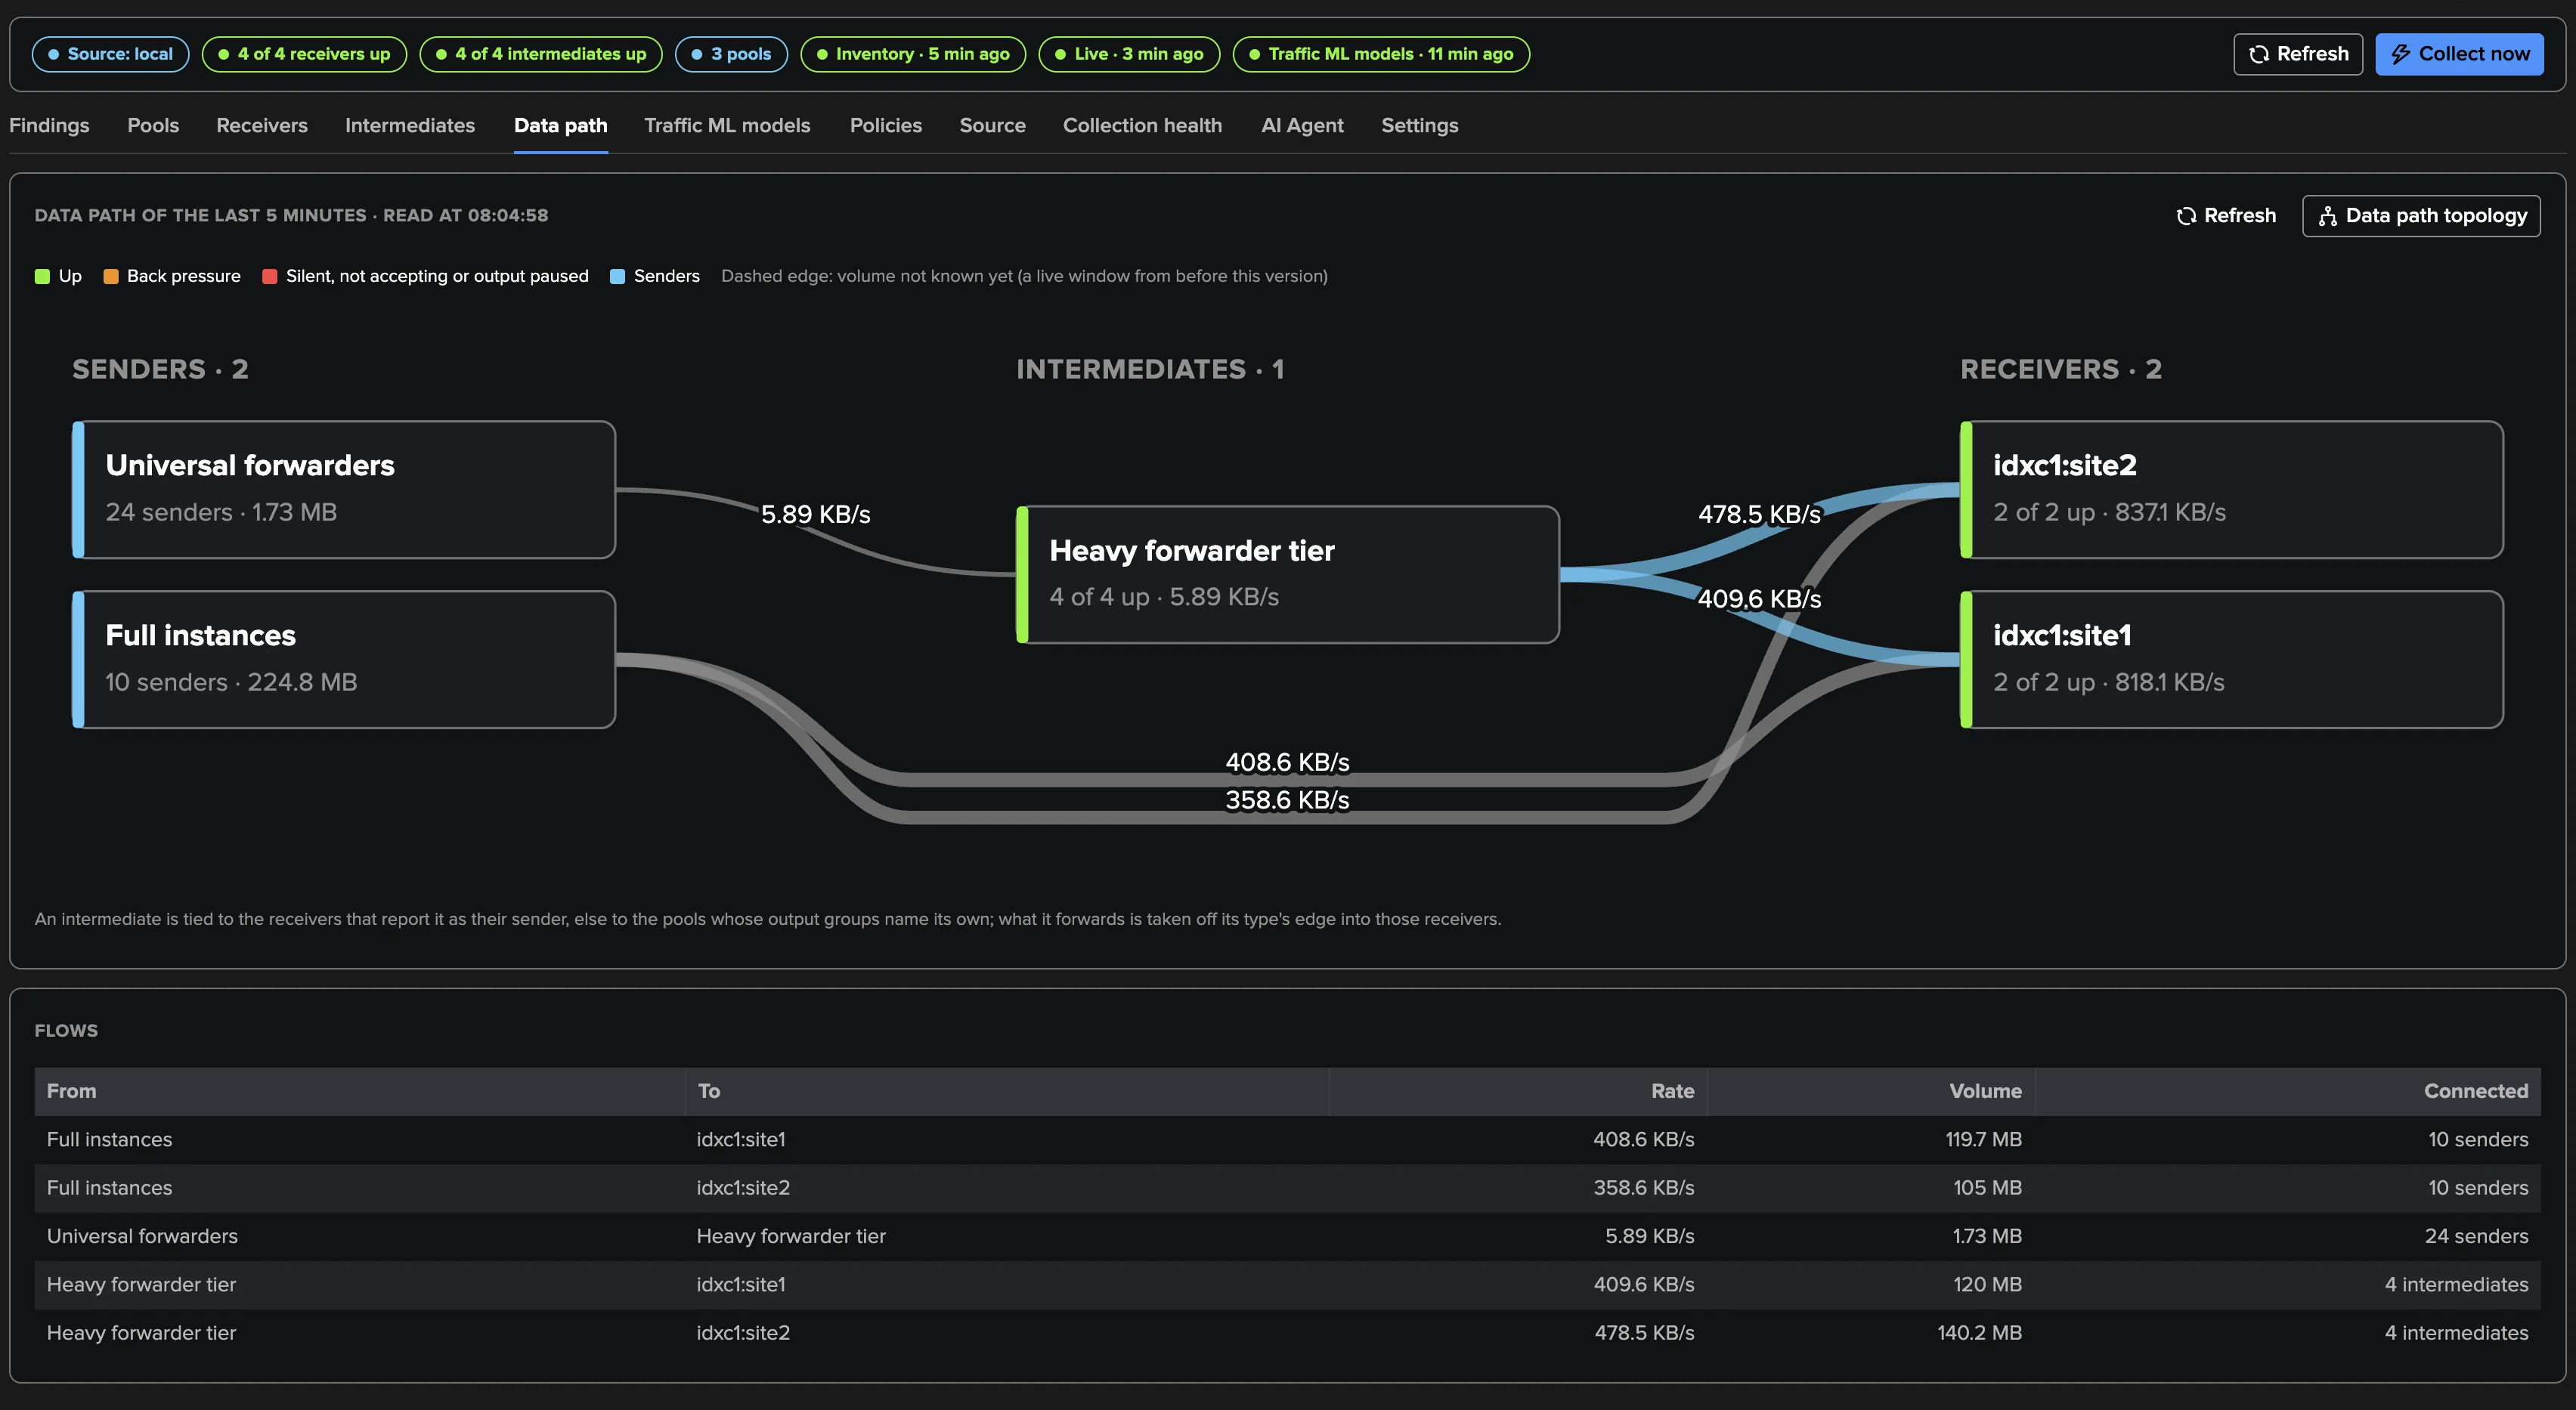
The generated three-column topology: sender types → intermediates → receivers, a pool as one node, edge width by volume, with a Flows table. |
Traffic models |
Every receiver pool’s models, their state, the model view, tuning and relearning. |
Policies |
The policy catalogue, custom policies, and How it is evaluated for every policy. |
Source |
The search tier, the qualification, the telemetry form, and the collection runs with their outcome and receipt. |
Collection health, AI Agent, Settings |
See below. |
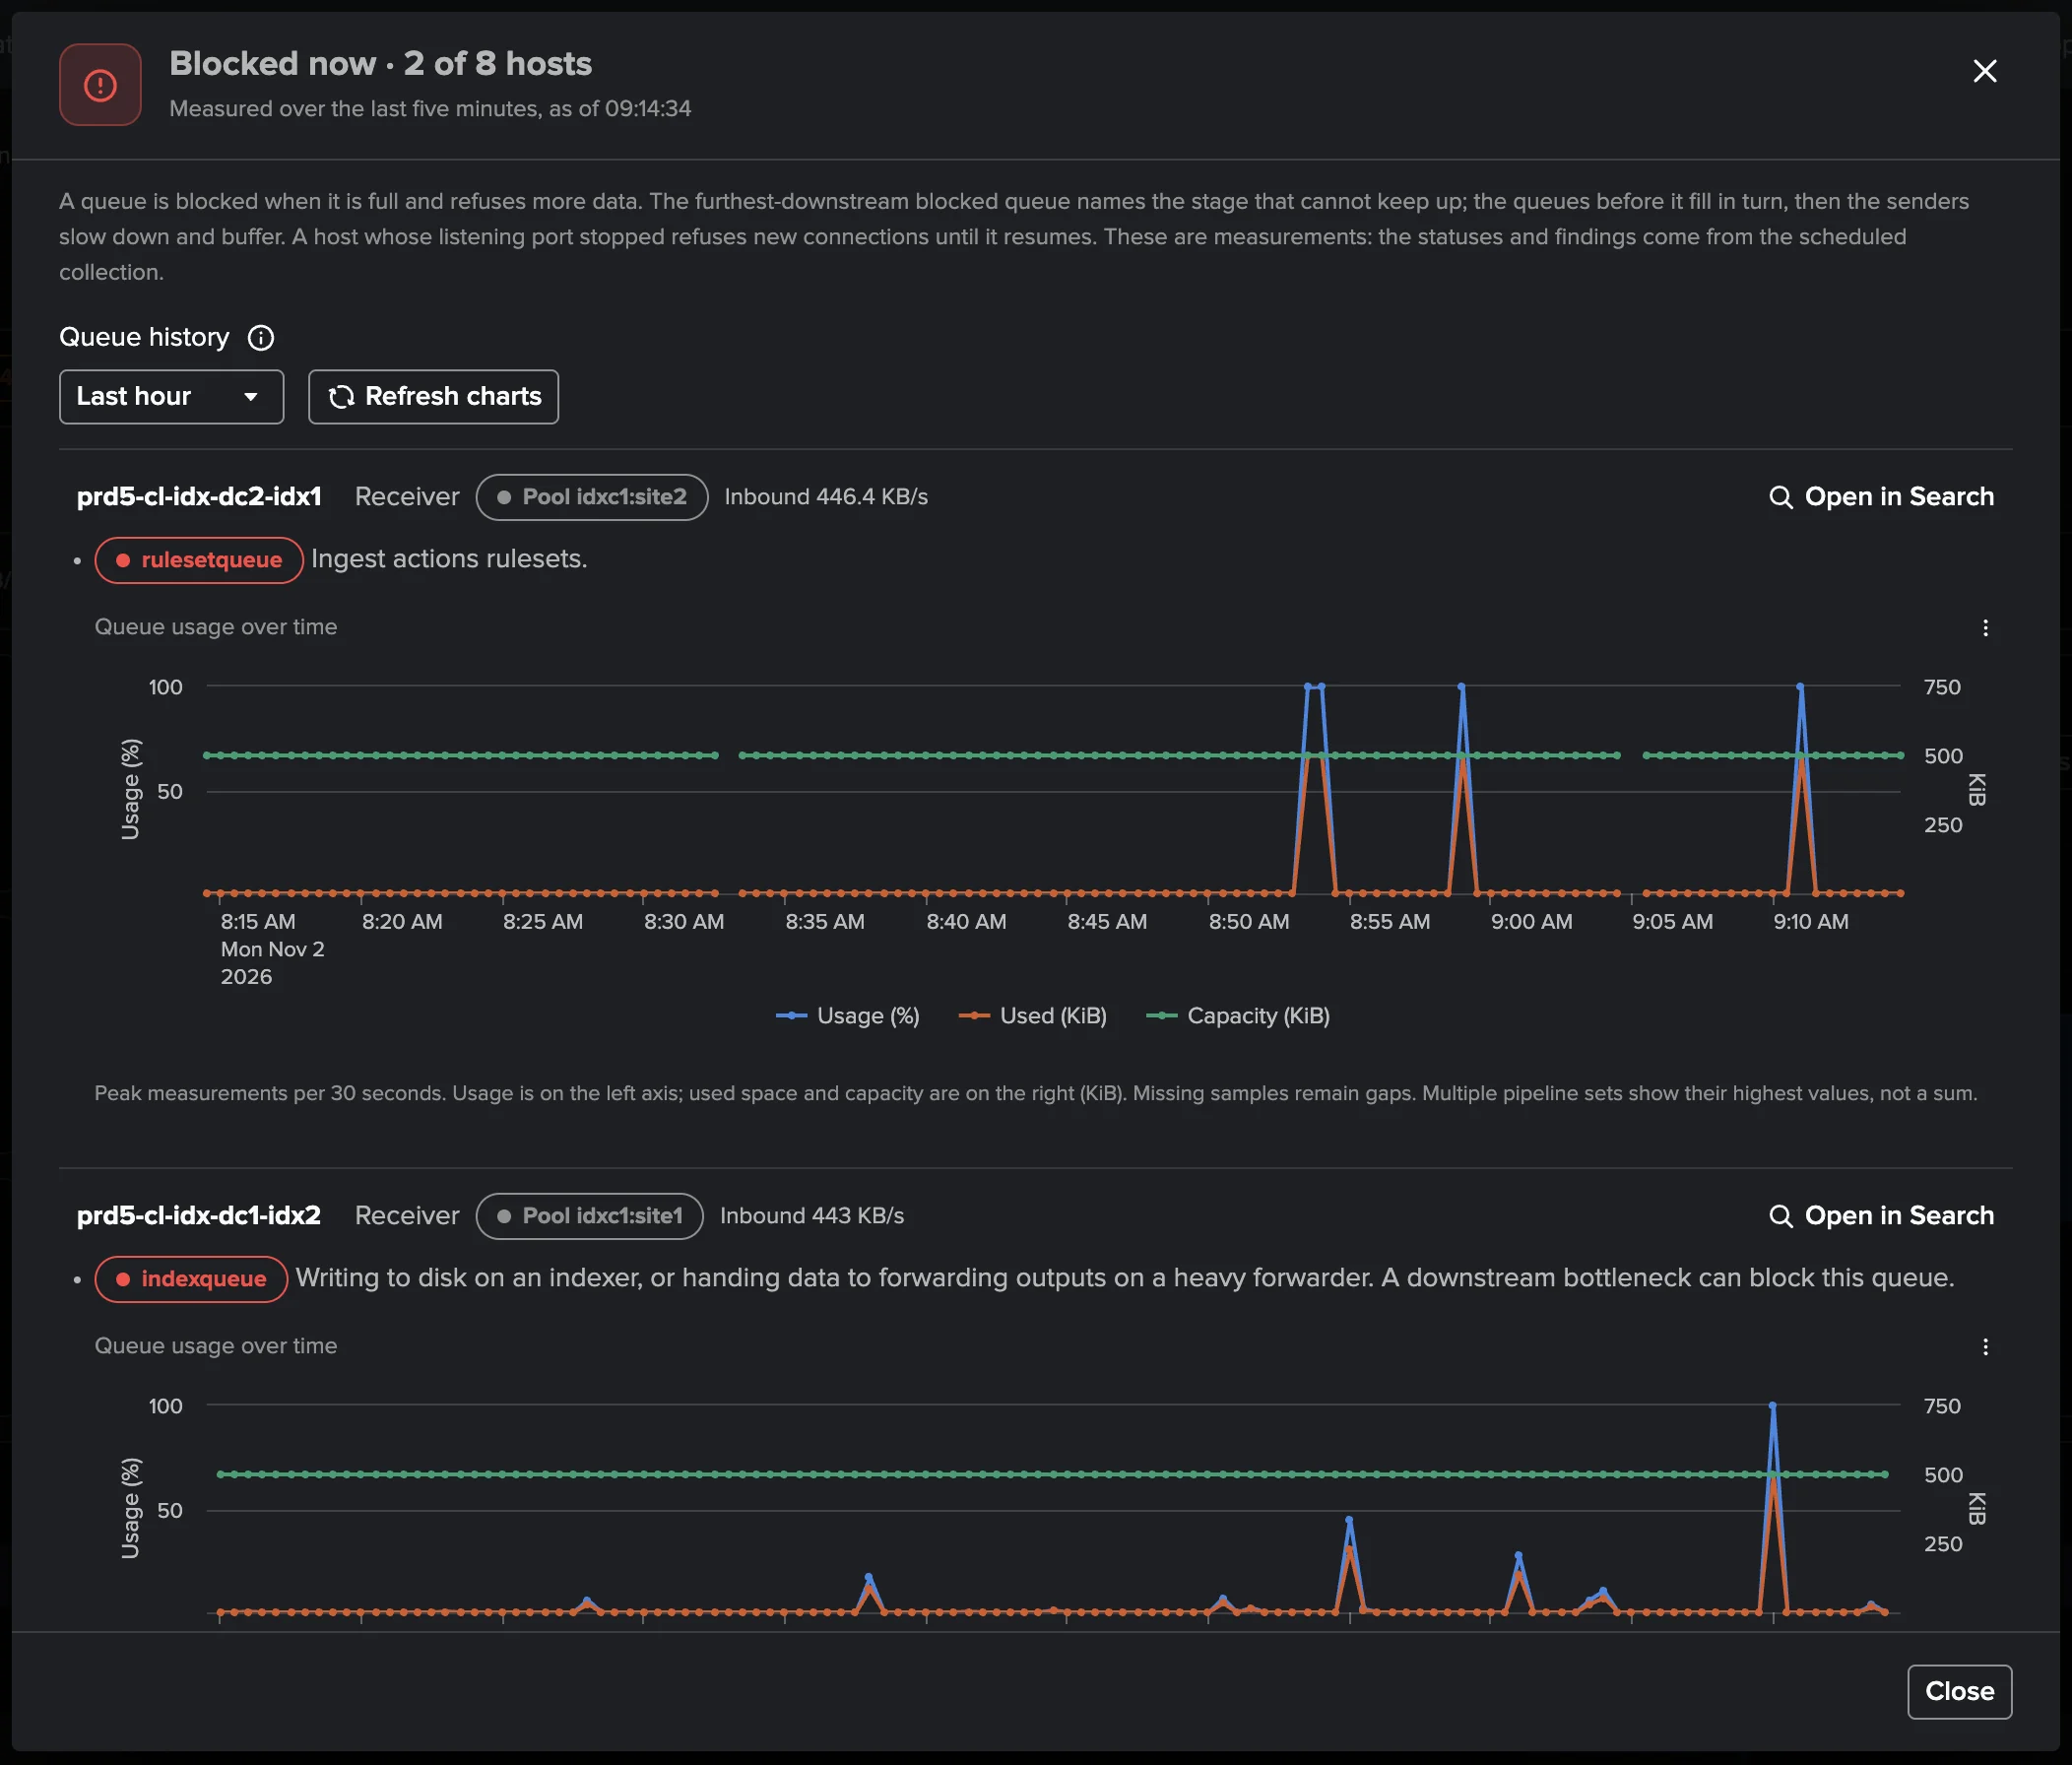
Blocked now. When a host of the last five minutes has a blocked queue, the strip’s Blocked now · N of M hosts opens what is blocked: each host with its role, its pool and its inbound, every blocked queue with what that stage of the pipeline does, a stopped listening port, Open in Search on the host’s queues, and the queue history of each blocked queue (usage, used and capacity, last 15 minutes to 24 hours, two hosts per page). These are measurements: the host statuses and the findings come from the scheduled collection, so a queue blocked for a few samples shows here without any finding opening.
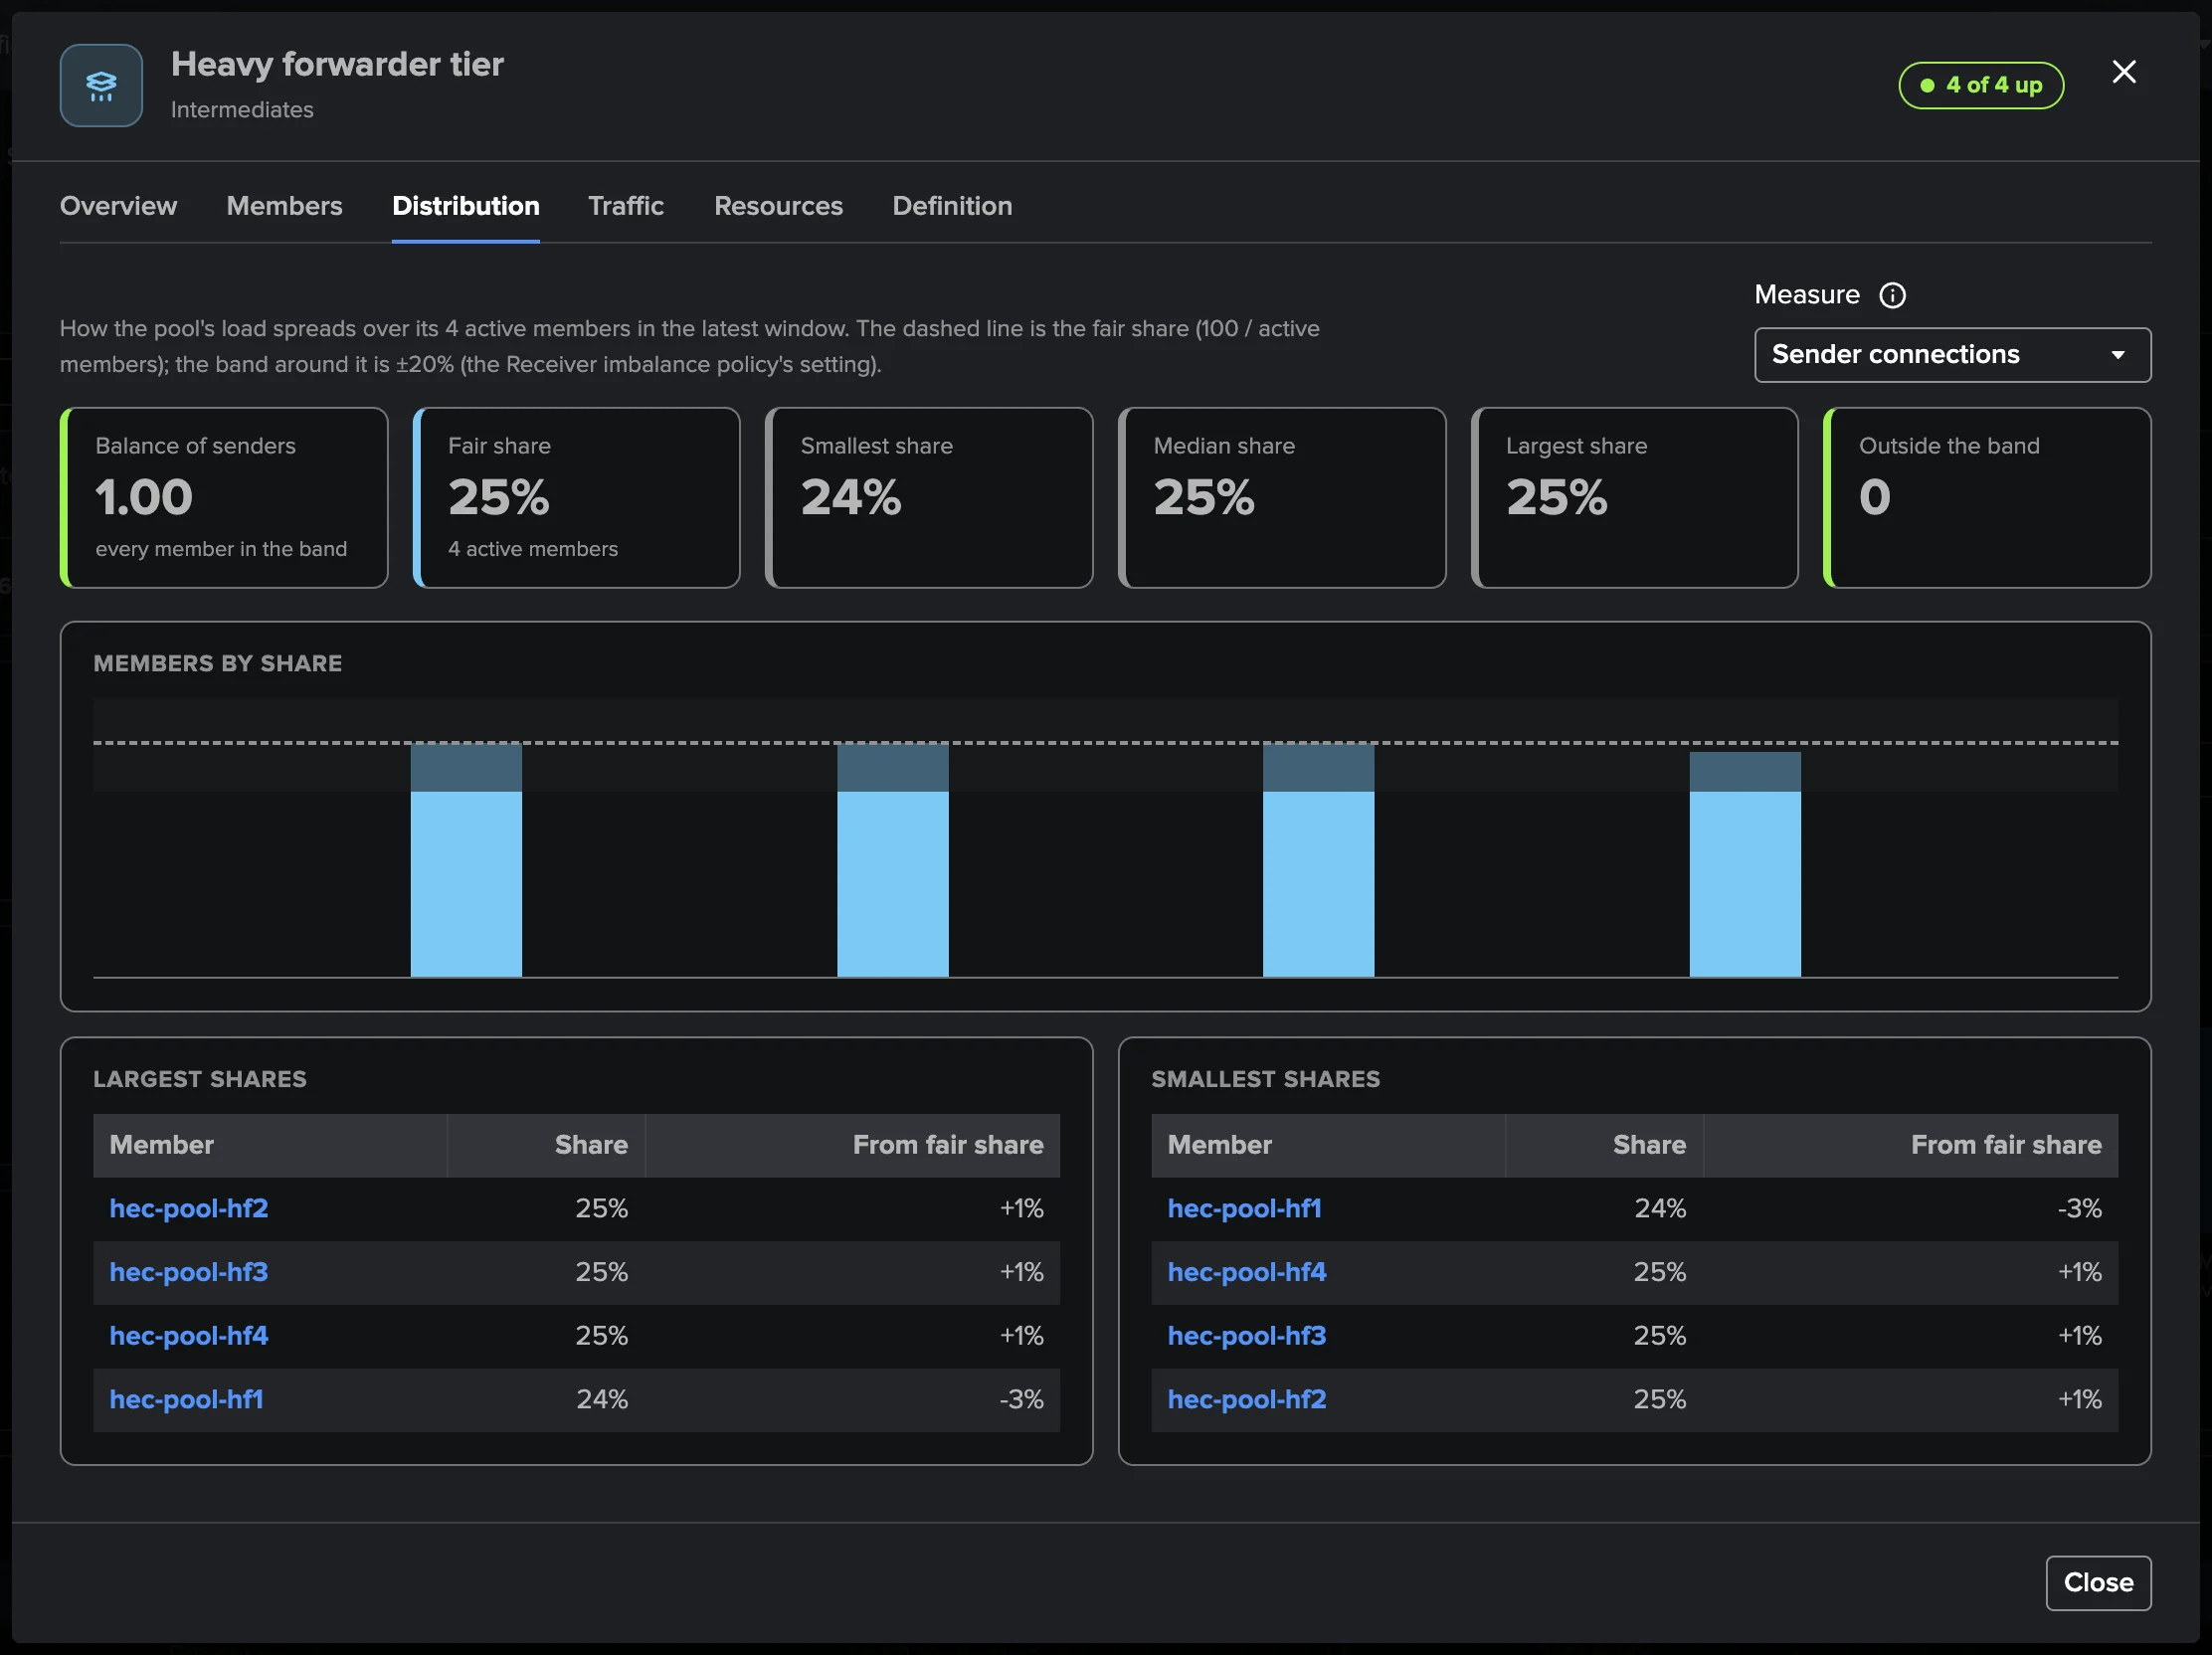
The pool modal has tabs Overview, Members, Distribution (one bar per active member’s share of the pool, the fair-share line and the imbalance band of the Receiver imbalance setting; switch between sender connections and volume; Jain’s fairness index), Traffic (with the traffic model’s band on a receiver pool), Cluster (an indexer cluster pool), Resources (the members’ CPU and memory) and Definition.
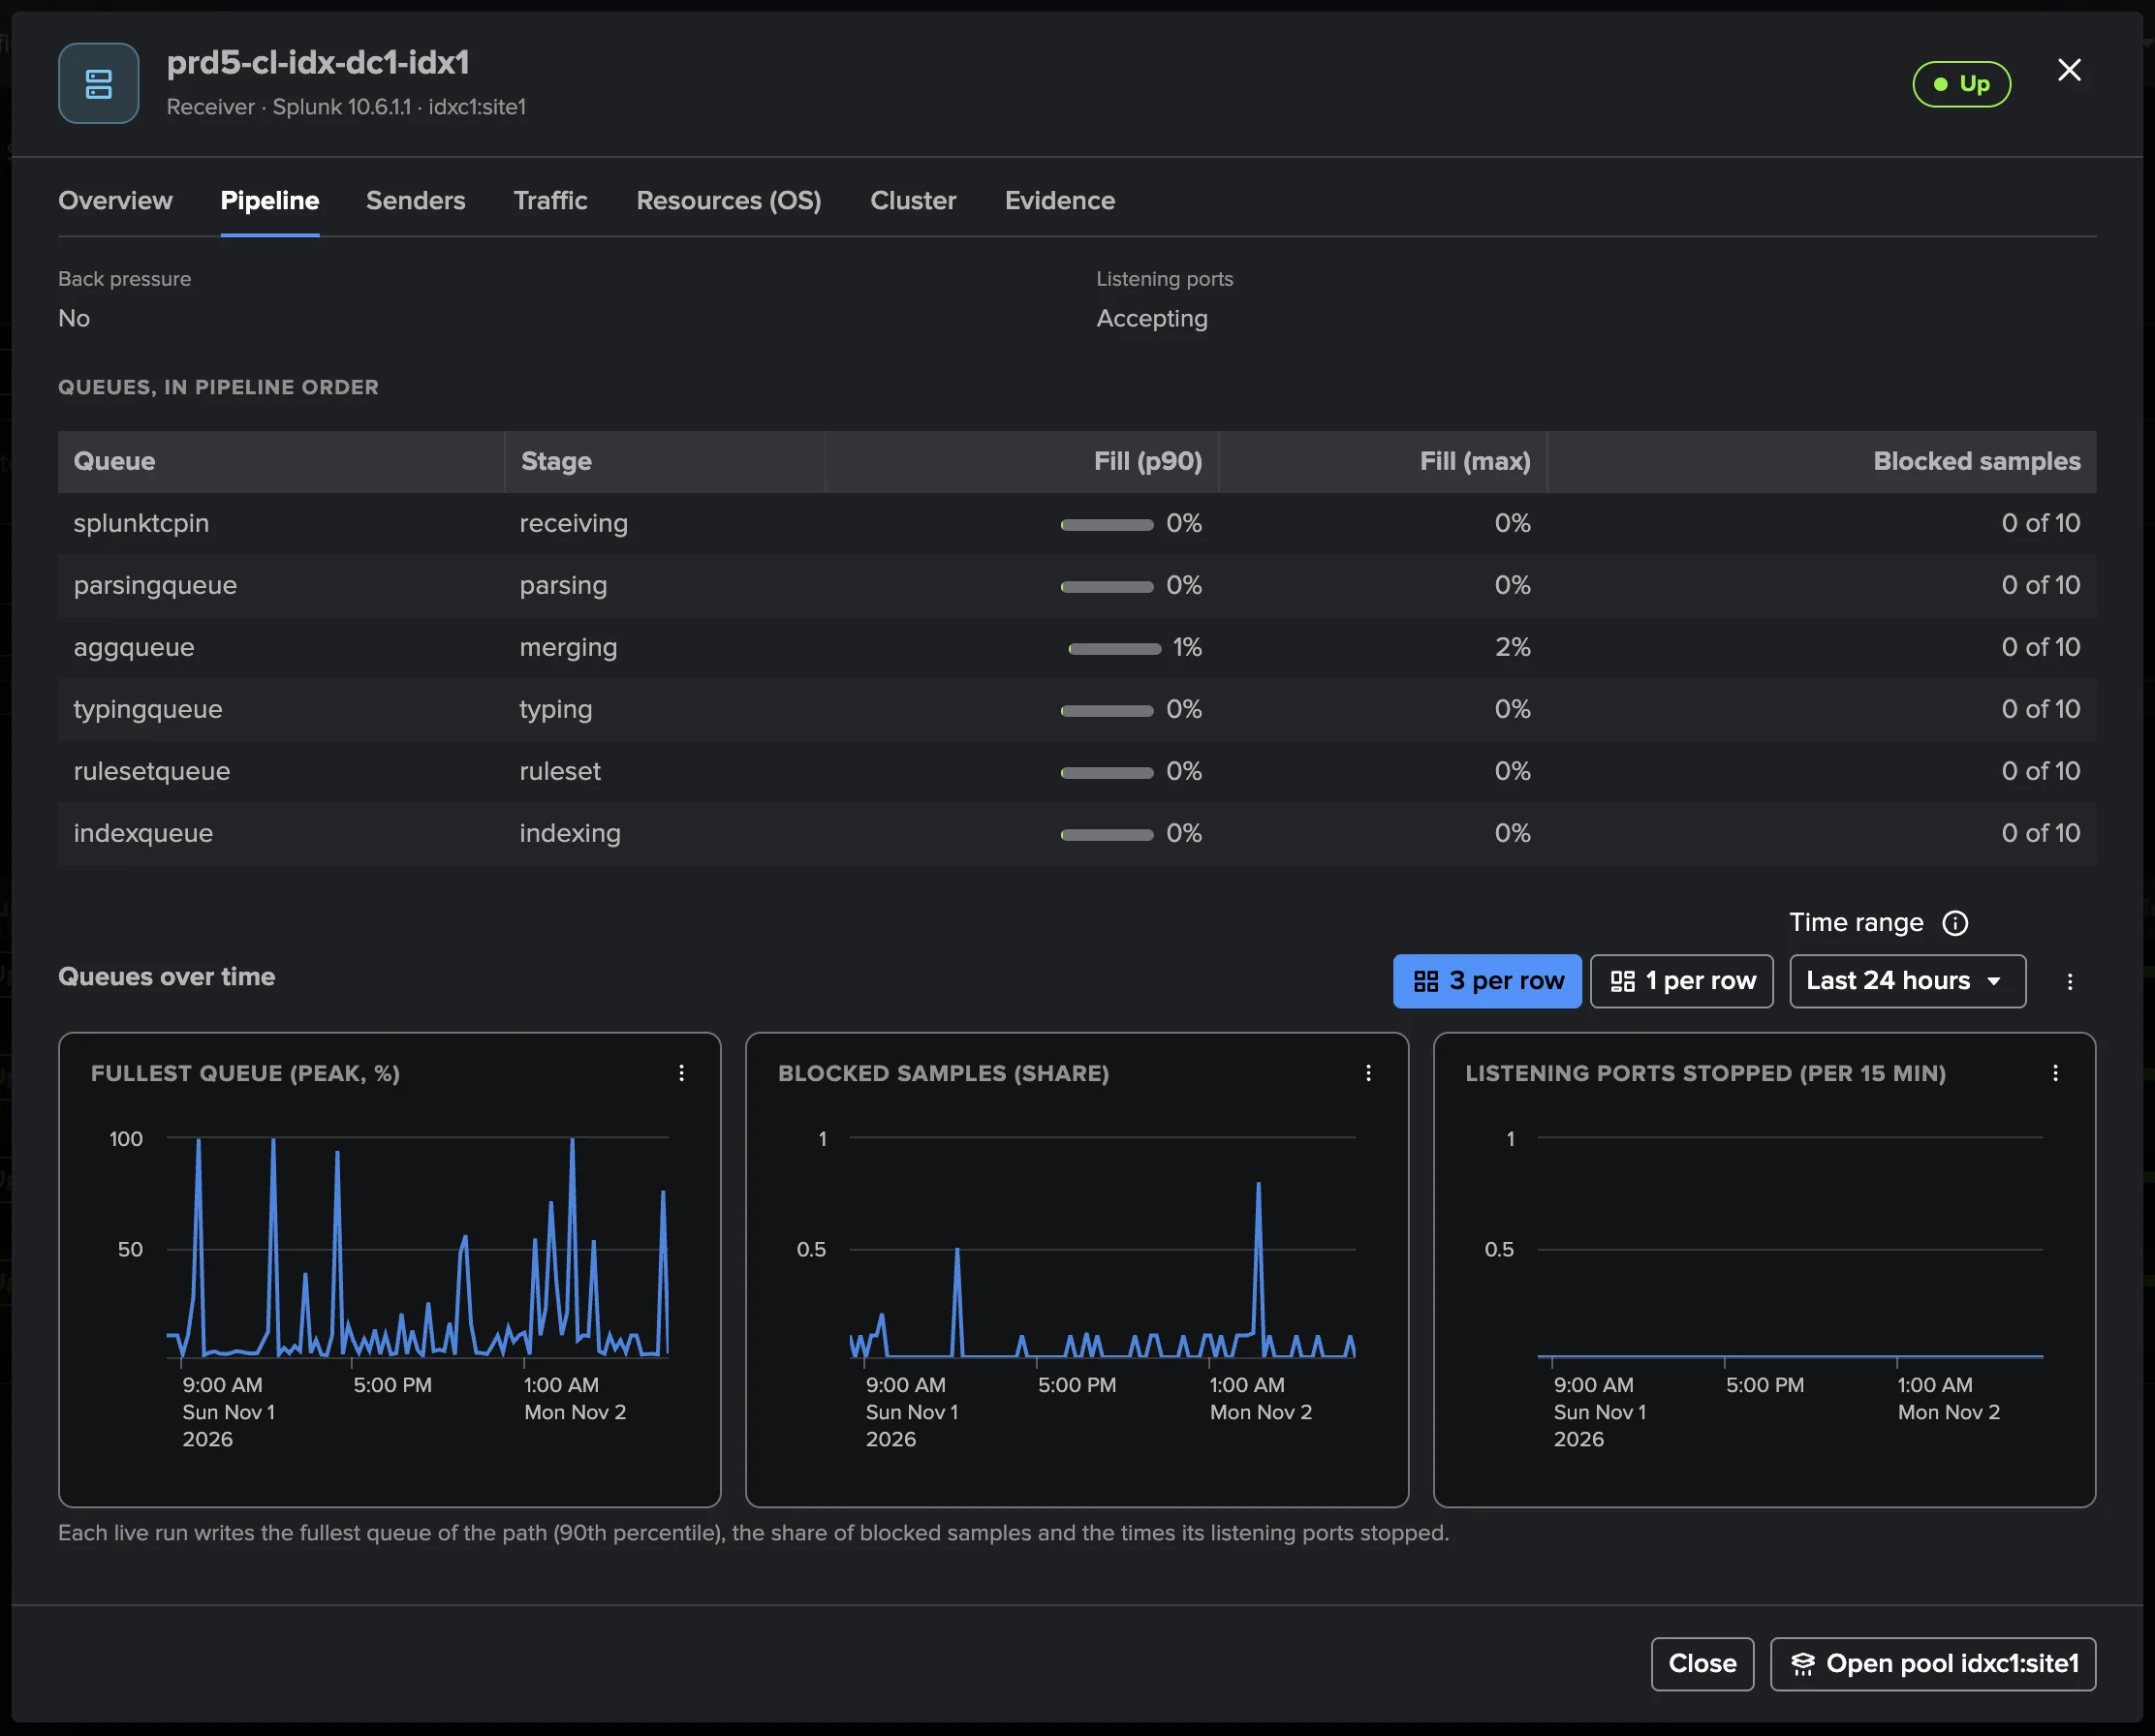
The host modal has tabs Overview (status, senders, inbound, worst queue, the last 5 minutes, and what needs attention with its open findings), Pipeline (the queues in pipeline order with fill bars and over time, the listening ports, an intermediate’s output groups and destinations), Senders (posture tiles, senders by version, the senders table), Traffic, Resources, Cluster (an indexer peer) and Evidence.
The Data path tab draws the forwarding path of the last five minutes from what the receivers report: the sender types, the intermediates and the receivers, edges sized by volume, and a Flows table that states every edge in words. An intermediate is tied to its receivers by its output group, never by guessing from a destination address; Data path topology saves it to Topology Studio.
What the figures mean
Figure |
Meaning |
|---|---|
Inbound |
The KB of the host’s (or pool members’) connection lines in the live window, by index time. |
Senders |
Distinct sender GUIDs, exact: a sender load balancing over N members counts once for the pool, never as a sum of per-member counts. |
Connections |
Sender connections: a sender connected to N receivers counts N times. |
Worst queue |
The highest 90th-percentile fill of the host’s path queues (the output queue excluded). |
Back pressure |
A queue saturated: 90th-percentile fill of 80 % or more, or blocked in 30 % or more of its samples. |
Balance |
Jain’s fairness index of the volume of every member up (1 is an even split). |
Expected size |
A cluster’s registered peers (a site pool: the peers of its site), else the configured size, else the second-highest daily peak of members up over 7 days. |
Traffic ML models
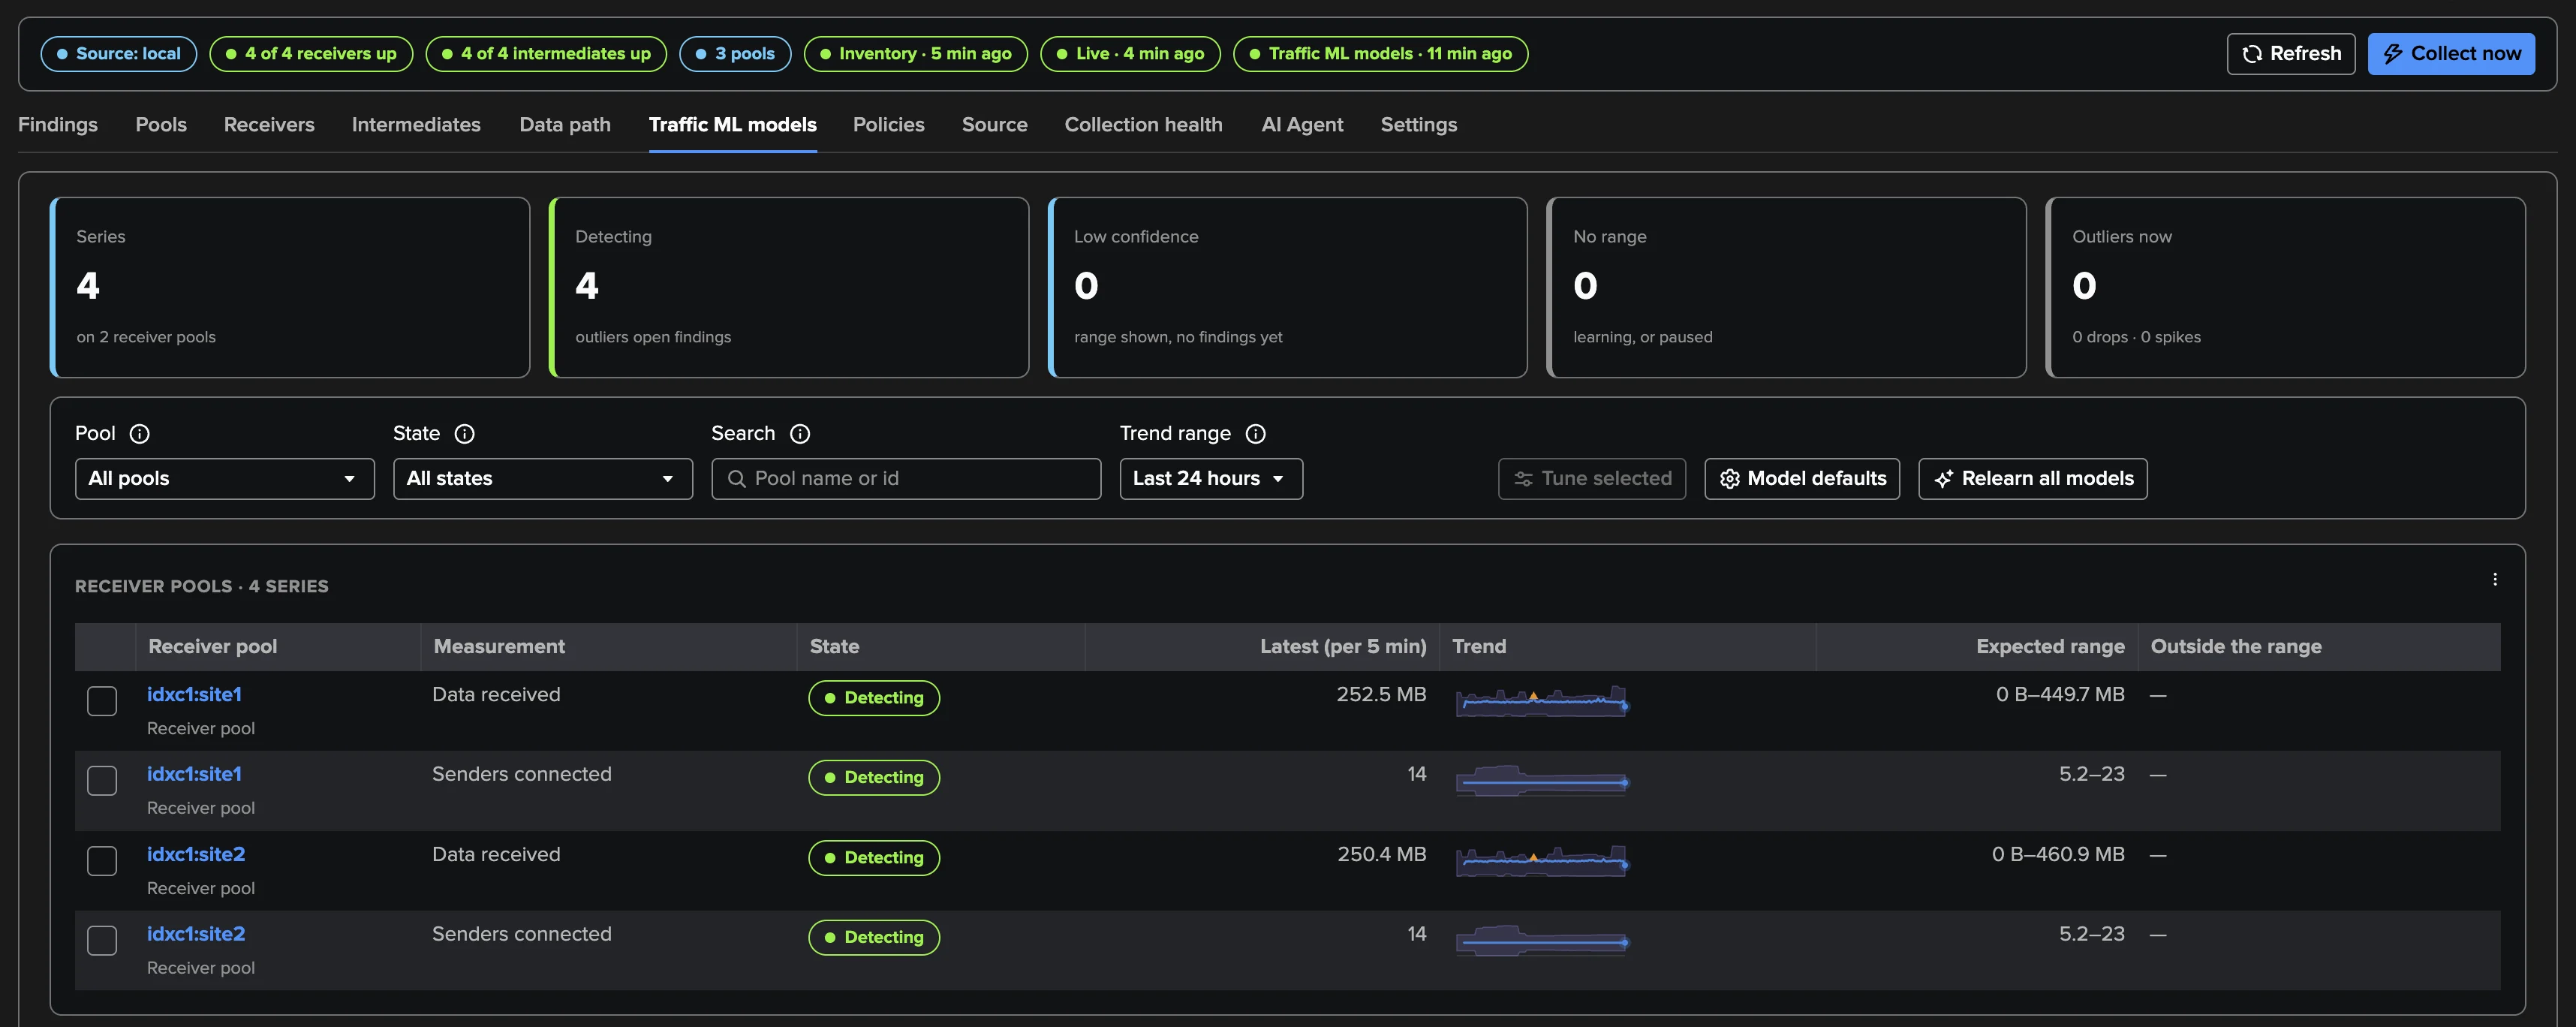
Every receiver pool (each site pool of a multisite cluster) has two traffic models: KB received (per five minutes) and connected senders (the distinct senders of each member, summed over the members). They are learned per weekday and hour from the members’ connection lines over the tenant’s model learning history (14 days by default; 0, 7, 14, 30, 60 or 90 days), refreshed every half hour. A five-minute bucket in which a member reported and the pool received nothing counts as zero.
The Traffic models tab lists every model with its state, opens the model view (the expected range against the observed traffic), Tune model with a simulation of past windows, Not an anomaly on a finding, and, for TrackMe administrators, Model defaults and Relearn all models. These are the traffic model features of the Splunk HEC and Cribl Stream tenants: see Traffic ML models and Expected traffic. The Pool traffic outlier policy uses them; Pool traffic drop is a plain statistic (the same hour’s median over 7 days) and needs no model. Intermediate pools, discovered hosts and empty pools are not modelled. Bank holidays are not learned.
Policies
Twenty-two built-in policies cover the receivers, the intermediate forwarders, the pools and the destinations; every policy is evaluated. Each policy has its severity, the runs it needs to open and to recover, a scope (Pools: empty means every pool and the hosts no pool claims), a bank holiday hold, and a How it is evaluated tab that shows the rule as configured, the data it reads with ready-to-run searches on the tenant’s own source, and how to investigate and resolve.
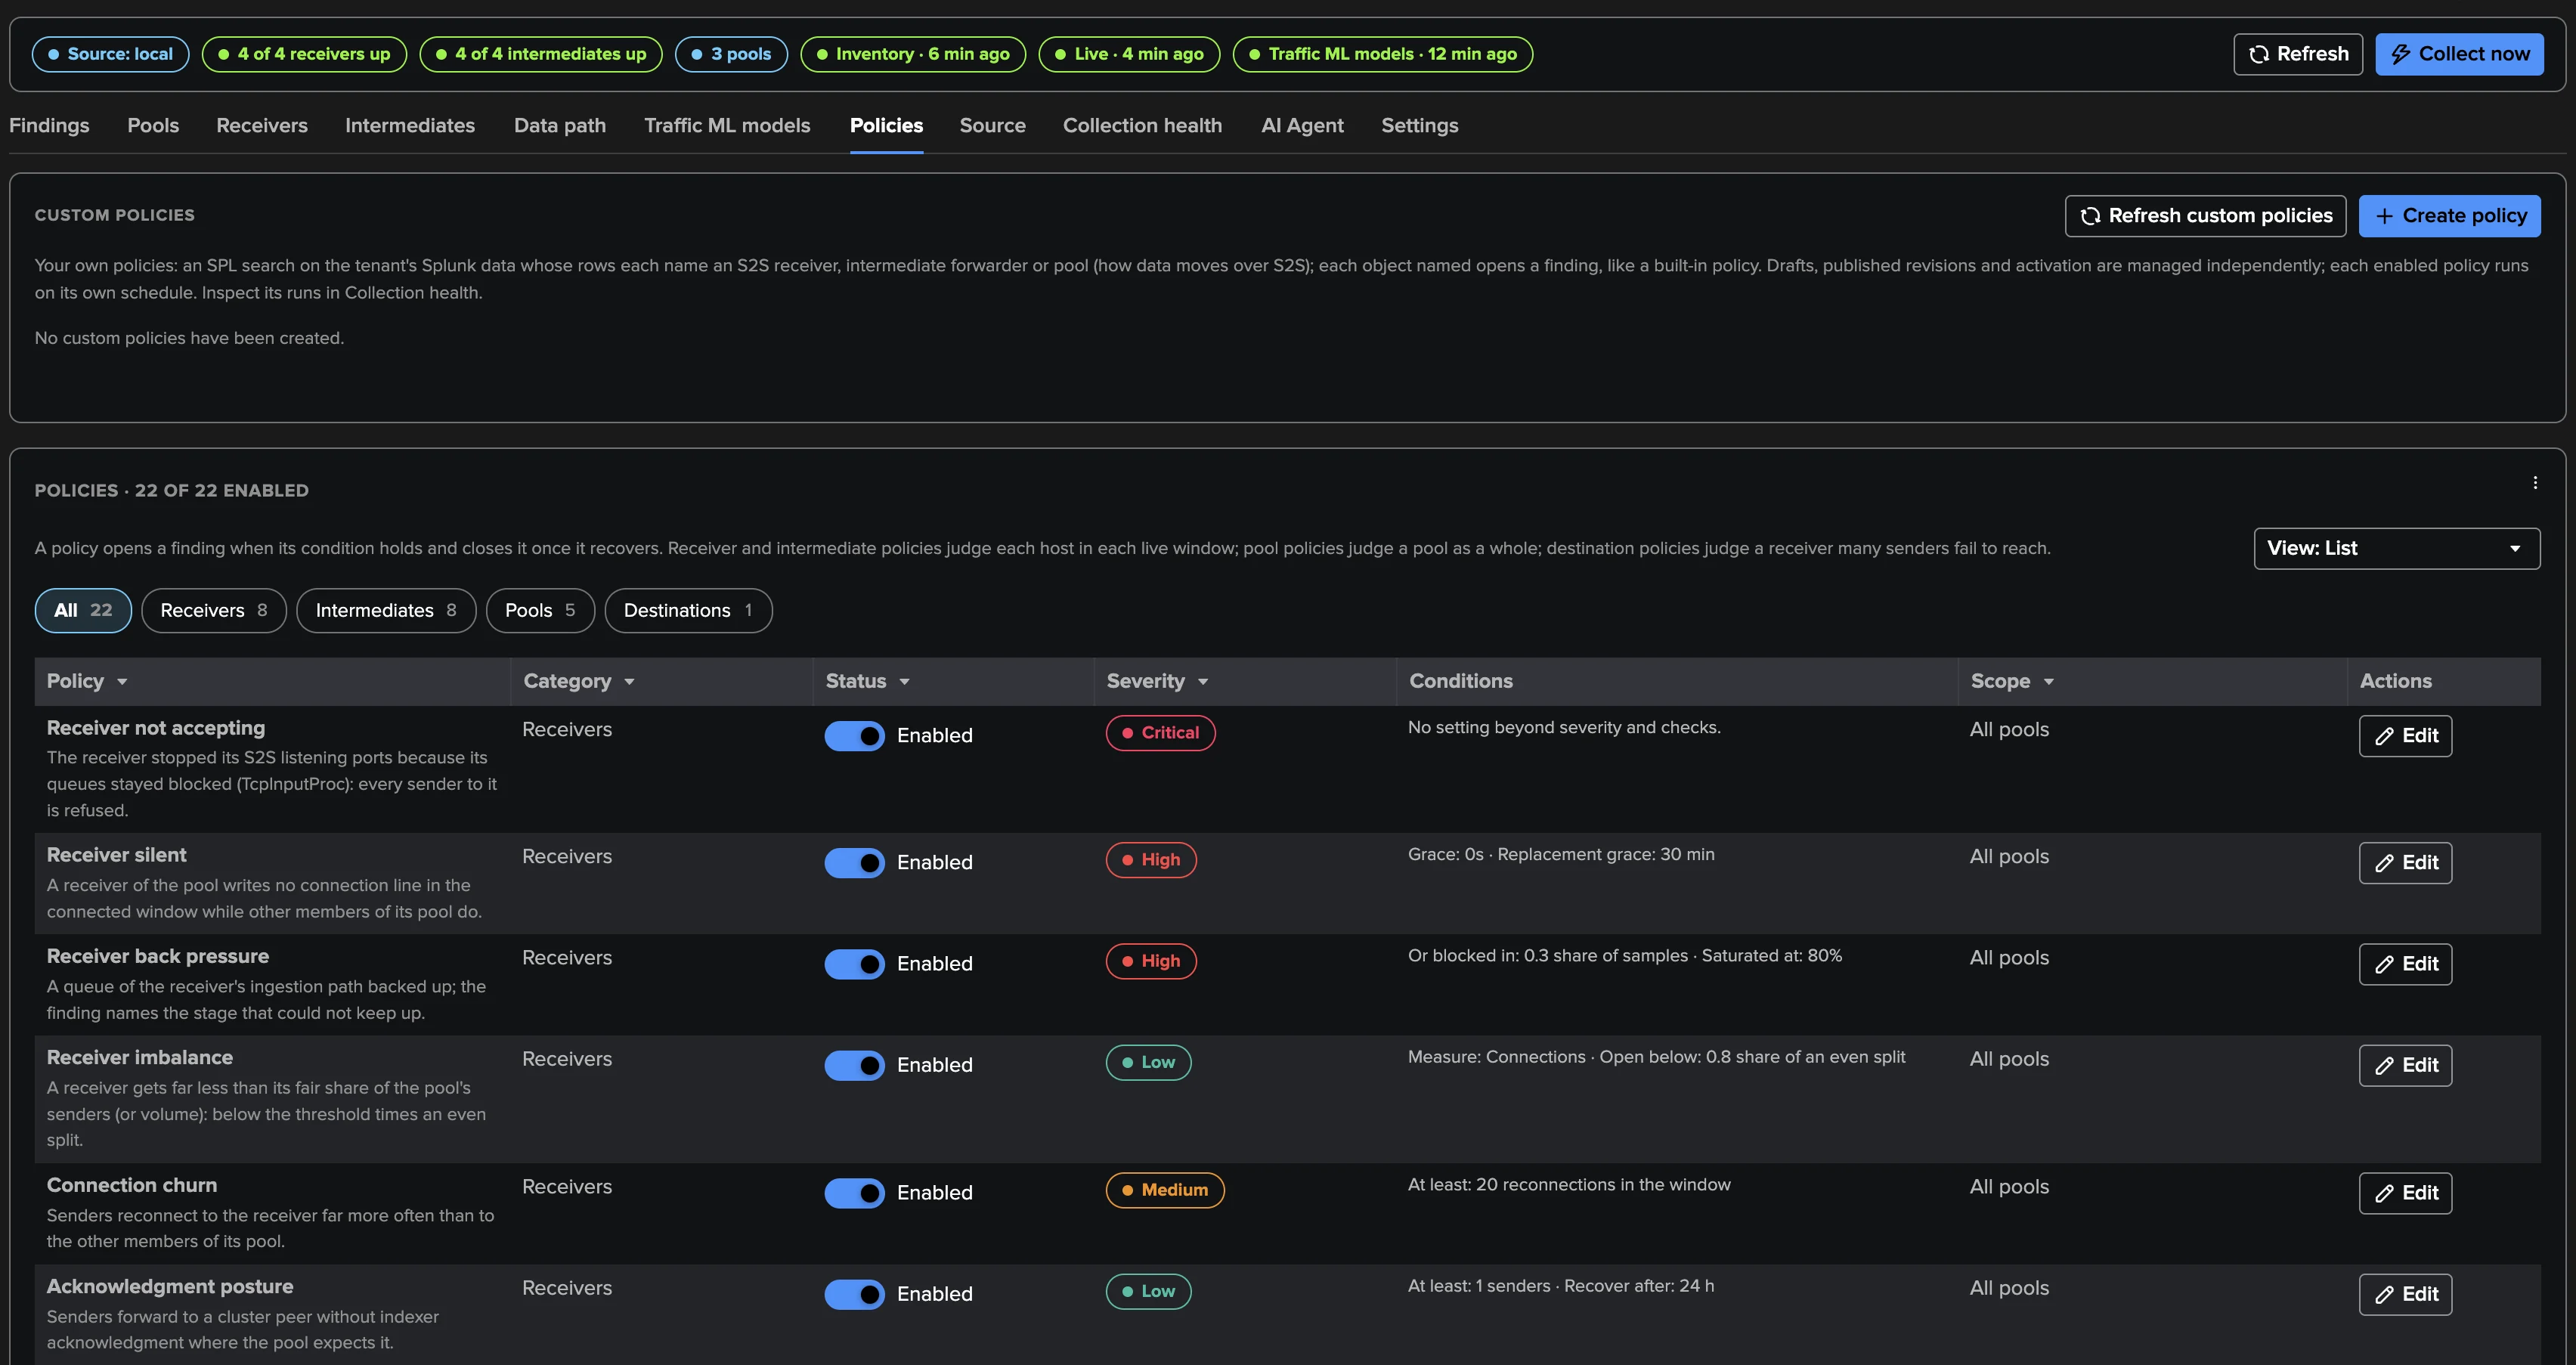
The most useful policies to know first:
Receiver not accepting (critical) — the receiver stopped its listening ports because its queues stayed blocked: every sender to it is refused.
Intermediate output blocked (critical) — an intermediate paused its output: every sender behind it is held back. The finding counts the senders held and names the destinations.
Back pressure cascade (critical) — in one window, a receiver pool backs up while intermediates are paused towards it: one finding names the origin and the intermediates held.
Pool capacity (high, critical when no member is up) — fewer members up than expected.
Receiver back pressure and Intermediate back pressure (high) — a queue of the path is saturated; the finding names the bottleneck, and on an intermediate whether the cause is downstream, local or an upstream surge.
Destination unreachable (high) — many senders fail to reach one receiver for 15 minutes: one finding on the receiver, the senders listed in its evidence.
Every policy, its defaults and its settings are in Built-in policies.
Planned work is not an incident. With Hold during planned work on (the default), Receiver silent, Pool capacity, Pool not receiving, Pool traffic drop, Receiver imbalance, Connection churn and Pool traffic outlier hold on a cluster pool in maintenance mode or a rolling restart: an open finding stays open, a new one waits until the planned work ends.
Custom policies. Above the catalogue, TrackMe administrators of the tenant write their own SPL:
each result row names a receiver (receiver), an intermediate forwarder (intermediate) or a
pool (pool), and opens a finding like a built-in policy. See Custom policies.
Findings in practice
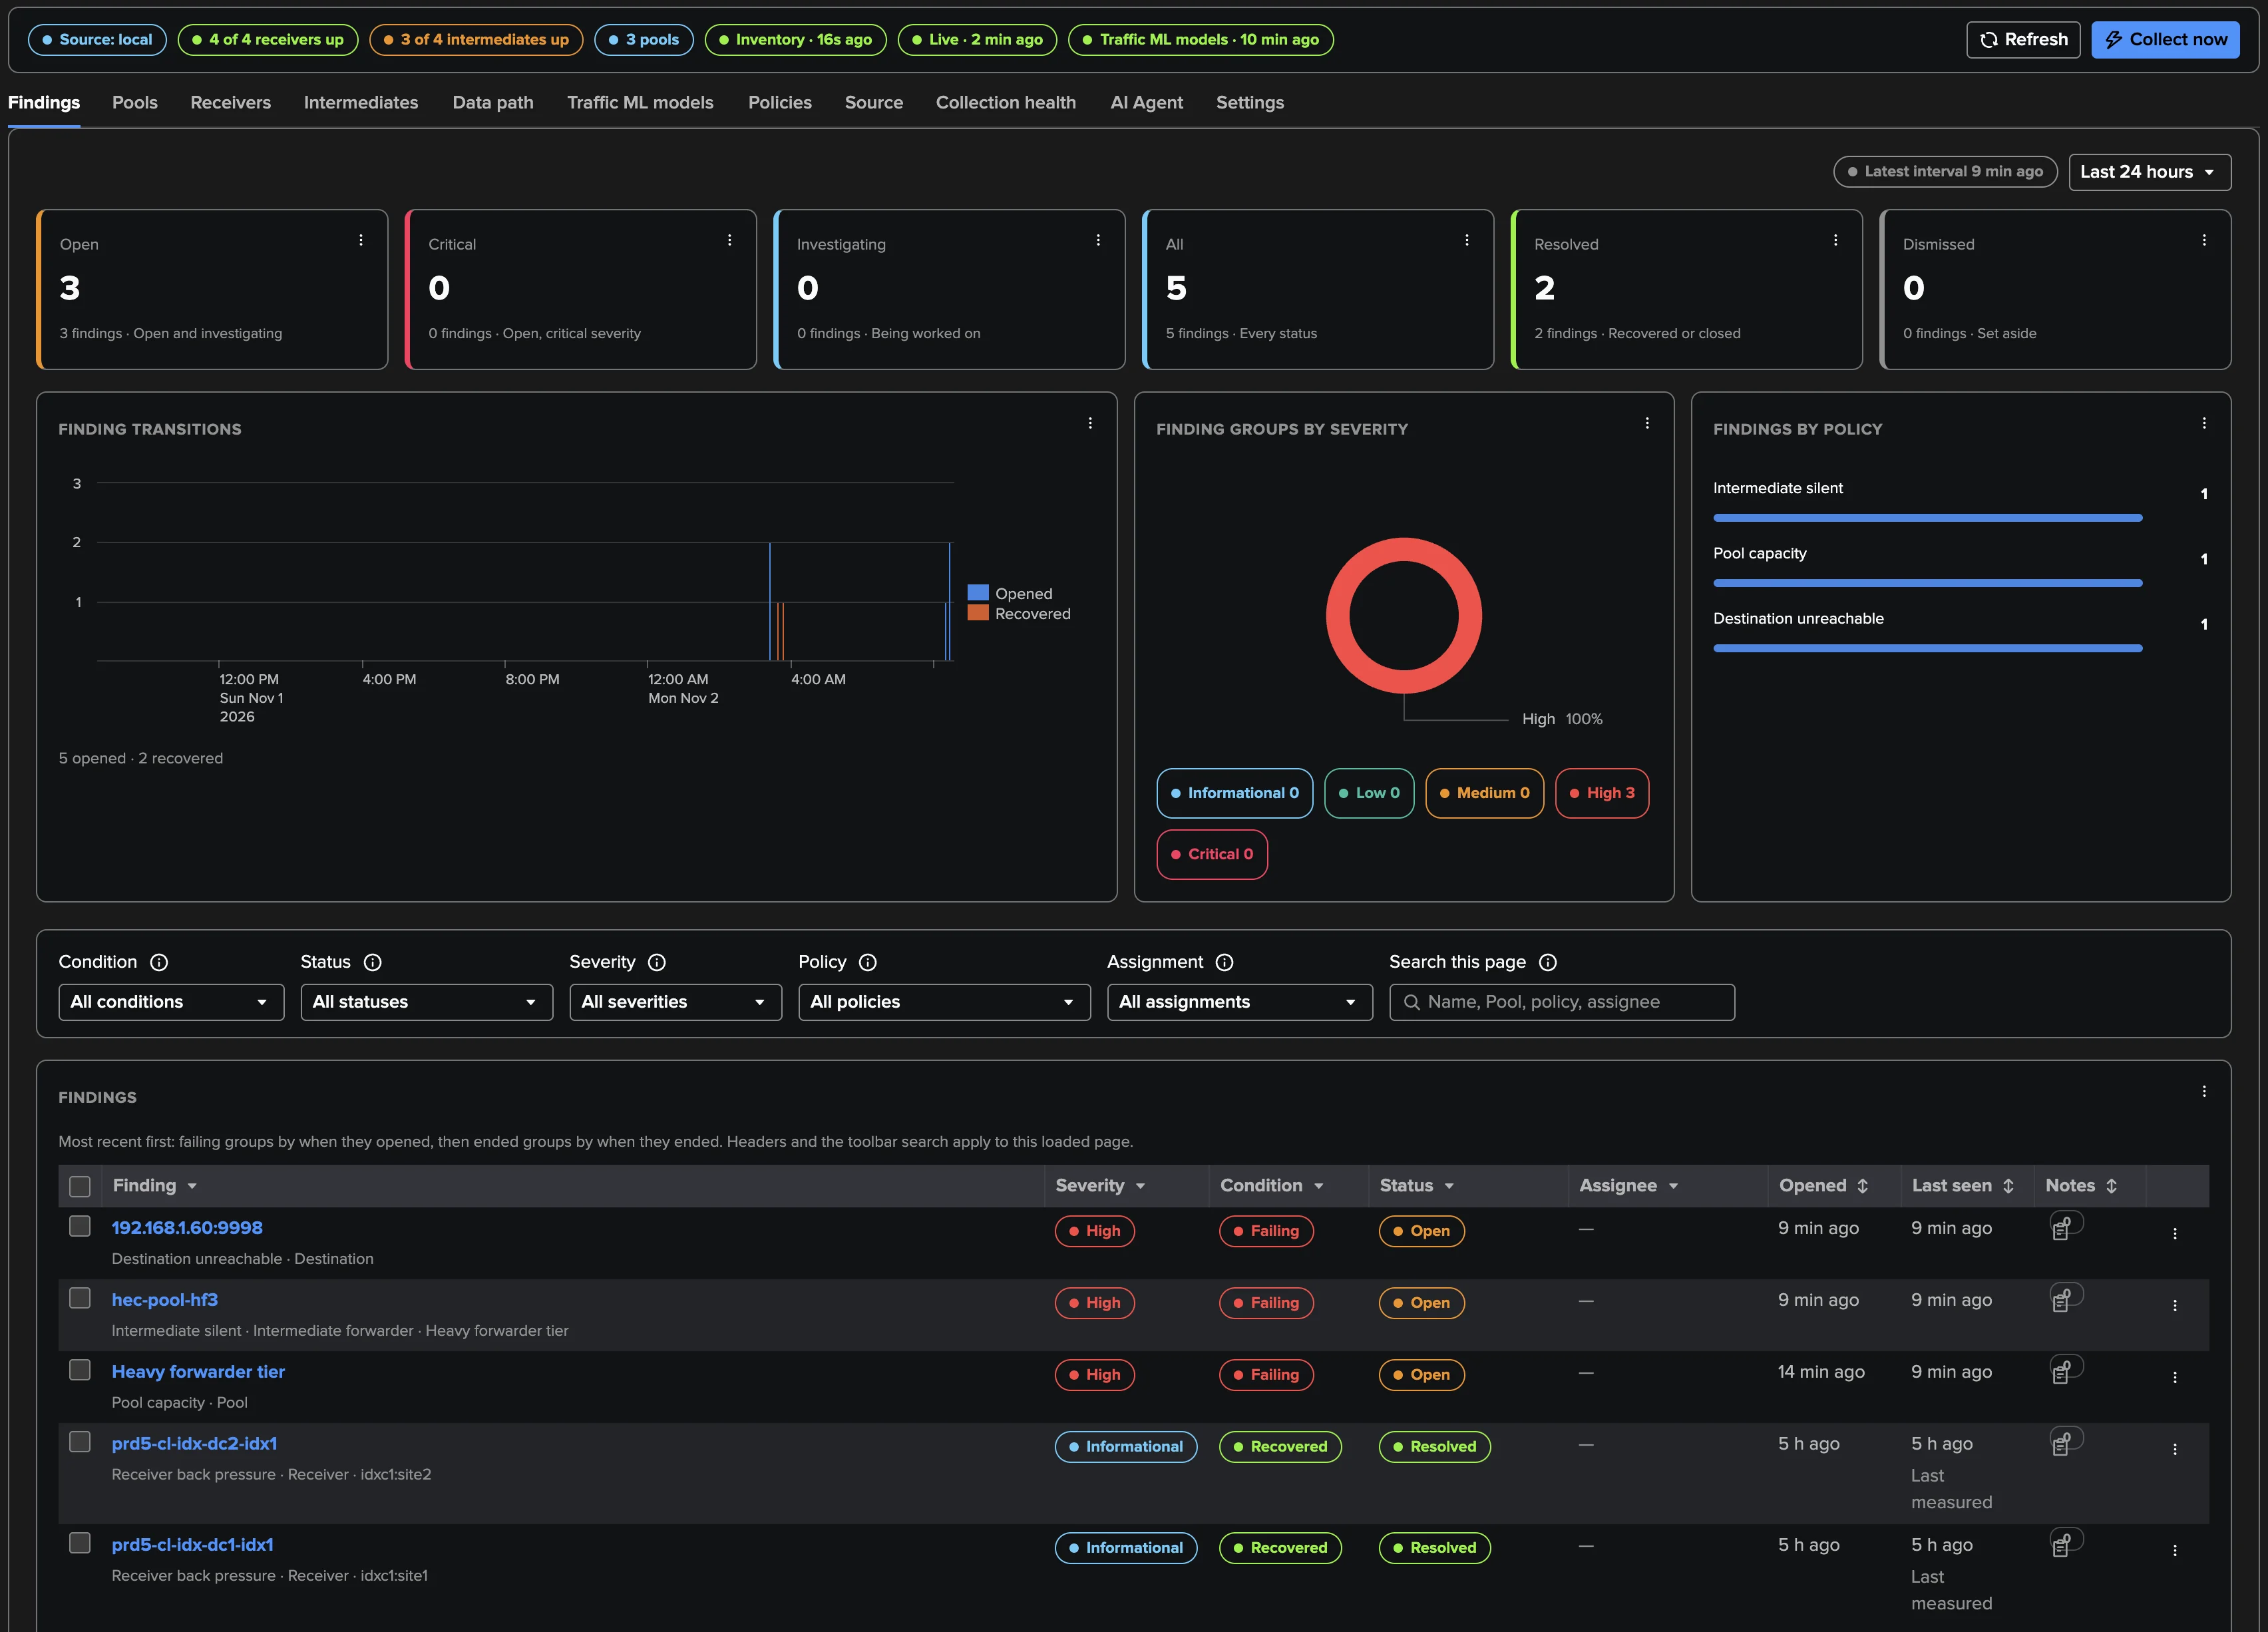
A finding of a Splunk S2S tenant reads like every finding of a dedicated tenant (see Findings, Finding groups and findings actions): one row per Finding group, the decision history, the measurements of the policy, triage (investigate, snooze, dismiss, resolve), assignment, notes, findings actions and Ask the AI Agent. Open resource opens the host or the pool modal in place. The findings of one object form one Finding group: a stopped heavy forwarder’s own findings read together, the pool’s capacity finding on the pool, and the senders that cannot reach it on the destination. Merge them by hand into one group when one incident is worked as one.
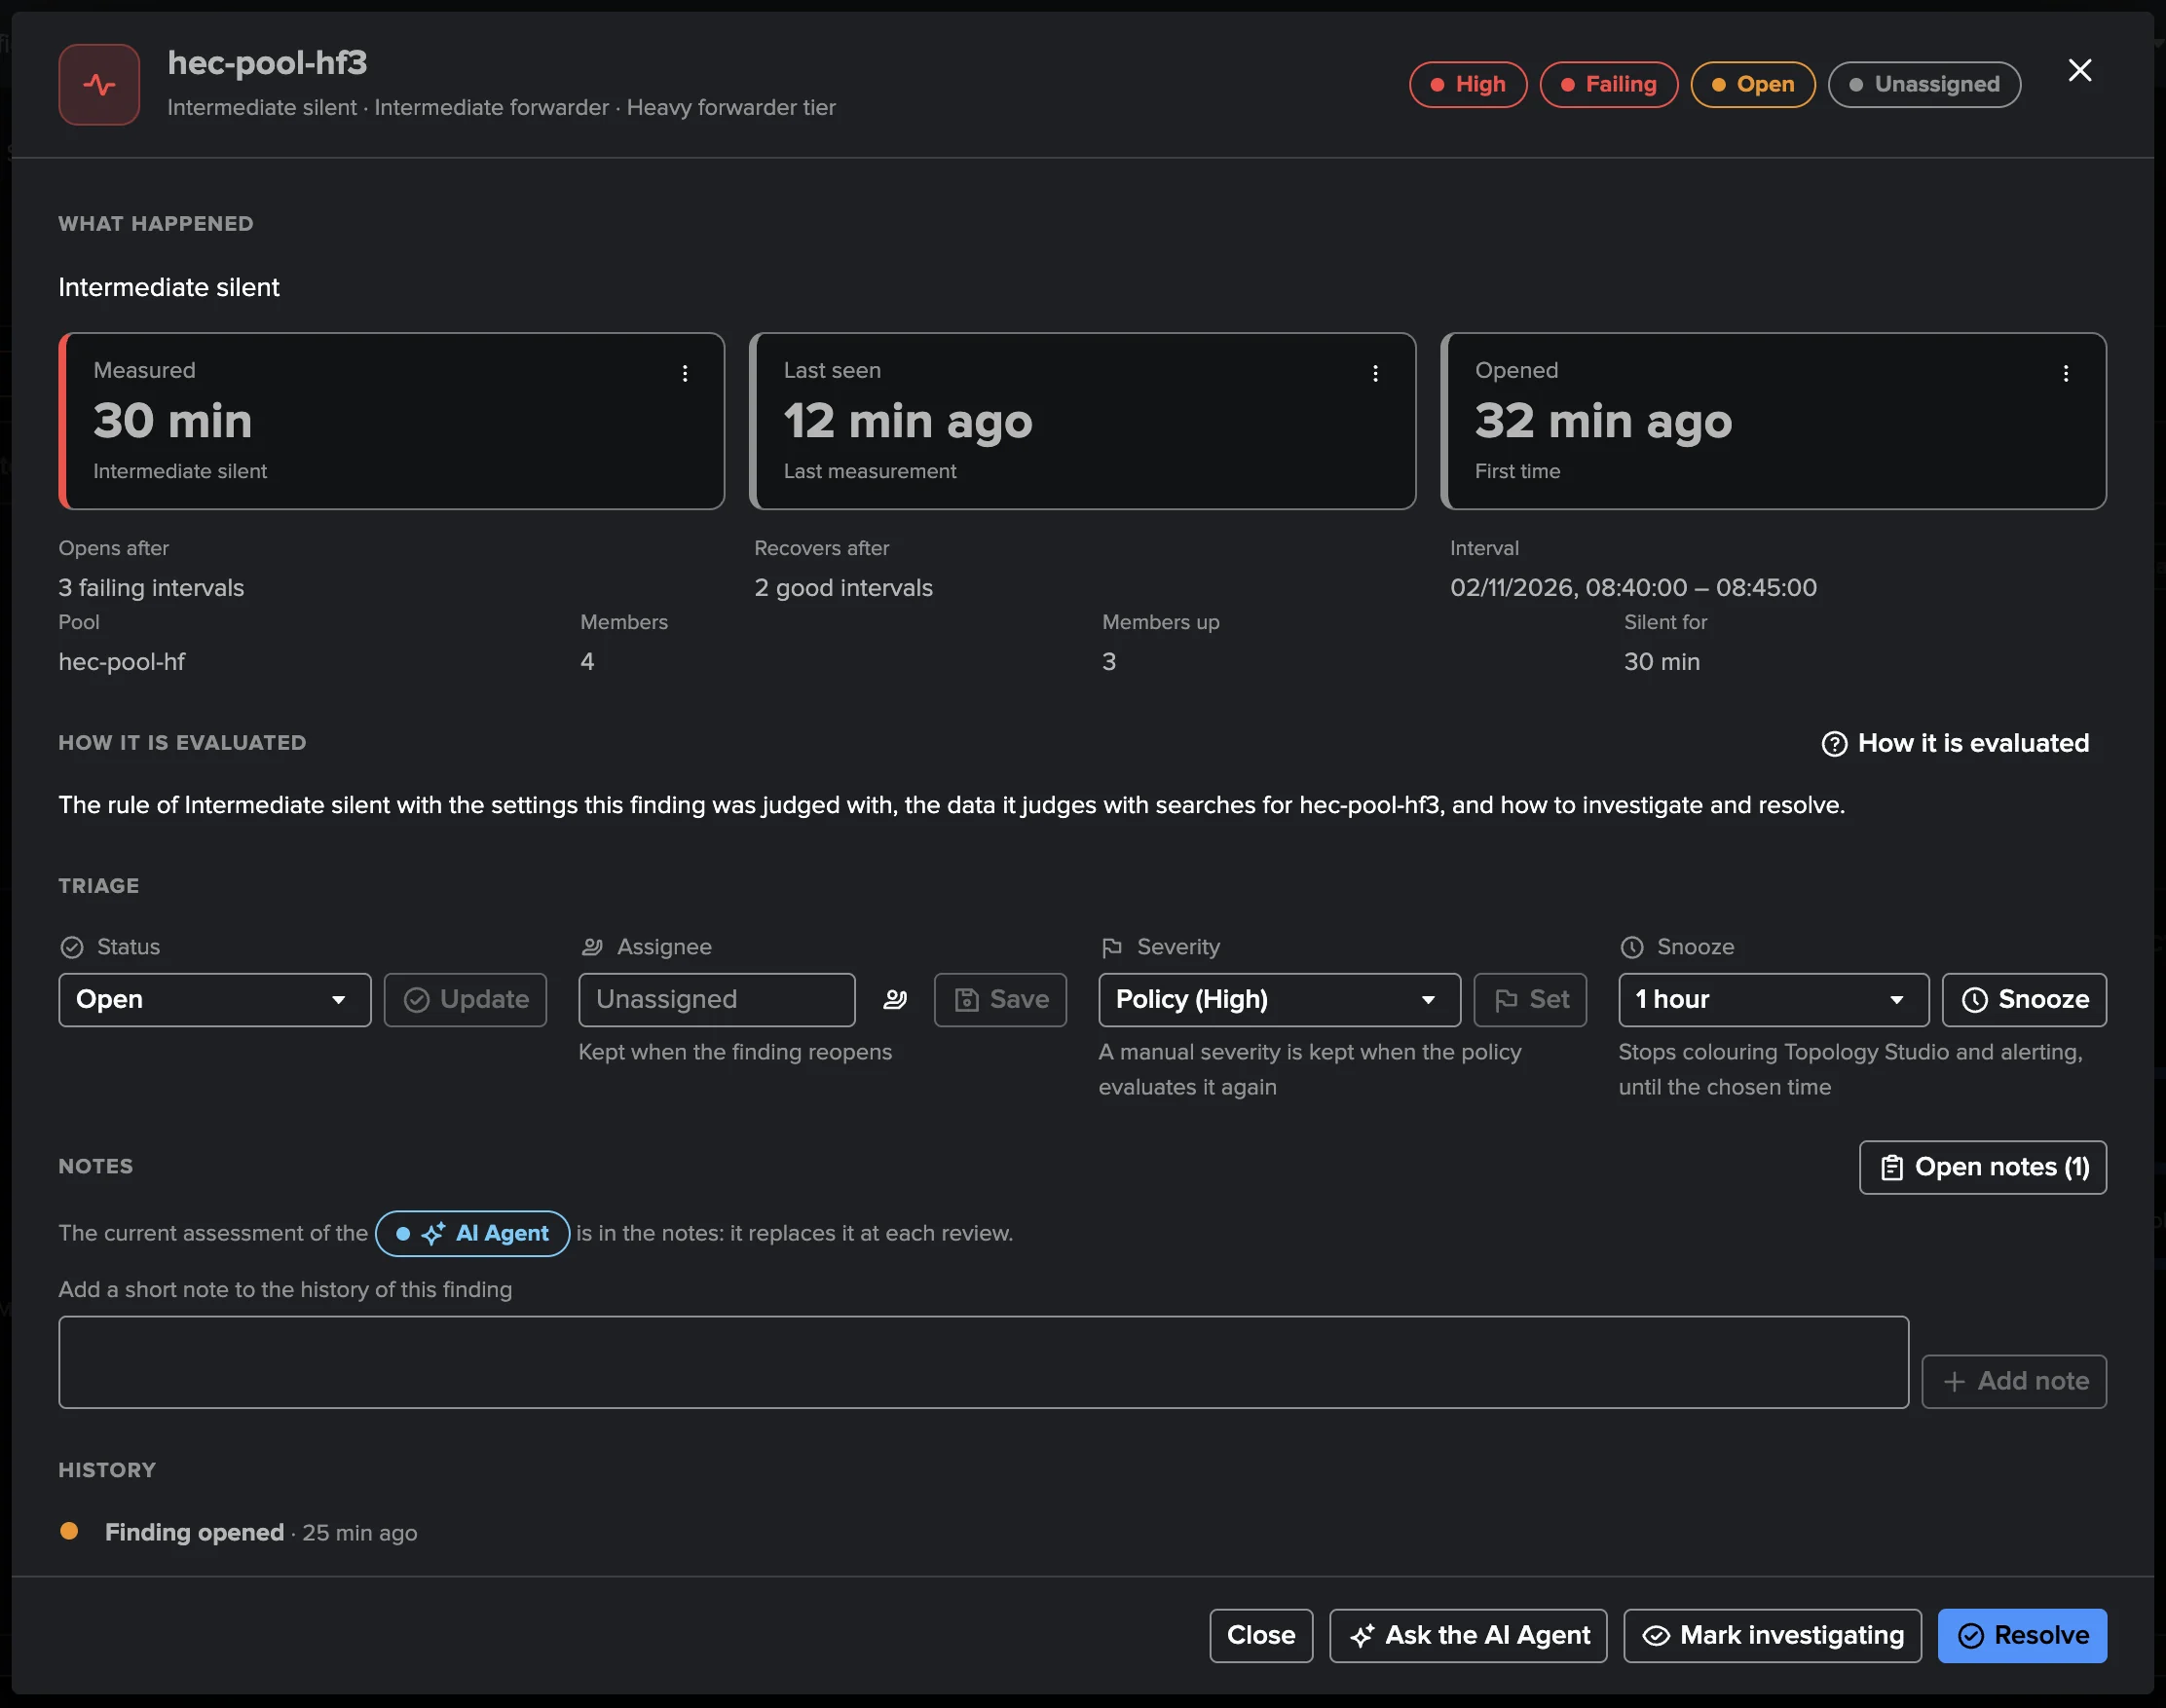
Stopping one heavy forwarder of the tier opened three findings: Pool capacity on the Heavy forwarder tier first (three members up against four expected), then Intermediate silent on the heavy forwarder and Destination unreachable on its receiving port, measured on the 23 universal forwarders that failed to reach it for 15 minutes or more (24 of 24 failing). The forwarders load balanced to the other members, so no sender was held and no back pressure cascade opened.
Notifications
Settings → Notifications emails the transitions of the tenant’s findings: one digest per live
run, or one threaded email per transition of a Finding group, from a minimum severity, for every
policy or chosen ones, through an email delivery account, with the finding’s chart embedded (in per
Finding group mode, more than 10 Finding groups with updates to send at once go as one digest). Every
transition is also written as an event to the tenant’s notable index (sourcetype=
trackme:cribl:finding), whatever the notification settings. See Findings, Finding groups and findings actions.
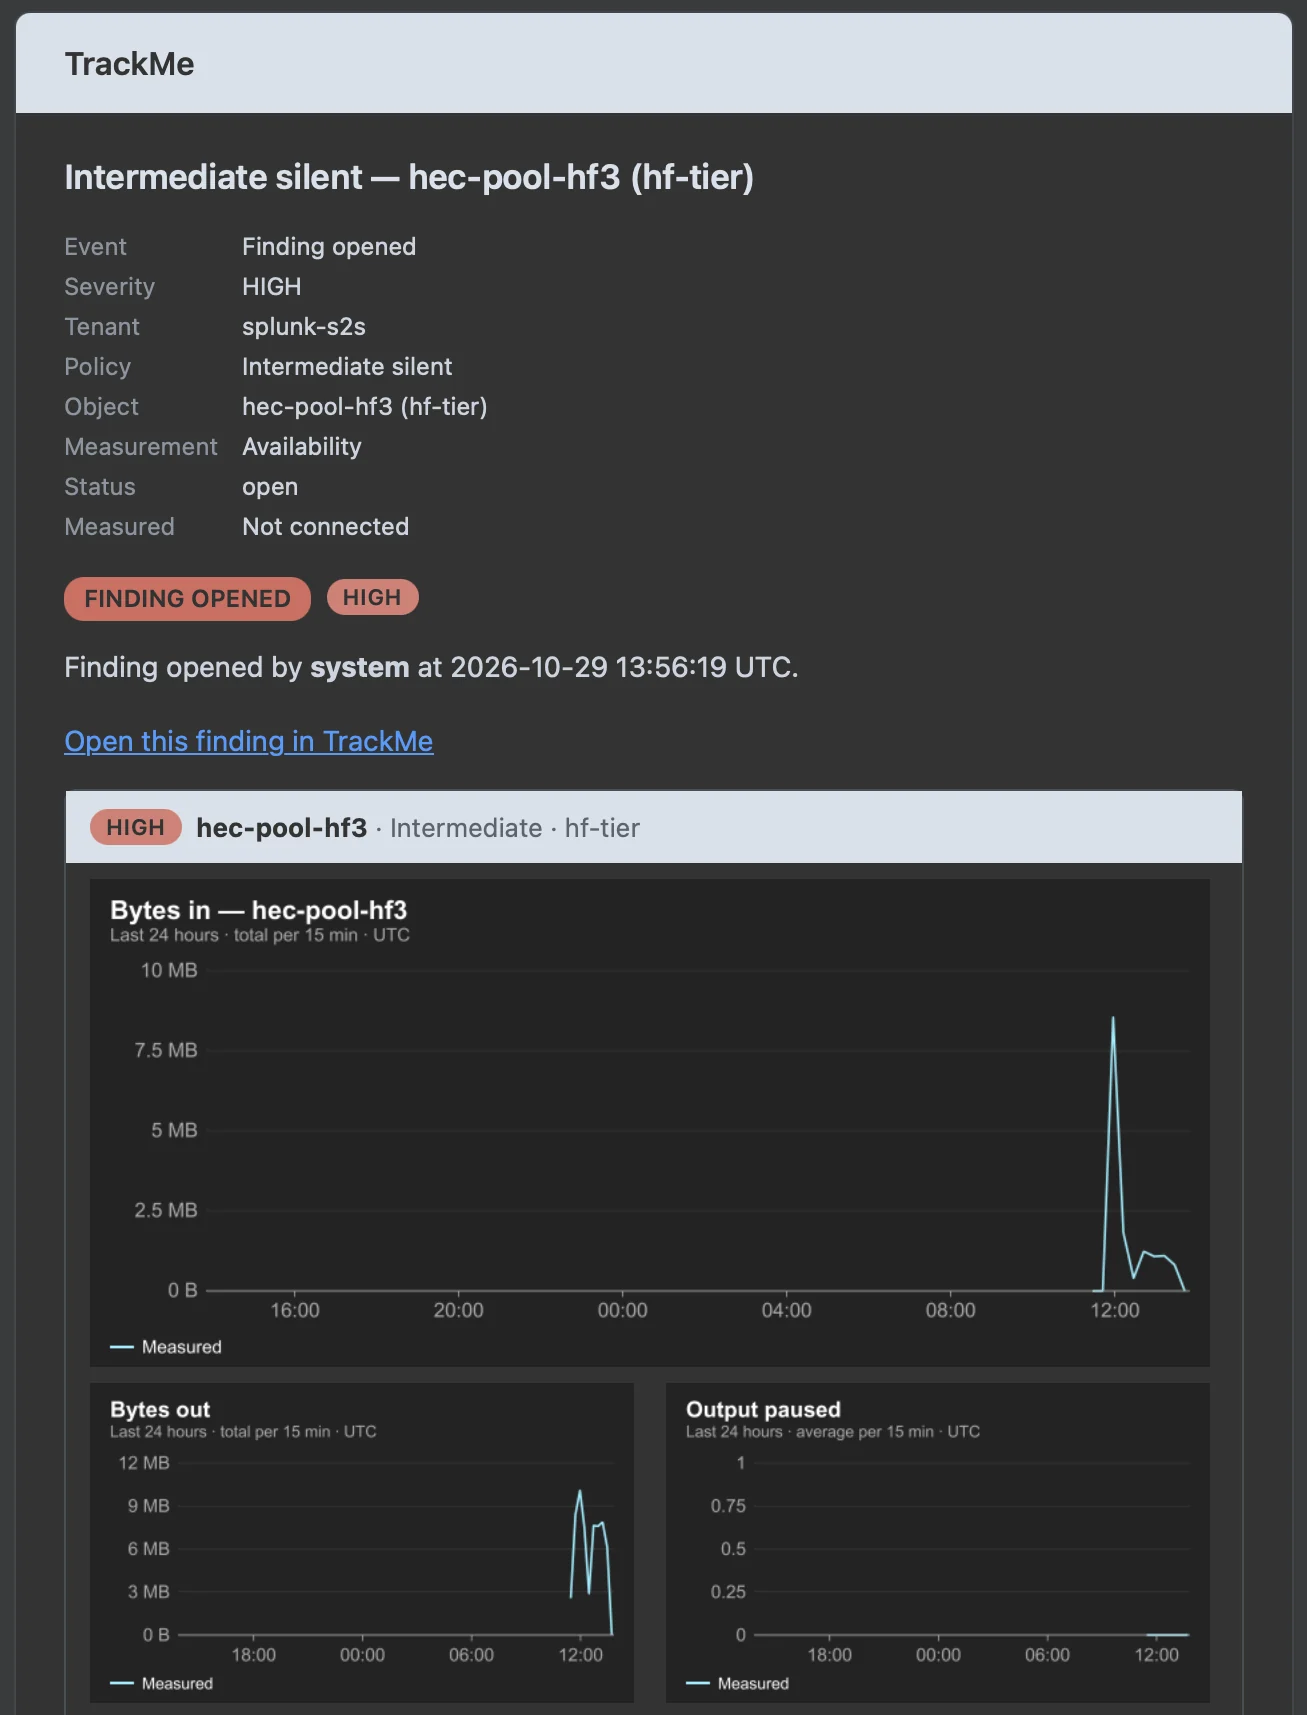
An intermediate forwarder of the pool went silent: the email names the policy, the object and its measurement, links back to the finding, and embeds the intermediate’s last 24 hours (bytes in, bytes out, output paused).
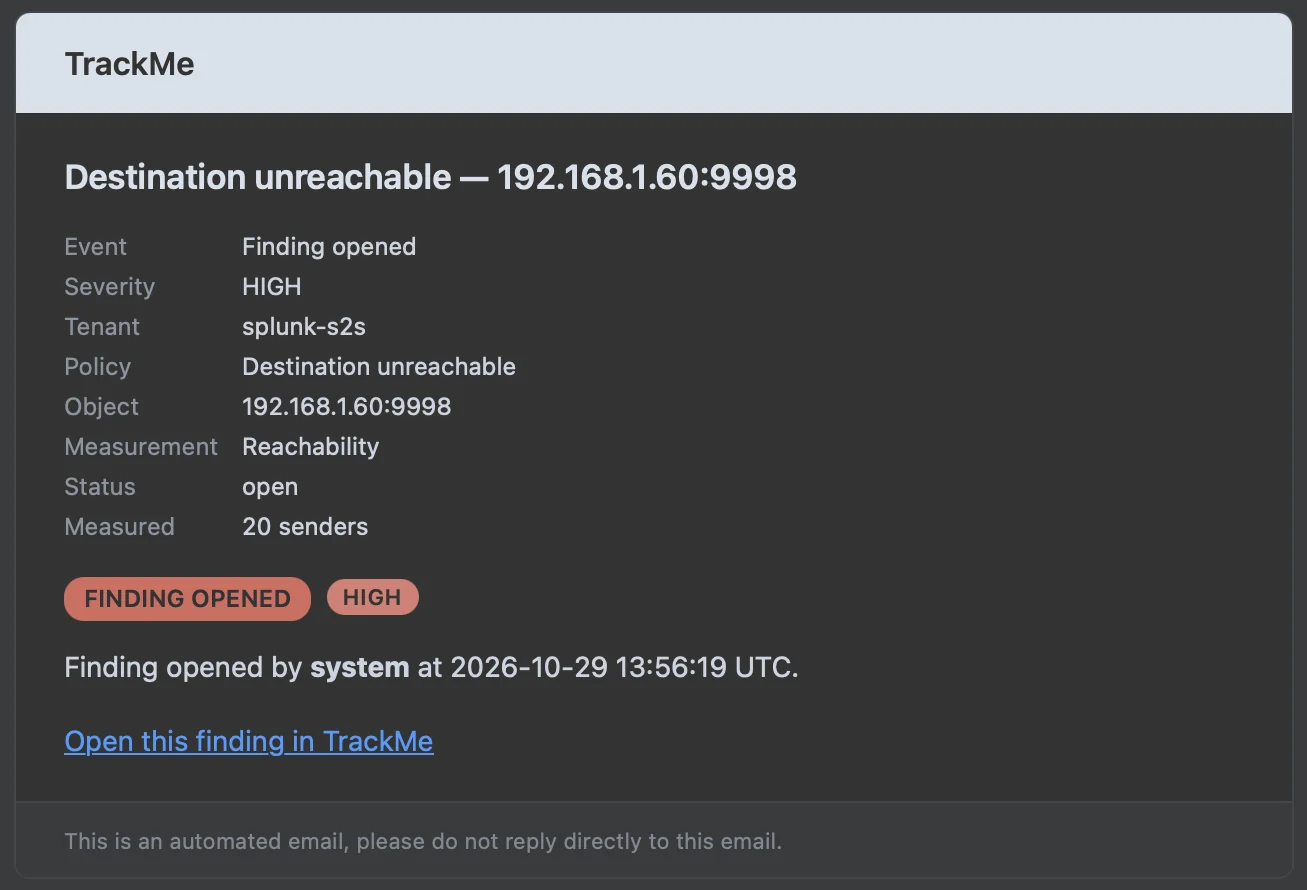
The same stop made the intermediate unreachable for the universal forwarders that send to it: one Destination unreachable finding on its receiving port, measured on the senders that failed to reach it (here, in an earlier run of the same exercise, twenty).
Topology Studio
Splunk S2S objects are first-class in Topology Studio: receivers, intermediates and pools in the entity picker and as dynamic groups (by status, the receivers of a pool, back pressure, open findings). Their status comes from their findings first; without one, a measured host is green and a silent one quiet. The templates Forwarding path (sender types → intermediates → receivers), Receivers by pool, Problems wall and Intermediates build a view in one click, and the AI Topology Builder knows the tenant (“Draw my forwarding path”). When a Splunk UF Fleet tenant reads the same source, its fleet is drawn linked to these receiving nodes. The workspace’s Data path tab saves its generated topology to Topology Studio on request. See Topology Studio.
The Splunk S2S AI Agent
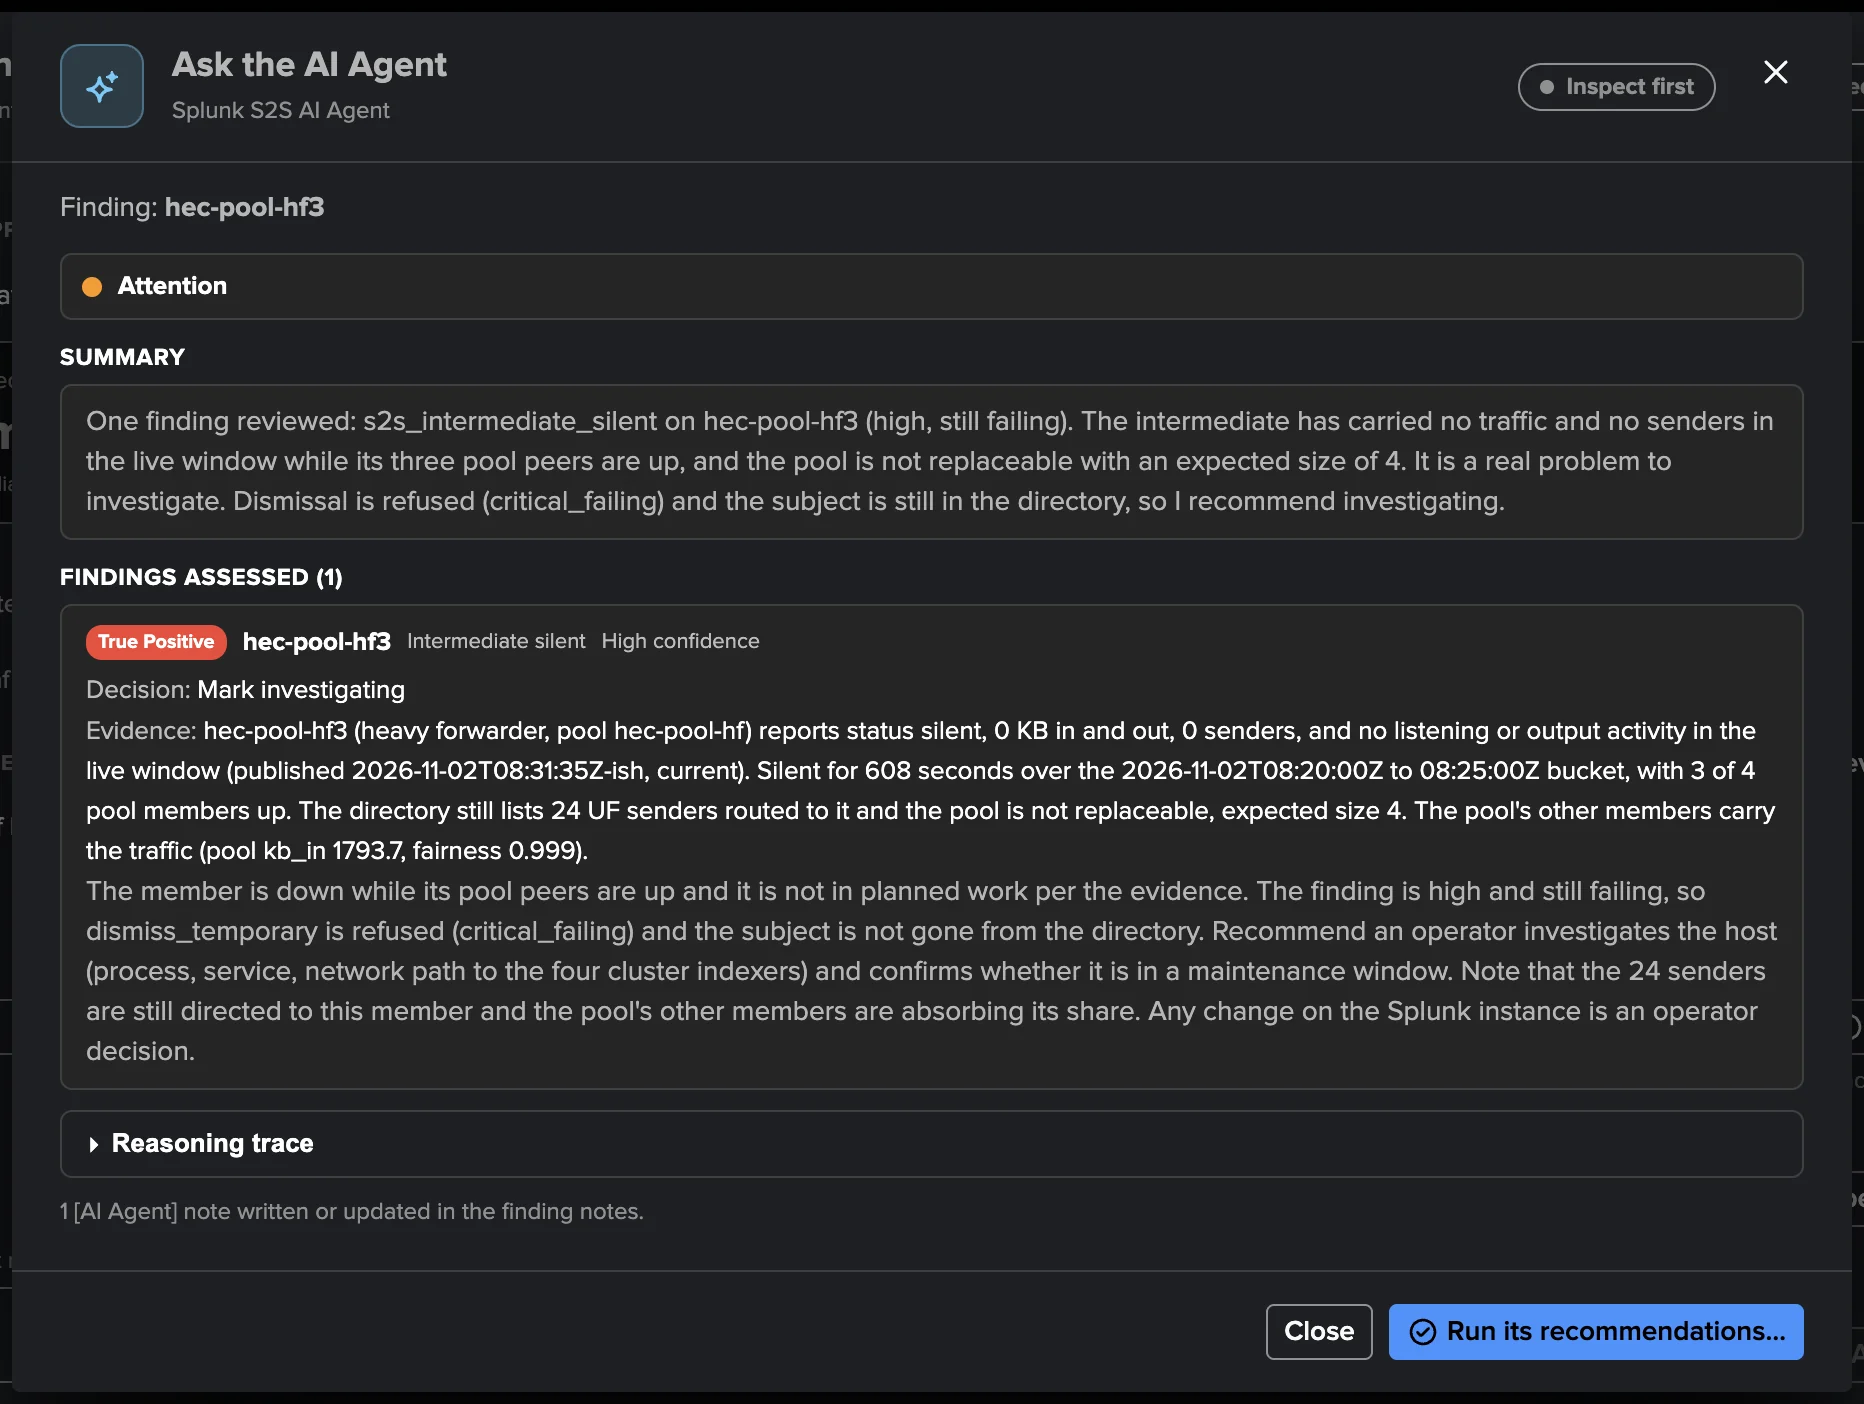
The Splunk S2S AI Agent reviews findings on the shared findings AI Agent framework (see
AI Agents for findings). It reads what TrackMe holds about the finding — the host’s live row
(pipeline, listening ports, output trouble, origin, senders’ mix, TLS, acknowledgement, resources,
churn, health), its pool with the members needing attention and the cluster summary, collection
health, the Finding group and past decisions — and may read further through its tools (the
overview, a host, a pool, the senders, the data path, the traffic models, log evidence, trends, the
last 5 minutes). It writes one [AI Agent] note per review; in act mode it applies only what the
tenant allows: marking a finding investigating (allowed by default), a temporary dismissal of at
most 7 days (allowed), and resolving after a measured recovery (not allowed by default). It never
changes anything on a Splunk instance.
Ask the AI Agent from a finding or a Finding group runs it on demand. Scheduled triage is off
by default (Settings → AI Agent, or Manage AI Agents): hourly, up to 10 findings per run, a
finding reviewed again after a day unless it moved. The agent needs the AI Assistant enabled and an
LLM provider; a scheduled run works with a least-privilege tenant owner, not with nobody.
The Tenant Home AI Assistant knows the workspace, its policies and its open findings: ask “Which pools have members down or backing up, and where is the bottleneck?” or “Which senders forward without TLS or acknowledgement?”.
Collection health
The Collection health tab shows whether the tenant collects as configured: the Status view
lists every problem with its meaning, its source, its causes and the steps to fix it, and the runs
that did not complete in the last 24 hours; Trackers shows each job’s last run with the searches
it sent and a Run now; Data & storage, Troubleshoot & help and Custom policies (the
runs of each custom policy) complete it. The same assessment raises the Configuration Guardian check
cribl_collection_health. Every problem code is listed in Splunk S2S reference.
Troubleshooting
My indexer cluster shows as two pools. It is a multisite cluster: each site is a pool, judged on its own peers (capacity, balance, traffic). A single-site cluster, or one whose peers’ sites are not all known, stays one pool.
My heavy forwarders are in a pool I never created. That is the automatic pool of their host-name family (Intermediate forwarders as pools). Configure it in Settings → Pools to rename it and give it its output groups; set the setting to Off to leave the intermediates no pool claims as discovered.
The cluster pools are empty and Collection health says cluster_read_refused. The reader (the
tenant owner, or the source account’s user) lacks list_indexer_cluster. Add it (read-only), or
set Indexer clusters as pools to Off.
My intermediate’s output is far smaller than what its receivers count. Its own count is compressed bytes on the wire; the receivers count uncompressed data. The workspace never compares them.
A pool’s Senders is lower than the sum of its members’ senders. A sender load balancing over N members is one sender for the pool: the counts are exact distinct counts.
Connection churn on every receiver? Splunk’s automatic load balancing alone reconnects each sender many times an hour. The policy compares each receiver with the median of its pool’s other members, never with an absolute count.
Findings stopped during a rolling restart. That is Hold during planned work: an open finding stays open, a new one waits until the cluster’s planned work ends.
The manager account check fails, but the account searches fine. The clustering endpoints need
list_indexer_cluster; an account that cannot serve a | rest read answers no row. The check
names the missing capability and the role to create.
What the Splunk S2S tenant does not do
It does not follow the forwarding agents themselves: that is Splunk UF Fleet.
It does not judge an indexer cluster’s own health (peers, factors, buckets) nor a host’s CPU and memory: both are shown, never findings.
A sender behind a non-Splunk hop (Cribl Stream, for example) appears as the hop’s workers; senders using S2S over HTTP are not counted.
TLS and acknowledgement posture are read from the connection lines’
sslandackflags.Several ingestion pipeline sets are merged, the worst queue of each kind winning.
It never changes anything on a Splunk instance.
Next: the reference
Every policy with its defaults and settings, the custom policy subjects, the jobs, the settings, the Collection health codes, the commands and the permissions are in Splunk S2S reference.