Workload monitoring — in depth
Tip
This is the in-depth reference for Workload (splk-wlk) monitoring. For the readable overview, start with Workload monitoring. This page collects the full administration and usage detail: Splunk Cloud setup, status-macro internals, the overgroup procedure, metadata versioning, the anomaly-reason and metrics tables, and the discovery / investigation workflow.
Introduction to the Workload component
The TrackMe workload component (splk-wlk) is a licensed users restricted component which tracks the activity from any kind of scheduled search in your Splunk deployment, from reports to alerts and Data Model Acceleration. (DMA)
The Workload component tracks various use cases such as execution errors which can slightly affect the consistency of your Splunk use cases, providing powerful features to detect issues and track the performance of the Splunk scheduling activity.
For the User Guide, consult: WLK — Workload Knowledge
Note
Grouping in the Workload component: group and overgroup
By default, the Workload component groups entities by
appwhich represents the Splunk application namespace hosting the scheduled report or alert.When creating the tenant and also later on when creating trackers manually, since TrackMe 2.0.70, you can optionally override this behaviour by setting up an
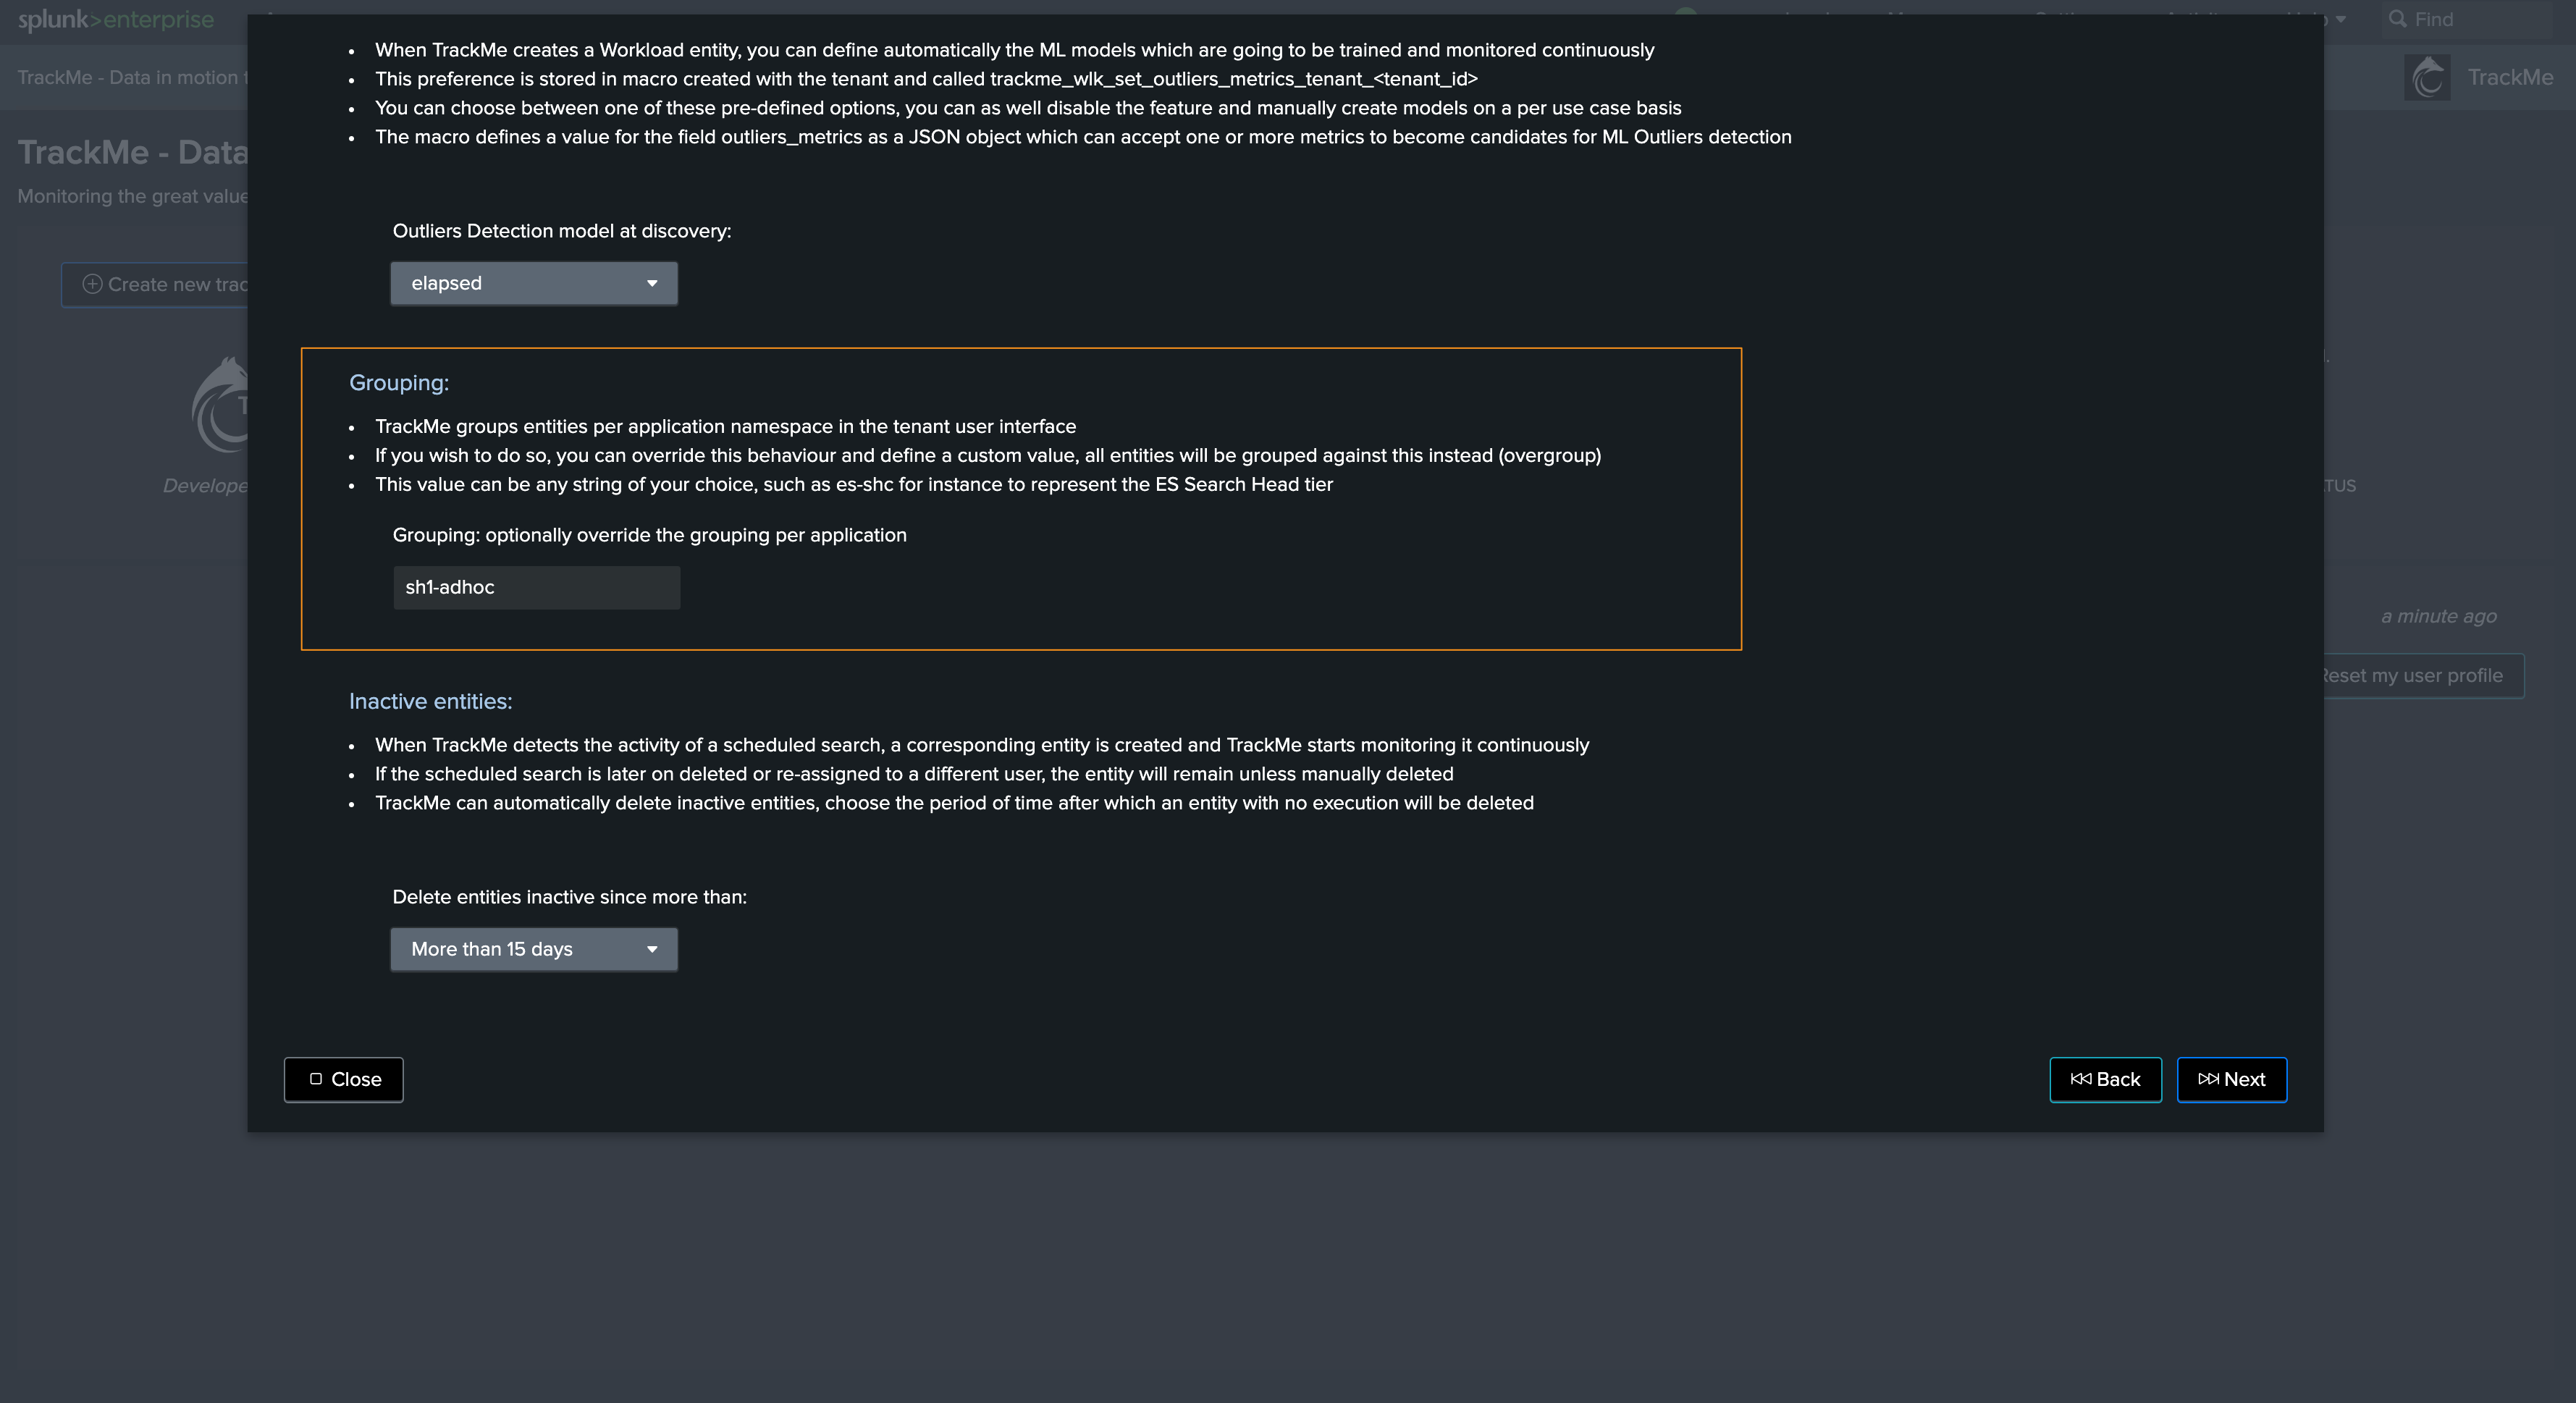
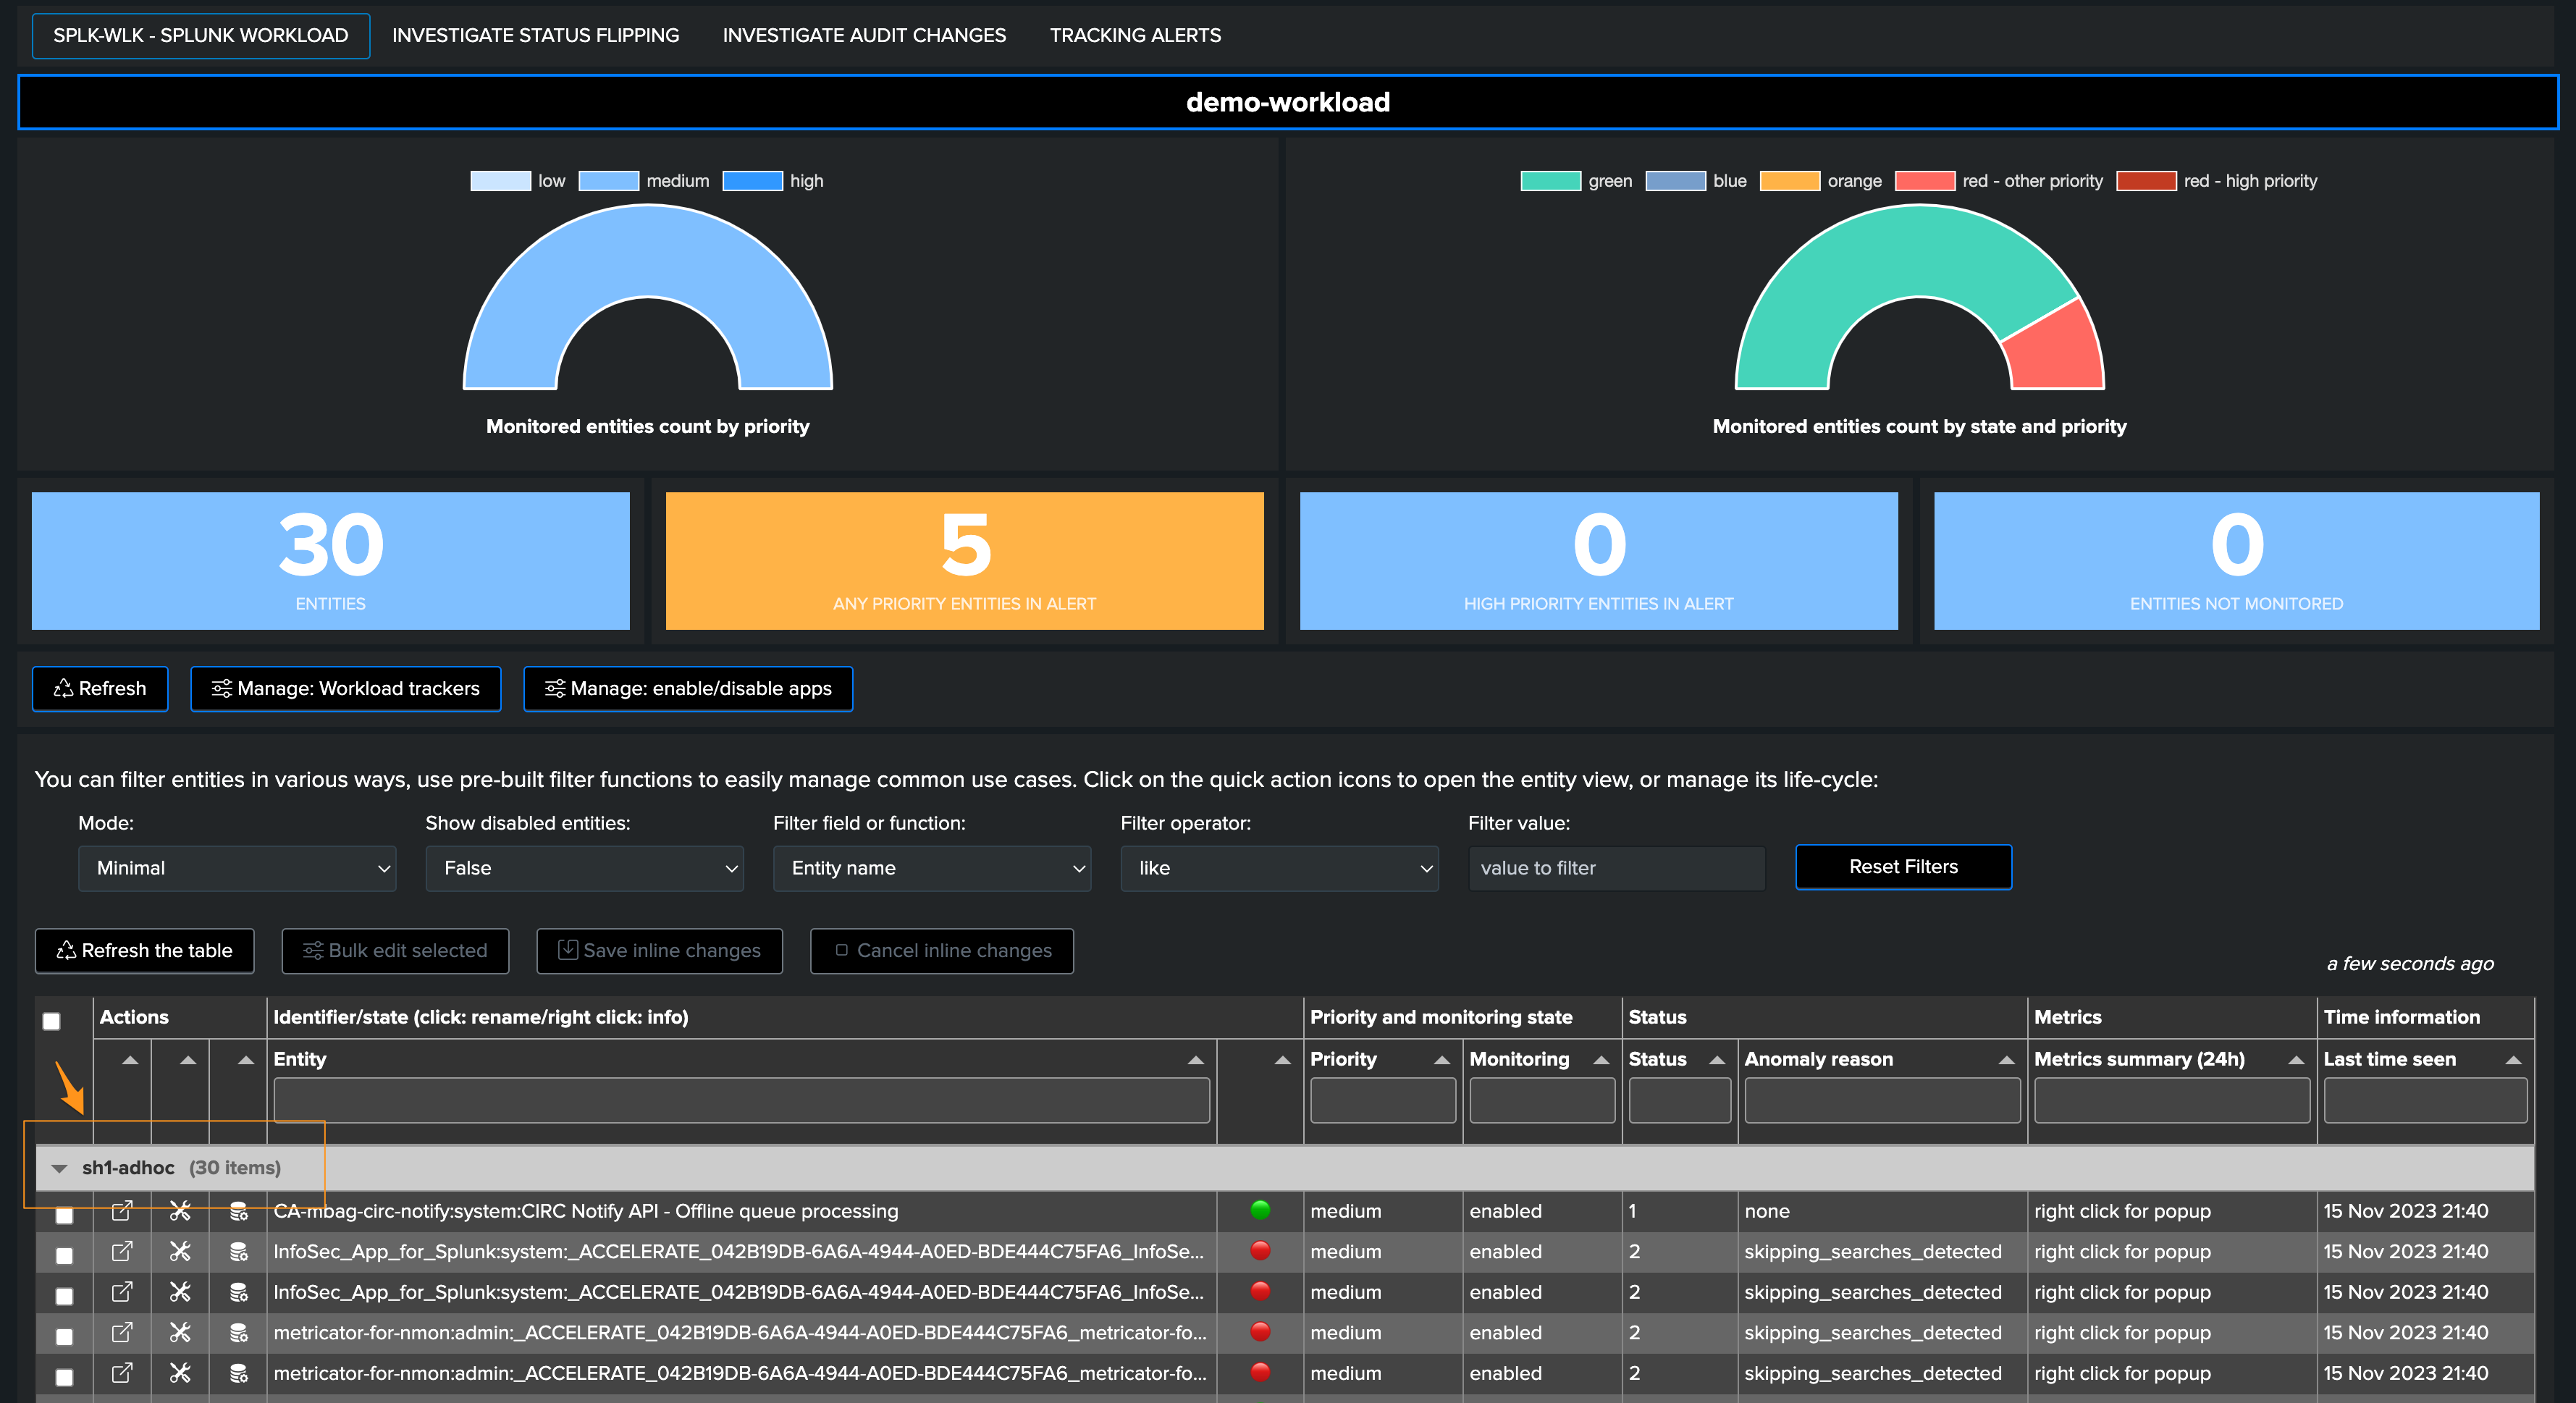
overgroupvalue.By doing so, the Workload will group entities based on a custom term instead of applications, this can be useful if for instance you want to have multiple Search Head tiers in the same tenant.
Refer to the Creating a Workload tenant to host multiple Search Head tiers with overgroup section for more information.
Note
Data collection enhancements in TrackMe v2.0.75
Since TrackMe 2.0.75, the Workload components has been enhanced to automatically support data collection overlap between execution, relying on the tracking of the last known metrics for a given account/group and type of metrics.
This allows TrackMe to look at multiple slices of times when tracking the Workload activity (scheduler, introspection, etc) and avoids missing any data point in case of Splunk delaying the execution of the workload trackers. (Splunk skew parameter, time_window and/or over busy scheduler)
This process is fully automated and transparent, the last seen metadata are stored in a KVstore called
trackme_wlk_last_seen_activity_tenant_<tenant_id>.
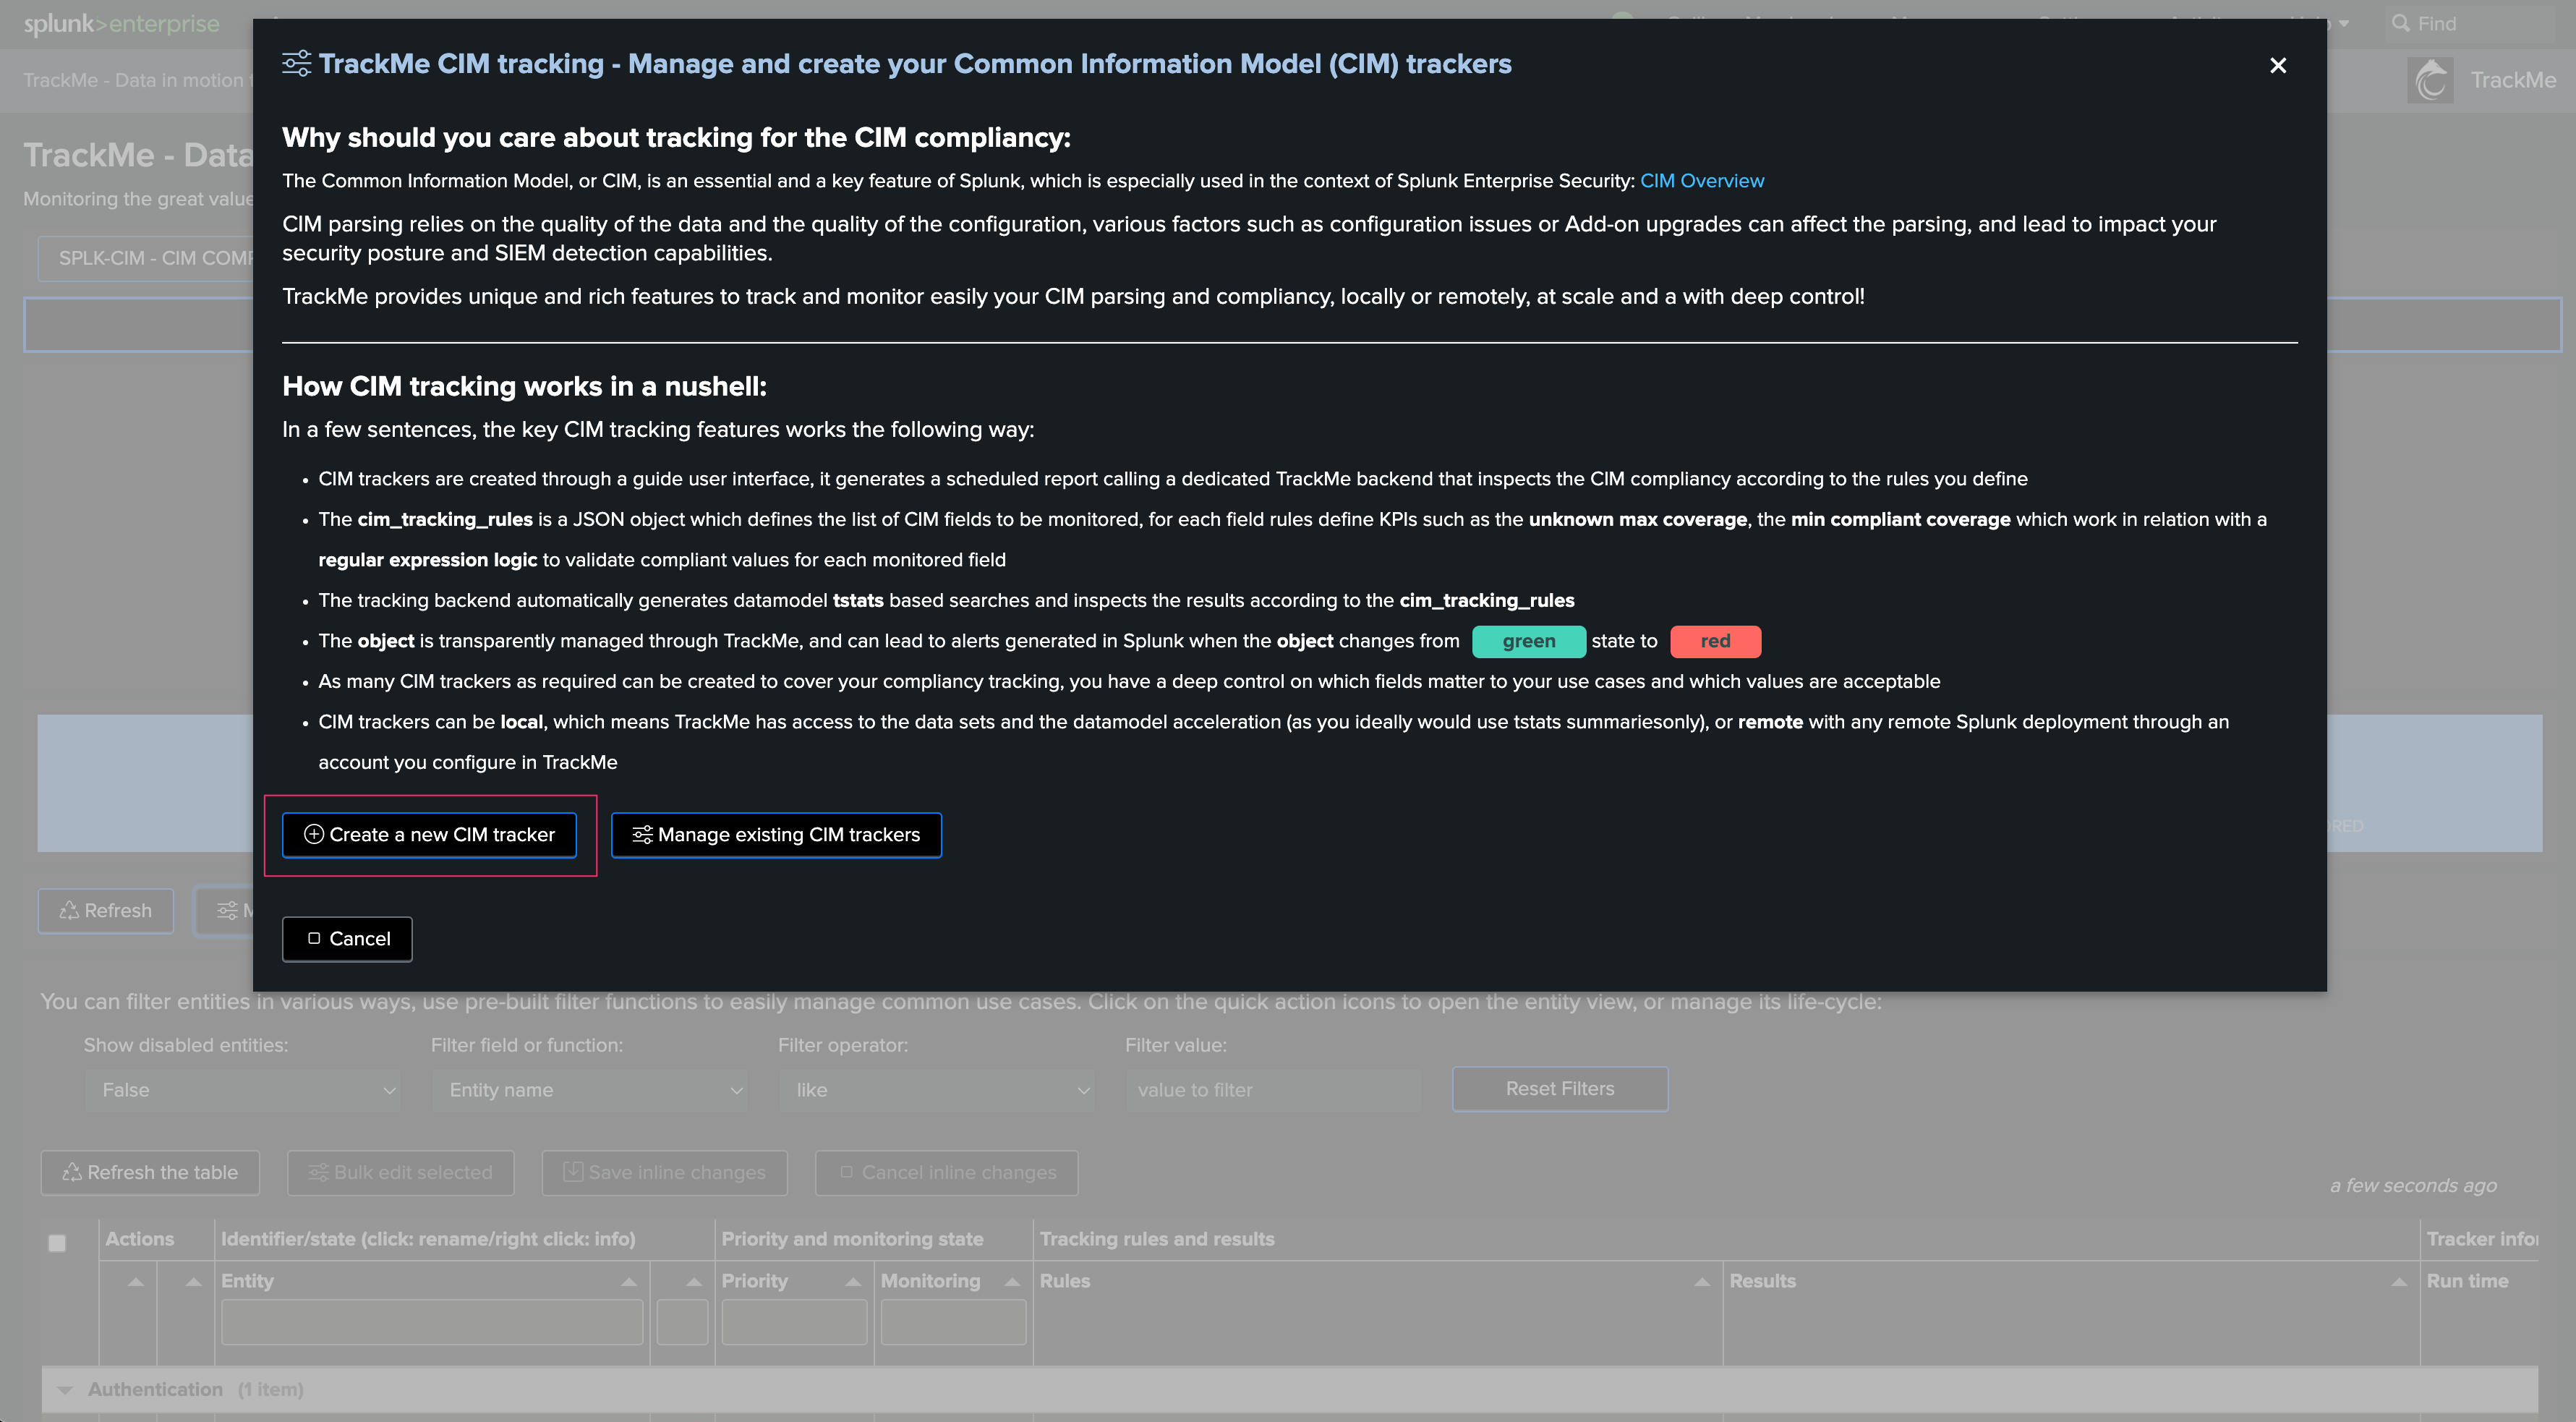
Creating and configuring a Workload Tenant
The creation and configuration of a Workload Tenant is guided through the wizard, click on the “create new tenant” and choose the associated component to start the configuration process:
Workload component in Splunk Cloud
Generally, in Splunk Cloud have two or more Search Head layers:
The ad-hoc Search Head tier, where TrackMe should be used (standalone or SHC)
The premium app Search Head tier, running Enterprise Security or ITSI (standalone or SHC)
In a nutshell, the configuration path is the following:
configure a TrackMe Splunk Remote Deployment which targets the premium app Search Head tier (this is required notably for the versioning tracking of scheduled searches, even through both Search Head tiers access the same indexing tier)
following these instructions to identify the Search Head tiers names as automatically defined per Splunk Cloud summary data, and recycle this information using a simple subsearch (see in the next sections)
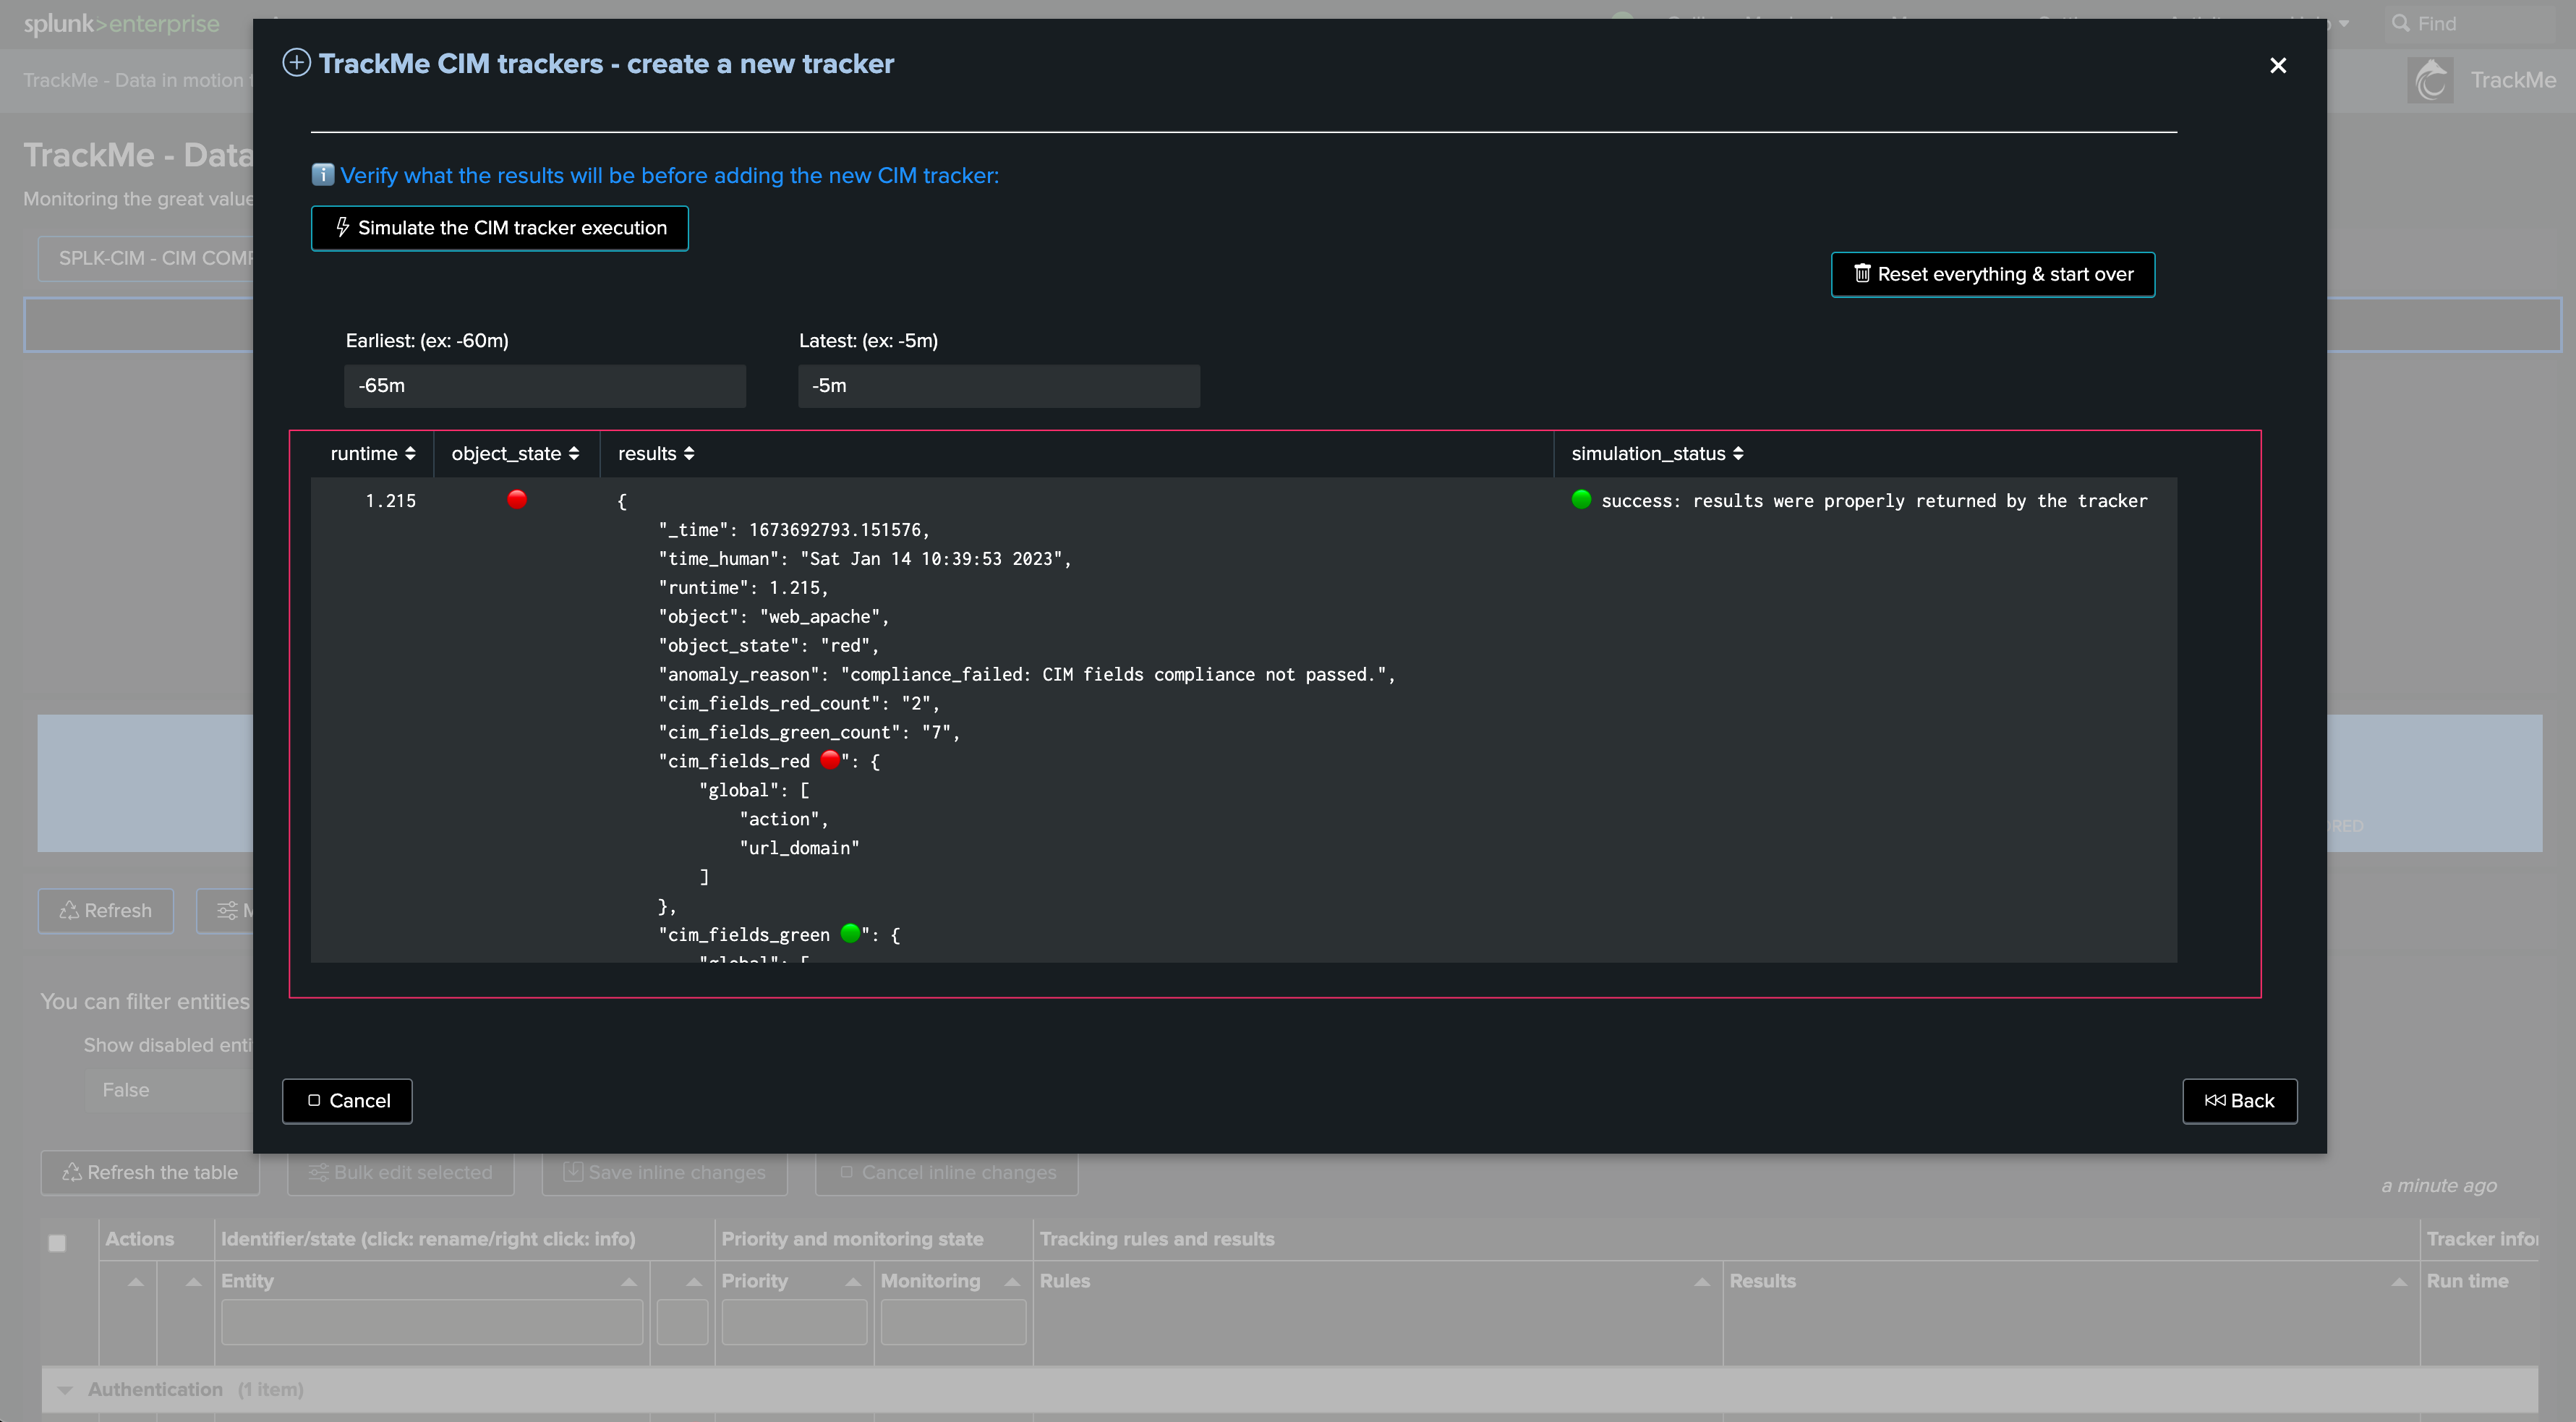
create and configure the Workload tenant in TrackMe
Step 1: configure the remote Splunk Deployment
For more information about TrackMe’s Splunk Remote Deployments capabilities and configuration, consult: Remote Splunk deployments
Proceed as following:
Create a bearer token in the premium app Search Head tier, it is good practice to associate the bearer token with a service account dedicated for that purpose
Identify the Splunk Cloud label per Search Tier, we will use this logic as a subsearch when creating the Workload tenant/trackers:
index=summary source="splunk-svc-consumer" earliest=-7d latest=now
| stats values(usage_source) as members by search_head_names
Hint
Using the search_head_names label with a subsearch to dynamically restrict the hosts
In Splunk Cloud, use the following subsearch technique to assign dynamically the list of Search Heads for that given Search Head tier
If Search Head members are re-created, the subsearch will automatically pick up the new hosts and you have no changes to perform yourself
for instance, if the target Search head tier is called “es” (Enterprise Security), we will use the following subsearch to filter out the hosts dynamically:
[ search index=summary source="splunk-svc-consumer" search_head_names="es" earliest=-24h latest=now | stats count by usage_source | table usage_source | rename usage_source as host | format | eval search = if(search="NOT ()", "host=*", search) ]
Once you have validated the connectivity, you can continue and start the configuration of the Workload tenant.
Step 2: create and configure the Workload tenant
Open the assistant wizard, and proceed as follows:
Select “Splunk Cloud” in the Splunk environment dropdown:
Select the Remote deployment target:
Set the search restrictions:
Hint
Search restrictions per Workload component
Since the release 2.0.57, you can define the search restrictions per component, to ease and improve the configuration process
You can directly validate that the search will return results by clicking on the search preview link
This opens a pre-populated search interface, it also sets the restrictions and calls splunkremotesearch if the search has to run against a remote Search Head tier
Complete the rest of the setup, it can take up to 5 minutes before entities start to be visible in the Workload tenant.
Workload component in Splunk Enterprise
If you are running Splunk Enterprise, then the setup slightly depends on your deployment:
If you have multiple Search Head tiers, you can use the same tag approach as documented in the Splunk Cloud setup above
You can also create a custom indexed or search time field on the Search Head tier level, which automatically identifies the Search Head tiers to be targeted
Use different combinations up to your preference
Managing Workload Trackers
There are a certain number of Workload trackers which are created automatically by the wizard, depending on your Splunk environment.
Through the trackers management user interface, you can eventually add new trackers if needed, either if you want to re-create the trackers or extend the tracking to additional context:
However, the general recommendation is to dedicate a Workload Tenant to a given Search Head tier.
The REST API UI also allows you to manage all types of Workload trackers:
Managing Workload detection
When a Workload Virtual Tenant is created, TrackMe automatically creates a macro which defines the main status definition behaviour for that tenant.
The macro is named as follows:
trackme_wlk_set_status_tenant_<tenant_id>
You can update this macro to modify how TrackMe defines the status of Workload entities, for instance these lines define the grace time period for the detection of delayed entities:
``` Calculate the delta in sequence between now and the last execution compared against the requested cron schedule sequence, add 1h of grace time, detect if the execution has been delayed ```
| eval status=if(cron_exec_sequence_sec>0 AND ( now()-last_seen > (cron_exec_sequence_sec + 3600) ), 2, status)
This also defines the level of skipping searches (percentage) which leads entities to turn orange or red:
``` If there are skipping searches, define two levels of alerting, less than 5% is 3 (orange), more is 2 (red) ```
| eval status=case(skipped_pct>0 AND skipped_pct<5, 3, skipped_pct>0 AND skipped_pct>=5, 2, 1=1, status)
The macro is part of the life cycle of the tenant’s knowledge objects, therefore it will be removed automatically if the tenant itself is deleted.
This macro is executed by the “main” tracker, which naming convention is the following:
trackme_wlk_hybrid_main_ce555e75db1643a_wrapper_tenant_<tenant_id>
Creating a Workload tenant to host multiple Search Head tiers with overgroup
To create a tenant which hosts multiple Search Head tiers, you can use the overgroup feature, follow the steps below:
Step 1: Create the tenant with a first Search Head tier and the corresponding overgroup
We start by creating a brand new Workload tenant, where we define the first Search Head tier constraint, target (account) and overgroup value:
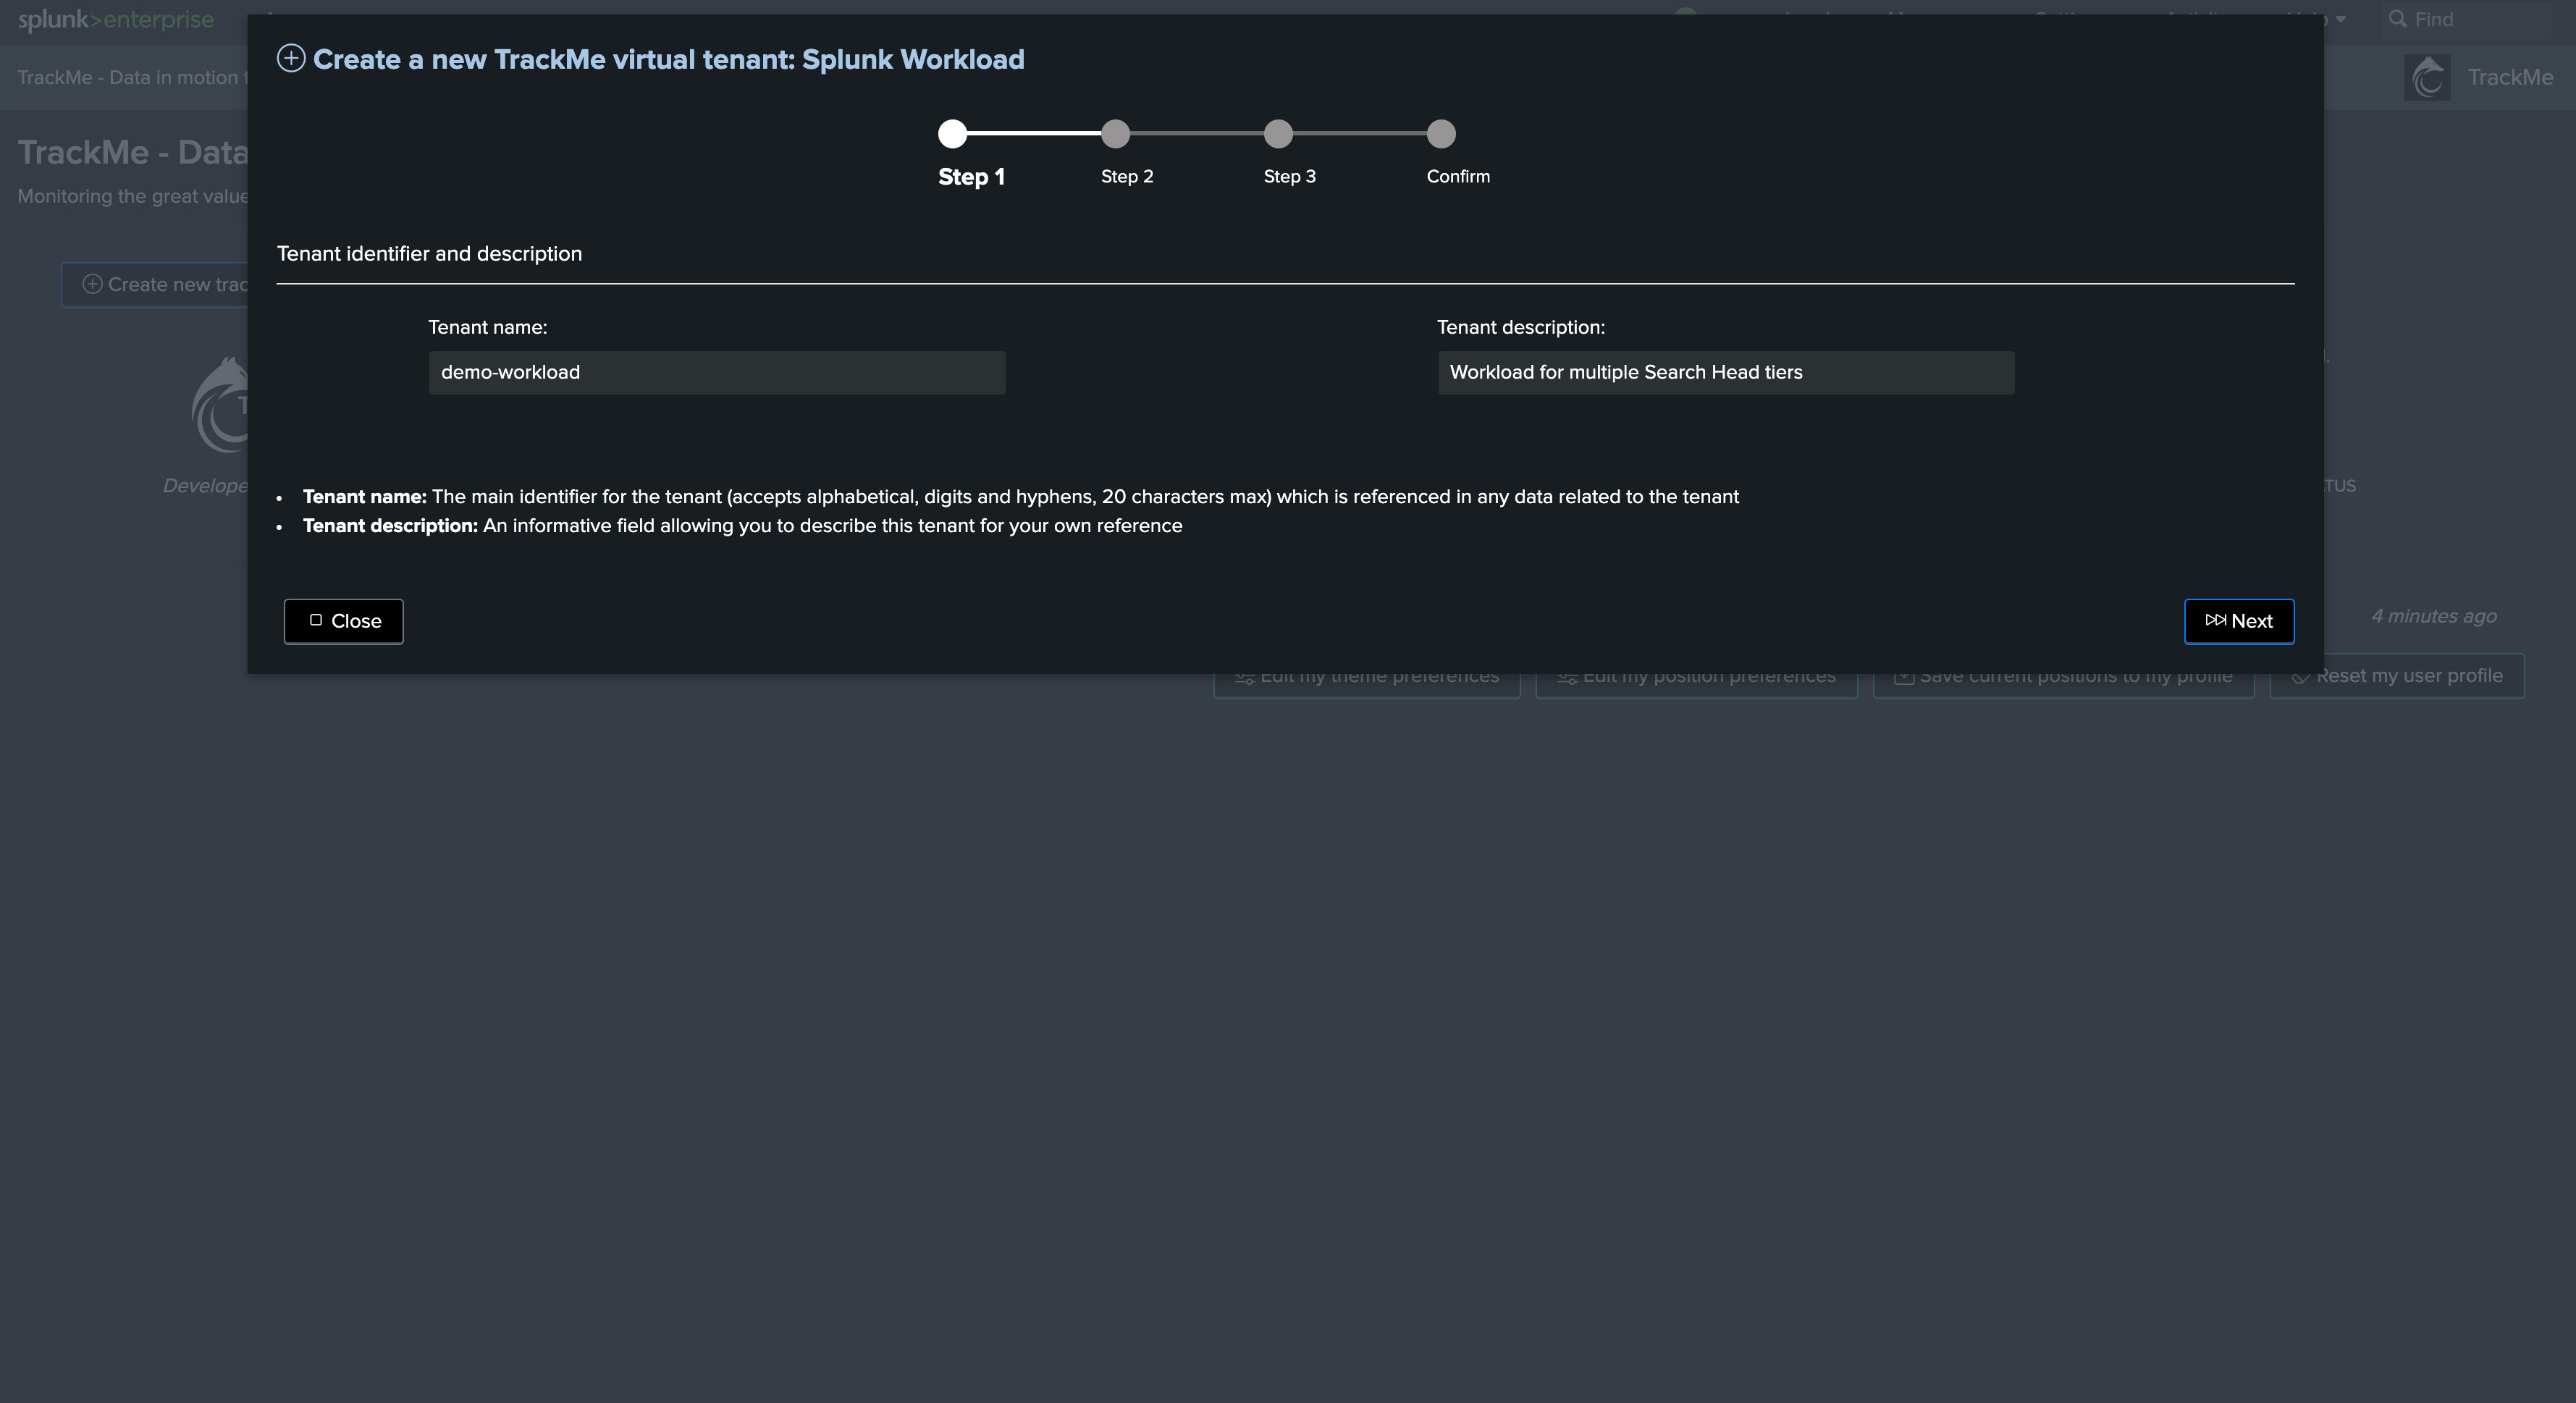
Define everything as needed (account, constraints, etc) then enter a custom value for the overgroup:
Once created and after 5/10 minutes, entities will be visible under the overgroup:
Step 2: In the Workload tenant, create the additional trackers for the second Search Head tier
Now that the tenant is created, we can create the additional trackers for the second Search Head tier, the following types of trackers can be created:
scheduler
introspection
Splunk Cloud SVC (optional, for Splunk Cloud only)
Notable (optional, if you wish to track notable activity)
Note
Common trackers:
You do not need to create additional trackers for main, metadata and inactive entities
There can be only one copy of these trackers per tenant, and these trackers can manage entities accordingly as long as these entities refer to a different account than the one used when creating the tenant
Therefore, we can manage multiple Search Head tiers in a same tenant as long as each Search Head tier corresponds to a different account (which in fact will be the case systematically in the Workload component)
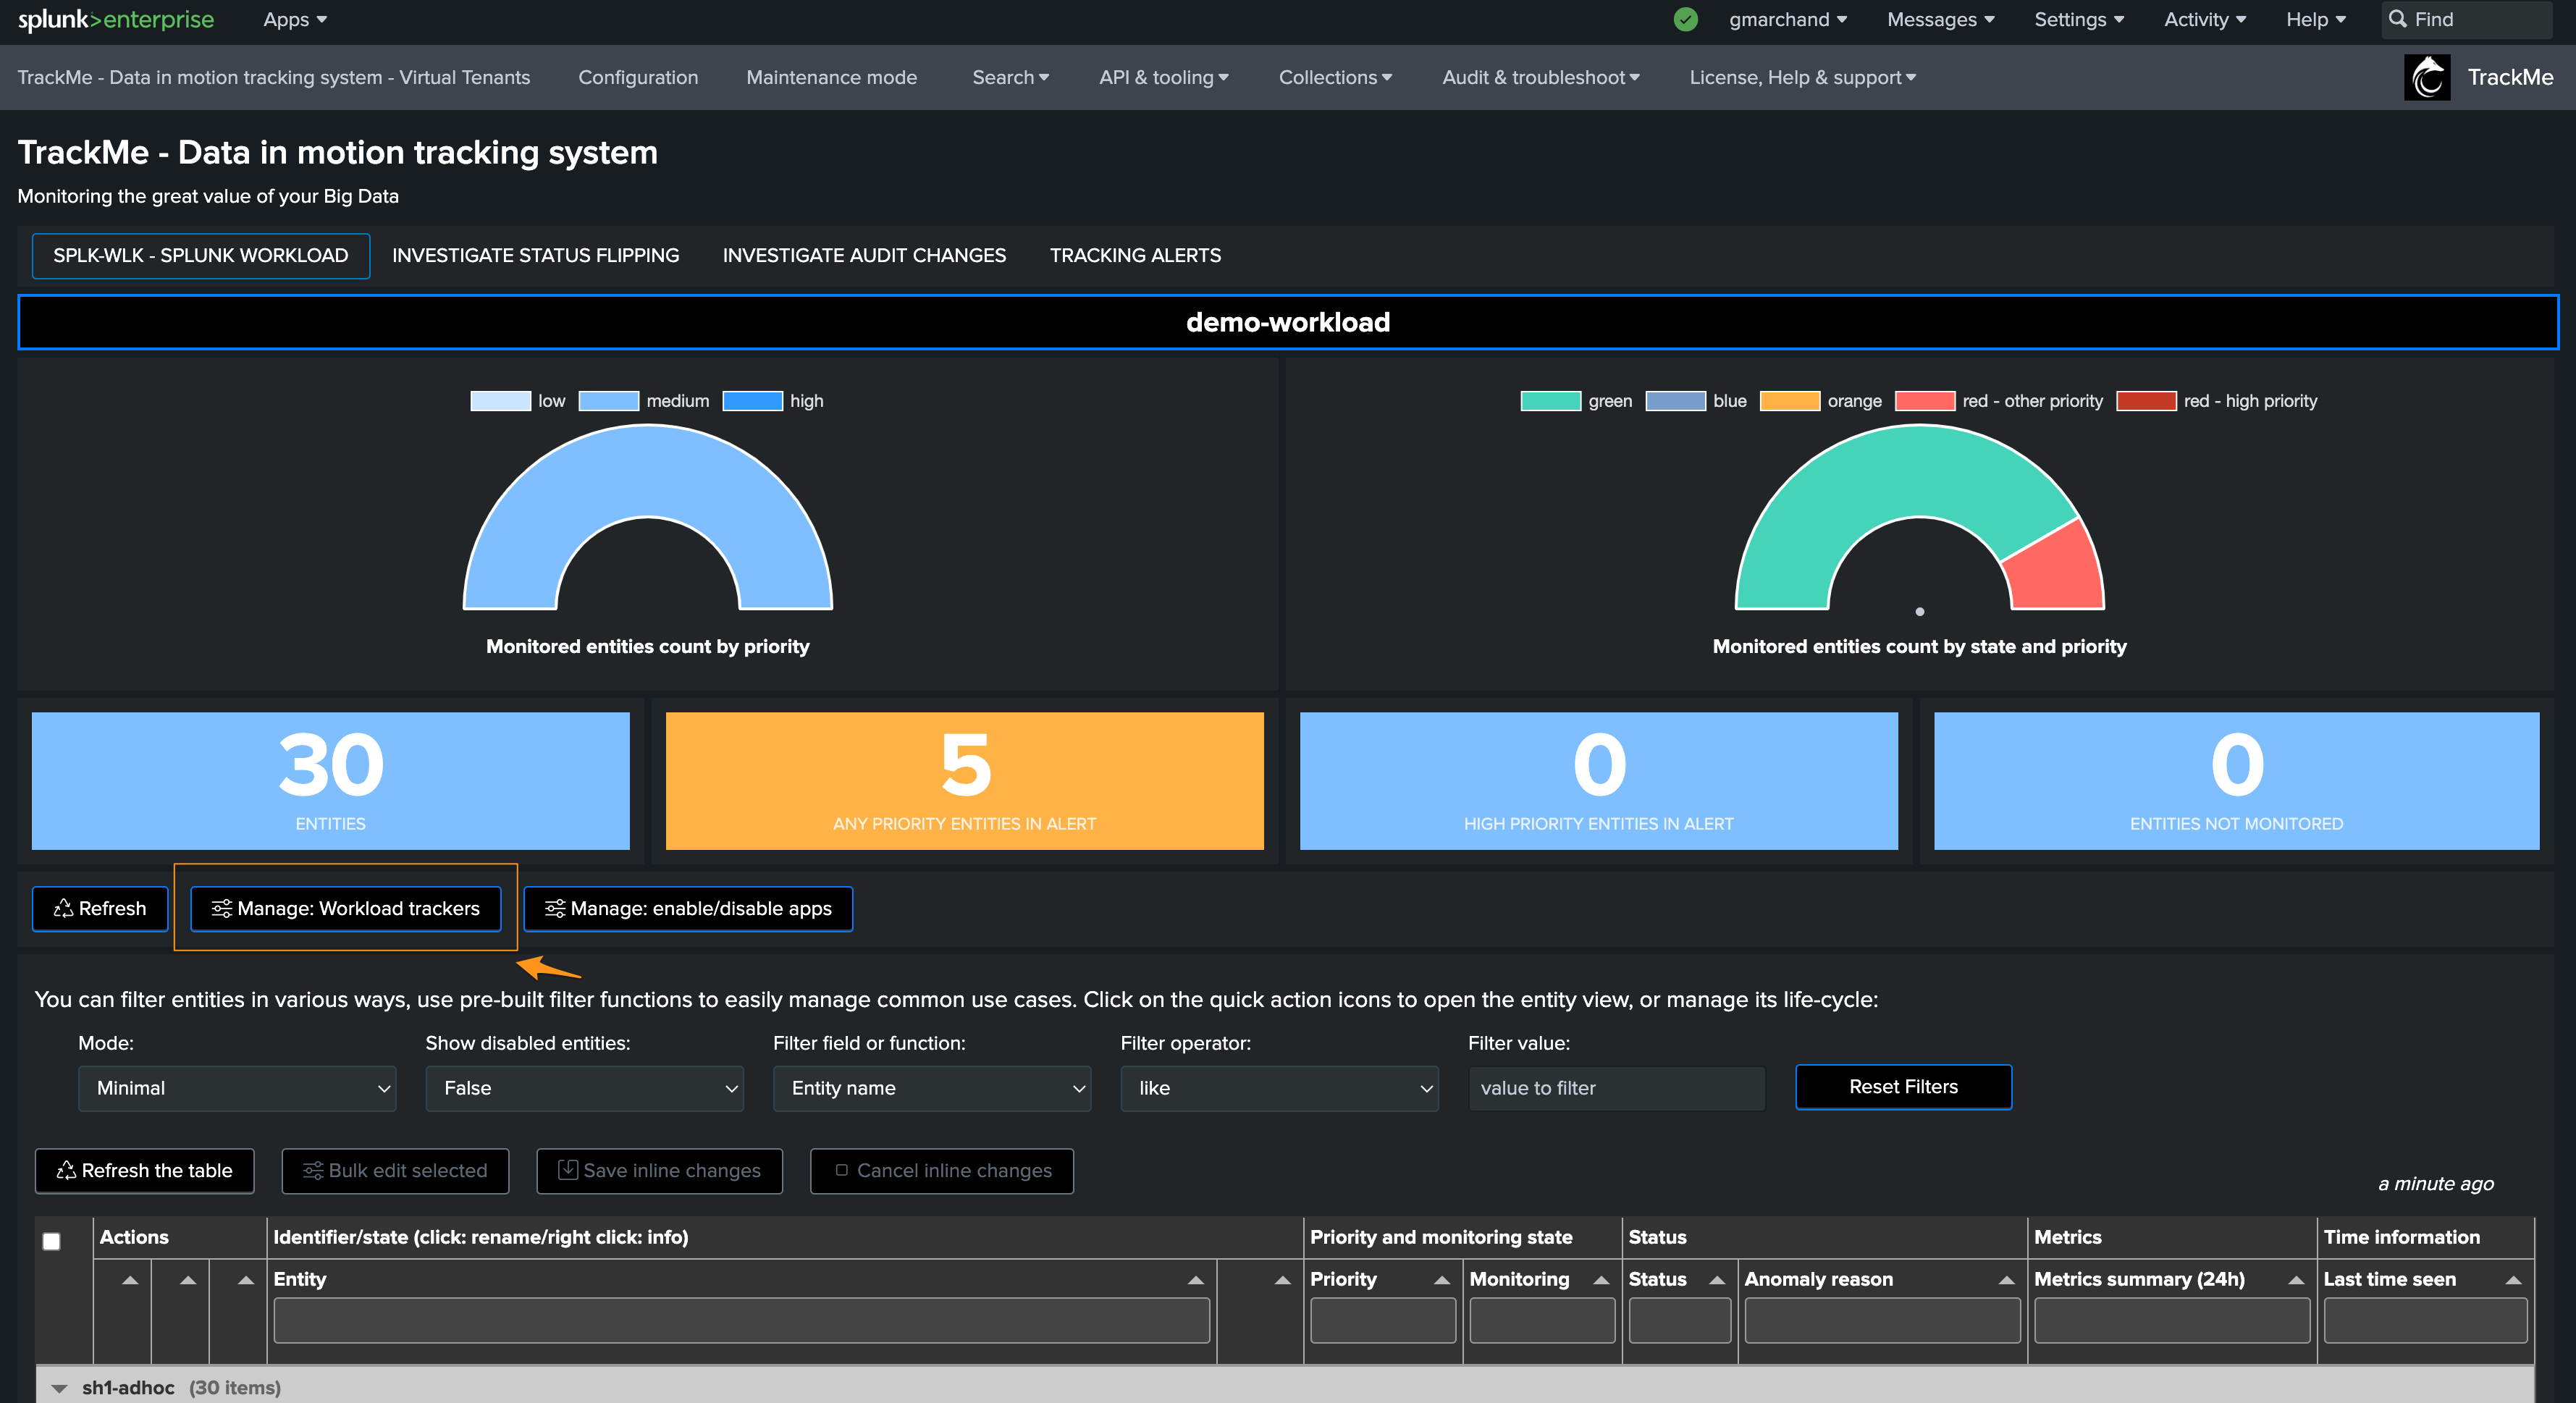
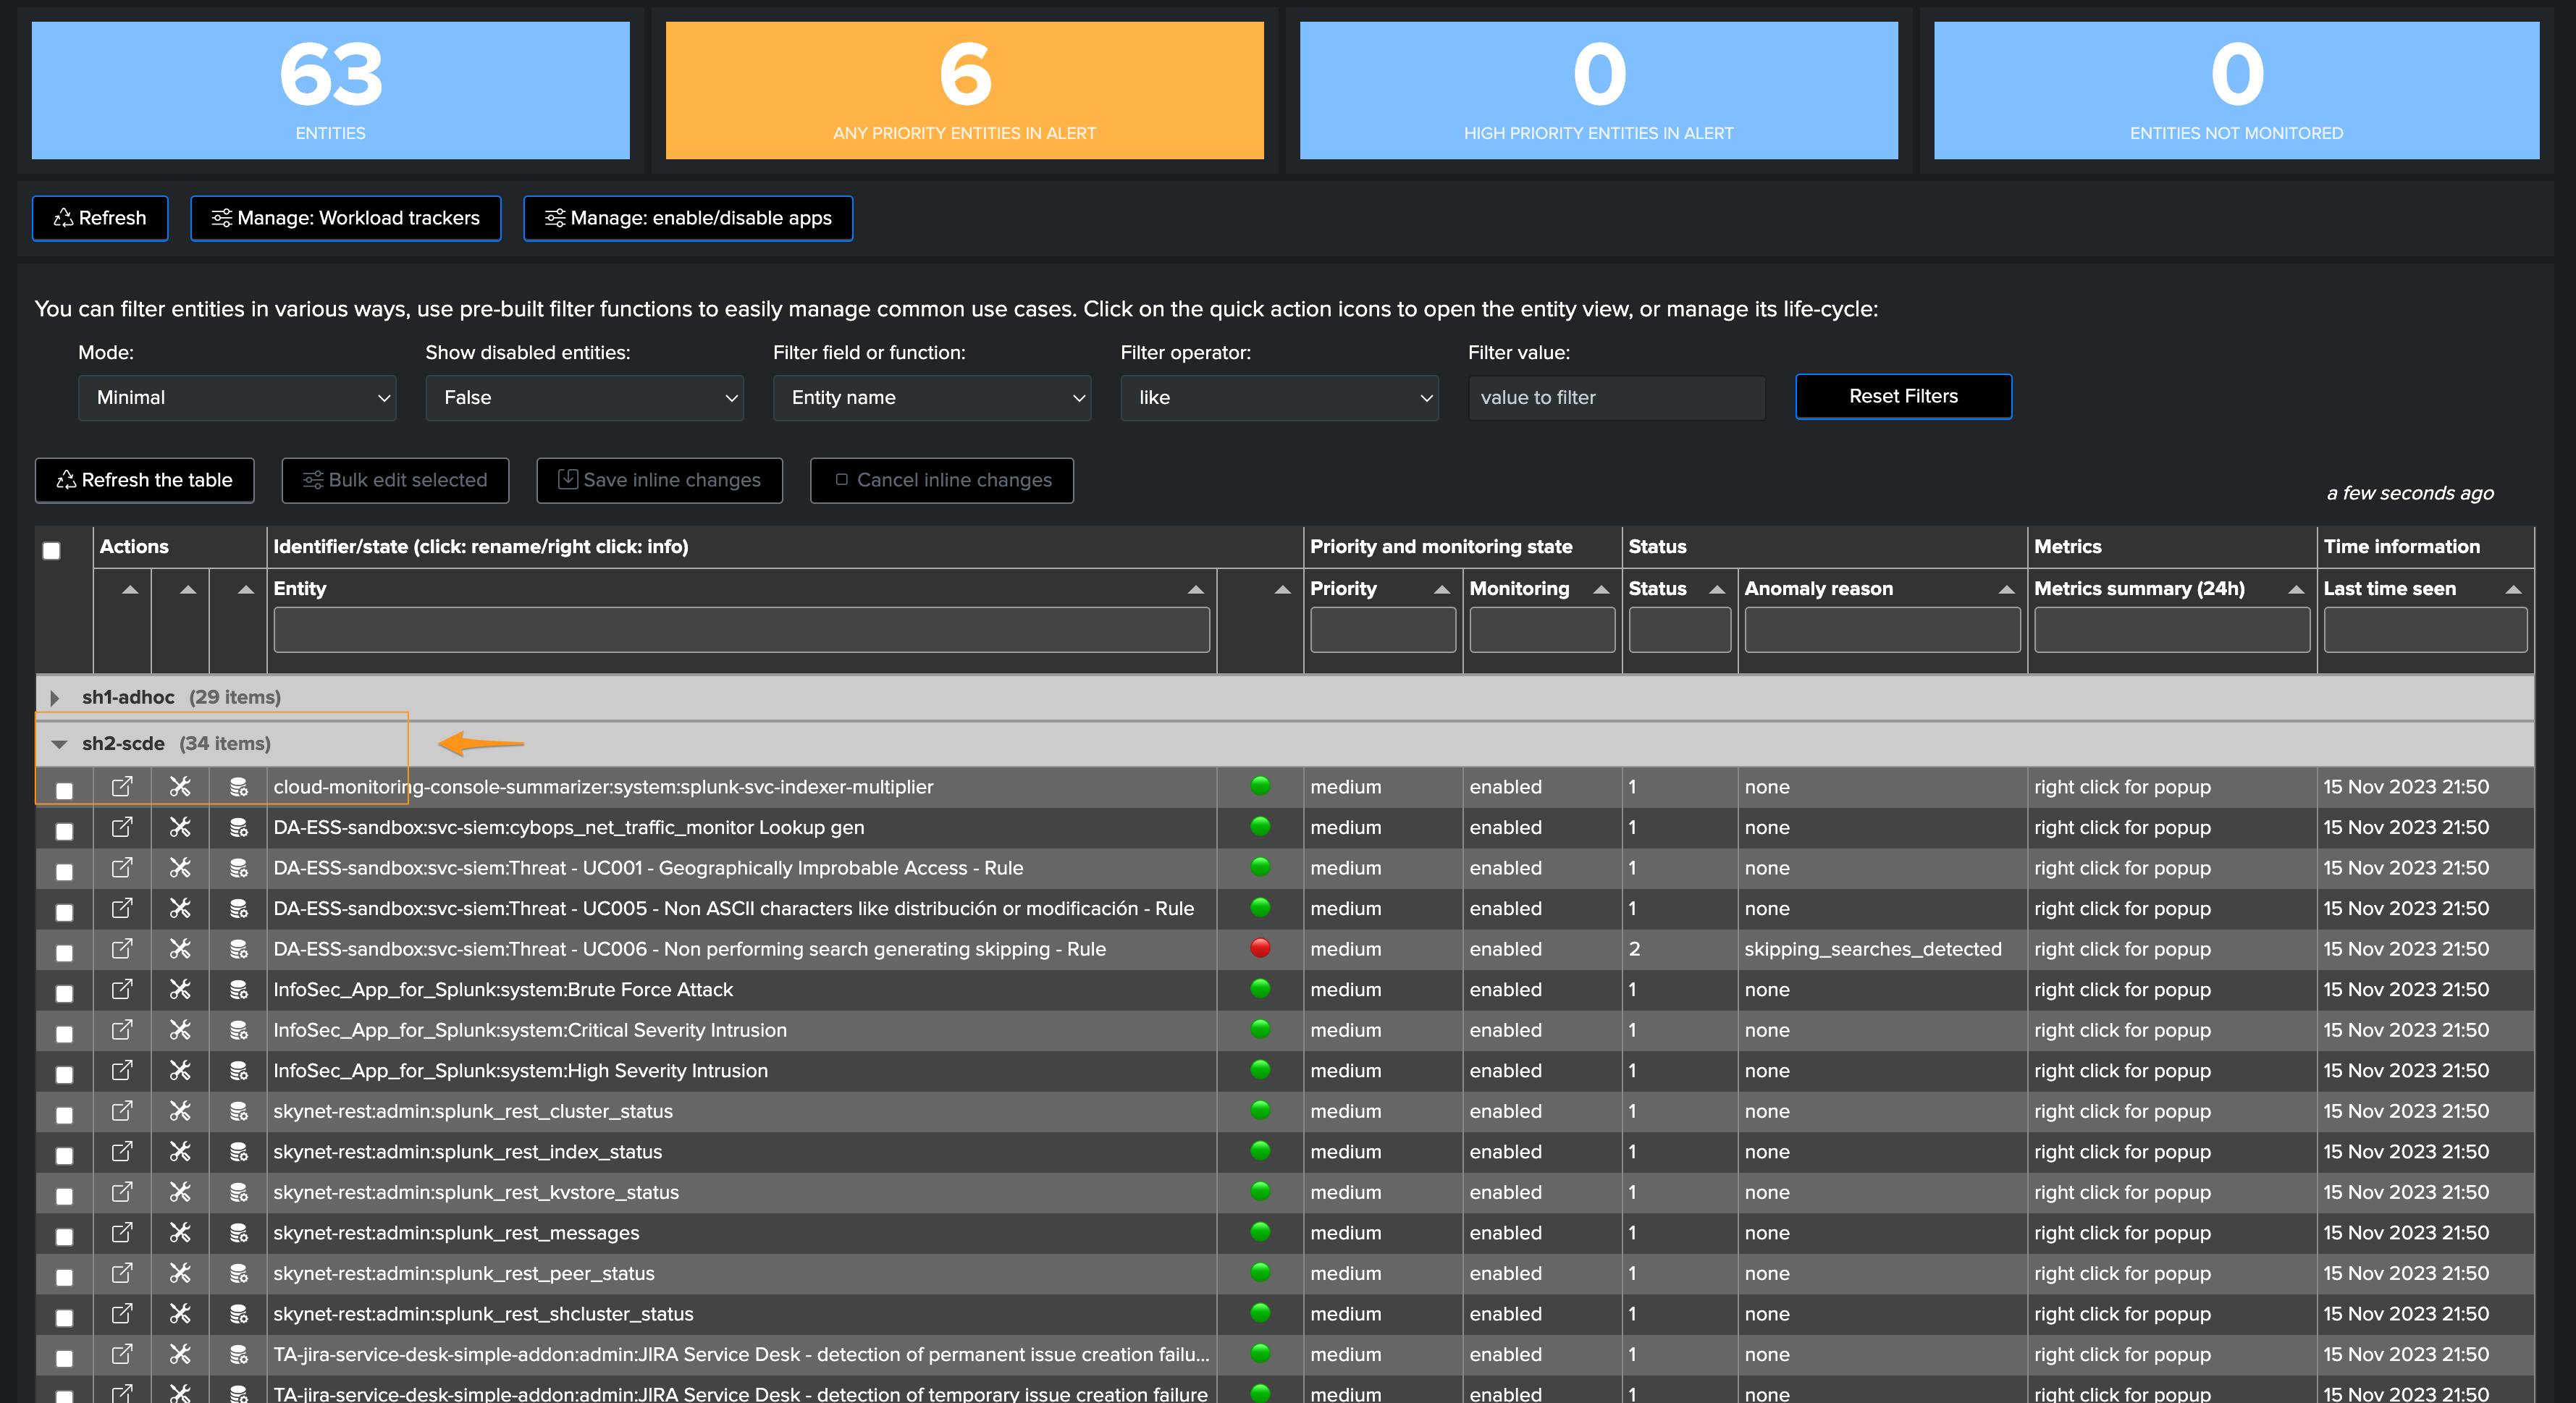
For instance, we will create trackers for a second Search Head tier targeting a remote account and will name the overgroup sh2-scde:
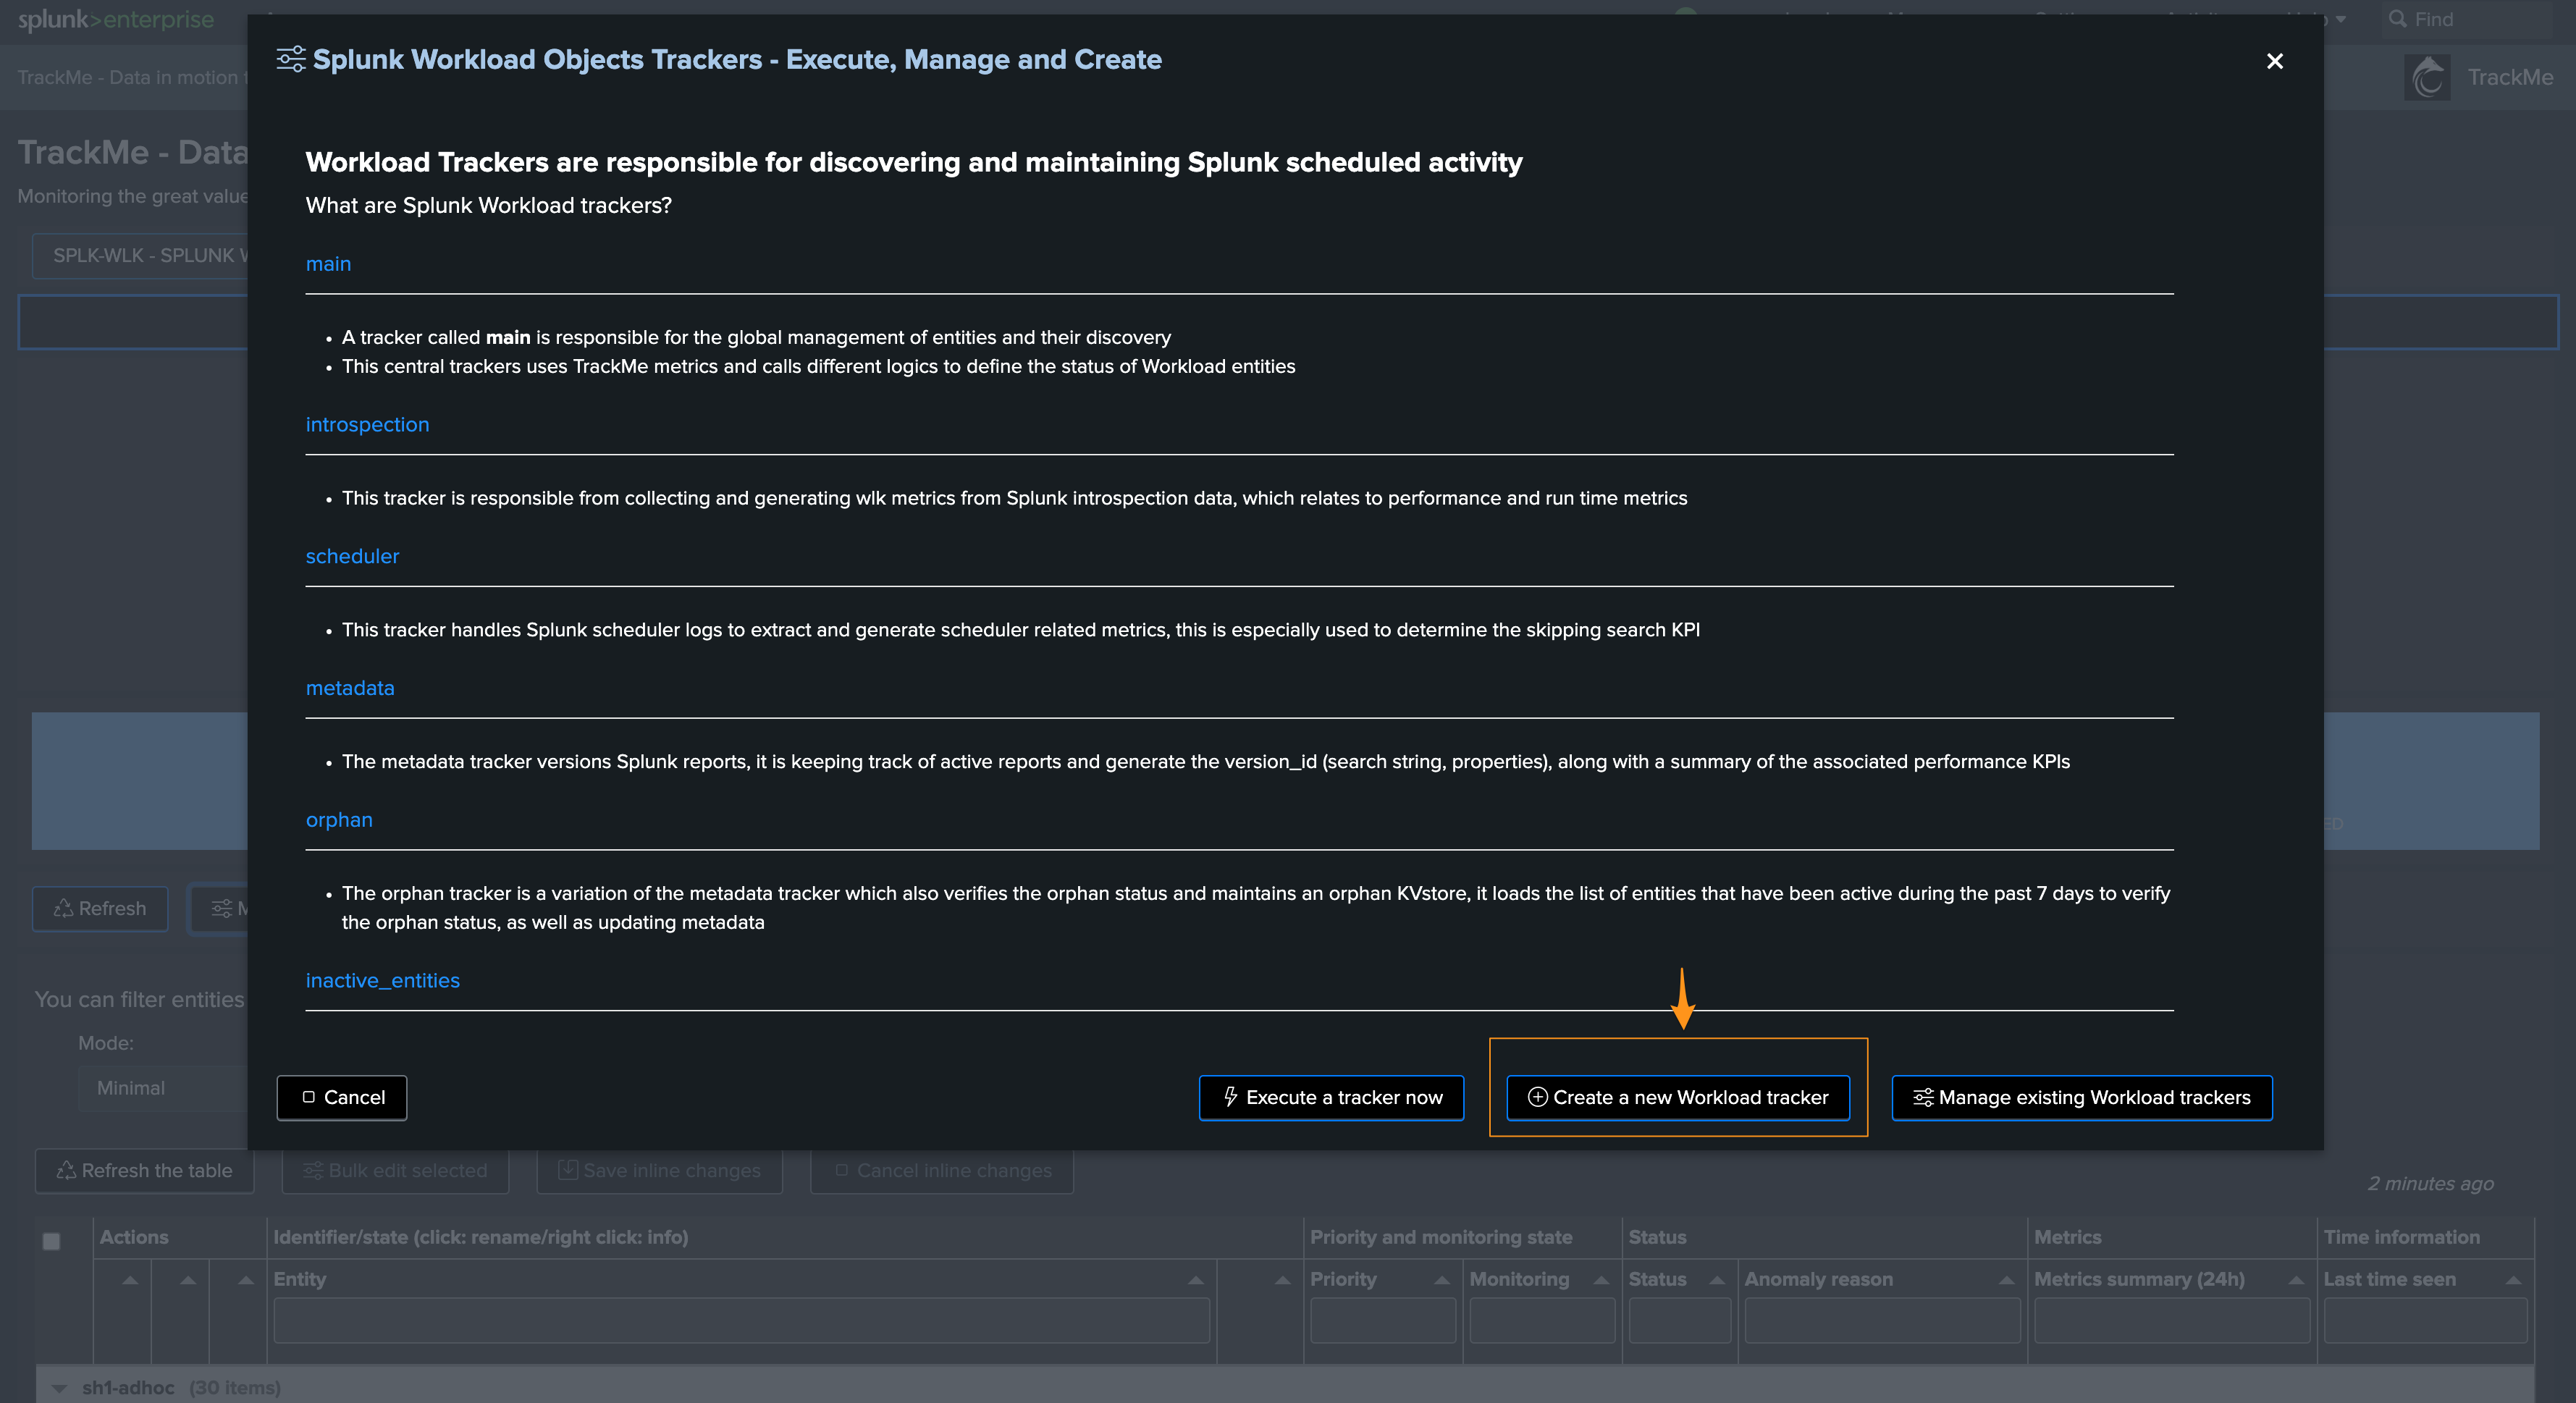
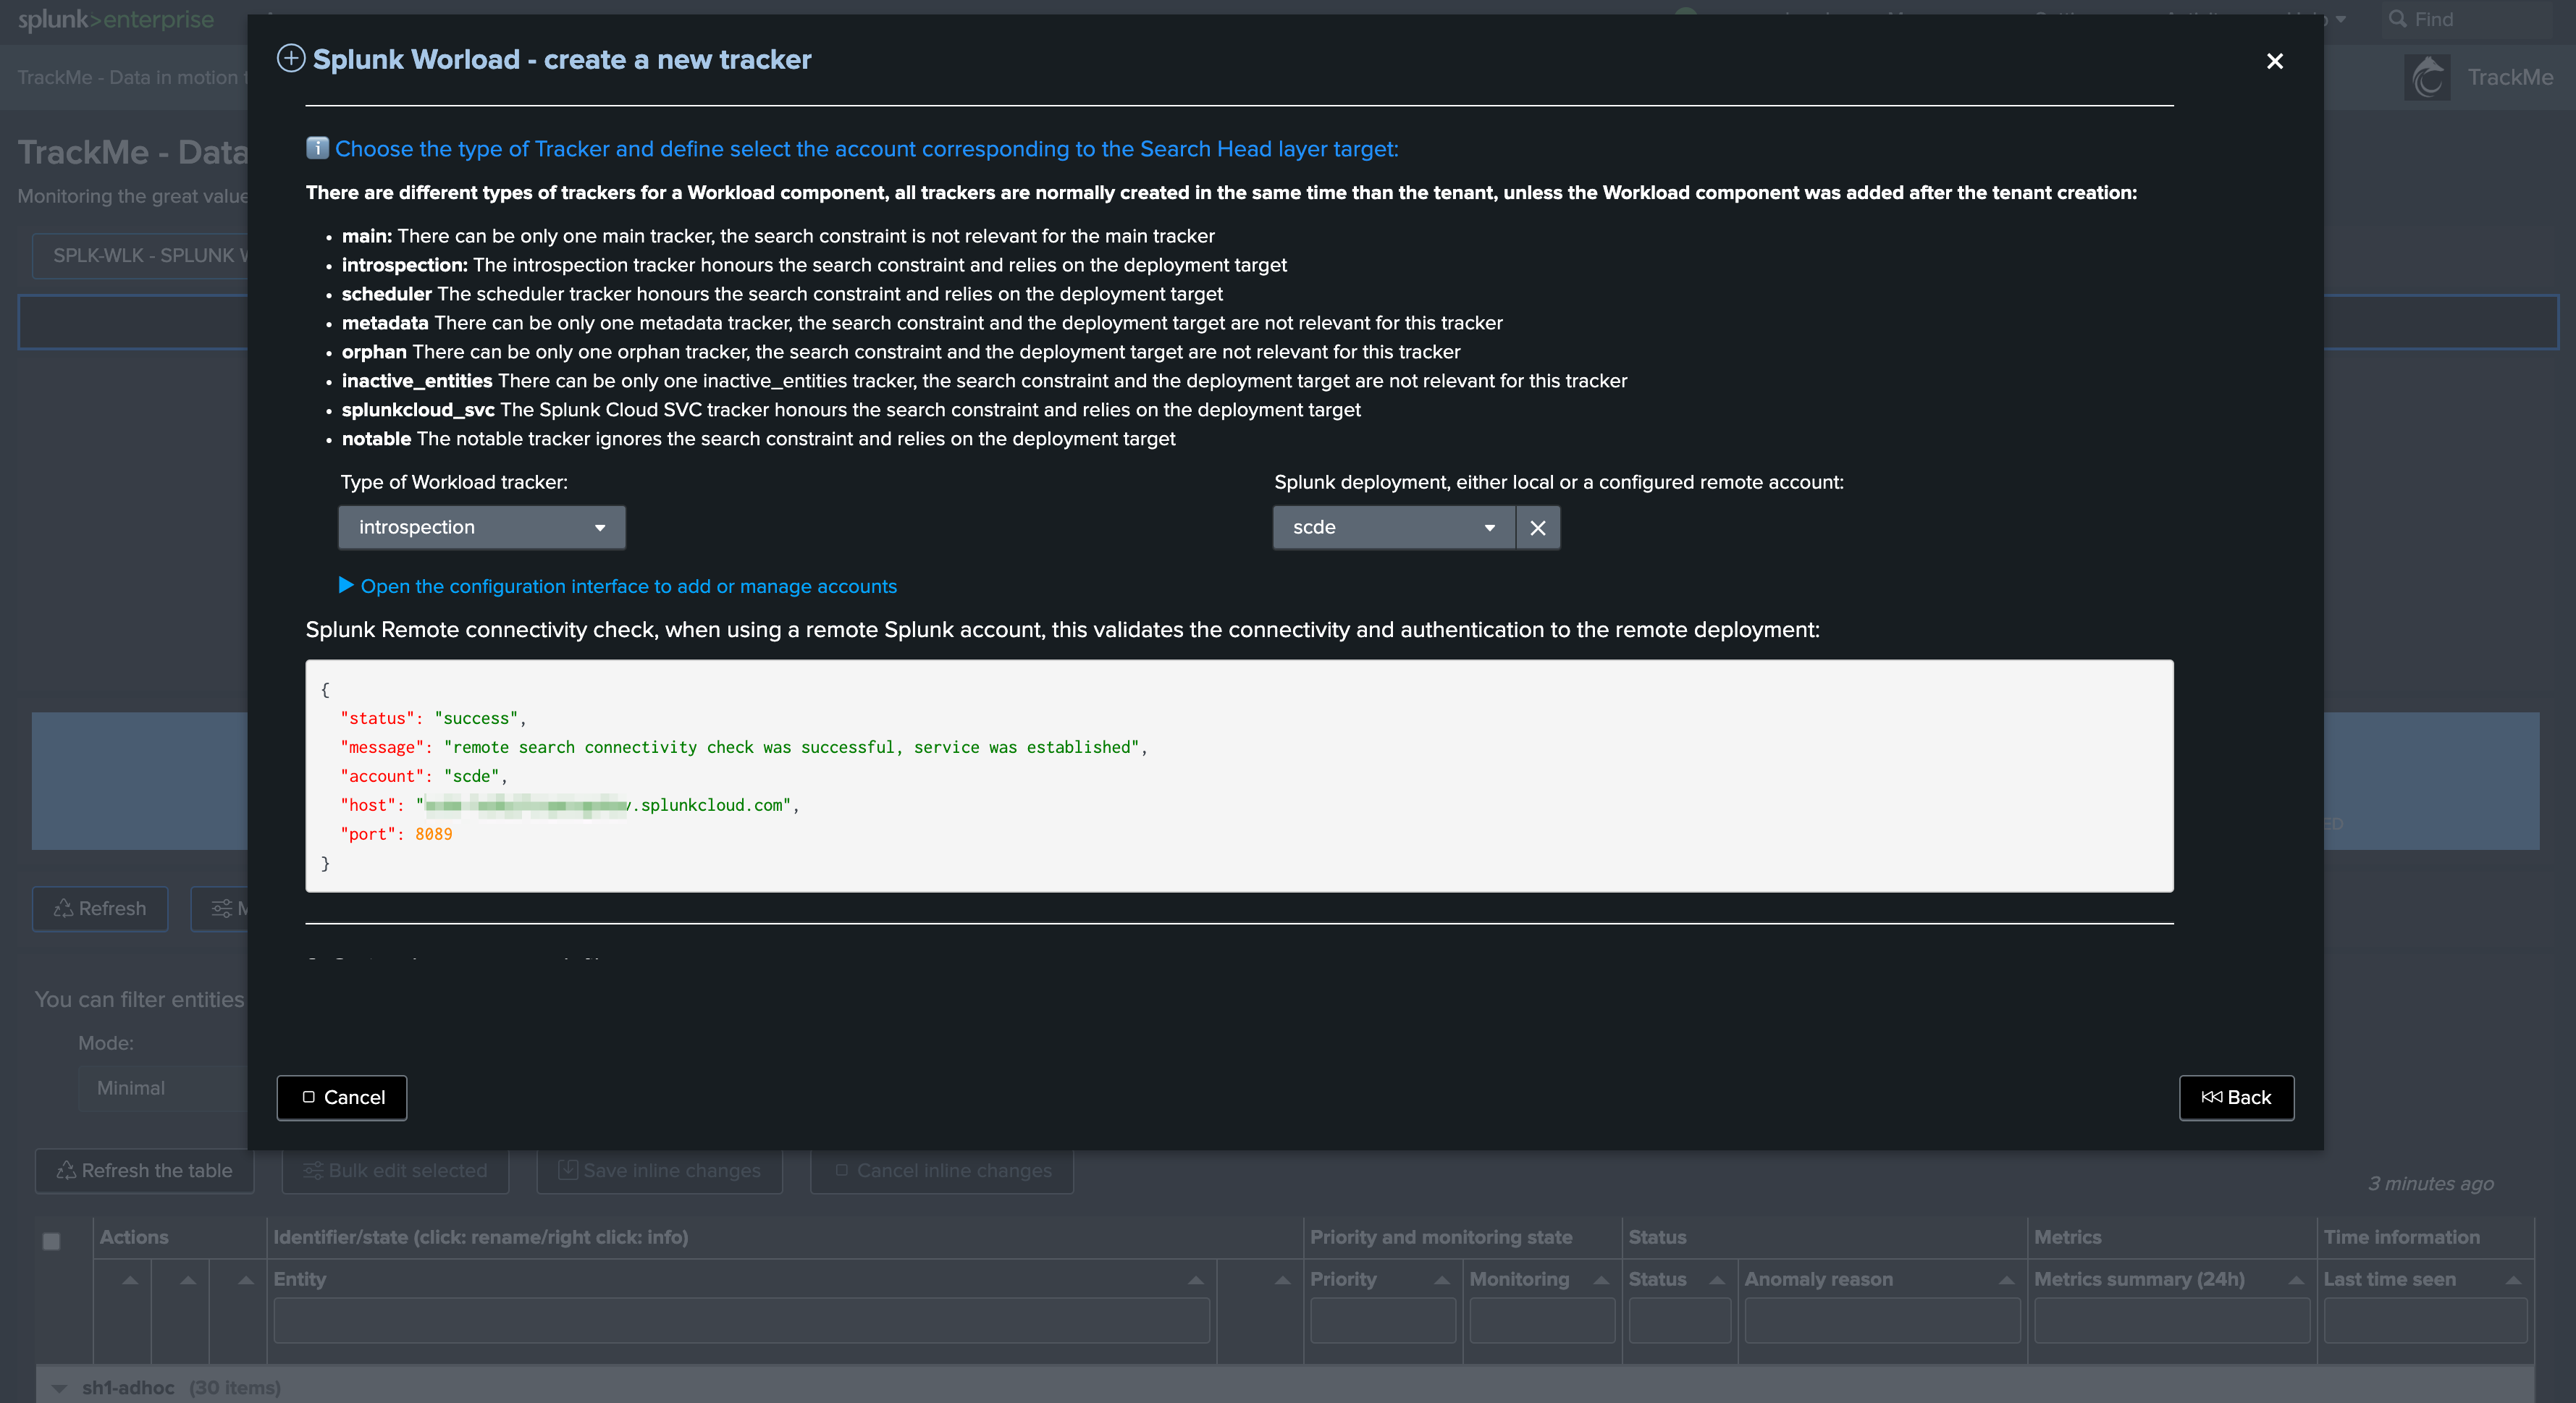
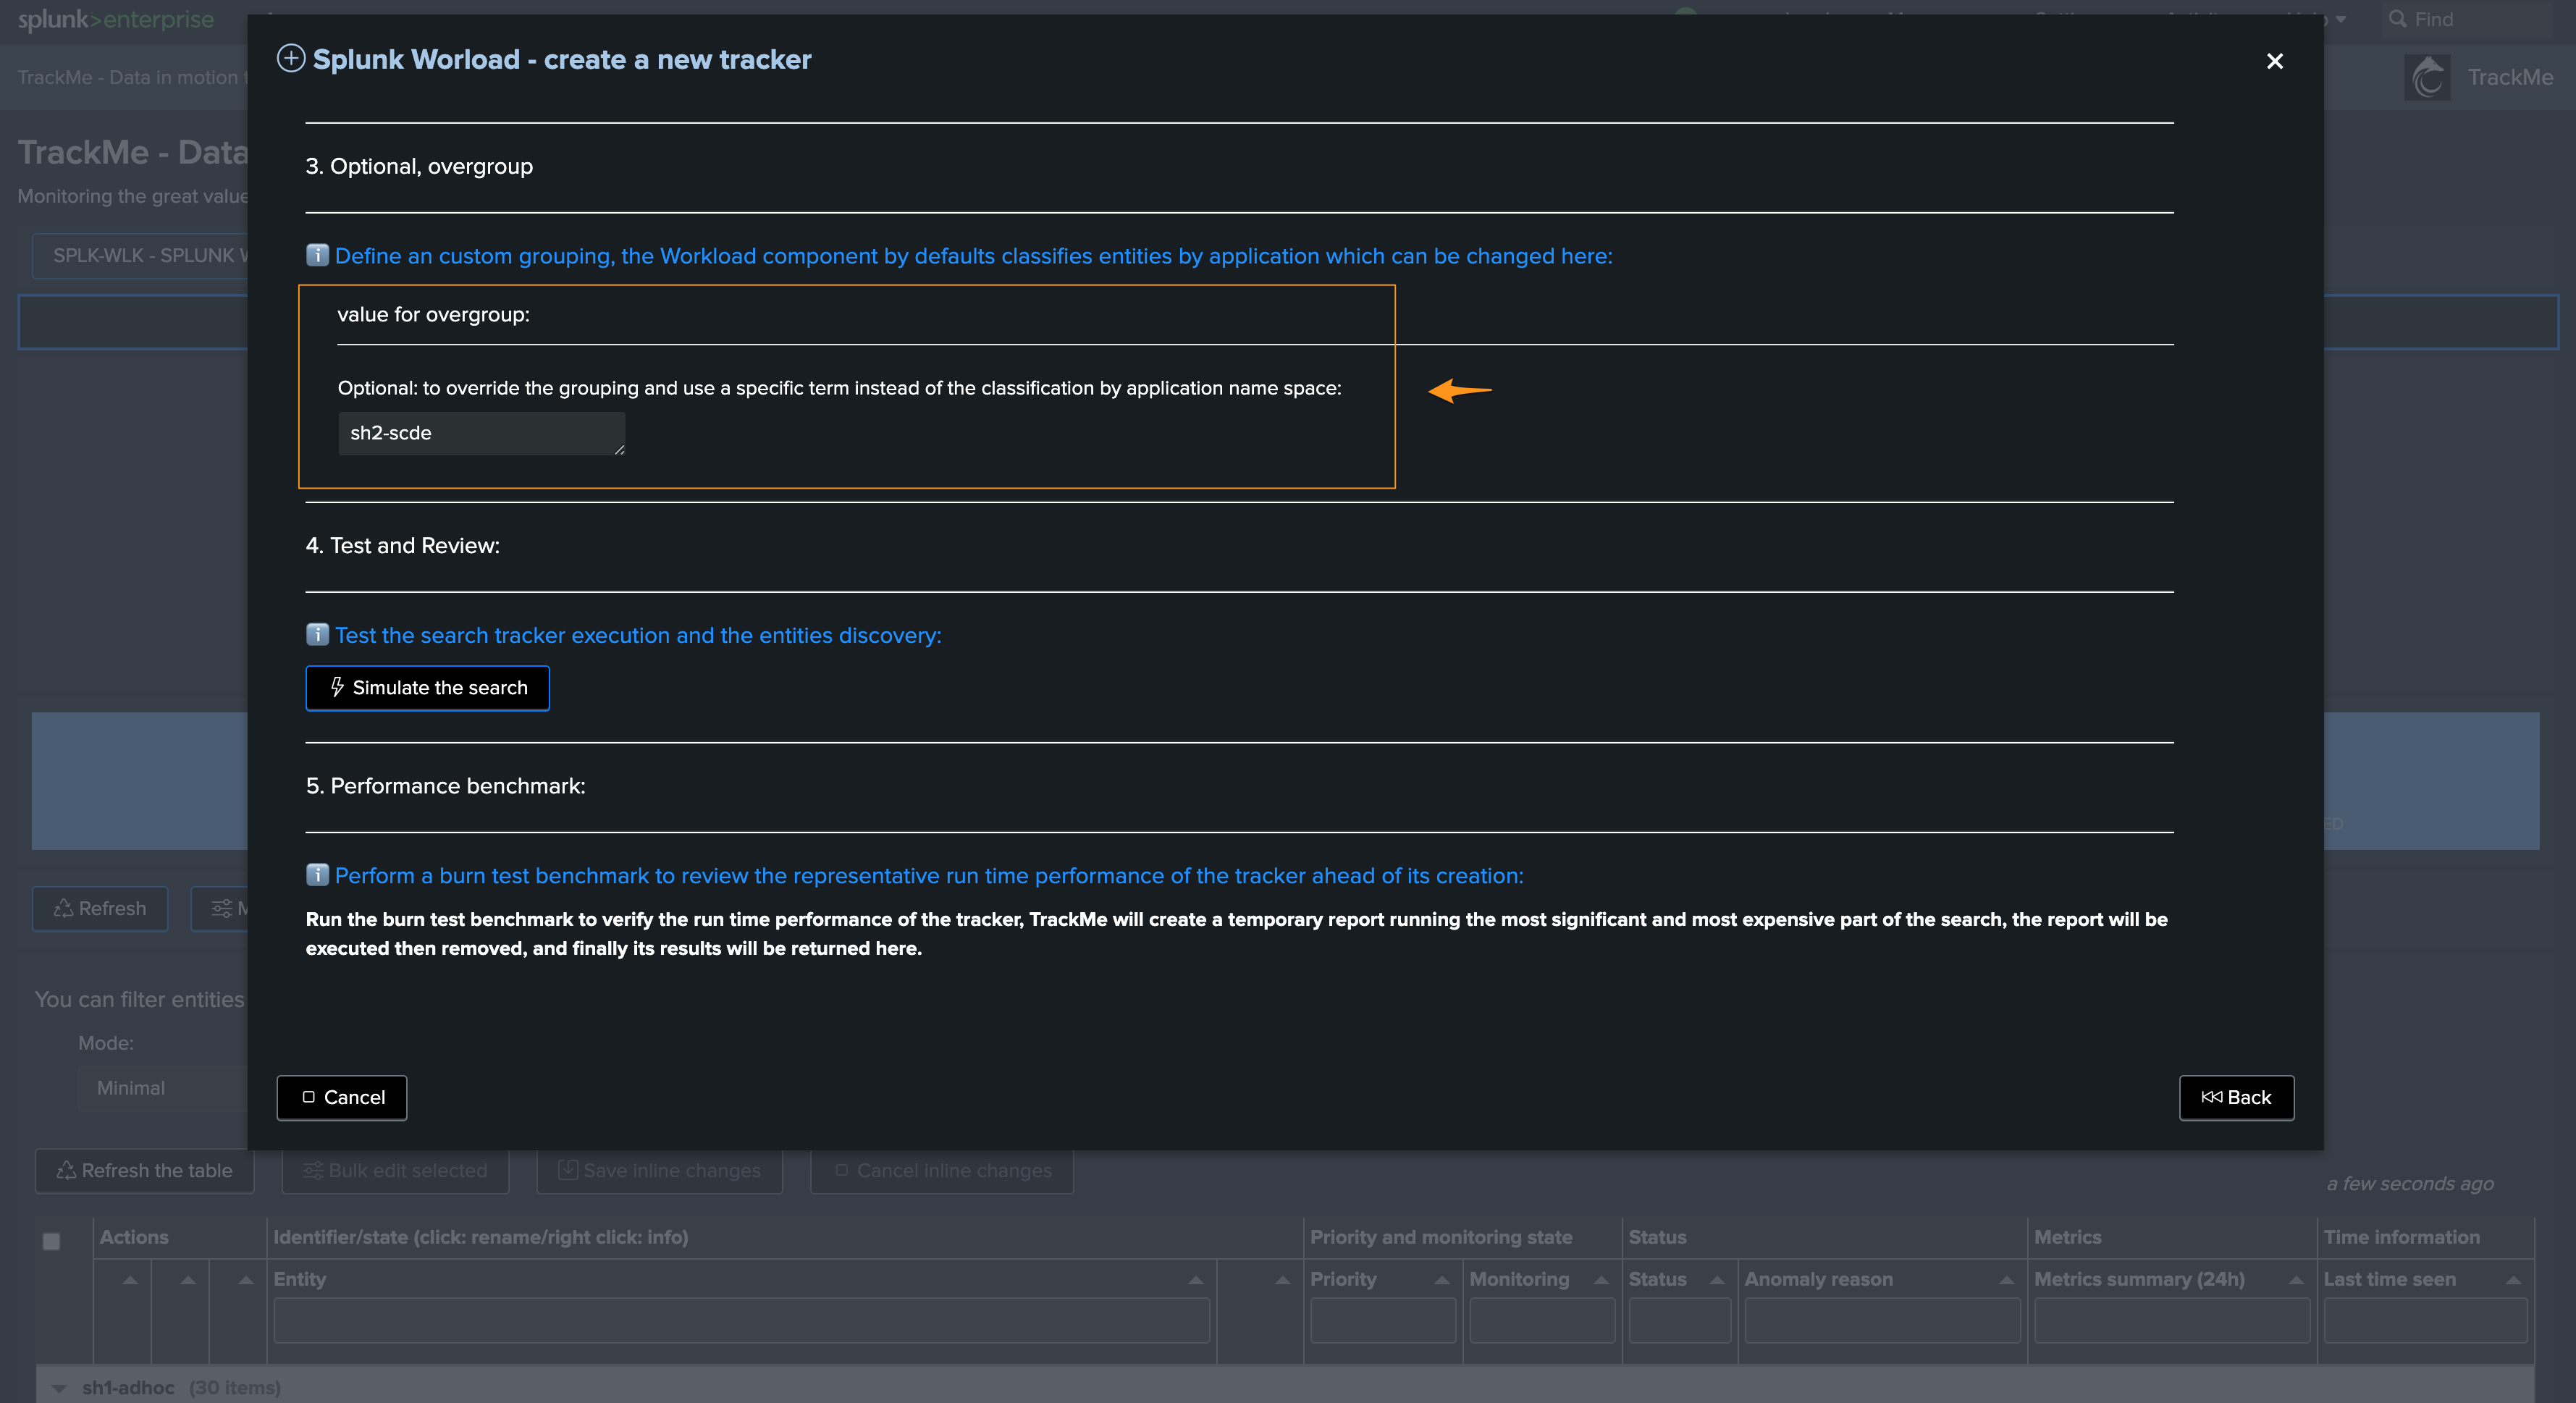
After 5/10 minutes, entities are now also created under the second overgroup as expected:
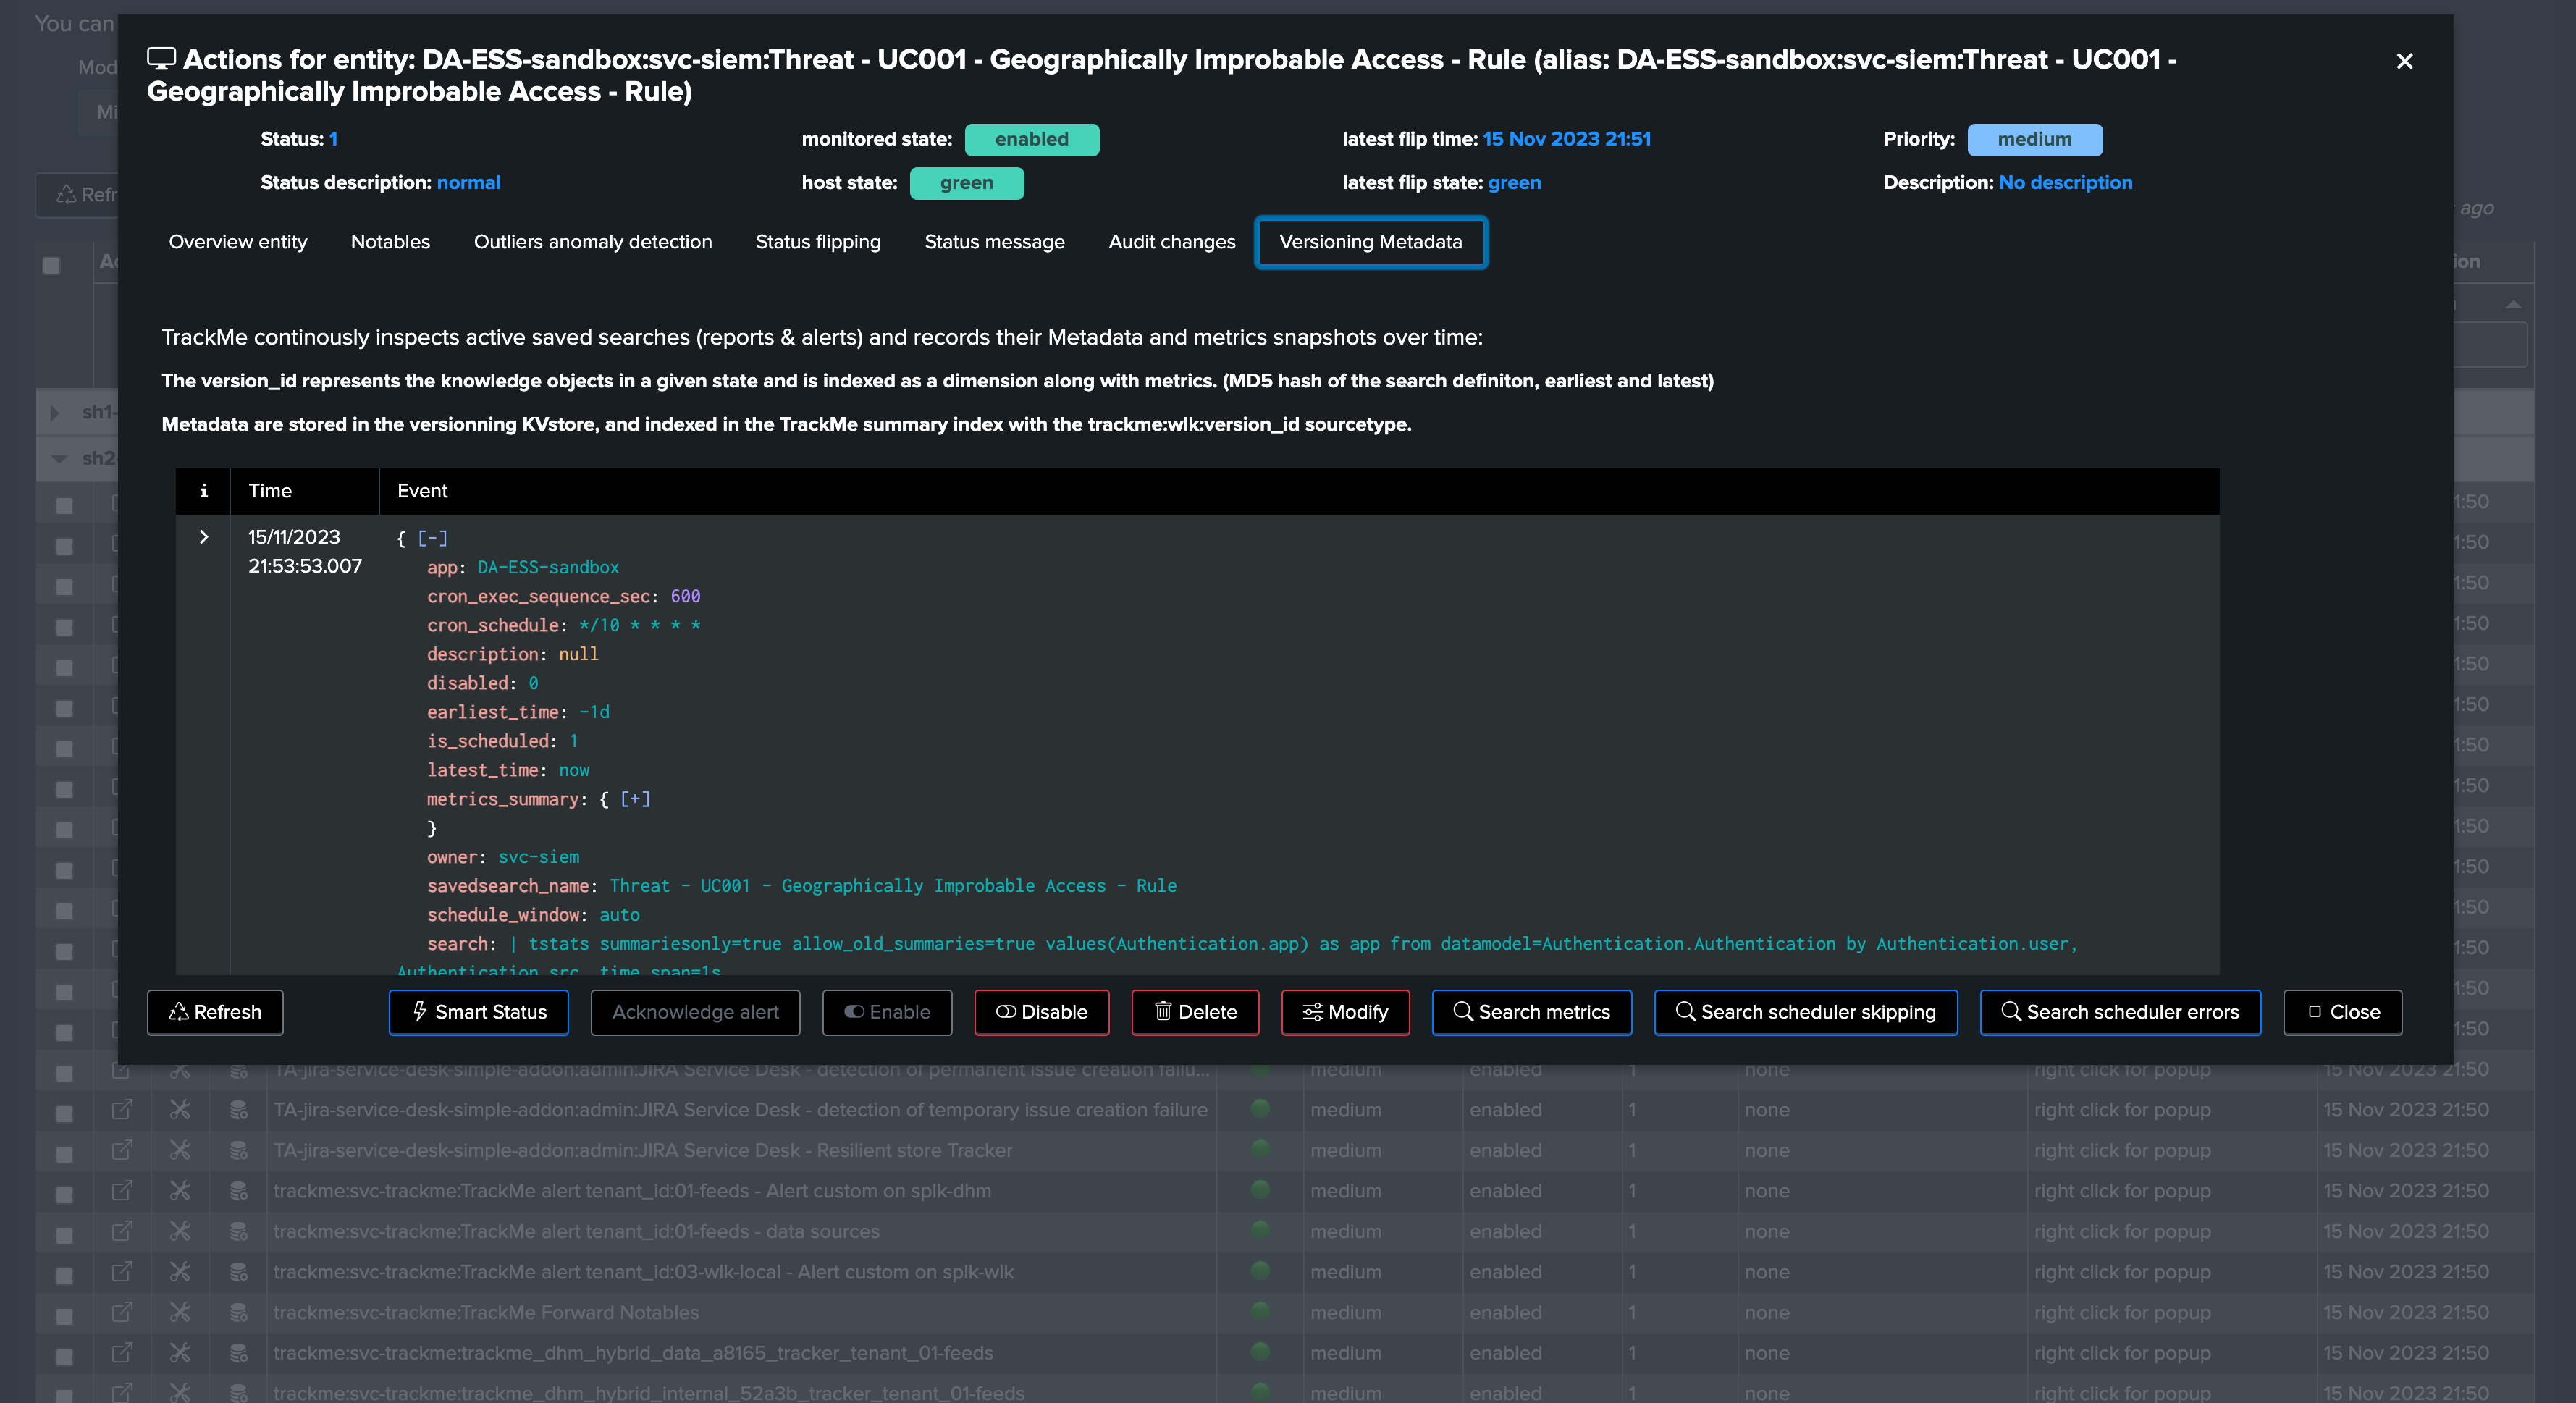
Metadata are managed transparently depending on their parent account, so TrackMe knows which Search Head tier to query for:
Workload monitoring — concepts & usage
The following material covers the Workload component from the user’s perspective — what it discovers, how to read its anomaly reasons, metrics and status messages, and the investigation workflow.
Note
TrackMe Workload component
This feature is part of TrackMe’s restricted features and allows tracking the key value activity and KPIs of your Splunk scheduling, from alerts to scheduled reports and Enterprise Security correlation searches.
We track and alert on sophisticated concepts such as the detection of execution anomalies or delayed execution, consumption behavior changes using Machine Learning as well as version control and changes in the searches themselves.
The TrackMe Workload component is extremely powerful and provides the missing deep visibility on your critical Splunk workflow, whether you are using Splunk for security or IT operations, or any other use case.
Hint
Evolutions in TrackMe 2.1.28
Since TrackMe 2.1.28, you can now control the list of parameters that are taken into account to calculate the version_id hash.
To do so, go in Configure / splk-general and update the
splk_general_workload_version_id_keysparameter.The default is to take into account the following parameters: search,dispatch.earliest,dispatch.latest,description,cron_schedule
1. Introduction
The objective of the Splunk Workload component for TrackMe is to continuously track the scheduling activity of a Splunk deployment, and perform key activity and detection:
Discover Splunk scheduled activity across the environment; an entity will be the association of the Splunk application namespace, the owner, and the search name
Track the scheduled activity behavior, and detect issues that can affect the well-being of Splunk scheduled reports and alerts
Track and identify the scheduled objects’ Metadata, such as their definition, to investigate and detect changes impacting searches’ behaviors over time
Generate consistent and key value metrics from Splunk introspection, scheduler and SVC usage for Splunk Cloud customers
Use Machine Learning Outliers detection to track for abnormal behaviors and changes, such as an abnormal increase in costs, run time or consumption
Alert when scheduled reports and alerts are affected by issues, and get benefit from the full set of TrackMe’s features and workflow to handle the lifecycle of Splunk scheduled activity
The TrackMe Workload component, associated with TrackMe’s unique workflow, is a game-changing companion for Splunk, allowing it to quickly detect and alert on Splunk’s most critical activity, as well as providing the keys to understand scheduled related costs like never before.
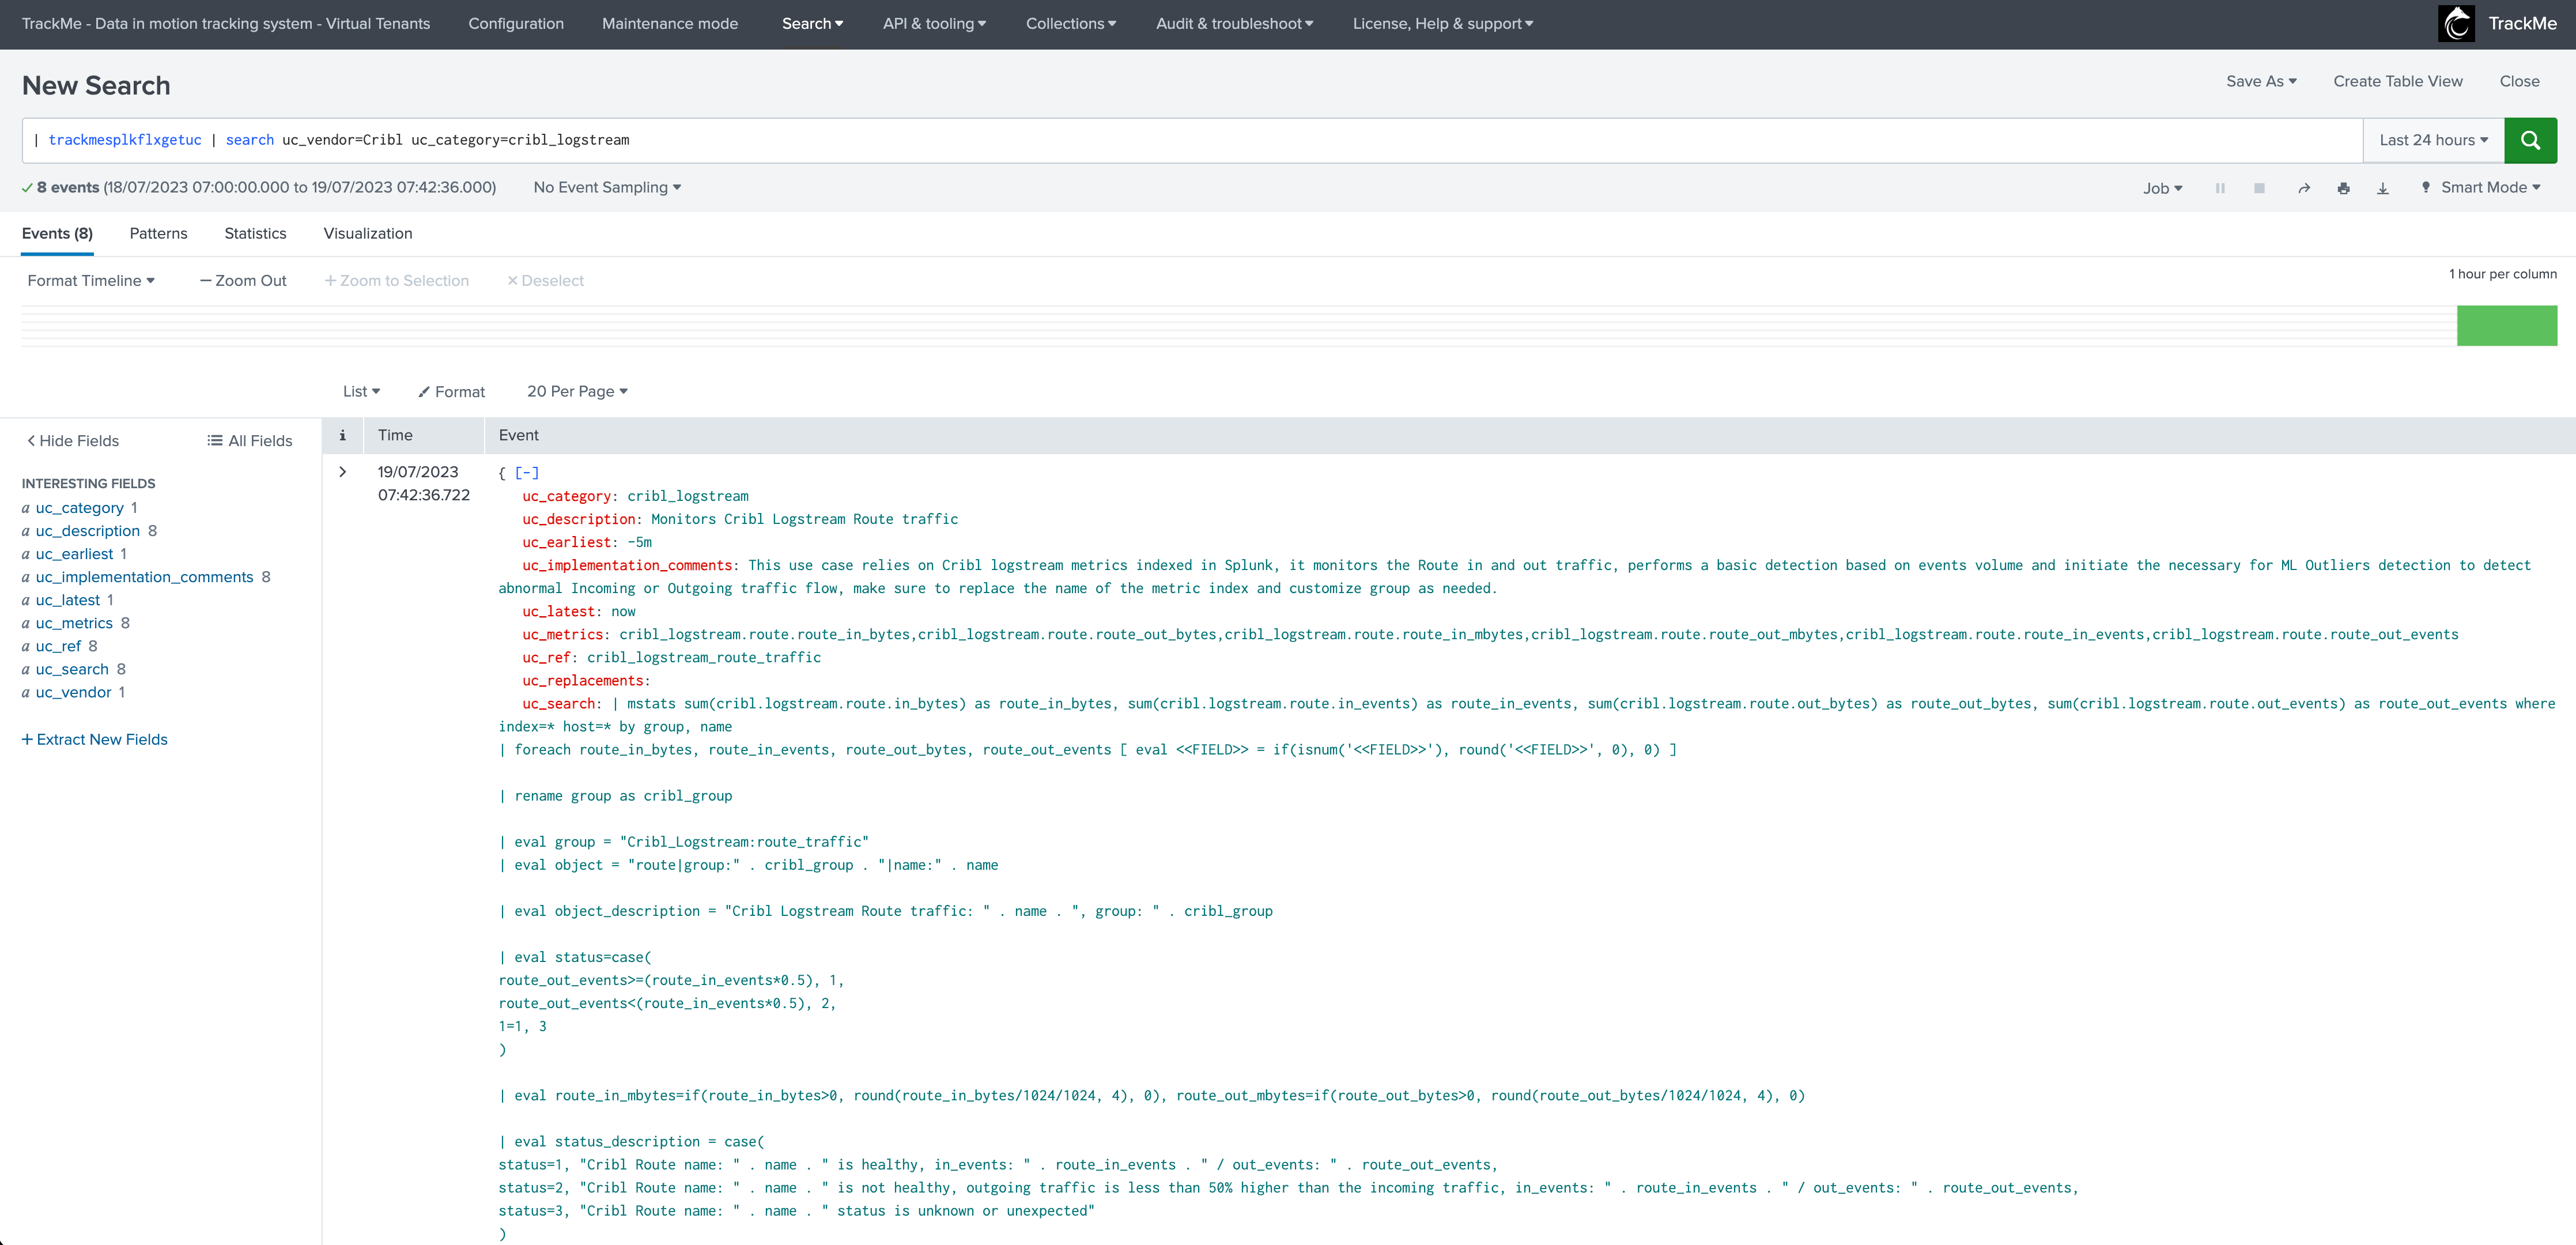
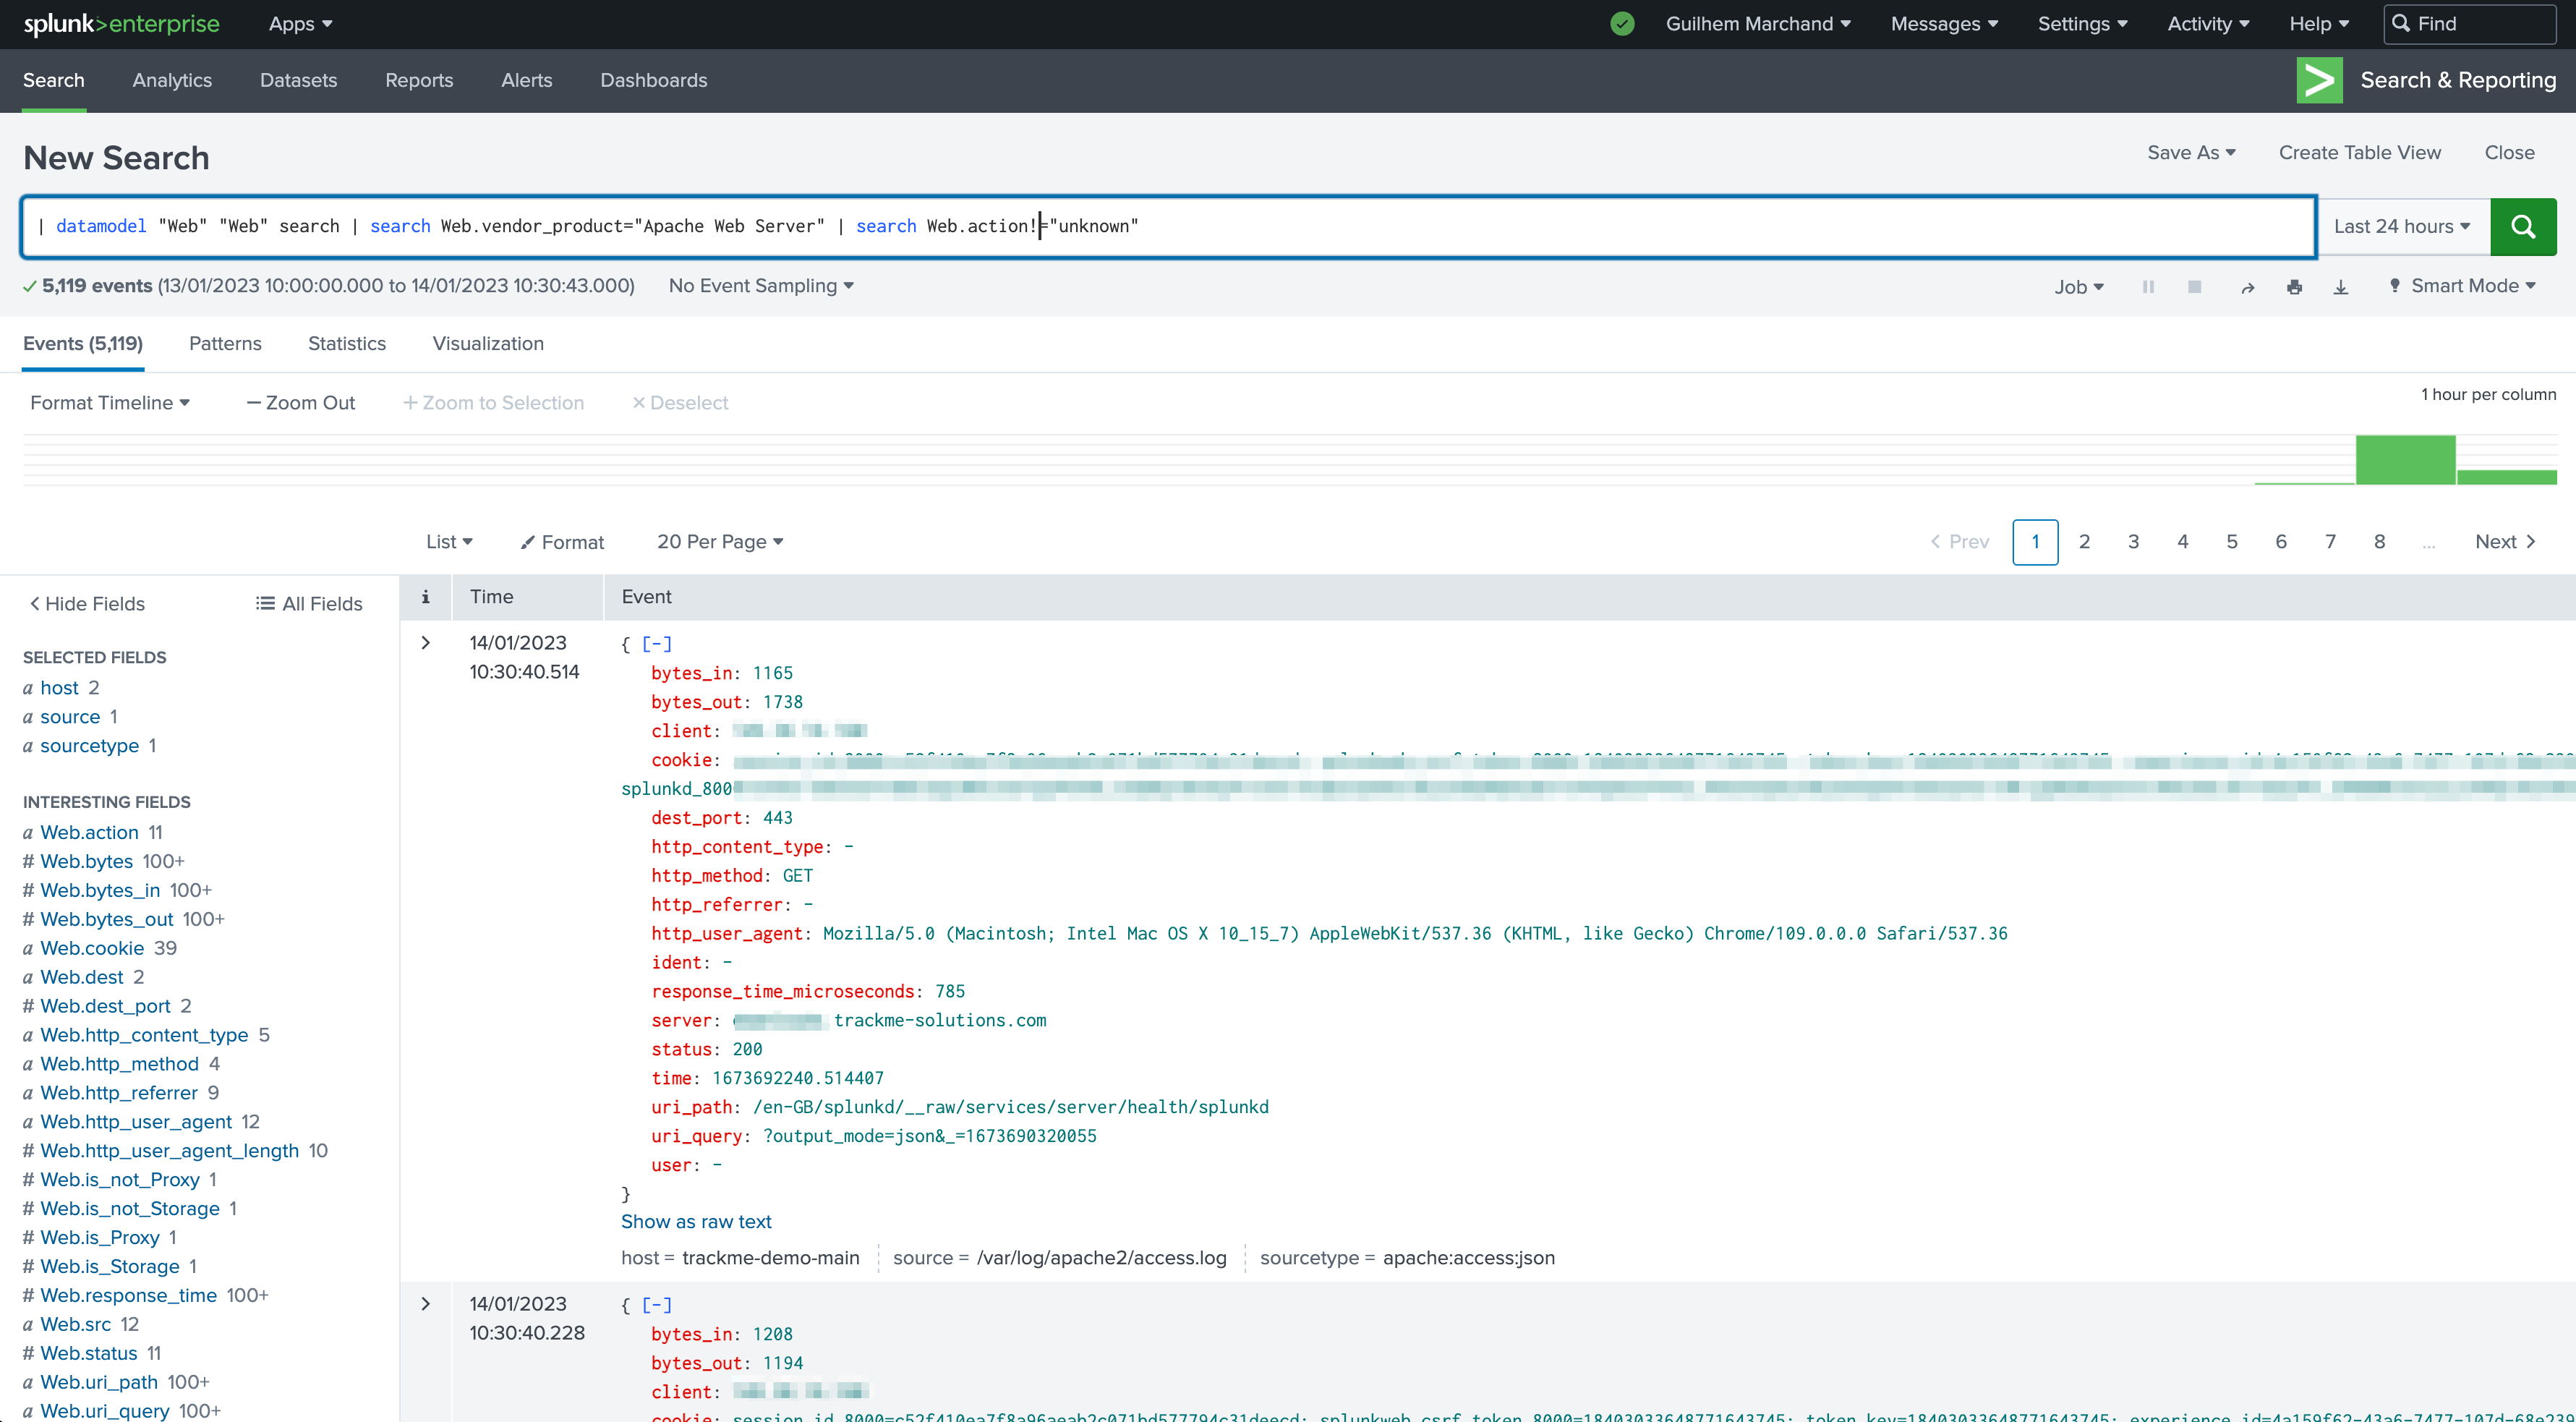
Note
Grouping in the Workload component: group and overgroup
By default, the Workload component groups entities by
appwhich represents the Splunk application namespace hosting the scheduled report or alert.When creating the tenant and also later on when creating trackers manually, since TrackMe 2.0.70, you can optionnally override this behaviour by setting up an
overgroupvalue.By doing so, the Workload will group entities based on a custom term instead of applications, this can be useful if for instance you want to have multiple Search Head tiers in the same tenant.
Refer to the Creating a Workload tenant to host multiple Search Head tiers with overgroup section for more information.
2. Workload entities
Once a Workload TrackMe Virtual Tenant has been configured, TrackMe starts to track for any scheduled activity and will create and maintain associated entities:
An entity name is composed of:
app+ “:” +owner+ “:” + savedsearch name
Should any of this information change, TrackMe will consider this as a new entity to be created and maintained, for instead of a search reassignment, if the search is moved between different application name spaces, or if the search knowledge object identifier is changed.
3. Anomaly reason
3.1 Anomaly reason definition
TrackMe considers each entity individually, and will trigger a status change based on the following criteria:
Anomaly Reason |
Conditions |
|---|---|
none |
The entity is green and is healthy, there are no issues detected currently |
skipping_searches_detected |
TrackMe detected skipping executions for that scheduled, by default orange<5% and red>5% |
orphan_search_detected |
A previously active scheduled search is now orphaned, which means the owner is not valid any longer and the search cannot be executed |
execution_errors_detected |
Execution errors are detected and the scheduled report/alert is not working properly |
anomaly_outliers_detected |
The Machine Learning outliers engine detected issues in one or more active ML models, this can be for instance an abnormal increase in the schedule runtime |
execution_delayed |
TrackMe uses the Metadata and the cron schedule translation to monitor if the search is delayed compared to its expected schedule (with 5 min of grace time by default) |
status_not_met |
The status of the entity is red, for unclassified reason |
out_of_monitoring_window |
The status of the entity is not healthy, however the current period is out of the monitoring window set for this entity |
3.2 Checking the Anomaly Reason
You can observe the current anomaly reason in different locations:
In the table column called “Anomaly Reason”
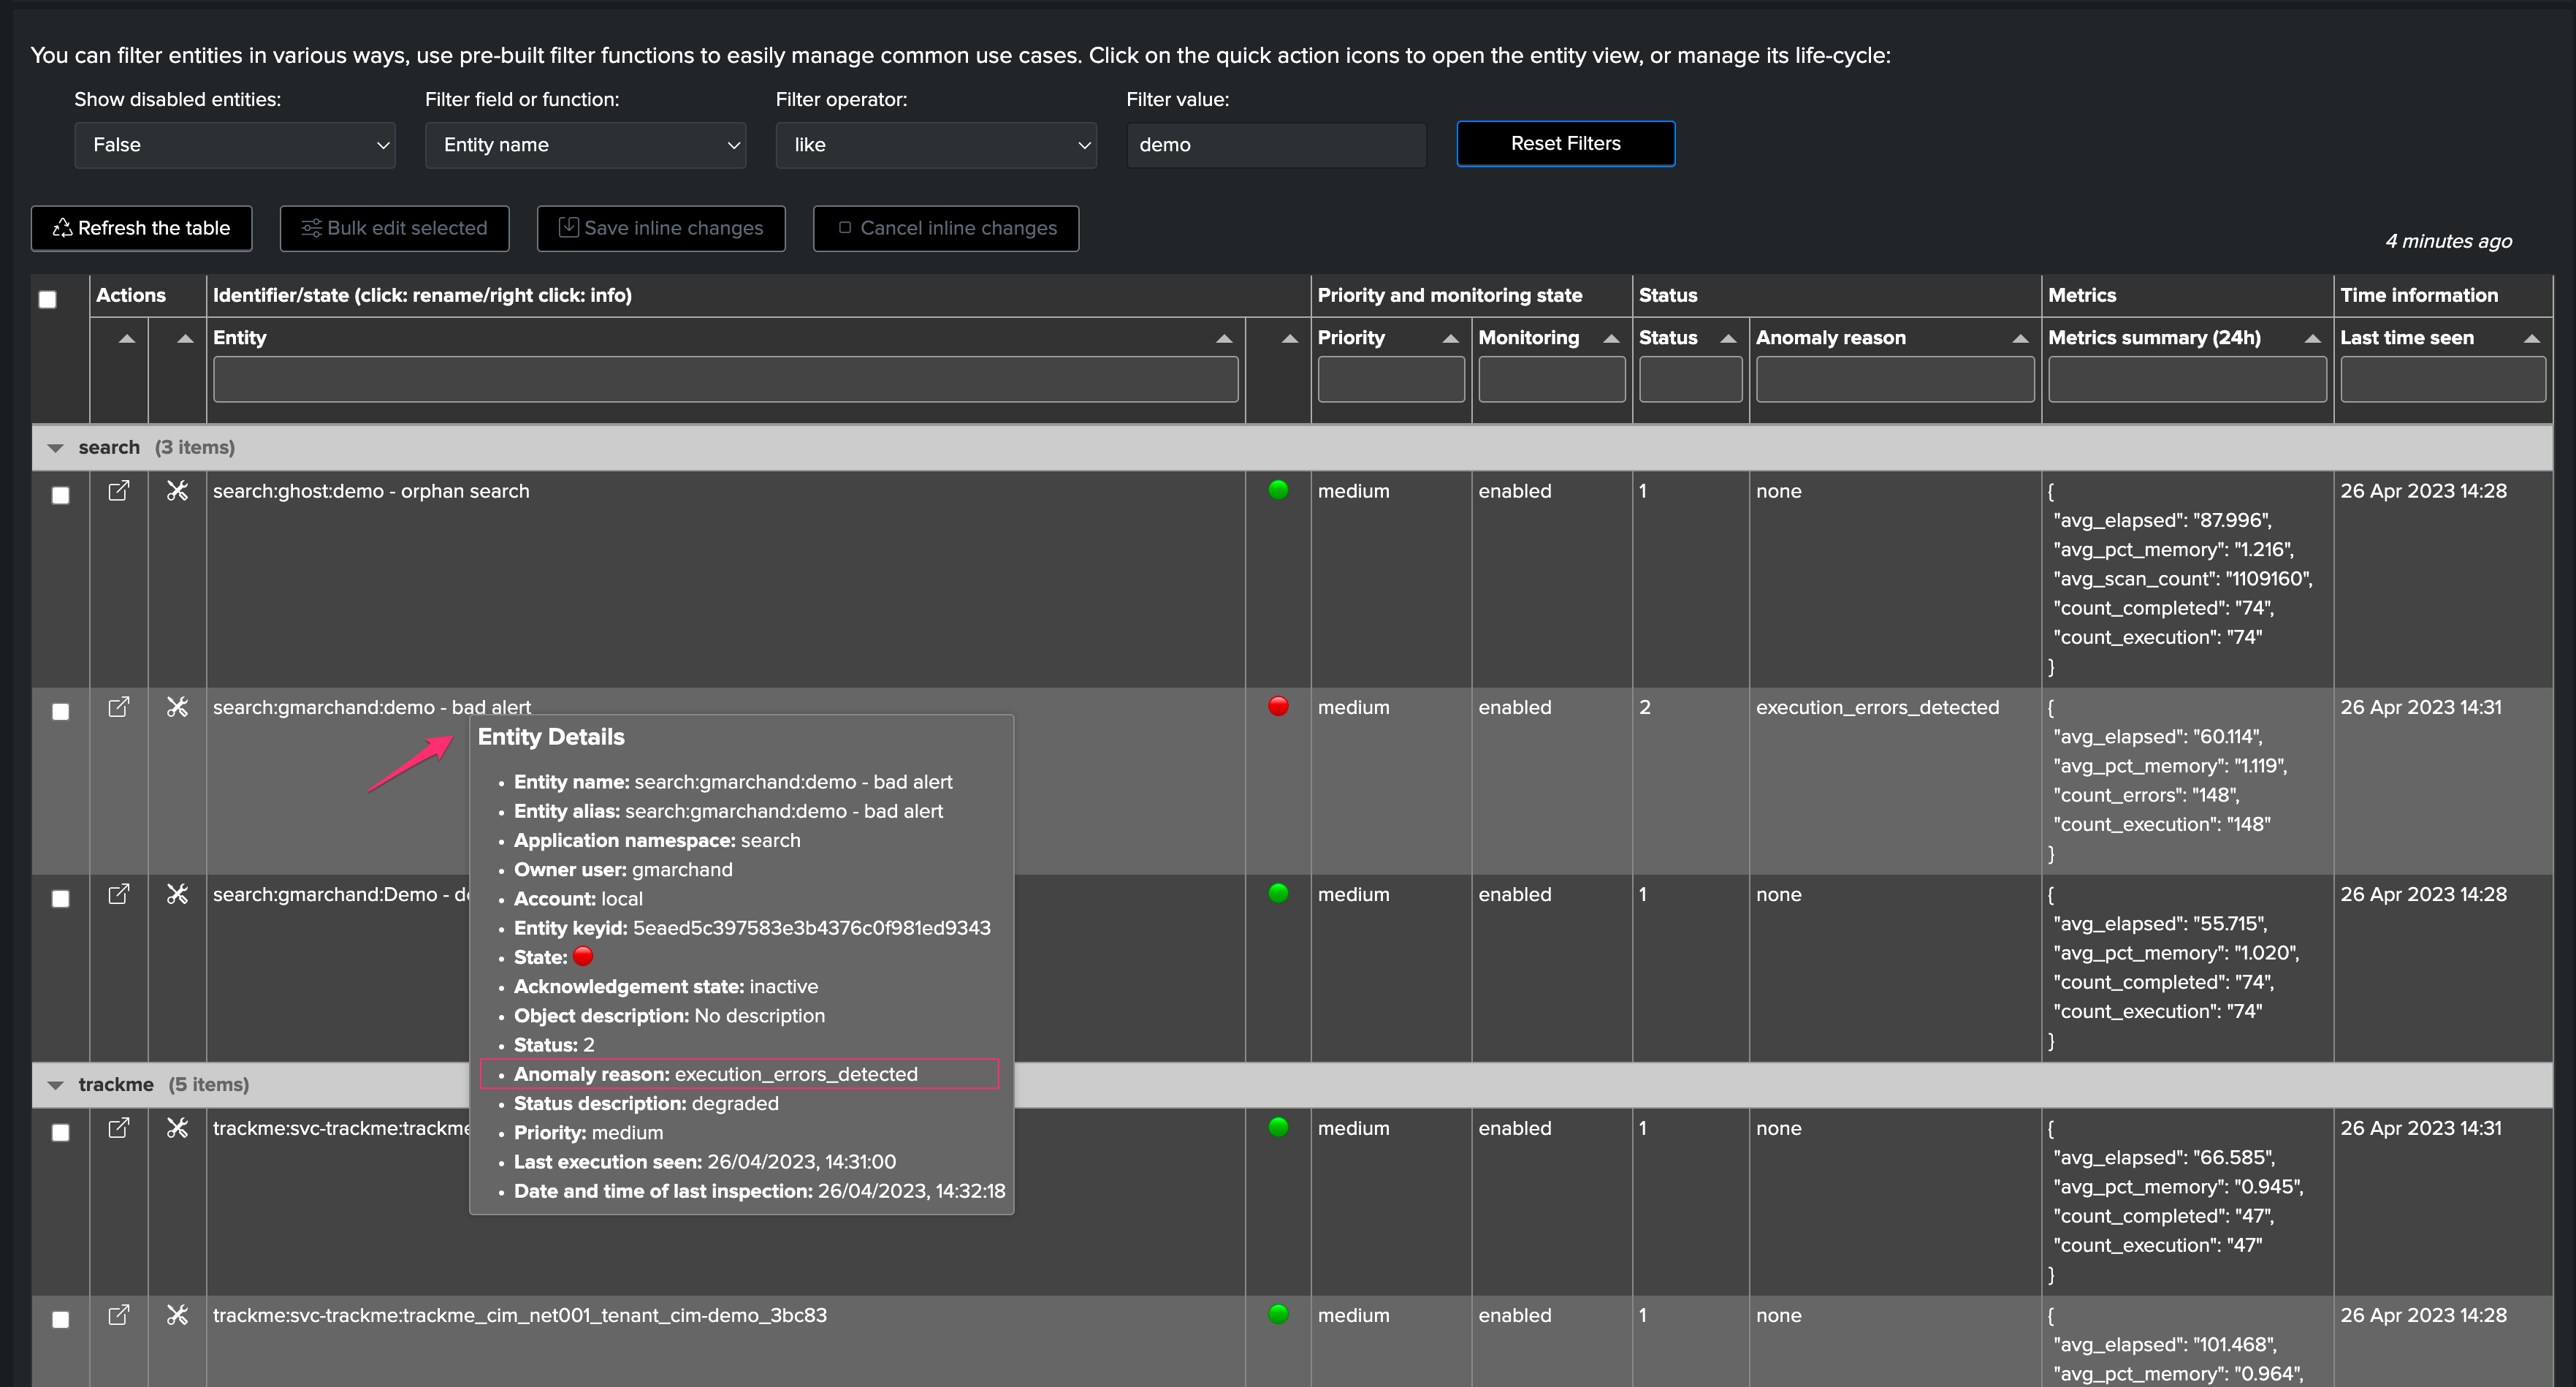
By right clicking on the entity, in the contextual menu
When the alert is sent over, as part of the fields resulting from the alert
When the alert fires, as part of the TrackMe notable event
table anomaly reason column:
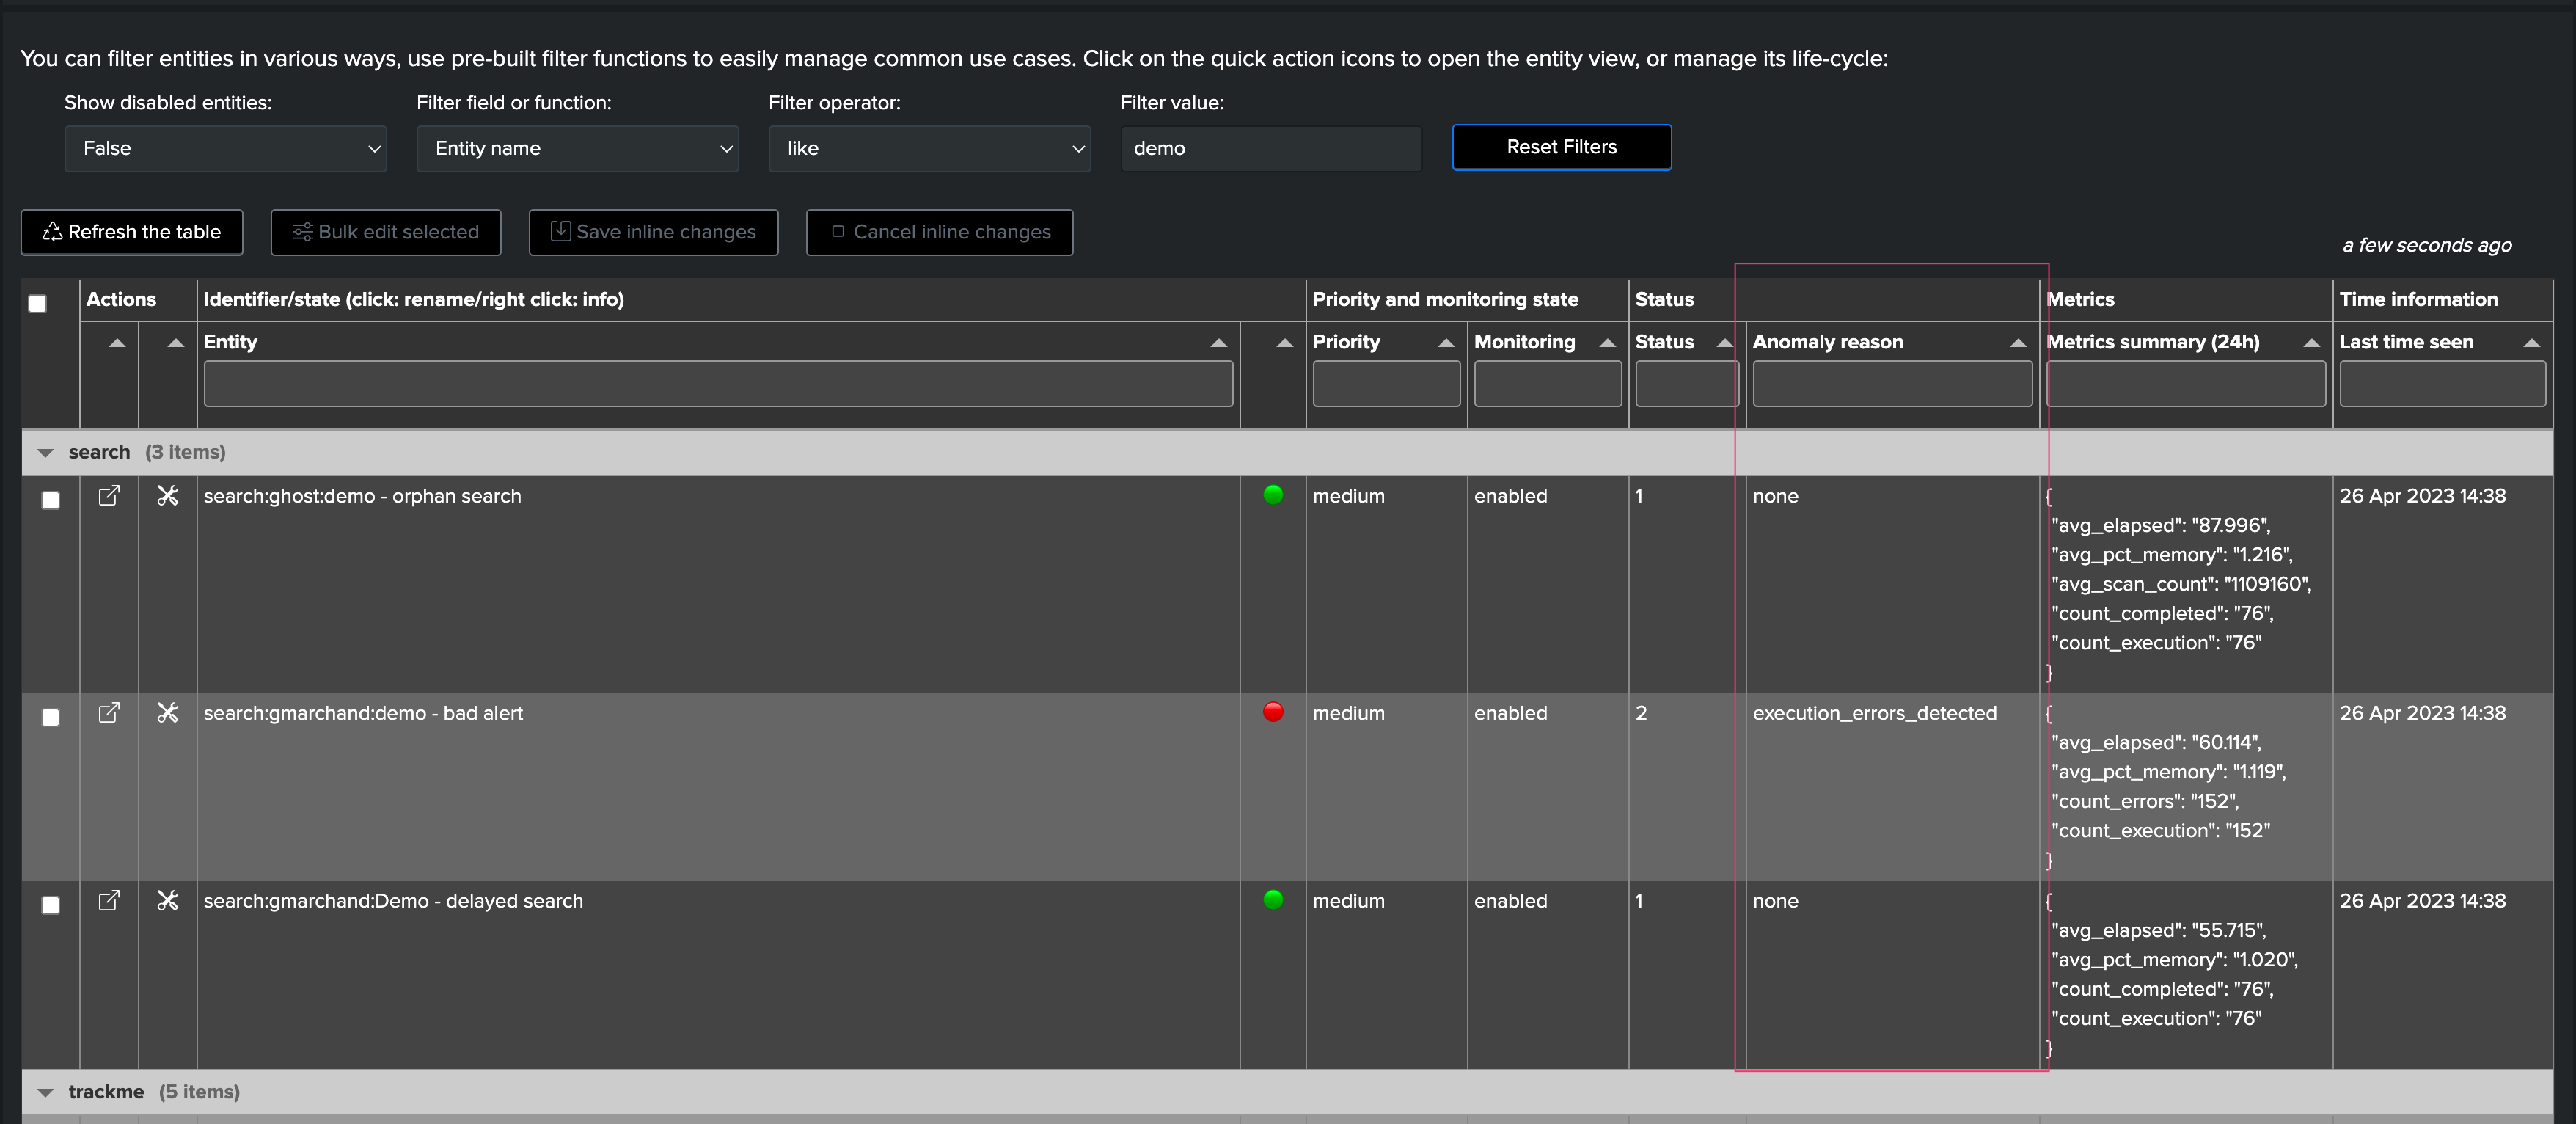
right click contextual menu on the entity name:
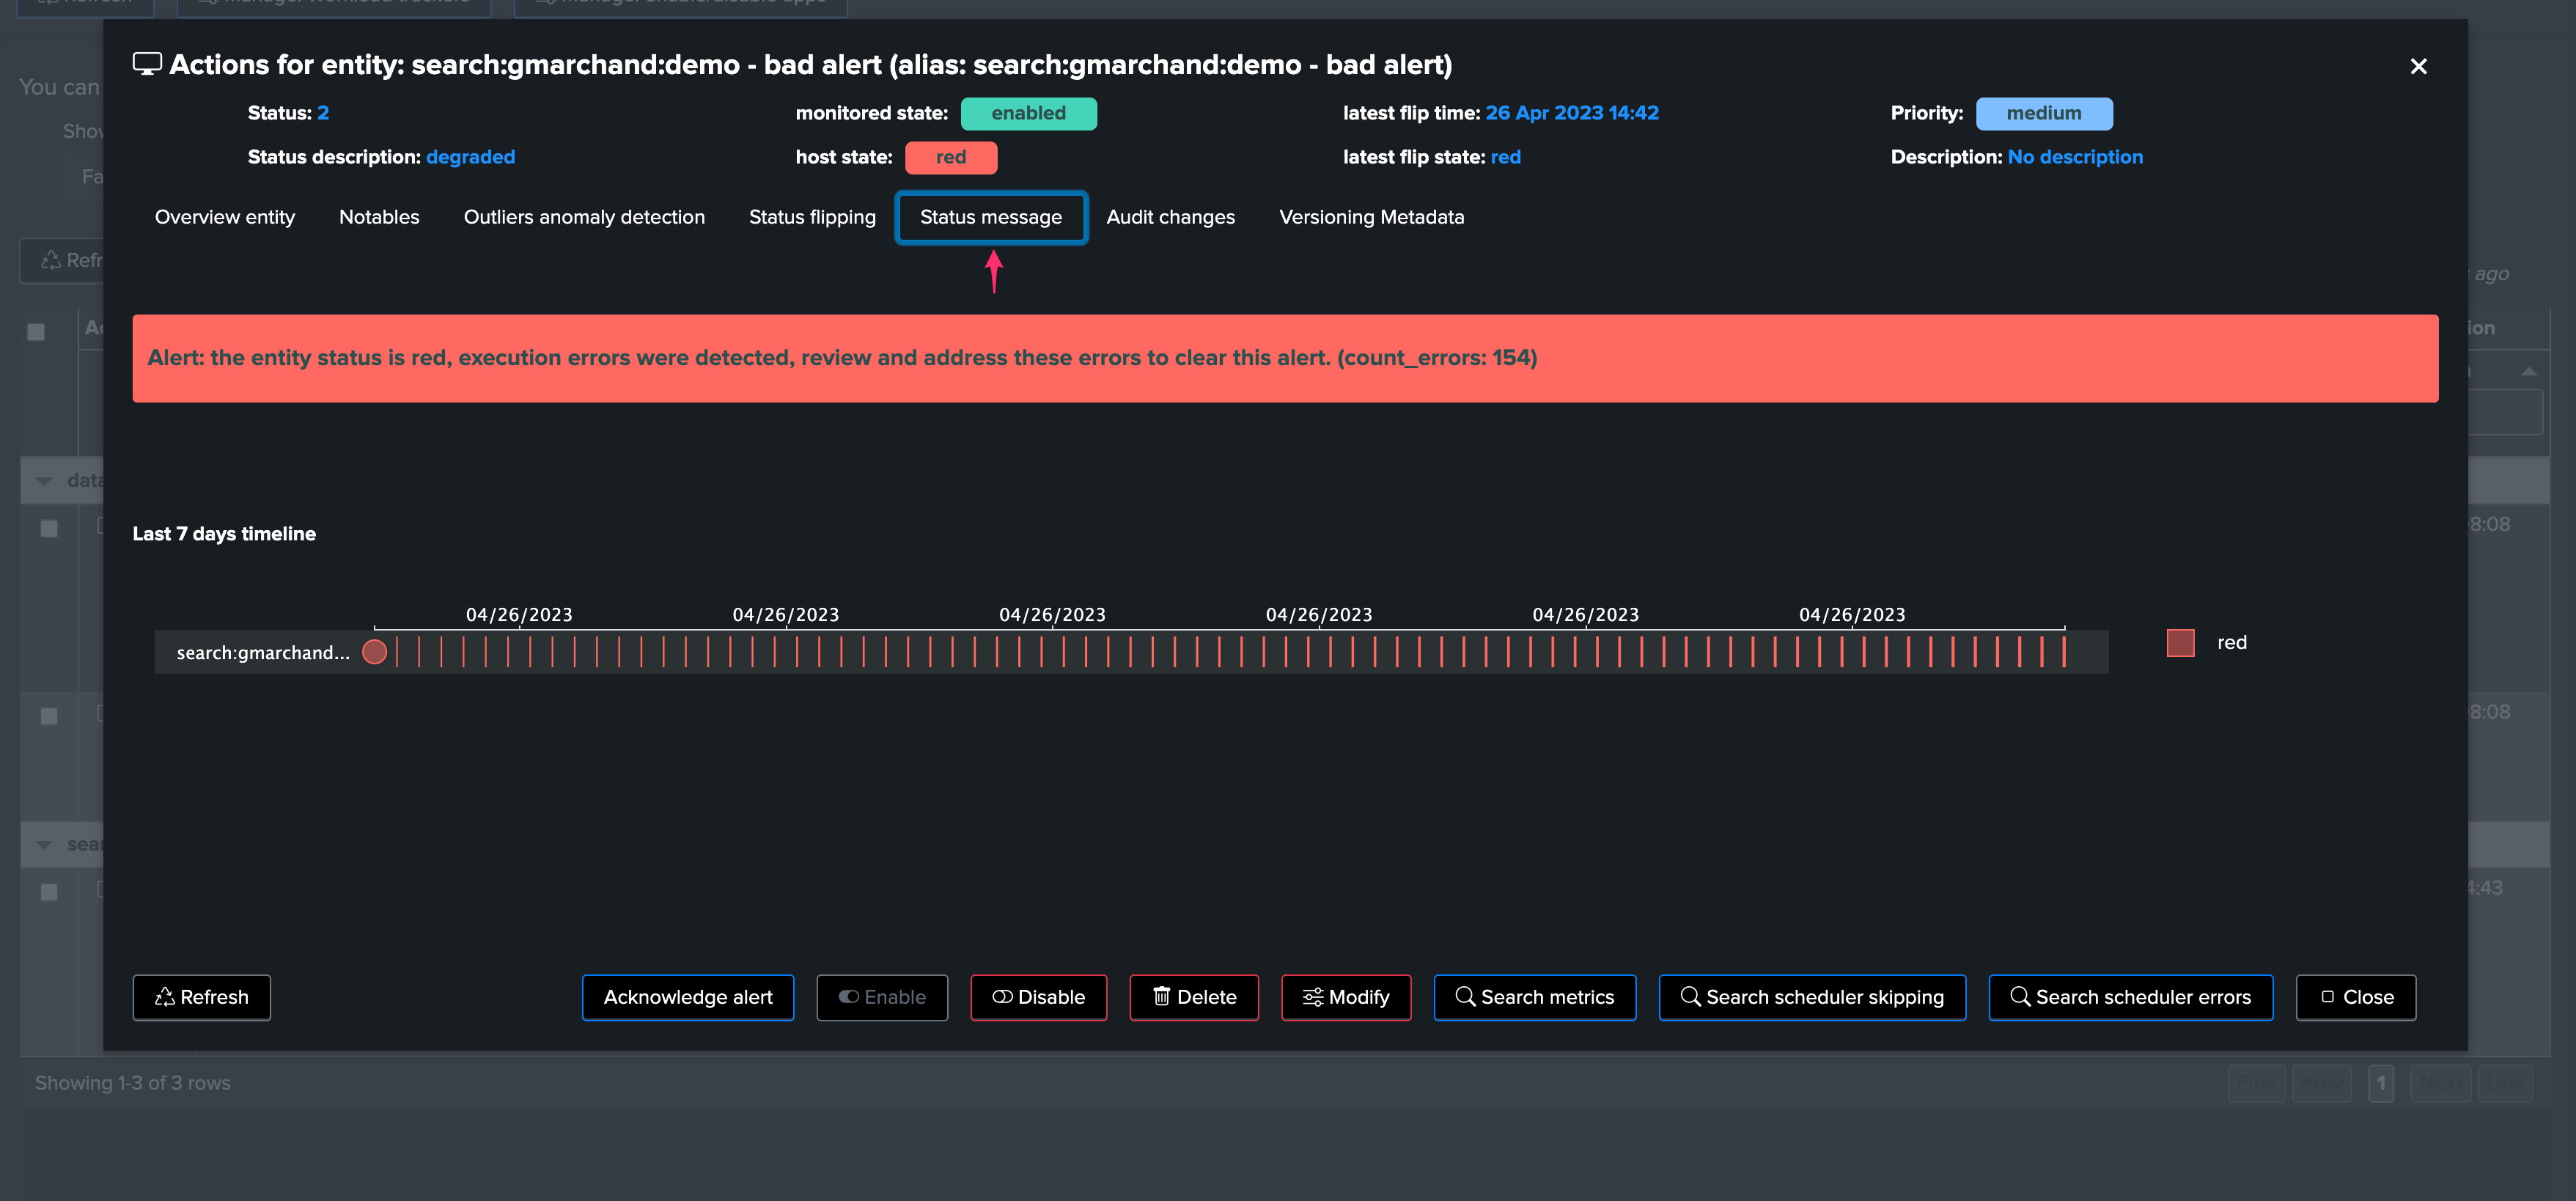
The status message is conditioned by the anomaly reason value and translated into a detailed message:
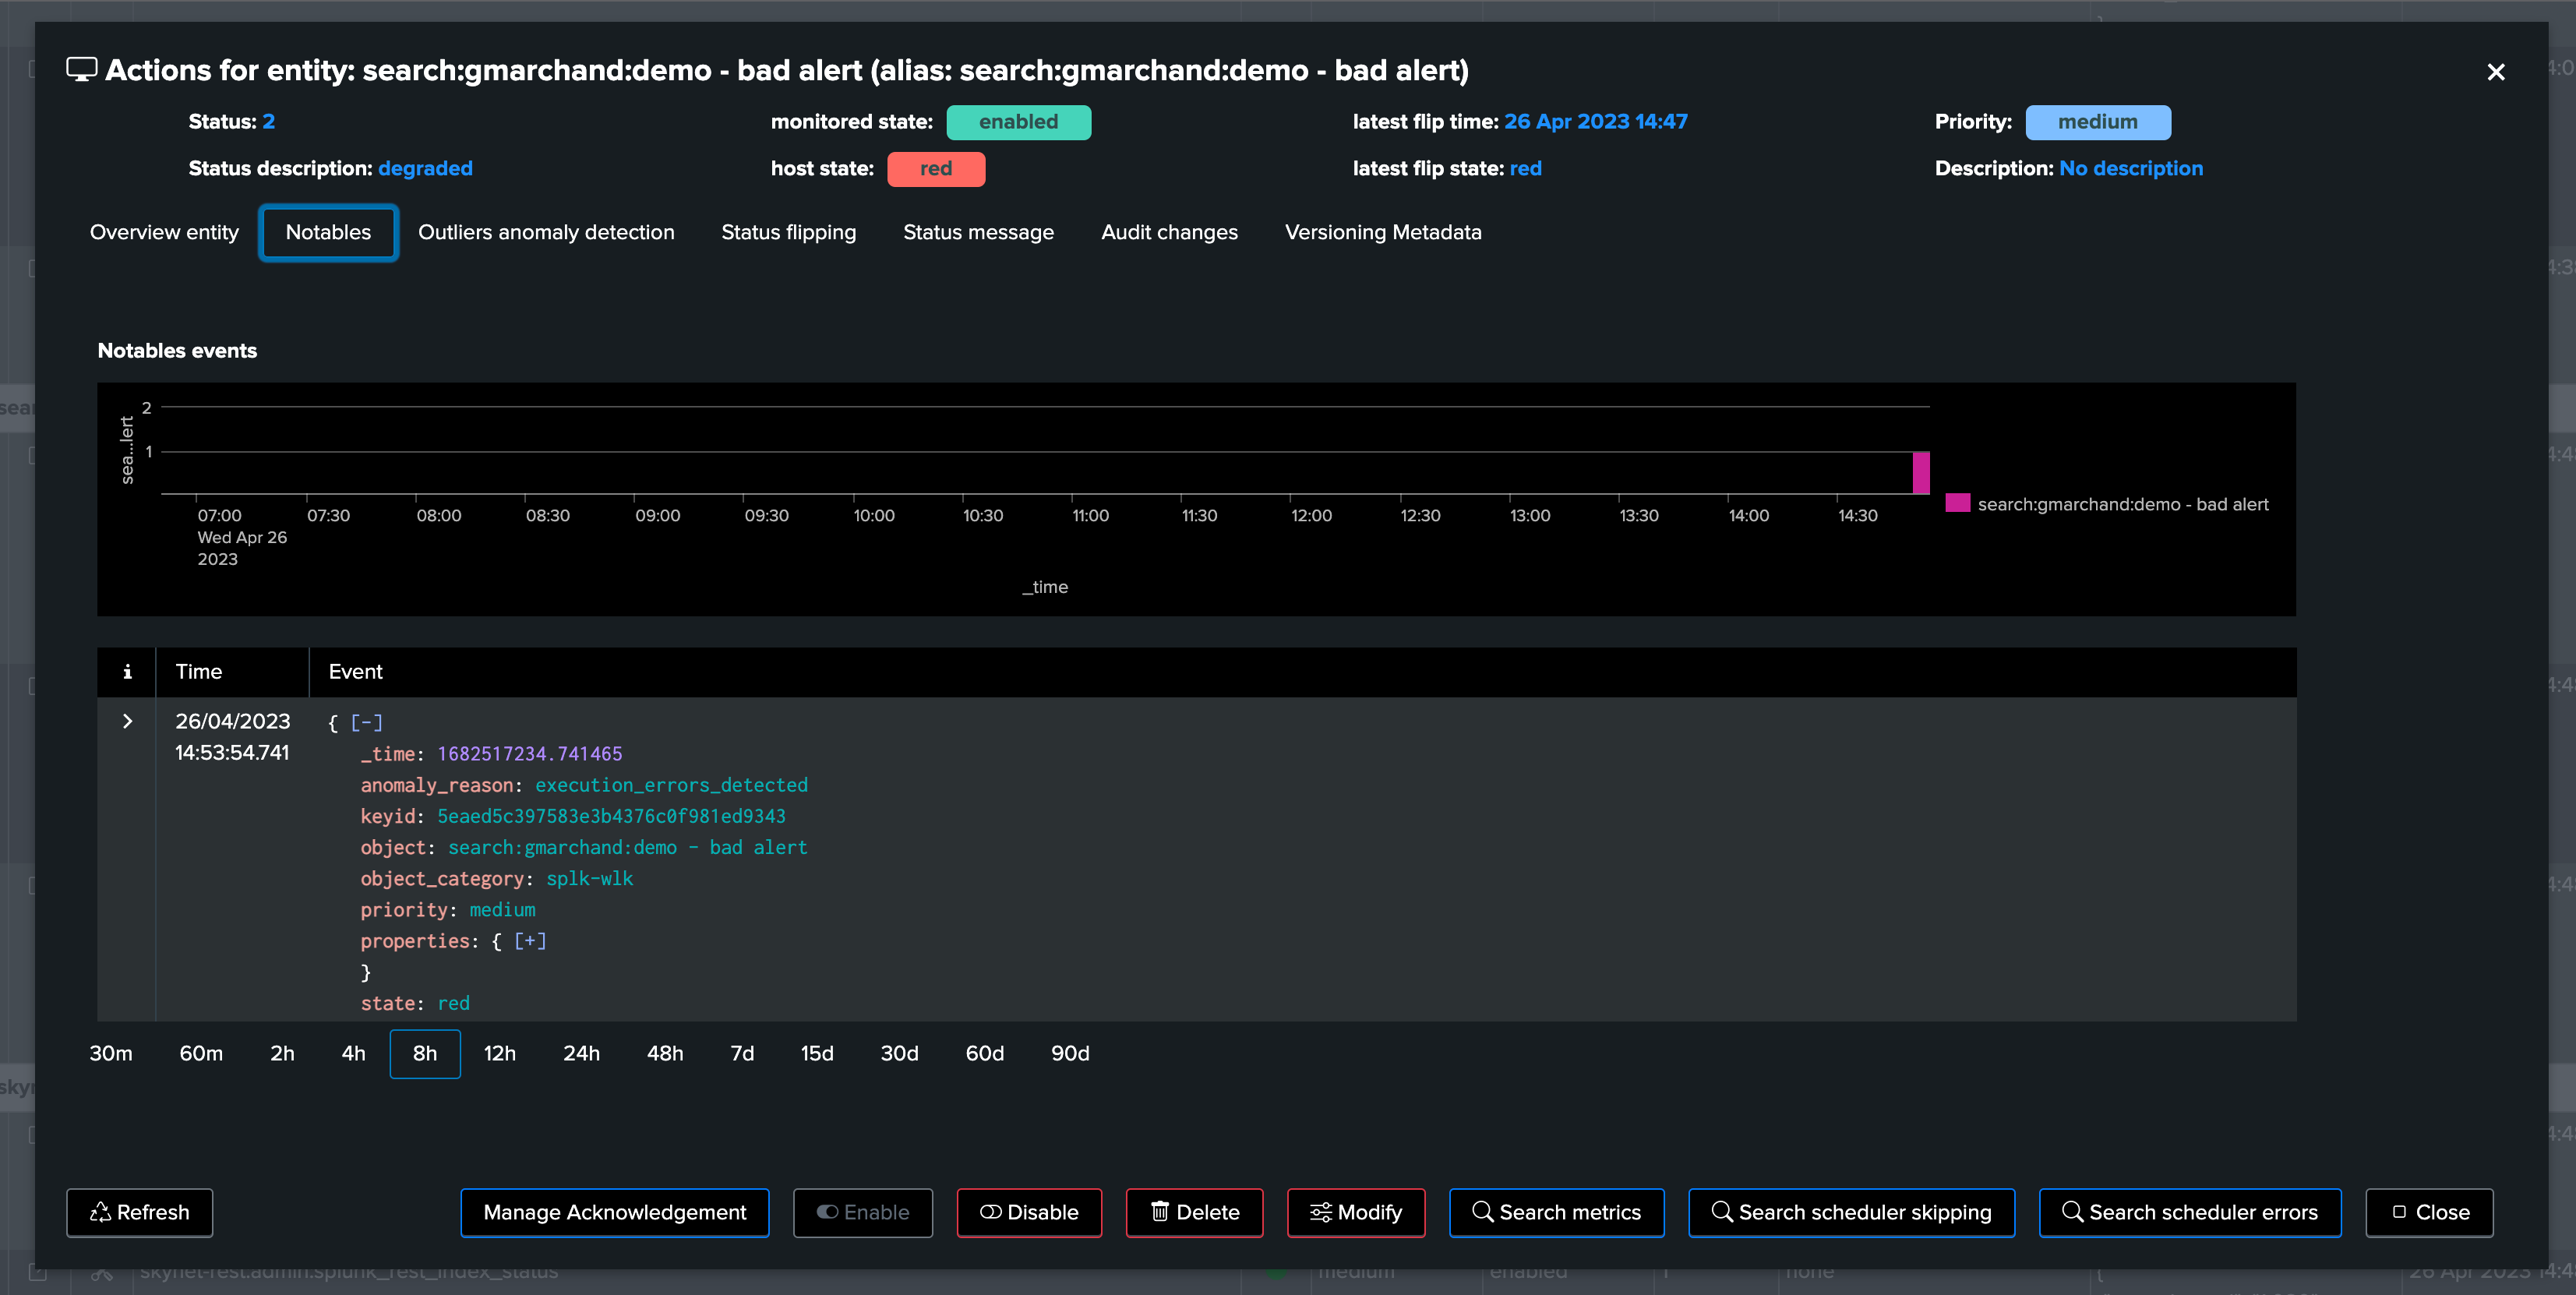
The anomaly reason is part of a notable event when an alert triggered:
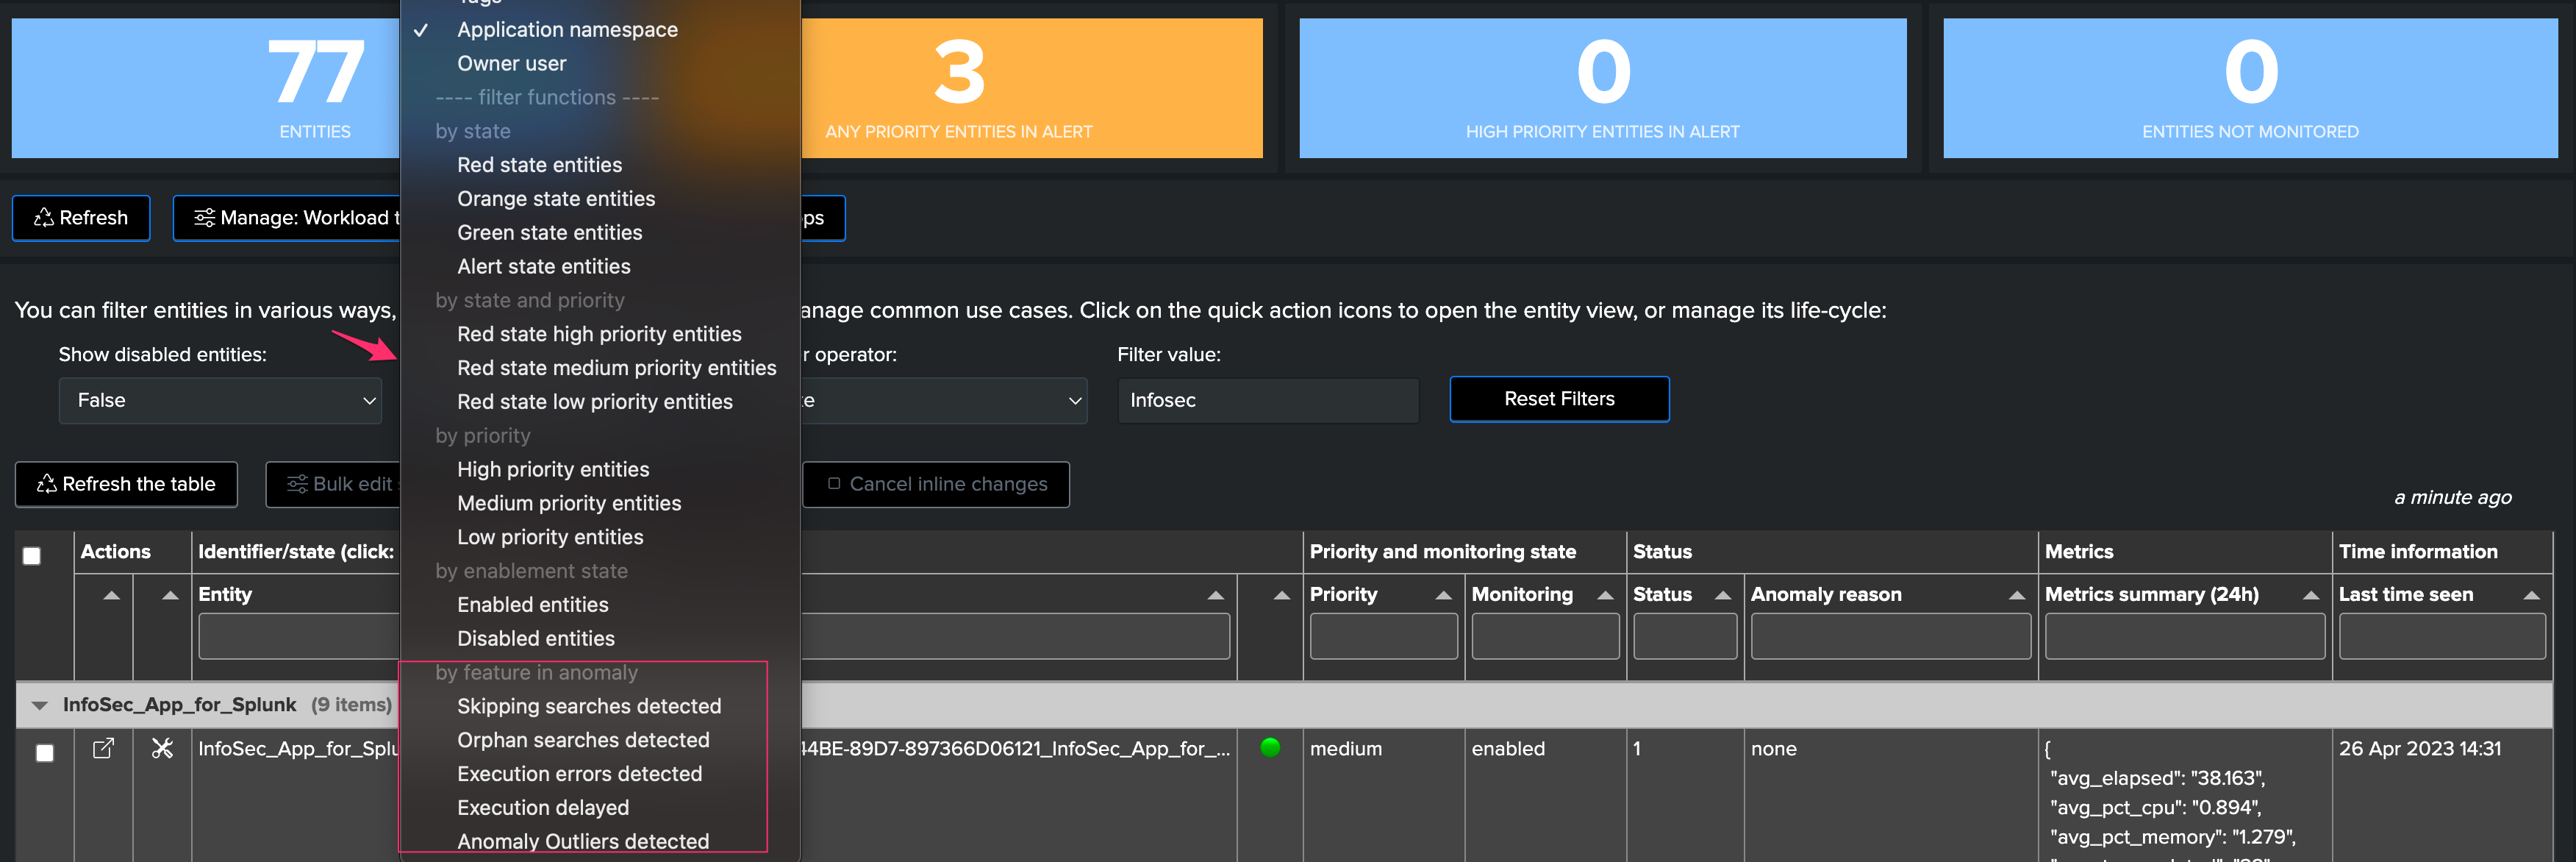
3.3 Filtering on Anomaly Reasons
You can use the filter functions to check all entities with a given anomaly reason:
4. Workload metrics
Once a scheduled entity was discovered, TrackMe tracks its activity and generates various key metrics:
Metric name |
Description |
|---|---|
count_execution |
Scheduler metric: the number of requested executions for this schedule |
count_completed |
Scheduler metric: the number of successfully completed executions for this schedule |
count_skipped |
Scheduler metric: the number of skipped executions for this schedule |
count_errors |
Scheduler metric: the number of executions errors detected for this schedule |
elapsed |
Introspection metric: the run time of the search, in seconds |
pct_cpu |
Introspection metric: the aggregated percentage of CPU used for this schedule (which can be more than 100%) |
pct_memory |
Introspection metric: the aggregated percentage of Memory used for this schedule (which can be more than 100%) |
scan_count |
Introspection metric: the number of events scanned for this schedule |
svc_usage |
Splunk Cloud metric: the SVC usage for this consumer |
The Workload metrics are then used to condition the status of the entity, and feed the Machine Learning Outliers engine.
4.1 Accessing metrics
4.1.1 Metrics summary table
Metrics summary in the table:
TrackMe shows a summary of the metrics of the last known 24 hours per entity:
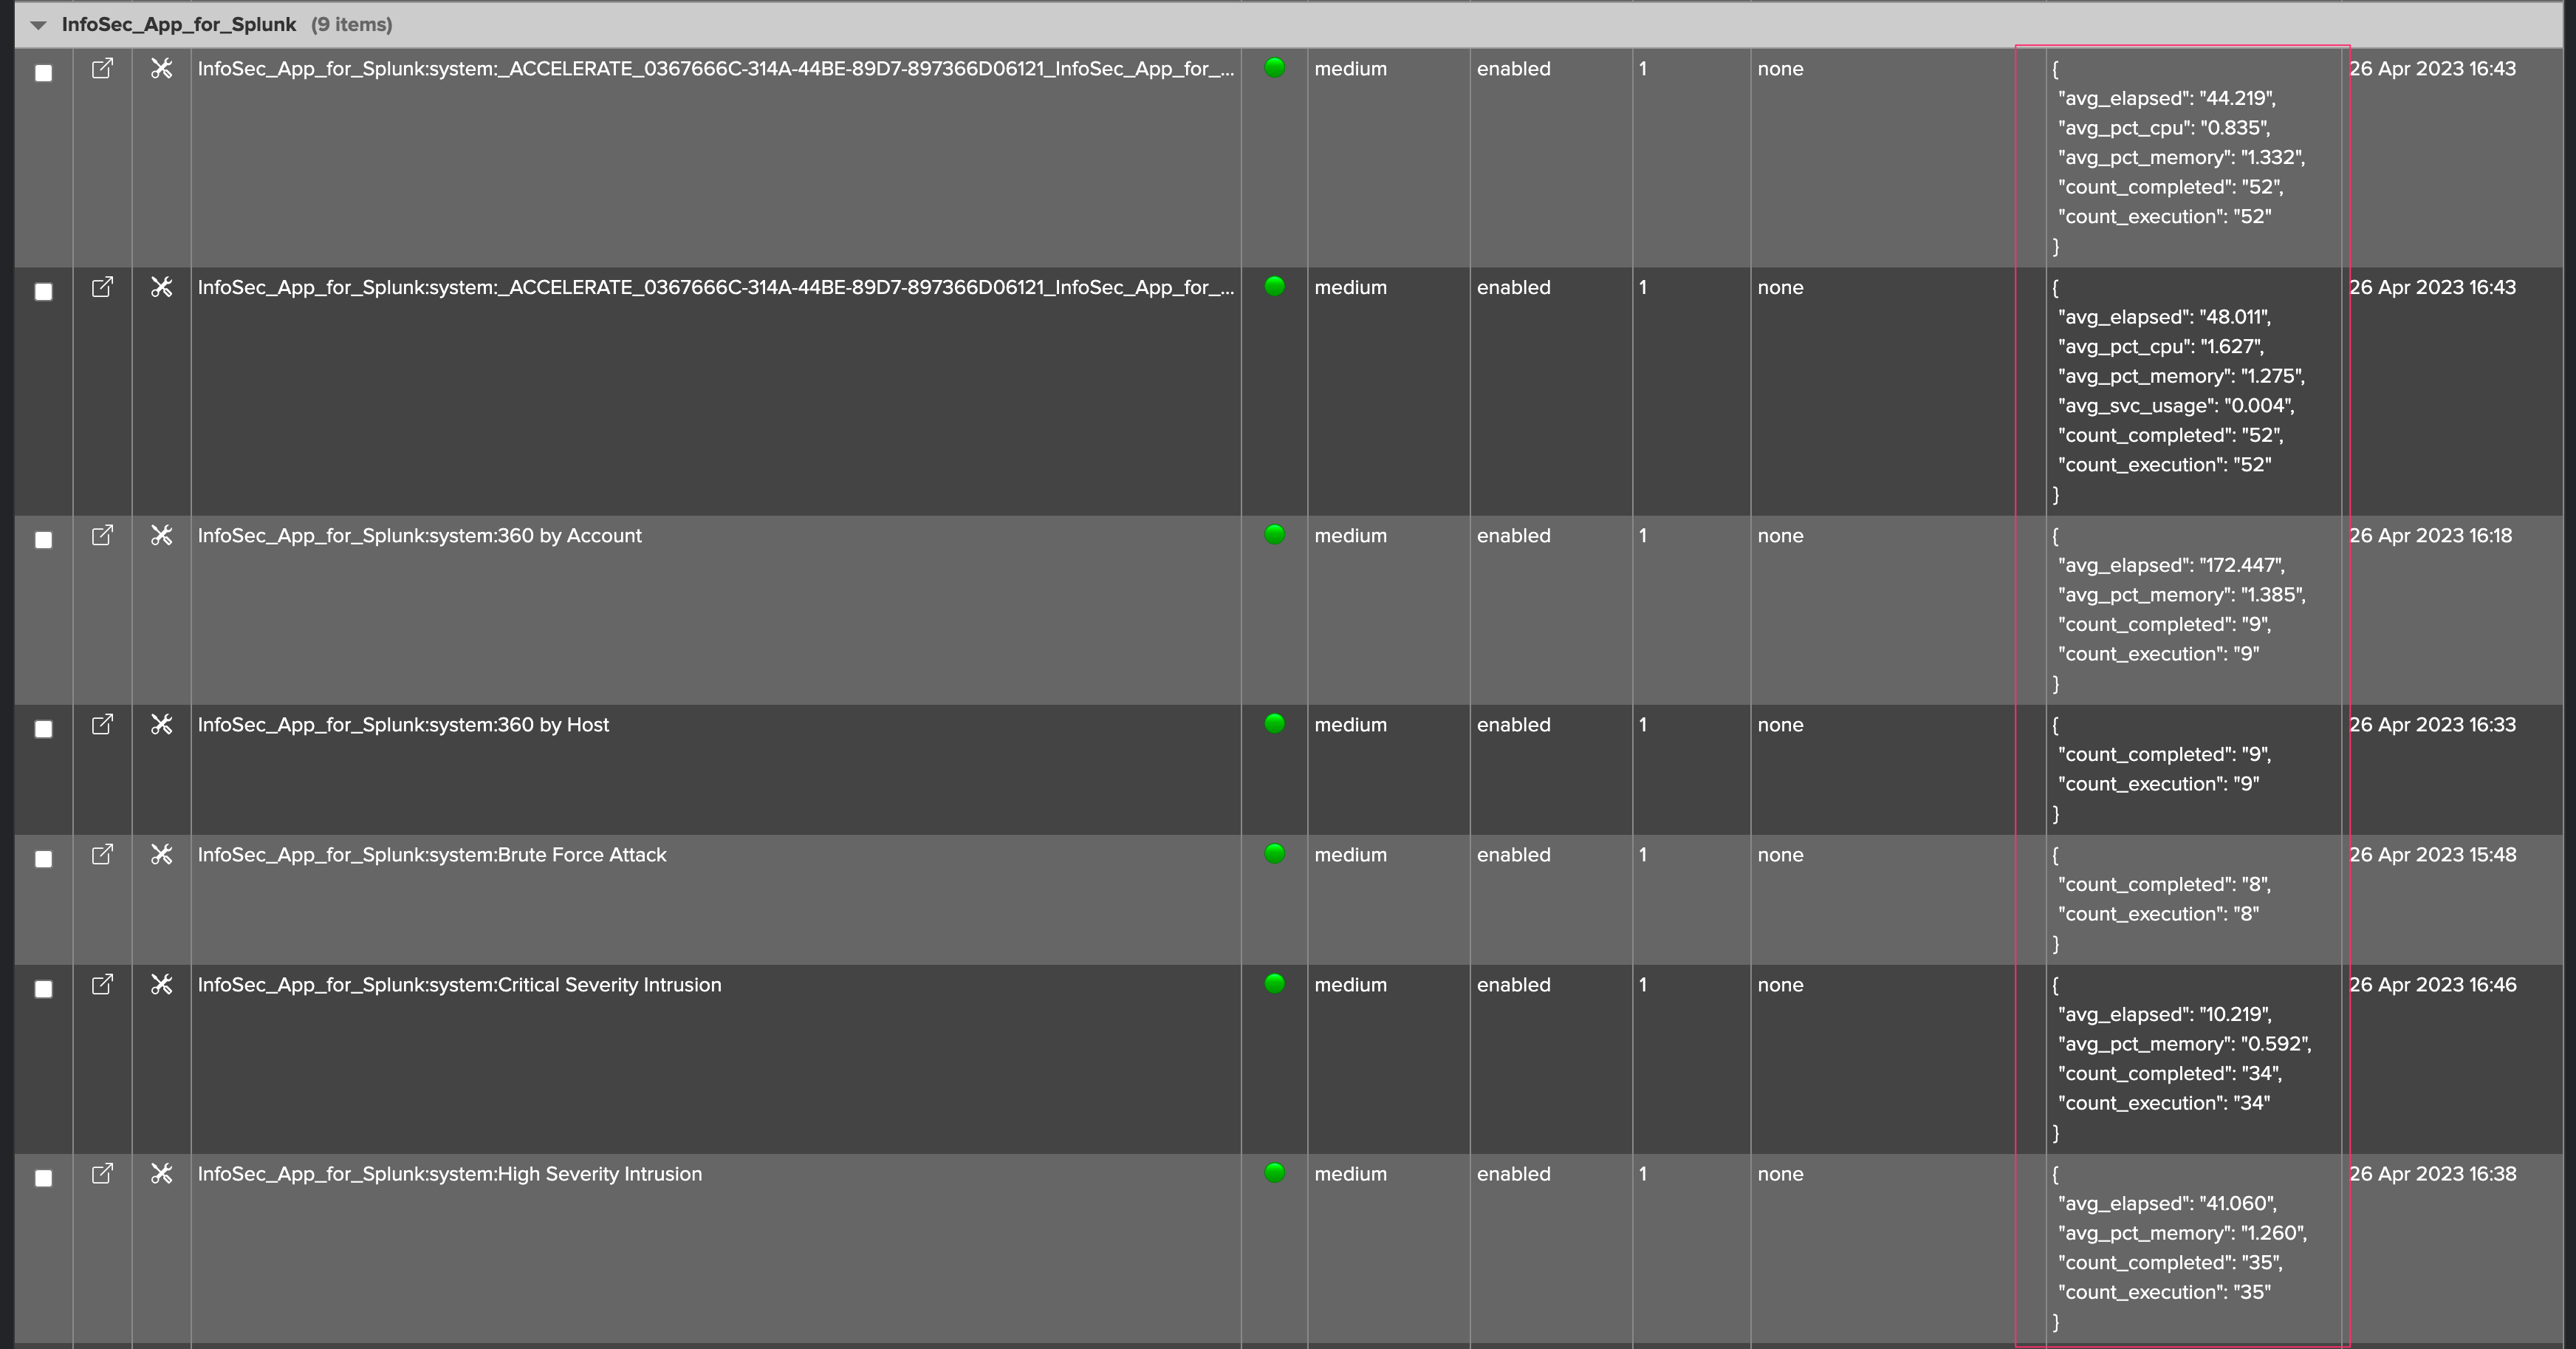
Note that metrics shown in the summary JSON vary depending on the metrics available, for instance an entity which has not been experiencing skipping searches will not show the metric as it is null.
4.2.2 Metrics chart over time
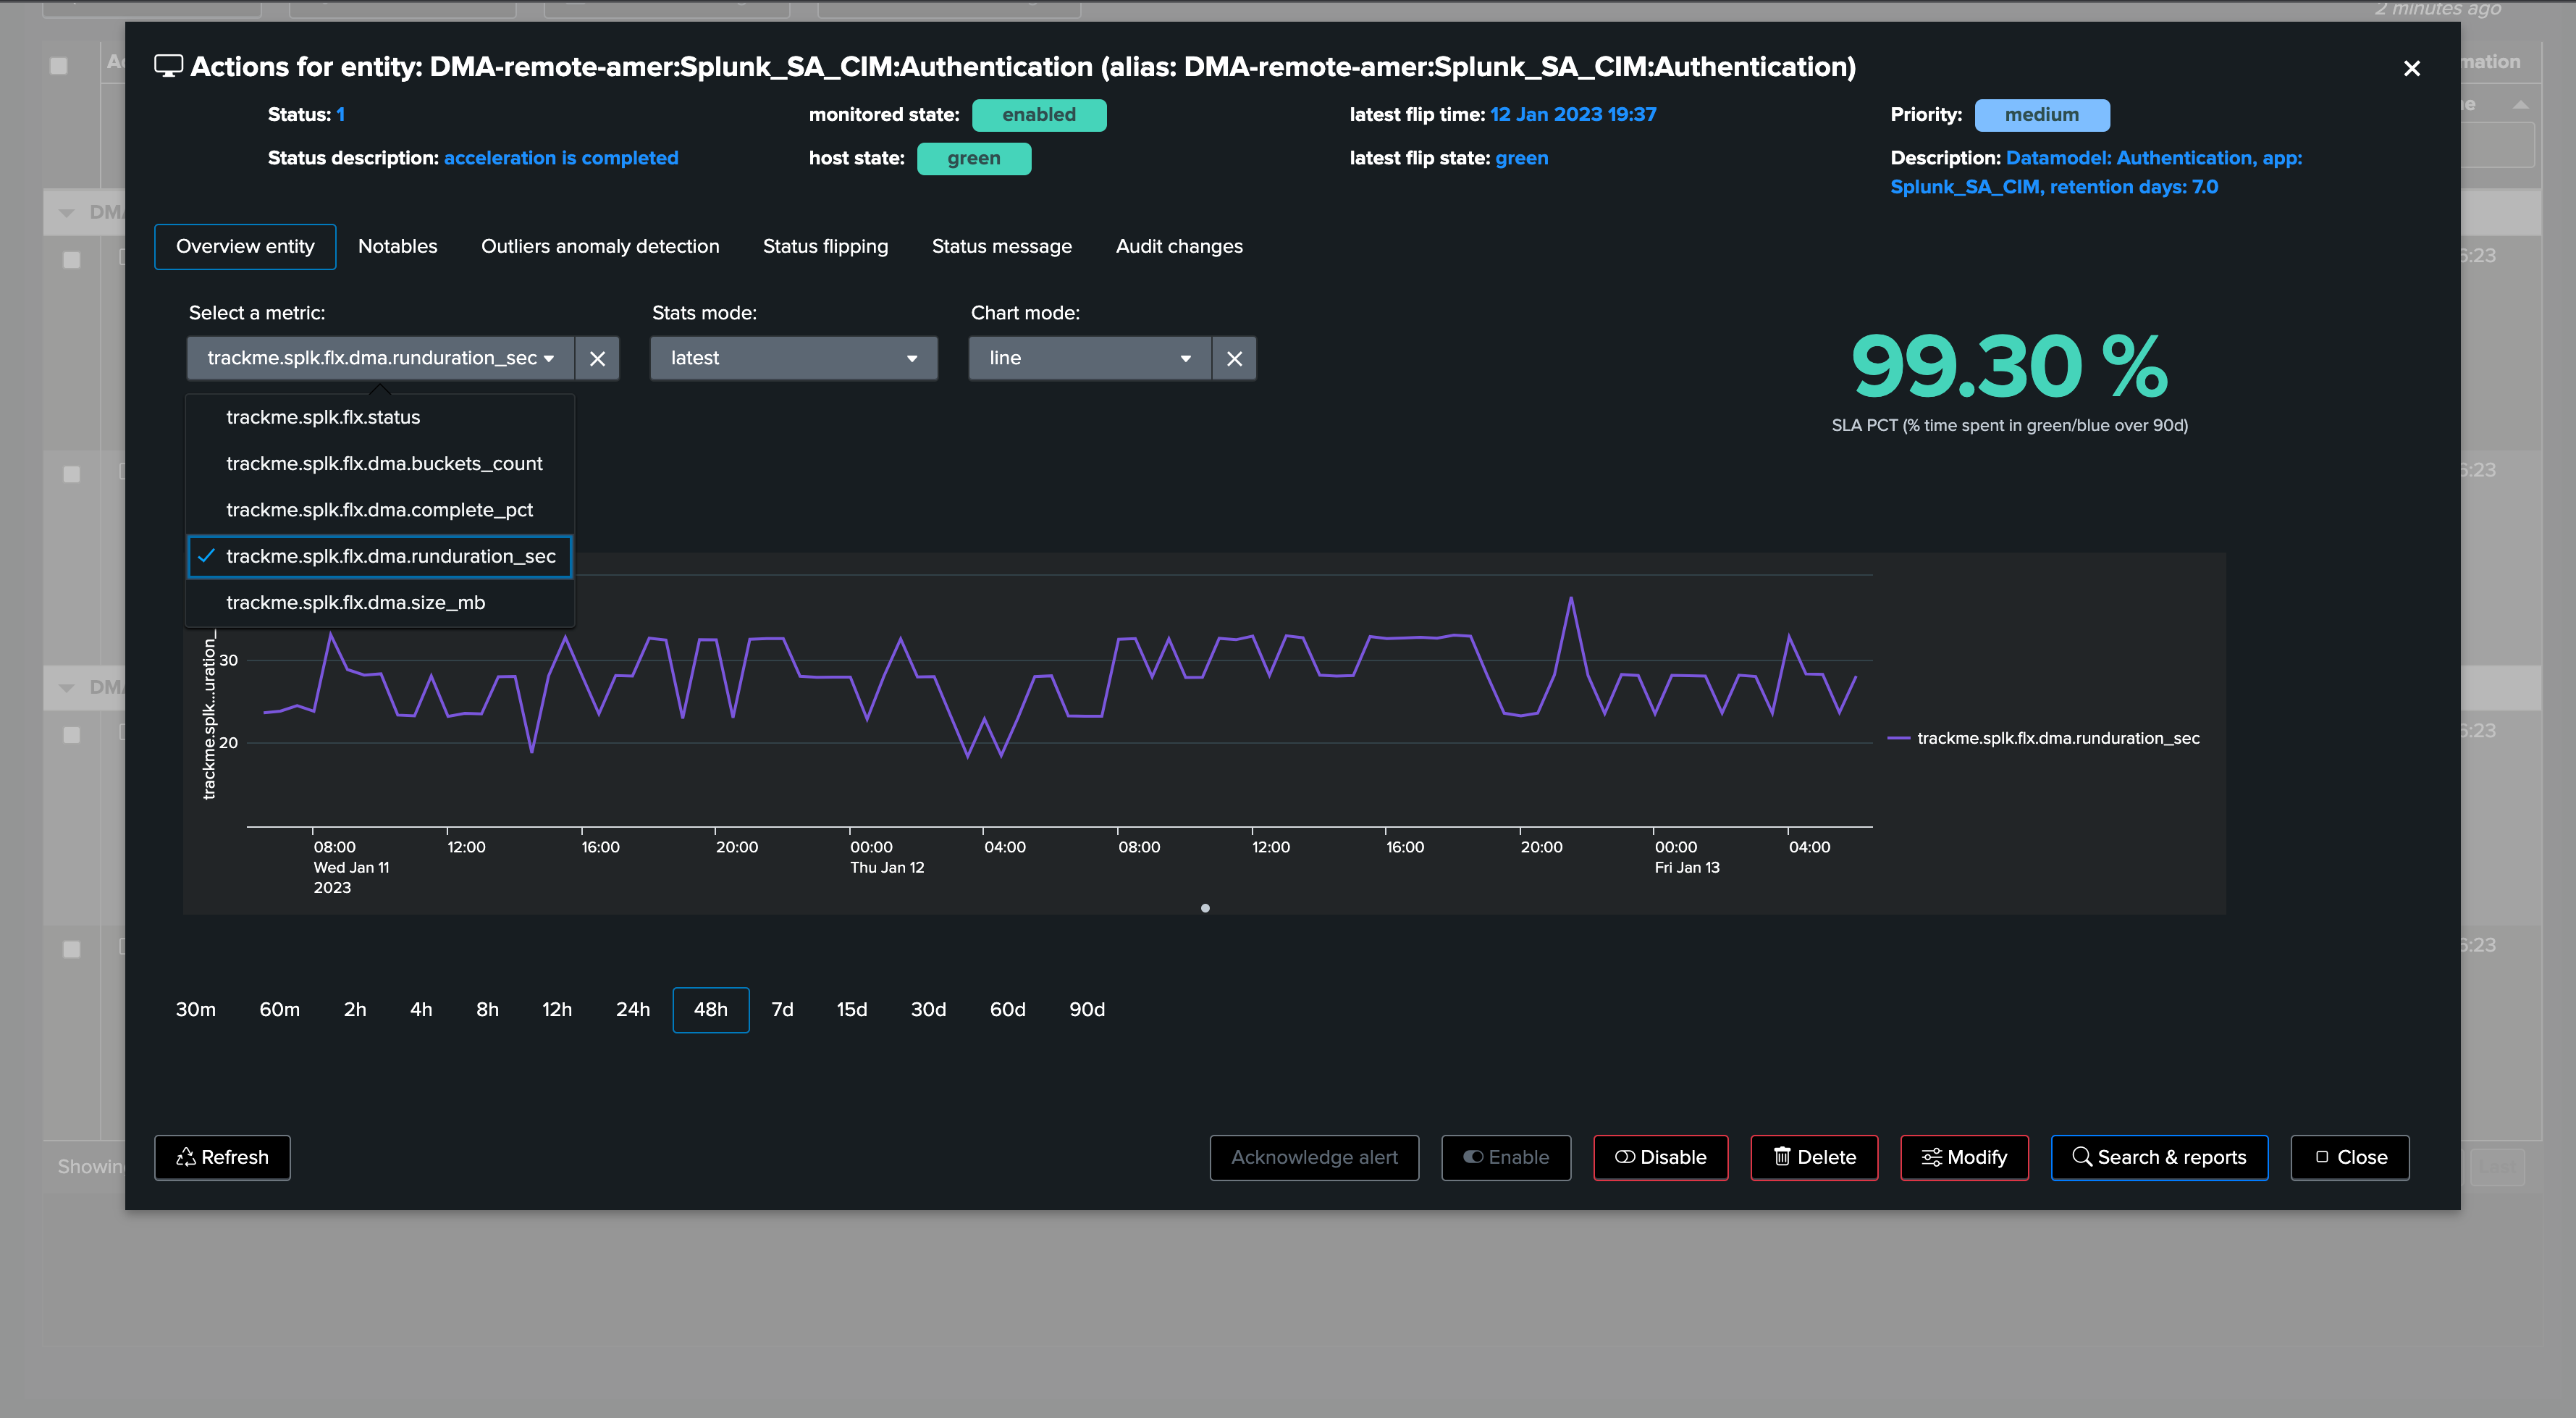
You access to the metric chart selector by opening an entity overview:
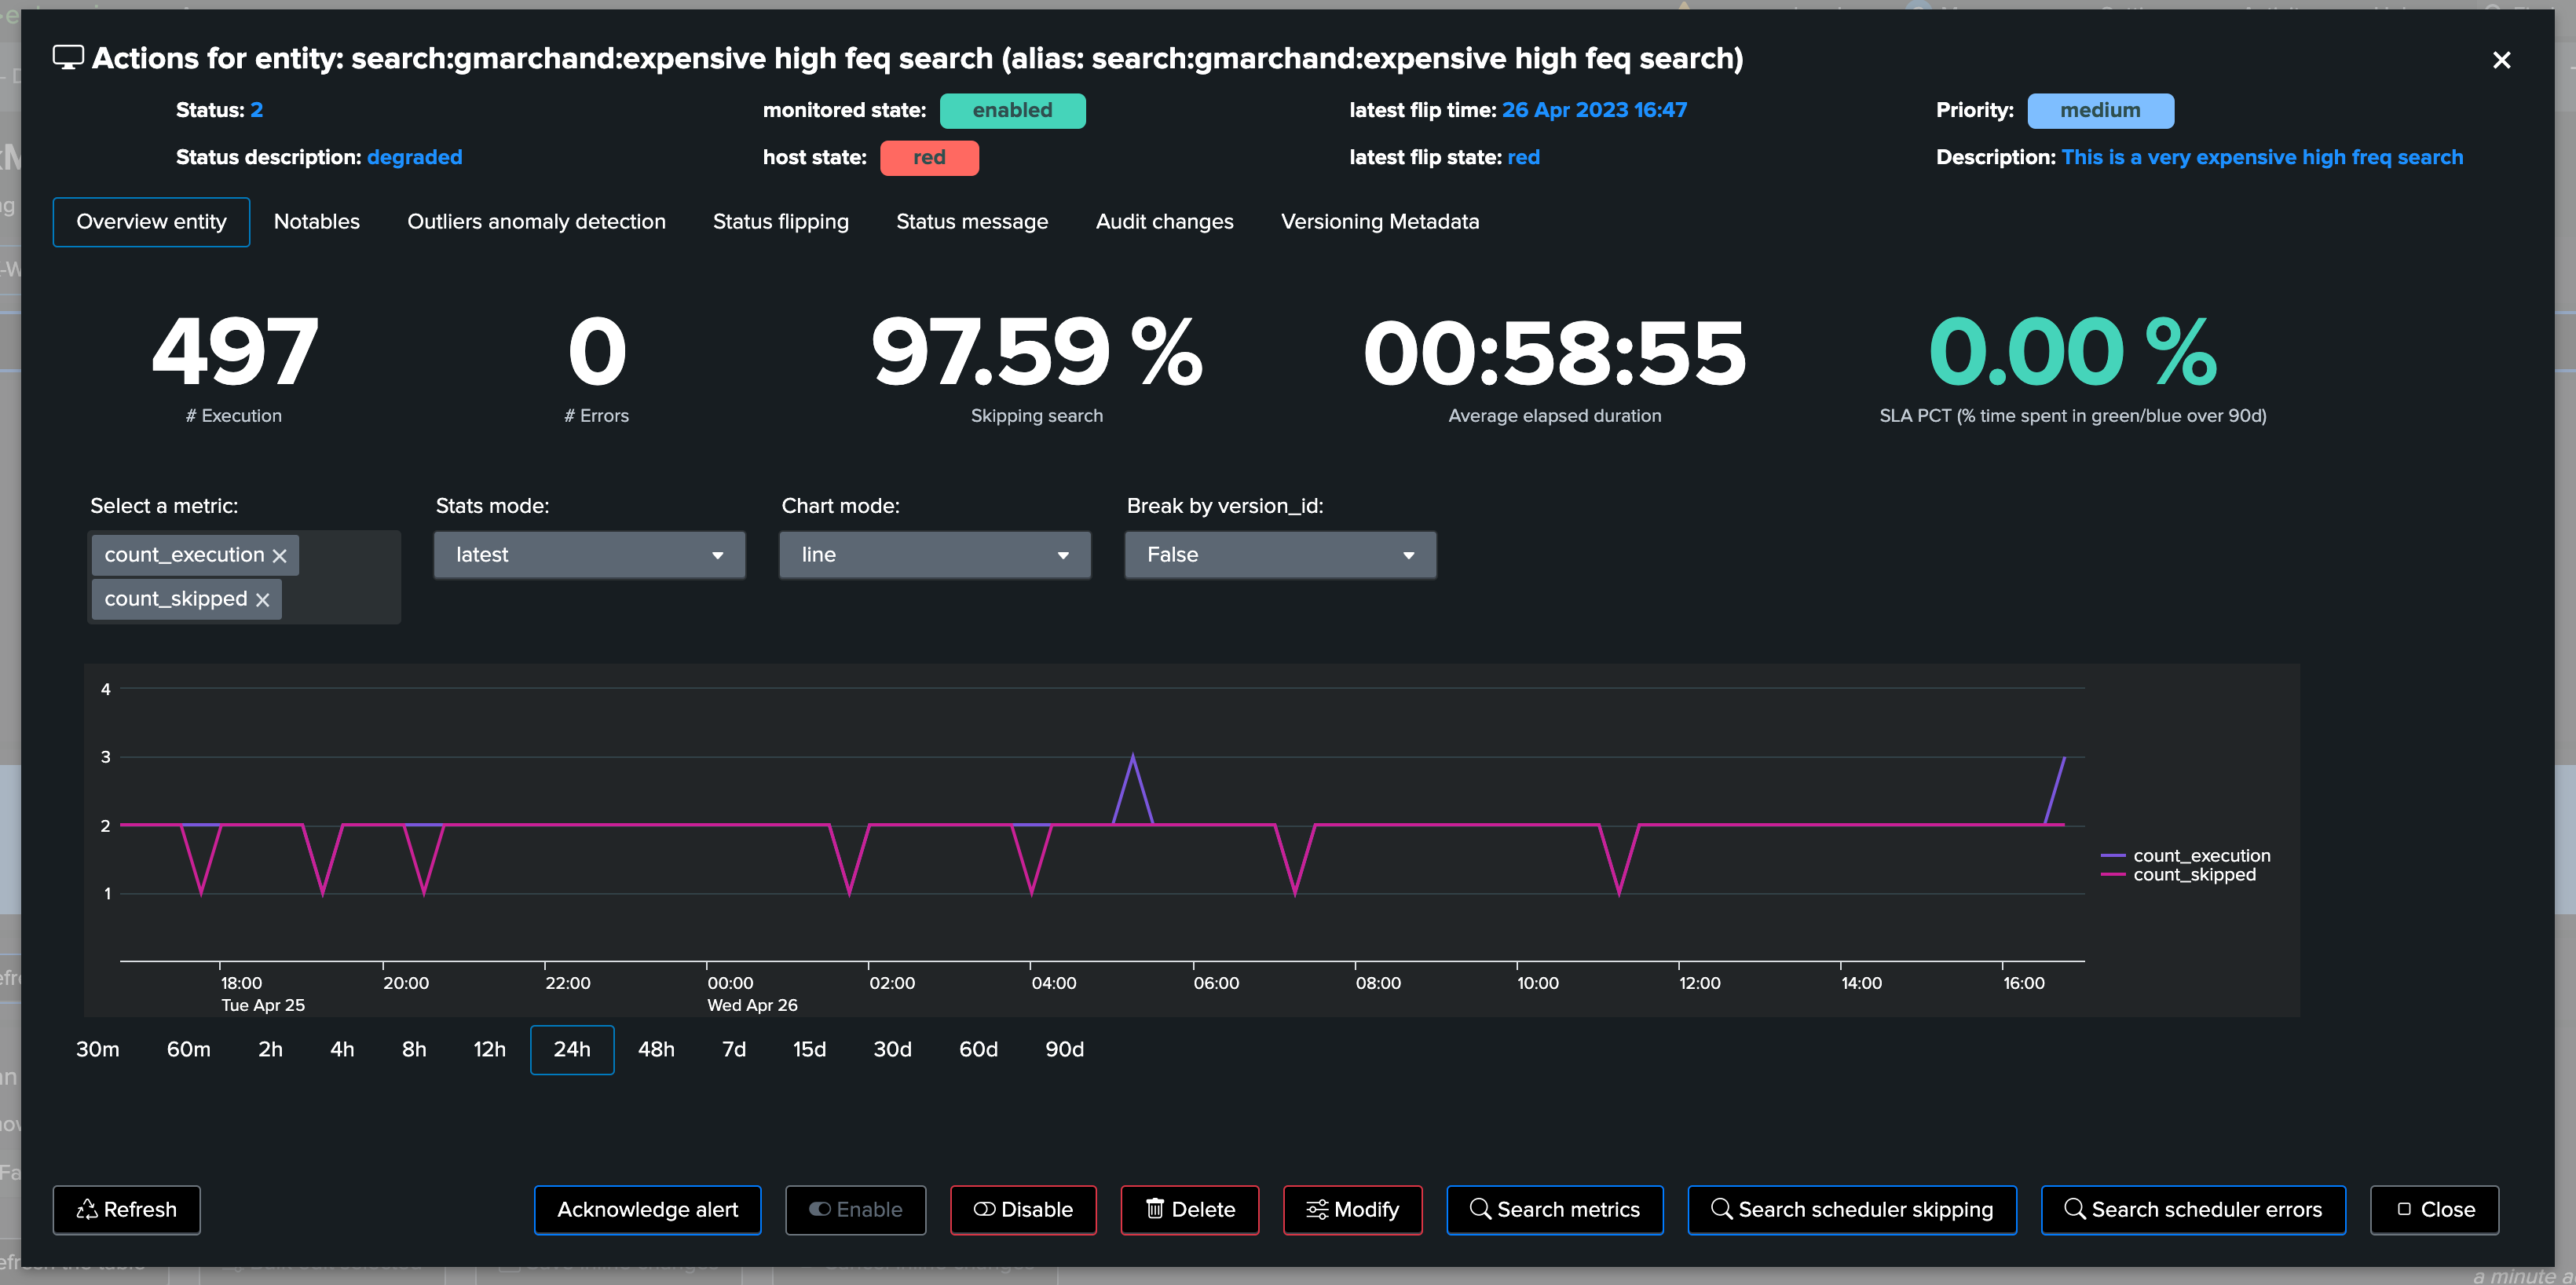
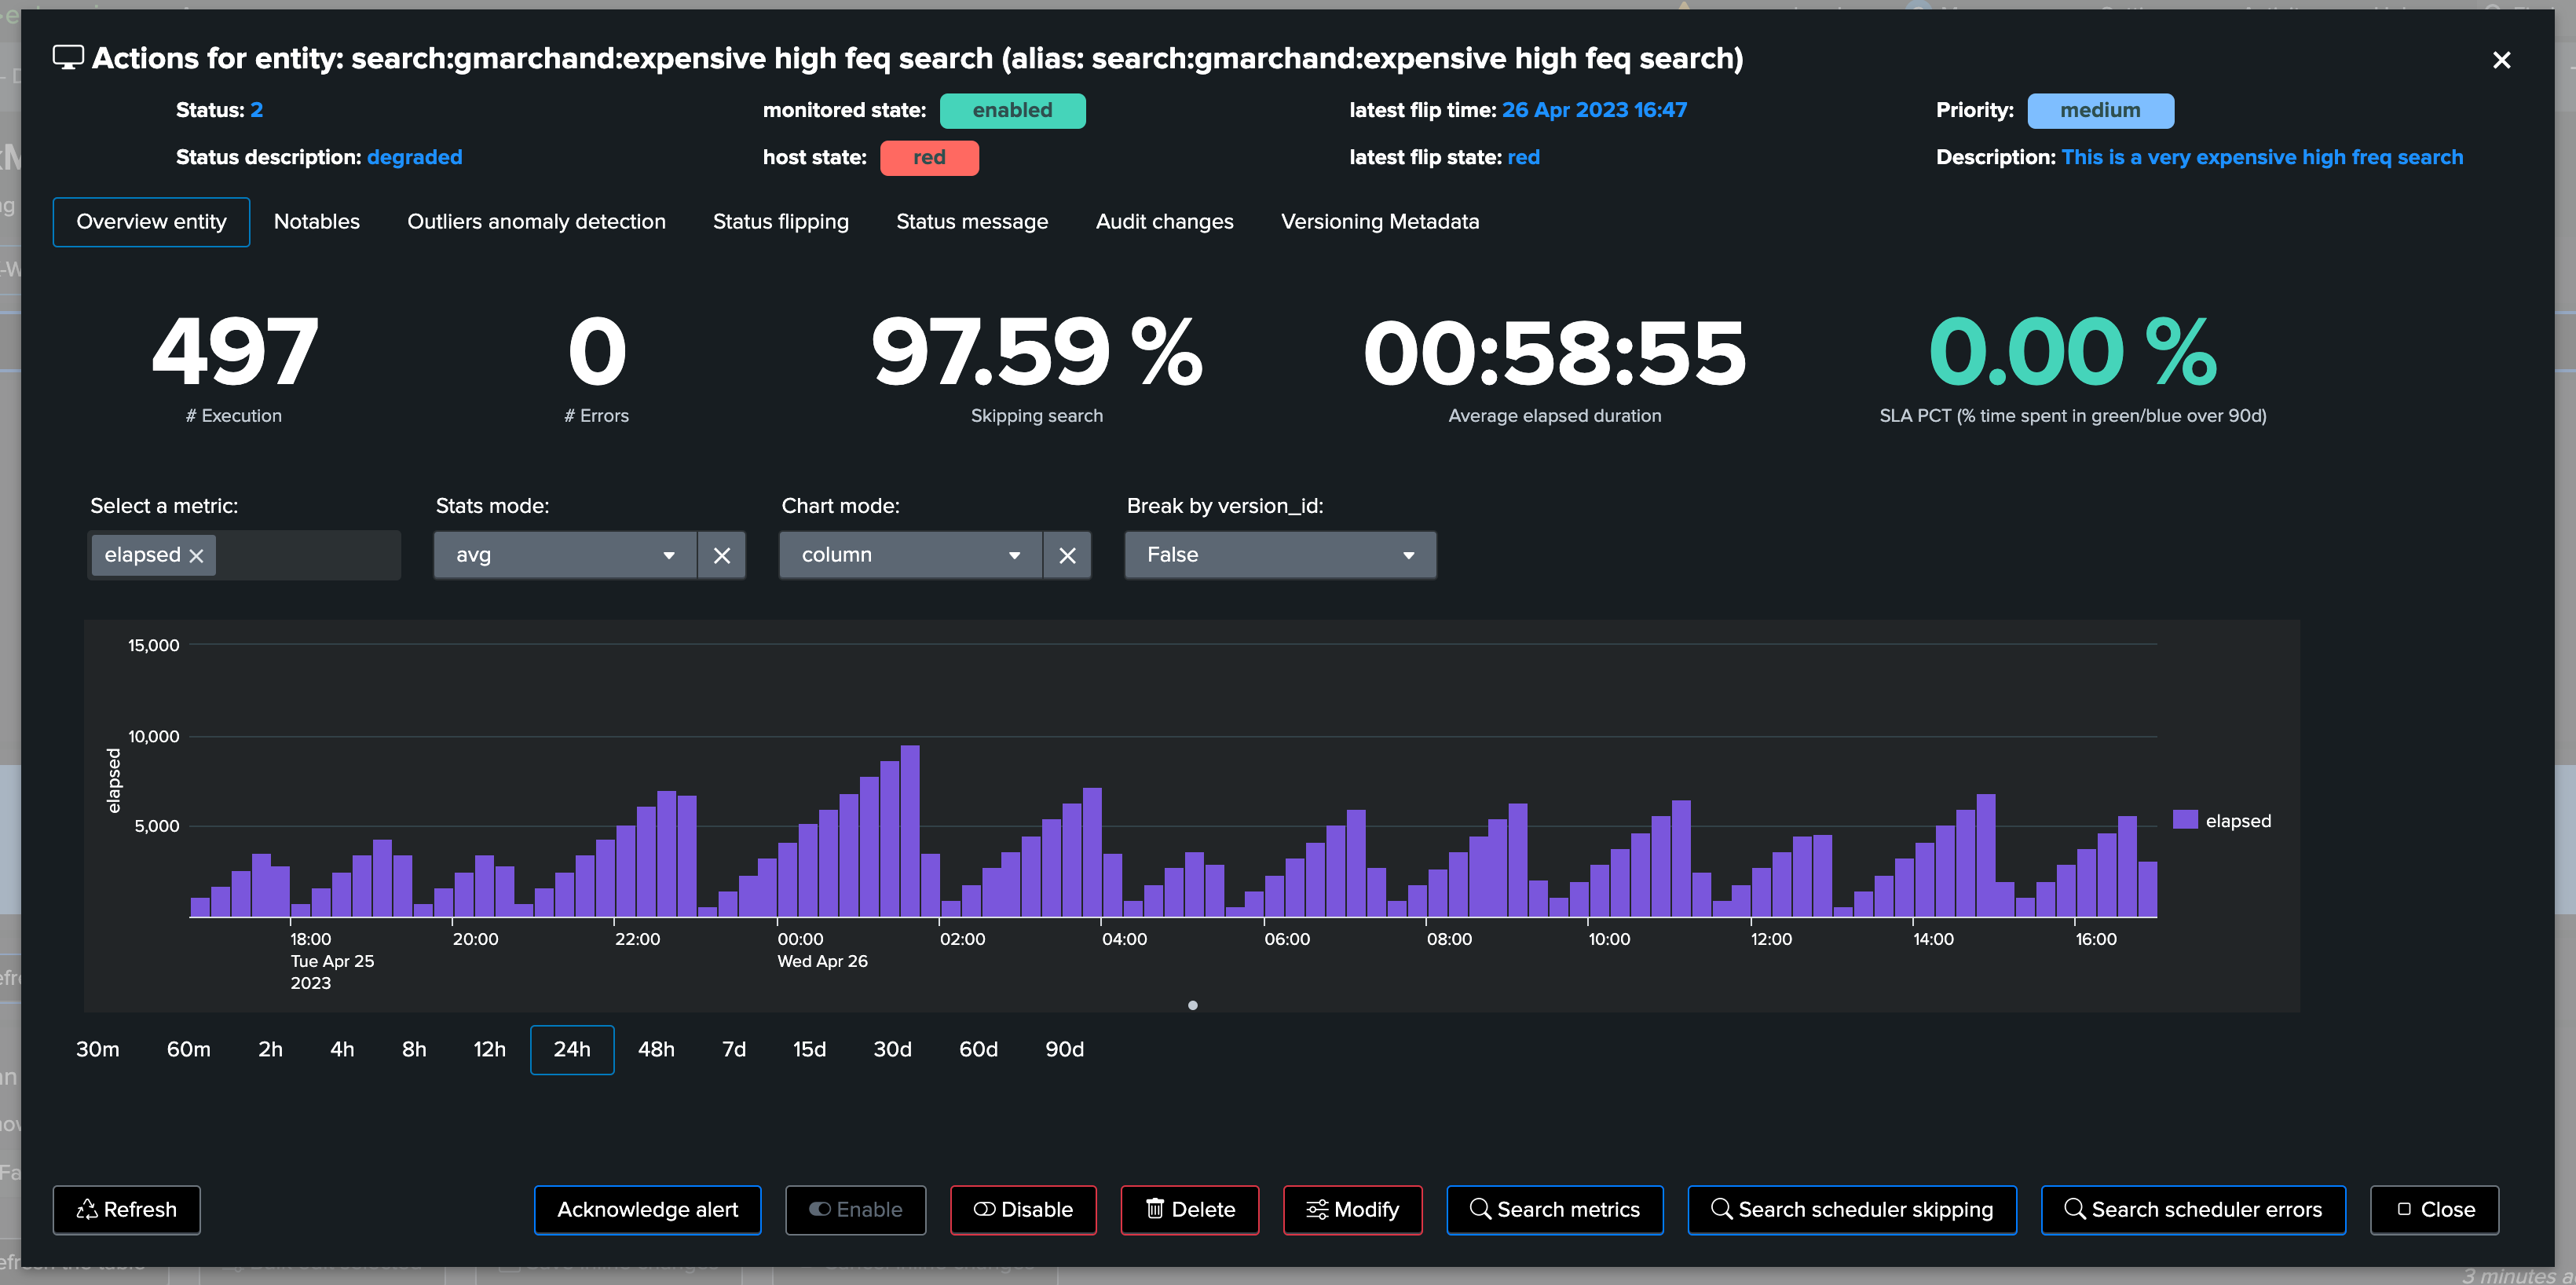
Use the metric selector, and optionally other settings according to your needs, in the following examples, we are looking at the average elapsed for that entity:
5. Metadata Versioning
TrackMe monitors the versioning of scheduled entities, to detect changes and allow linking a knowledge object state with its performance metrics.
Hint
Diff search/earliest/latest (new in TrackMe 2.0.72)
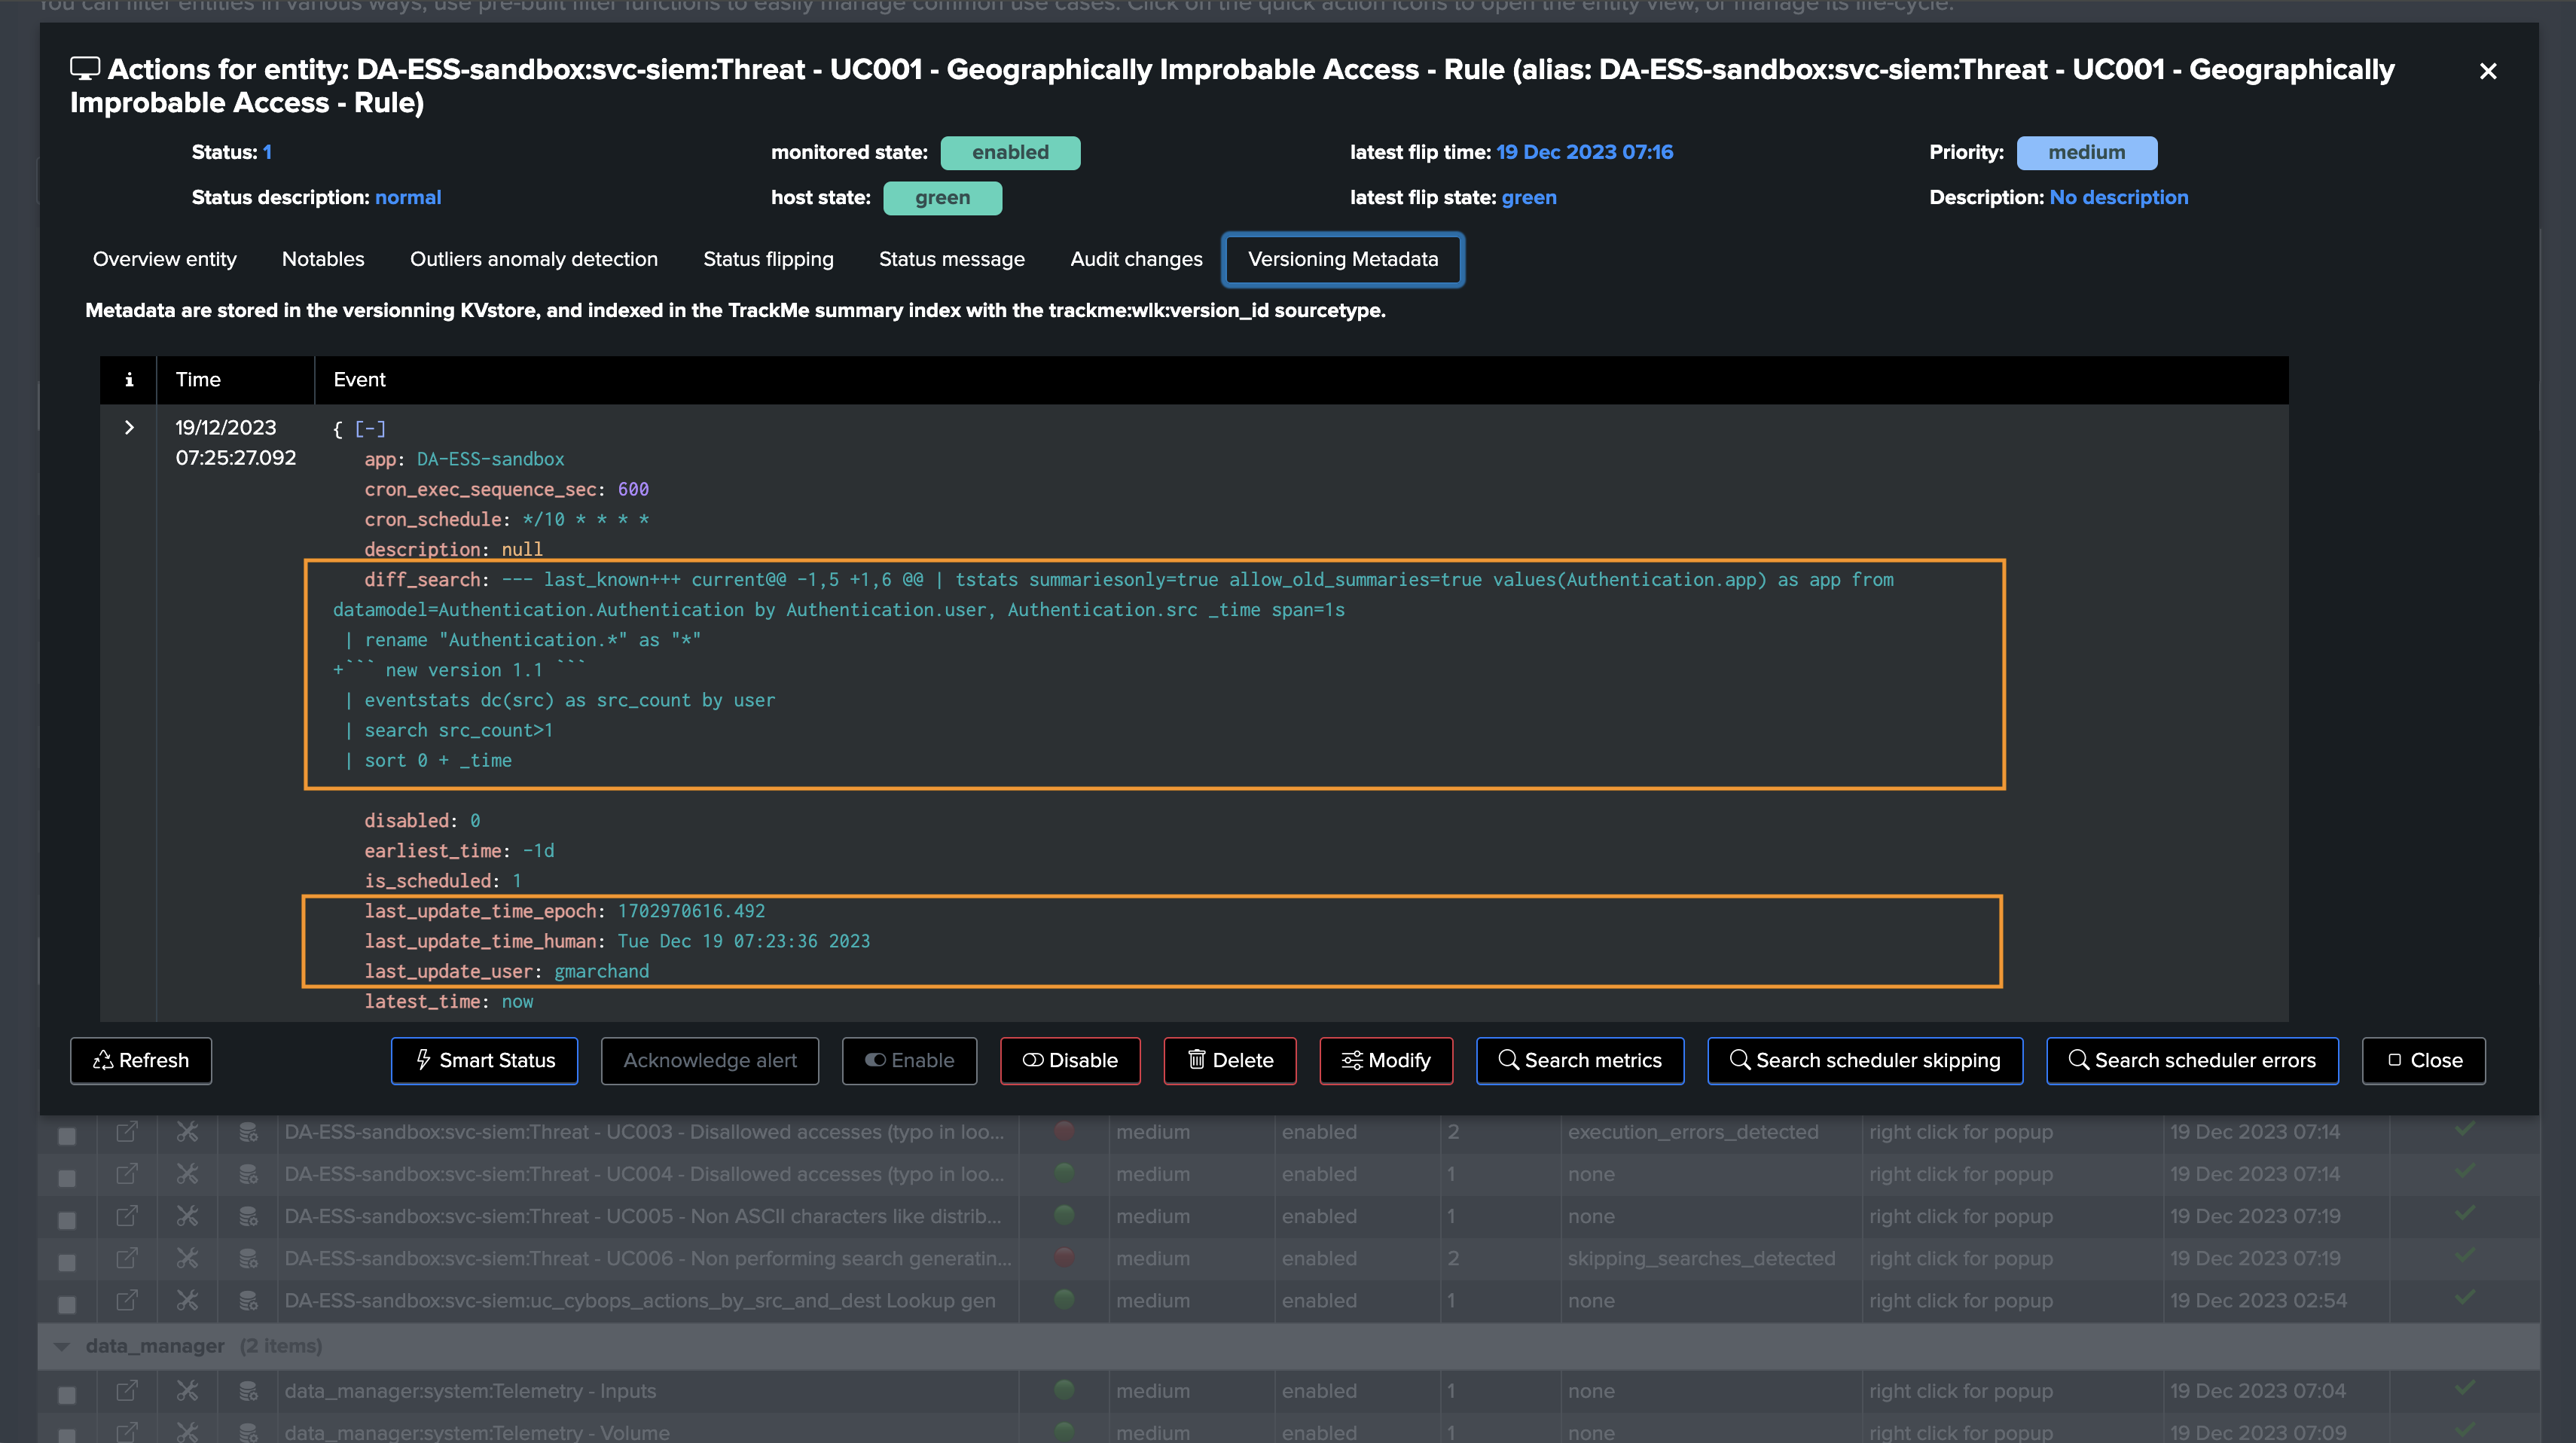
Since TrackMe 2.0.72, the diff of the search and/or earliest/latest quantifiers is performed and stored as part of the versioning events and records
This means that TrackMe automatically identifies the difference of the search when a change is detected against the previously known version, stored as part of the
diff_<context>fieldsIt will also attempt to identify the user that performed the change and when this change occurred (if the change occurred via Splunk Web/Splunk API, not application configuration push)
5.1 How the Metadata Versioning works under the cover
This activity is performed by two associated scheduled TrackMe trackers:
metadata
orphan

Via a Python based integration, TrackMe maintains the knowledge of scheduled entities, and identity a certain state as an MD5 hash which is composed by:
The search code definition, basically the whole SPL statement whatever its complexity is
The earliest time quantifier
The latest time quantifier
5.2 Accessing Metadata information via the UI
Regularly, active entities are inspected, if a change is detected, a new version_id is defined, a new set of Metadata are extracted and stored in a KVstore collection:
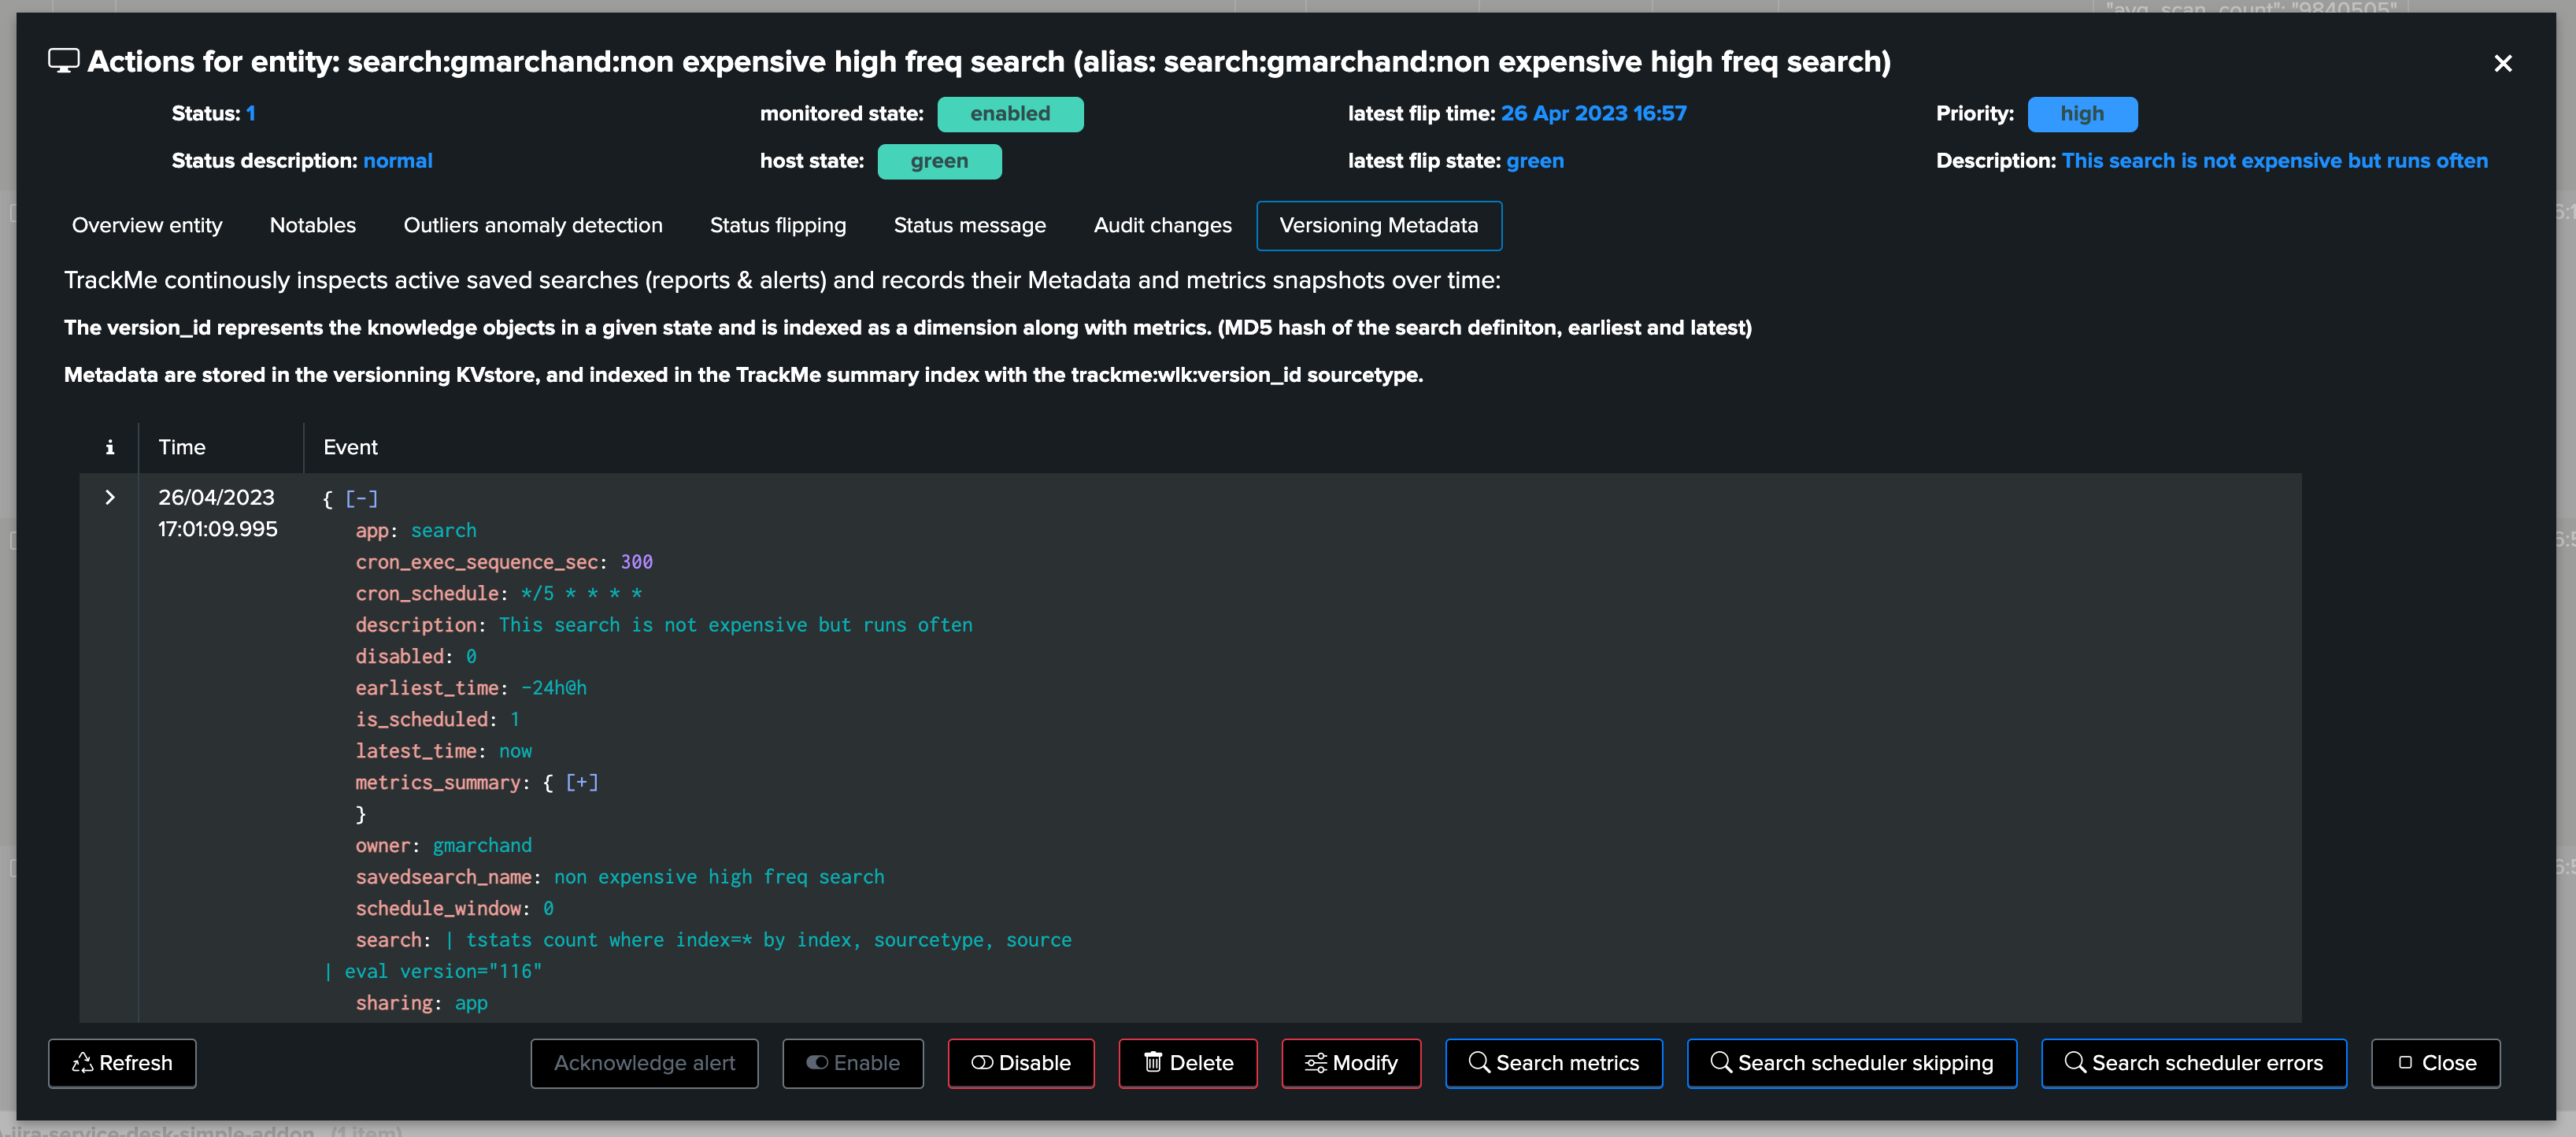
5.3 Accessing Metadata information via the KVstore
The Metadata version is stored in a JSON structure within the KVstore record associated with a given entity, in a persistent fashion:
| inputlookup trackme_wlk_versioning_tenant_<replace with tenant_id> | search object="<replace with object name>"
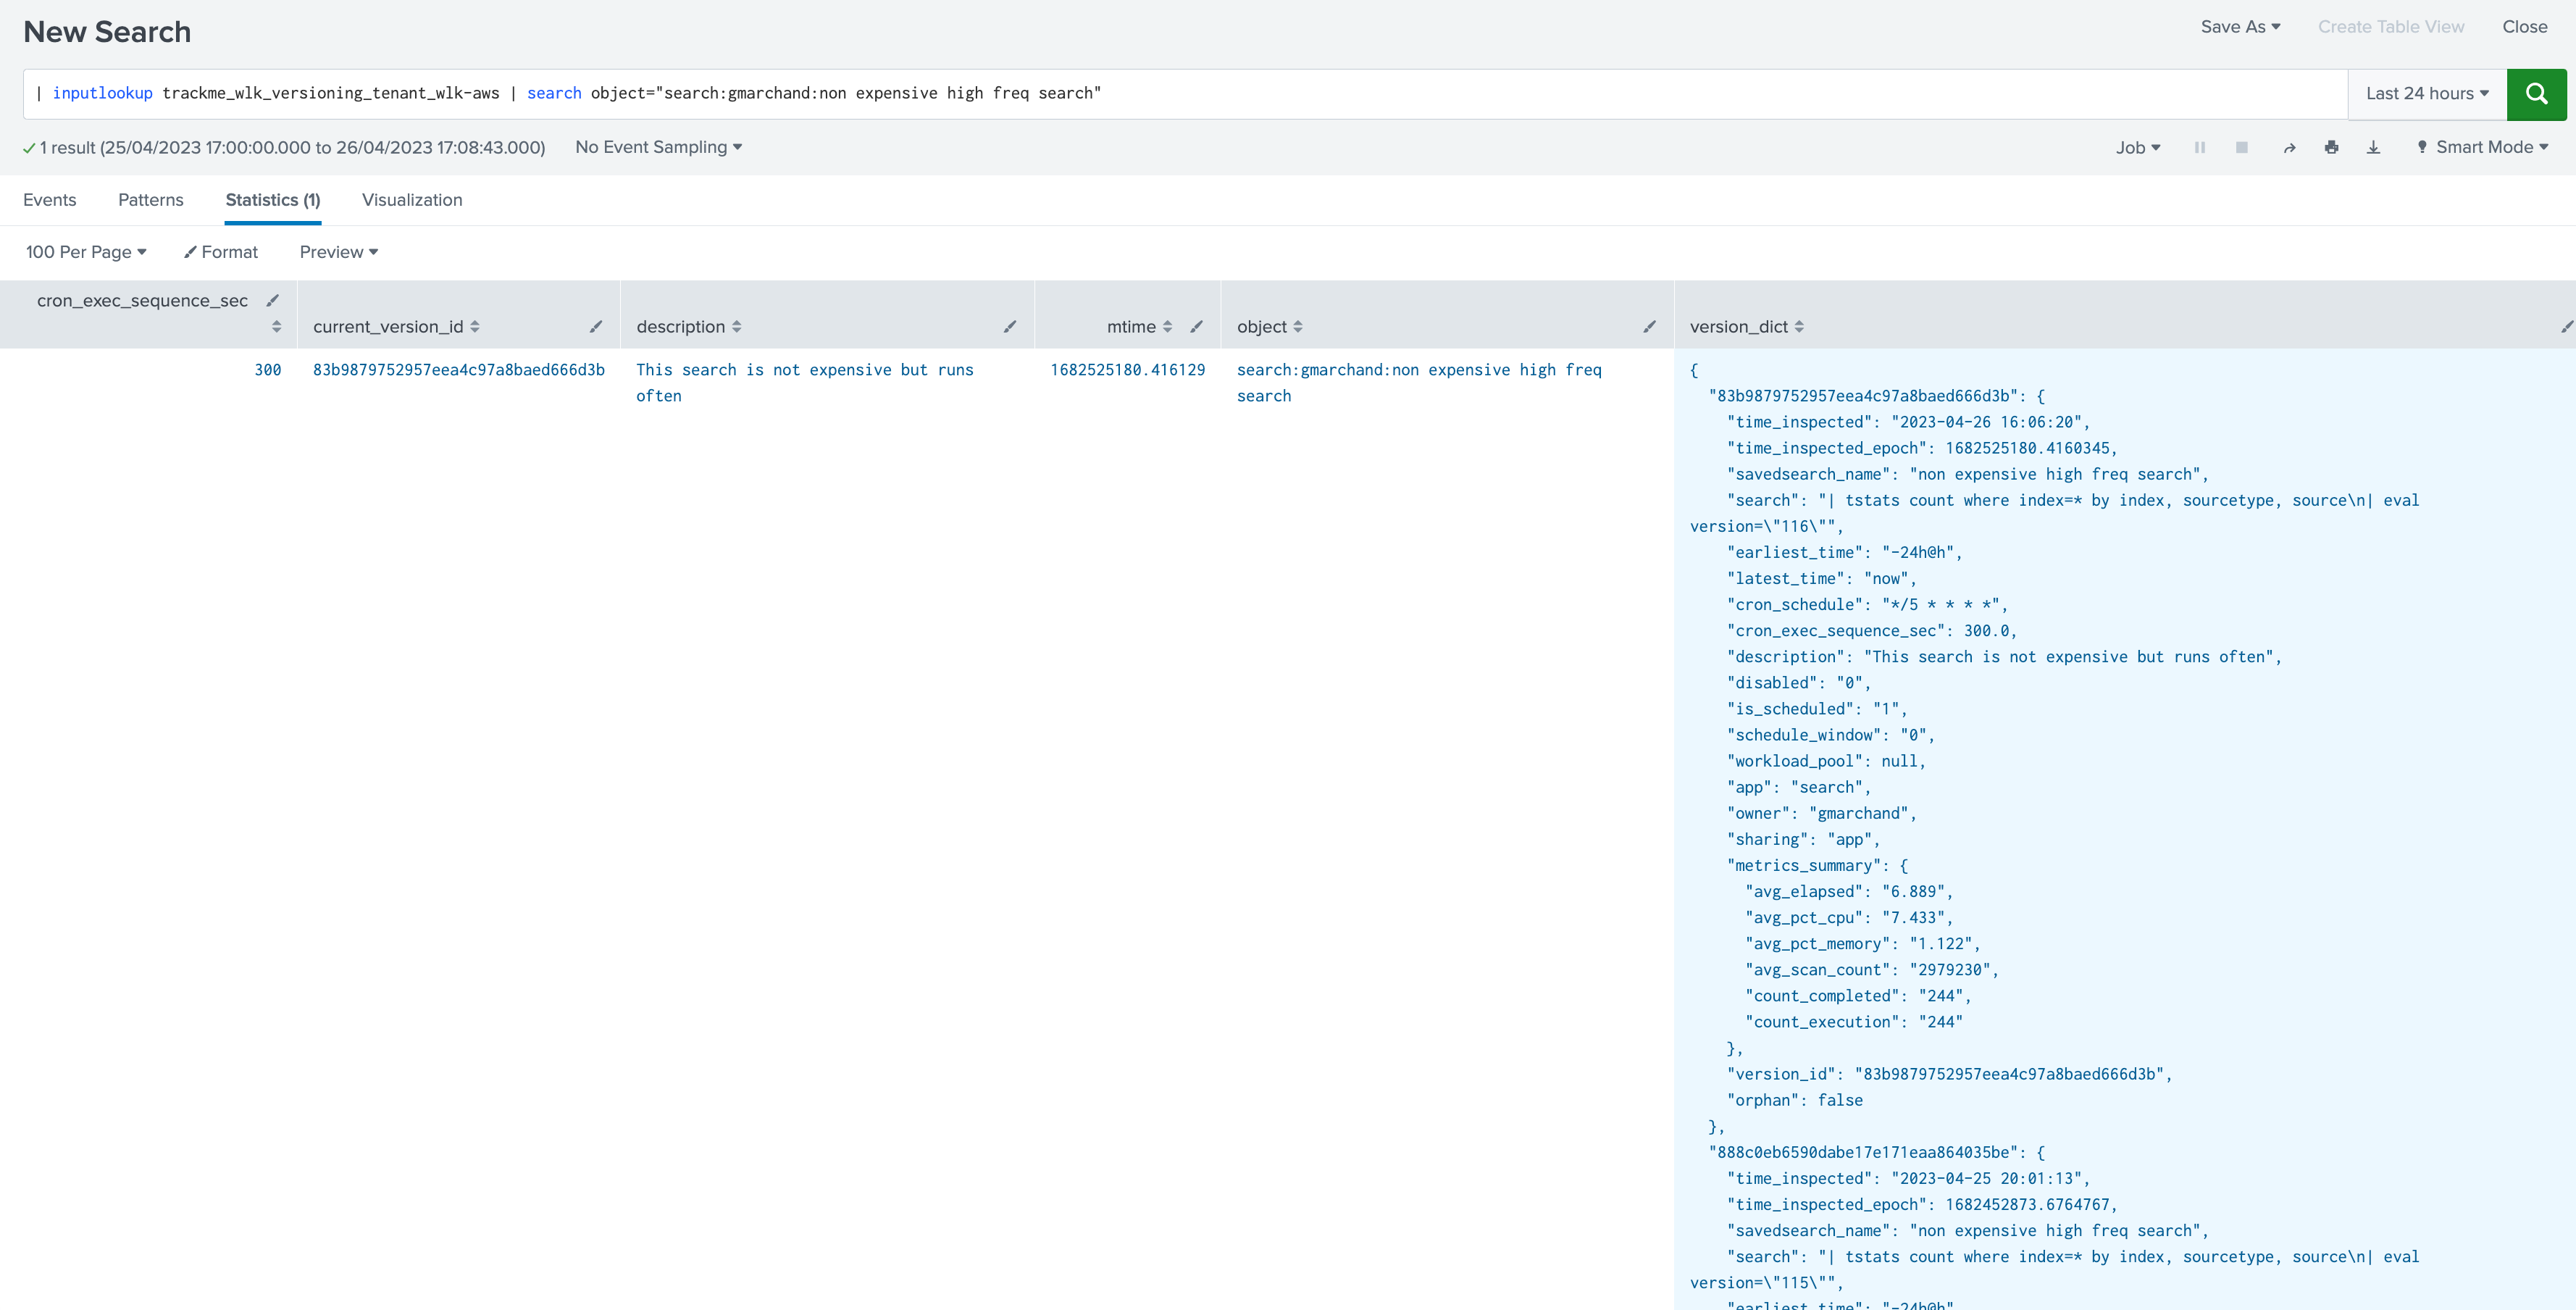
5.4 Accessing Metadata information via TrackMe indexed events
When TrackMe detects a new version of a monitored scheduled entity, it will as well generate an event in the trackme_summary index of the tenant, with the sourcetype:
index=trackme_summary sourcetype=trackme:wlk:version_id tenant_id="<replace with tenant_id> object="<replace with object name>"
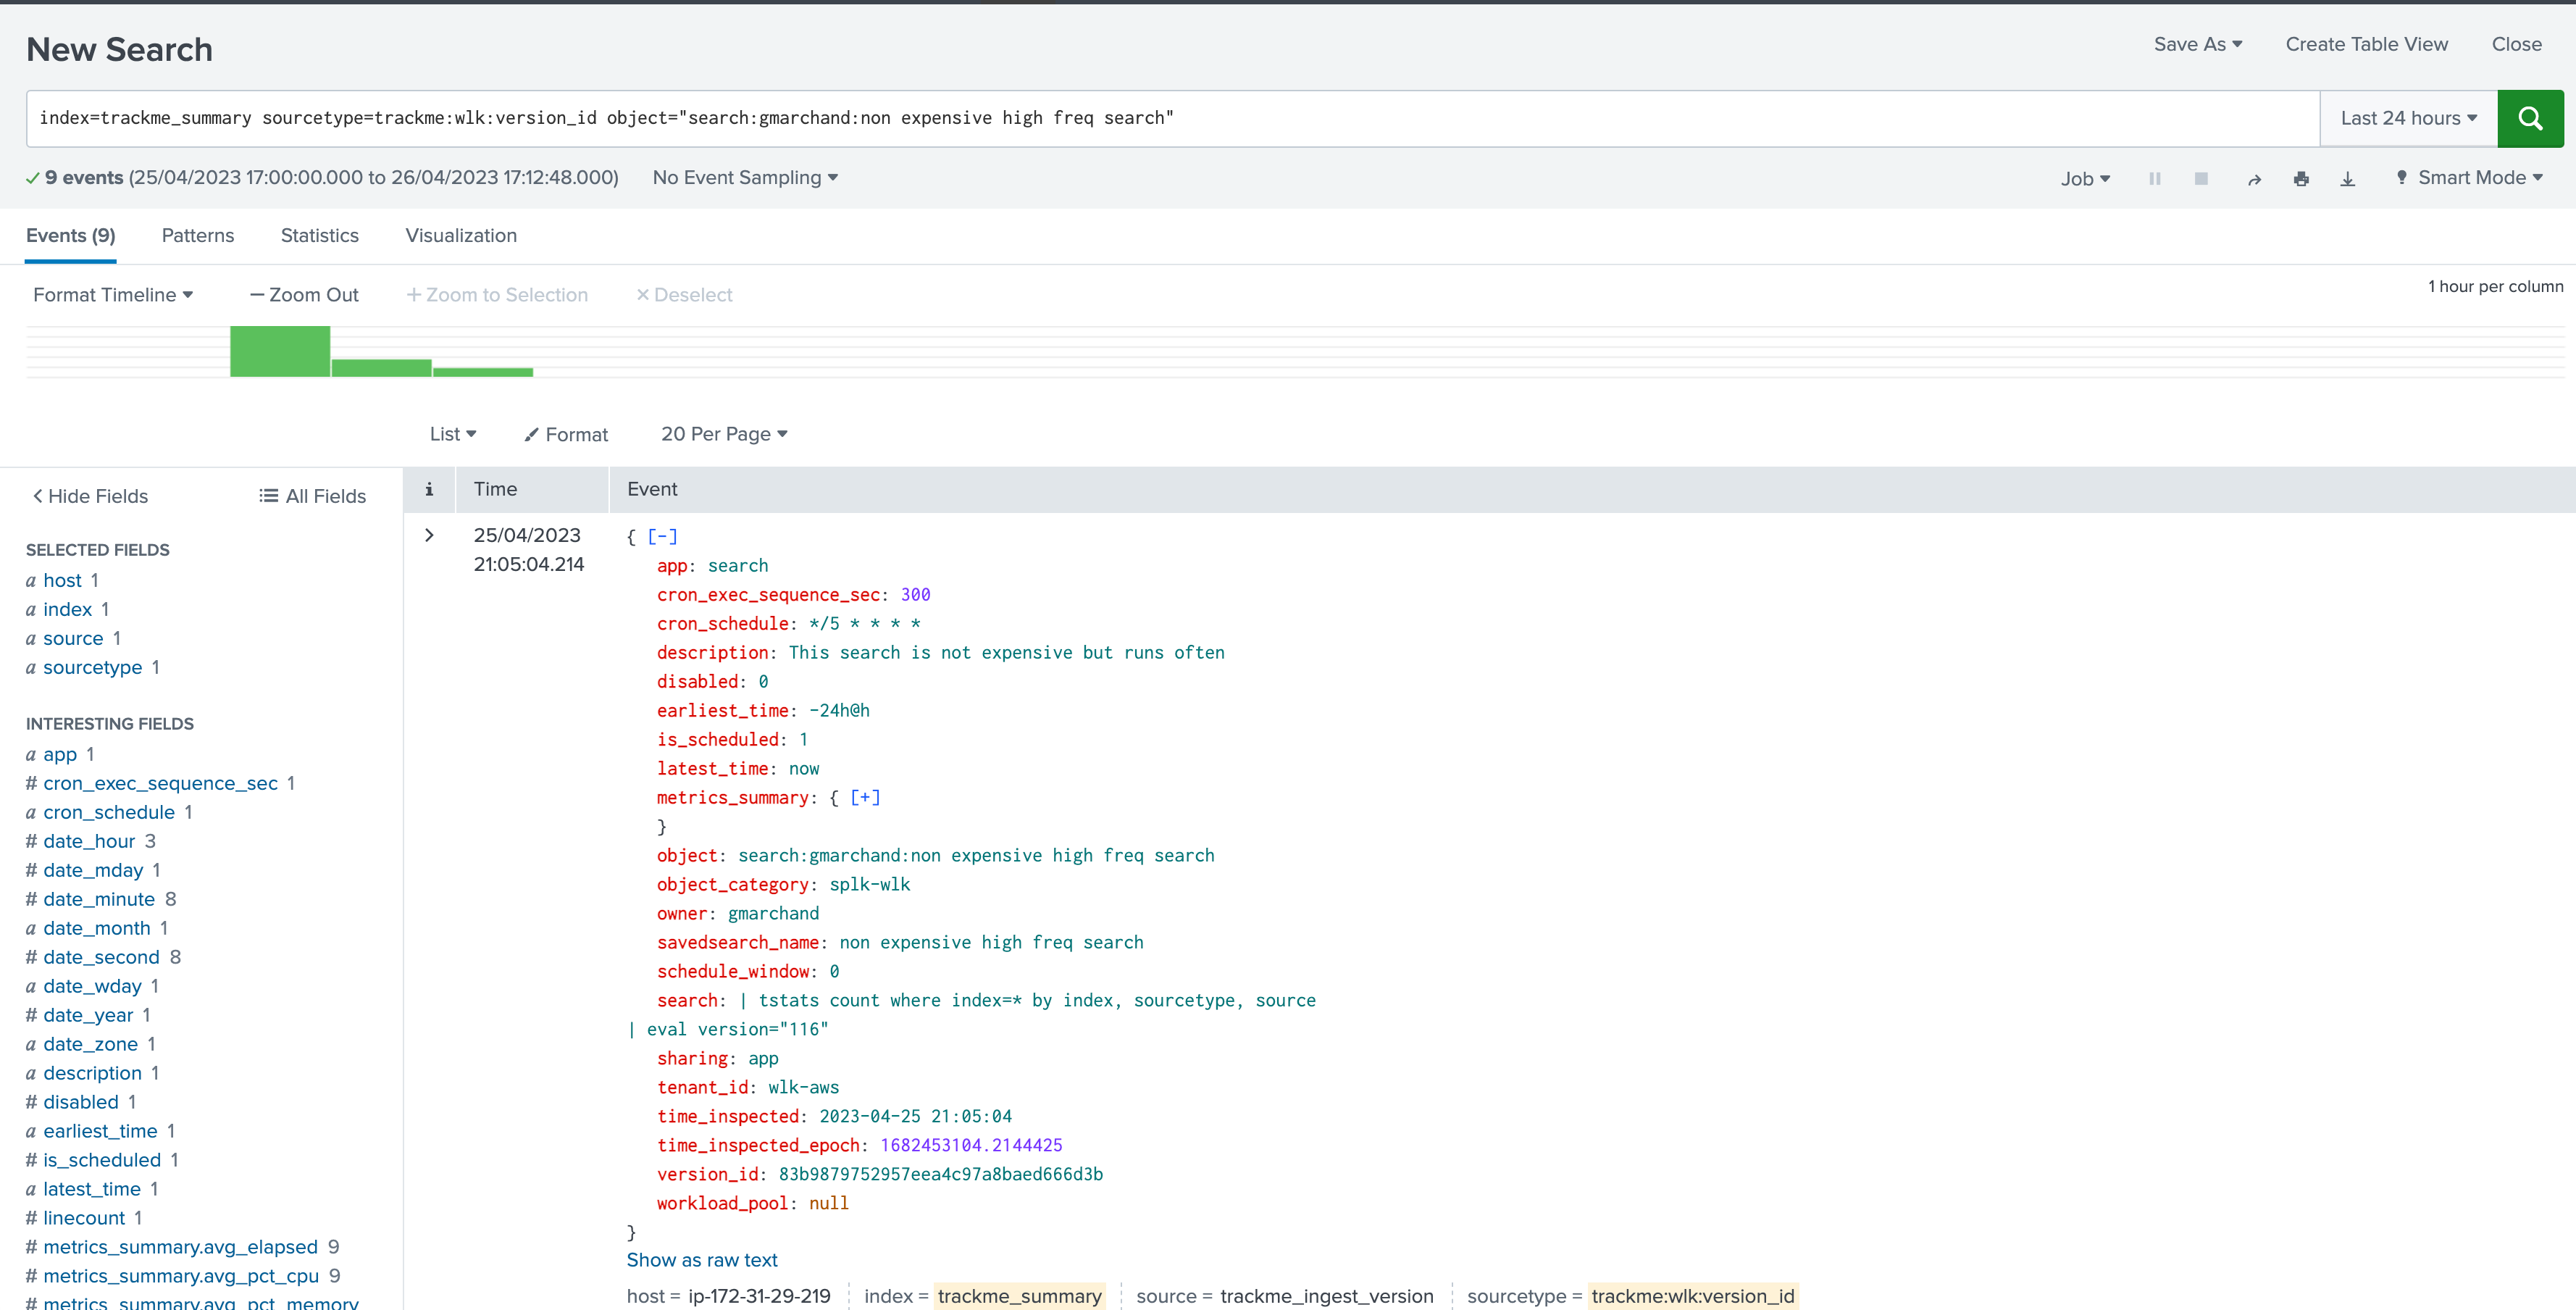
5.5 Use cases for versioning
So, what are the use cases for the versioning TrackMe feature, associated with TrackMe’s workflow, incident management, metrics generation and so forth? There are many valuable use cases of course.
For instance, it becomes fairly easy to link a change in the search logic to a massive increase of its run time or computing costs, potentially suddenly leading to alerts in TrackMe caused by skipping searches.
When accessing the metrics overview, use the break down selector to add the version_id as part of the break by statement:
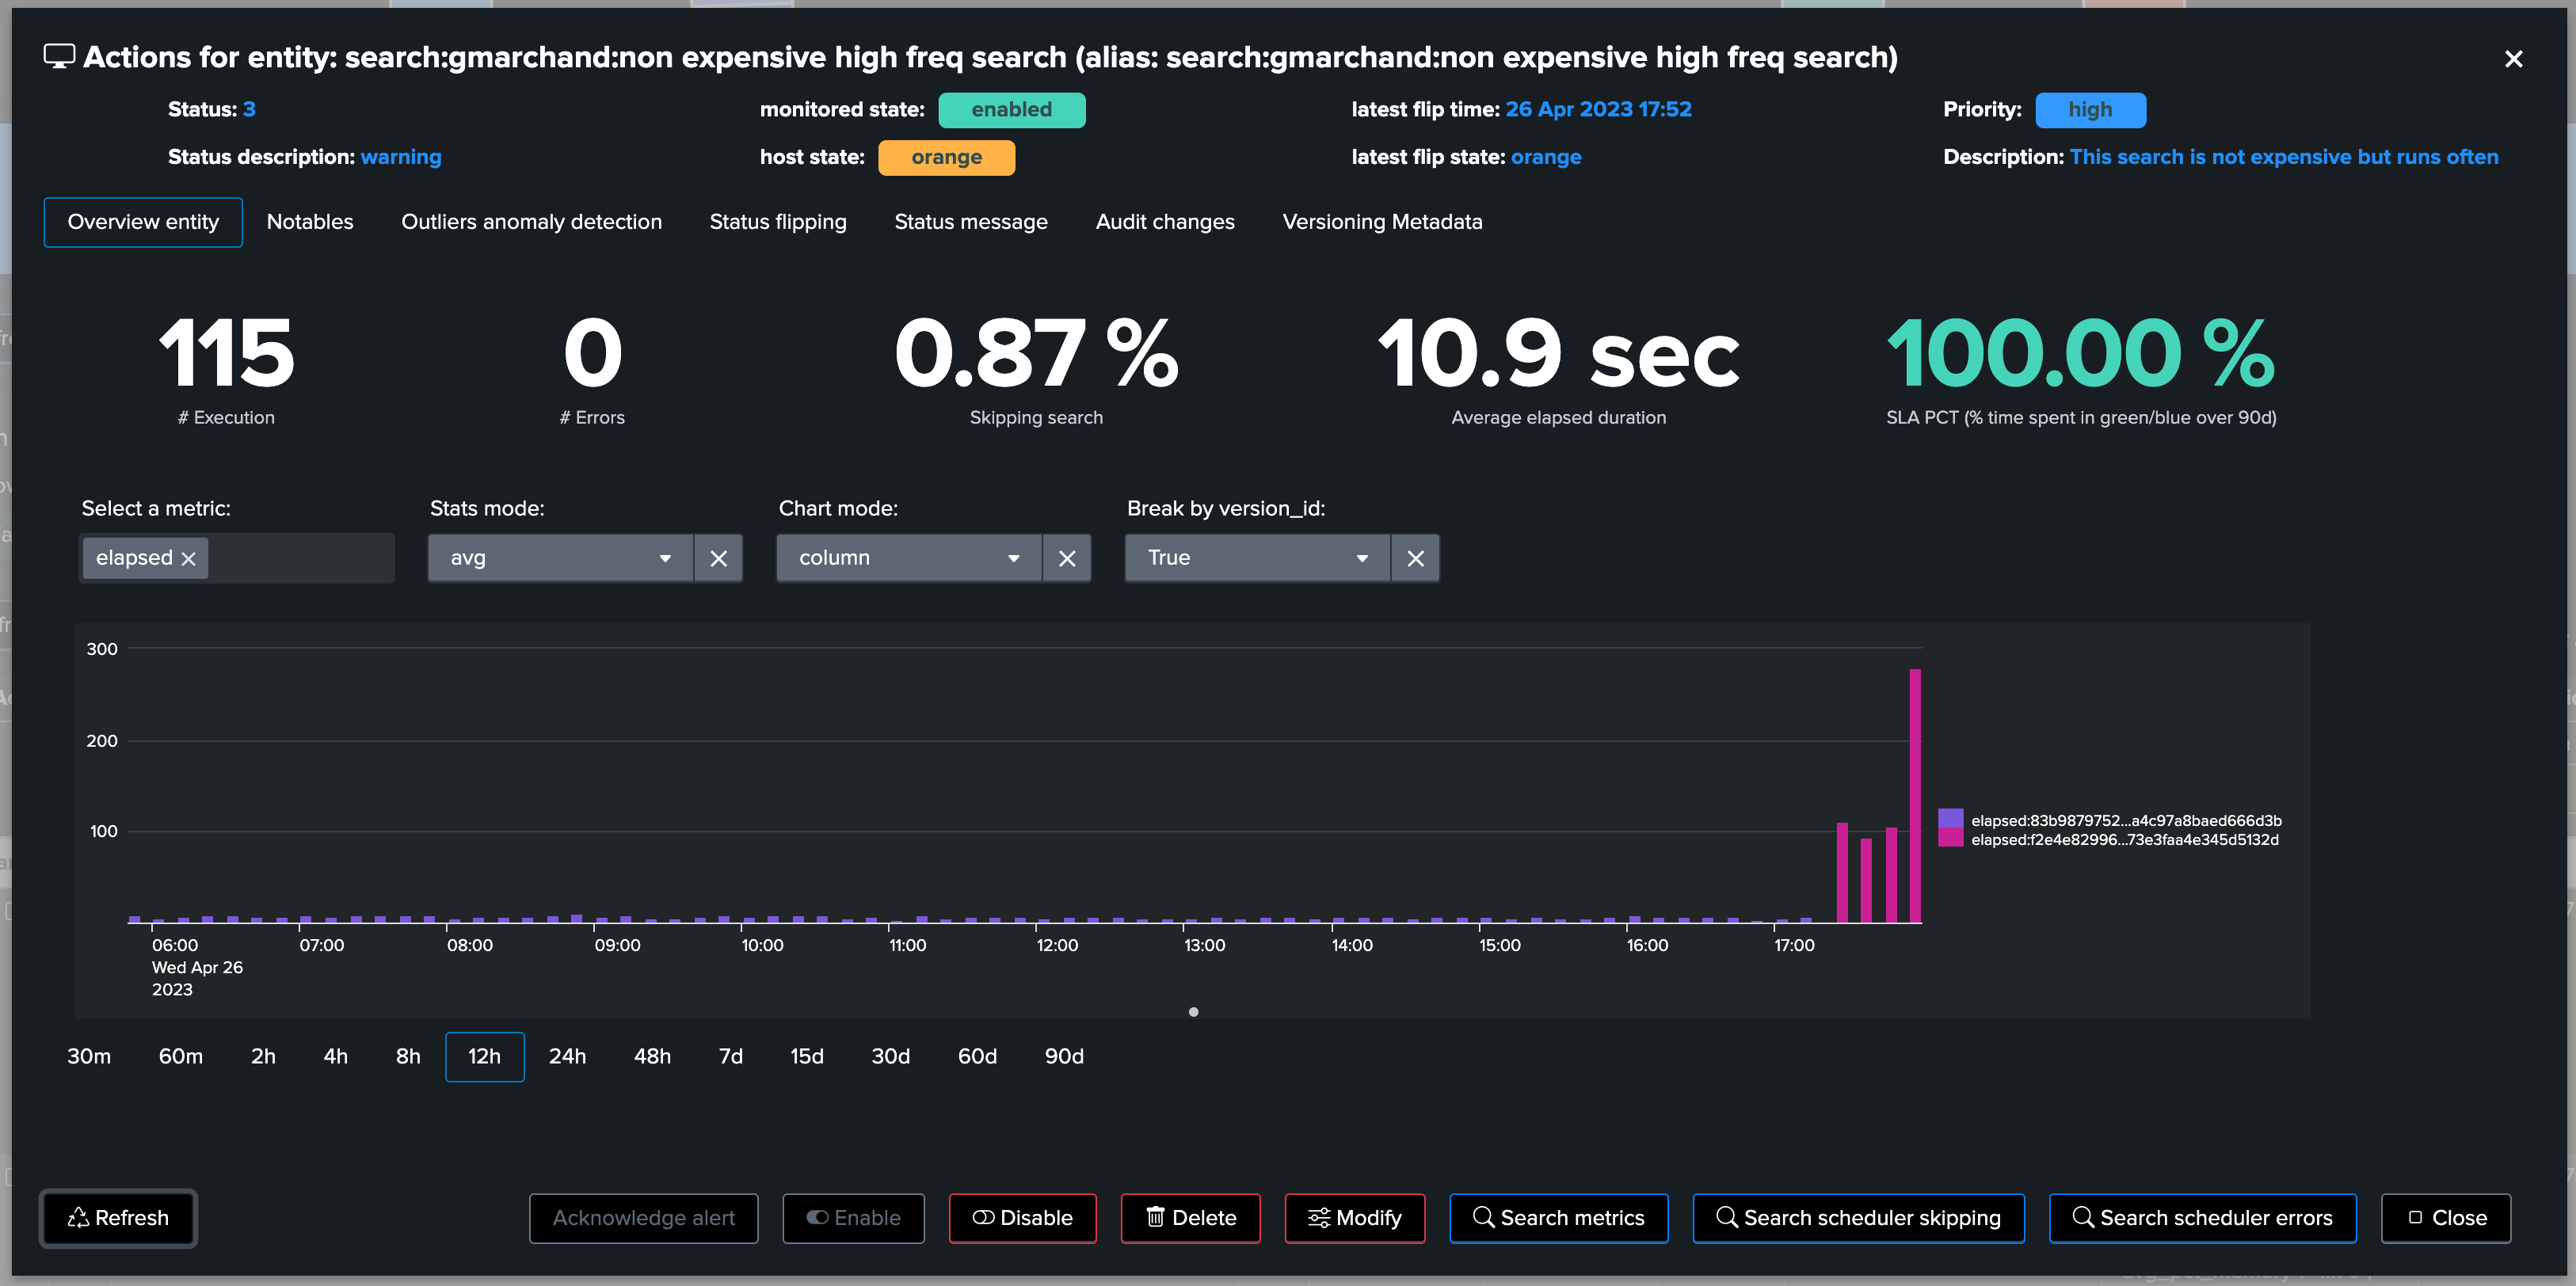
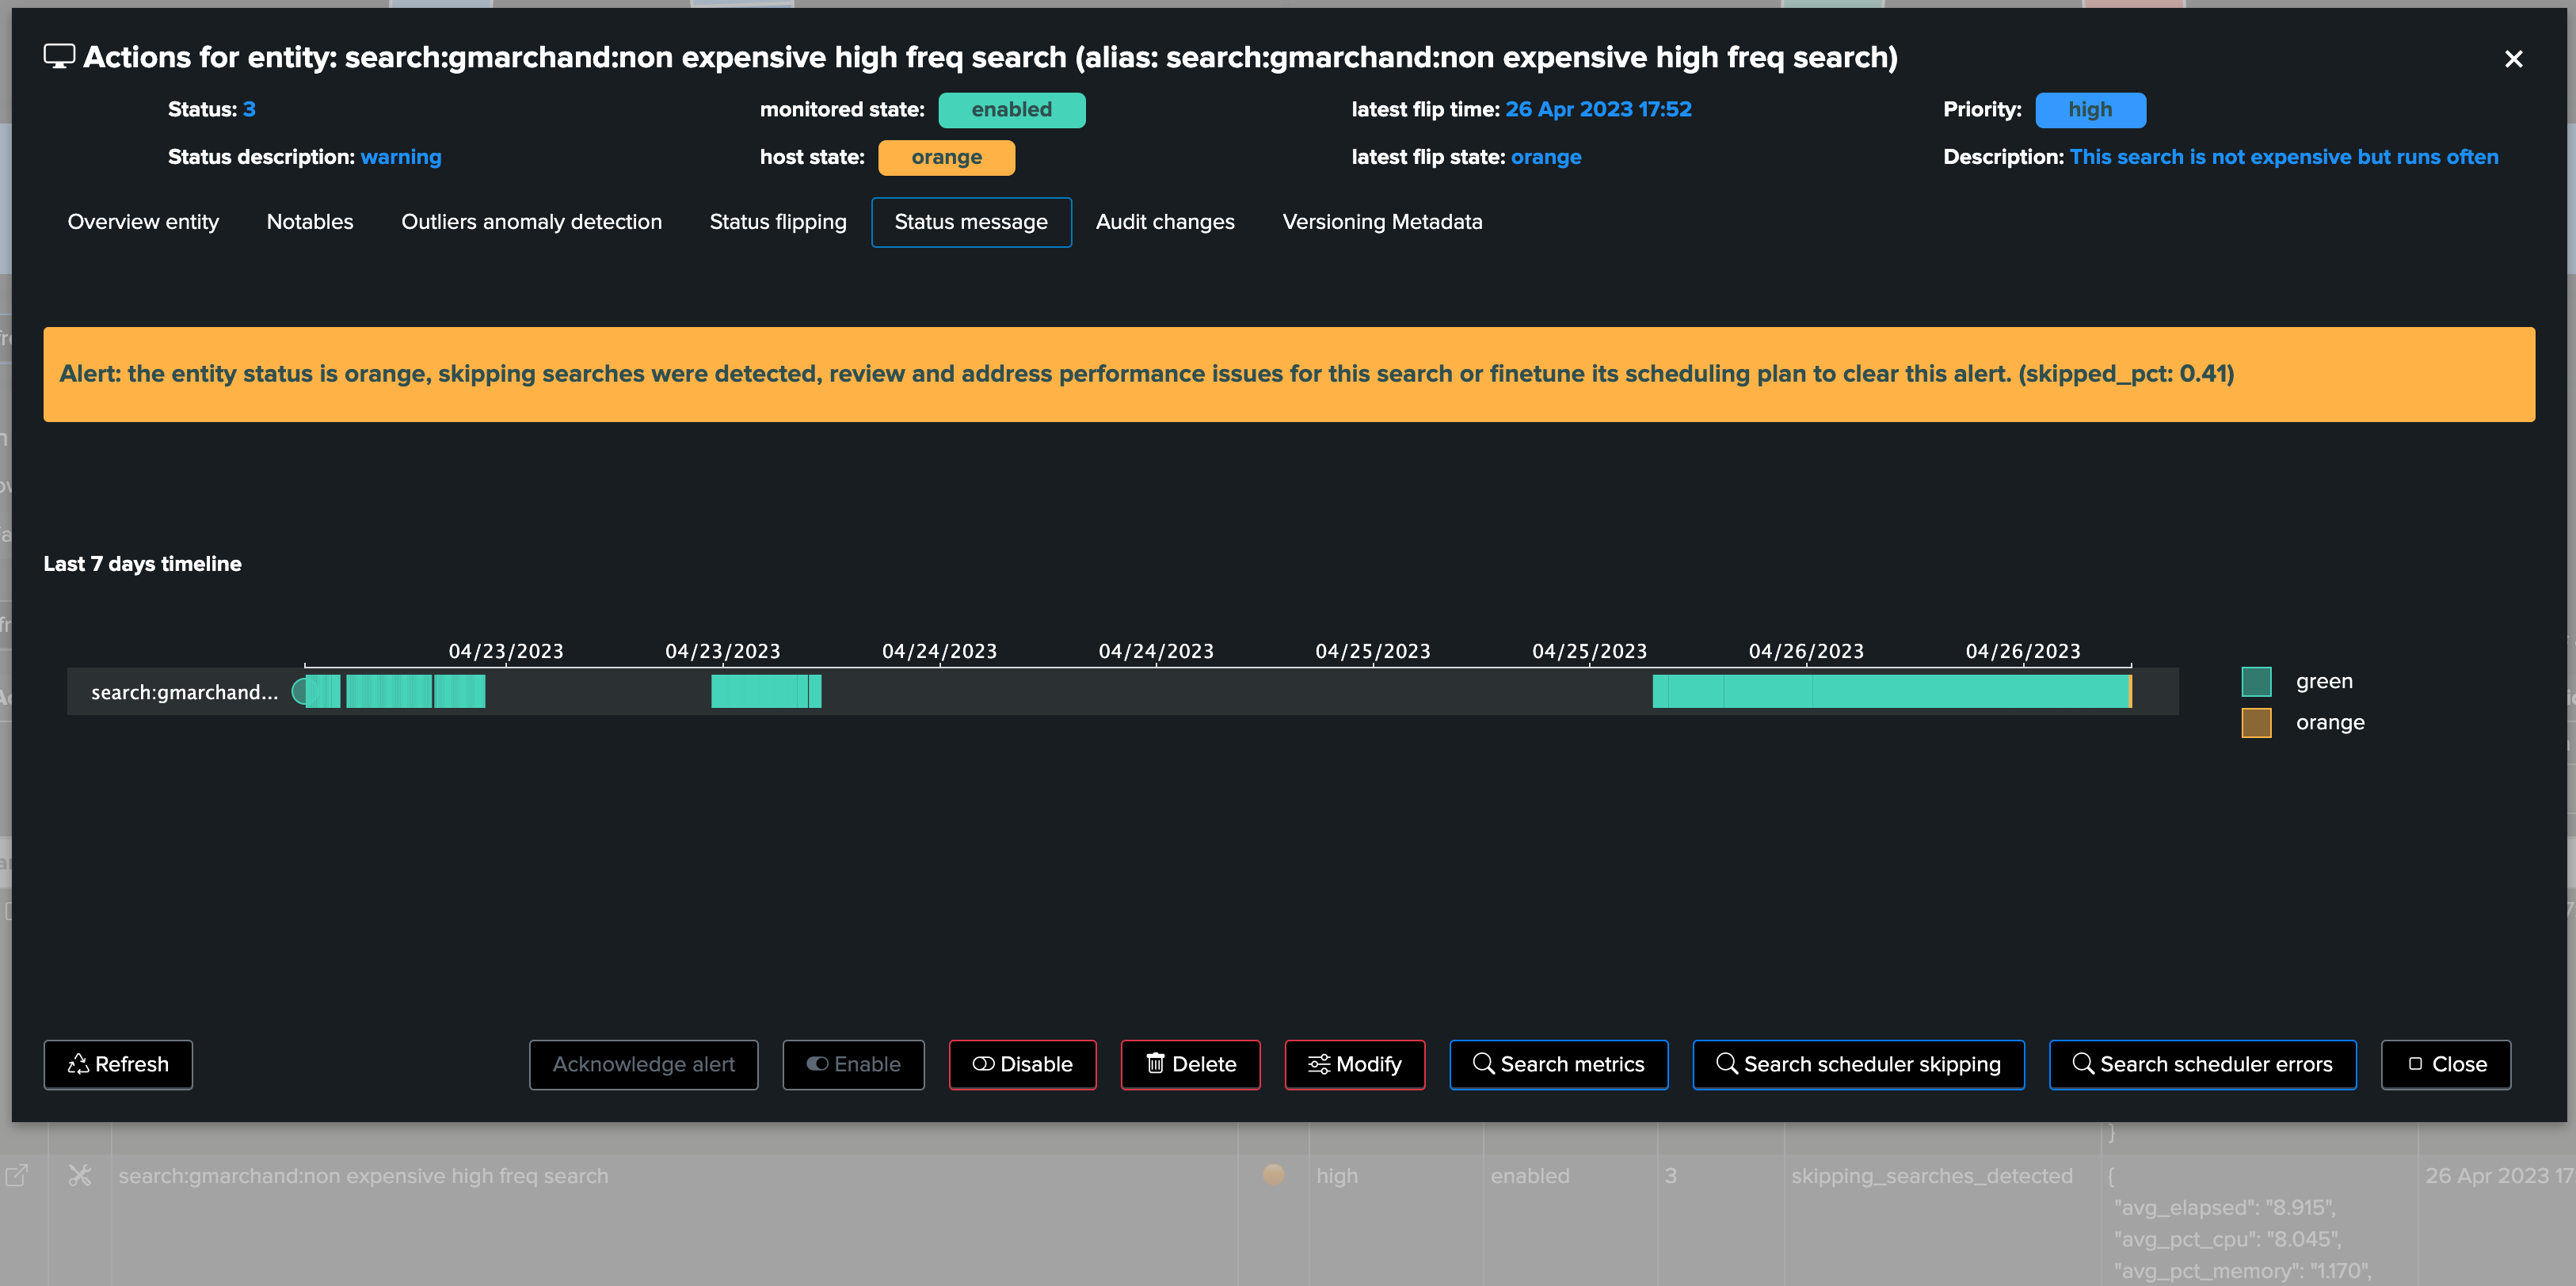
Perhaps TrackMe started to detect bad behaviour of the scheduled object, for instance starting to generate a certain level of skipping searches:
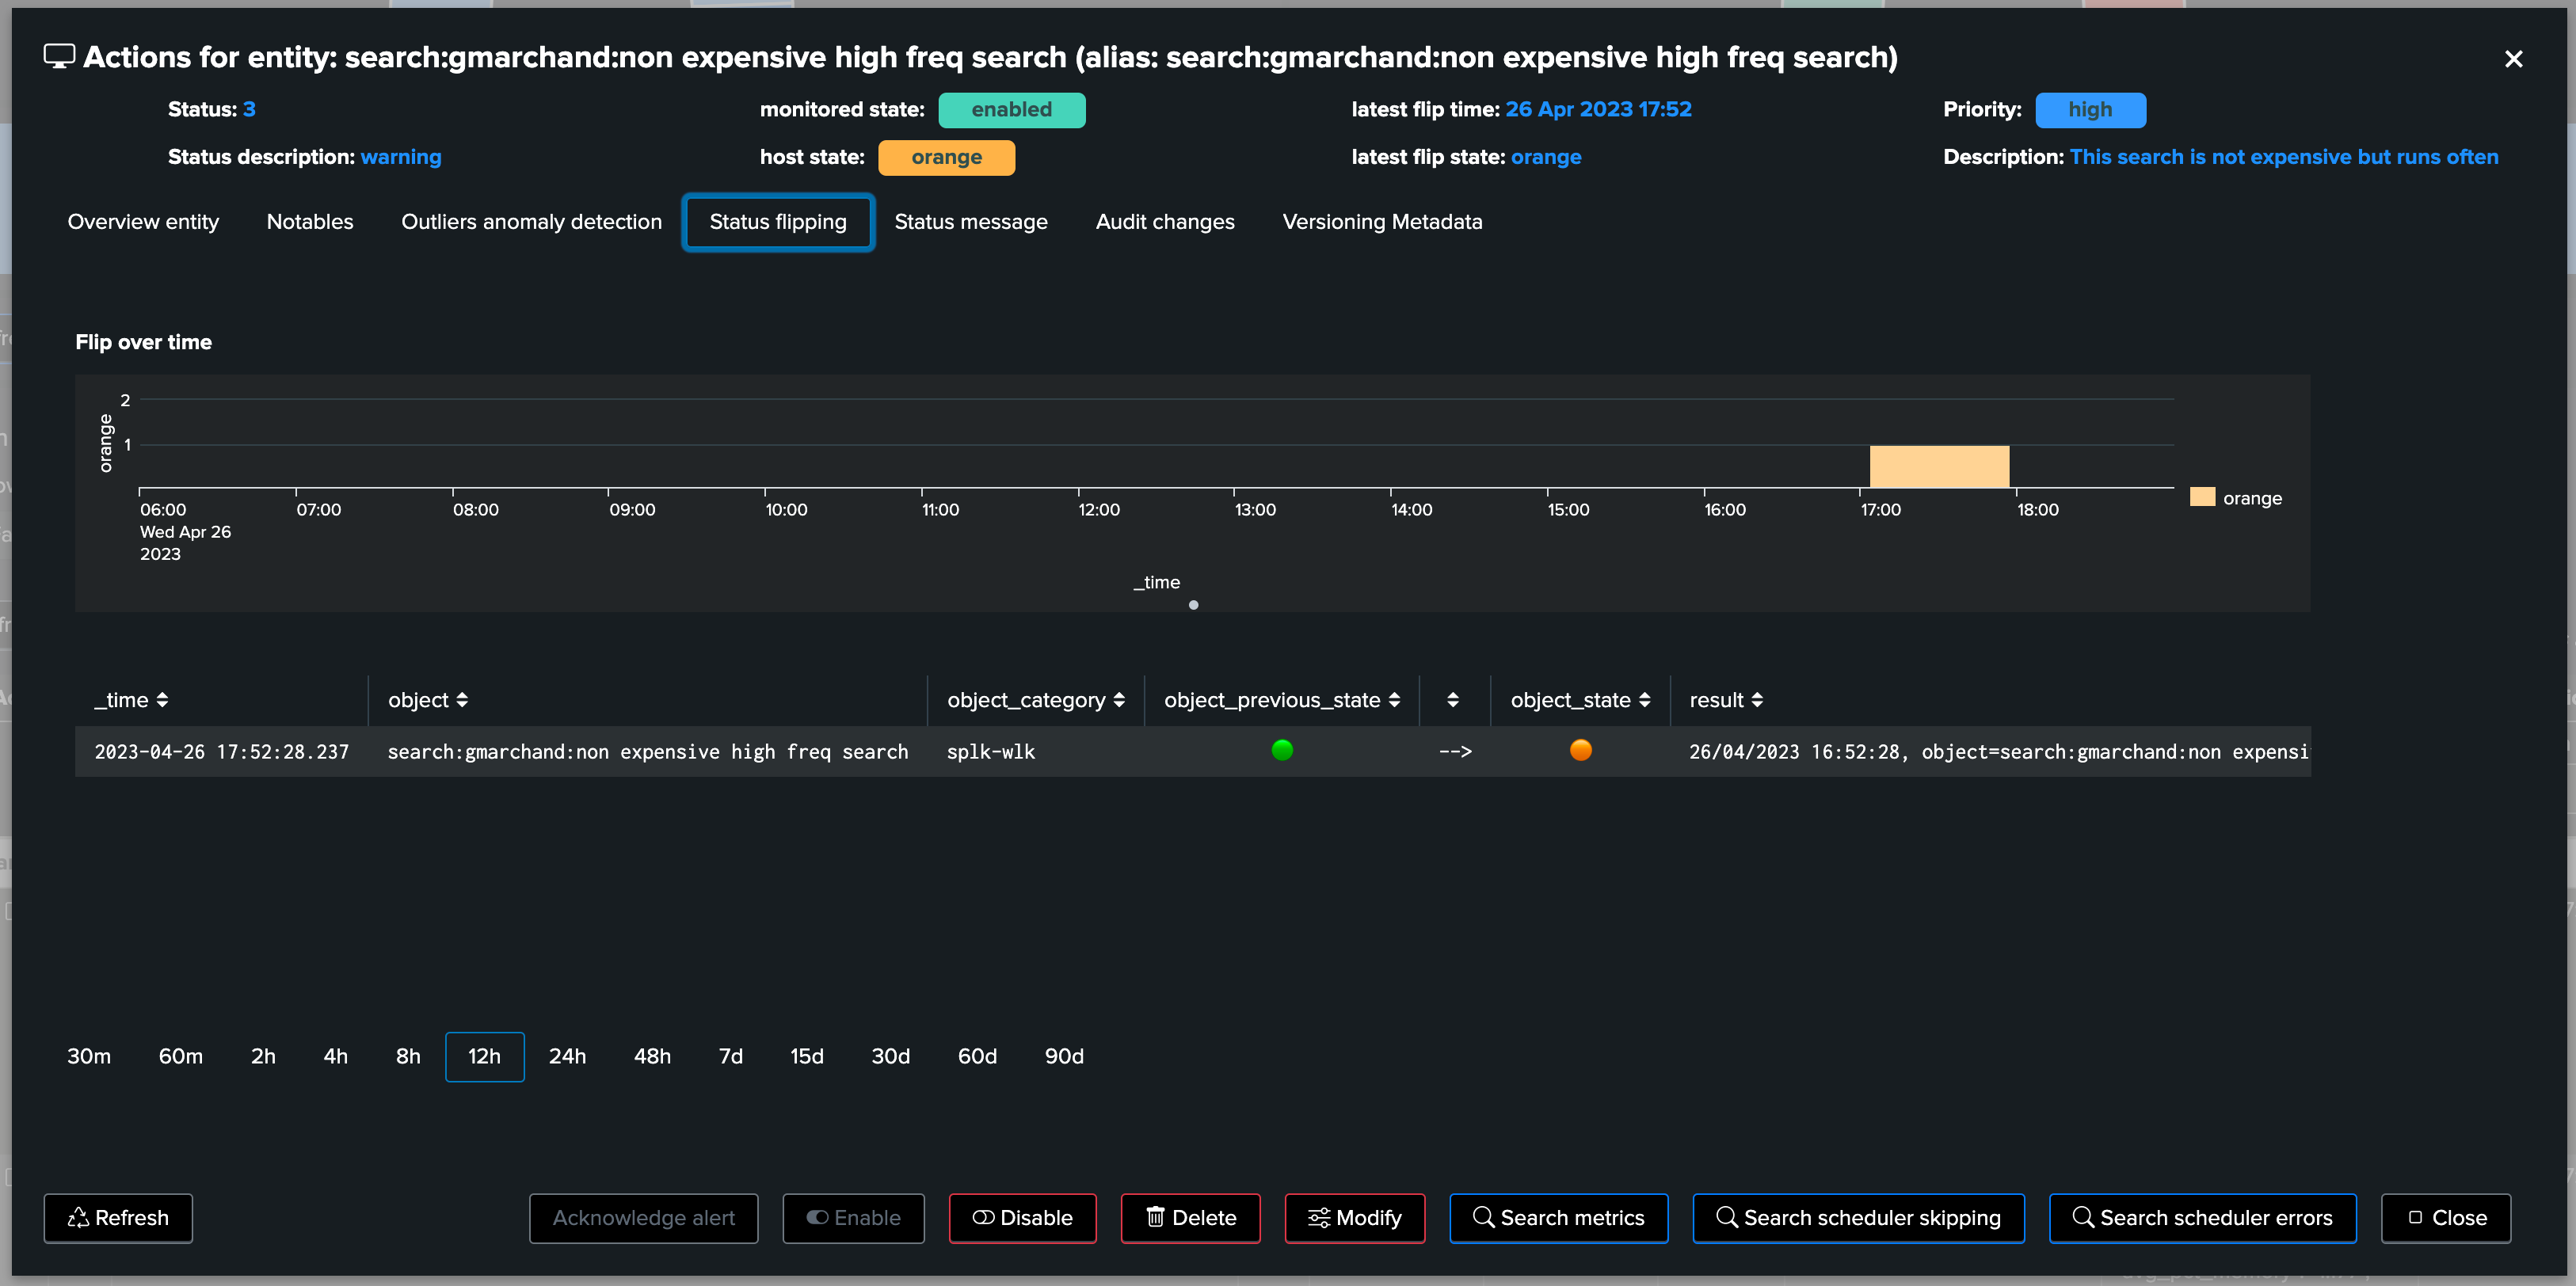
Wait what, don’t we have information about flipping statuses? We also know the “when”:
As we can see in the chart, a clear increase in in the elapsed (run time in seconds) became suddenly visible, which we have been able to easily associate with a change of the Splunk knowledge object itself:
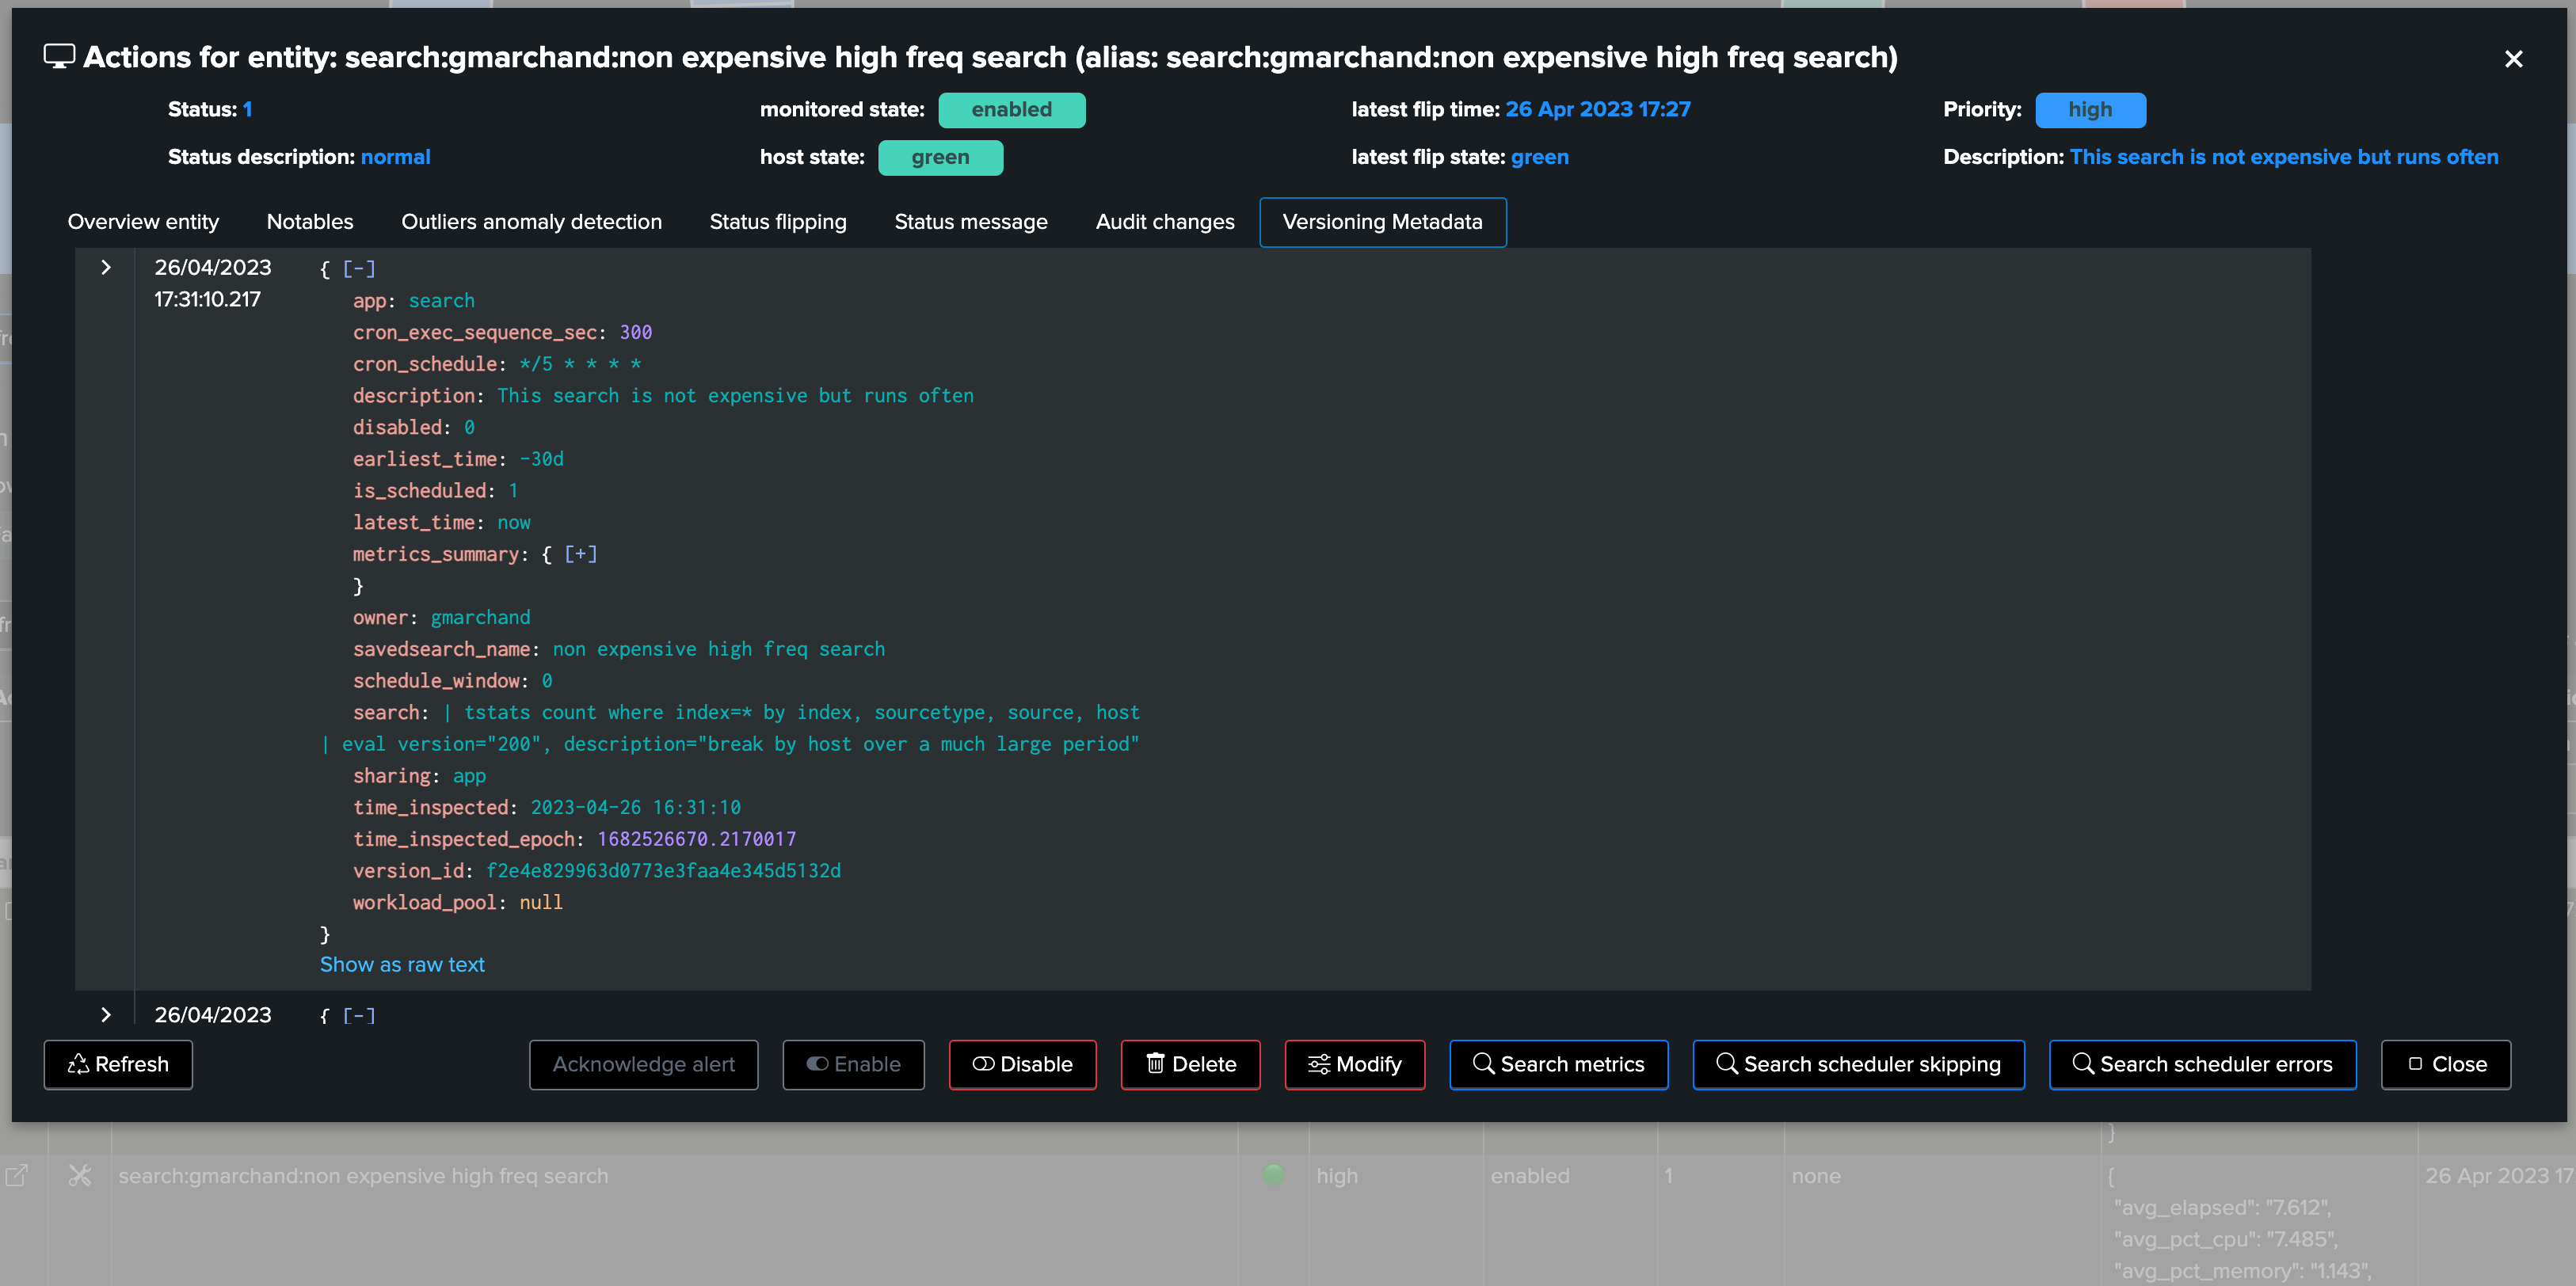
A search which was very efficient suddenly starts consuming a huge amount of resources, potentially impacting the functional use case itself, perhaps even the platform and starting to cost real money to the company, with the need for additional resources and so forth!
Use cases for the Workload features and the versioning are legions, its value grows exponentially along with your deployment size, scale and maturity.
6. Delayed searches execution detection
As part of the Workload component, TrackMe verifies that scheduled entities have been executing properly according to their requested schedule.
A delayed search execution can have severe implications, from a functional perspective this can mean security events which are not considered properly for instance, with all the range of potential consequences.
This verification is called “execution_delayed” anomaly reason status, and works the following way:
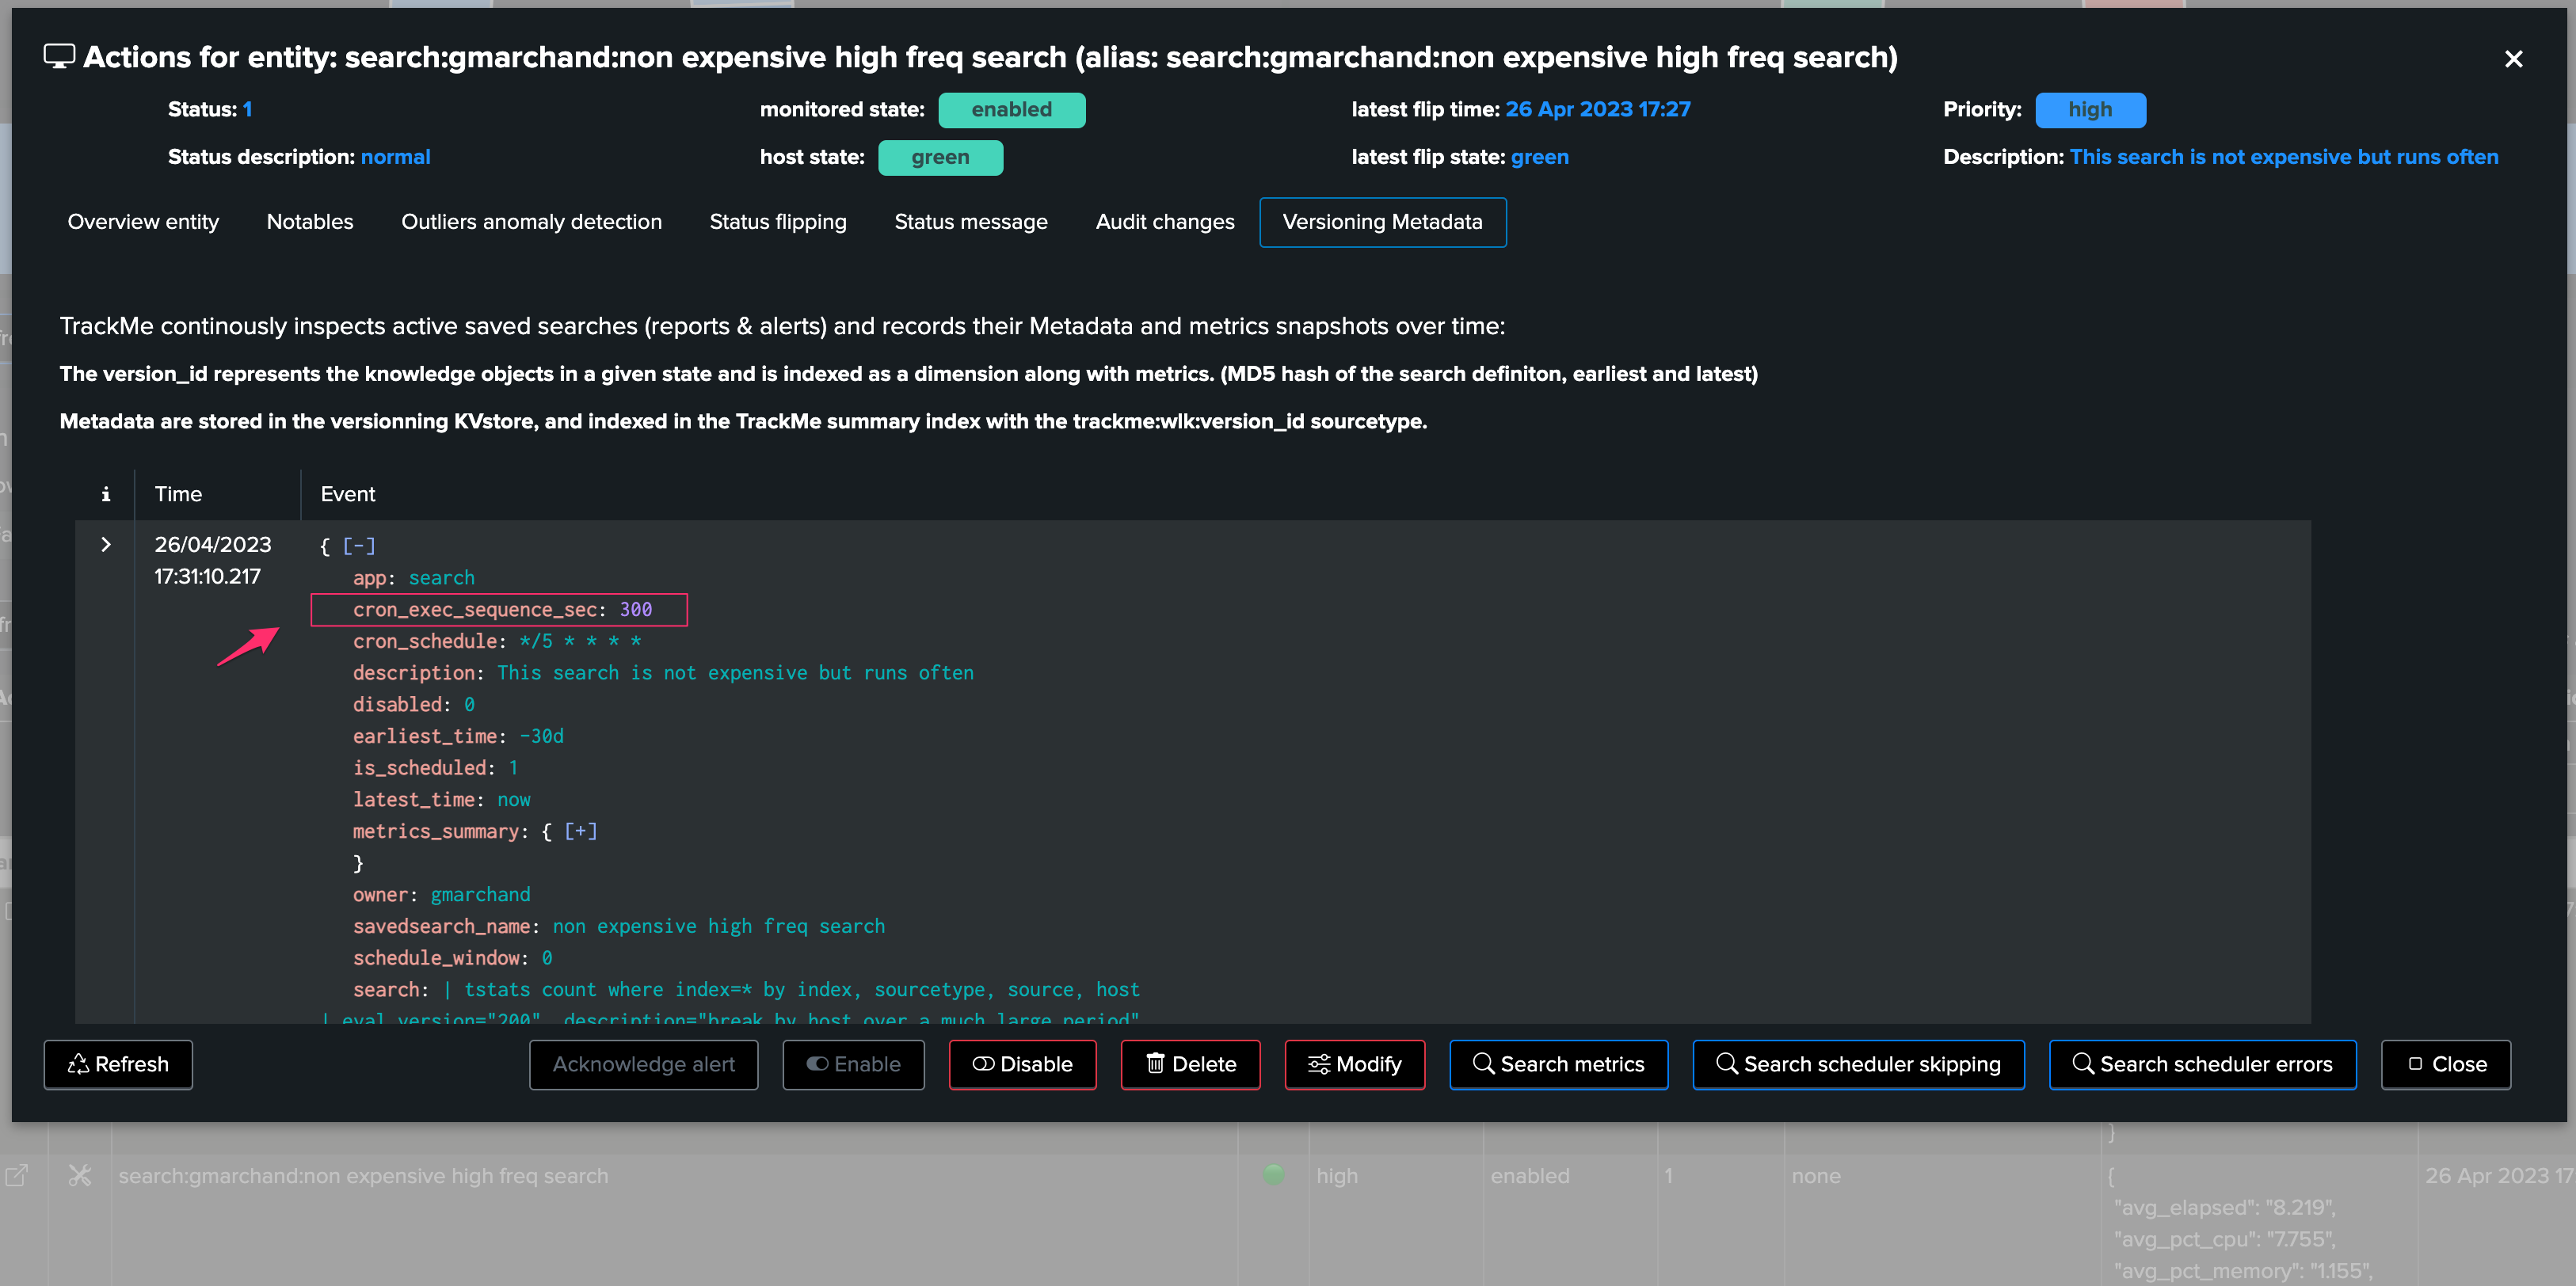
When the versioning components inspect the Metadata of an entity, it retrieves the cron schedule expression too, which defines how often a scheduled is going to be scheduled
This cron schedule is transformed into a per seconds value defining how often the search should have been executing (using the croniter Python library), and stored in the field
cron_exec_sequence_secalong with the metadata record of the entity
Finally, TrackMe verifies and stores the scheduled successful execution traces, if a search which should have executed at least once in the past 5 minutes has not been since active since more than 5 minutes, plus the grace period, then TrackMe can consider this entity as unhealthy and trigger and alert accordingly,
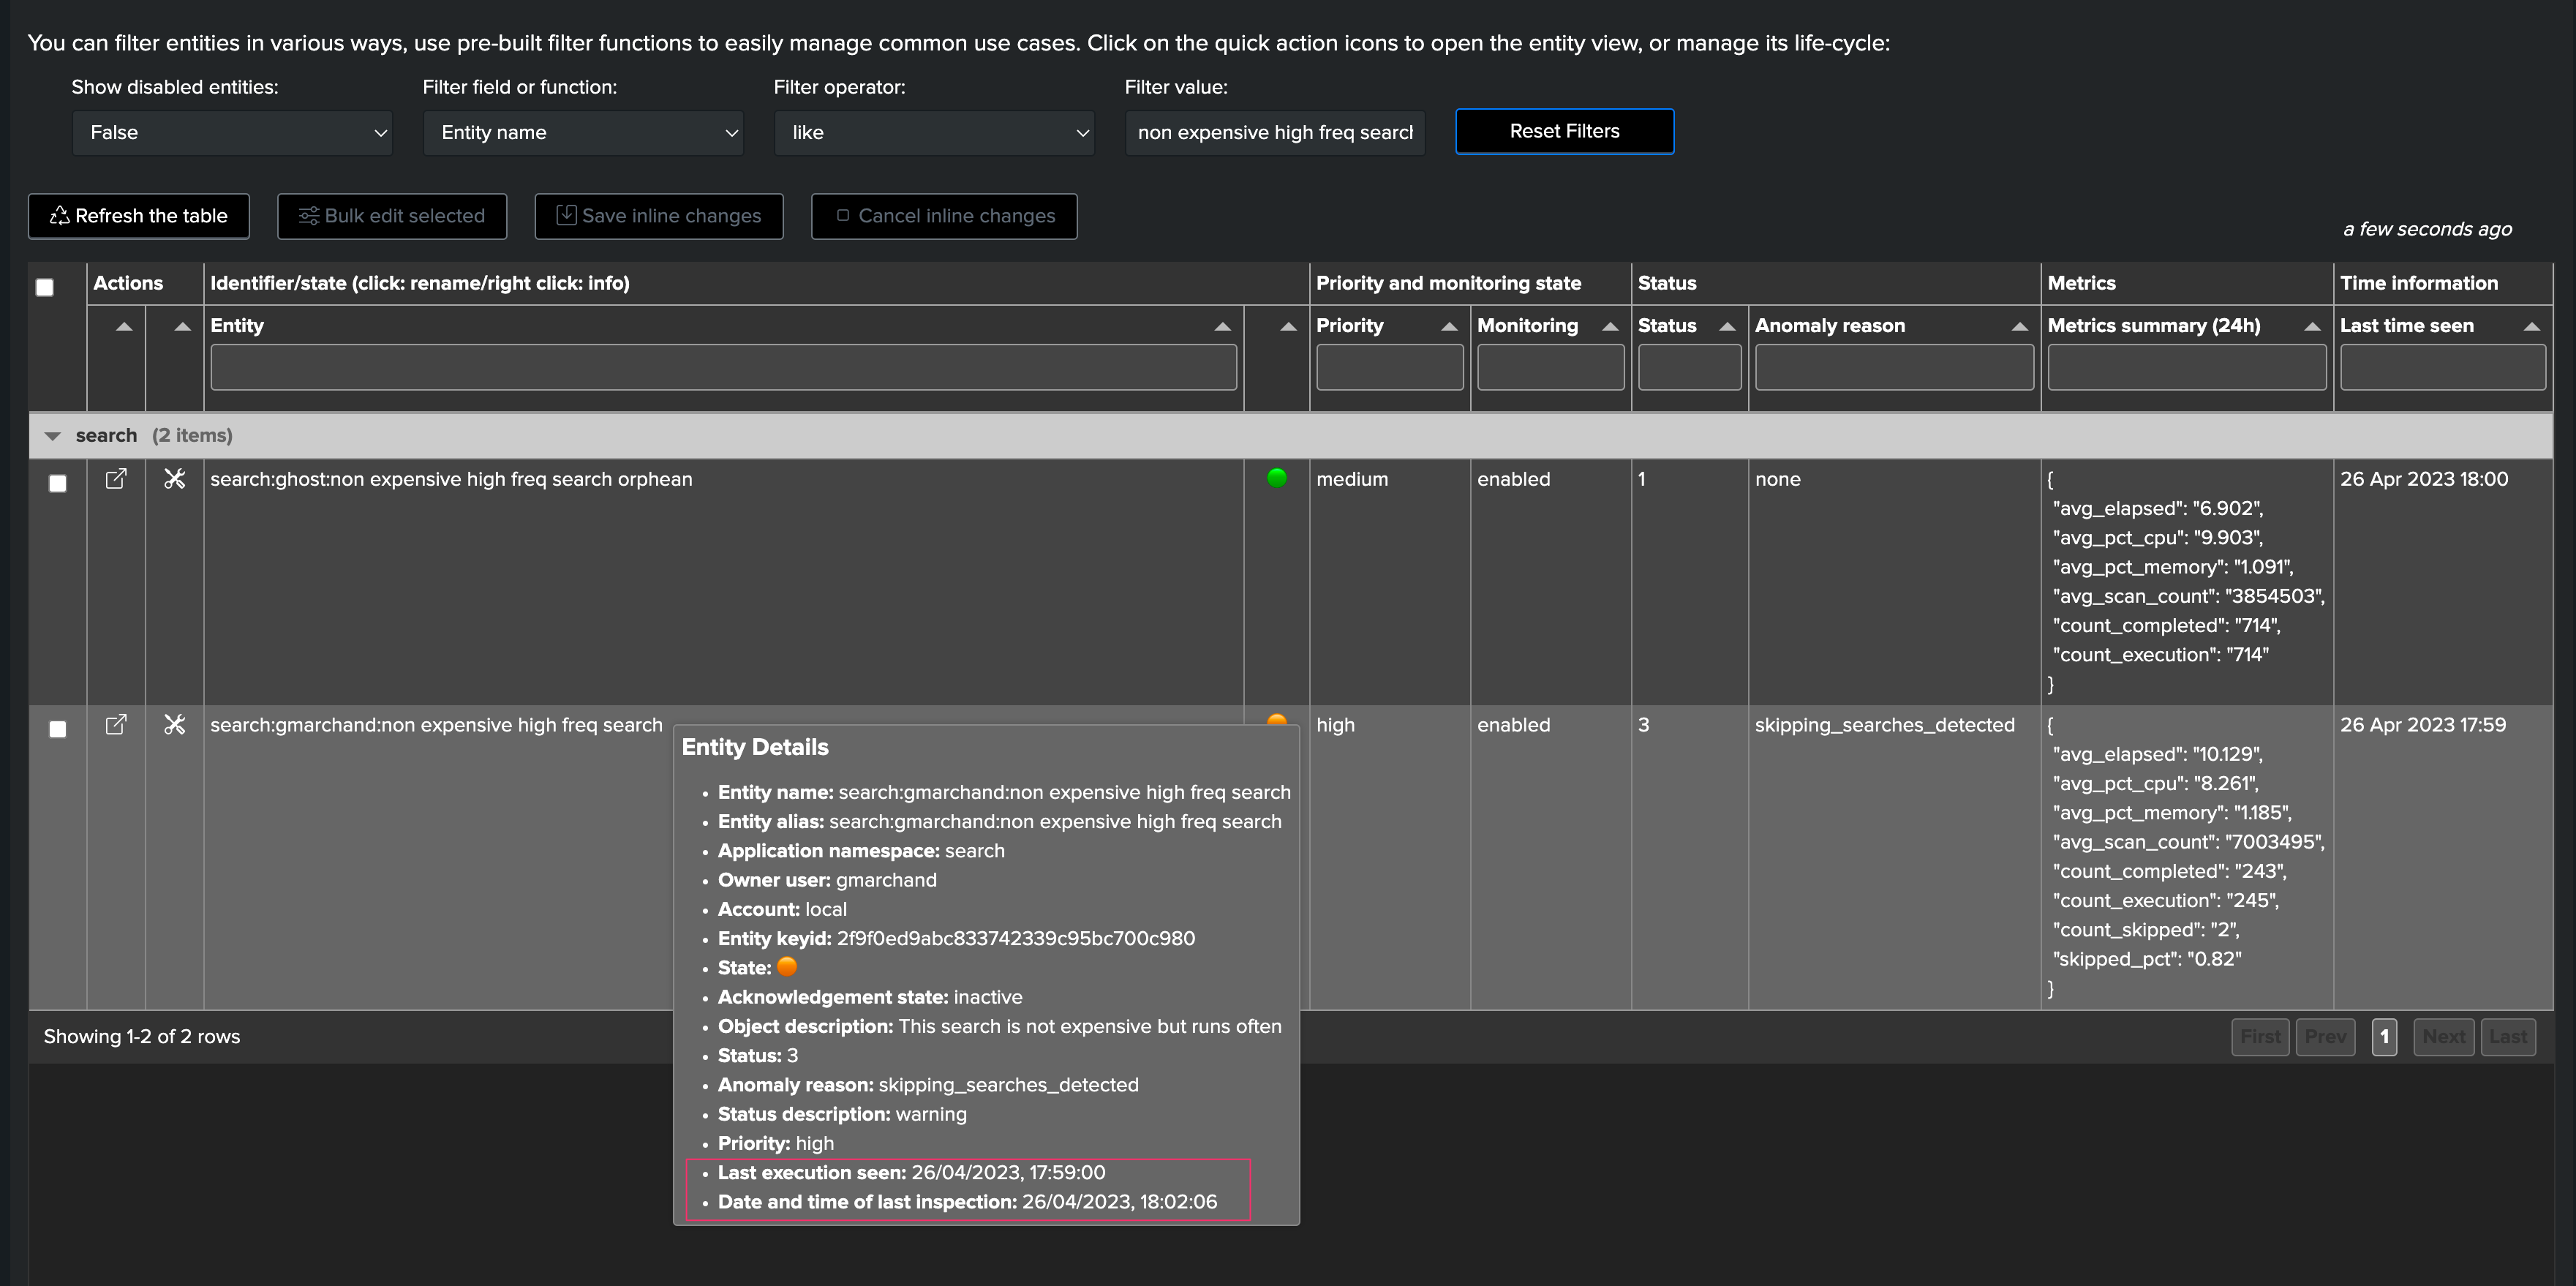
For instance, let’s disable the scheduling of an active schedule (a mistake? bad behaviour?), after a short period of time, TrackMe detects the conditions which immediately impacts the entity, generates an alert and TrackMe notable!
we can observe the dates of latest inspection and latest execution in the contextual menu:
After some minutes, TrackMe detected that the scheduled search is delayed:
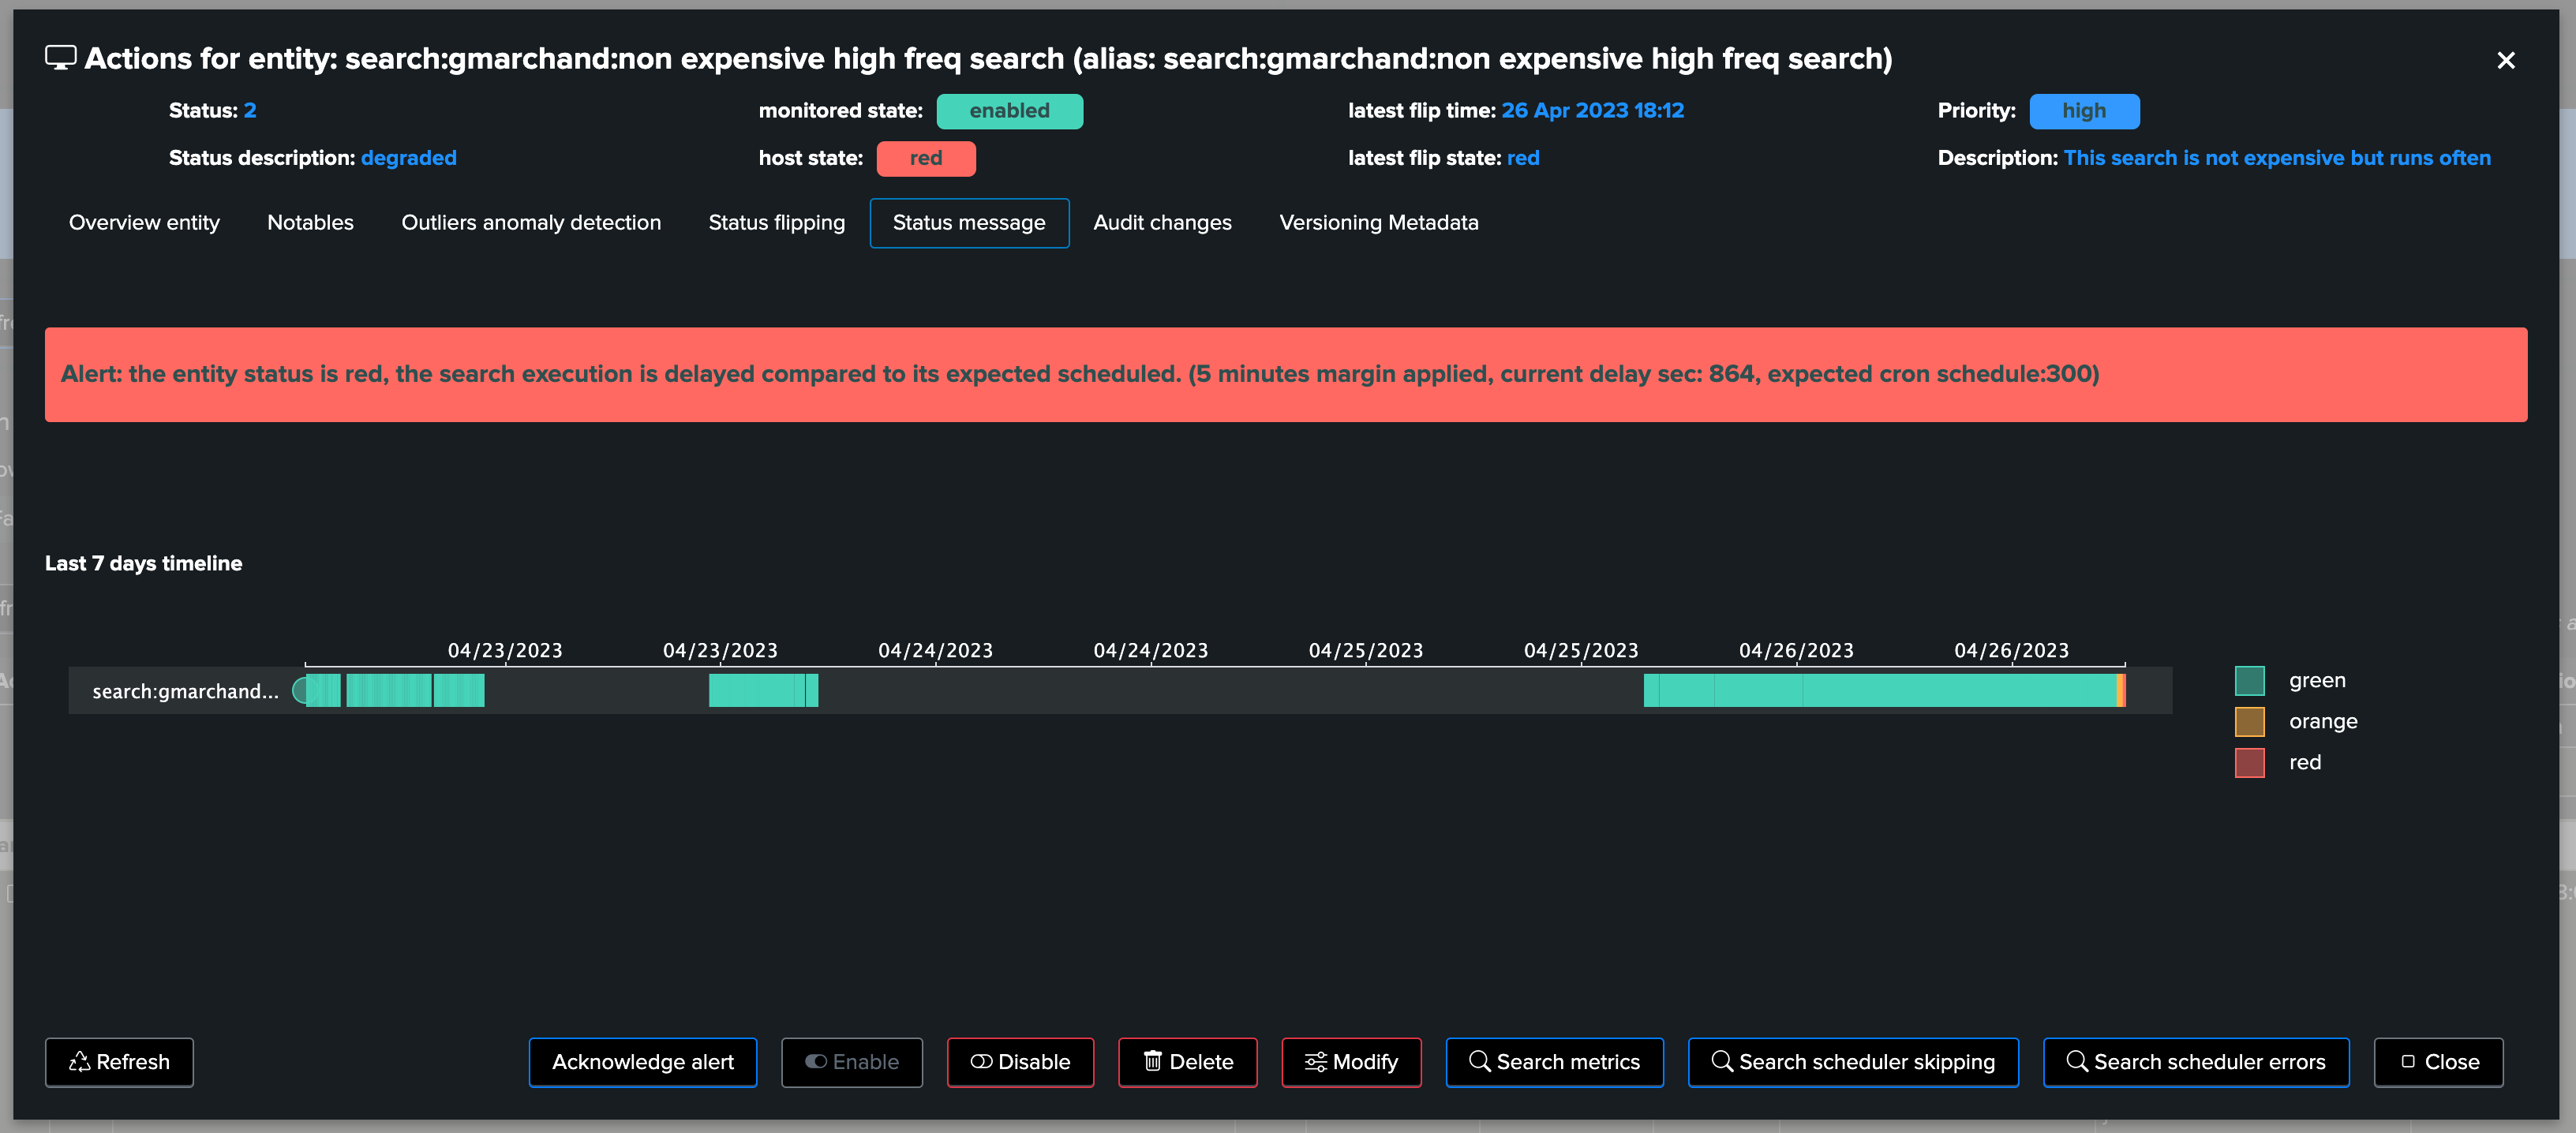
From this stage, we automatically detect an abnormal condition for our critical scheduled activity, and we can start acting accordingly before it starts having any severe consequences!
7. Orphan searches detection
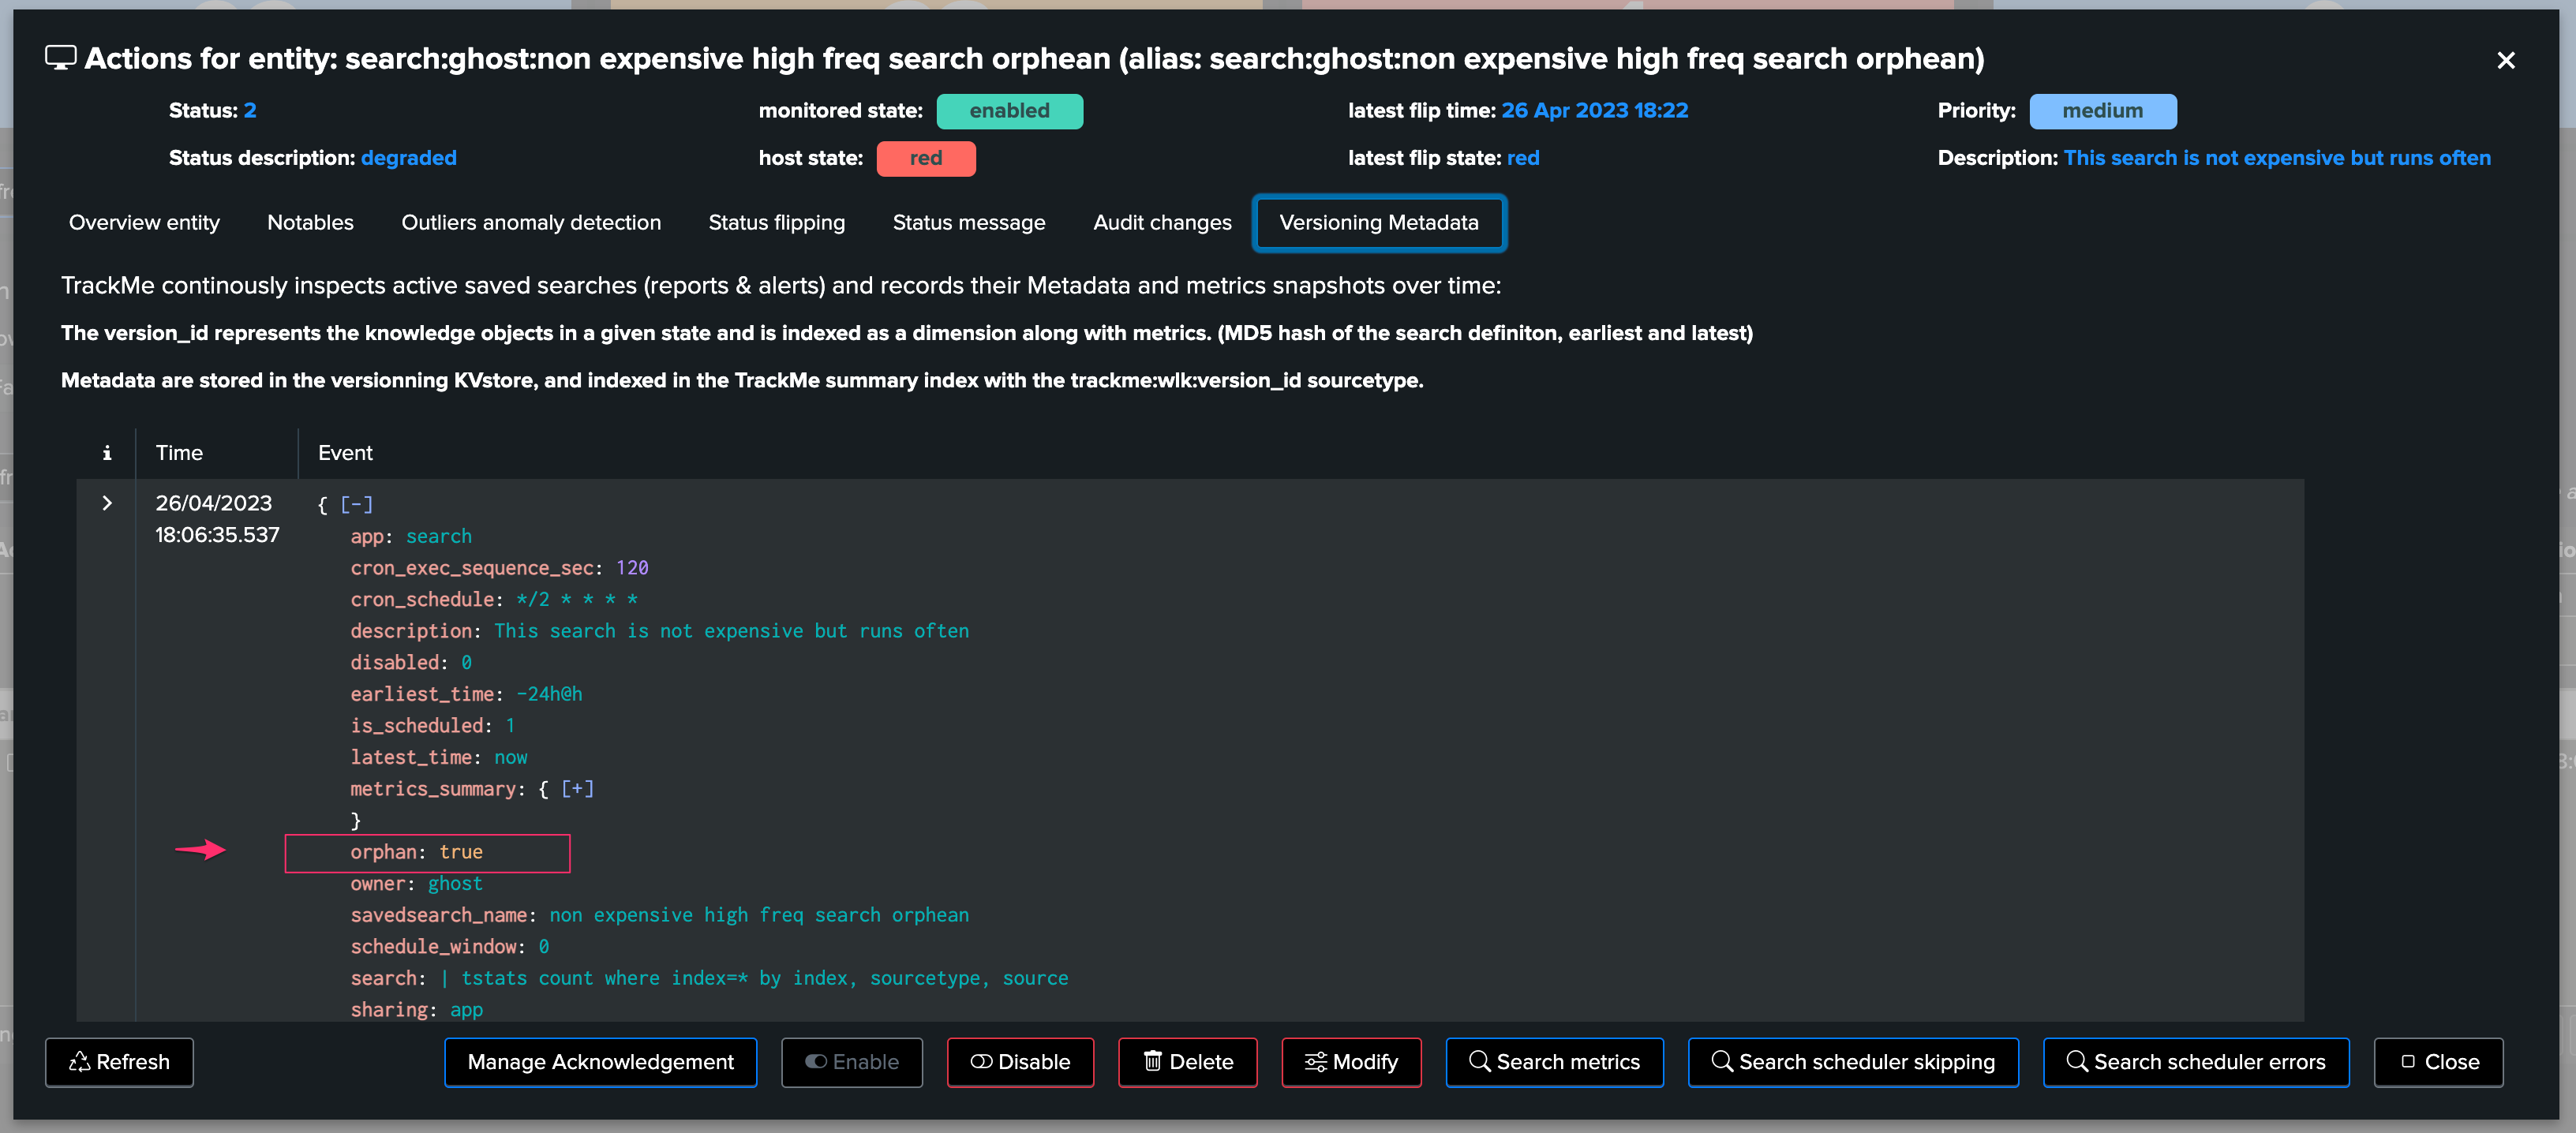
Orphan search condition is also detected by TrackMe, for any search that has been actively discovered, in short:
Once per hour, TrackMe verifies via the orphan tracker the current status of all active scheduled objects for the past 7 days
It updates the Metadata information with the
orphanbooleanIn return, TrackMe as part of its condition verifies that the search has not been detected as an orphan search, which otherwise will be considered as a critical condition for this entity
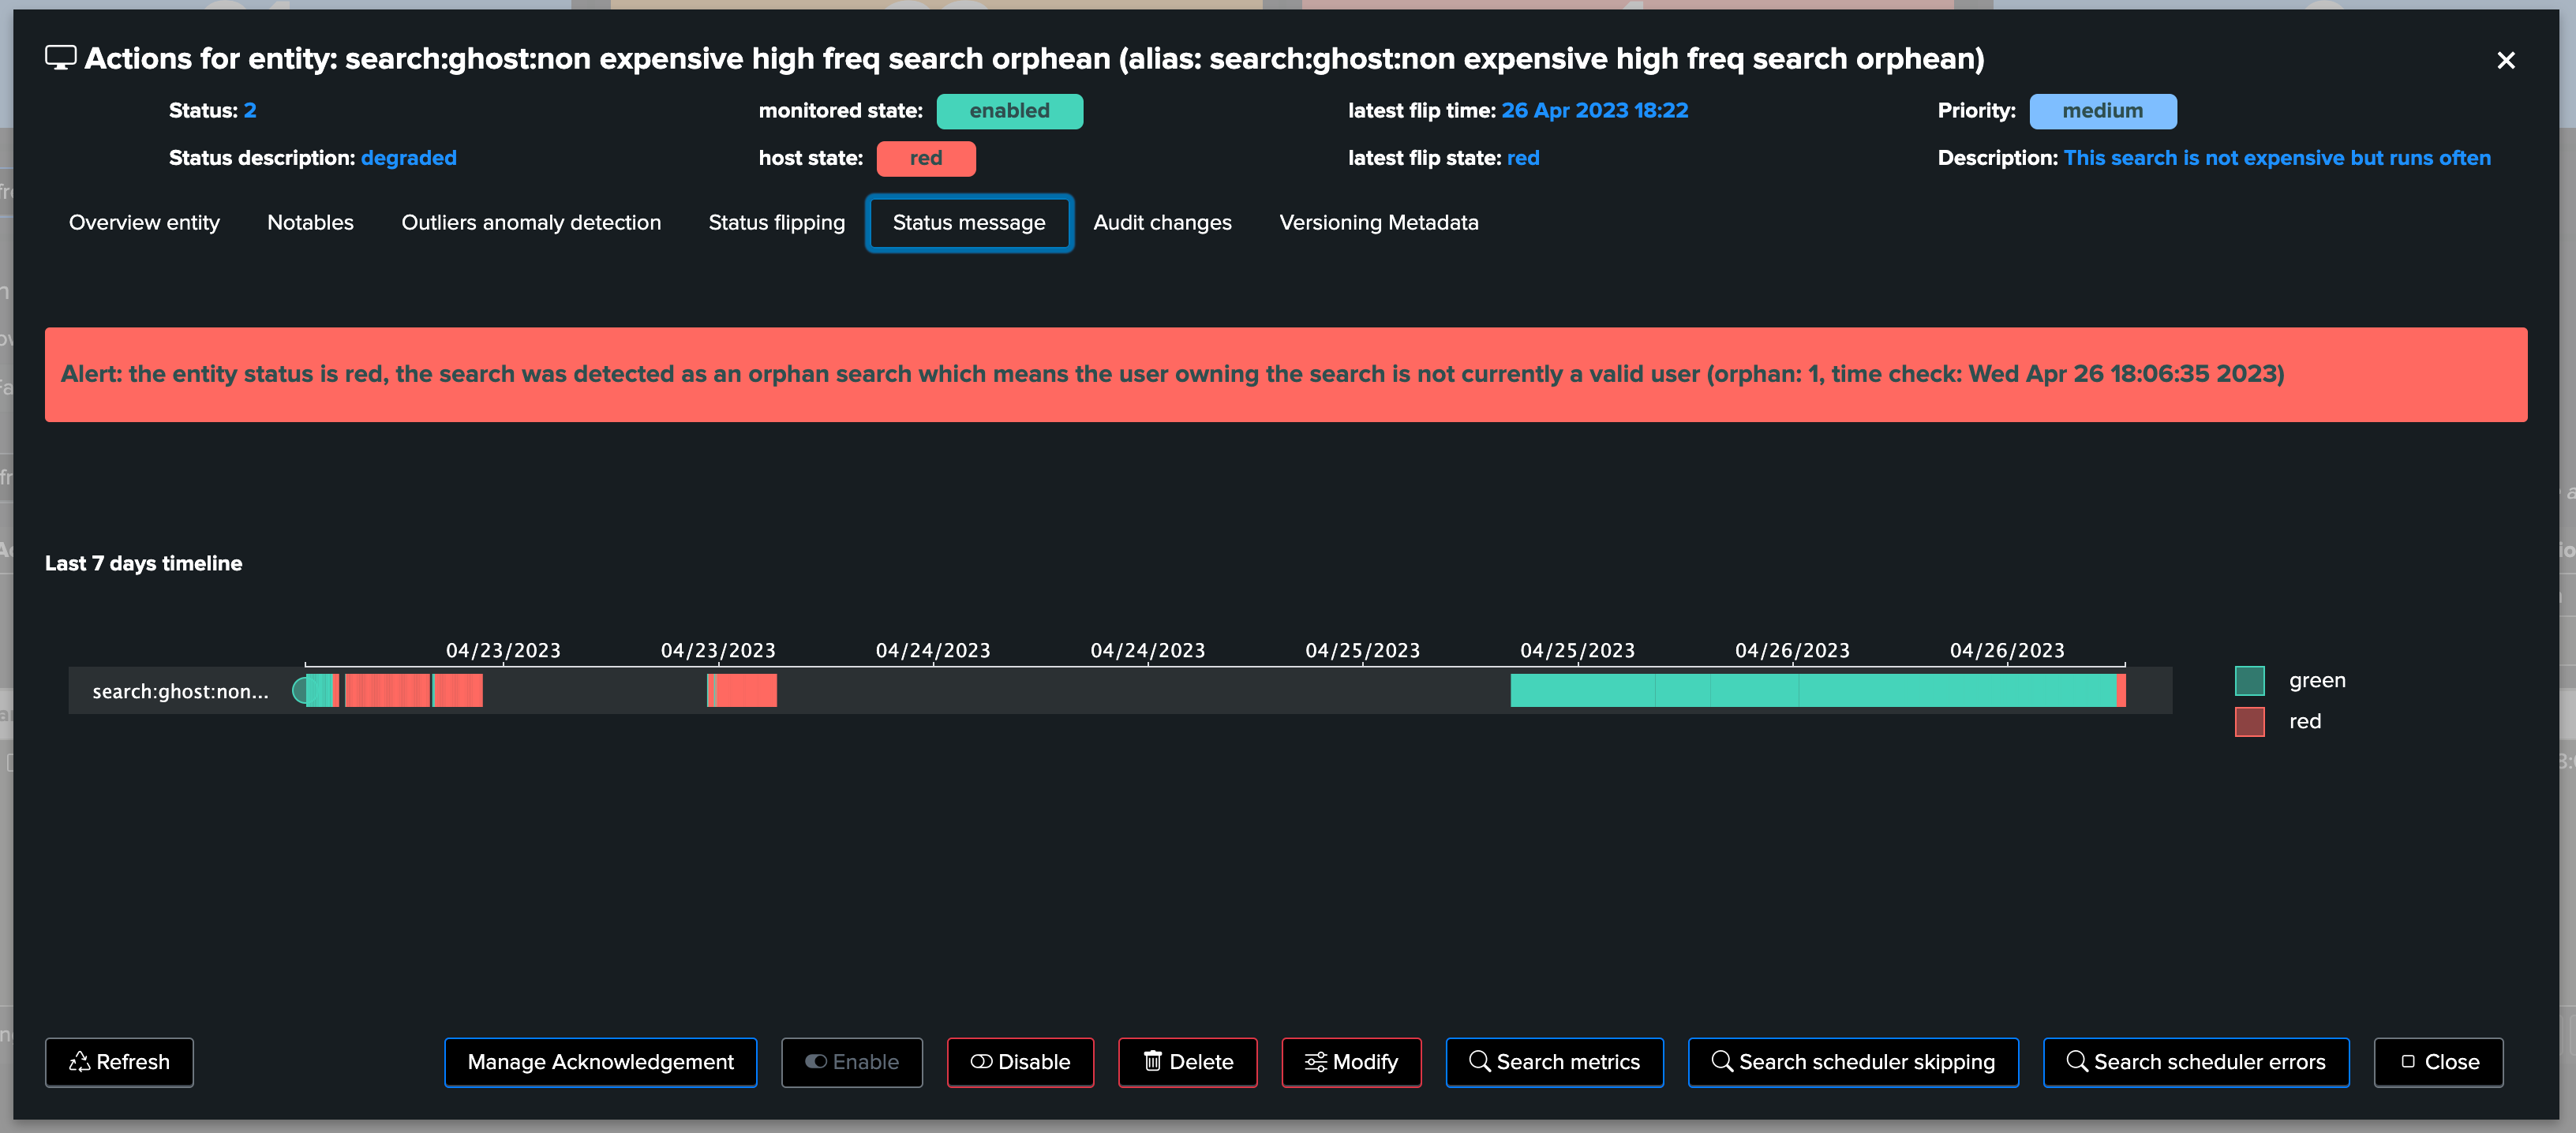
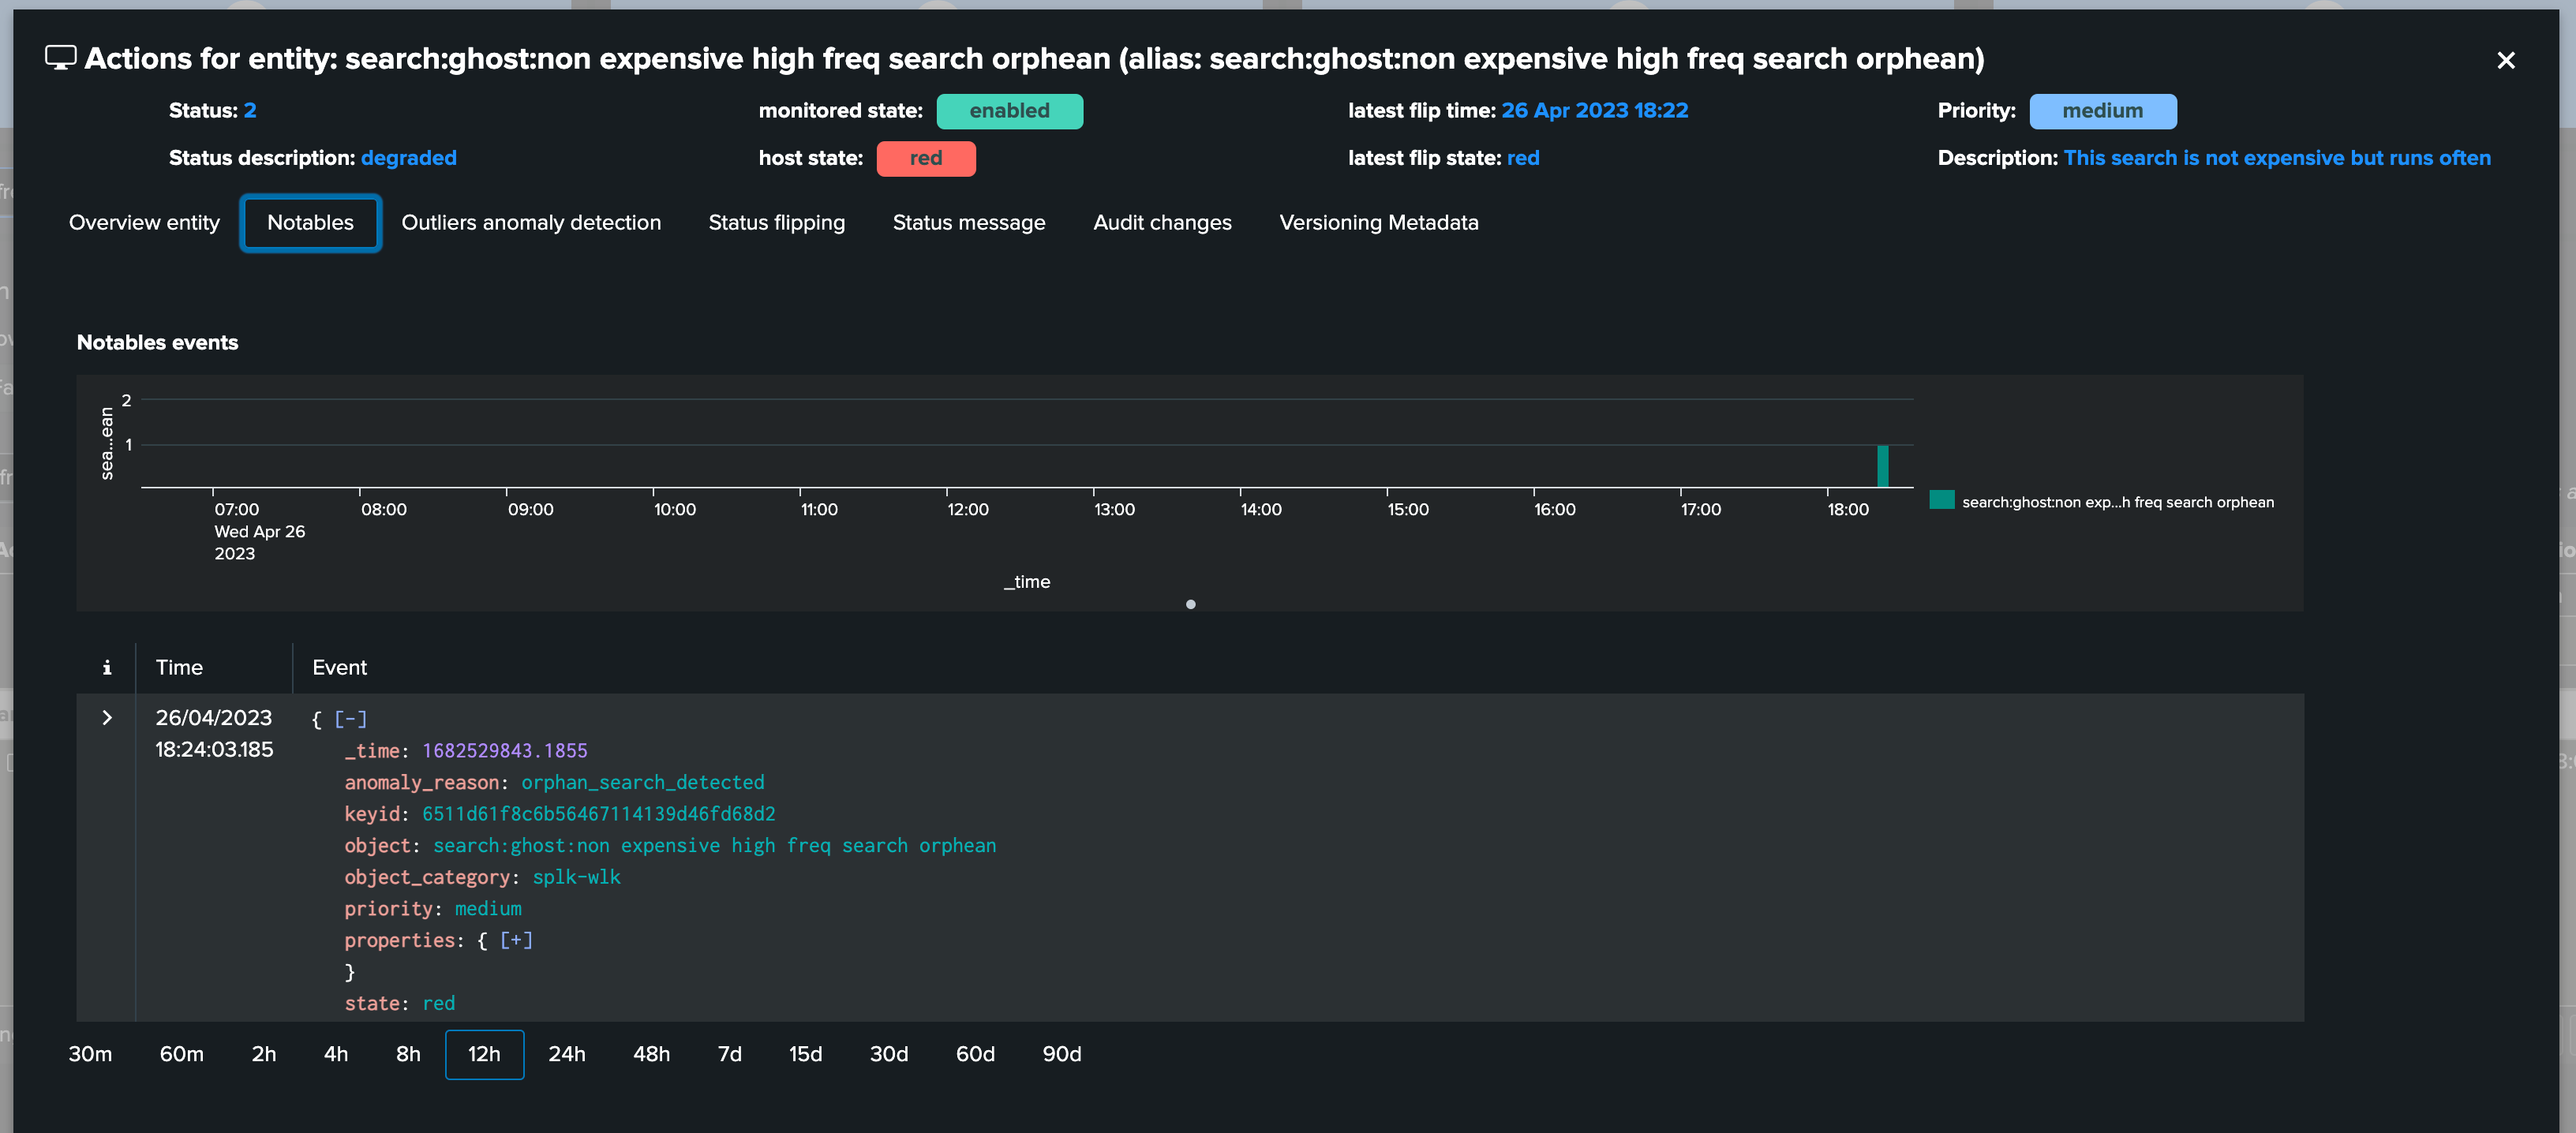
8. Skipping searches detection
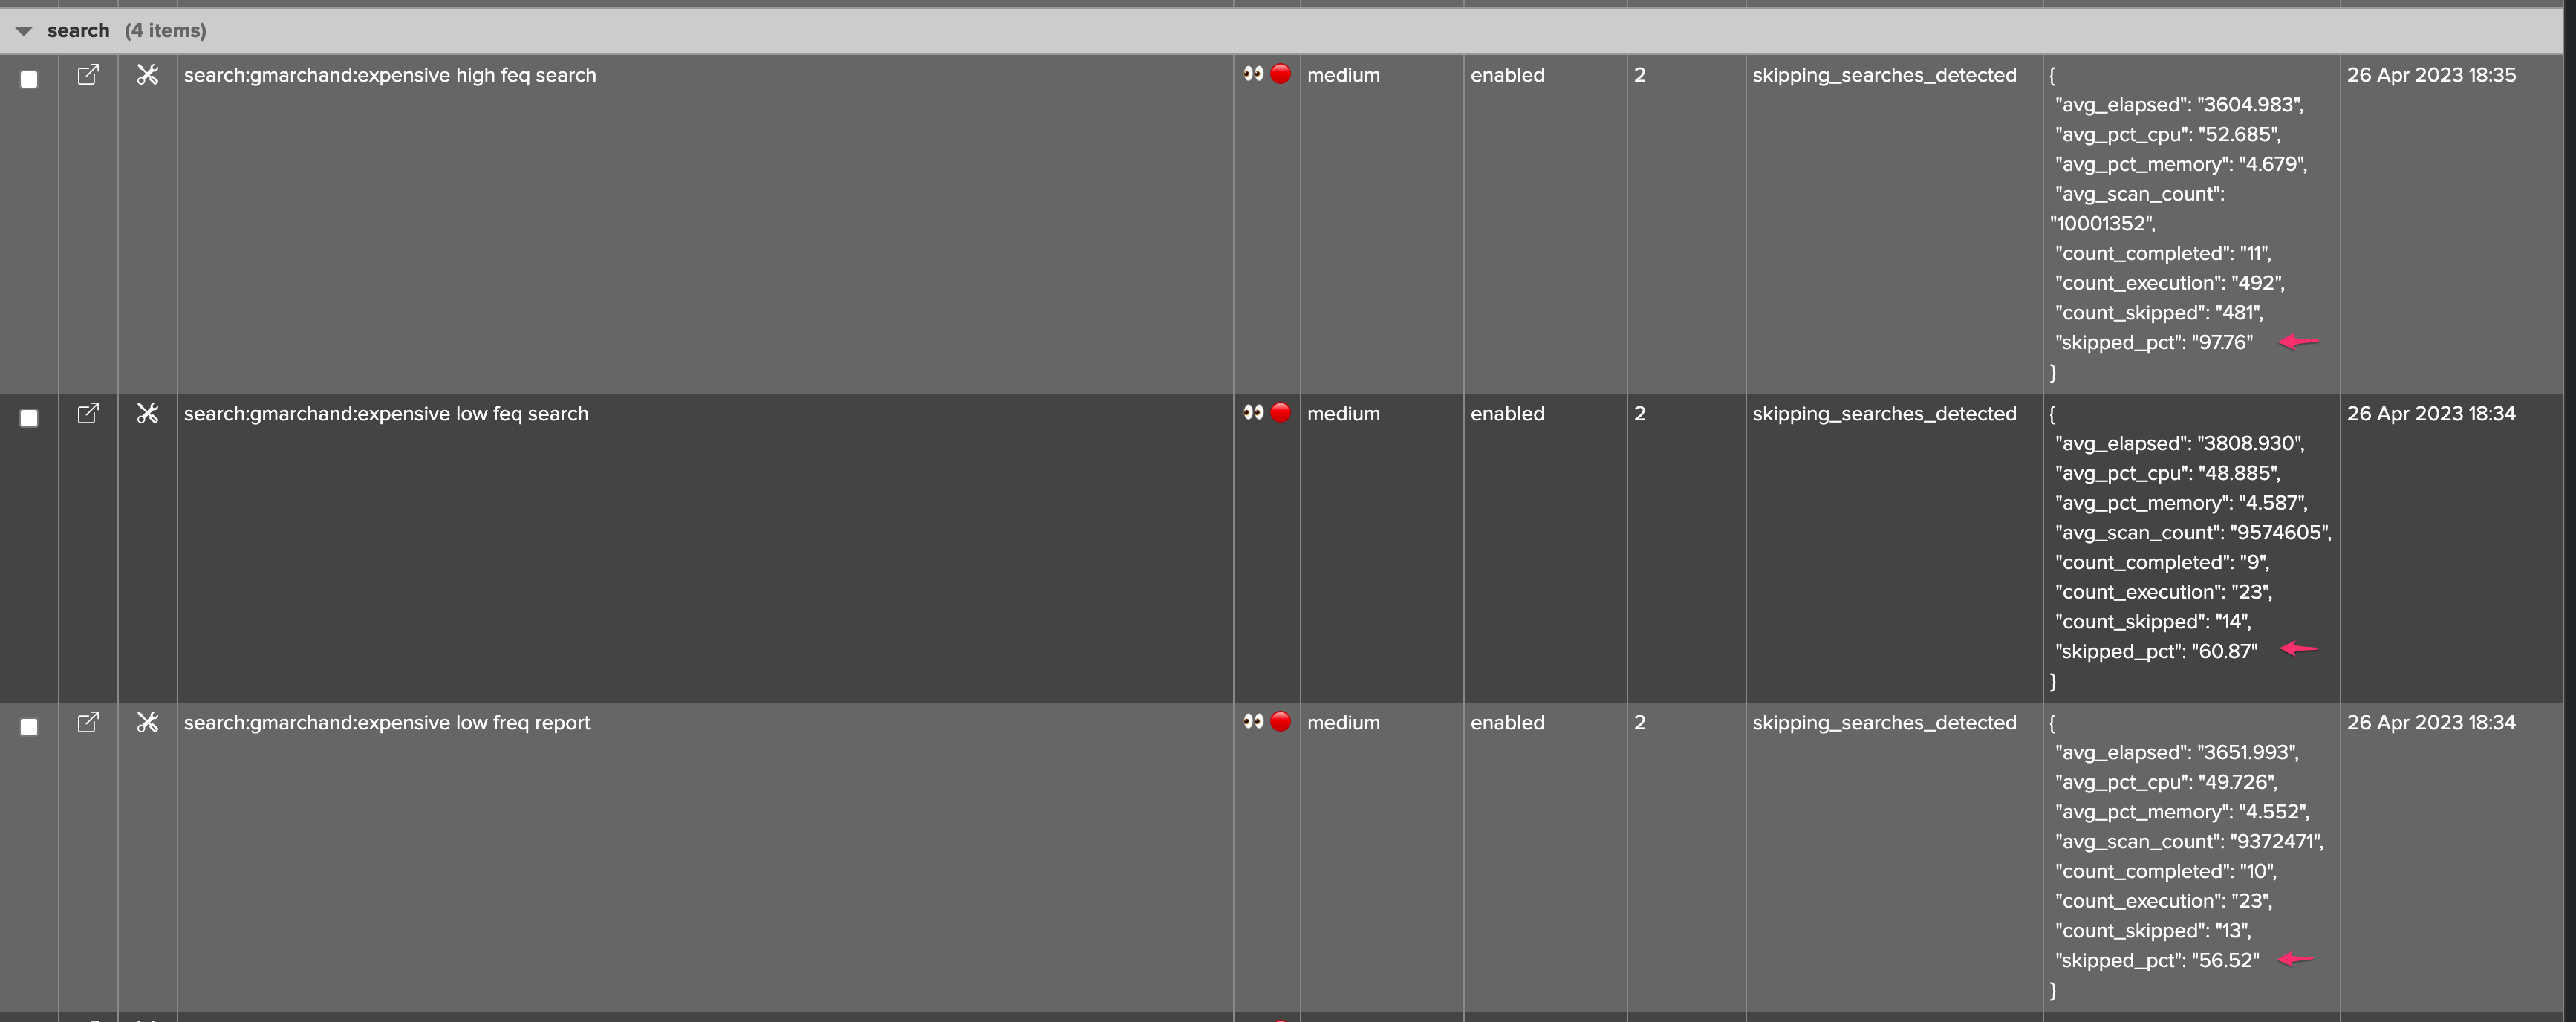
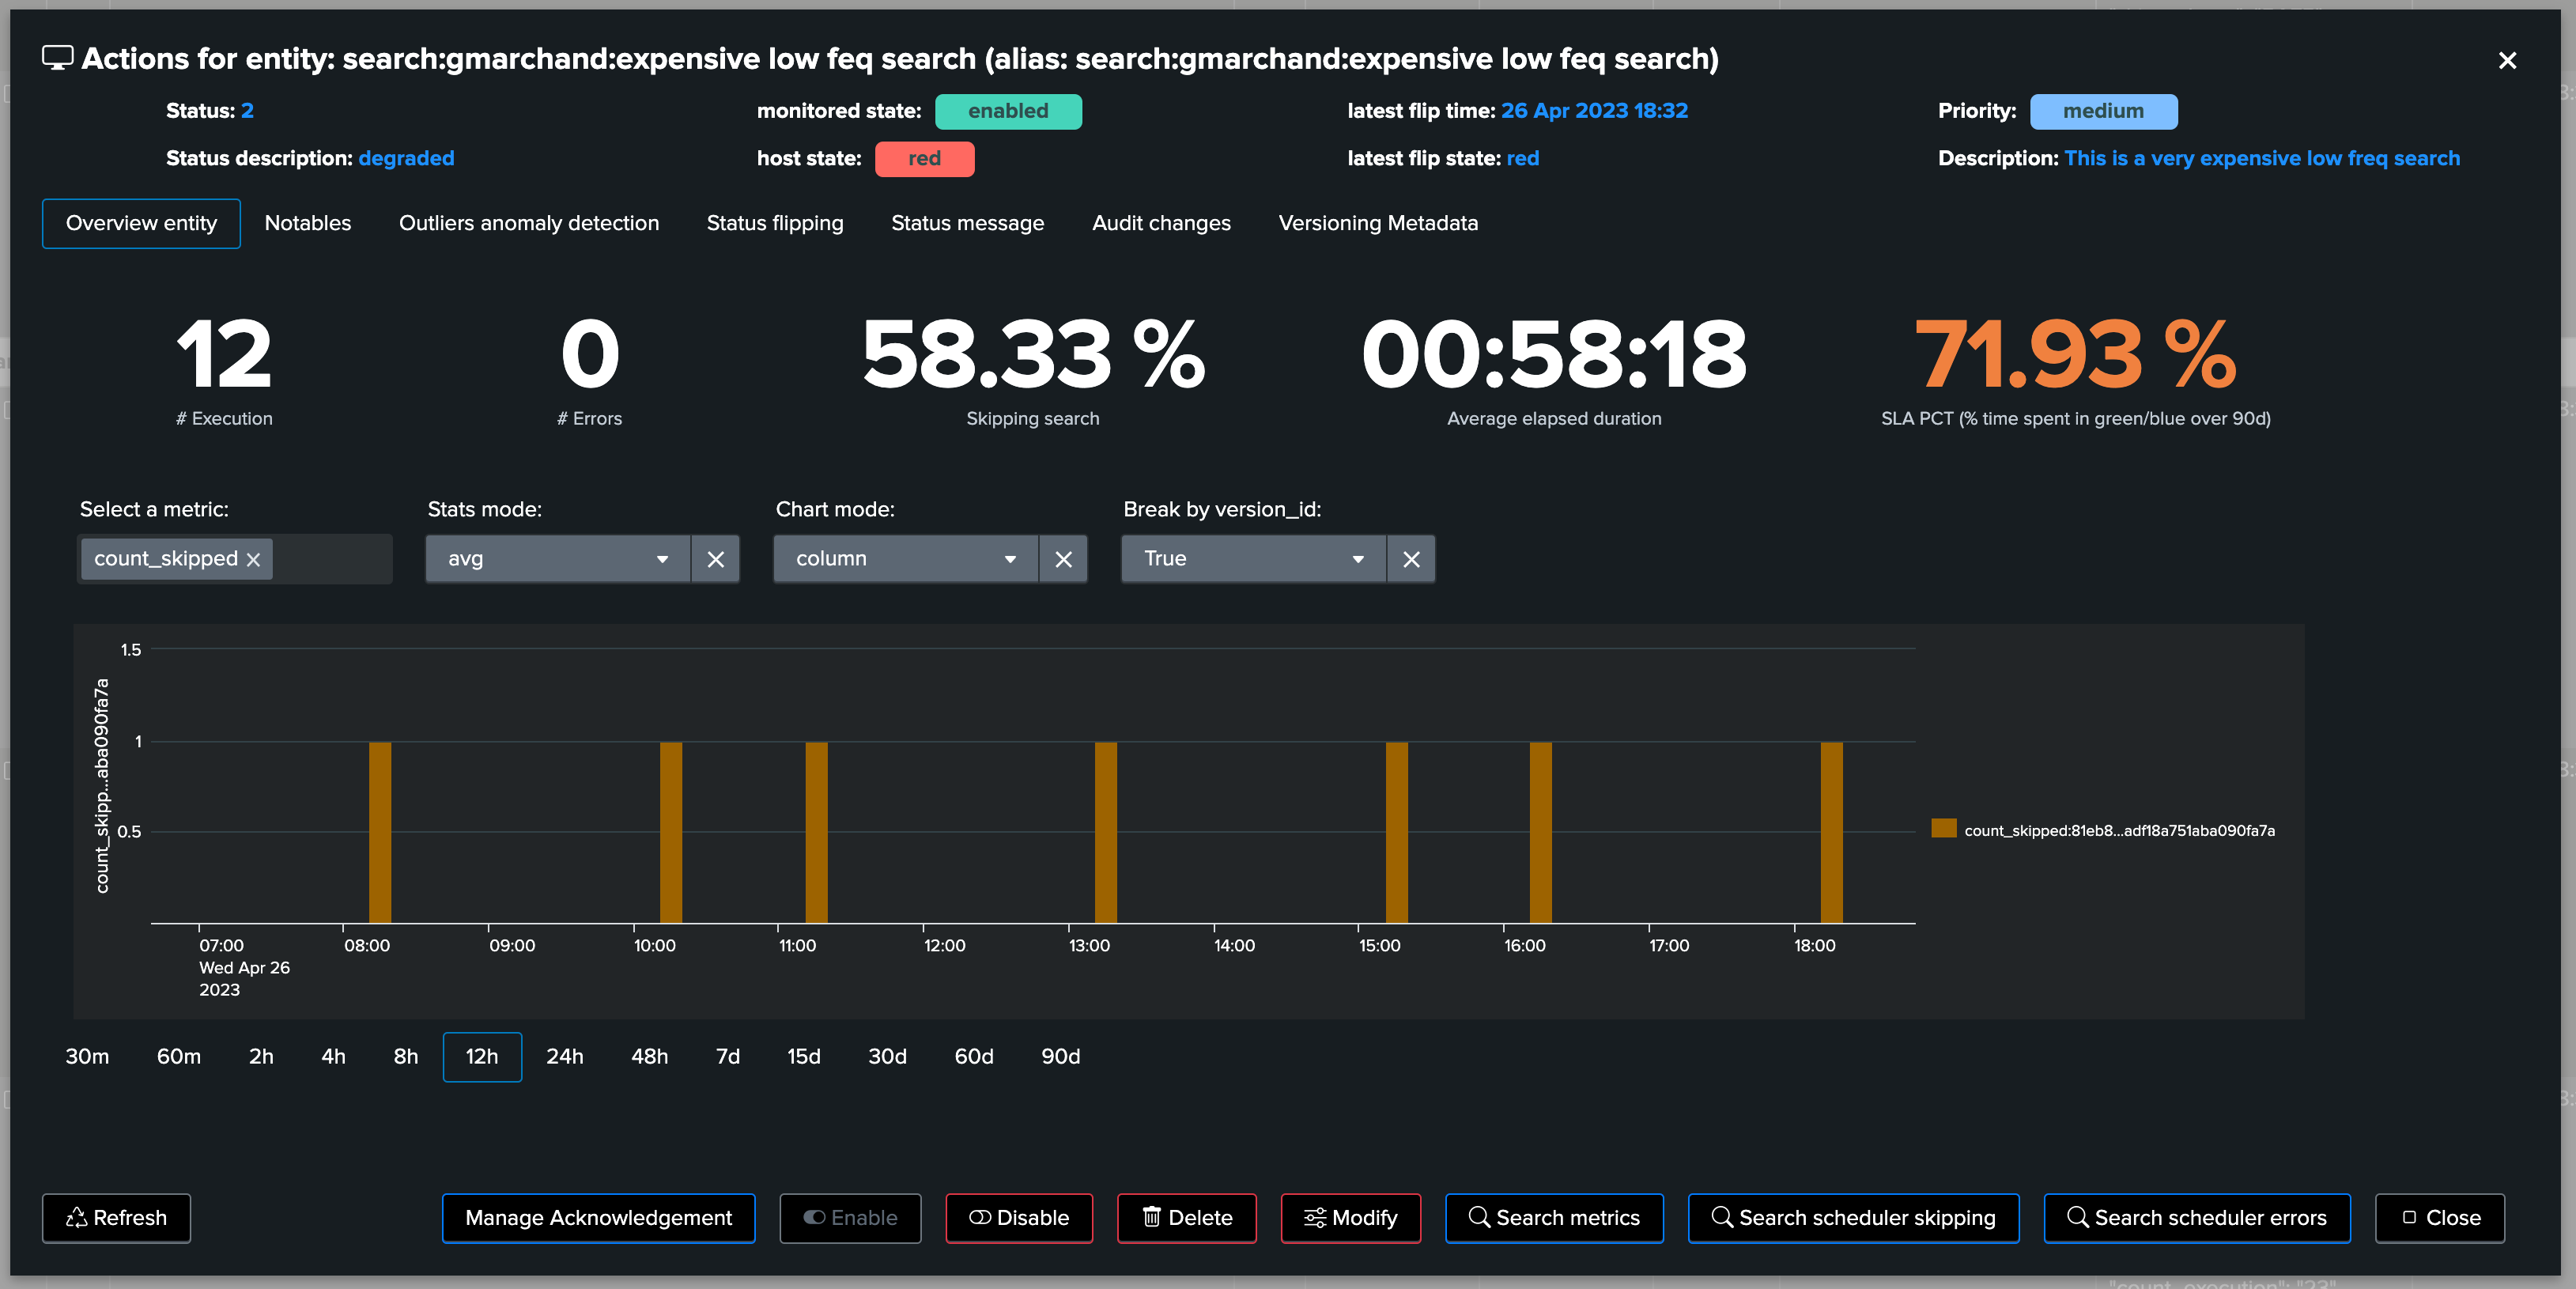
Skipping search condition is achieved by comparing the collected count_execution and count_completed collected metrics, which gives the skipping search percentage:
If the skipping search percentage is somewhere between 0 to less than 5%, the entity status will be orange
Over 5% of skipping search percentage, the entity will turn red
The skipping percentage can be seen in the summary metrics JSON in the table, or via the metric over time inspector
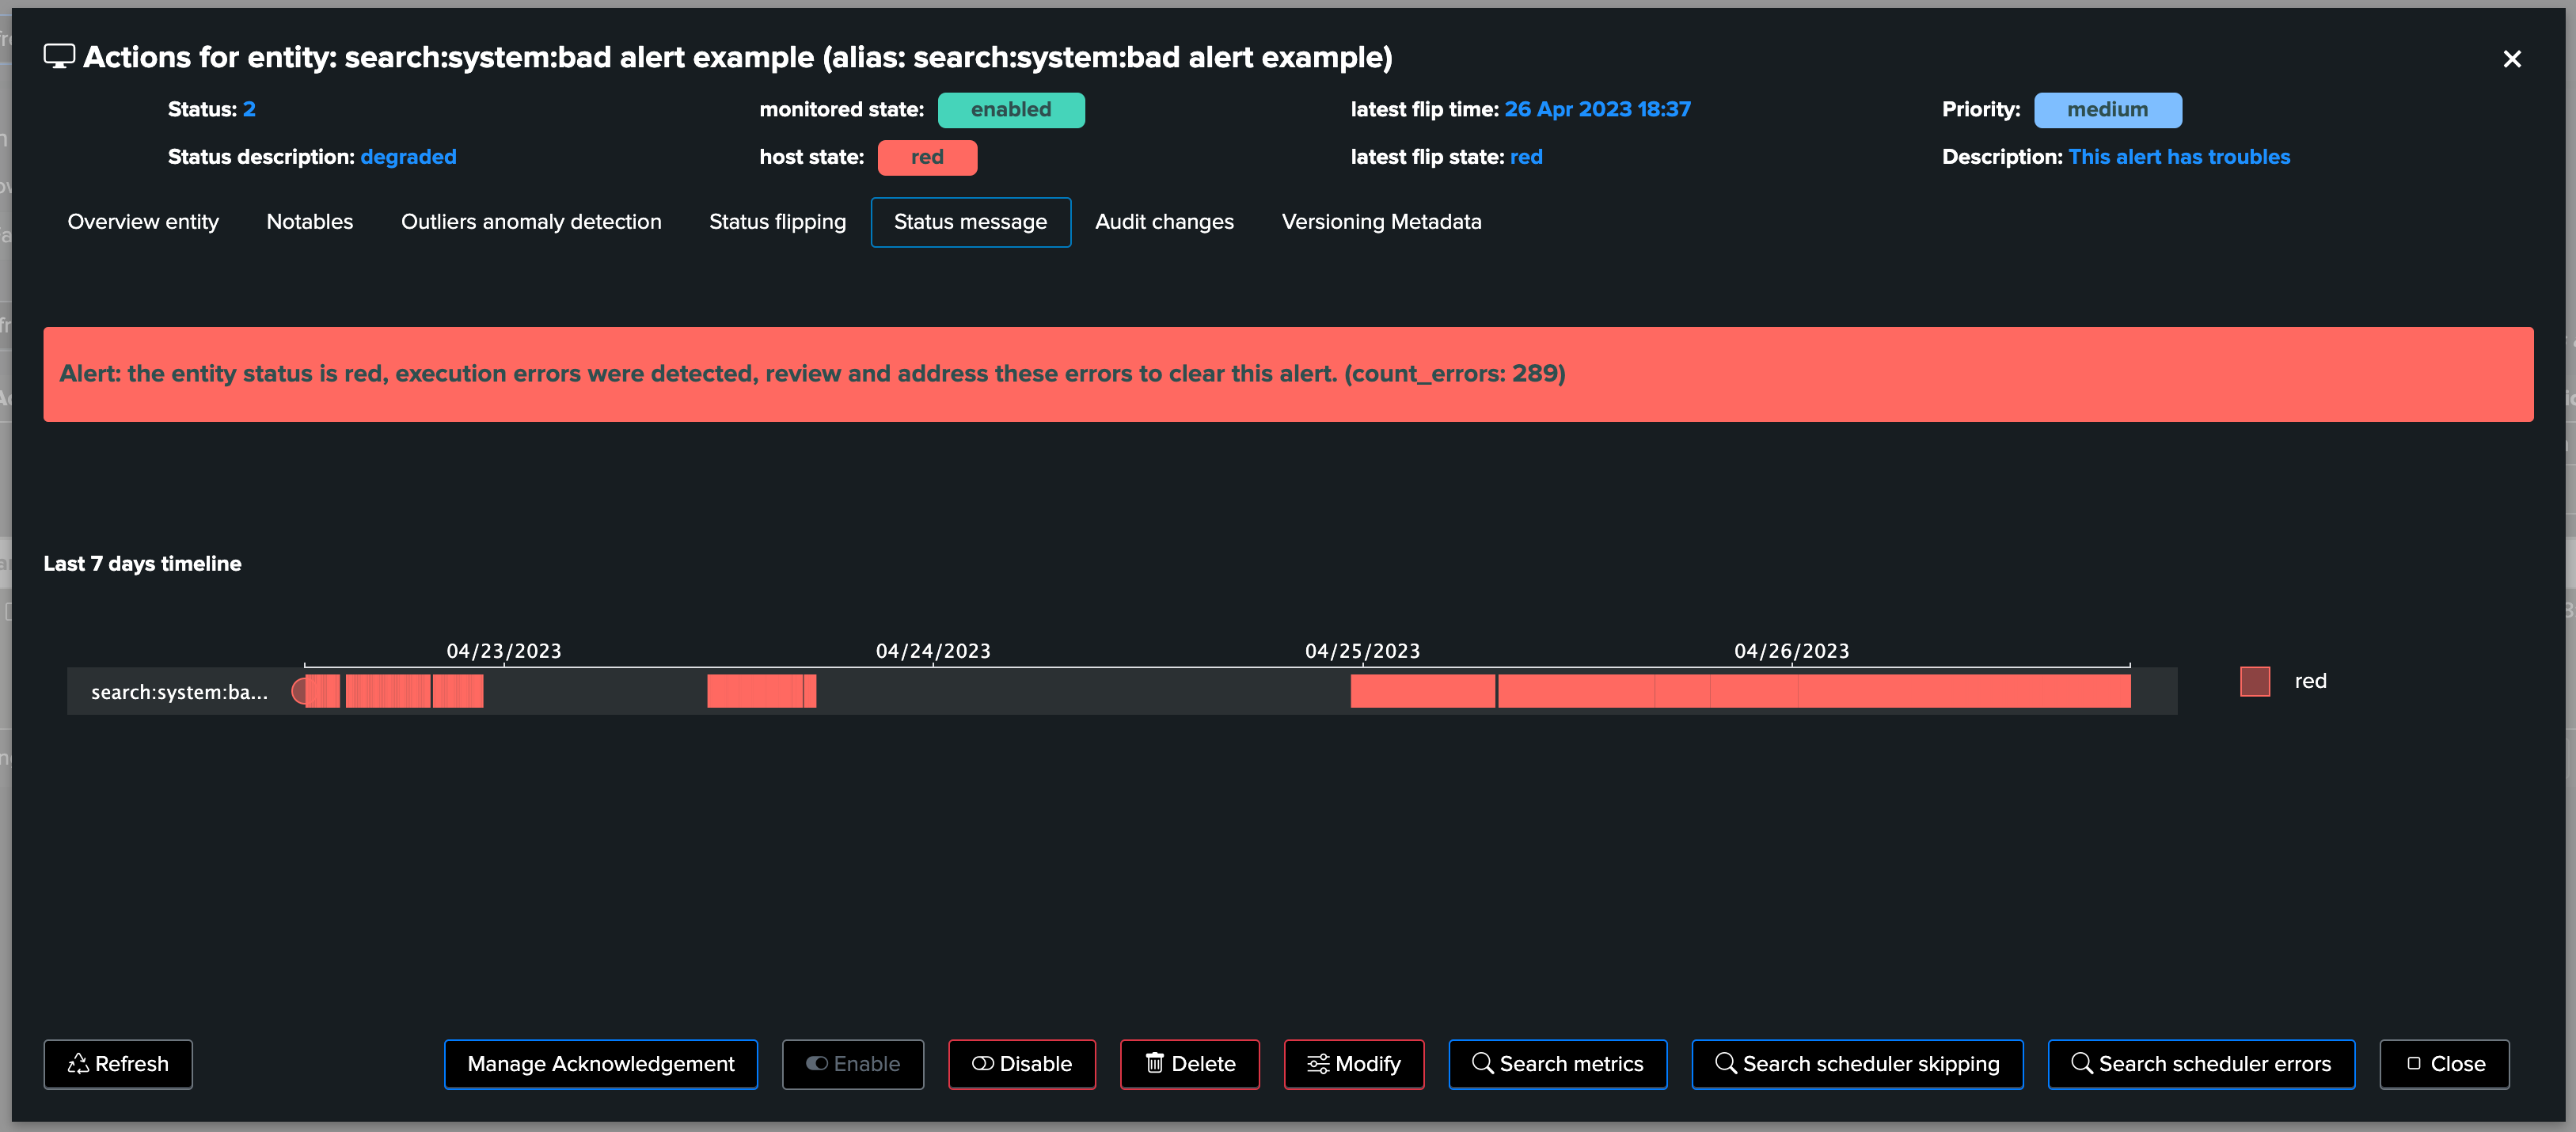
9. Error executions detection
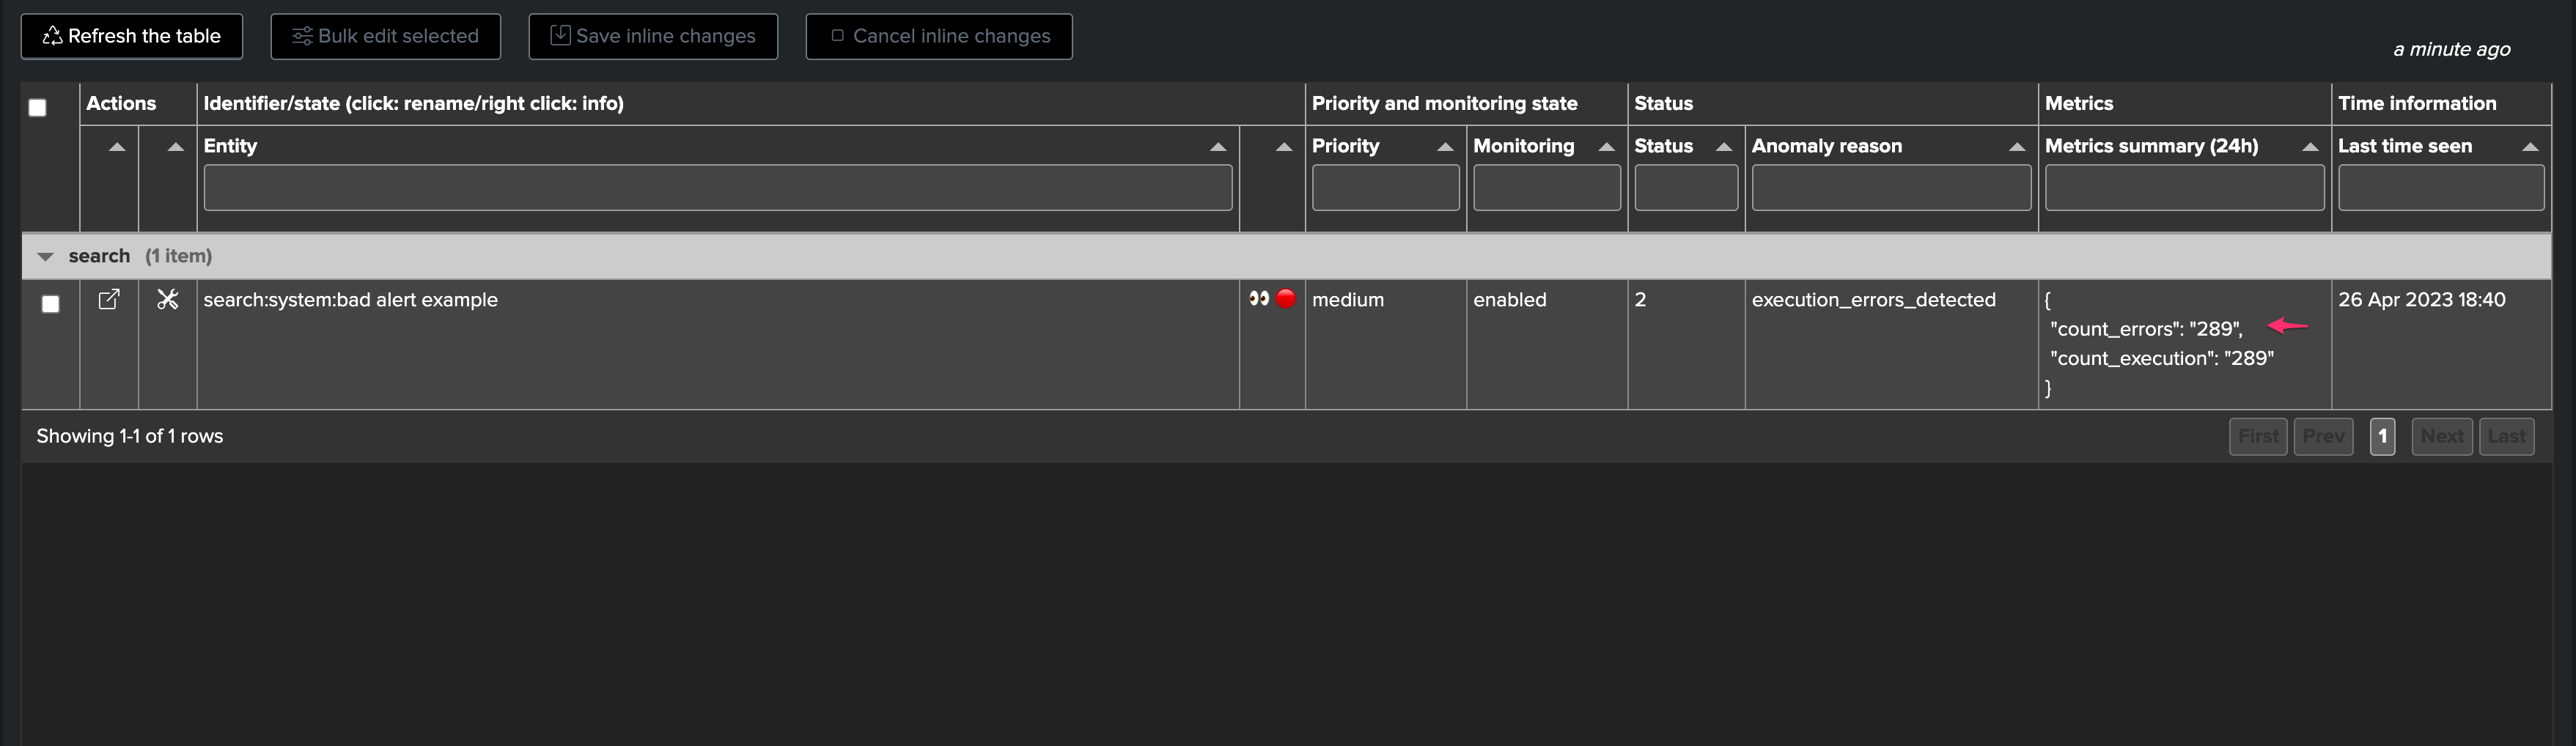
Detecting at scale and automatically execution errors is another challenge TrackMe tackles in the Workload component:
Execution errors can happen for all sorts of reasons, for instance a related knowledge object (macro, lookup etc.) which is not available to the search logic
Errors in the application development, lack of qualification, unexpected deployment side effect, etc. many combinations can lead to a scheduled search to be failing pretty much silently
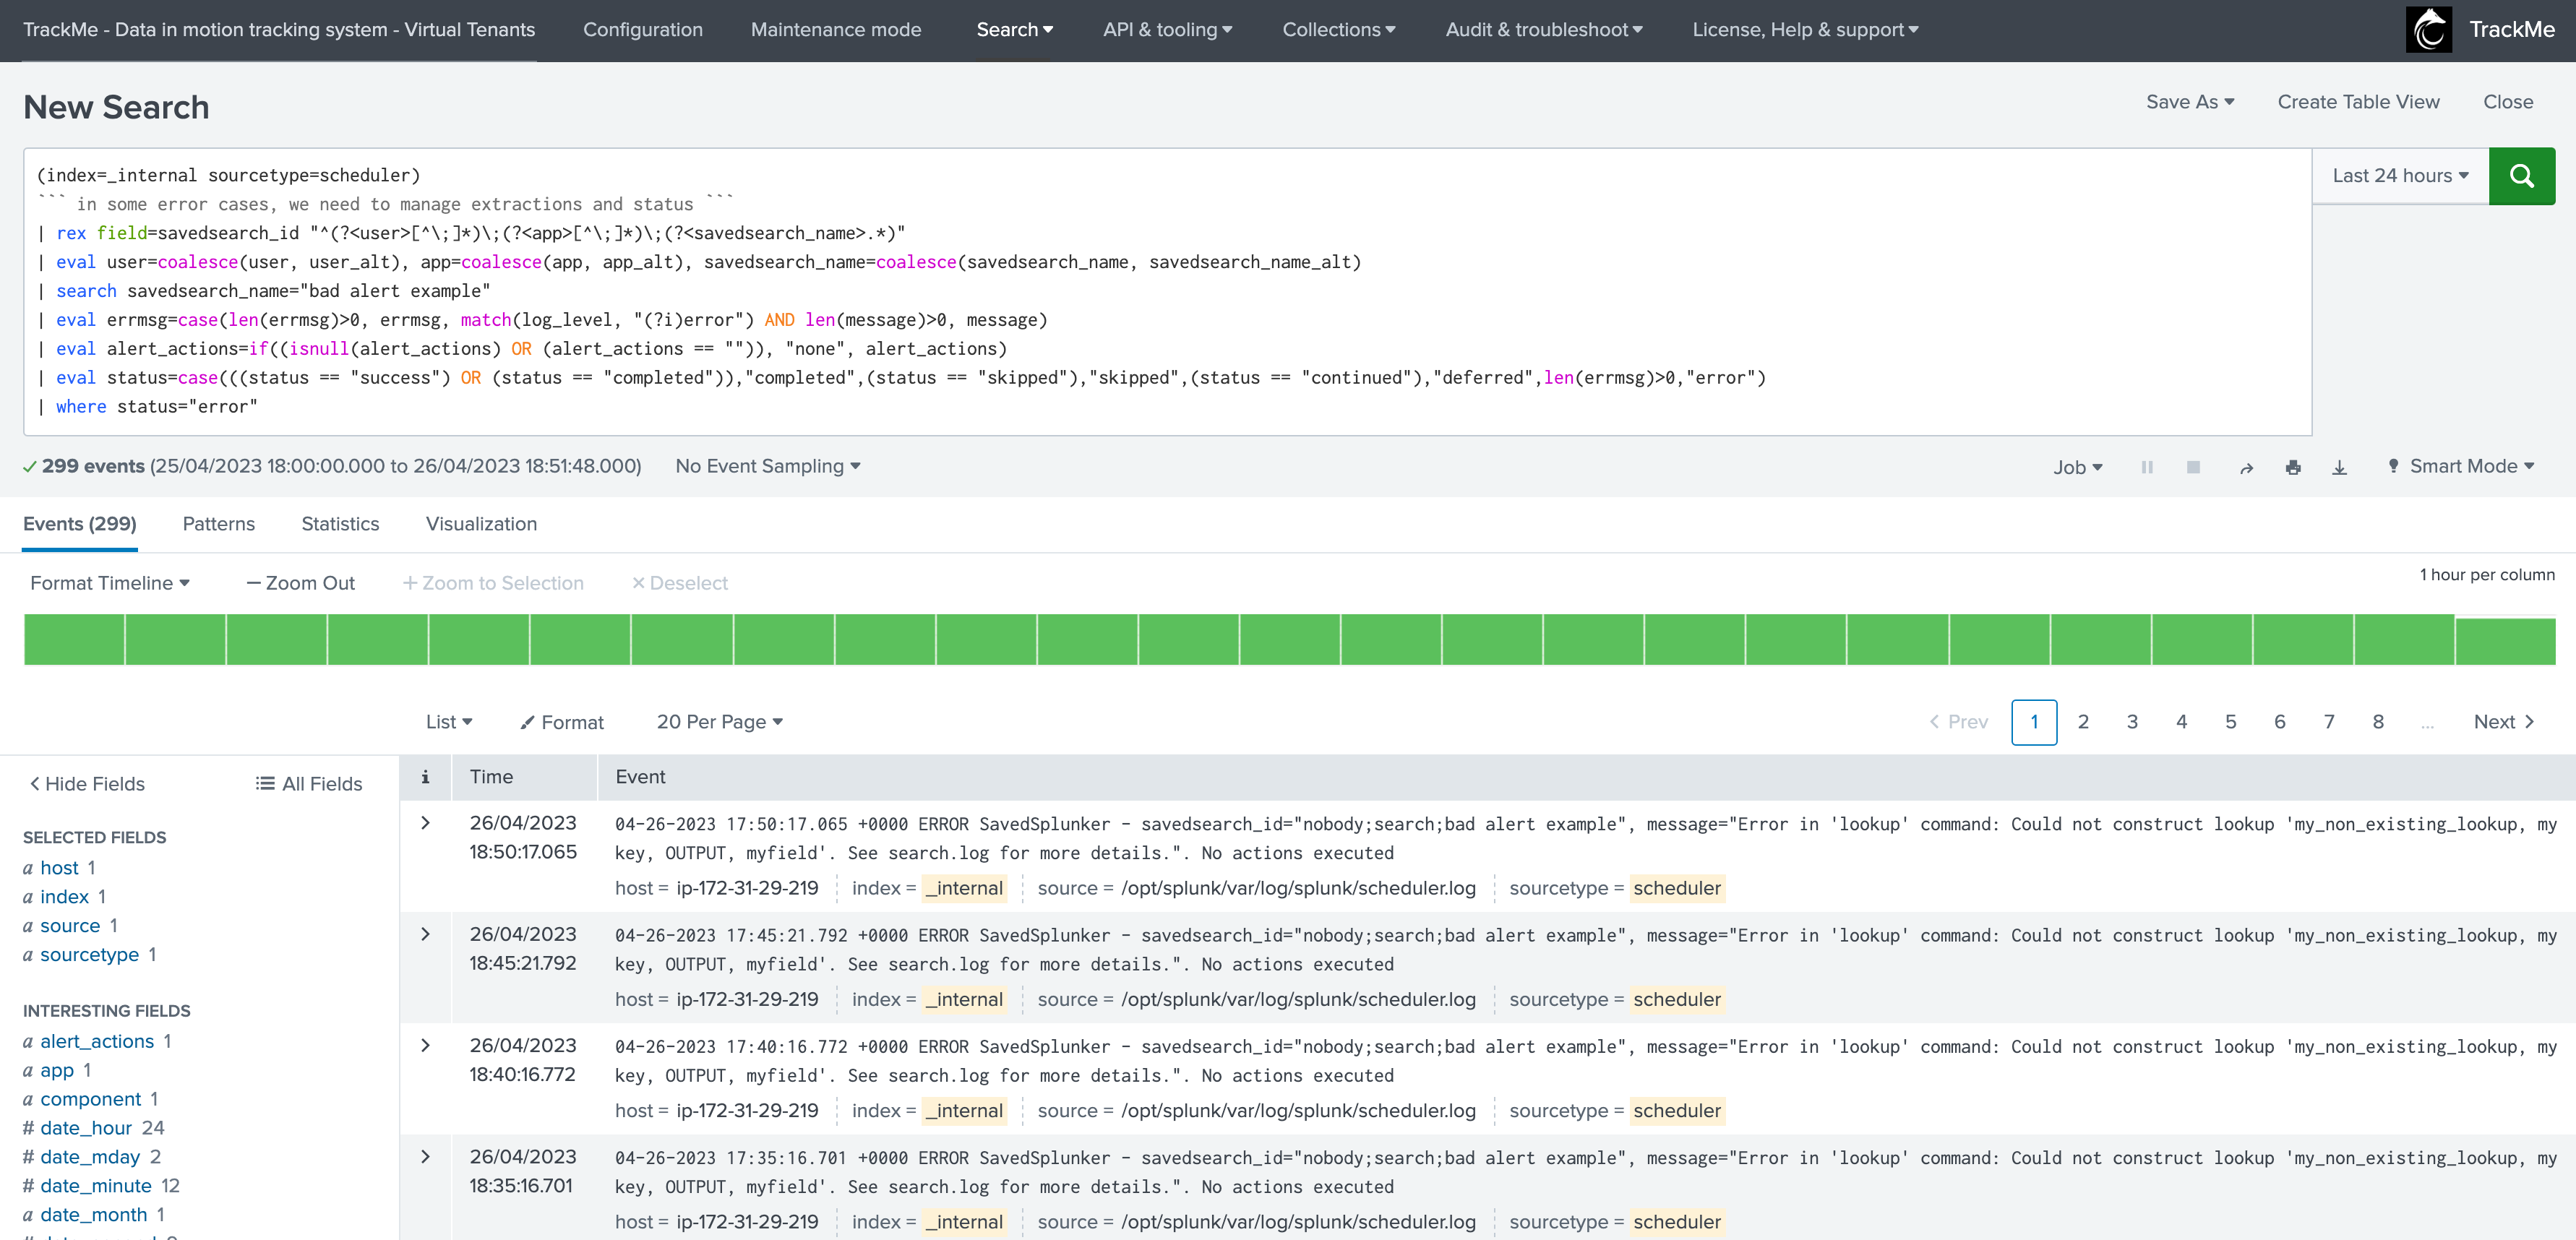
TrackMe handles the challenge by continuously looking at the scheduler activity, and extracting the executions errors turning these into a metric which we can take into account
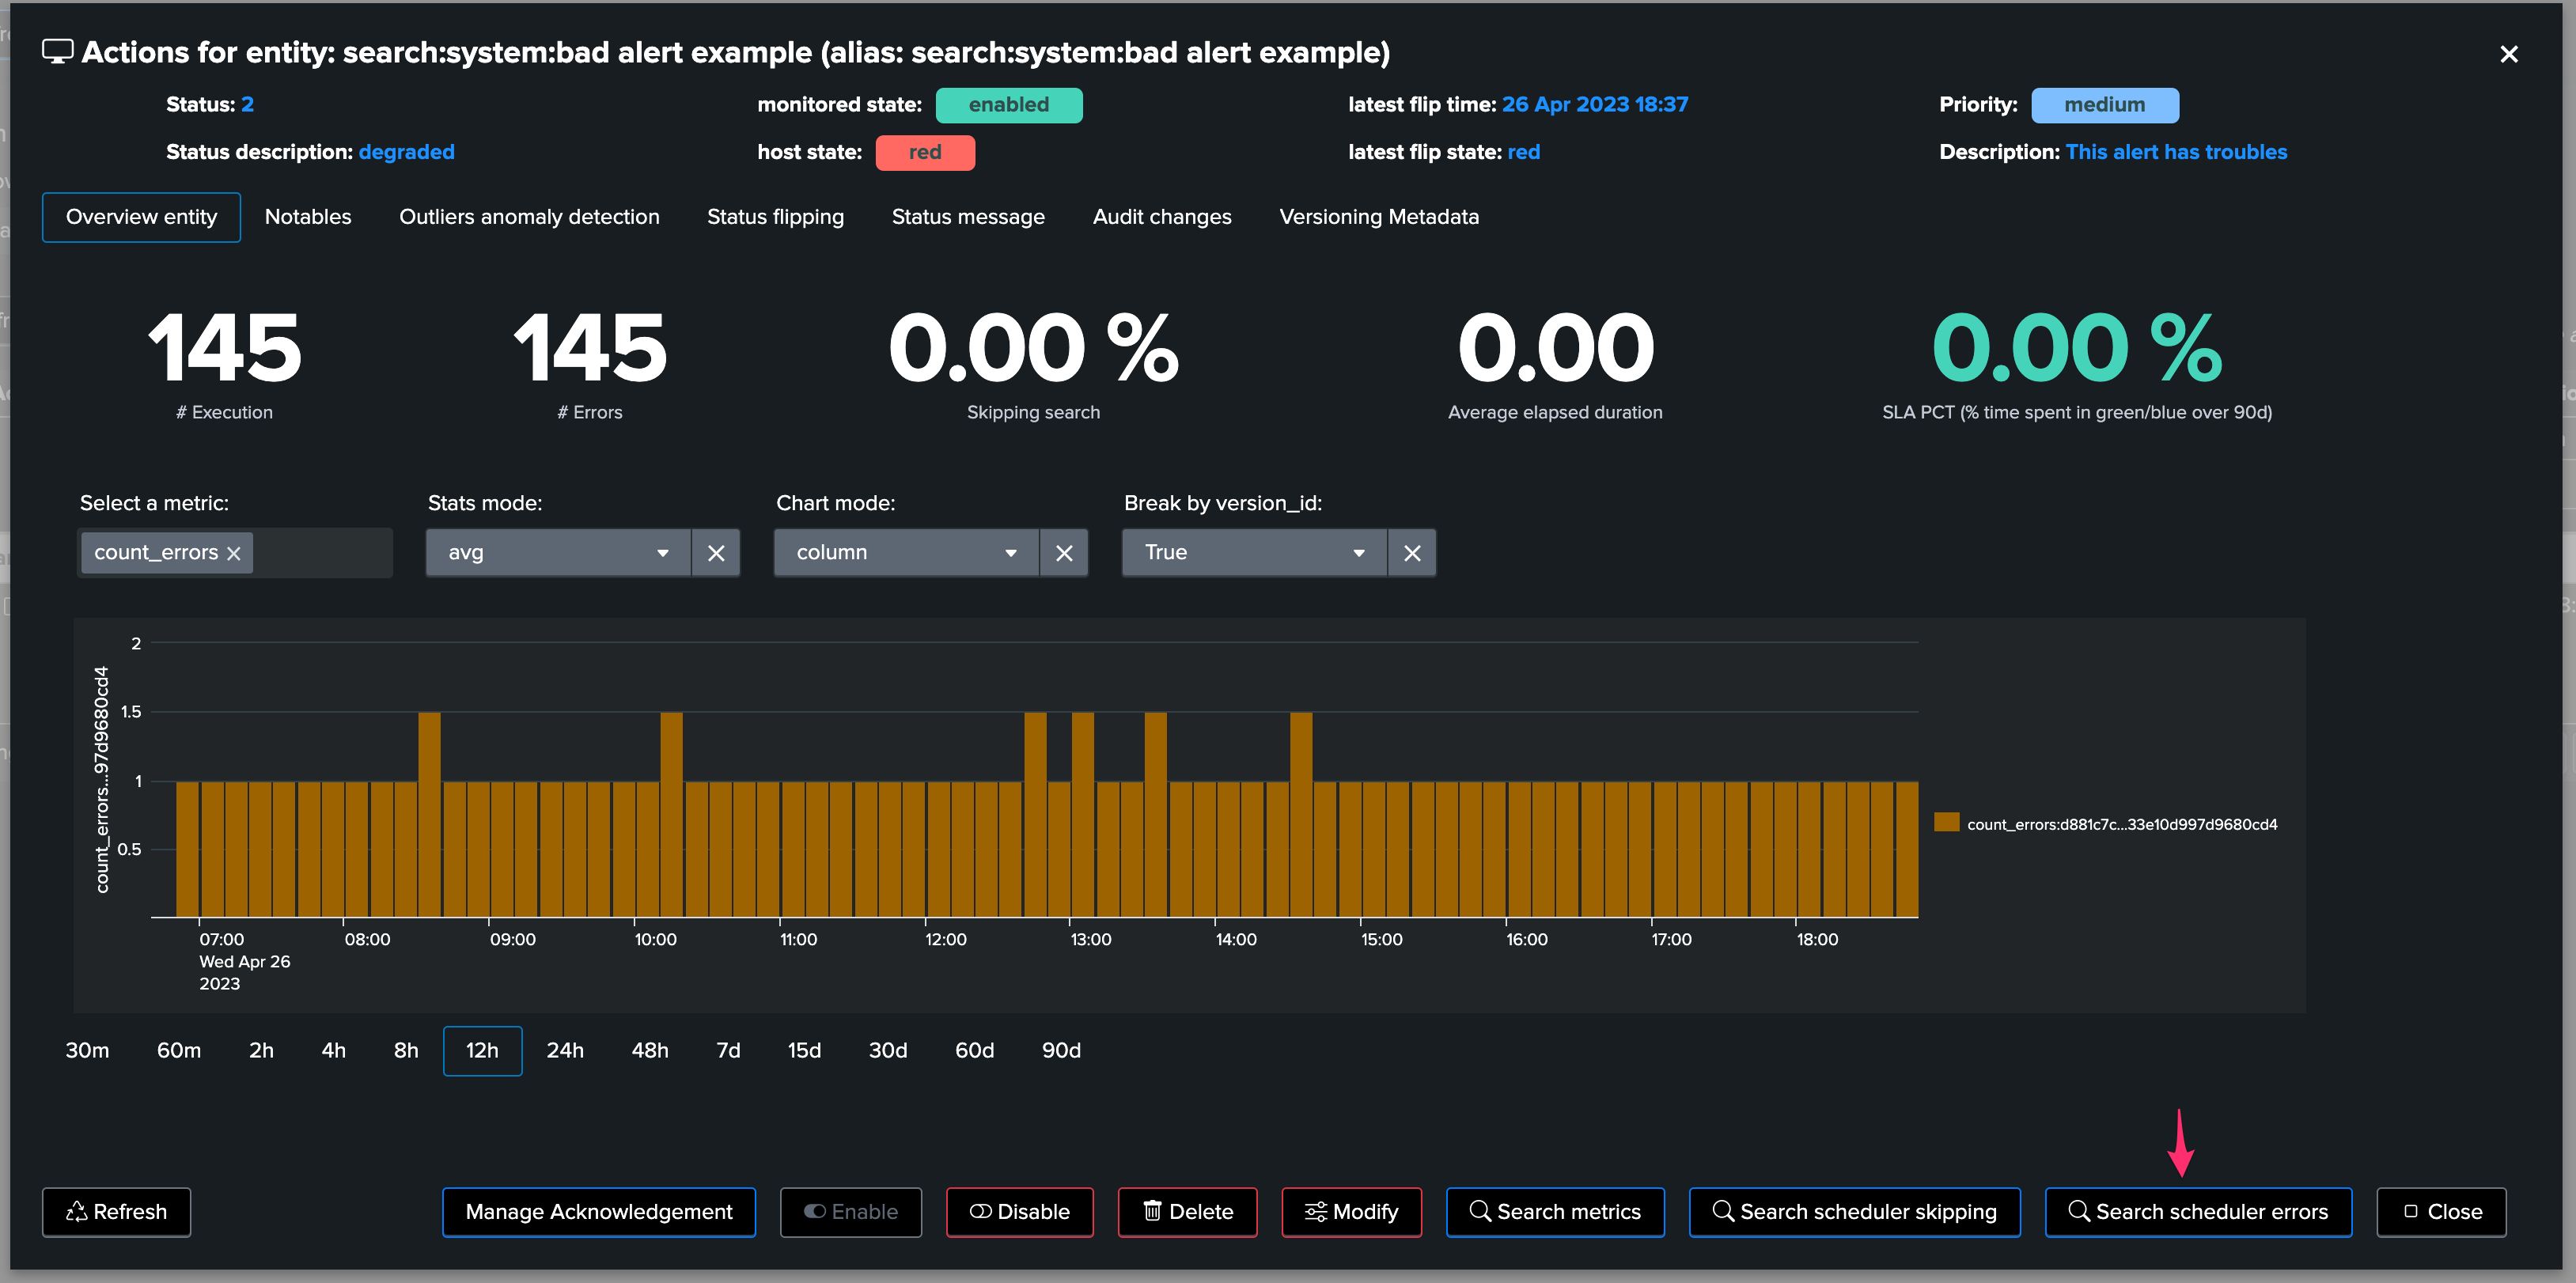
From the overview (currently looking at the metrics), you can as well directly access to the scheduler errors:
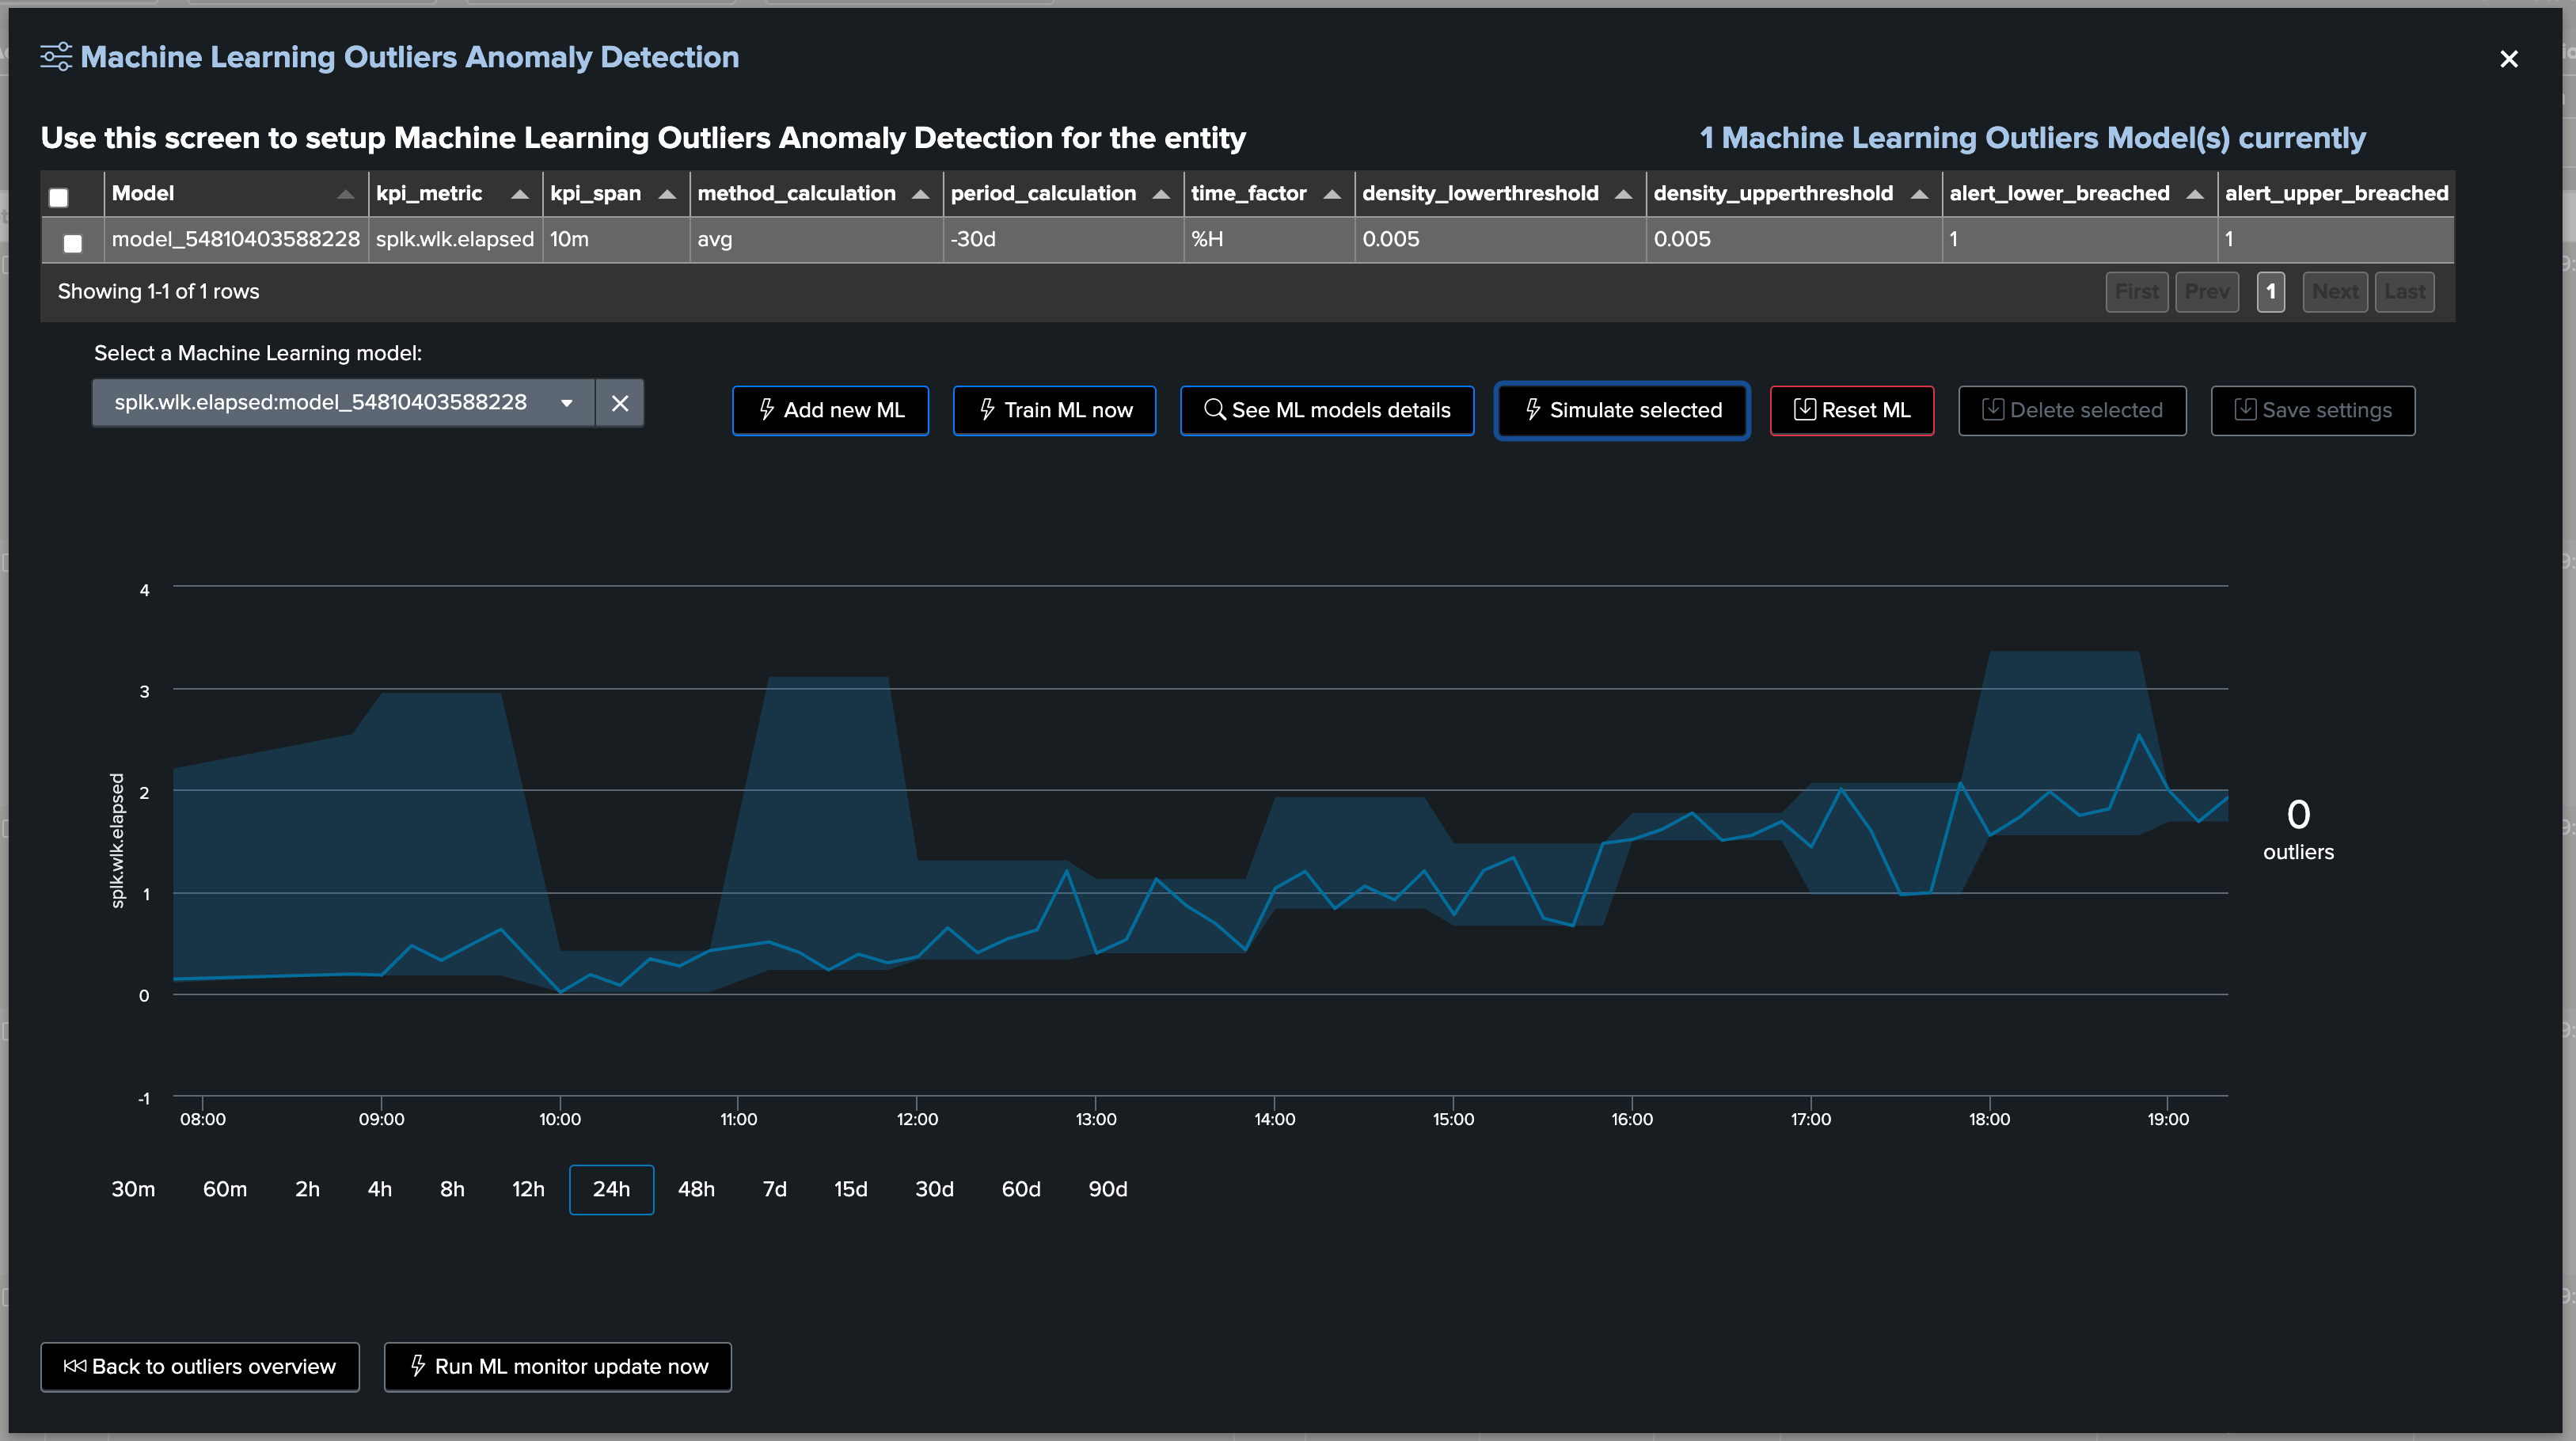
10. Machine Learning Outliers detection
Machine Learning Outliers detection can be used to detect abnormal trends for the scheduled entities, based on any of the available KPIs:
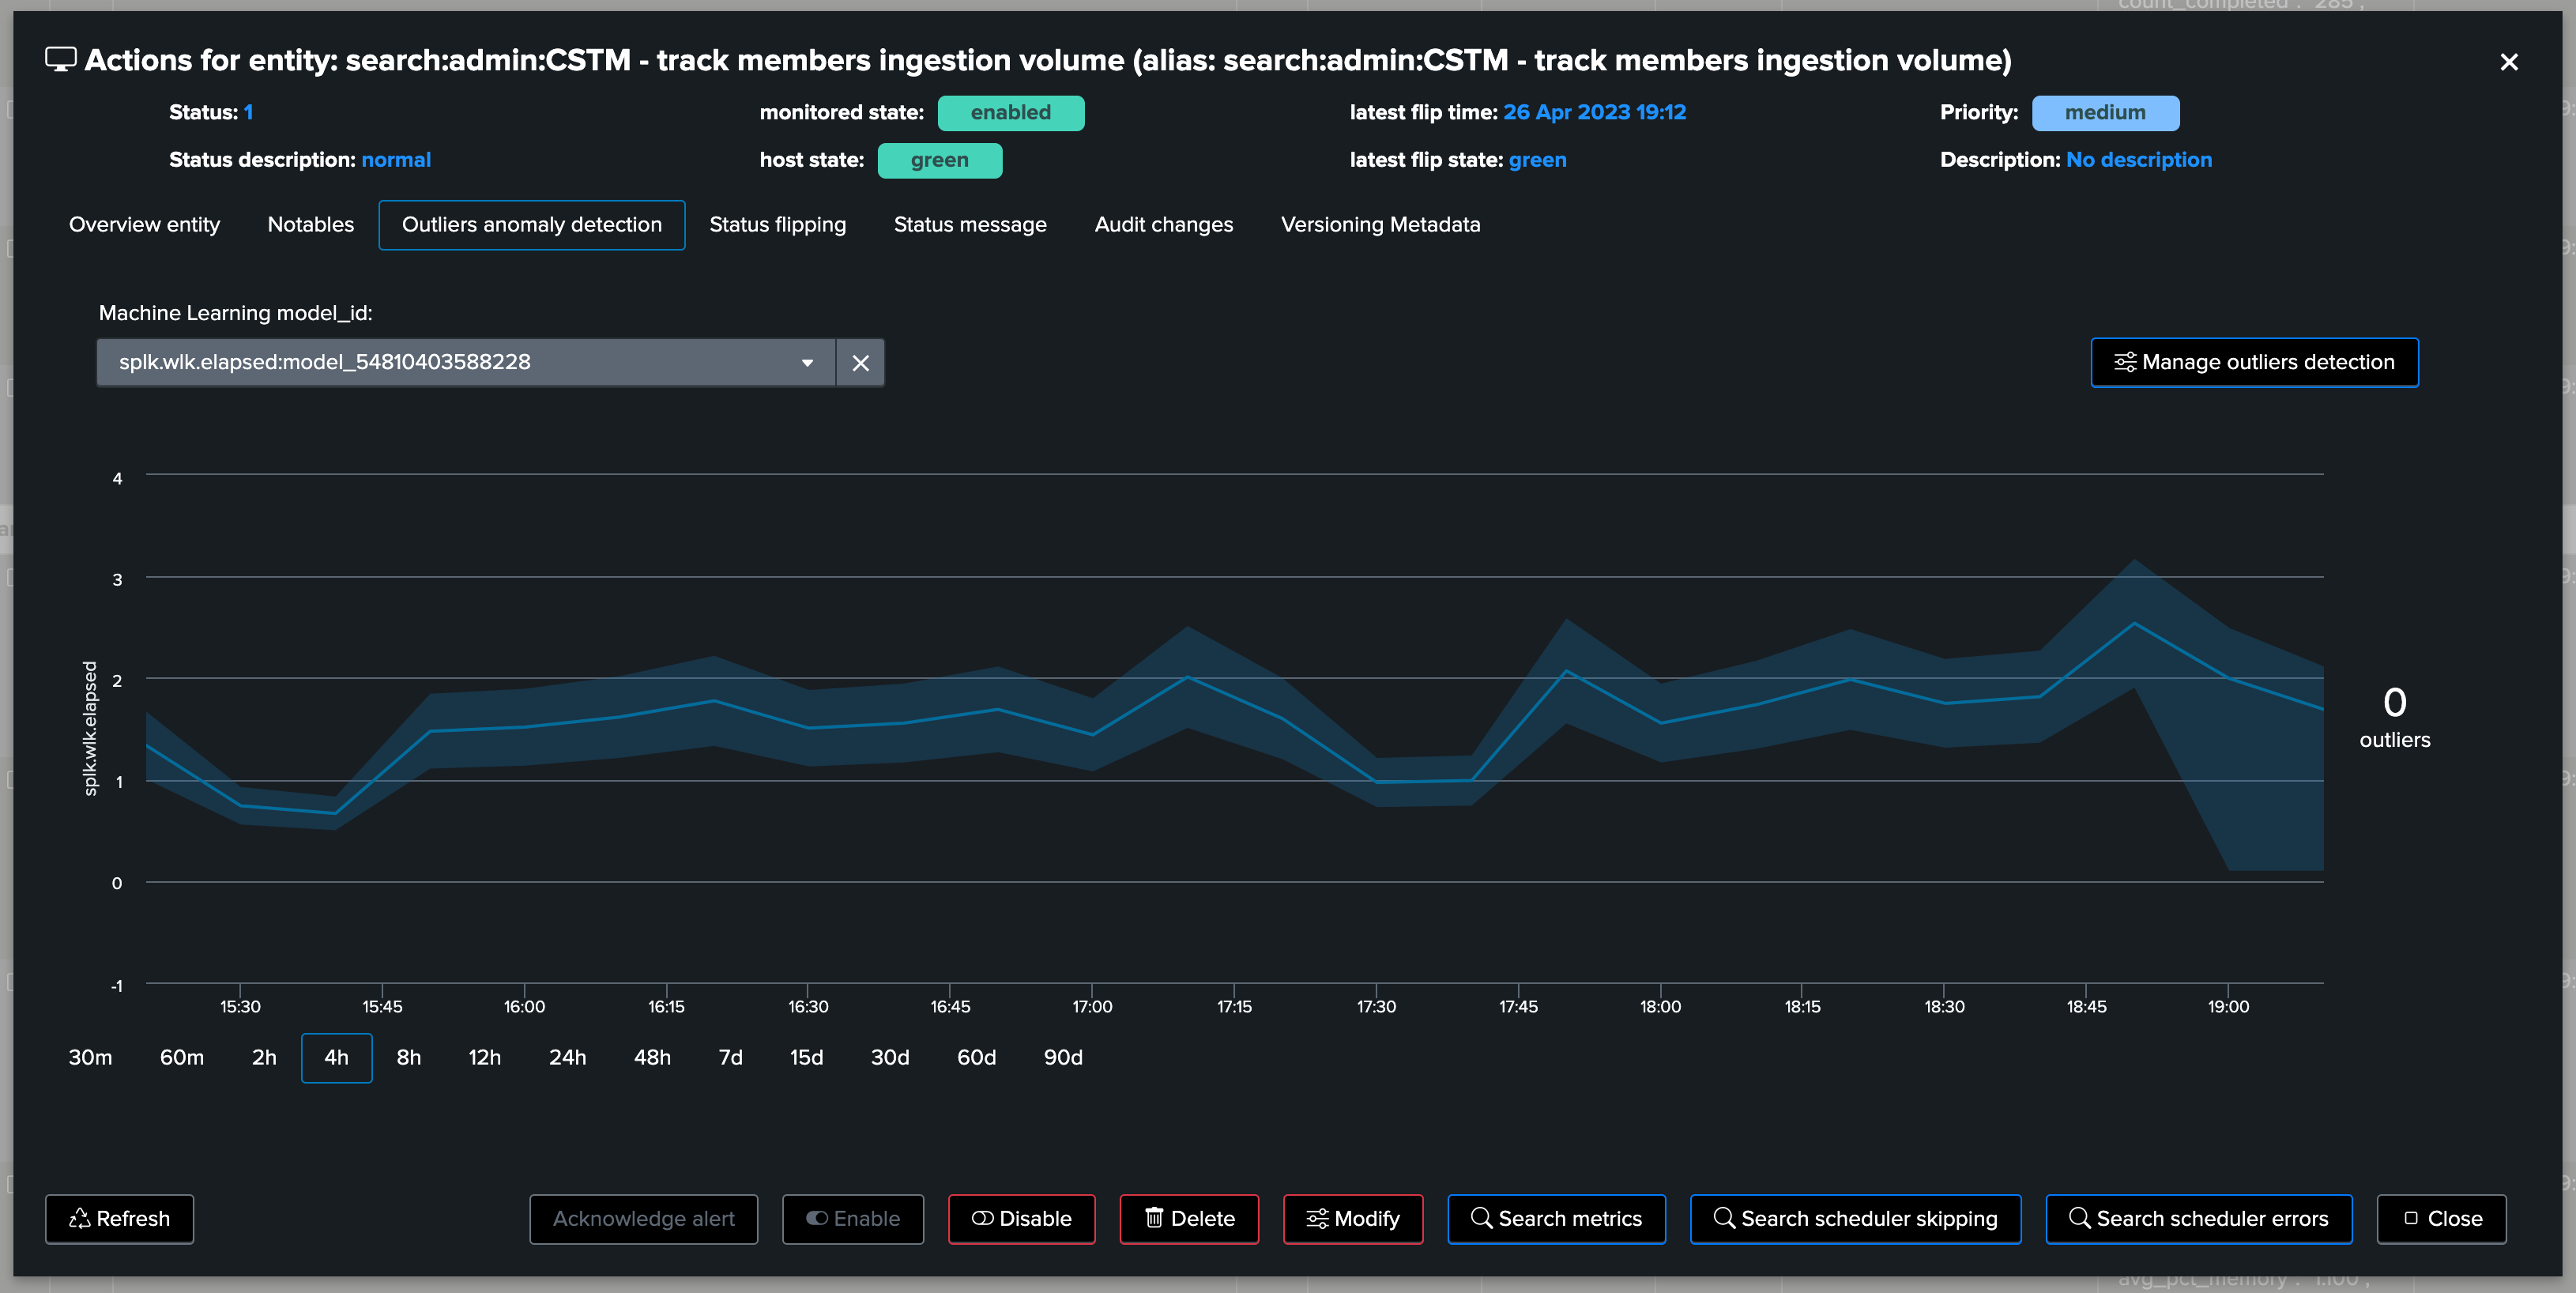
Machine Learning models created and trained by default depend on the Virtual Tenant configuration, additional ML models can be created on demand: