Monitor Splunk Workload with TrackMe’s Workload component
Monitoring Splunk Search Head Clusters with TrackMe Flex Objects
This tutorial demonstrates the monitoring of Splunk Workload with the TrackMe Workload component.
The Workload component is a component restricted to licensed customers. Please contact Splunk Sales for more information.
Using these steps will enable TrackMe to continuously monitor Splunk scheduled activity, detect execution anomalies and changes in behavior, as well as performing versioning of searches definition.
Monitoring the Splunk scheduling workload is a critical part for Splunk. For instance, detecting when your SIEM correlation searches are affected by any issue is as crucial as detecting when feeds have stopped feeding your use cases.
With TrackMe’s remote search capabilities, you can monitor as many Search Head tiers as you need from a single pane of glass.
Hint
Evolutions in TrackMe 2.1.28
Since TrackMe 2.1.28, you can now control the list of parameters that are taken into account to calculate the version_id hash.
To do so, go in Configure / splk-general and update the
splk_general_workload_version_id_keysparameter.The default is to take into account the following parameters: search,dispatch.earliest,dispatch.latest,description,cron_schedule
Requirements
In most cases, you will want to target a different Search Head tier than the one where the TrackMe instance is running.
For example, if you are running Splunk Enterprise Security, this is normally in a different Search Tier. We will therefore start by creating a Splunk Remote Account in TrackMe to access the Search Head tier, programmatically speaking.
Step 1: Create a Splunk Remote Deployment Account for the SHC
The first step is to create a Splunk Remote Deployment Account for the Cluster Manager. For more information about TrackMe Remote Search capabilities and configuration:
Splunk Remote Deployments (splunkremotesearch)
On the Search Head Cluster, create a new Splunk bearer token for the TrackMe Remote Deployment Account:
In TrackMe, click on Configure / Remote Deployment Accounts and add a new account:
If running a Search Head Cluster, you can specify each of the SHC members in a comma-separated list or use a load balancer URL.
If running a standalone Search Head, you can specify the Splunk API URL of the Search Head.
If multiple endpoints are specified, TrackMe automatically dispatches searches randomly amongst available and responding members (it validates connectivity and authentication)
Managing multiple Search Head tiers
If you have multiple Search Head tiers to be monitored, you can create a Remote Deployment Account for each tier.
You will then be able to manage and monitor as many Search Head tiers as you need from a single pane of glass in TrackMe.
Step 2: Create a Workload tenant and use the wizard to create trackers automatically
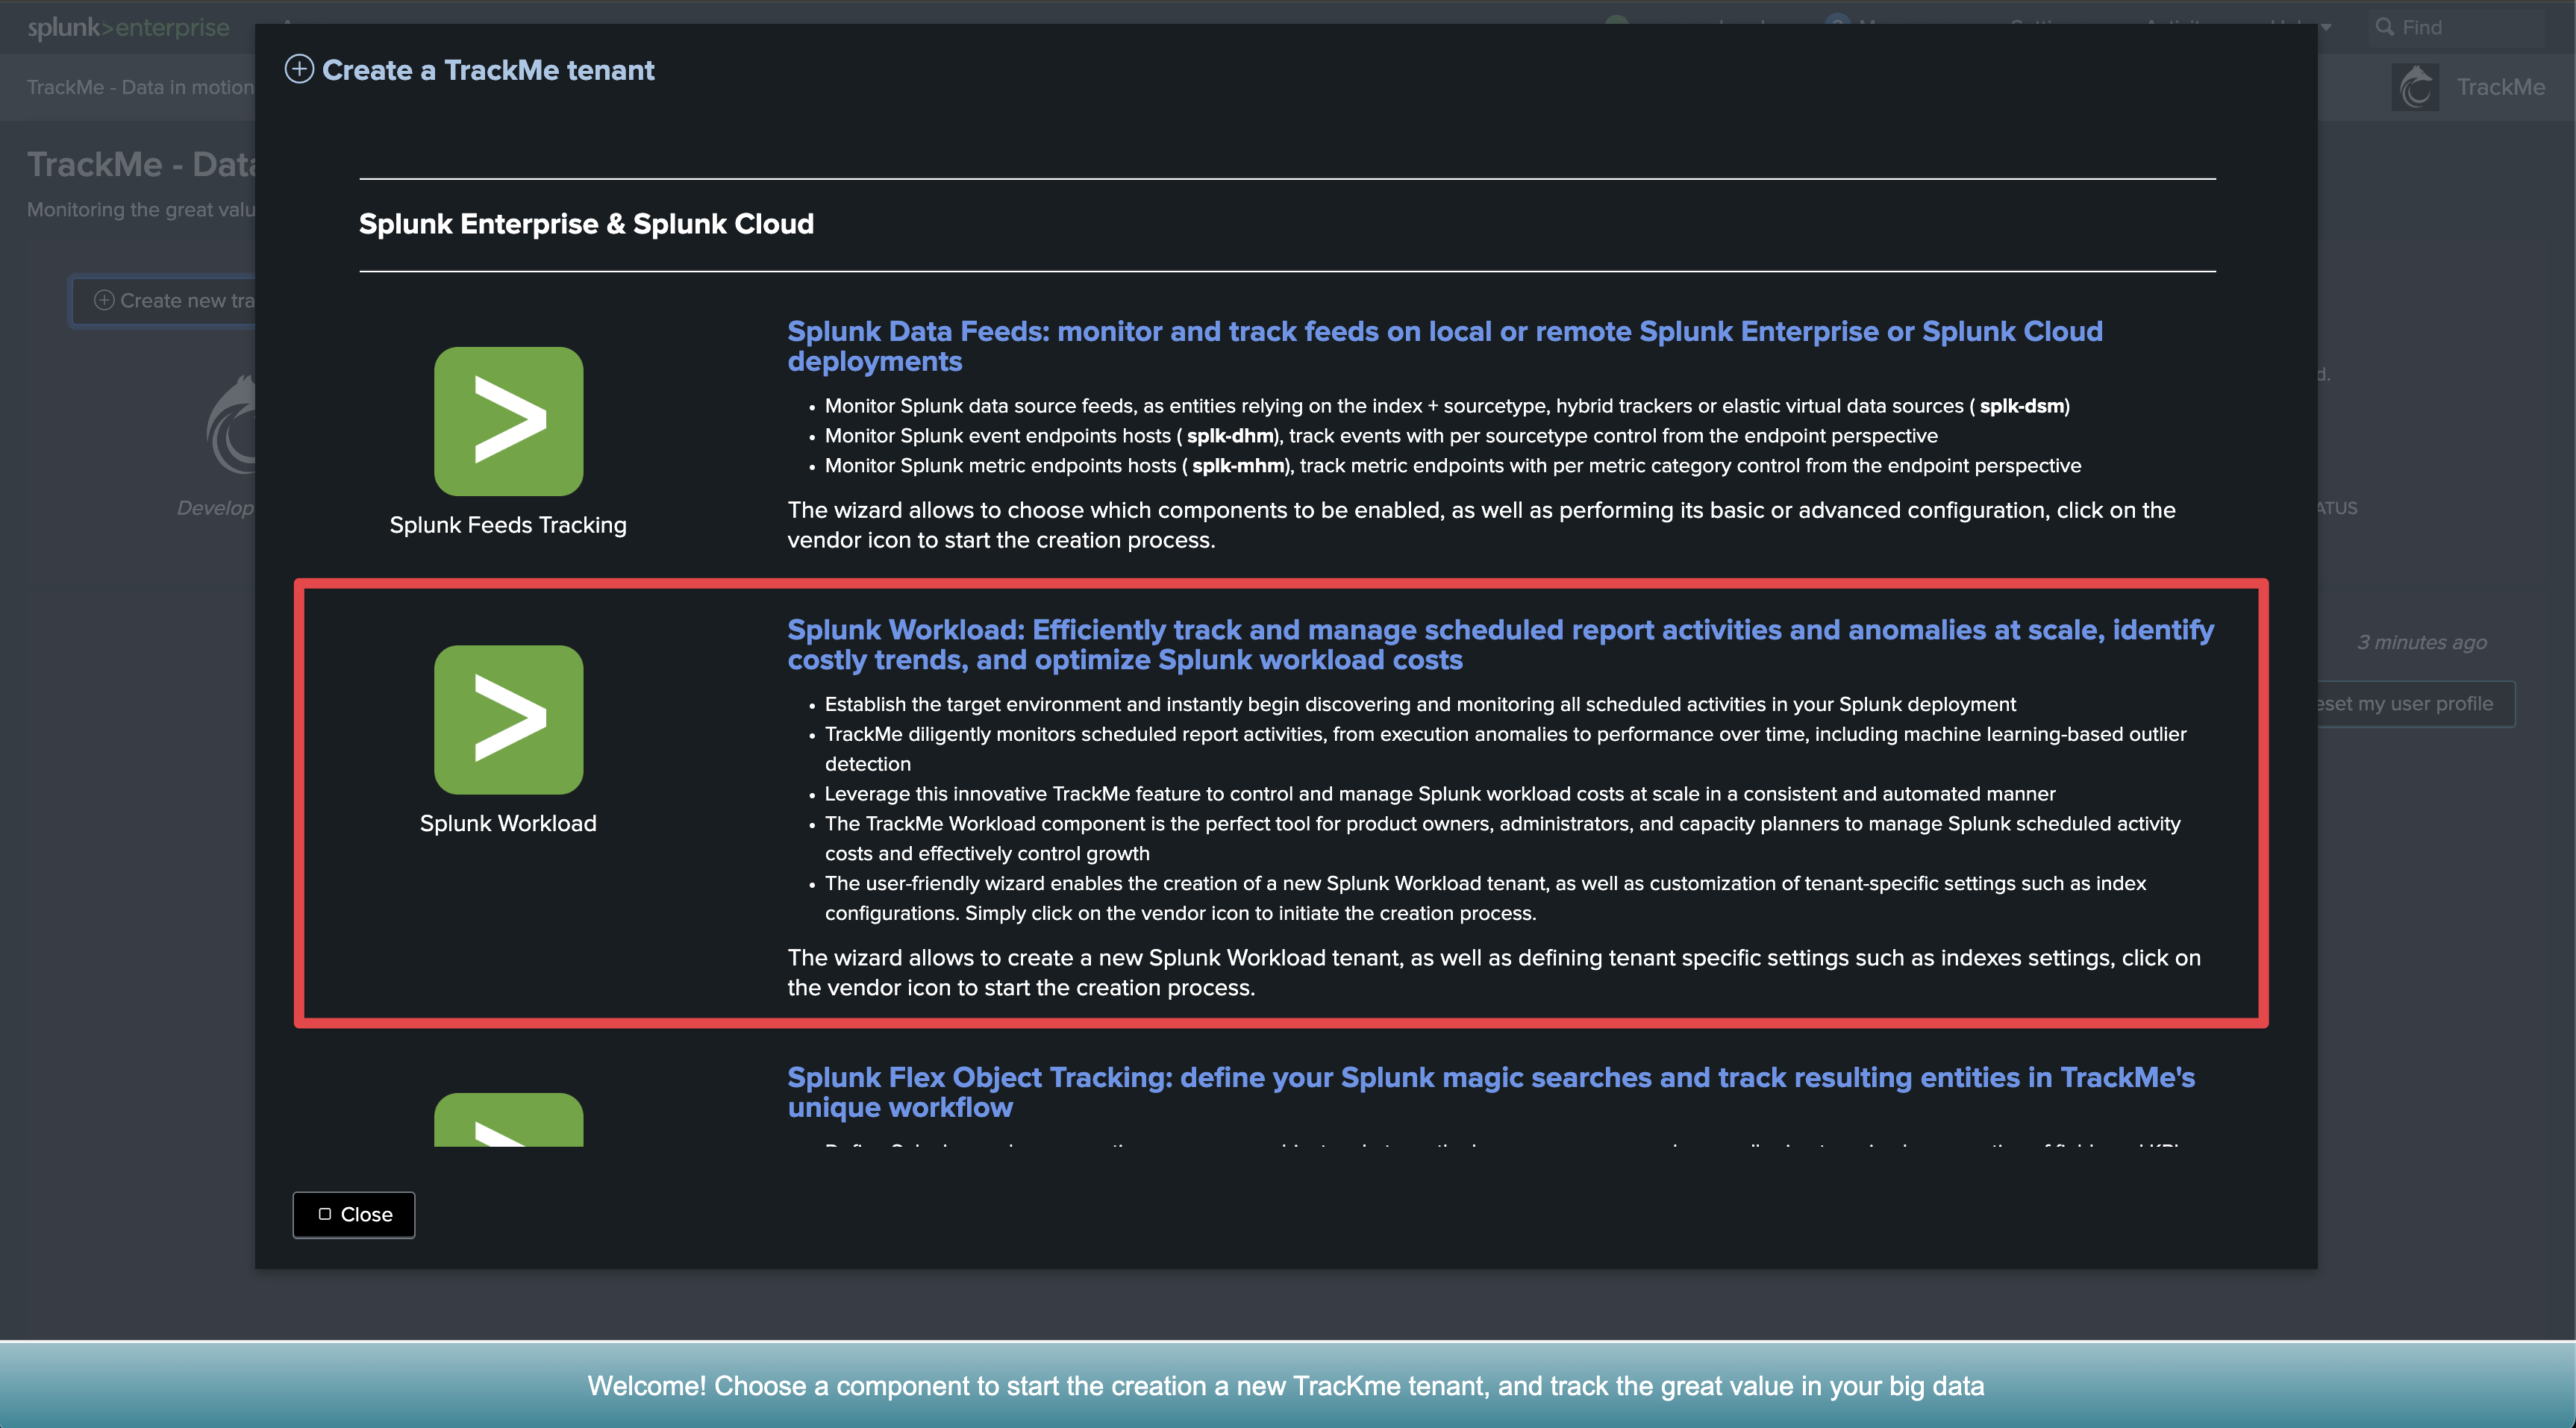
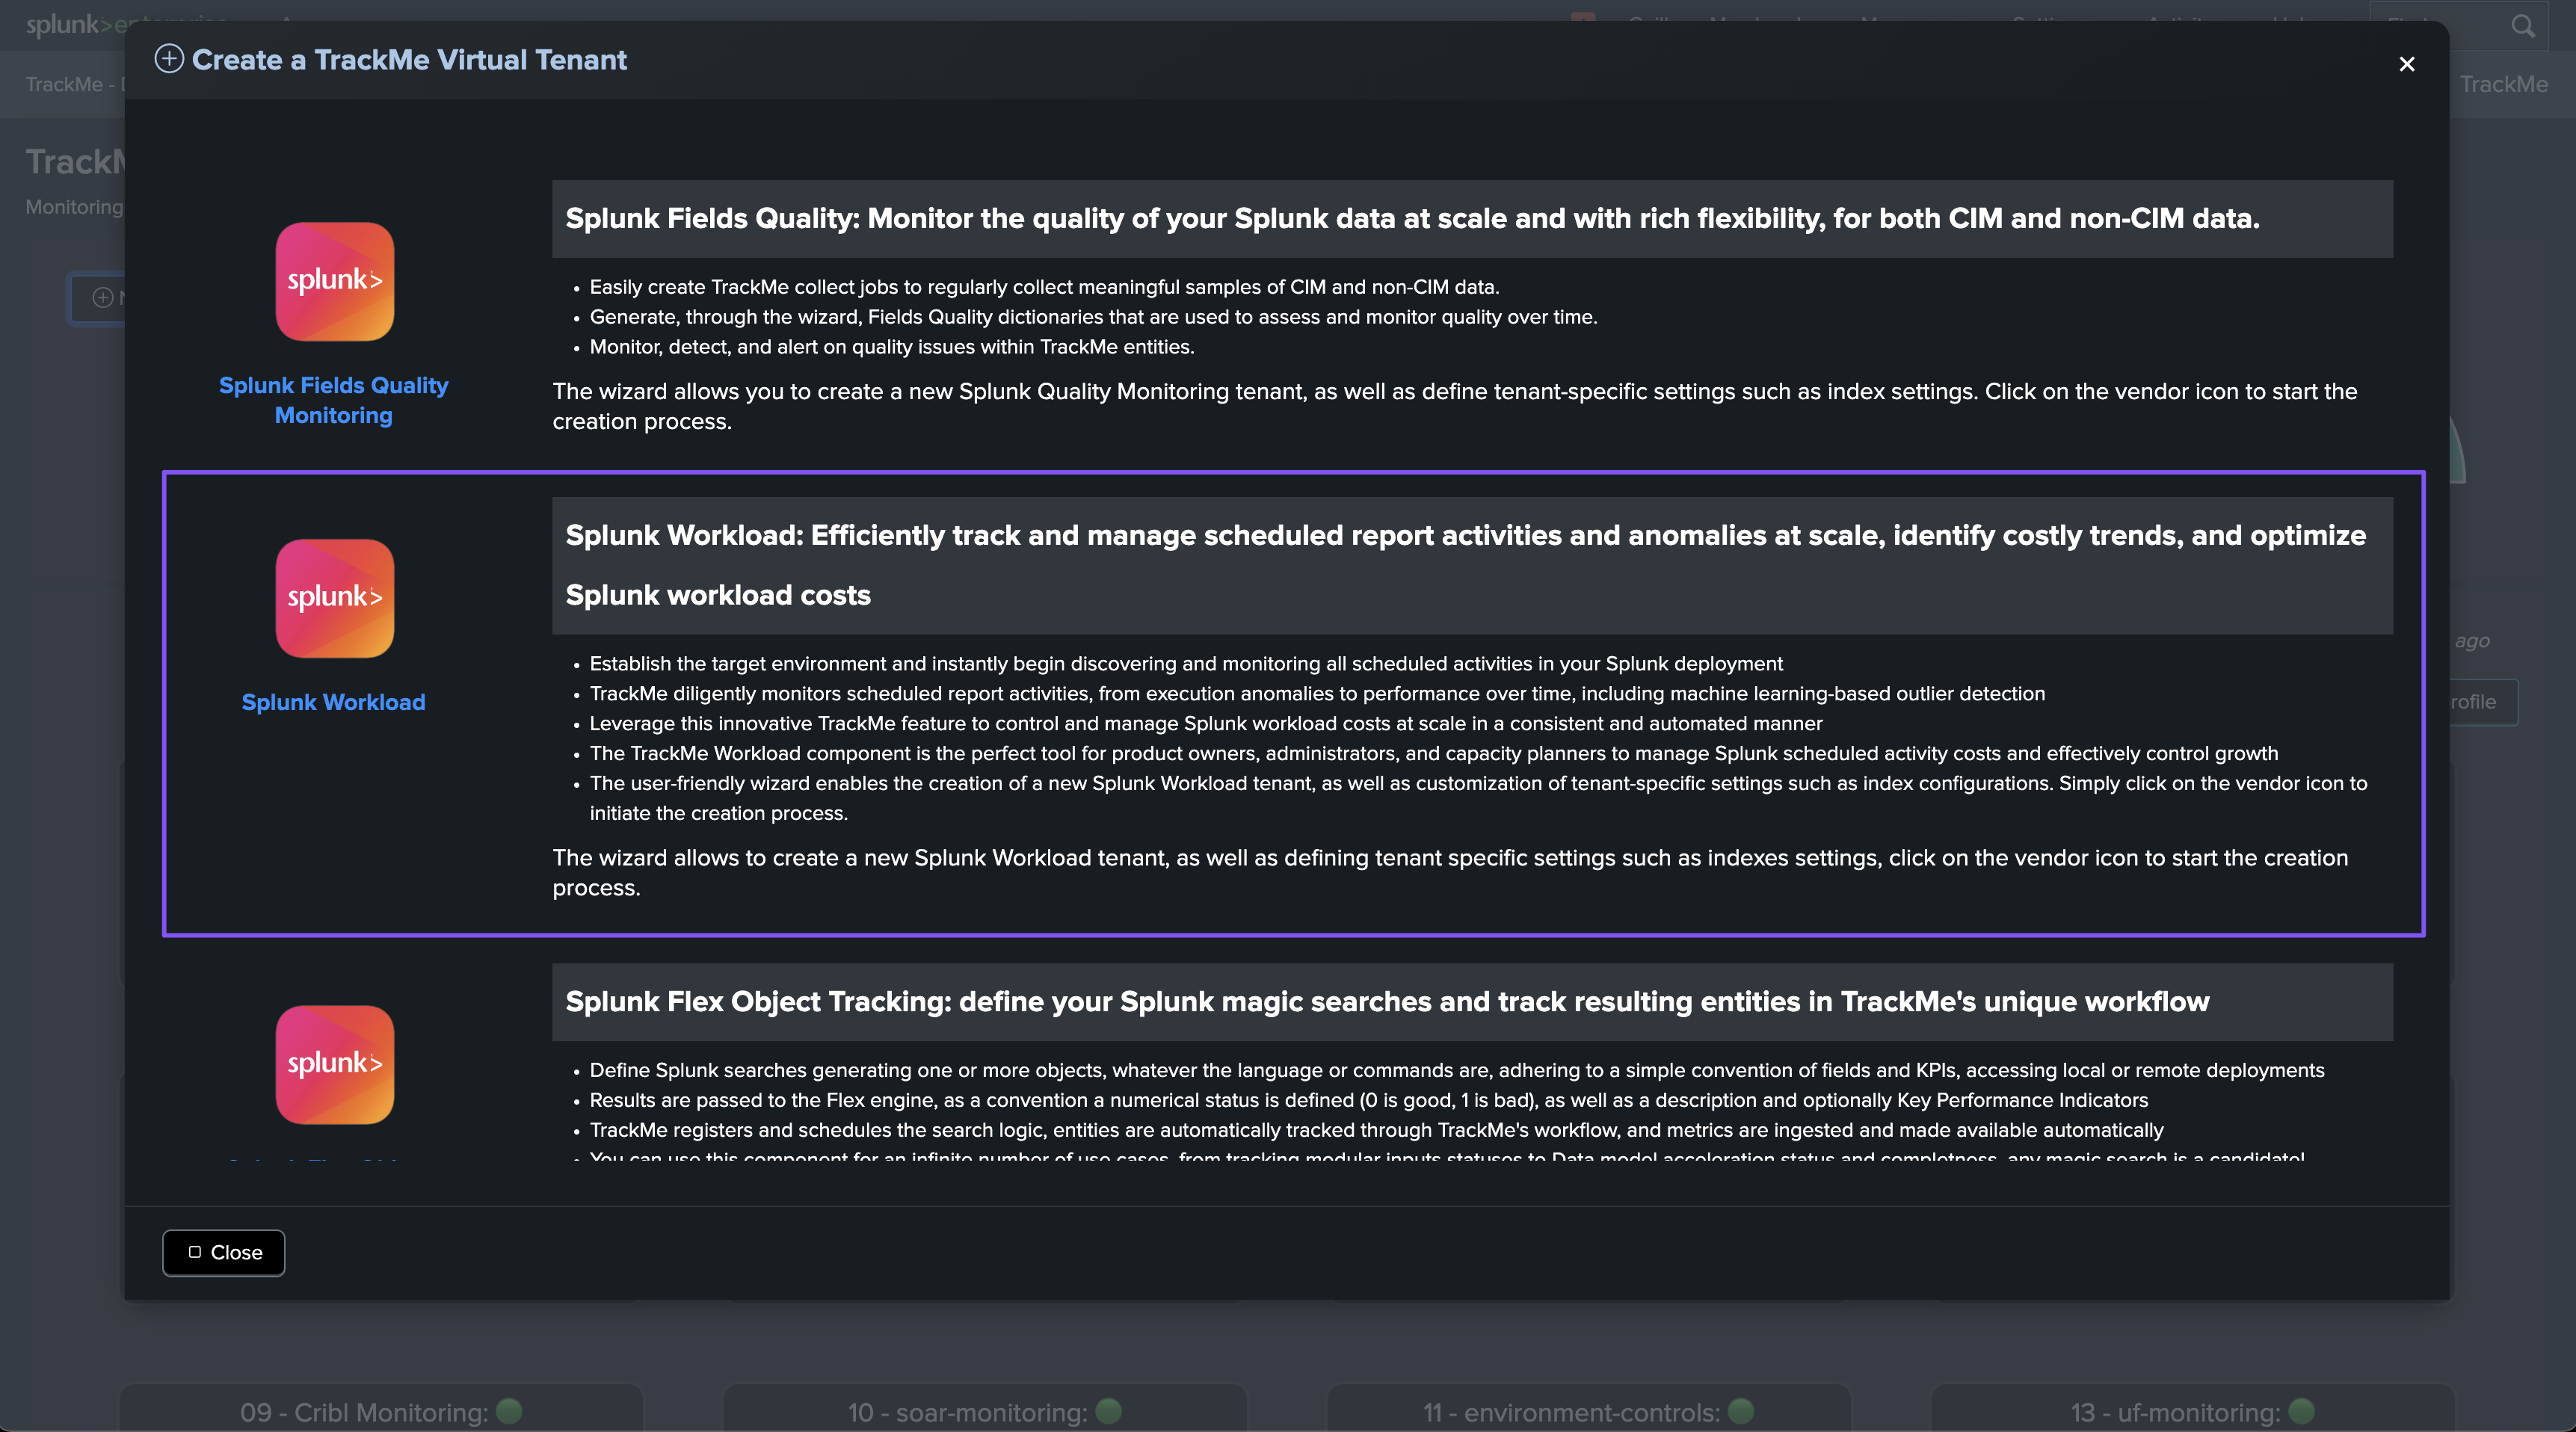
Access the tenant creation wizard and select the Workload component
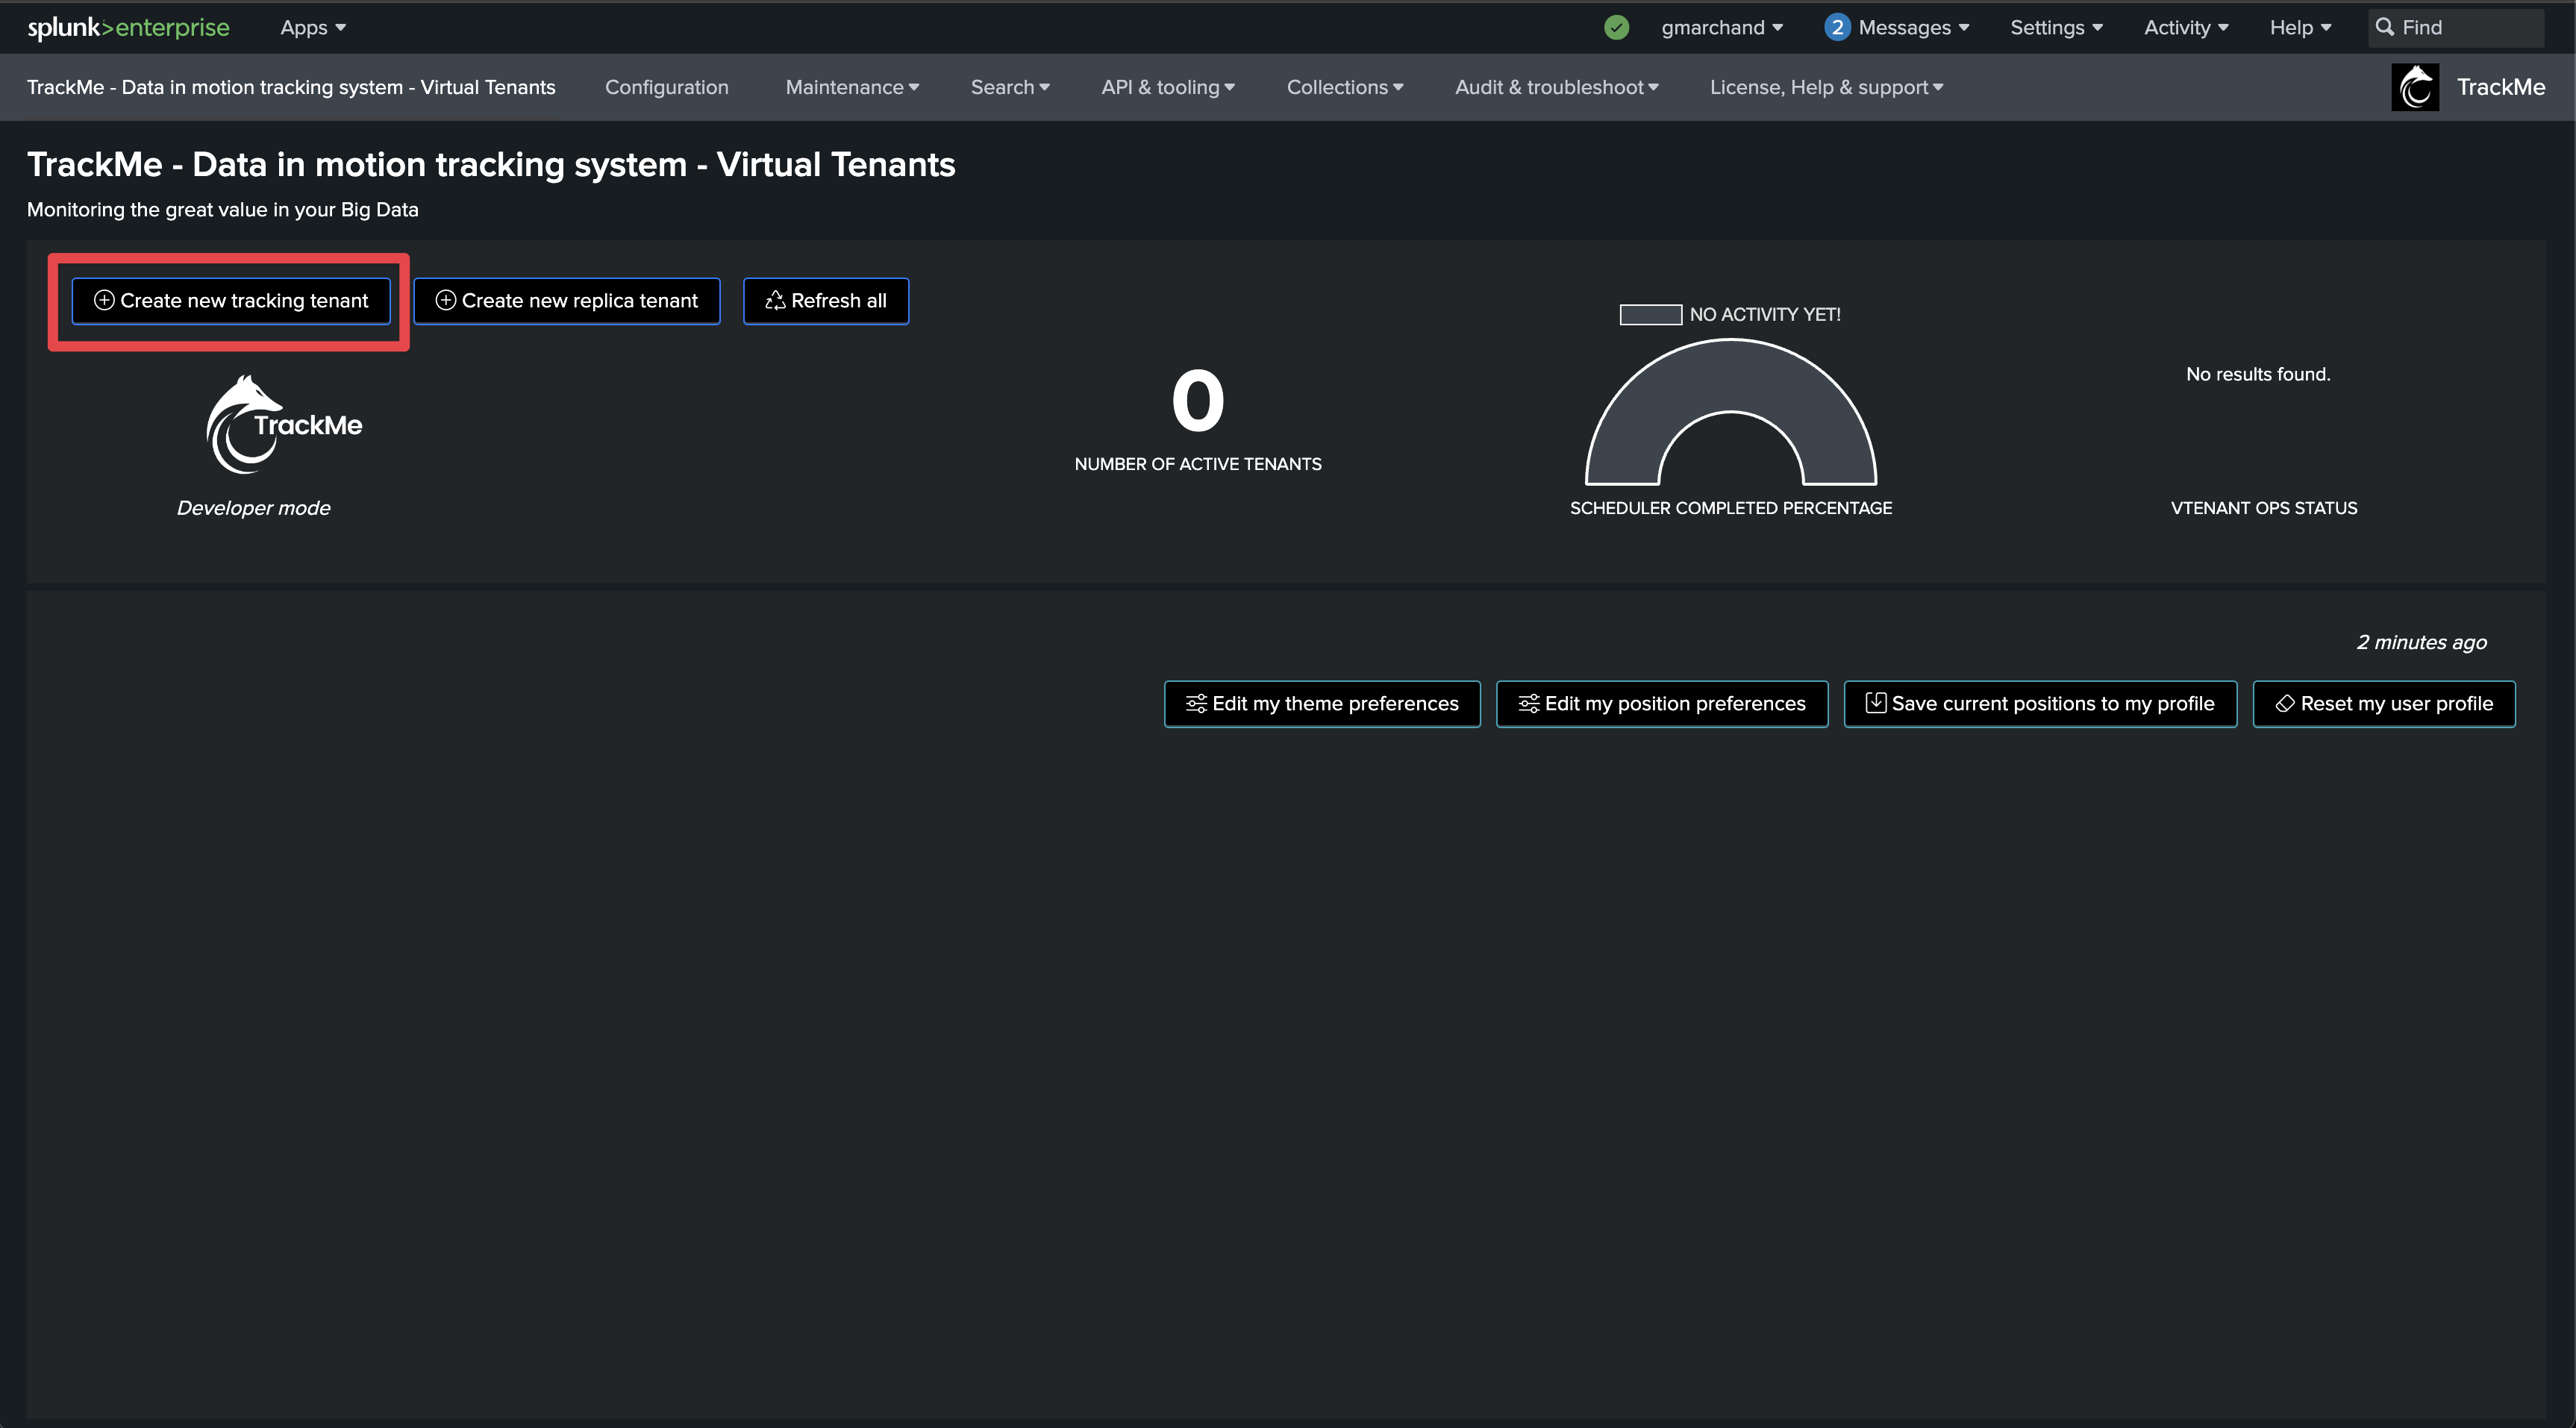
Click on “New tracking tenant”:
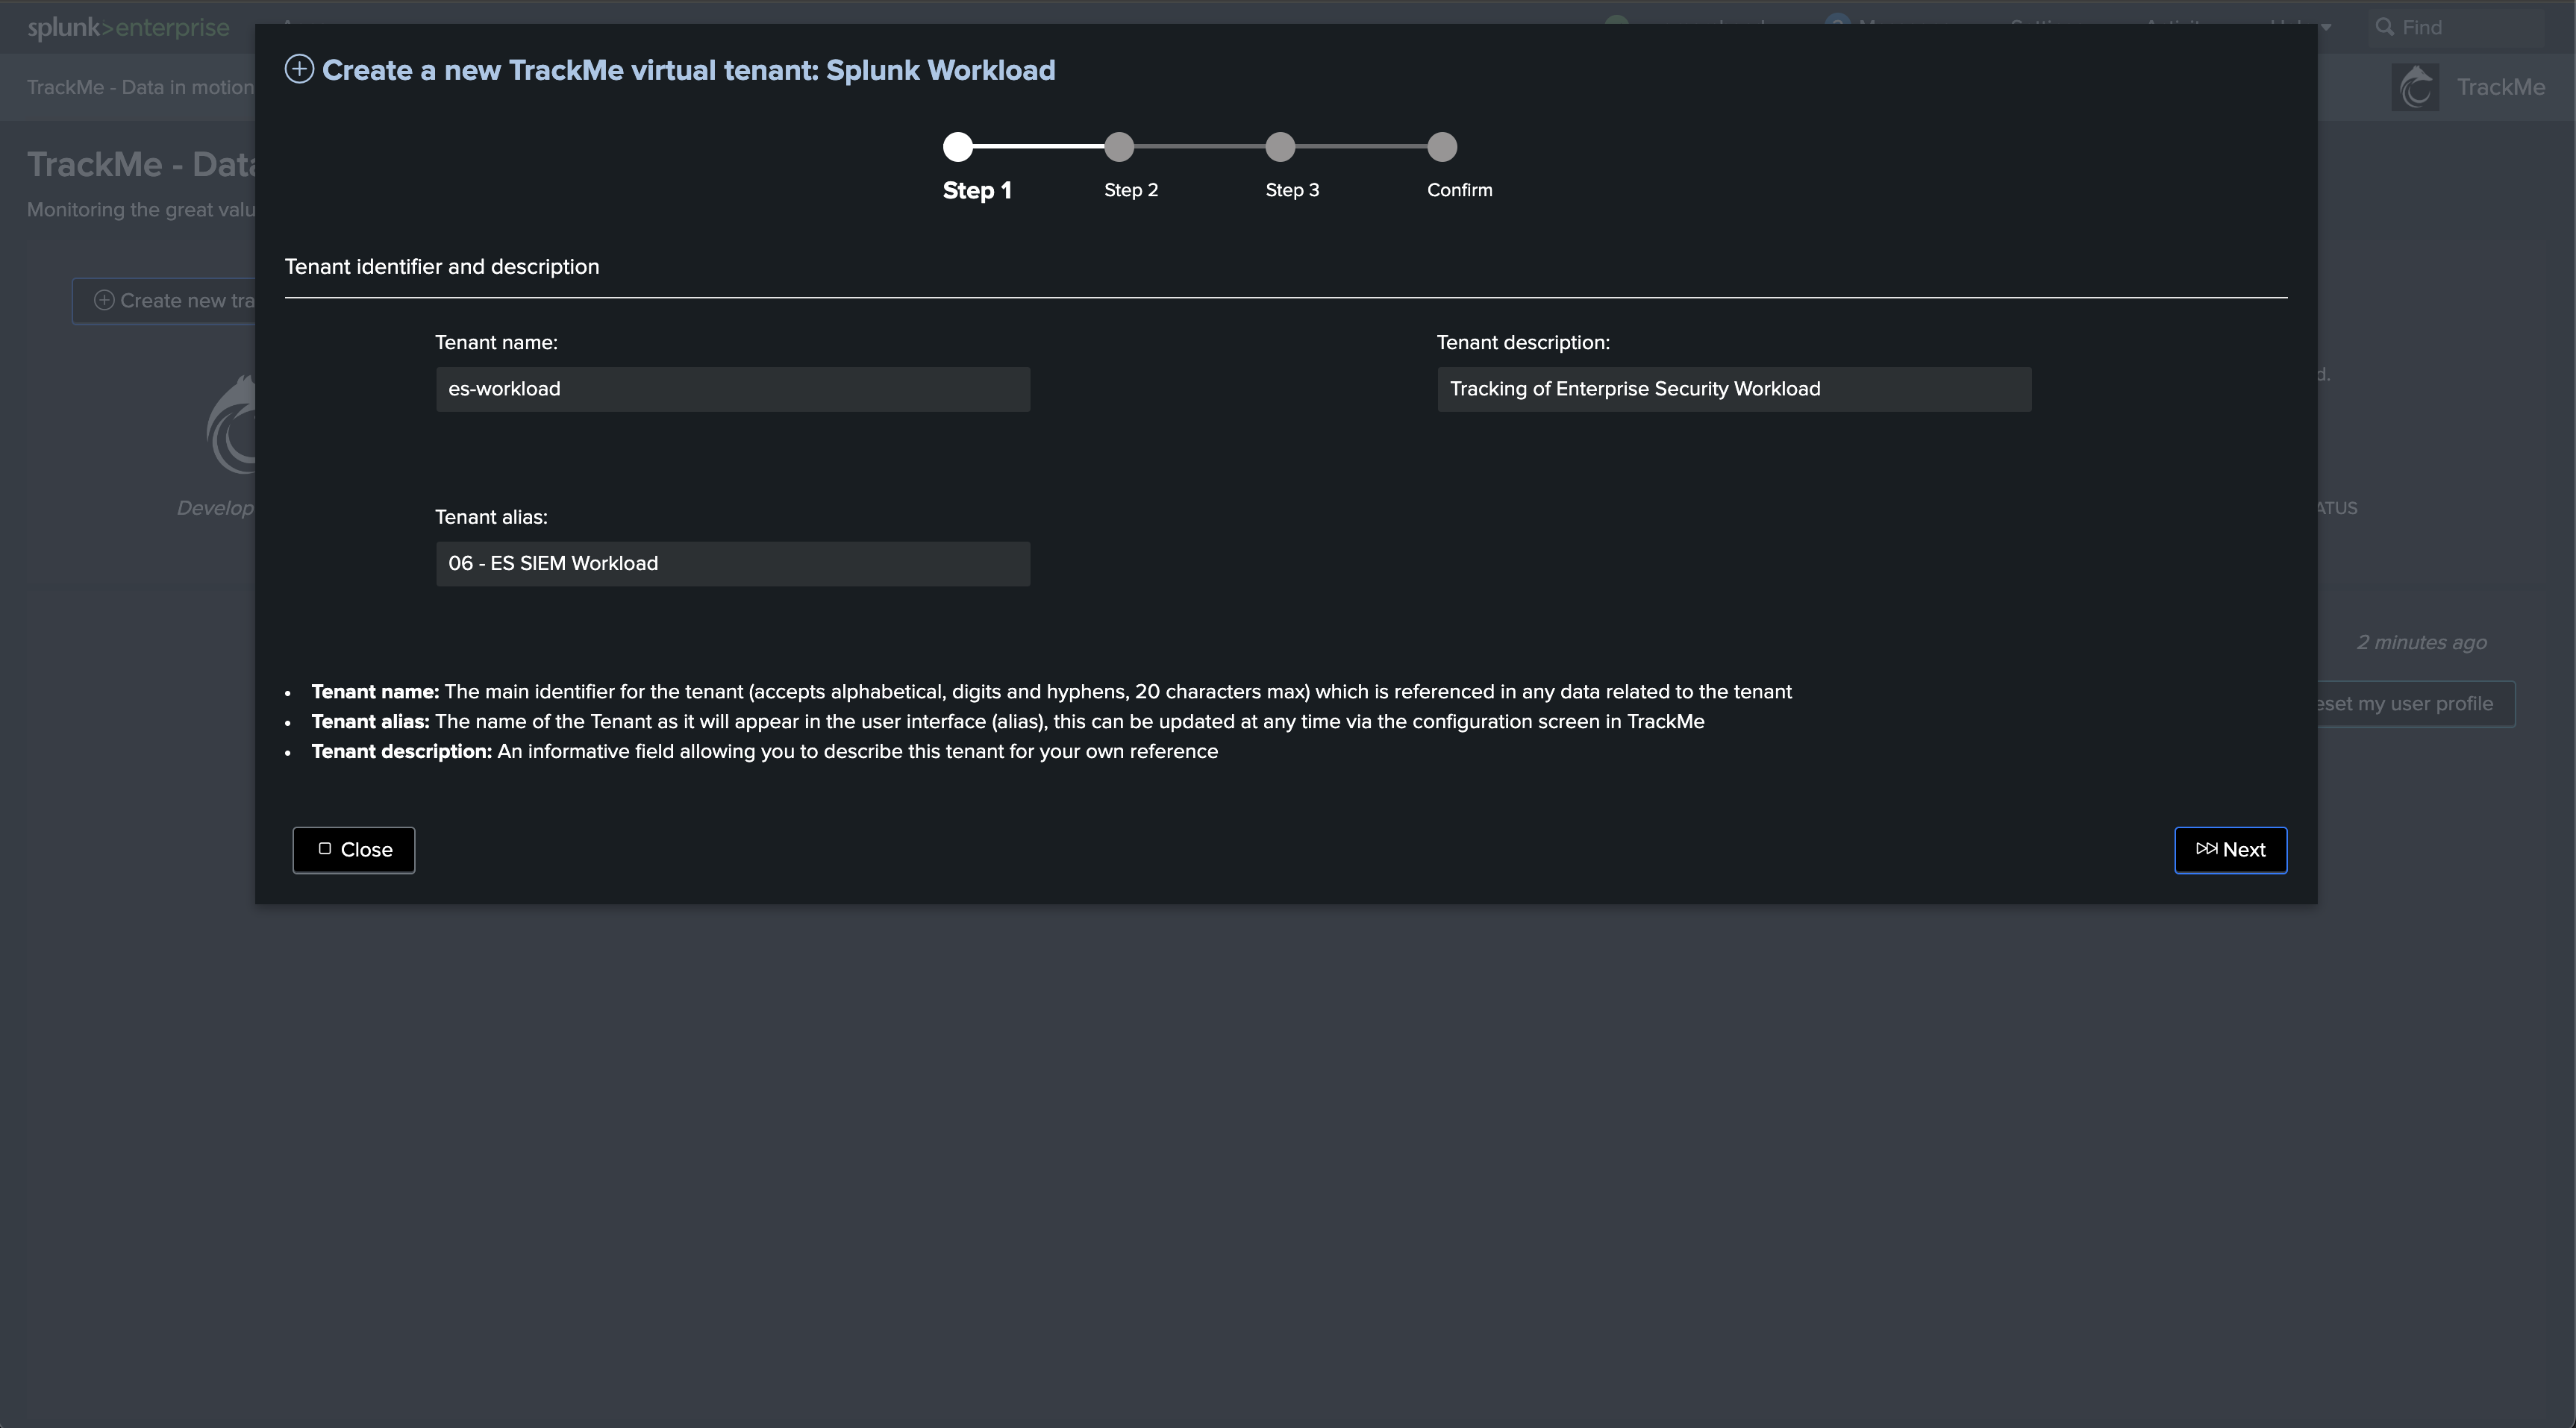
Choose the tenant_id and other main information

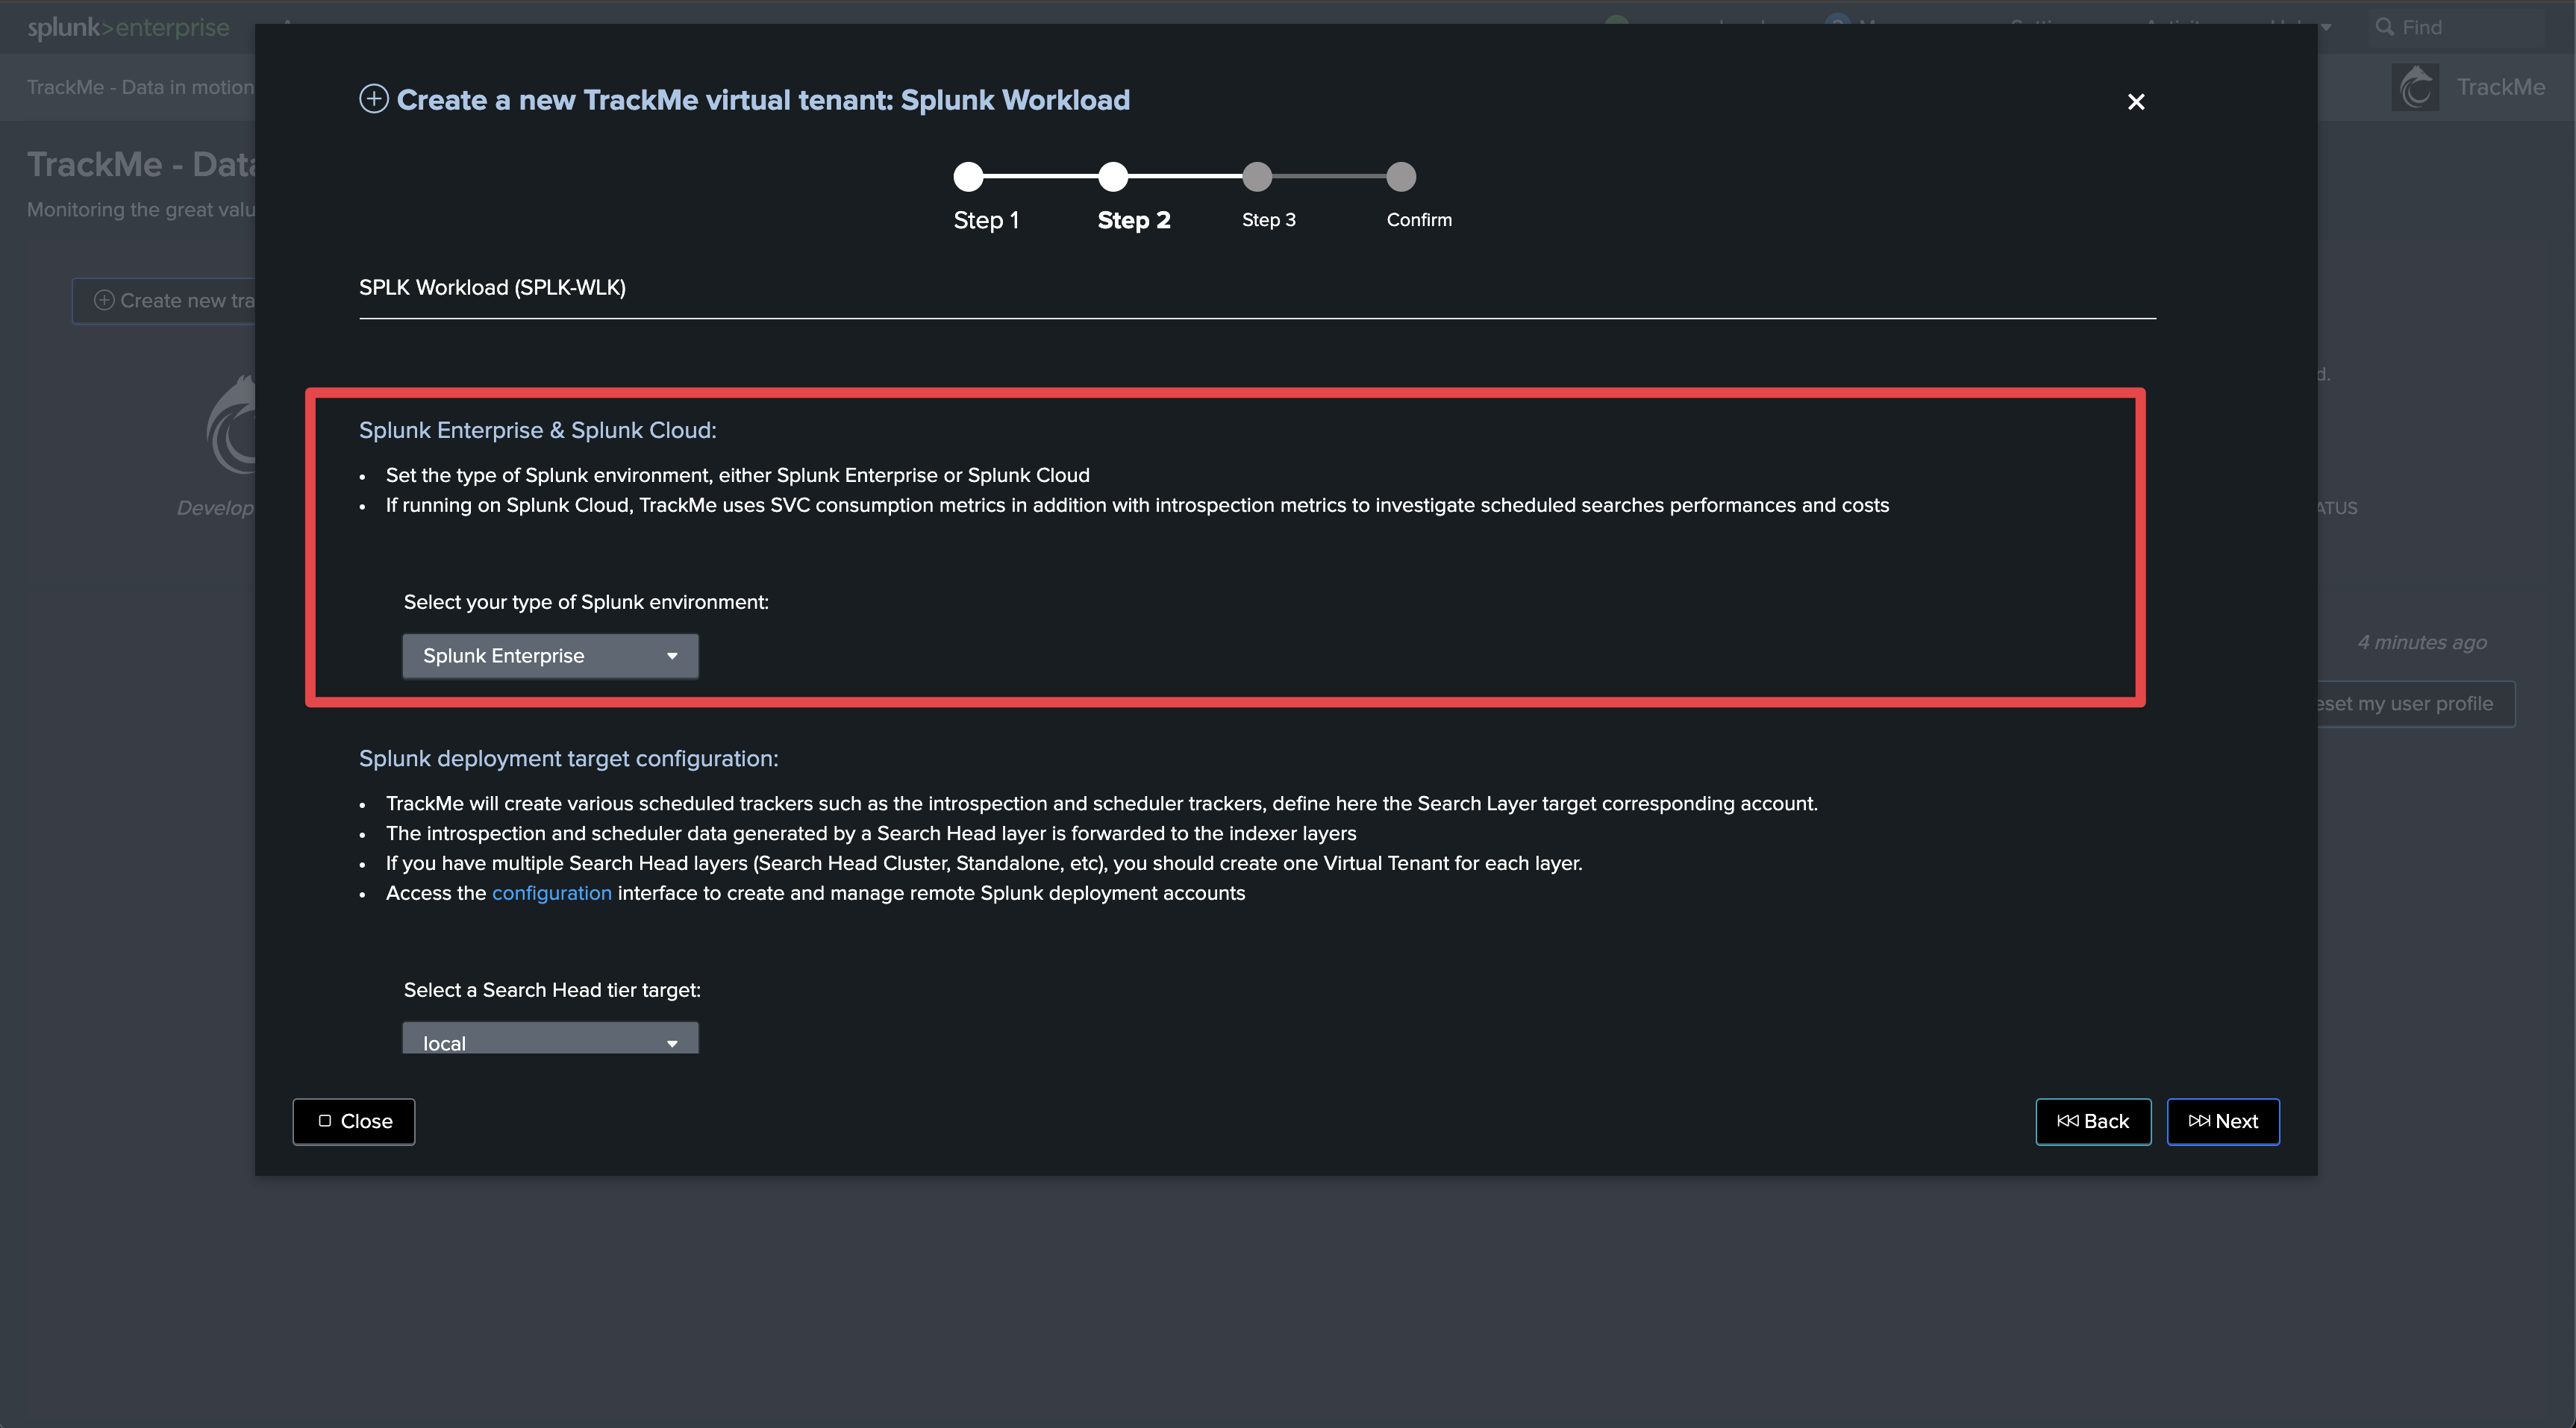
Define the type of Splunk deployment (Enterprise/Cloud)
Splunk Enterprise vs Splunk Cloud
The main difference here is that if Splunk Cloud is selected, TrackMe will create necessary trackers to monitor the SVC consumption of monitored scheduled searches.
Select Splunk Cloud if the environment being monitored is a Splunk Cloud environment.
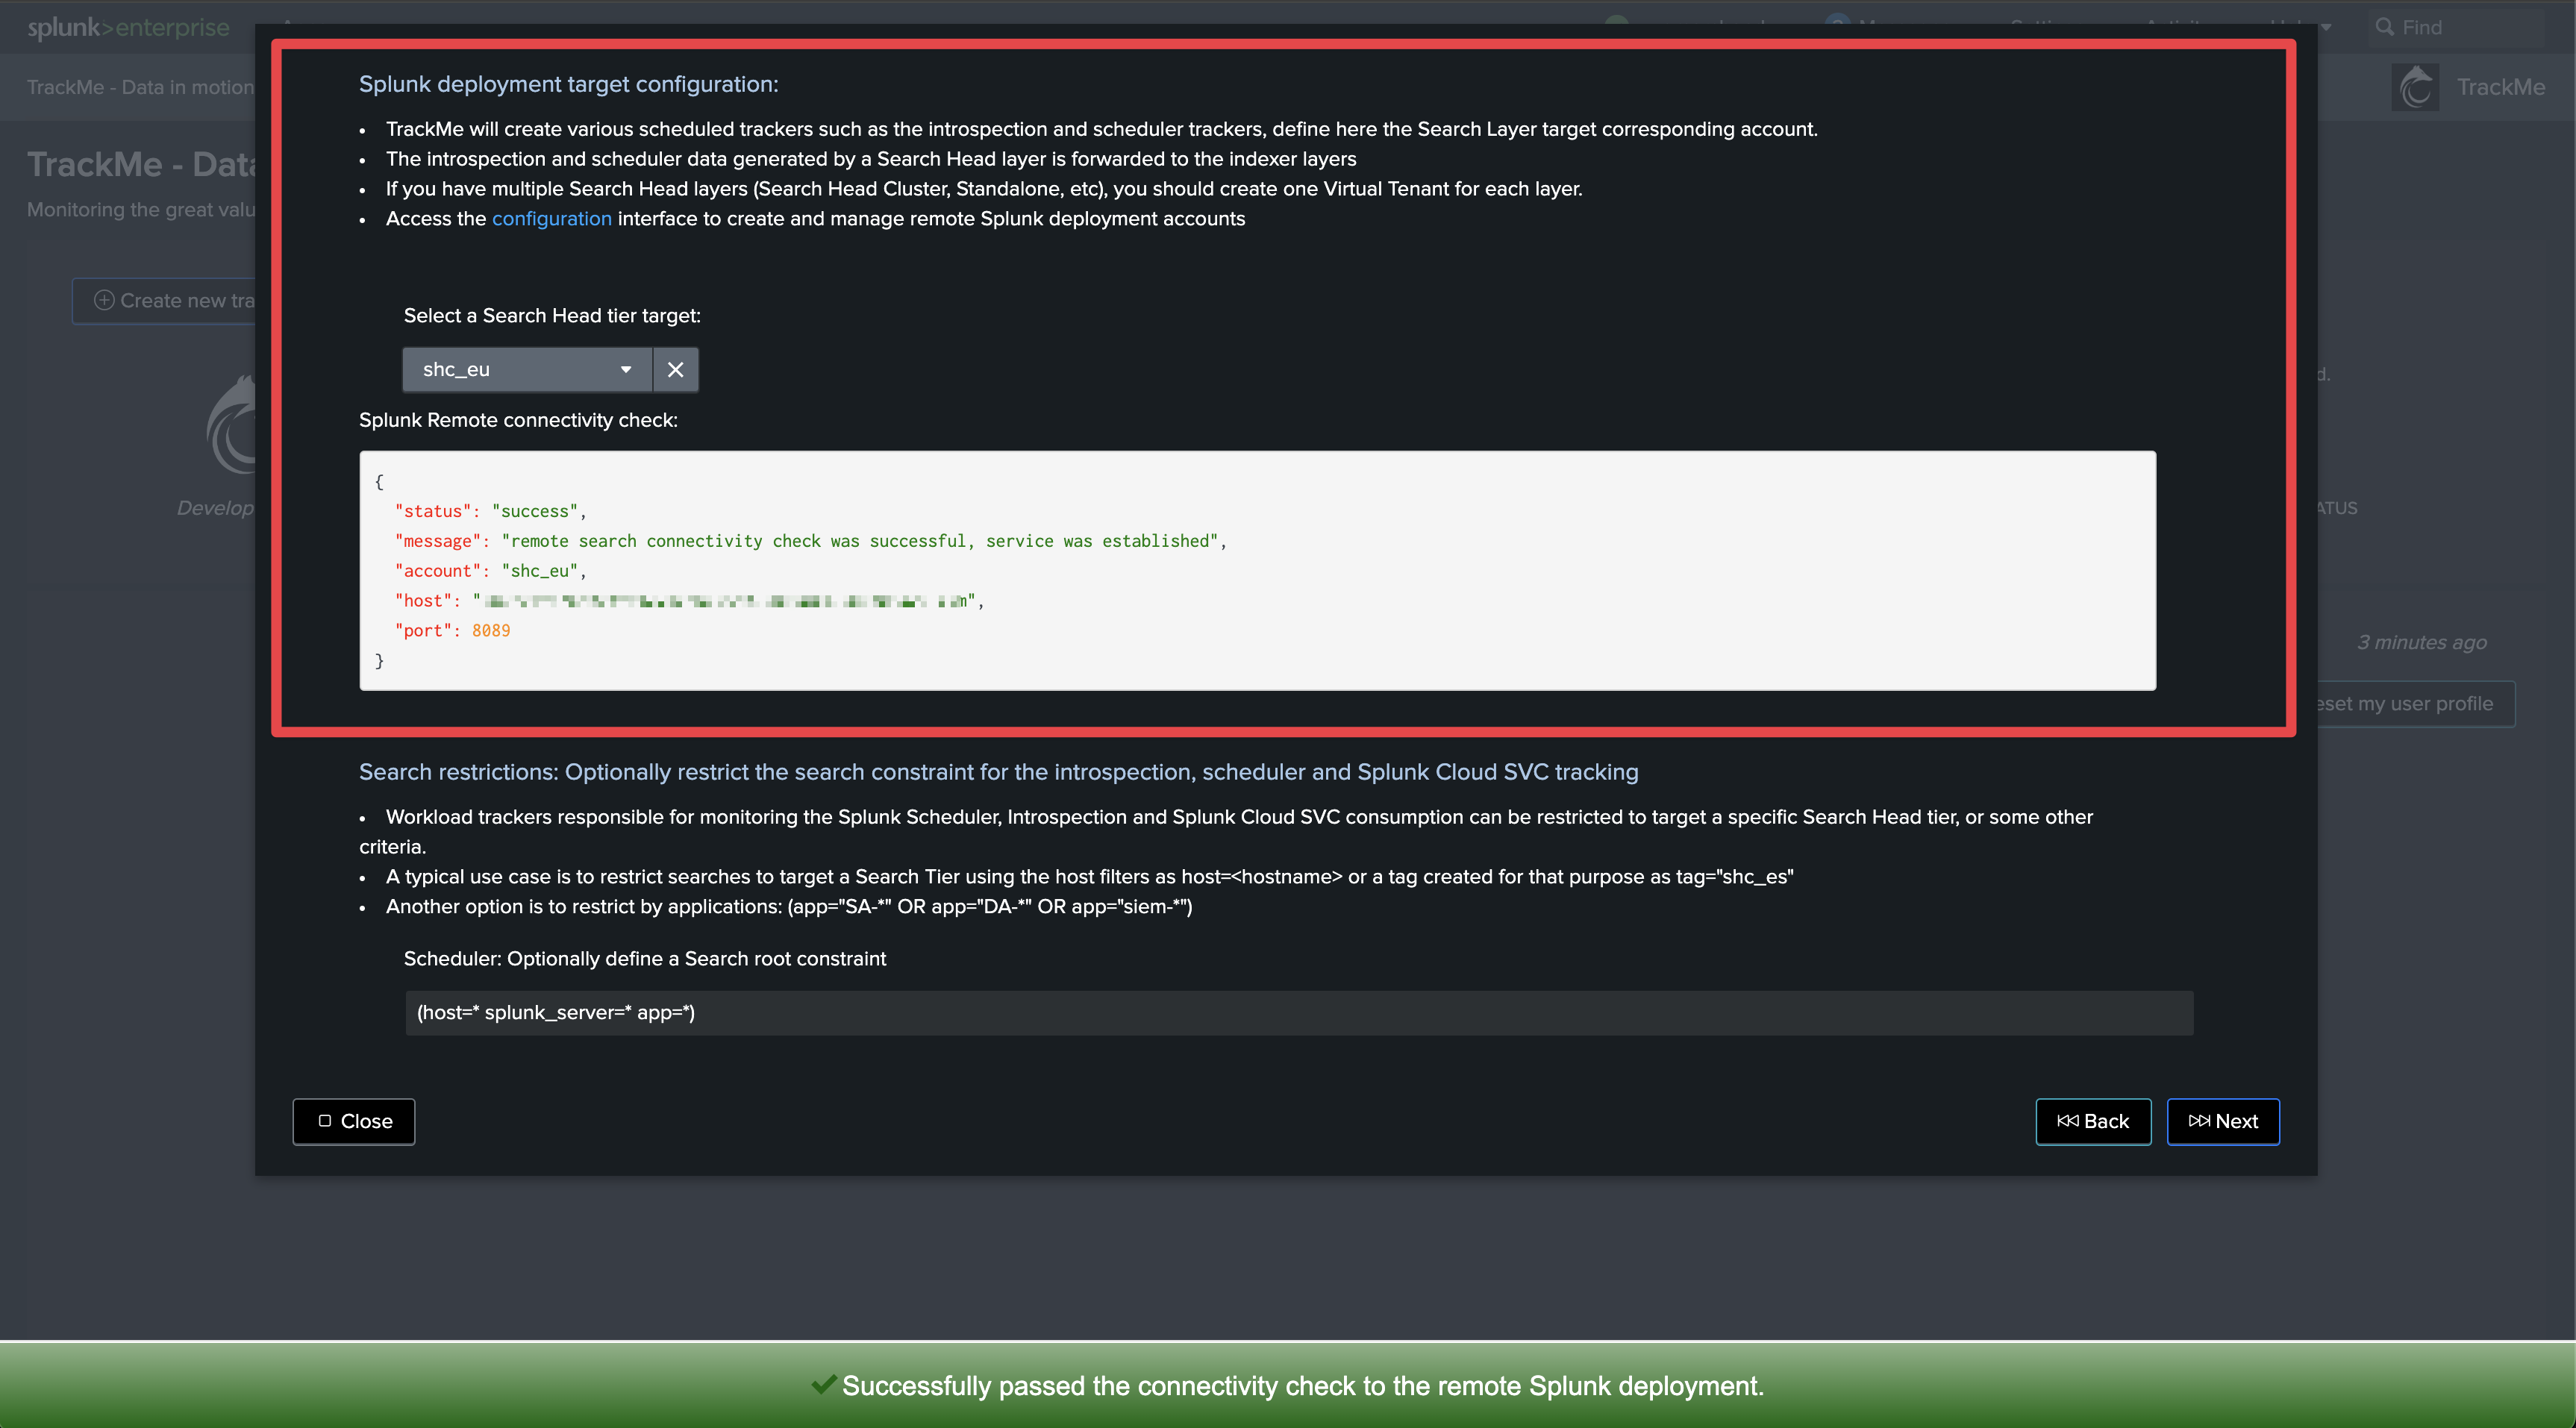
Select the Search Head tier target
Search Head target
Although some of the search logics TrackMe implements could indeed be run on the TrackMe instance itself if both can search the same indexers, there are much deeper API-related logics which come into account for the Workload components.
Therefore, it is important to select the right Splunk Remote Deployment Account targeting the desired Search Head tier.
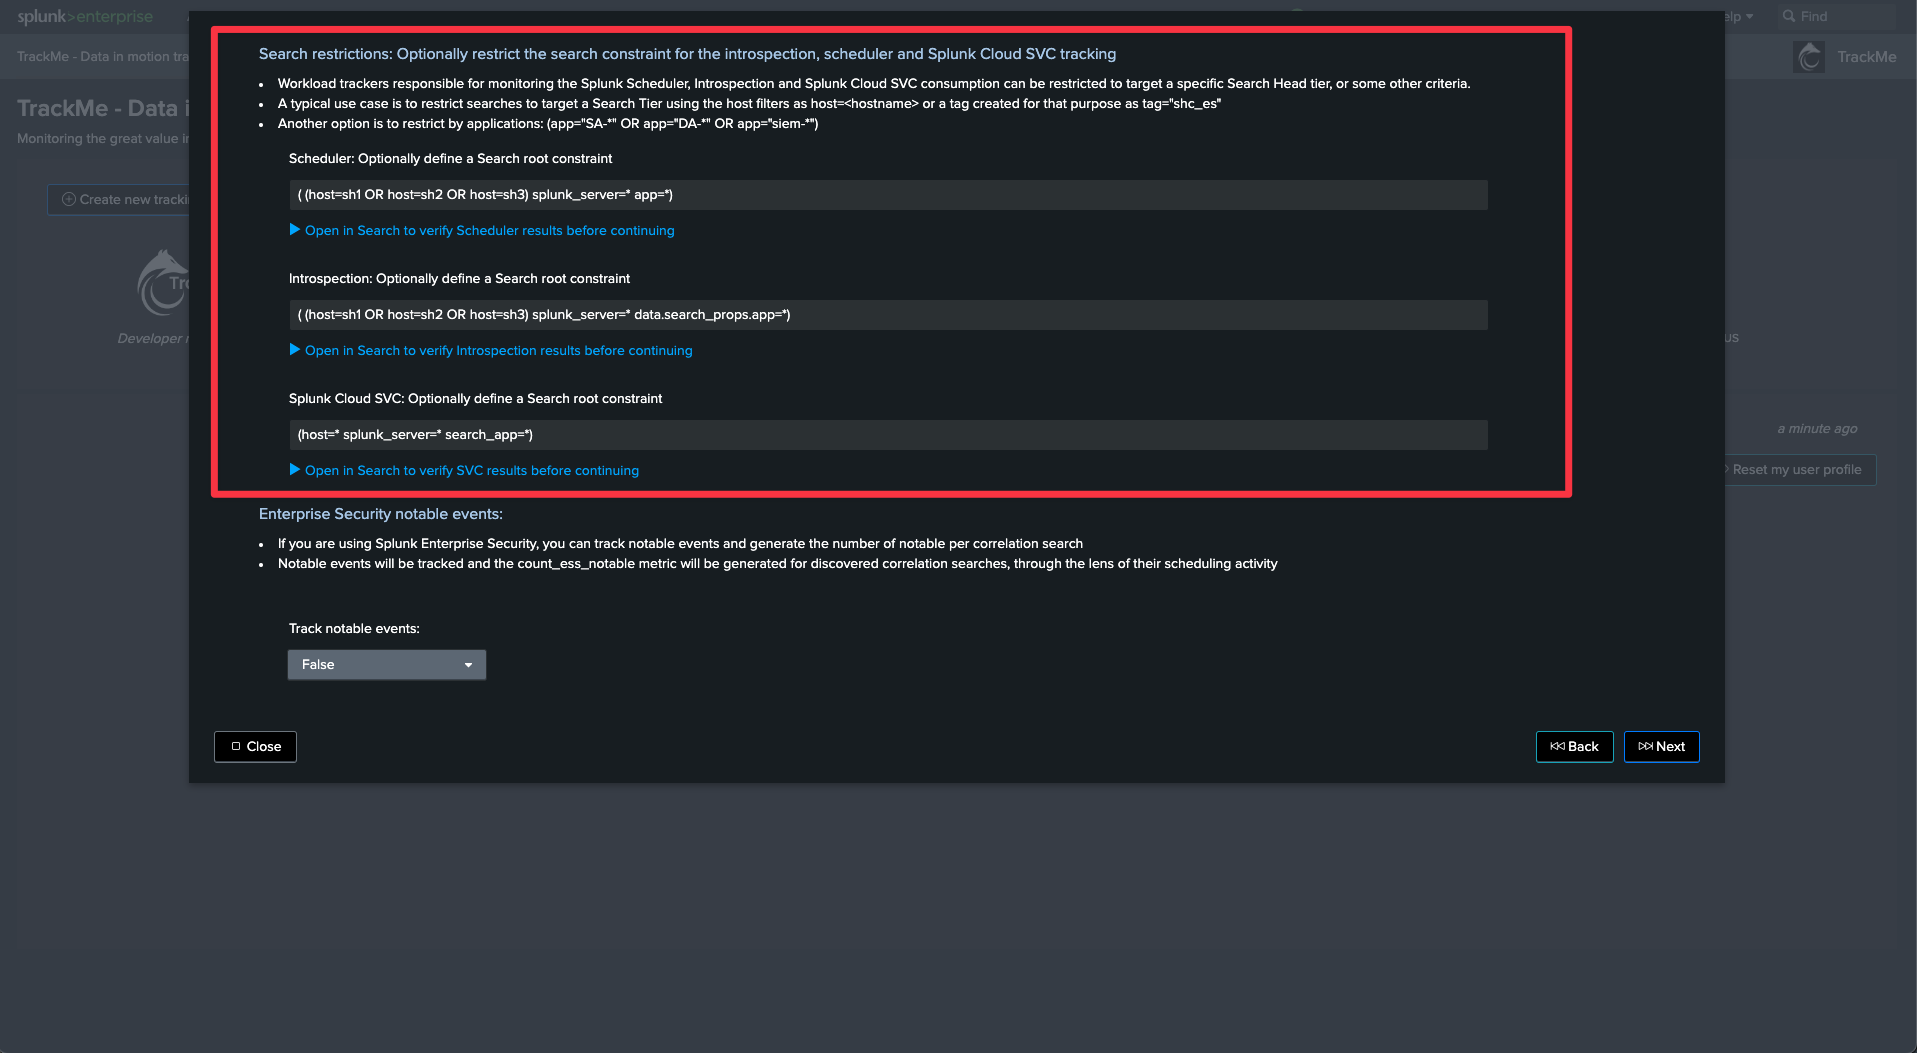
Define Search Restrictions
Search Restrictions
For each of the main categories of activity, you need to define and/or restrict the Search Heads to be considered for monitoring.
This is important to avoid monitoring searches that are out of the scope of the Search Head you target, but whose underlying activity can be accessed from the TrackMe instance.
In the example below, we restrict to a given Search Tier using the filter
(host=sh1 OR host=sh2 OR host=sh3)
Tracking Enterprise Security Notables
Tracking Notable events
The Workload component can track notable events generated by correlation search, and turns this into a TrackMe metric.
You can then use TrackMe to review the number of notable events created by your correlation searches.
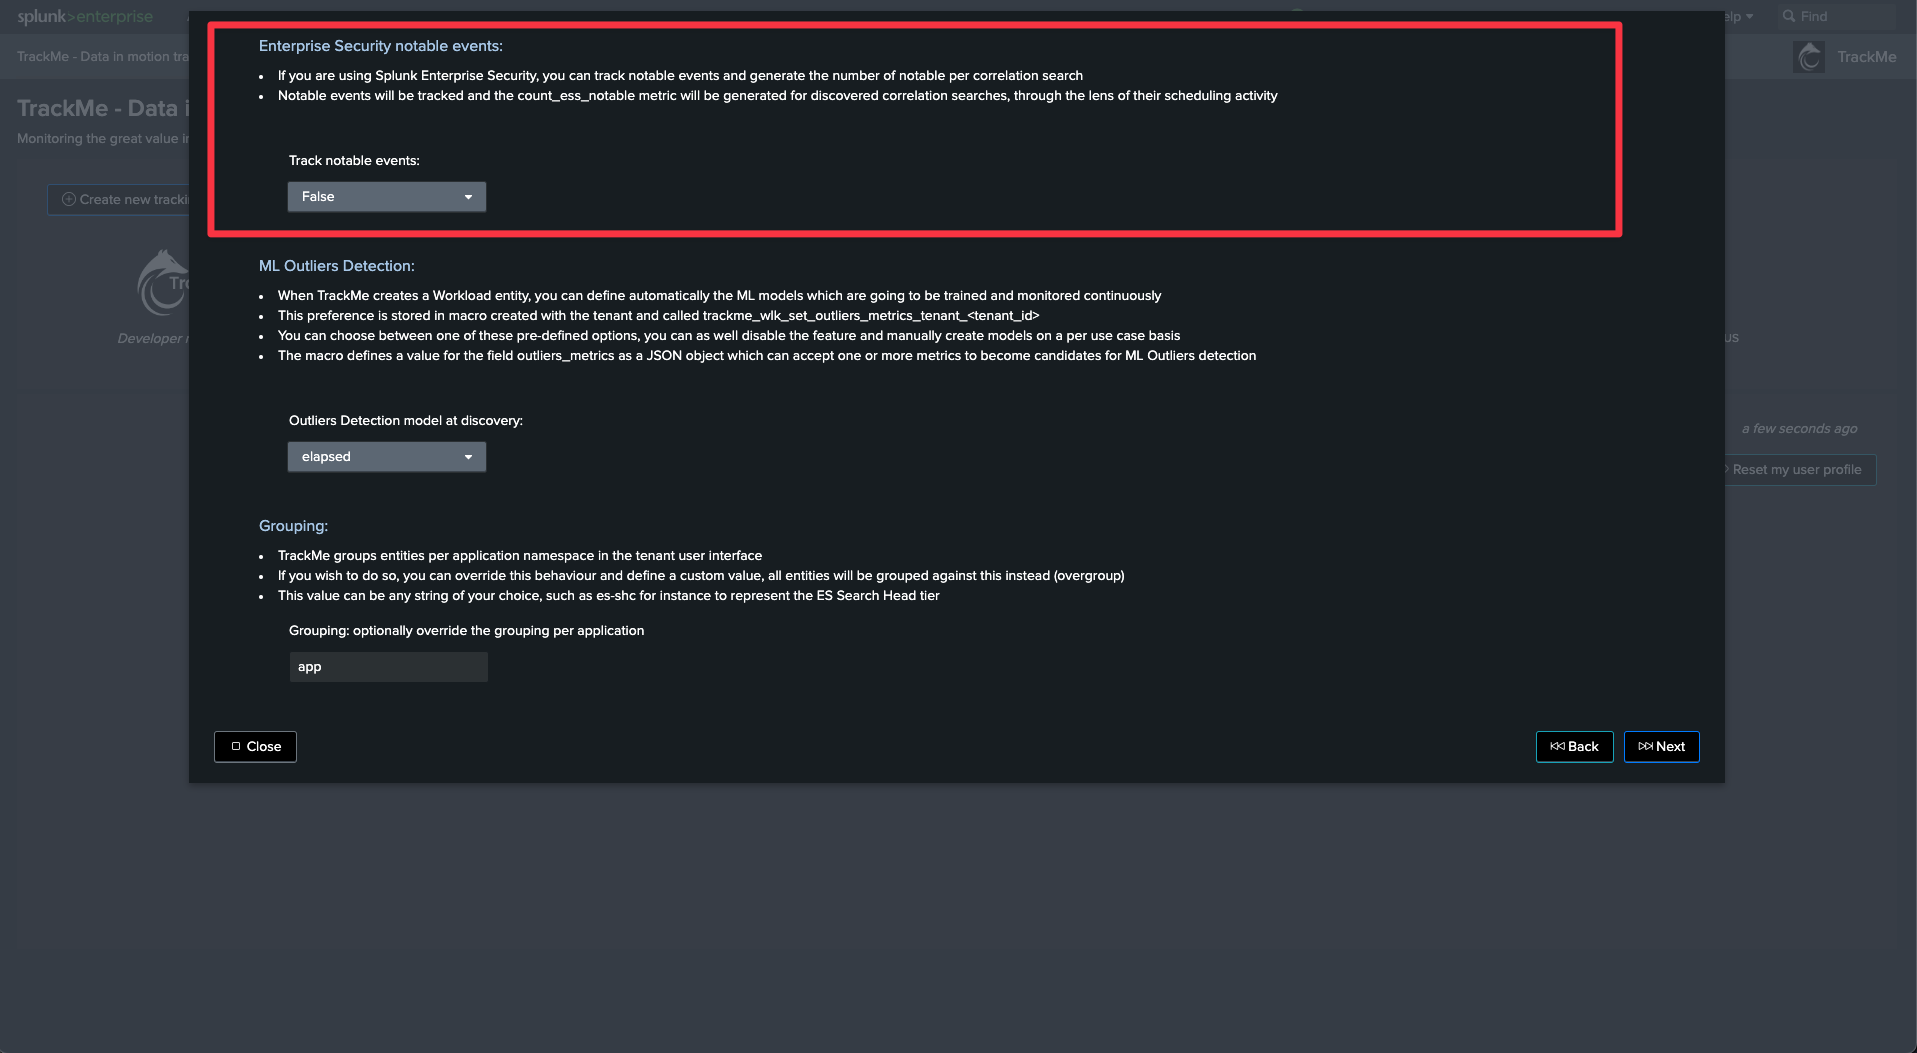
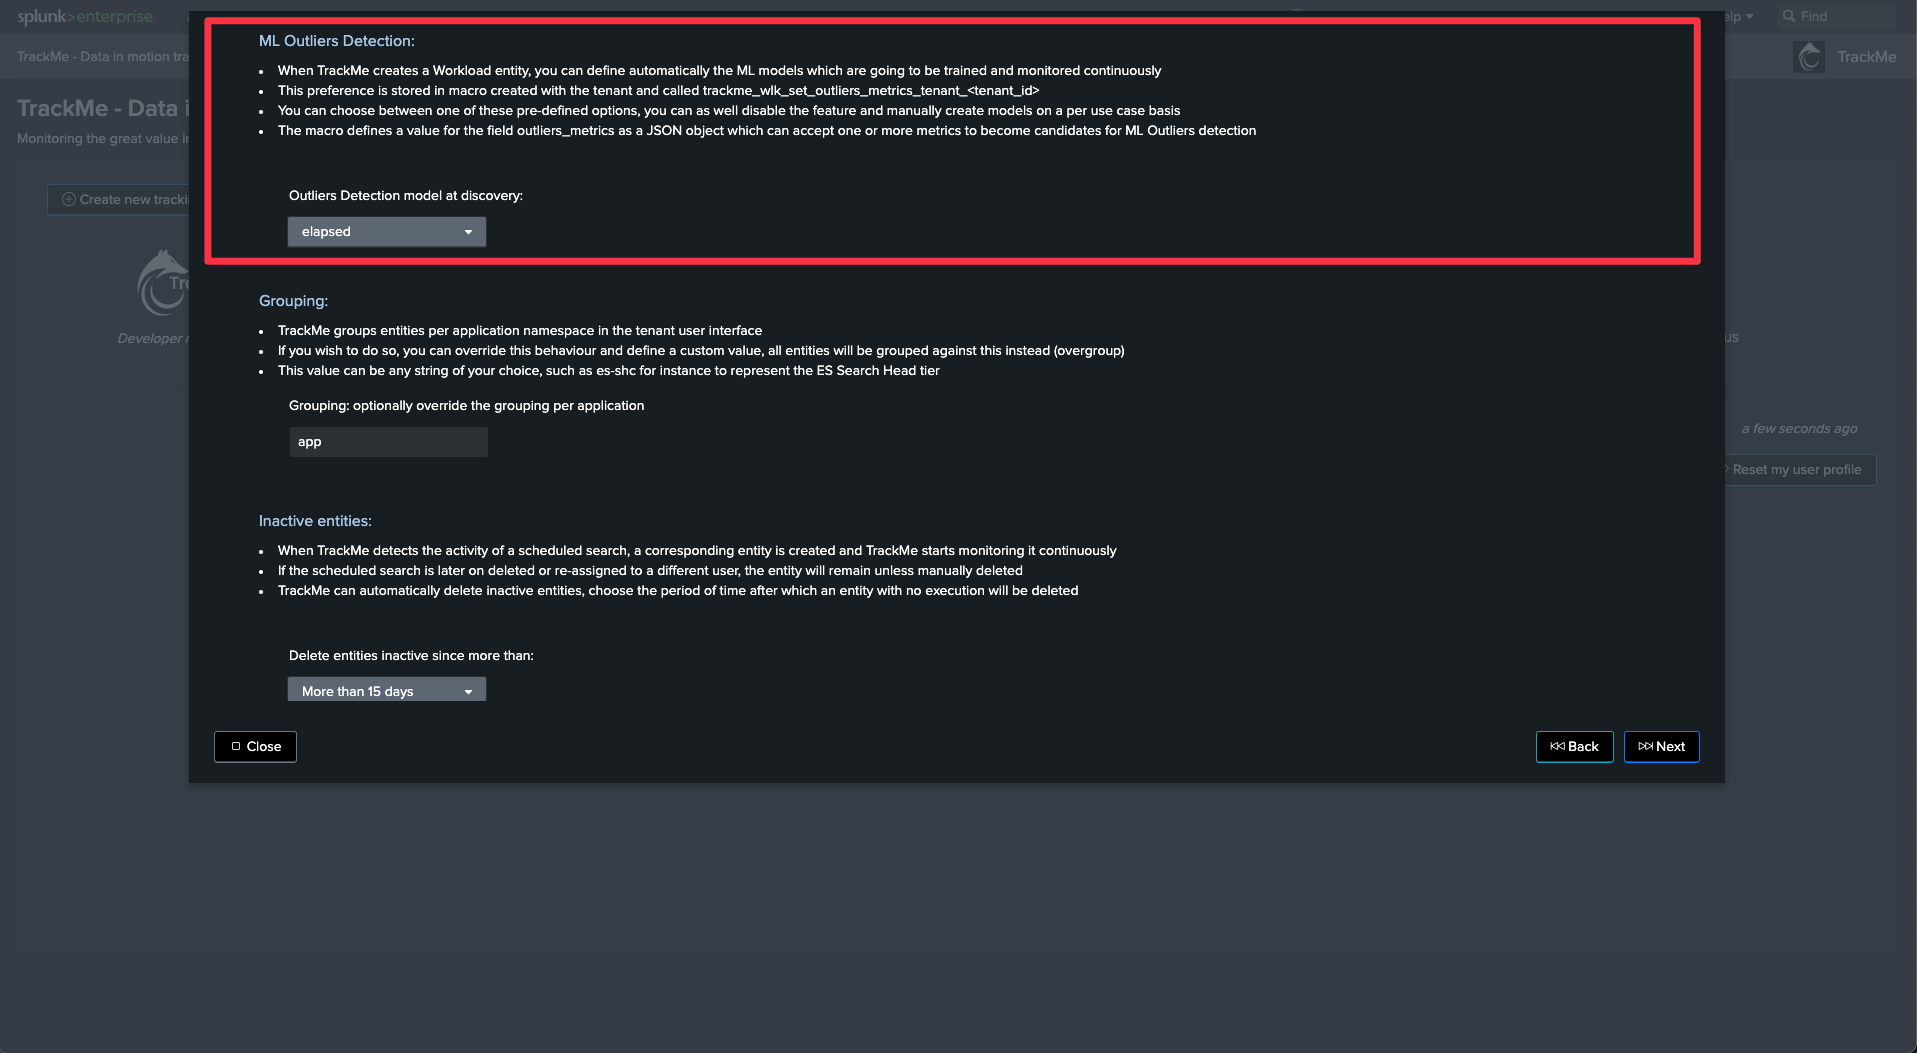
ML Outliers Detection
Outliers detection and Workload
TrackMe can use ML Outliers detection to automatically detect abnormal trends for a given metric.
In the context of the Workload, TrackMe by default generates and trains models against the run time in seconds of the searches, so it can detect an abnormal trend in the time taken by searches to be executed.
You can customize and/or disable this behavior.
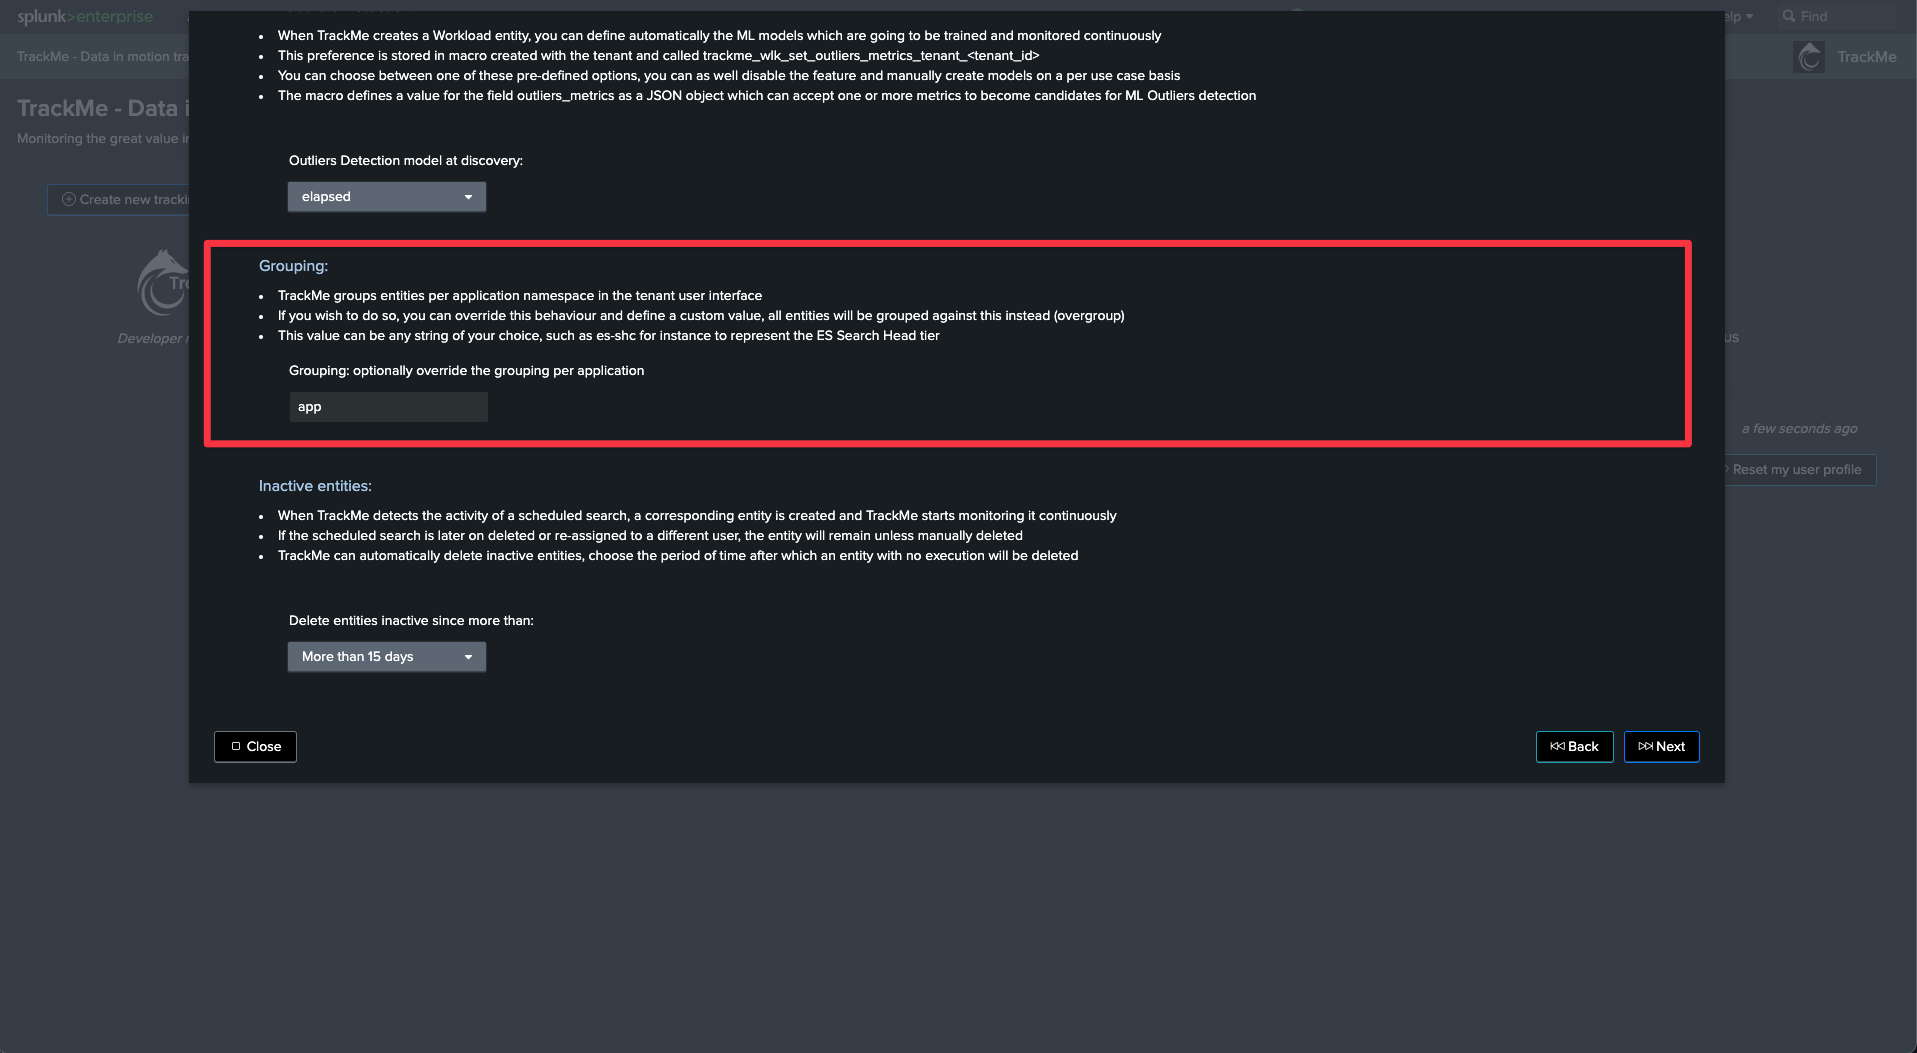
Grouping
Workload grouping
In the Workload component, the default behavior is to group TrackMe entities per Splunk application namespace.
This means you should not monitor multiple Search Head tiers within the same tenant (entities would be mixed all together).
If you wish to target multiple Search Head tiers in the same tenant, you need to use the grouping to group against a custom pattern.
You can also simply use this setting to force TrackMe not to group per application namespace.
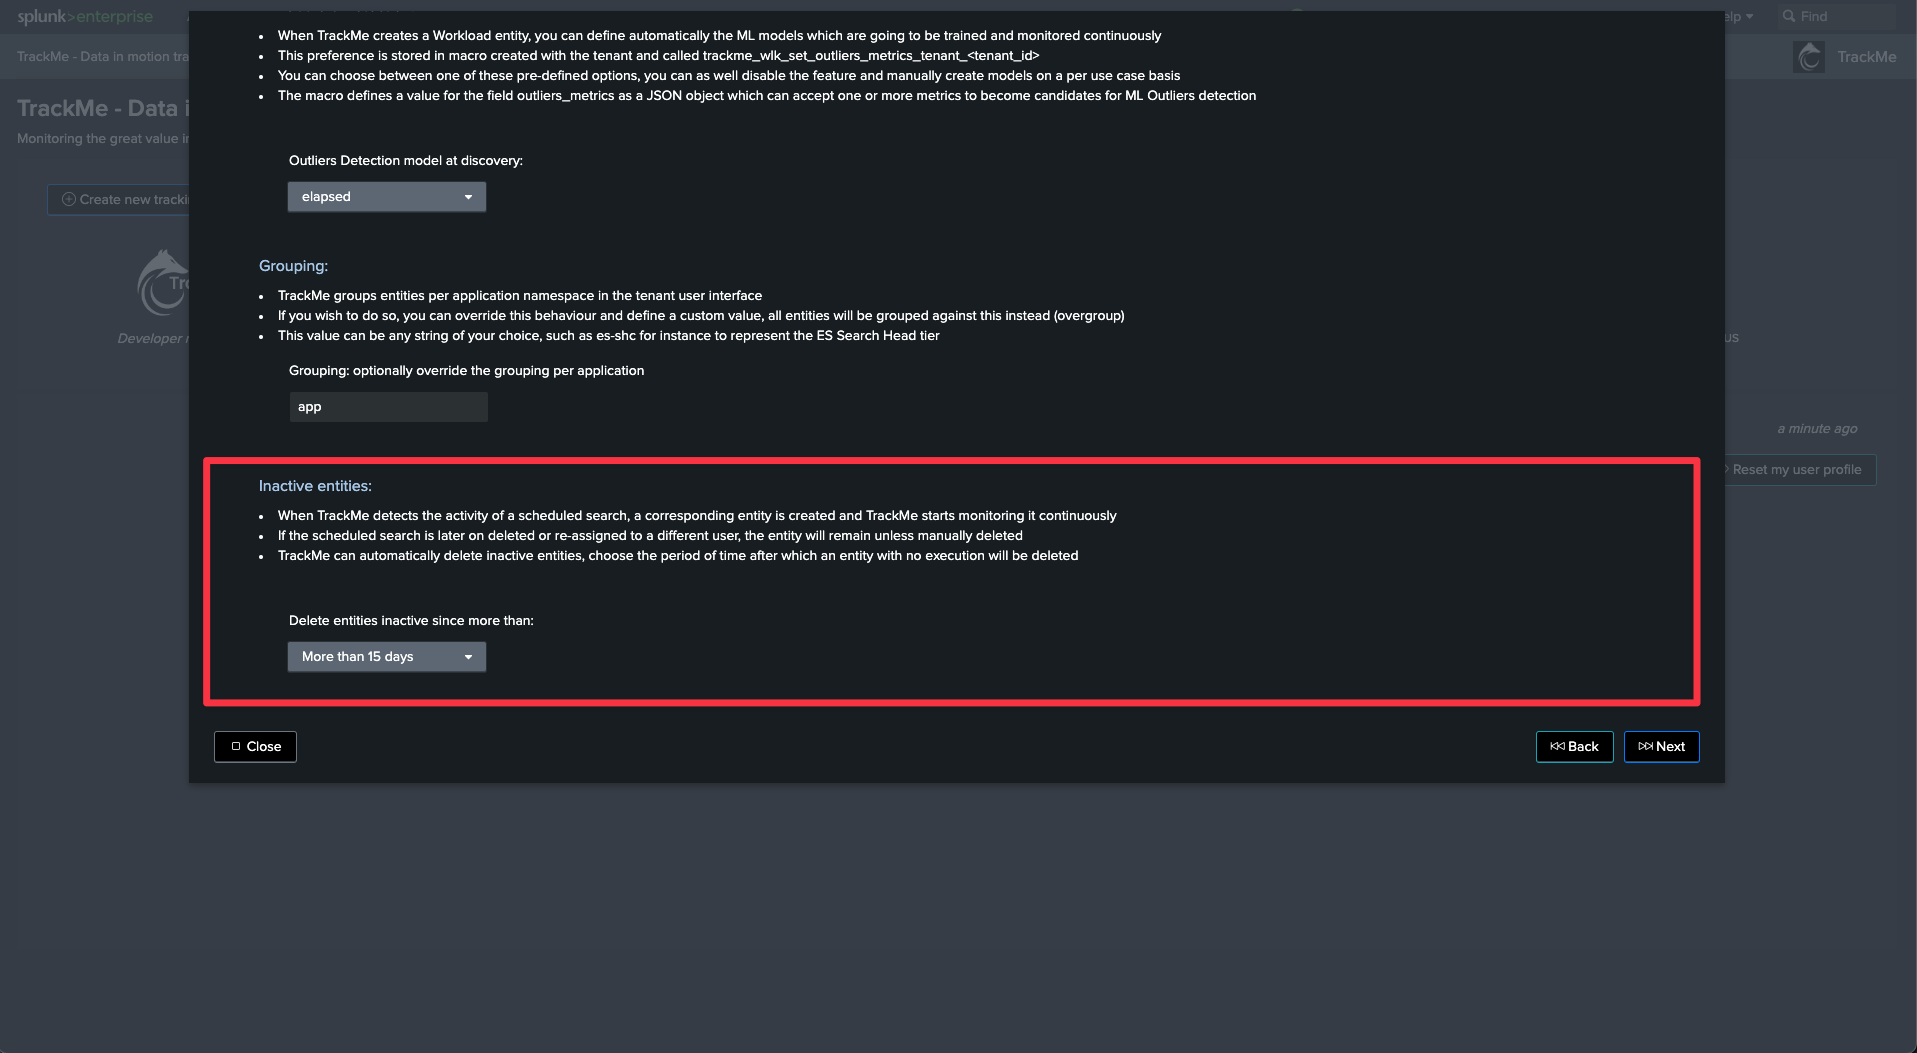
Inactive entities
Managing entities without any activity
When a search schedule is disabled, it will become inactive after some time.
This setting instructs what TrackMe should do with these entities. The default behavior is to remove entities which have not been active for more than 15 days.
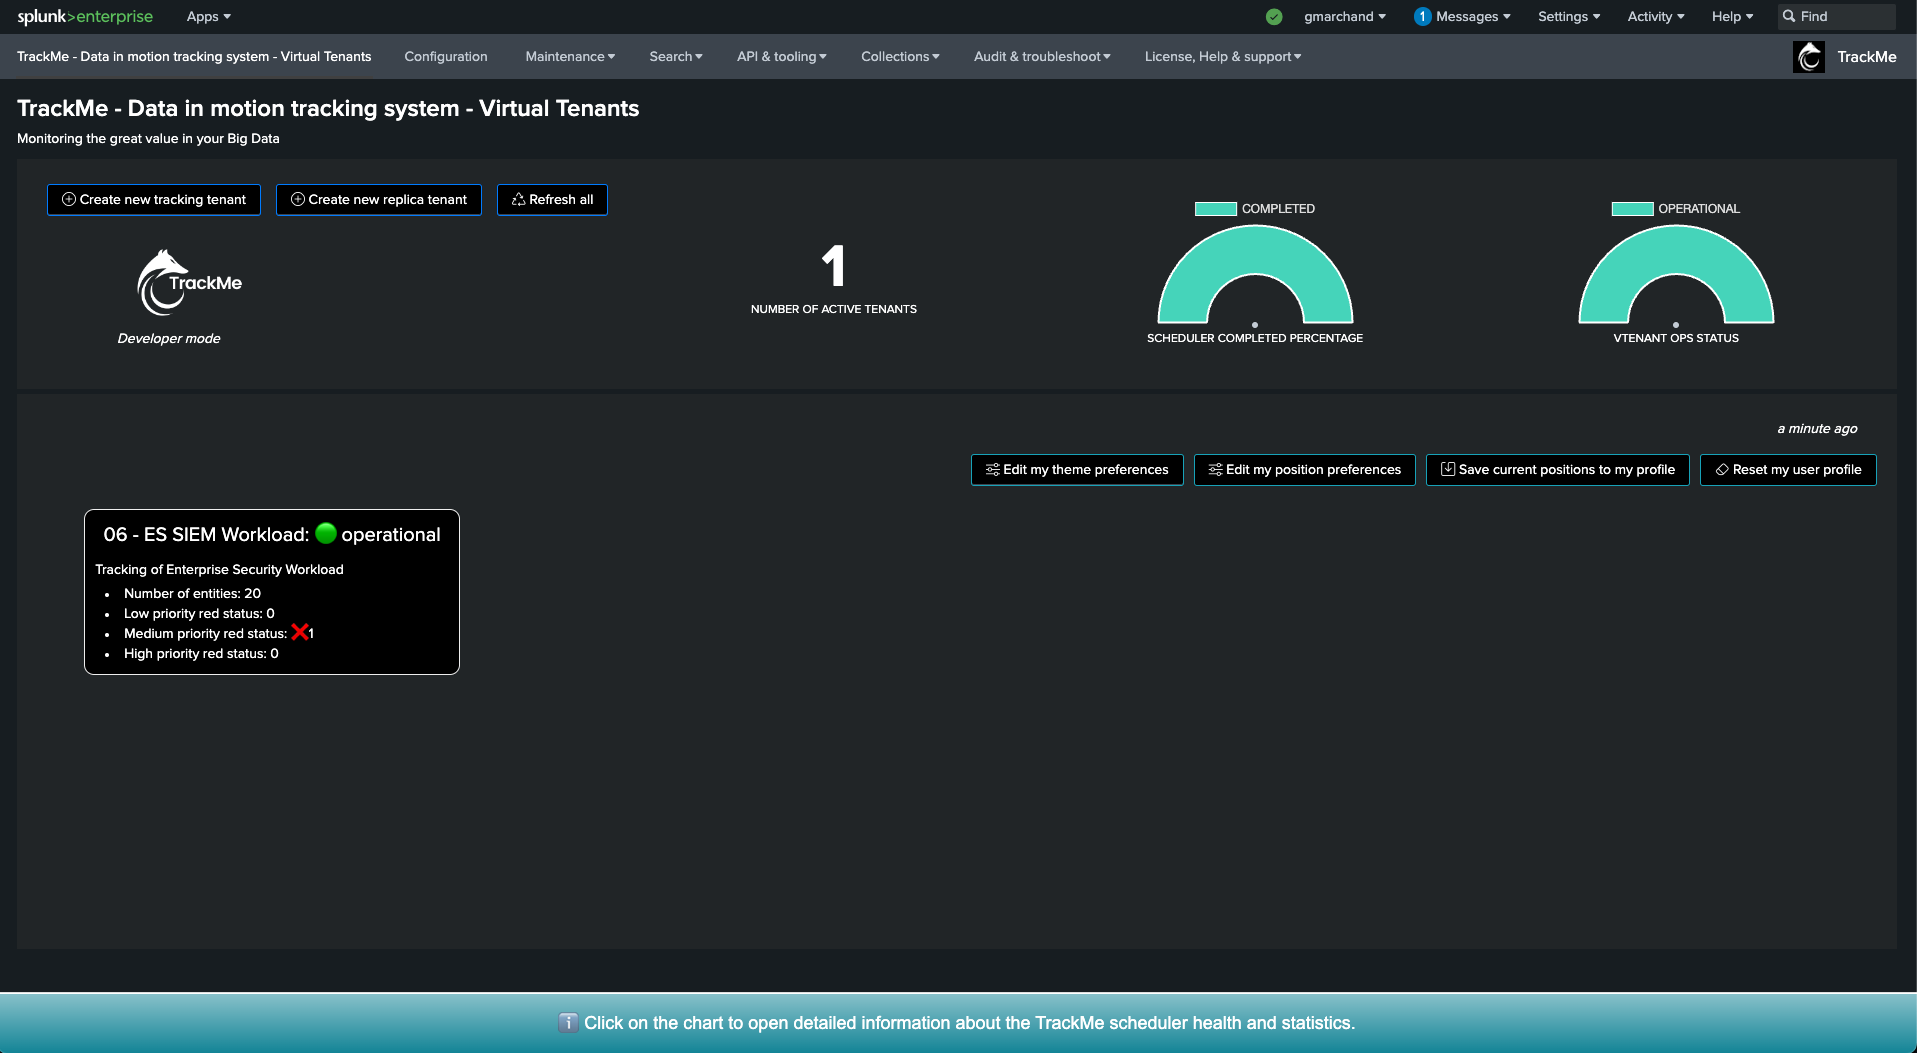
Validate the tenant creation and start
After the tenant is created, wait up to 5 minutes before seeing the first entities in TrackMe
Immediately after the tenant is created, TrackMe starts to orchestrate the Workload detection logic.
This can take up to 5 minutes before you can start seeing entities created in the Workload component.
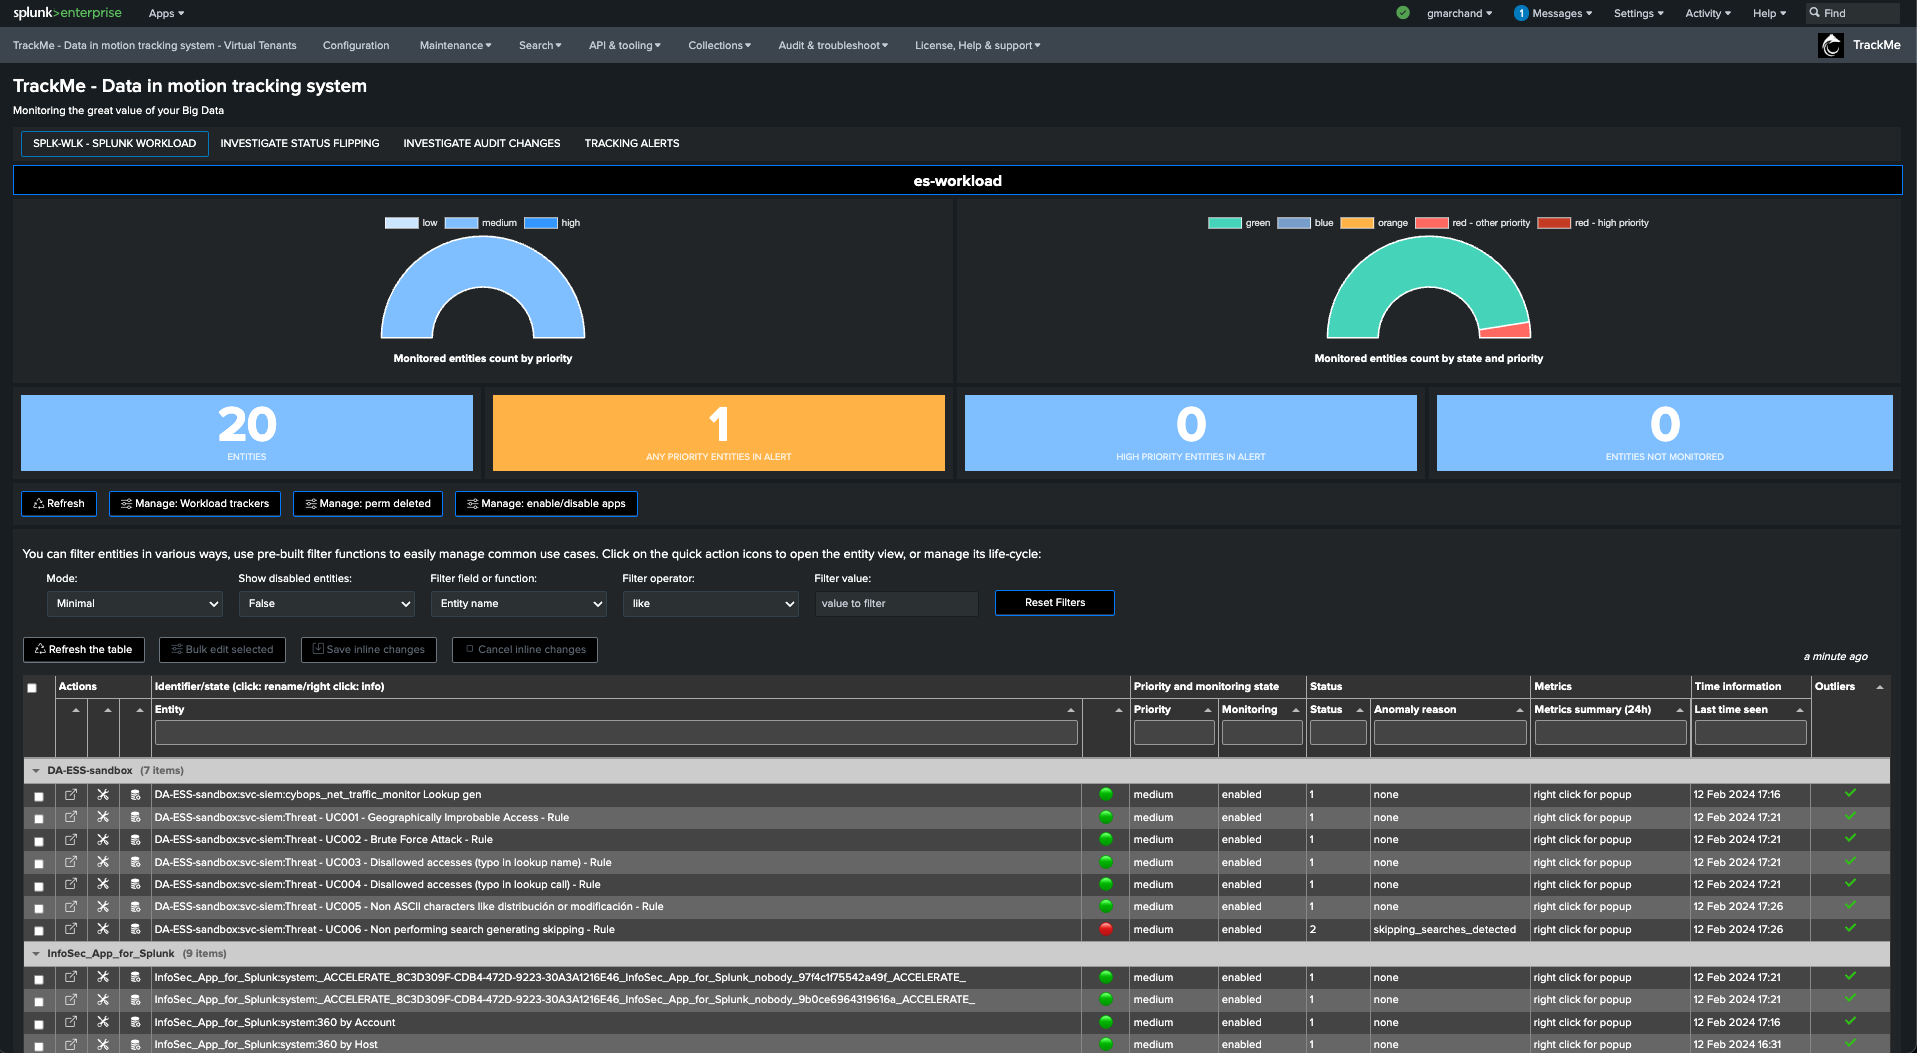
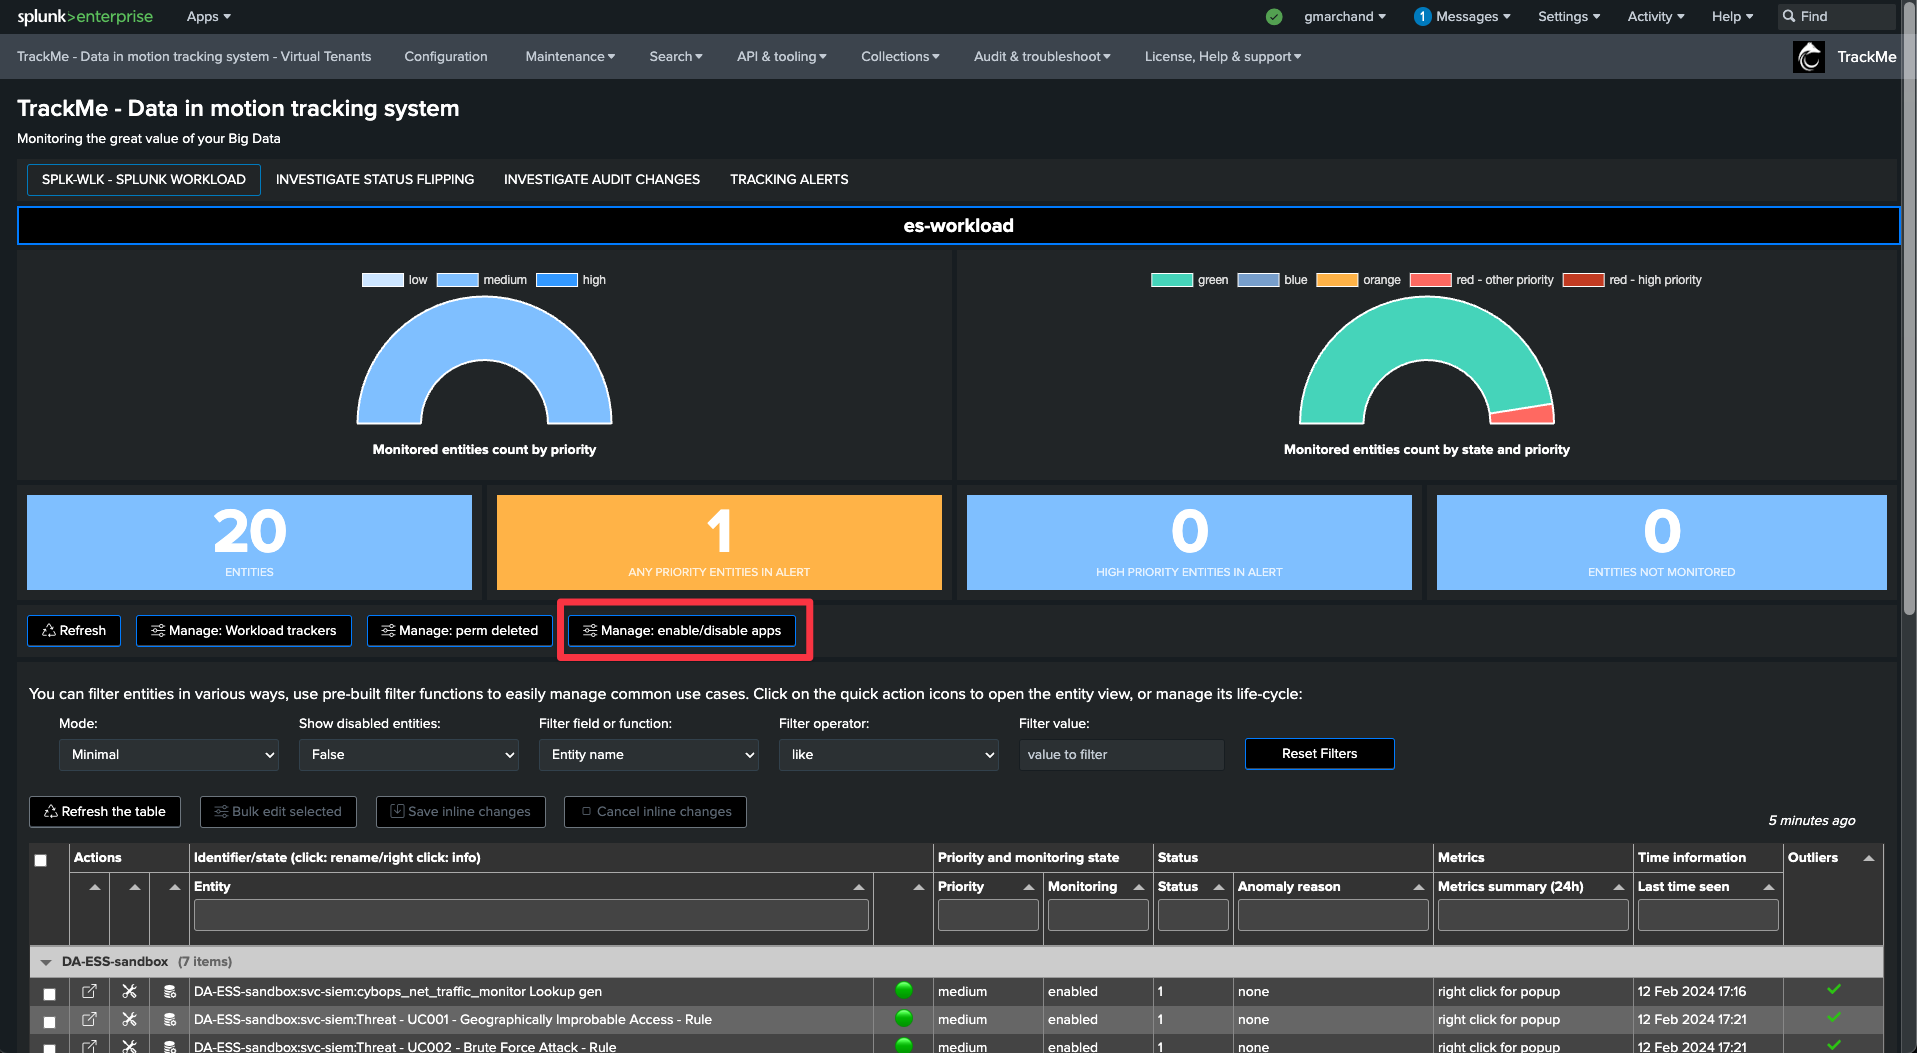
Step 3: Start using the Workload component, detect and investigate scheduling issues
Ignoring specific Splunk application namespaces
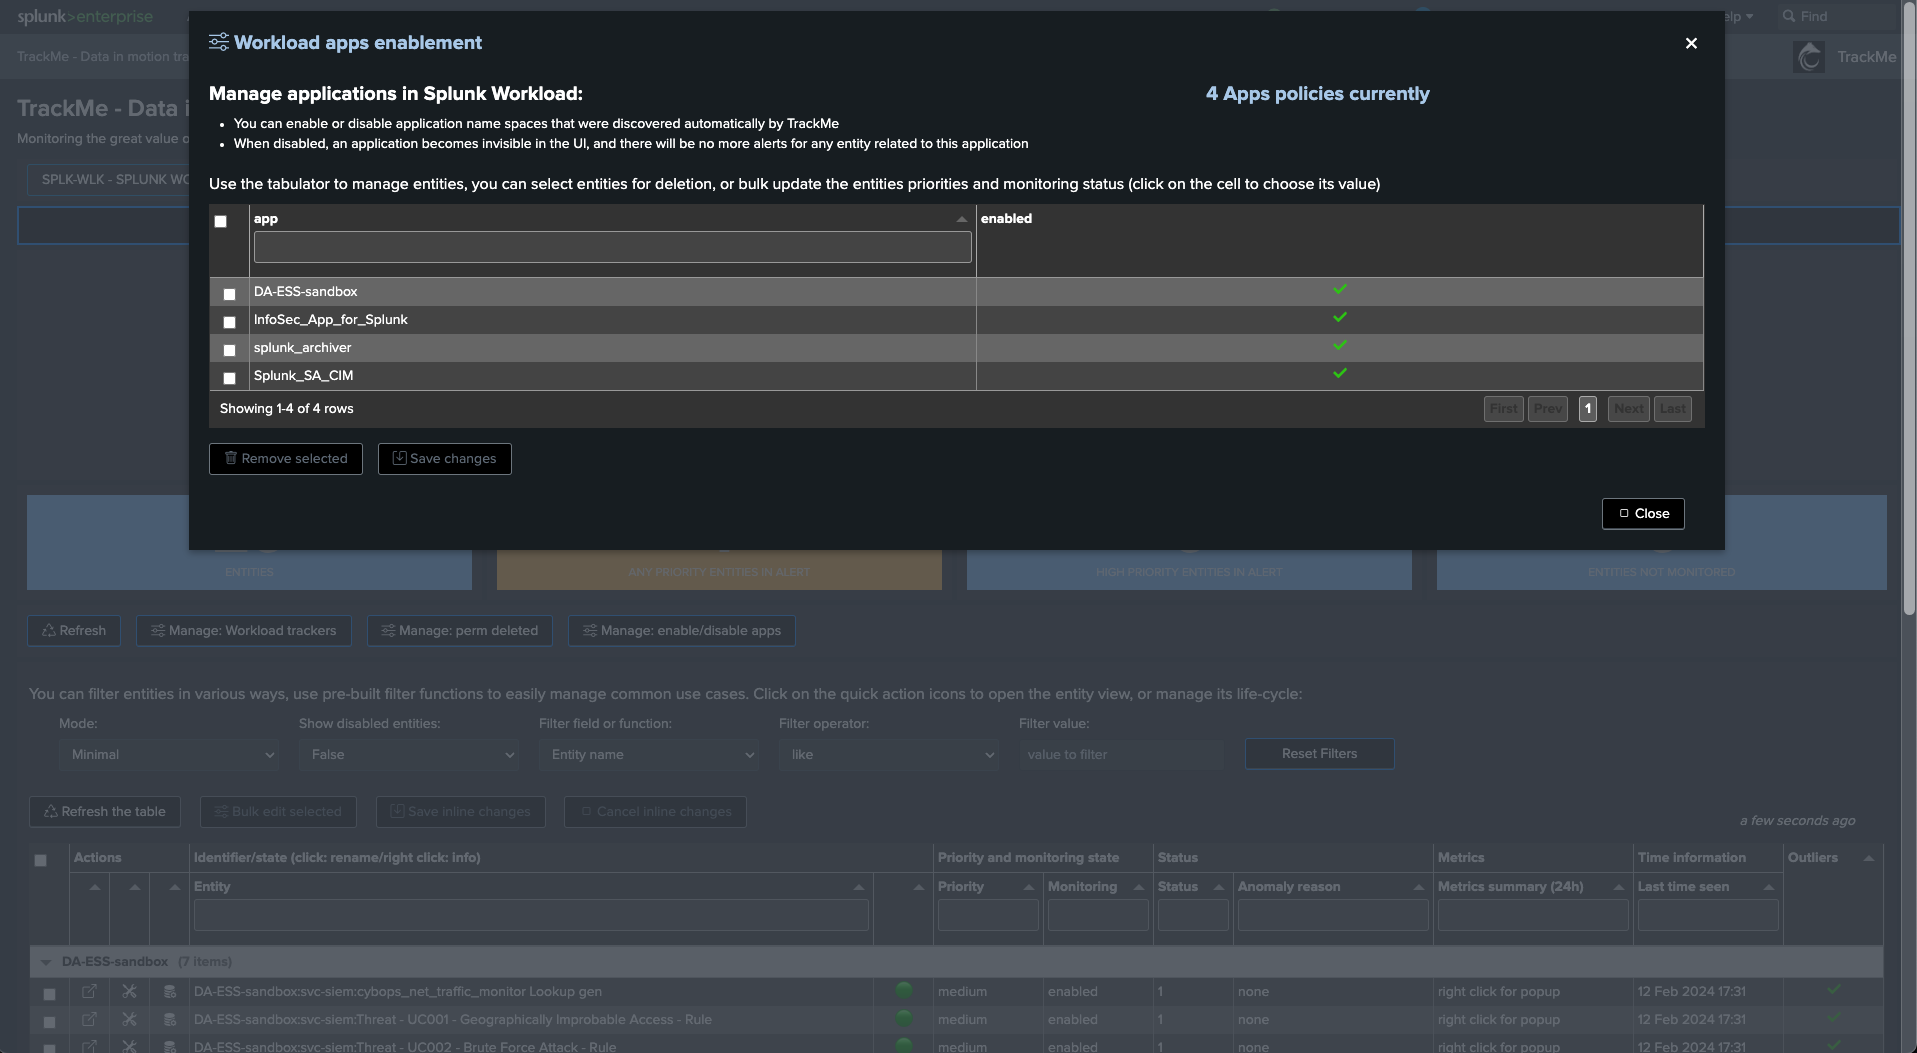
You can ignore specific Splunk application namespaces from the Workload component.
This can be useful to remove Splunk out-of-the-box applications which are not relevant for your monitoring.
Click on “Manage: enable/disable apps” to access the configuration screen
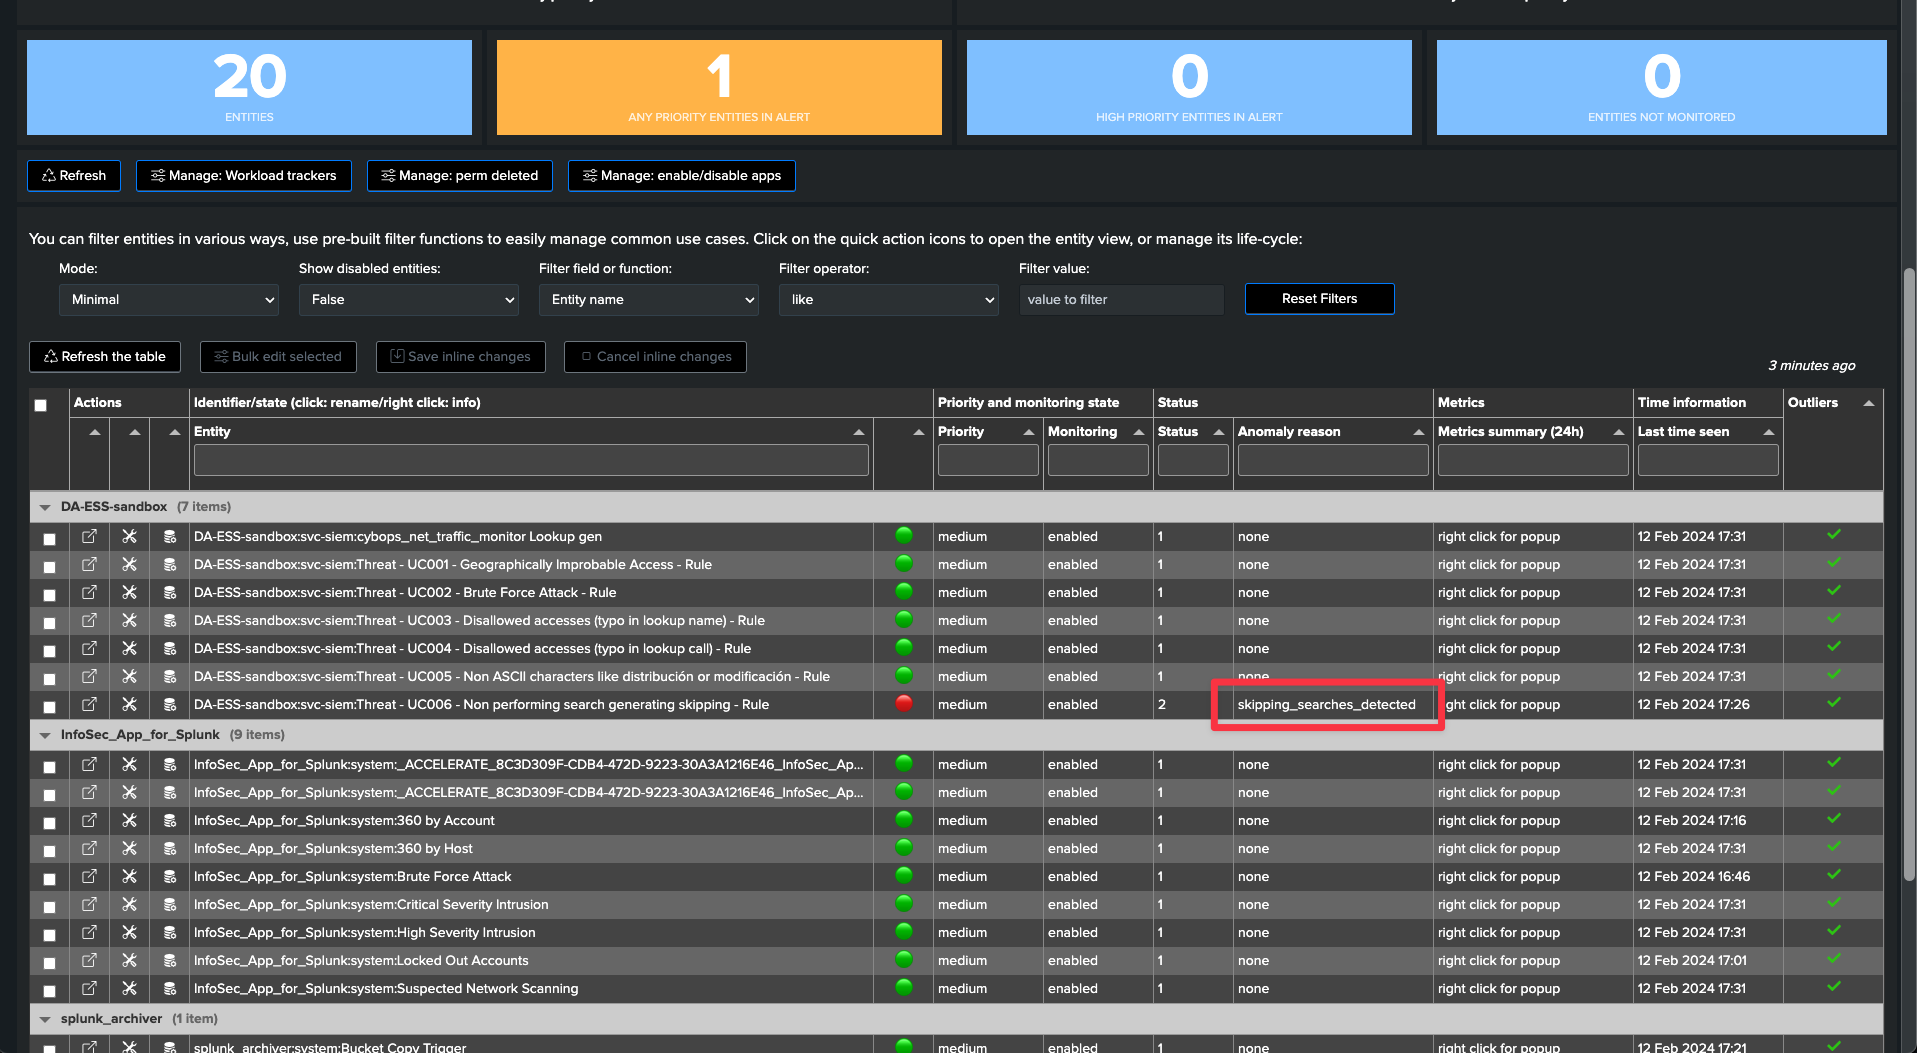
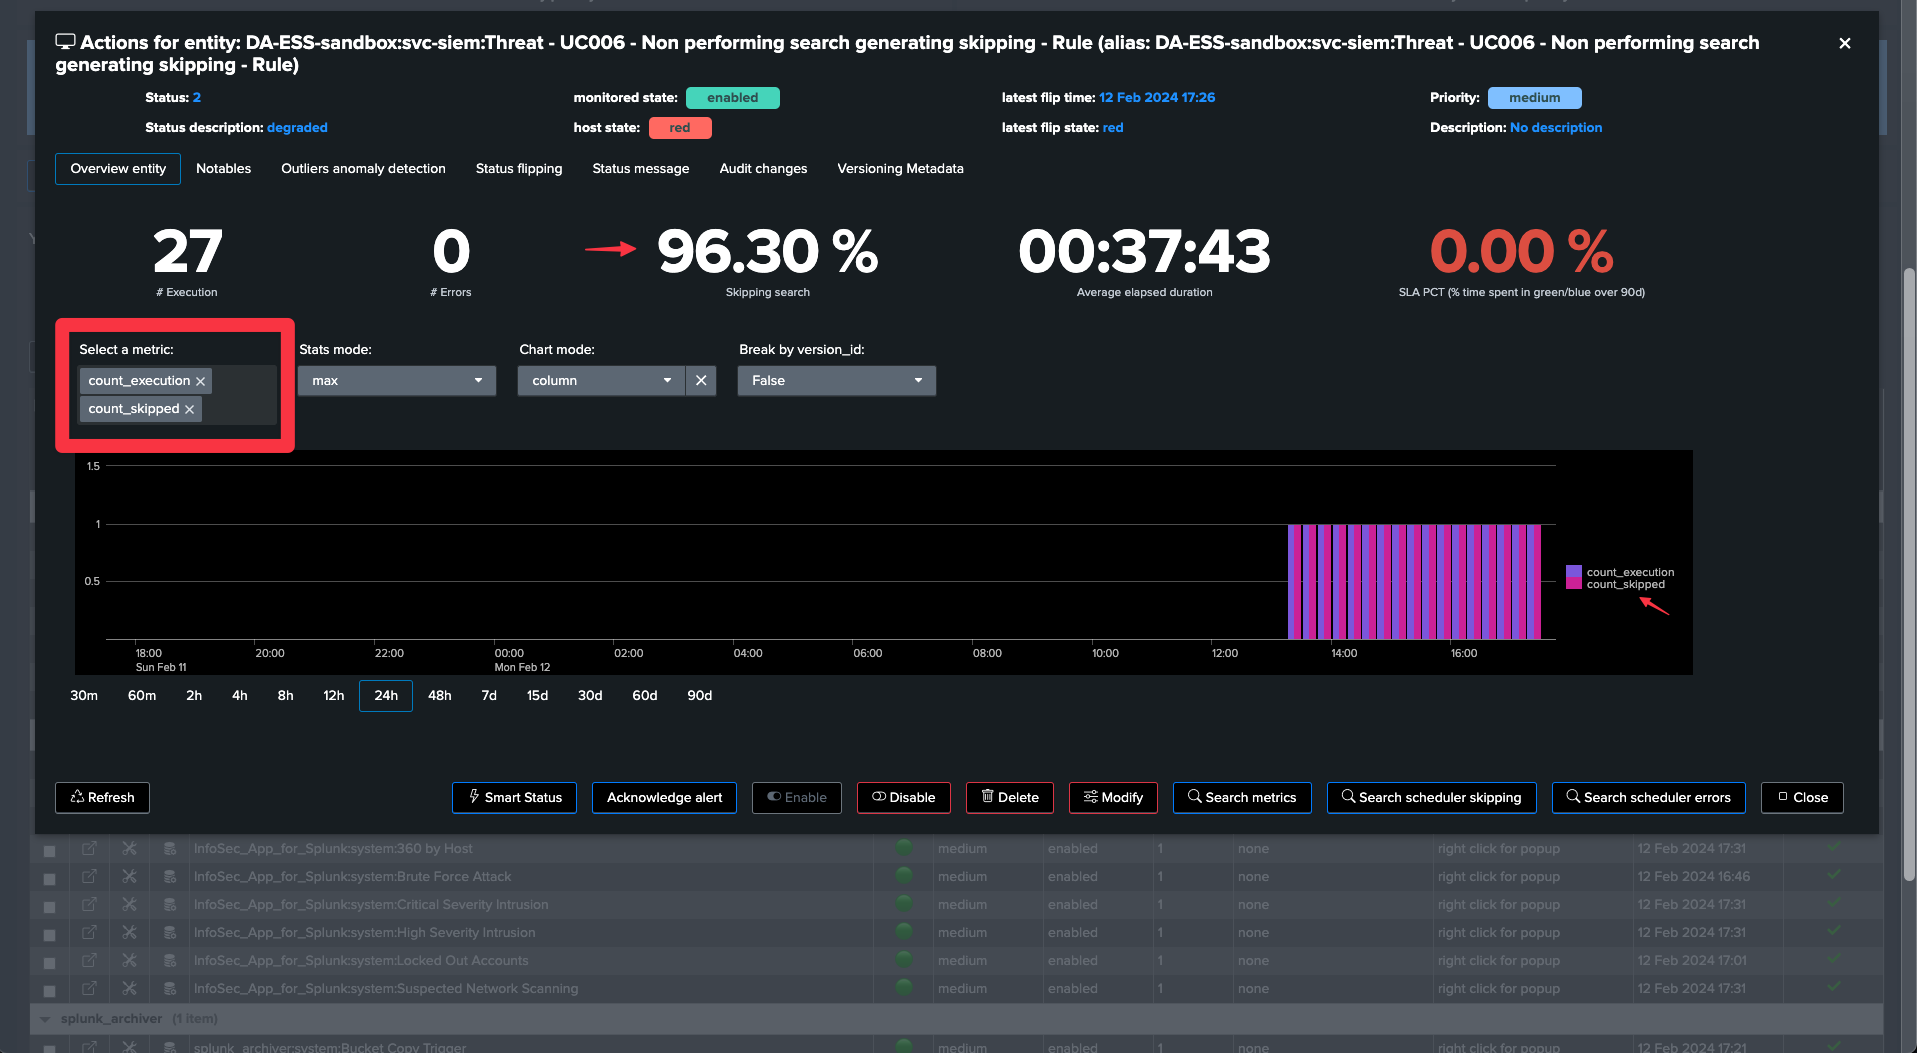
Use case: detecting skipping searches
What are skipping searches and how these affect Splunk workload
Skipping searches happen when a given search takes too long to be executed and is then skipped by the scheduler.
The current cron schedule defines how often the search is executed and indirectly defines how long in seconds the search can run before a new search should normally be executed.
If Splunk encounters that a search is already running at this stage, its execution will be skipped.
Depending on the percentage of skipping searches, TrackMe sets the entities status to orange or red:
TrackMe’s versioning, cron schedule and cron sequence
TrackMe performs versioning of all monitored searches and detects when a search is updated.
It also extracts the cron schedule and uses the
croniterPython library to calculate the maximum run time sequence in seconds of the search.You can use this information to easily understand, without quitting TrackMe, the reasons for skipping searches.
In this example, we can see that the cron schedule is set to run every 5 minutes, and that the maximum run time sequence is 300 seconds:
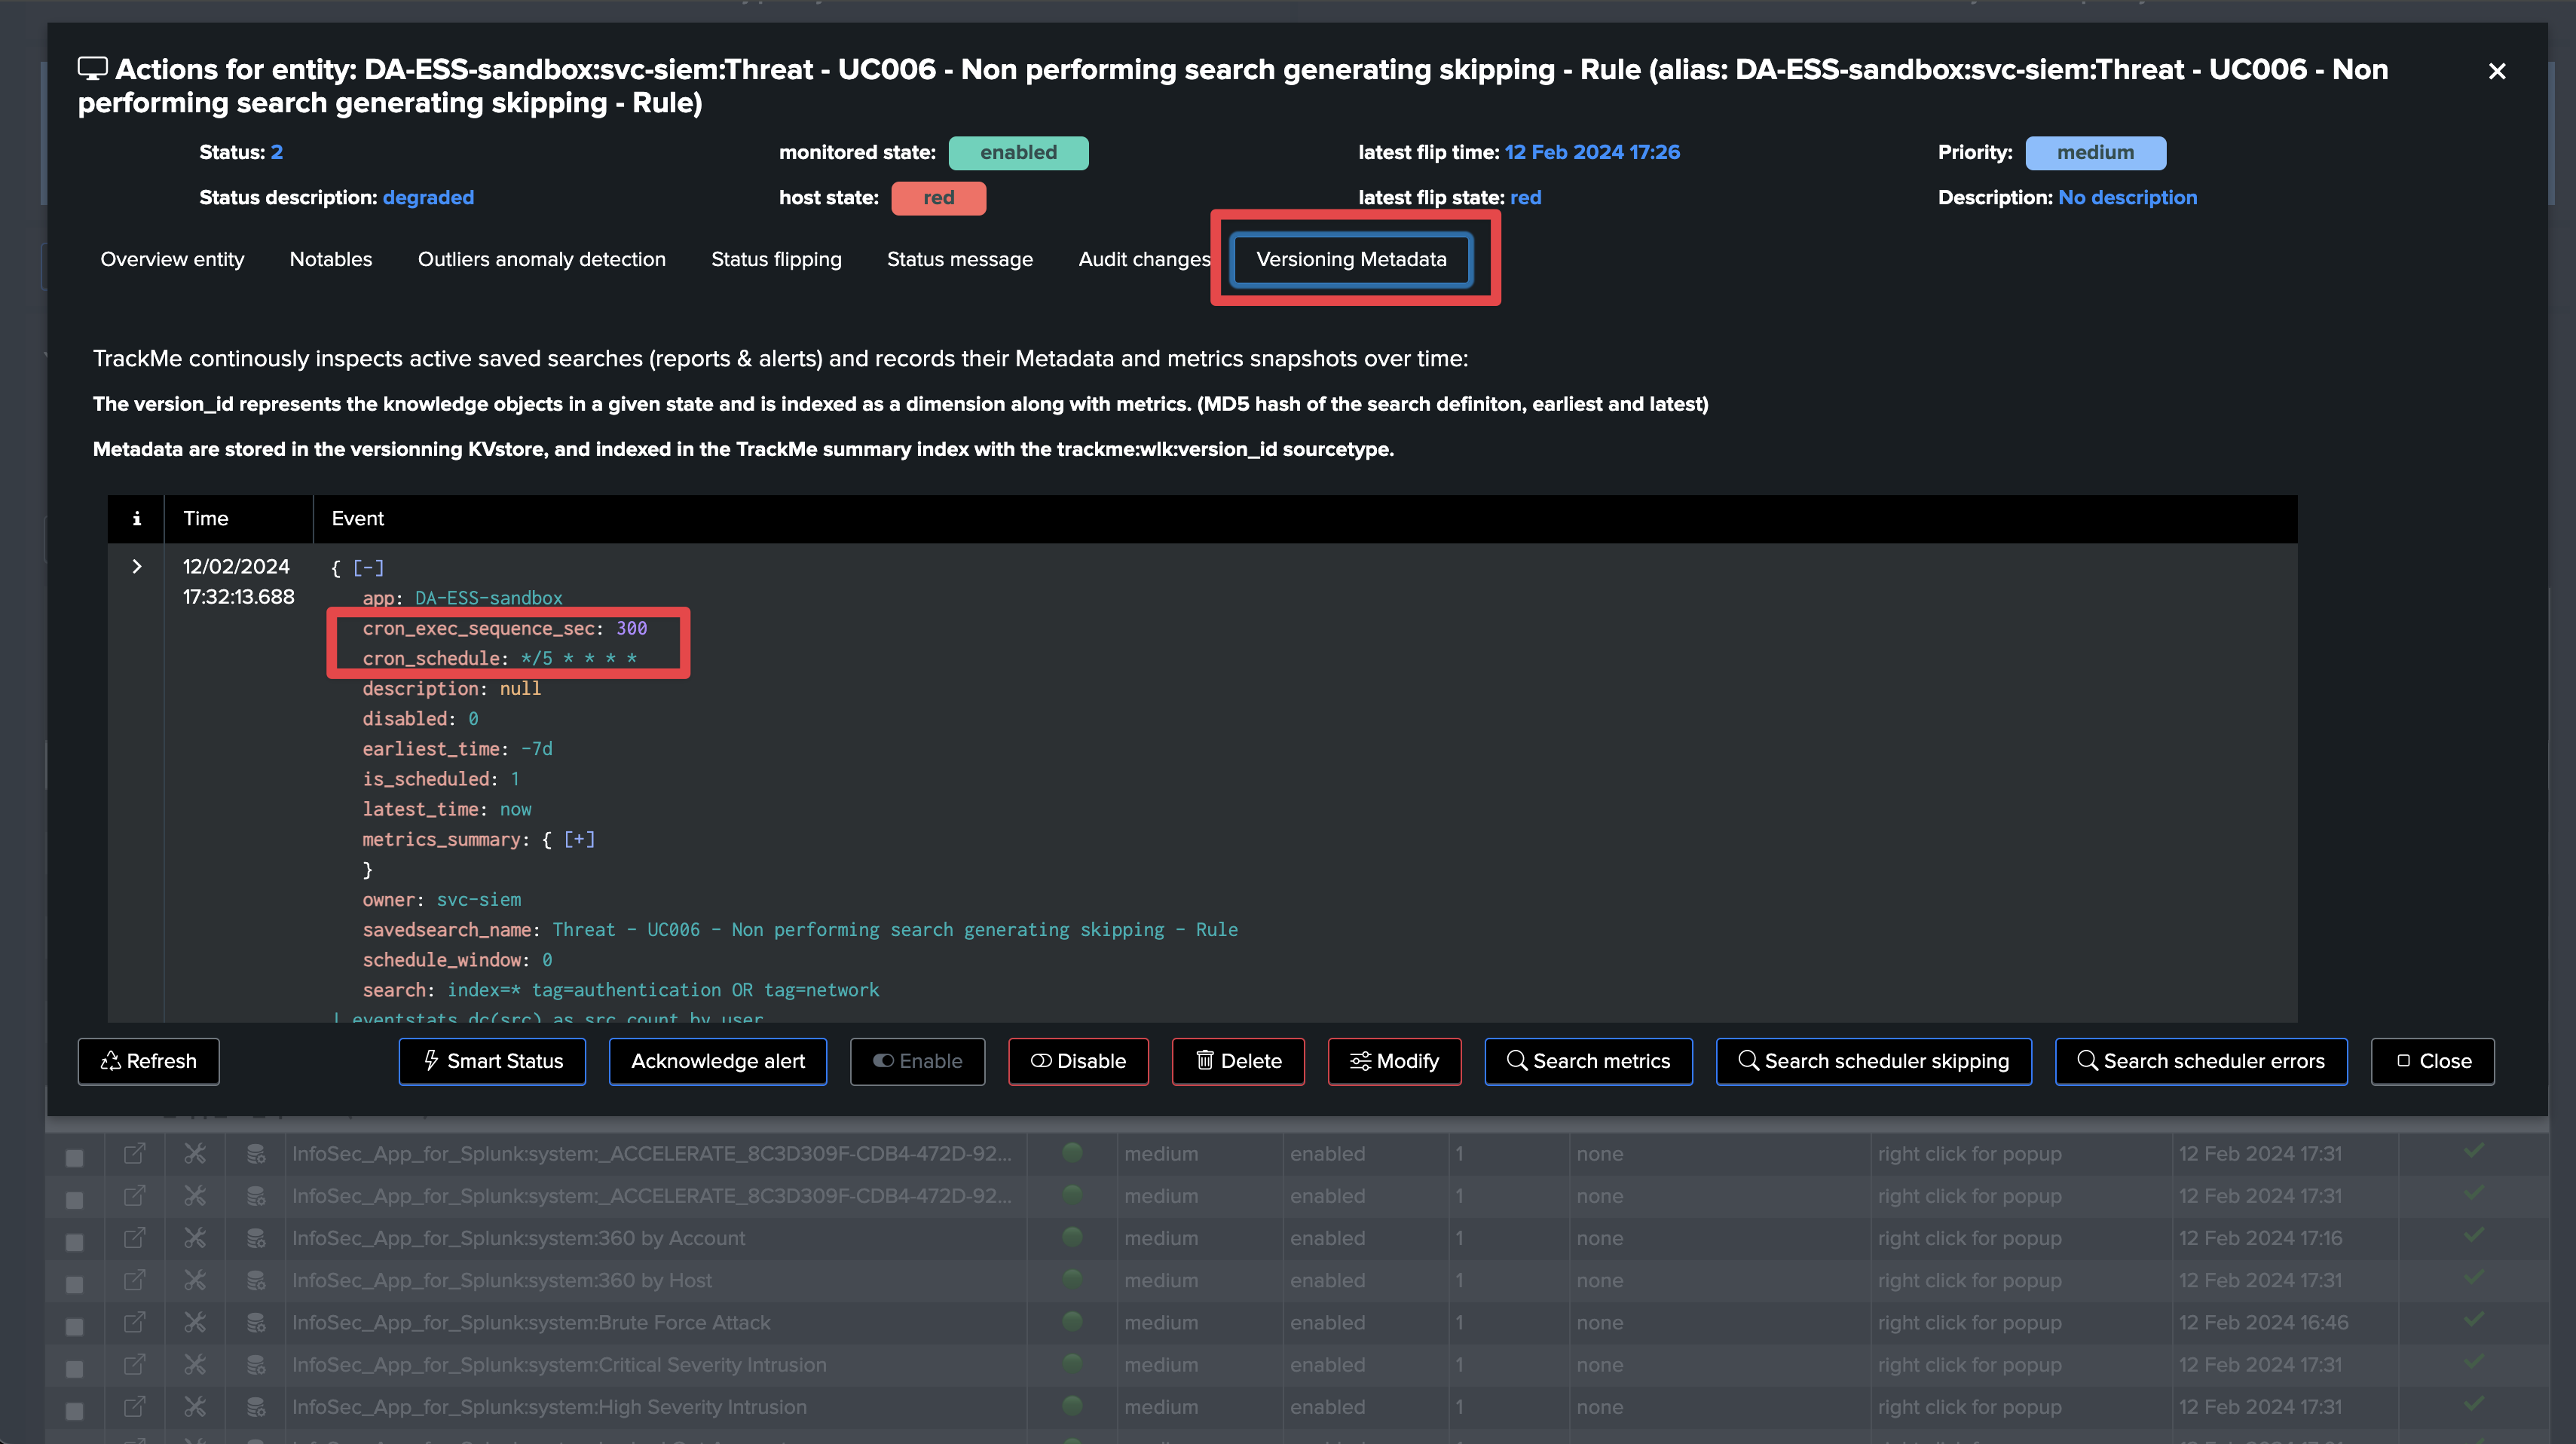
However, The run time execution is well over acceptable values, and the search is skipped:
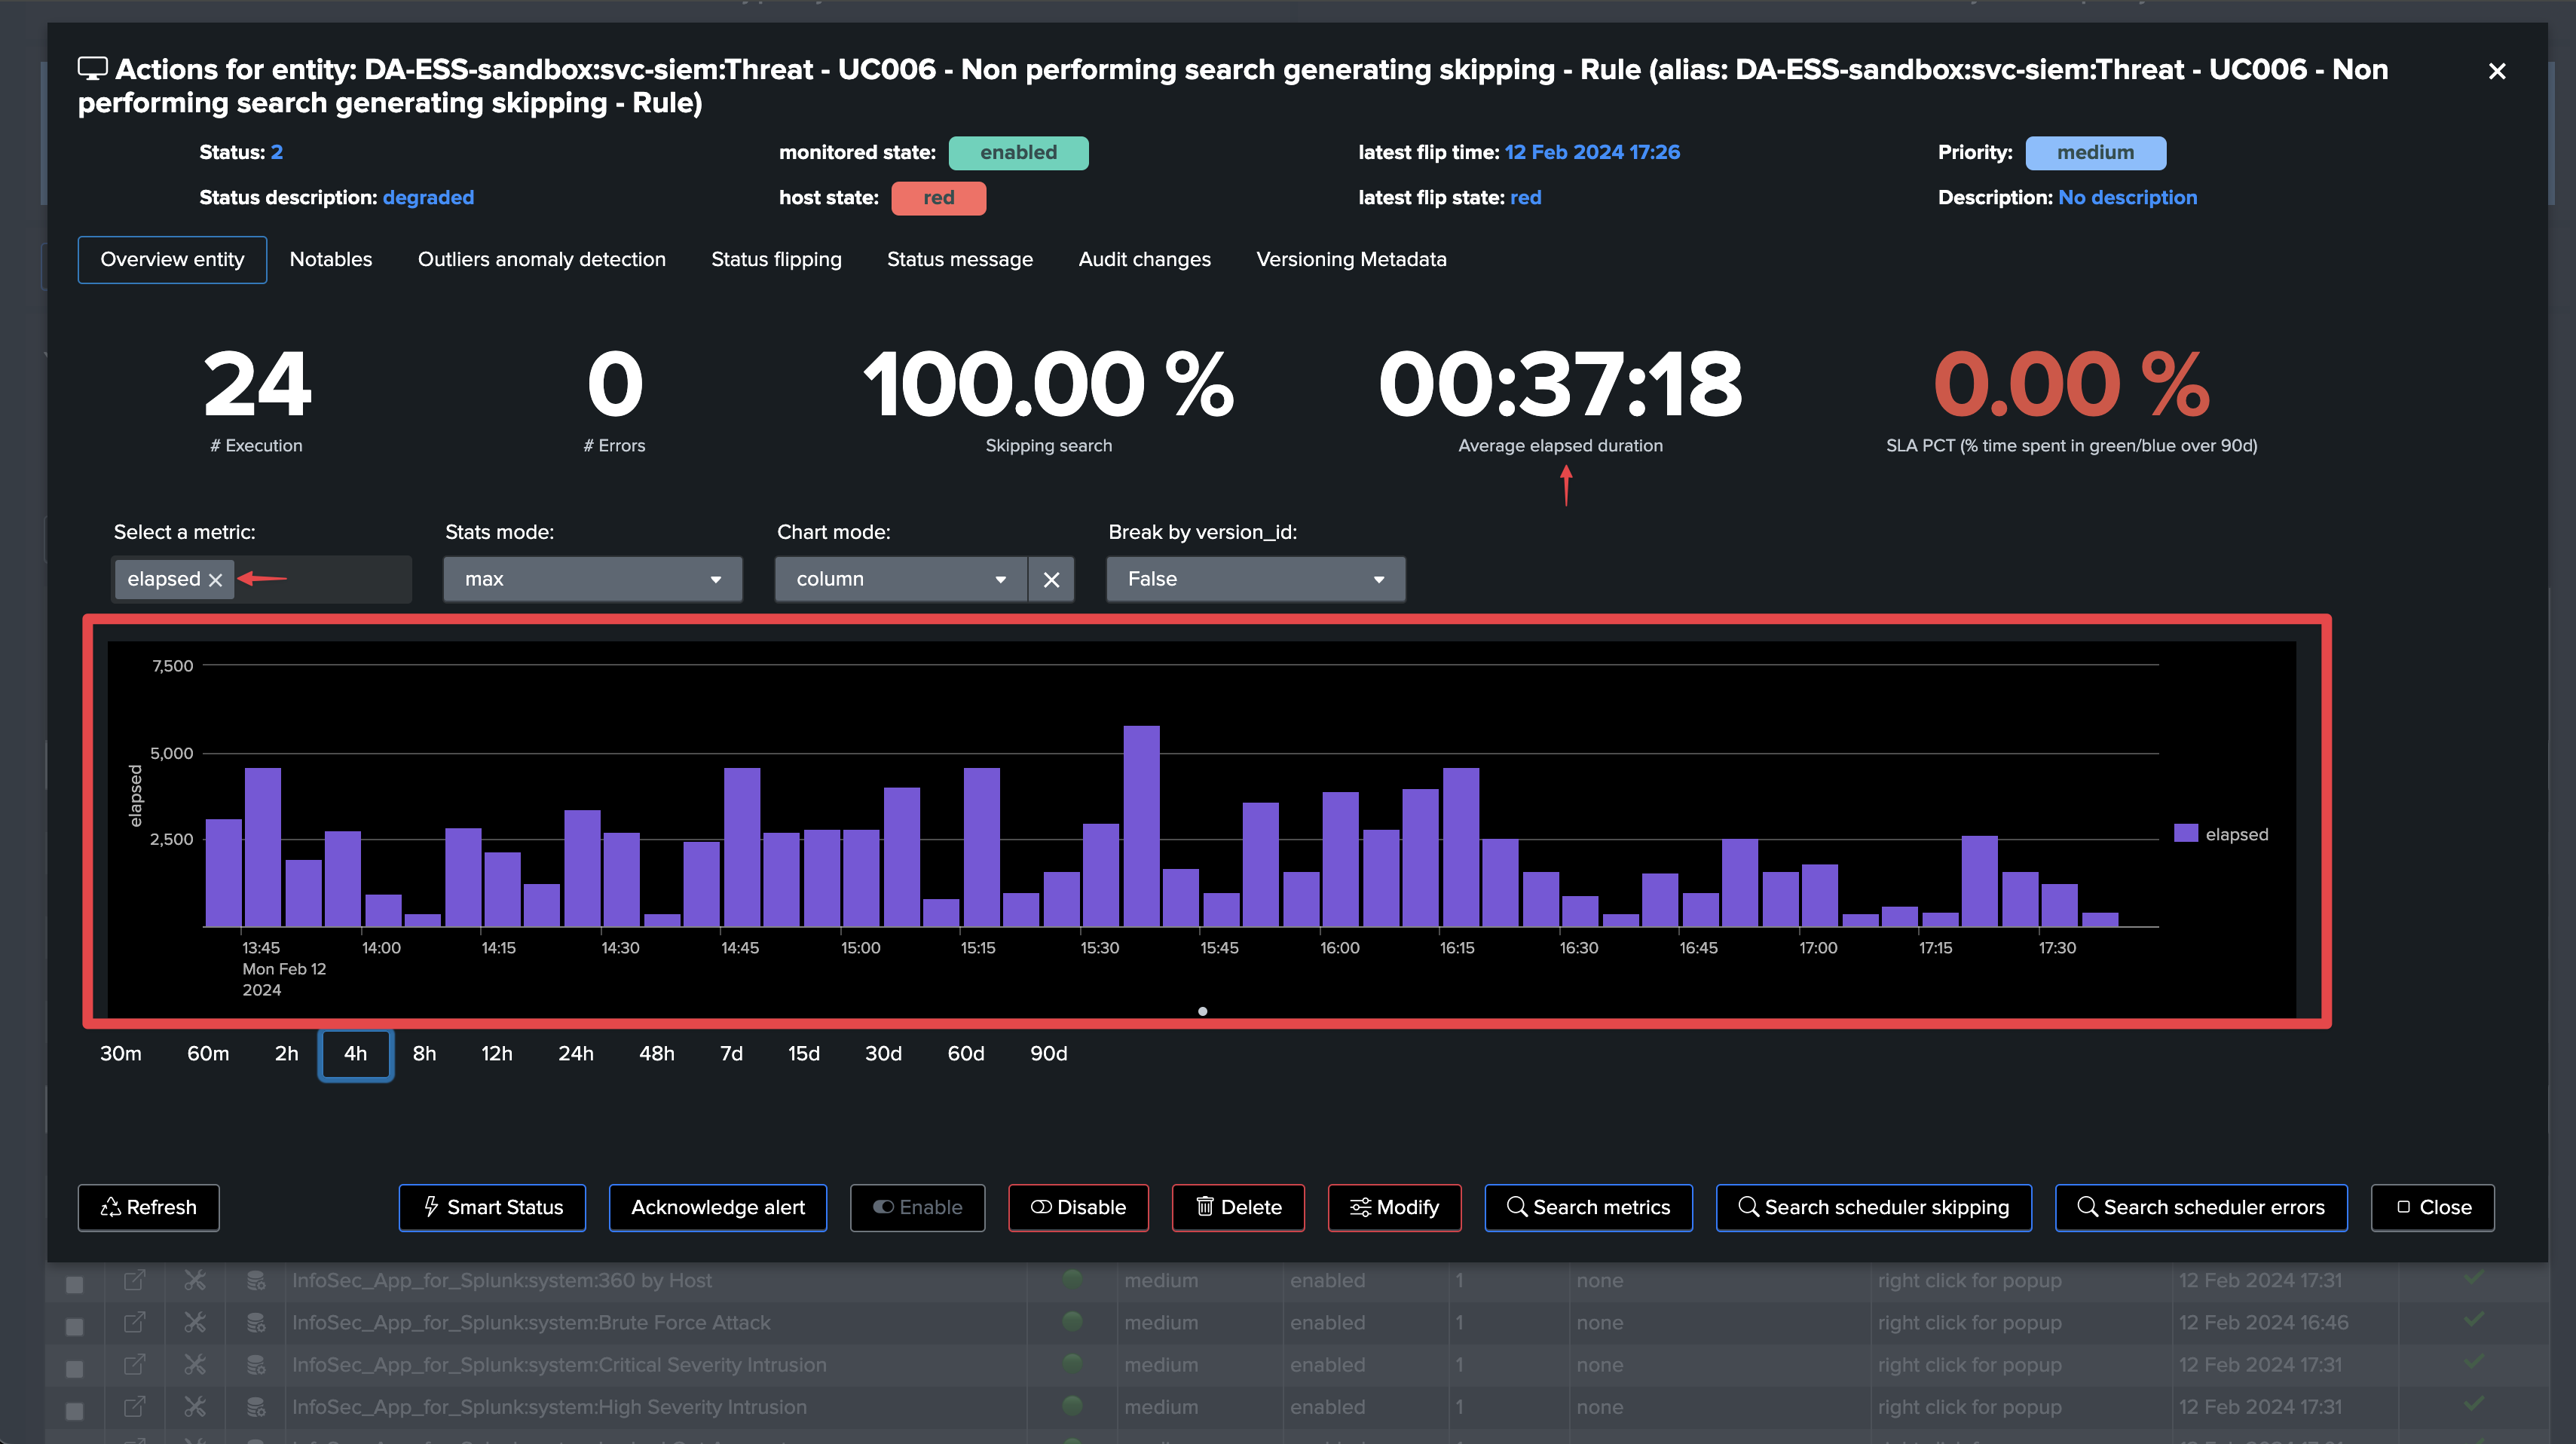
This search is clearly encountering quality issues, and needs to be reviewed and redesigned to perform properly or have a more adapted cron schedule.
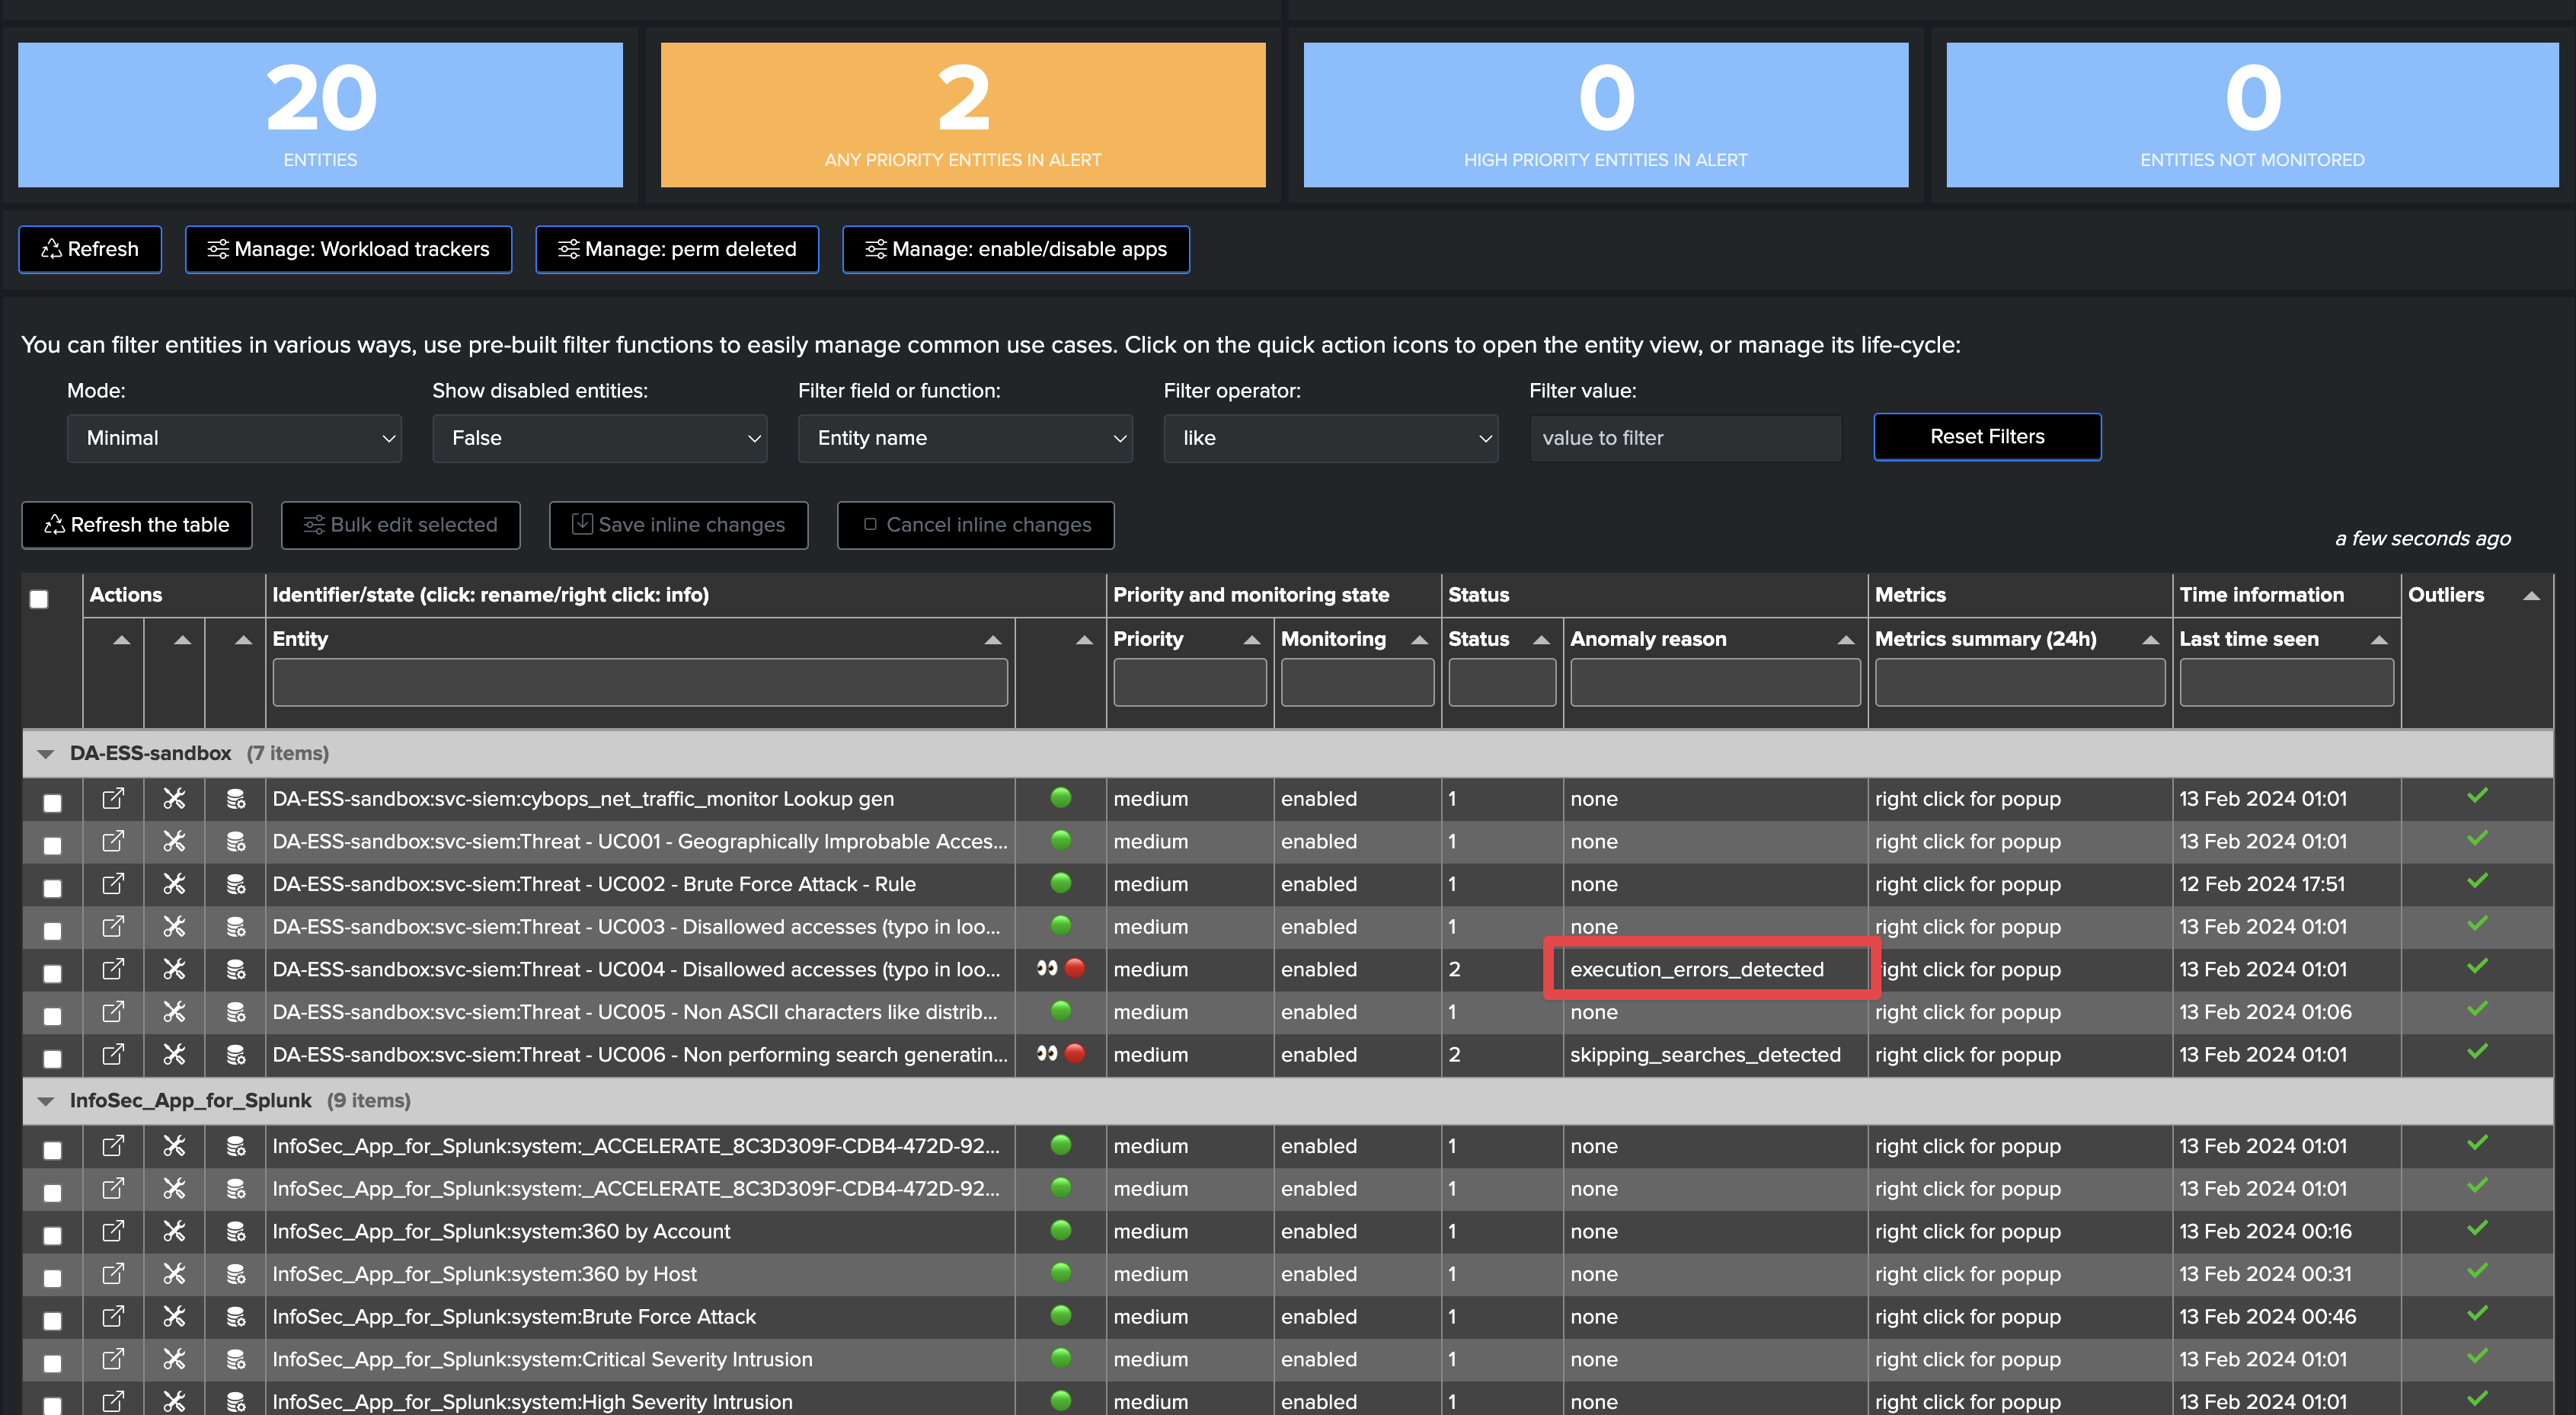
Use case: detecting searches suffering from execution anomalies
Execution errors typically indicate non-working searches and may slightly affect your Splunk use cases
There are plenty of reasons why a Splunk search could start failing at some point in its lifecycle.
This may happen due to temporary infrastructure issues, incorrect syntax, breaking change introduction, third-party application installation or updates… plenty!
This gets also more complex and challenging with the continuous growth of the environment and use cases. Very often, use cases fail silently and are not detected until a major issue is encountered.
With TrackMe’s Workload component, anomaly executions are detected at scale, made easily available and automatically investigated for use cases and platform owners to review as soon as possible.
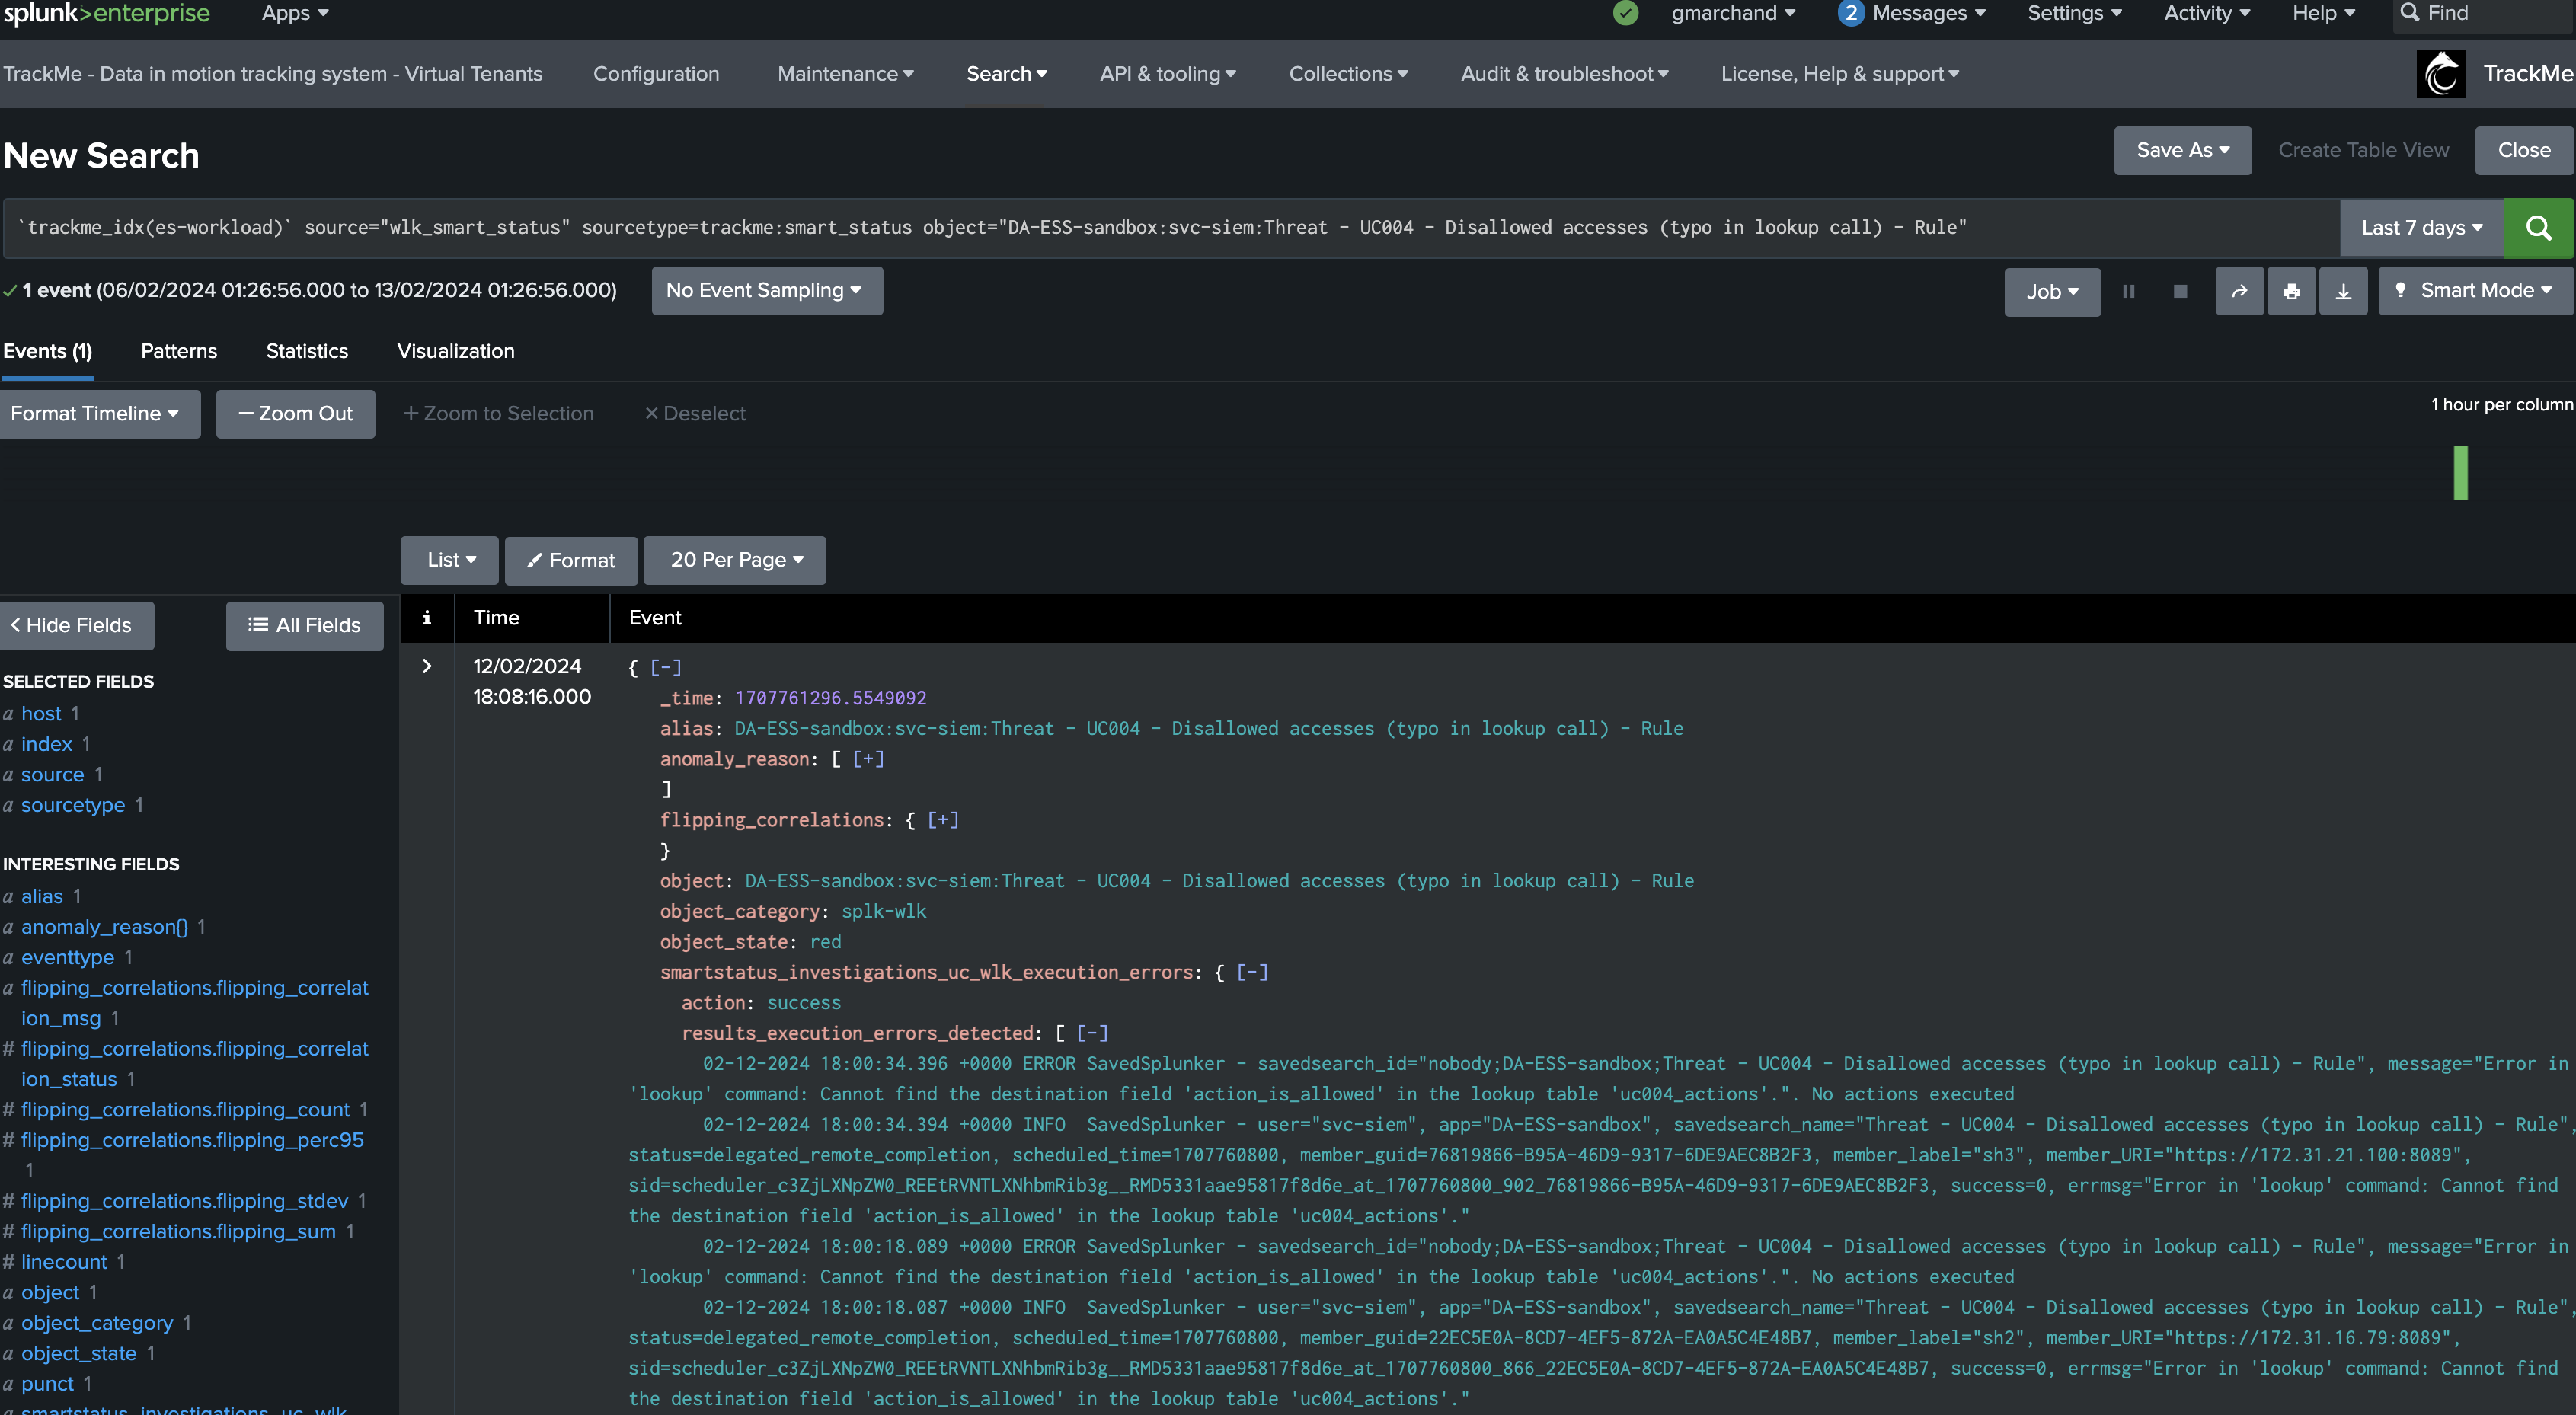
Searches suffering from execution anomalies are tagged with the anonaly_reason=execution_errors_detected
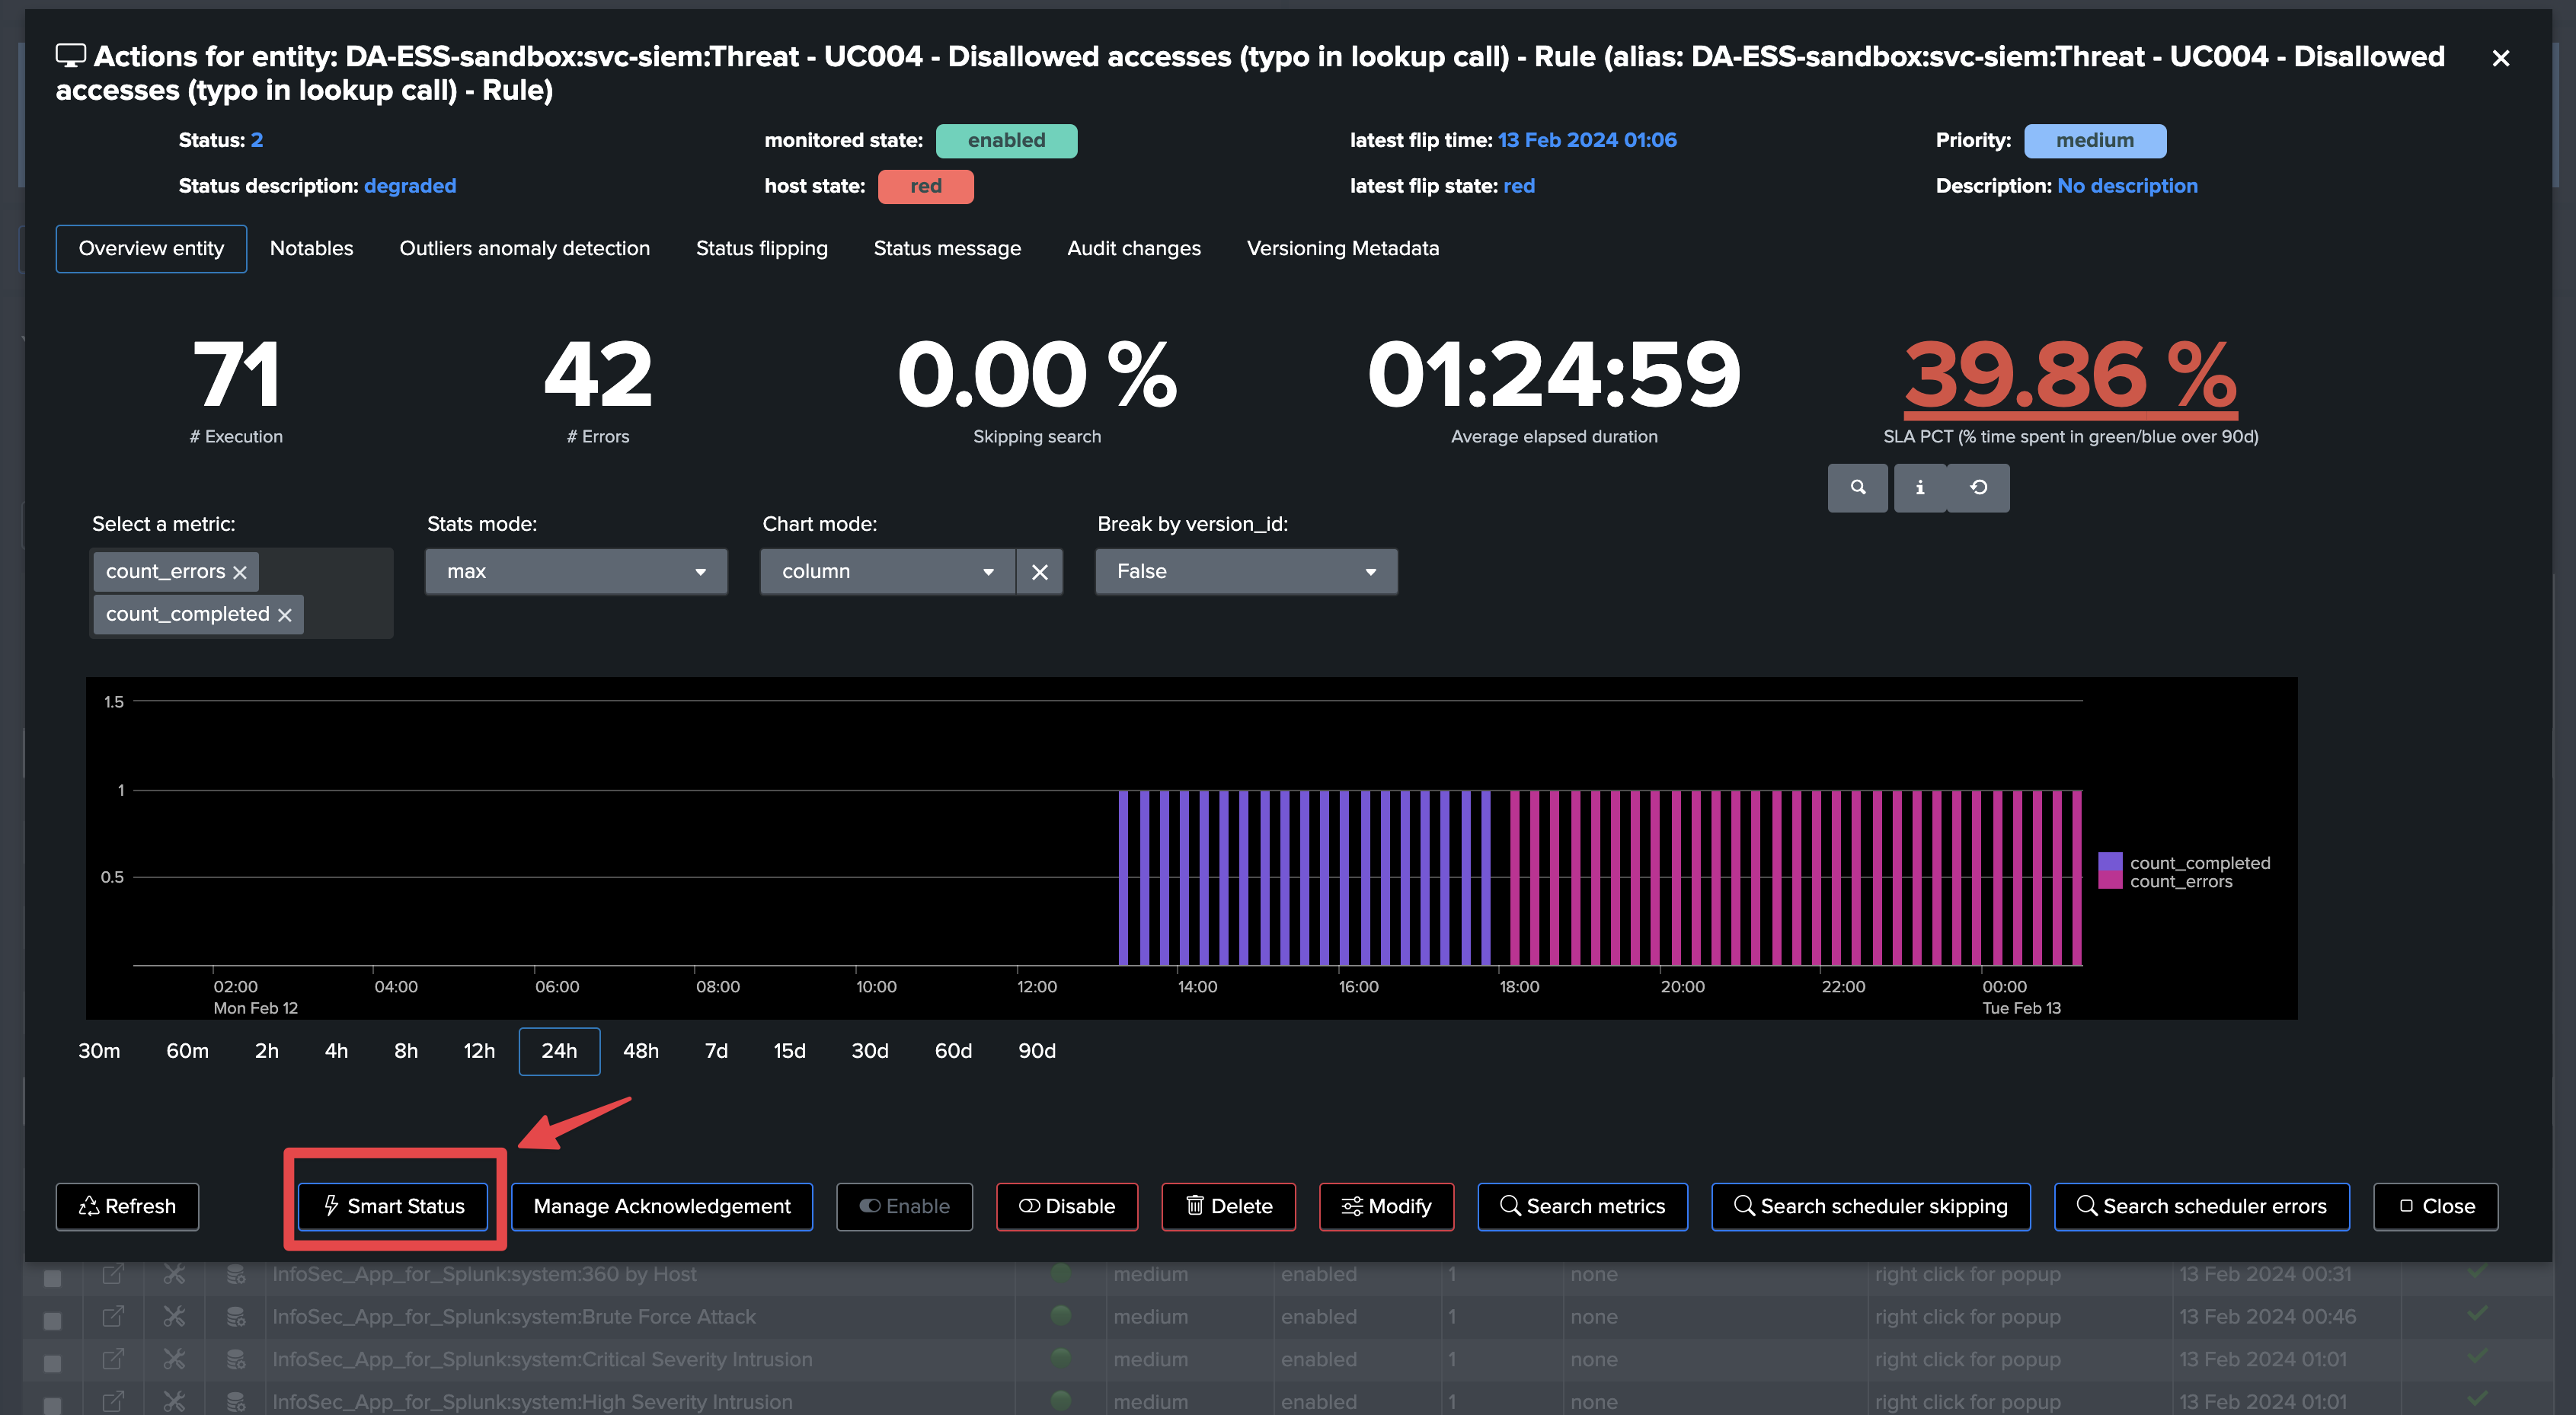
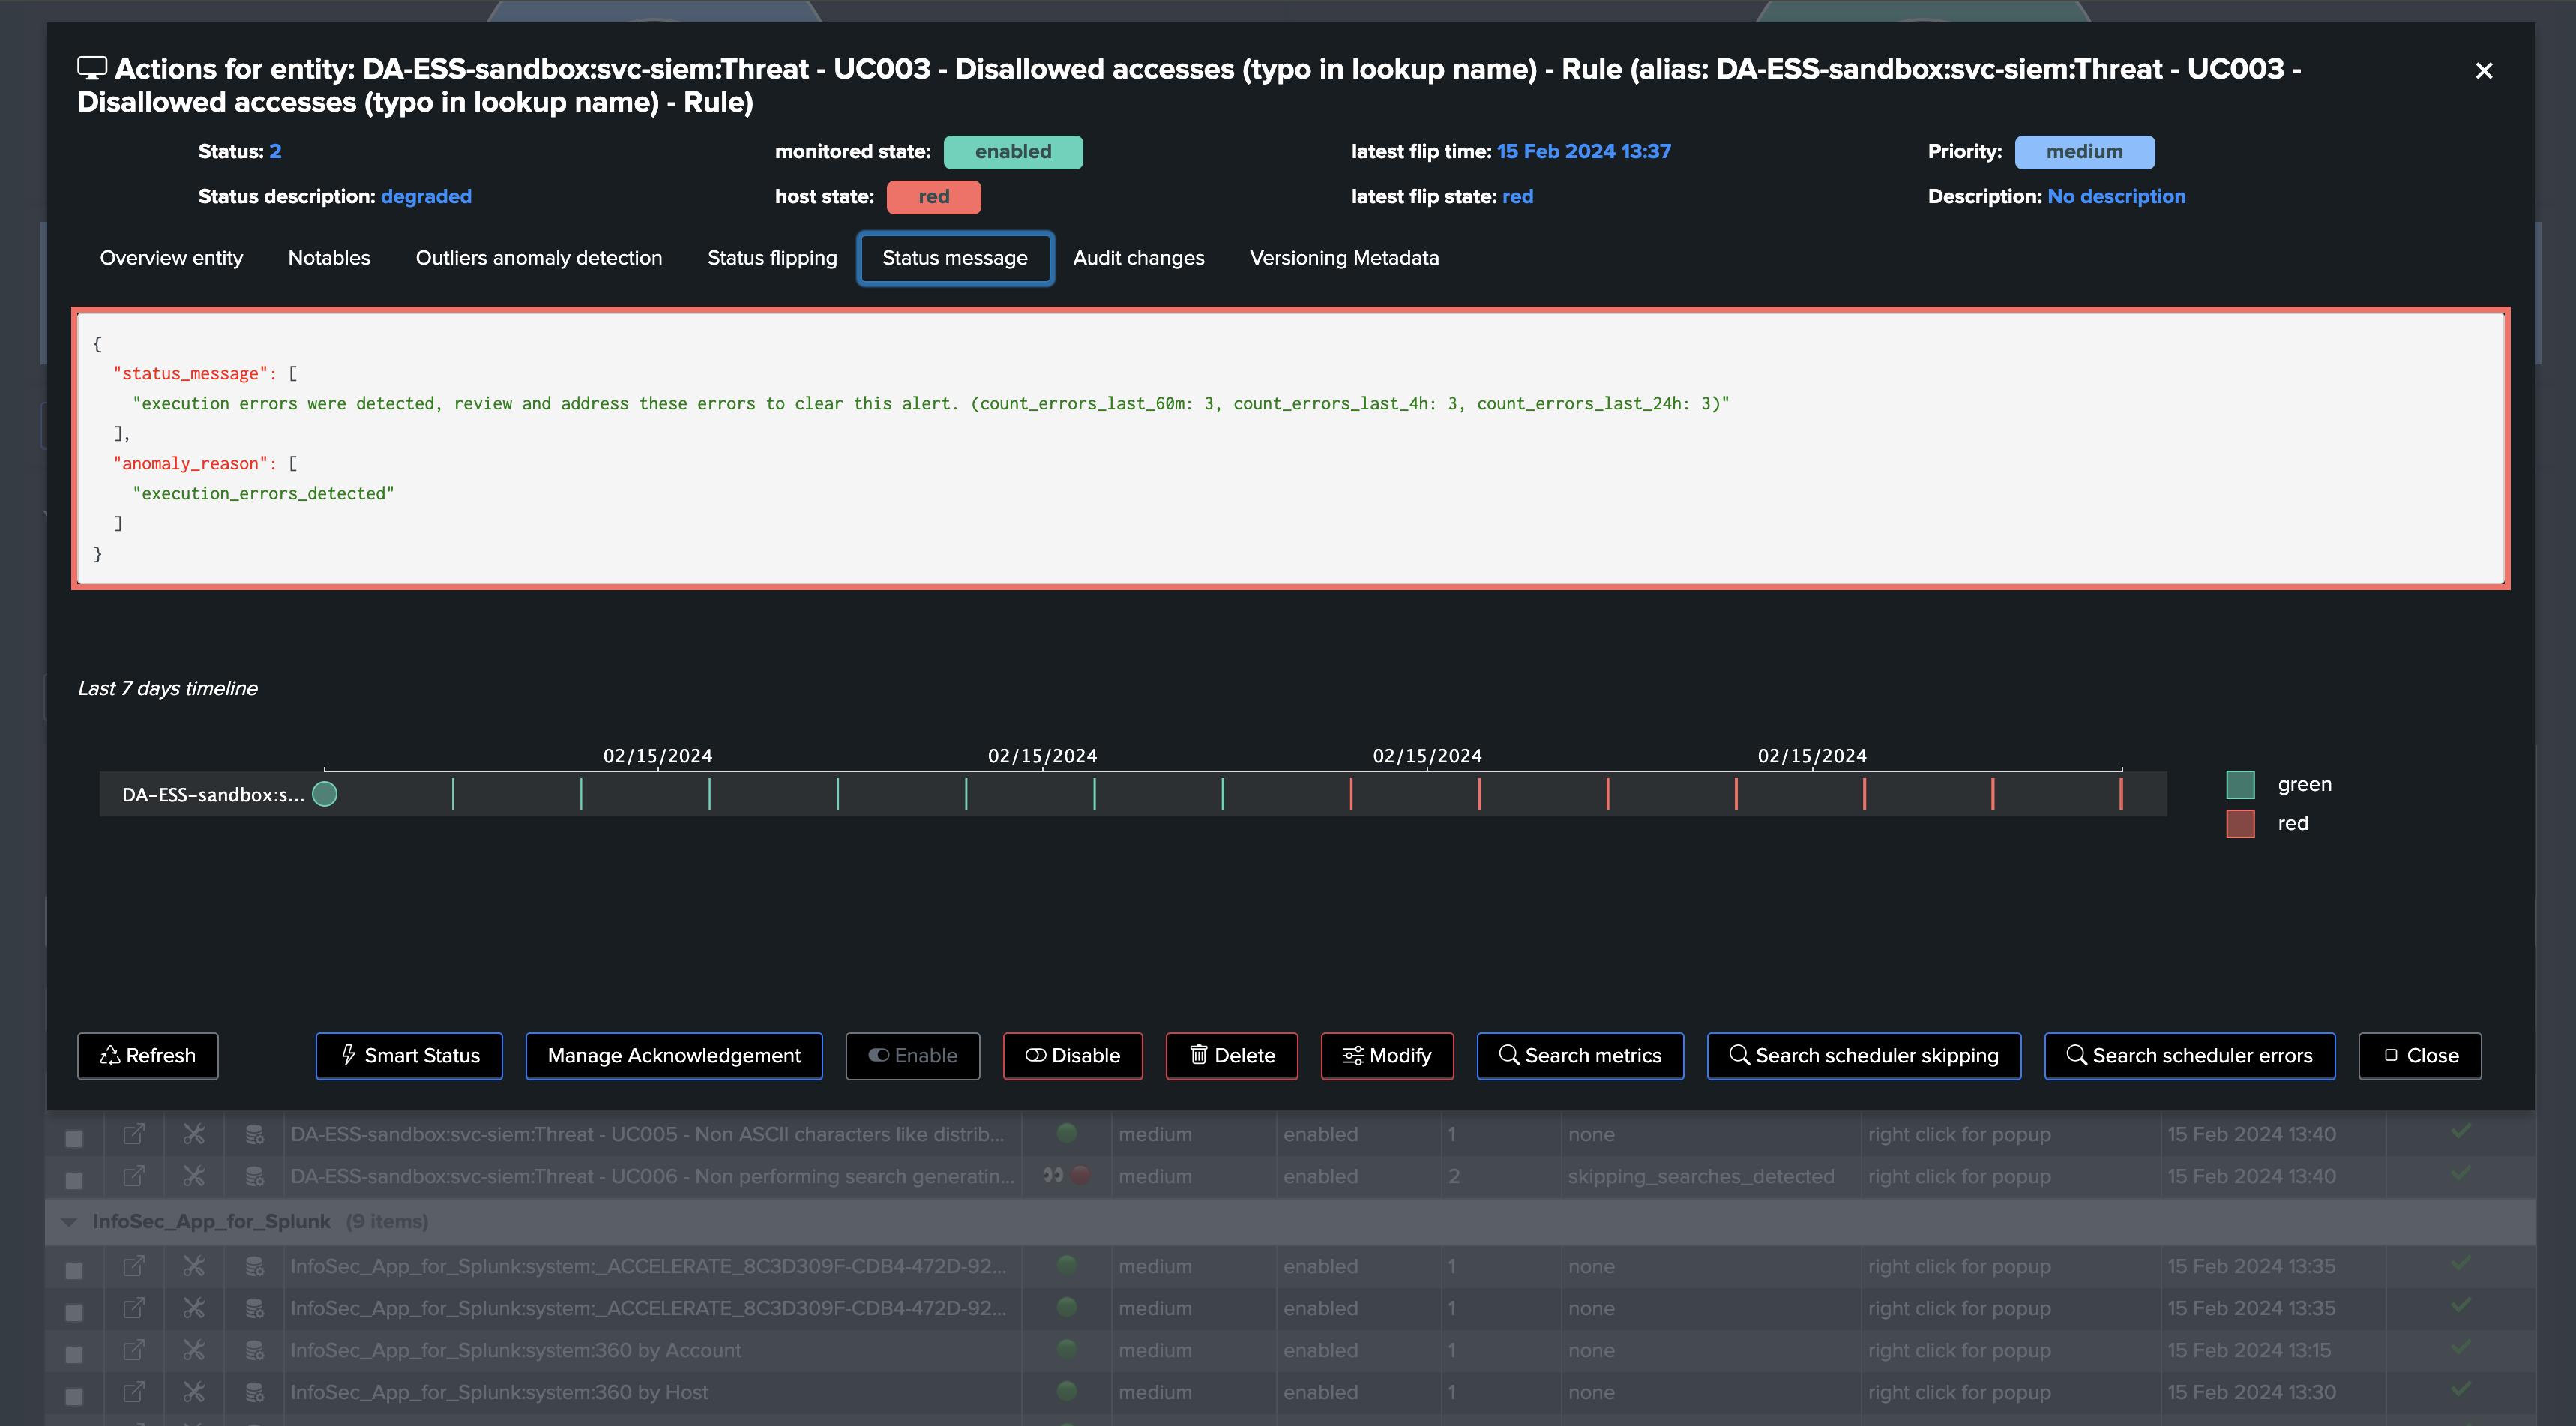
Open the entity and review when execution errors were detected
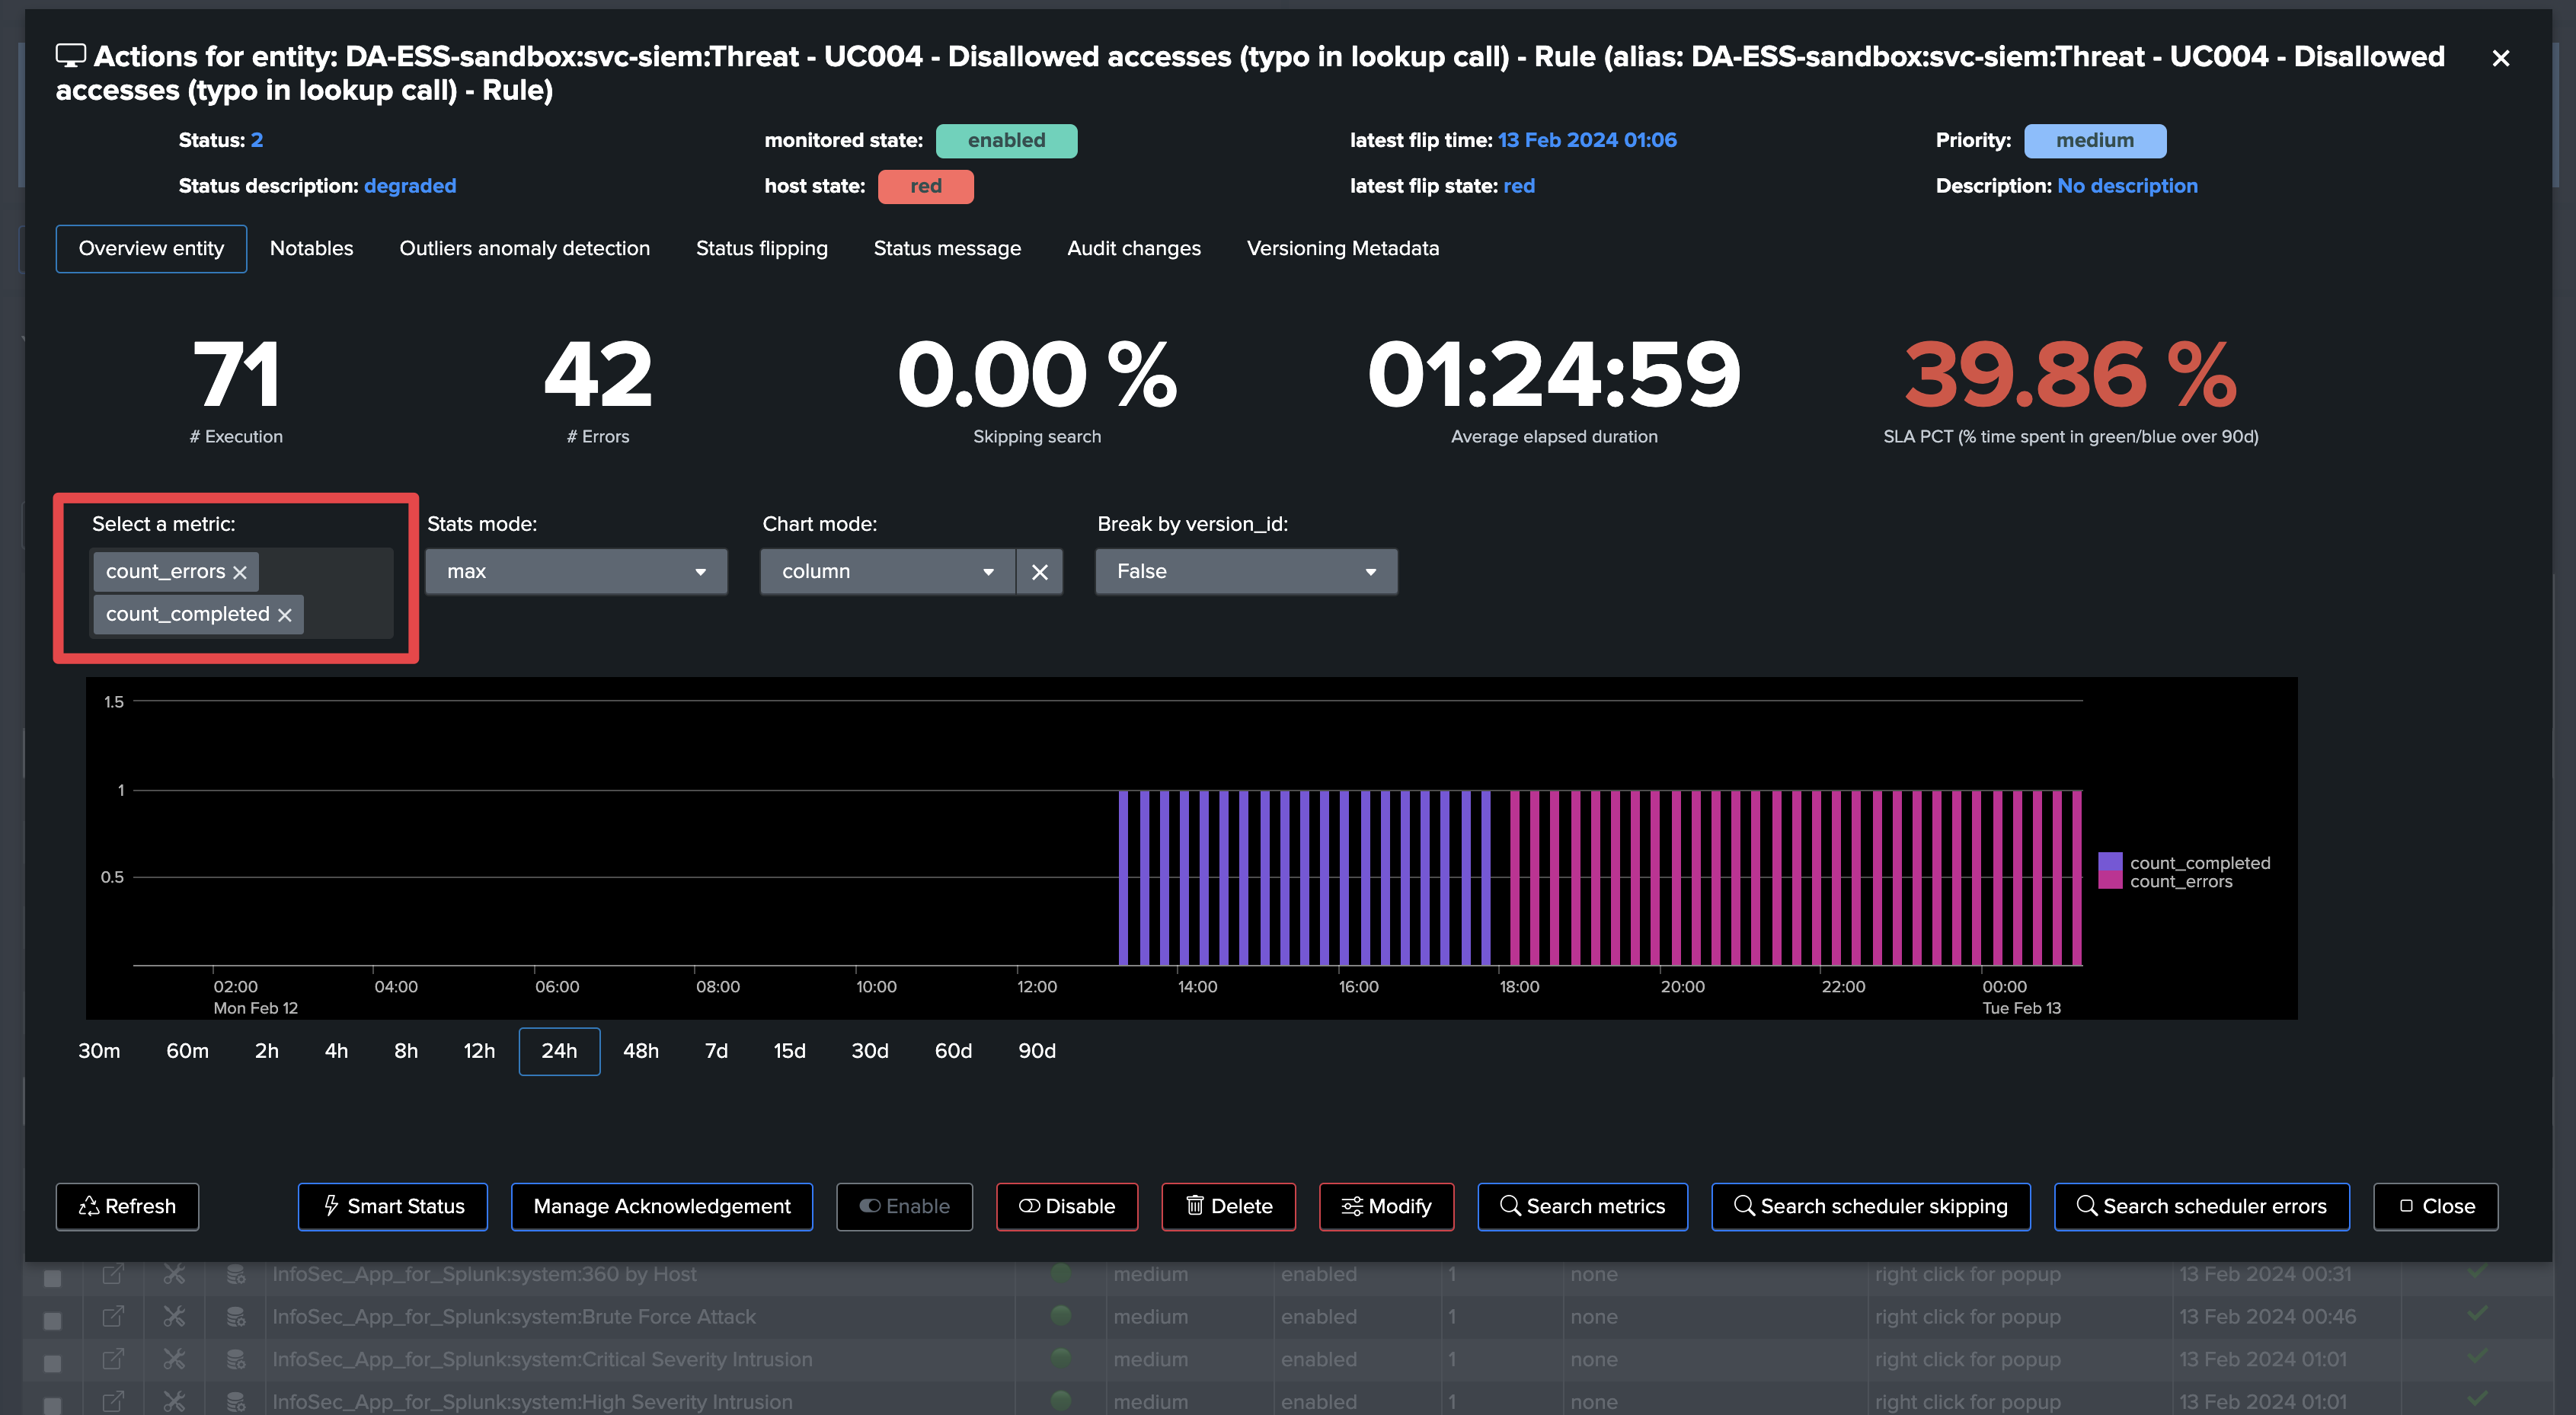
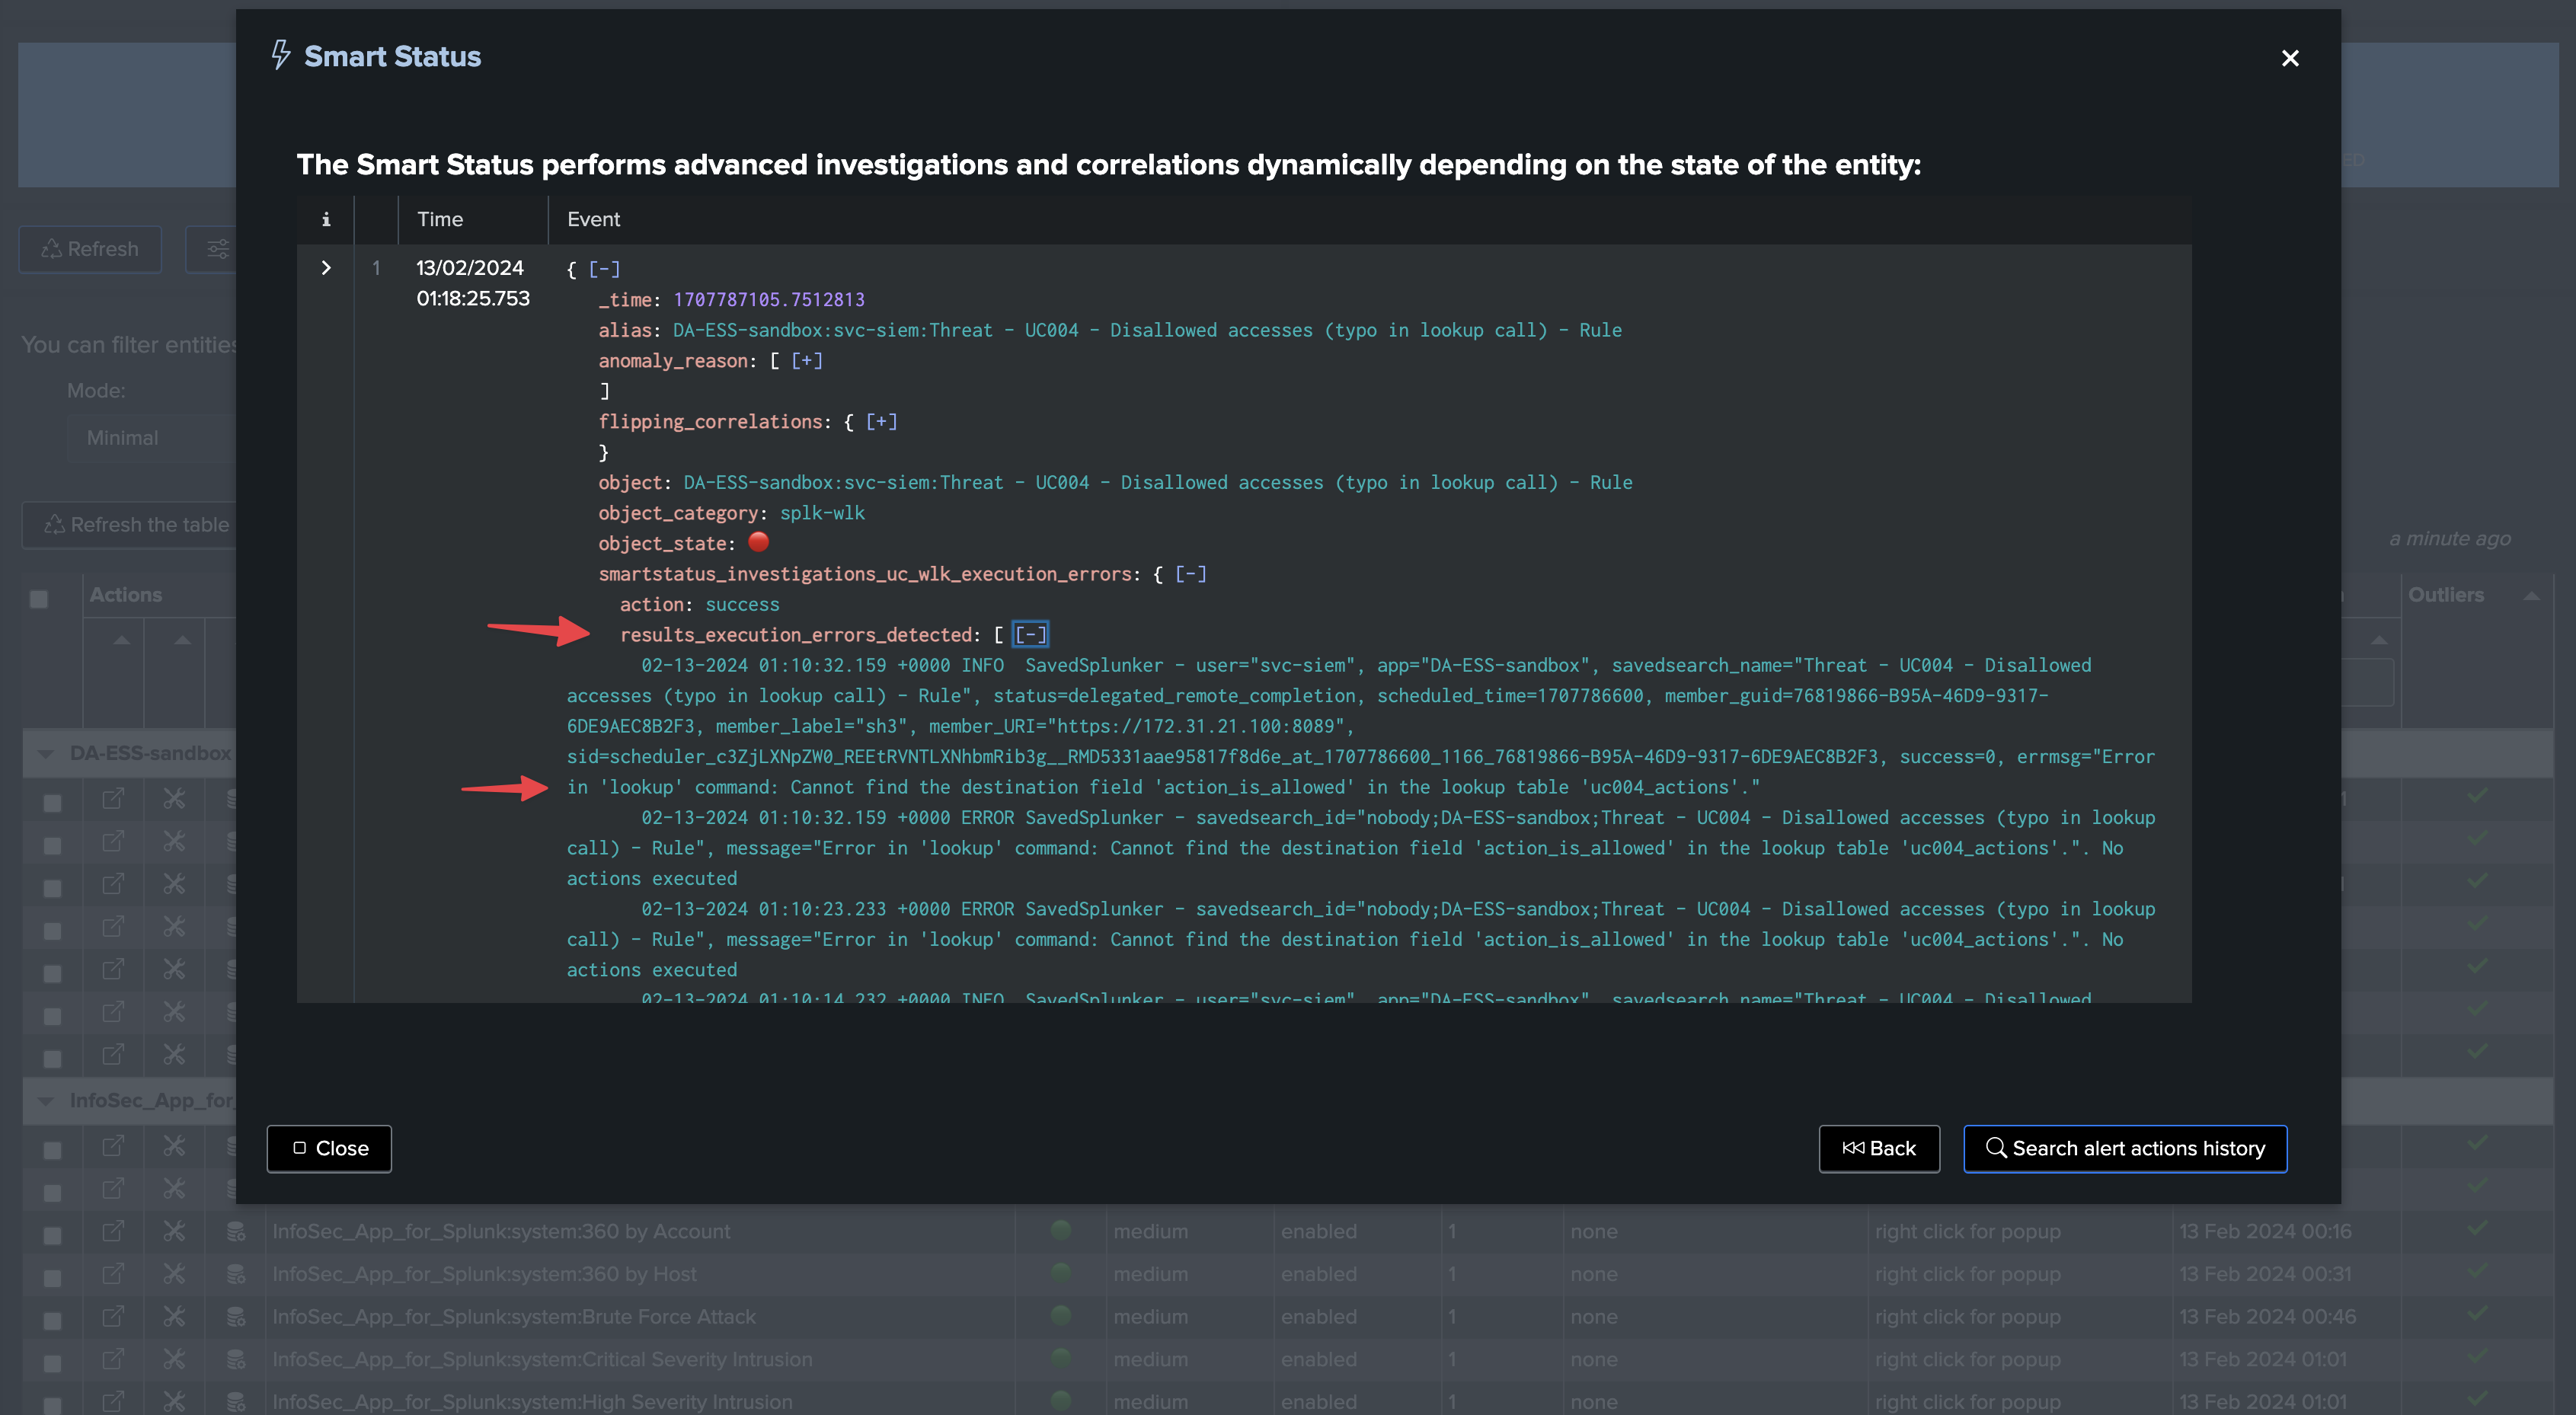
In a single click, you can use the SmartStatus to retrieve a meaningful sample of the Splunk scheduler execution errors:
Hint
SmartStatus provides access to the _internal execution errors to use cases owners with no access to the _internal index
With the SmartStatus and TrackMe’s RBAC management, use case owners can transparently access to the execution errors from the _internal, even if they do not have access to the _internal index.
This is possible via controlled elevation of privileges, users that are granted access to the TrackMe API endpoints through the RBAC configuration, will be able to execute the SmartStatus action which itself is executed with system level privileges.
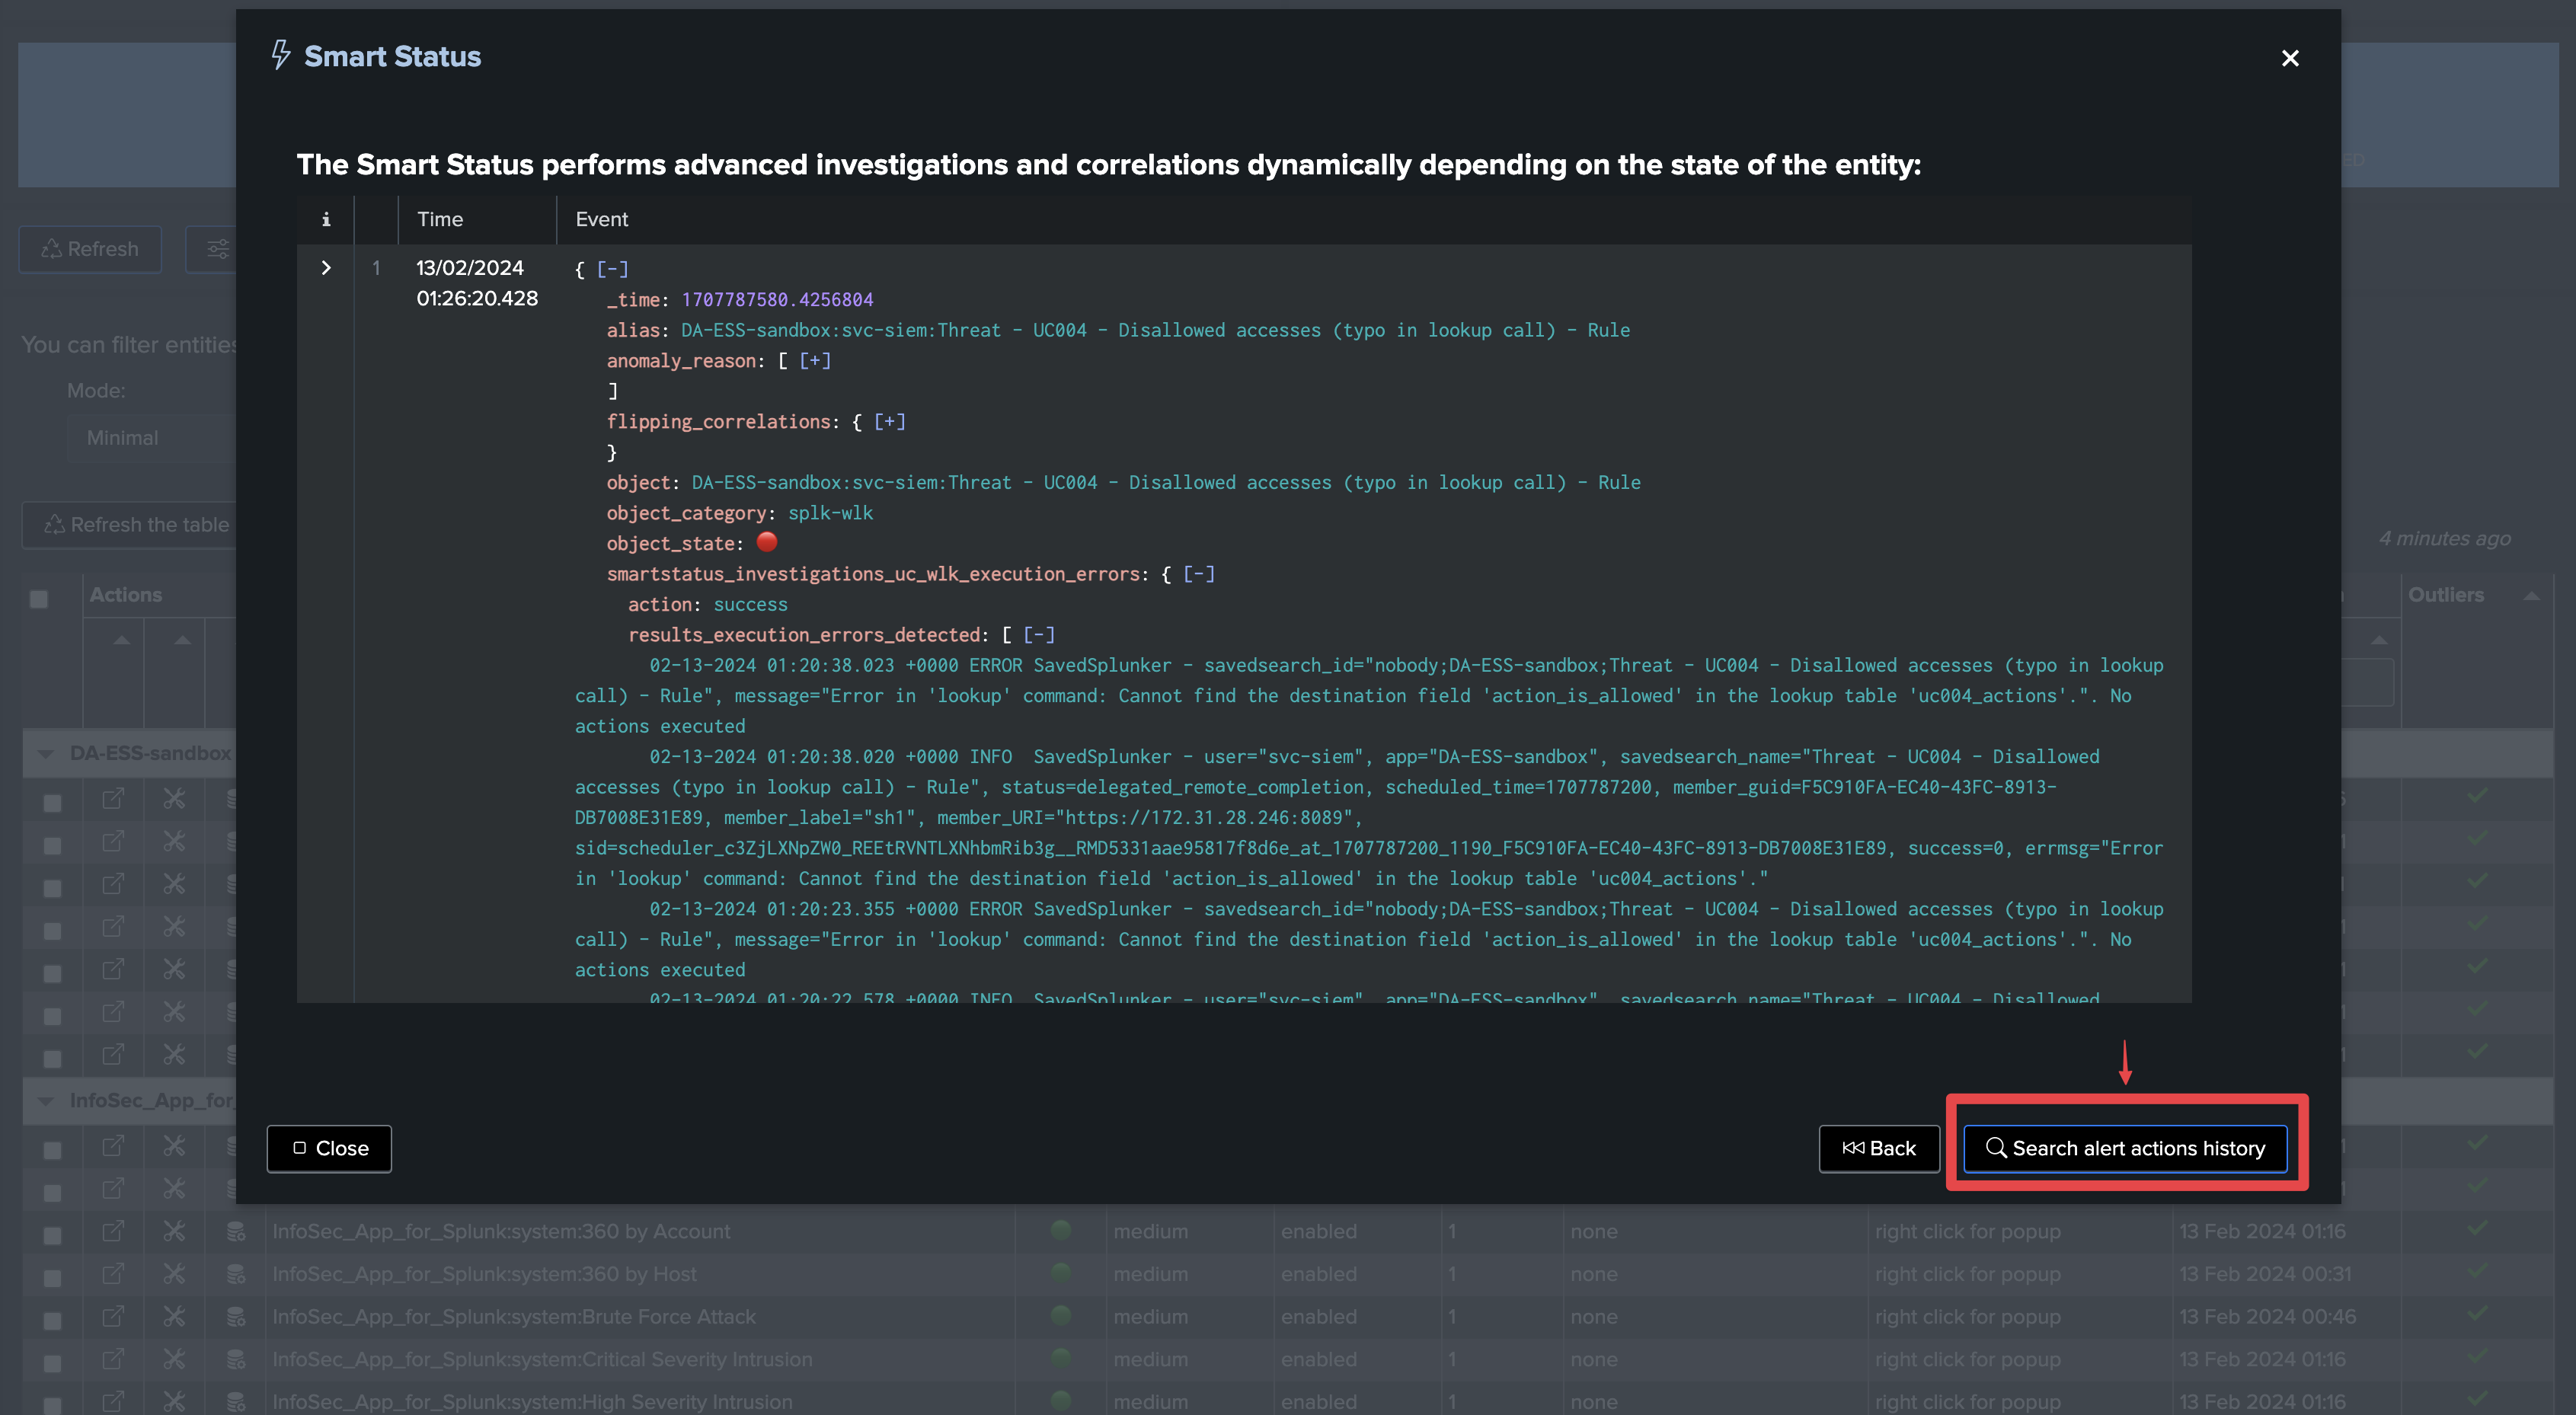
Finally, TrackMe also executes the SmartStatus automatically via the builtin alert action, and indexes the results of it into the associated TrackMe summary index.
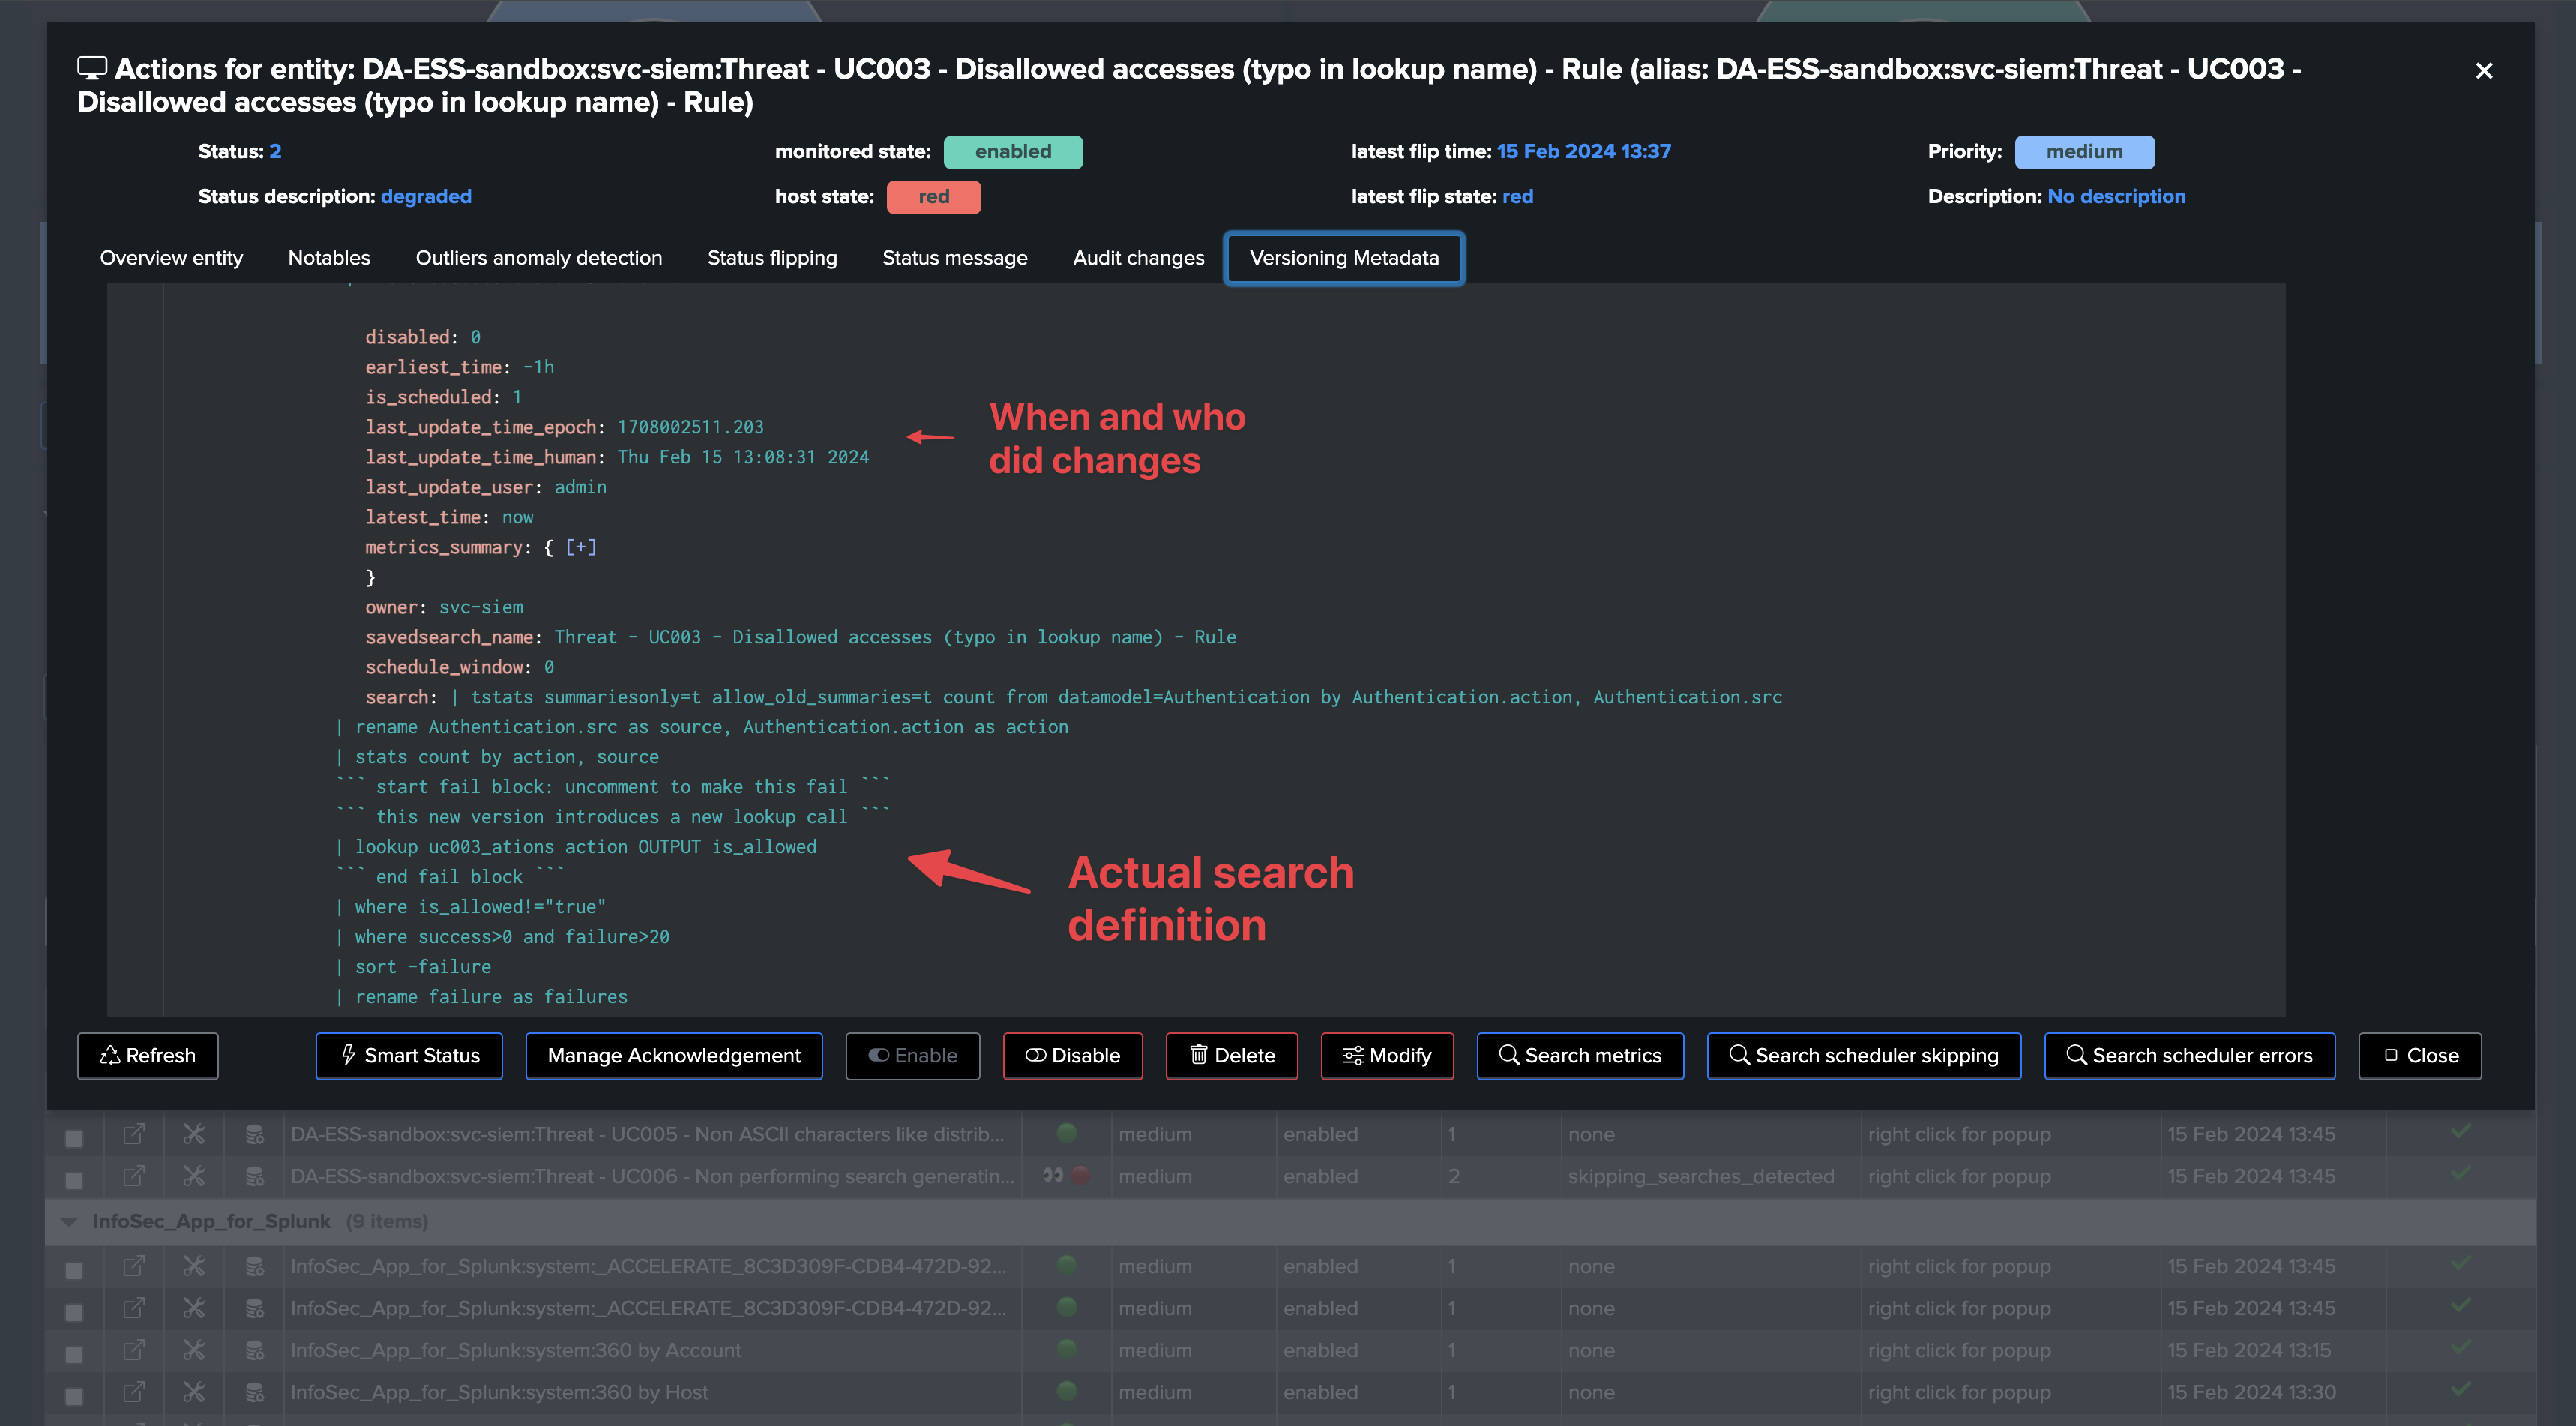
Use case: Use TrackMe’s version to establish relations between search updates and changes in behavior
Using TrackMe’s Workload search versioning, you can easily detect changes and make the link between these changes and how these impact the search behavior
Once TrackMe discovers a search entity, it starts to continuously track the code version of the search.
TrackMe creates a dimension called
version_idwhich is the unique SHA256 hash based on the Workload keys in configuration. (by default: search,dispatch.earliest,dispatch.latest,description,cron_schedule)This dimension is indexed with the Workload metrics and represents the unique instance of a search at some point in time.
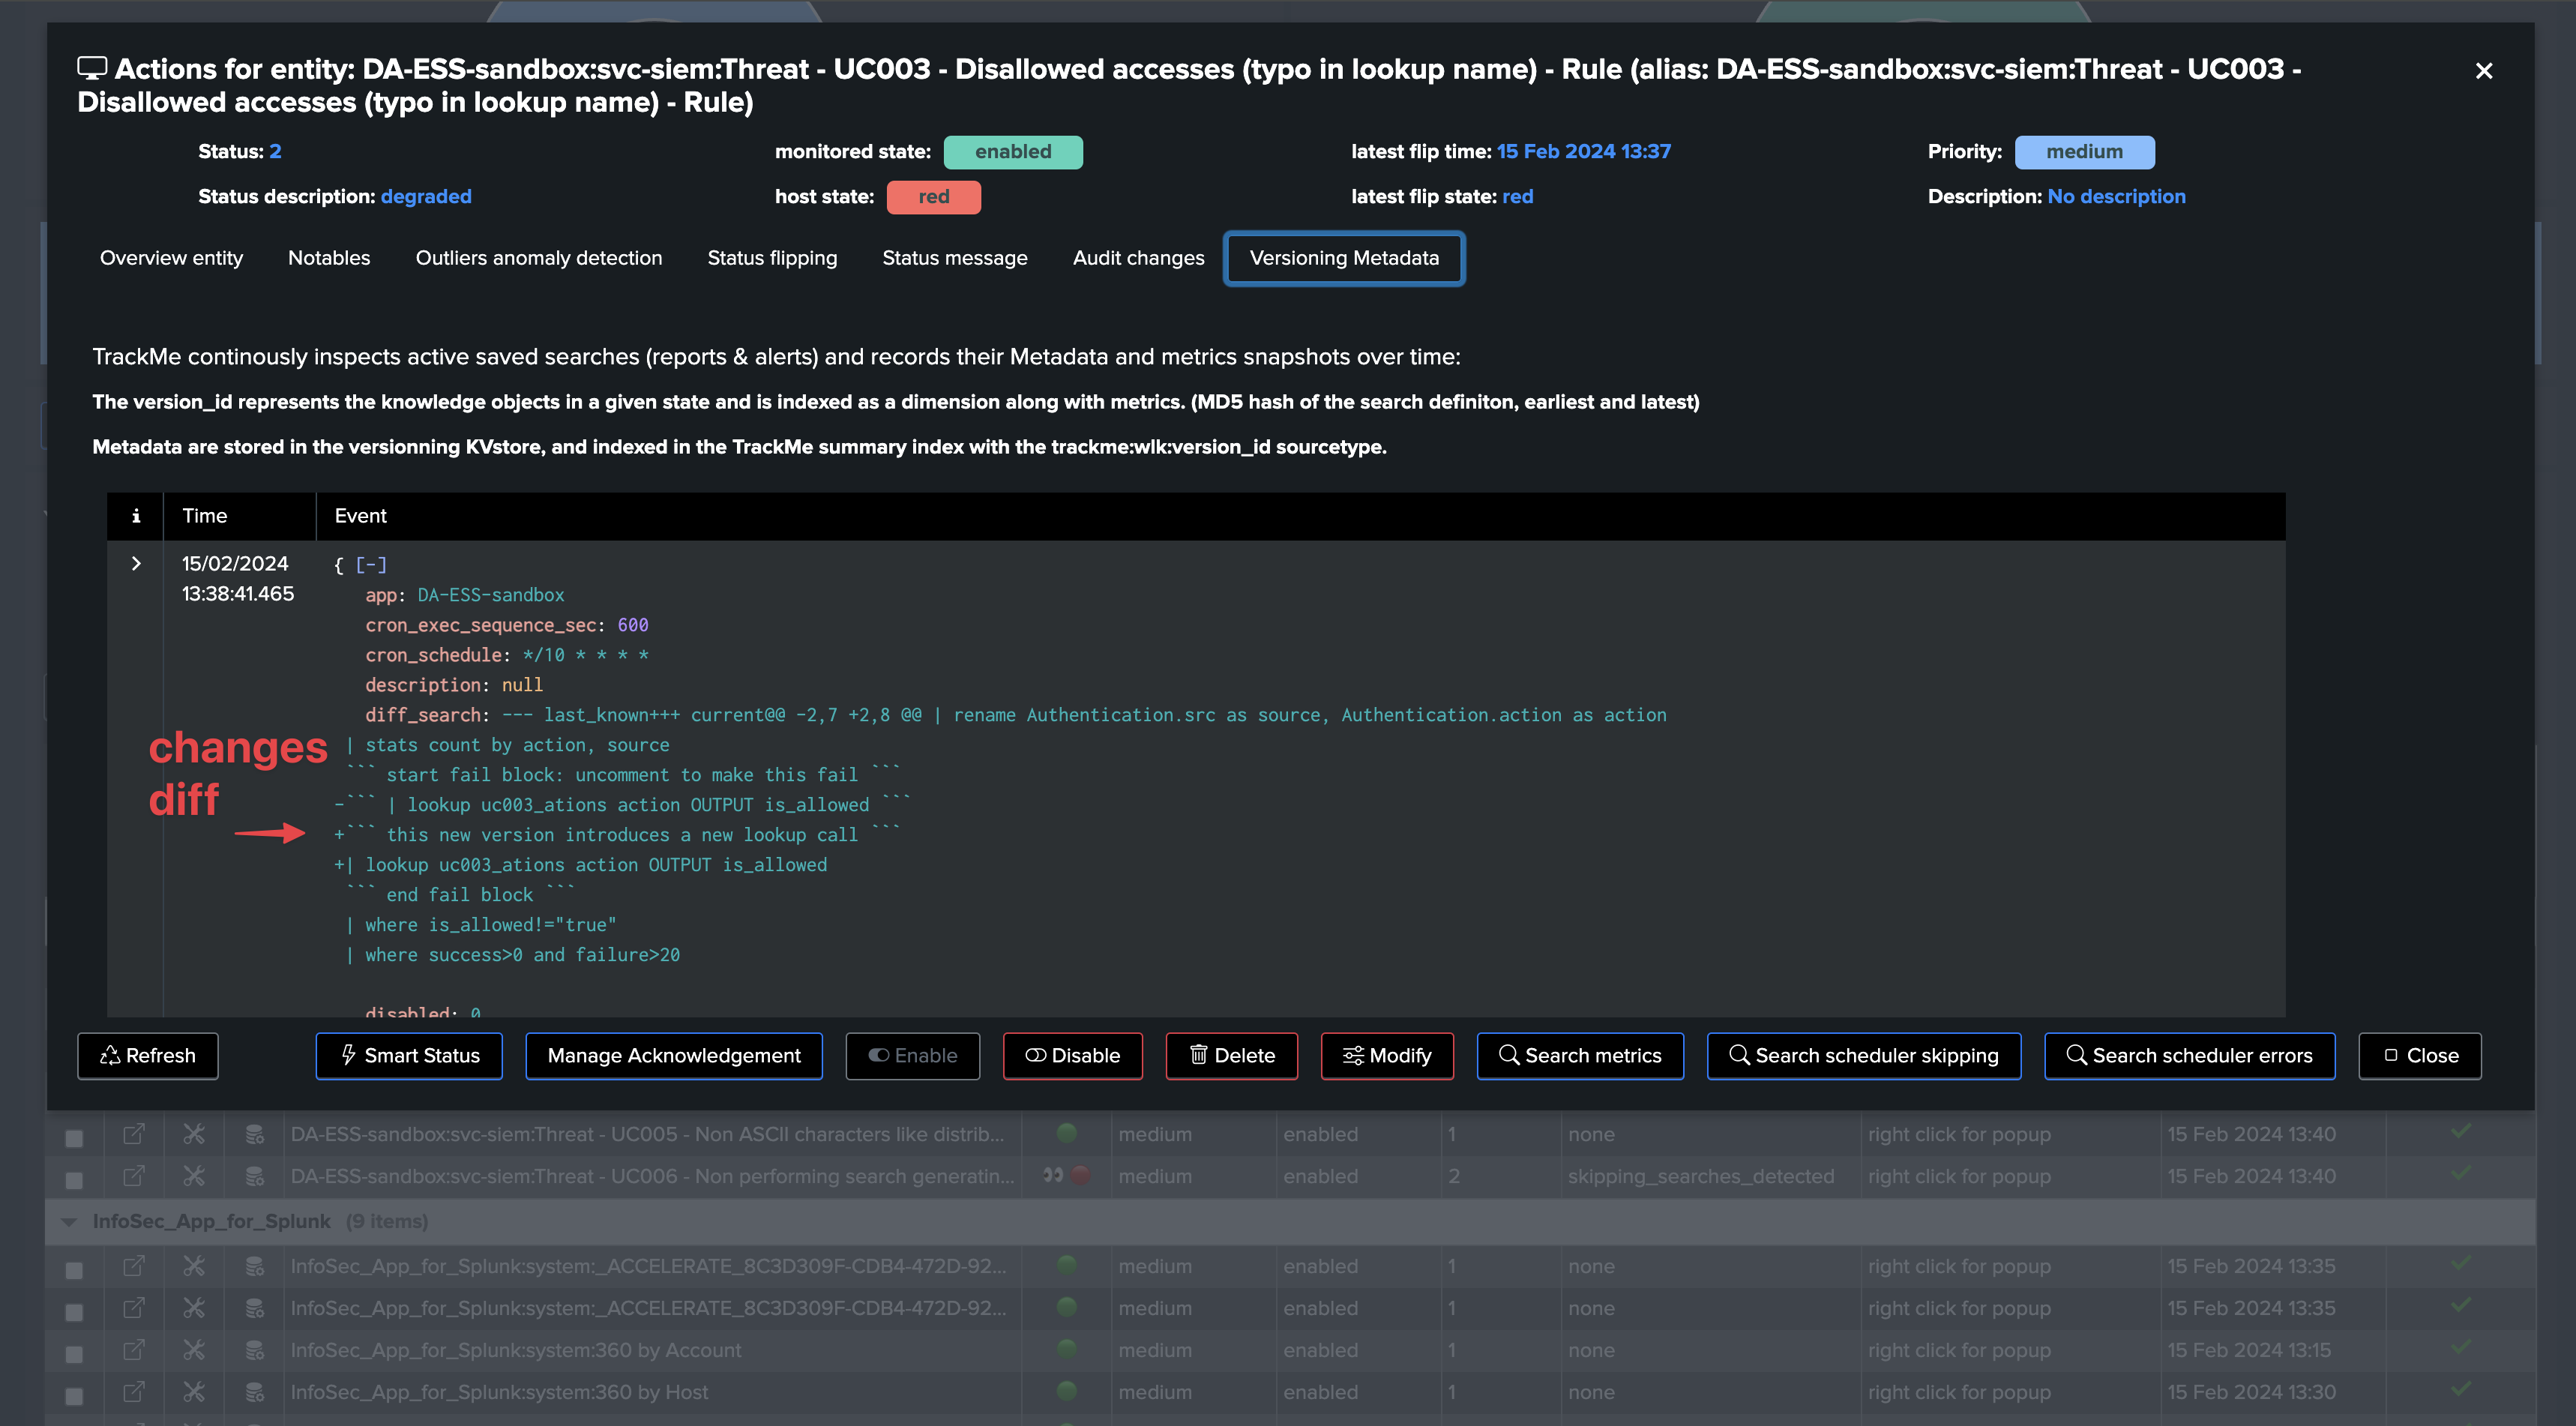
When a change to the search is detected, a new value of the
version_idis generated, the search version KVstore record is updated and TrackMe generates a version event which is indexed in the TrackMe summary index of the tenant.TrackMe also issues a diff of the search definition, time quantifiers and attempts to identify when and who updated the search, which information is added to the versioning record and event.
Finally, you can review changes easily in TrackMe UI, whether this search is local to the TrackMe host or hosted on any remote deployment, without quitting TrackMe for a second.
Say you have a search which suddenly started to generate anomalies execution, TrackMe captures this fact and impacted the entity:
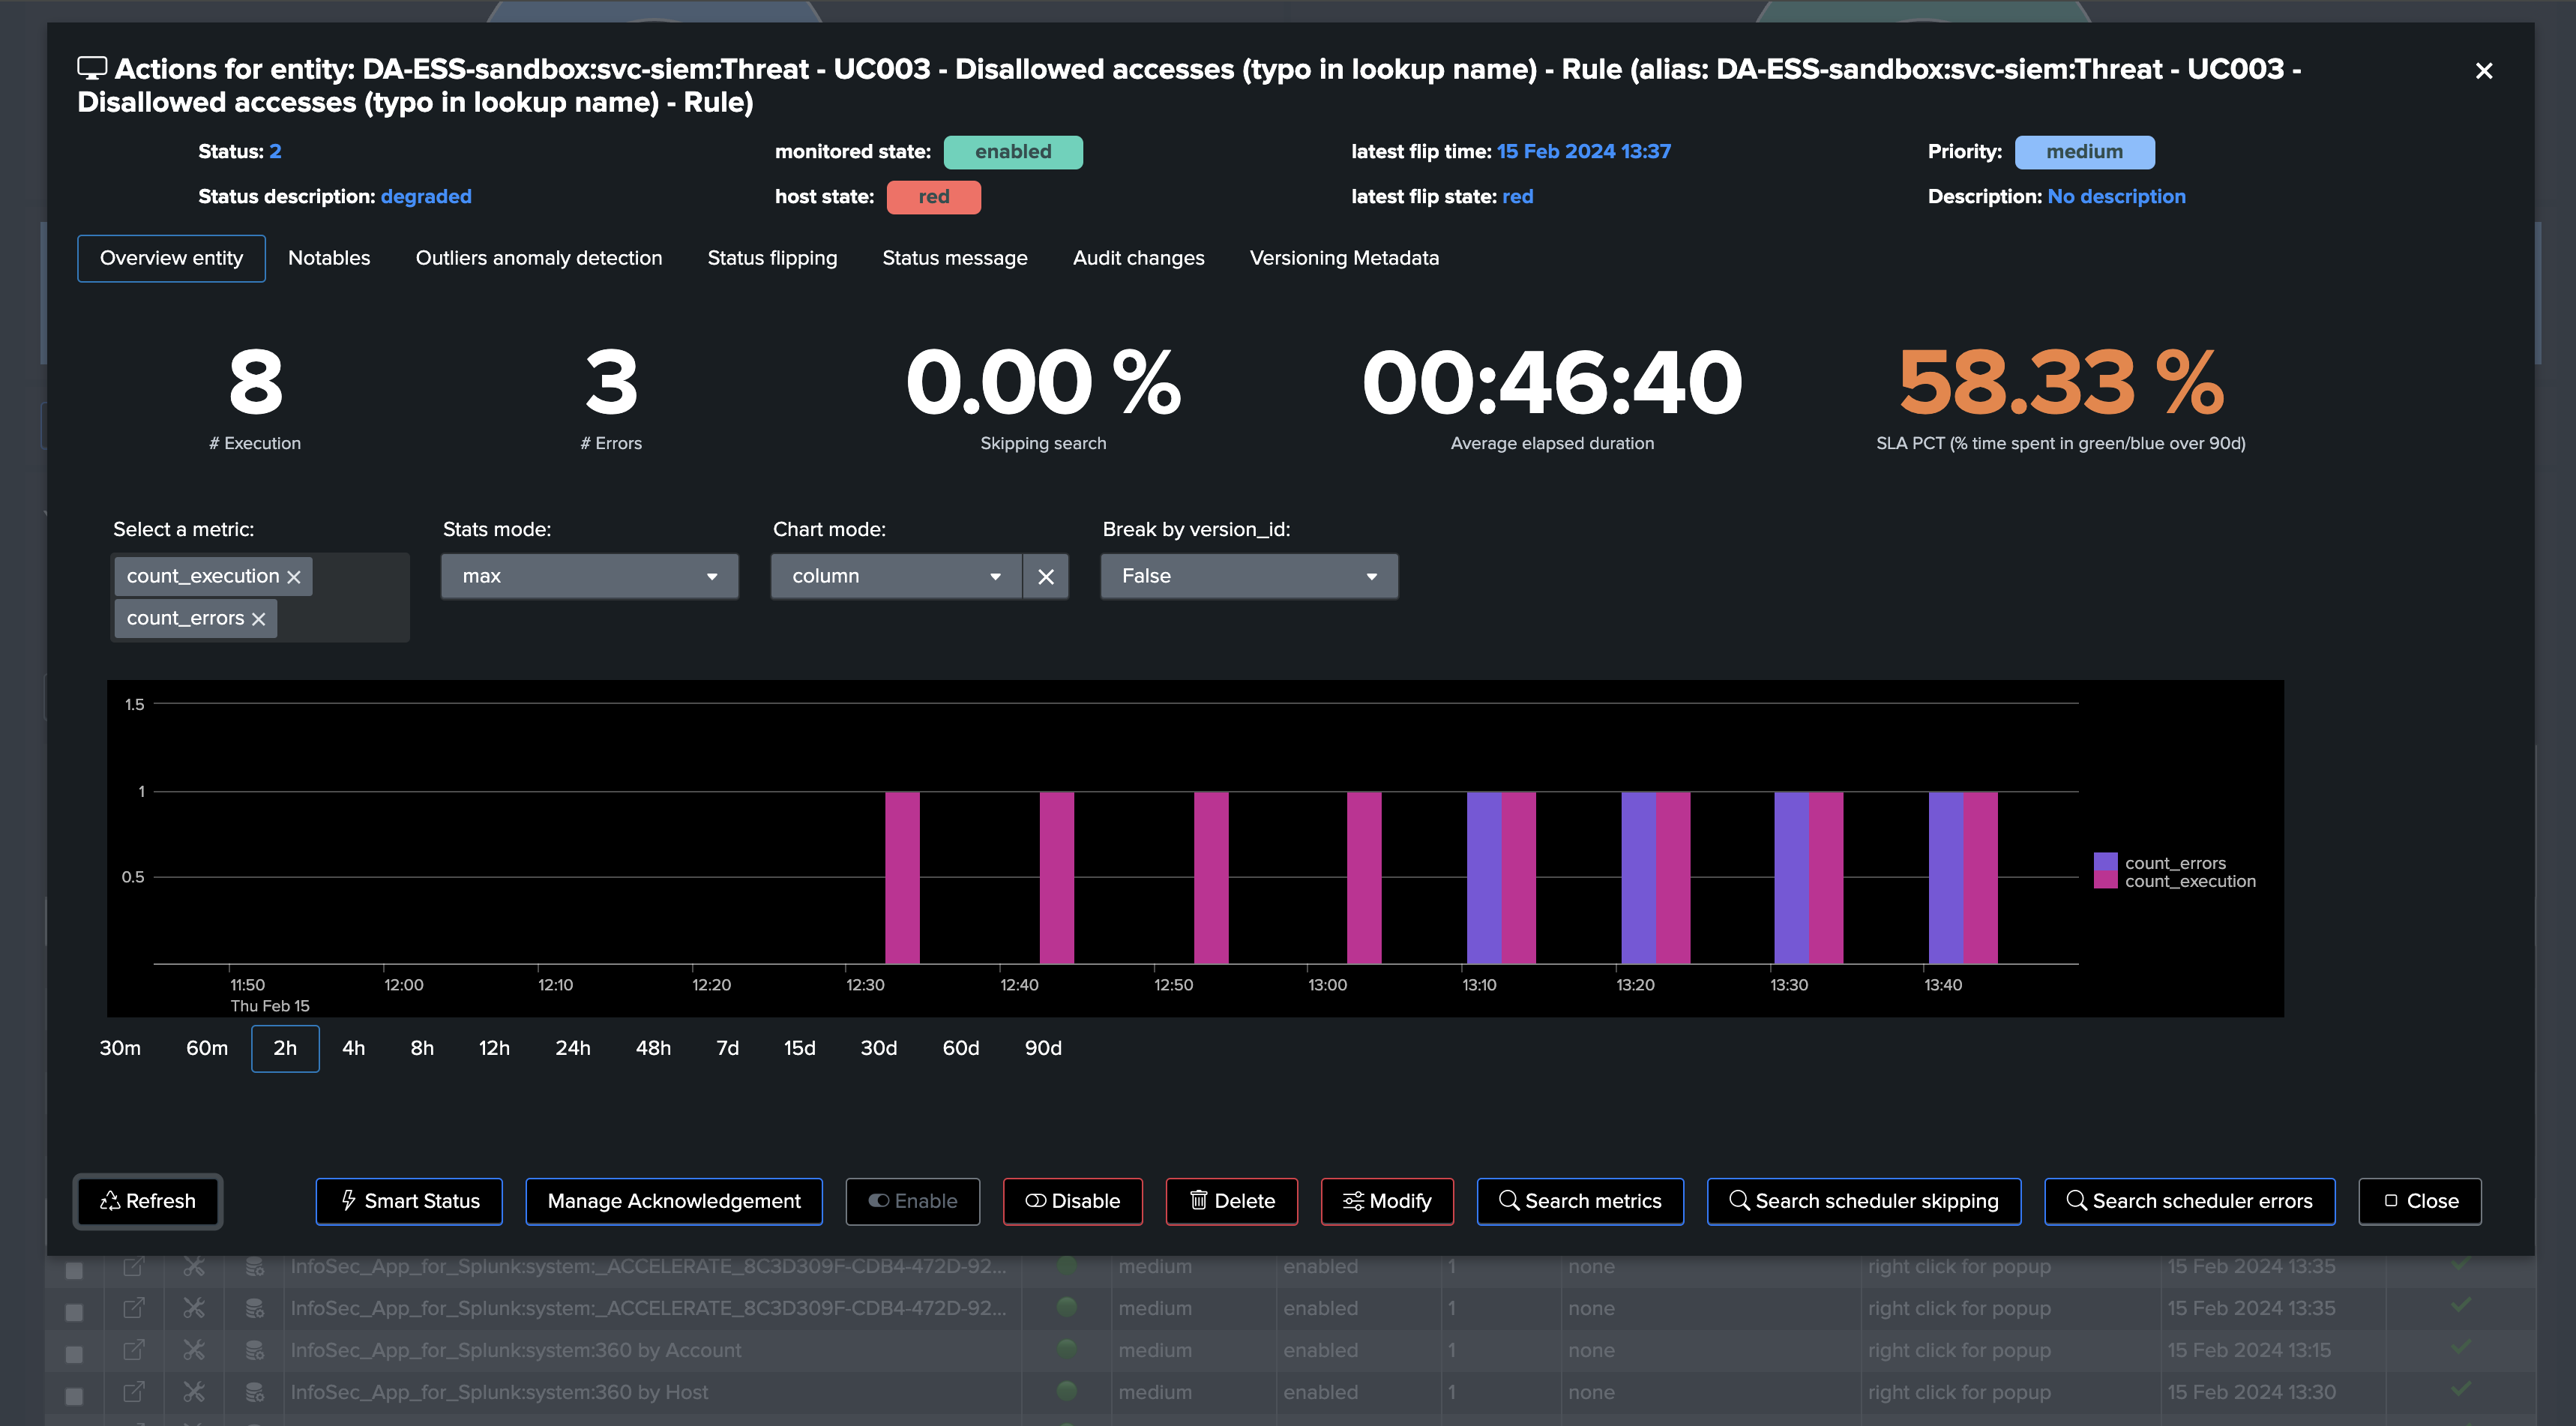
Looking at the version tab, you can see the changes made to the search, and when these were made:
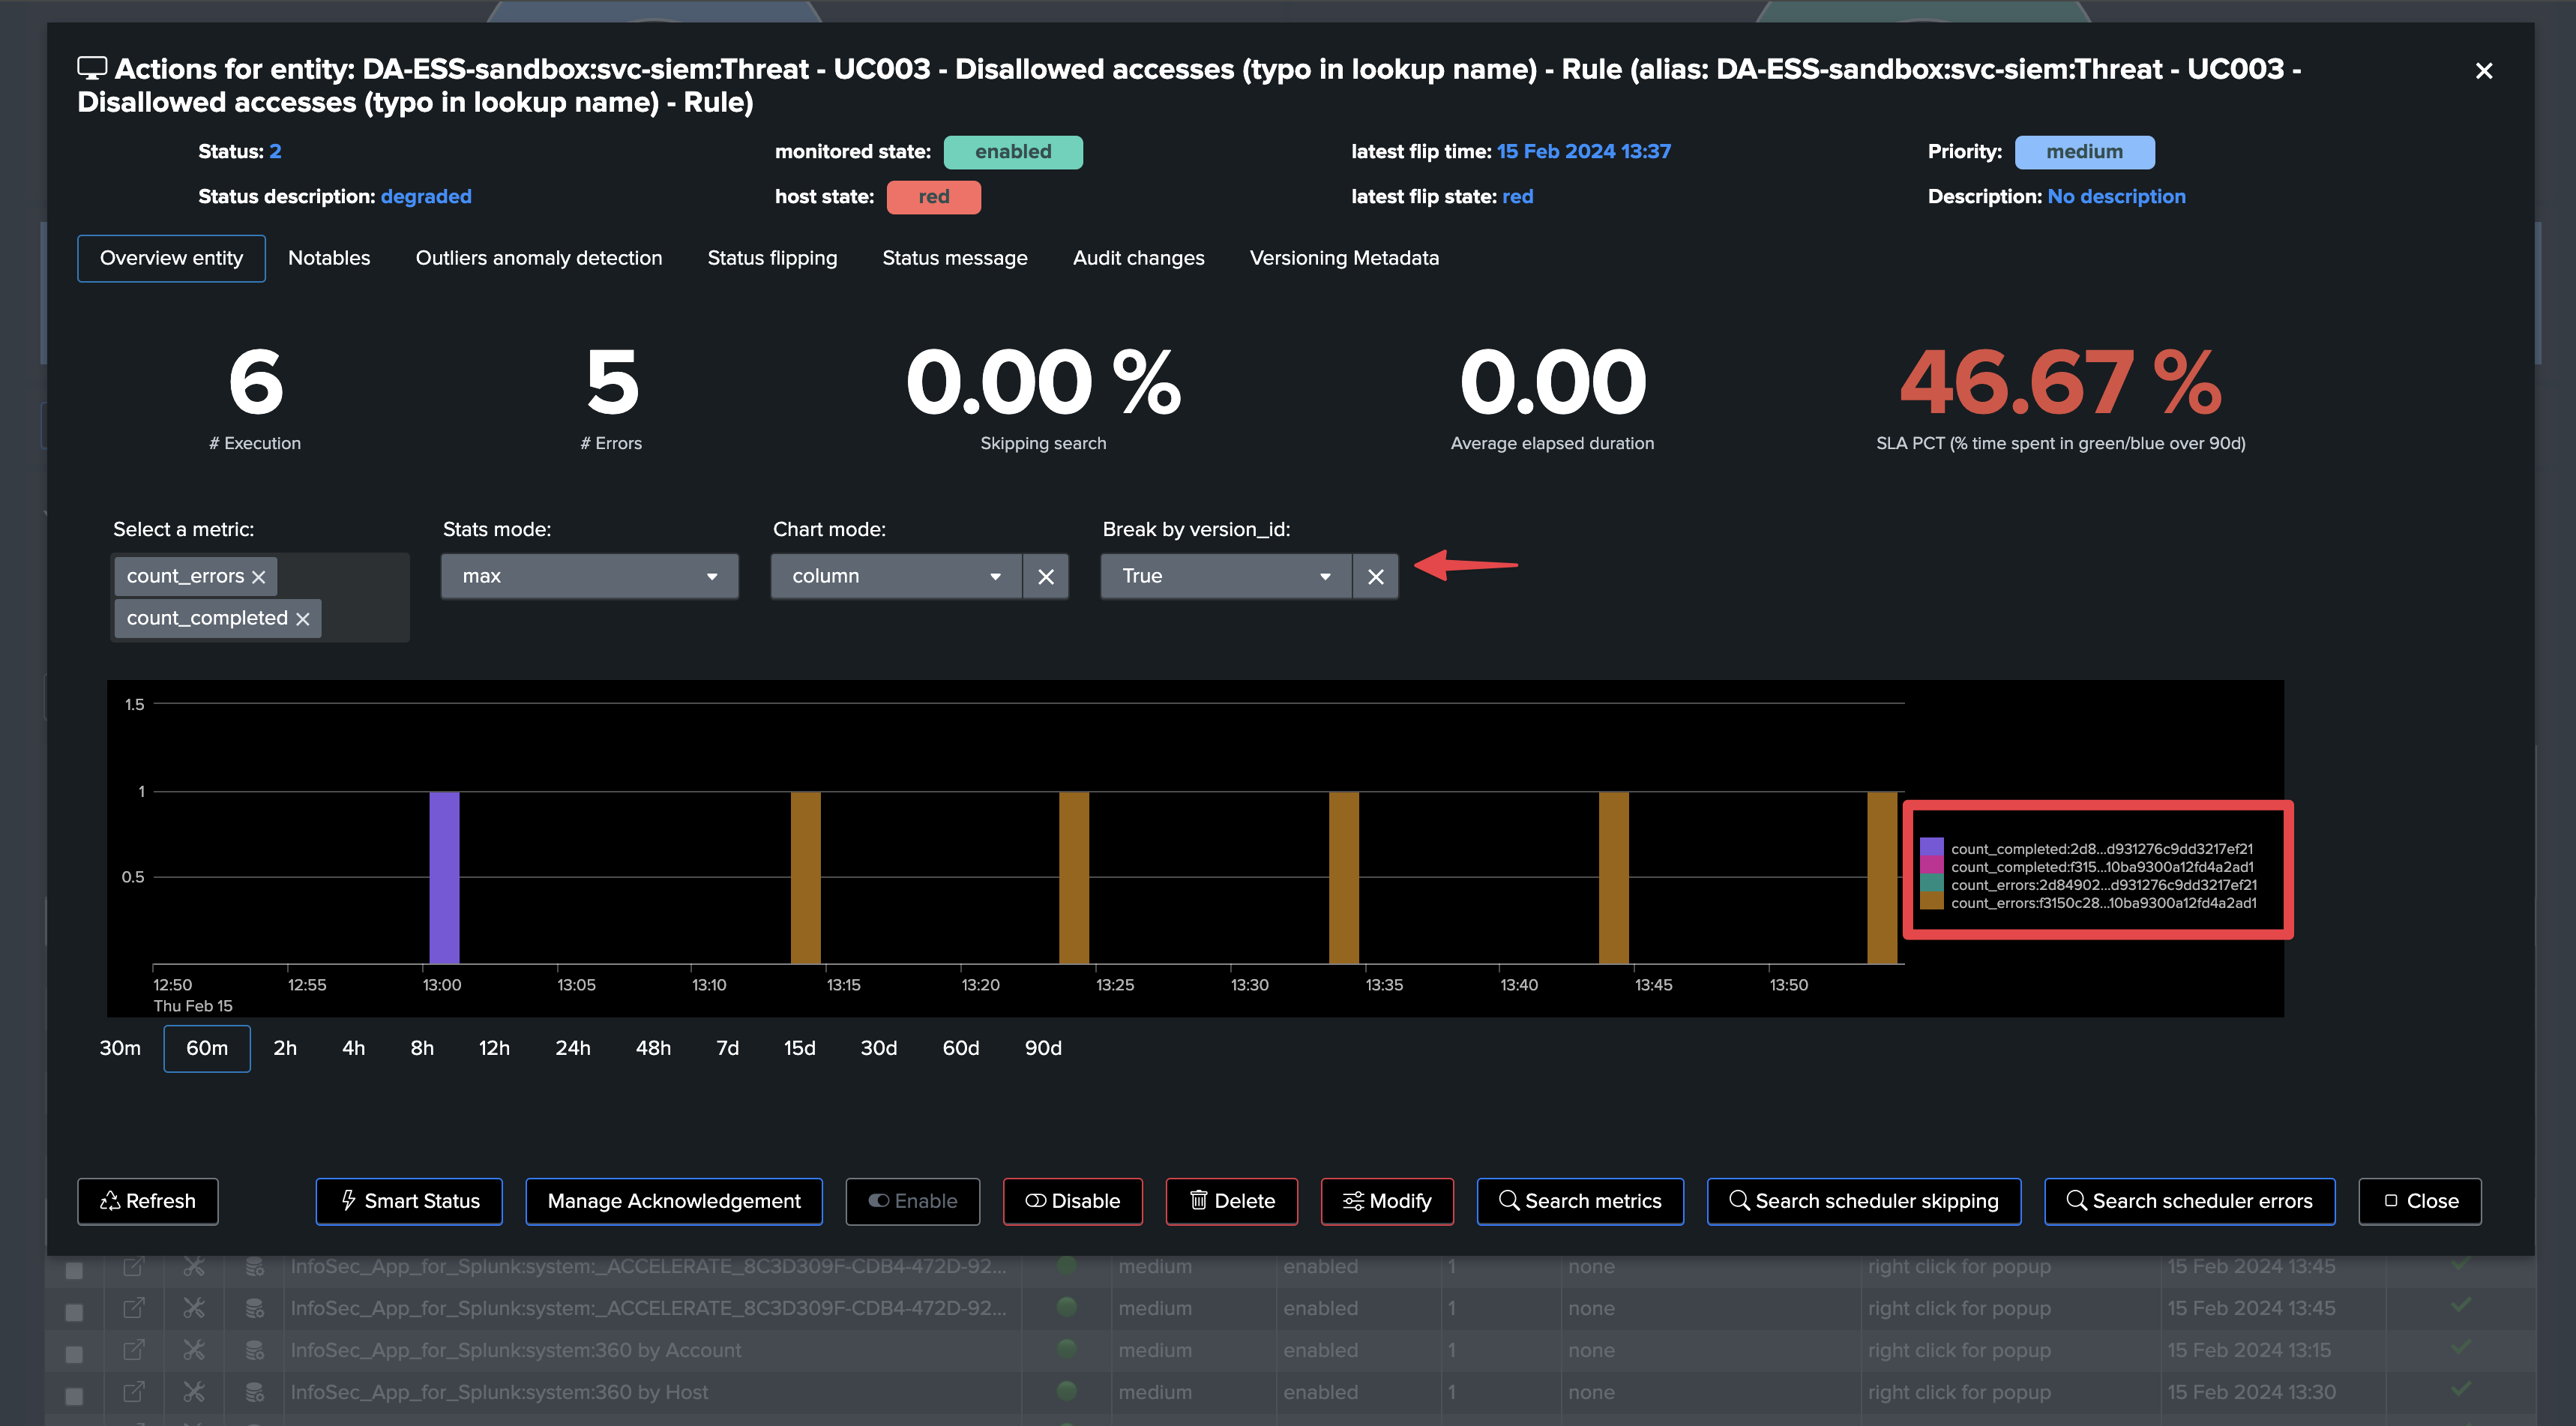
From the metrics perspective, we break by the version_id and identify when the change was made and how this impacted the search behavior:
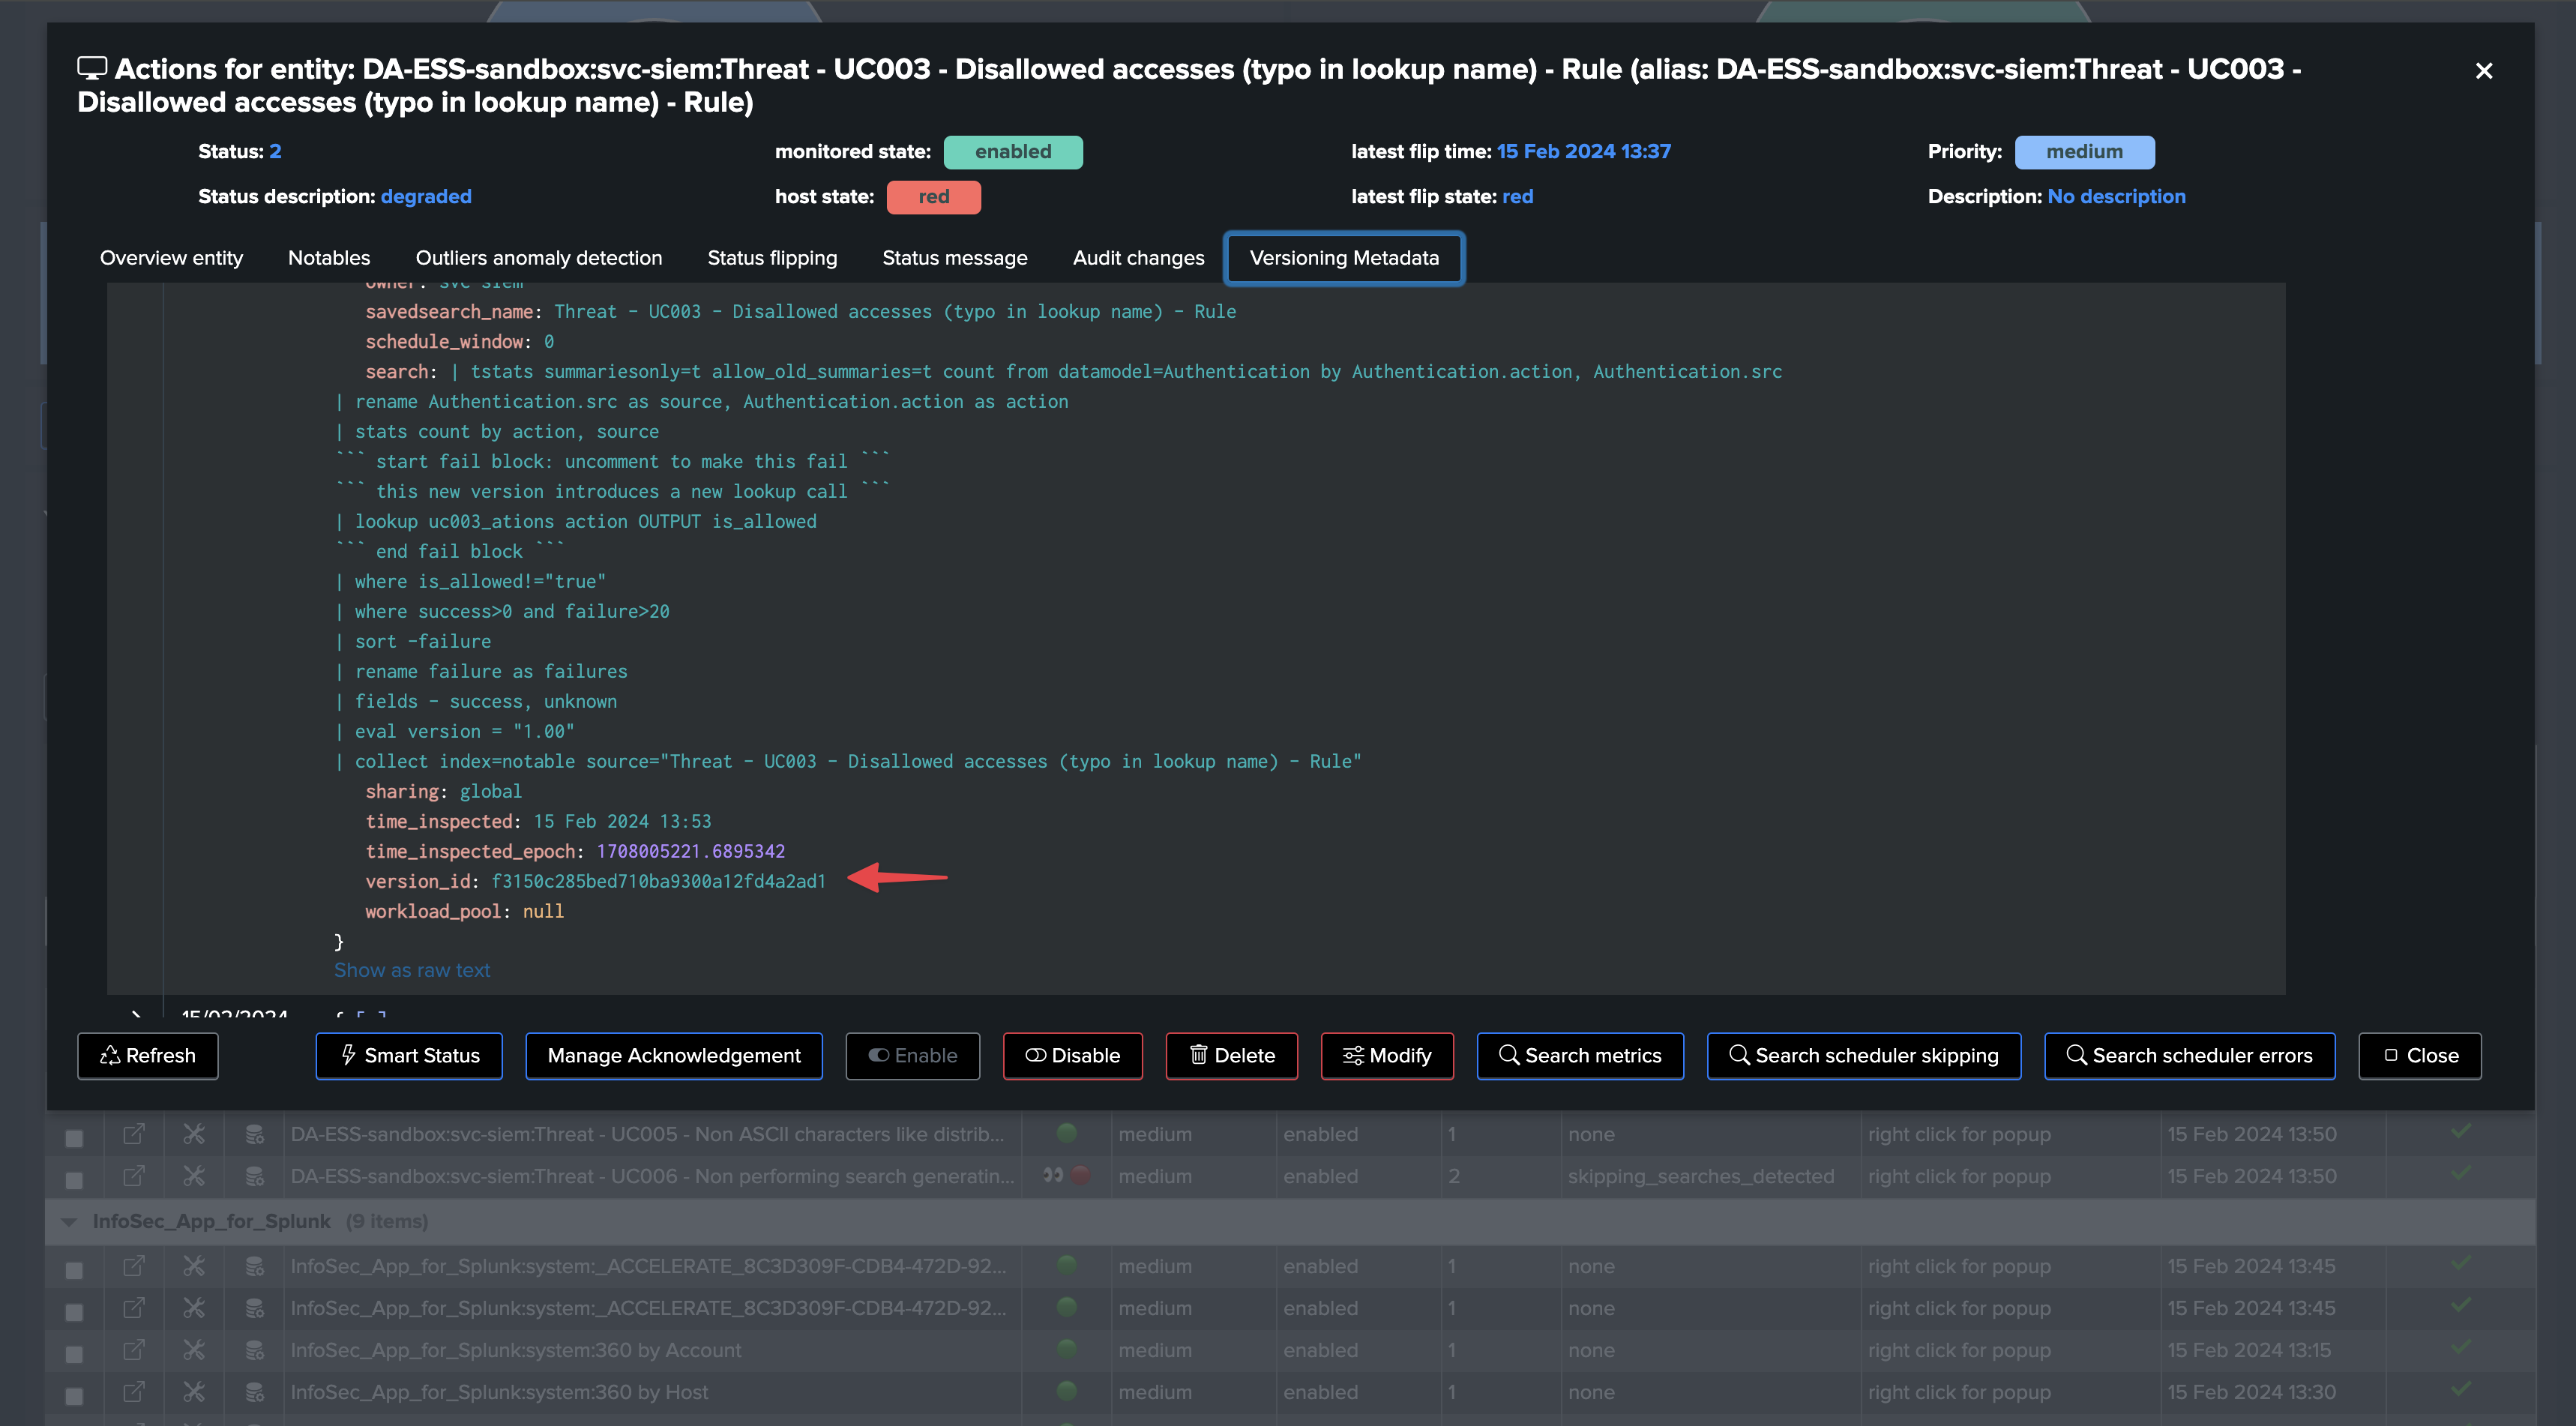
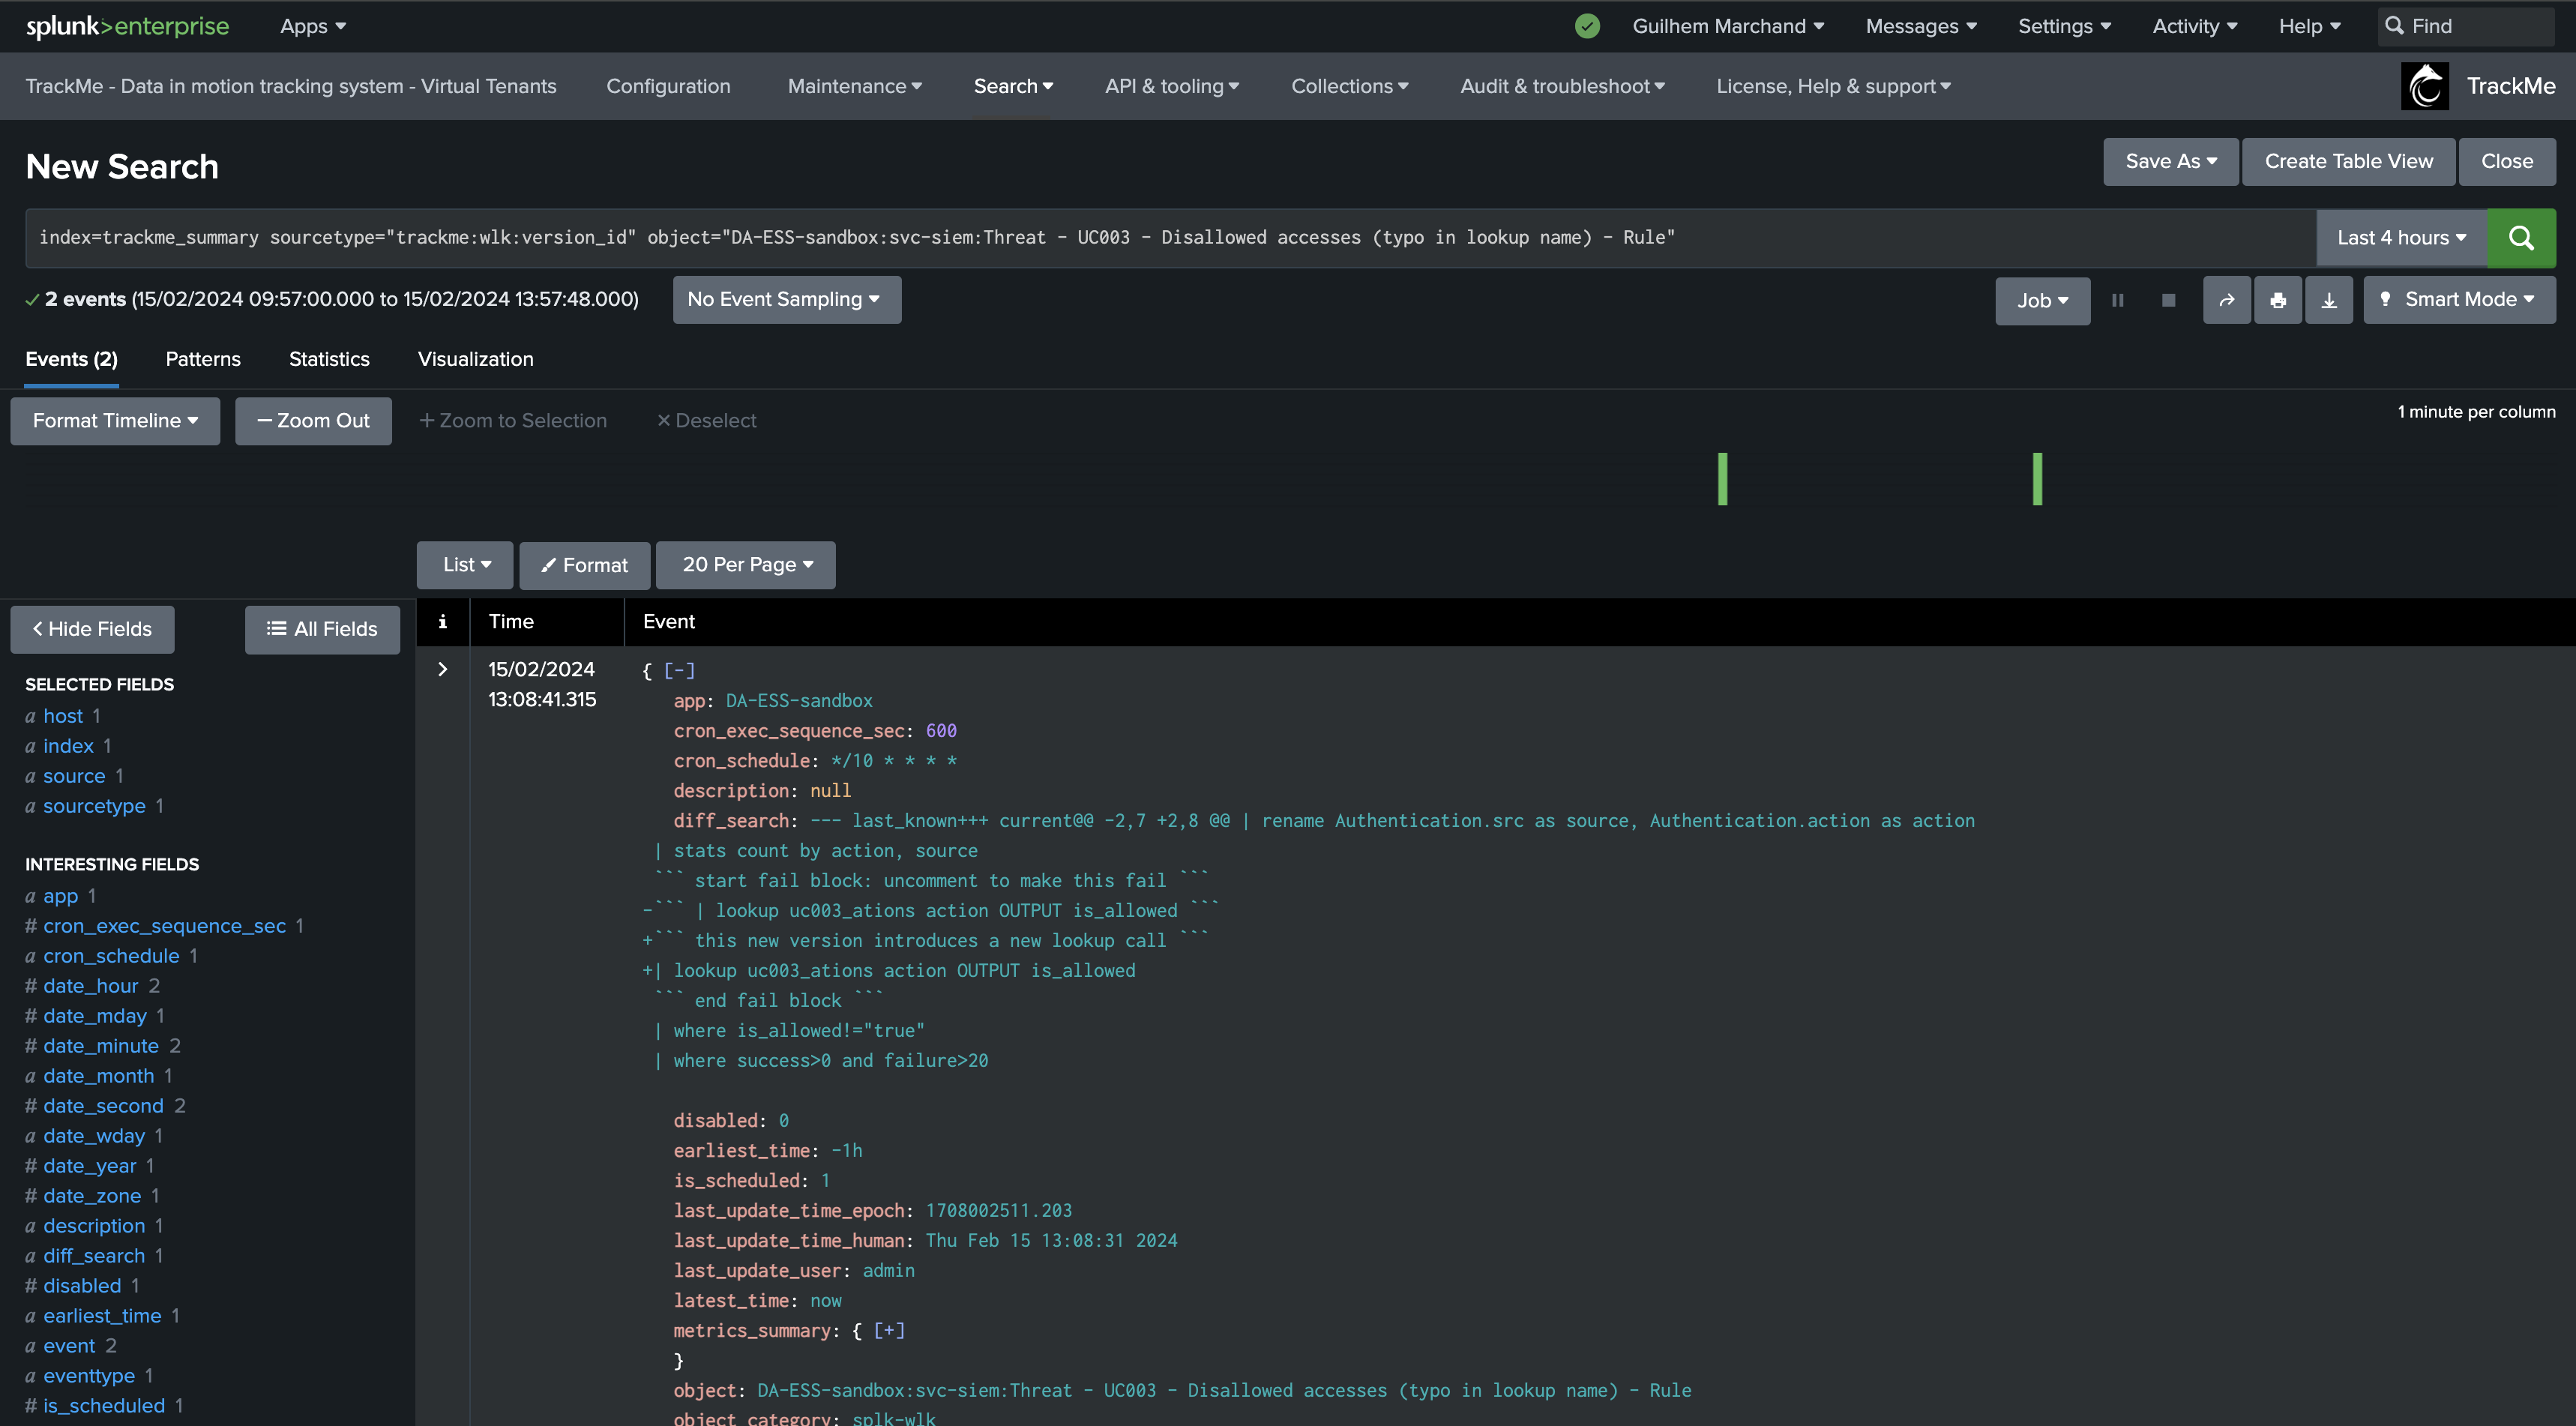
You can also look at the corresponding versioning events:
index=trackme_summary sourcetype="trackme:wlk:version_id" object=*
Use case: Detect delayed searches
By monitoring scheduled searches, TrackMe also detects if a search has stopped being executed
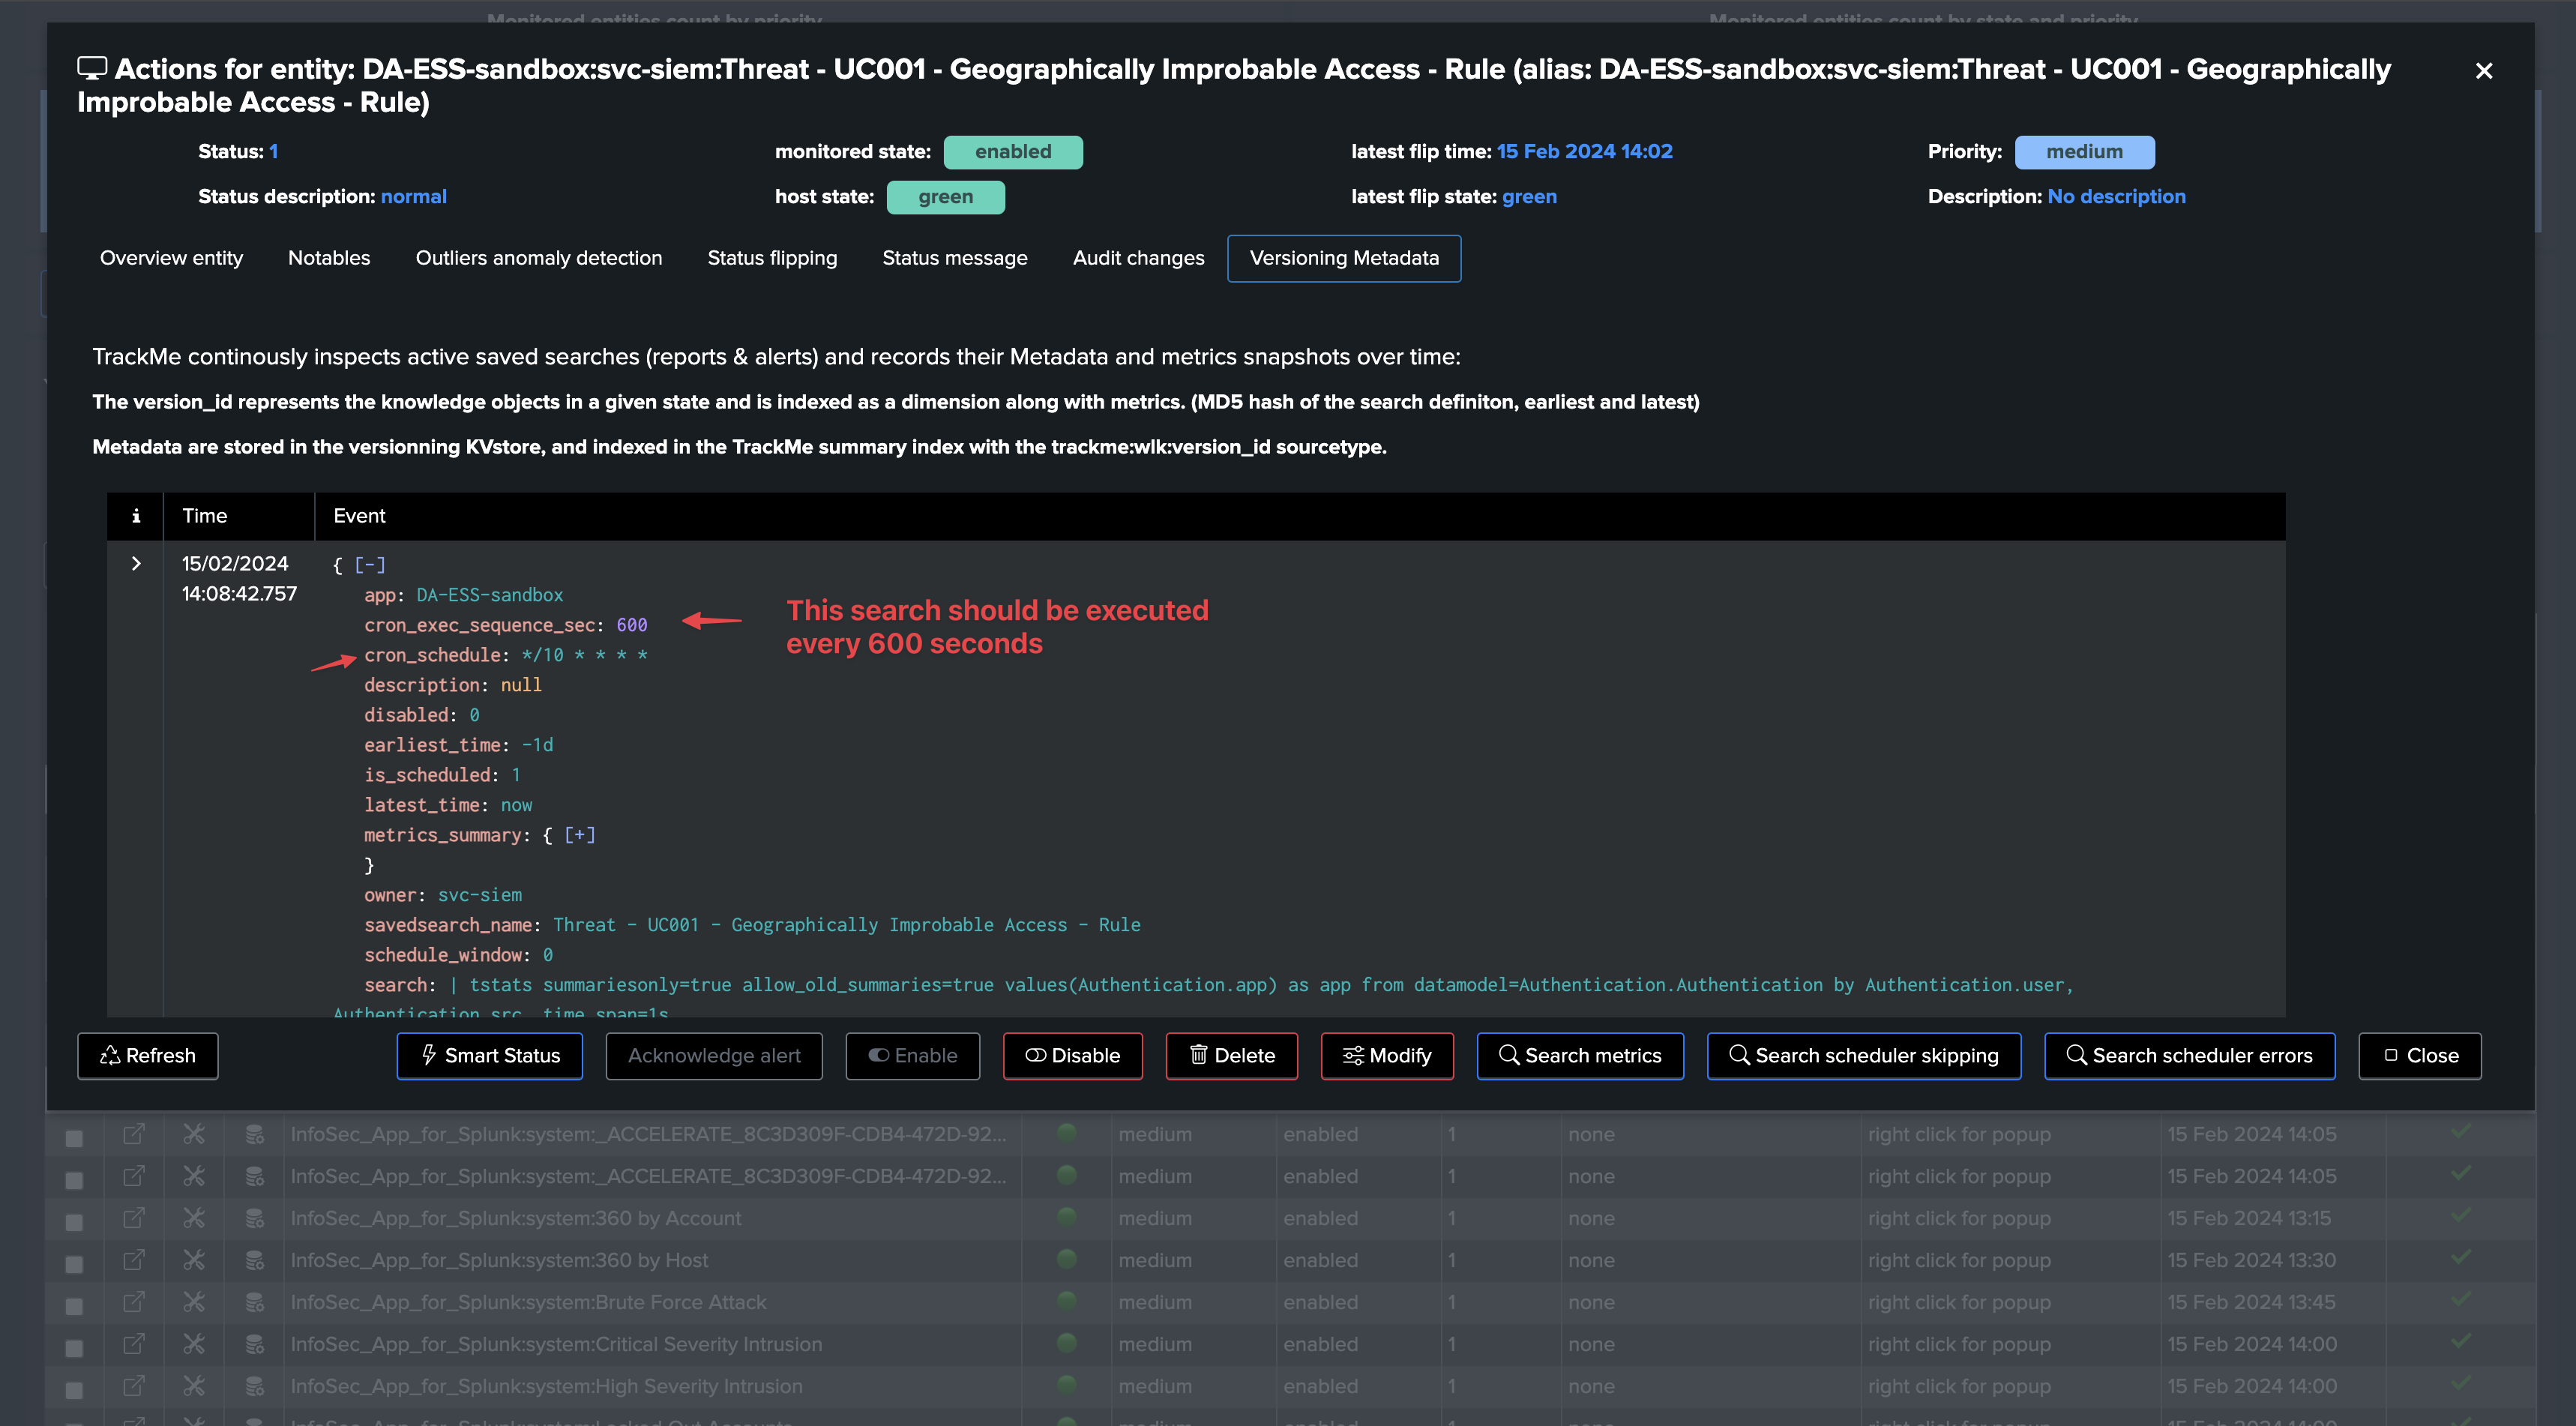
Using its versioning capabilities, TrackMe interprets the cron schedule and defines the
cron_exec_sequence_sec(using the Python library croniter).This value in seconds represents the time expected between two executions of the search.
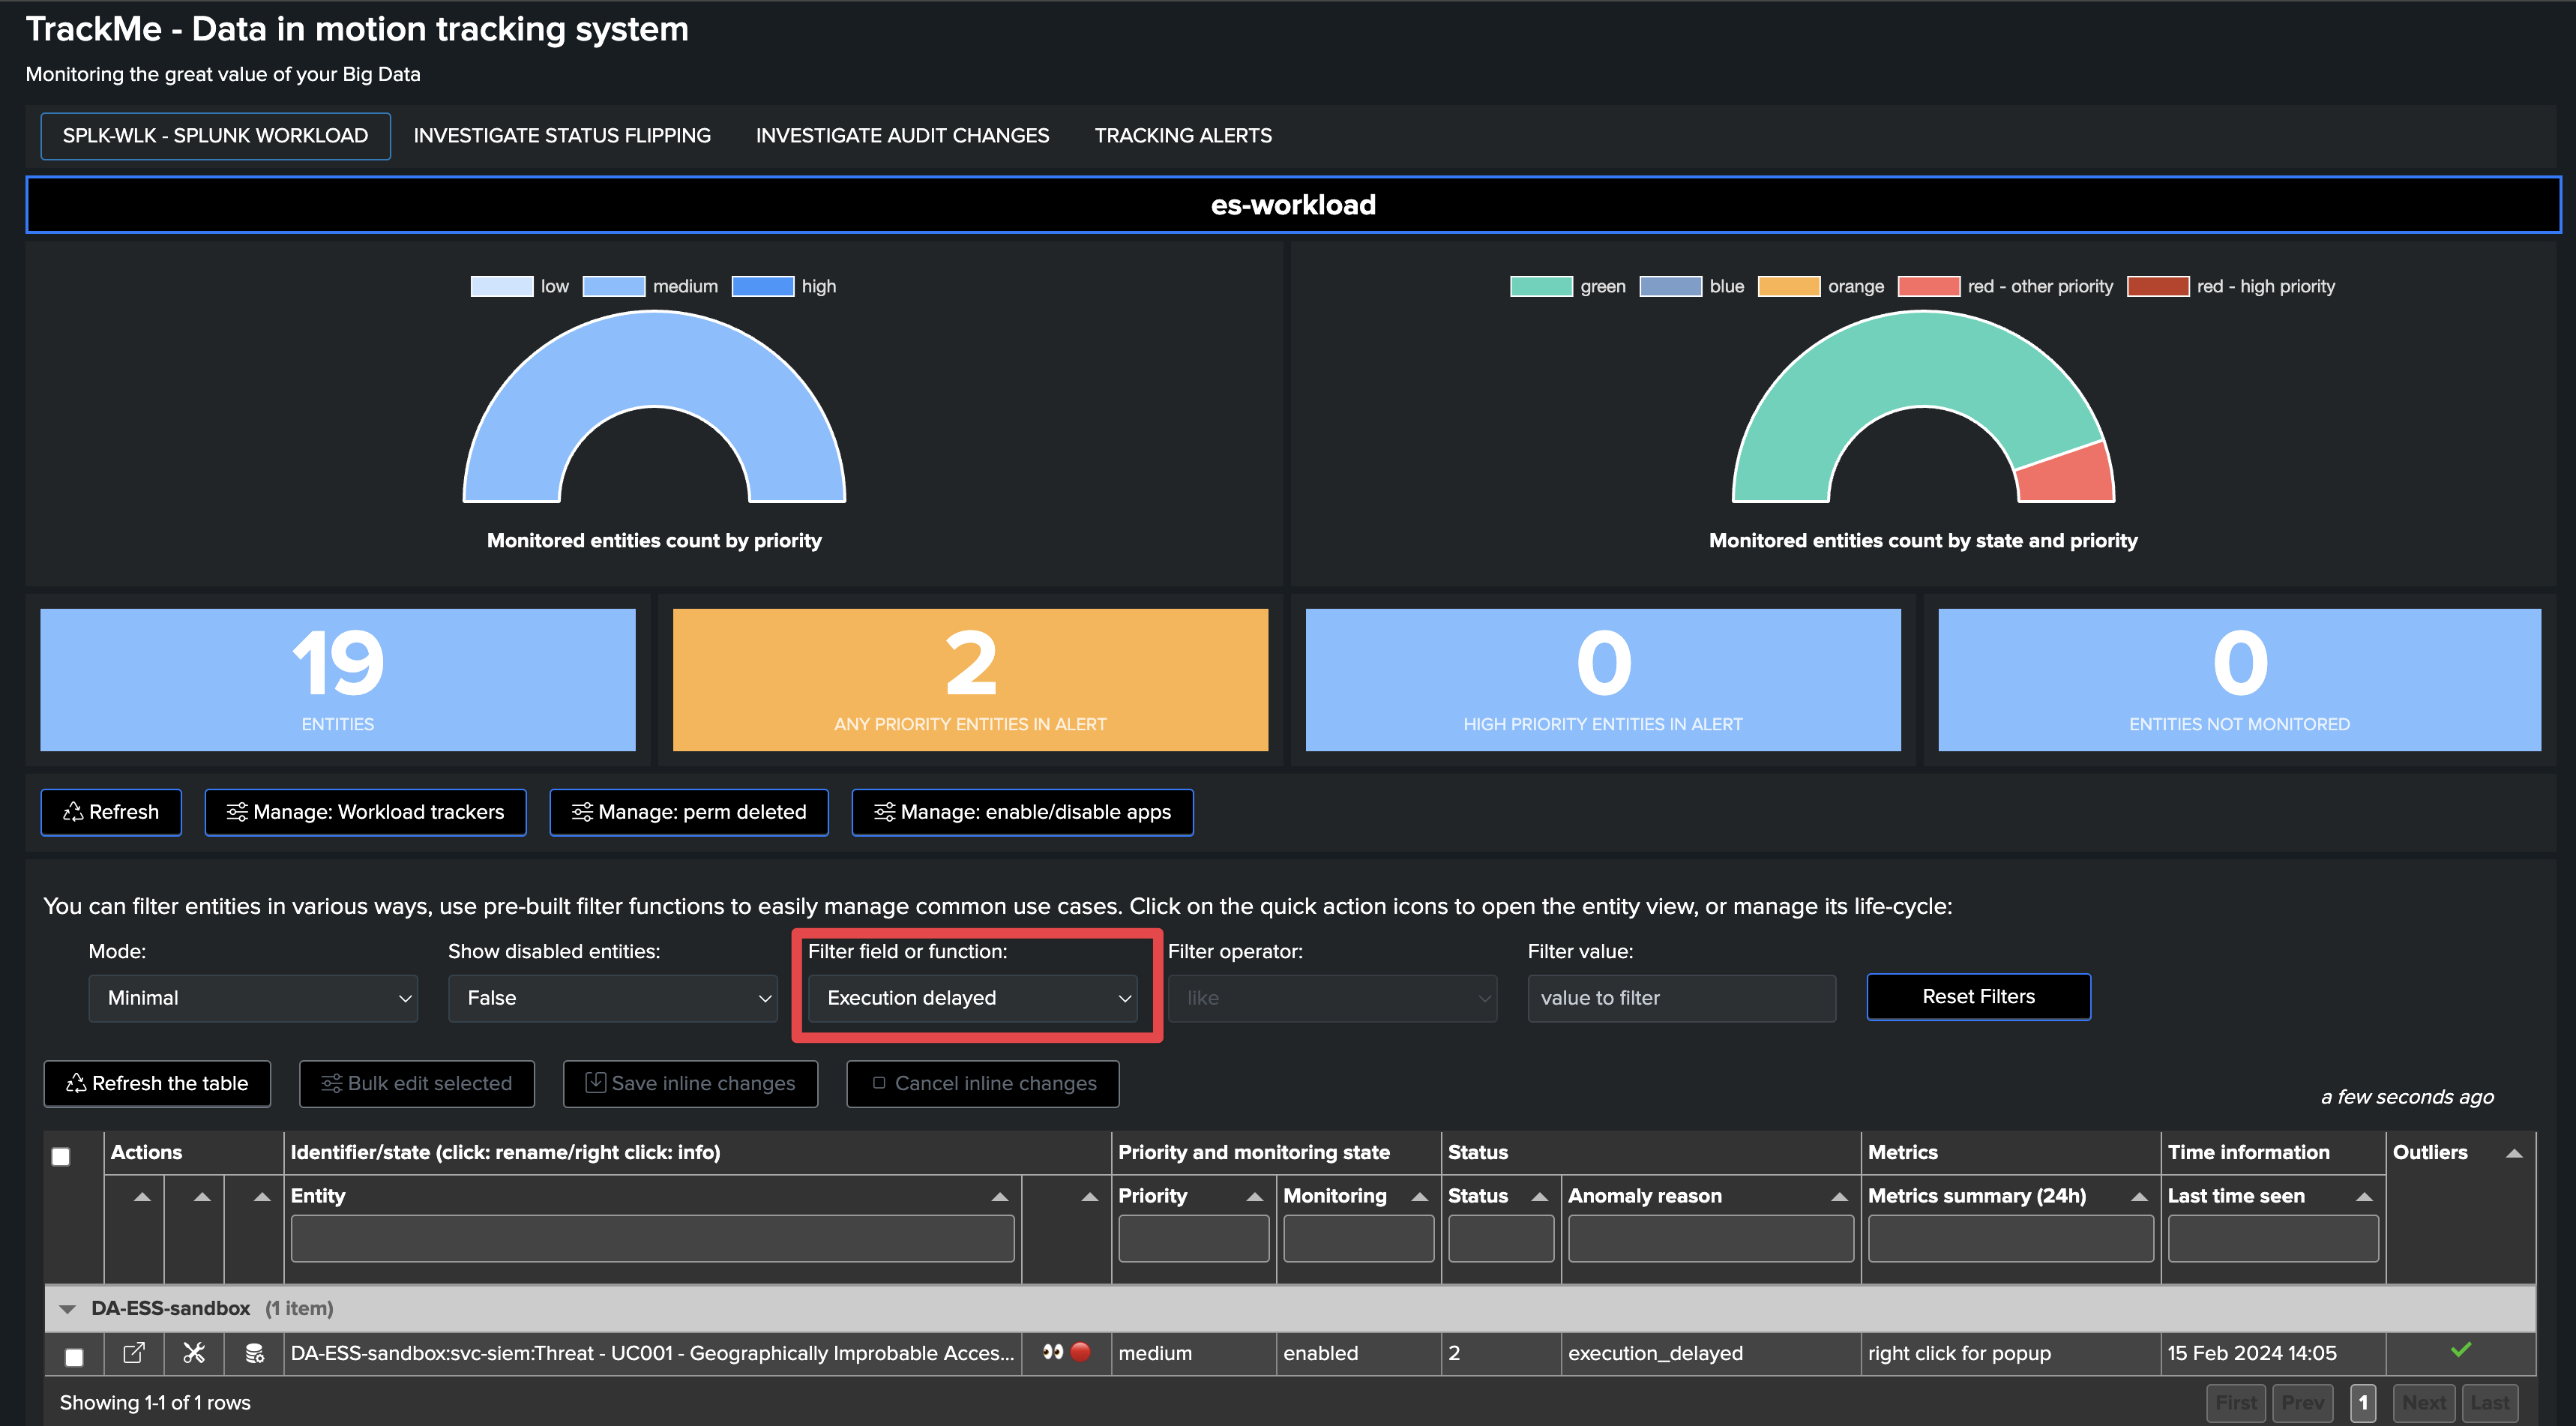
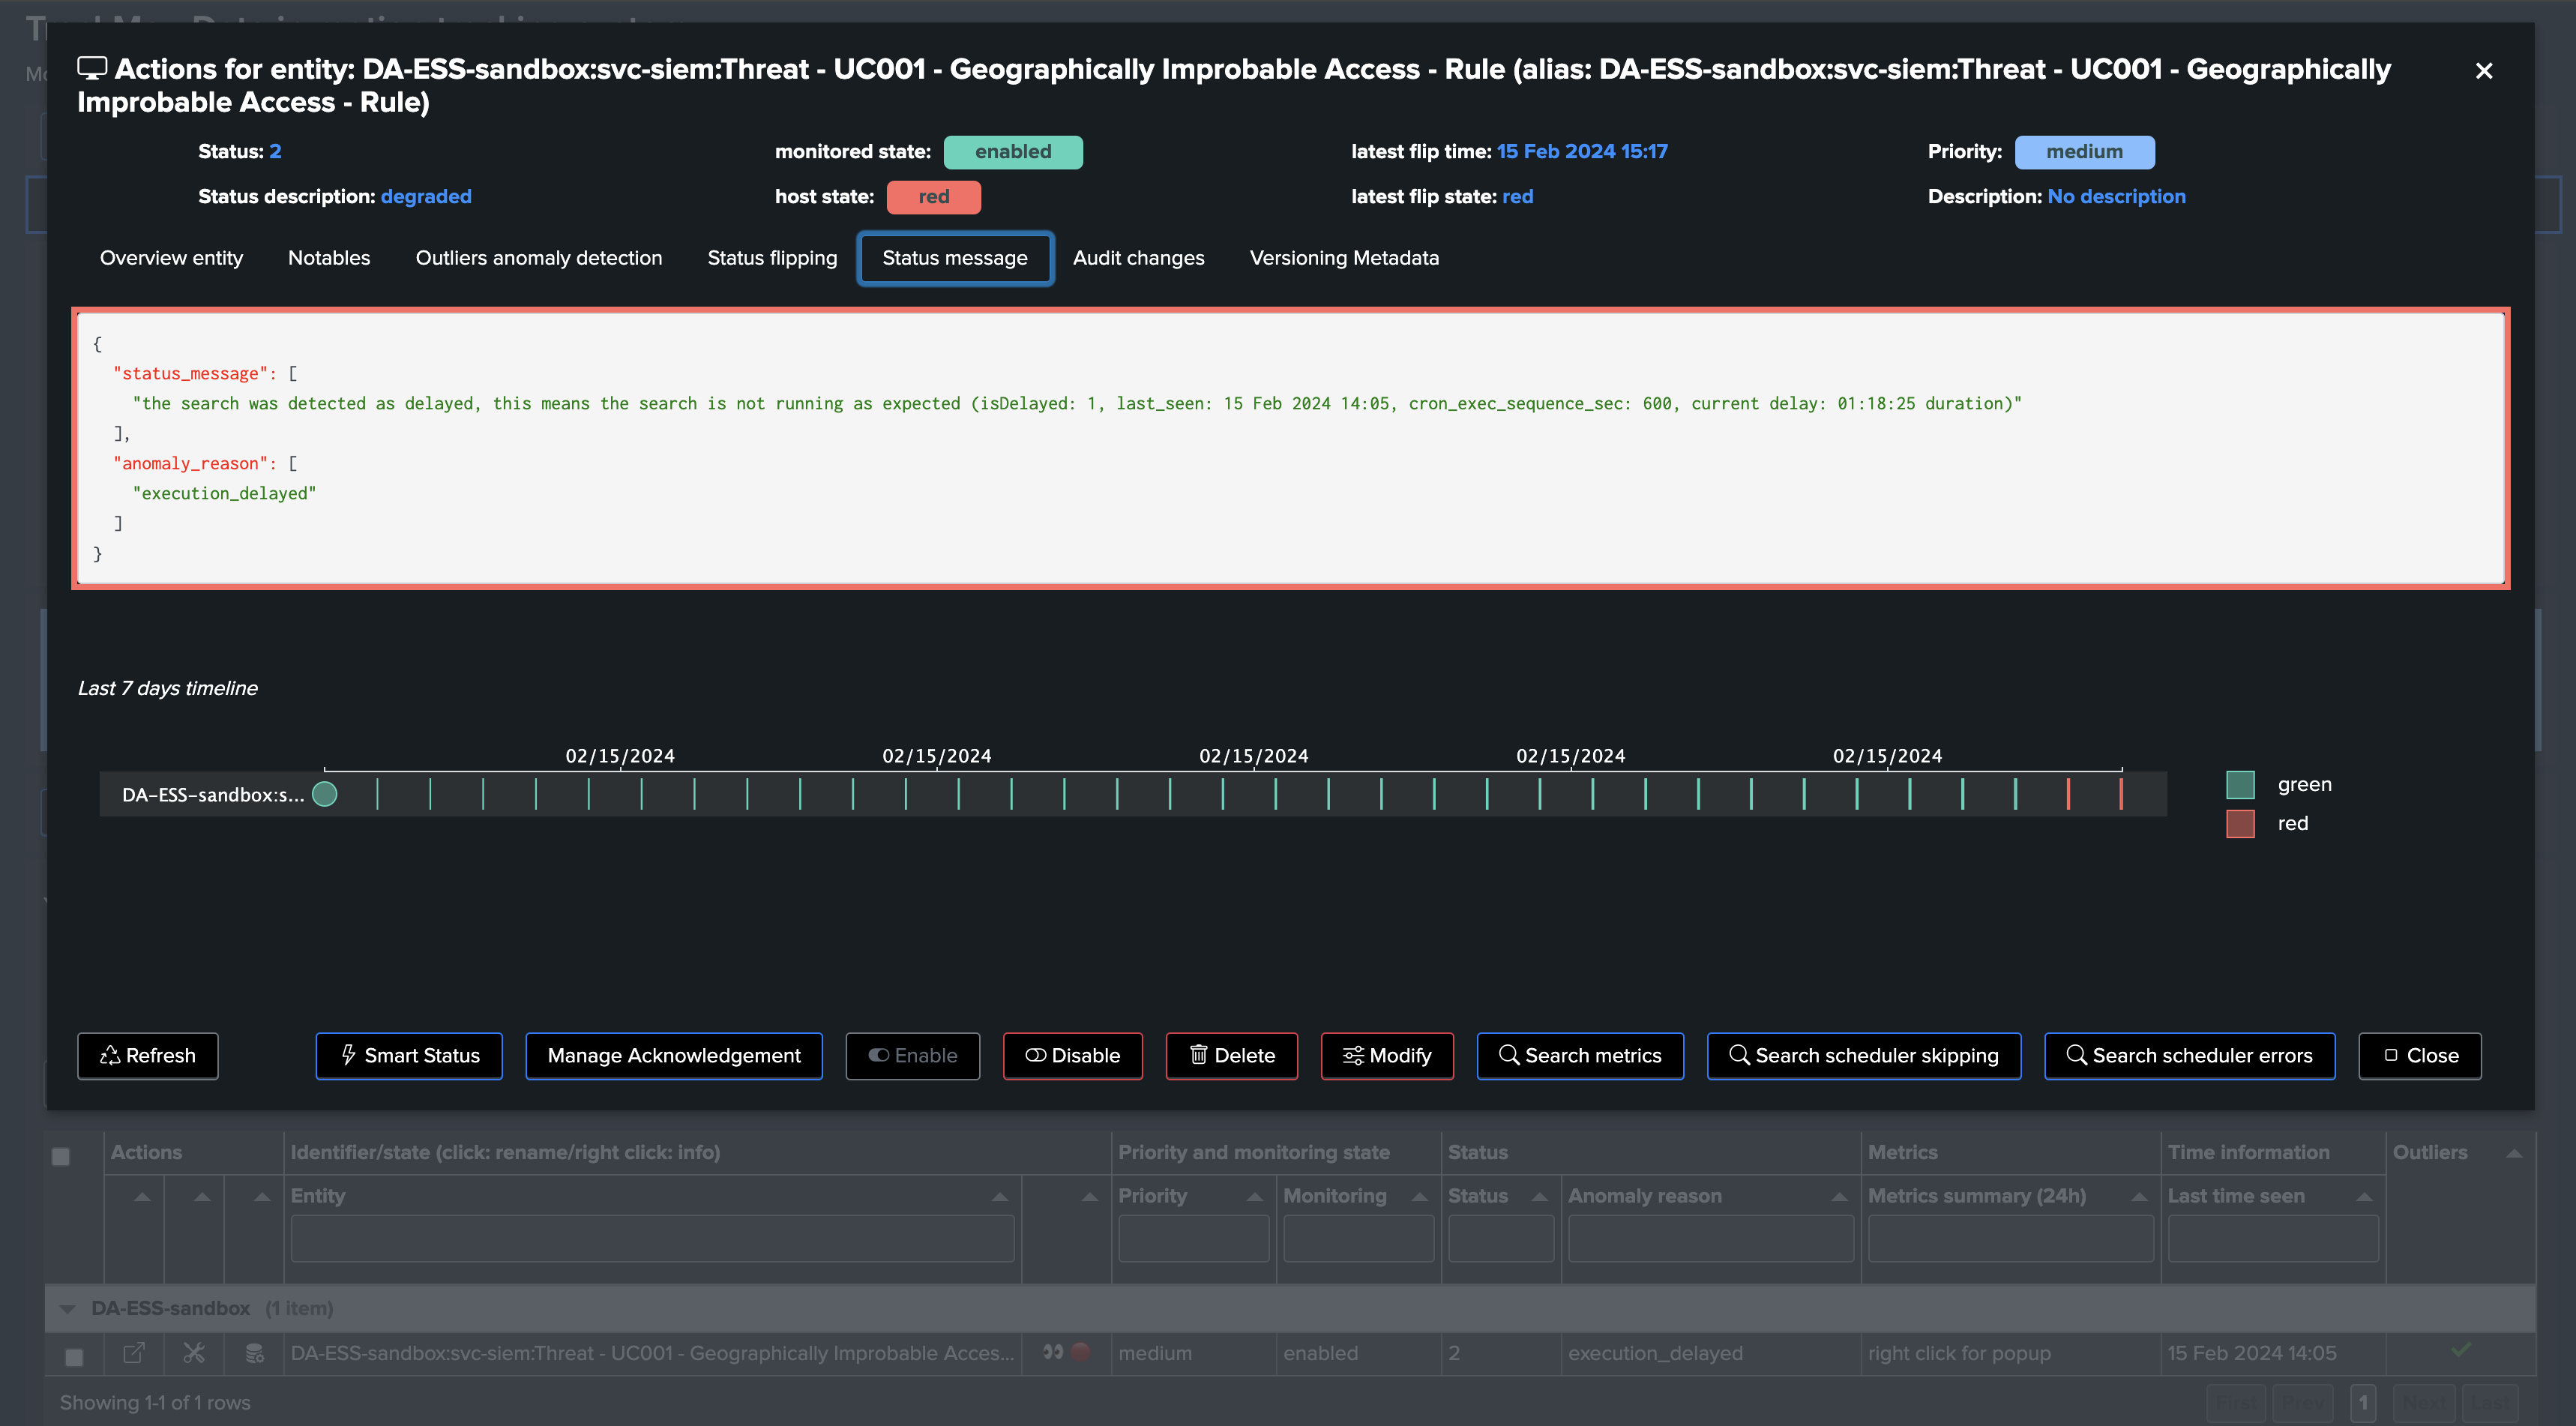
If a search that was discovered suddenly stops being executed, TrackMe will detect it and tag the entity as delayed.
TrackMe applies a 60-minute delay grace time before impacting the entity.
This is a vital verification, especially for SIEM environments. Being capable of detecting use cases that are not executed anymore is very important and should lead to the investigation of the issue.
In the versioning tab, you can see the cron_schedule as well as the cron_exec_sequence_sec:
TrackMe detects that the search has stopped being executed, and tags the entity as delayed:
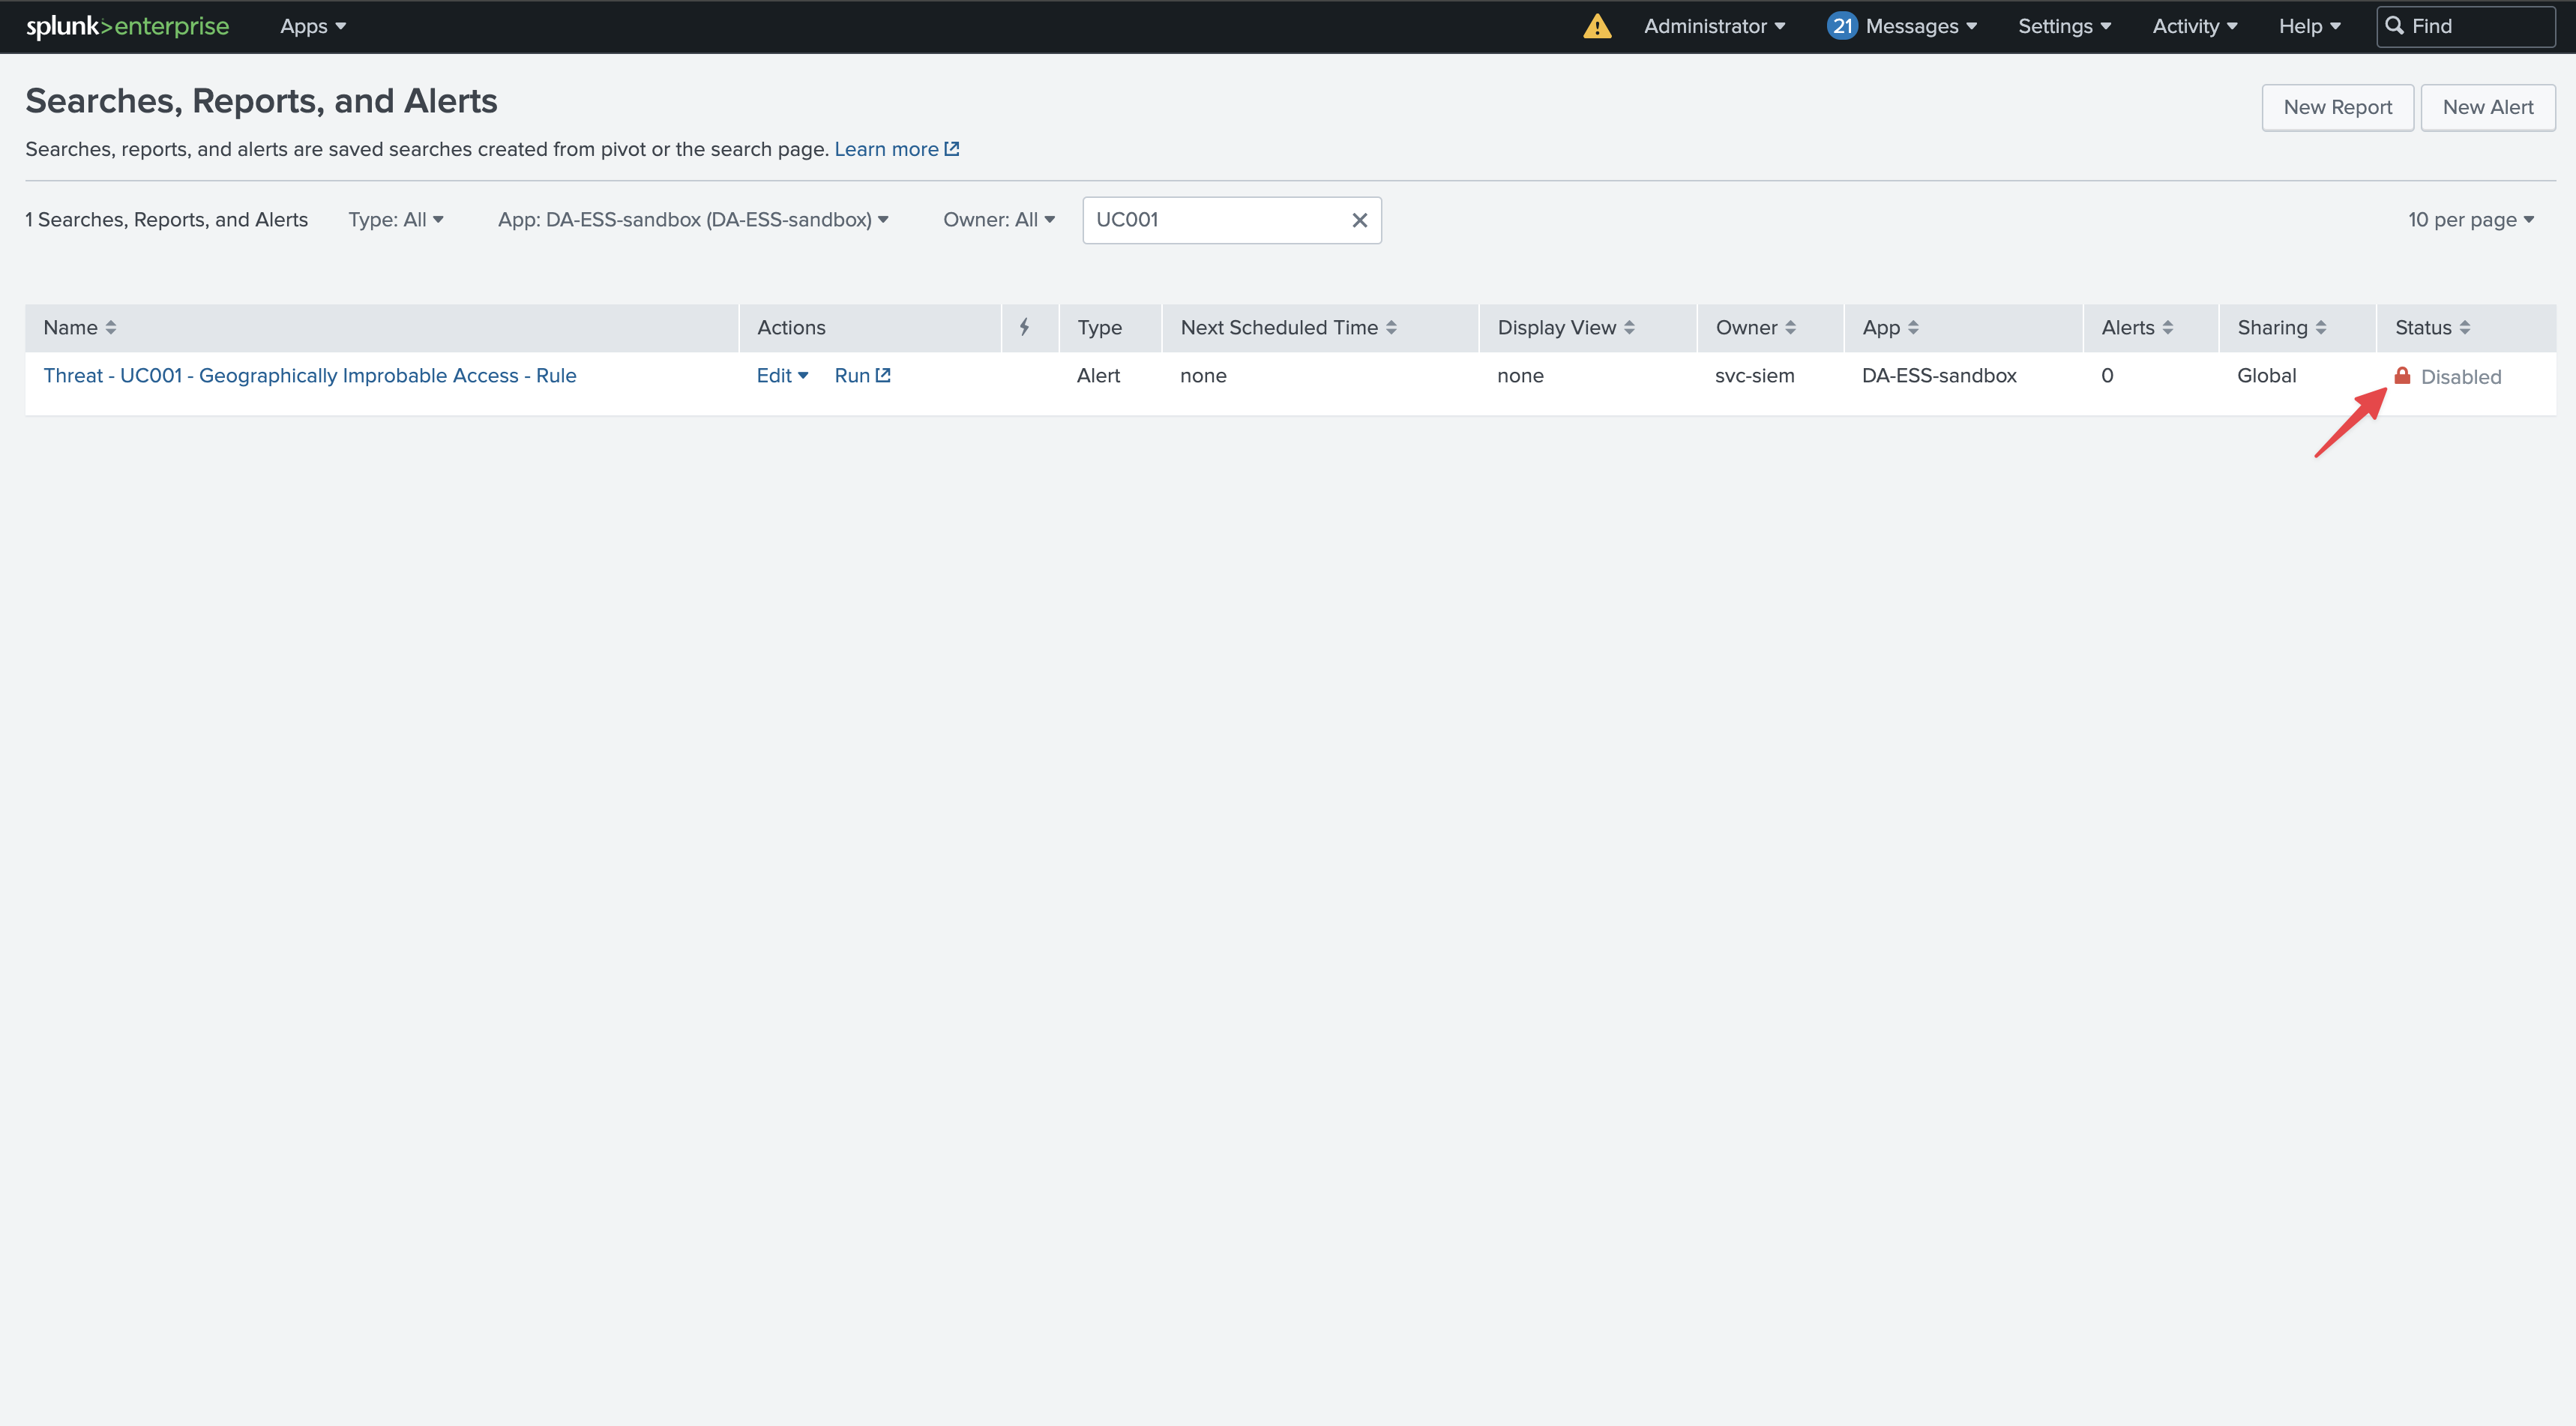
The search was indeed disabled at the Splunk level, which might have been intentional, or not, and should be reviewed:
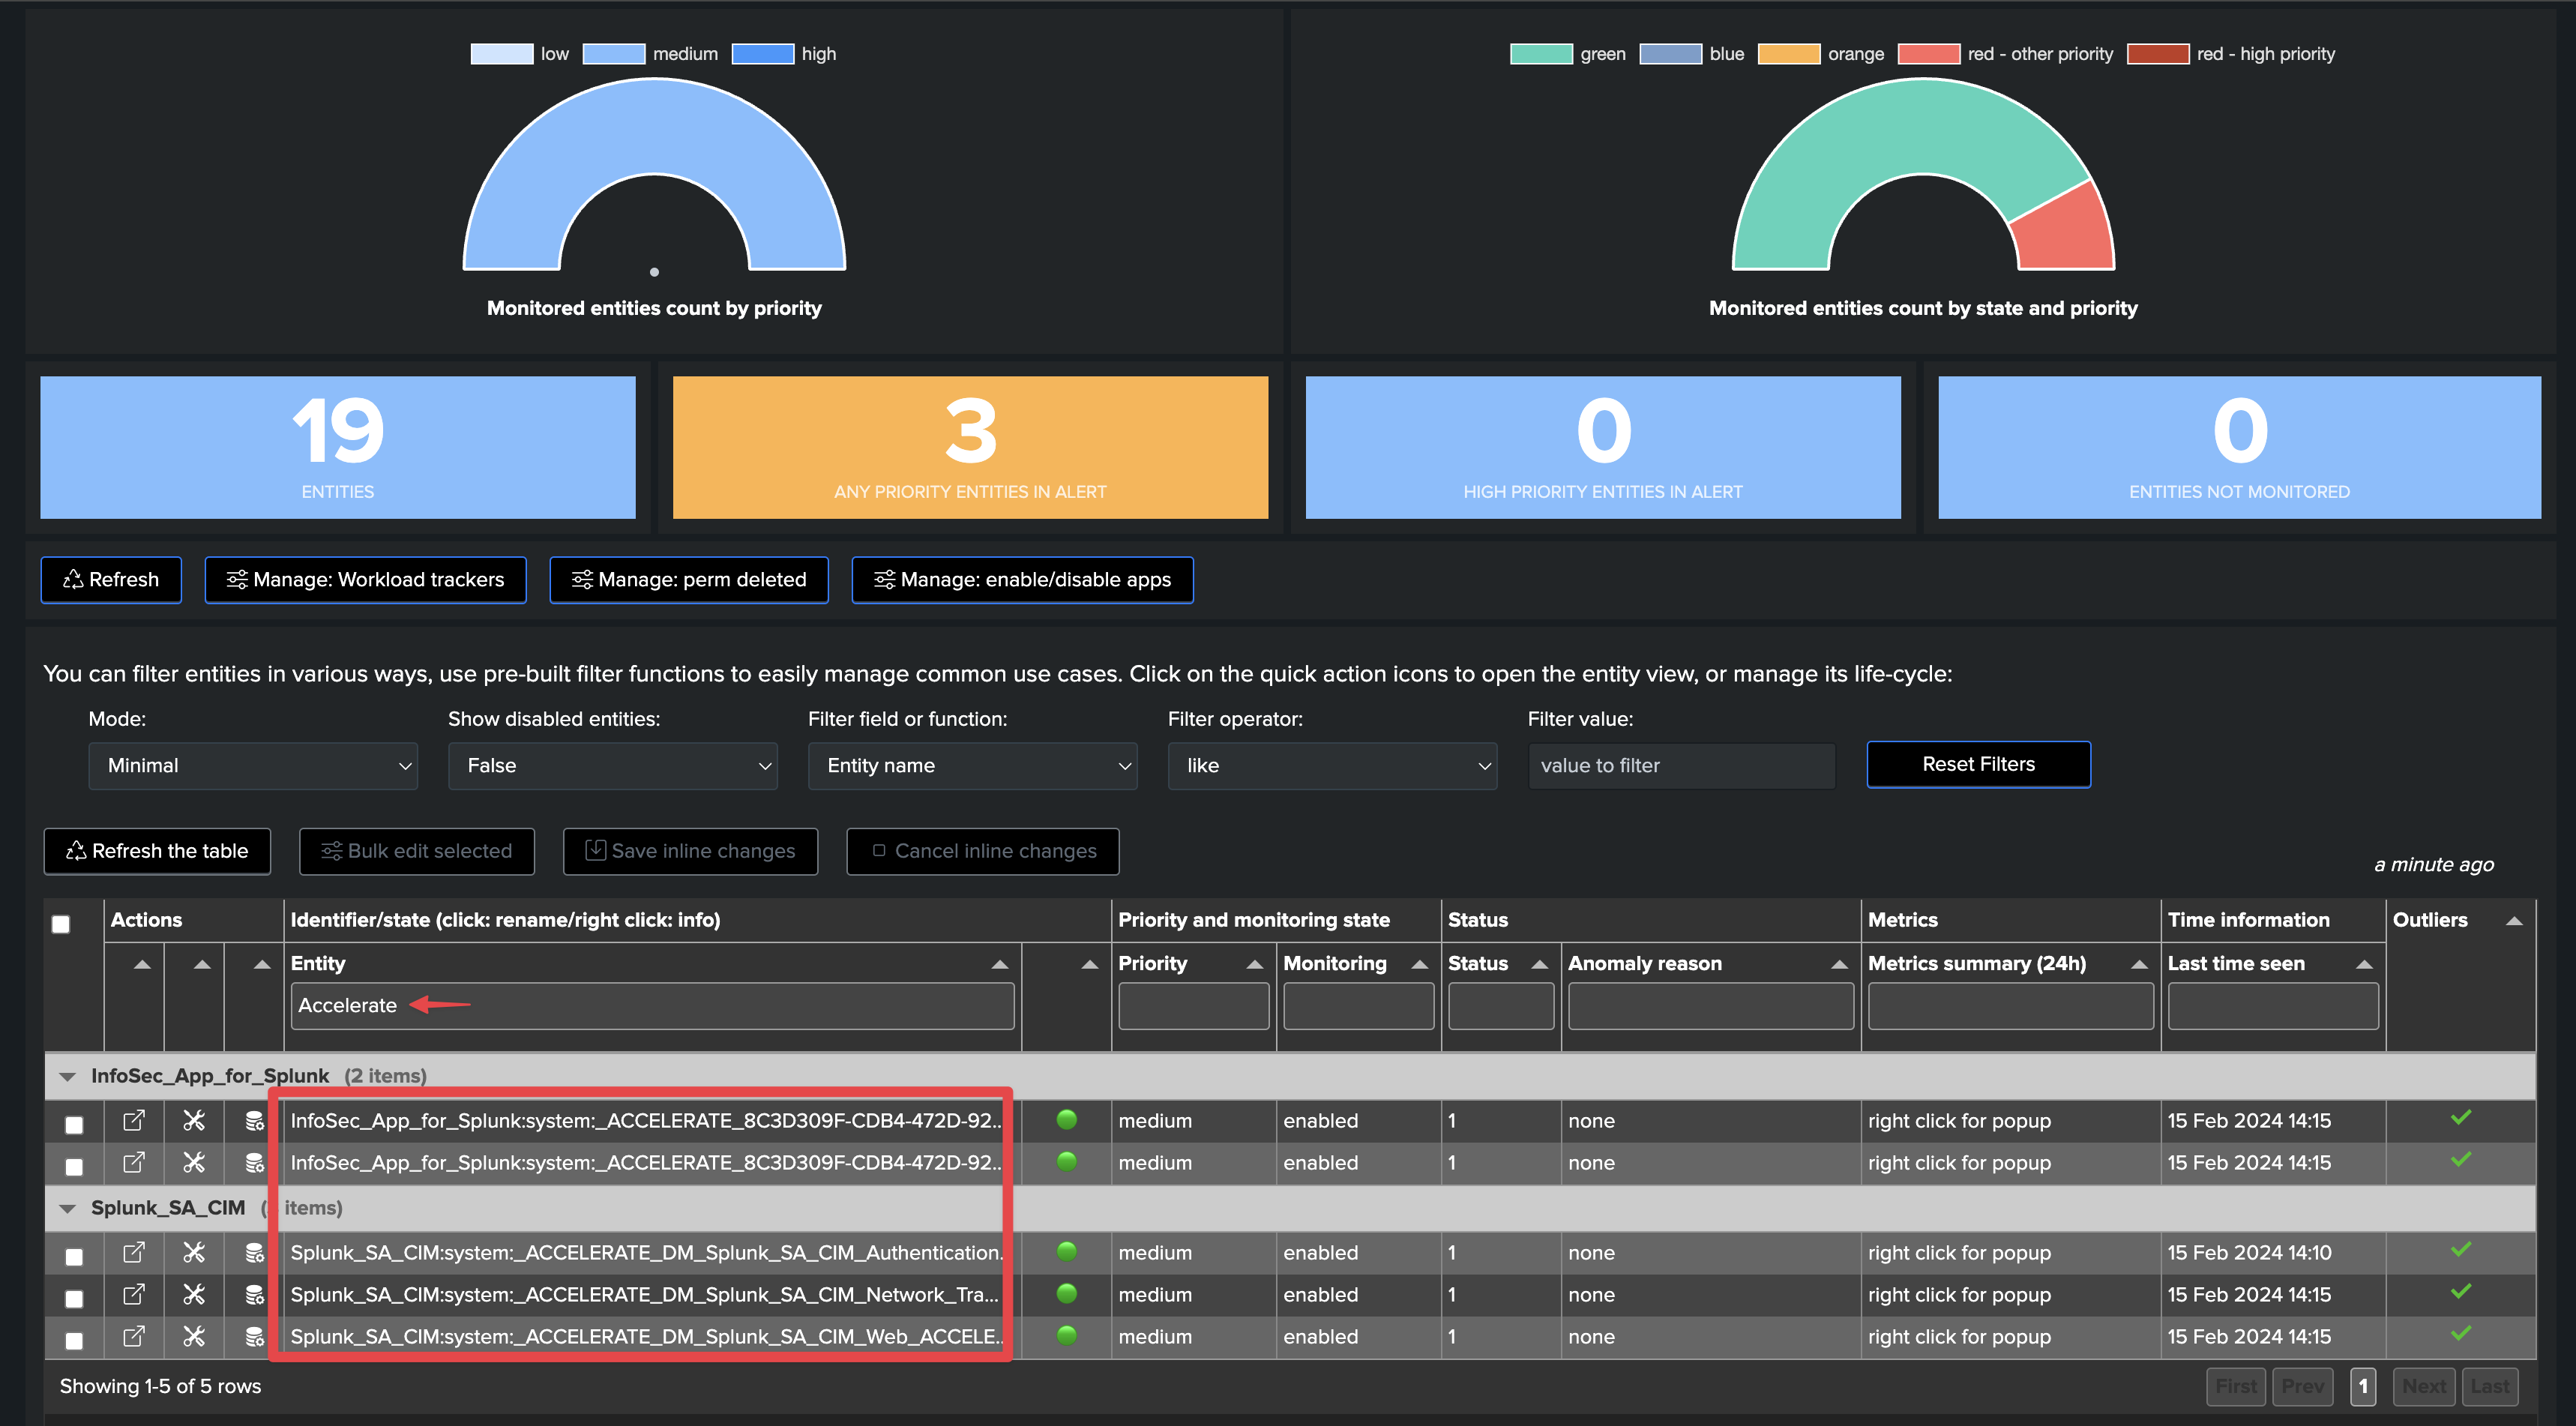
Use case: Monitoring Data Models Acceleration and Reports Acceleration behaviors and performance
Splunk Accelerated Searches in the Workload component
TrackMe also discovers and monitors searches that relate to Splunk Data Models (DMA) and Reports Acceleration.
Especially for DMA, it is important to monitor the level of Skipping searches per Data Model, as well as the elapsed time performance of these searches.
TrackMe will, for instance, automatically alert if these are suffering from high skipping searches ratios.
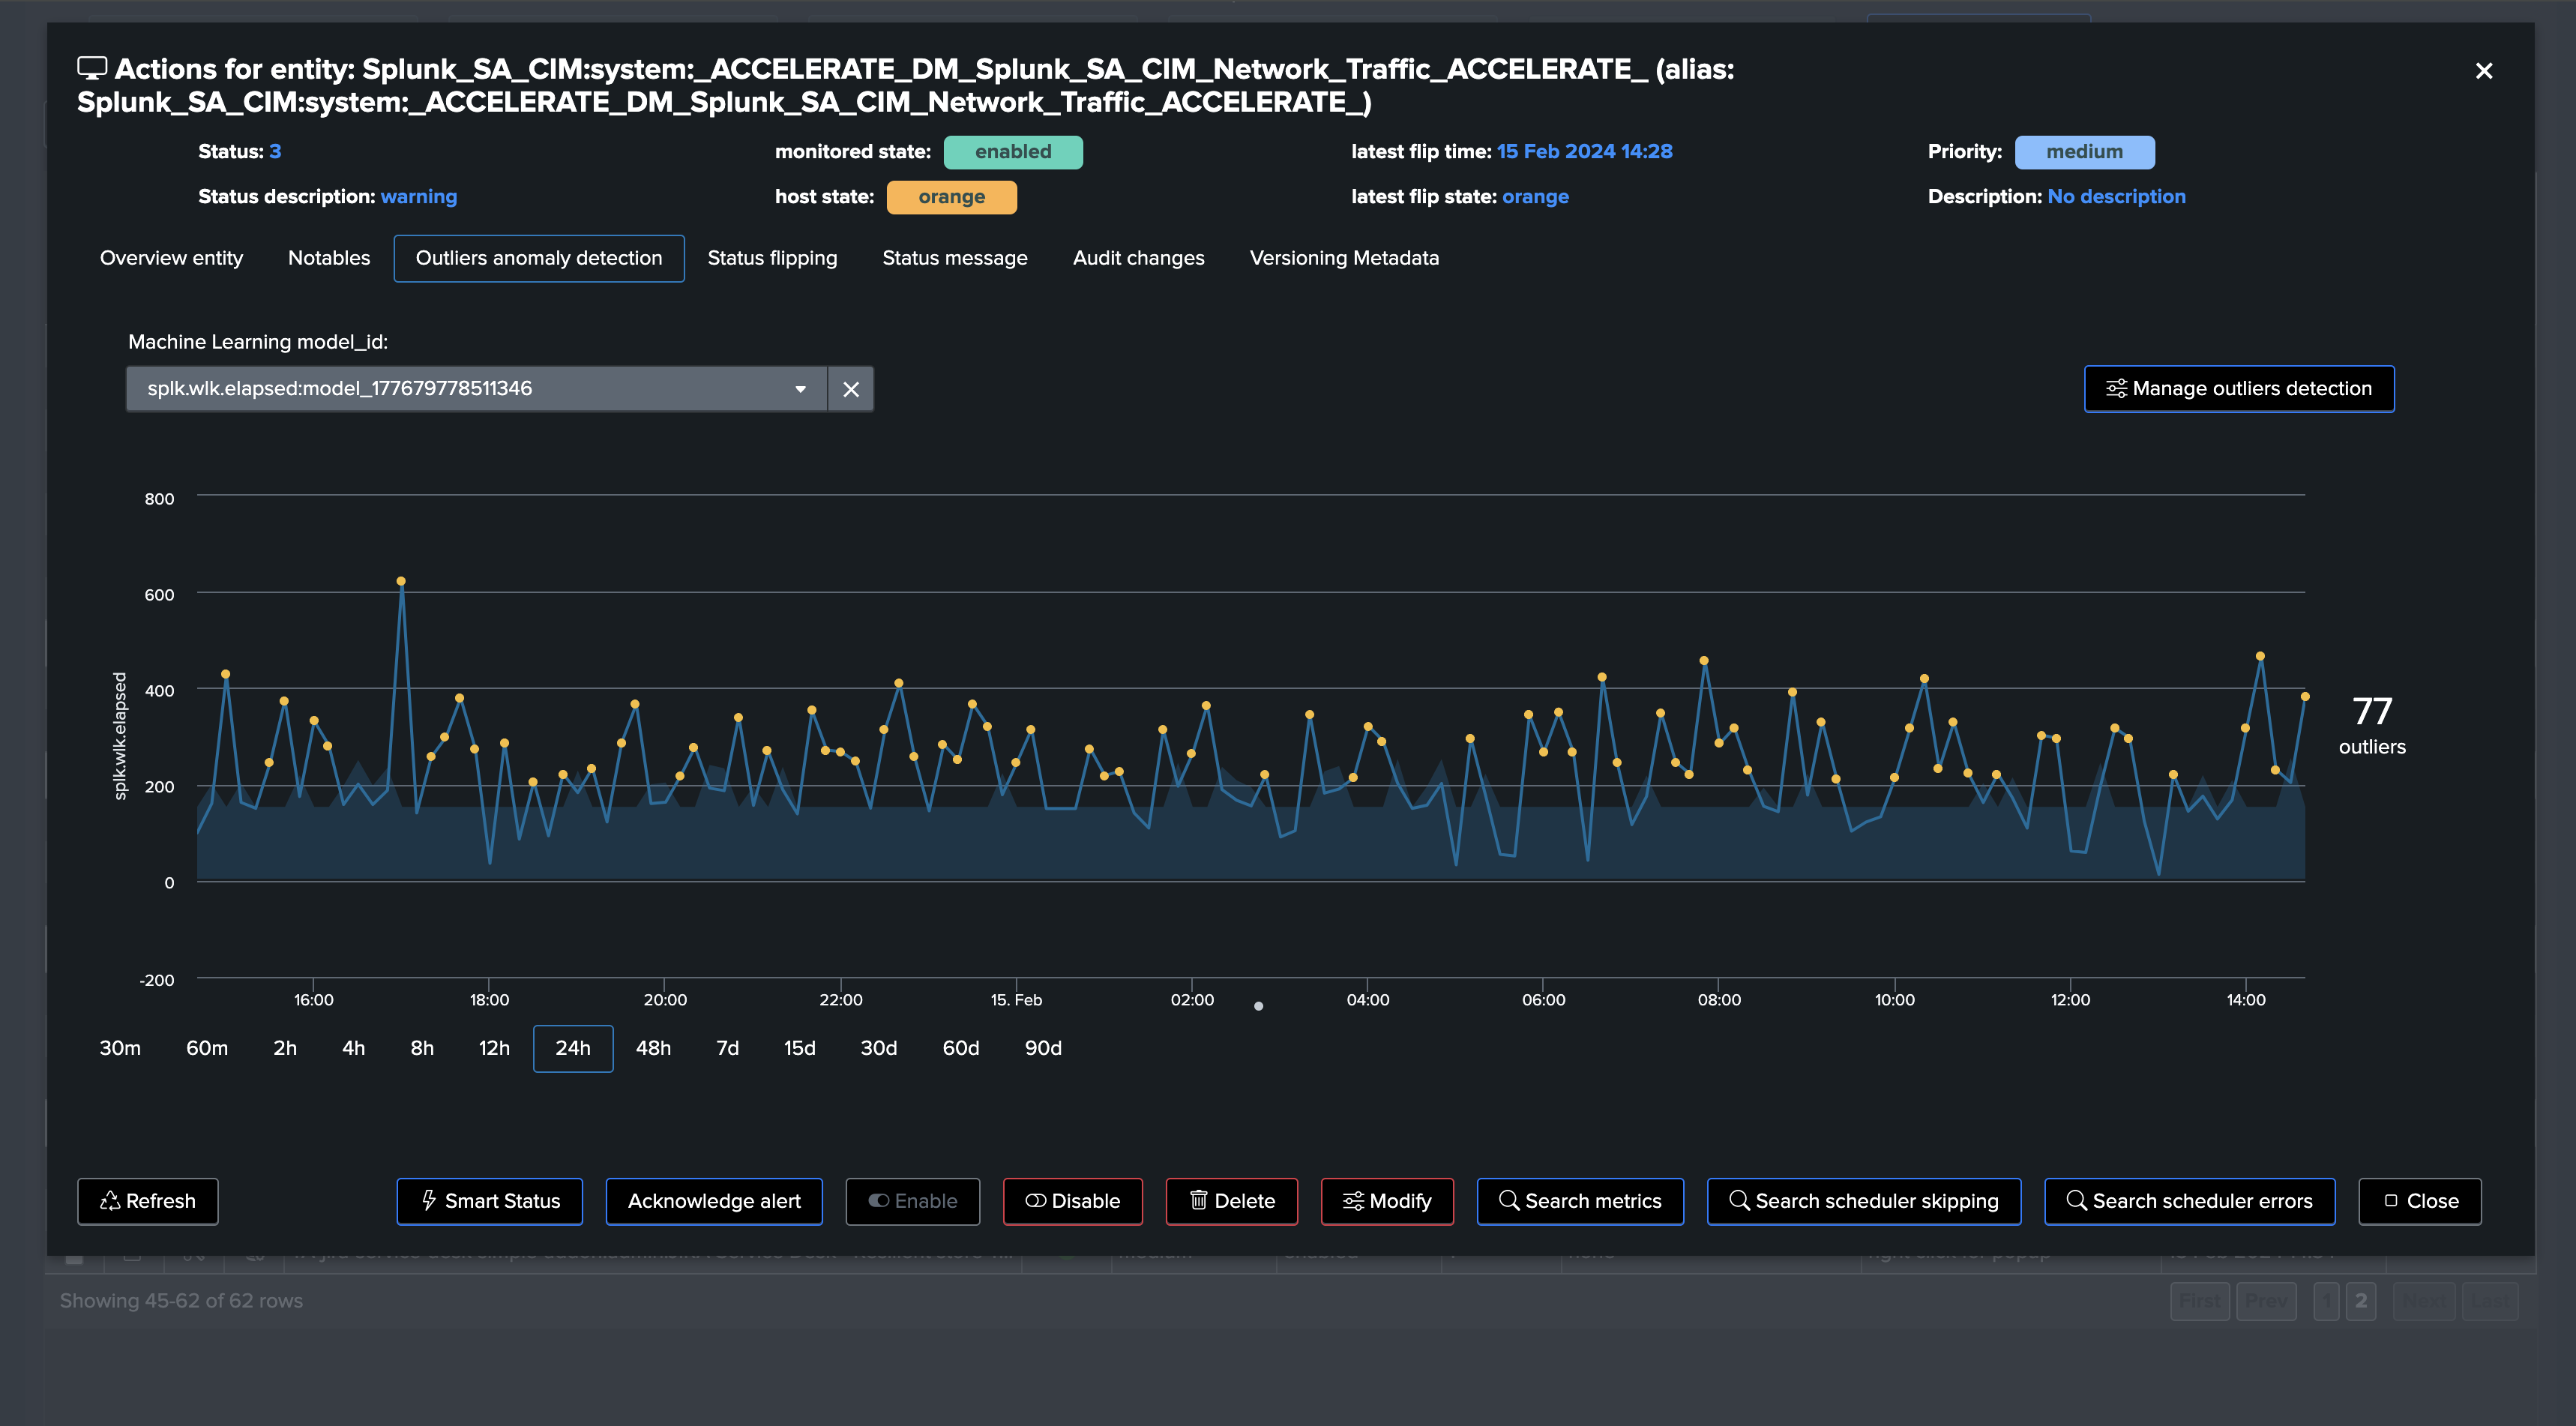
Finally, TrackMe also uses Machine Learning to detect Outliers regarding the performance of the searches and may alert if an abnormal increasing trend is detected.
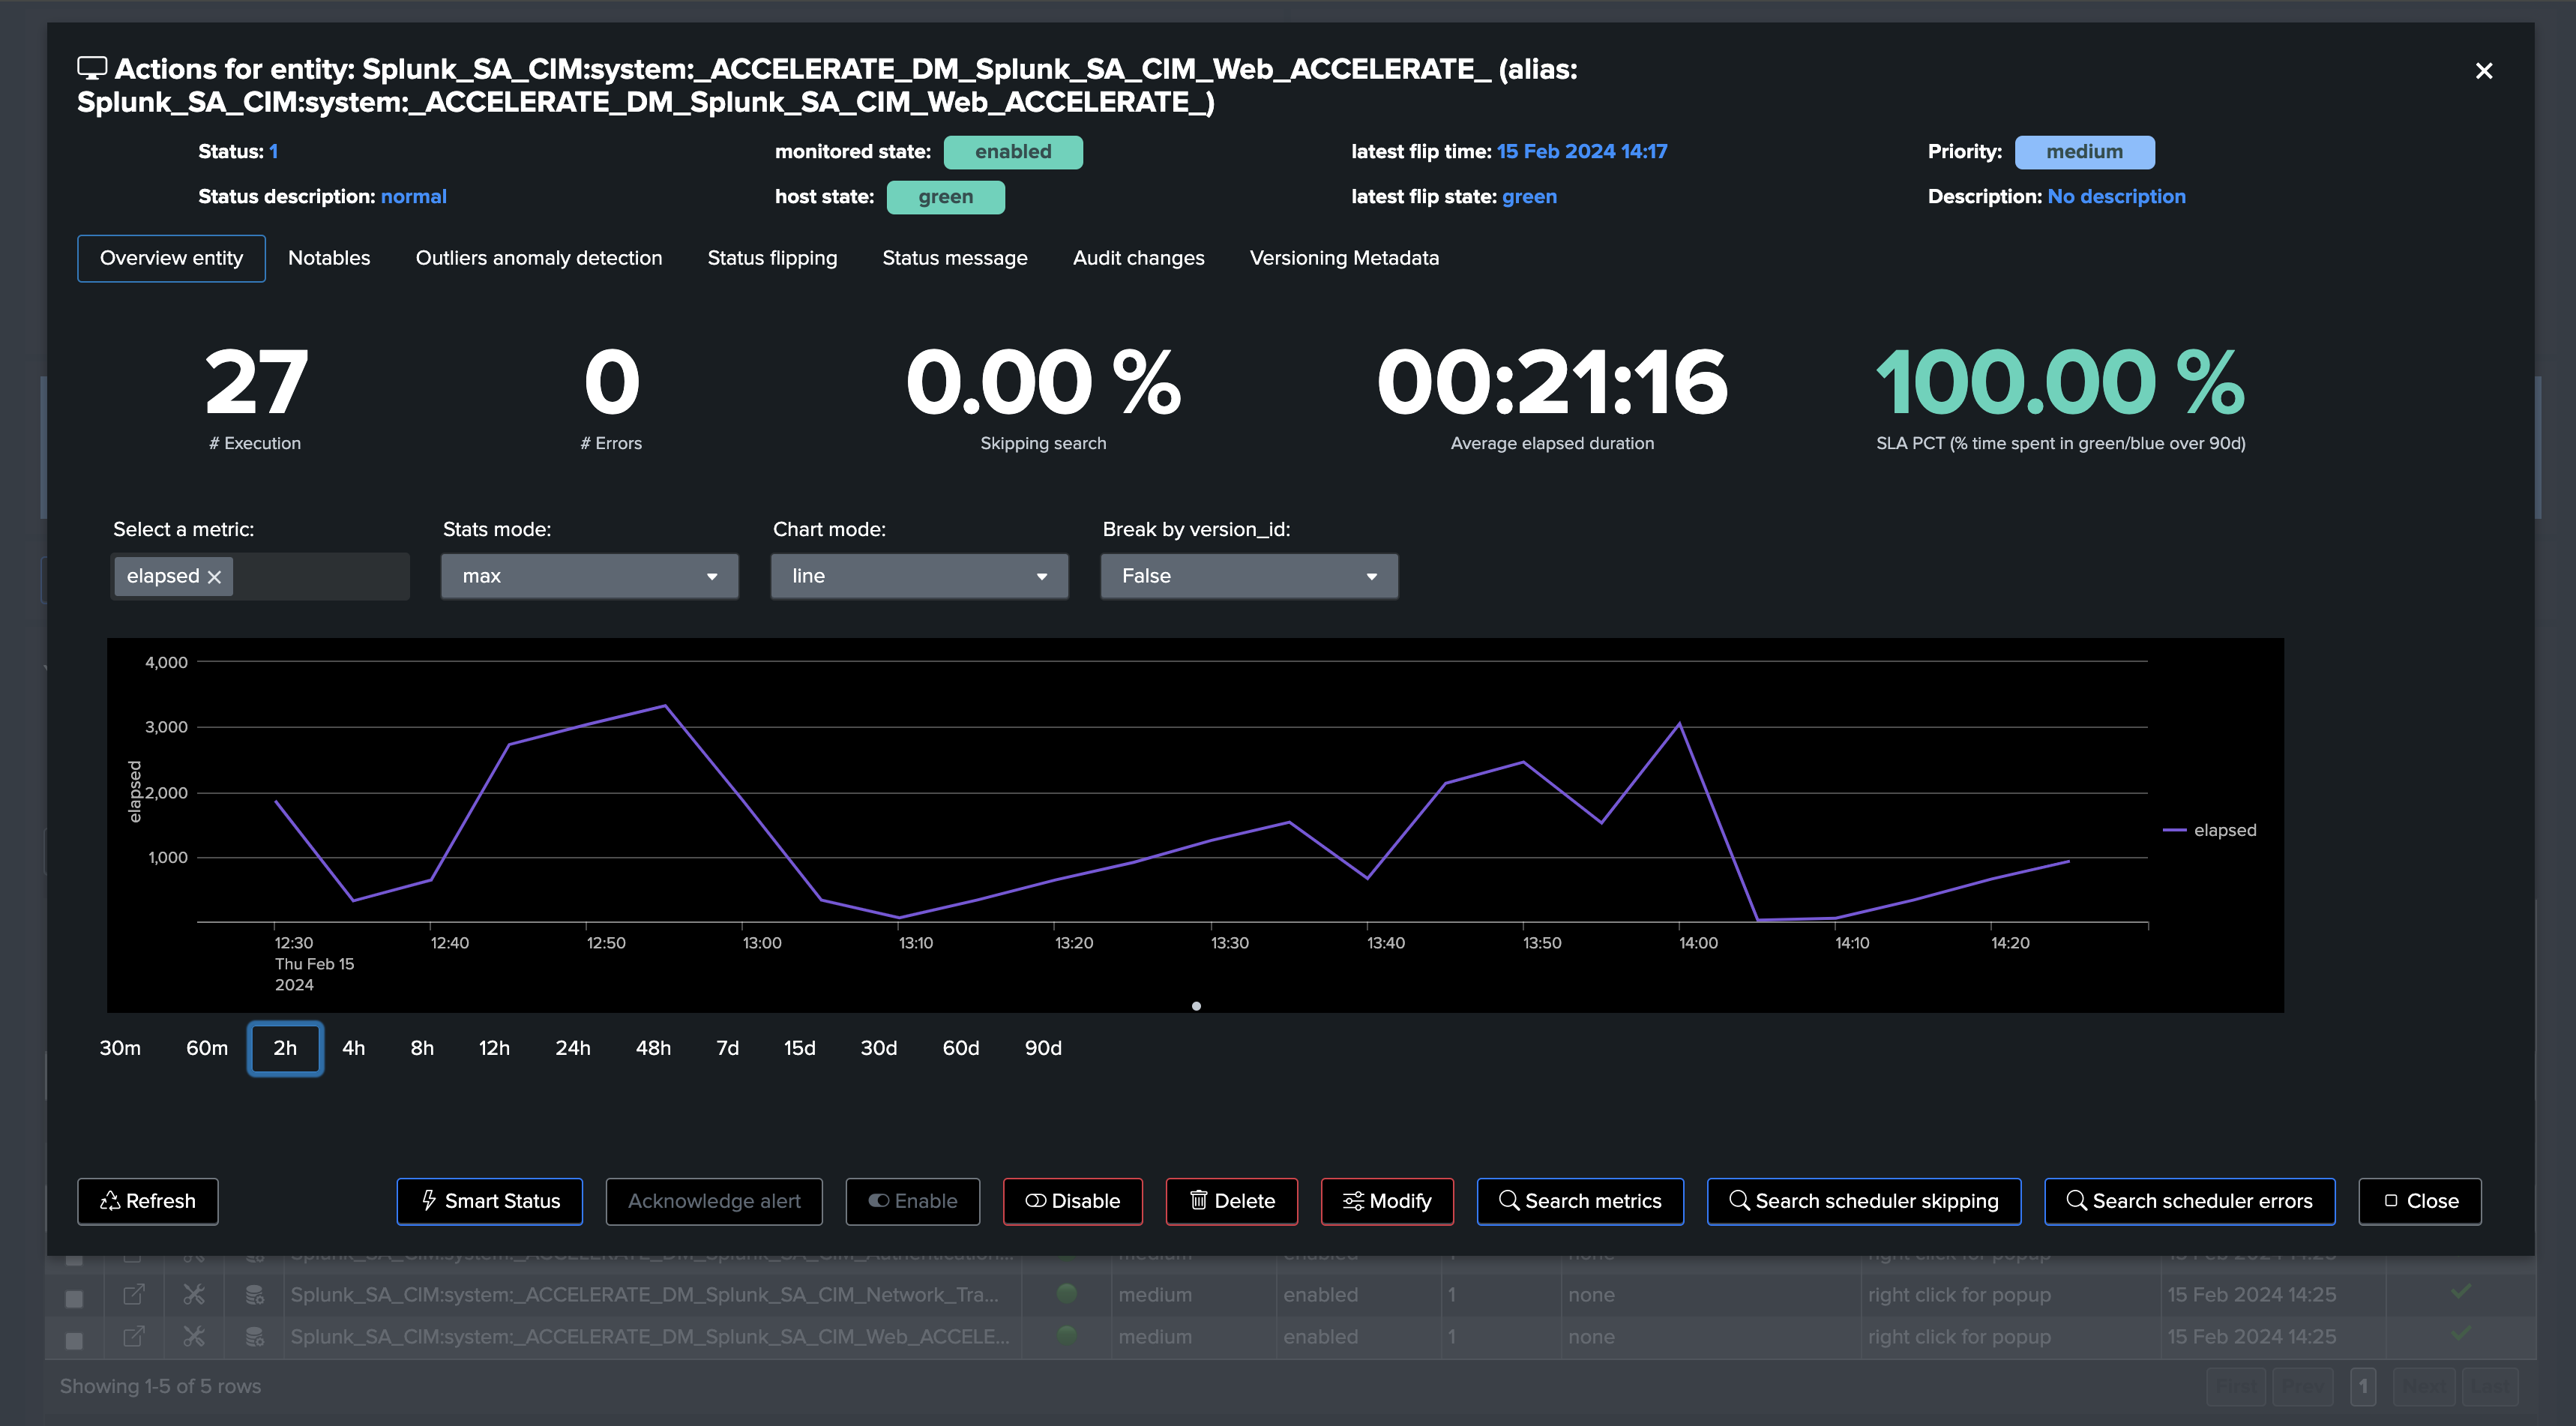
DMA and report acceleration searches are automatically discovered and monitored by TrackMe:
All metrics are available, such as the elapsed: (run time in seconds)
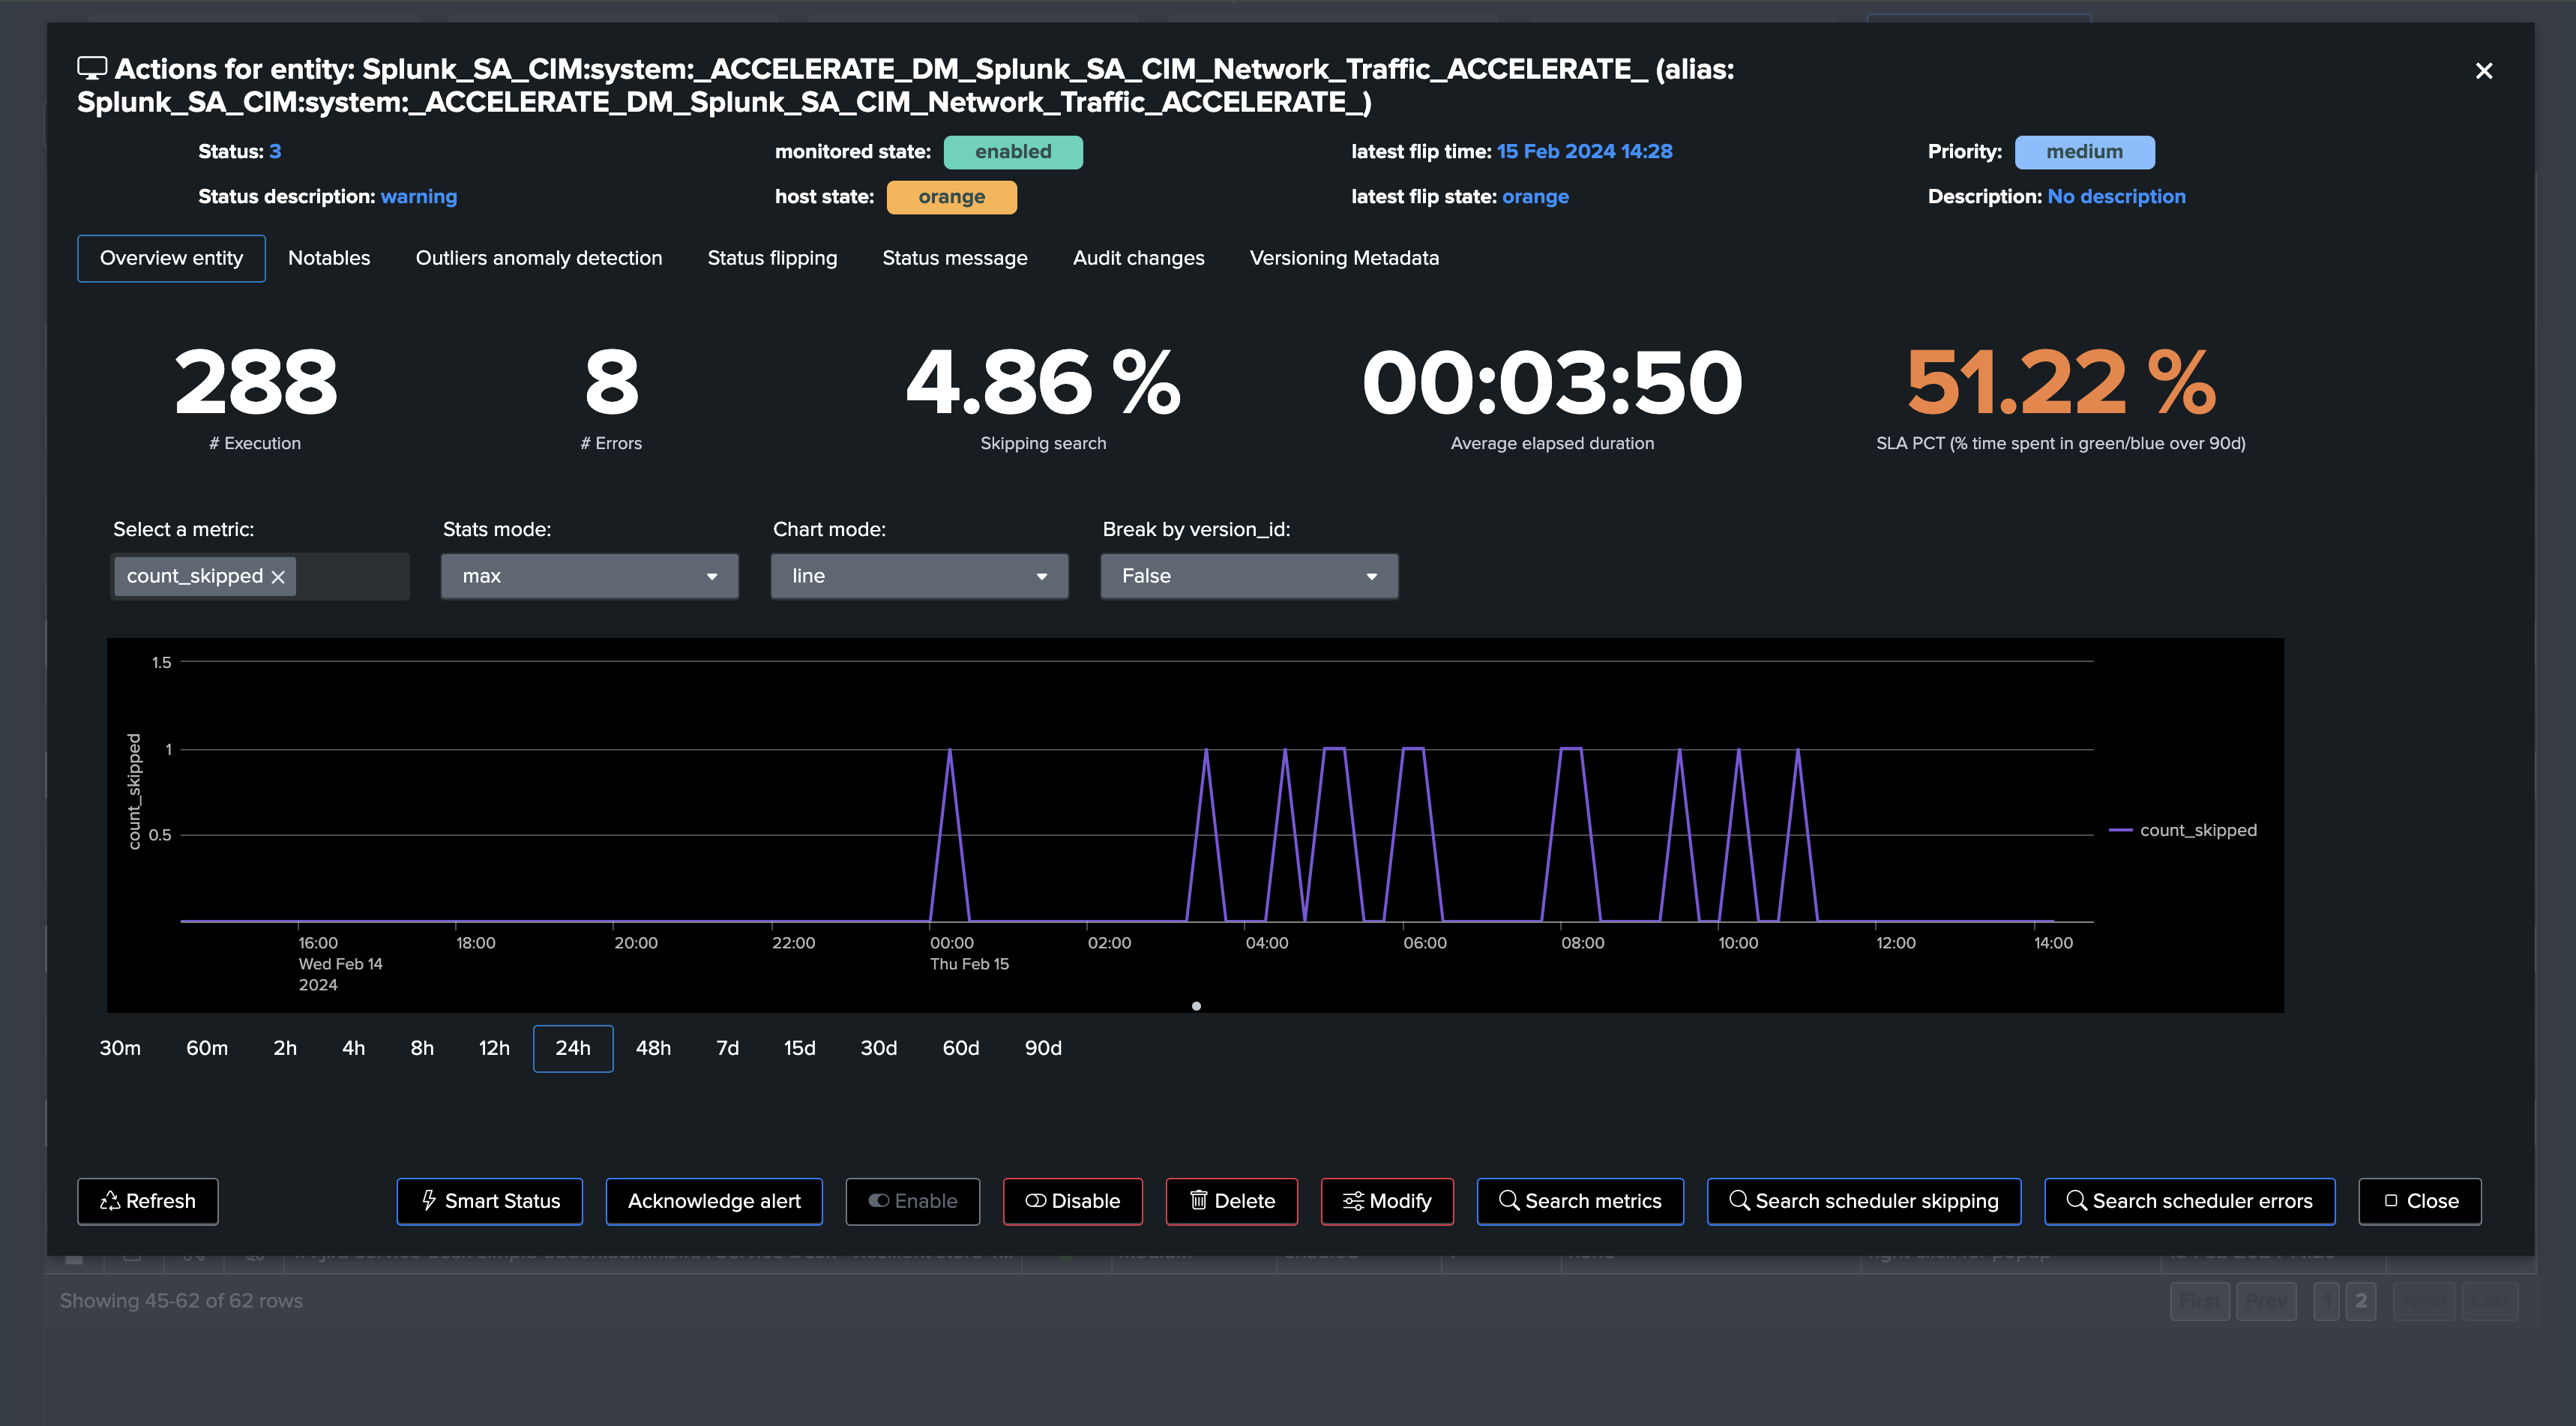
This environment is struggling to maintain DMA for instance, indicating underneath issues that can affect your security use cases:
Splunk Cloud customers can easily review related SVC usage:
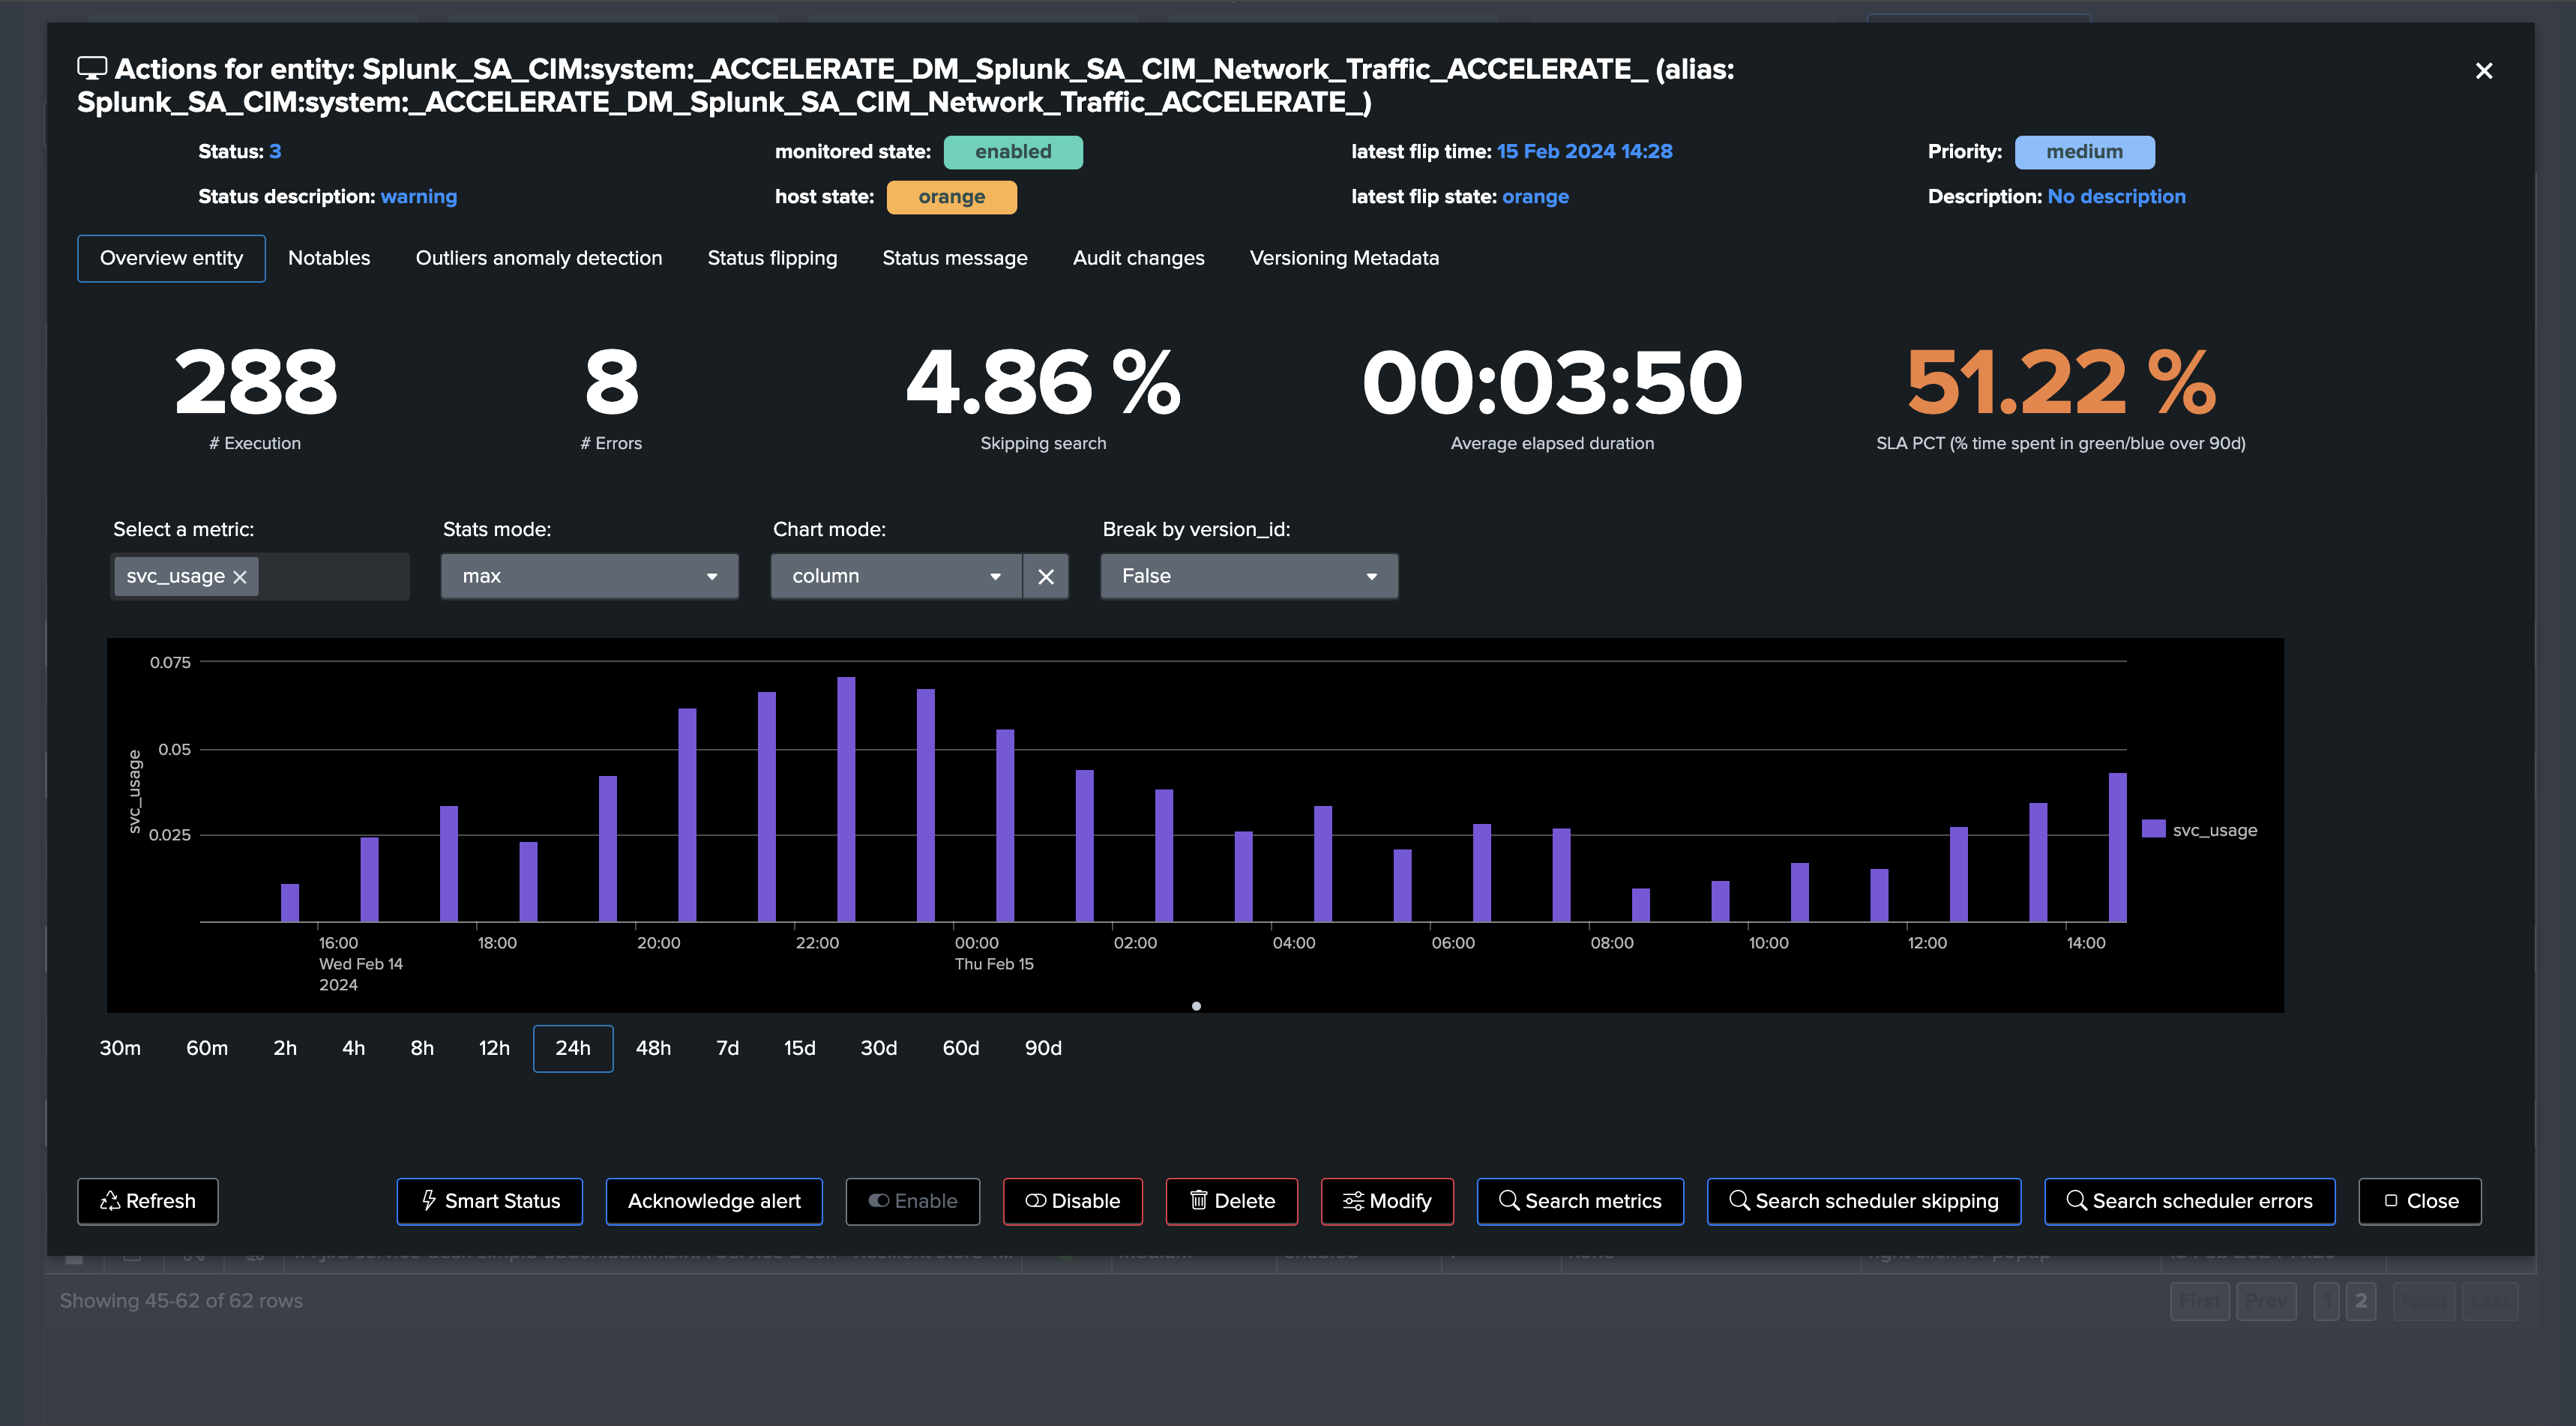
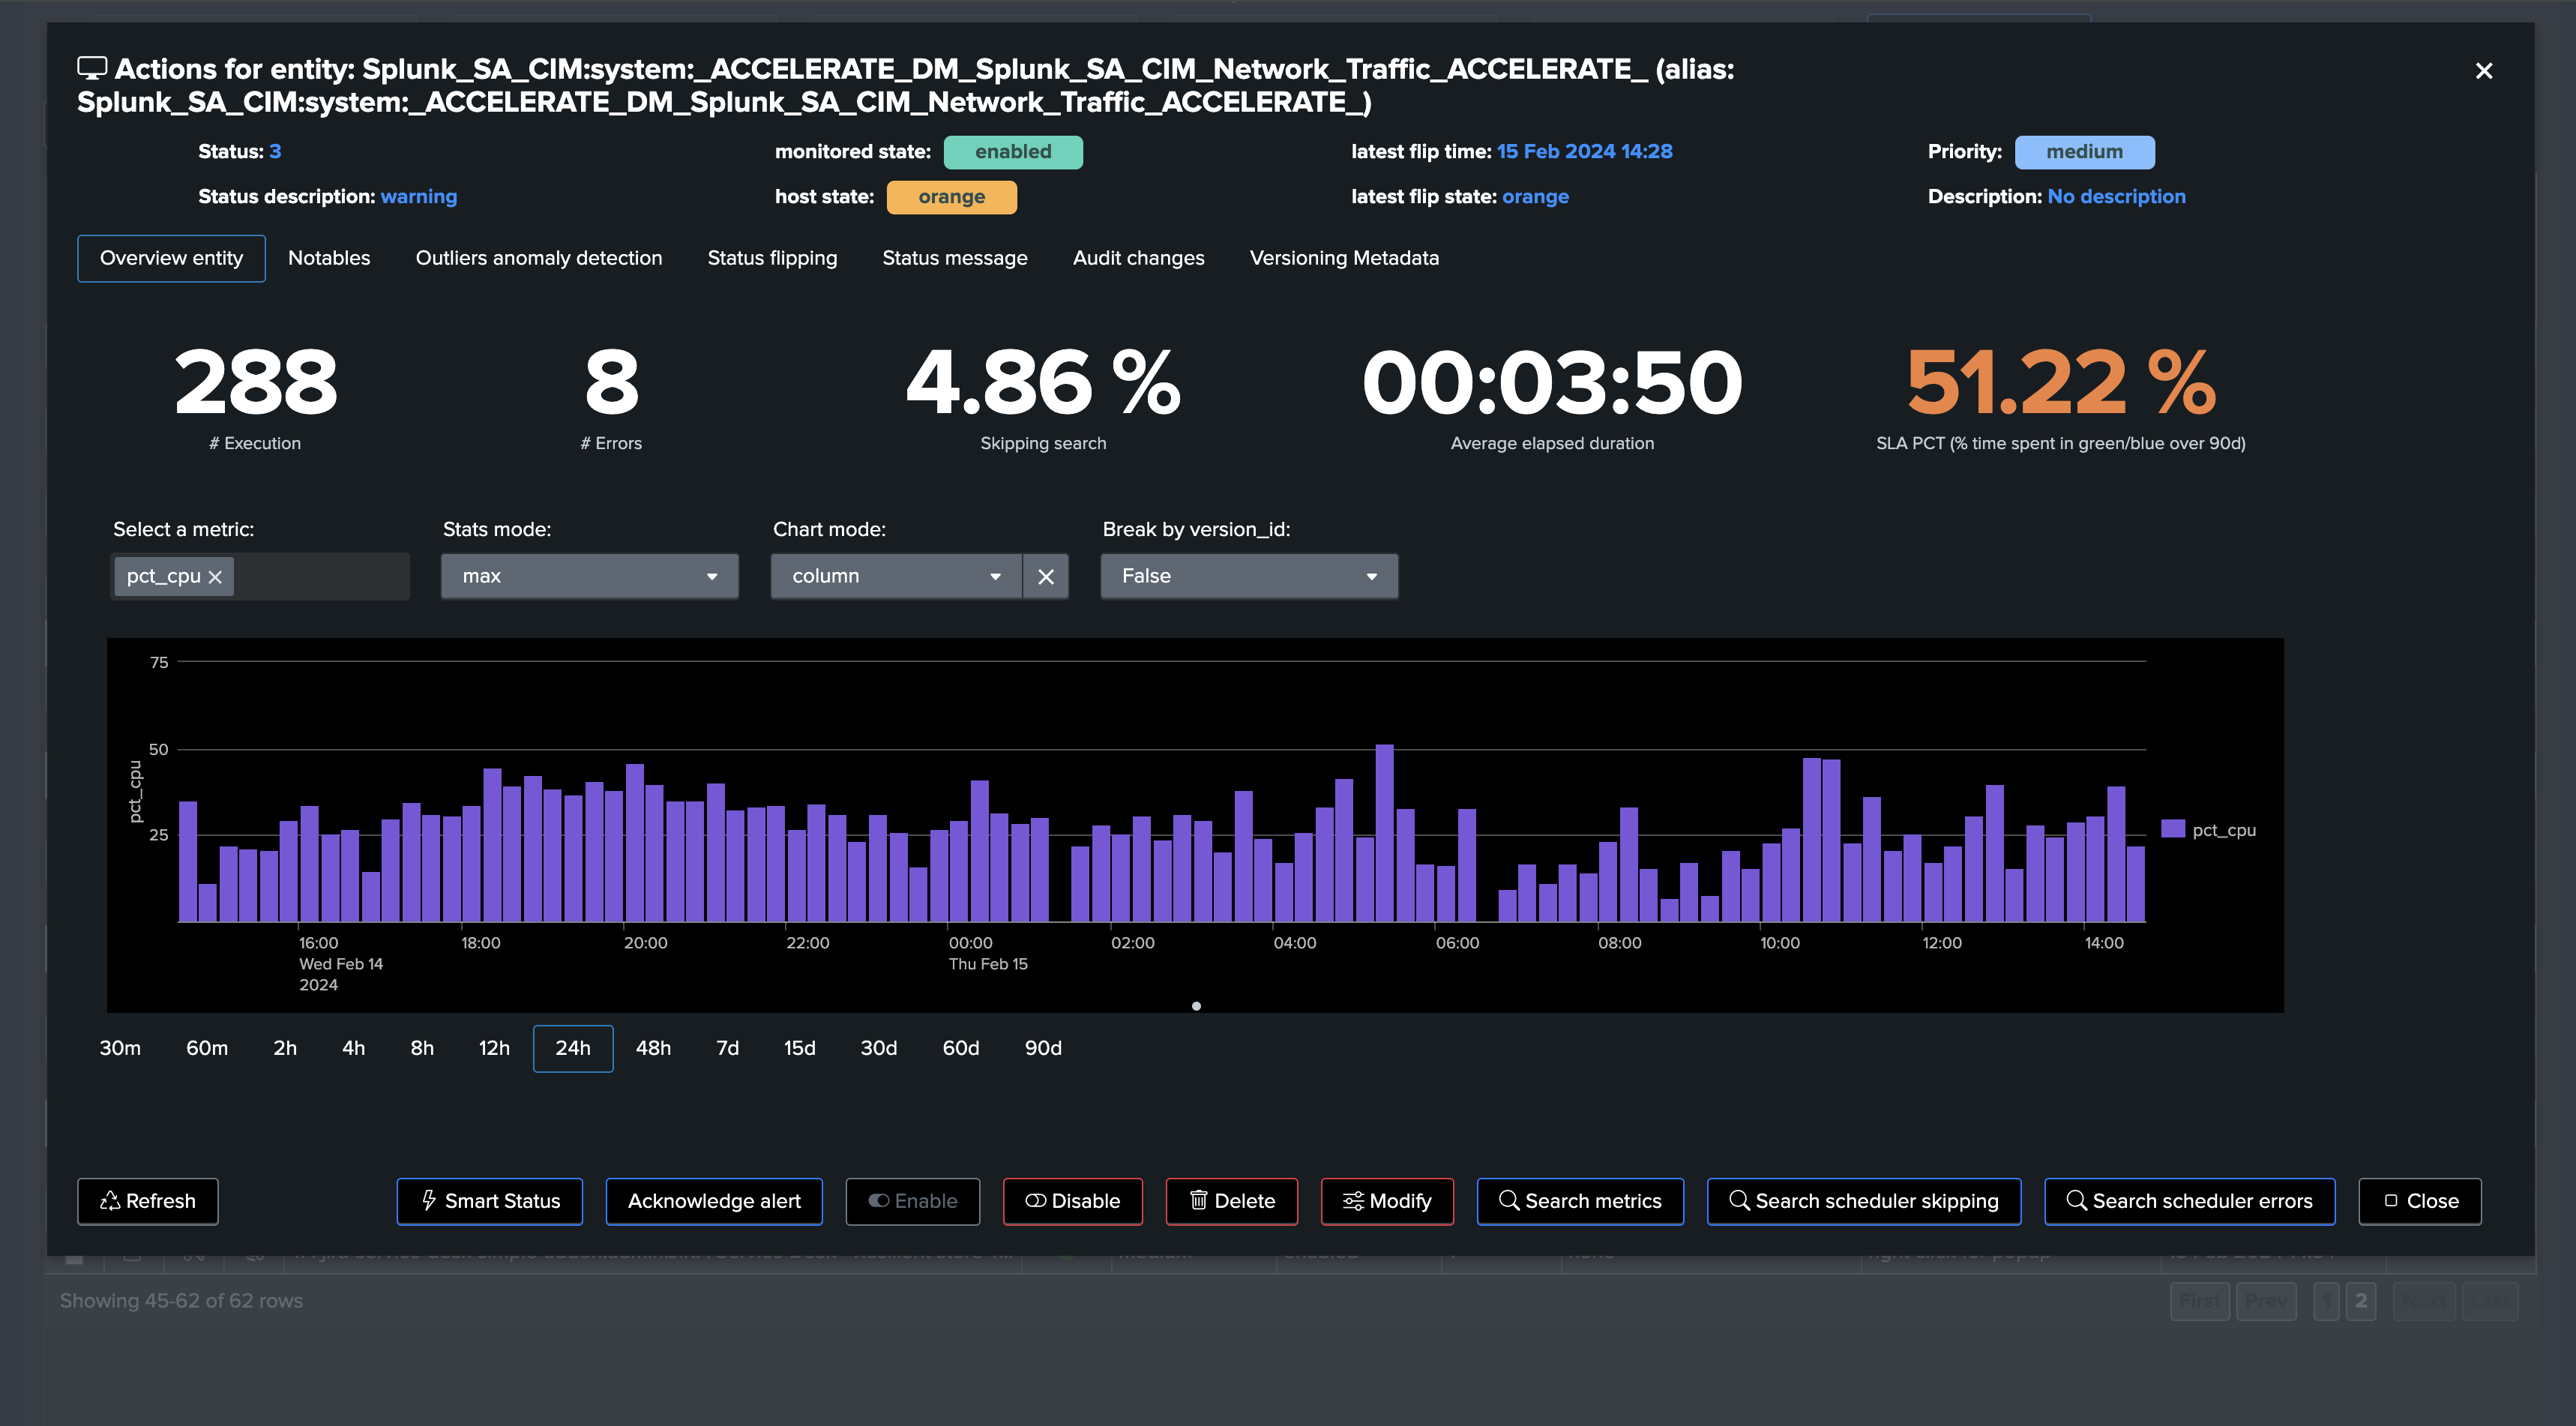
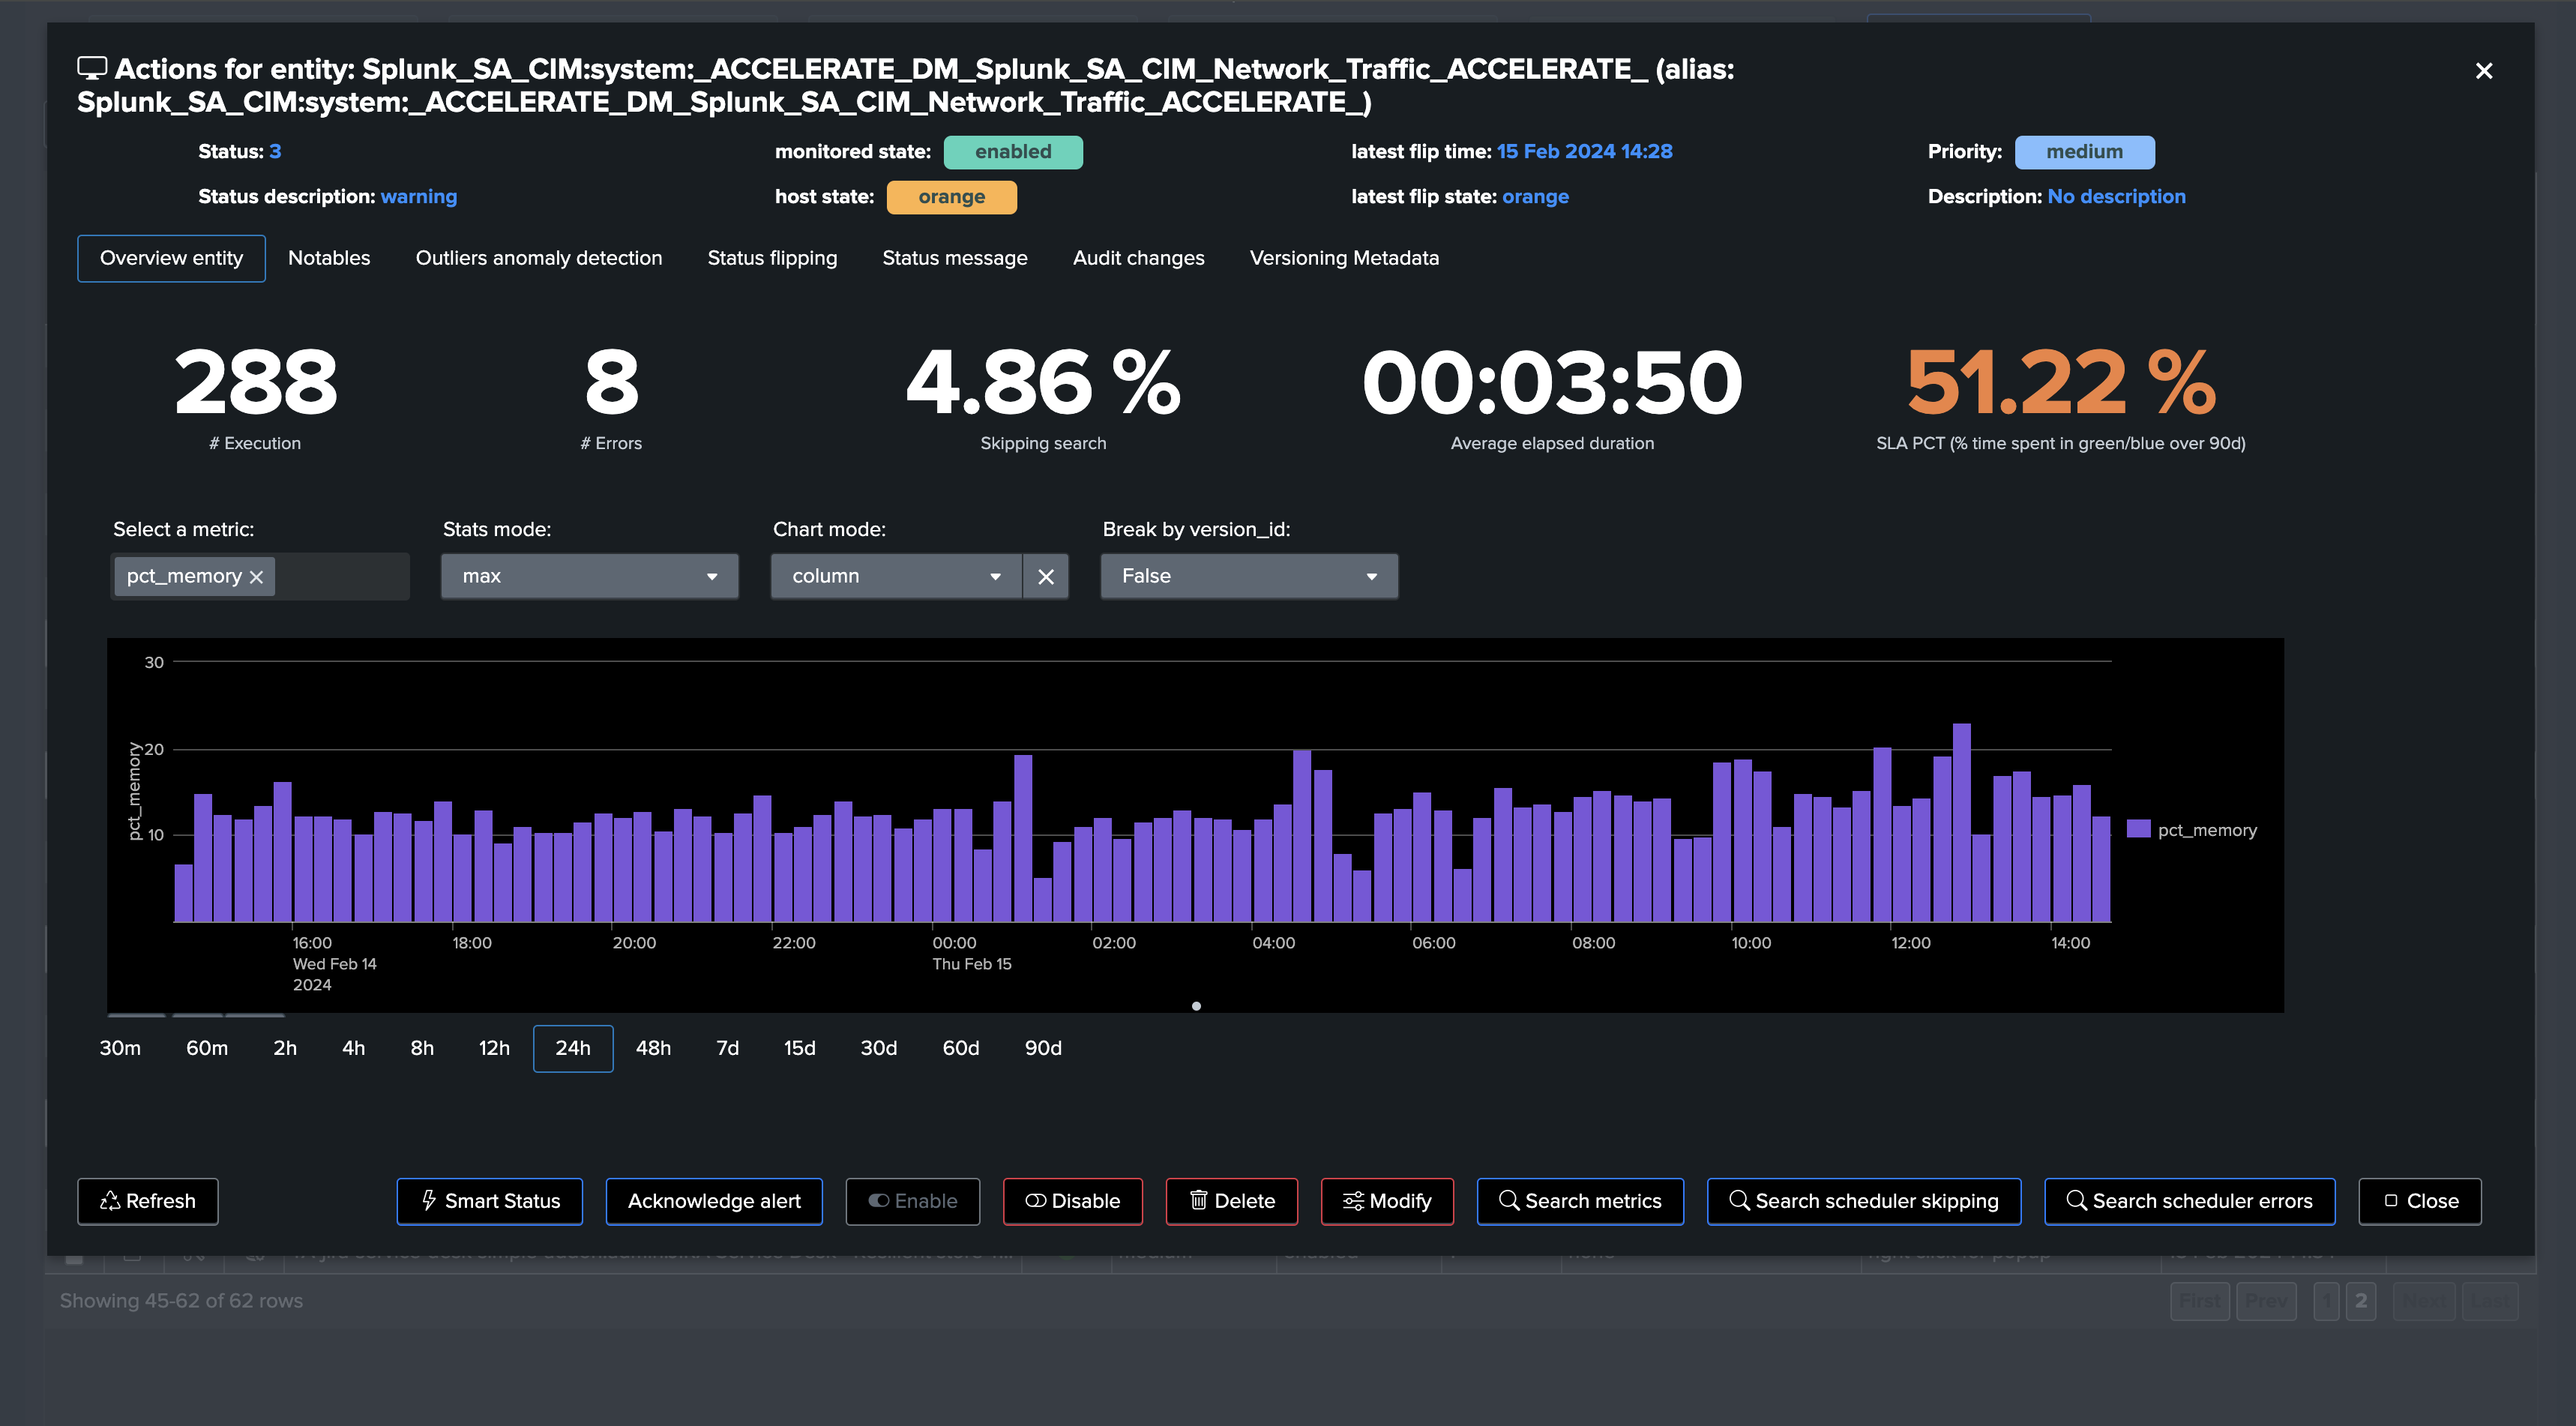
Splunk Enterprise & Cloud can also review CPU usage and memory consumption metrics:
TrackMe’s unique ML Outliers detection clearly catched the bad situation:
There are plenty more use cases that can be covered by the Workload component, and the above are just a few examples.
Some more documentation: