Elastic sources for feeds tracking
Introduction to Elastic sources
Elastic sources feature versus Hybrid Trackers in TrackMe V2
In TrackMe V2 and in a large number of use cases, the concept of Elastic Sources is superseded by Hybrid Trackers
Indeed, an Elastic Source creates and maintains a single TrackMe entity, where Hybrid Trackers can manage from a few to tens of thousands of entities
However, there are also use cases where Elastic Sources can be required and can be very valuable to meet your requirements or to address specific use cases such as tracking lookups and more
What does the Elastic sources feature do?
The Elastic sources feature provides a built-in workflow to create virtual data sources based on any constraints and any Splunk language
In TrackMe V2, the target can be the local Search Head tier, as well as any remote Splunk deployment or instance using TrackMe’s built-in remote search capabilities
Elastic Sources allows extending TrackMe feeds tracking capability in a rich and flexible way
Elastic Sources can be based on
tstats,raw,from (datamodel and lookup)andmstatssearches
Some examples of use cases for Elastic Sources:
Creating a Virtual entity which is the combination of different indexes, sourcetypes, sources and so forth with additional search filters, using indexed or search time extracted fields
Creating a Virtual entity based on a Splunk search language not supported by Hybrid Trackers (
fromwhich allows calling lookups or datamodels)Create a Virtual entity based on a
rawsearch, as opposed totstatsused typically on Hybrid Trackers for performance purposes, and where the use case requires using search time extracted only fieldsTracking specific Splunk objects such as lookup content over time (CSV based lookup or KVstore), to detect if the lookup is being updated and also apply Machine Learning based outliers detection on the number of records
Shared Elastic versus Dedicated Elastic:
An Elastic Source can be added to the Shared tracker, or created as an independent Dedicated Tracker
Shared Elastic Sources are orchestrated by the Elastic Sources shared tracker
Dedicated Elastic Sources are orchestrated by their own scheduled report
The Shared Elastic Sources tracker processes searches in a multithreading parallel way (the max number of concurrent searches is configurable at the TrackMe system level and can be overridden on a per tenant basis)
When the Shared Elastic Sources tracker reaches its maximal run time (which is automatically calculated depending on its cron schedule and time margin configuration), it stops its execution to avoid generating skipping searches
On the next iteration, the Shared Elastic Sources tracker will resume its execution starting with entities which have not been inspected previously (but the oldest age of the inspection date)
On the other hand, Dedicated Elastic trackers are fully independent scheduled reports, their life cycle remains orchestrated by TrackMe but these run independently from each other
Accessing the Elastic source creation UI
First, let’s expose how to access the Elastic sources interface, from the data sources tab in the main UI, click on the Elastic Sources button:
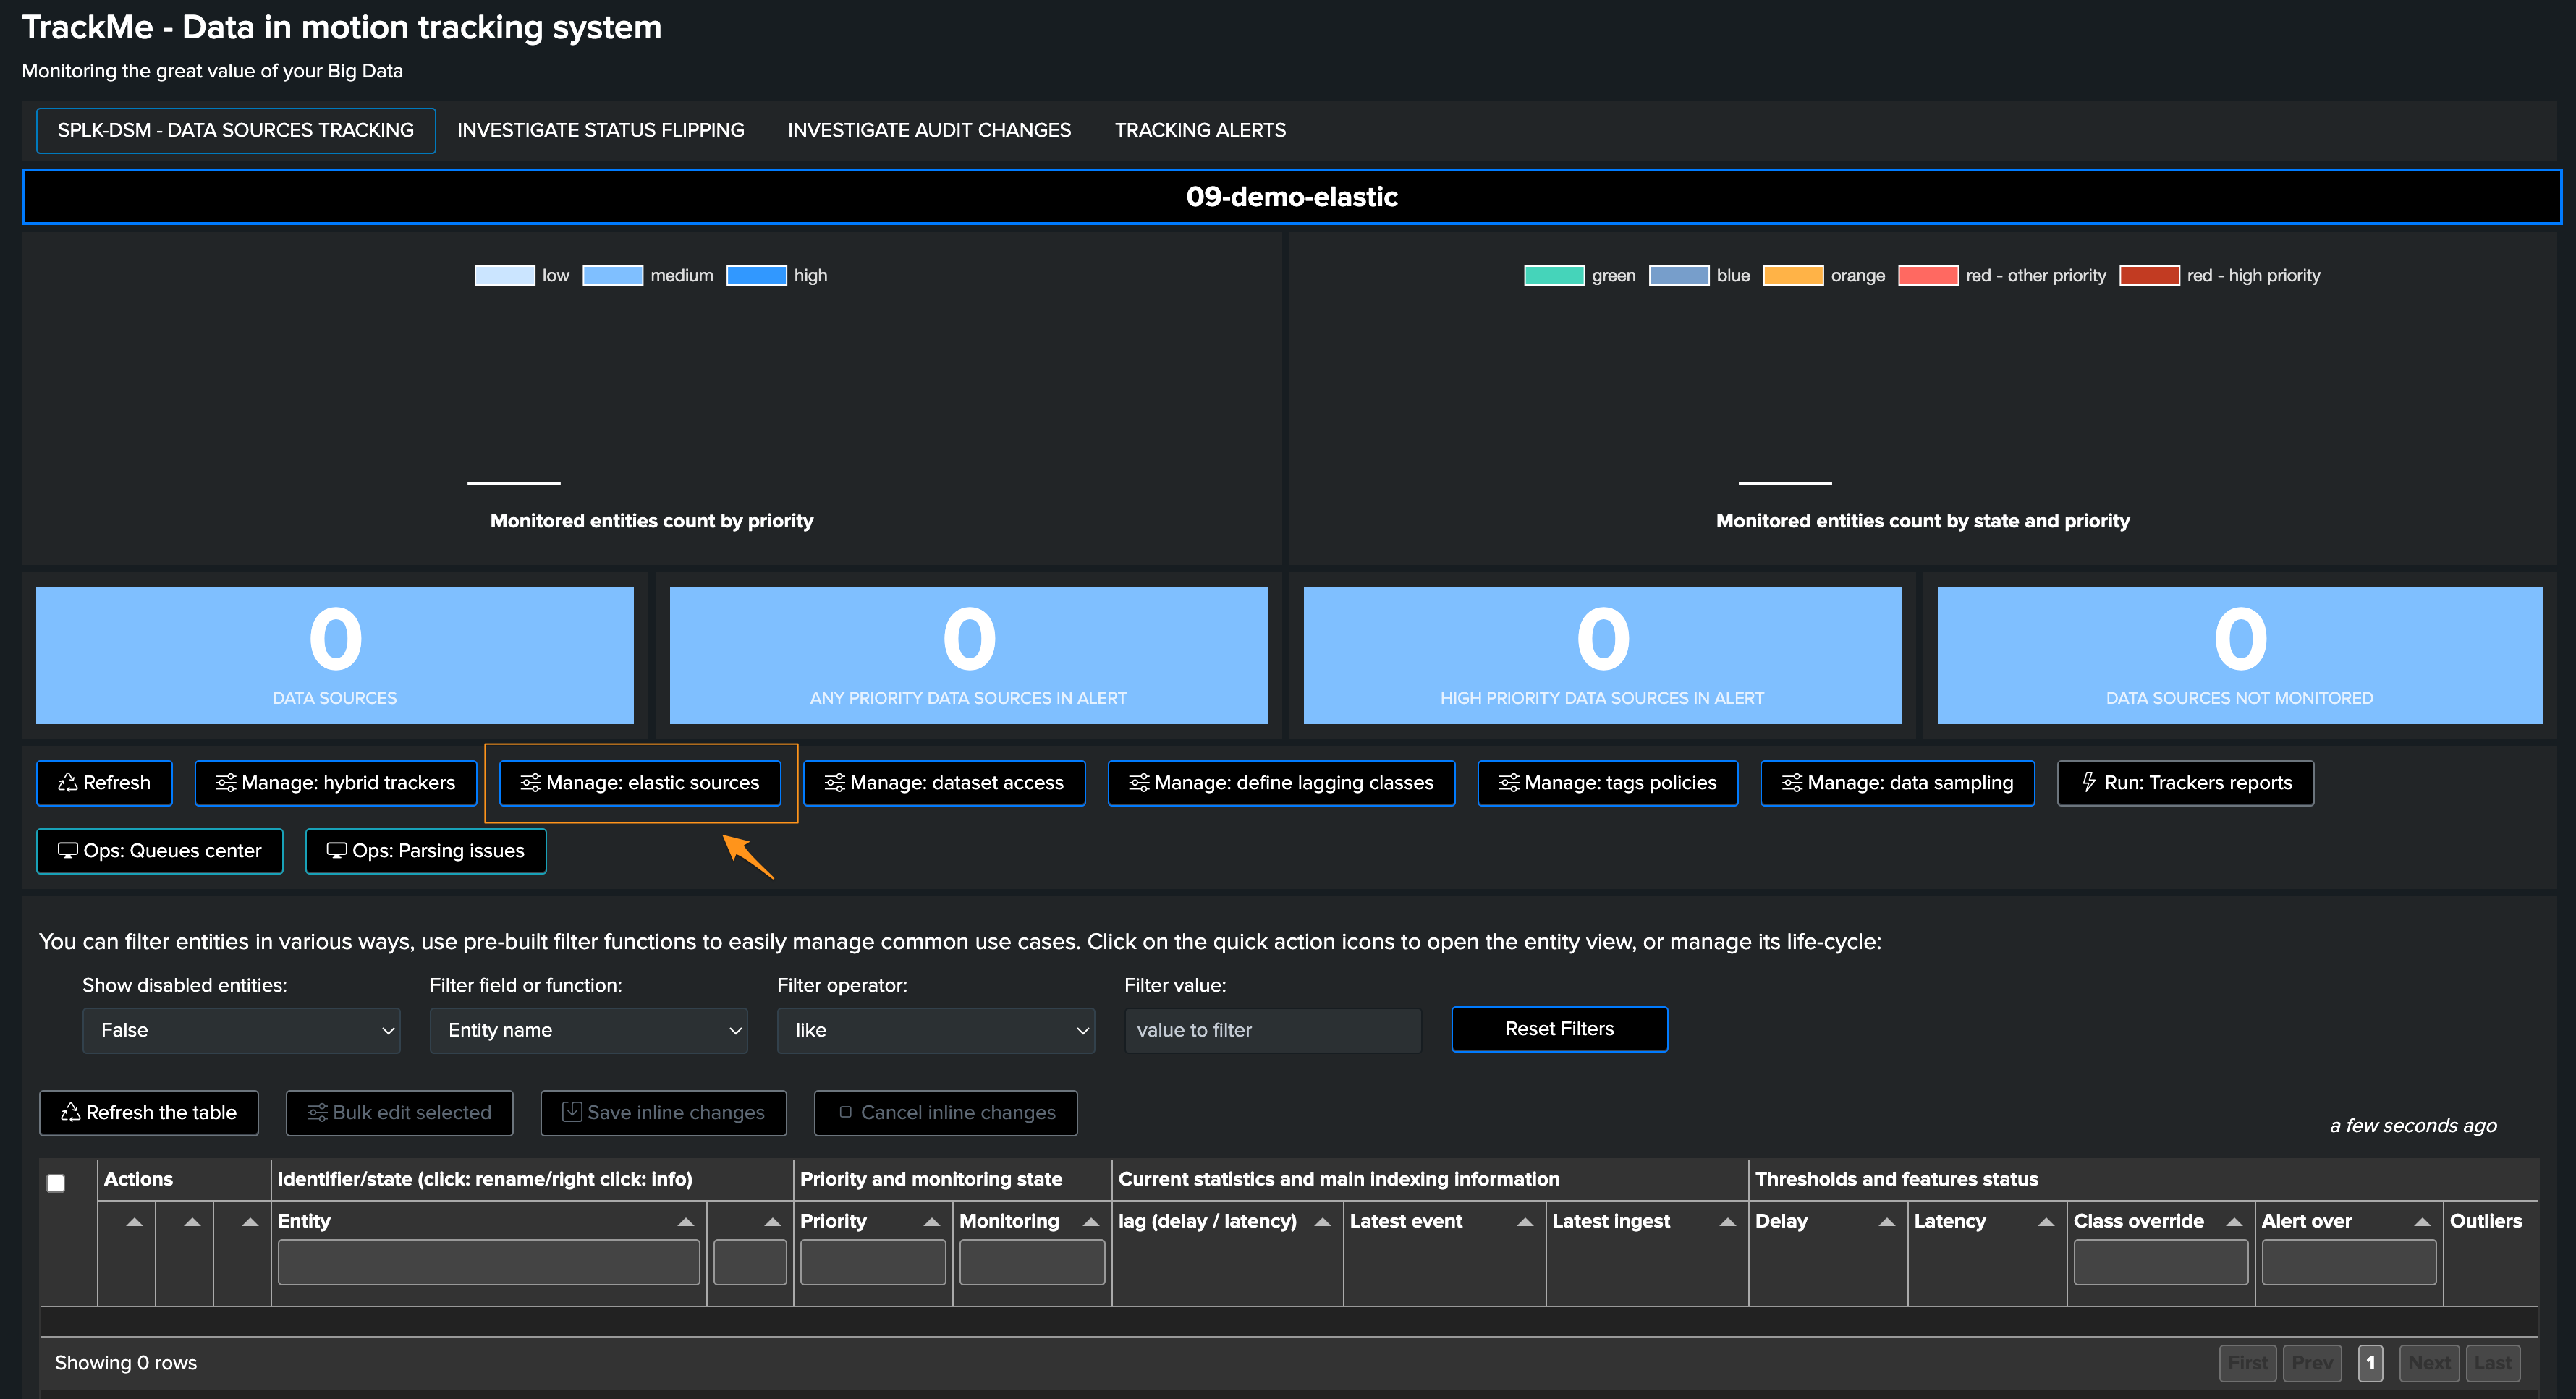
The following screen appears:

Elastic source example 1: raw search with search time only extracted fields
Hint
tstats versus raw
These steps are in fact the same whenever you use a raw search, or a tstats based search
In the first case and in the example below, we use a raw search to benefit from search time extracted fields
A tstats based search is how highly recommendable when possible, performances are infinitely better than raw searches, and computing costs much lower
In this example, requirements are:
To monitor the Web data coming from a specific Website (trackme-solutions.com)
Fields that can be used are only available at search time, creating indexed time fields for this use case would be challenging and possibly overkill for this edge use case (assuming we use tstats Hybrid Trackers globally)
The volume of data is relatively low, allowing efficient searches to be performed
The following search constraints provides access to the data we need:
(index=webserver site="trackme-solutions.com")
We will create a new Shared Elastic source in a just a couple of easy steps:
Step 1: define name of the entity
This defines the name of the entity, stored as the value for
objectandaliasin TrackMe’s collections (you probably want something meaningful)Also define the target,
localmeans that we looking at data searchable from the local Search head tier,remotewould target a remote account previously configured
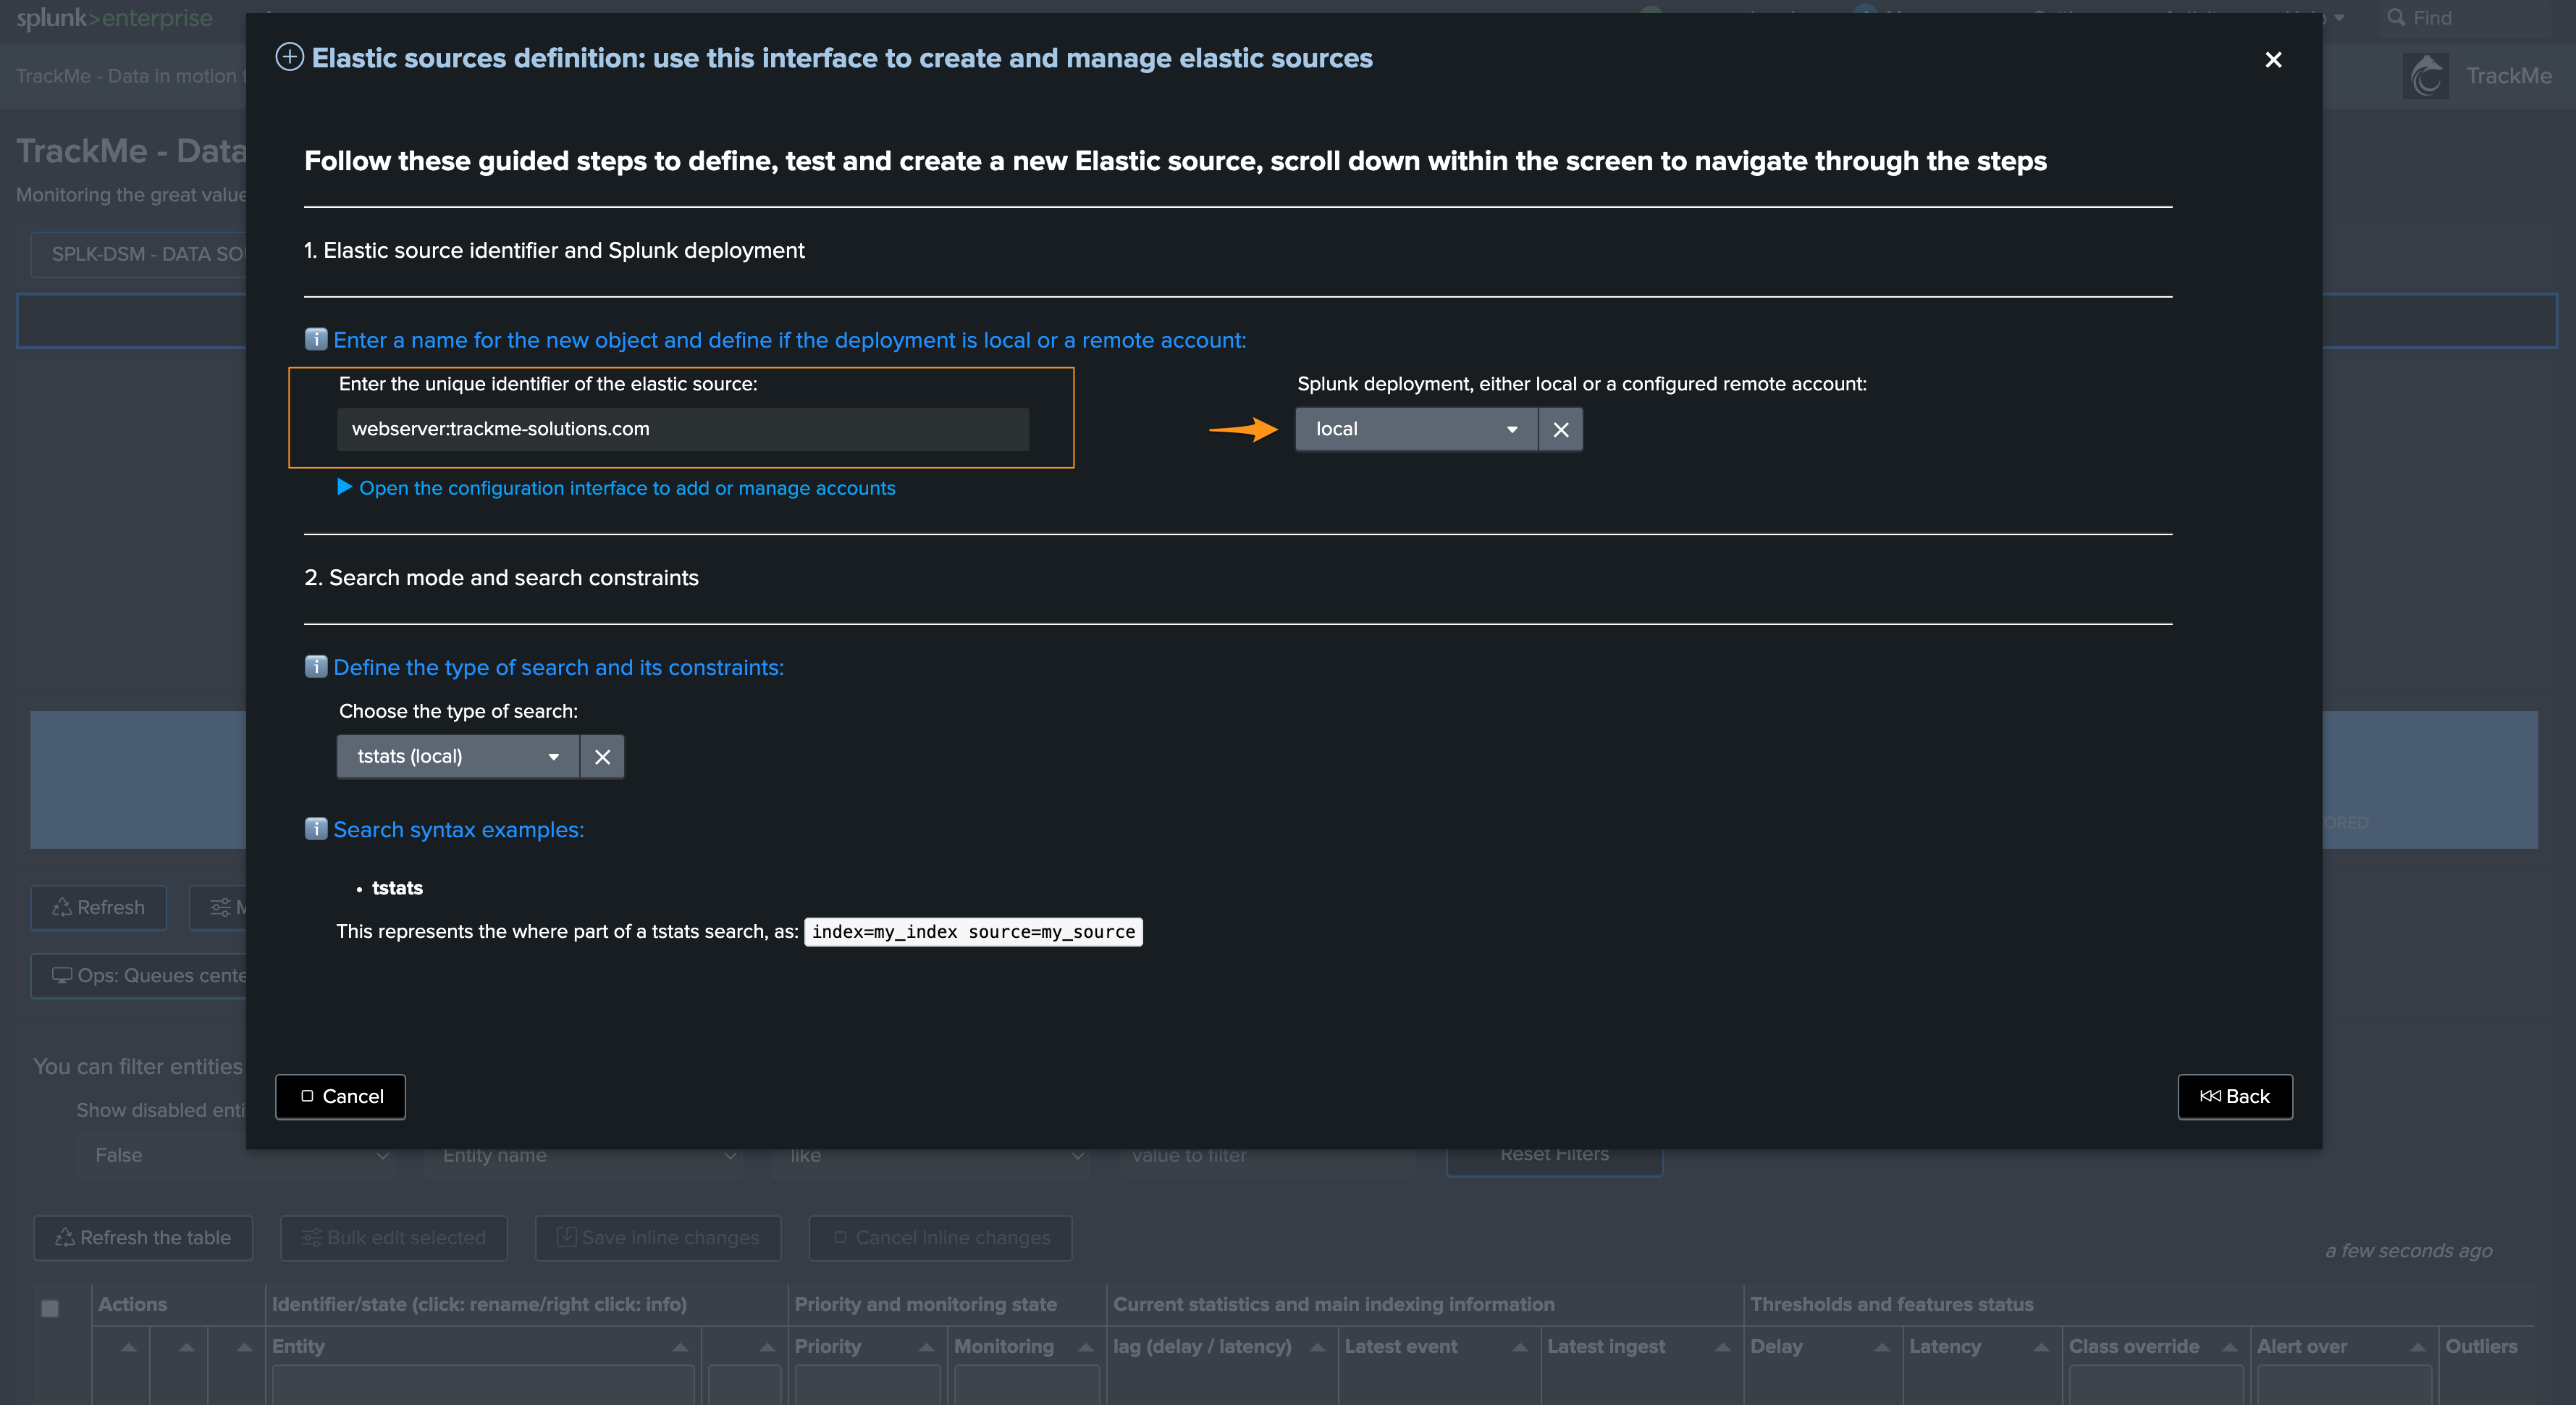
Step 2: choose the language
You can choose between different options, in our case we will use
rawbecause we want to use search time extracted fields
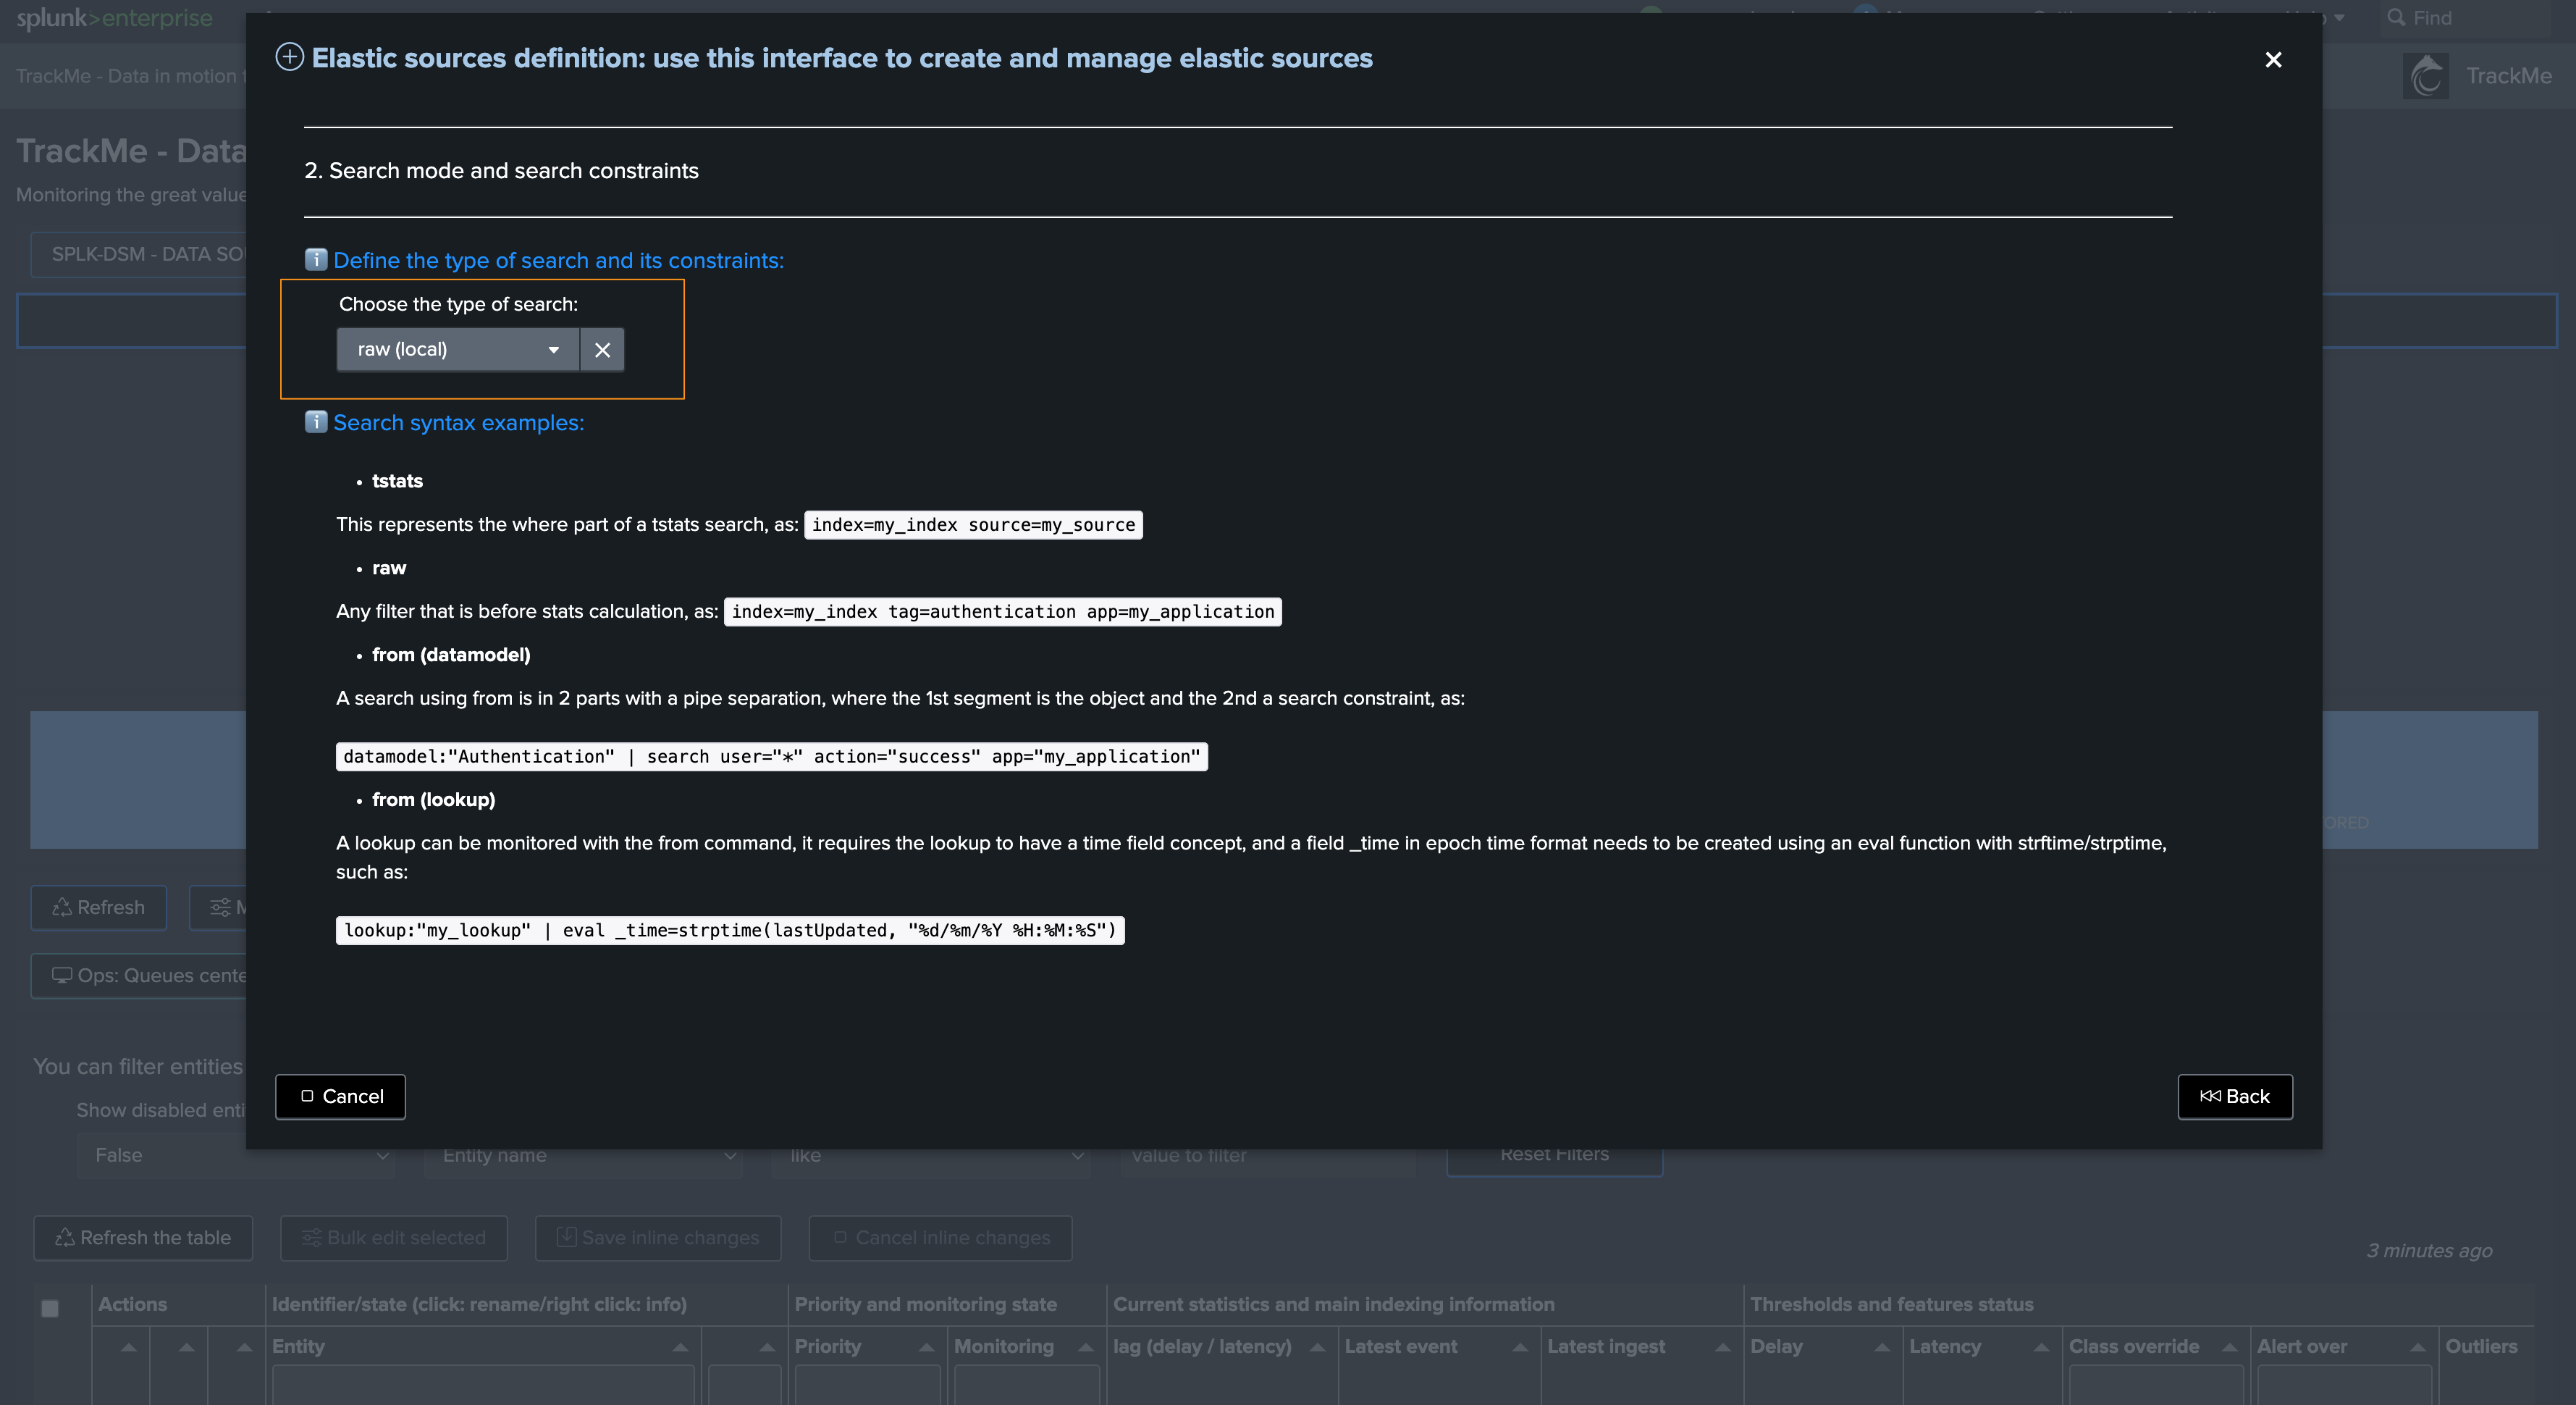
Then we define the search constraint:
The search constraint should target valid filters, allowing the search to be as efficient as possible and targeting the data we want to monitor

Hint
Defining the search constraint
The search constraint is meant to be the list of filters providing access to the data you want to monitor
This can be a simple constraint, or a complex one using OR and AND operators, different levels of parentheses, etc
However, it is not meant to be the place where you would perform complex regular expression extractions for this instance, this should happen at the props and transforms level instead
In step 3, you should define proper values for index and sourcetypes:
These are virtual values, they do not impact the search itself but are used to classify the entity in the UI
You can choose anything you want, but it is recommended to use values that are meaningful to you
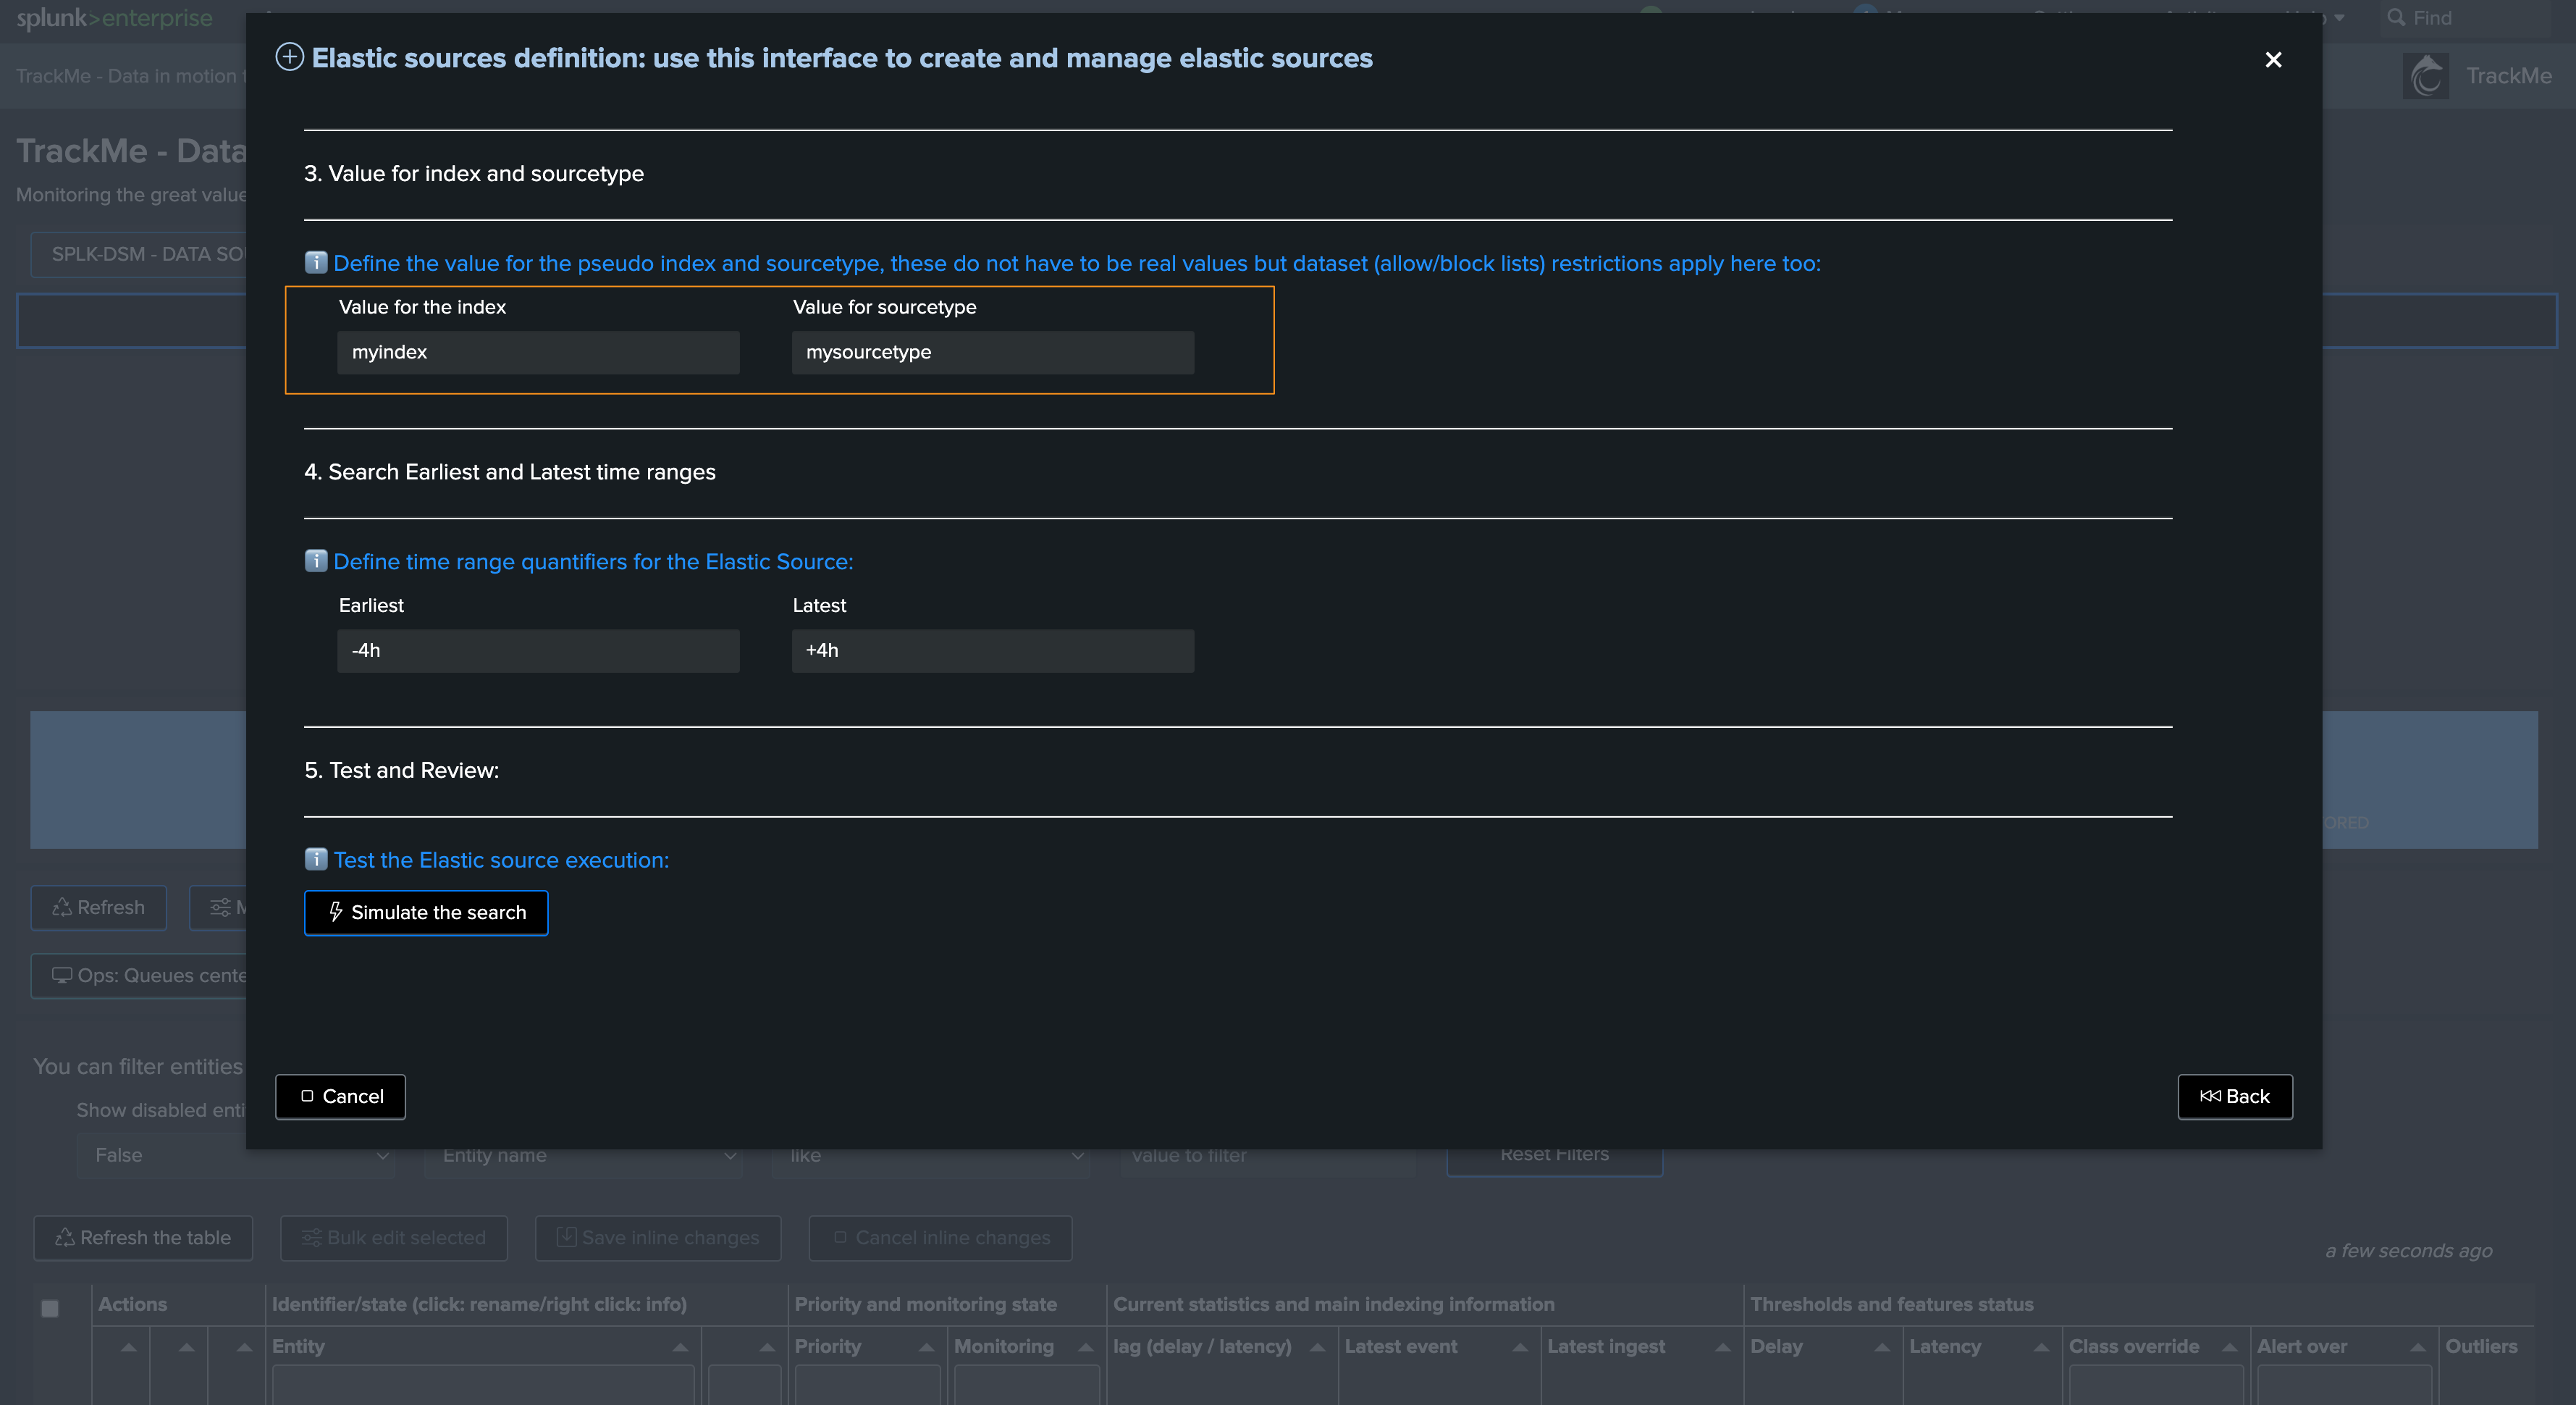
Finally in Step 4, define the earliest and latest time ranges:
These are relevant for both Shared and Dedicated Sources
The values influence how performing this search will be, especially with raw searches
In this example, we reduce the earliest to -1h, latest should be in the future to be able to detect events abnormally defined in the future
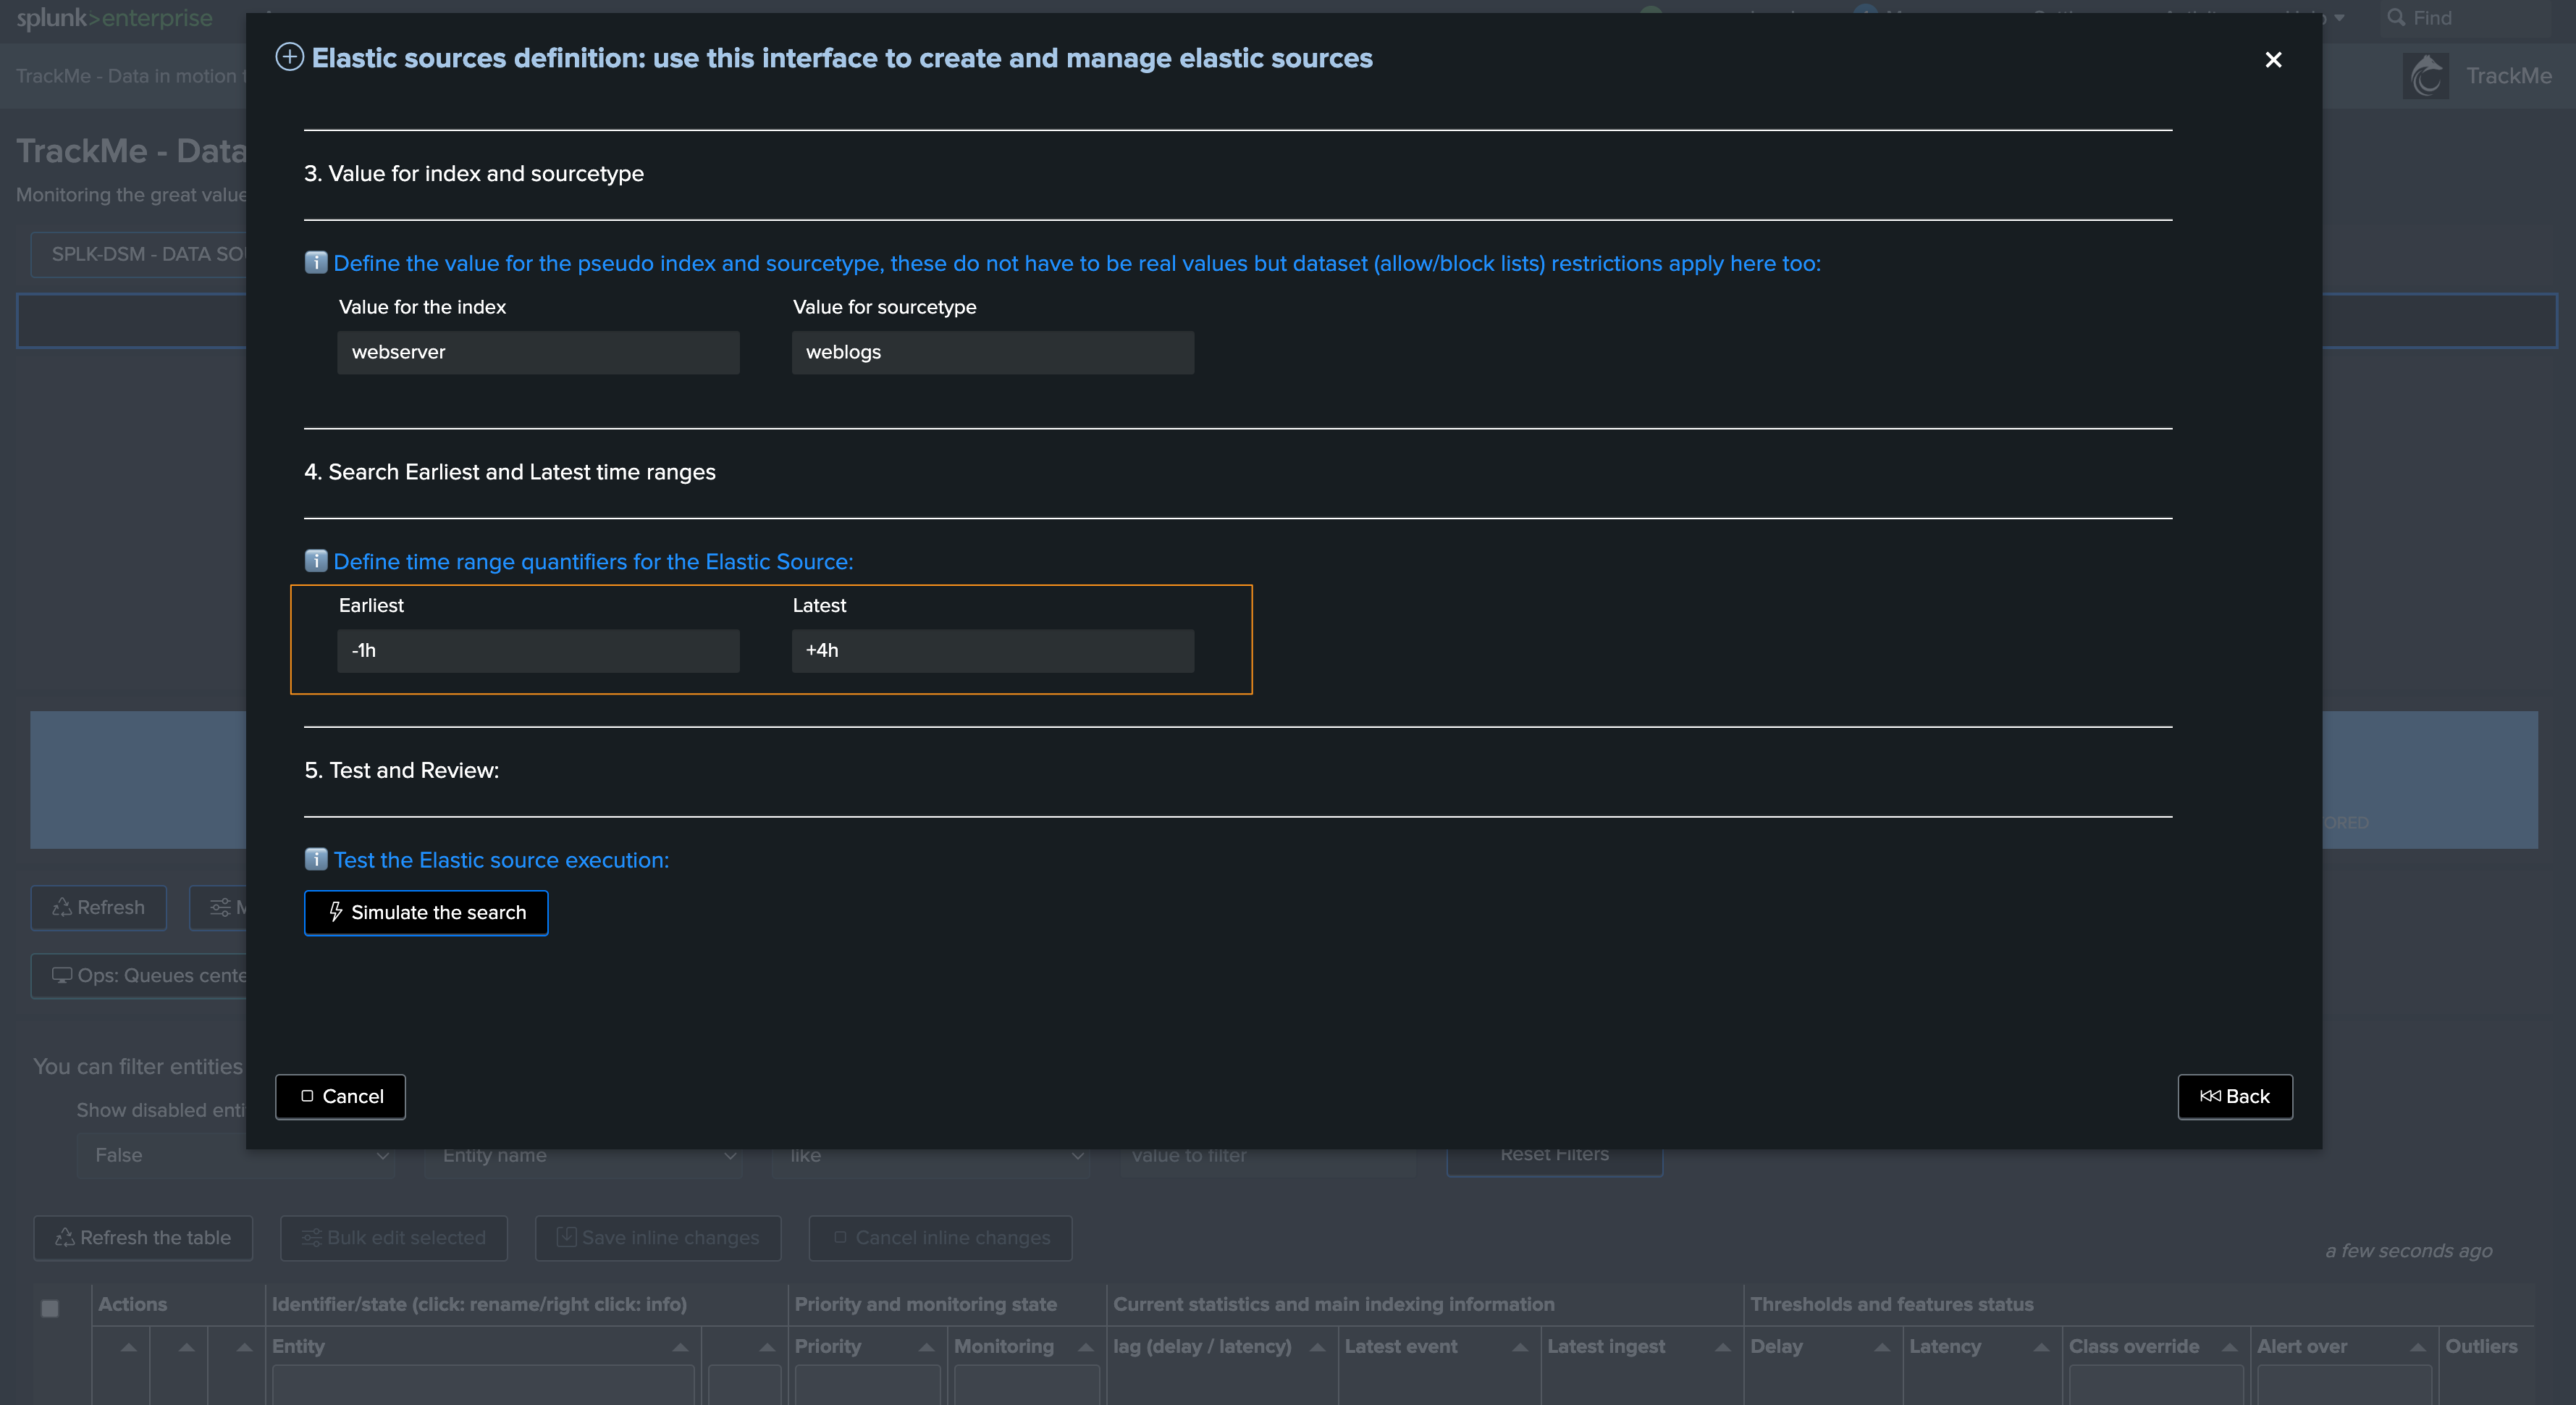
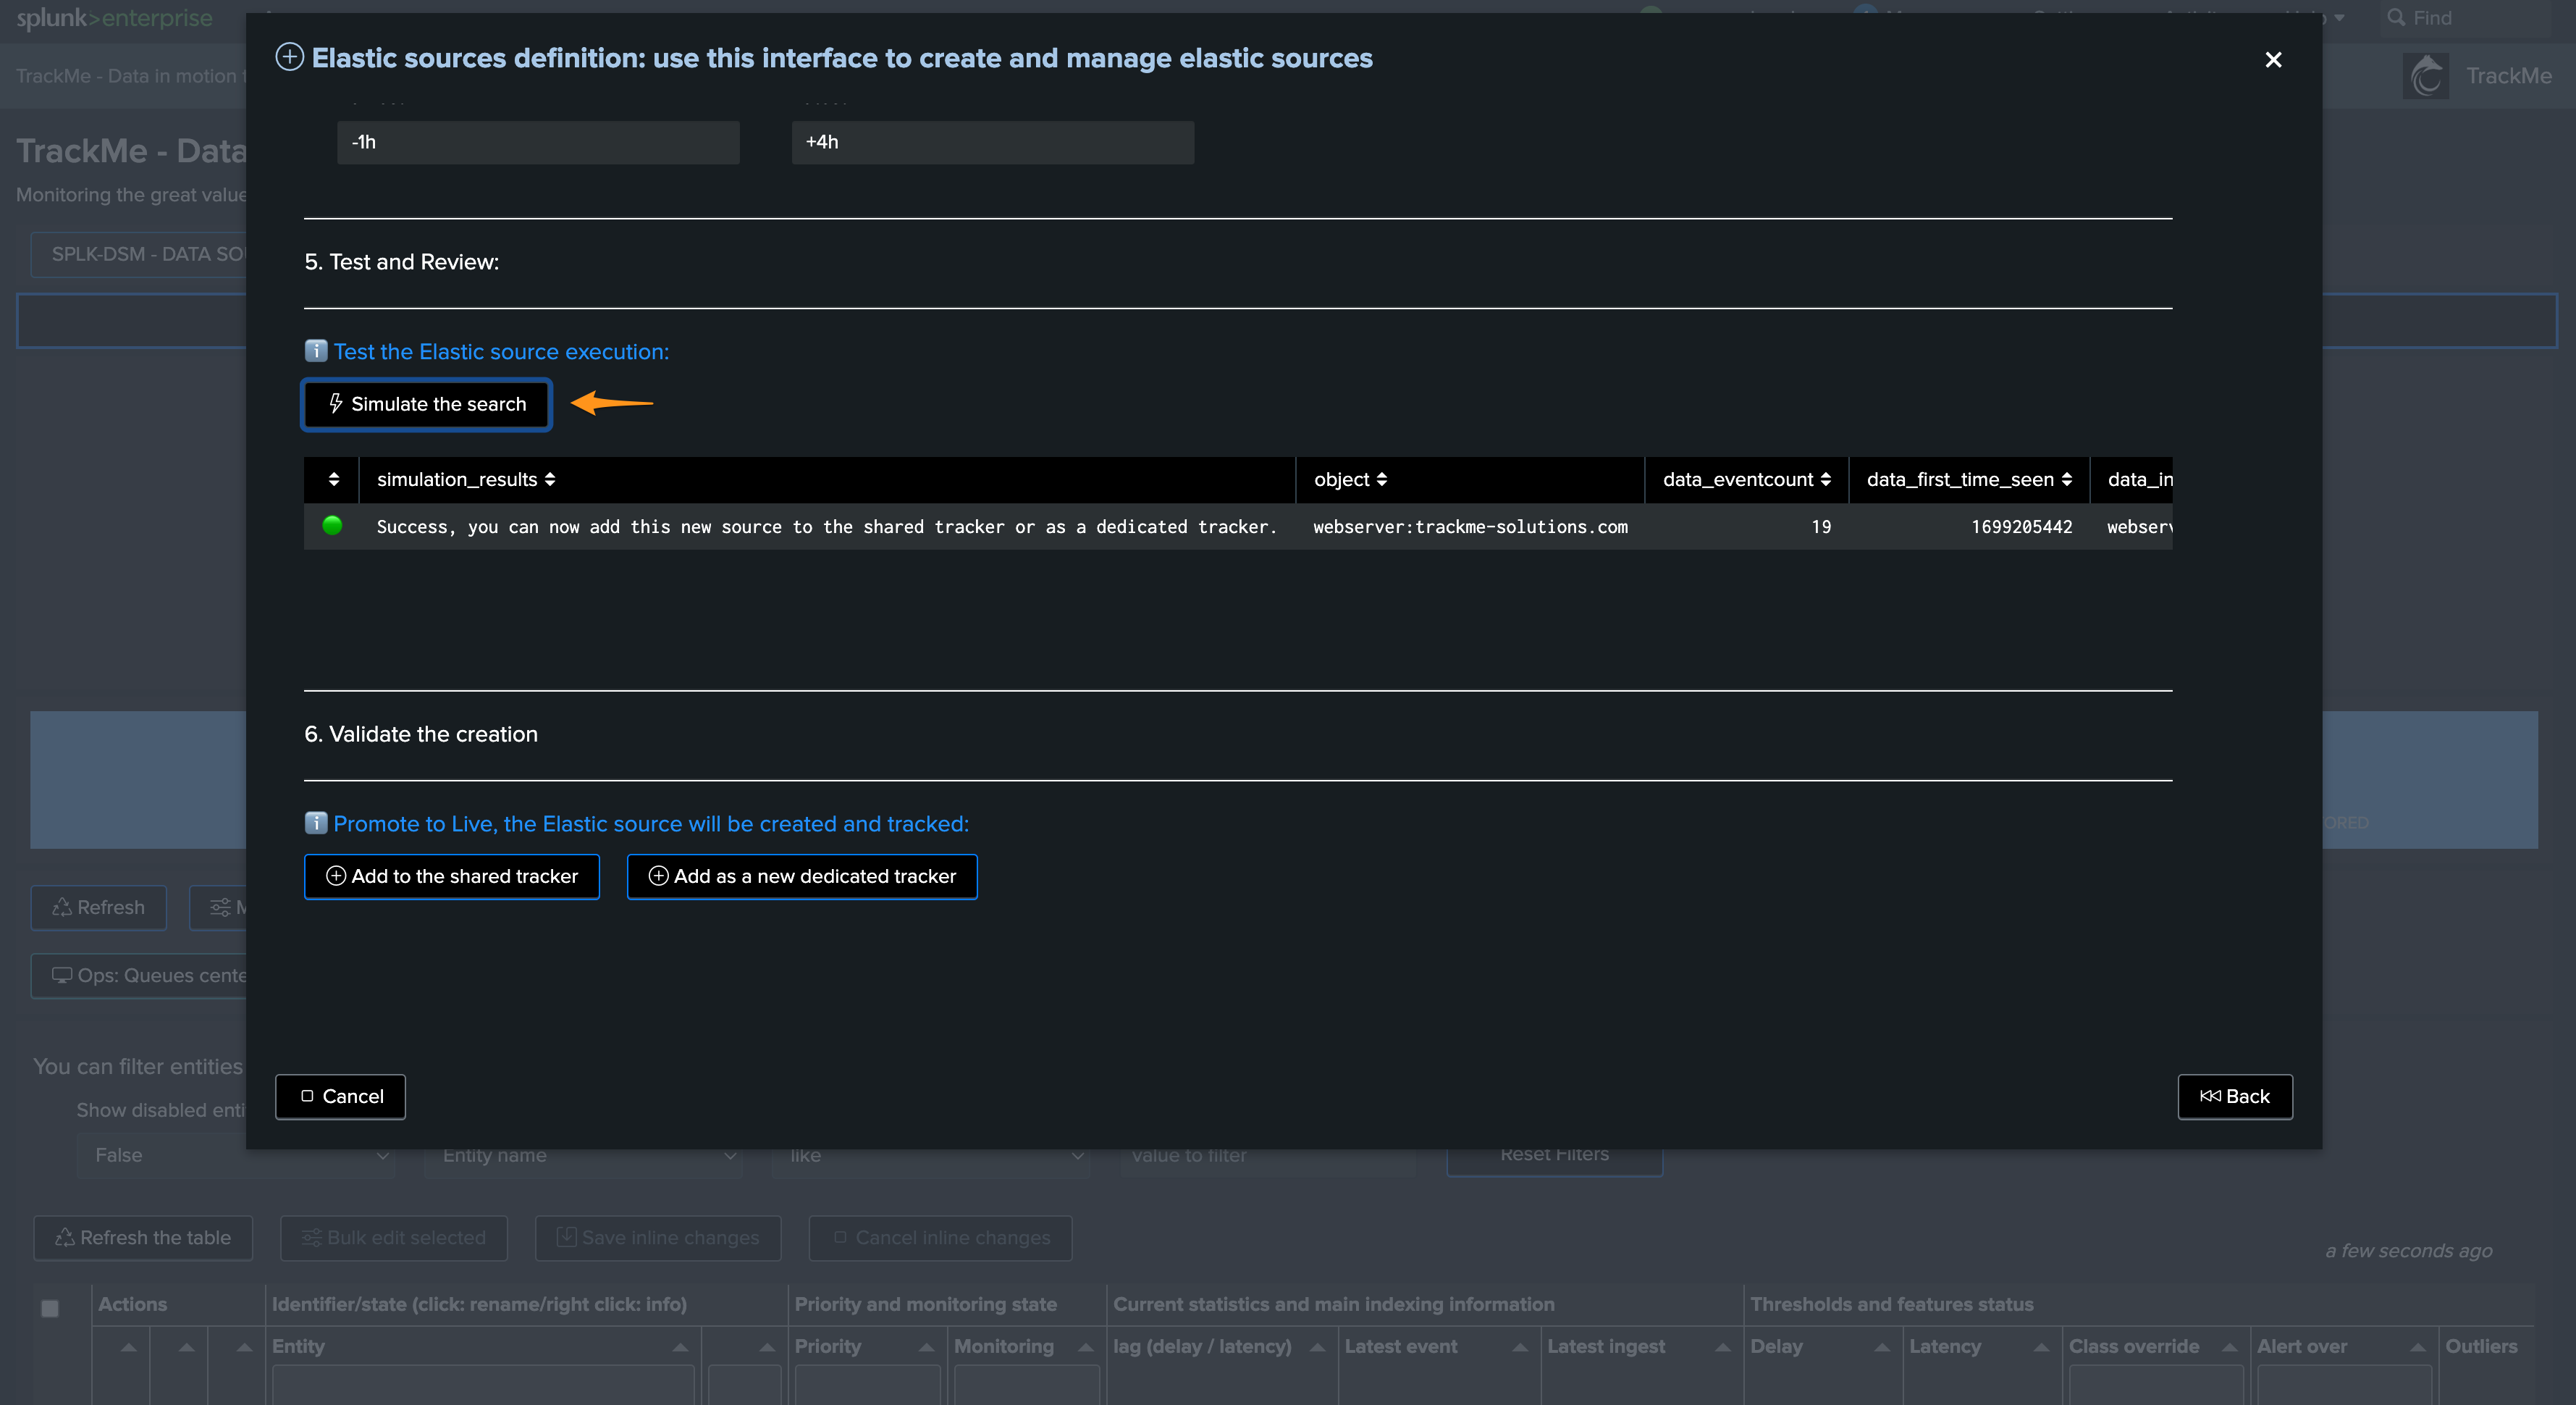
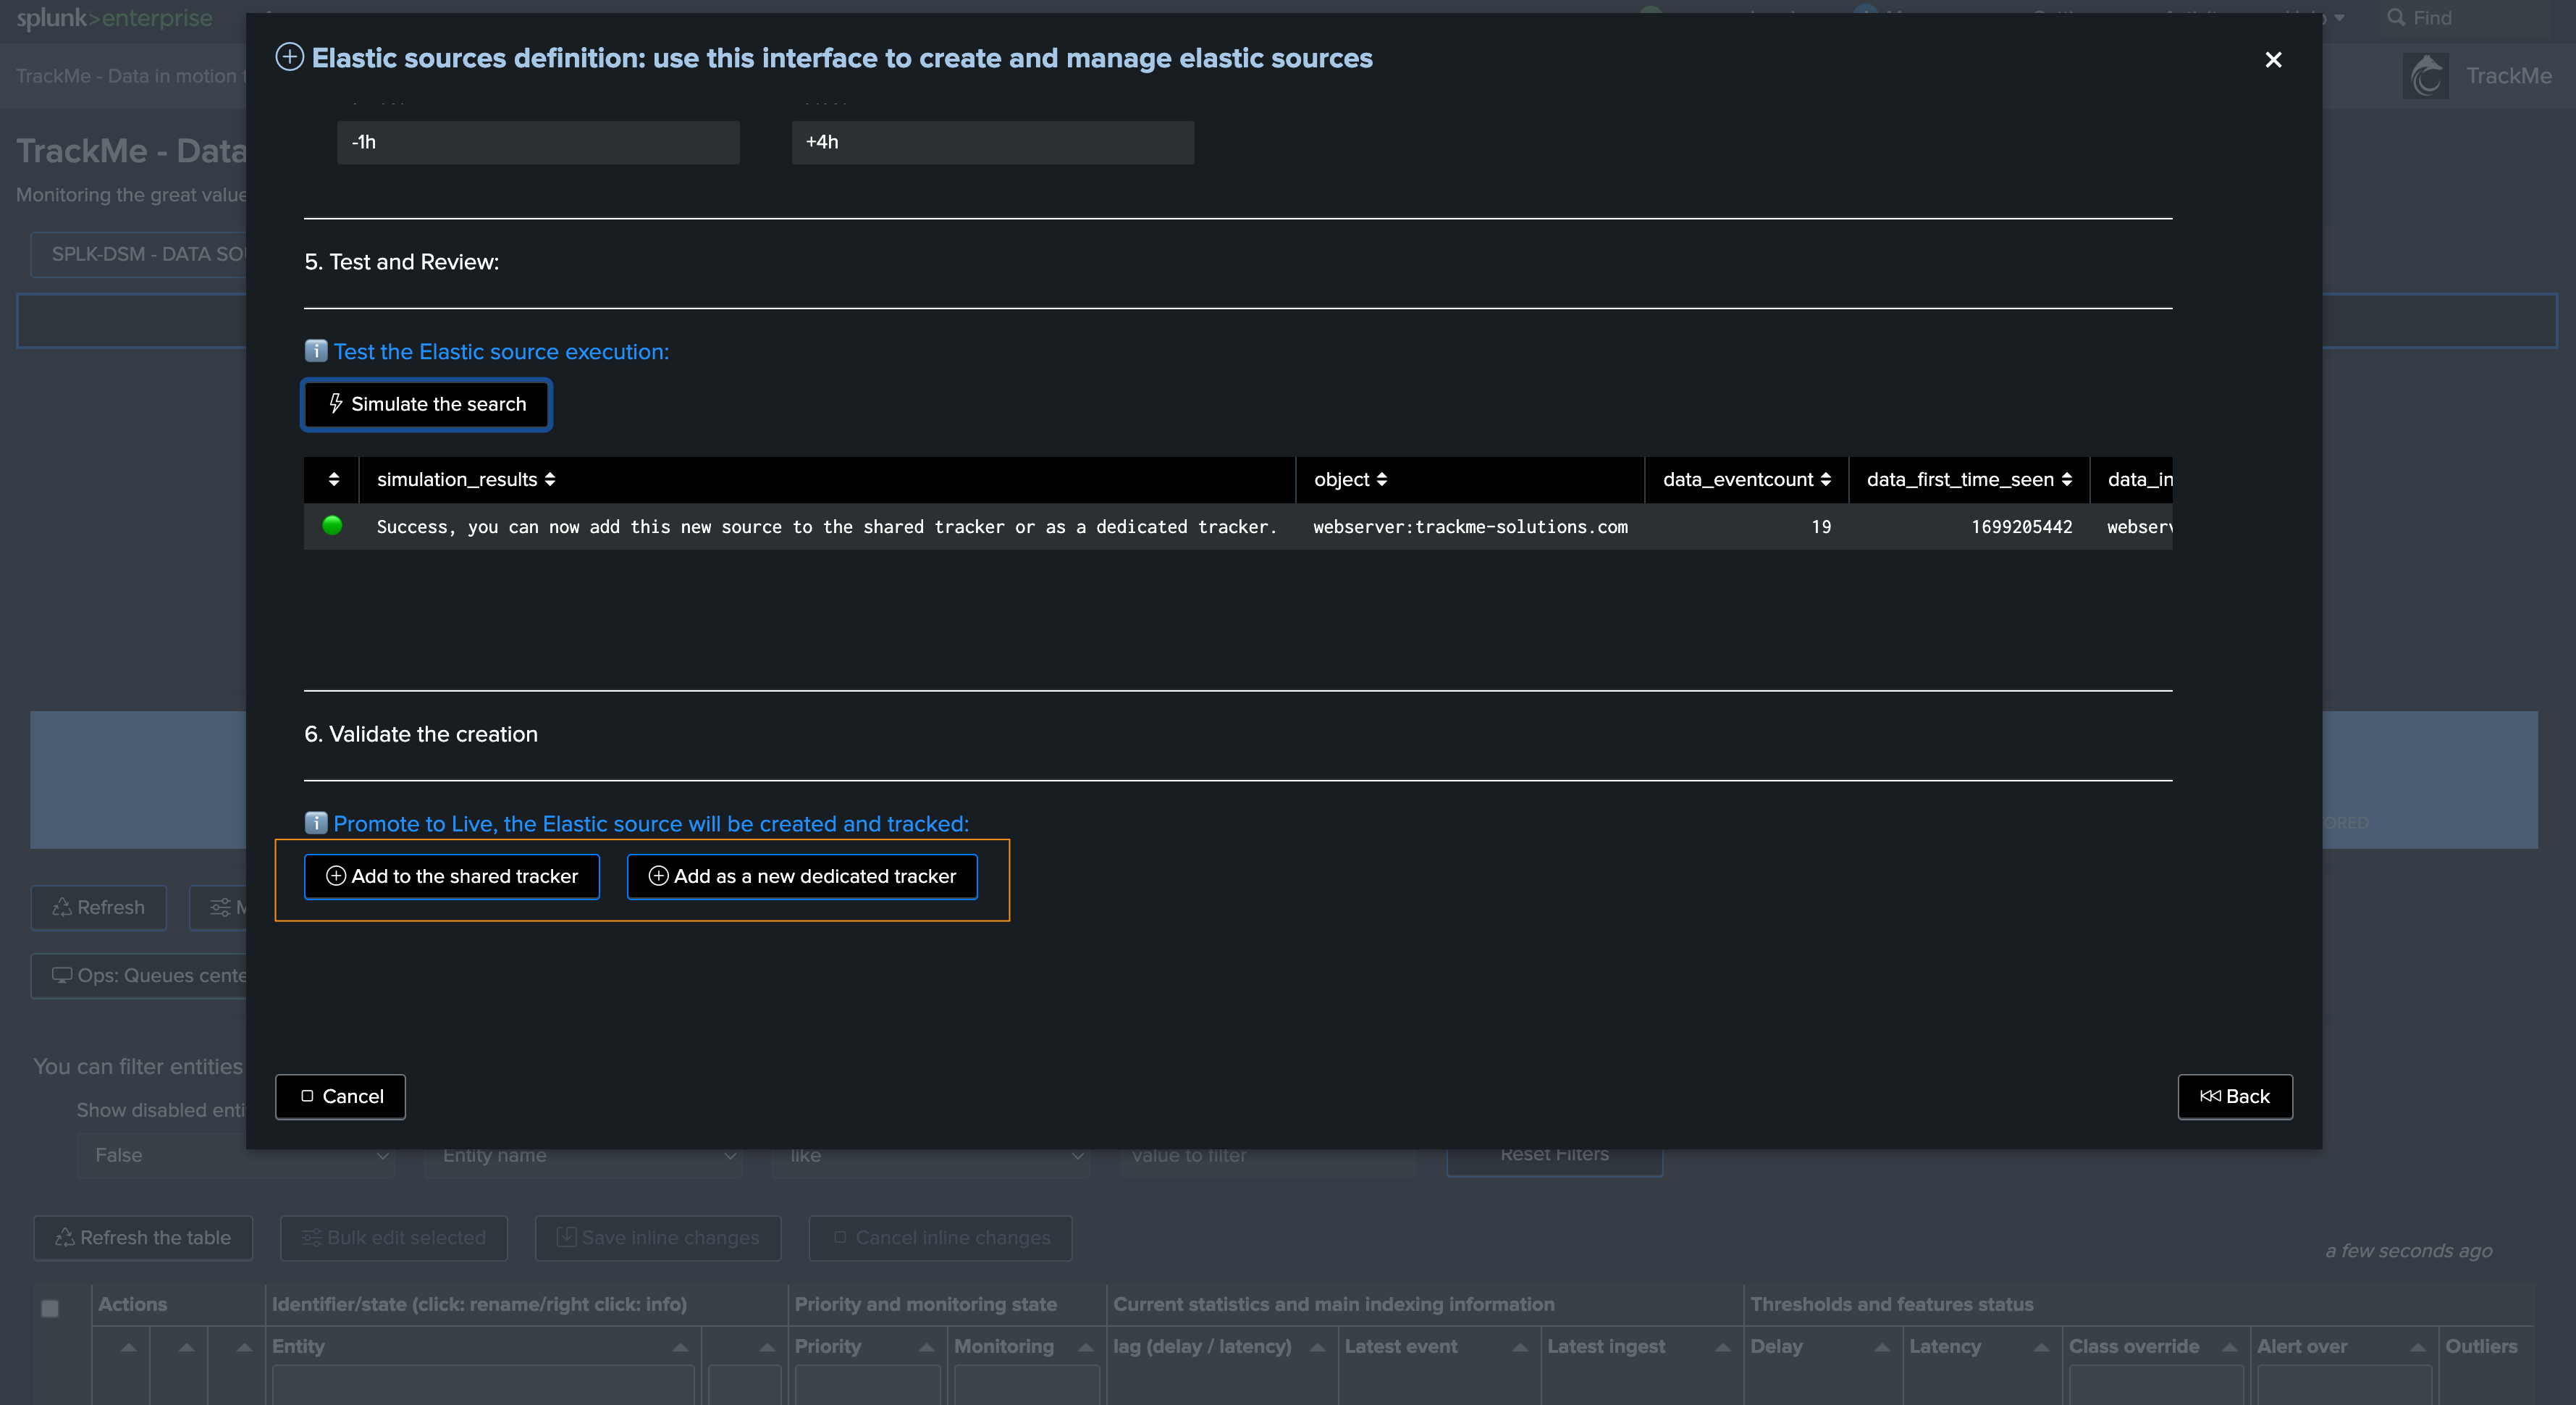
Finally, after the simulation, we validate the creation as Shared or Dedicated:


Elastic source example 2: tracking lookups update and number of records
In this example, we will demonstrate how we can monitor the content of a Splunk lookup, KVstore or CSV based lookup, and get alerted if the lookup is not updated as expected.
Lookups are very useful in Splunk, we use these all the time as intermediate storage, for enrichment purposes, etc.
However, and this is especially true for security use cases, being capable of detecting if a lookup used in other use cases has stopped being updated or maintained is a critical requirement.
In our example, we have a KVstore based lookup called cybops_net_traffic_monitor which is updated on a regular basis and contains some associations and pre-calculations for network devices:
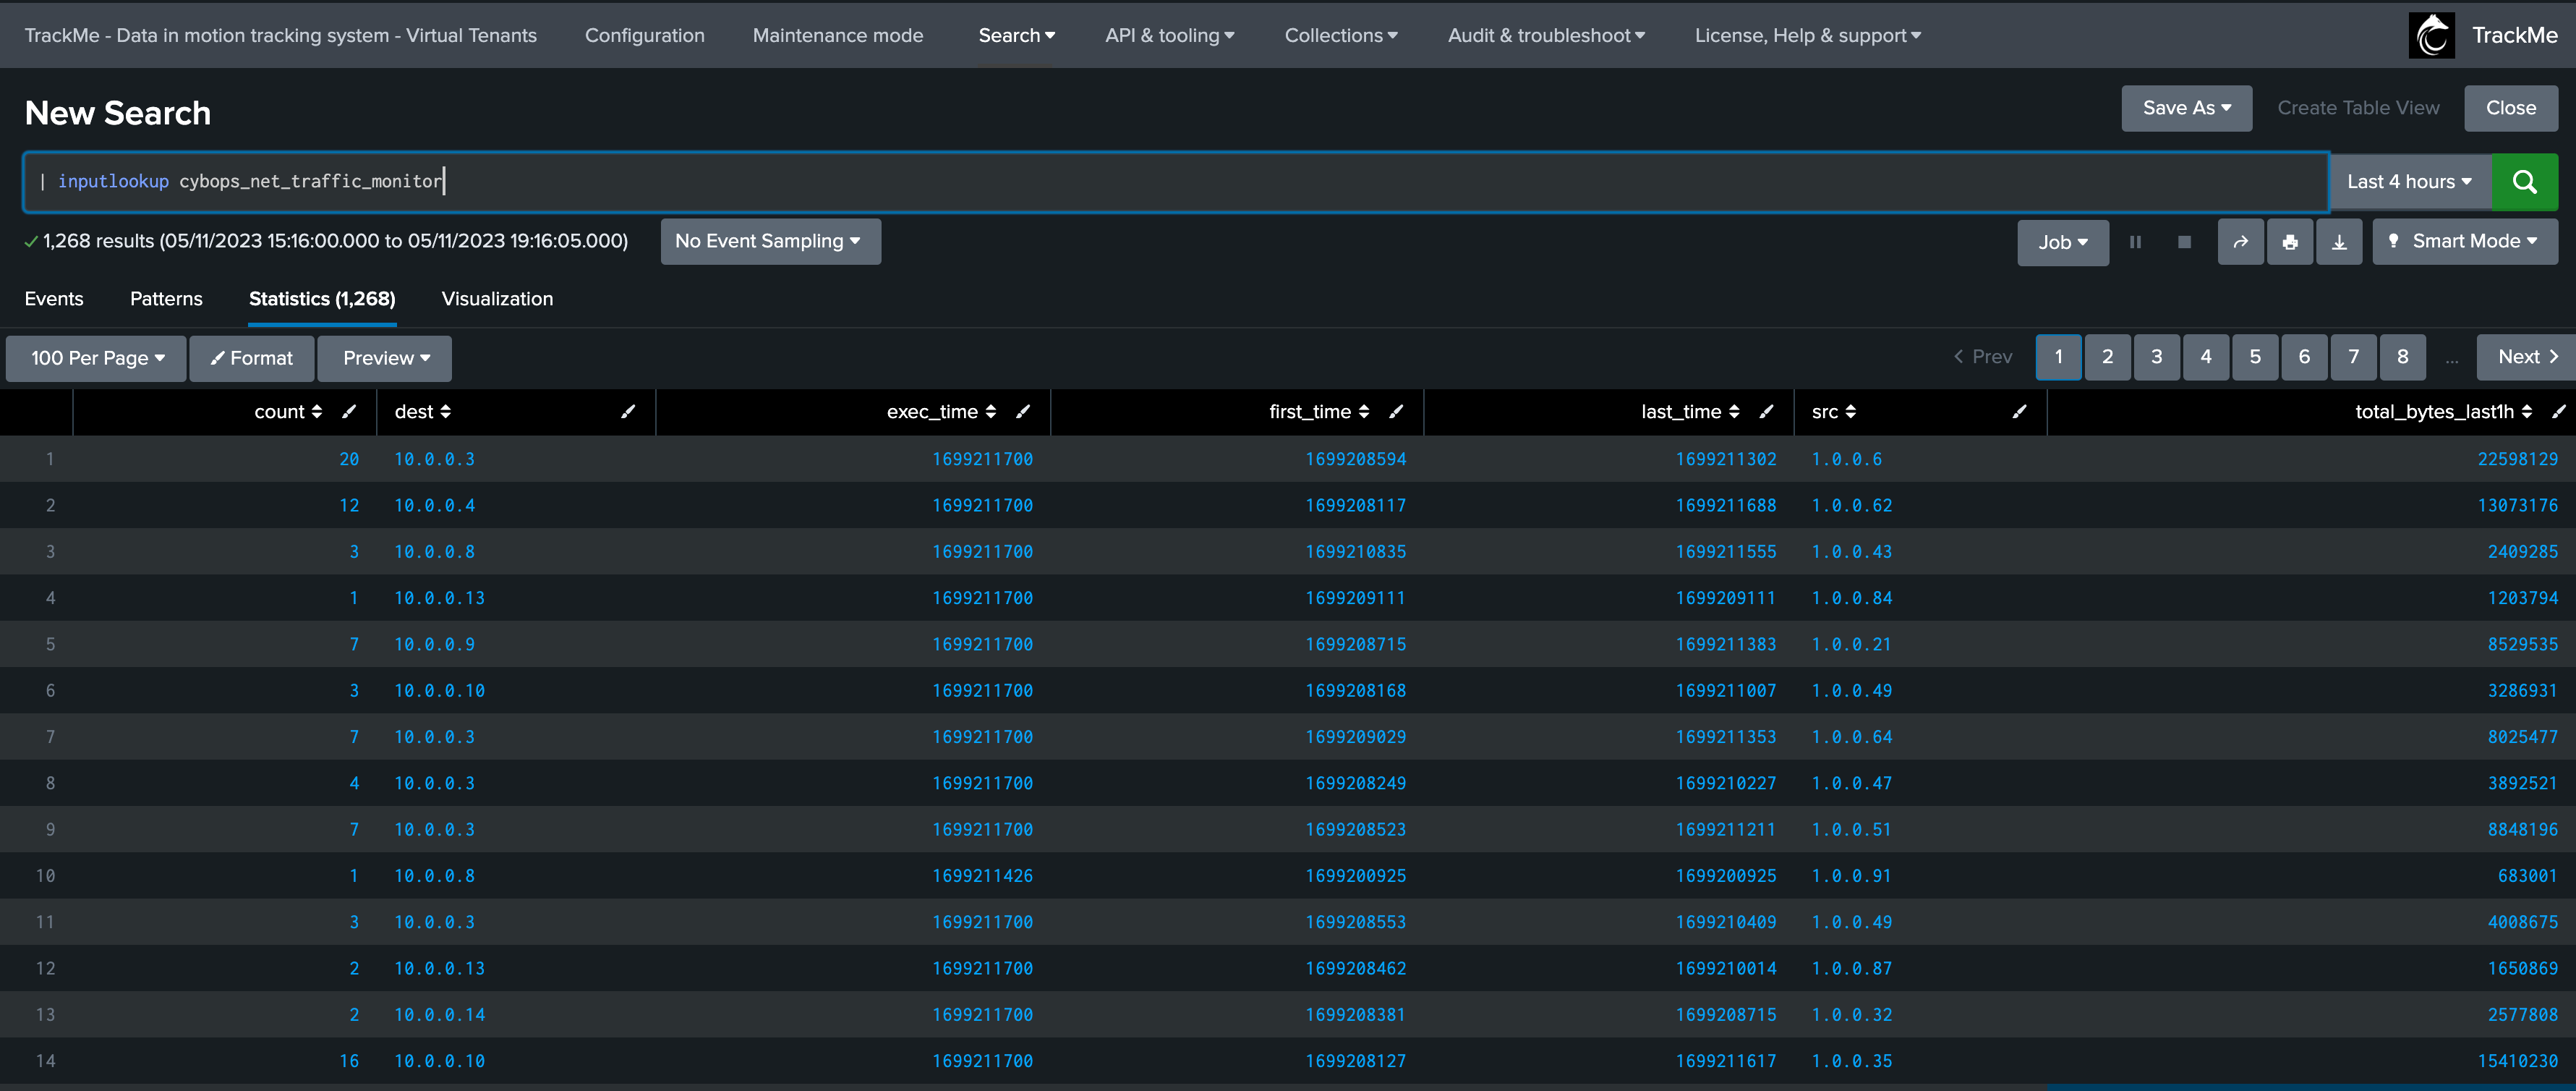
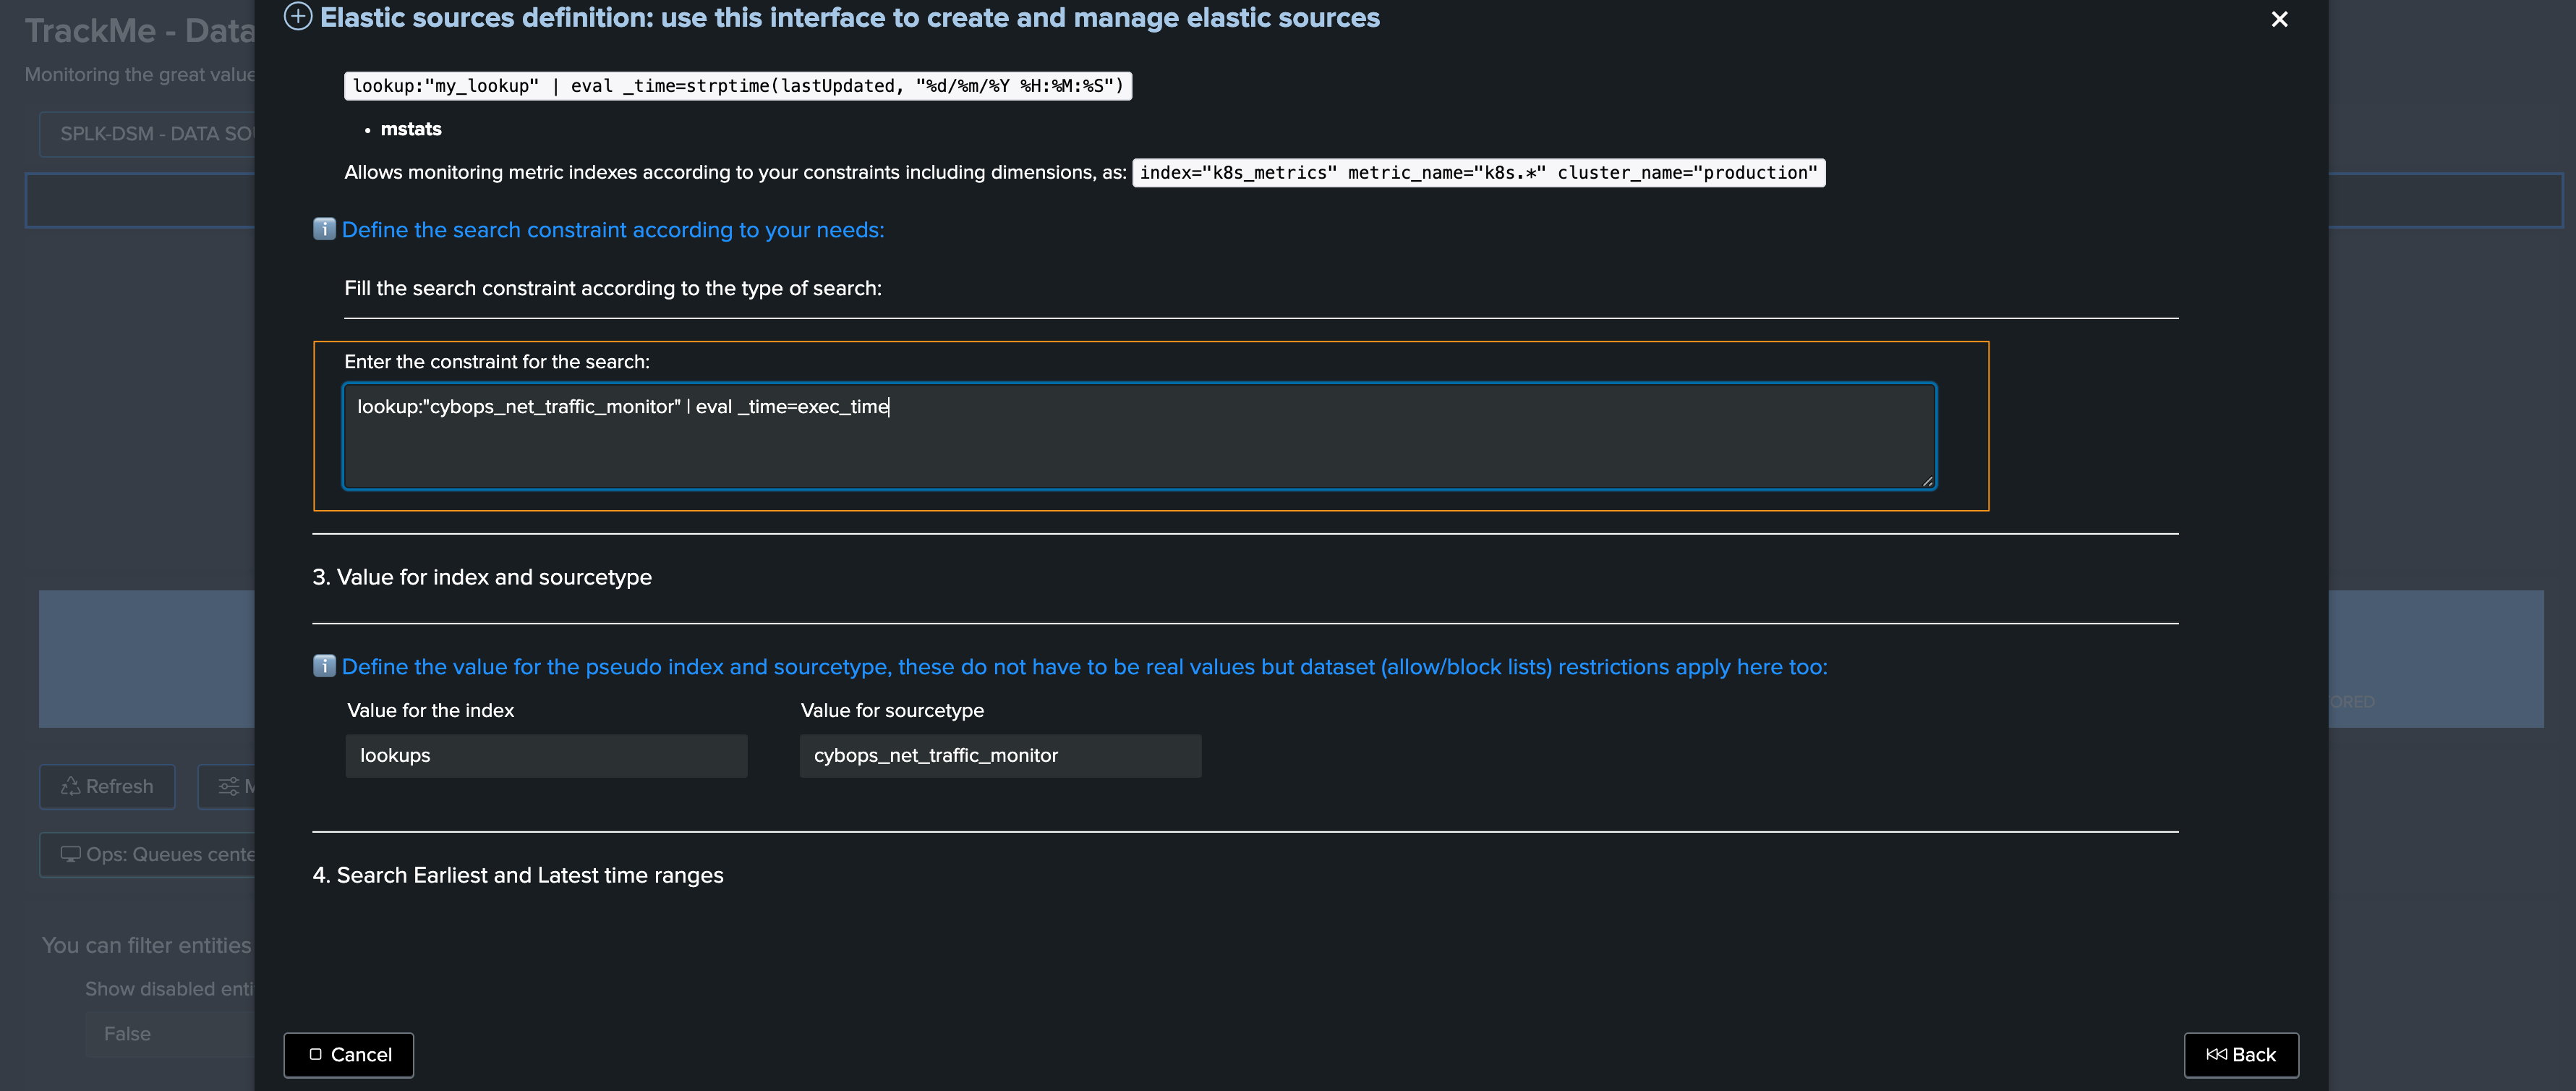
We will use the following Elastic Source definition to monitor our lookup, and we will leverage the exec_time field to define the _time value:
| from lookup:cybops_net_traffic_monitor | eval _time=exec_time
Administering Shared Elastic Sources
Shared Elastic sources are orchestrated by the Shared Elastic tracker, this tracker is automatically created along with the Virtual Tenant creation. (if the component splk-dsm is enabled)
The tracker is called:
trackme_dsm_shared_elastic_tracker_tenant_<tenant_id>
The tracker is a scheduler wrapper which calls a Python engine:
| trackmeelasticexecutor tenant_id="<tenant_id>" component="splk-dsm"
You can find its execution logs using the following search:
index=_internal sourcetype=trackme:custom_commands:trackmeelasticexecutor
The Shared Elastic tracker loads entities to be processed from a KVstore, the following search shows the content of the KVstore: (update the tenant_id)
| inputlookup trackme_dsm_elastic_shared_tenant_<tenant_id>
Its execution is influenced by the following configuration item(s), go in Configuration / splk-general:
Option |
Purpose |
Default |
|---|---|---|
Concurrent searches Elastic |
System level number of parallel concurrent searches for Shared Elastic sources, this can be overridden on a per tenant basis using max_concurrent_searches on the Shared Elastic tracker |
3 |
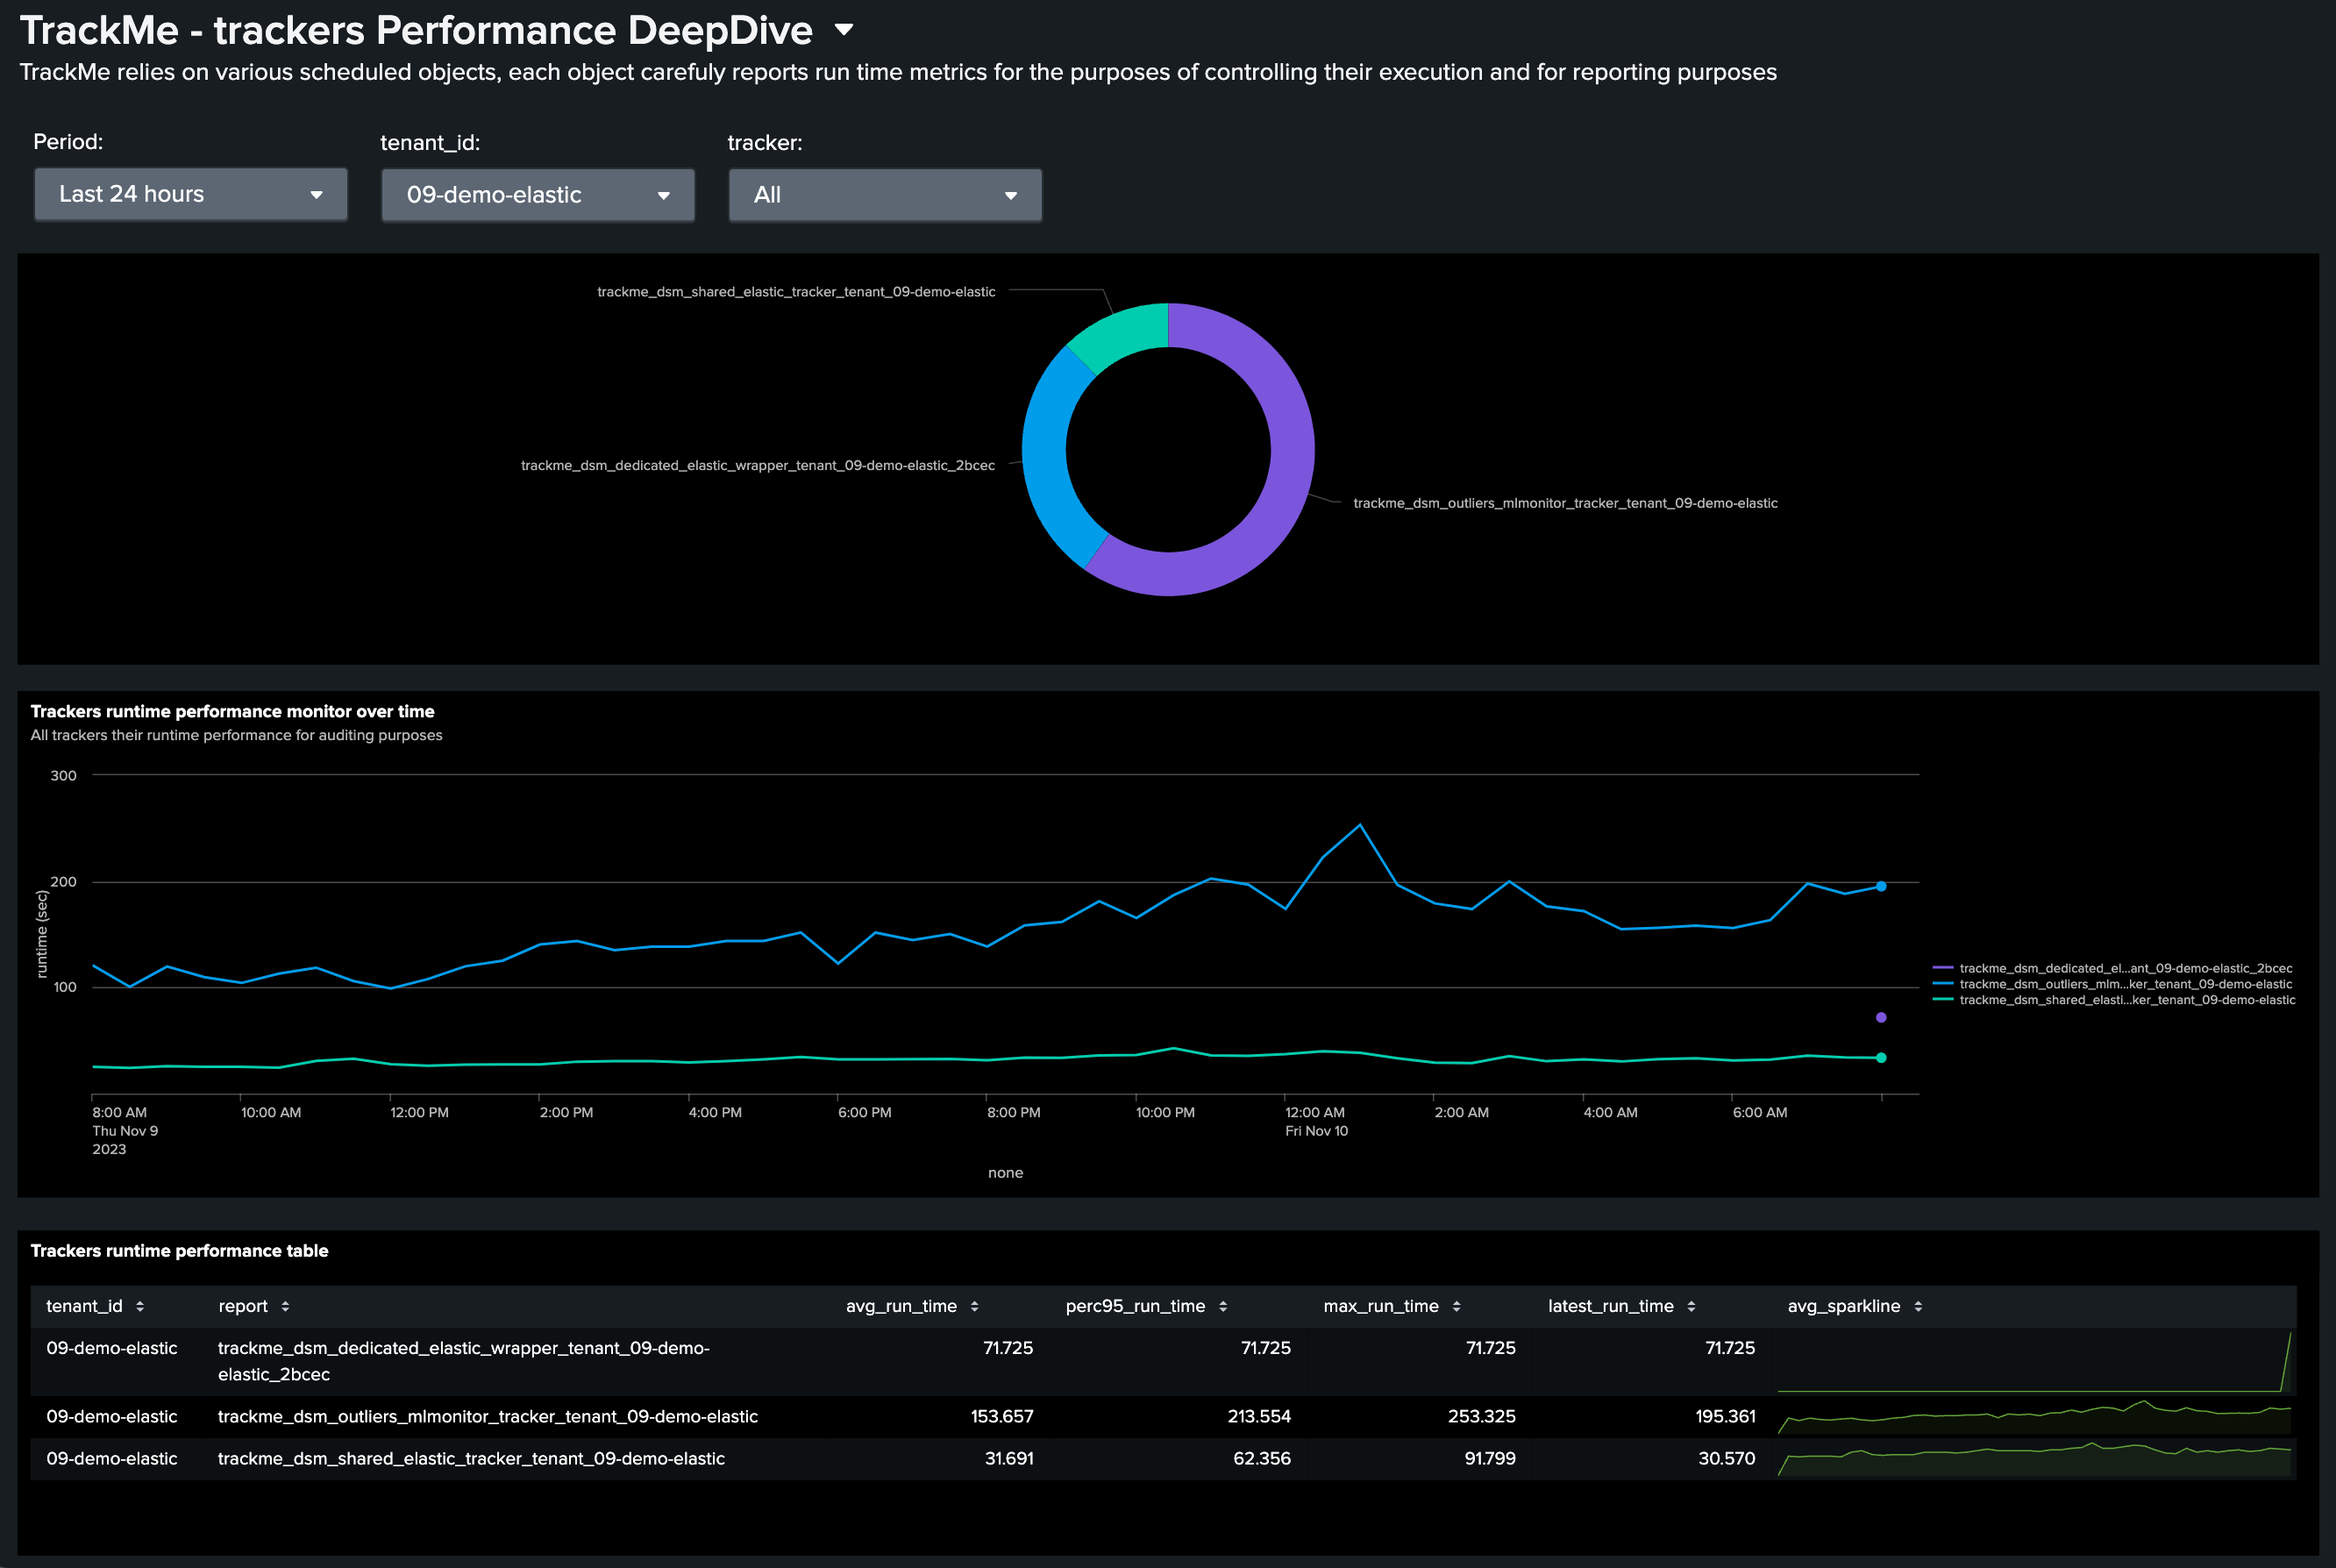
You can review the performance run time of the Shared Elastic Tracker using the deep dive dashboard:

When the job starts, the following message is shown:
2023-11-09 22:21:11,840 INFO trackmeelasticexecutor.py generate 426 tenant_id="09-demo-elastic", component="splk-dsm", report="trackme_dsm_shared_elastic_tracker_tenant_09-demo-elastic", Elastic Sources shared job started, max_concurrent_searches=3, margin_sec=60
This message indicates the current number of max concurrent searches, as well as the time margin in seconds to calculate the max run time of the full job.
The max concurrent job is first defined at the global level as explained above, but it can also be overridden on a per tenant basis adding the argument in the search definition:
**Syntax:** **max_concurrent_searches=****
**Description:** The max number of searches to be executed in parallel, if set to a different value than the system default, this value wins.
The margin in seconds defines the time in seconds to be deducted from the total cron translation in seconds, for instance if the job is scheduled to run every 5 minutes, the cron sequence is 300, the job will interrupt at 300-<margin_sec>, this value can be overridden on a per tenant basis by adding the argument:
**Syntax:** **margin_sec=****
**Description:** The time in seconds used as a margin when calculating the max runtime depending on the cron schedule.
If the search is triggered every 5 minutes, the max runtime will be 5 minutes less the margin_sec value.
When the job inspects an entity to be processed, it will show the following message: (example)
2023-11-09 22:32:28,903 INFO trackmeelasticexecutor.py process_elastic_object 176 tenant_id="09-demo-elastic", component="splk-dsm", report="trackme_dsm_shared_elastic_tracker_tenant_09-demo-elastic", processing elastic object, object="elastic:local:lookup:cybops_net_traffic_monitor", last inspection with tracker_runtime="2023-11-09 22:26:57", elastic_report_root_search="| from lookup:cybops_net_traffic_monitor | eval _time=exec_time
| eventstats max(_time) as indextime | eval _indextime=if(isnum(_indextime), _indextime, indextime) | fields - indextime
| eval host=if(isnull(host), "none", host)
| stats max(_indextime) as data_last_ingest, min(_time) as data_first_time_seen, max(_time) as data_last_time_seen, count as data_eventcount, dc(host) as dcount_host
| eval latest_eventcount_5m=data_eventcount
| eval object="elastic:local:lookup:cybops_net_traffic_monitor", data_index="lookups", data_sourcetype="cybops_net_traffic_monitor" | `trackme_elastic_dedicated_tracker("09-demo-elastic")`
| eval tenant_id="09-demo-elastic"
| stats count as report_entities_count by tenant_id
| `register_tenant_component_summary(09-demo-elastic, dsm)`"
Once the search has been executed, TrackMe shows is summary result and its run time information:
2023-11-09 22:32:57,742 INFO trackmeelasticexecutor.py process_elastic_object 245 tenant_id="09-demo-elastic", component="splk-dsm", object="elastic:local:lookup:cybops_net_traffic_monitor", report="trackme_dsm_shared_elastic_tracker_tenant_09-demo-elastic", Entity search successfully executed, status="success", run_time="28.839"
If the system reaches the max number of concurrent searches (Splunk wise), TrackMe will re-attempt automatically for a certain number of times, which is visible with a warning message:
2023-11-09 22:46:54,302 WARNING trackmeelasticexecutor.py process_elastic_object 265 tenant_id="09-demo-elastic", component="splk-dsm", report="trackme_dsm_shared_elastic_tracker_tenant_09-demo-elastic", temporary search failure, current_failures_count=4, max_failures_count=24, exception="HTTP 503 Service Unavailable -- b'{"messages":[{"type":"WARN","text":"Search not executed: The maximum number of concurrent historical searches on this instance has been reached., concurrency_category=\\"historical\\", concurrency_context=\\"instance-wide\\", current_concurrency=30, concurrency_limit=30","help":""}]}'"
Once all entities to be processed have been processed effectively, the job will show the following final message which includes the total run time: (which runtime is shown in the deep dive dashboard)
2023-11-09 22:53:18,138 INFO trackmeelasticexecutor.py generate 535 tenant_id="09-demo-elastic", component="splk-dsm", report="trackme_dsm_shared_elastic_tracker_tenant_09-demo-elastic", Elastic Sources shared job successfully executed, status="success", run_time="82.069", entities_count="6"
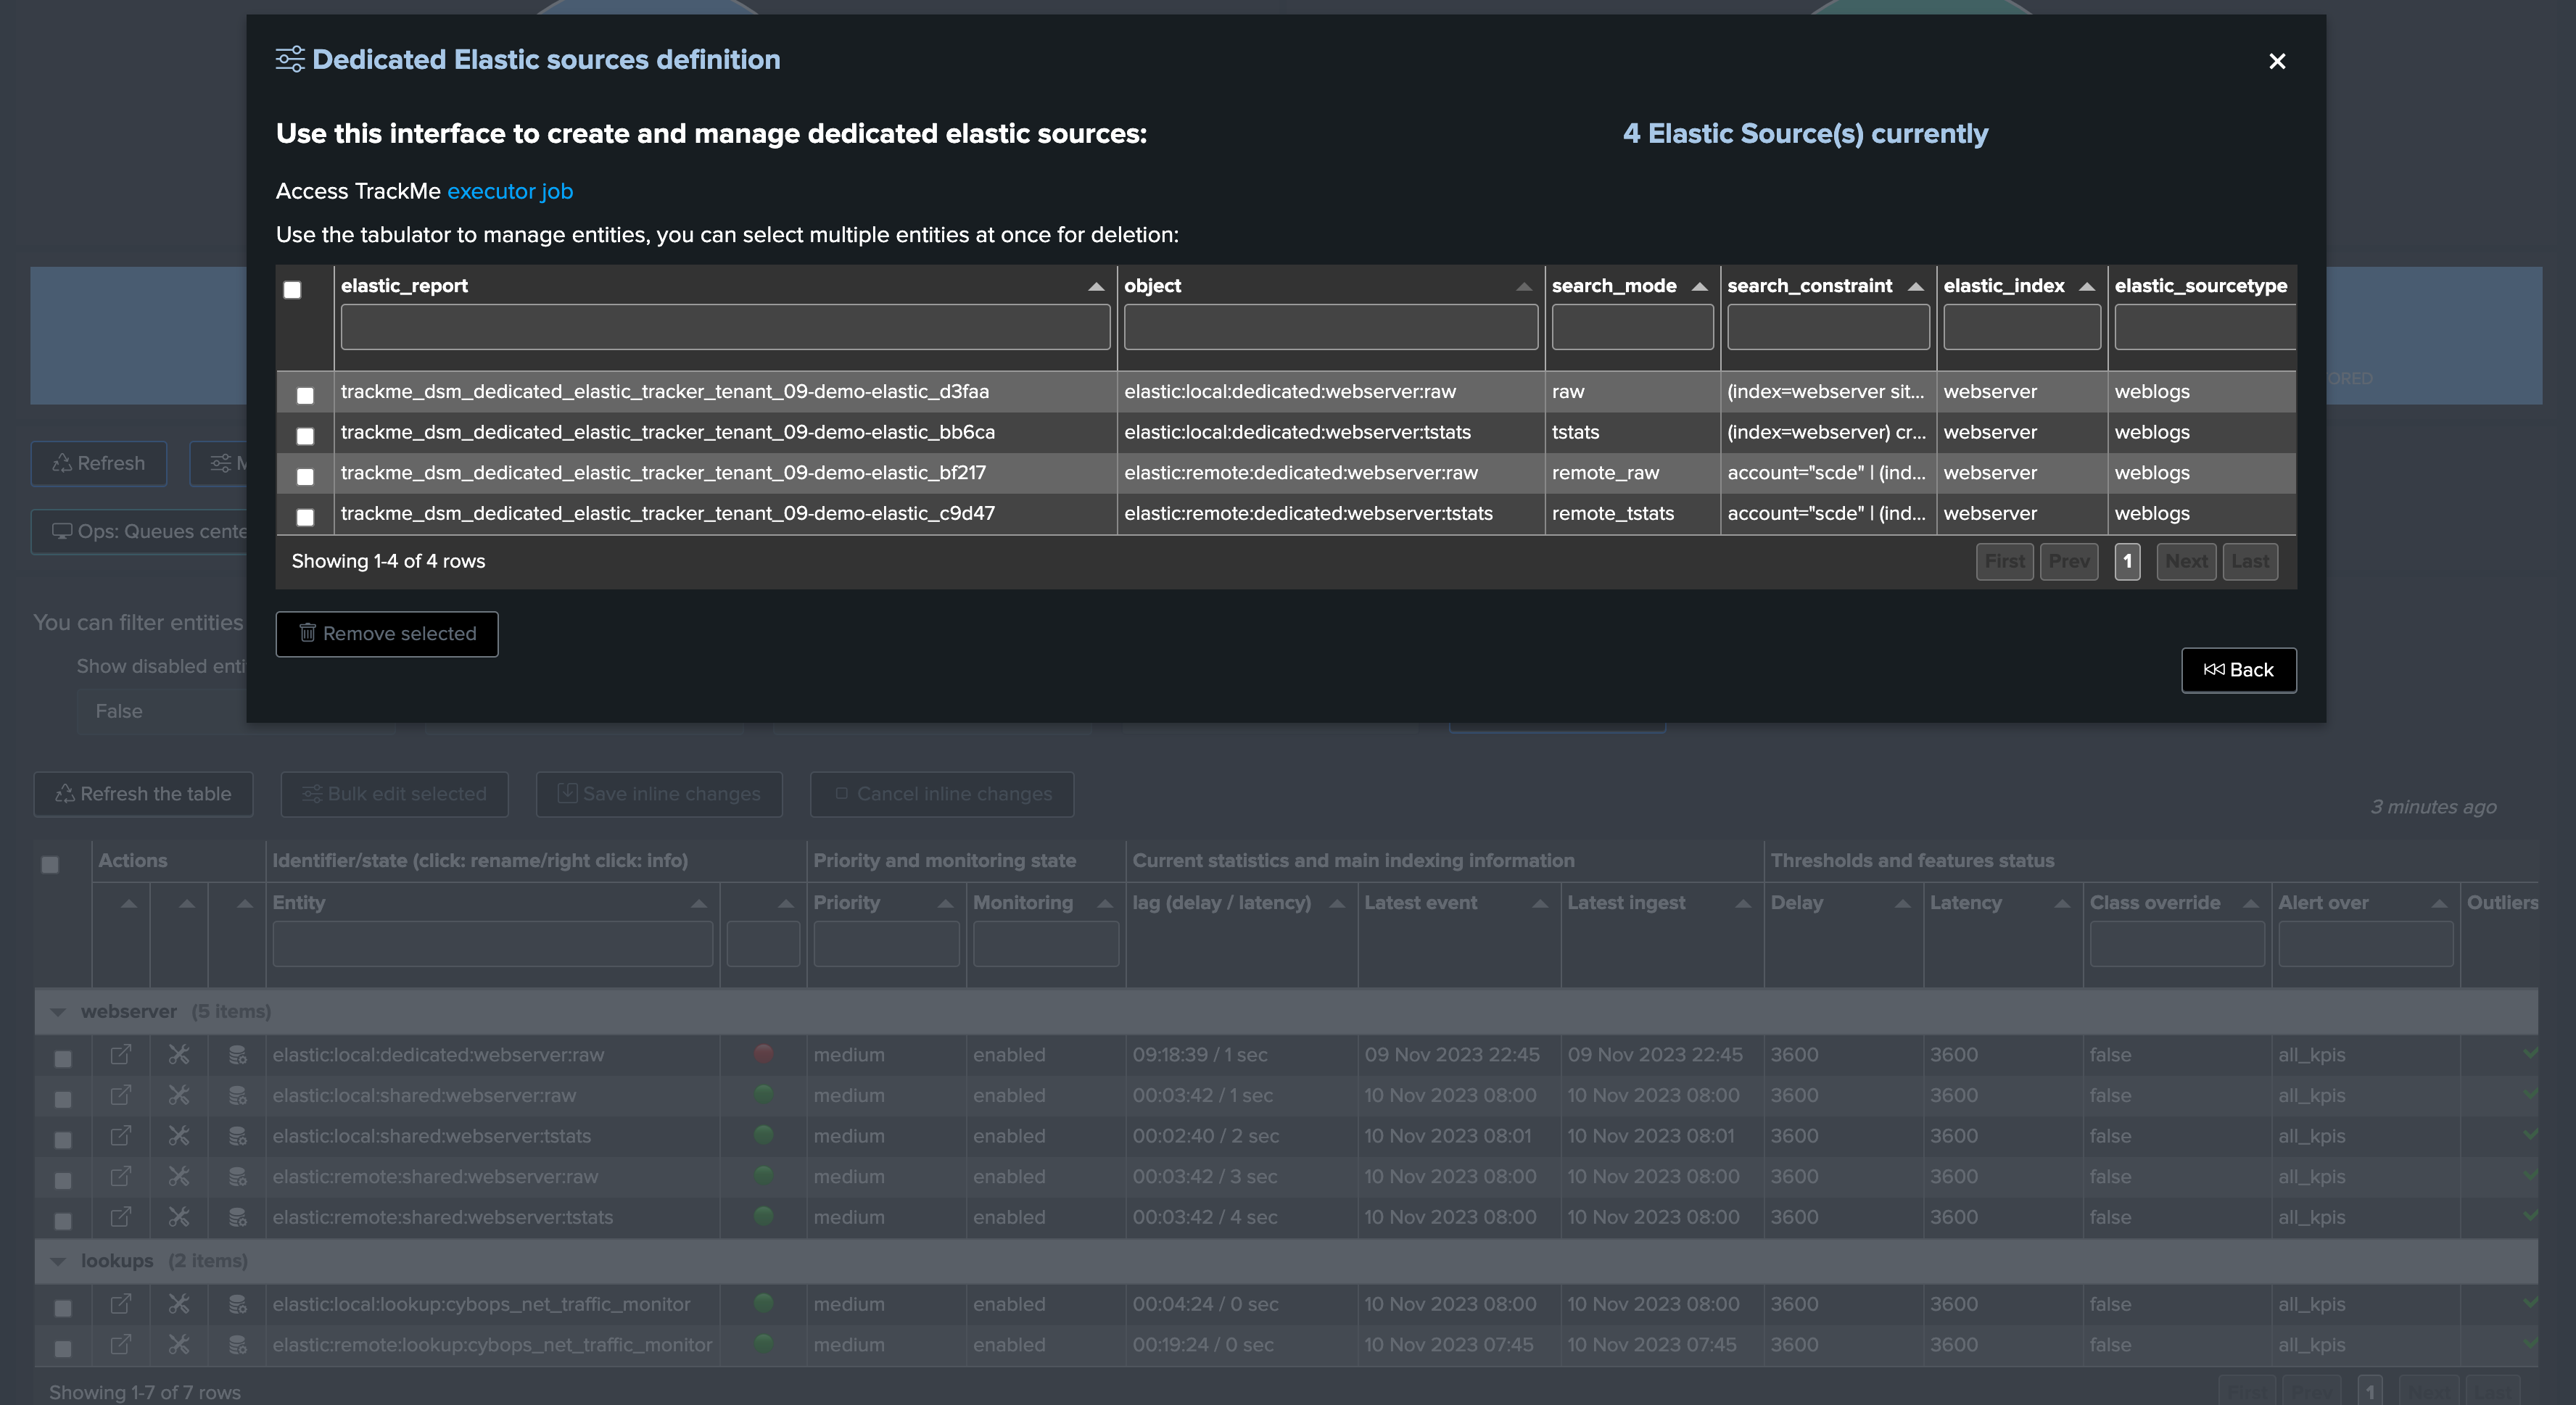
Administrating Dedicated Elastic Sources
Dedicated Elastic trackers are independent scheduled reports, their life cycle is orchestrated by TrackMe but they run independently from each other.
Each tracker is composed by two reports, the tracker which is scheduled and the wrapper which is called by the tracker:

The tracker calls the trackmetrackerexecutor command:

Execution logs can be found with the following search:
index=_internal sourcetype=trackme:custom_commands:trackmetrackerexecutor
Similarly, use the deepdive performance dashboard to review the tracker performance over time:
TrackMe stores dedicated Elastic trackers main Metadata in the following KVstore:
| inputlookup trackme_dsm_elastic_dedicated_tenant_<tenant_id>