Monitor Splunk Search Head Clusters
Monitoring Splunk Search Head Clusters with TrackMe Flex Objects
This tutorial demonstrates the monitoring of Splunk Search Head Clusters with TrackMe Flex Objects.
TrackMe Flex Objects is a component restricted to licensed customers. Please contact Splunk Sales for more information.
Using these steps will enable TrackMe to continuously monitor the health of your Splunk Search Head Clusters and alert you when issues are detected.
With TrackMe’s remote search capabilities, you can monitor as many Search Head Clusters as you need from a single pane of glass.
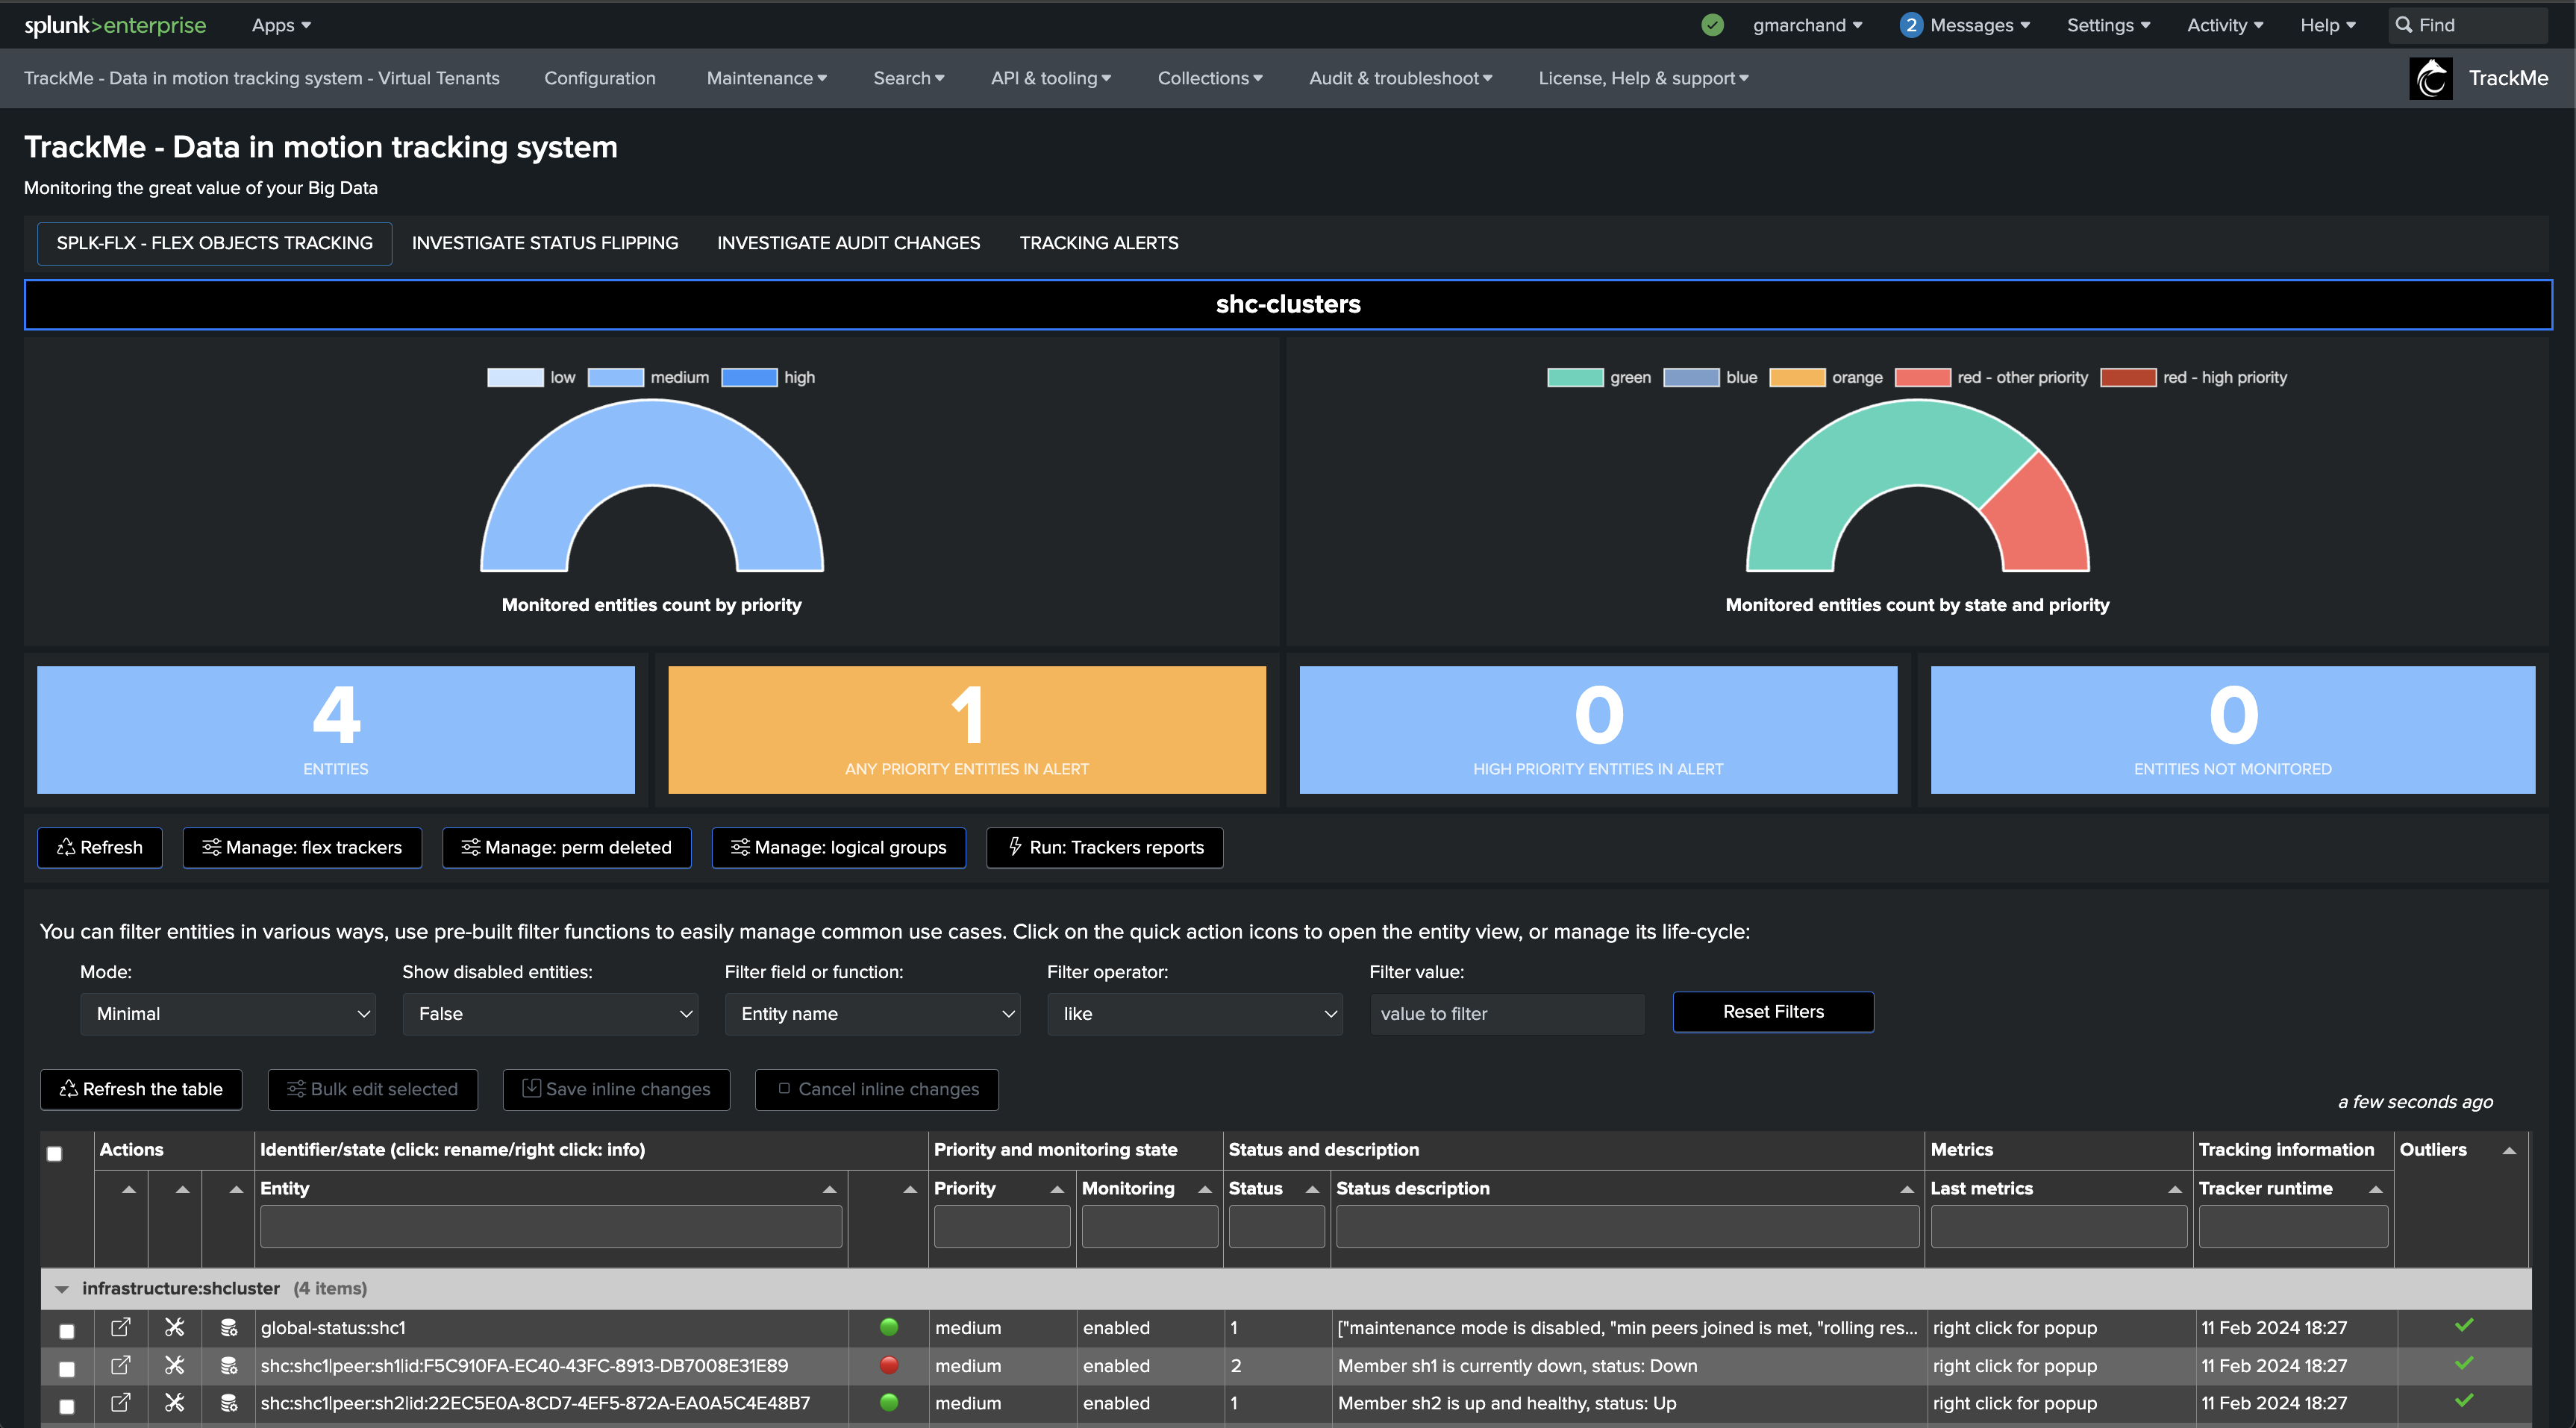
The following screen shows the final results in TrackMe, starting from Step 1 to easily implement the monitoring of your Splunk Search Head Clusters.


Step 1: Create a Splunk Remote Deployment Account
Hint
Interacting with Splunk API through TrackMe’s remote search capabilities
This use case relies on a Splunk | rest command which is a Splunk REST API call through native SPL.
Therefore, this command needs to be executed on a remote Splunk target, in the context of monitoring Search Head Clusters, the command can be executed on any up and running SHC member.
Using TrackMe’s remote search capabilities, you can transparently execute the command on a remote target, and process results locally on the TrackMe guest.
The first step is to create a Splunk Remote Deployment Account for the Cluster Manager. For more information about TrackMe Remote Search capabilities and configurations:
Splunk Remote Deployments (splunkremotesearch)
On the Search Head Cluster, create a new Splunk bearer token for the TrackMe Remote Deployment Account:
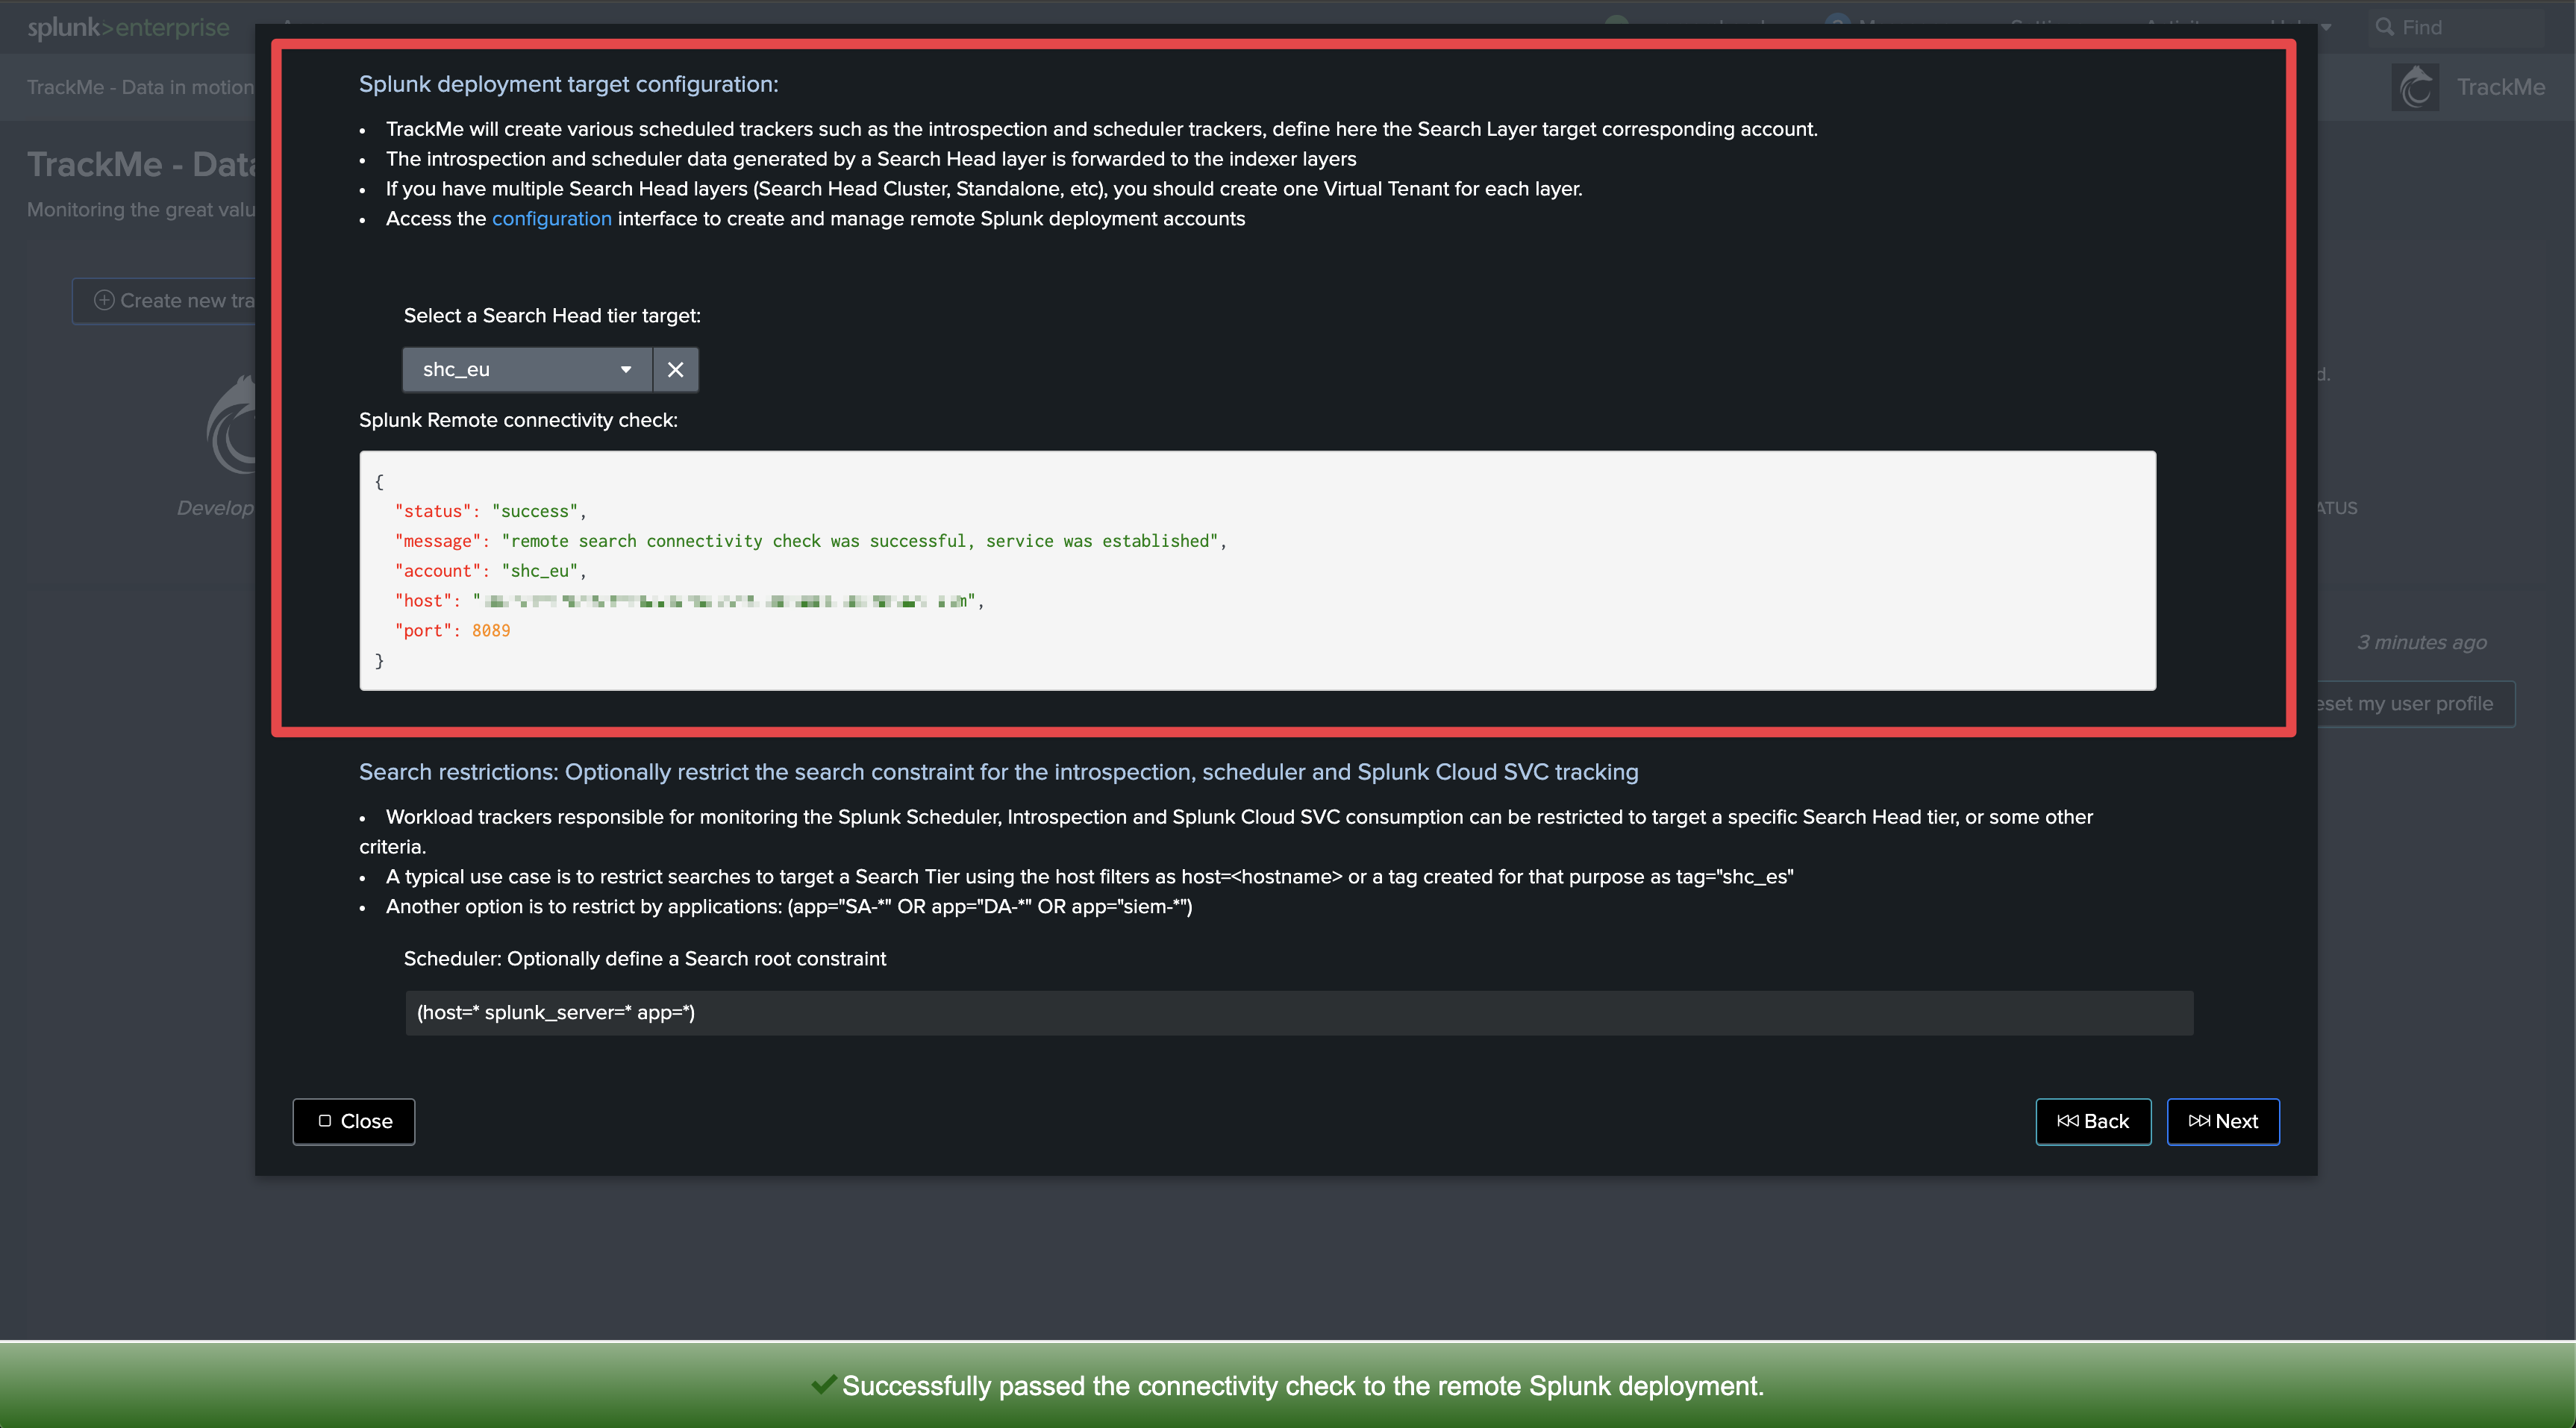
In TrackMe, click on Configure / Remote Deployment Accounts and add a new account:
You can specify each of the SHC members in a comma separated list or use a load balancer URL.
If multiple endpoints are specified, TrackMe automatically dispatches searches randomly amongst available and responding members (it validates connectivity and authentication)
Hint
Managing multiple Search Head Clusters
If you have multiple Search Head Clusters, you can create a Remote Deployment Account for each SHC.
You will then be able to manage and monitor as many Search Head Clusters as you need from a single pane of glass in TrackMe.
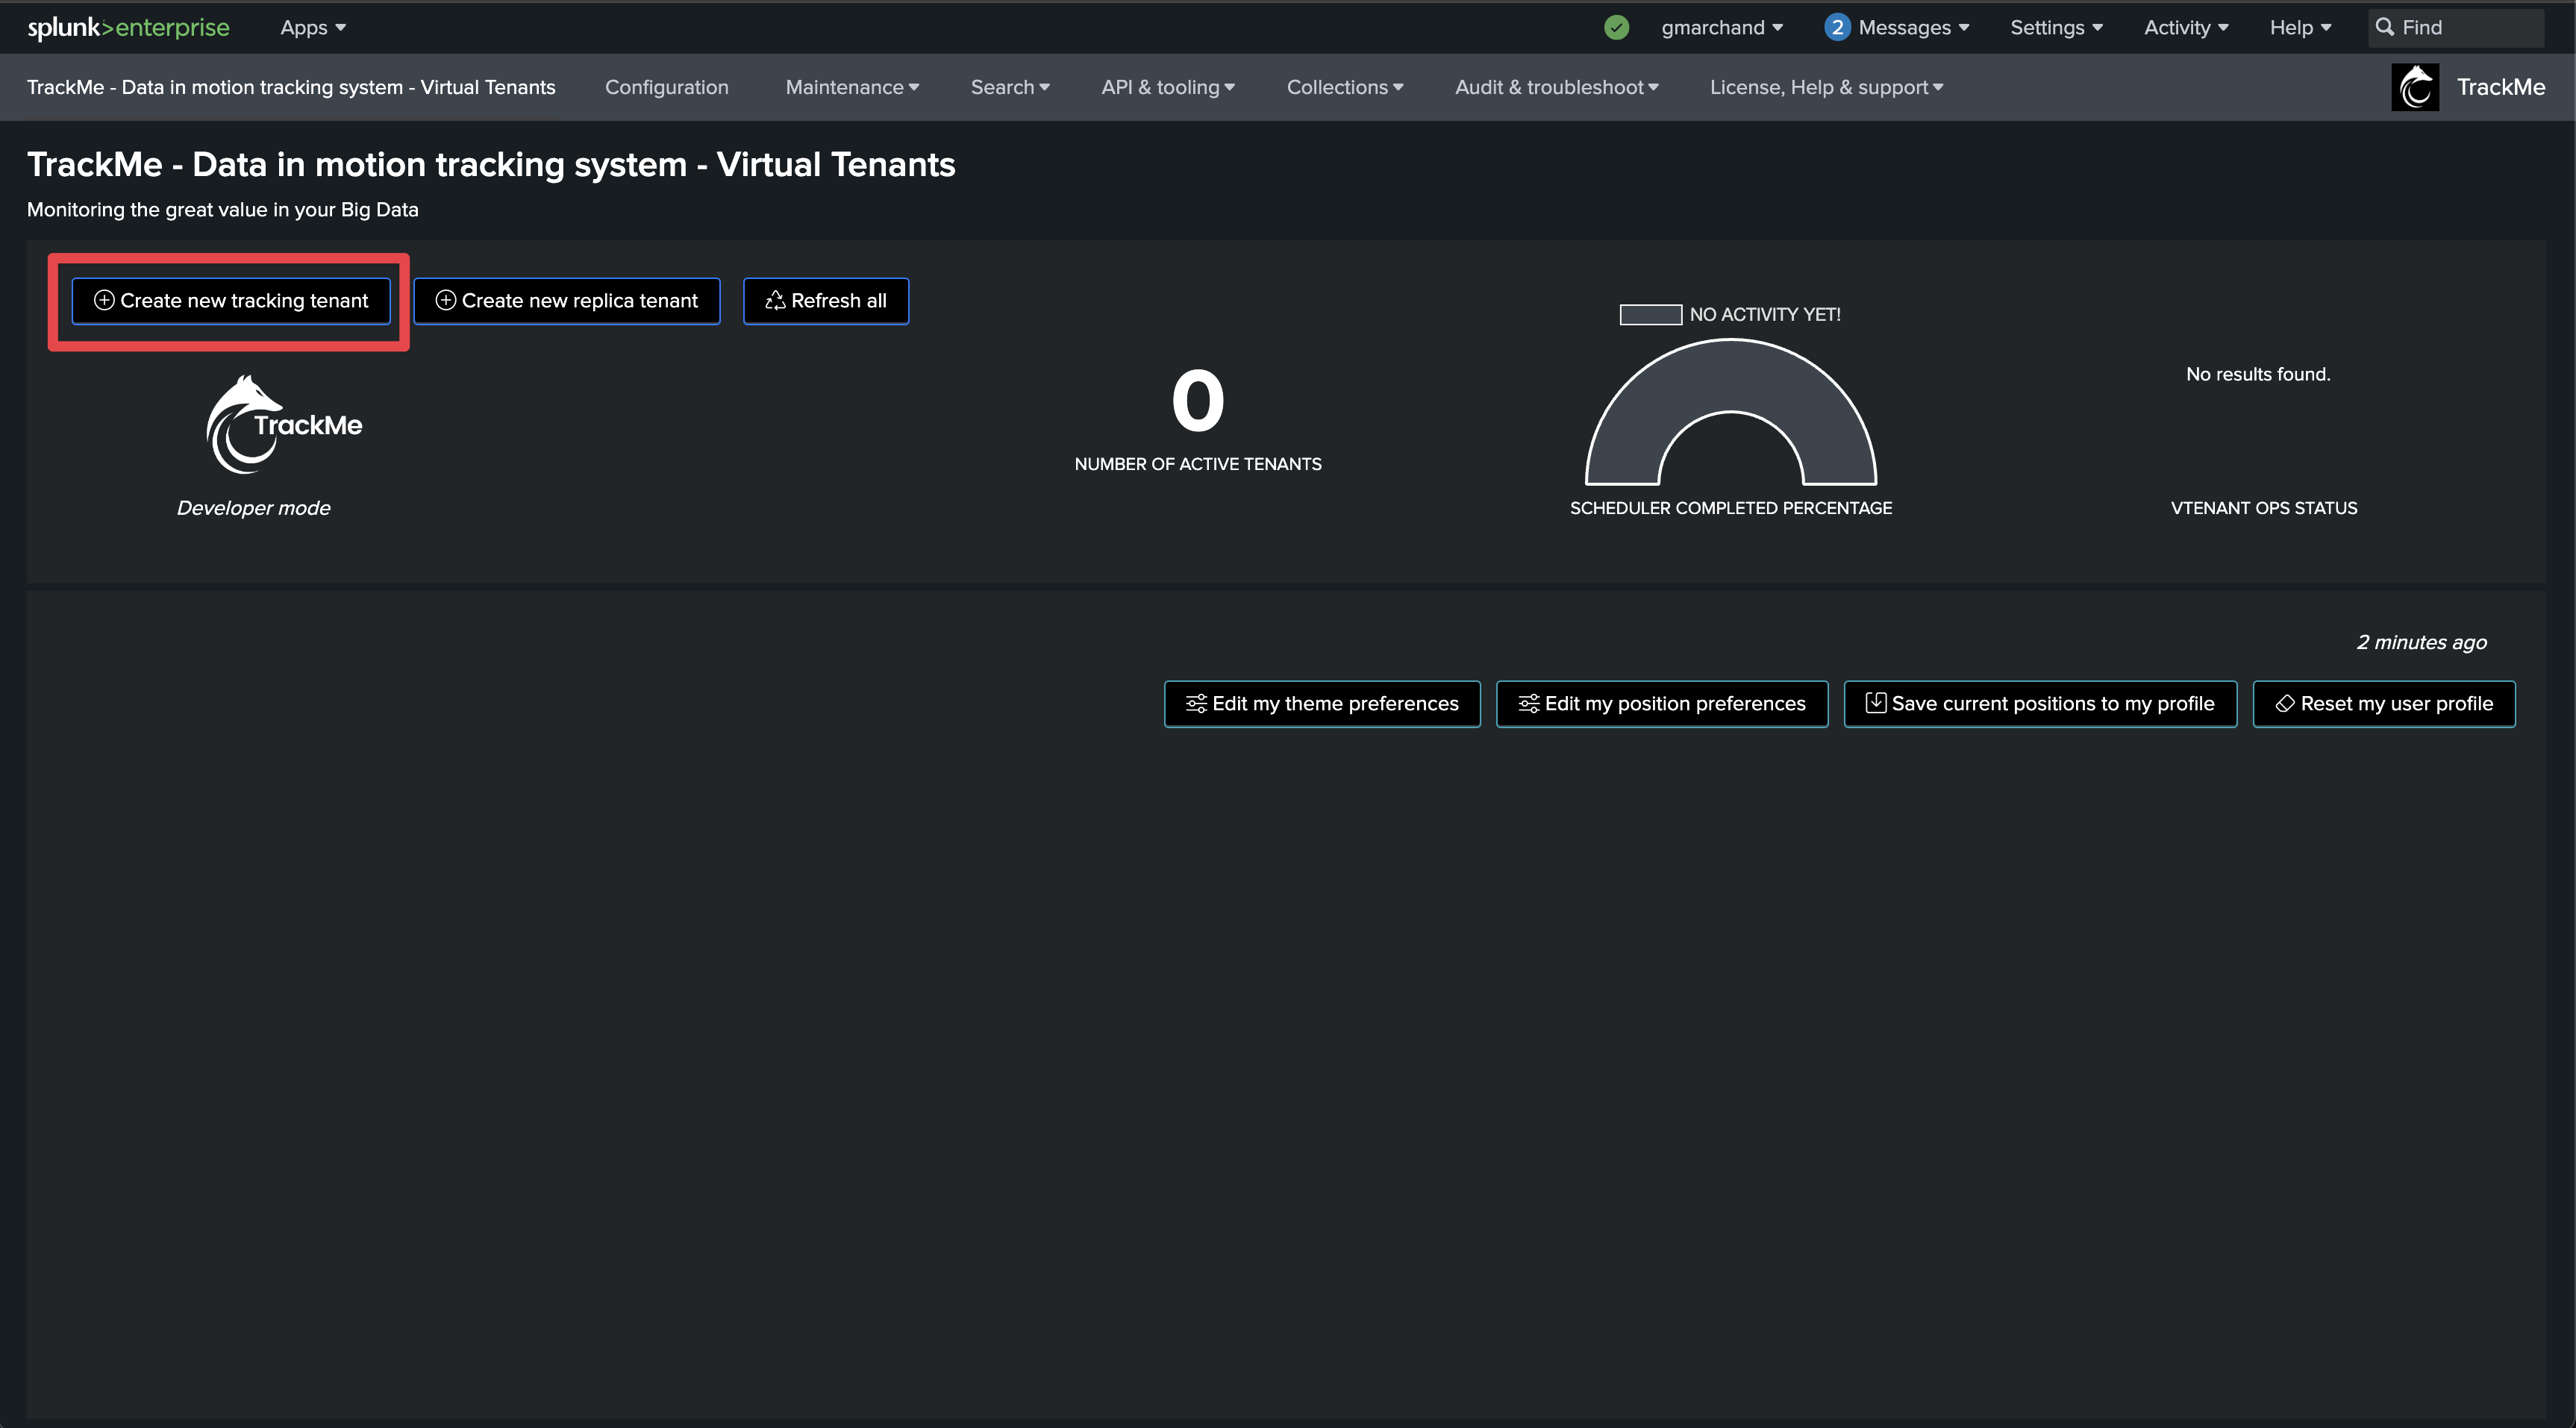
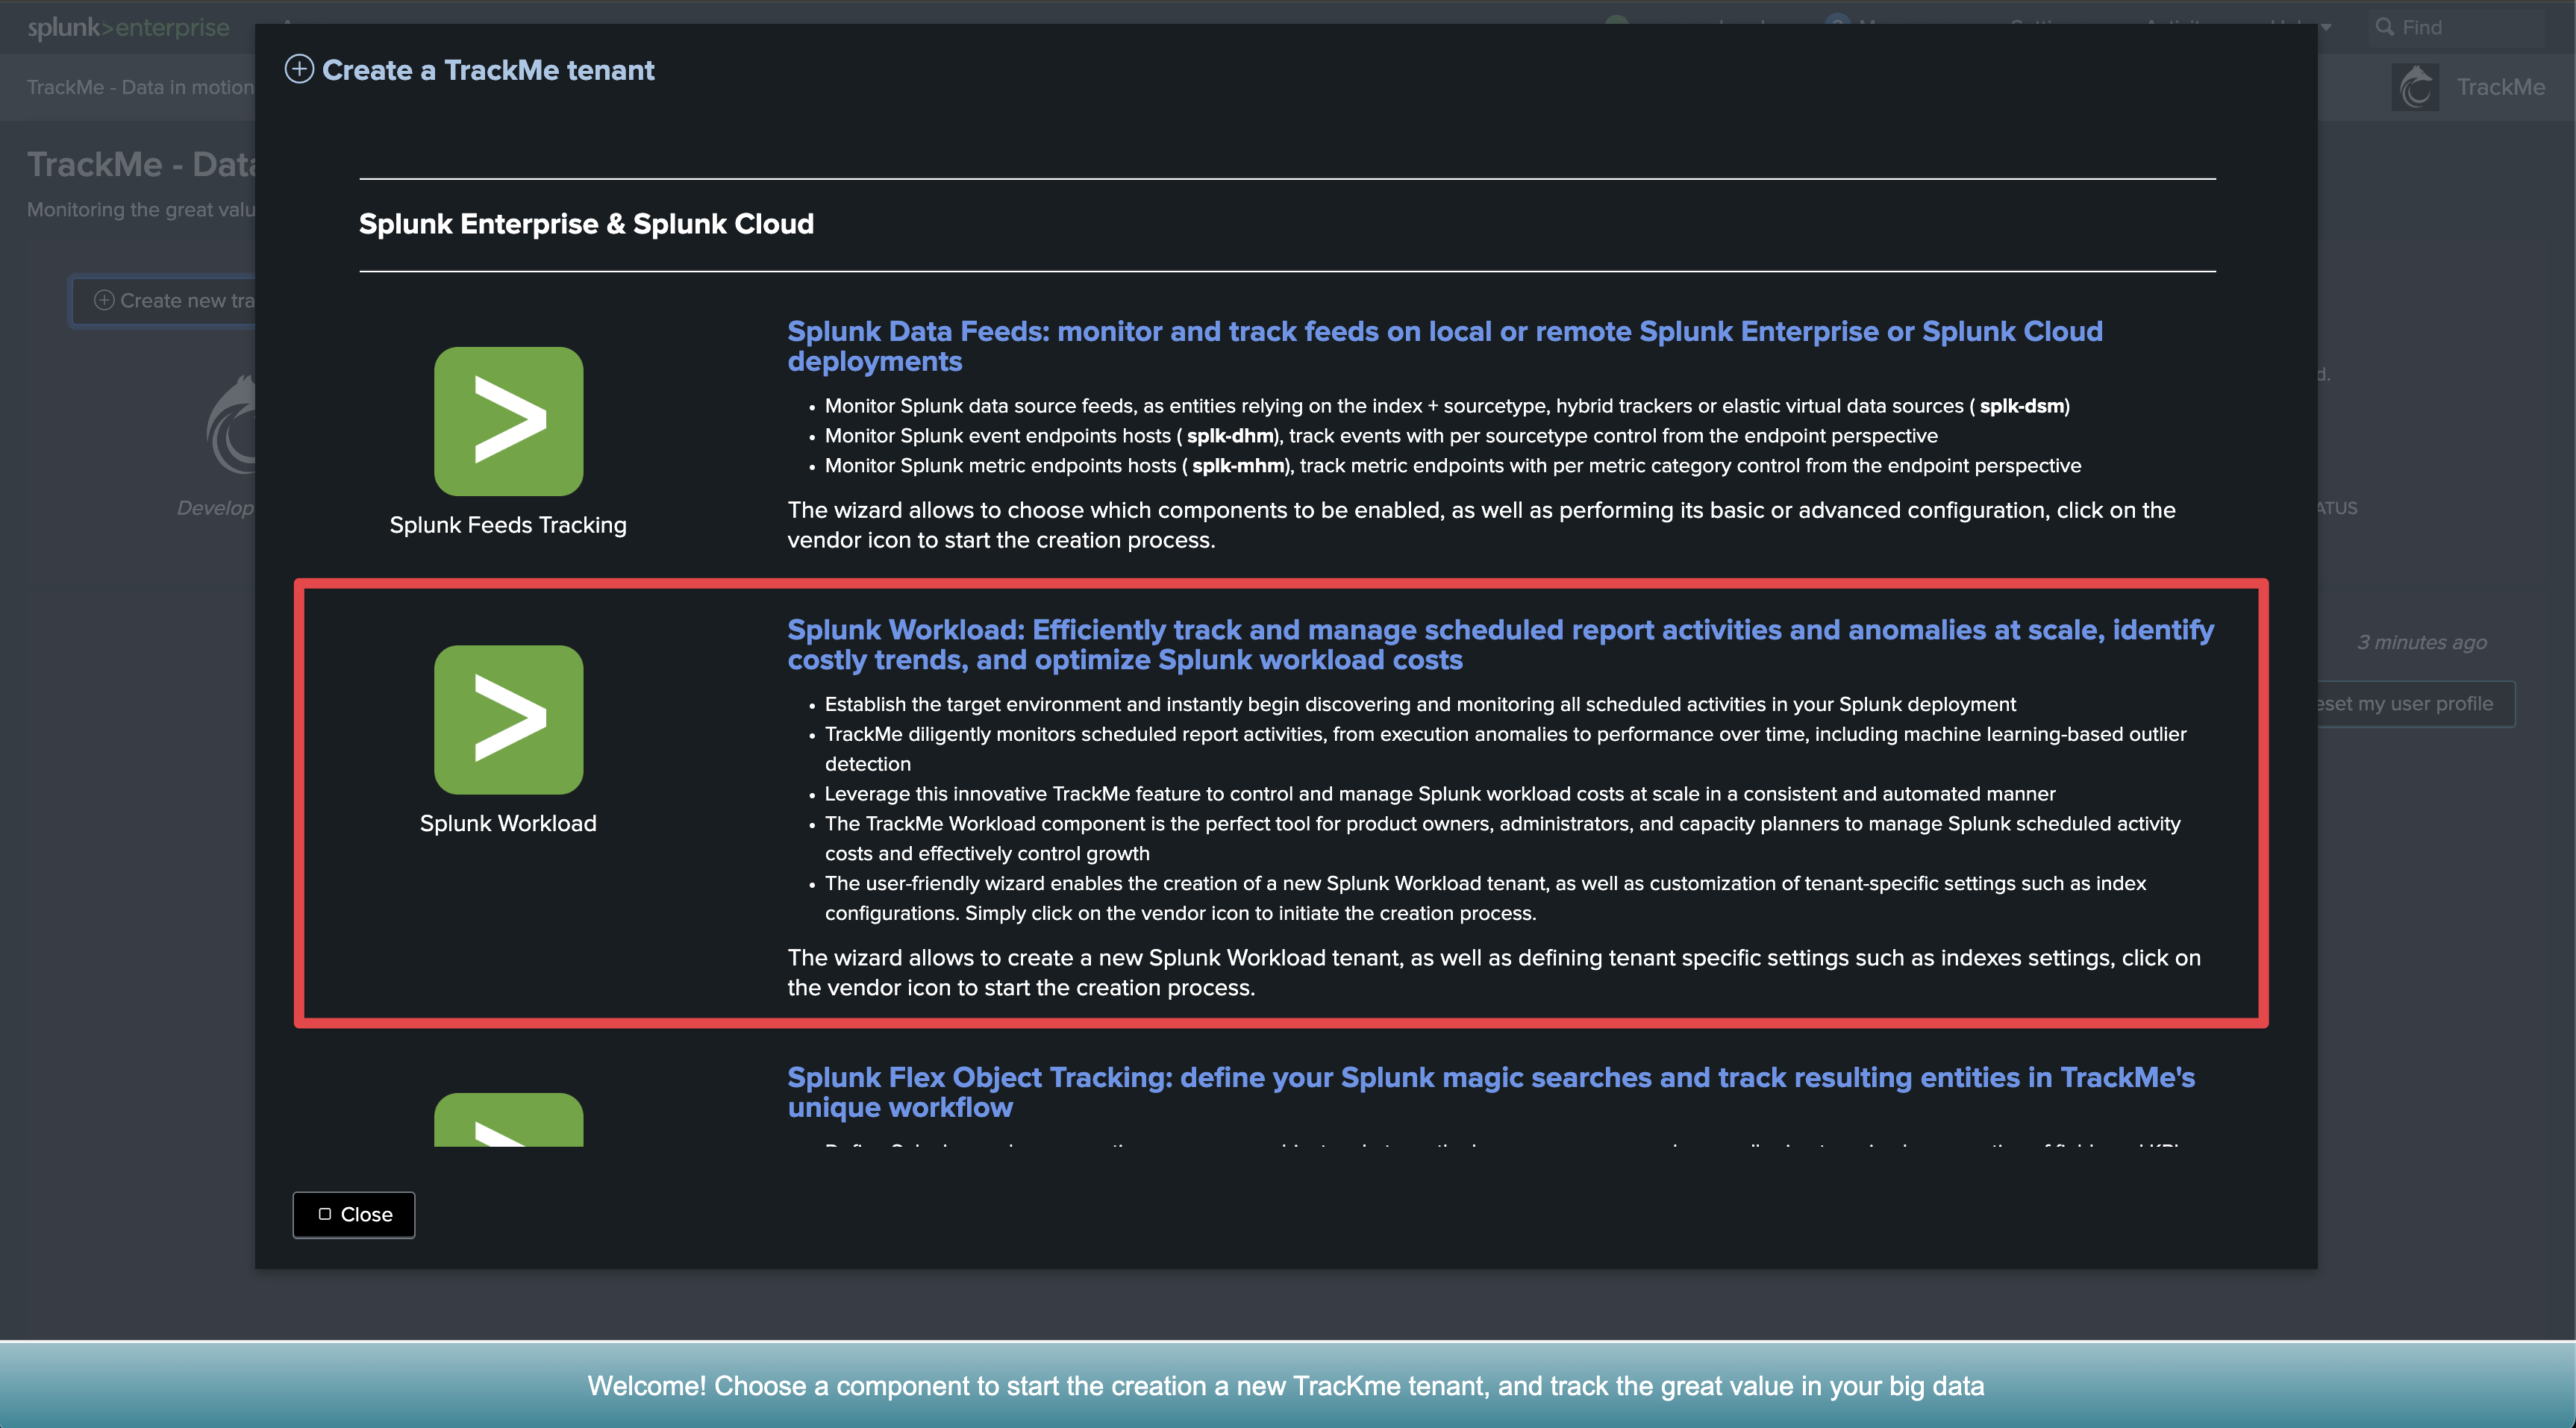
Step 2: Create a Flex Object tenant for Search Head Clusters monitoring
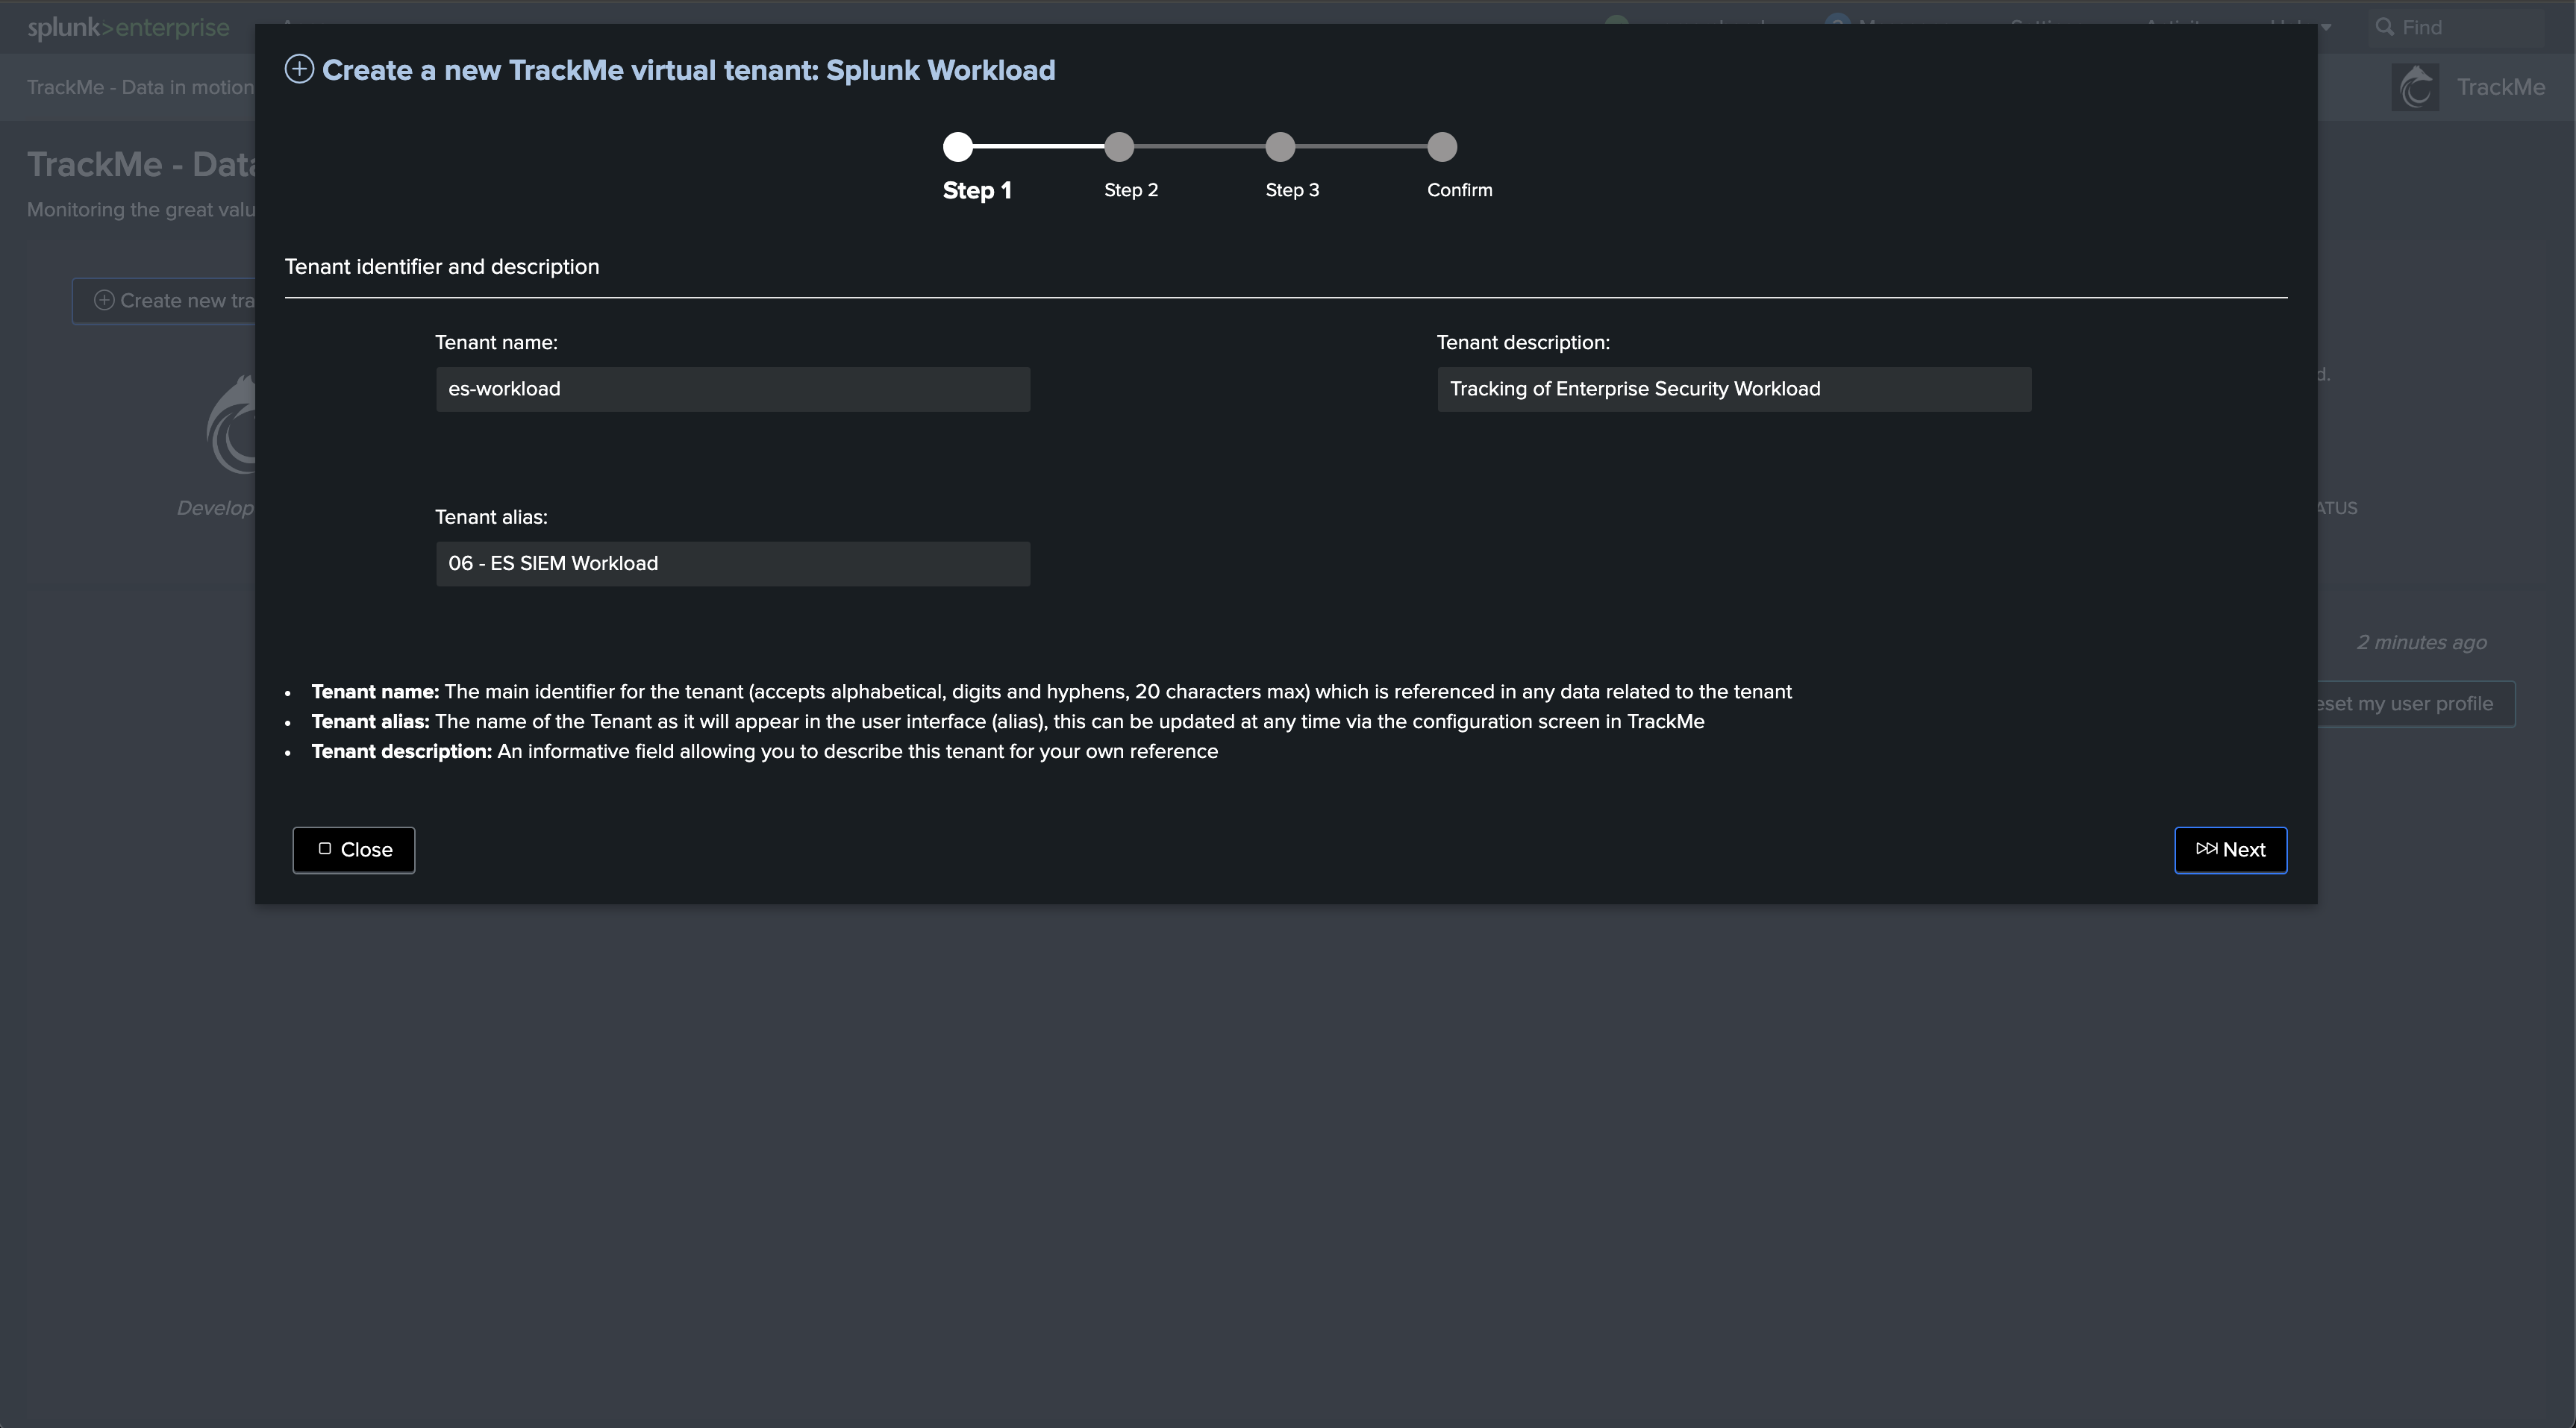
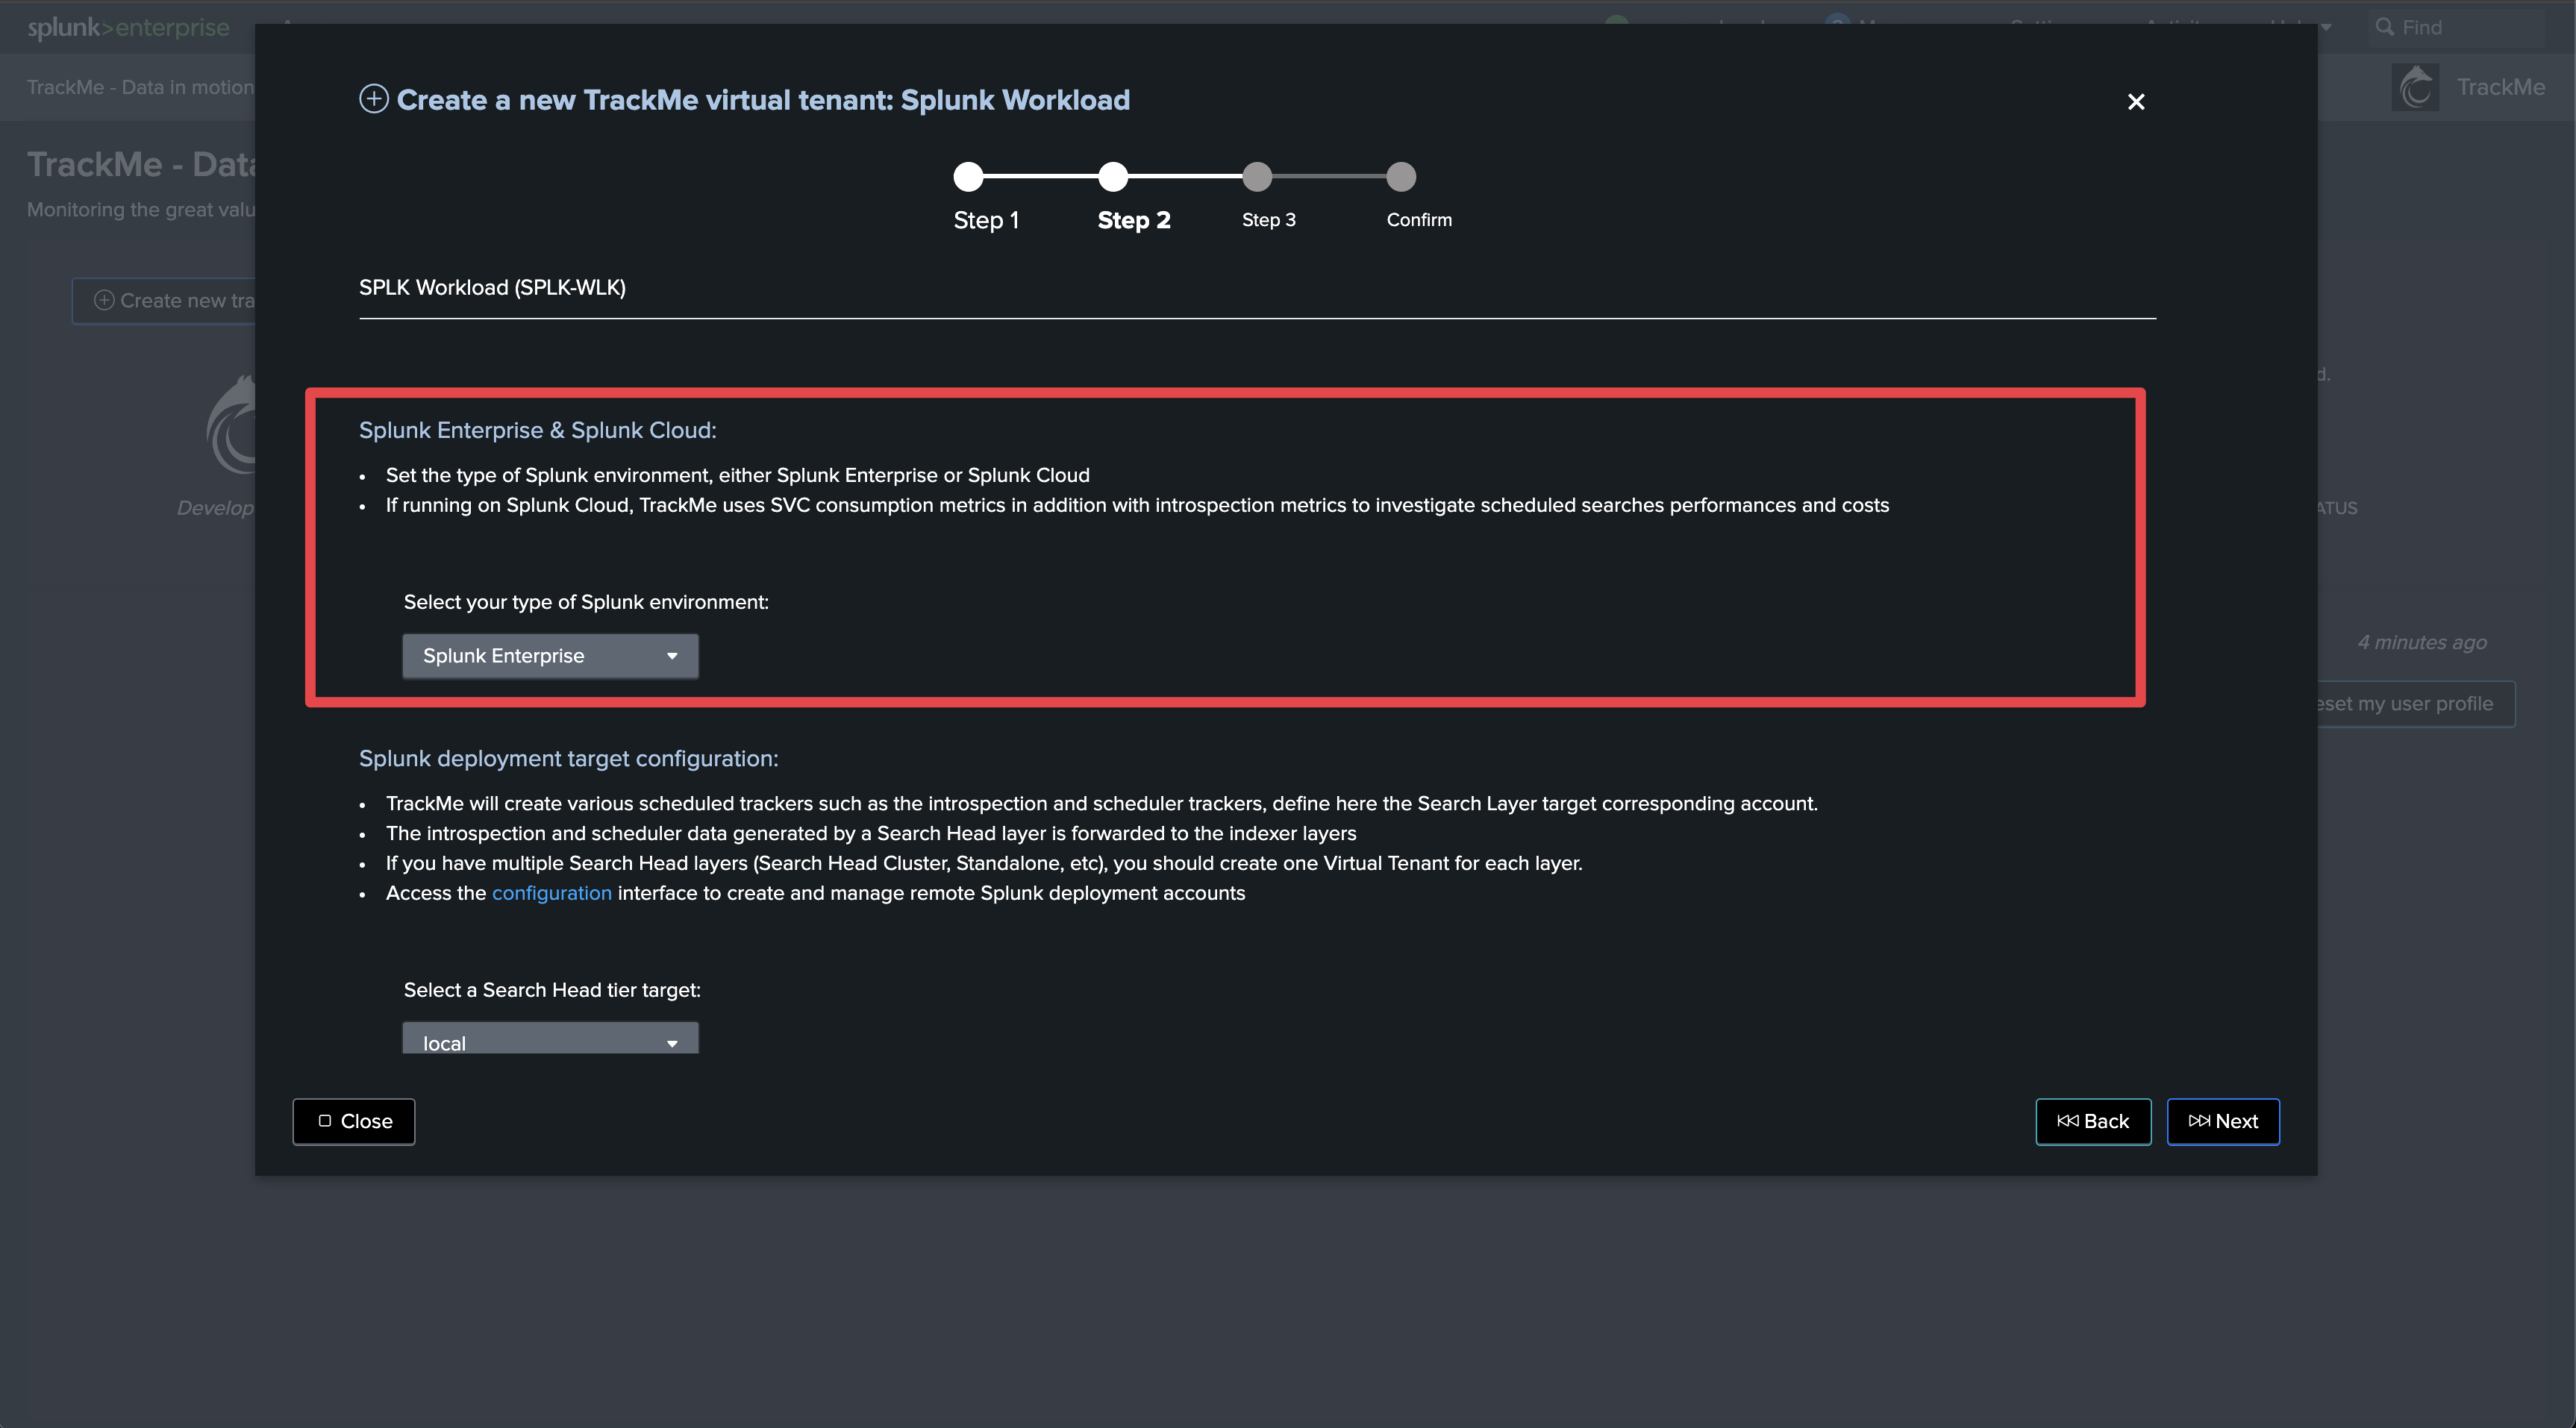
Now, let’s create a new tenant for the purposes of monitoring our Search Head Clusters. We can achieve this via the UI wizard or with a simple command line:
| trackme url=/services/trackme/v2/vtenants/admin/add_tenant mode=post body="{'tenant_name': 'shc-clusters', 'tenant_alias': '12 - SHC Clusters', 'tenant_desc': 'Splunk Search Head Clusters', 'tenant_roles_admin': 'trackme_admin', 'tenant_roles_power': 'trackme_power', 'tenant_roles_user': 'trackme_user', 'tenant_owner': 'admin', 'tenant_idx_settings': 'global', 'tenant_flx_enabled': 'true'}"
Step 3: Create Flex Object trackers using the Flex Objects library
Hint
Find the use cases definition (SPL) in annex of this documentation
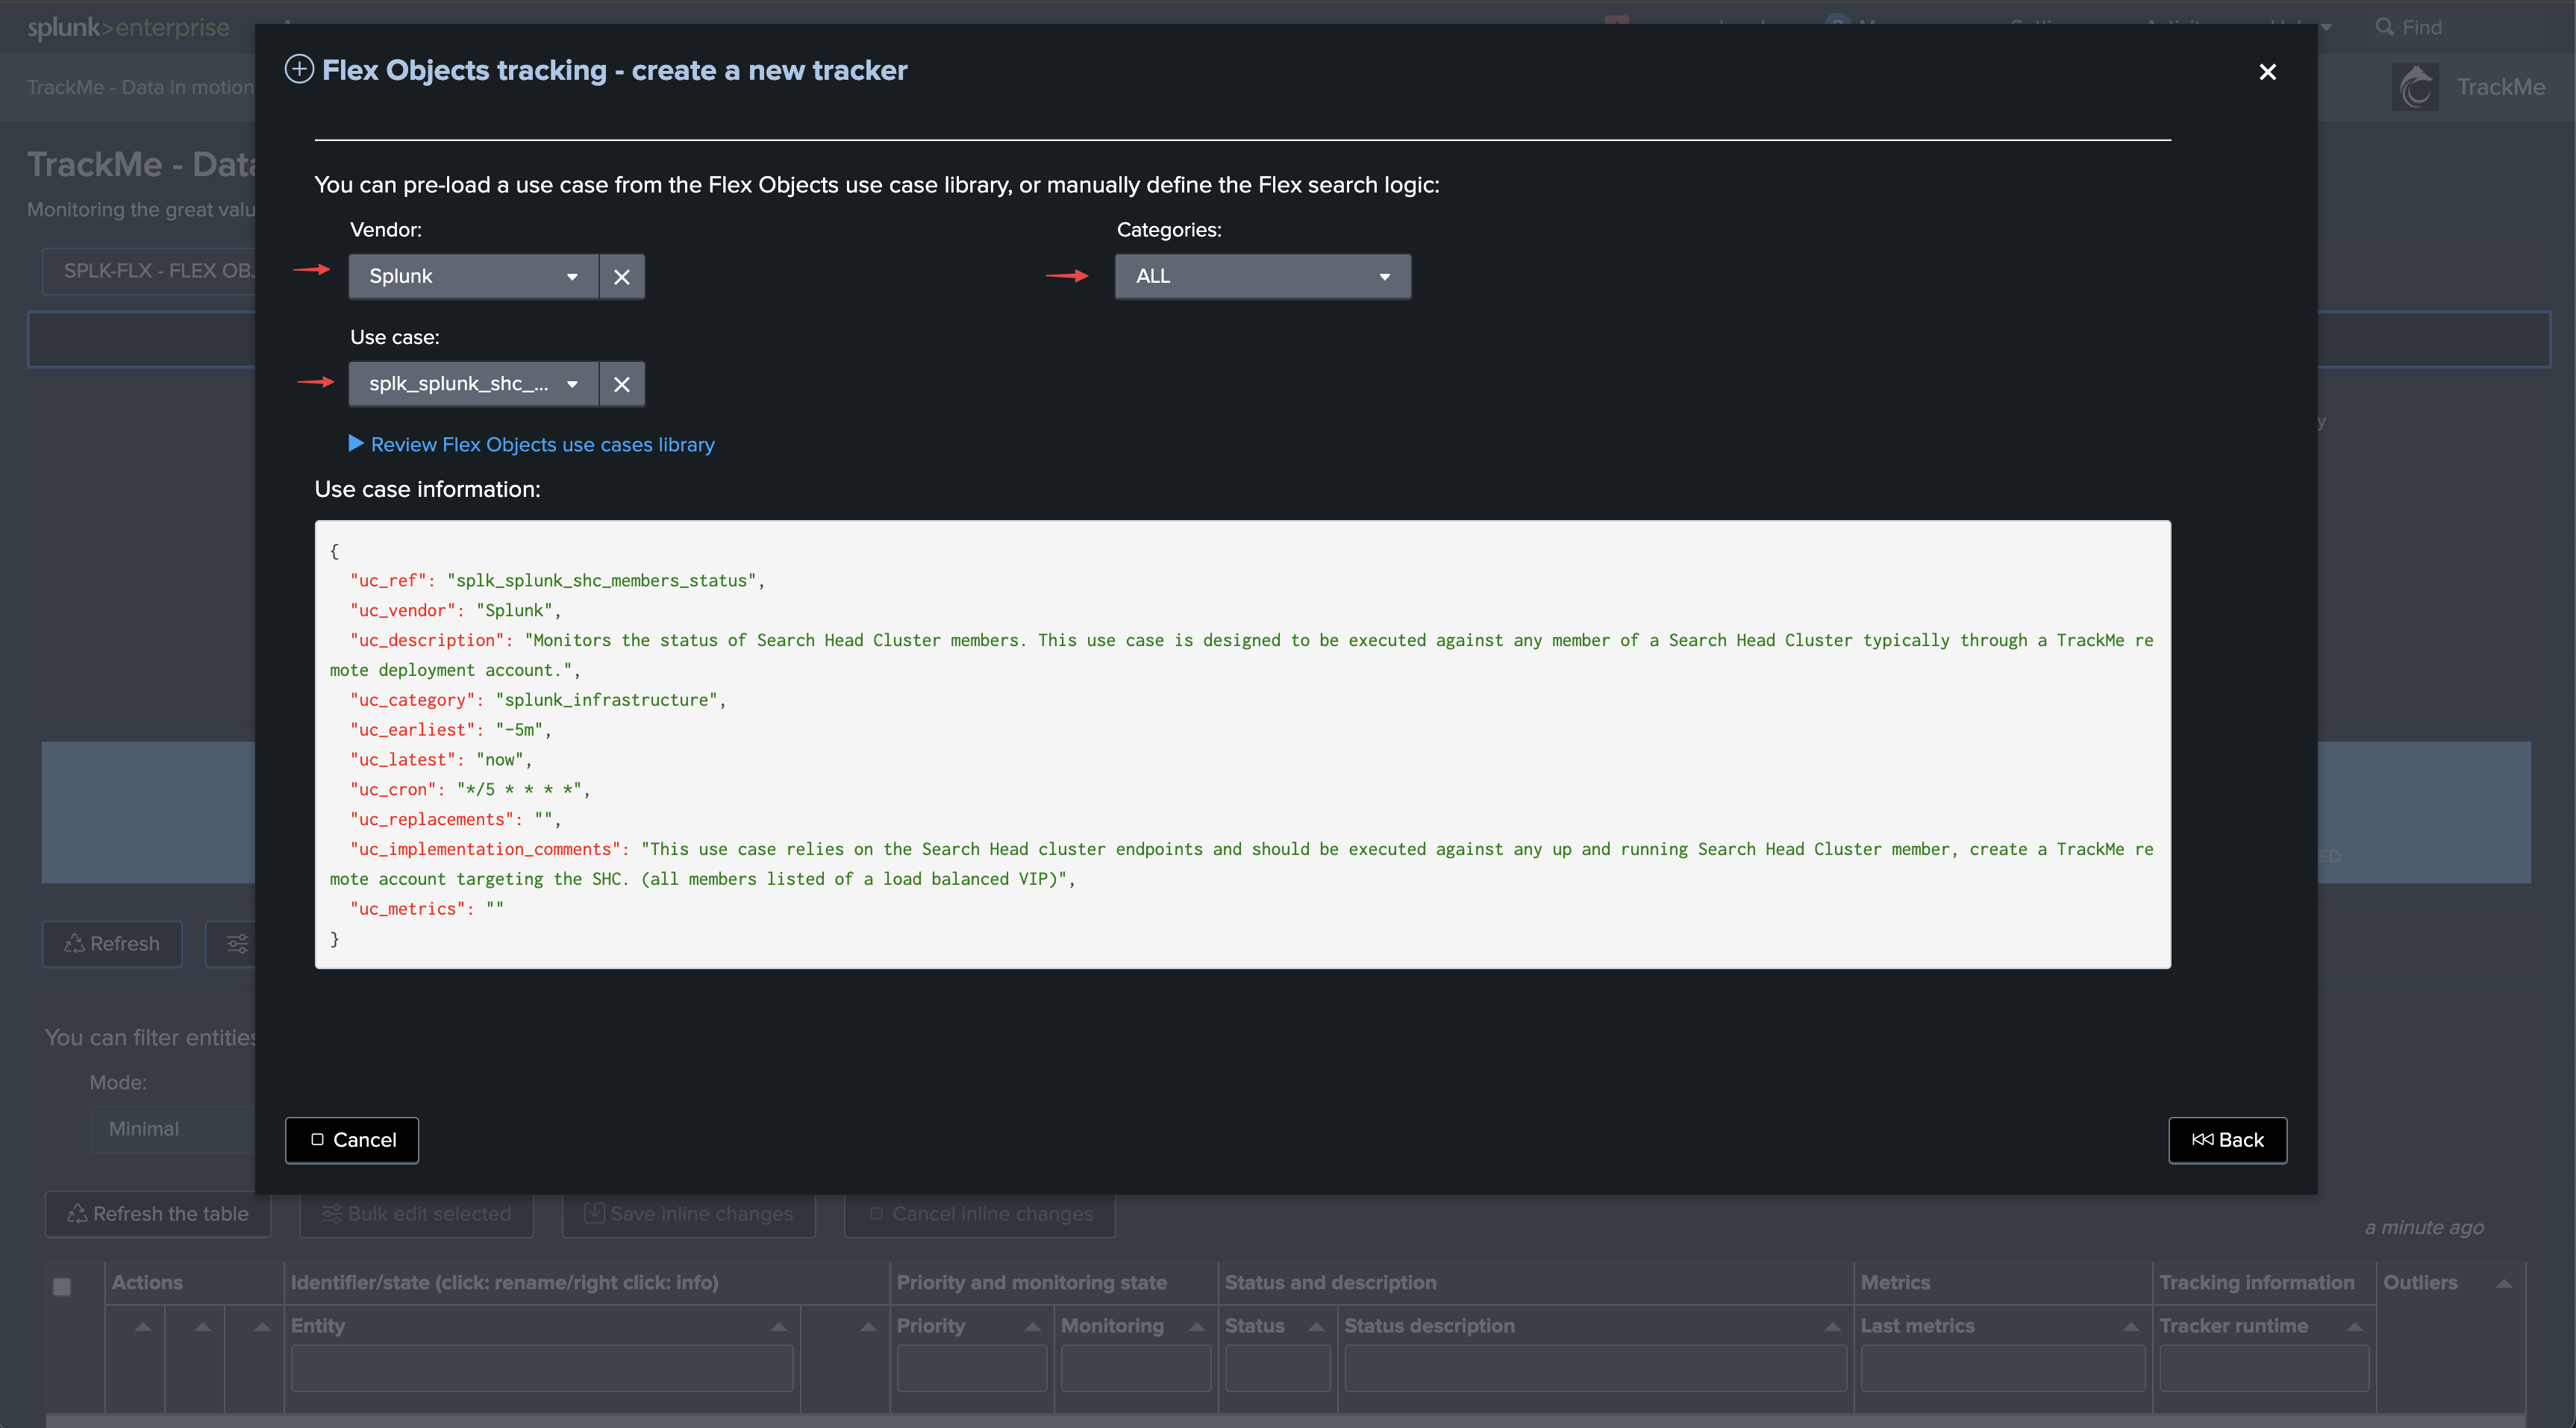
Enter the newly created tenant and start the Flex Object wizard using the built-in Flex Objects library:
Select the use cases and remote accounts:
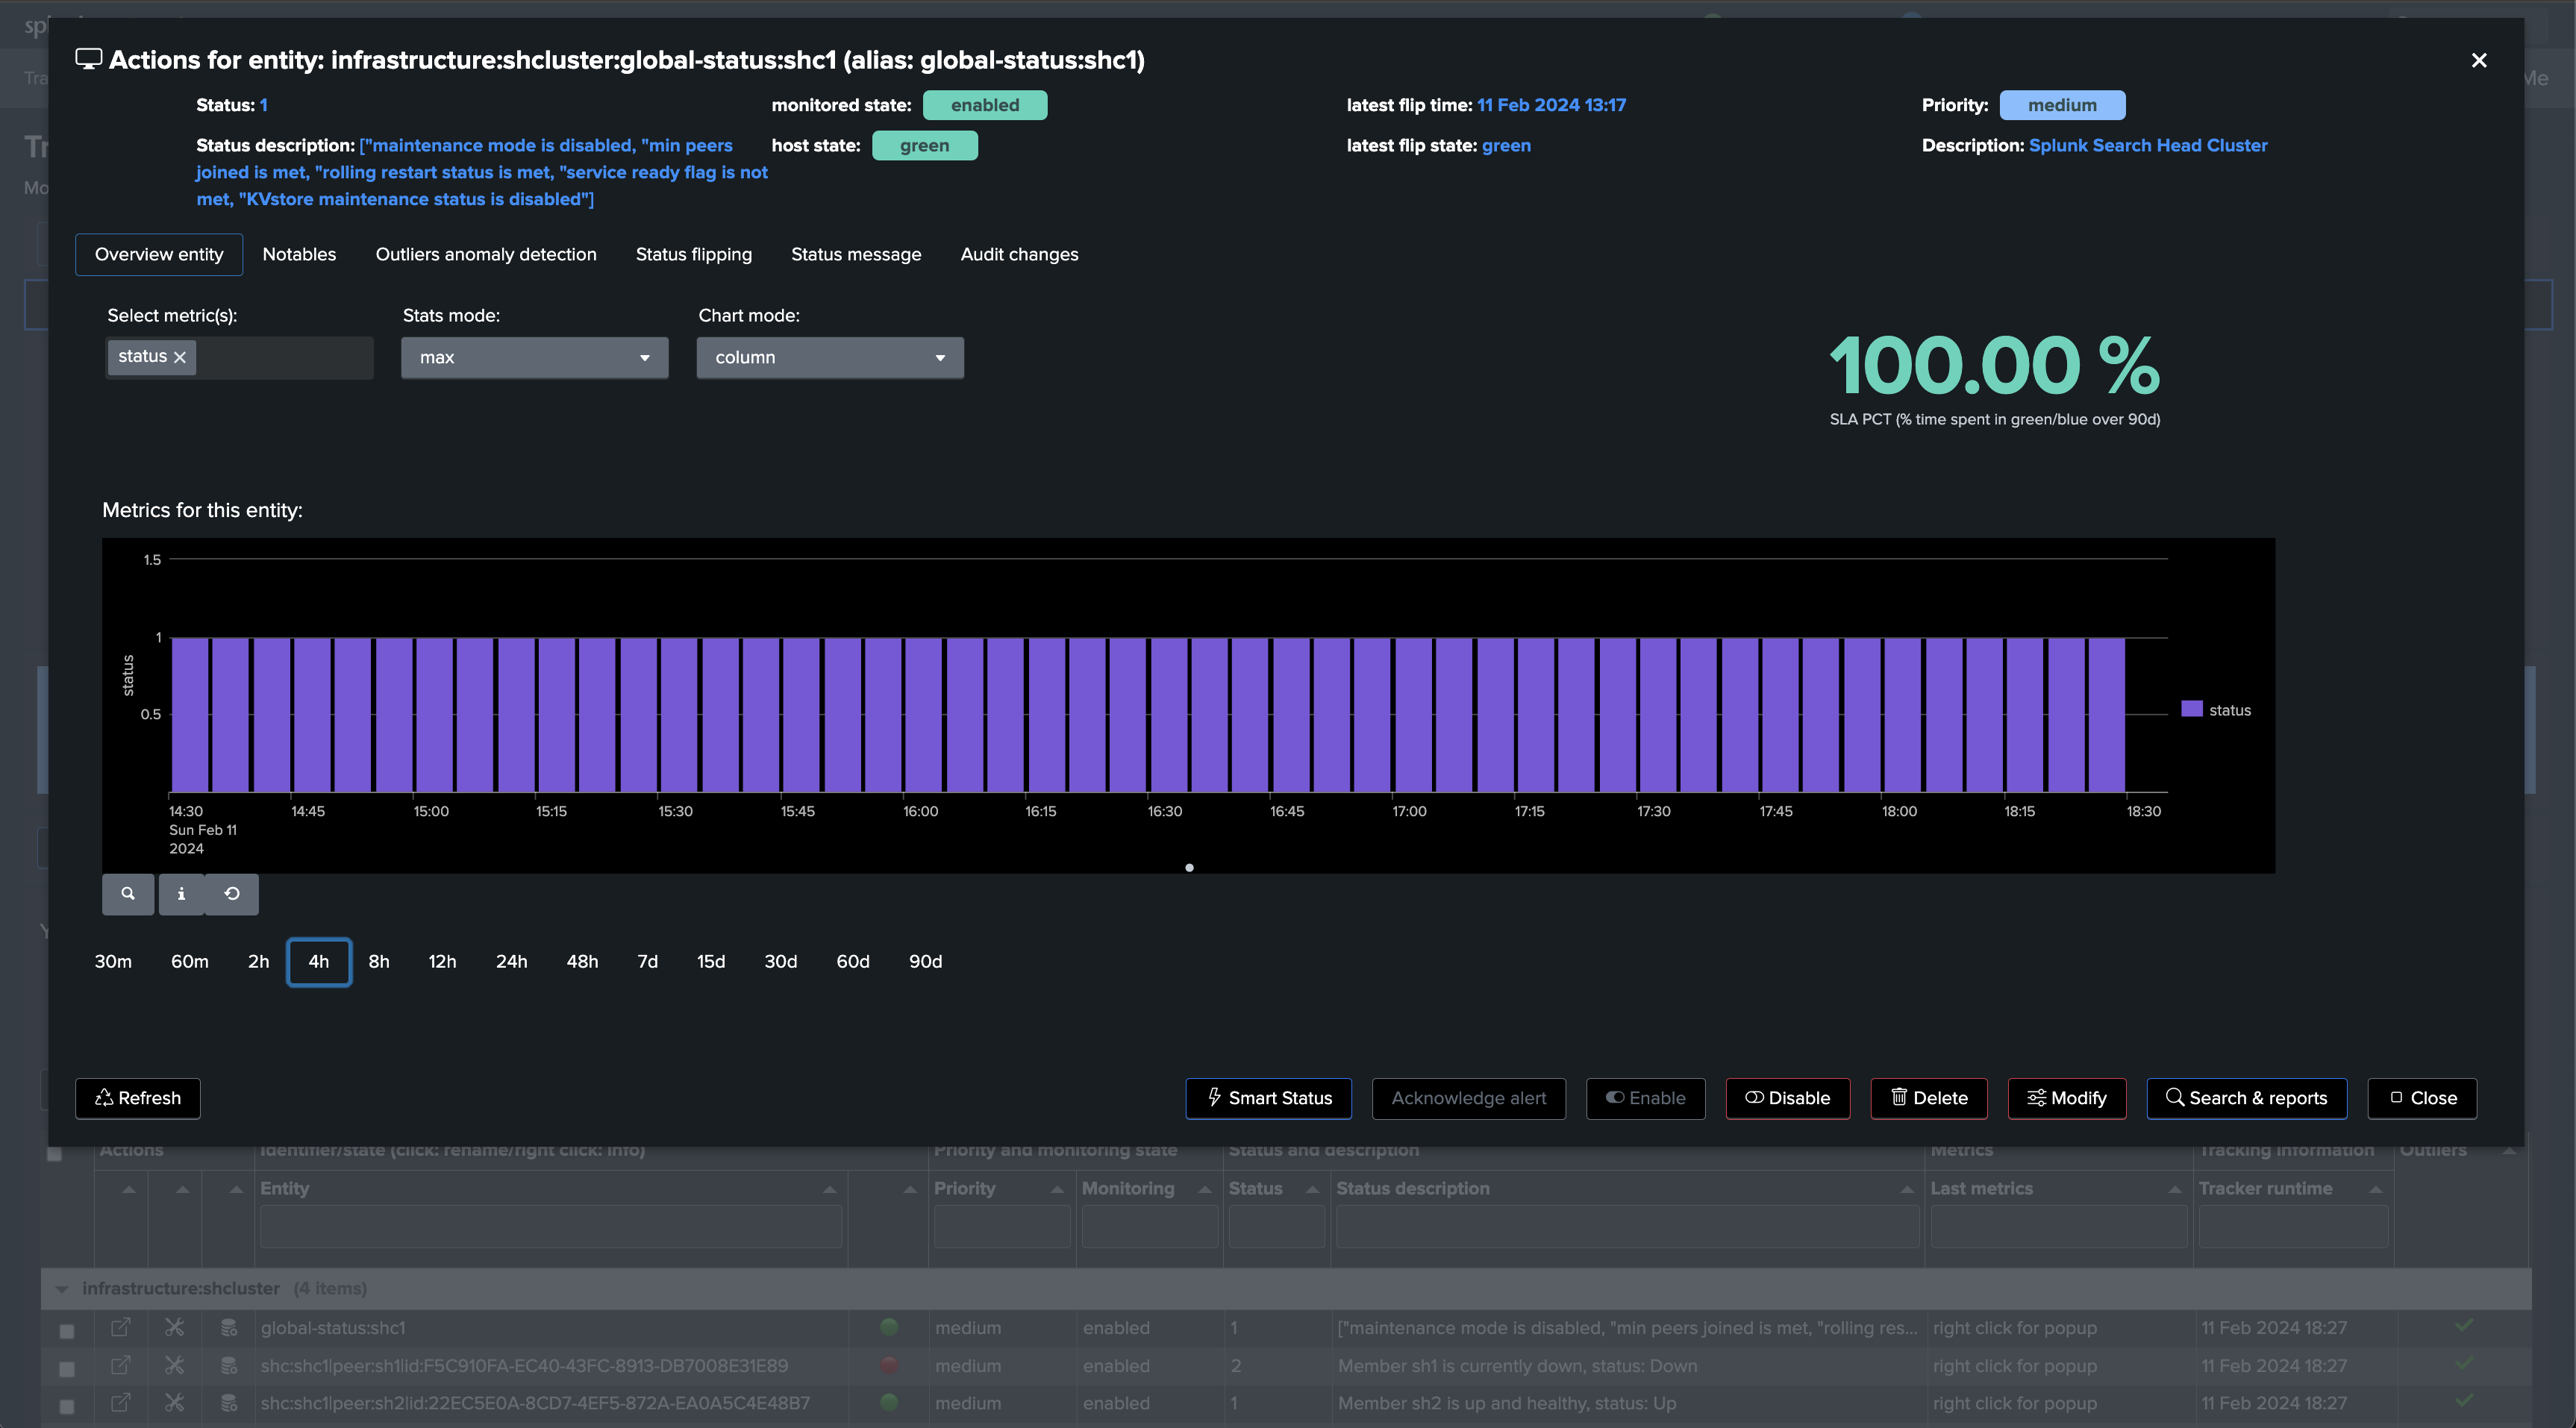
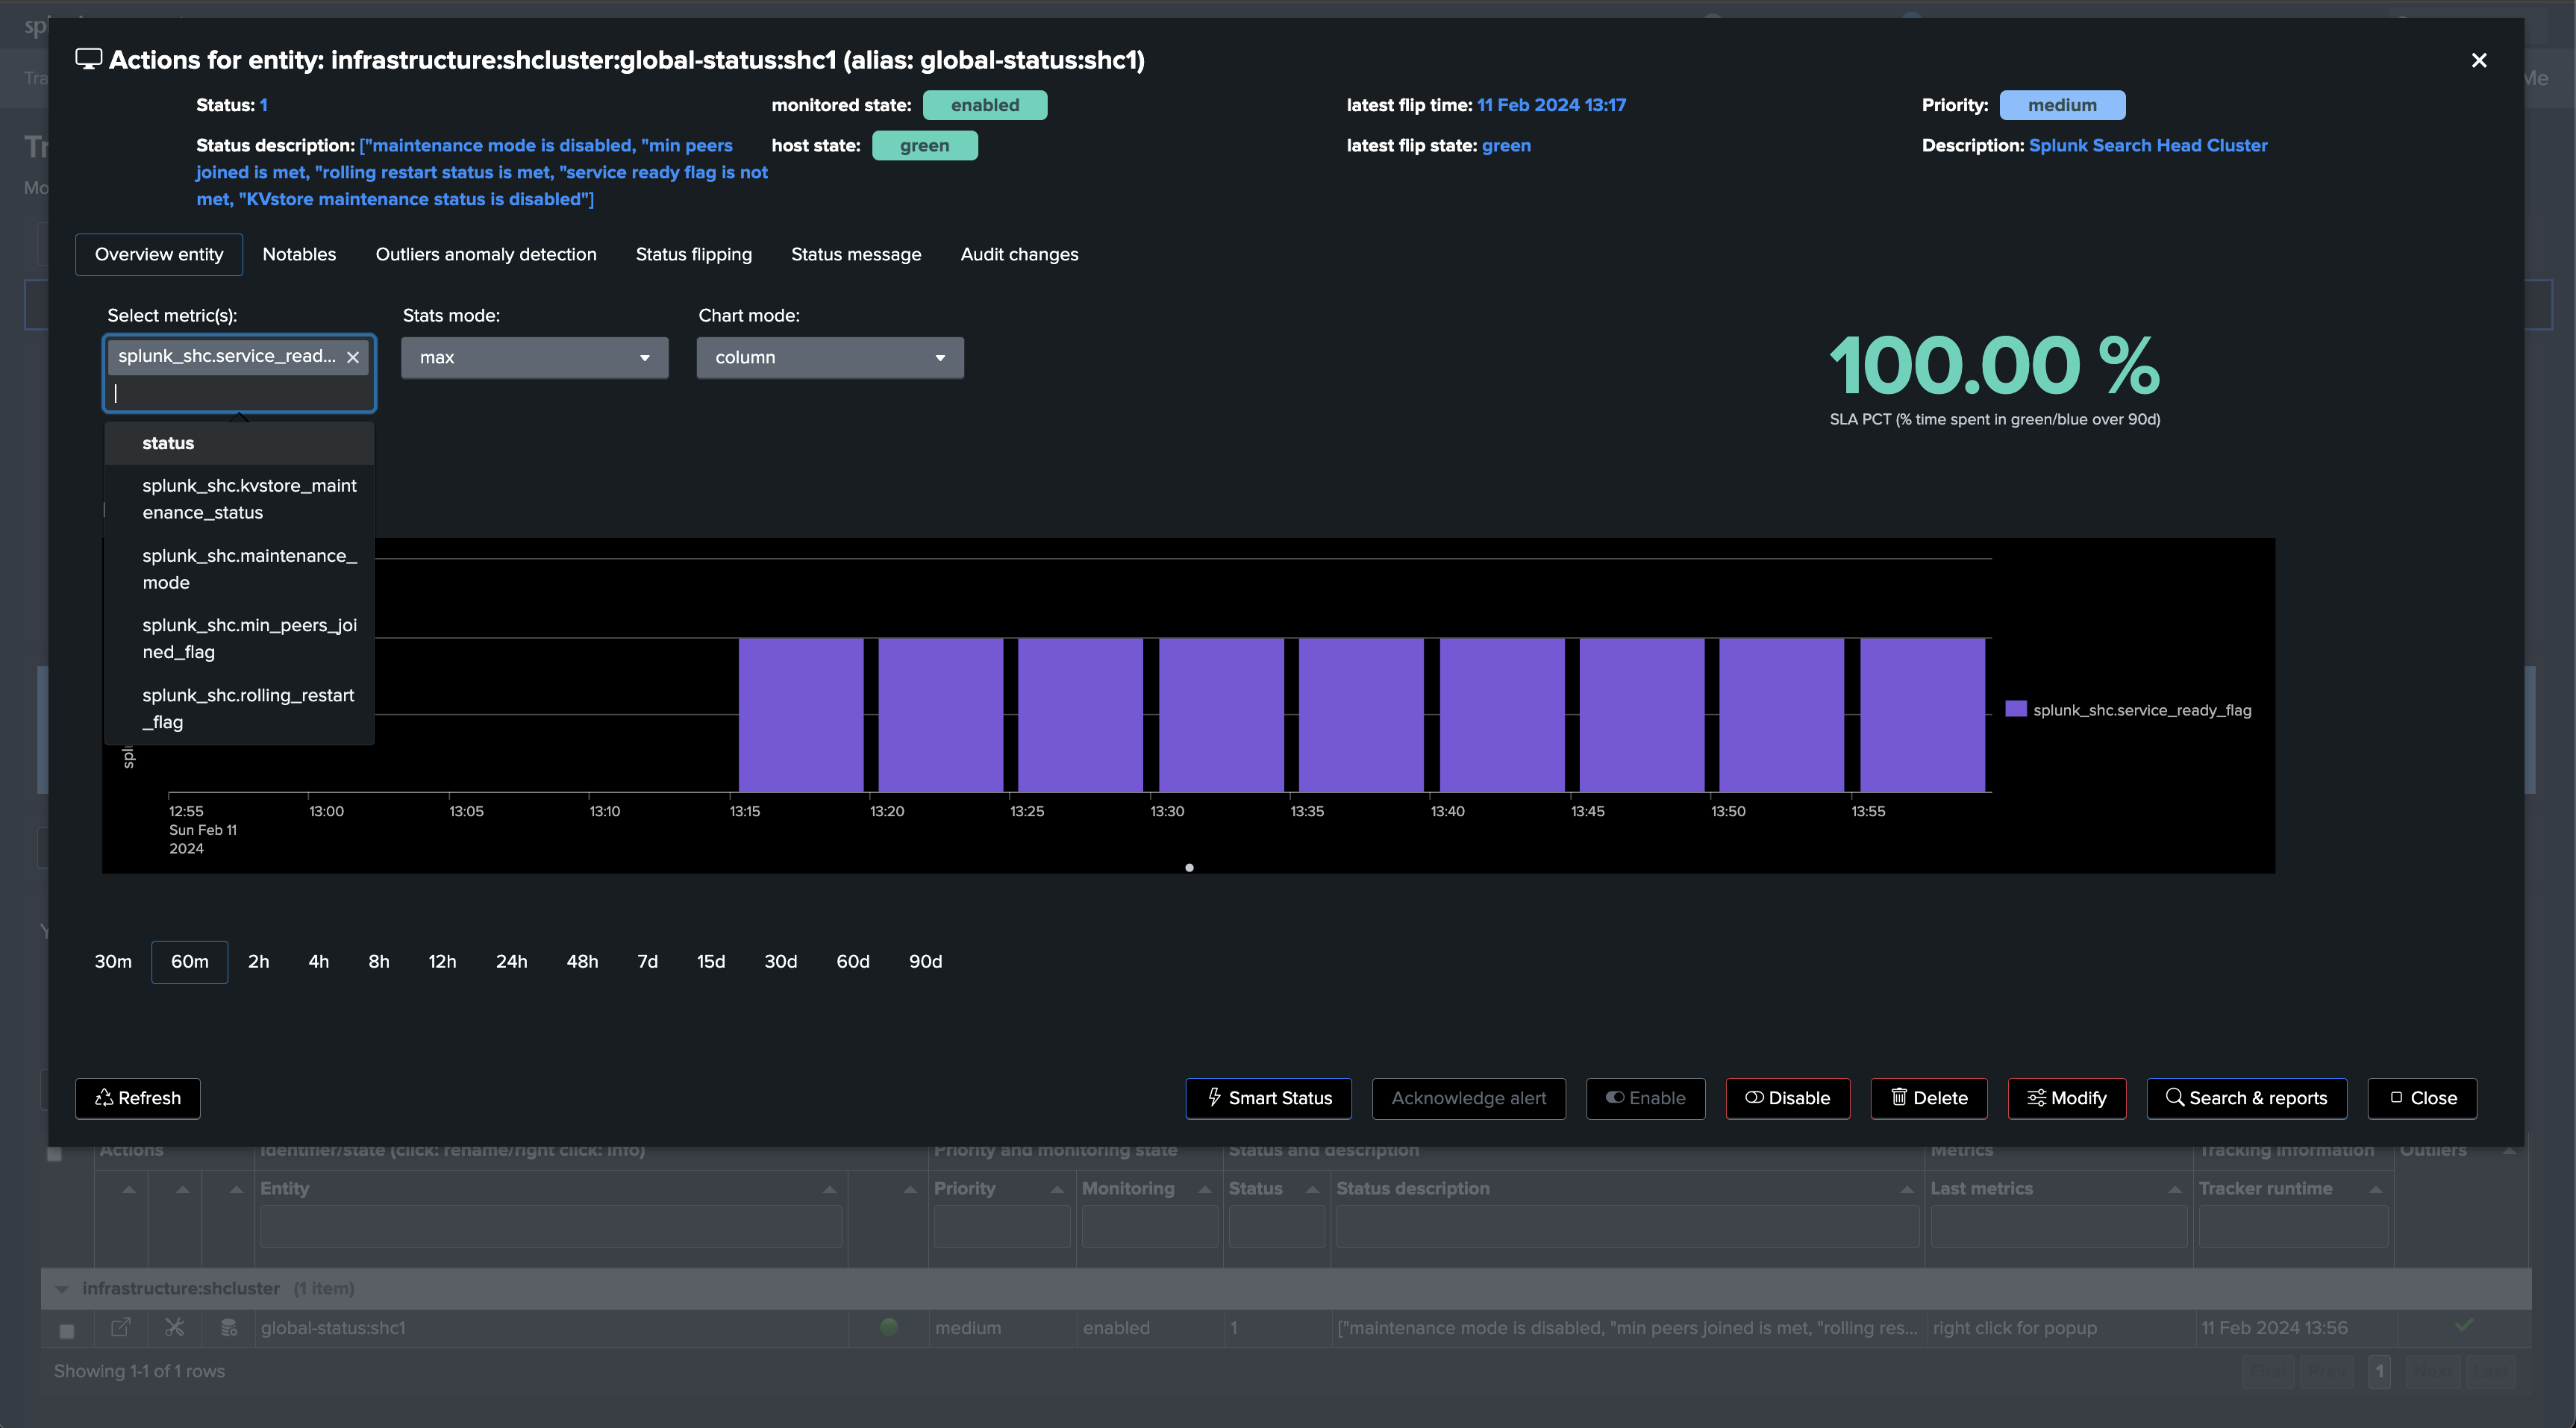
We will start with the use case “splk_splunk_shc_global_status” which tracks the SHC globally using the SHC API endpoints.
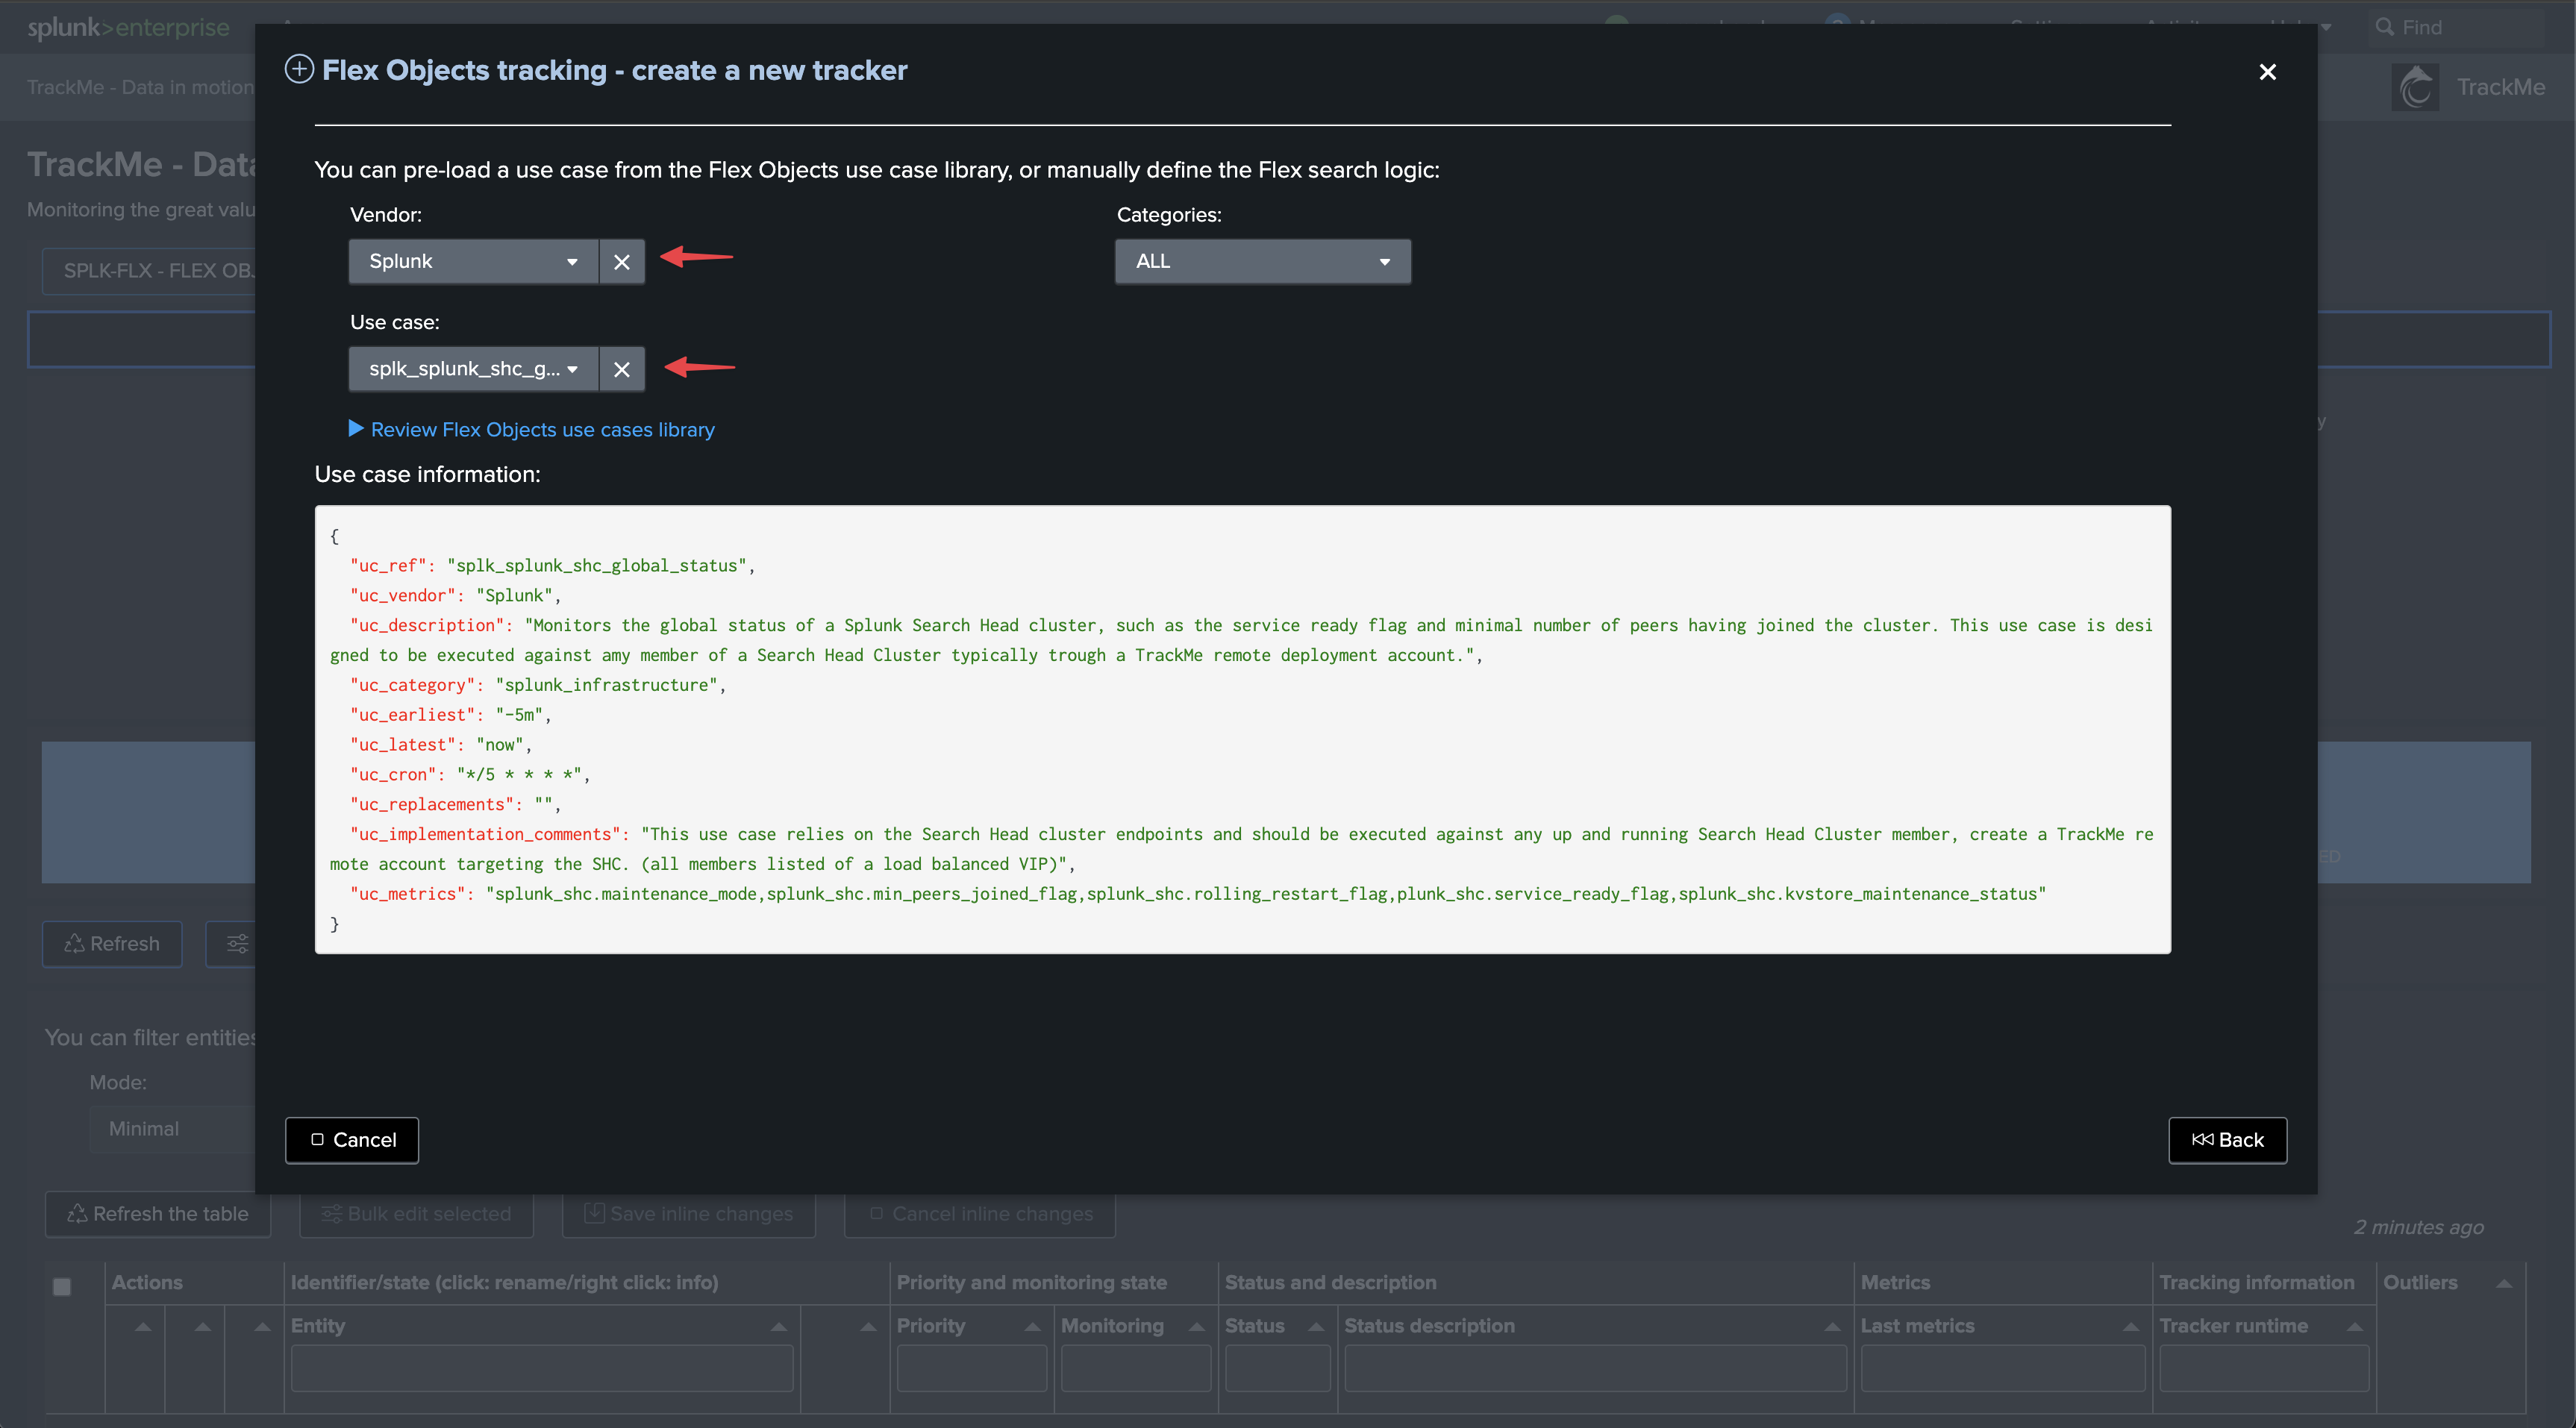

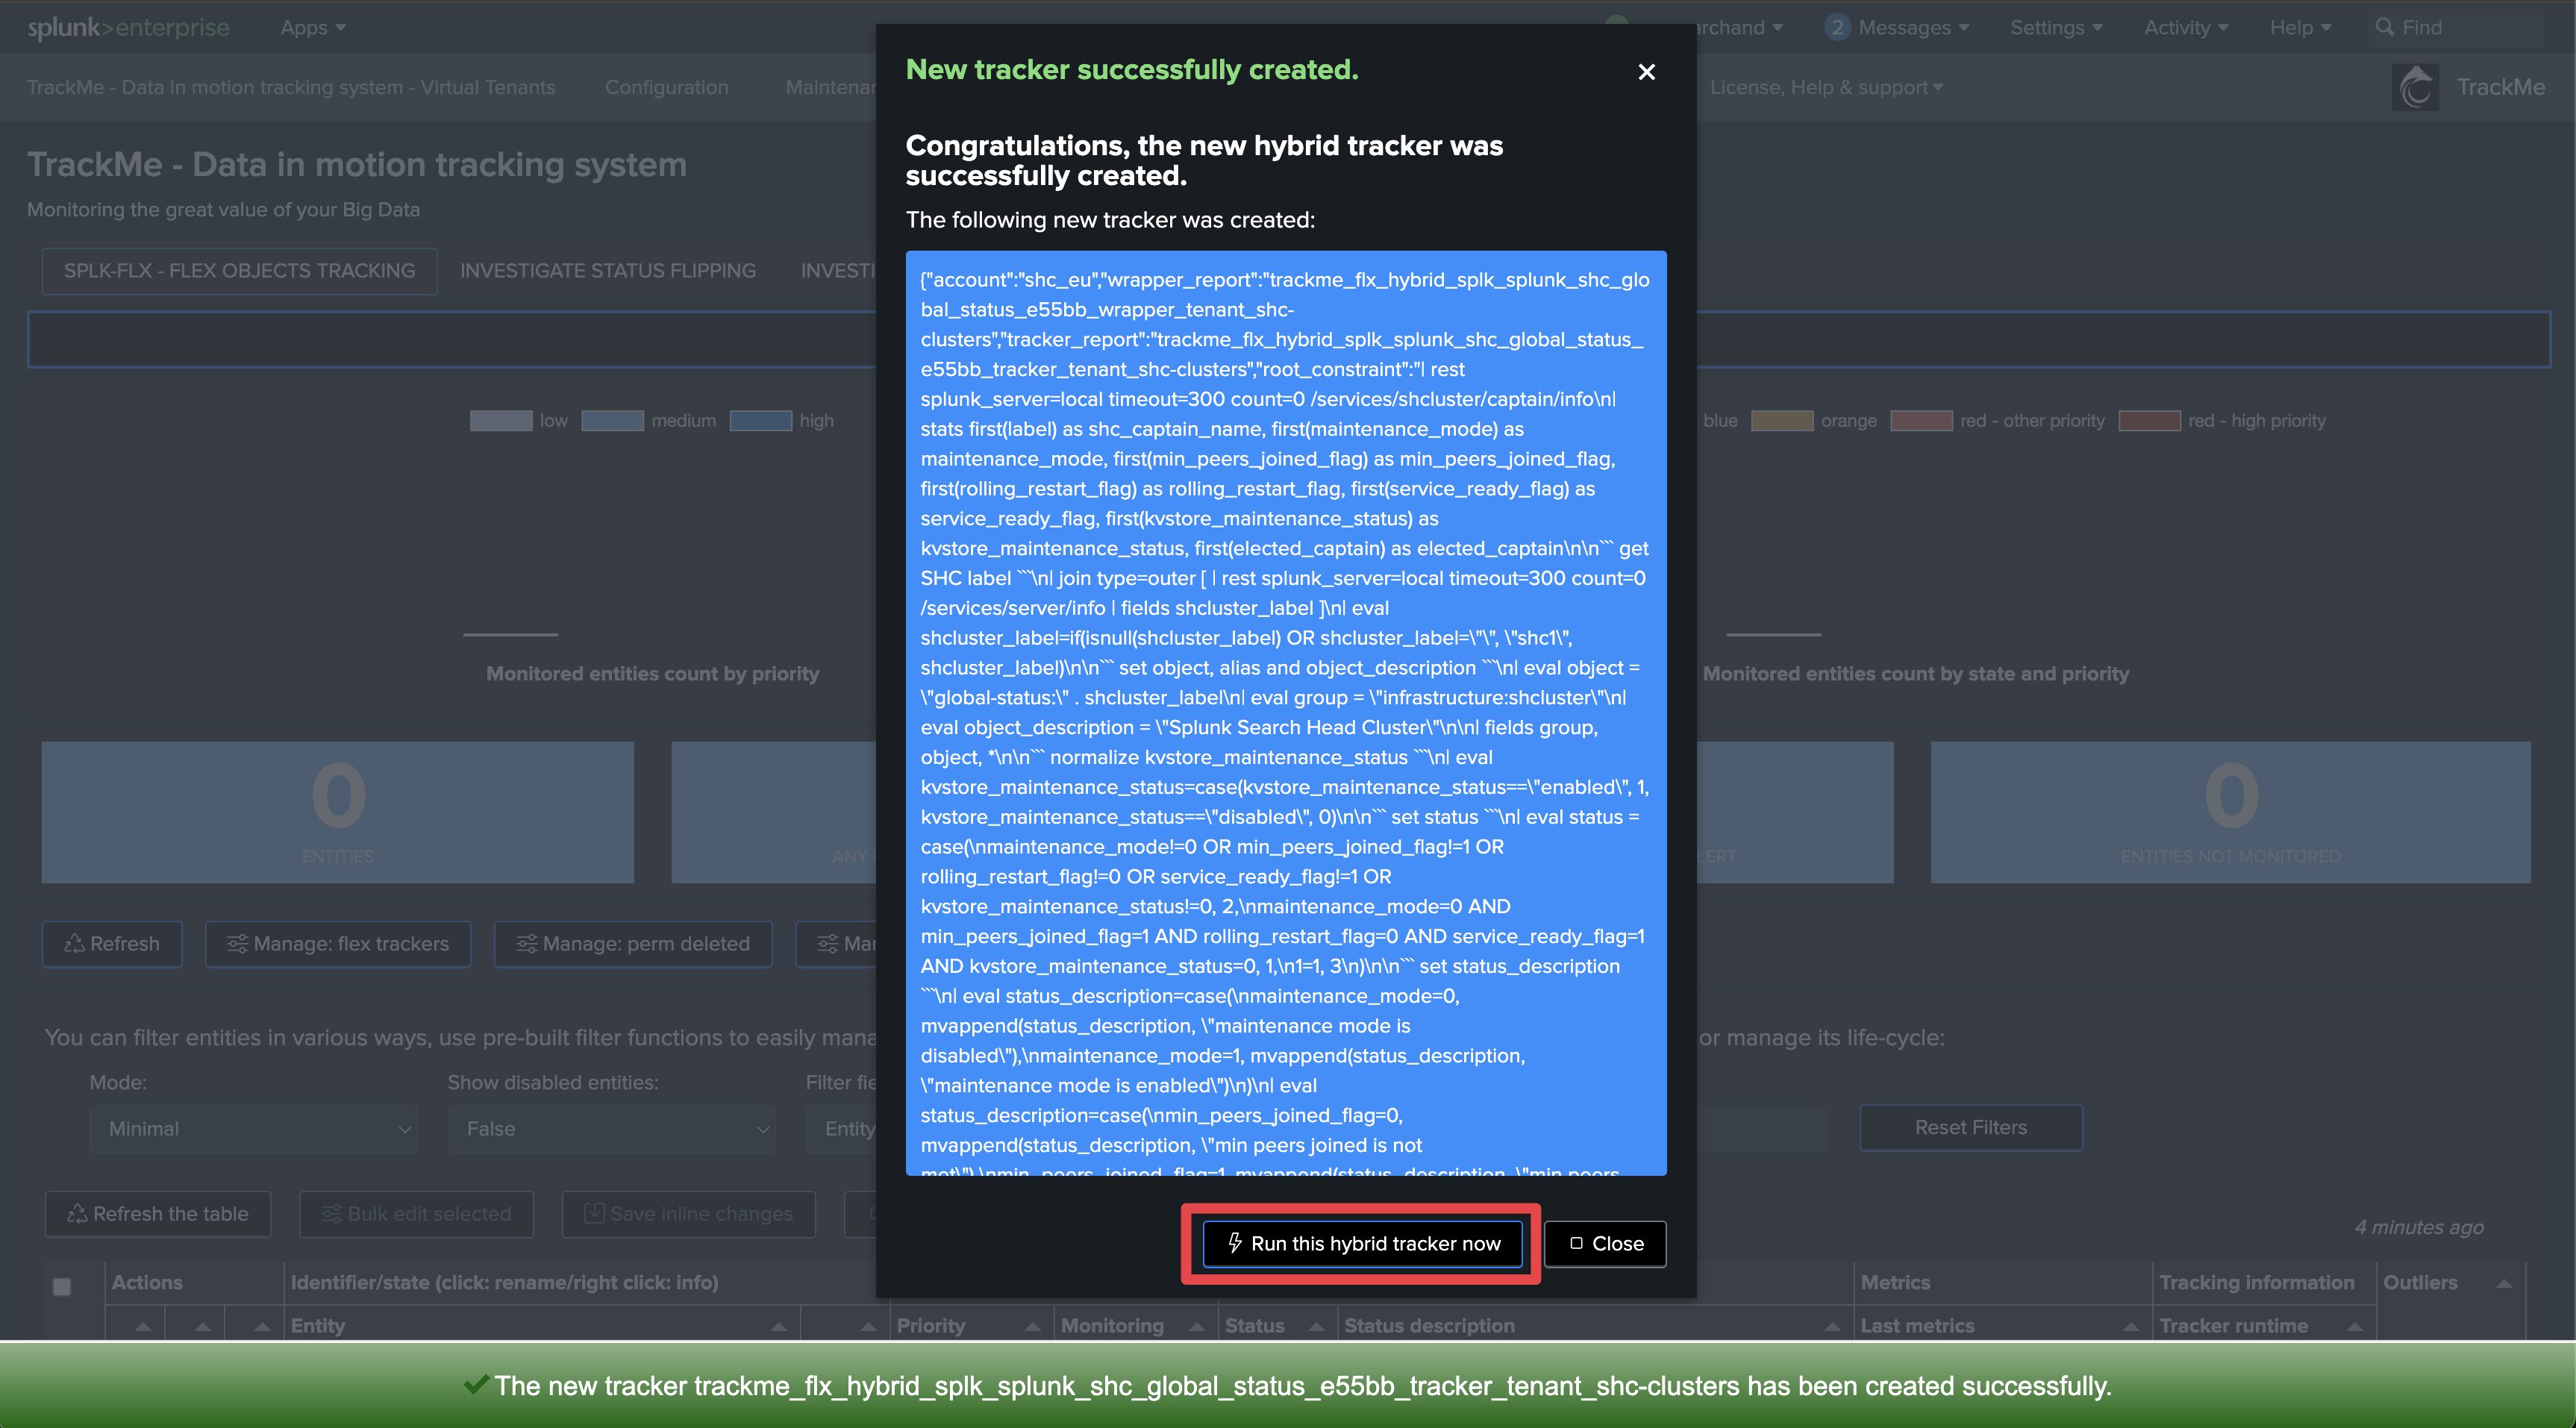
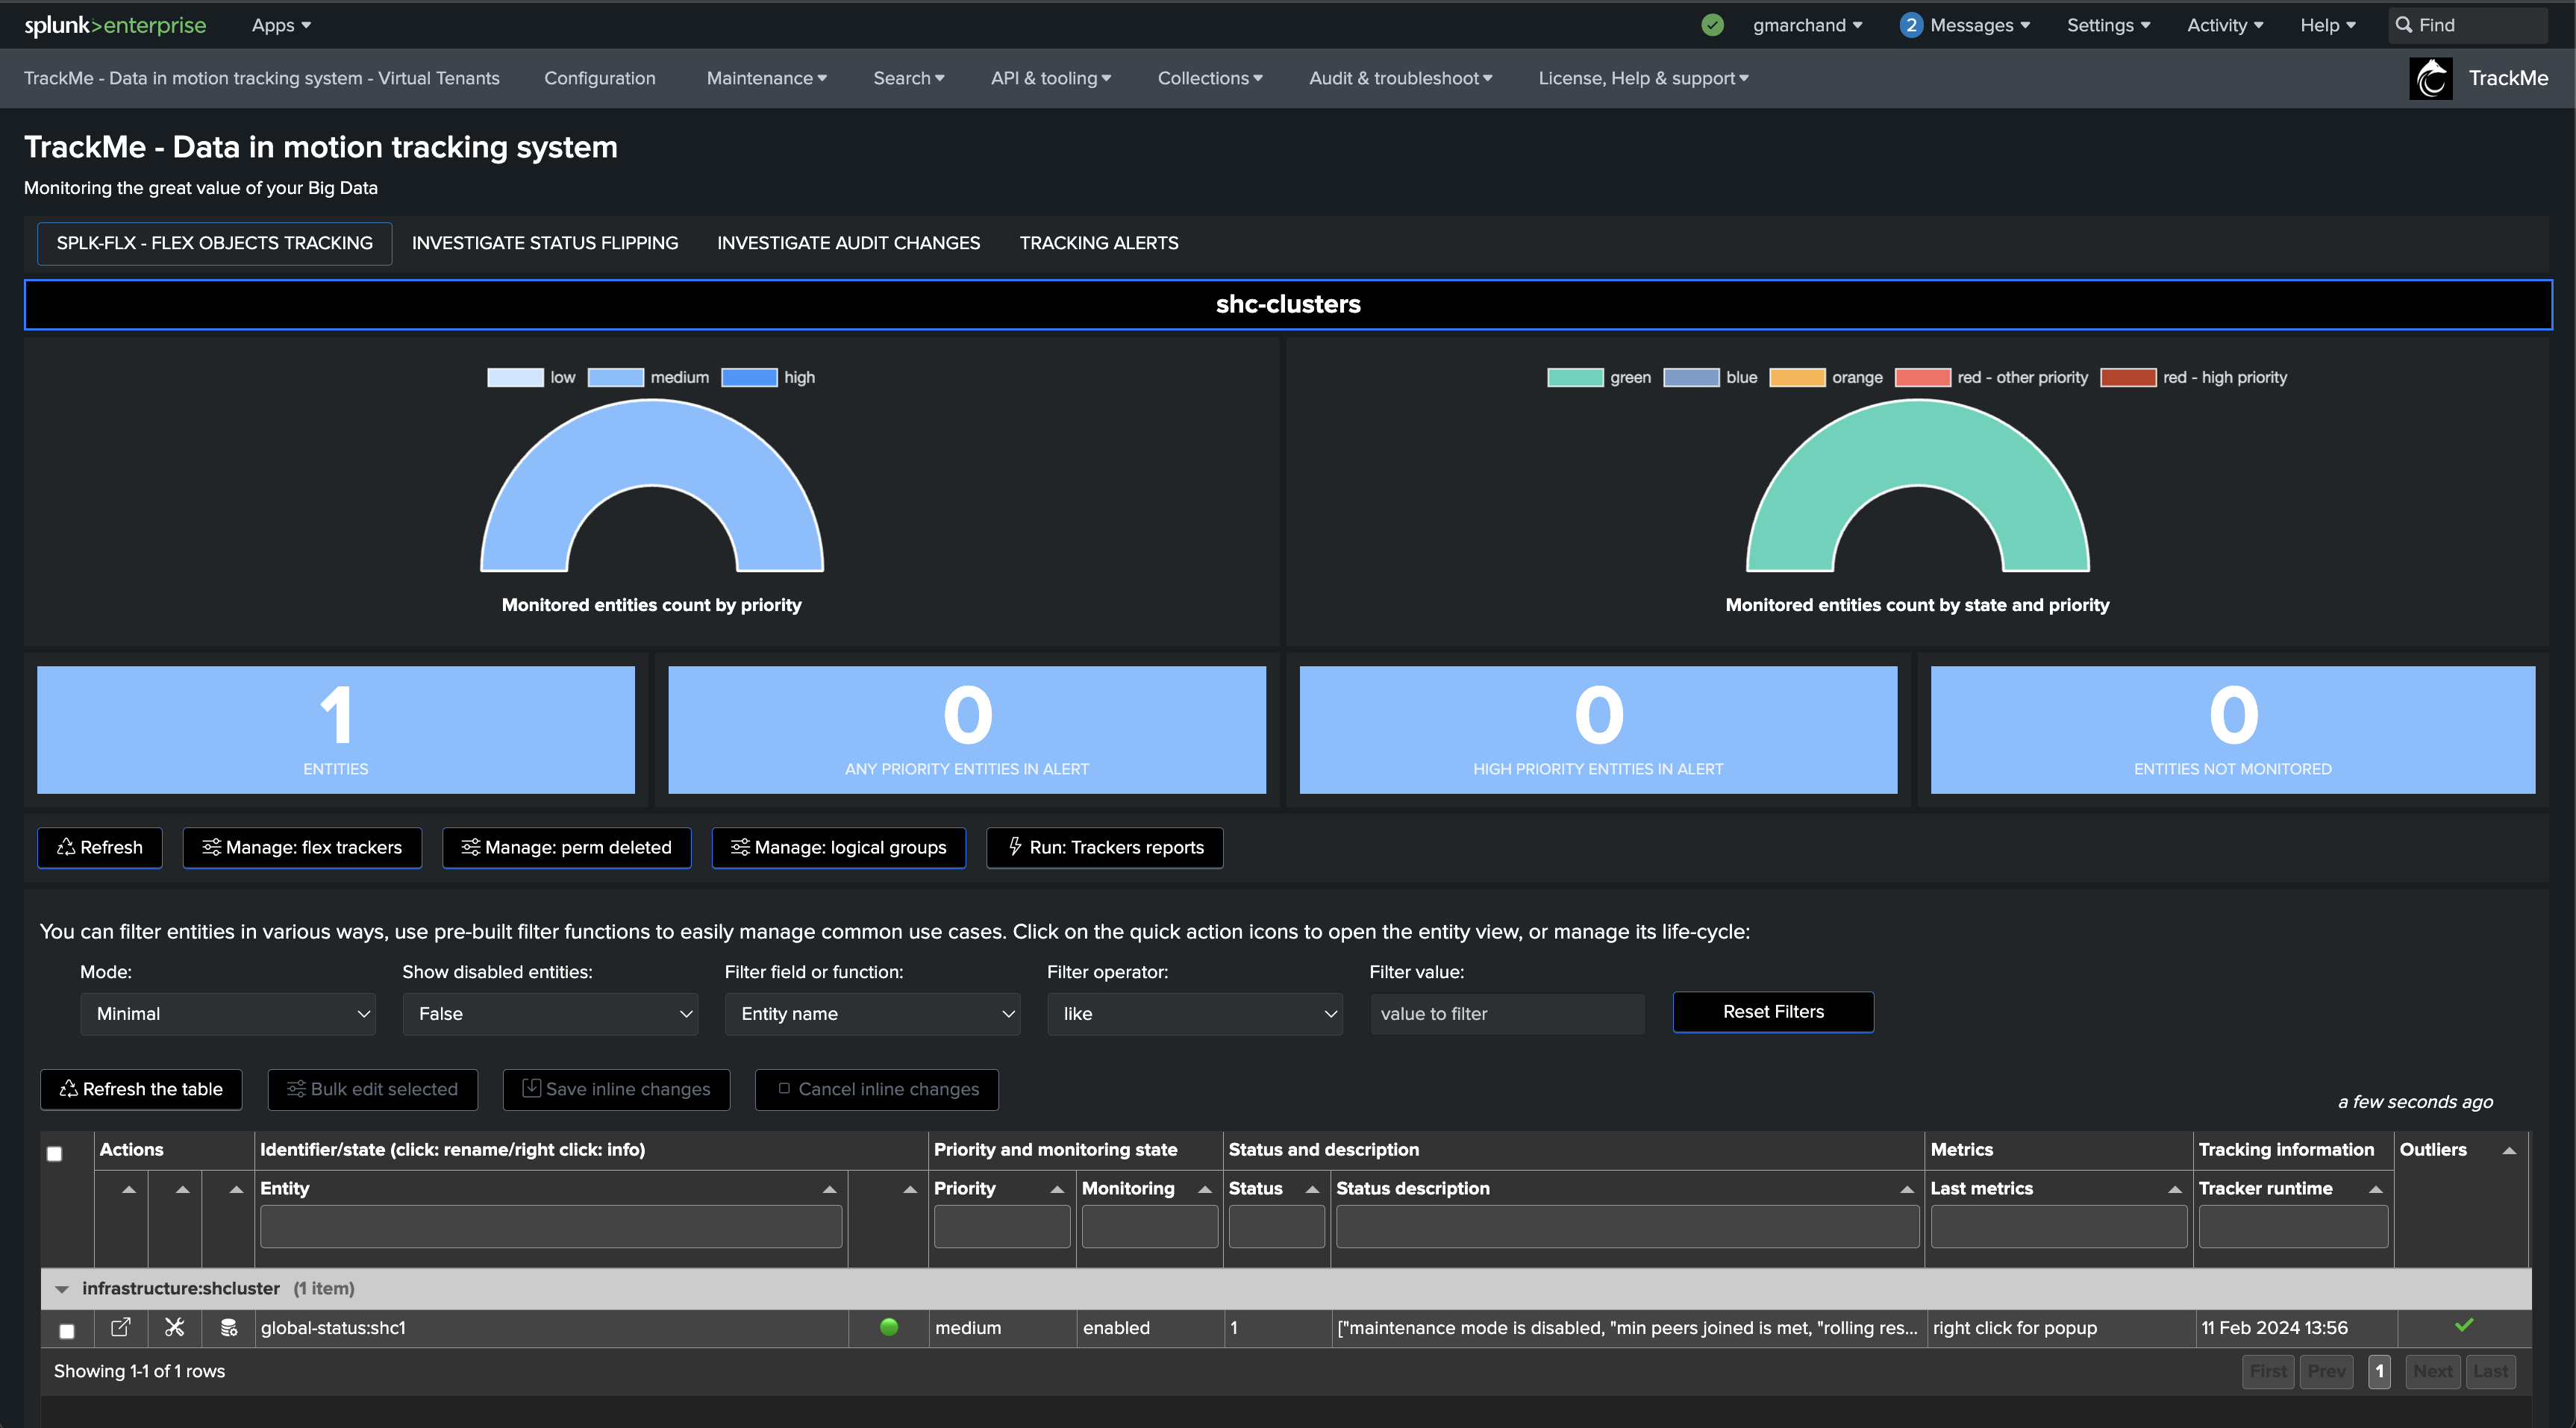
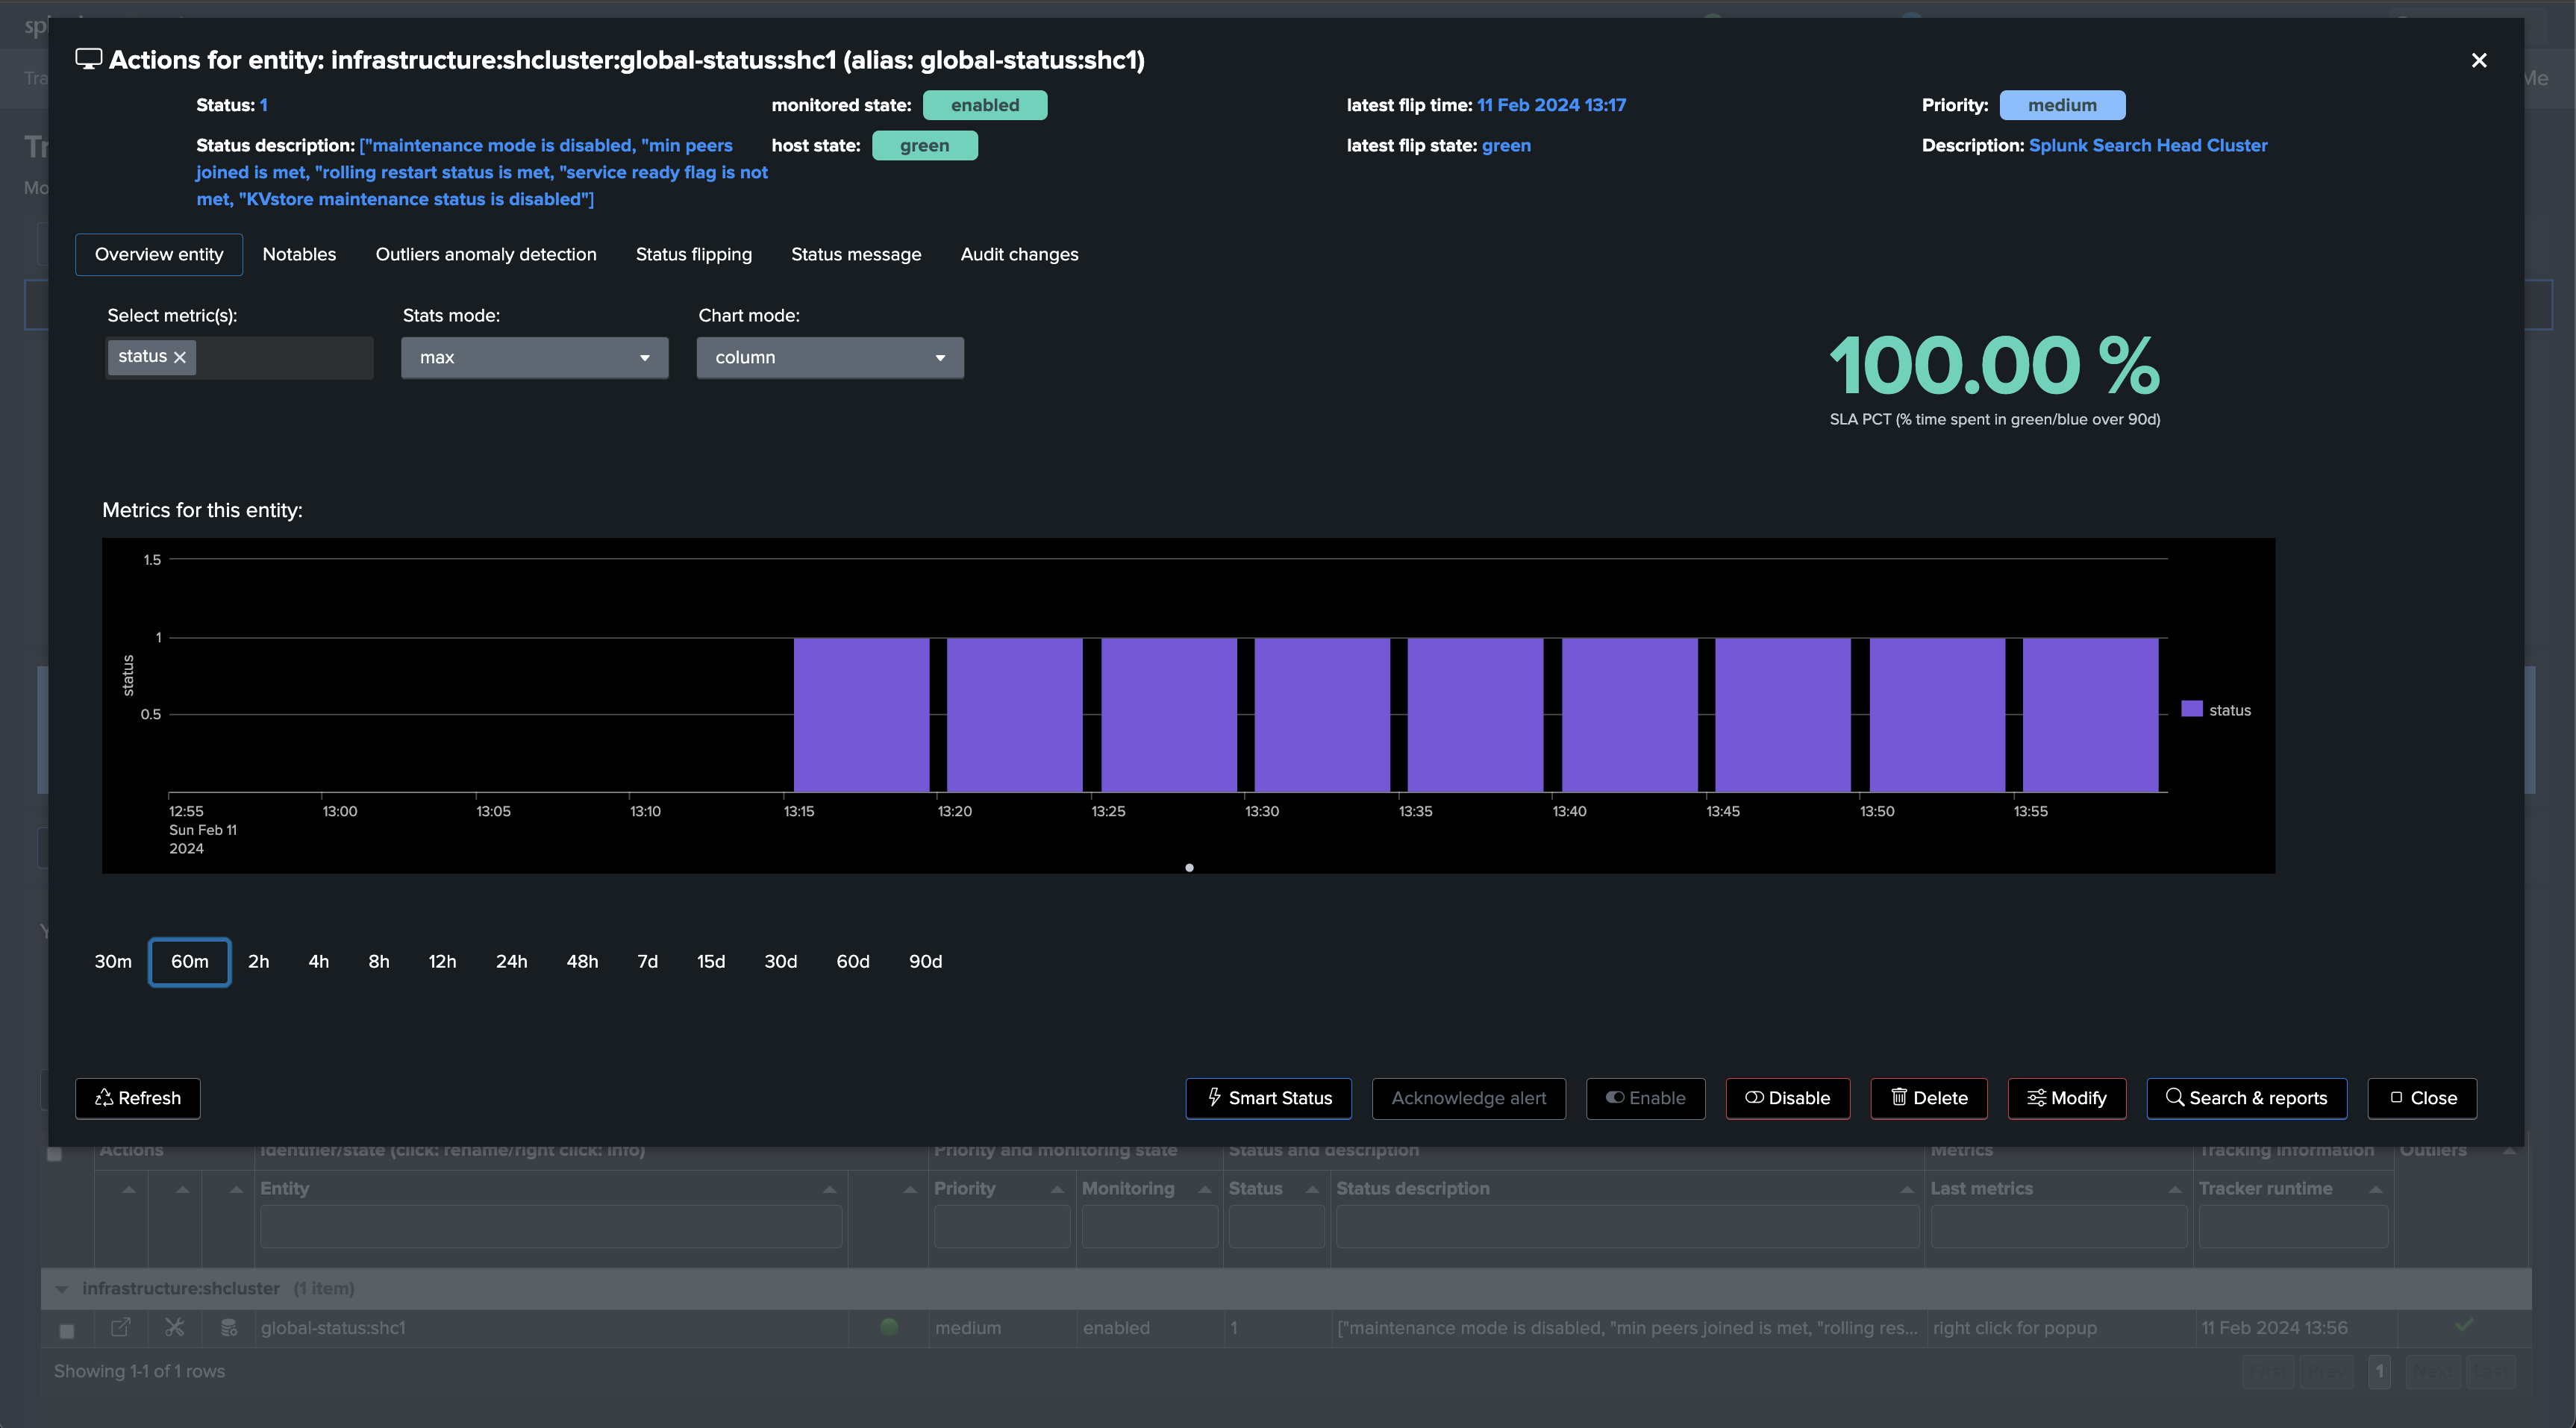
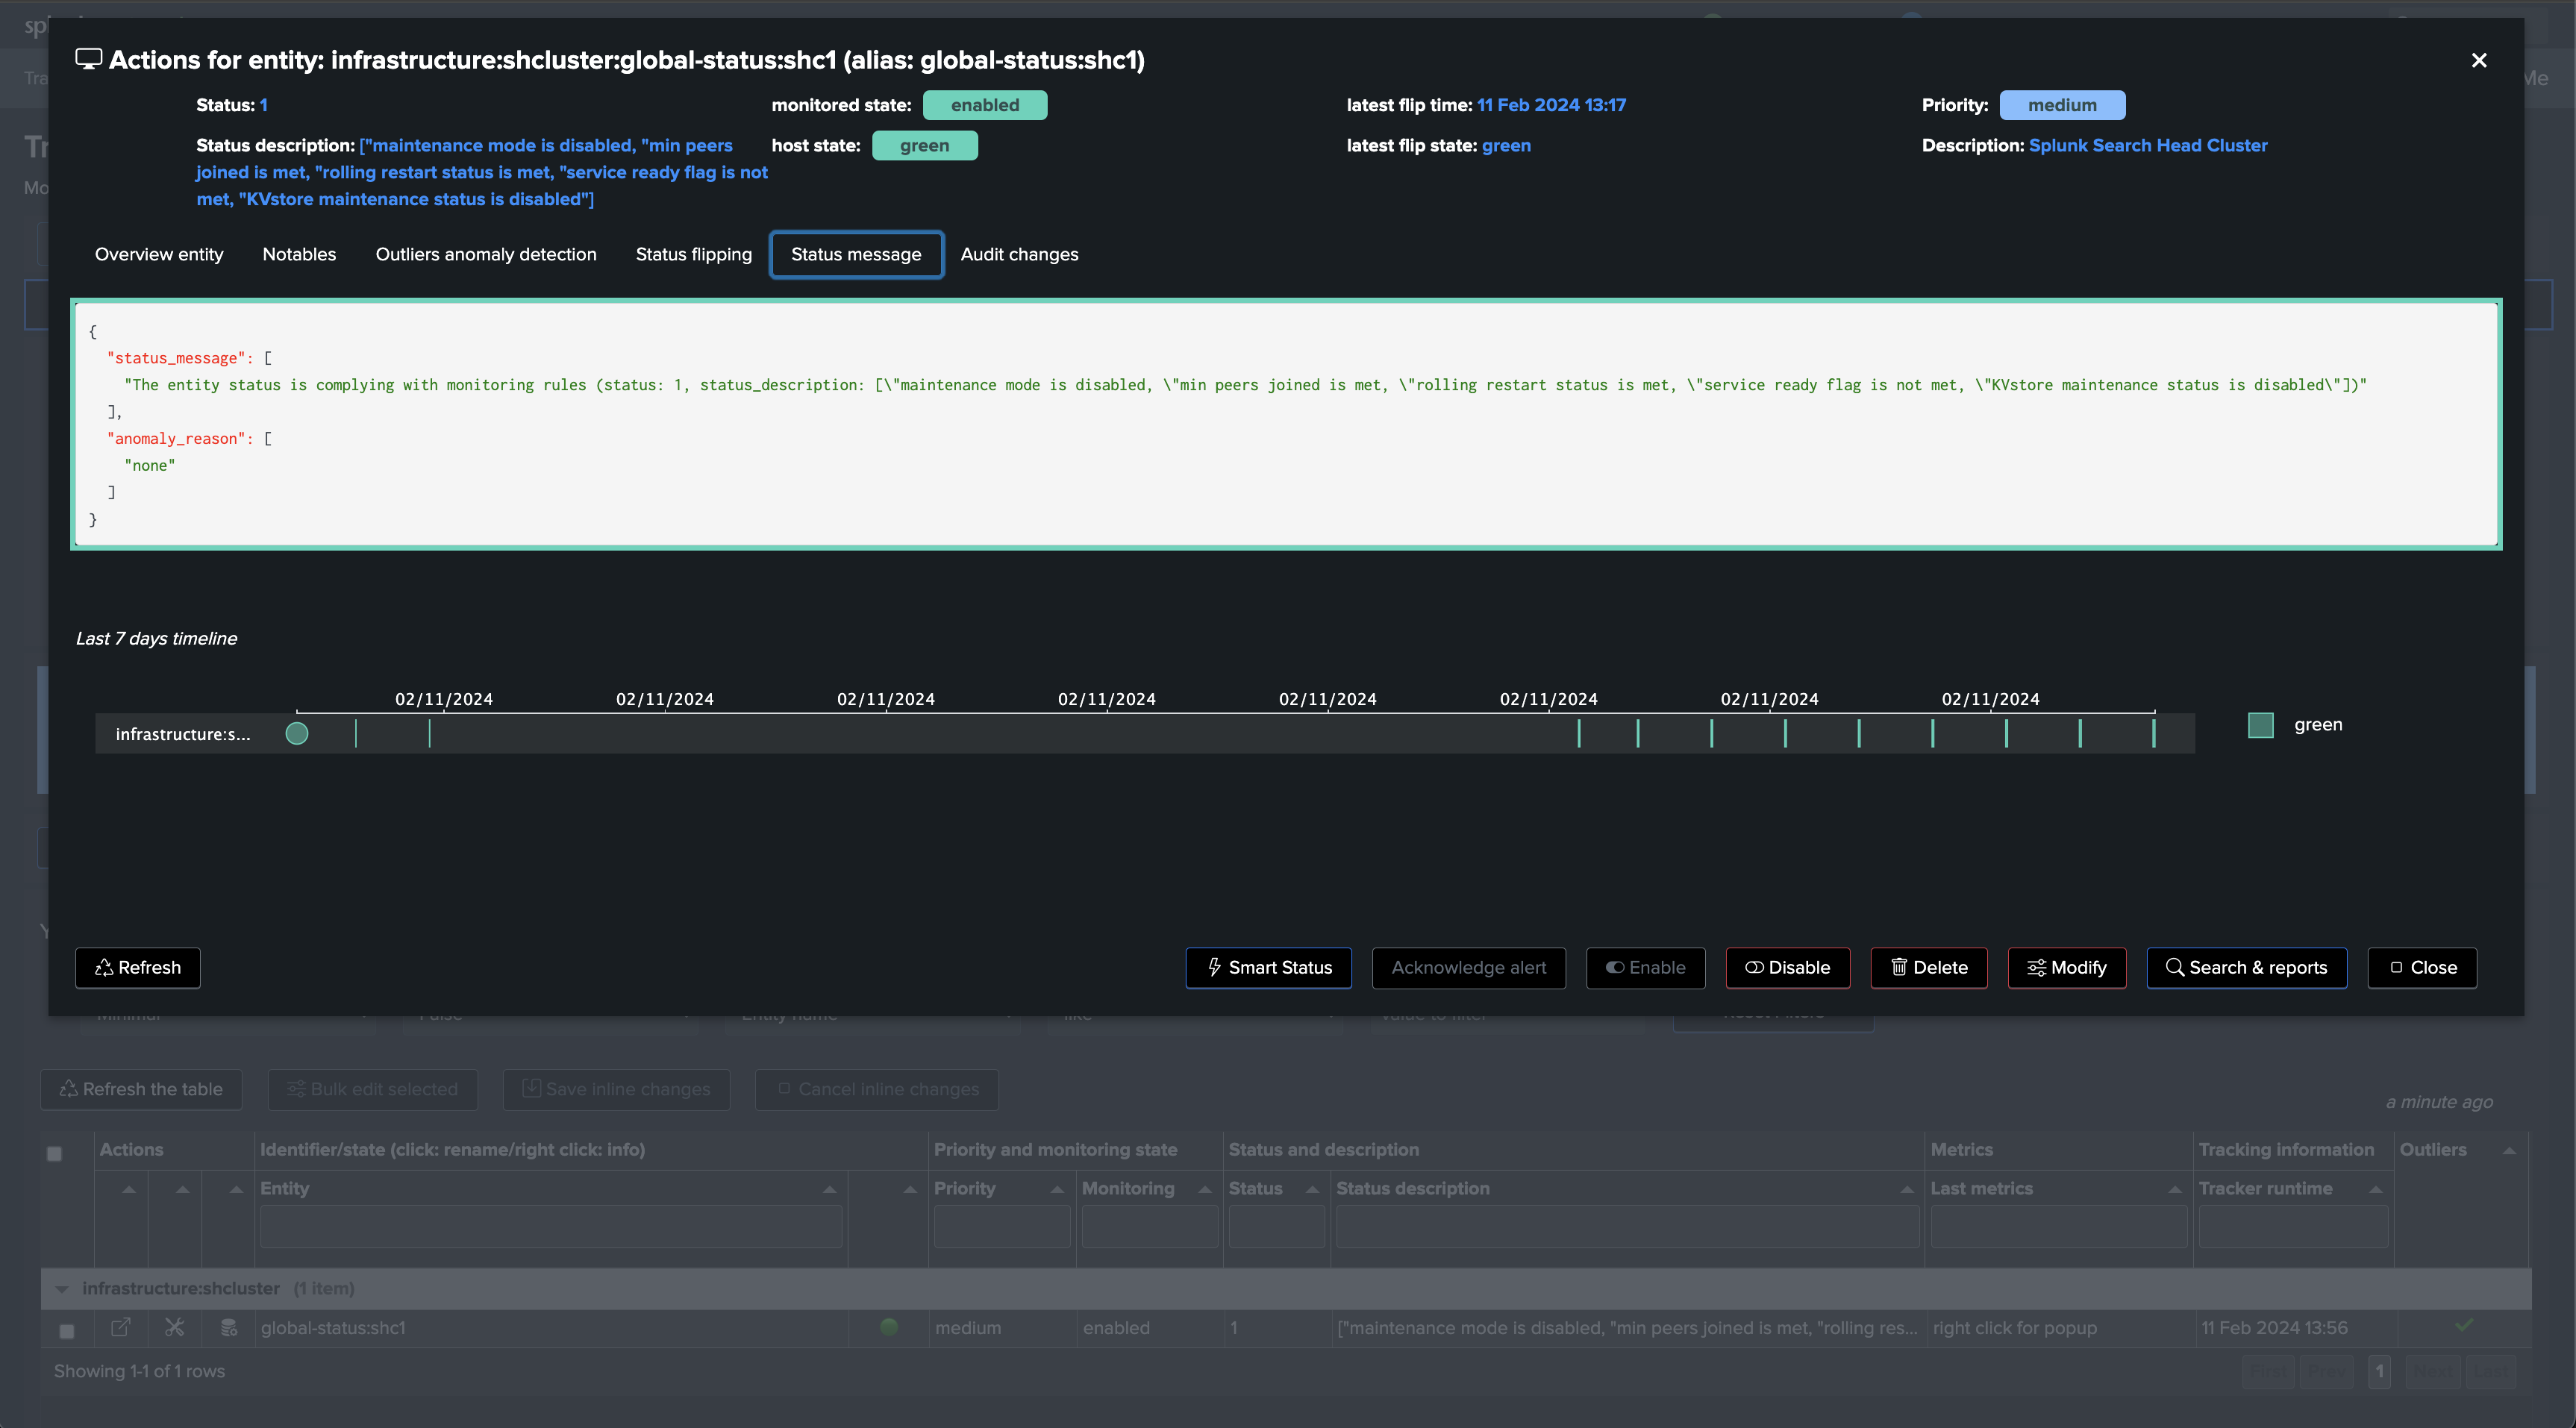
Once executed, TrackMe immediately starts monitoring the SHC global status, generates and indexes metrics, and alerts you when issues are detected.
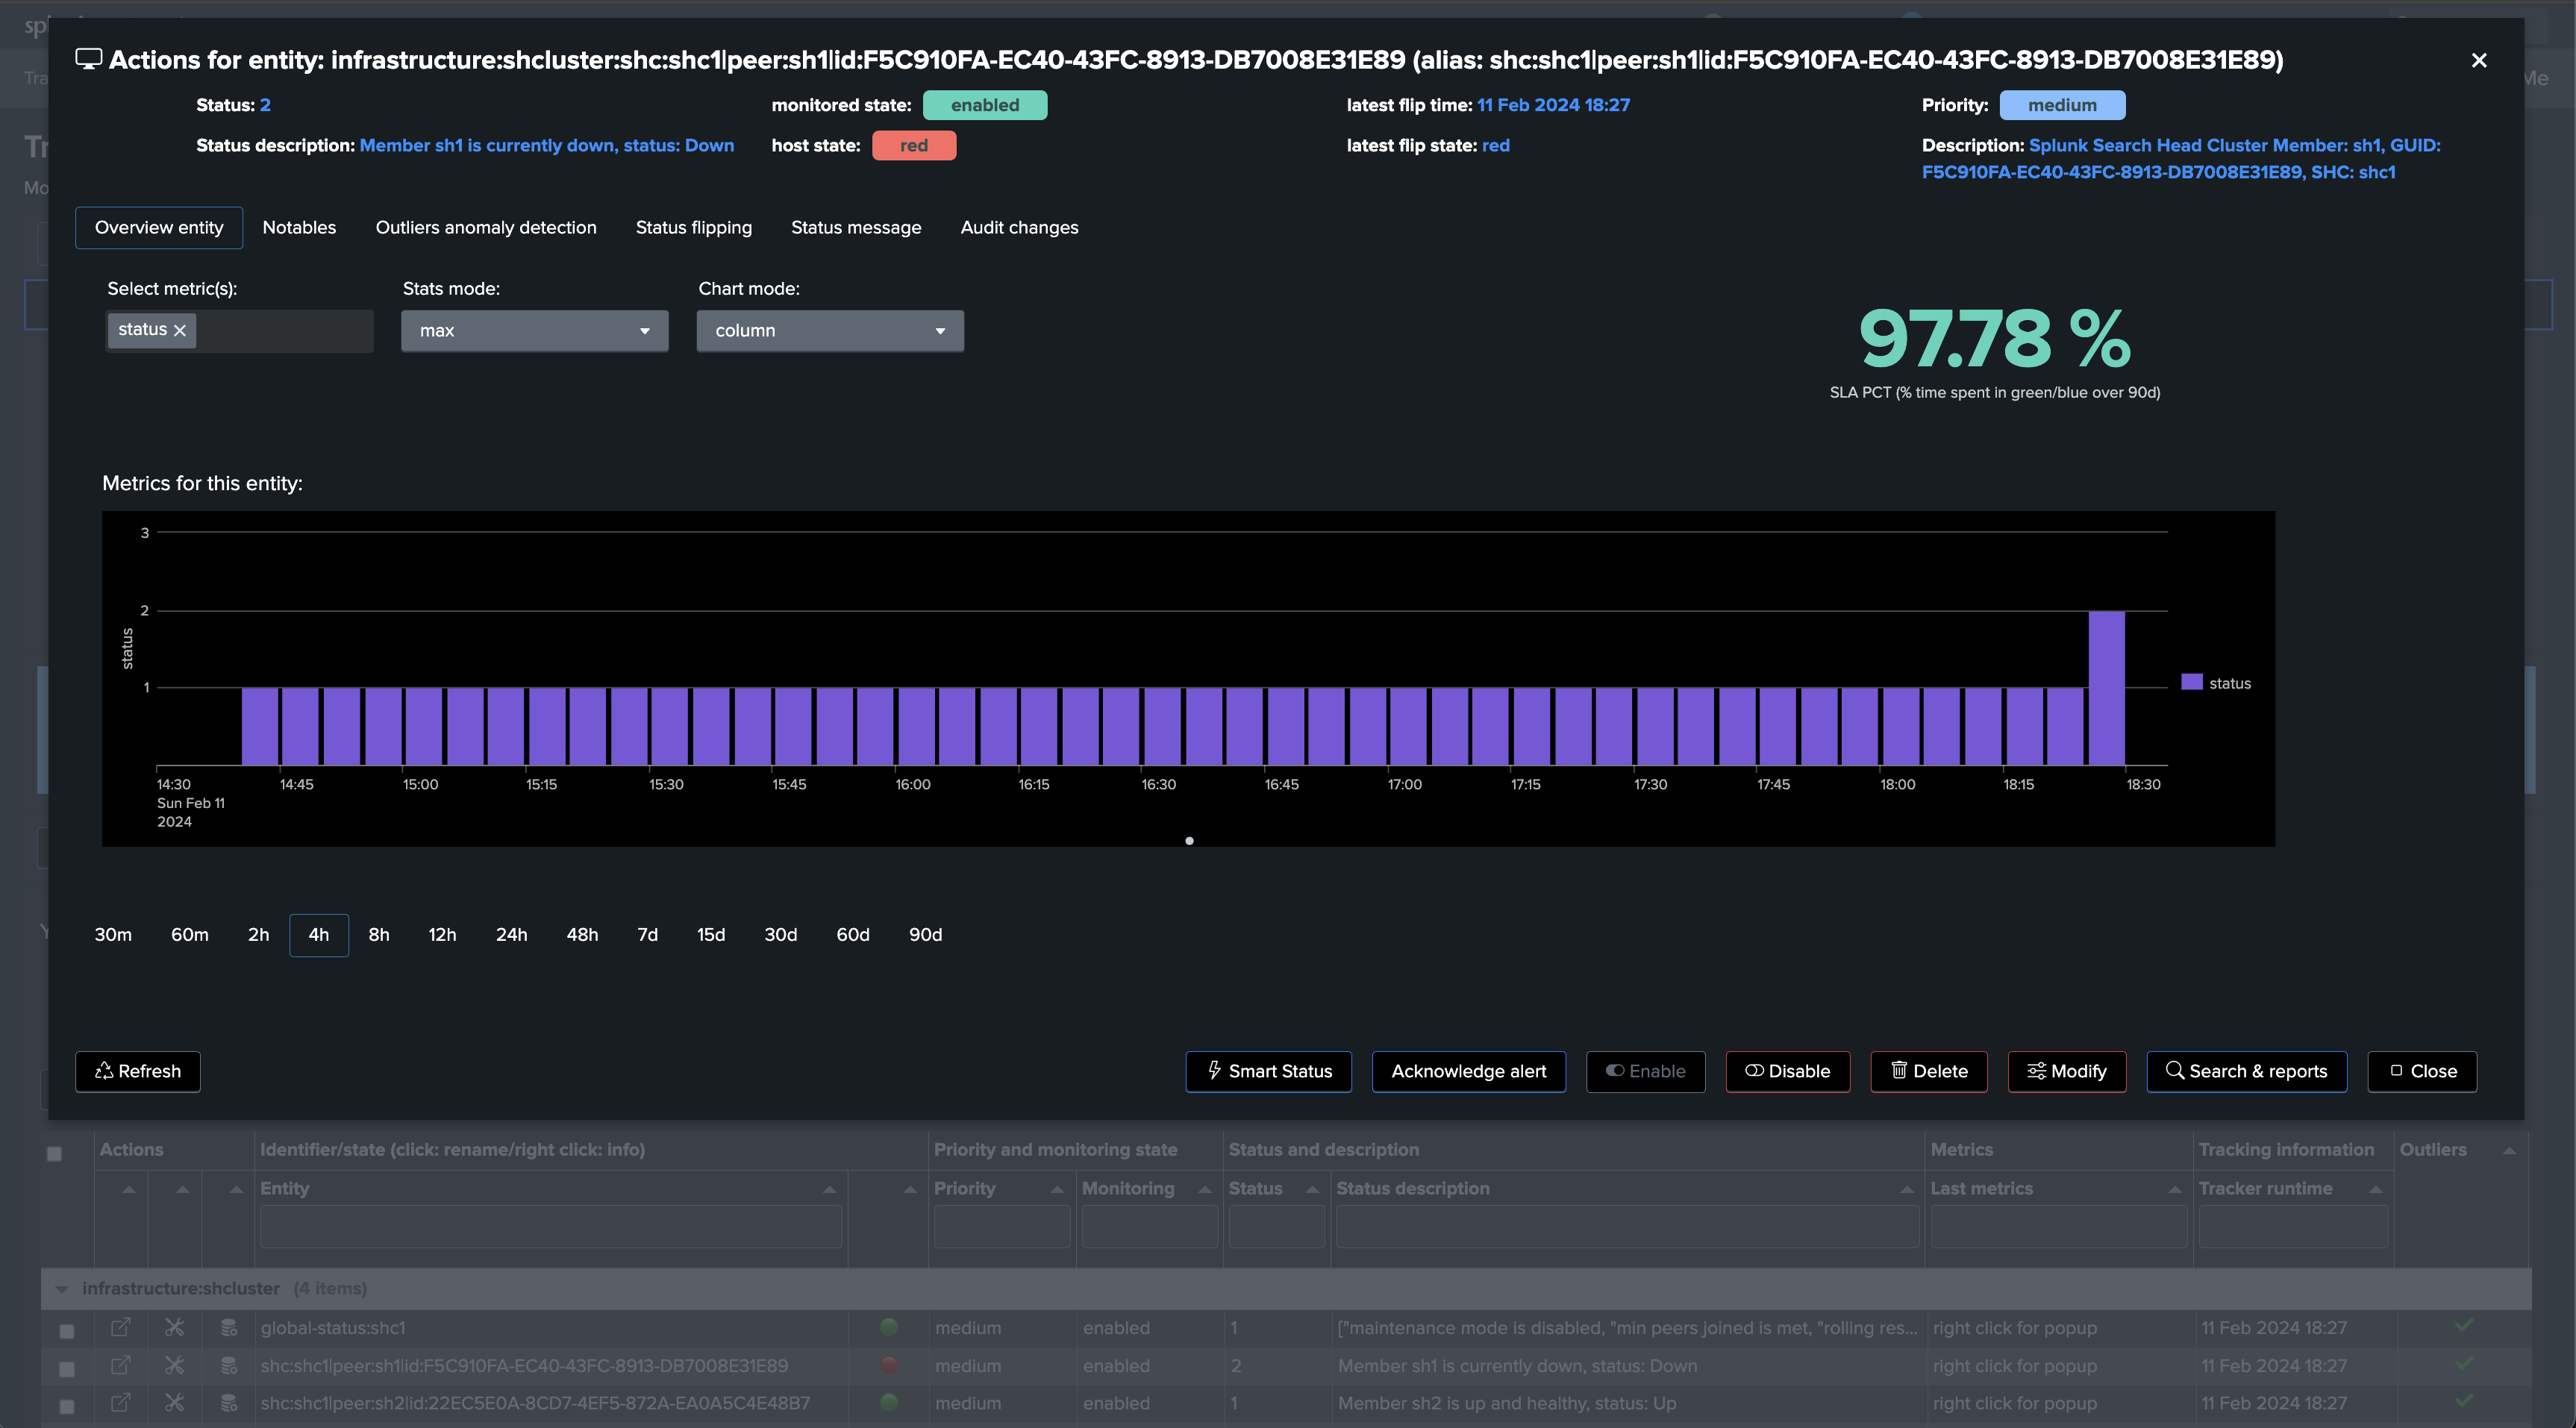
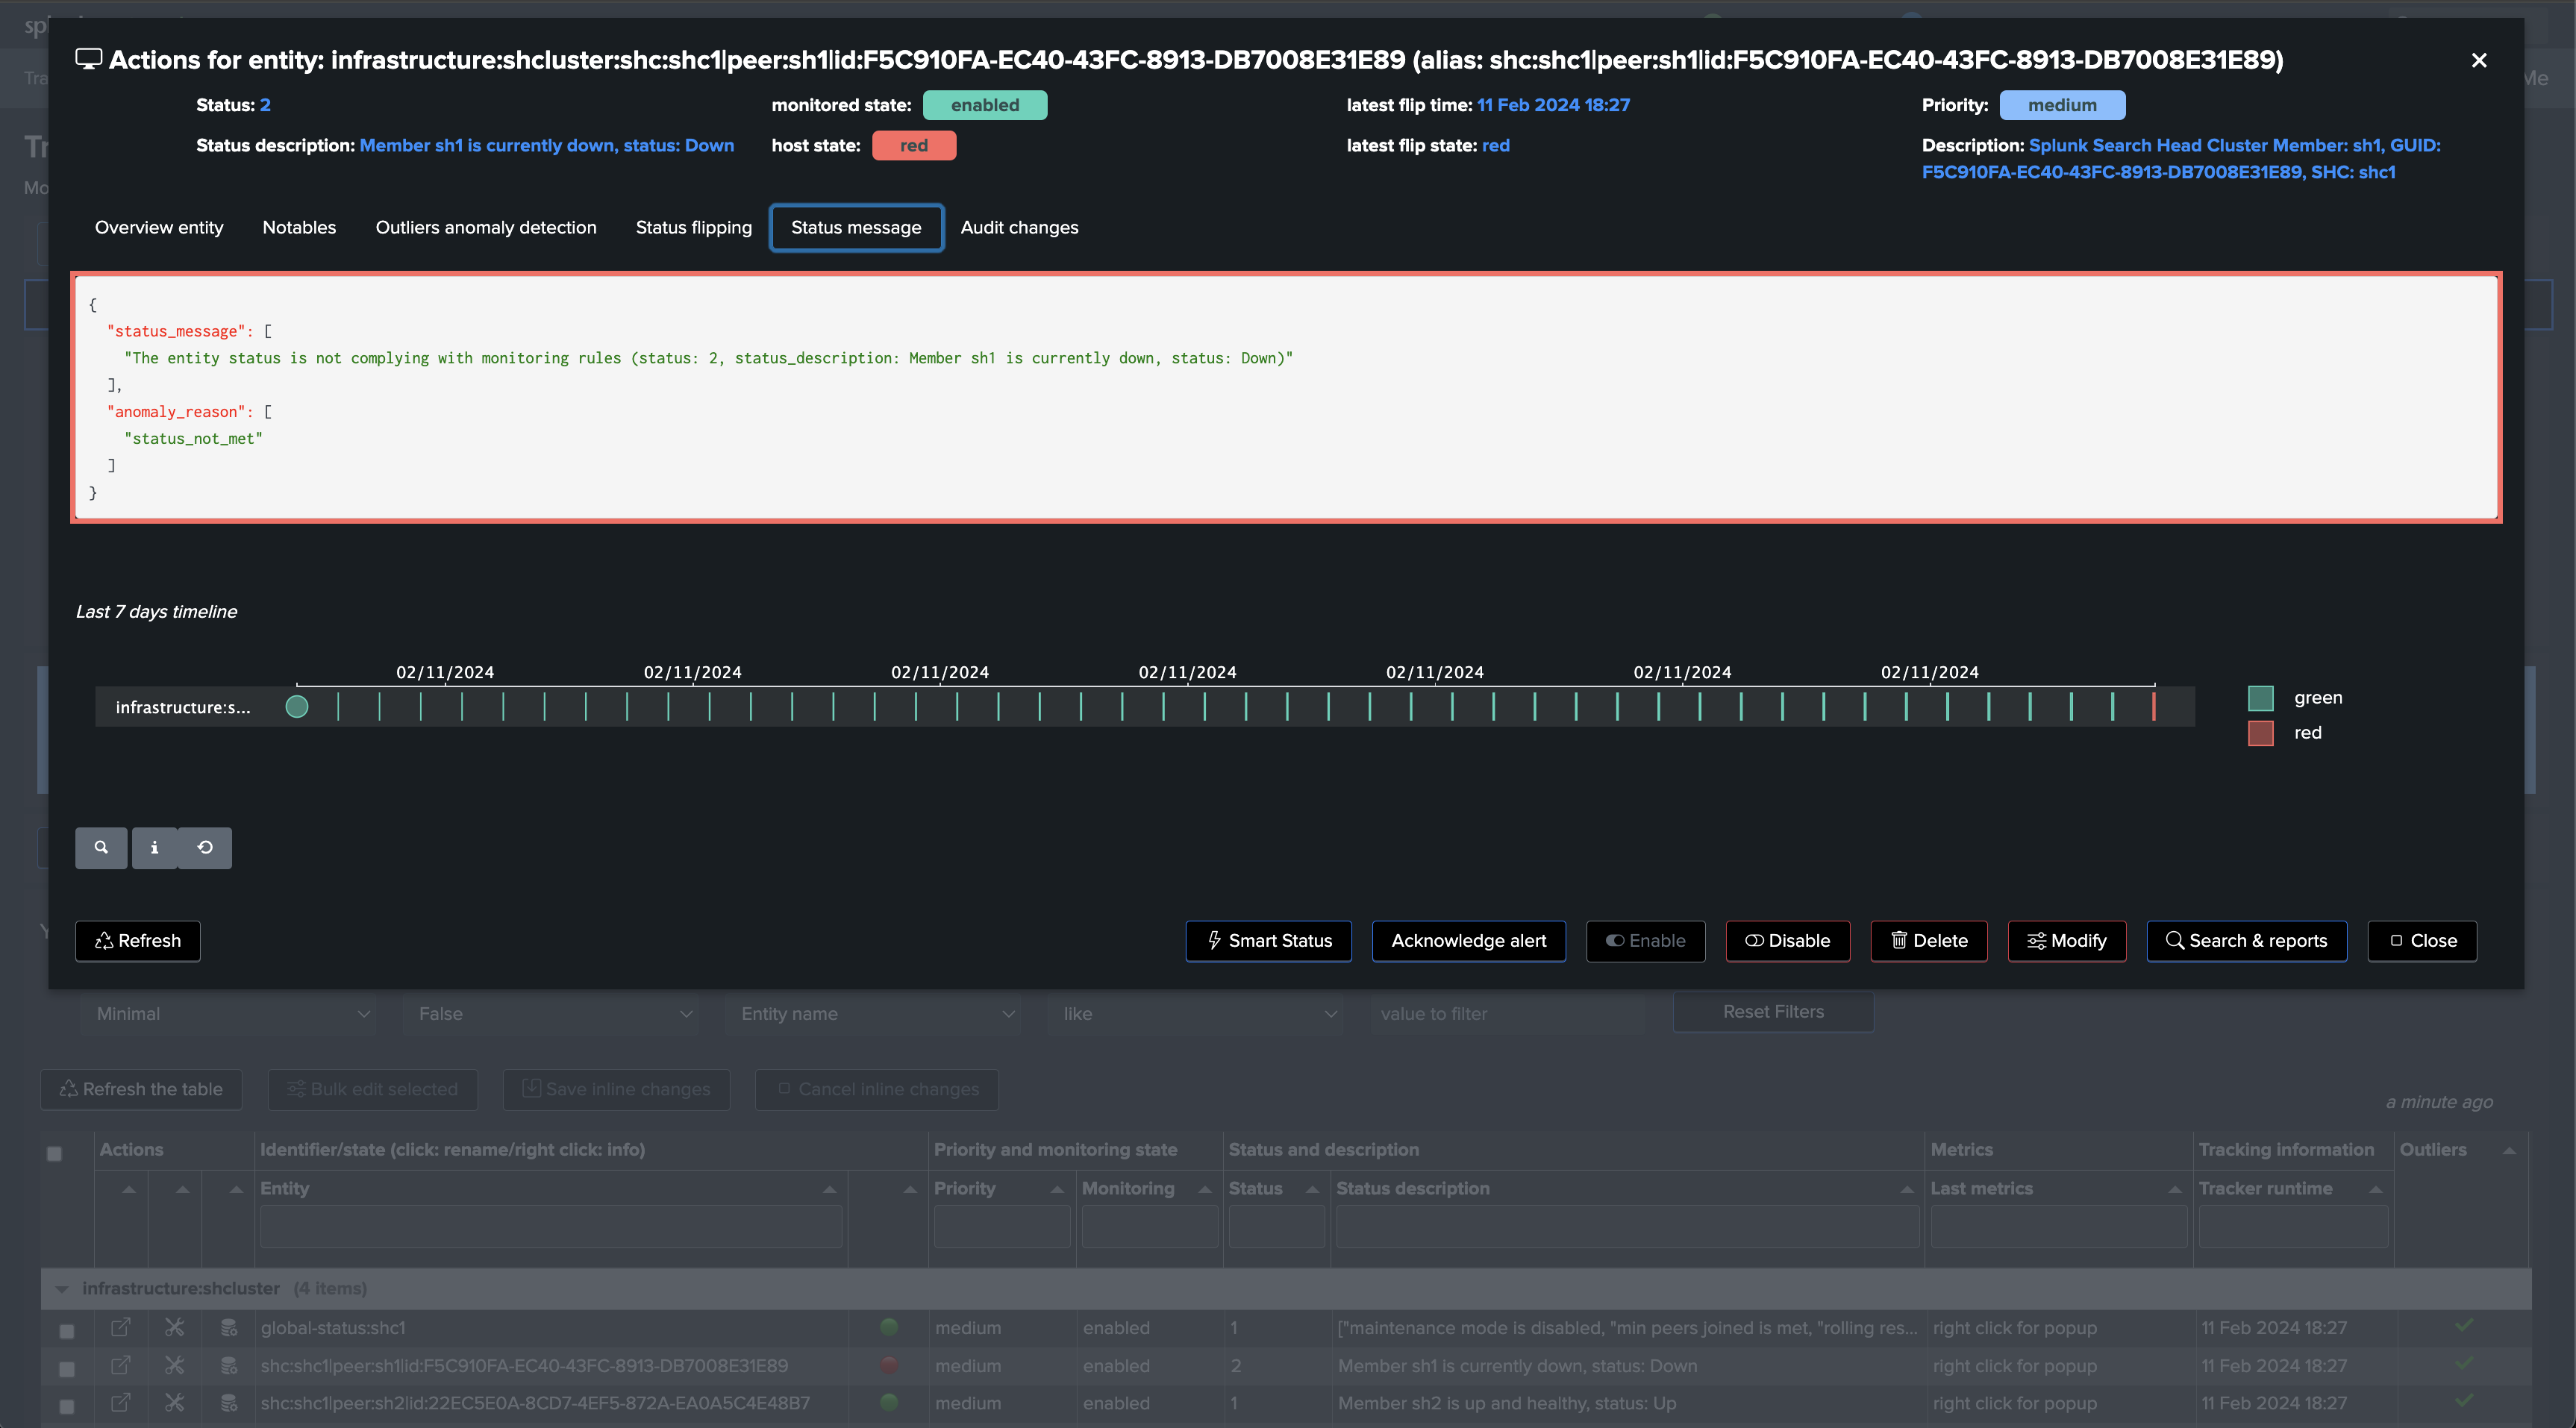
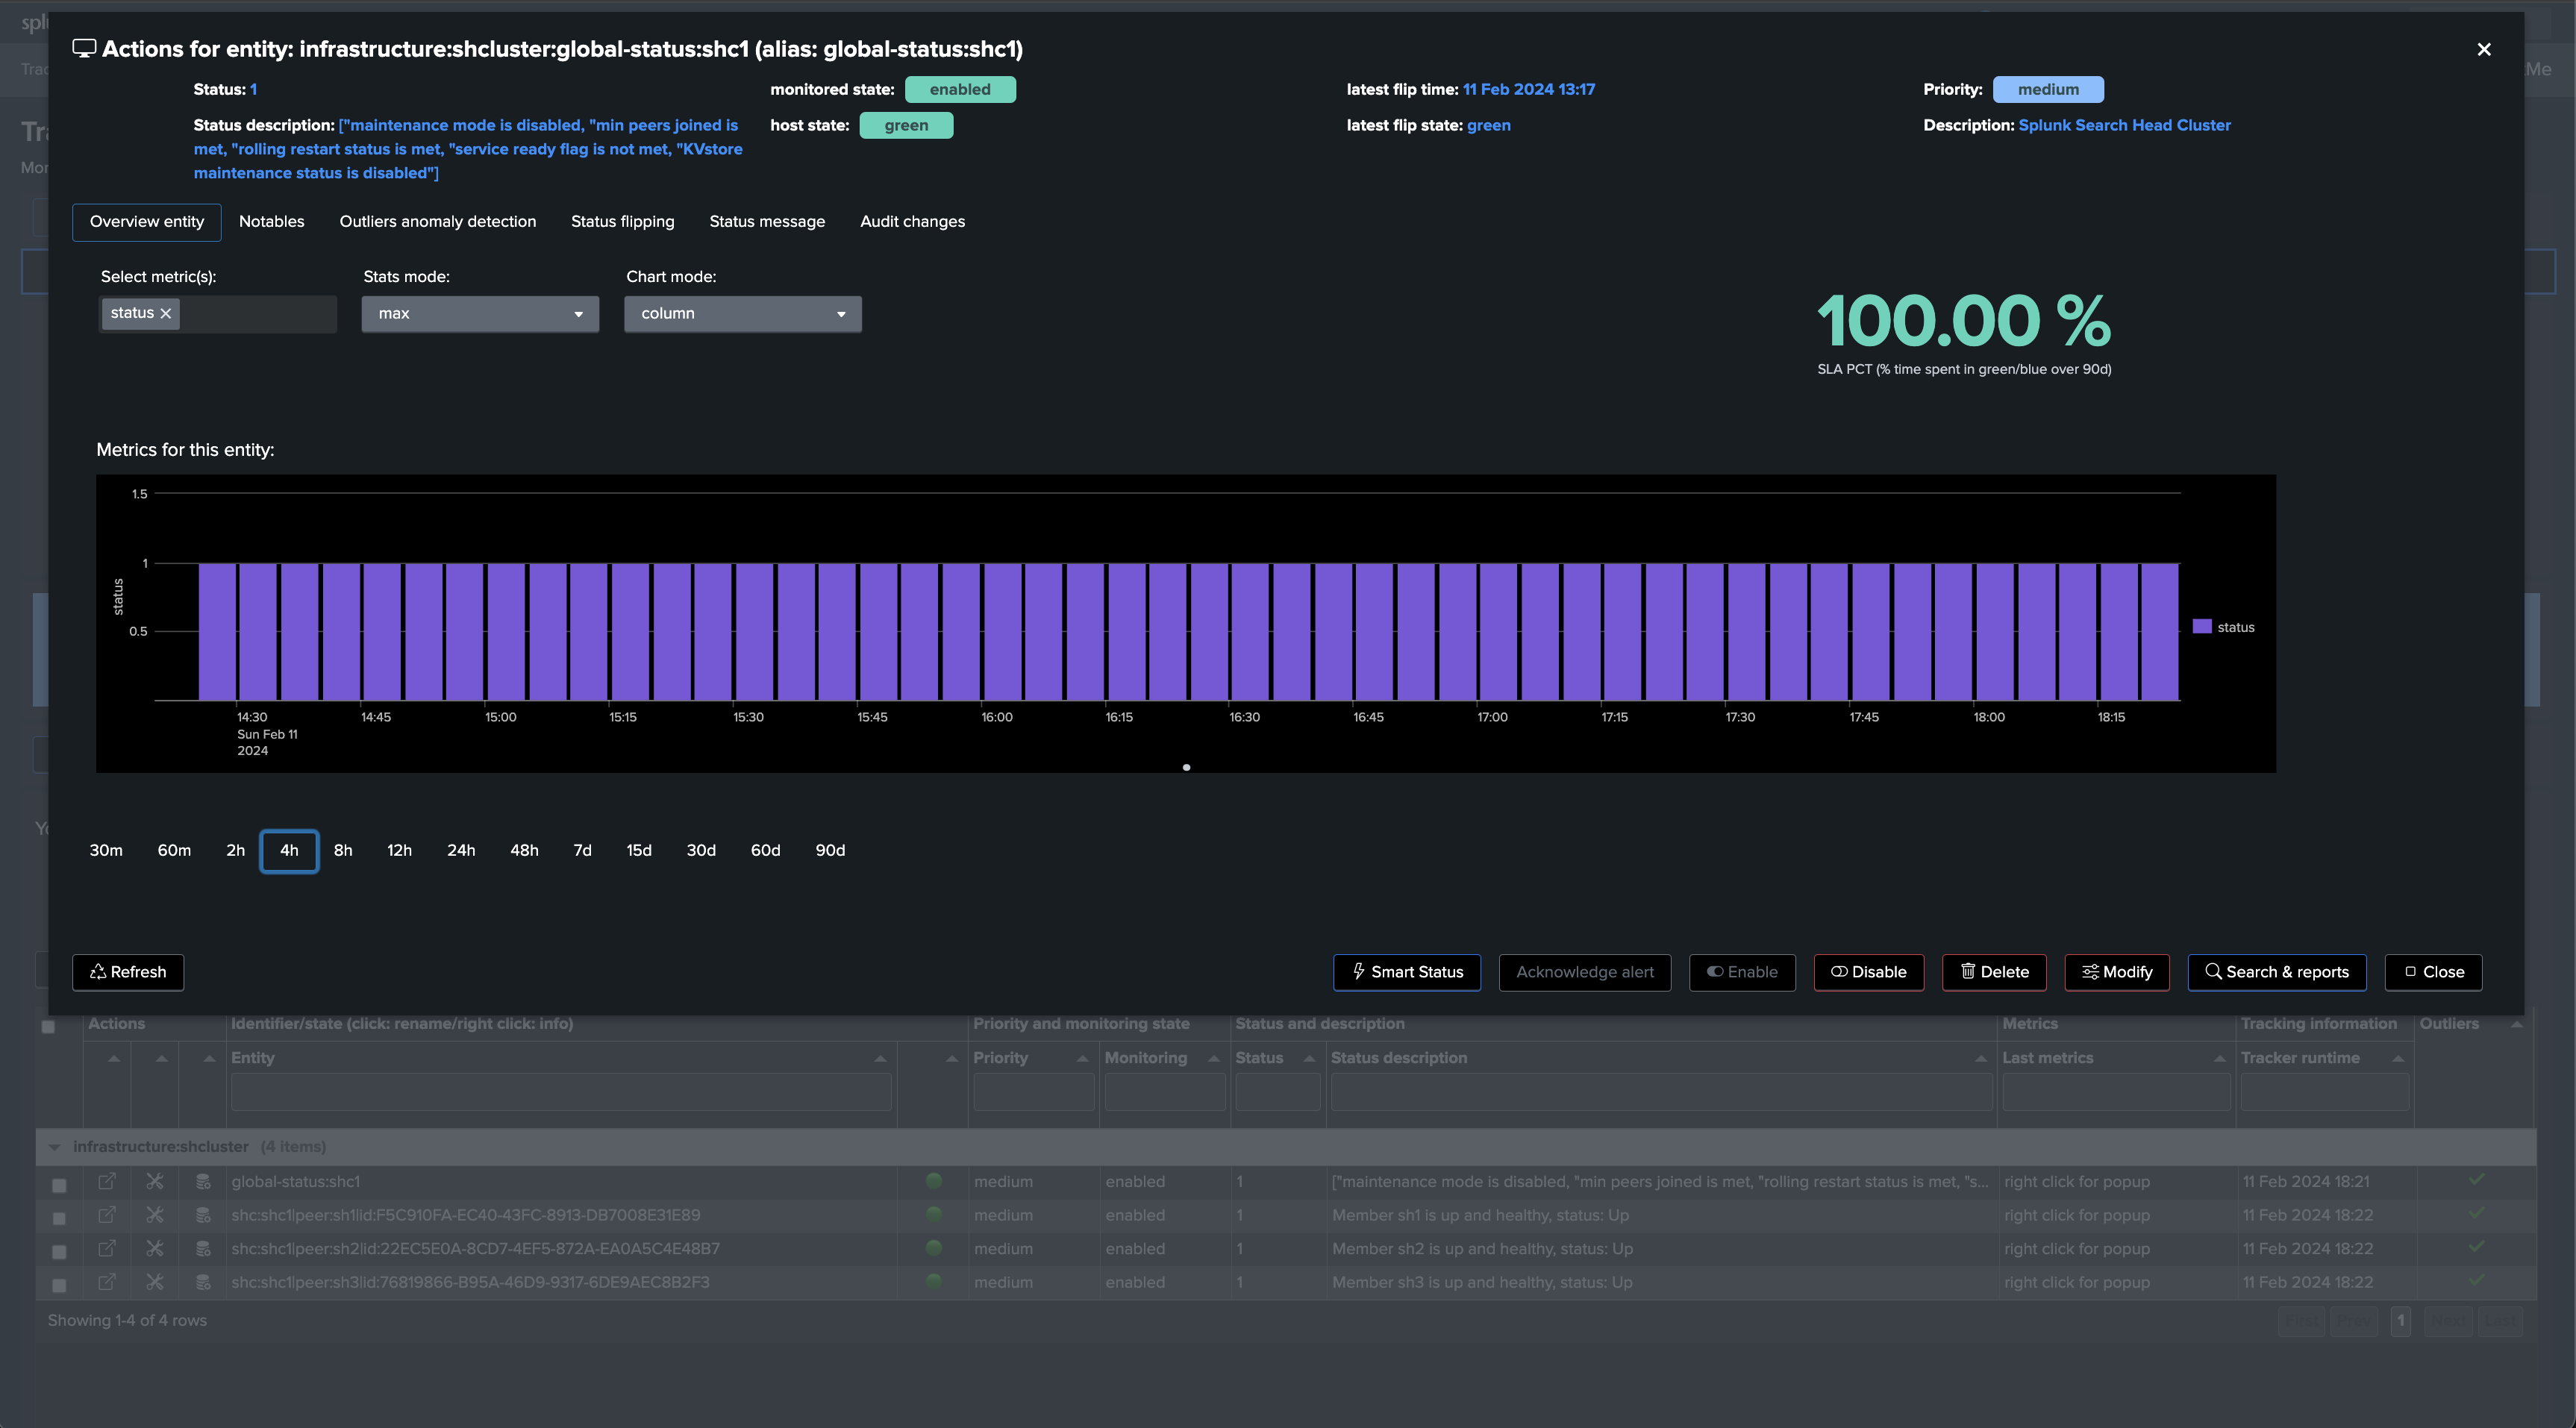
Repeat the same operation with the use case “splk_splunk_shc_members_status” which tracks the SHC members individually, so we instantly detect which members are having issues:
After the first execution of this second tracker, we have a global view of the Search Head Cluster, as well as the view on a per member basis, TrackMe will alert automatically when issues are detected.


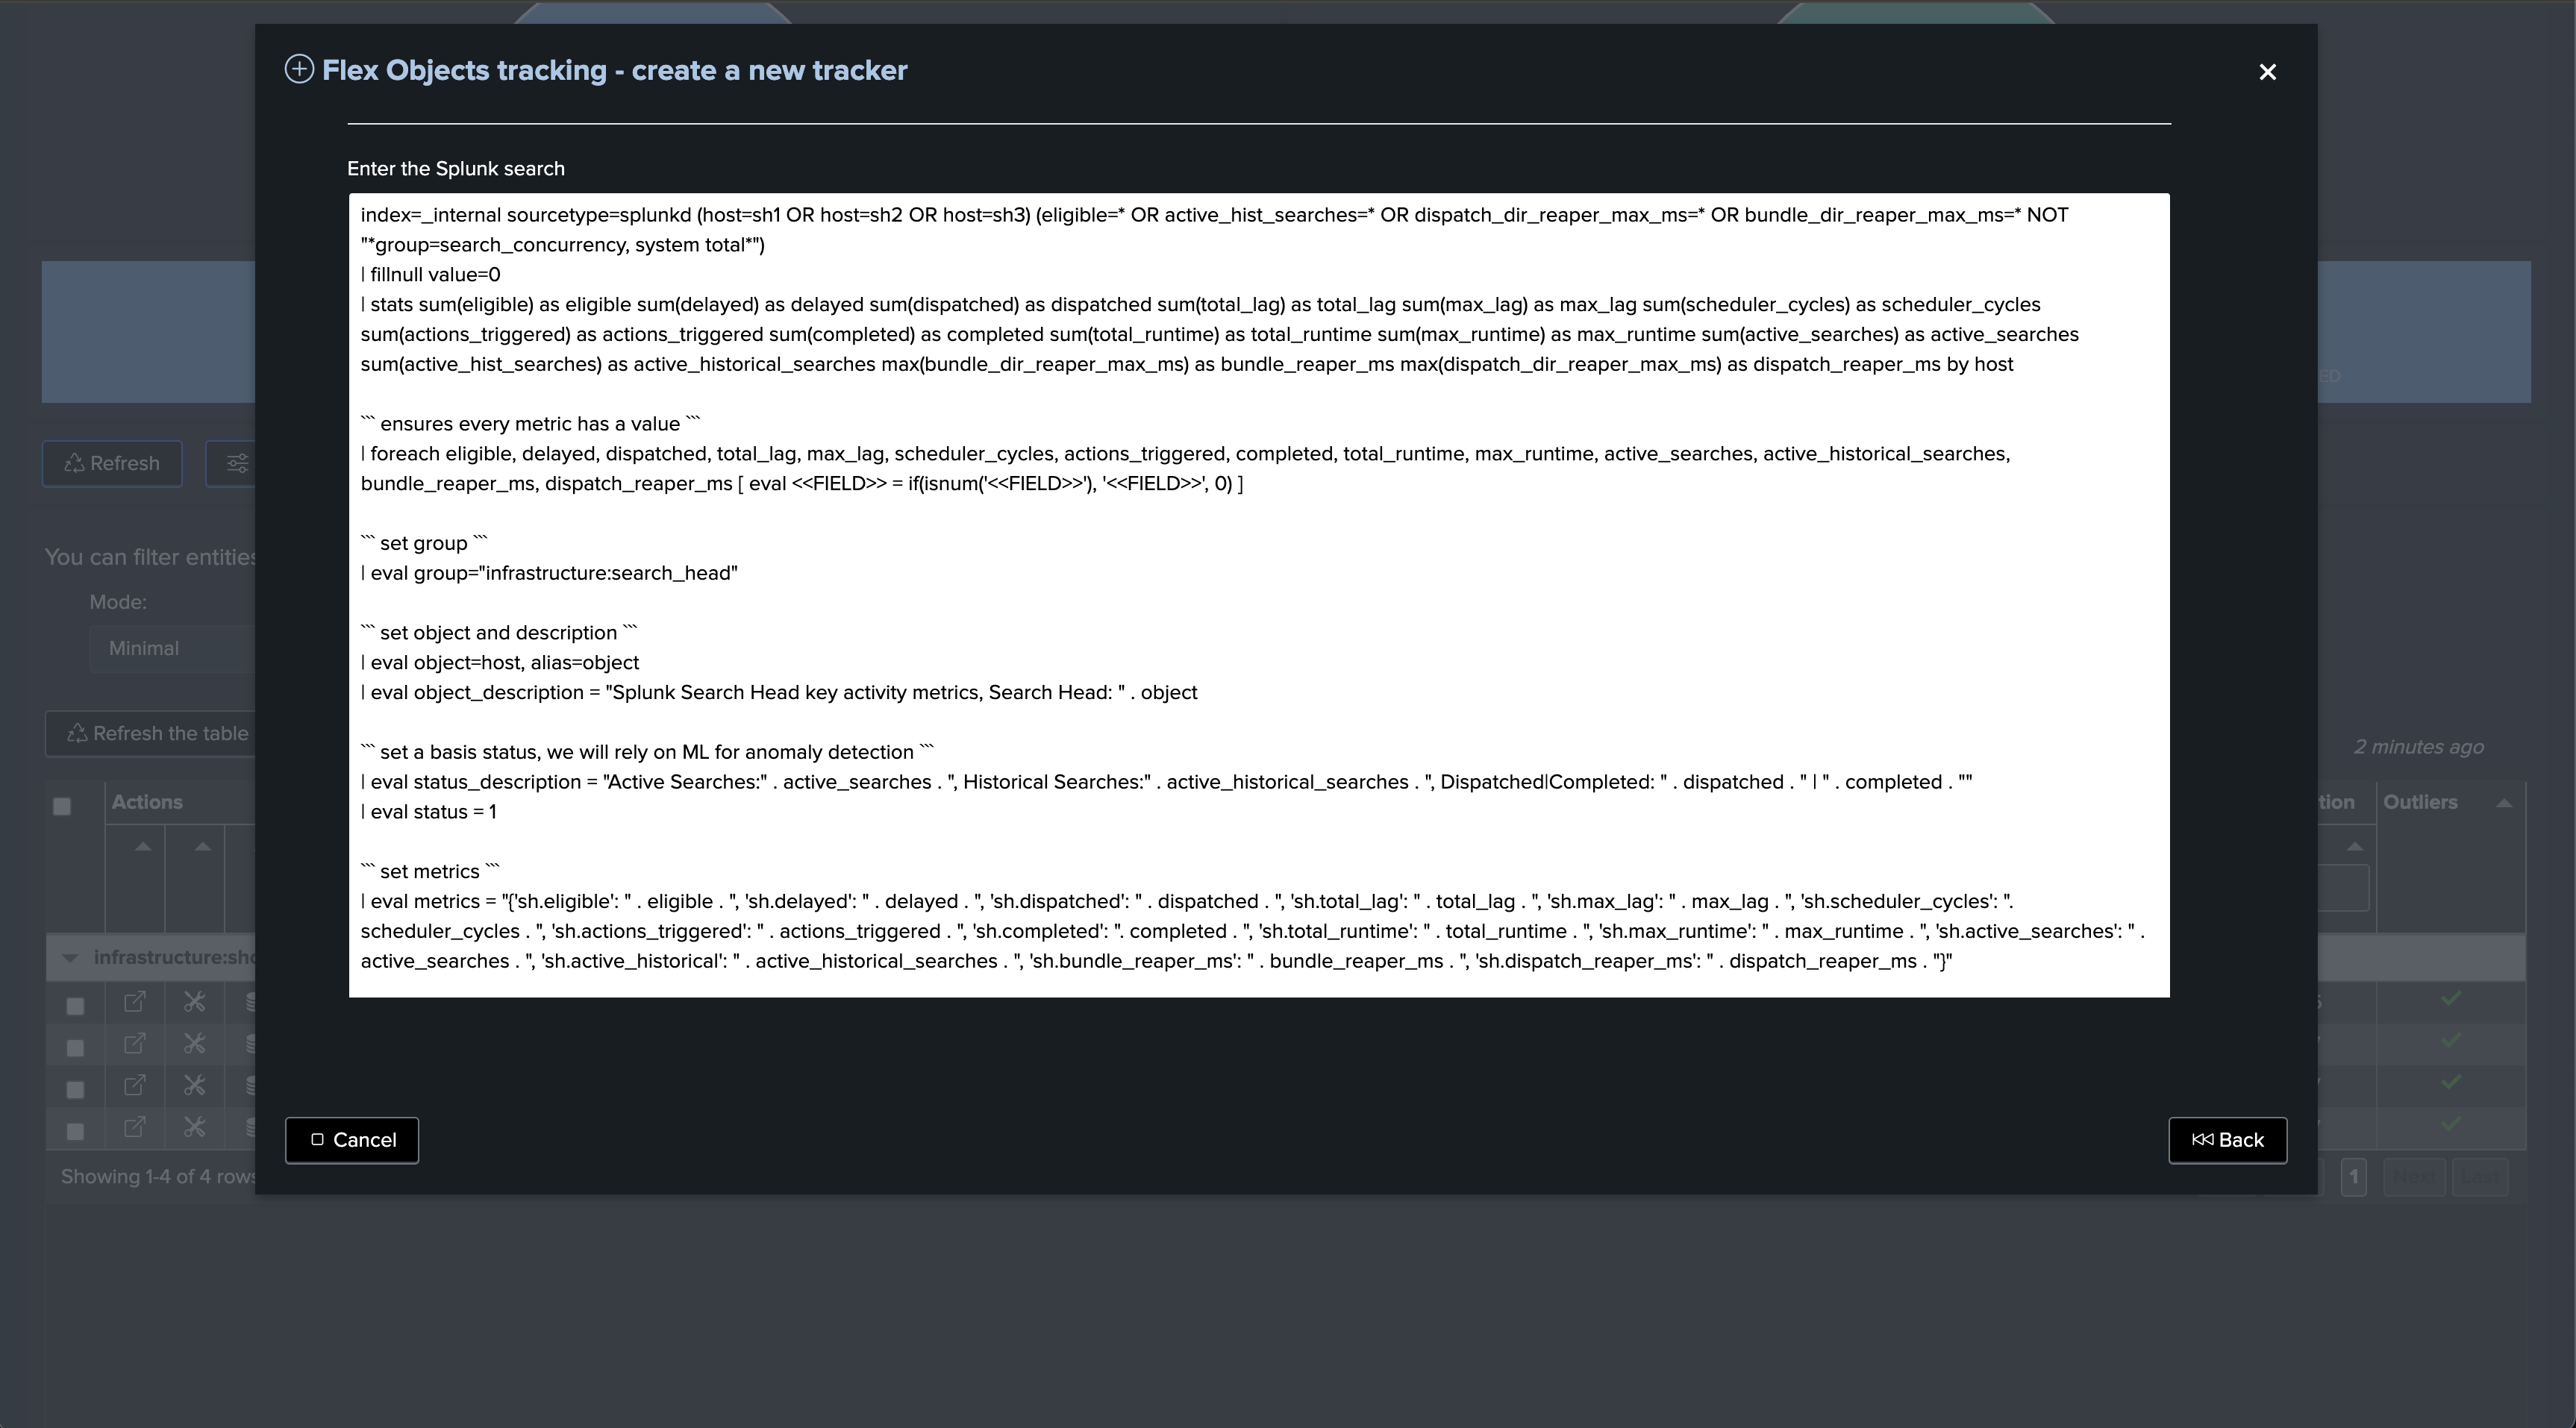
Finally, we can also opt out for the Search Head activity Flex use case, which focuses on collecting and monitoring the activity of the Search Heads:
Hint
Search Head activity Flex use case
This use case relies on Splunk indexed data, unlike the rest related use cases which are basically interactions with the Splunk REST API.
Therefore, If TrackMe has access to the same indexers from a search perspective, it is not required to target the remote account in this case.
On the other hand, or if you prefer to do so, if the TrackMe guest is on a different indexing layer, using the remote account is mandatory.
Finally, make sure to restrict the list of host to the Search Heads only, or this use case will also monitor any Search Head type of activity from other Search Heads
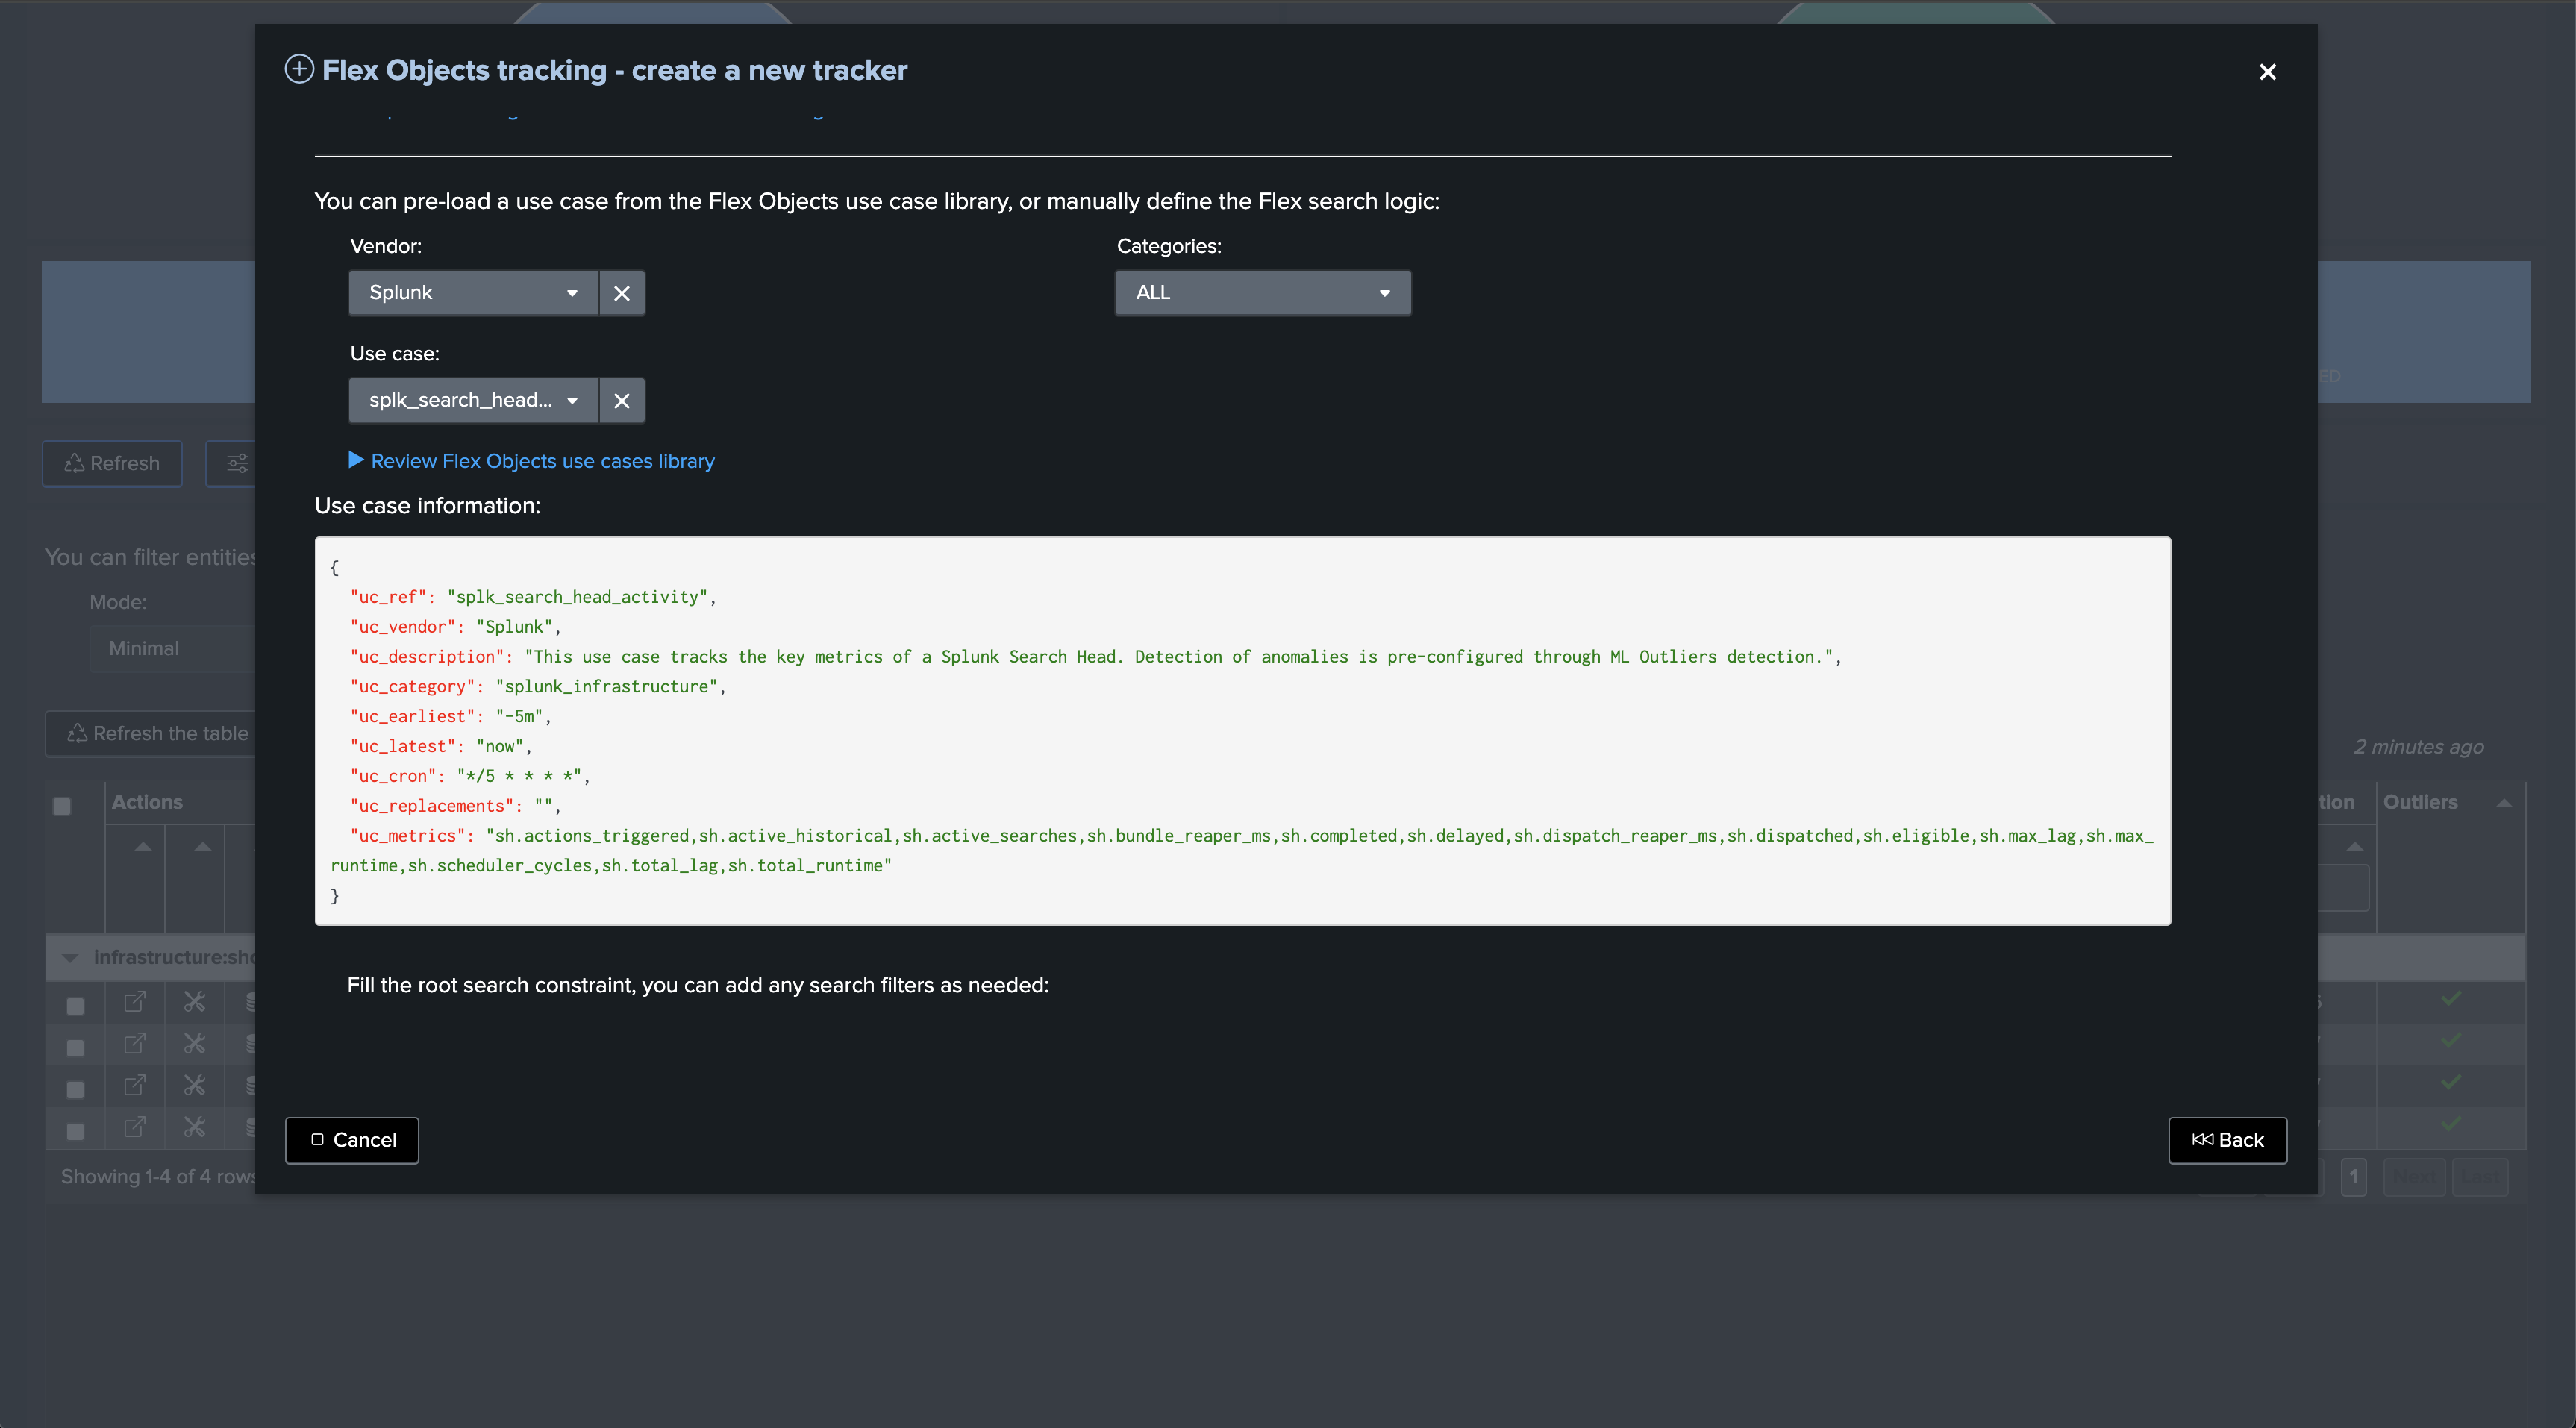
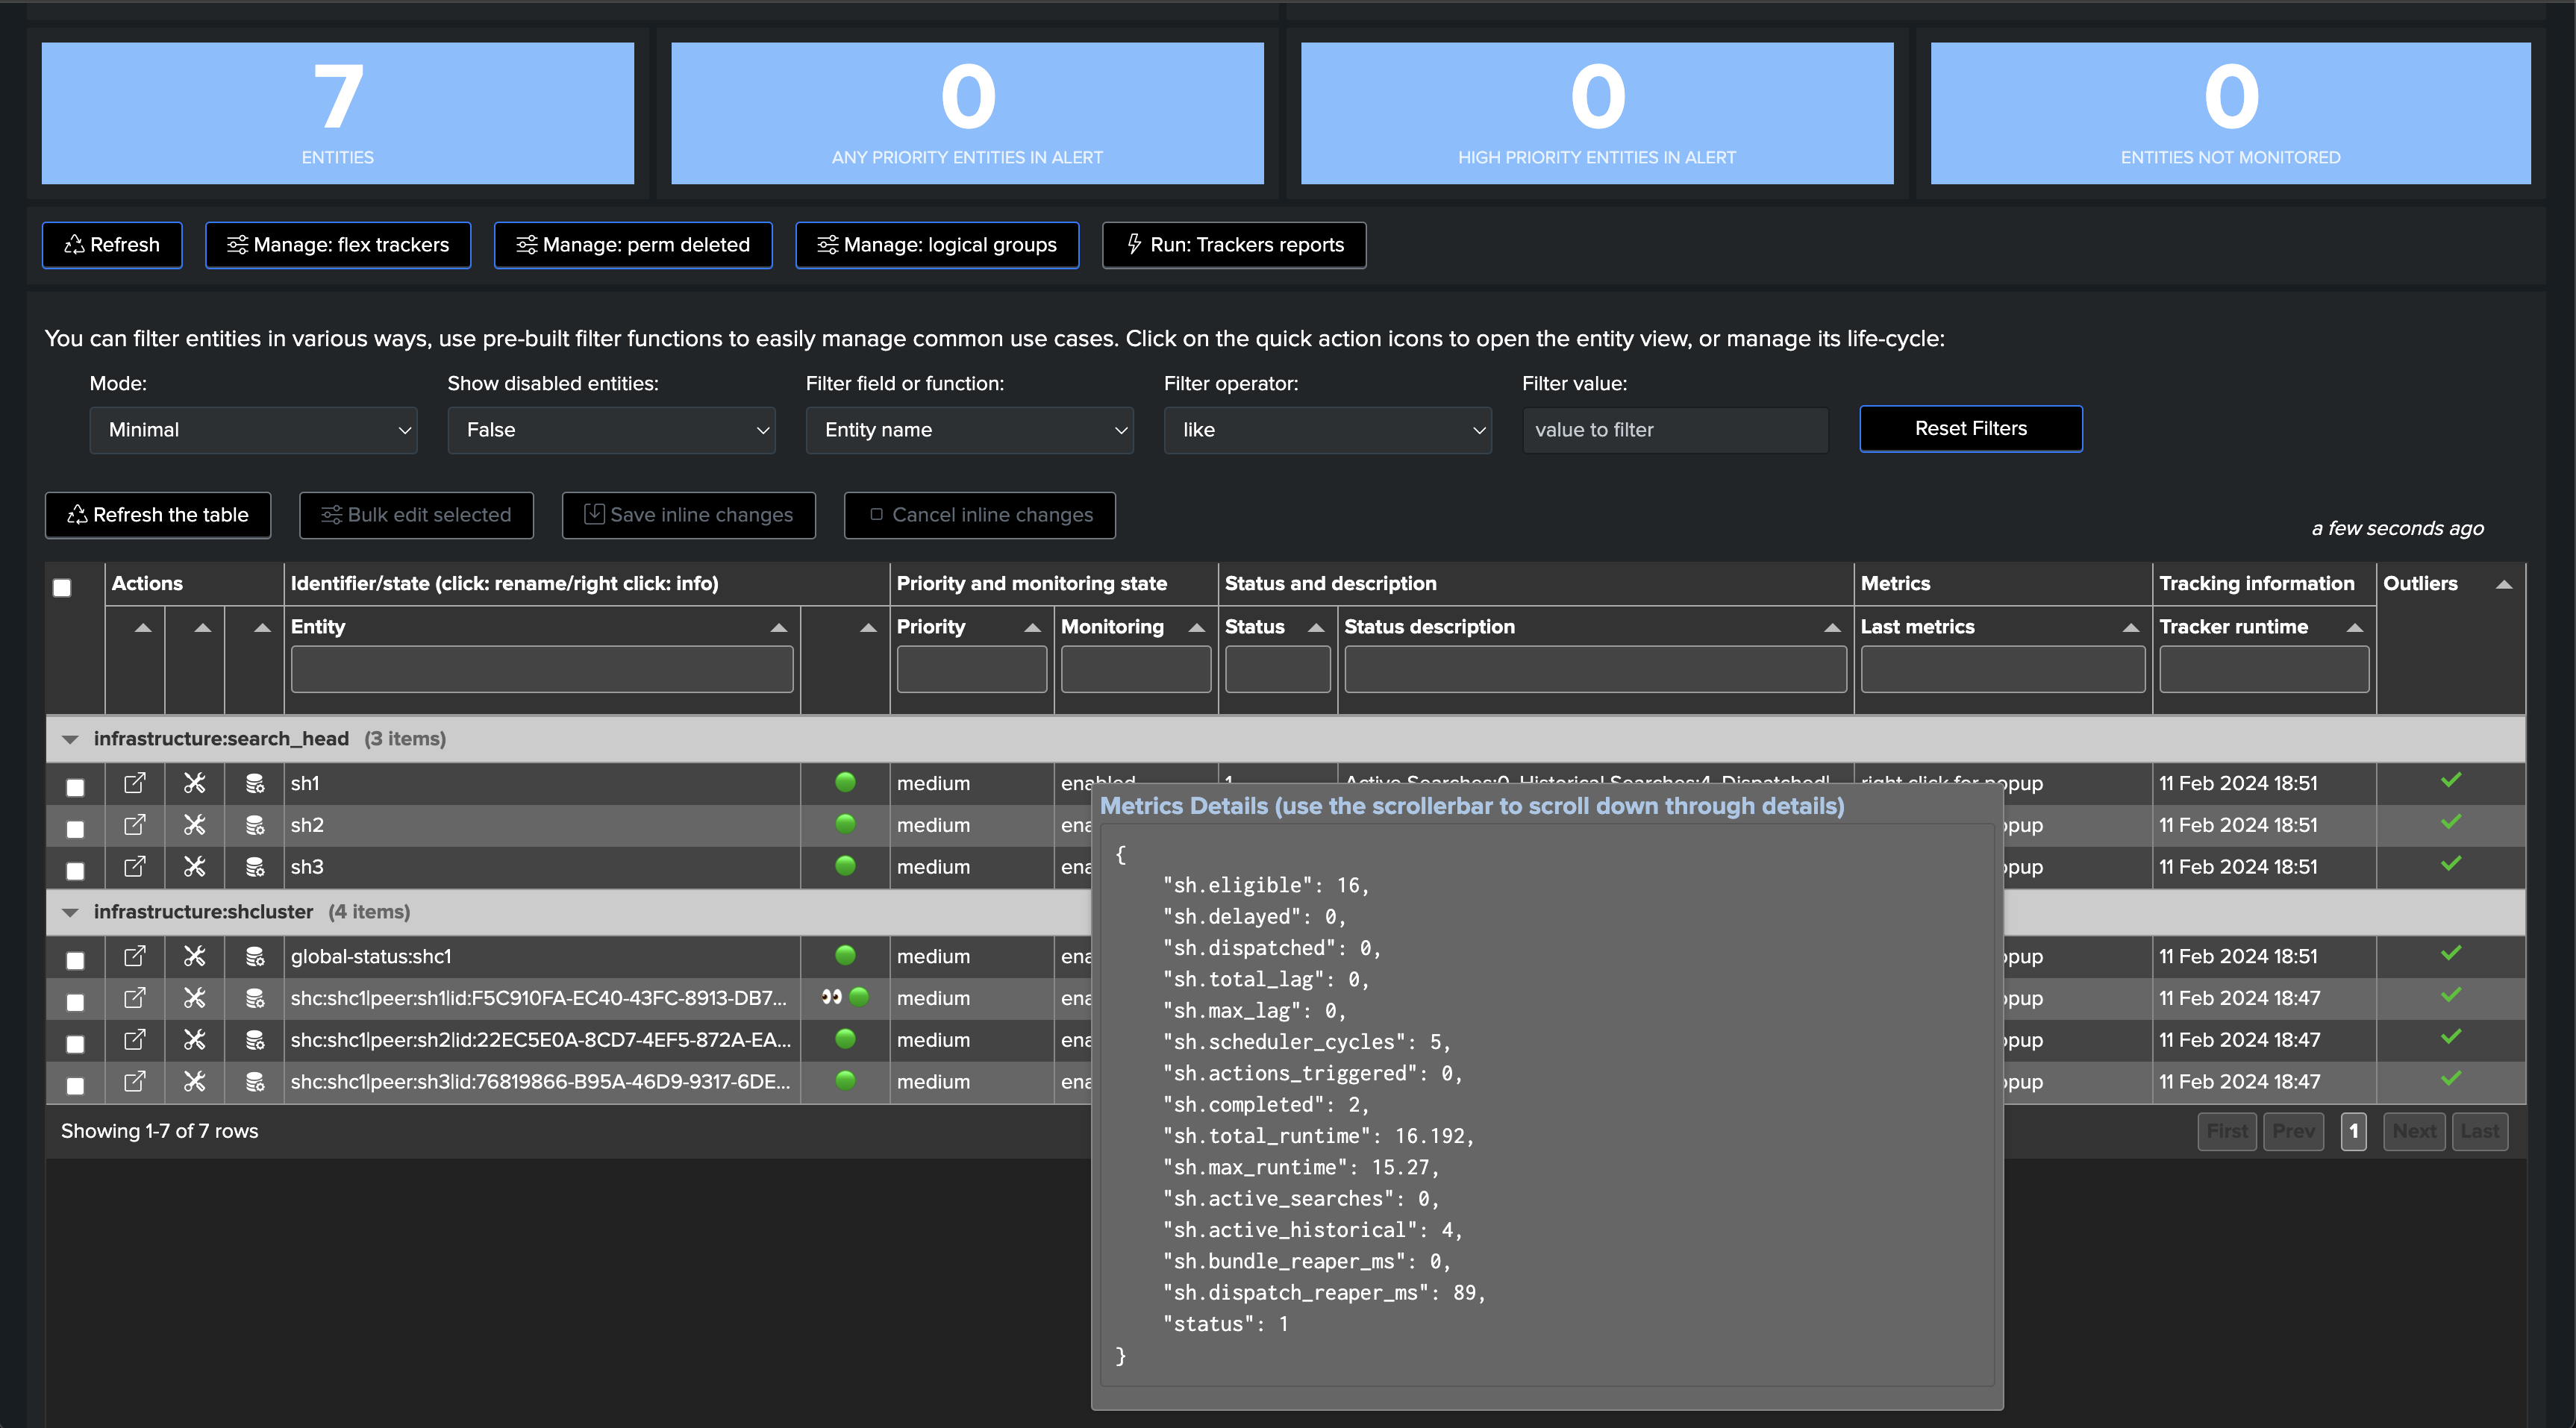
Note that unlike the previous use cases, we alert based on the detection of abnormal behaviours of the Search Heads using Machine Learning, notably TrackMe monitors the typical volume of search executions on the Search Head.
Annex: Use cases definition (SPL)
Use case splk_splunk_shc_global_status
| rest splunk_server=local timeout=300 count=0 /services/shcluster/captain/info
| stats first(label) as shc_captain_name, first(maintenance_mode) as maintenance_mode, first(min_peers_joined_flag) as min_peers_joined_flag, first(rolling_restart_flag) as rolling_restart_flag, first(service_ready_flag) as service_ready_flag, first(kvstore_maintenance_status) as kvstore_maintenance_status, first(elected_captain) as elected_captain

``` get SHC label ```
| join type=outer [ | rest splunk_server=local timeout=300 count=0 /services/server/info | fields shcluster_label ]
| eval shcluster_label=if(isnull(shcluster_label) OR shcluster_label="", "shc1", shcluster_label)

``` set object, alias and object_description ```
| eval object = "global-status:" . shcluster_label
| eval group = "infrastructure:shcluster"
| eval object_description = "Splunk Search Head Cluster"

| fields group, object, *

``` normalize kvstore_maintenance_status ```
| eval kvstore_maintenance_status=case(kvstore_maintenance_status=="enabled", 1, kvstore_maintenance_status=="disabled", 0)

``` set status ```
| eval status = case(
maintenance_mode!=0 OR min_peers_joined_flag!=1 OR rolling_restart_flag!=0 OR service_ready_flag!=1 OR kvstore_maintenance_status!=0, 2,
maintenance_mode=0 AND min_peers_joined_flag=1 AND rolling_restart_flag=0 AND service_ready_flag=1 AND kvstore_maintenance_status=0, 1,
1=1, 3
)

``` set status_description ```
| eval status_description=case(
maintenance_mode=0, mvappend(status_description, "maintenance mode is disabled"),
maintenance_mode=1, mvappend(status_description, "maintenance mode is enabled")
)
| eval status_description=case(
min_peers_joined_flag=0, mvappend(status_description, "min peers joined is not met"),
min_peers_joined_flag=1, mvappend(status_description, "min peers joined is met")
)
| eval status_description=case(
rolling_restart_flag=0, mvappend(status_description, "rolling restart status is met"),
rolling_restart_flag=1, mvappend(status_description, "rolling restart status is in progress or status is not met")
)
| eval status_description=case(
service_ready_flag=1, mvappend(status_description, "service ready flag is met"),
service_ready_flag=0, mvappend(status_description, "service ready flag is not met")
)
| eval status_description=case(
kvstore_maintenance_status=0, mvappend(status_description, "KVstore maintenance status is disabled"),
kvstore_maintenance_status=1, mvappend(status_description, "KVstore maintenance status is enabled")
)
| eval status_description="[\"" . mvjoin(status_description, ", \"") . "\"]"

``` set metrics ```
| eval metrics = "{" . "'splunk_shc.maintenance_mode': " . maintenance_mode . ", 'splunk_shc.min_peers_joined_flag': " . min_peers_joined_flag . ", 'splunk_shc.rolling_restart_flag': " . rolling_restart_flag . ", 'splunk_shc.service_ready_flag': " . service_ready_flag . ", 'splunk_shc.kvstore_maintenance_status': " .  kvstore_maintenance_status . "}"

``` alert if inactive for more than 3600 sec```
| eval max_sec_inactive=3600
Use case “splk_splunk_shc_members_status
| rest splunk_server=local timeout=300 count=0 /services/shcluster/status
| transpose
| rename column as category, "row 1" as value

``` extract information ```
| eval cluster_member_name=case(match(category, "^peers\.[^\.]*\.label$"), value)
| rex field=category "^peers\.(?<cluster_member_guid>[^\.]*)\.label$"
| eval cluster_member_status=case(match(category, "^peers\.[^\.]*\.status$"), value)

``` aggregate ```
| stats list(cluster_member_guid) as cluster_member_guid, list(cluster_member_name) as cluster_member_name, list(cluster_member_status) as cluster_member_status

``` build entity from mv fields ```
| eval cluster_member_info=mvzip(mvzip(cluster_member_guid, cluster_member_name), cluster_member_status)

``` order ```
| fields cluster_member_info, cluster_captain, service_ready_flag, rolling_restart_flag

``` expand entities and extract ```
| mvexpand cluster_member_info
| eval cluster_member_info=split(cluster_member_info, ",")
| eval cluster_member_guid=mvindex(cluster_member_info, 0), cluster_member_name=mvindex(cluster_member_info, 1), cluster_member_status=mvindex(cluster_member_info, 2)

``` order ```
| fields cluster_member_guid, cluster_member_name, cluster_member_status

``` get SHC label ```
| join type=outer [ | rest splunk_server=local timeout=300 count=0 /services/server/info | fields shcluster_label ]

``` set object, alias and object_description ```
| eval object = "shc:" . shcluster_label . "|peer:" . cluster_member_name . "|id:" . cluster_member_guid
| eval group = "infrastructure:shcluster"
| eval object_description = "Splunk Search Head Cluster Member: " . cluster_member_name . ", GUID: " . cluster_member_guid . ", SHC: " . shcluster_label

``` set status ```
| eval status = case(
cluster_member_status="Up", 1,
cluster_member_status="Down", 2,
1=1, 3
)

``` set status description ```
| eval status_description = case(
status=1, "Member " . cluster_member_name . " is up and healthy, status: " . cluster_member_status,
status=2, "Member " . cluster_member_name . " is currently down, status: " . cluster_member_status,
status=3, "Member " . cluster_member_name . " status is unknown or unexpected, status: " . cluster_member_status
)

``` alert if inactive for more than 3600 sec```
| eval max_sec_inactive=3600
Use case splk_splunk_shc_activity
index=_internal sourcetype=splunkd host=* (eligible=* OR active_hist_searches=* OR dispatch_dir_reaper_max_ms=* OR bundle_dir_reaper_max_ms=* NOT "*group=search_concurrency, system total*")
| fillnull value=0
| stats sum(eligible) as eligible sum(delayed) as delayed sum(dispatched) as dispatched sum(total_lag) as total_lag sum(max_lag) as max_lag sum(scheduler_cycles) as scheduler_cycles sum(actions_triggered) as actions_triggered sum(completed) as completed sum(total_runtime) as total_runtime sum(max_runtime) as max_runtime sum(active_searches) as active_searches sum(active_hist_searches) as active_historical_searches max(bundle_dir_reaper_max_ms) as bundle_reaper_ms max(dispatch_dir_reaper_max_ms) as dispatch_reaper_ms by host

``` ensures every metric has a value ```
| foreach eligible, delayed, dispatched, total_lag, max_lag, scheduler_cycles, actions_triggered, completed, total_runtime, max_runtime, active_searches, active_historical_searches, bundle_reaper_ms, dispatch_reaper_ms [ eval <<FIELD>> = if(isnum('<<FIELD>>'), '<<FIELD>>', 0) ]

``` set group ```
| eval group="infrastructure:search_head"

``` set object and description ```
| eval object=host, alias=object
| eval object_description = "Splunk Search Head key activity metrics, Search Head: " . object

``` set a basis status, we will rely on ML for anomaly detection ```
| eval status_description = "Active Searches:" . active_searches . ", Historical Searches:" . active_historical_searches . ", Dispatched|Completed: " . dispatched . " | " . completed . ""
| eval status = 1

``` set metrics ```
| eval metrics = "{'sh.eligible': " . eligible . ", 'sh.delayed': " . delayed . ", 'sh.dispatched': " . dispatched . ", 'sh.total_lag': " . total_lag . ", 'sh.max_lag': " . max_lag . ", 'sh.scheduler_cycles': ". scheduler_cycles . ", 'sh.actions_triggered': " . actions_triggered . ", 'sh.completed': ". completed . ", 'sh.total_runtime': " . total_runtime . ", 'sh.max_runtime': " . max_runtime . ", 'sh.active_searches': " . active_searches . ", 'sh.active_historical': " . active_historical_searches . ", 'sh.bundle_reaper_ms': " . bundle_reaper_ms . ", 'sh.dispatch_reaper_ms': " . dispatch_reaper_ms . "}"

``` set outliers metrics ```
| eval outliers_metrics = "{'sh.completed': {'alert_lower_breached': 1, 'alert_upper_breached': 0, 'time_factor': '%w%H'}}"

| eval max_sec_inactive=3600