Splunk Feeds Thresholds (Delay and Latency, Machine Learning adaptive thresholding)
1. Introduction to adaptive thresholding
In TrackMe, Splunk feeds latency and delay Key Performance Indicators (KPIs) are continuously monitored.
When a given entity breaches the predefined threshold values, this impacts the state of the entity, and depending on the configuration, the entity status will turn red, potentially leading to an alert being emitted by TrackMe.
By default and when discovering entities, TrackMe applies a 1-hour maximal threshold (3600 seconds) for both delay and latency.
The purpose of this documentation is to describe the options that TrackMe provides to configure the threshold values accordingly.
2. Adaptive delay thresholds with Machine Learning (since TrackMe v2.0.72)
Hint
Since TrackMe v2.0.72, we implement a Machine Learning driven approach to automatically adapt the delay threshold values based on the historical knowledge TrackMe has accumulated.
This feature is handled by a dedicated tracker called trackmesplkadaptivedelay inspecting entities reporting delay threshold breaches
It identifies the number of days of accumulated metrics for this entity (to define the confidence level, provided as an argument to the tracker, by default 7 days minimum required)
If conditions allow it, TrackMe updates automatically the delay threshold value
The more knowledge TrackMe accumulates over time, the more accurate the threshold values will be
Various important enhancements were made in further TrackMe releases to improve the accuracy and behavior of the adaptive threshold features in TrackMe
Hint
Since TrackMe 2.0.96, control the review period using the argument review_period_no_days
This argument was introduced in this release, it allows you to control the period of time for the review of TrackMe entities that were updated.
Valid options are: 7, 15 or 30 days, the default value is 30 days.
Update the argument in each tracker configuration if you wish to change the default value.
argument:
review_period_no_days=30
Hint
Since TrackMe 2.1.10, control the max SLA percentage using the argument max_sla_percentage
This argument was introduced in this release, it allows you to control the max SLA percentage for the adaptive thresholding.
This defines the threshold for the SLA percentage under which the adaptive thresholding will NOT attempt to update the threshold value for a given entity.
This feature reduces the risk of updating a stable entity which is affected by a true positive anomaly.
If the currently observed SLA percentage is not lower than the max SLA percentage (defaults to 90%), the entity will not be managed.
Update the argument in each tracker configuration if you wish to change the default value.
argument:
max_sla_percentage=100
2.1. Behavior
The adaptive threshold tracker monitors the status of feed entities currently in alert due to delay threshold breach (anomaly_reason=delay_threshold_breached).
This tracker invokes the command trackmesplkadaptivedelay for entities matching specific conditions, which then investigates historical metrics collected by TrackMe using Machine Learning. TrackMe uses the density function to calculate the UpperBound value per entity, and automatically updates entities when appropriate.
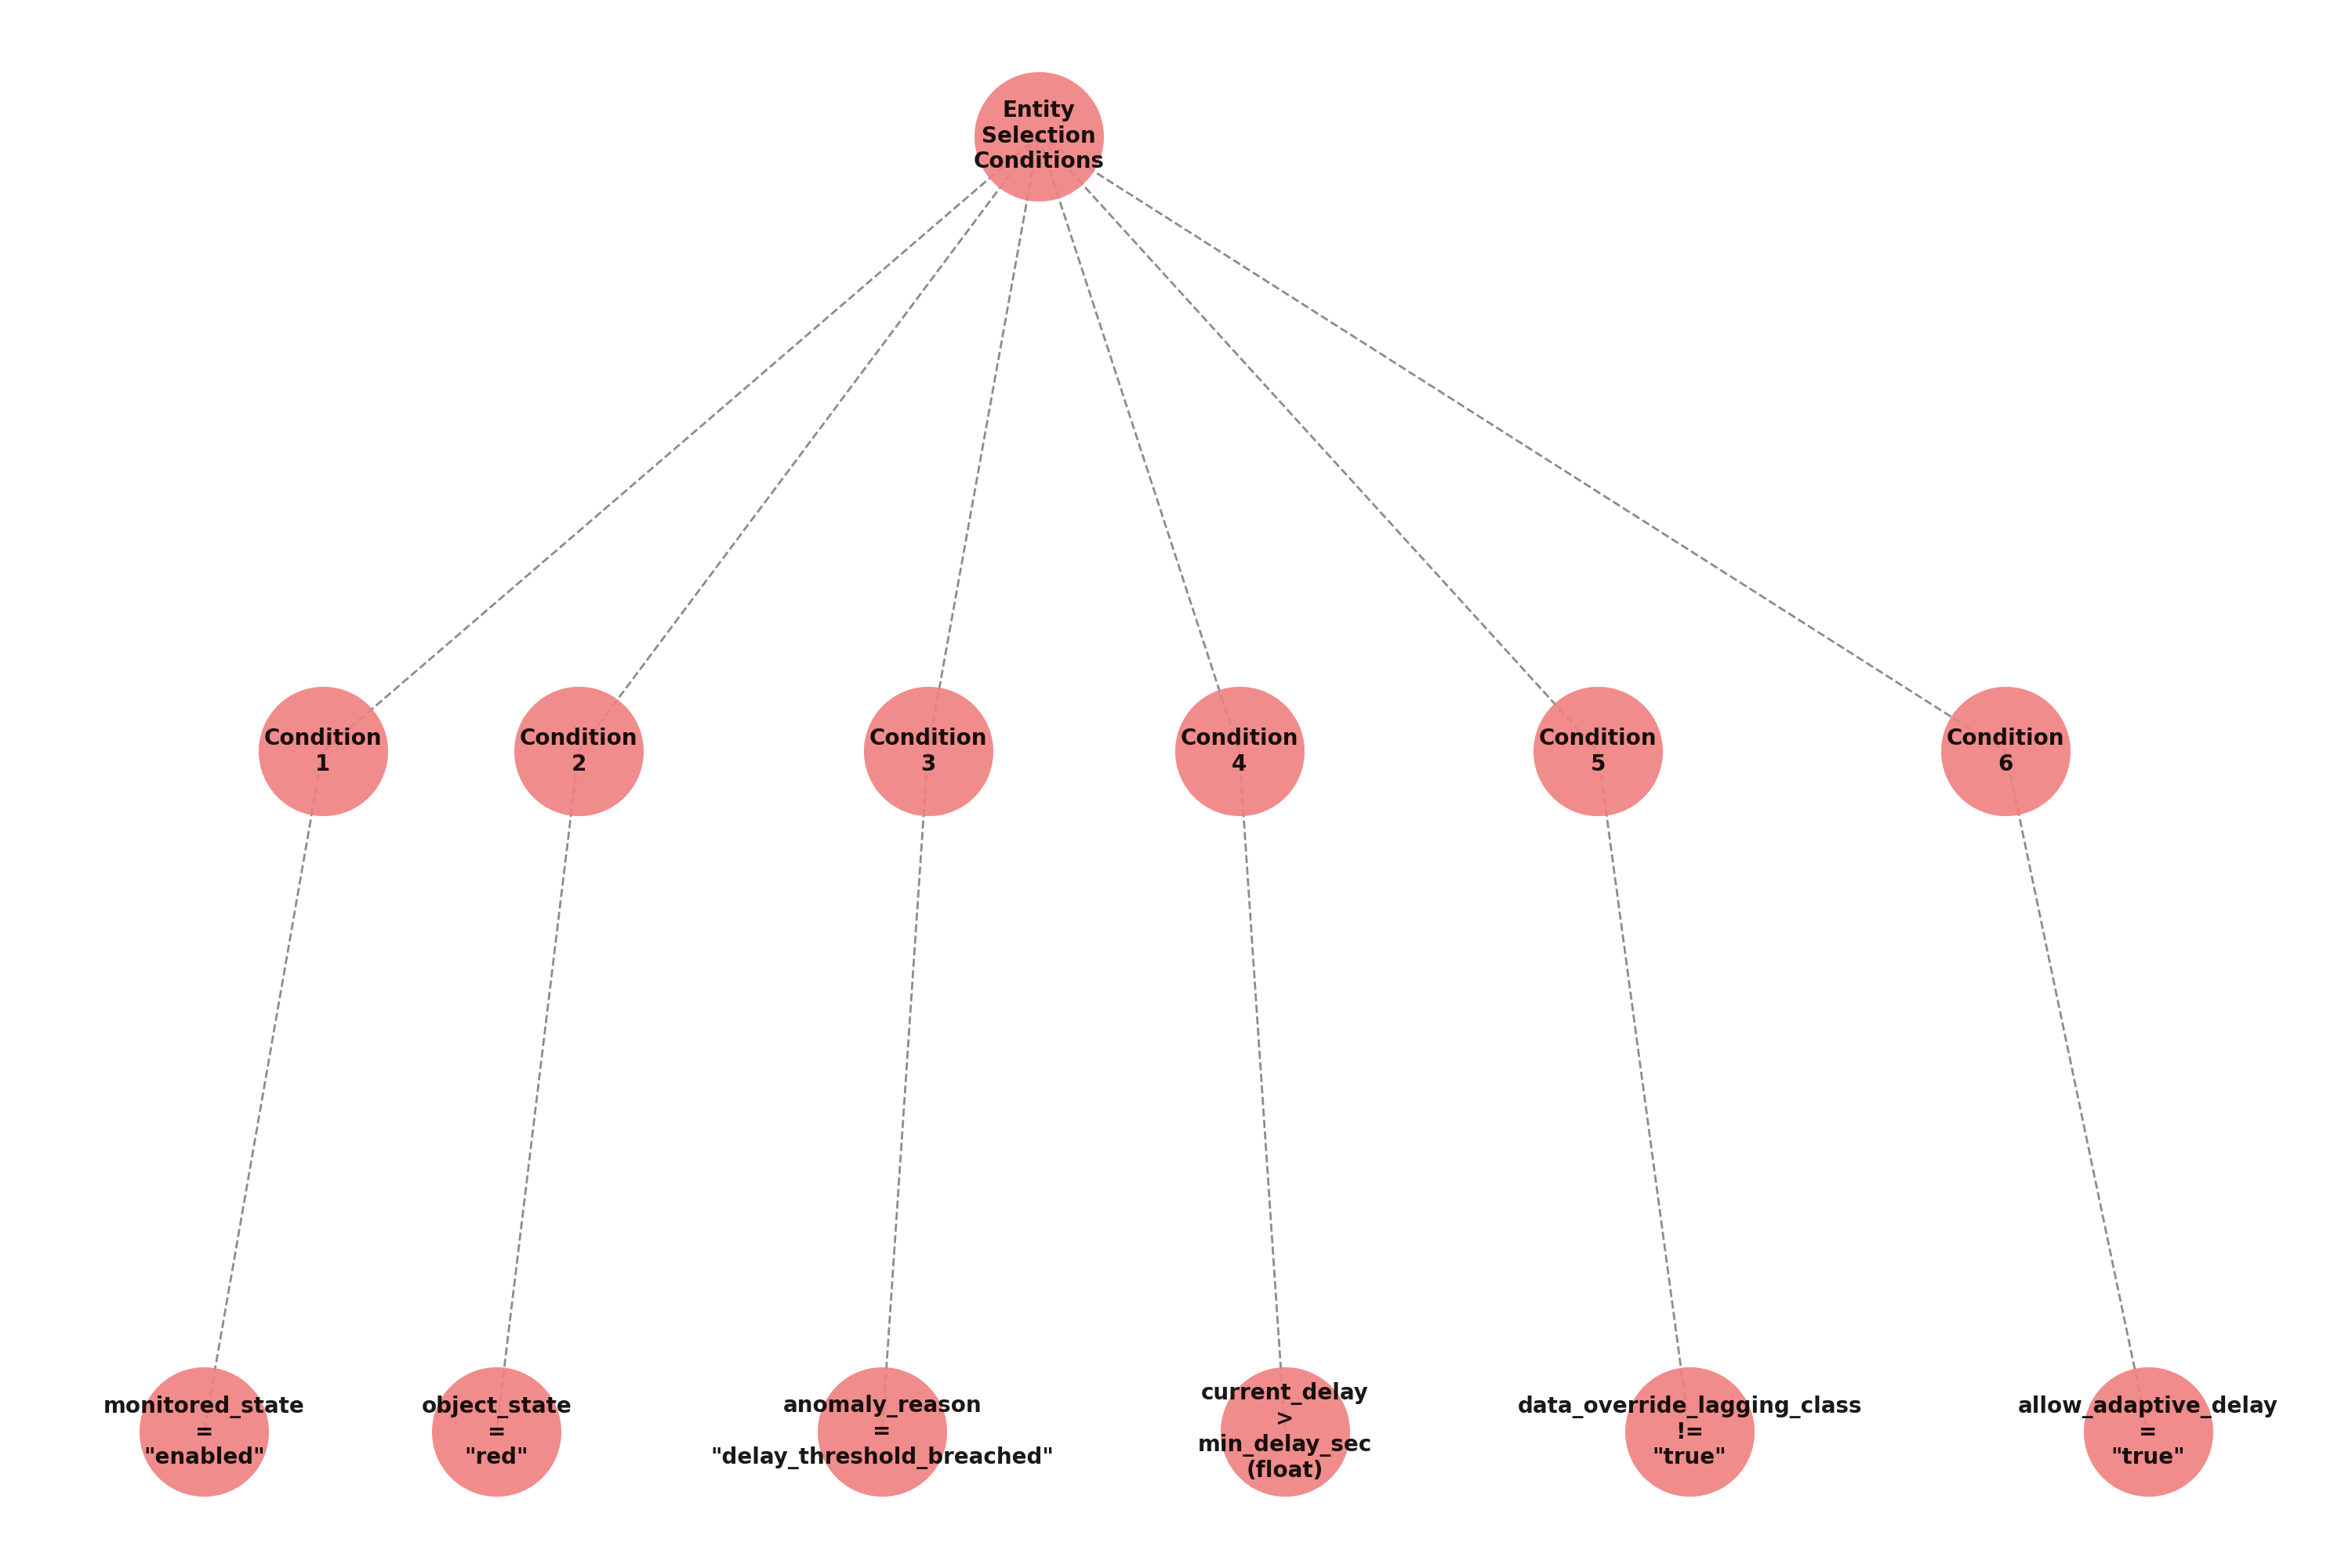
Entities filtering, when the trackers loads, it will take into account entities as:
monitored_state is “enabled”, status is “red”
anomaly_reason is “delay_threshold_breached”
data_override_lagging_class is “false” and allow_adaptive_delay is “true”
current_delay is more than min_delay_sec (argument submitted to the adaptive tracker, 3600 seconds by default)
Entities selection behavior can be summarized in the following mindmap:
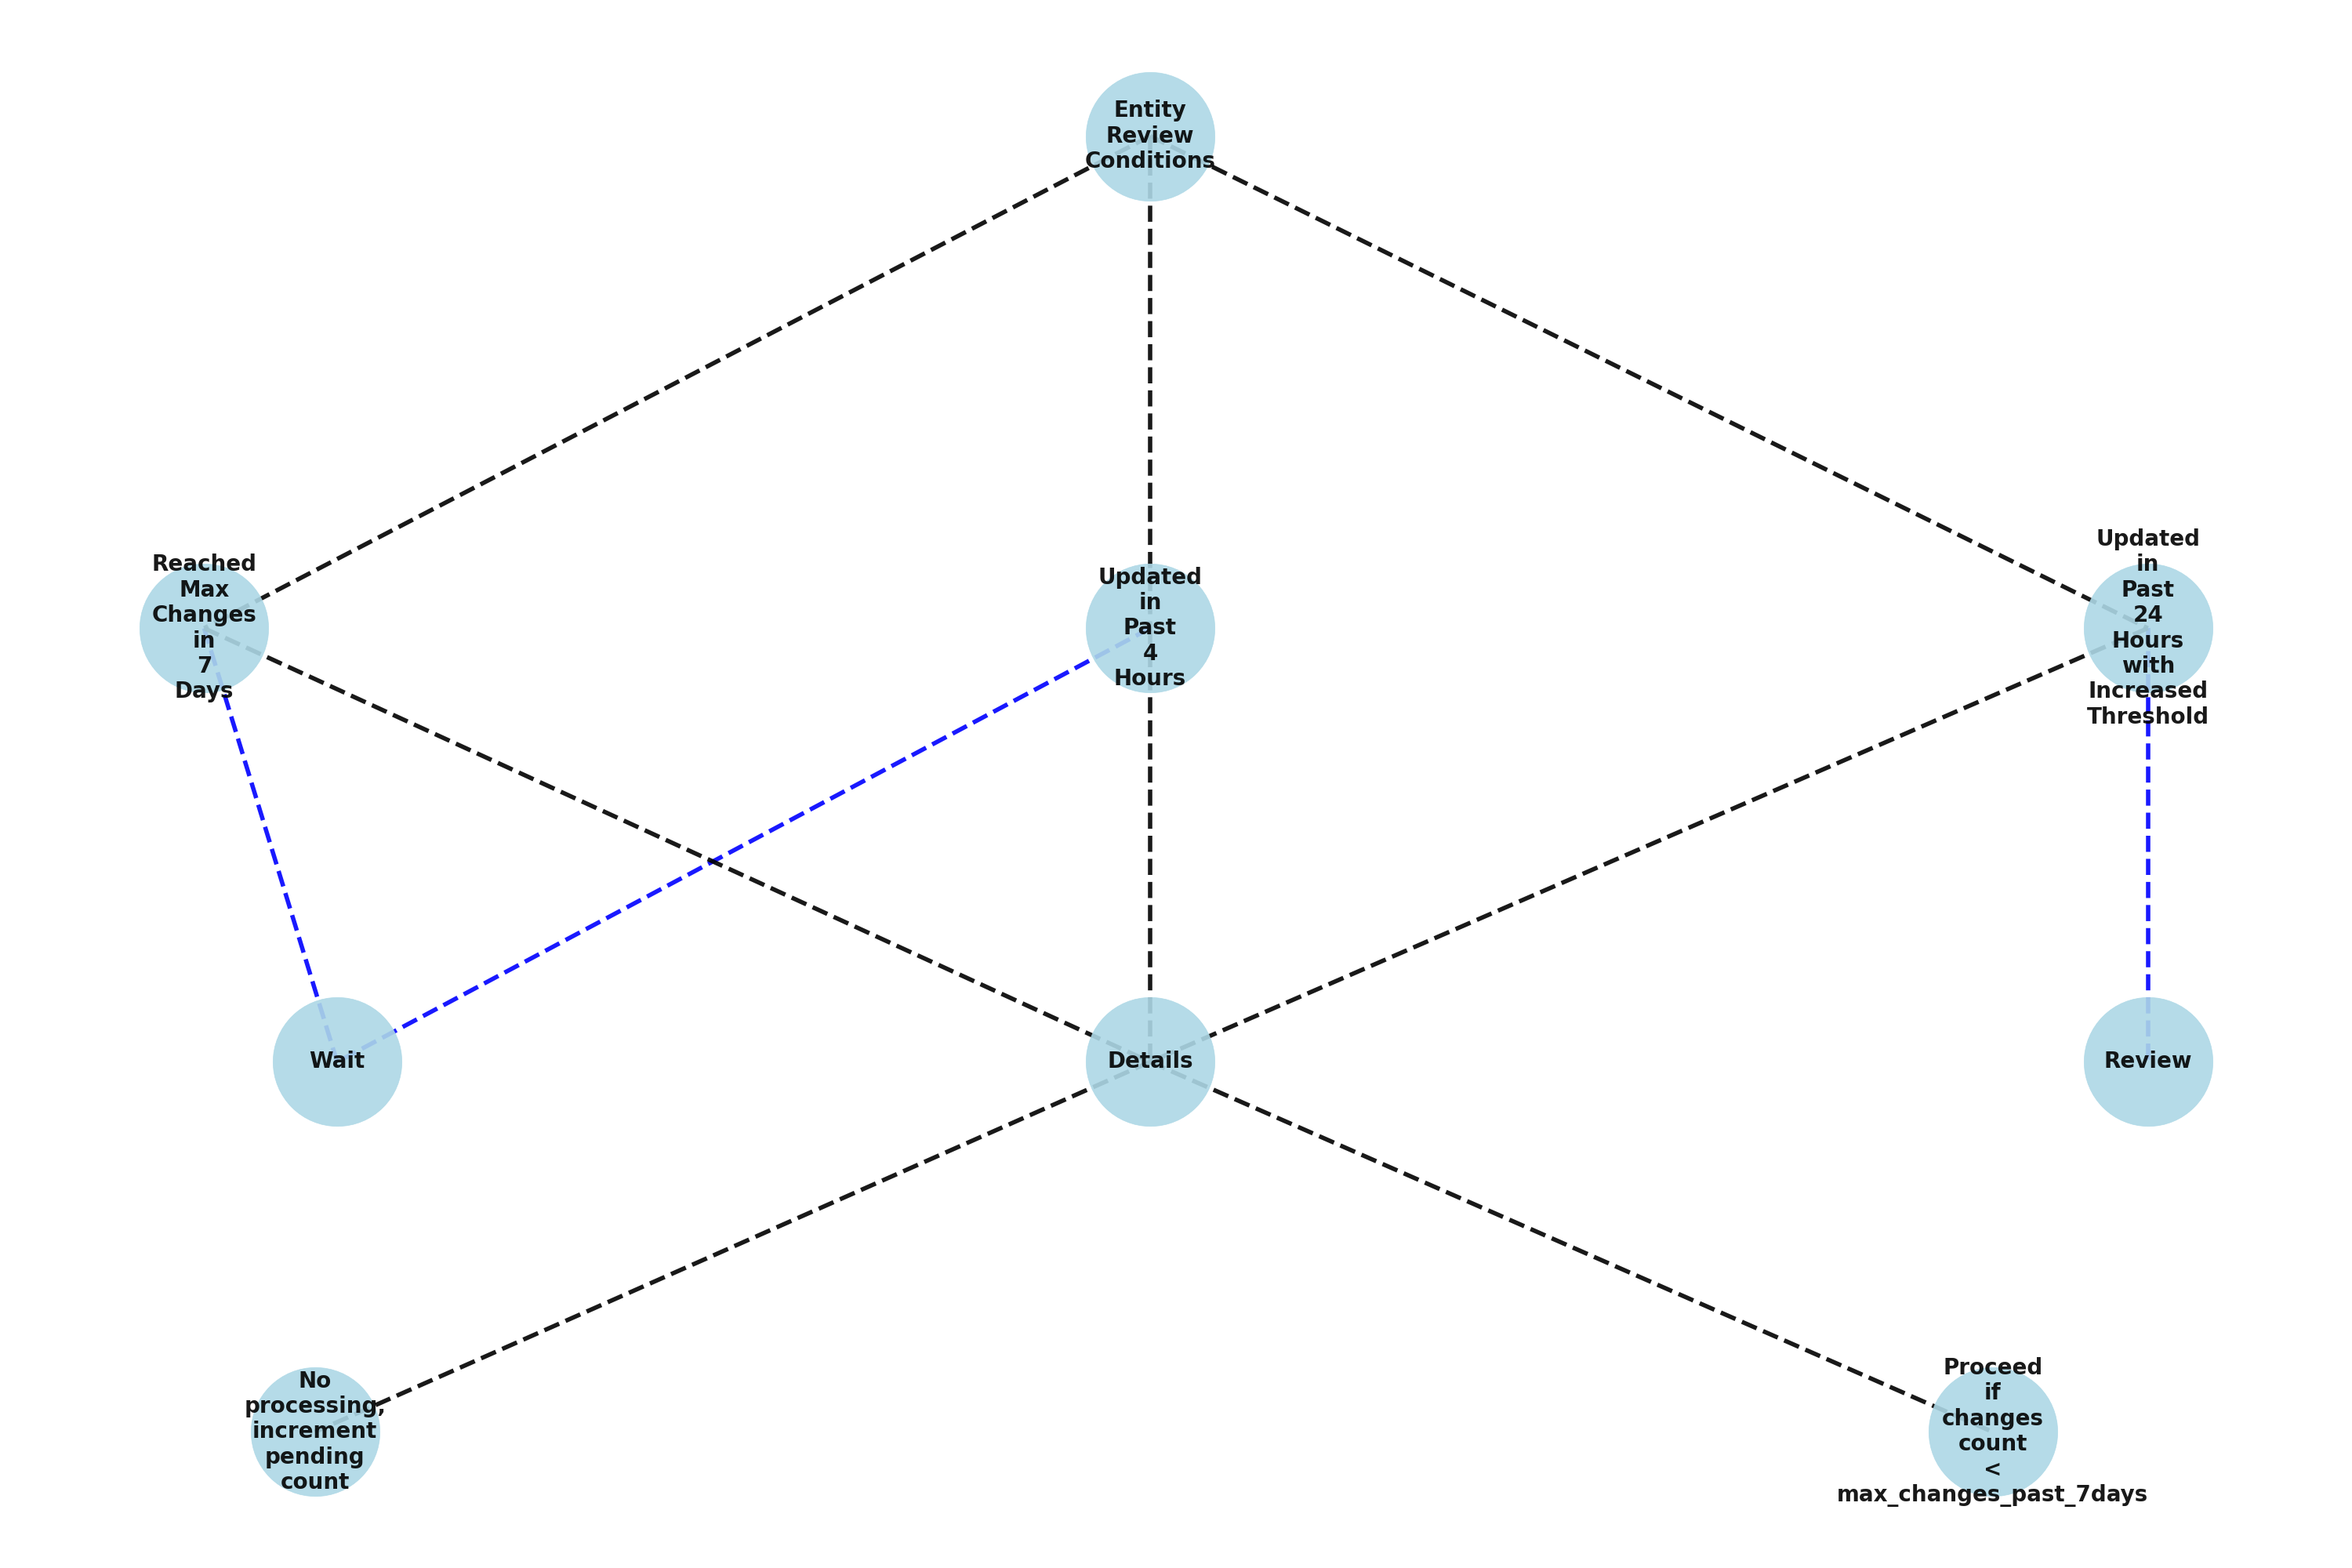
In Addition:
TrackMe verifies its internal processing logs to define the list of entities previously managed in the past 7 days.
Entities that were updated since the past 4 hours will not yet be reviewed, to allow some time before re-inspecting potential thresholds after an update.
Entities that were updated since more than 4 hours, within the past 24 hours and where the threshold value was increased are added for further review.
Beyond these conditions, entities that were updated during the past 7, 15 or 30 days depending on the settings are regularly reviewed and updated if needed and depending on the conditions and the stability of the feeds.
Entities review behavior can be summarized in the following mindmap:
2.2 Dynamic Threshold Logic Attribution
As a basis, TrackMe automatically runs the following mstats search (over 30 days of metrics by default), example:
| mstats latest(trackme.splk.feeds.lag_event_sec) as lag_event_sec where `trackme_metrics_idx(mytenant)` tenant_id="mytenant" object_category="splk-dsm" object="myobject" by object span=5m

``` ML calculations for this object ```
| fit DensityFunction lag_event_sec lower_threshold=0.005 upper_threshold=0.005 by object
| rex field=BoundaryRanges "(-Infinity:(?<LowerBound>[\d|\.]*))|((?<UpperBound>[\d|\.]*):Infinity)"
| foreach LowerBound UpperBound [ eval <<FIELD>> = if(isnum('<<FIELD>>'), '<<FIELD>>', 0) ]
| fields _time lag_event_sec LowerBound UpperBound

``` retain the UpperBound and perform additional calculations ```
| stats first(UpperBound) as UpperBound, perc95(lag_event_sec) as perc95_lag_event_sec, min(lag_event_sec) as min_lag_event_sec, max(lag_event_sec) as max_lag_event_sec, stdev(lag_event_sec) as stdev_lag_event_sec | eval UpperBound=round(UpperBound, 0)
| foreach *_lag_event_sec [ eval <<FIELD>> = round('<<FIELD>>', 0) ]

``` round by the hour, and go at the next hour range ```
| eval adaptive_delay = (round(UpperBound/3600, 0) * 3600) + 3600, adaptive_delay_duration = tostring(adaptive_delay, "duration")
When reviewing entities for further re-processing after an initial update, TrackMe uses a more sophisticated variation of this logic which works against different time frames (-24h, -7, -30d) and aggregates the results, this allows TrackMe to beter take into account a feed that returns to stability after an interruption and in a shorter time frame:
| mstats latest(trackme.splk.feeds.lag_event_sec) as lag_event_sec where `trackme_metrics_idx(01-feeds)` tenant_id="mytenant" object_category="splk-dsm" object="myobject" earliest="-30d" latest="now" by object span=5m

``` ML calculations for this object ```
| fit DensityFunction lag_event_sec lower_threshold=0.005 upper_threshold=0.005 by object
| rex field=BoundaryRanges "(-Infinity:(?<LowerBound>[\d|\.]*))|((?<UpperBound>[\d|\.]*):Infinity)"
| foreach LowerBound UpperBound [ eval <<FIELD>> = if(isnum('<<FIELD>>'), '<<FIELD>>', 0) ]
| fields _time object lag_event_sec LowerBound UpperBound

``` retain the UpperBound and perform additional calculations ```
| stats first(UpperBound) as UpperBound, perc95(lag_event_sec) as perc95_lag_event_sec, min(lag_event_sec) as min_lag_event_sec, max(lag_event_sec) as max_lag_event_sec, stdev(lag_event_sec) as stdev_lag_event_sec by object | eval UpperBound=round(UpperBound, 0)
| foreach *_lag_event_sec [ eval <<FIELD>> = round('<<FIELD>>', 0) ]

``` round by the hour, and go at the next hour range ```
| eval adaptive_delay = (round(UpperBound/3600, 0) * 3600) + 3600, adaptive_delay_duration = tostring(adaptive_delay, "duration")

``` rename ```
| rename LowerBound as LowerBound_30d, UpperBound as UpperBound_30d, perc95_lag_event_sec as perc95_lag_event_sec_30d, min_lag_event_sec as min_lag_event_sec_30d, max_lag_event_sec as max_lag_event_sec_30d, stdev_lag_event_sec as stdev_lag_event_sec_30d, adaptive_delay as adaptive_delay_30d, adaptive_delay_duration as adaptive_delay_duration_30d

| join type=outer object [

| mstats latest(trackme.splk.feeds.lag_event_sec) as lag_event_sec where `trackme_metrics_idx(01-feeds)` tenant_id="mytenant" object_category="splk-dsm" object="myobject" earliest="-7d" latest="now" by object span=5m

``` ML calculations for this object ```
| fit DensityFunction lag_event_sec lower_threshold=0.005 upper_threshold=0.005 by object
| rex field=BoundaryRanges "(-Infinity:(?<LowerBound>[\d|\.]*))|((?<UpperBound>[\d|\.]*):Infinity)"
| foreach LowerBound UpperBound [ eval <<FIELD>> = if(isnum('<<FIELD>>'), '<<FIELD>>', 0) ]
| fields _time object lag_event_sec LowerBound UpperBound

``` retain the UpperBound and perform additional calculations ```
| stats first(UpperBound) as UpperBound, perc95(lag_event_sec) as perc95_lag_event_sec, min(lag_event_sec) as min_lag_event_sec, max(lag_event_sec) as max_lag_event_sec, stdev(lag_event_sec) as stdev_lag_event_sec by object | eval UpperBound=round(UpperBound, 0)
| foreach *_lag_event_sec [ eval <<FIELD>> = round('<<FIELD>>', 0) ]

``` round by the hour, and go at the next hour range ```
| eval adaptive_delay = (round(UpperBound/3600, 0) * 3600) + 3600, adaptive_delay_duration = tostring(adaptive_delay, "duration")

``` rename ```
| rename LowerBound as LowerBound_7d, UpperBound as UpperBound_7d, perc95_lag_event_sec as perc95_lag_event_sec_7d, min_lag_event_sec as min_lag_event_sec_7d, max_lag_event_sec as max_lag_event_sec_7d, stdev_lag_event_sec as stdev_lag_event_sec_7d, adaptive_delay as adaptive_delay_7d, adaptive_delay_duration as adaptive_delay_duration_7d

]

| join type=outer object [

| mstats latest(trackme.splk.feeds.lag_event_sec) as lag_event_sec where `trackme_metrics_idx(01-feeds)` tenant_id="mytenant" object_category="splk-dsm" object="myobject" earliest="-24h" latest="now" by object span=5m

``` ML calculations for this object ```
| fit DensityFunction lag_event_sec lower_threshold=0.005 upper_threshold=0.005 by object
| rex field=BoundaryRanges "(-Infinity:(?<LowerBound>[\d|\.]*))|((?<UpperBound>[\d|\.]*):Infinity)"
| foreach LowerBound UpperBound [ eval <<FIELD>> = if(isnum('<<FIELD>>'), '<<FIELD>>', 0) ]
| fields _time object lag_event_sec LowerBound UpperBound

``` retain the UpperBound and perform additional calculations ```
| stats first(UpperBound) as UpperBound, perc95(lag_event_sec) as perc95_lag_event_sec, min(lag_event_sec) as min_lag_event_sec, max(lag_event_sec) as max_lag_event_sec, stdev(lag_event_sec) as stdev_lag_event_sec by object | eval UpperBound=round(UpperBound, 0)
| foreach *_lag_event_sec [ eval <<FIELD>> = round('<<FIELD>>', 0) ]

``` round by the hour, and go at the next hour range ```
| eval adaptive_delay = (round(UpperBound/3600, 0) * 3600) + 3600, adaptive_delay_duration = tostring(adaptive_delay, "duration")

``` rename ```
| rename LowerBound as LowerBound_24h, UpperBound as UpperBound_24h, perc95_lag_event_sec as perc95_lag_event_sec_24h, min_lag_event_sec as min_lag_event_sec_24h, max_lag_event_sec as max_lag_event_sec_24h, stdev_lag_event_sec as stdev_lag_event_sec_24h, adaptive_delay as adaptive_delay_24h, adaptive_delay_duration as adaptive_delay_duration_24h

]

``` aggregate the UpperBound, if for any reason one the UpperBound is not returned as expected, we will use the 7d value ```
| eval UpperBound=case(
isnum(UpperBound_30d) AND isnum(UpperBound_7d) AND isnum(UpperBound_24h), avg(UpperBound_30d+UpperBound_7d+UpperBound_24h/3, 2),
1=1, UpperBound_7d
)
| eval adaptive_delay = (round(UpperBound/3600, 0) * 3600) + 3600, adaptive_delay_duration = tostring(adaptive_delay, "duration")
TrackMe carefuly logs the searches performed as well as their result.
2.3 Tracker Level Key Arguments
min_delay_sec
This defines the minimum delay value in seconds for entities to be considered (2 hours by default).
min_delay_sec=3600
max_auto_delay_sec
This defines the maximal delay value that the adaptive backend can set, if the automated delay calculation goes beyond it, this value will be used instead, expressed in seconds.
Behavior change in TrackMe 2.0.84
Before this version, the behavior was to refuse updating entities if the calculation was leading to a superior value than the max_auto_delay_sec.
From this version, TrackMe will instead use this value and will update the entity, which then enters the cycle of review automatically.
max_auto_delay_sec=604800
max_changes_past_7days
This defines the maximal number of changes that can be performed in a 7 days time frame, once reached we will not update this entity again until the counter is reset.
max_changes_past_7days=10
min_historical_metrics_days
The minimal number of accumulated days of metrics before we start updating the delay threshold, expressed in days.
min_historical_metrics_days=7
review_period_no_days
This argument was introduced in TrackMe 2.0.96, it allows you to control the period of time for the review of TrackMe entities that were updated.
review_period_no_days=30
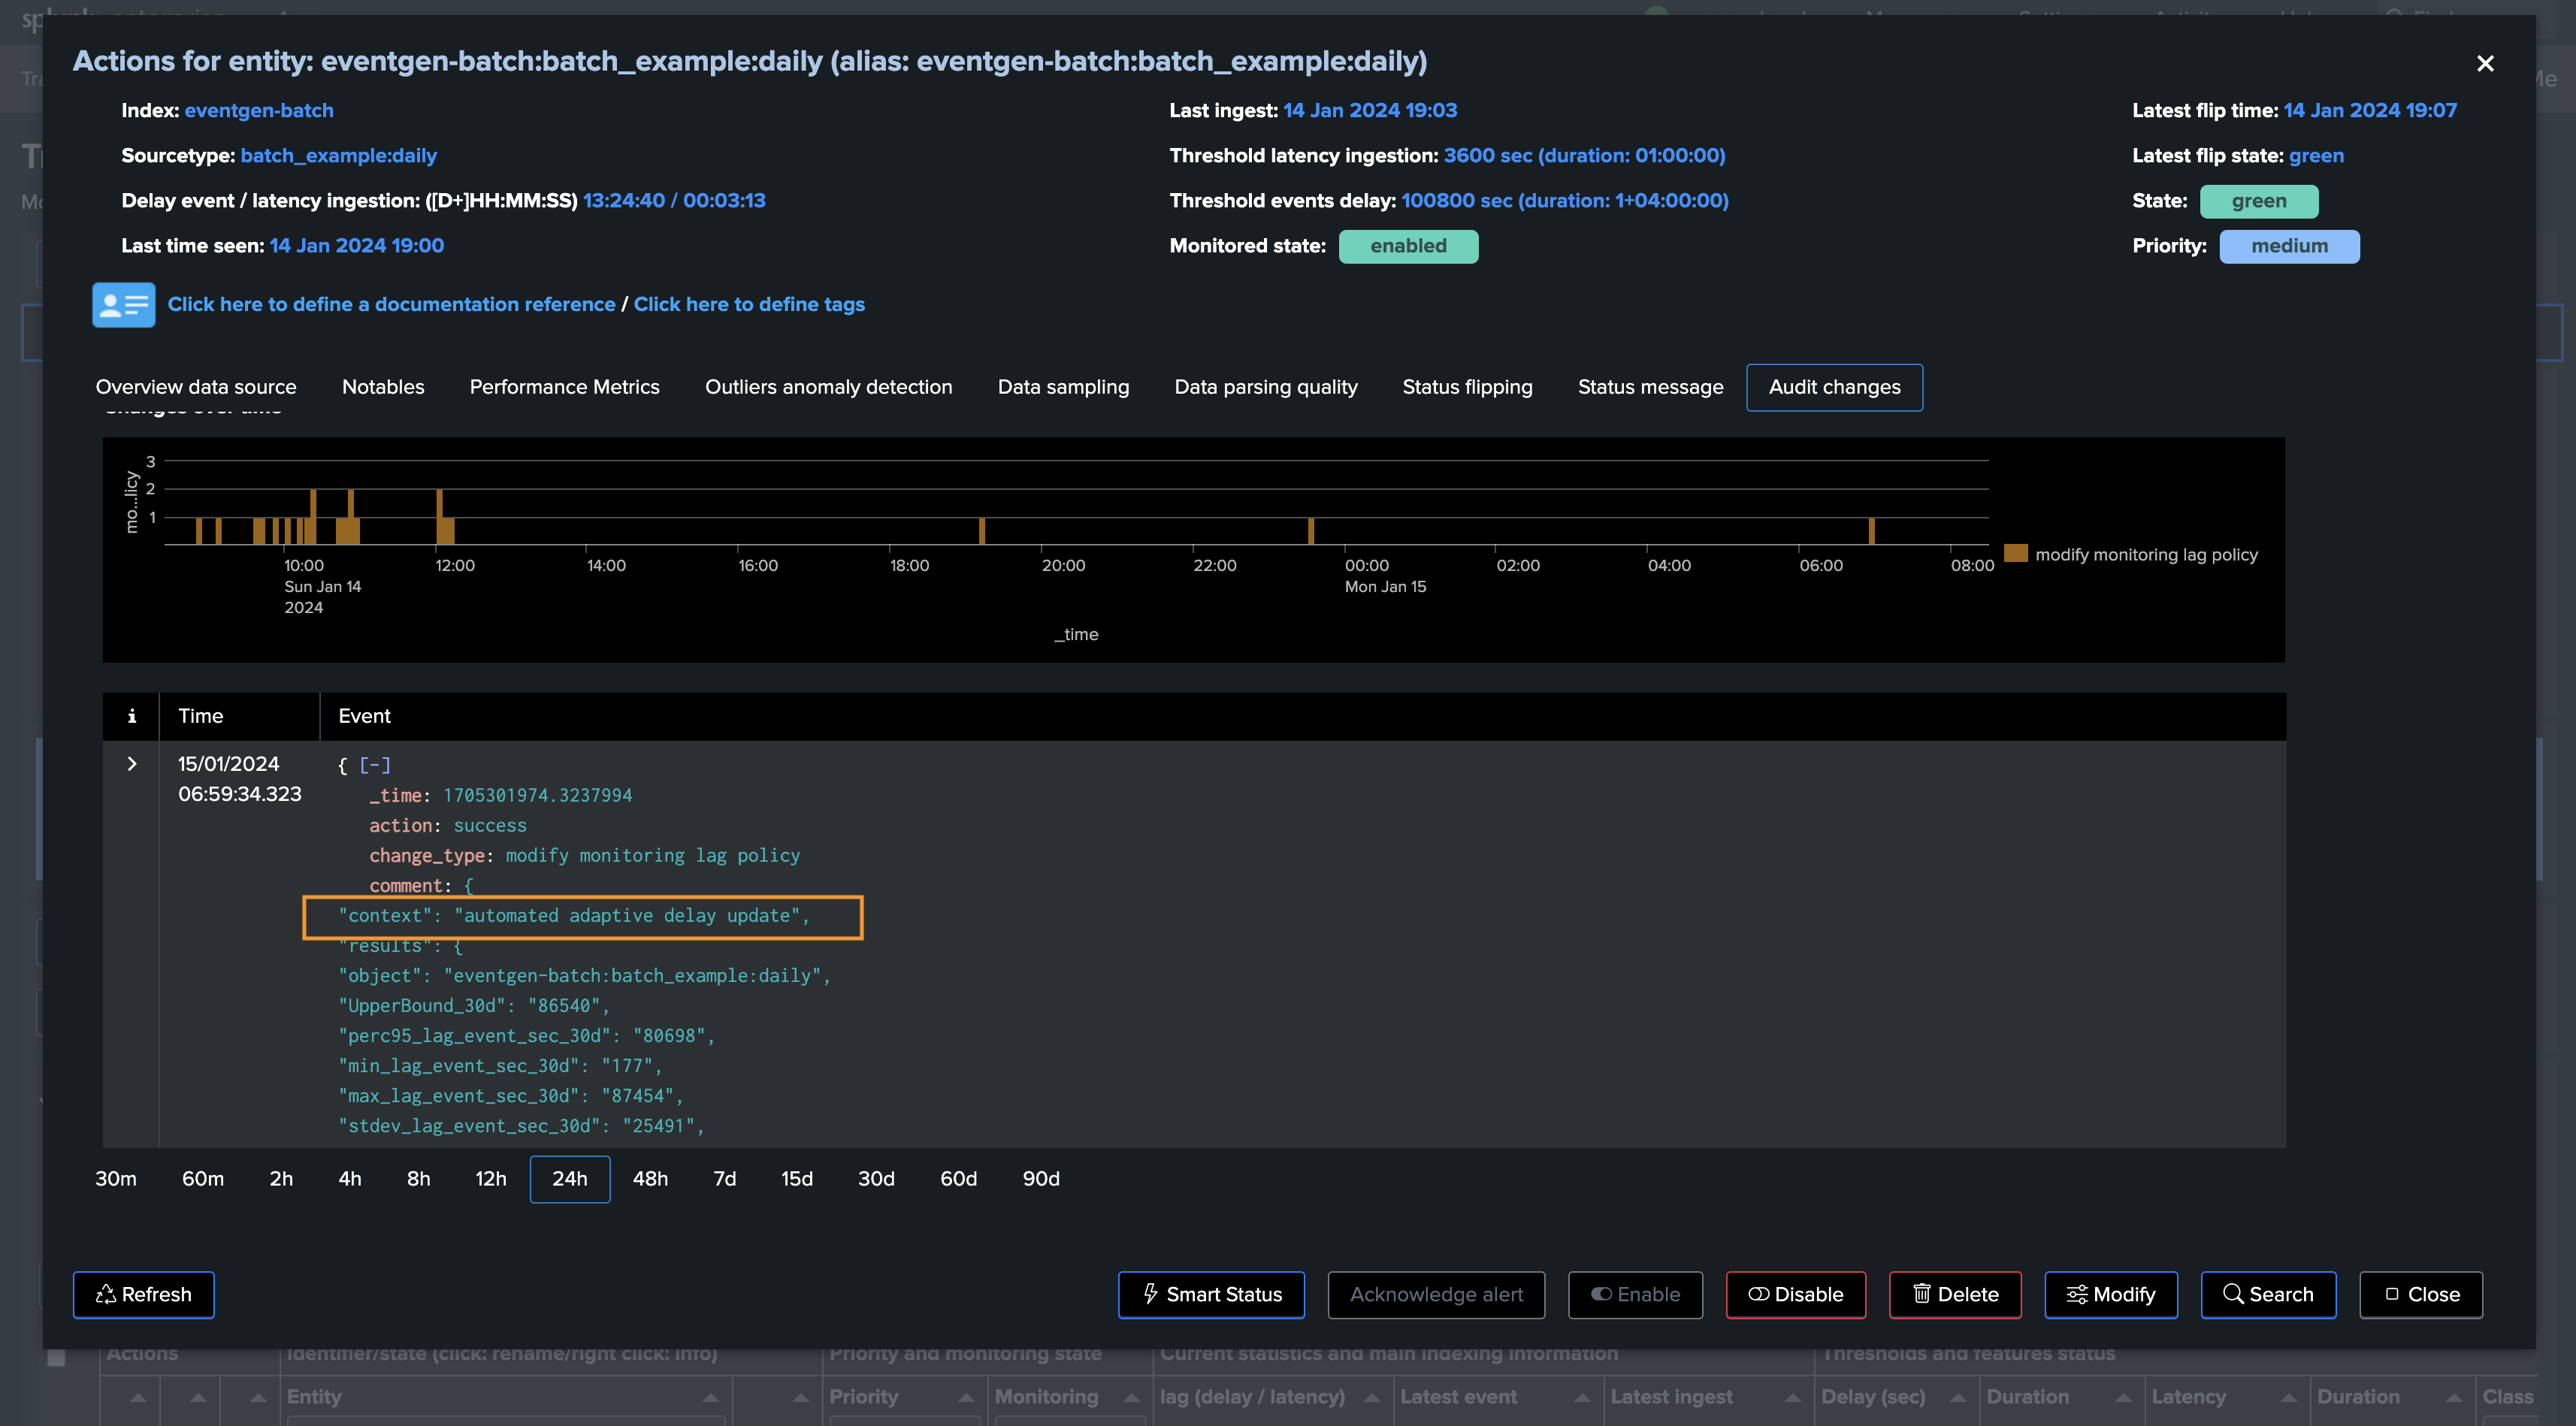
2.4 Updating Delay Thresholds Automatically
After performing these investigations, the command updates the delay threshold value for selected entities, and generates an audit record with corresponding results (context: automated adaptive delay update). Audit messages can be found with the following search:
`trackme_audit_idx` tenant_id=* "automated adaptive delay update"
| table _time, tenant_id, object_category, object, action, comment
| sort - 0 _time | trackmeprettyjson fields=comment
2.5 Adaptive tracker output & Activity log traces
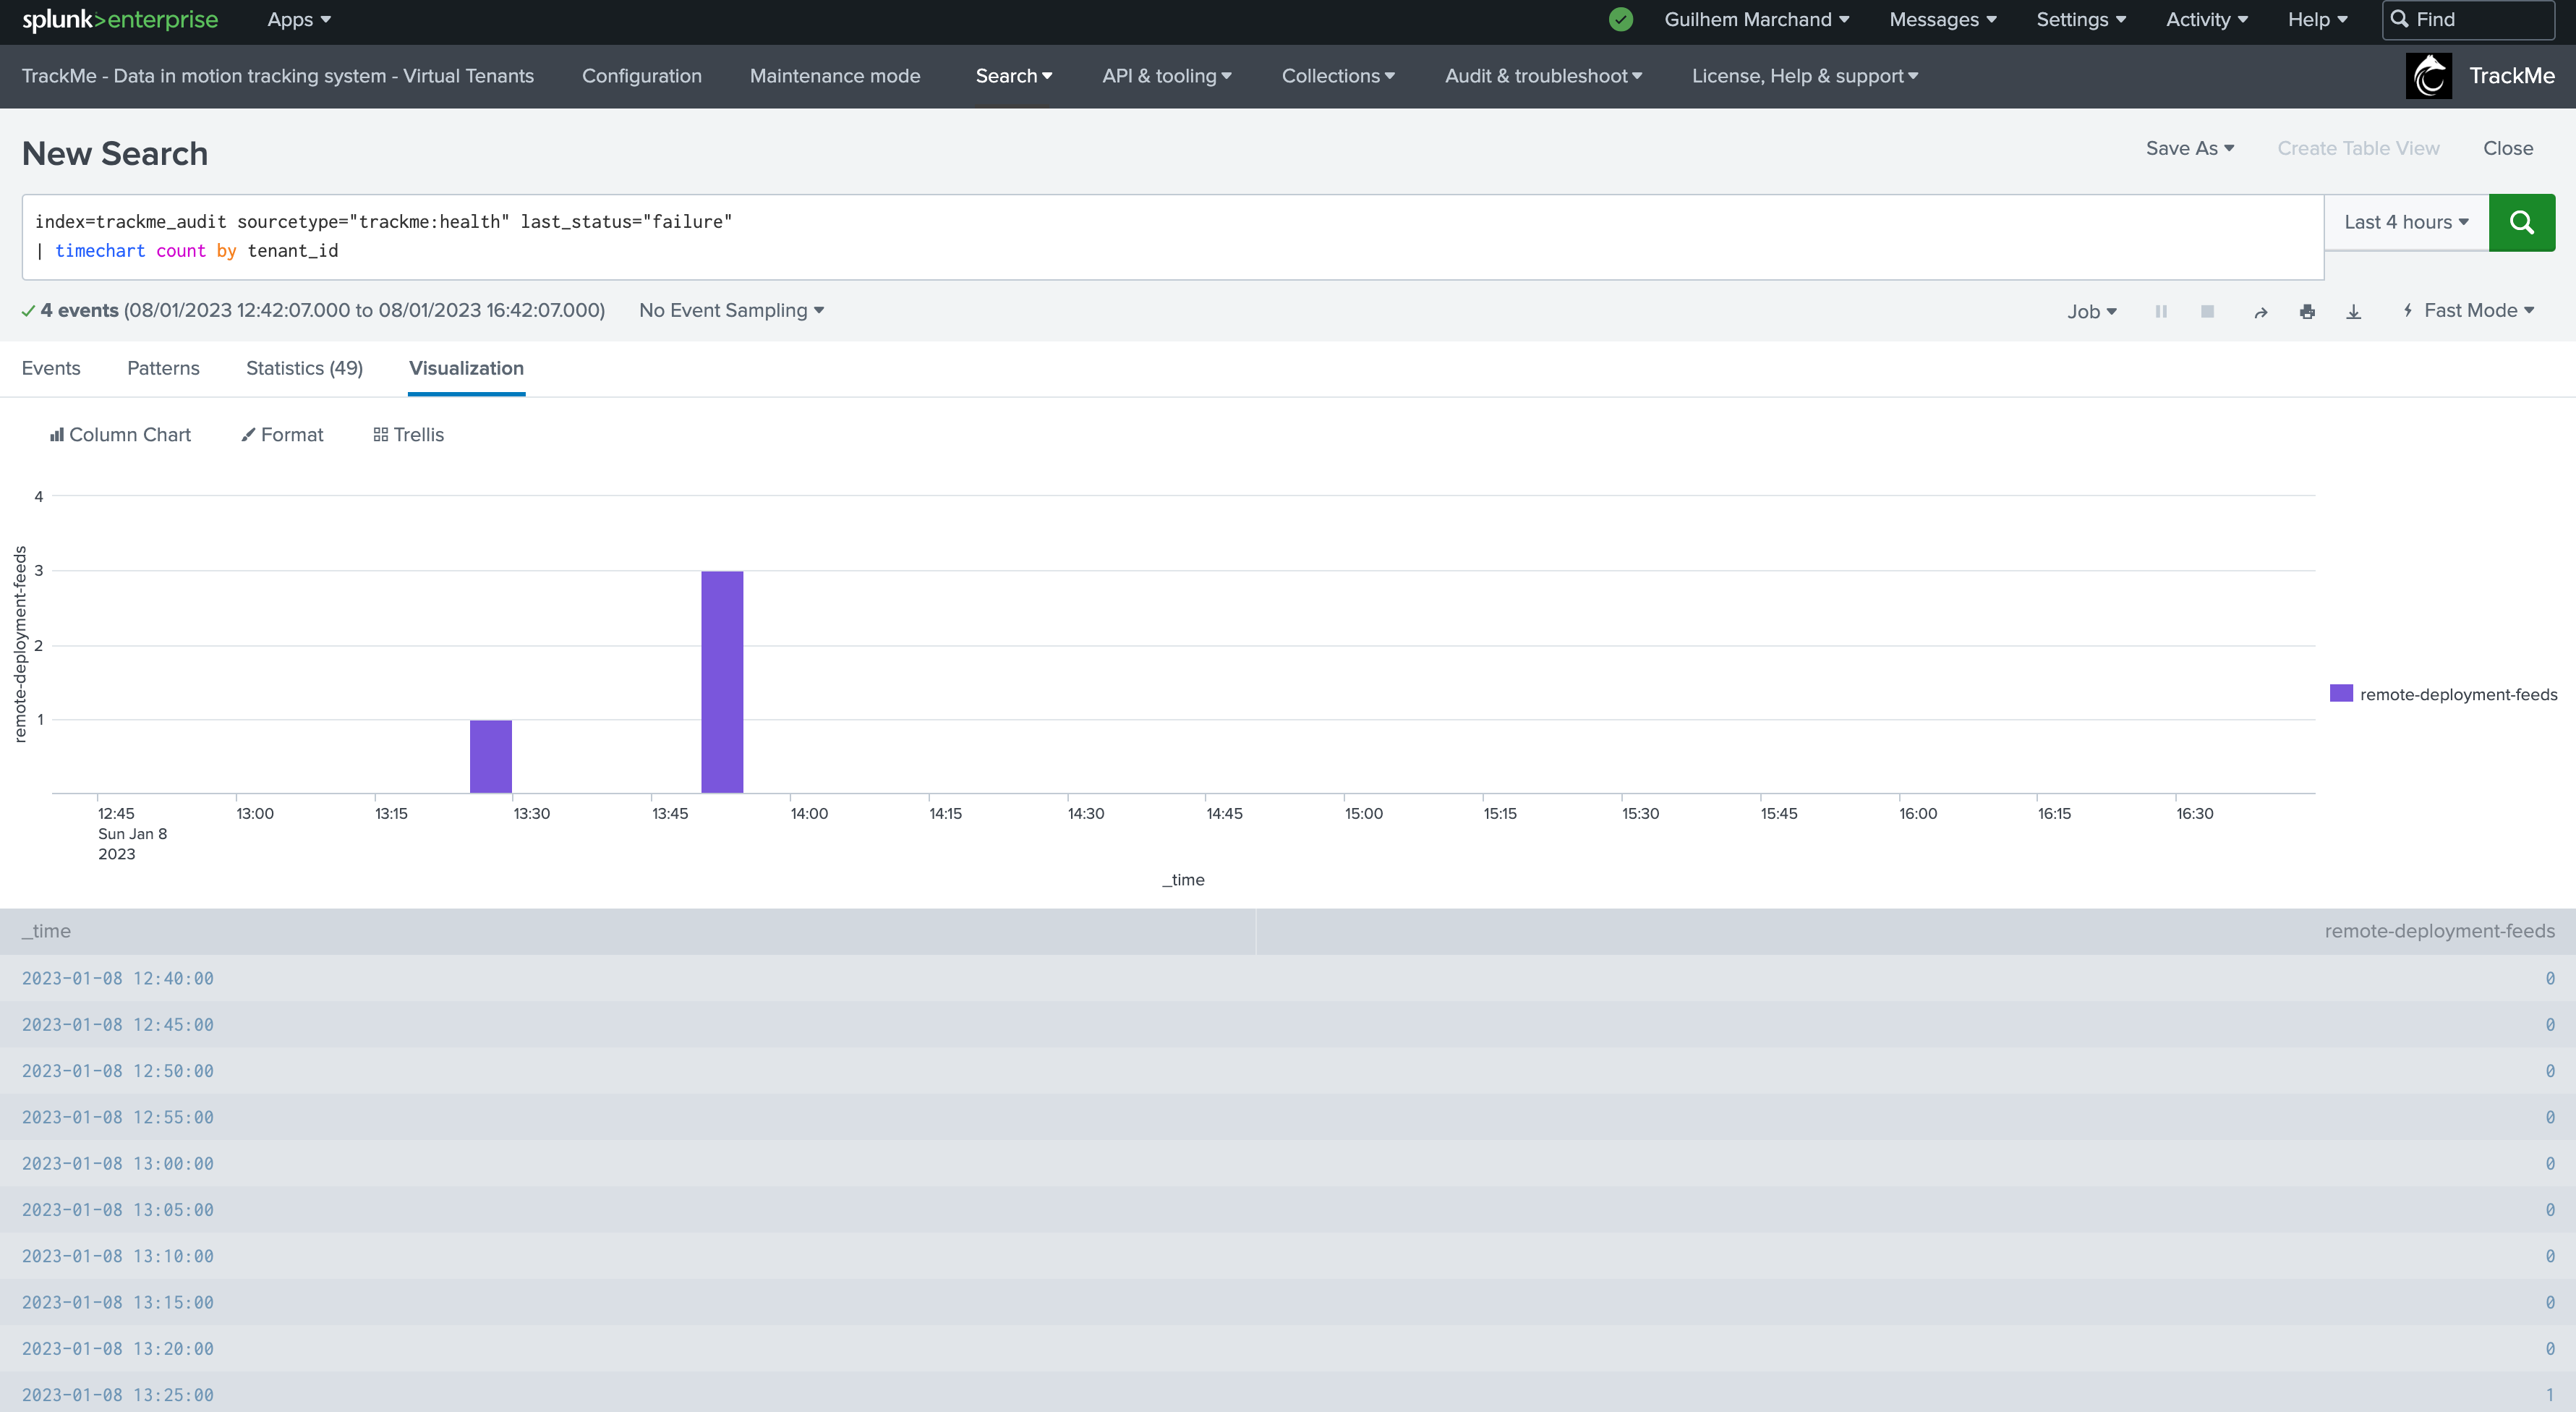
The activity log traces can be found with the following search:
index=_internal sourcetype=trackme:custom_commands:trackmesplkadaptivedelay
To easily review decisions made for a given entity, add the object as part of the search filter:
index=_internal sourcetype=trackme:custom_commands:trackmesplkadaptivedelay object="myobject"
TrackMe also generates an audit event every time the Adaptive Threshold performs an update, you can find this easily via TrackMe’s user interface:
When the Tracker runs, it register in its output every entity that was considered as well as actions performed for it:
The job output is also registered in the activity logs:
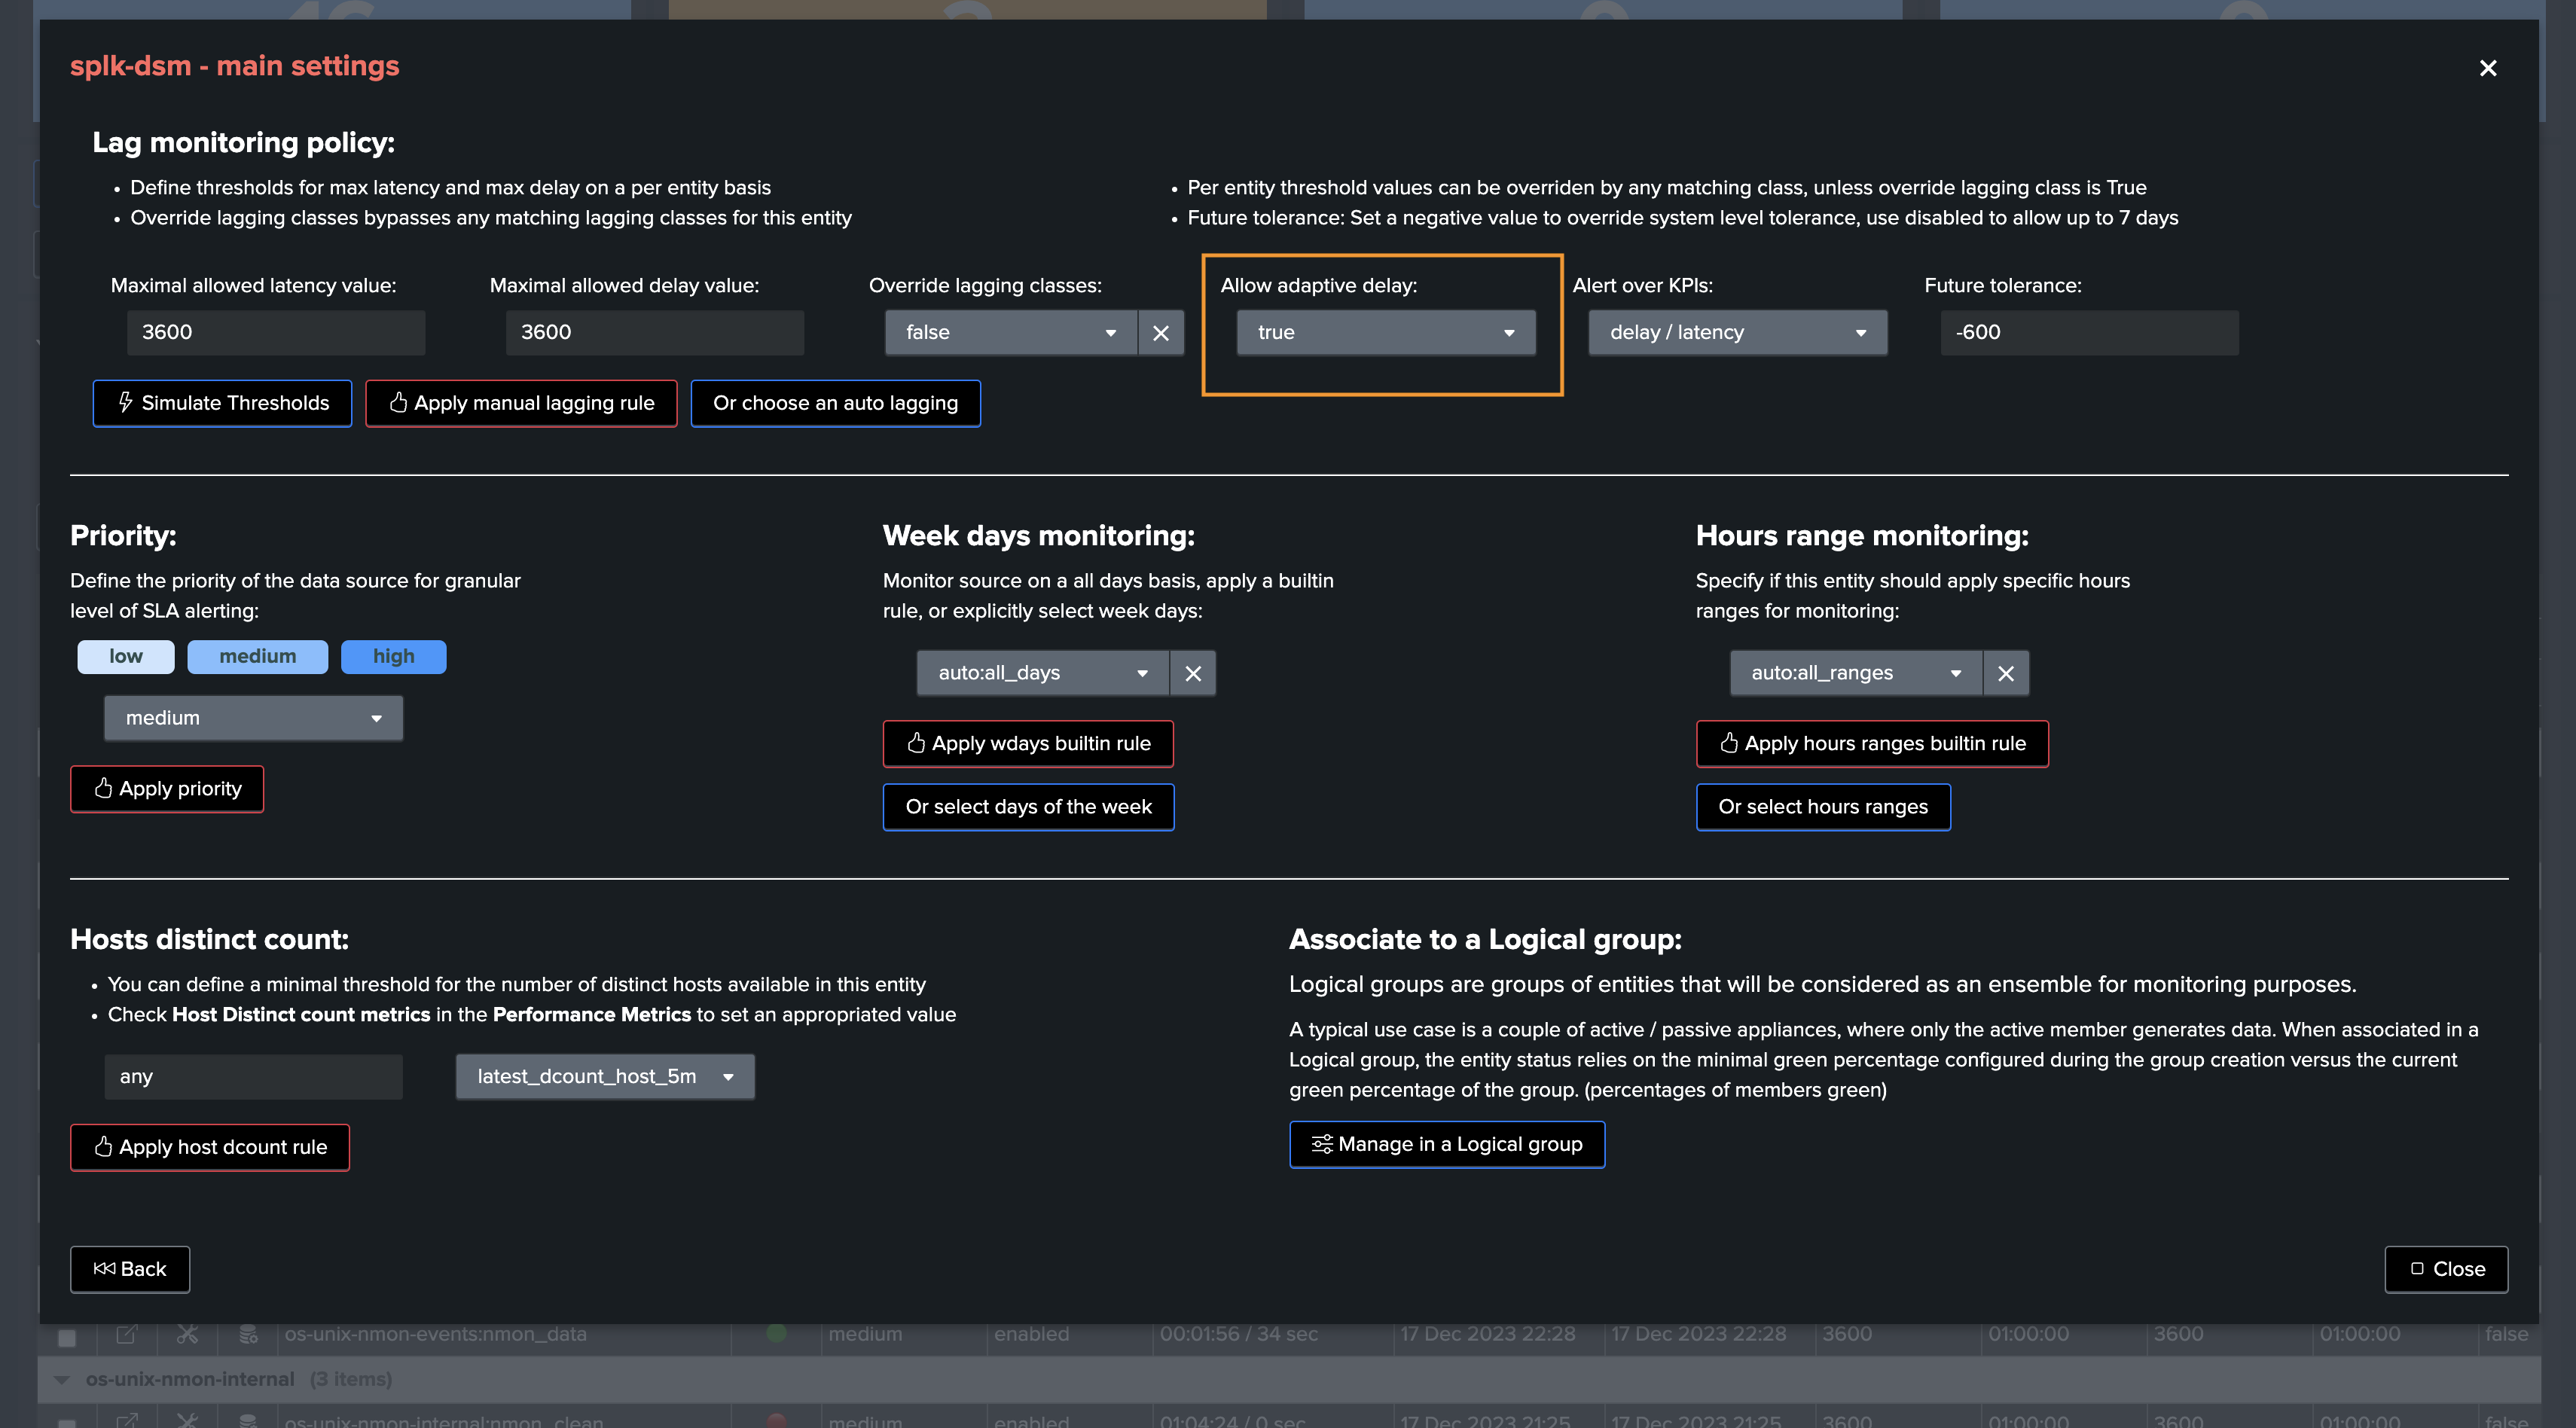
2.6 Preventing an Entity from Being Automatically Managed
Via the UI, you can set the value of allow_adaptive_delay to False, which prevents TrackMe from automatically updating the delay threshold for a given entity.
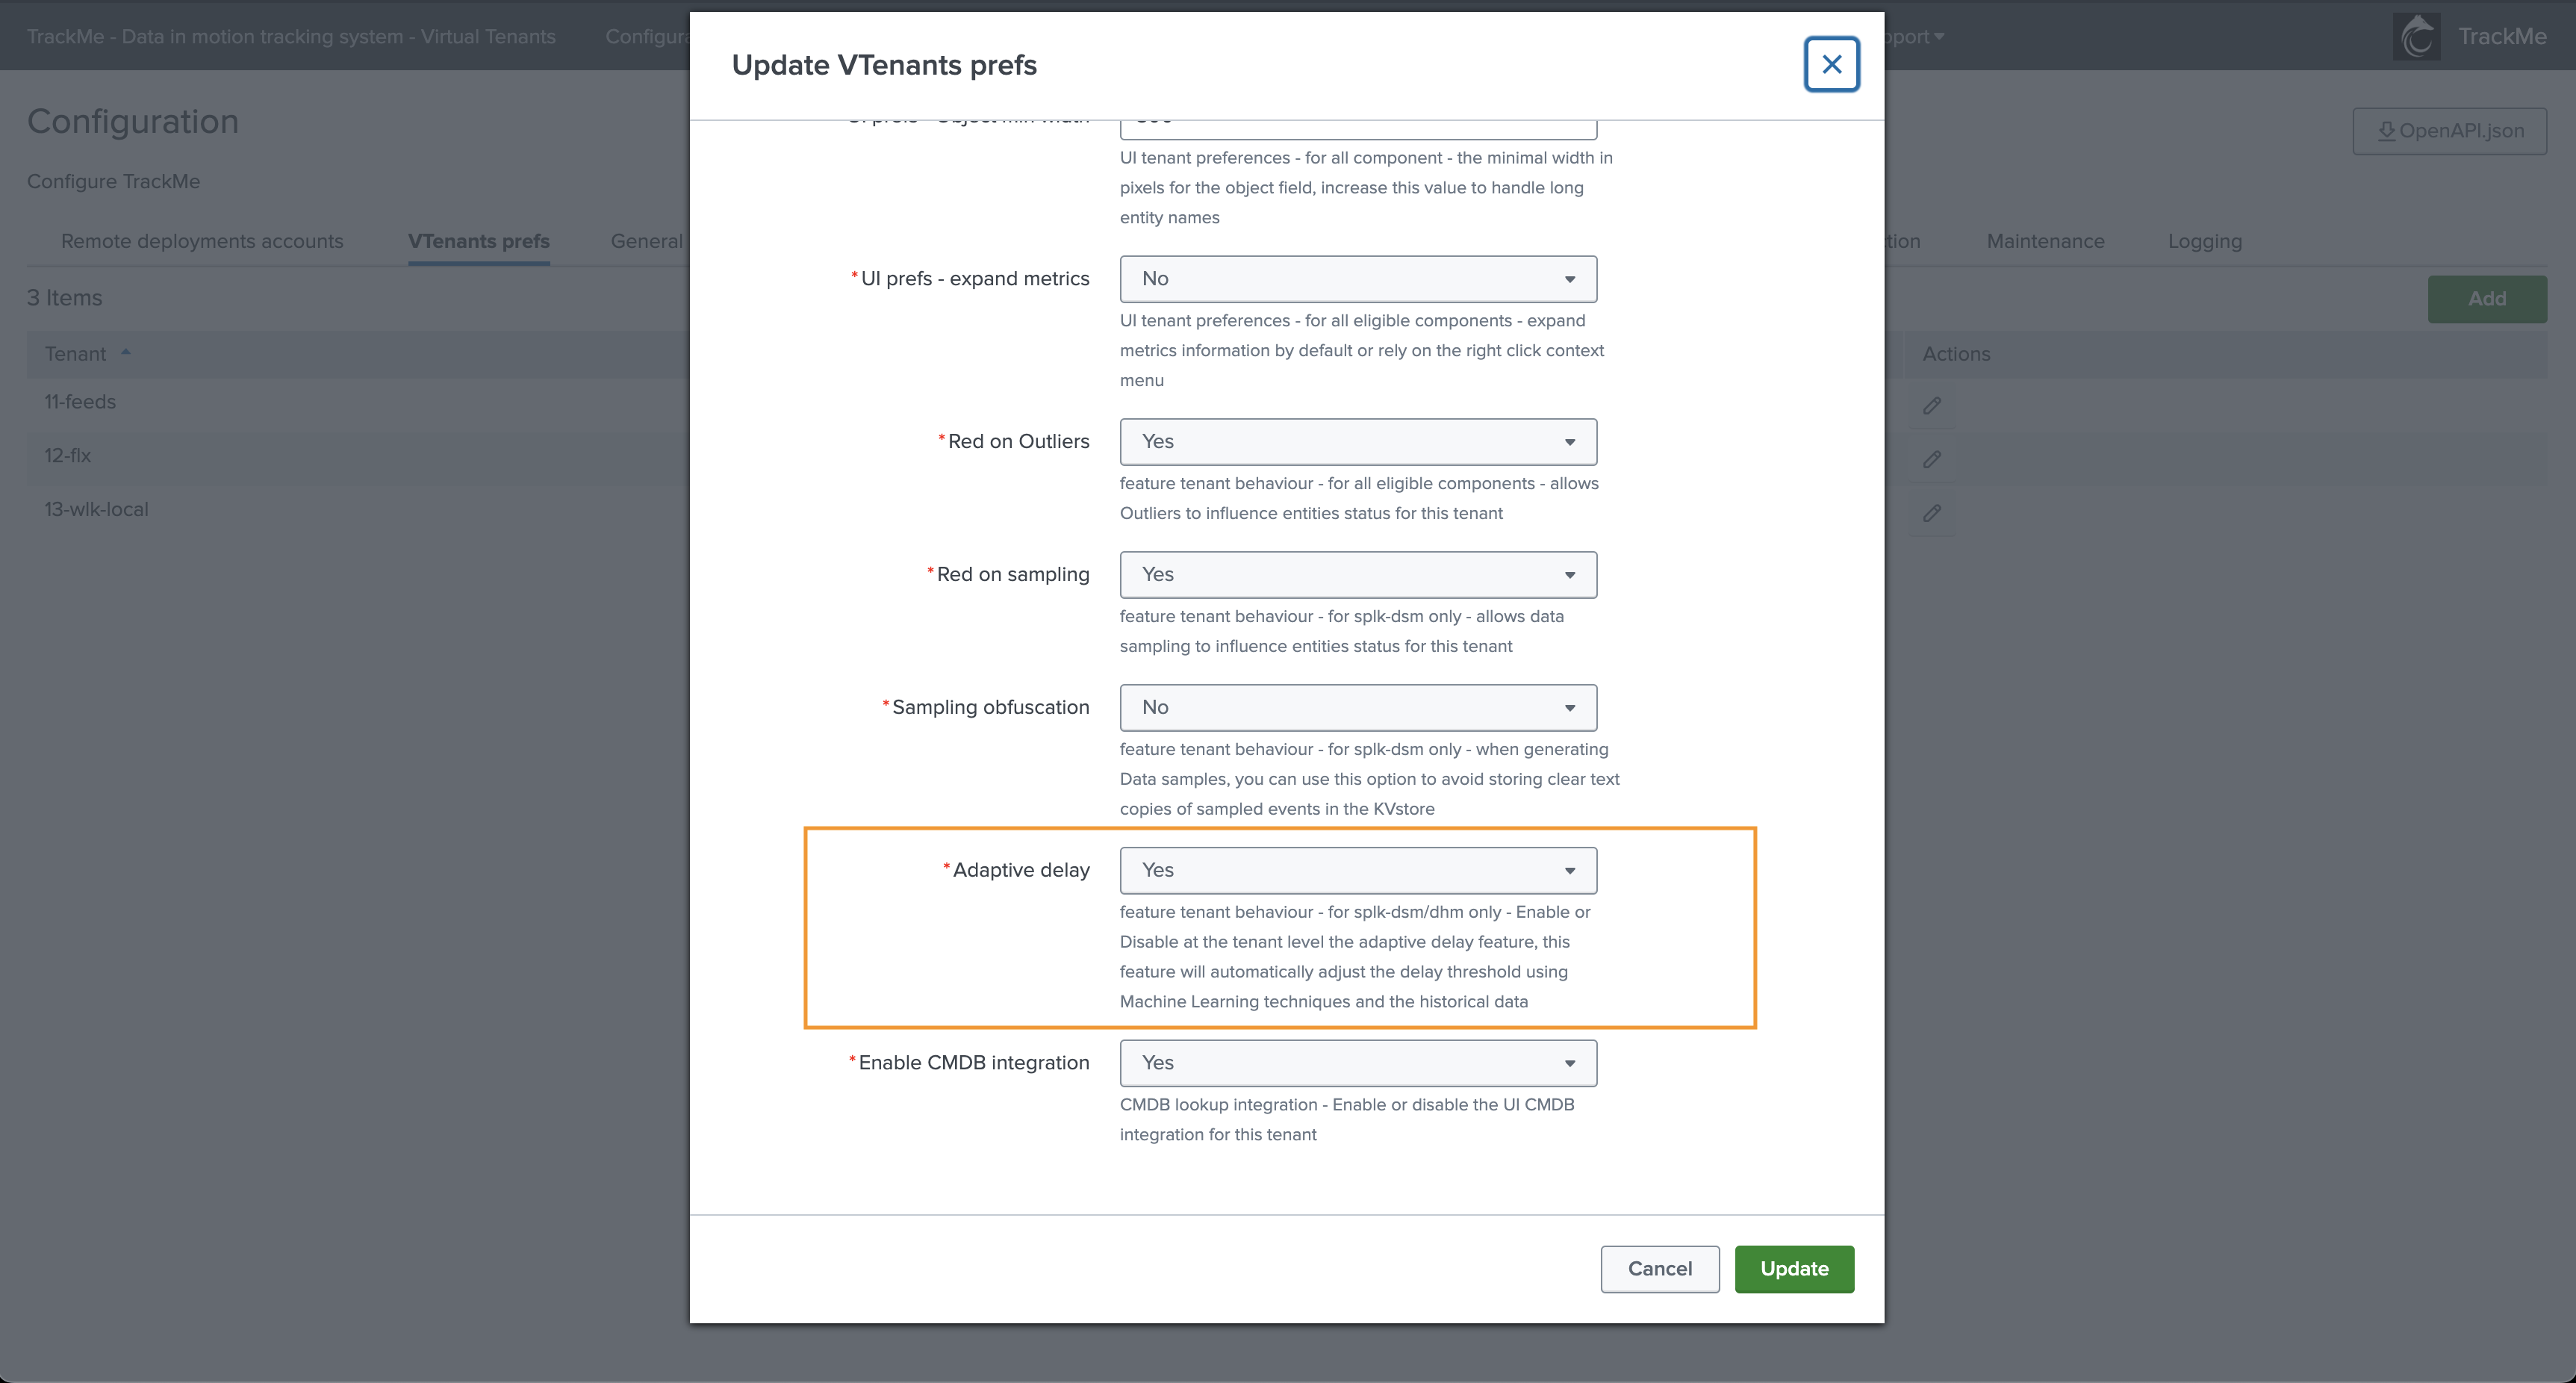
2.7 Disabling Adaptive Delay Thresholding at the Tenant Level
Since TrackMe V2.0.75, you can disable the adaptive delay thresholding feature at the Virtual Tenant account level (setting: adaptive_delay).
Go in Configure / VTenants prefs:
2.8 Audit dashboard
Review the audit dashboard called “TrackMe - Adaptive delay threshold audit” available in the menu Audit & Troubleshoot.
3. Reviewing Current Thresholds
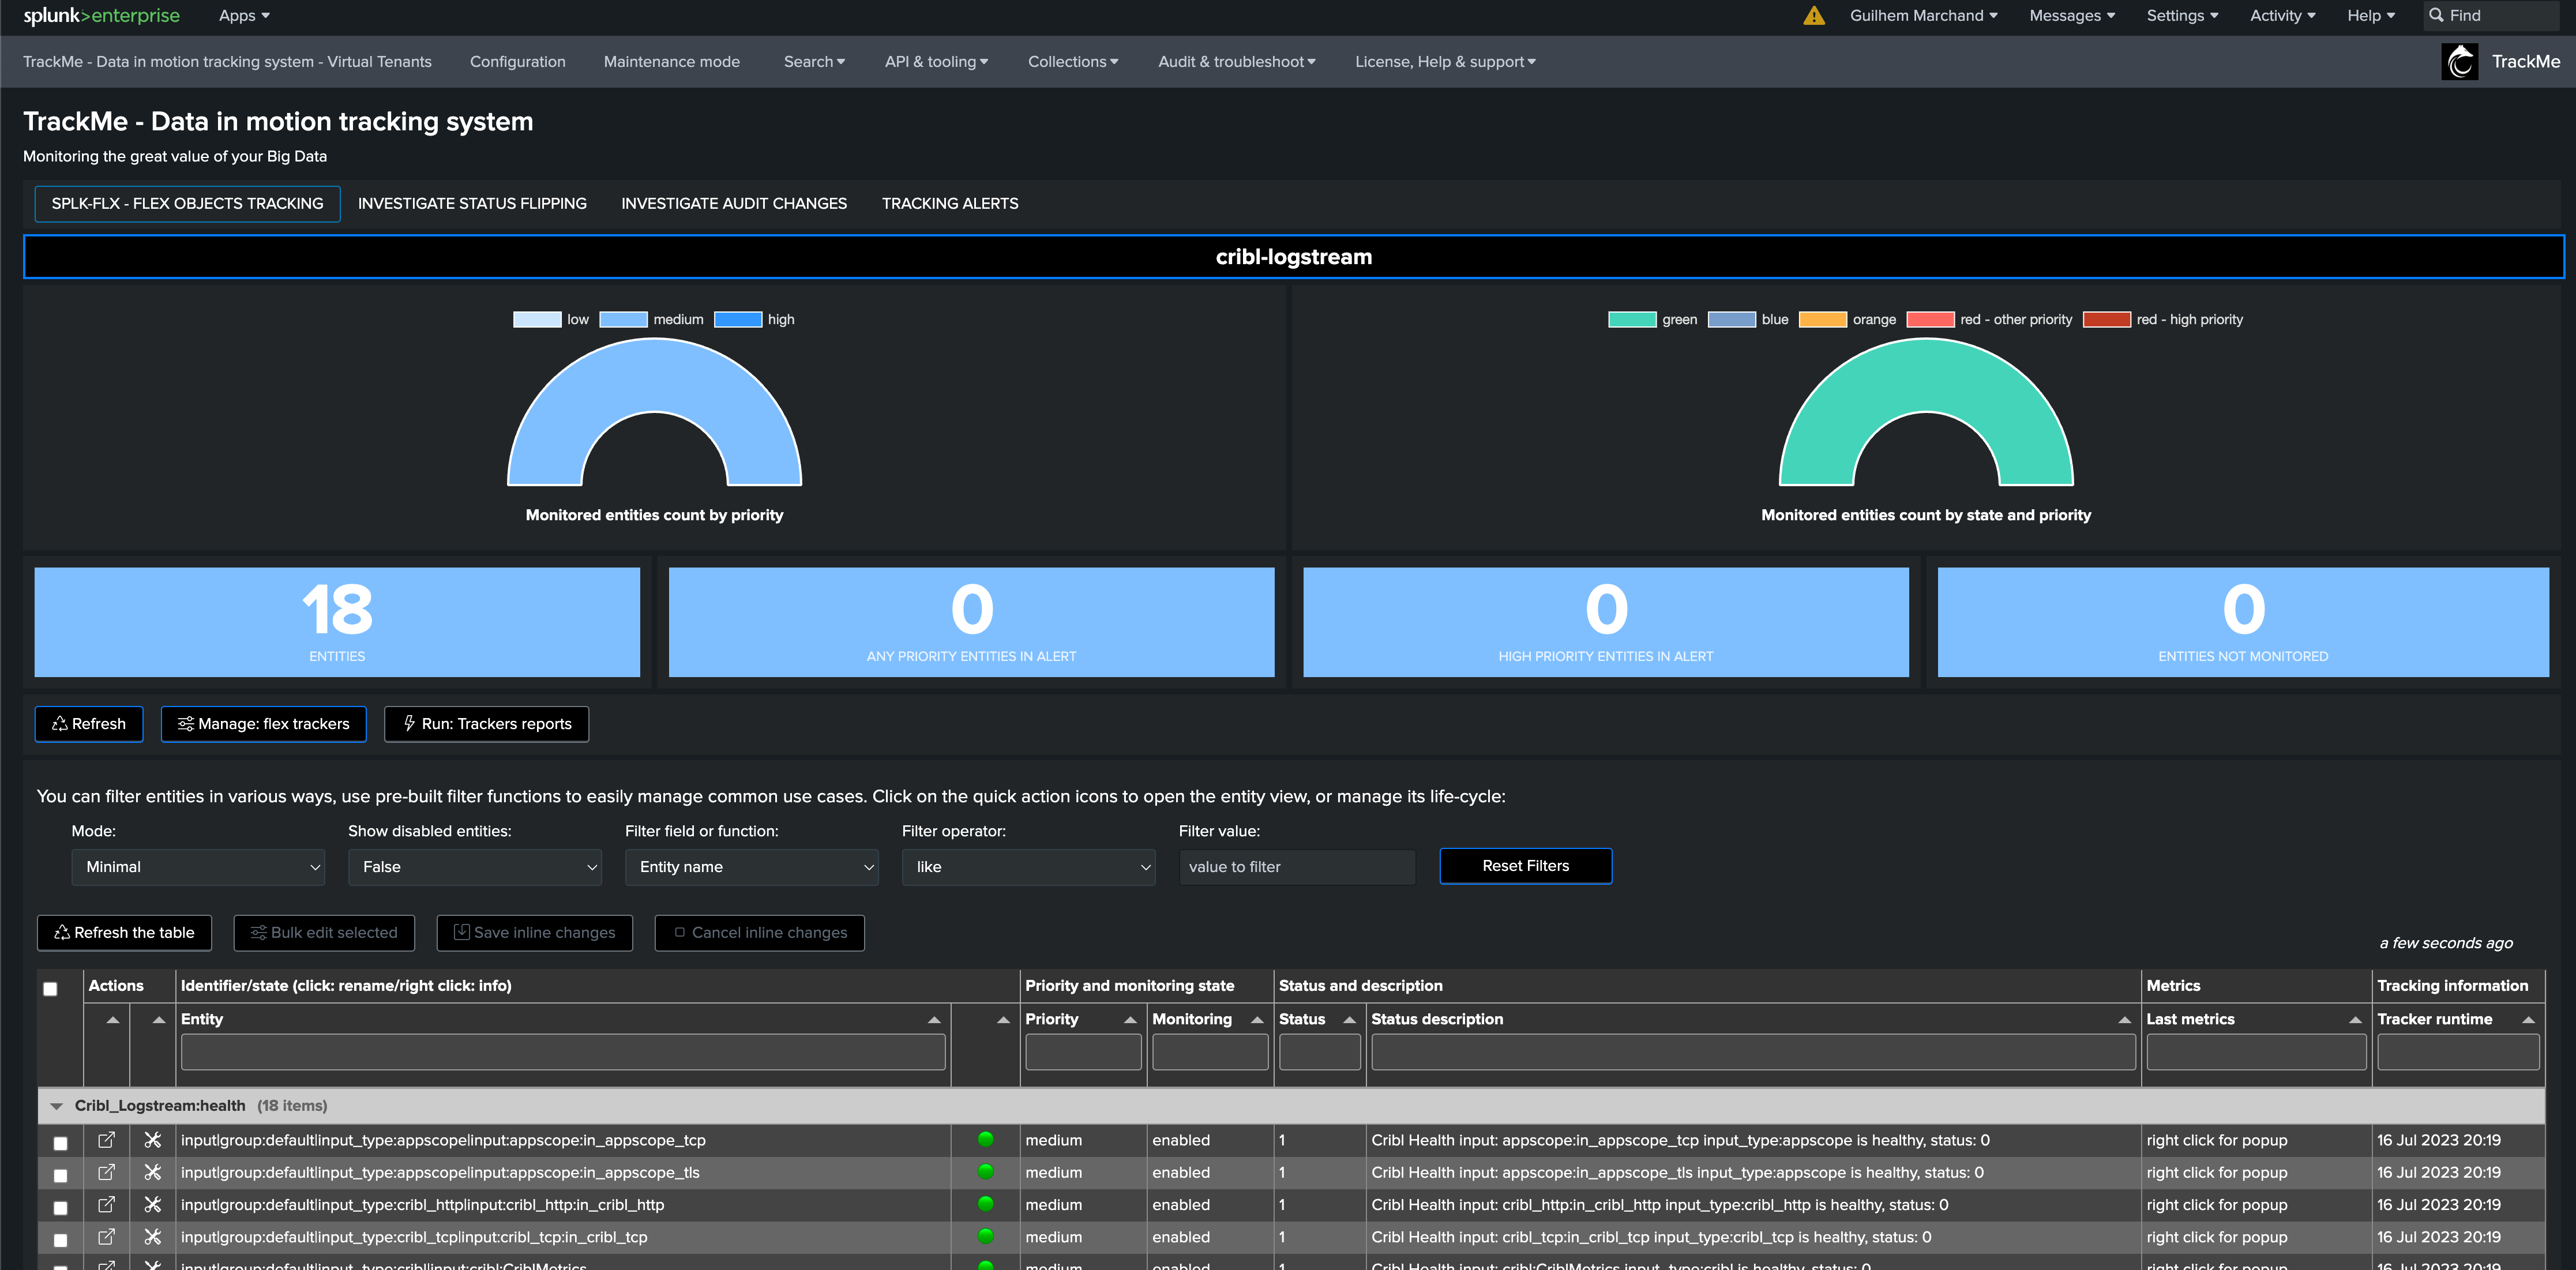
Currently set thresholds are shown in different parts of the TrackMe main user interface:
In the main user interface of the Virtual Tenant, the Tabulator shows a two-column element showing both threshold values
When opening the entity main screen
Viewing thresholds from the Tabulator:
Viewing thesholds from the entity view:
4. Defining Custom Threshold Values
There are mainly two approaches, which can be combined:
Defining global rules that define the threshold values based on custom criteria, these are called “Lagging classes” in TrackMe
Defining custom threshold values for a given entity, optionally overriding Lagging classes, if any
5. Lagging Classes for Thresholds Management
A best practice approach is to configure lagging classes.
Lagging classes can be defined using the following criteria: - Based on the index - Based on the sourcetype - Based on the priority level defined for the entity
When a lagging class is defined and matches an entity, TrackMe defines the values of the thresholds accordingly.
These values can be overridden on a per-entity basis, allowing managing generic use cases for a data provider while still being able to manage specific use cases per entity.
Example: defining a custom lagging class for a sourcetype:
In this example, we define a custom lagging class for the sourcetype “netscreen-firewall”, with the following values:
latency: 10 minutes (600 seconds)
delay: 2 hours (7200 seconds)
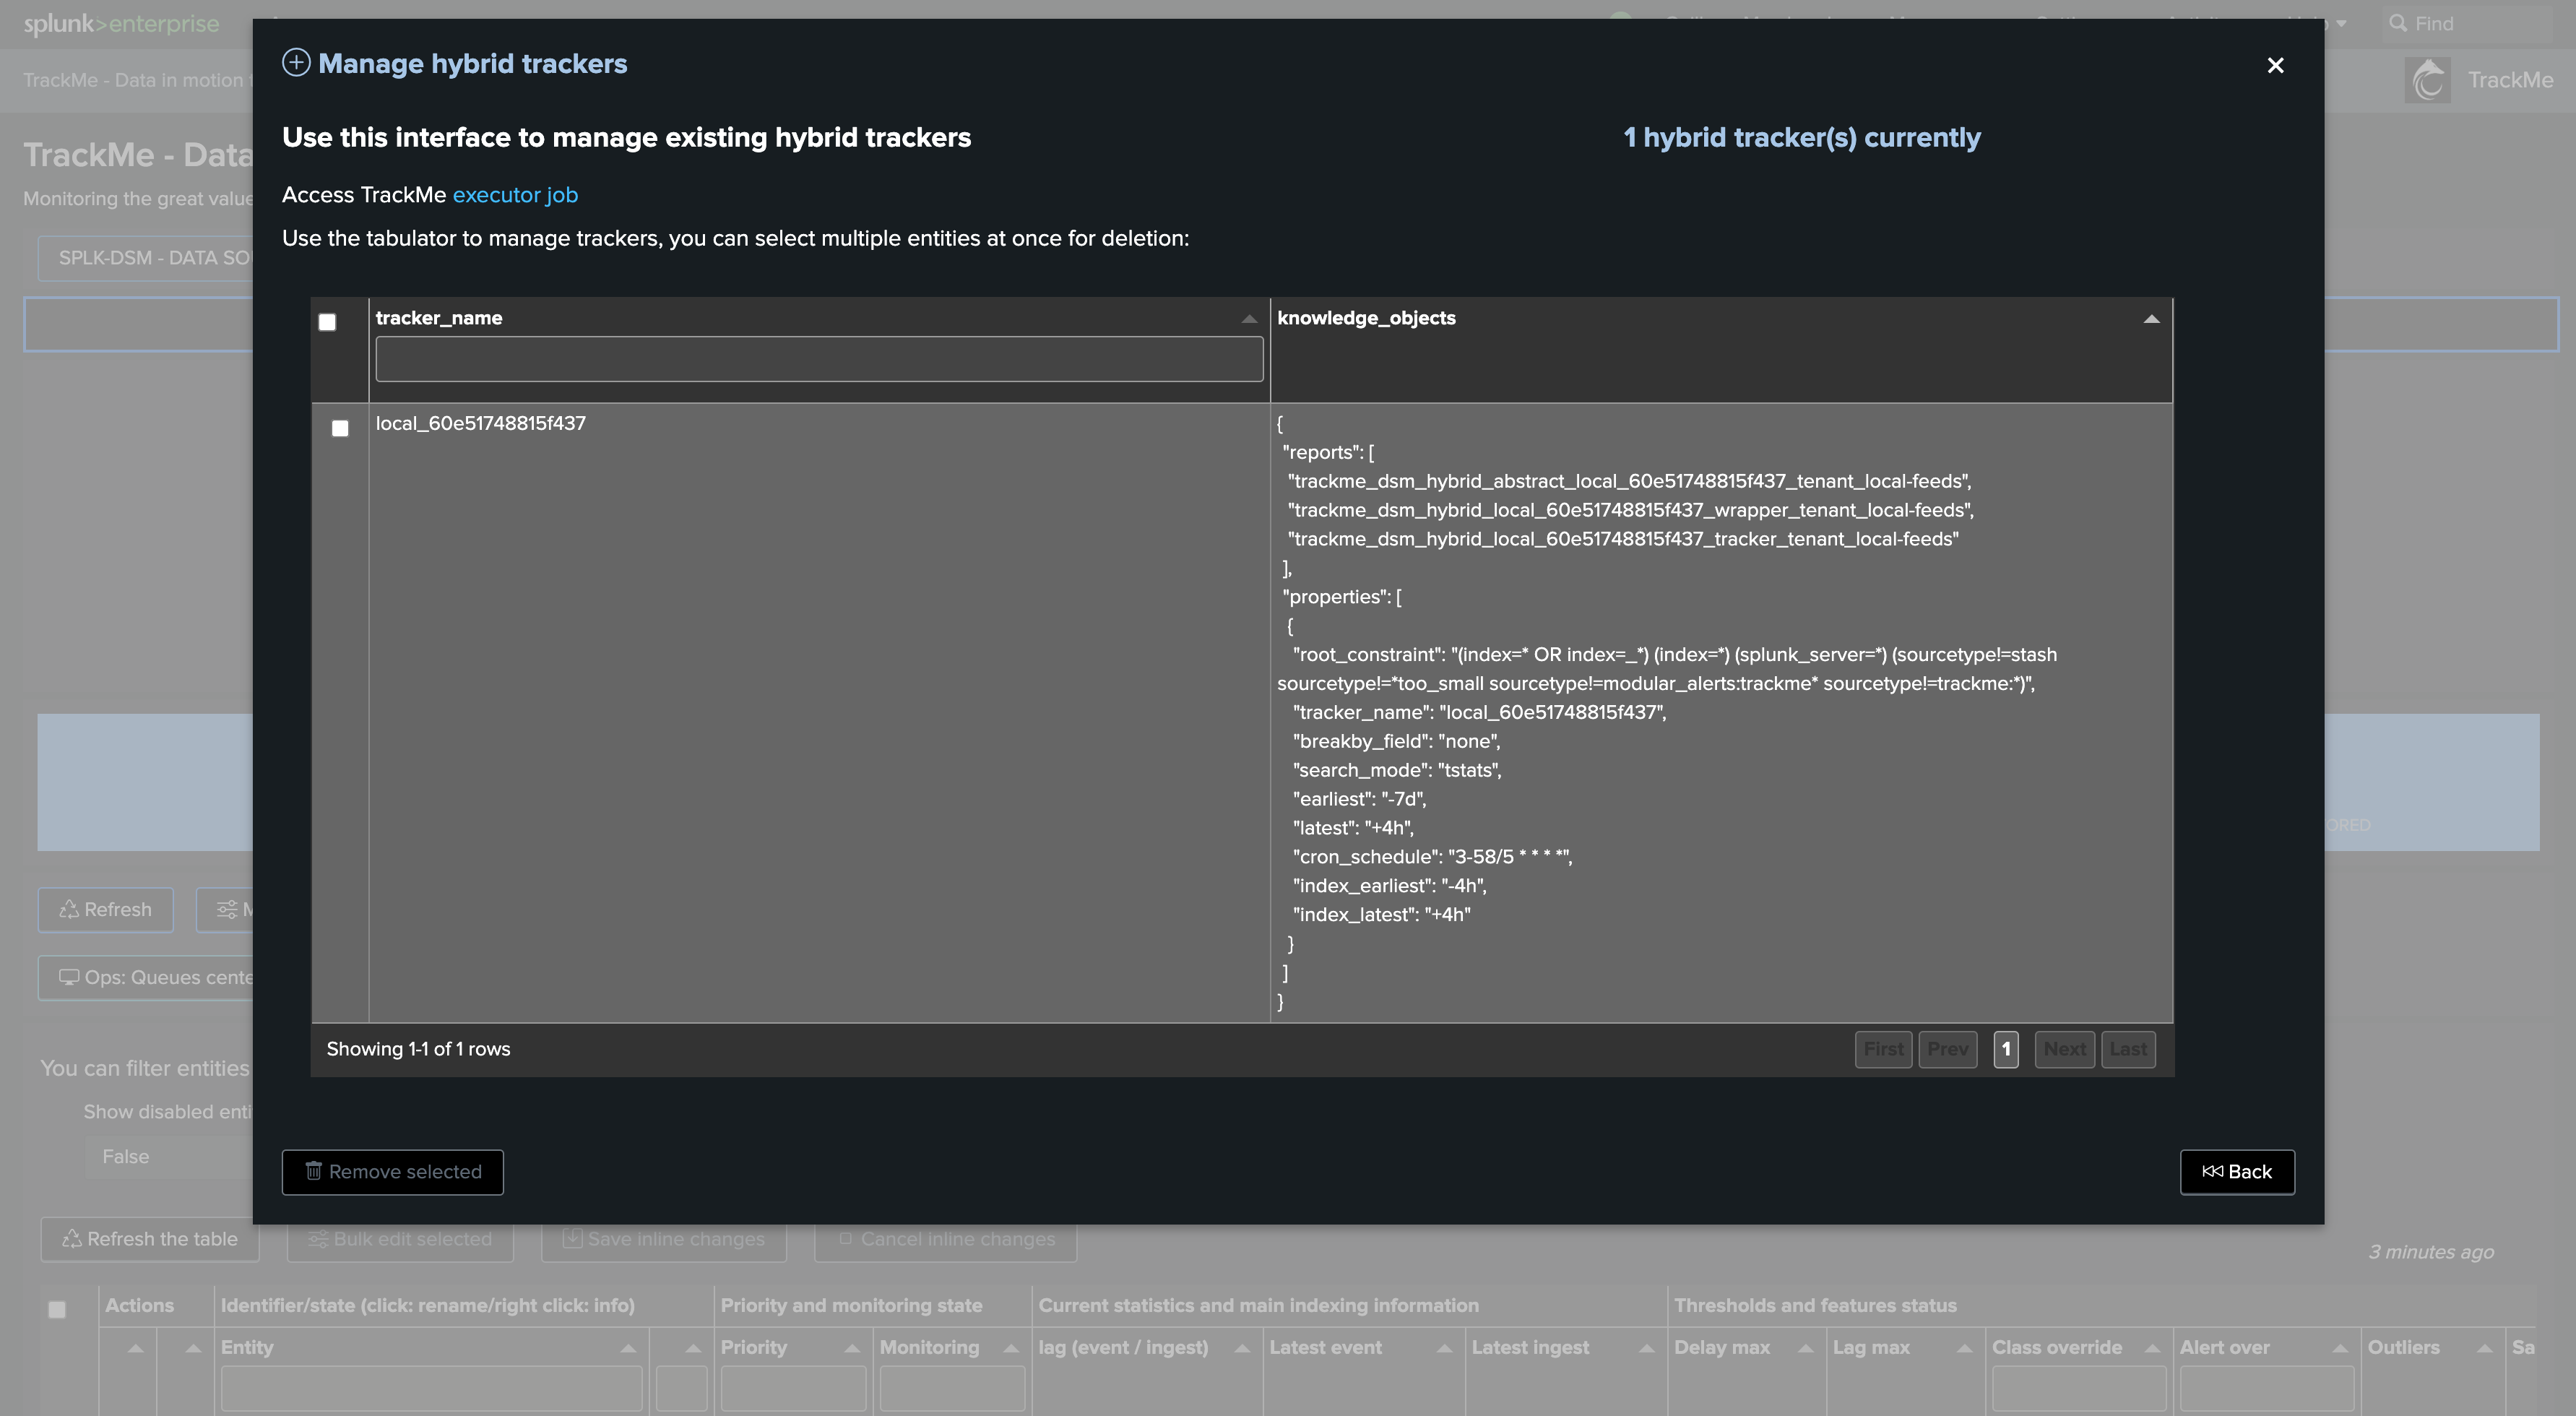
Once Hybrid Trackers have been executed at least once, and the entities are active, thresholds have been updated automatically:

6. Per Entity Thresholds
To manually define thresholds for a given entity, proceed as follows:
Open the entity main screen, and access the modification screen
On top of this screen, define the thresholds as needed
Set the override value to True if you are using lagging classes, to avoid these values from being overridden by a system-wide rule
Click on apply
Example: defining custom thresholds
In this screen, you can:
set the maximal acceptable value for latency
set the maximal acceptable value for delay
define if we should override lagging classes, if any matching (default to false, set true if needed)
define if we should alert on both KPIs (default is both), or only one of the two
7. Simulating Threshold Values
TrackMe provides a feature that allows simulating how thresholds would be breached based on your inputs.
Open the thresholds settings screen, and click on the simulate thresholds button:
Provide input values for both latency and delay thresholds
Click on simulate, TrackMe will apply these thresholds against TrackMe summary events and show an event for each breach that would result from your settings
Example:
For instance, this provider sends data to Splunk once per hour, however it does not suffer from latency when it does it:
The threshold simulation screen’s purpose is to use TrackMe summary events to simulate your settings against the historical knowledge TrackMe has accumulated, before you set these effectively.
In this example, as the data is generated once per hour, we could set up a small value for latency, and for instance 1 hour + 10 minutes of additional time for the delay:

Finally, we can click on the apply button to prefill our thresholds settings, and apply as needed.
8. Anatomy of an Entity suffering from index time Latency
In the following example, we are reviewing an entity which is suffering from latency at the ingestion time:
Some additional details:
Latency means that we receive and index events with potentially some high amounts of time between when these events were produced (based on the events timestamps) and when these were received
This may imply as well that we have delay, but not necessarily, you can receive for instance a mix of pseudo real time events and events with latency
In addition, the measures between latency and delay will differ, which is in most of the cases to be expected
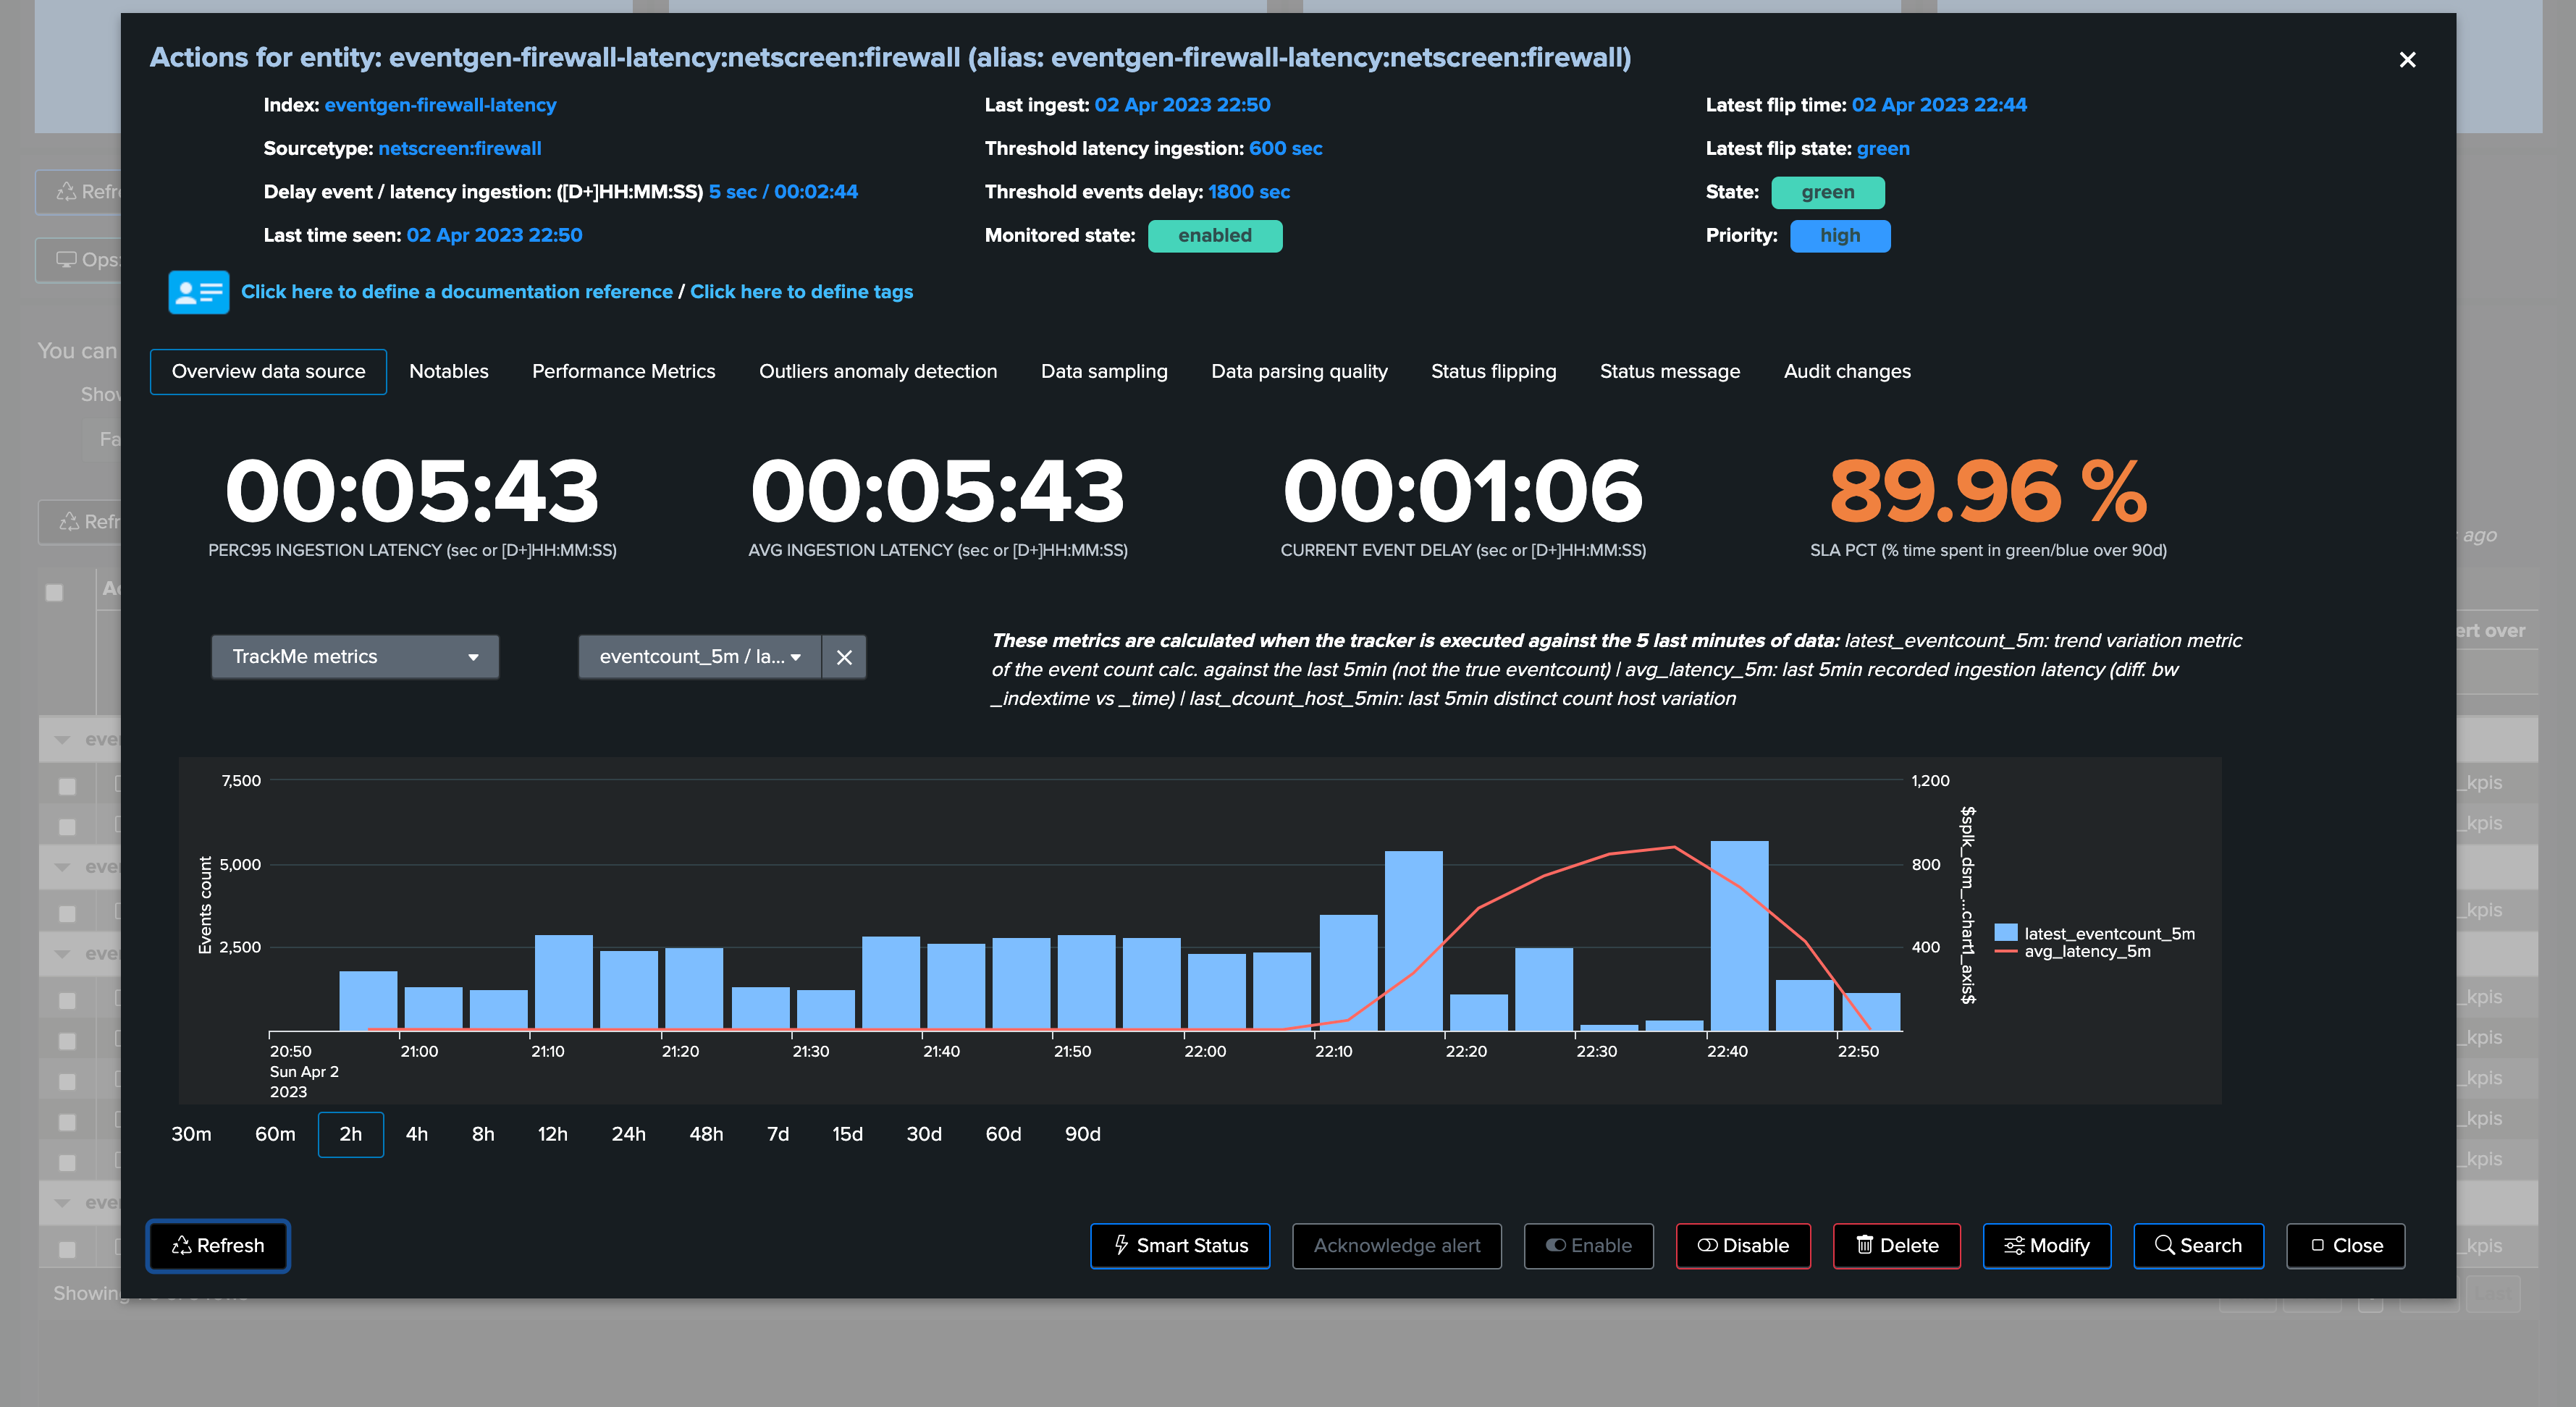
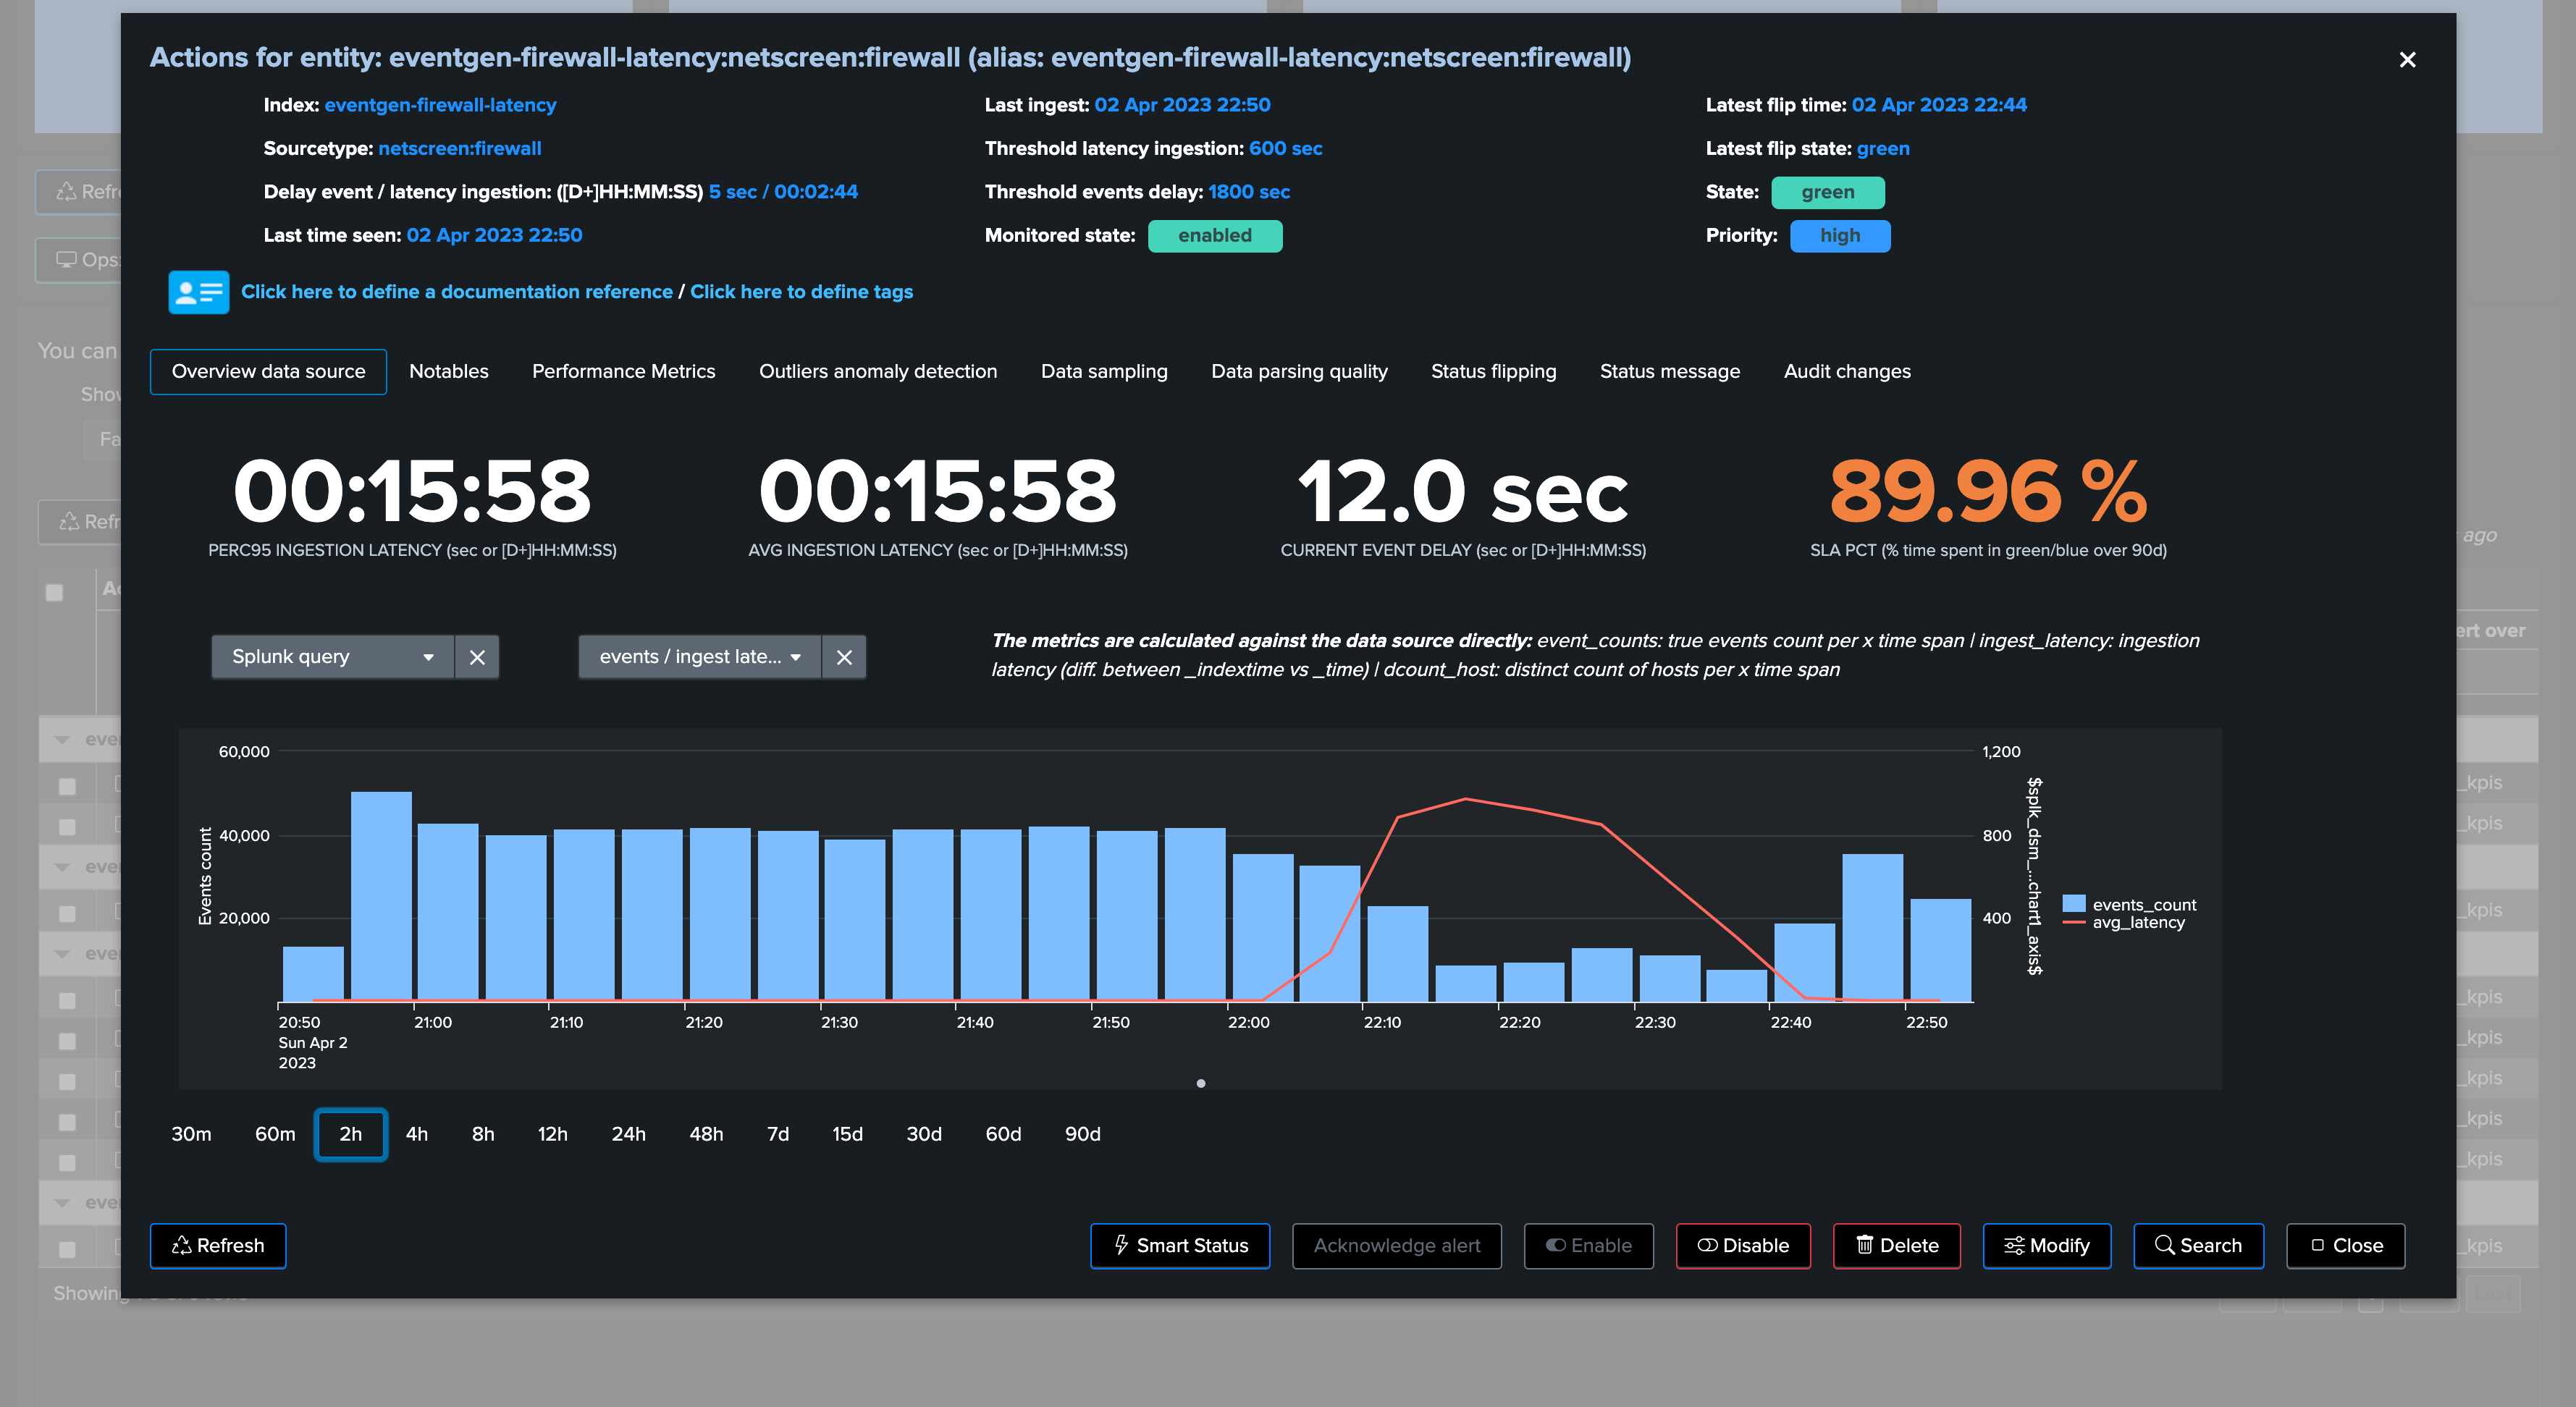
The following entity breached a pre-defined set of thresholds for delay and latency, TrackMe shows:
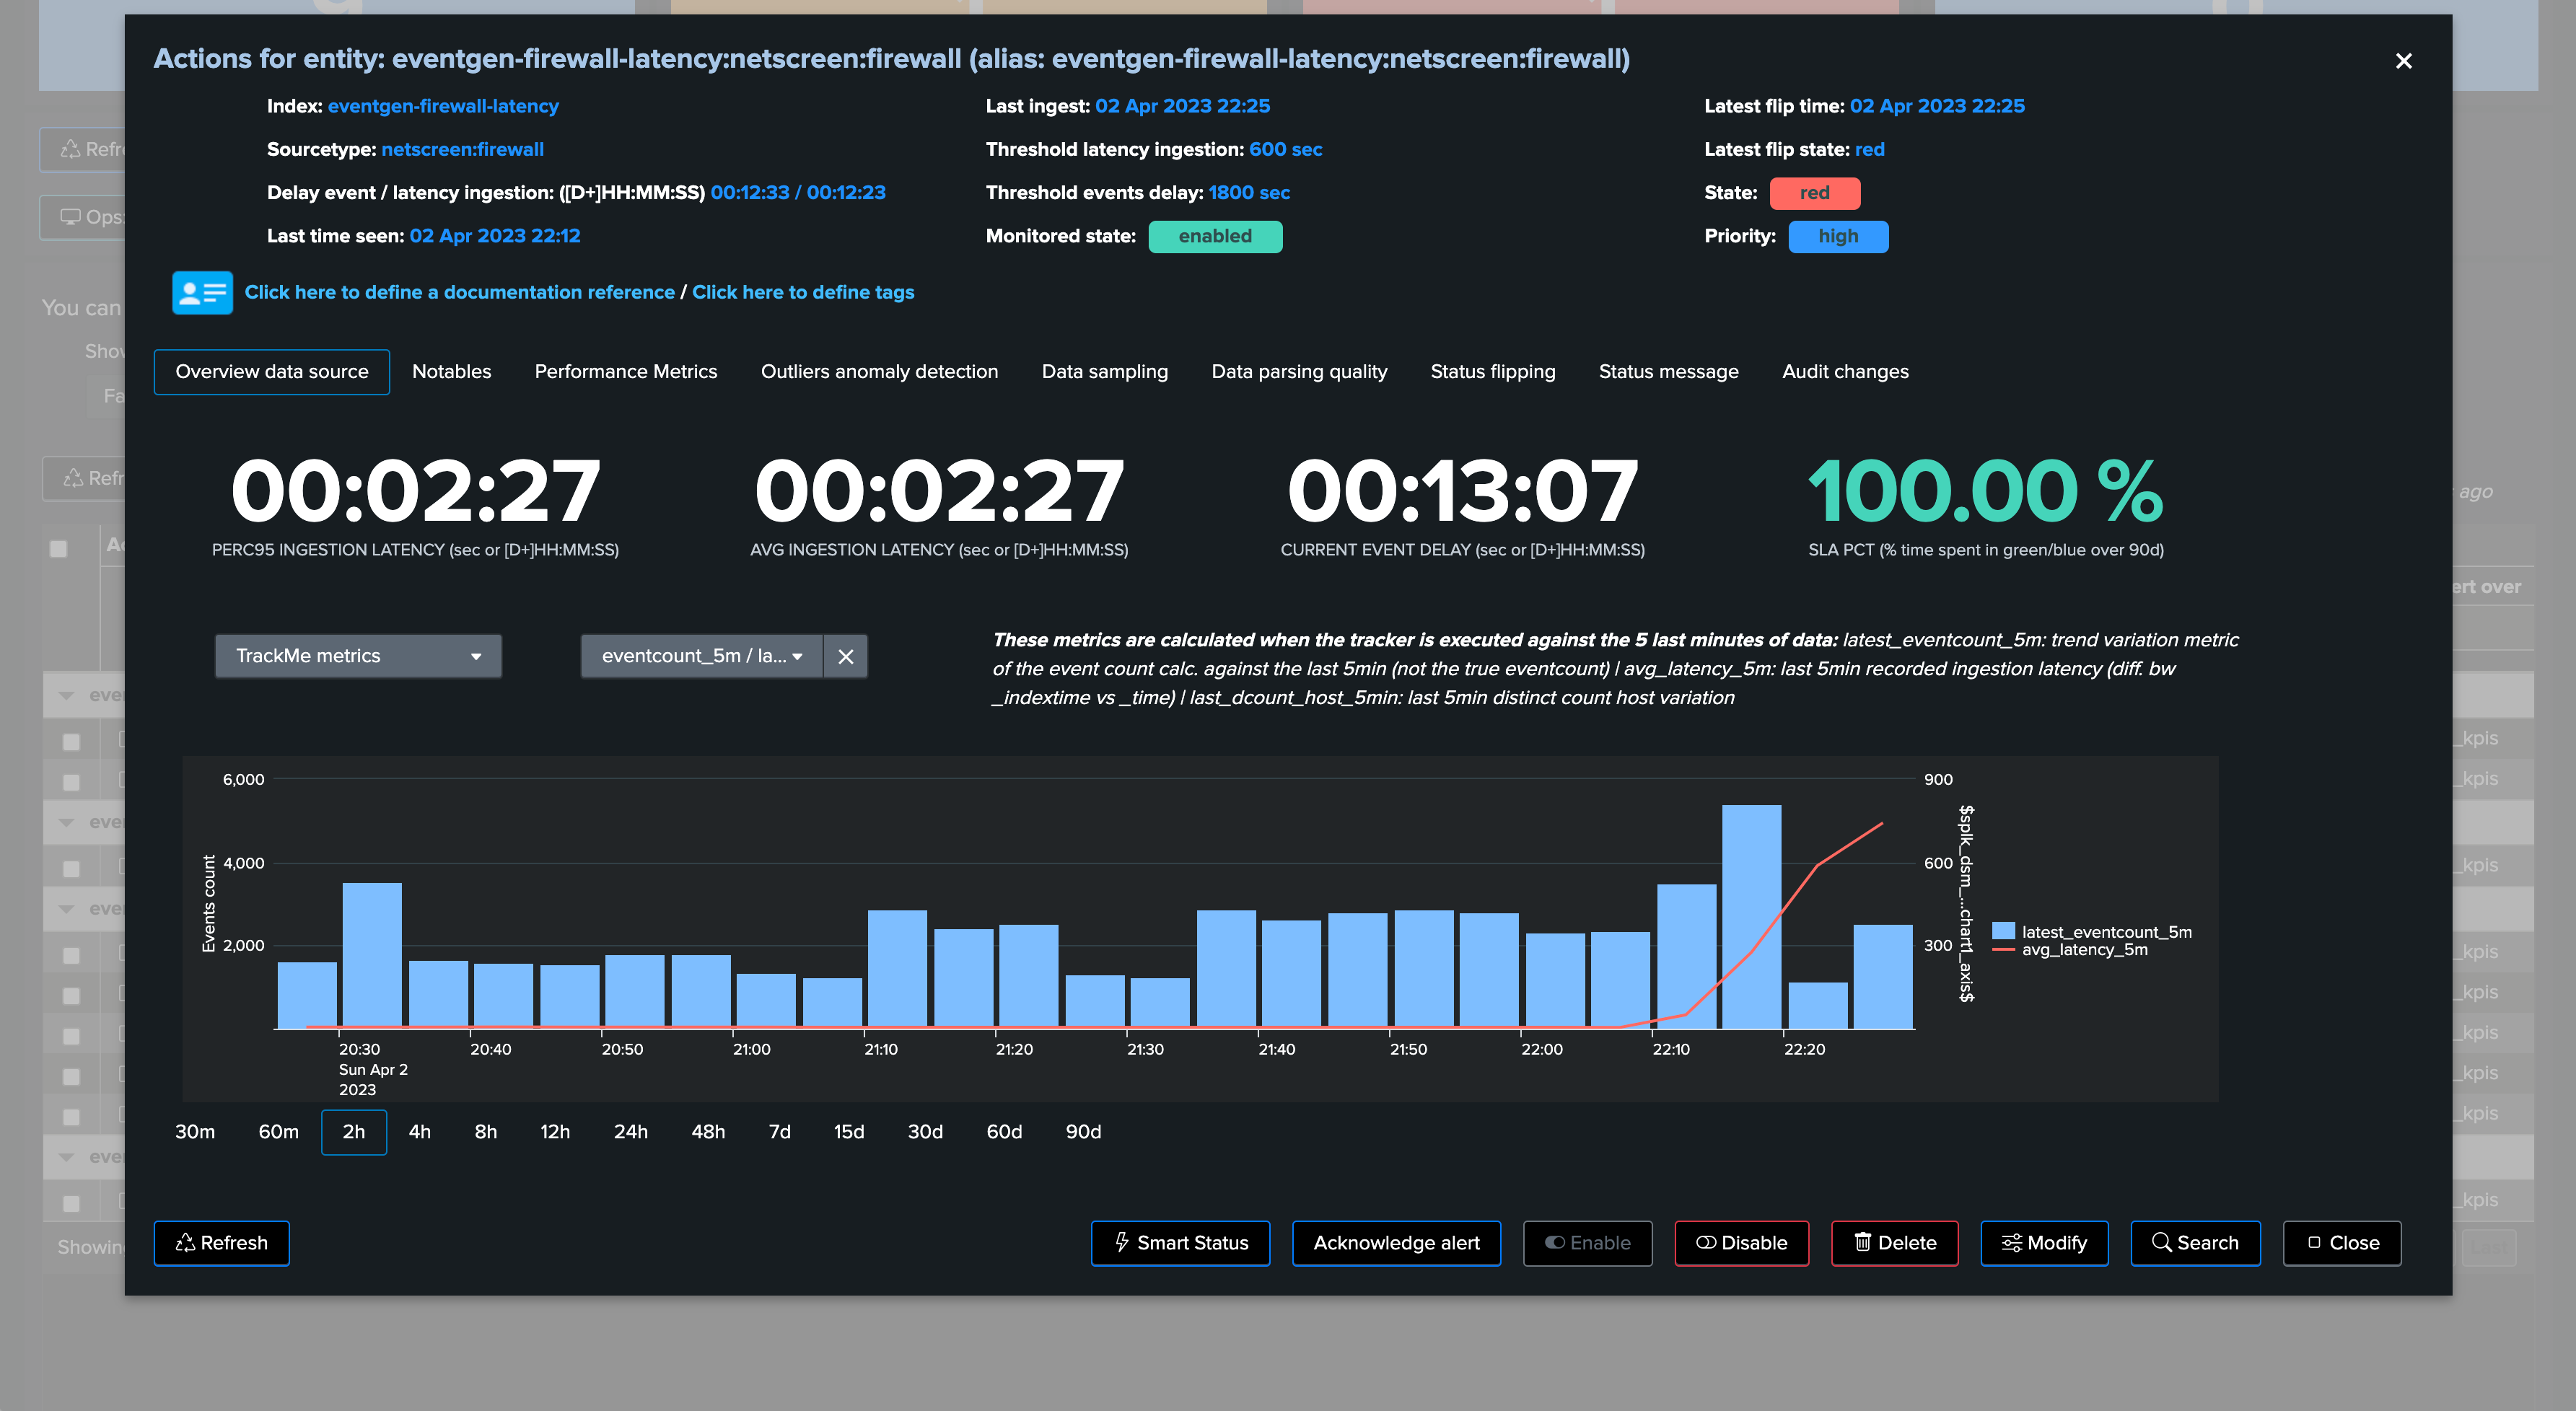
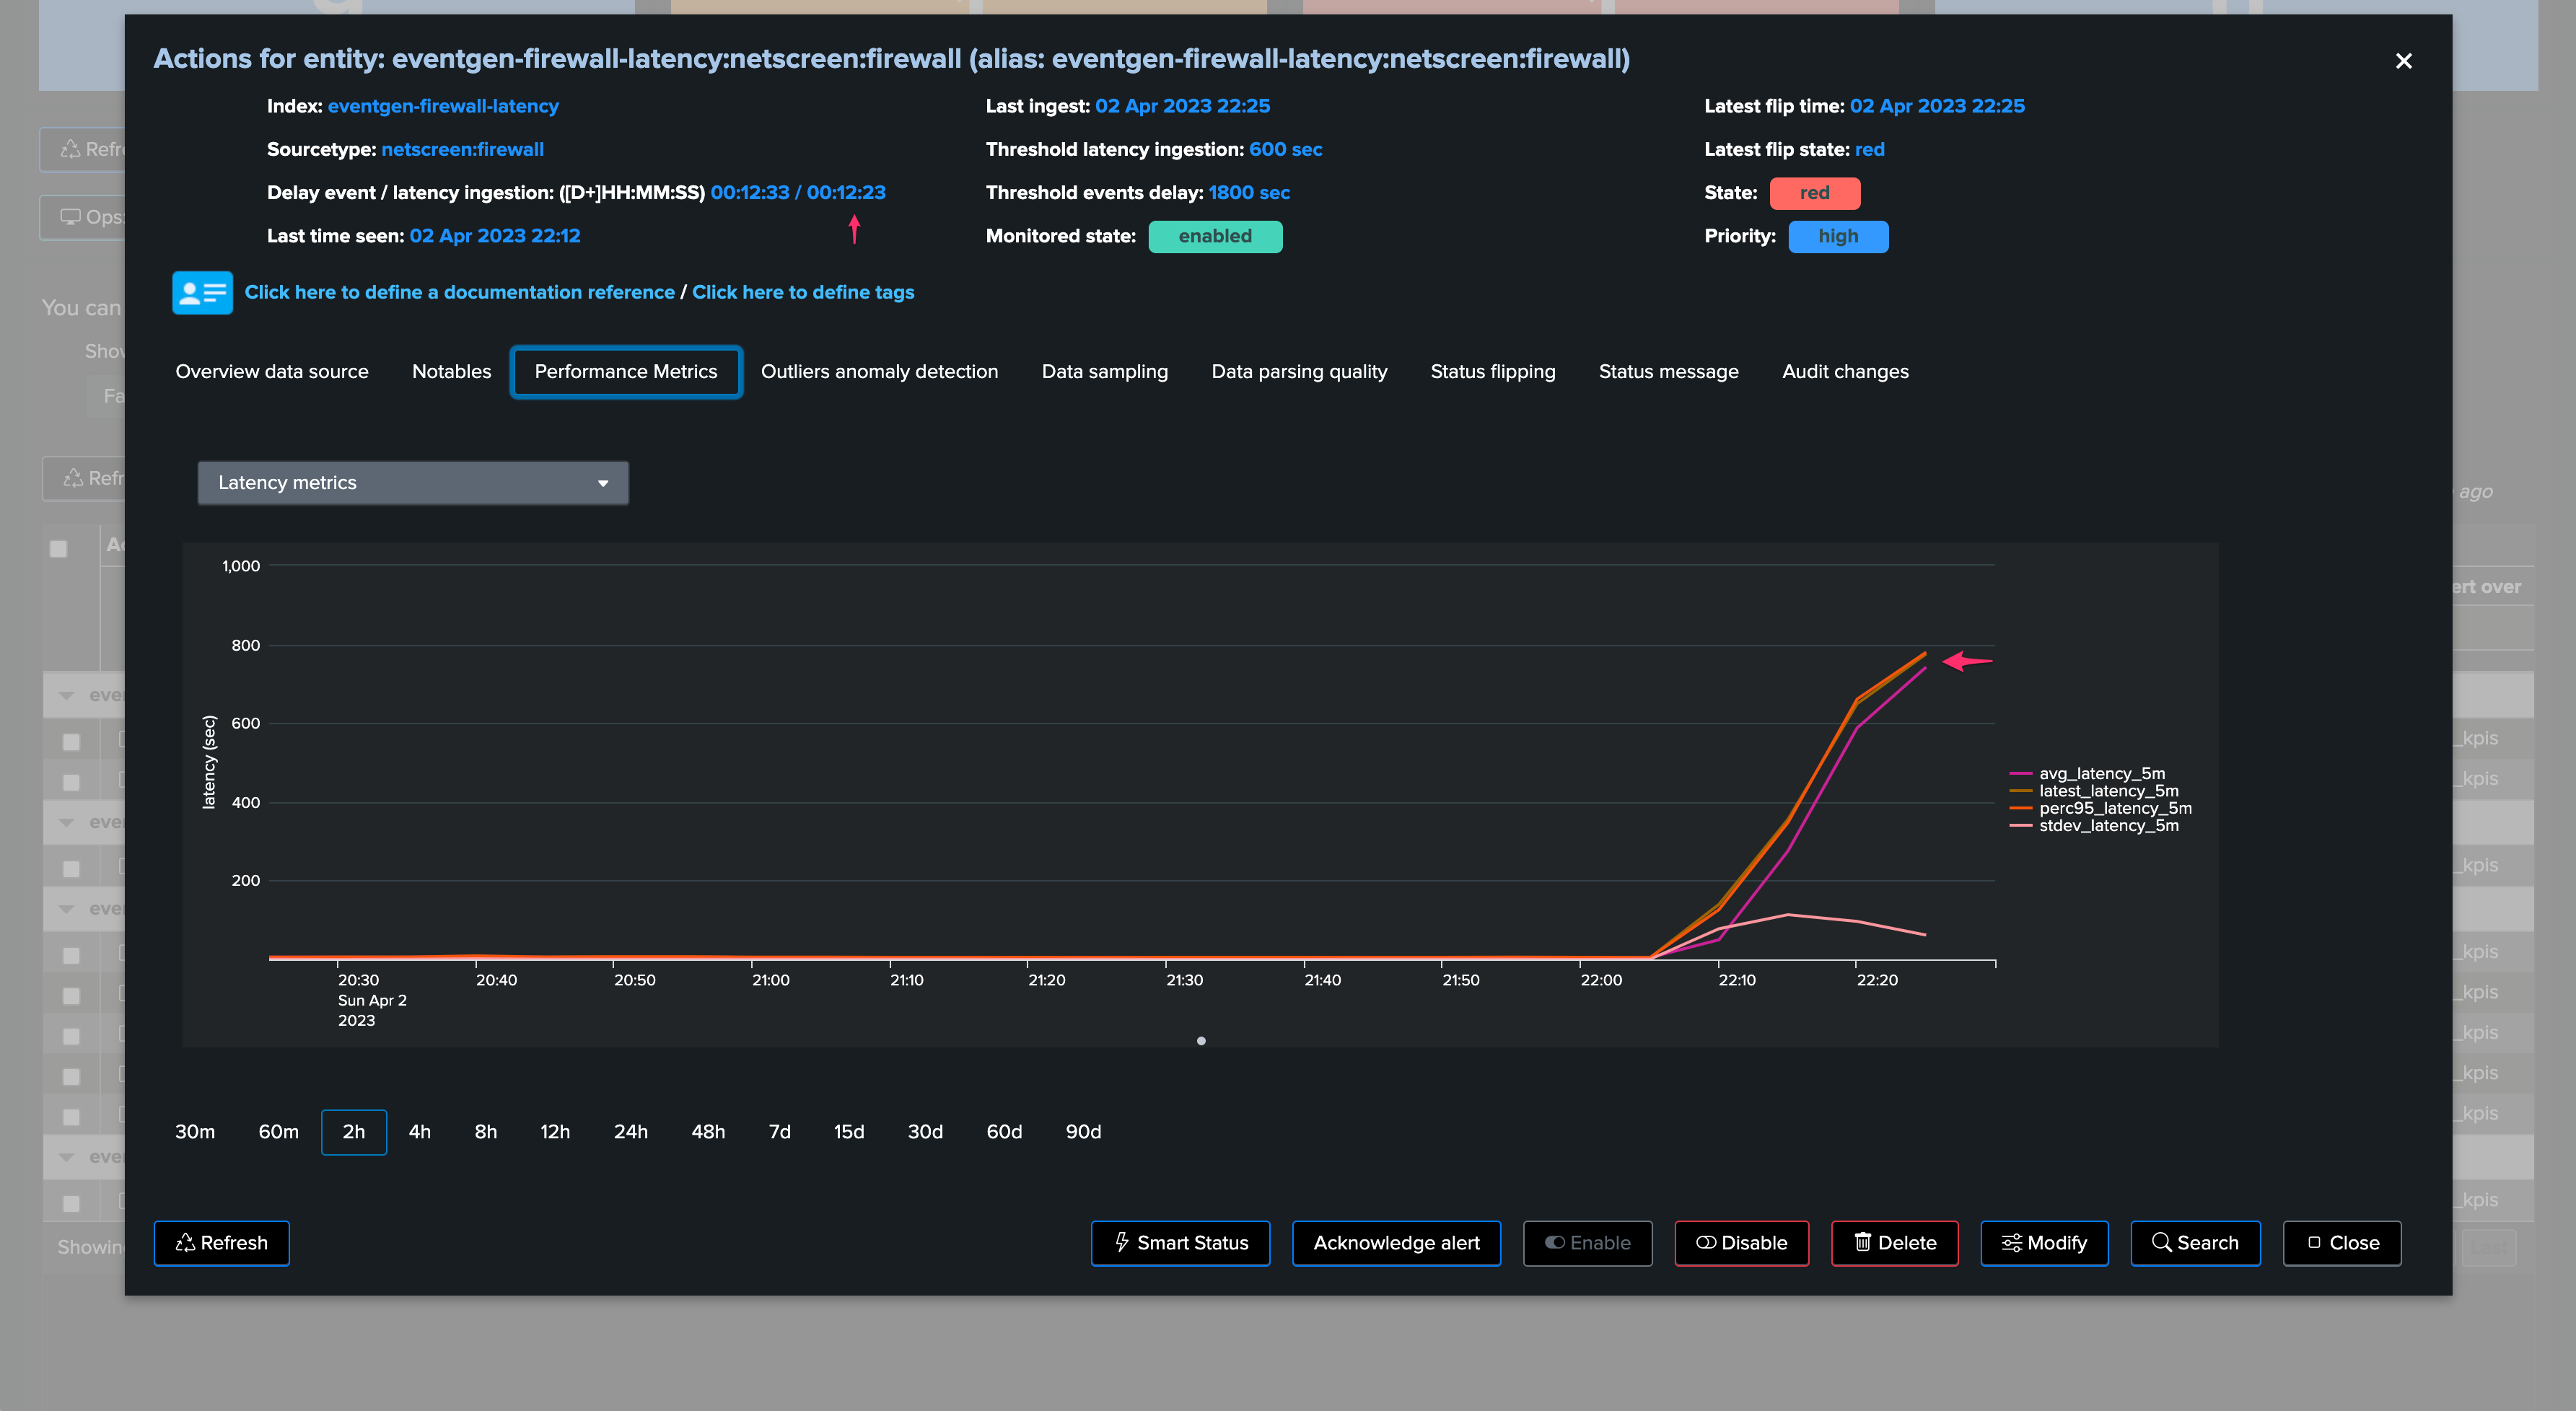
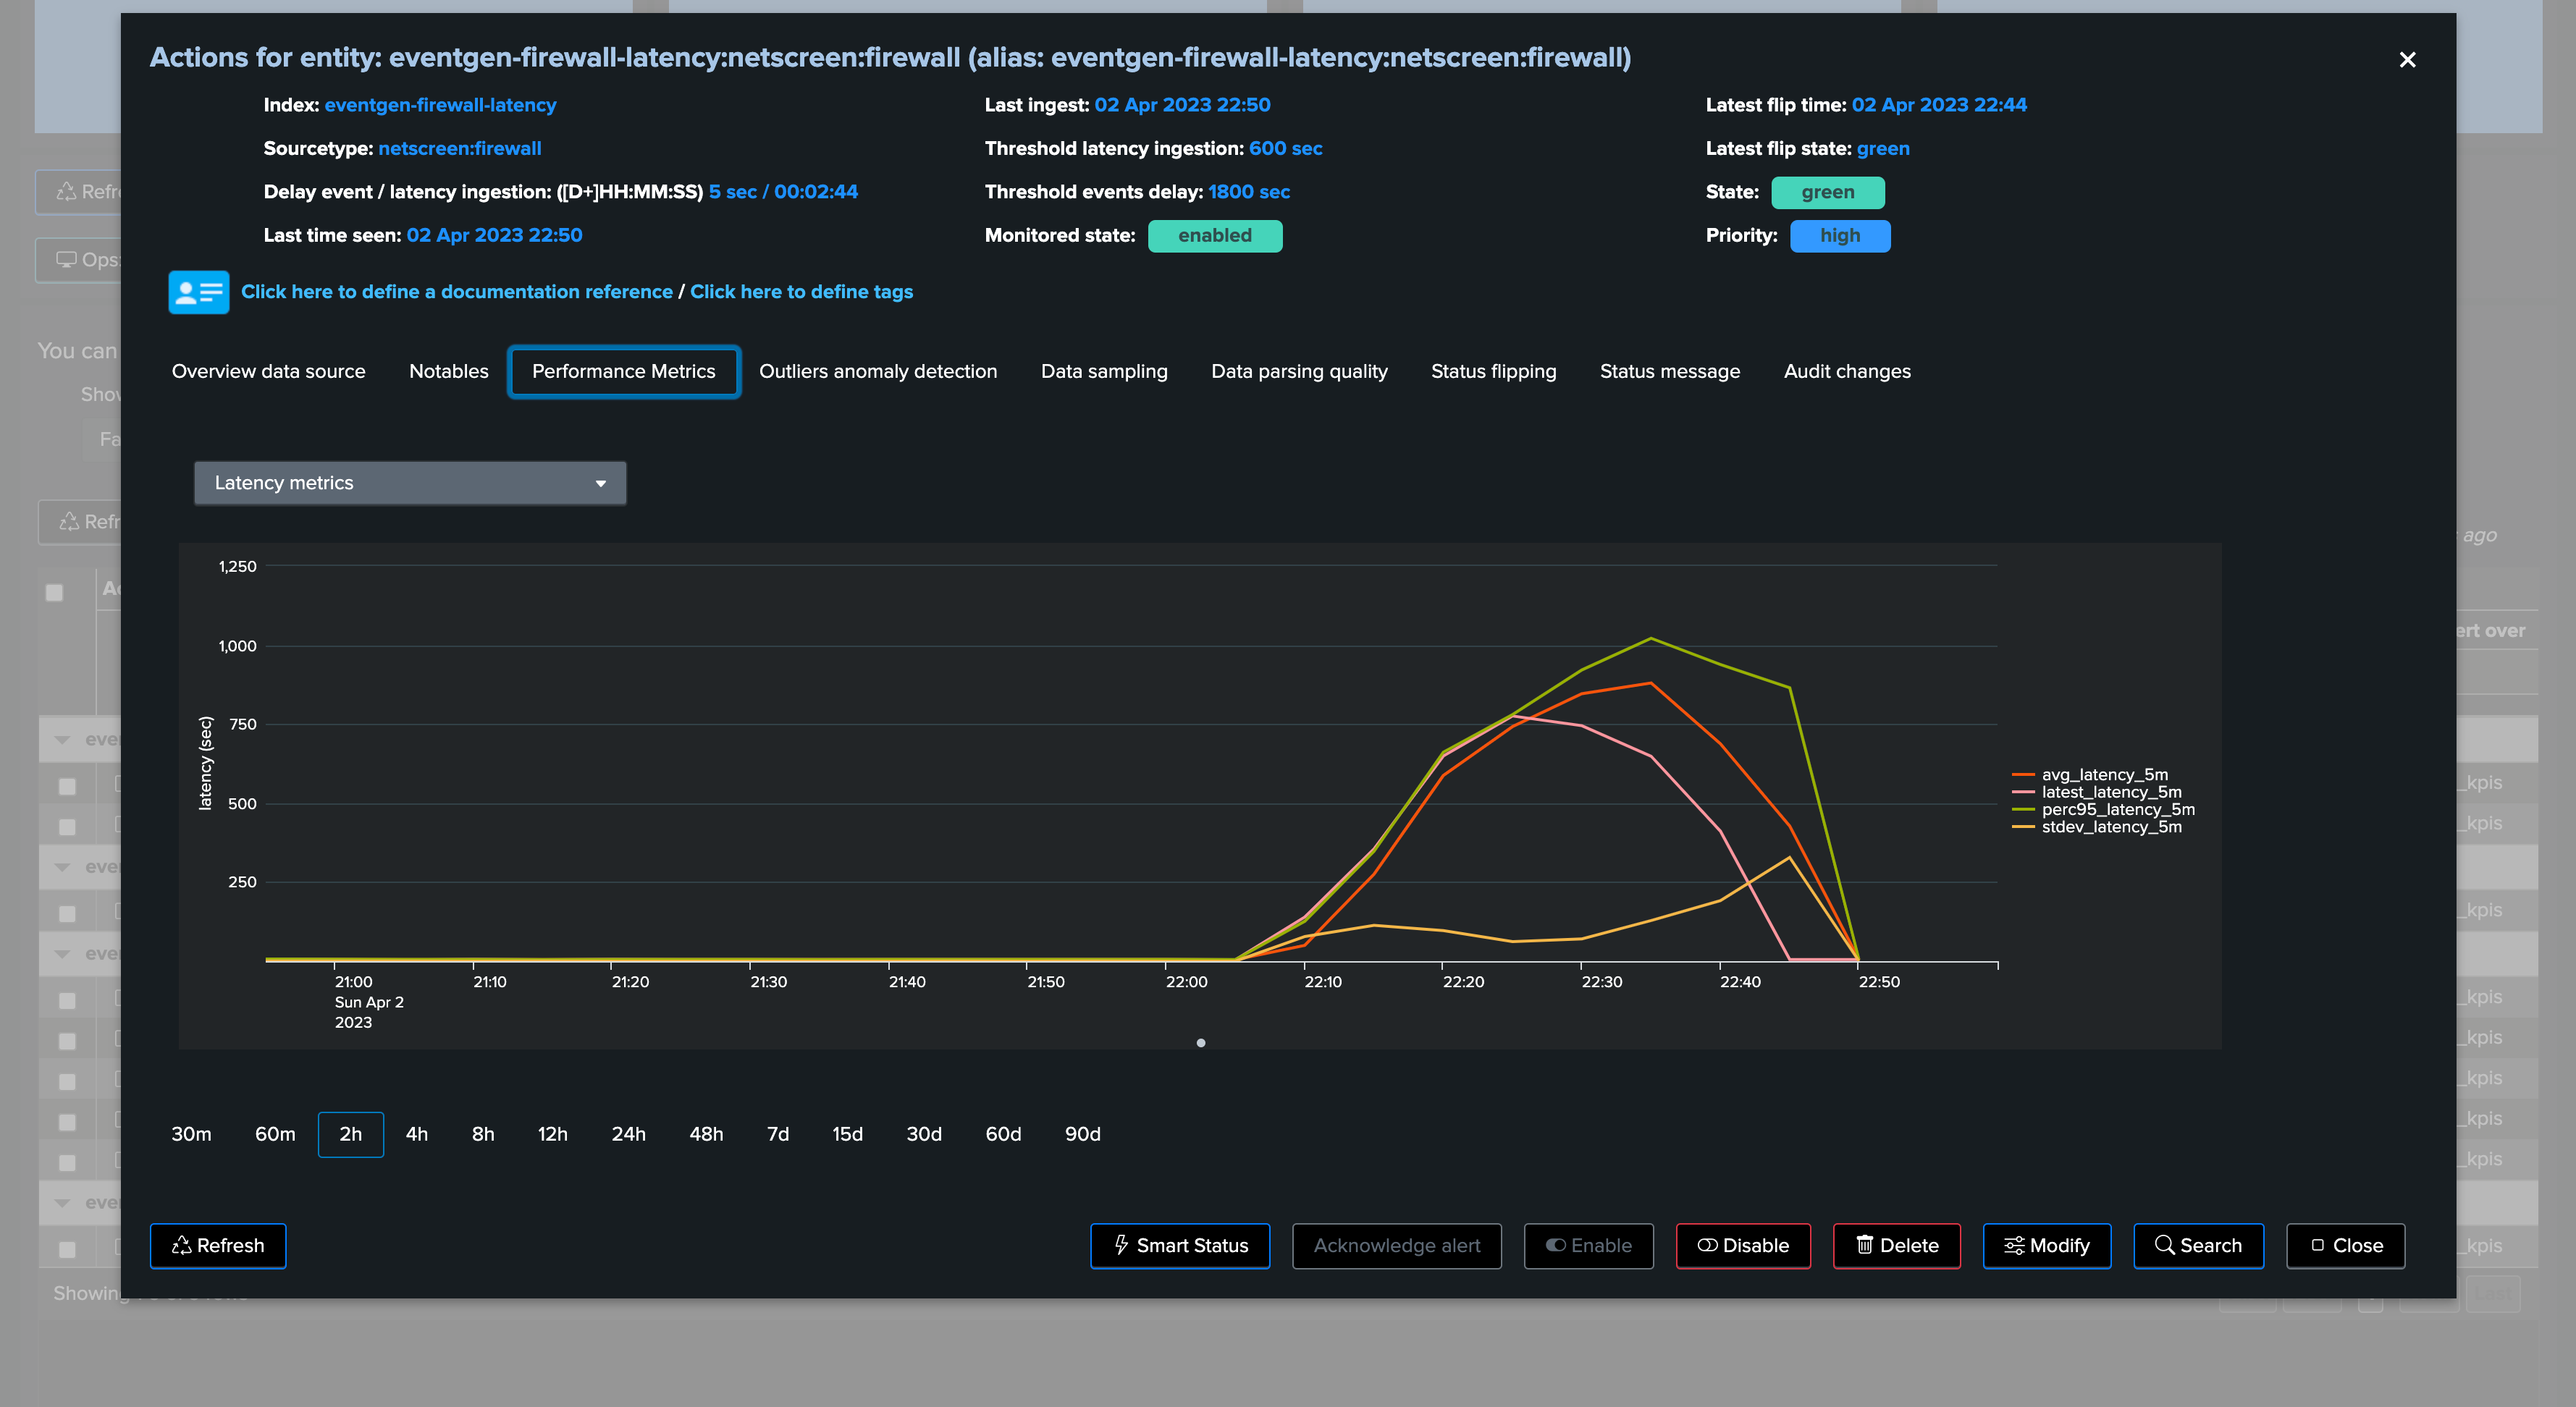
We can observe latency increasing for this entity in both the overview chart (based on TrackMe metrics and Splunk queries), as well as the Performance Metrics chart:
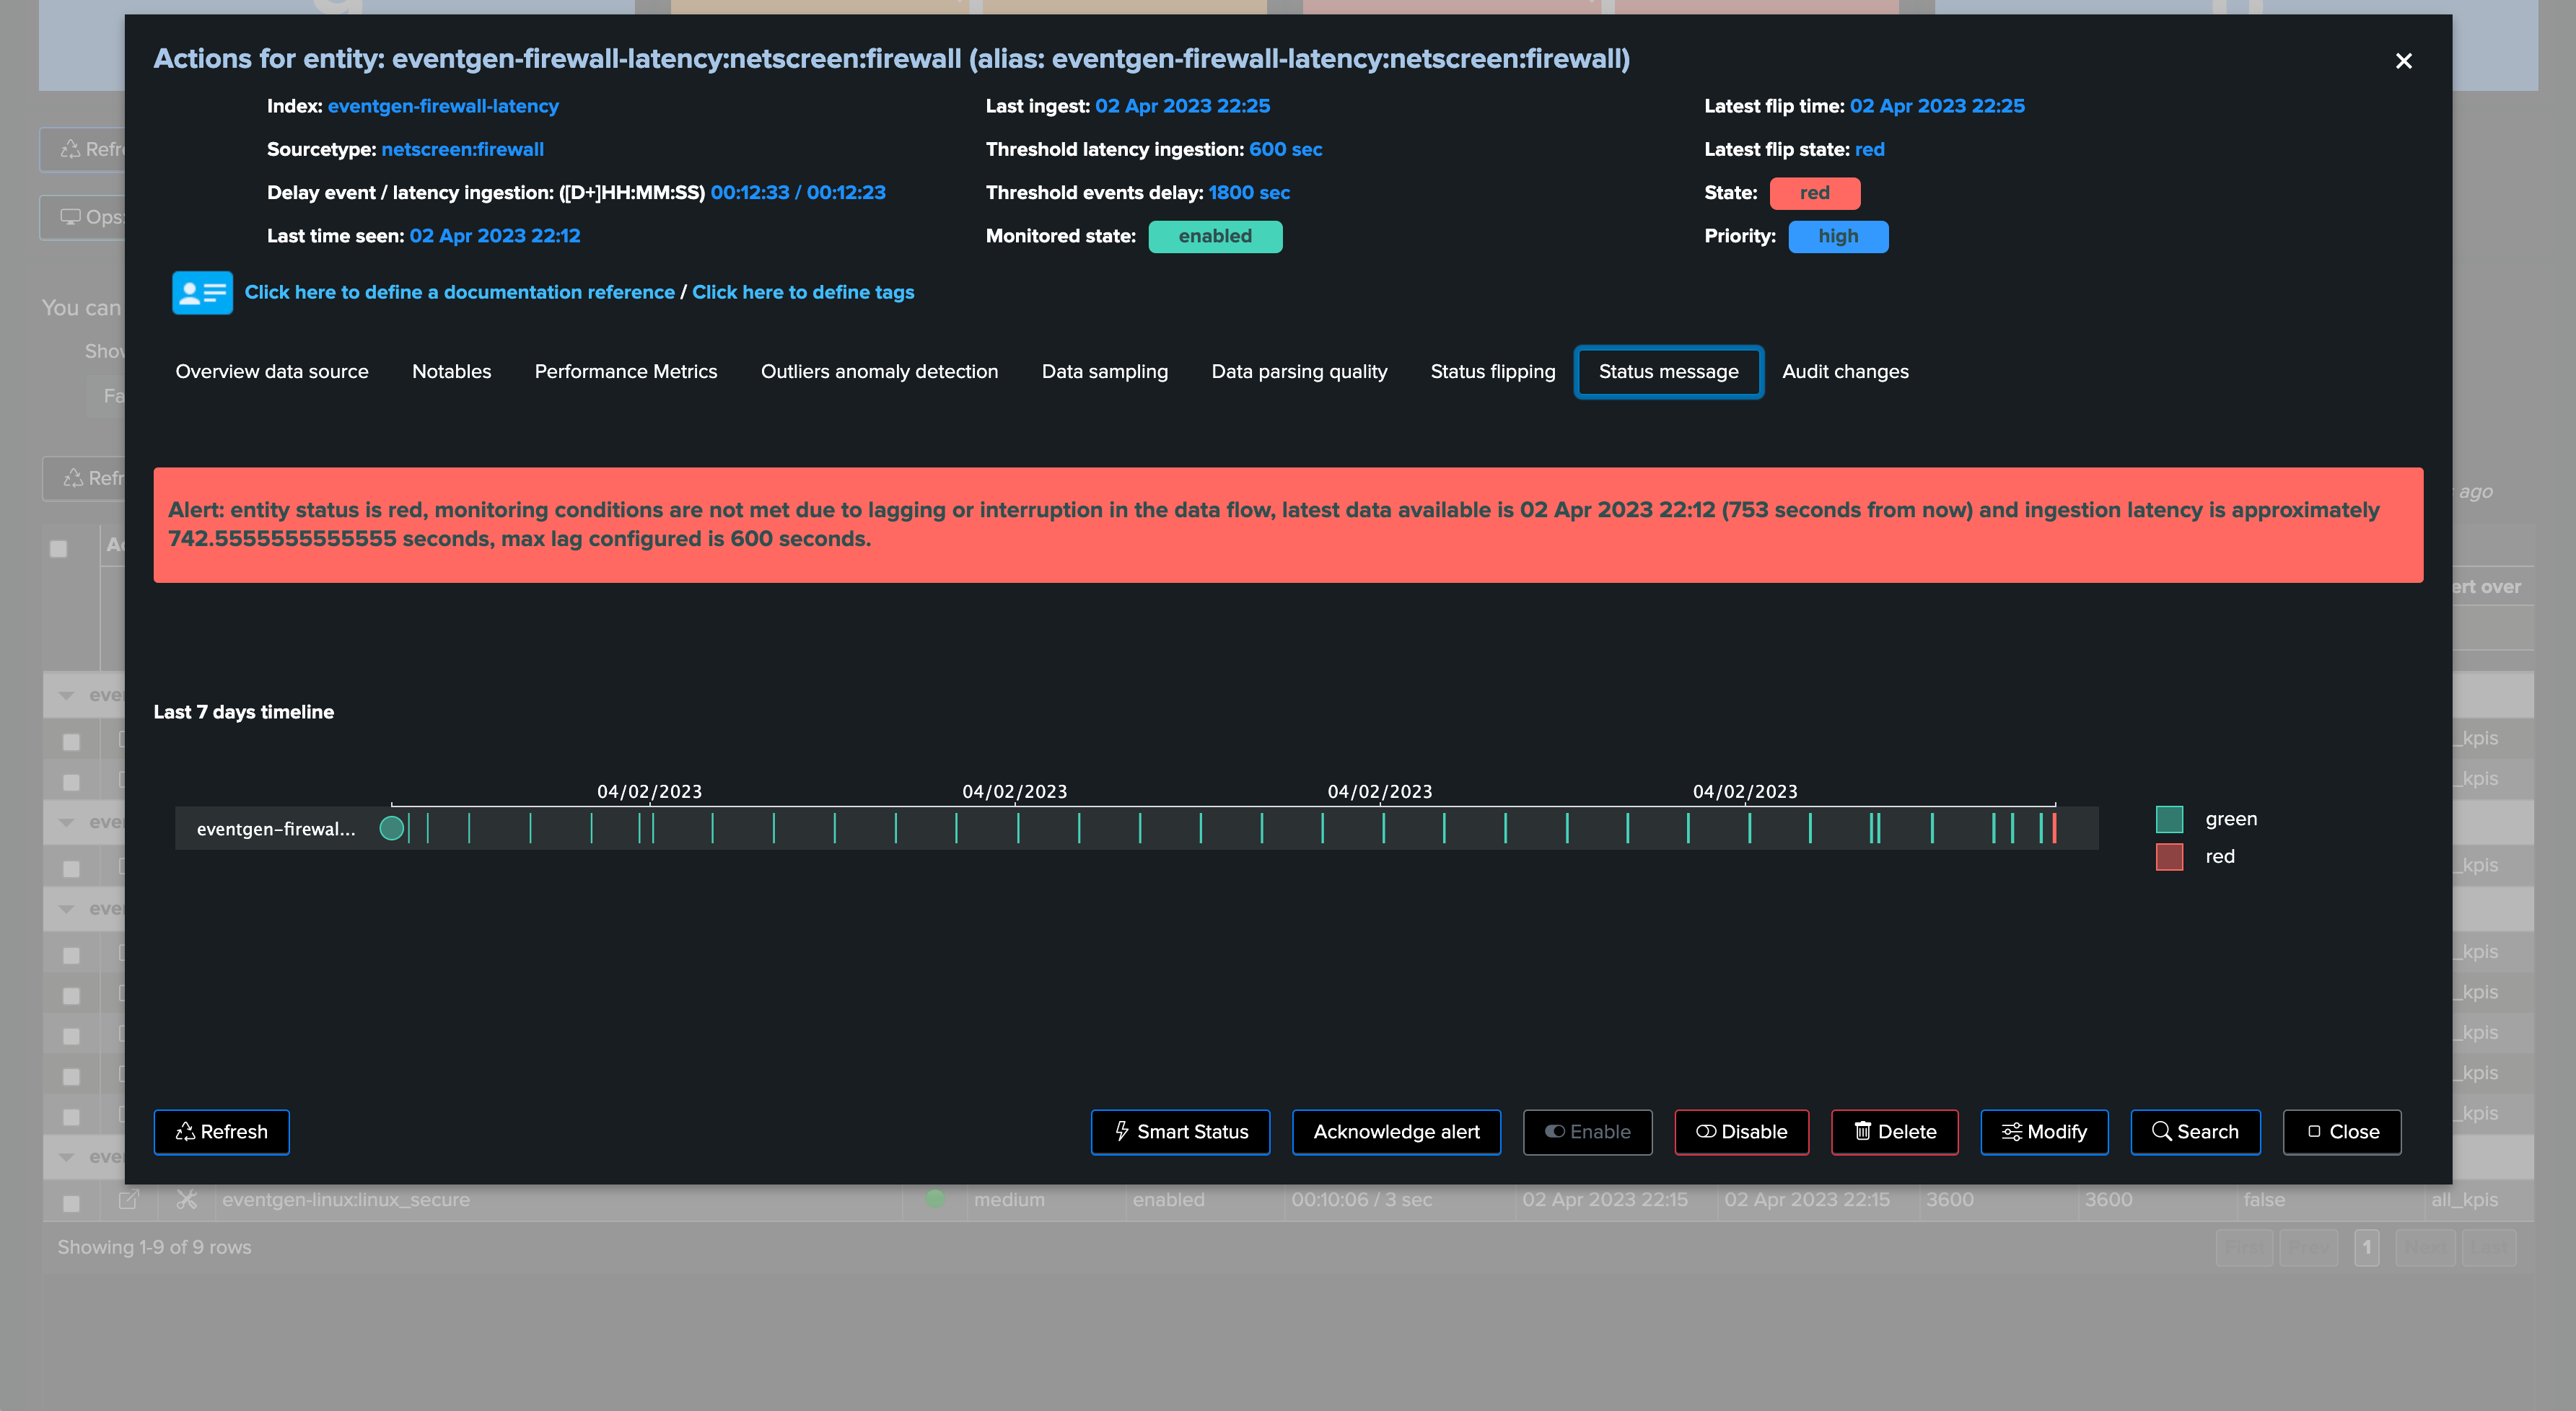
The Status Message shows a clear explanation about the issue that affects the entity:
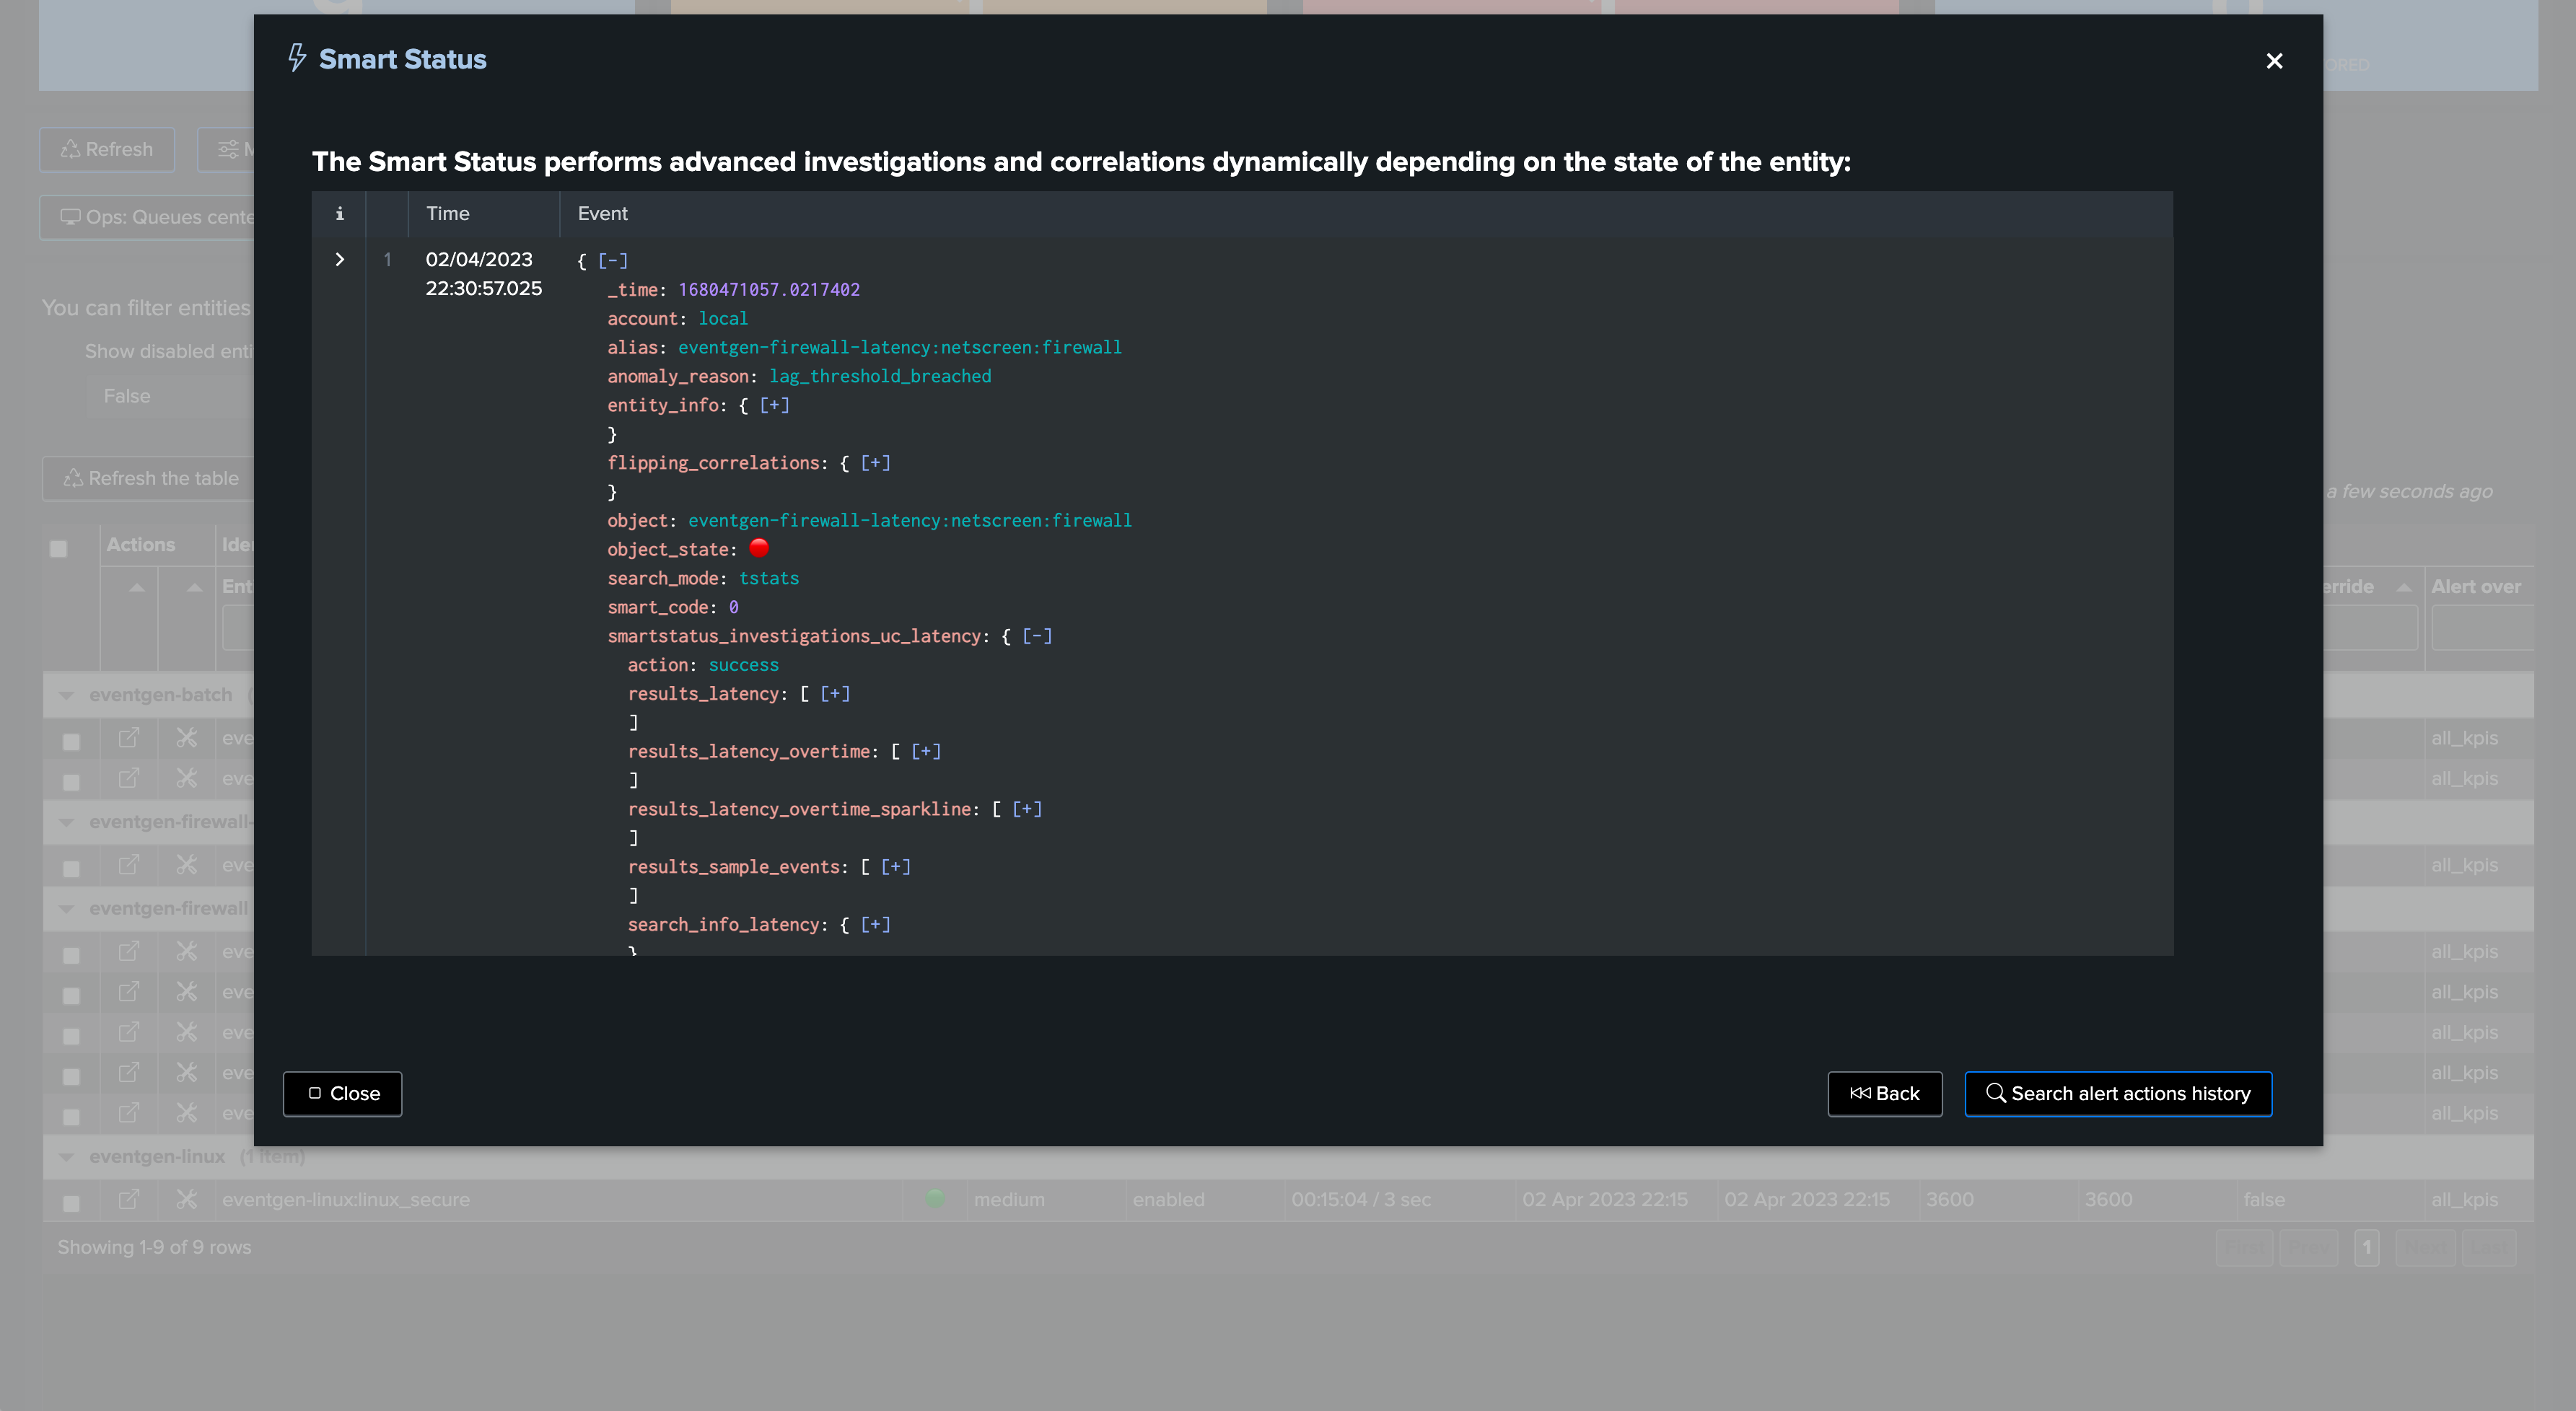
The Smart Status function provides automated investigations too:
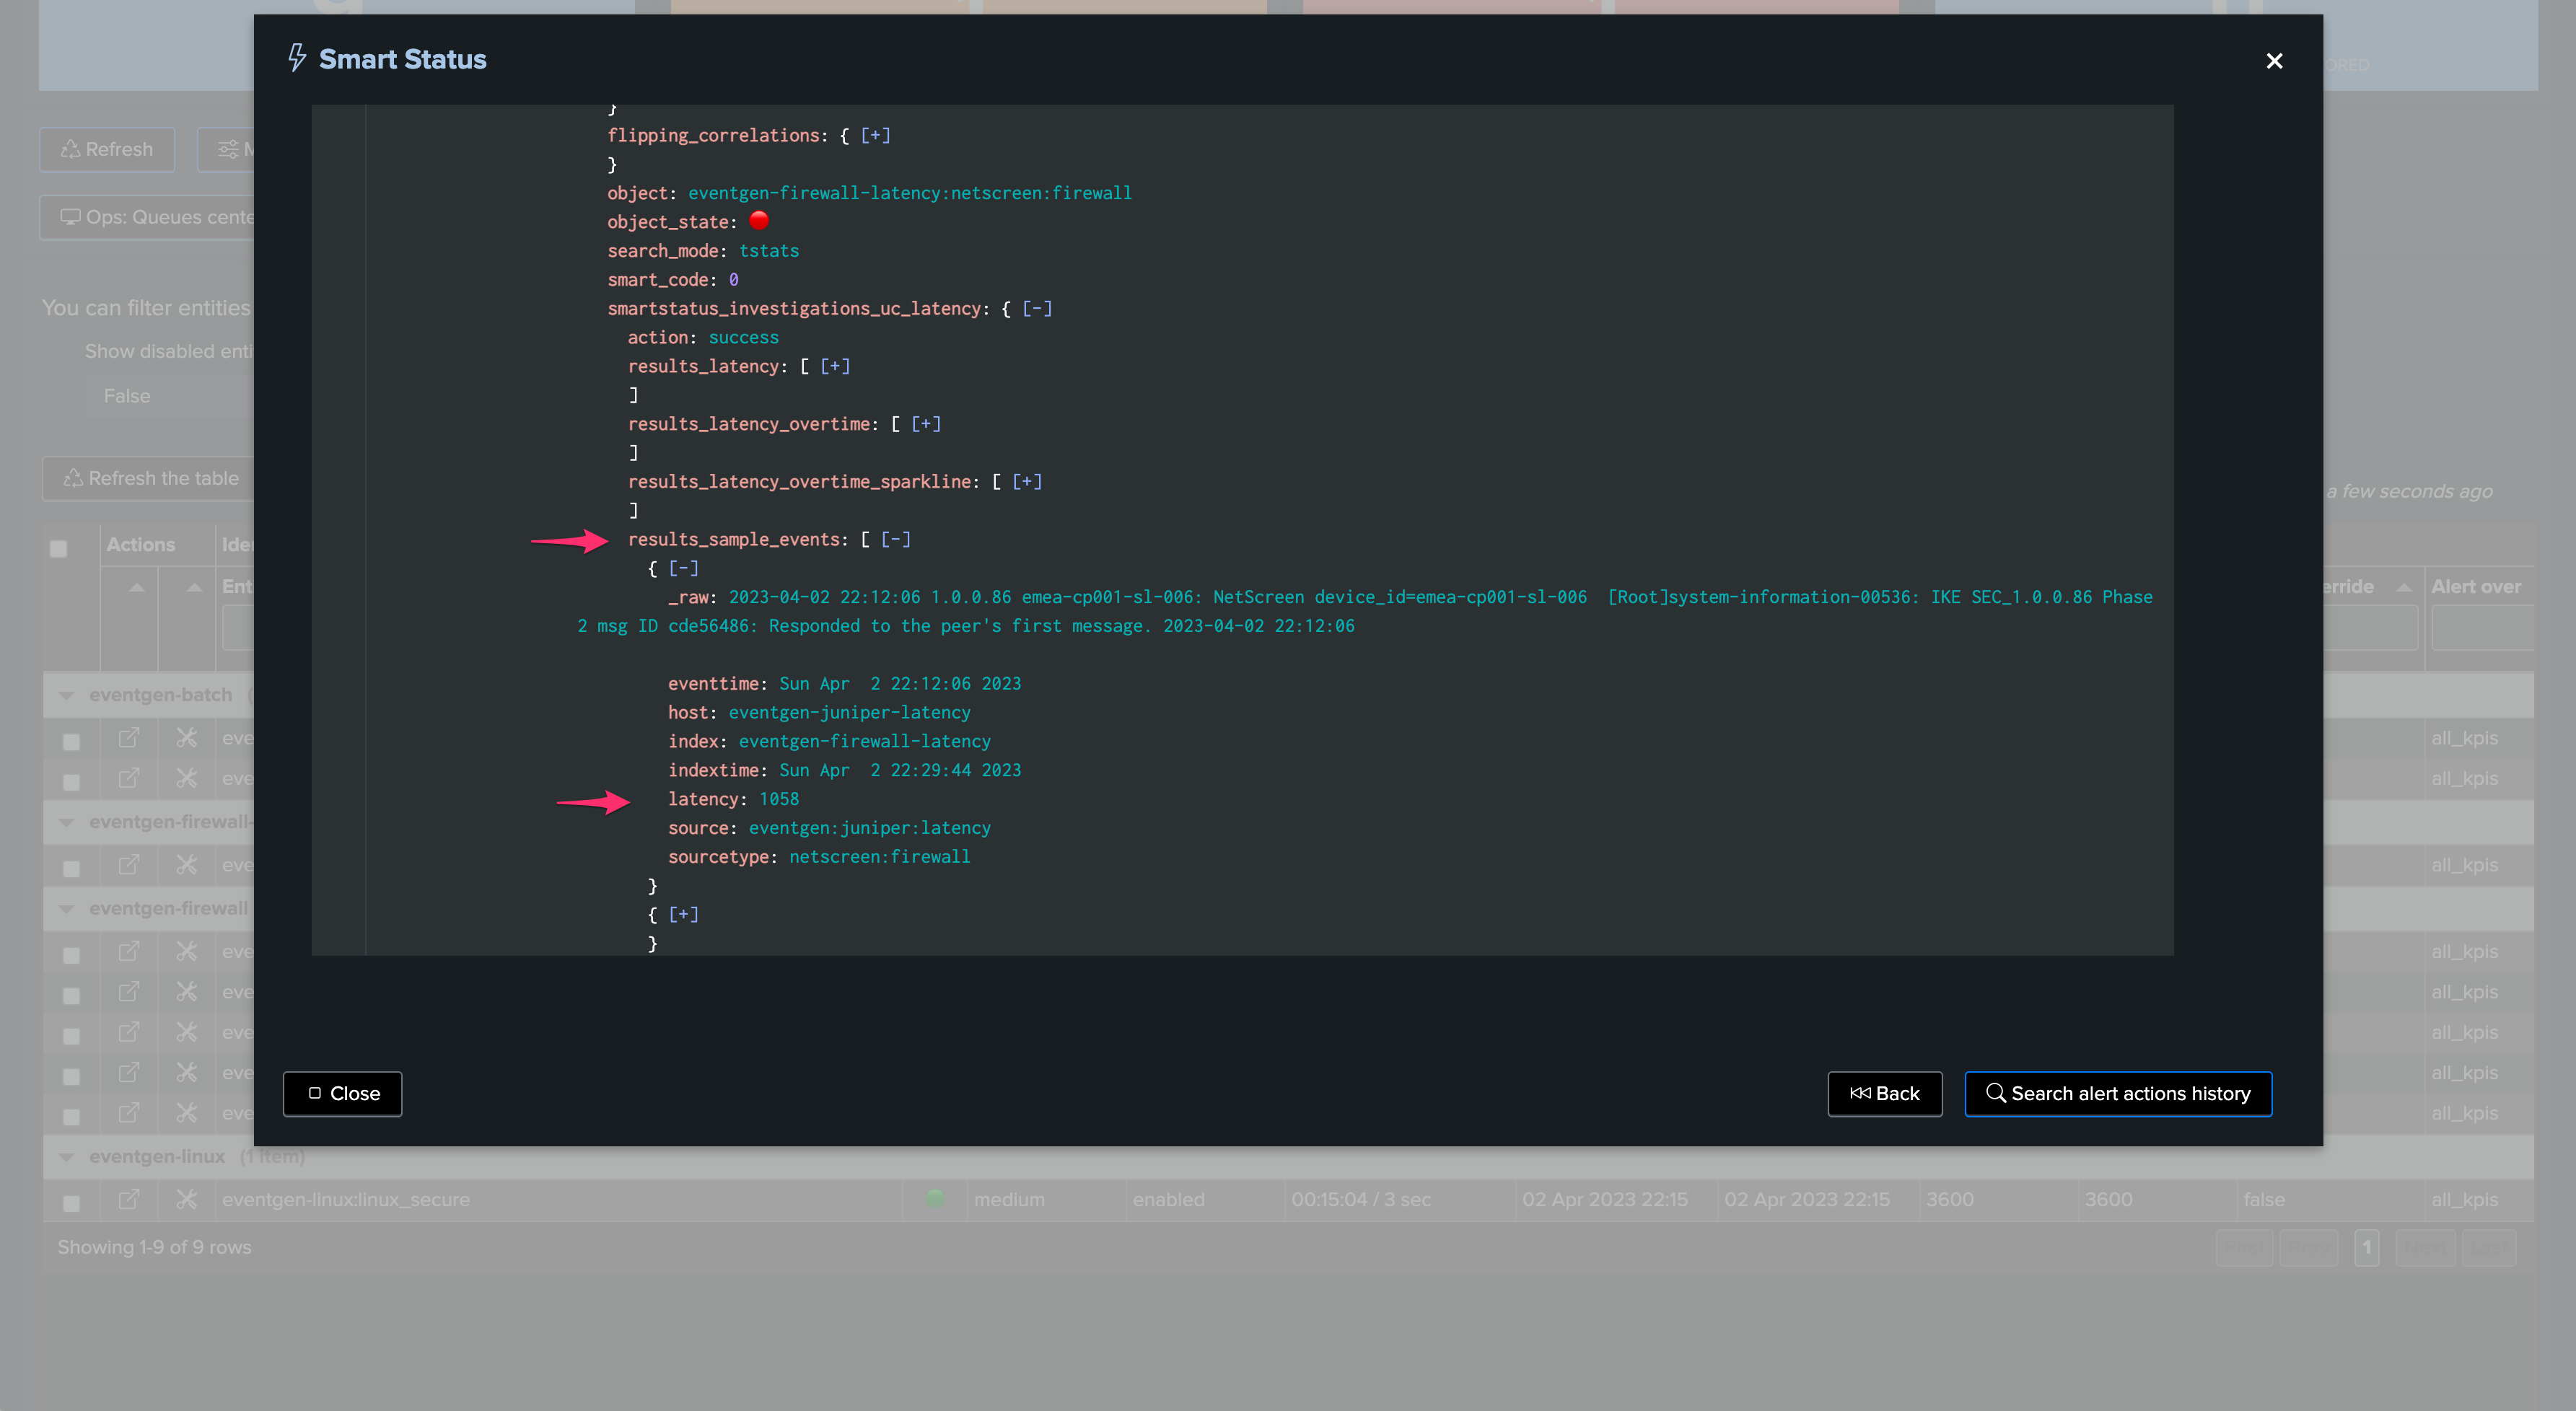
Shall we want to manually review events with latency, for instance searching for events indexed with more than 15 minutes of latency during the past 4 hours of indexed data with events within the past 4 hours:
index=myindex sourcetype=mysourcetype _index_earliest="-4h" _index_latest="+4h" earliest="-4h" latest="+4h"
| eval indextime=_indextime, latency=(_indextime-_time)
| where latency>900
| eval indextime=strftime(indextime, "%c")
| table _time indextime latency _raw
Once the issue is addressed and the root cause was fixed, and the latency is back to acceptable thresholds, TrackMe will return the entity status back to green after some time:
TrackMe metrics view:
Splunk query view:
Performance metrics tab:
9. Anatomy of an Entity with Delay with no Latency
Batch data once per day example
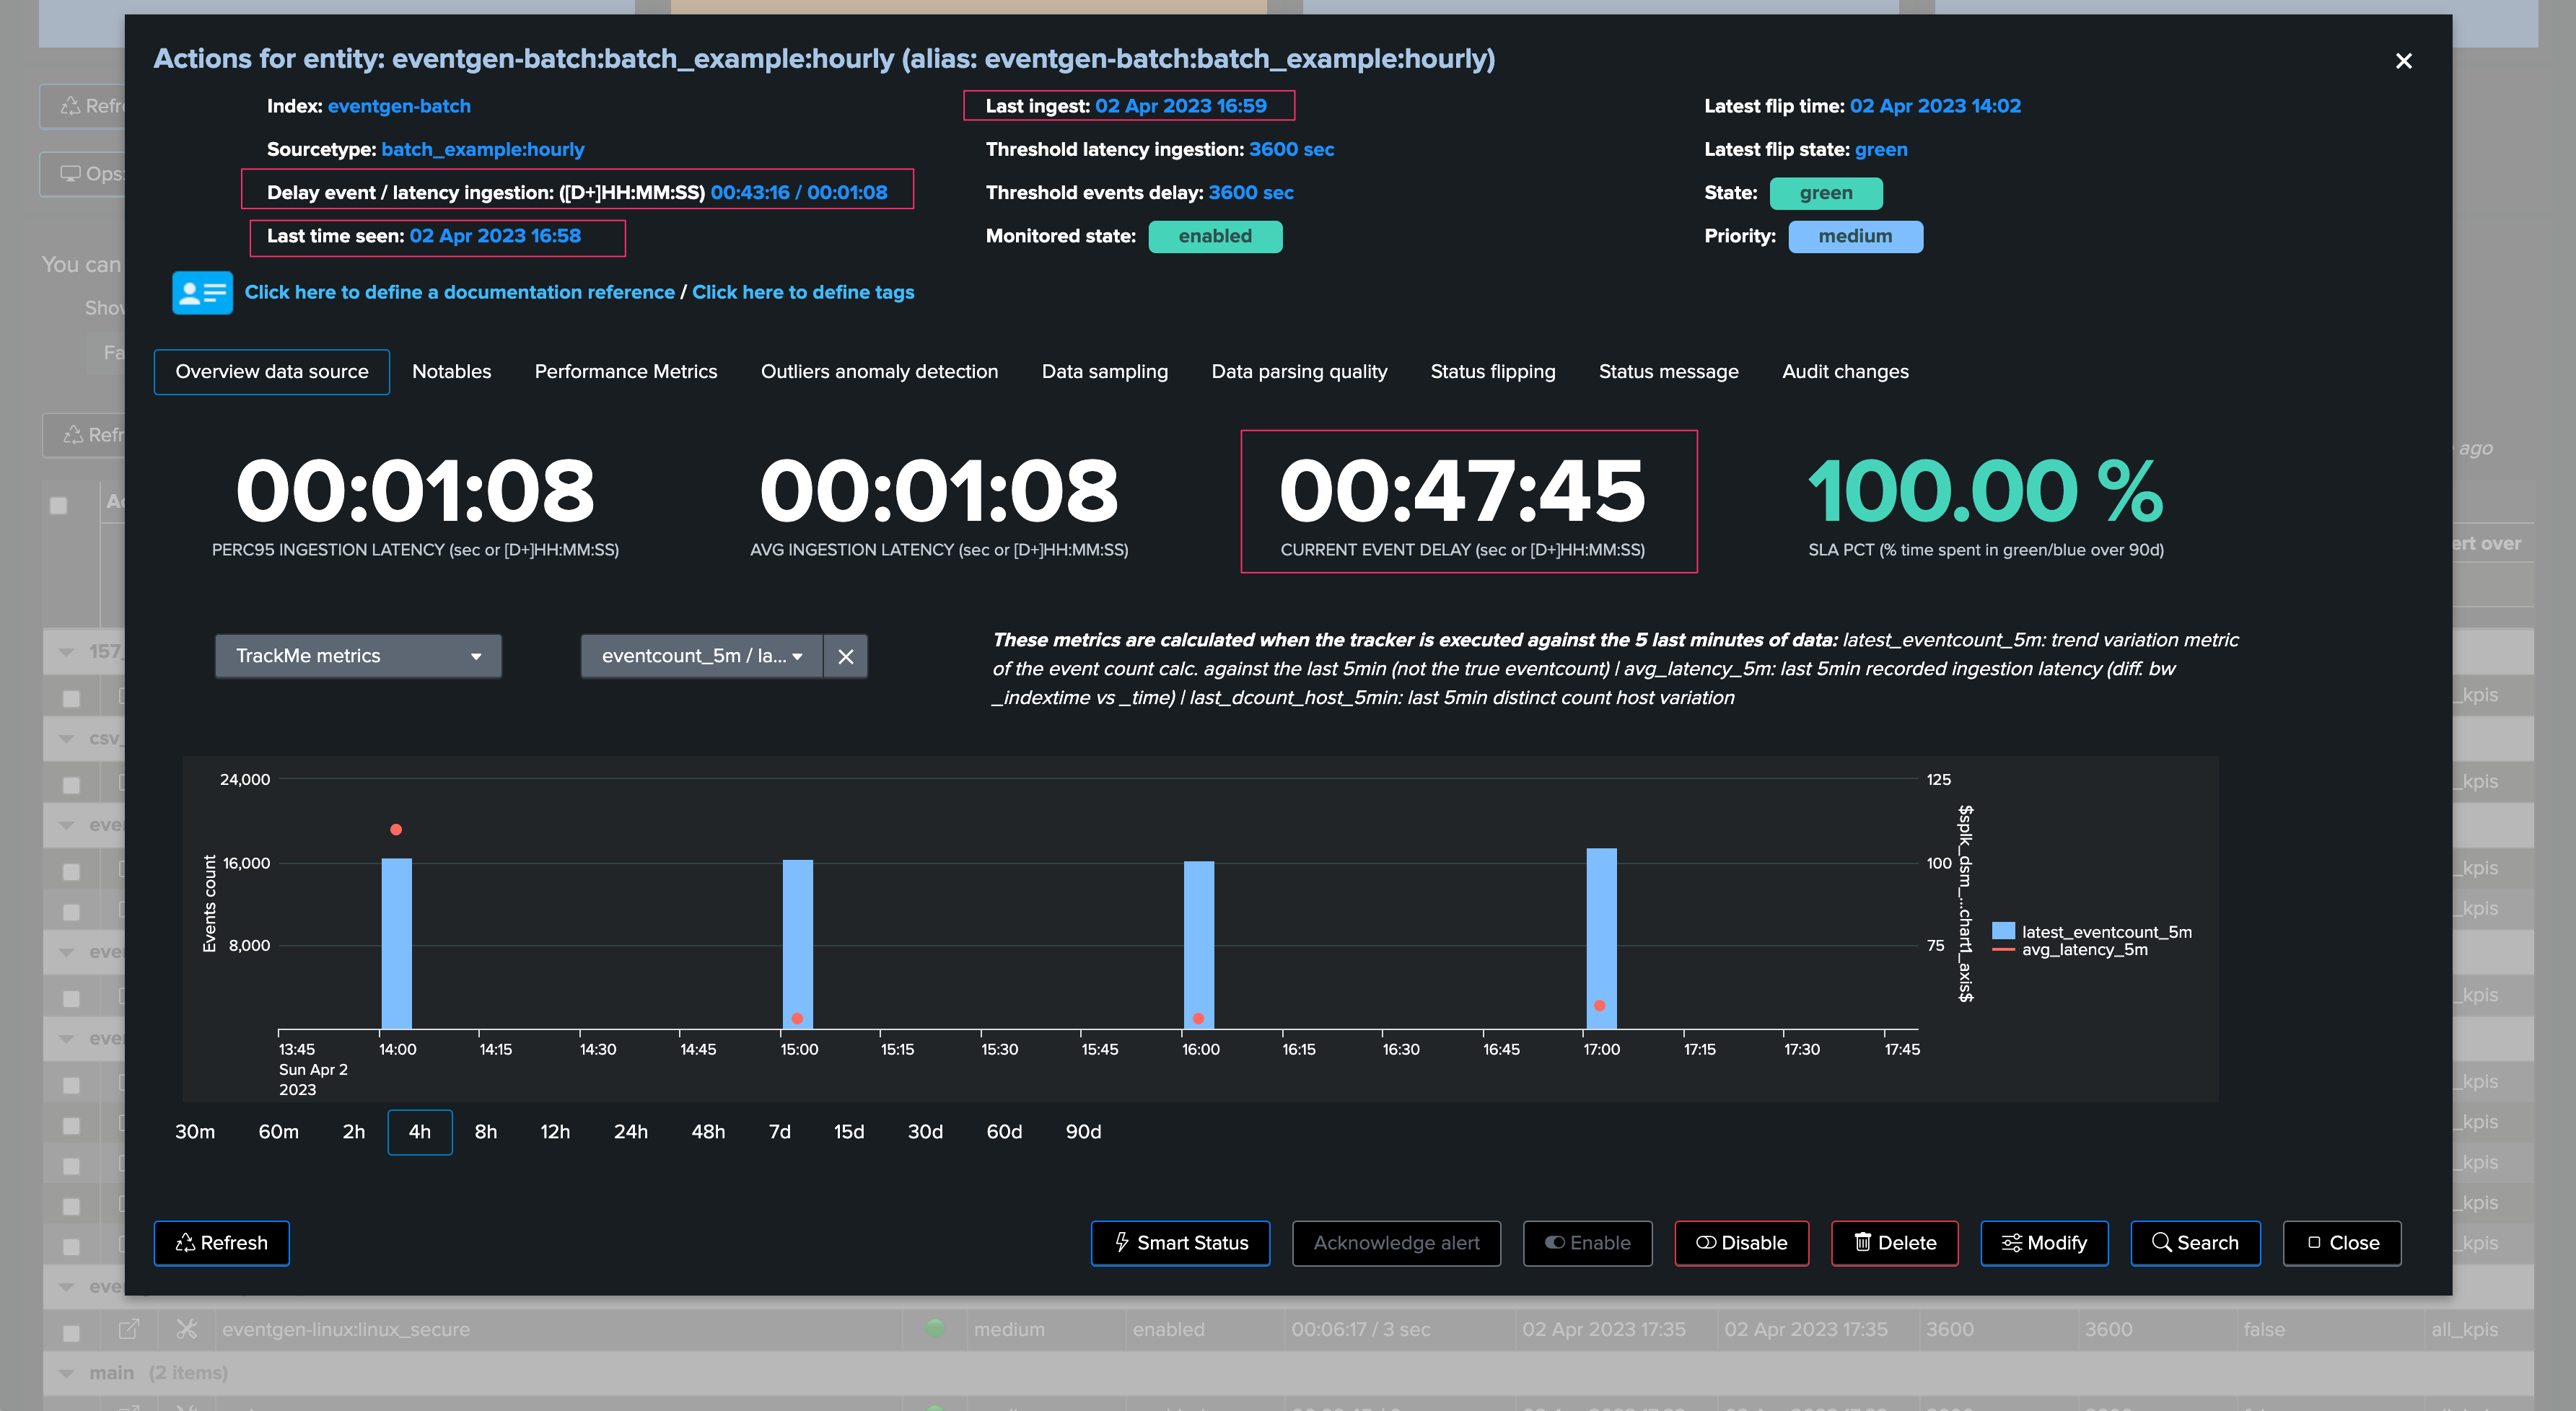
In the following example, we are reviewing an entity which is suffering from delay:
In this use case, the entity does not have any latency, however, it generates data in a batched manner, for instance this provider generates a bunch of Splunk events once per day:
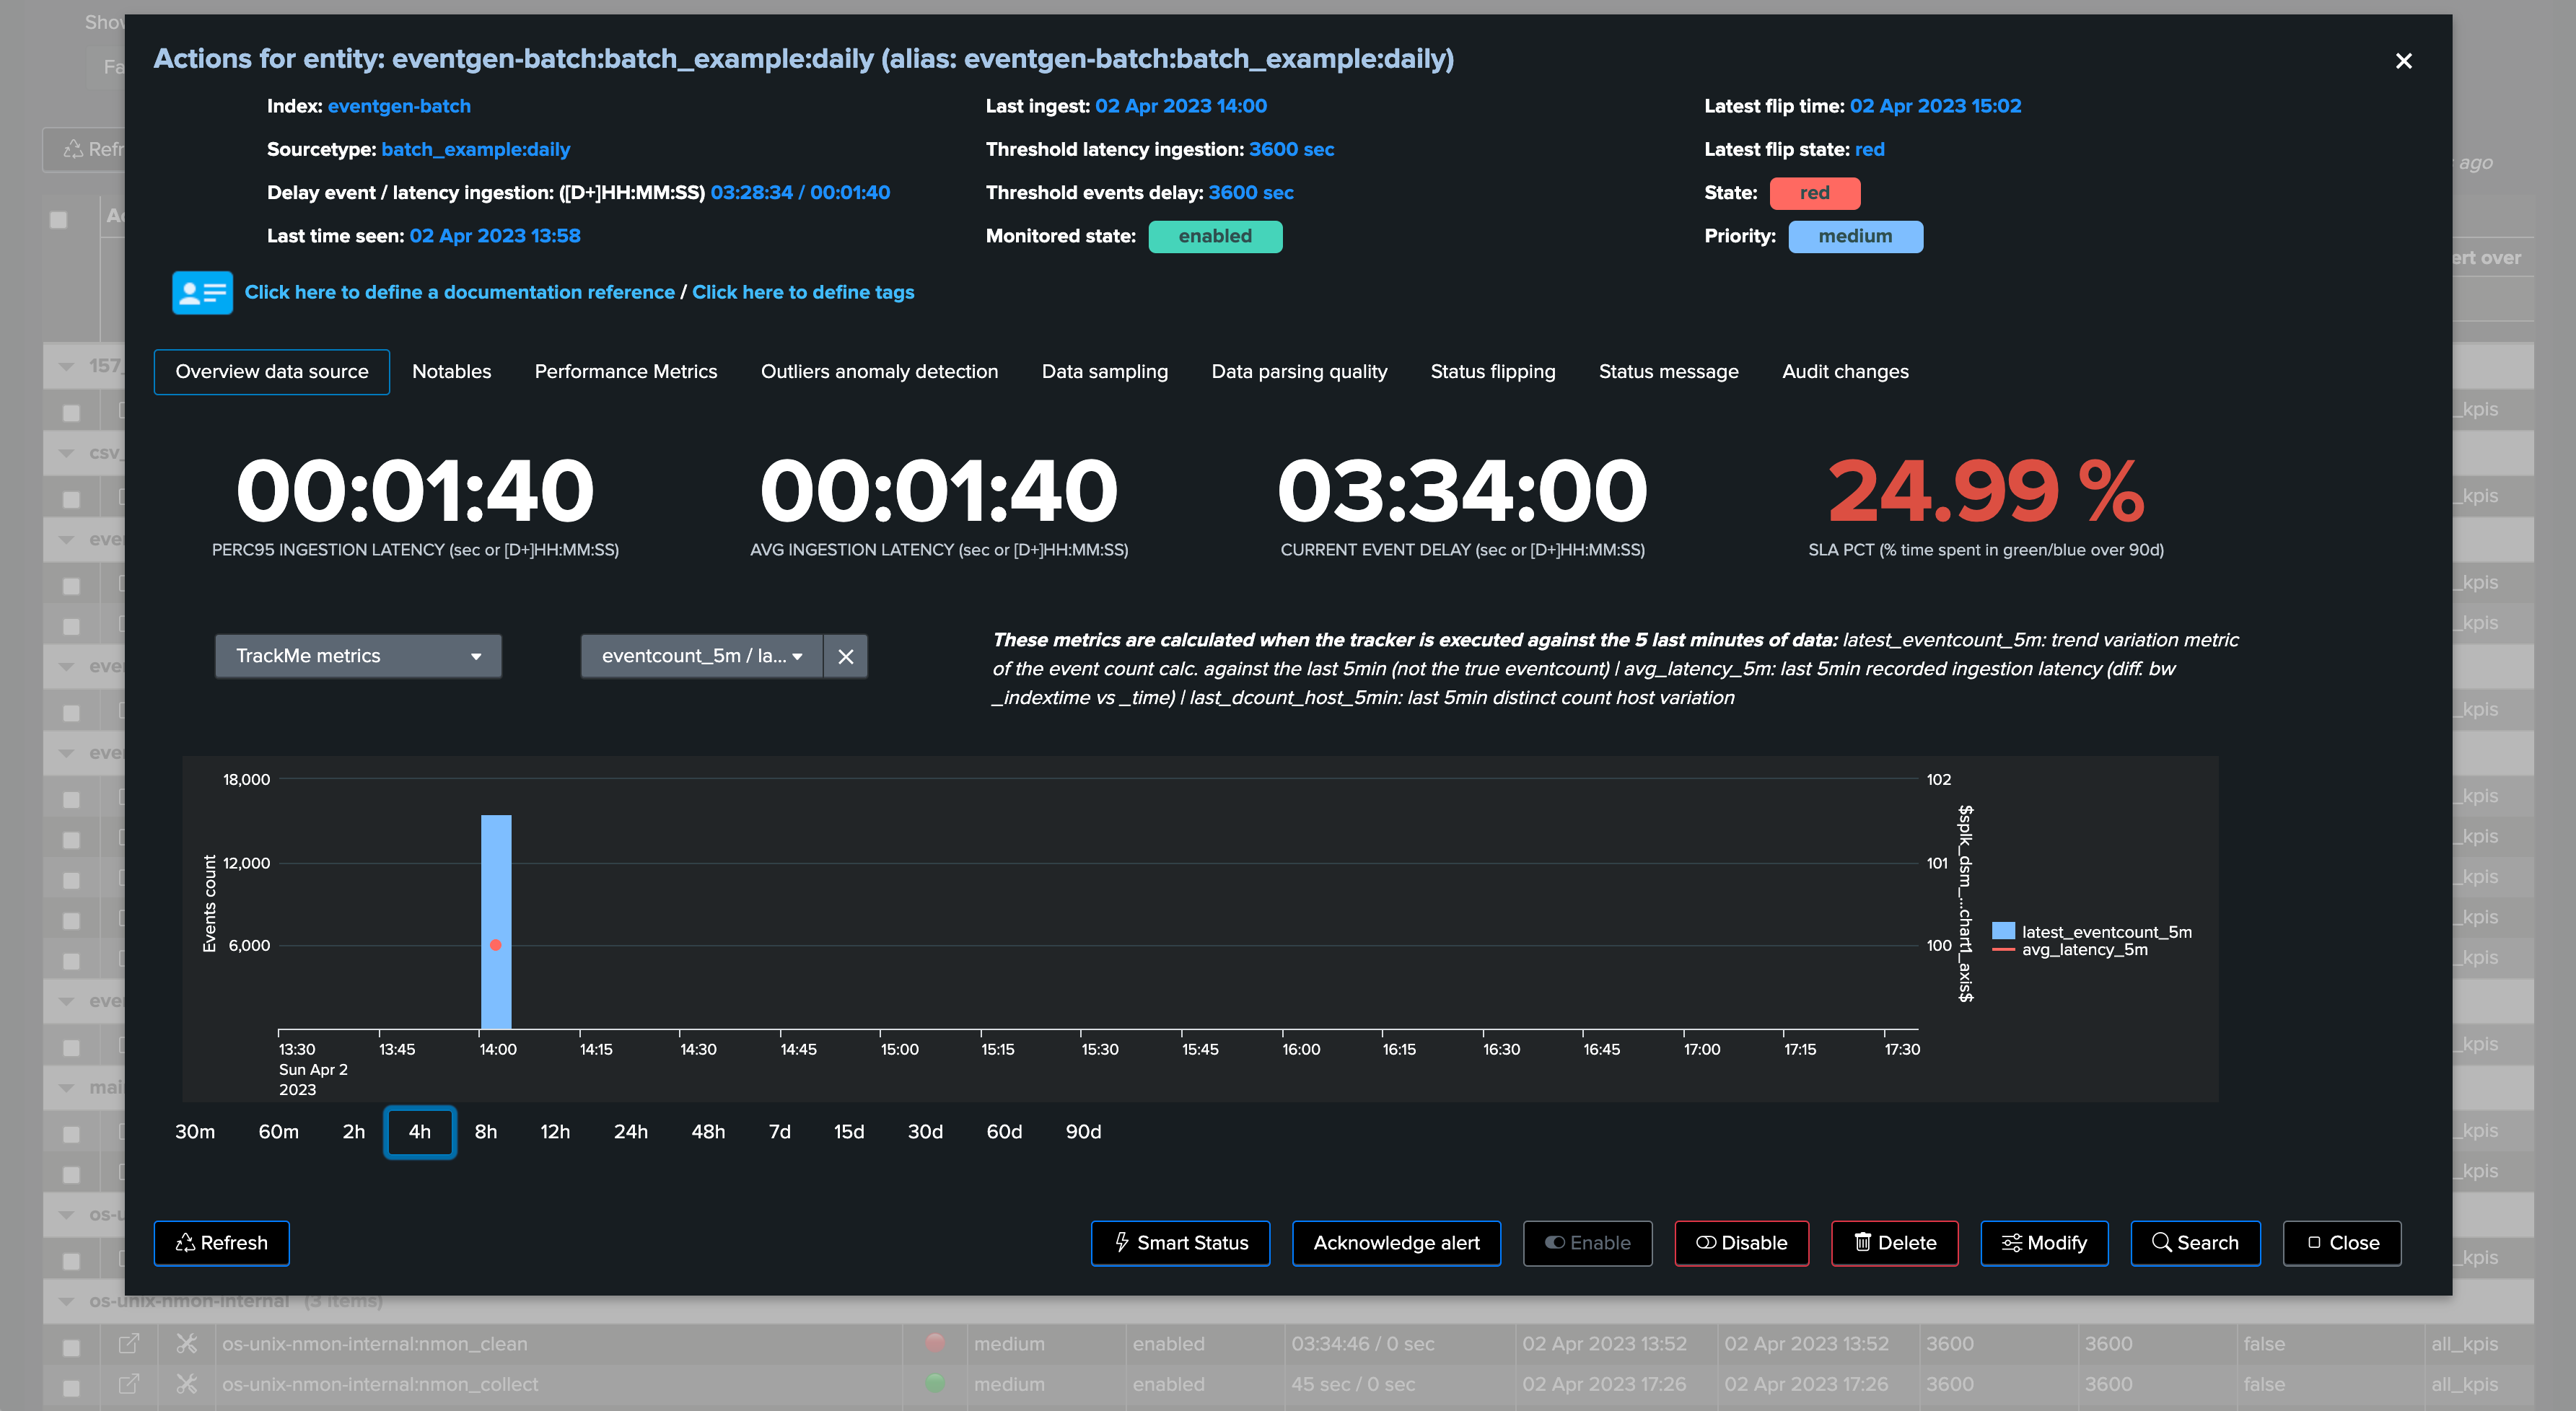
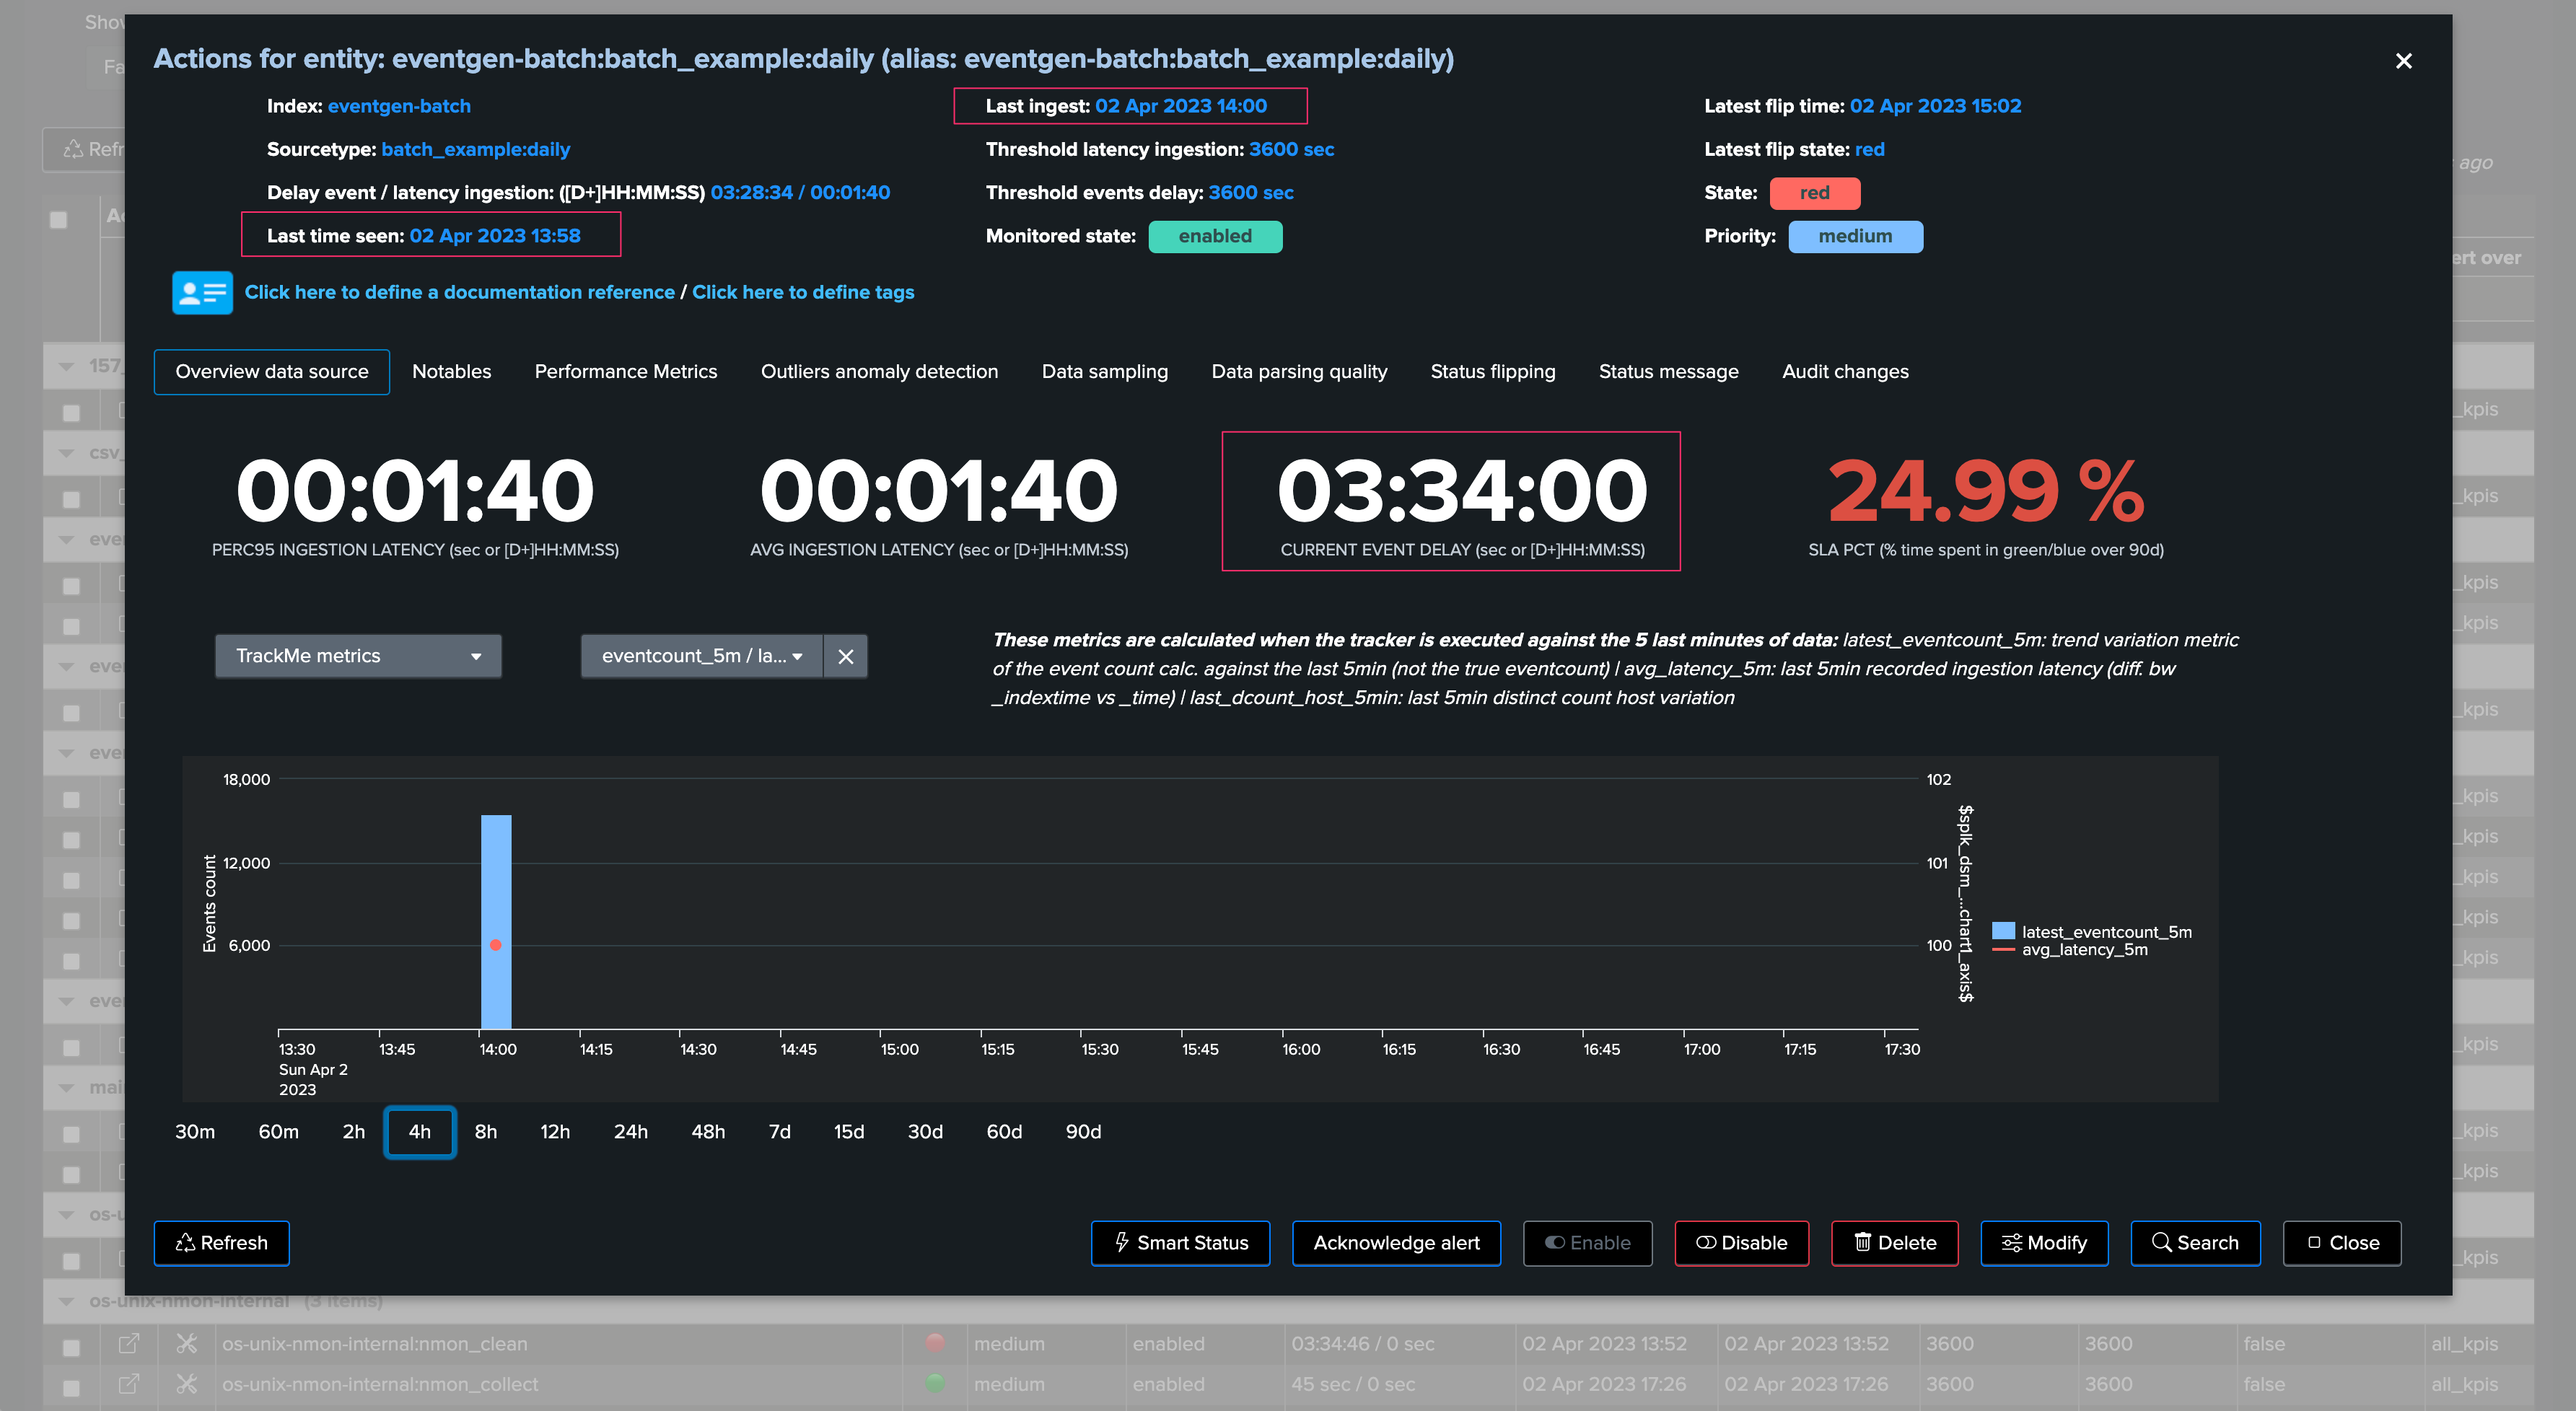
TrackMe shows the current delay, as well as the latest event (from the _time perspective) and the latest ingest event (therefore from the _indextime perspective):
In this context, we could set a max delay of a little bit more than 24 hours (say 24 hours + 10 minutes), the latency may remain low as we do not expect to ingest events with latency when these are produced:
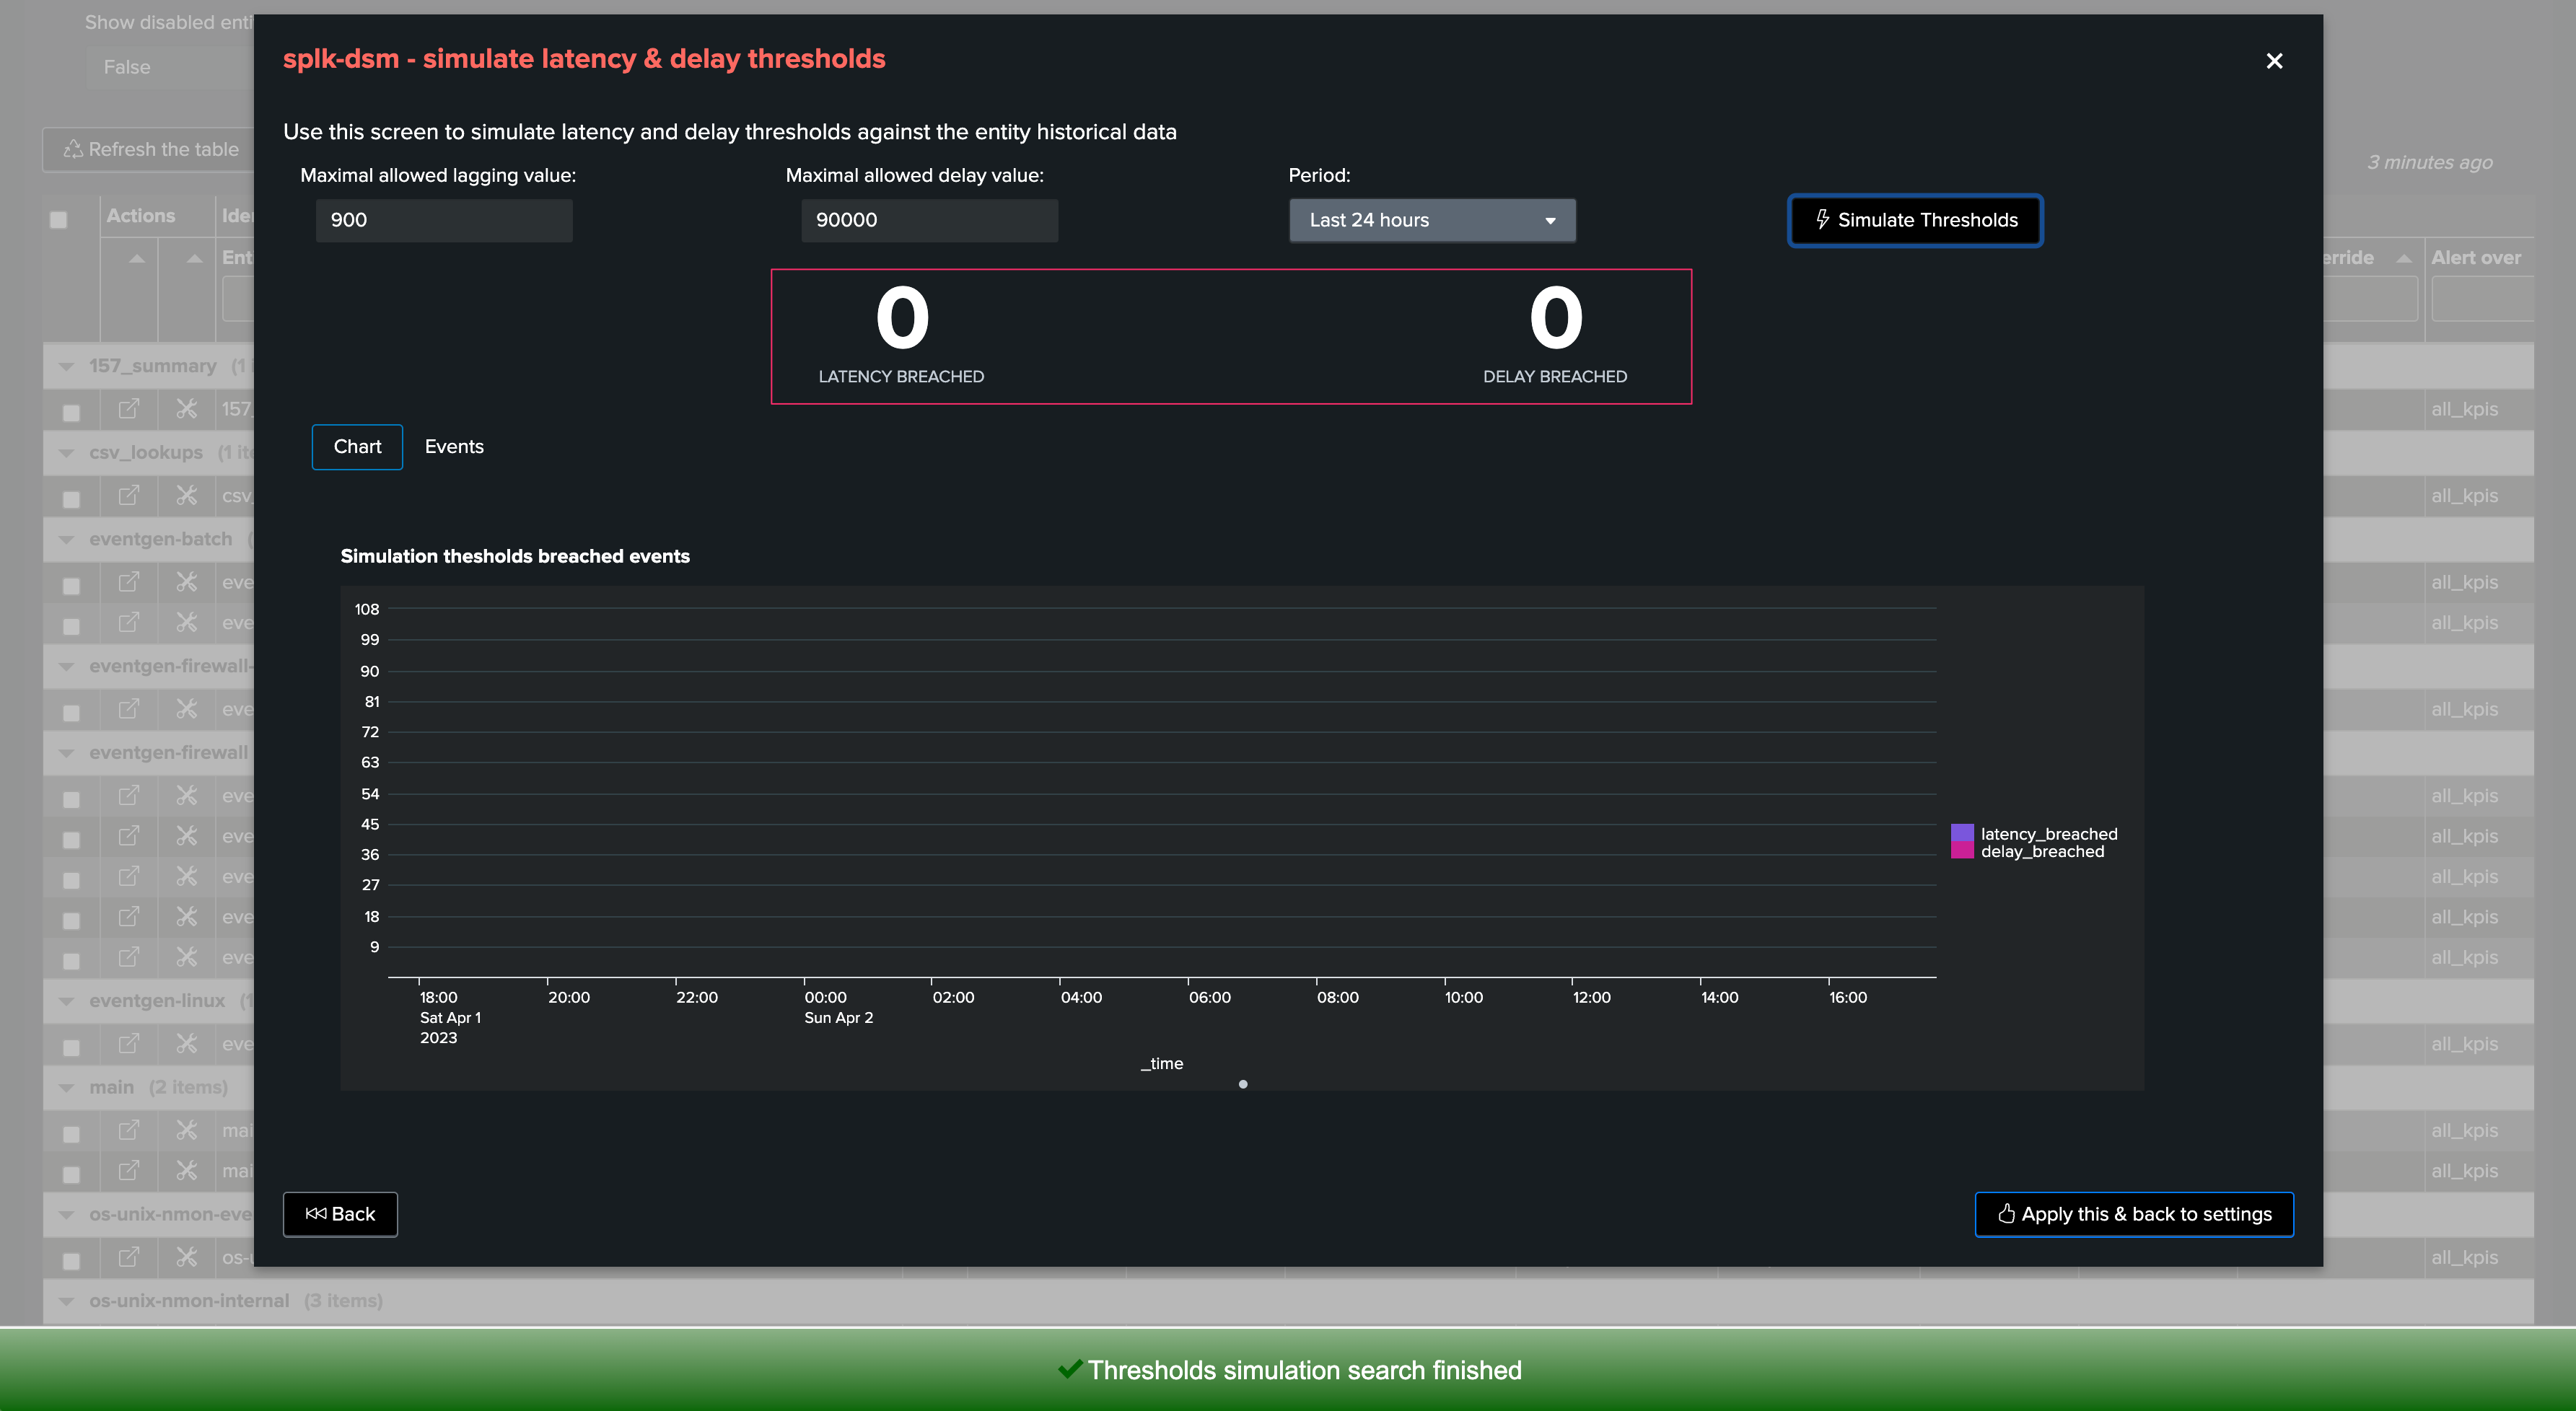
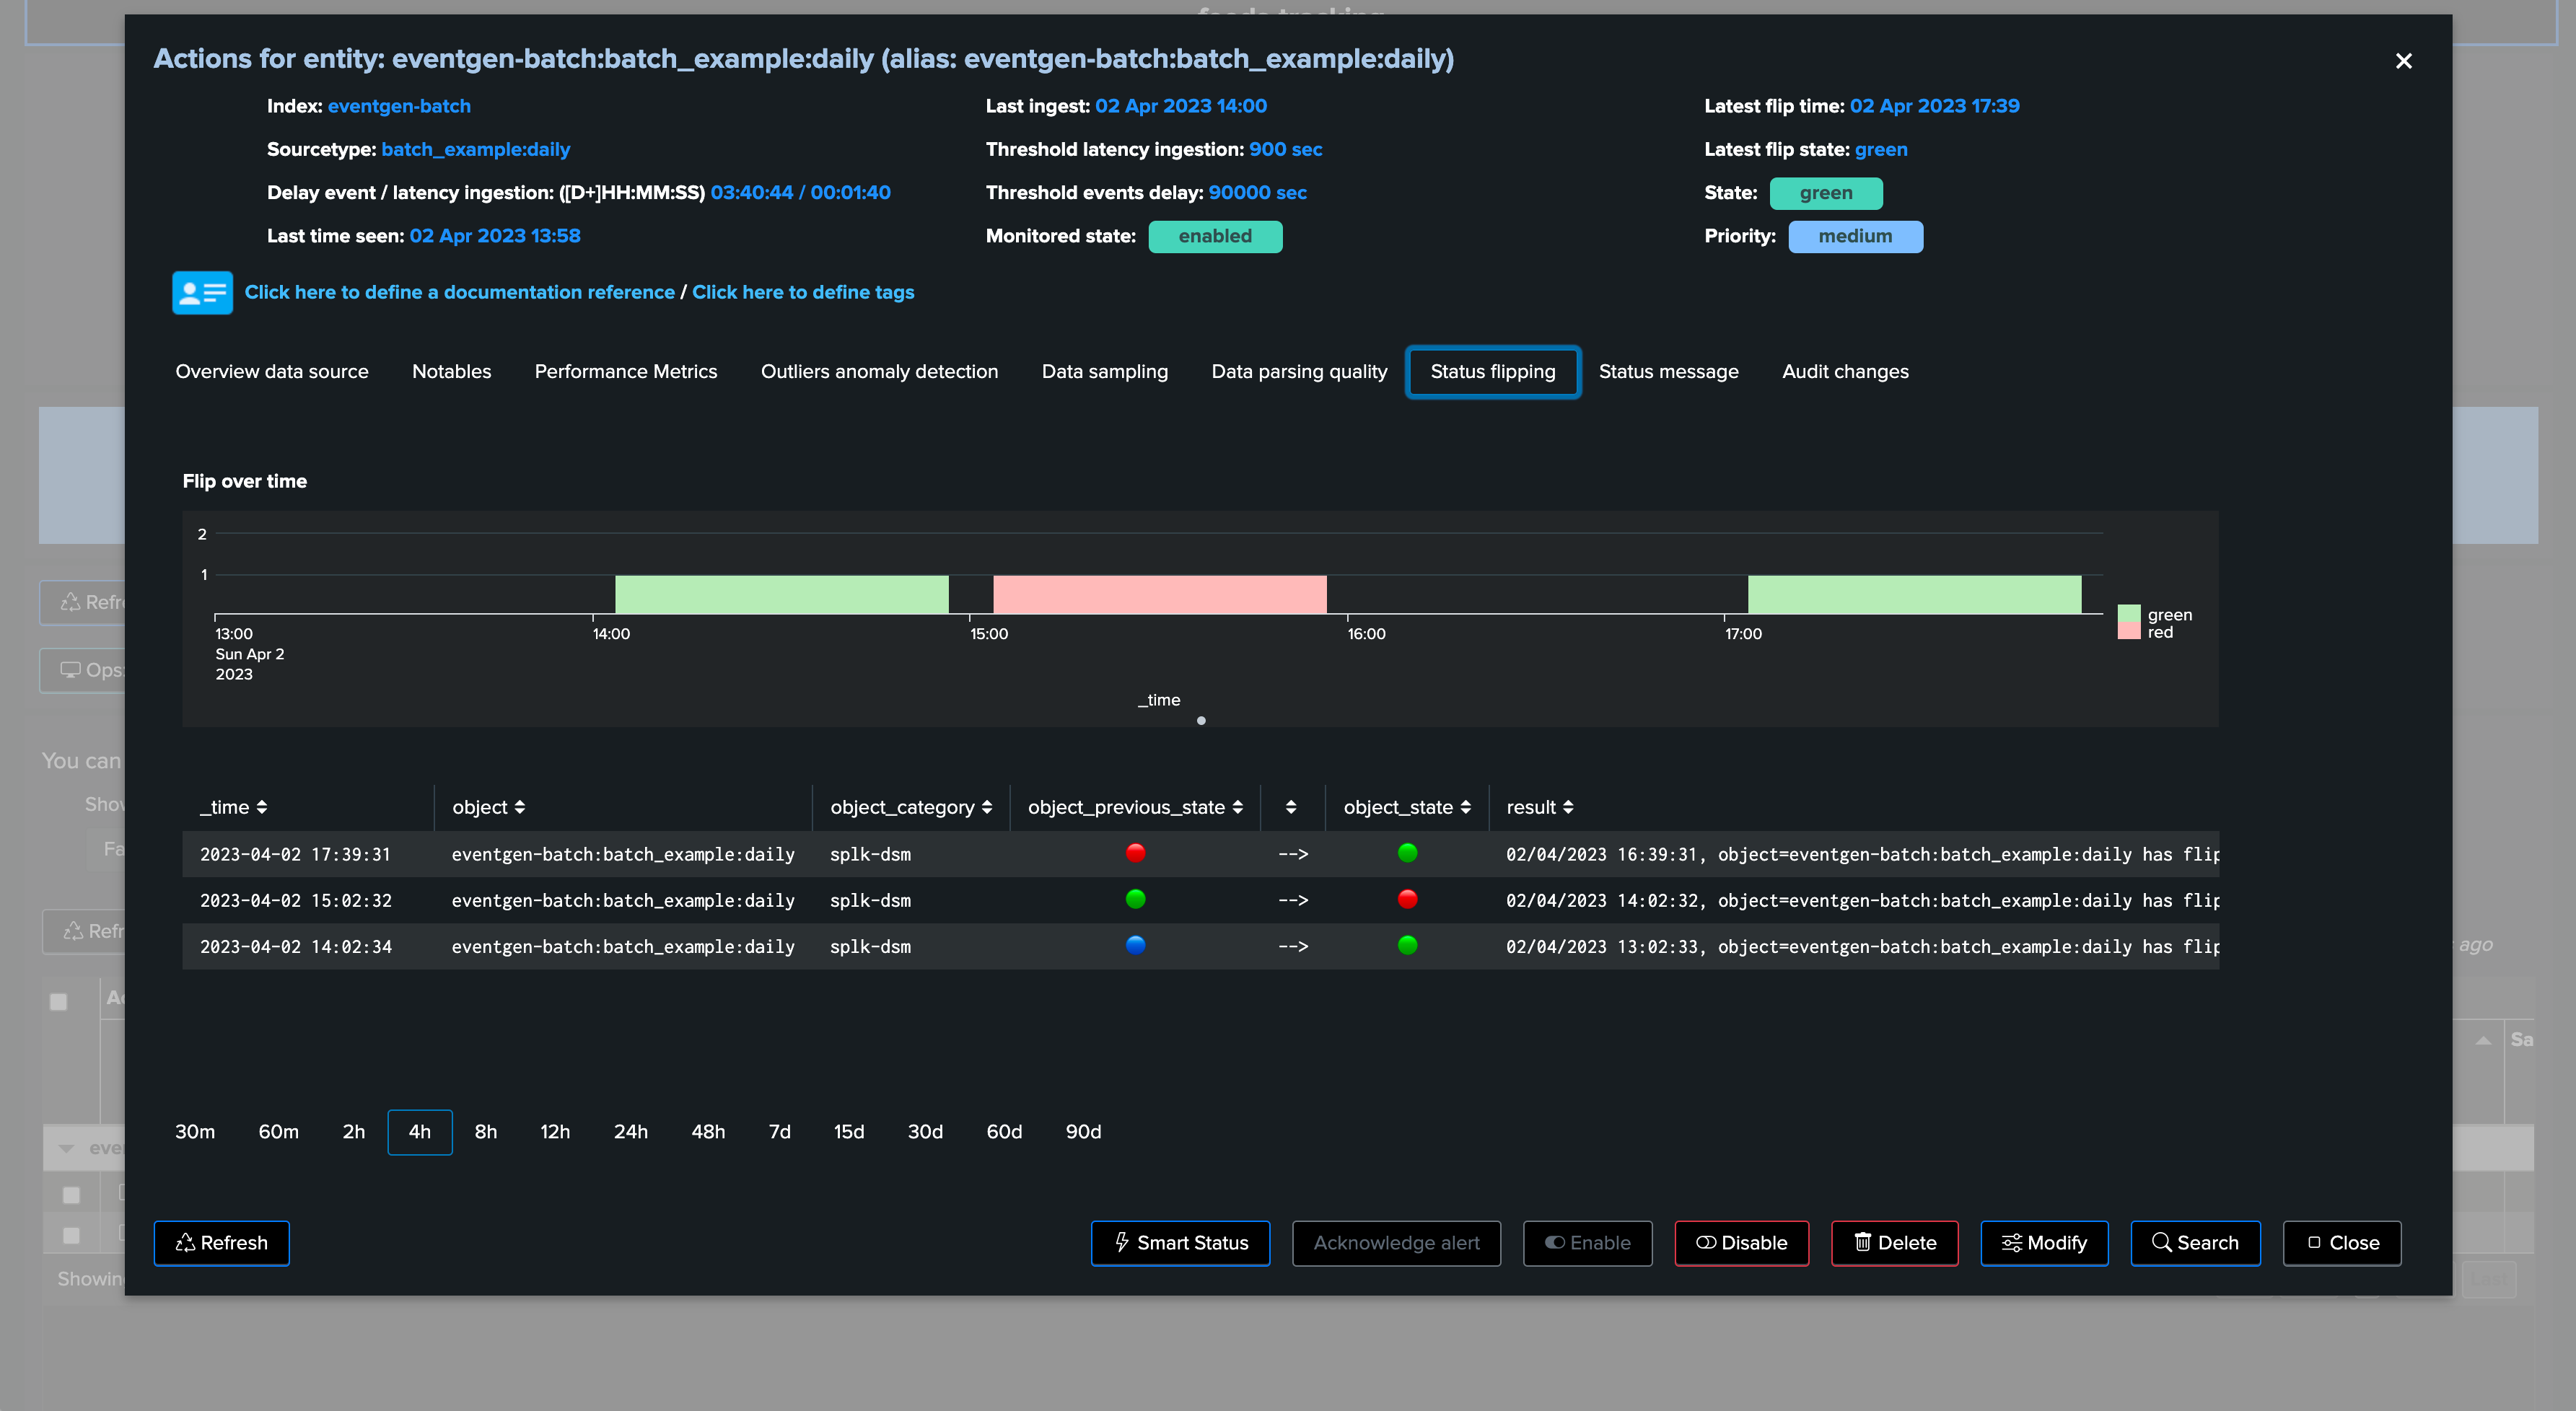
Once we apply our new thresholds, the entity returns to green and will remain healthy unless our monitoring conditions would not be met:
Batch data once per hour example
In this second example, we have another data source which generates data once per hour, similarly we may not expect latency, but it is likely that the data source alert could trigger with a default delay threshold of 3600 seconds if the provider is a little bit late:
Note that we clearly observe the delay, when data was generated and indexed, against as fast we received and indexed these events:
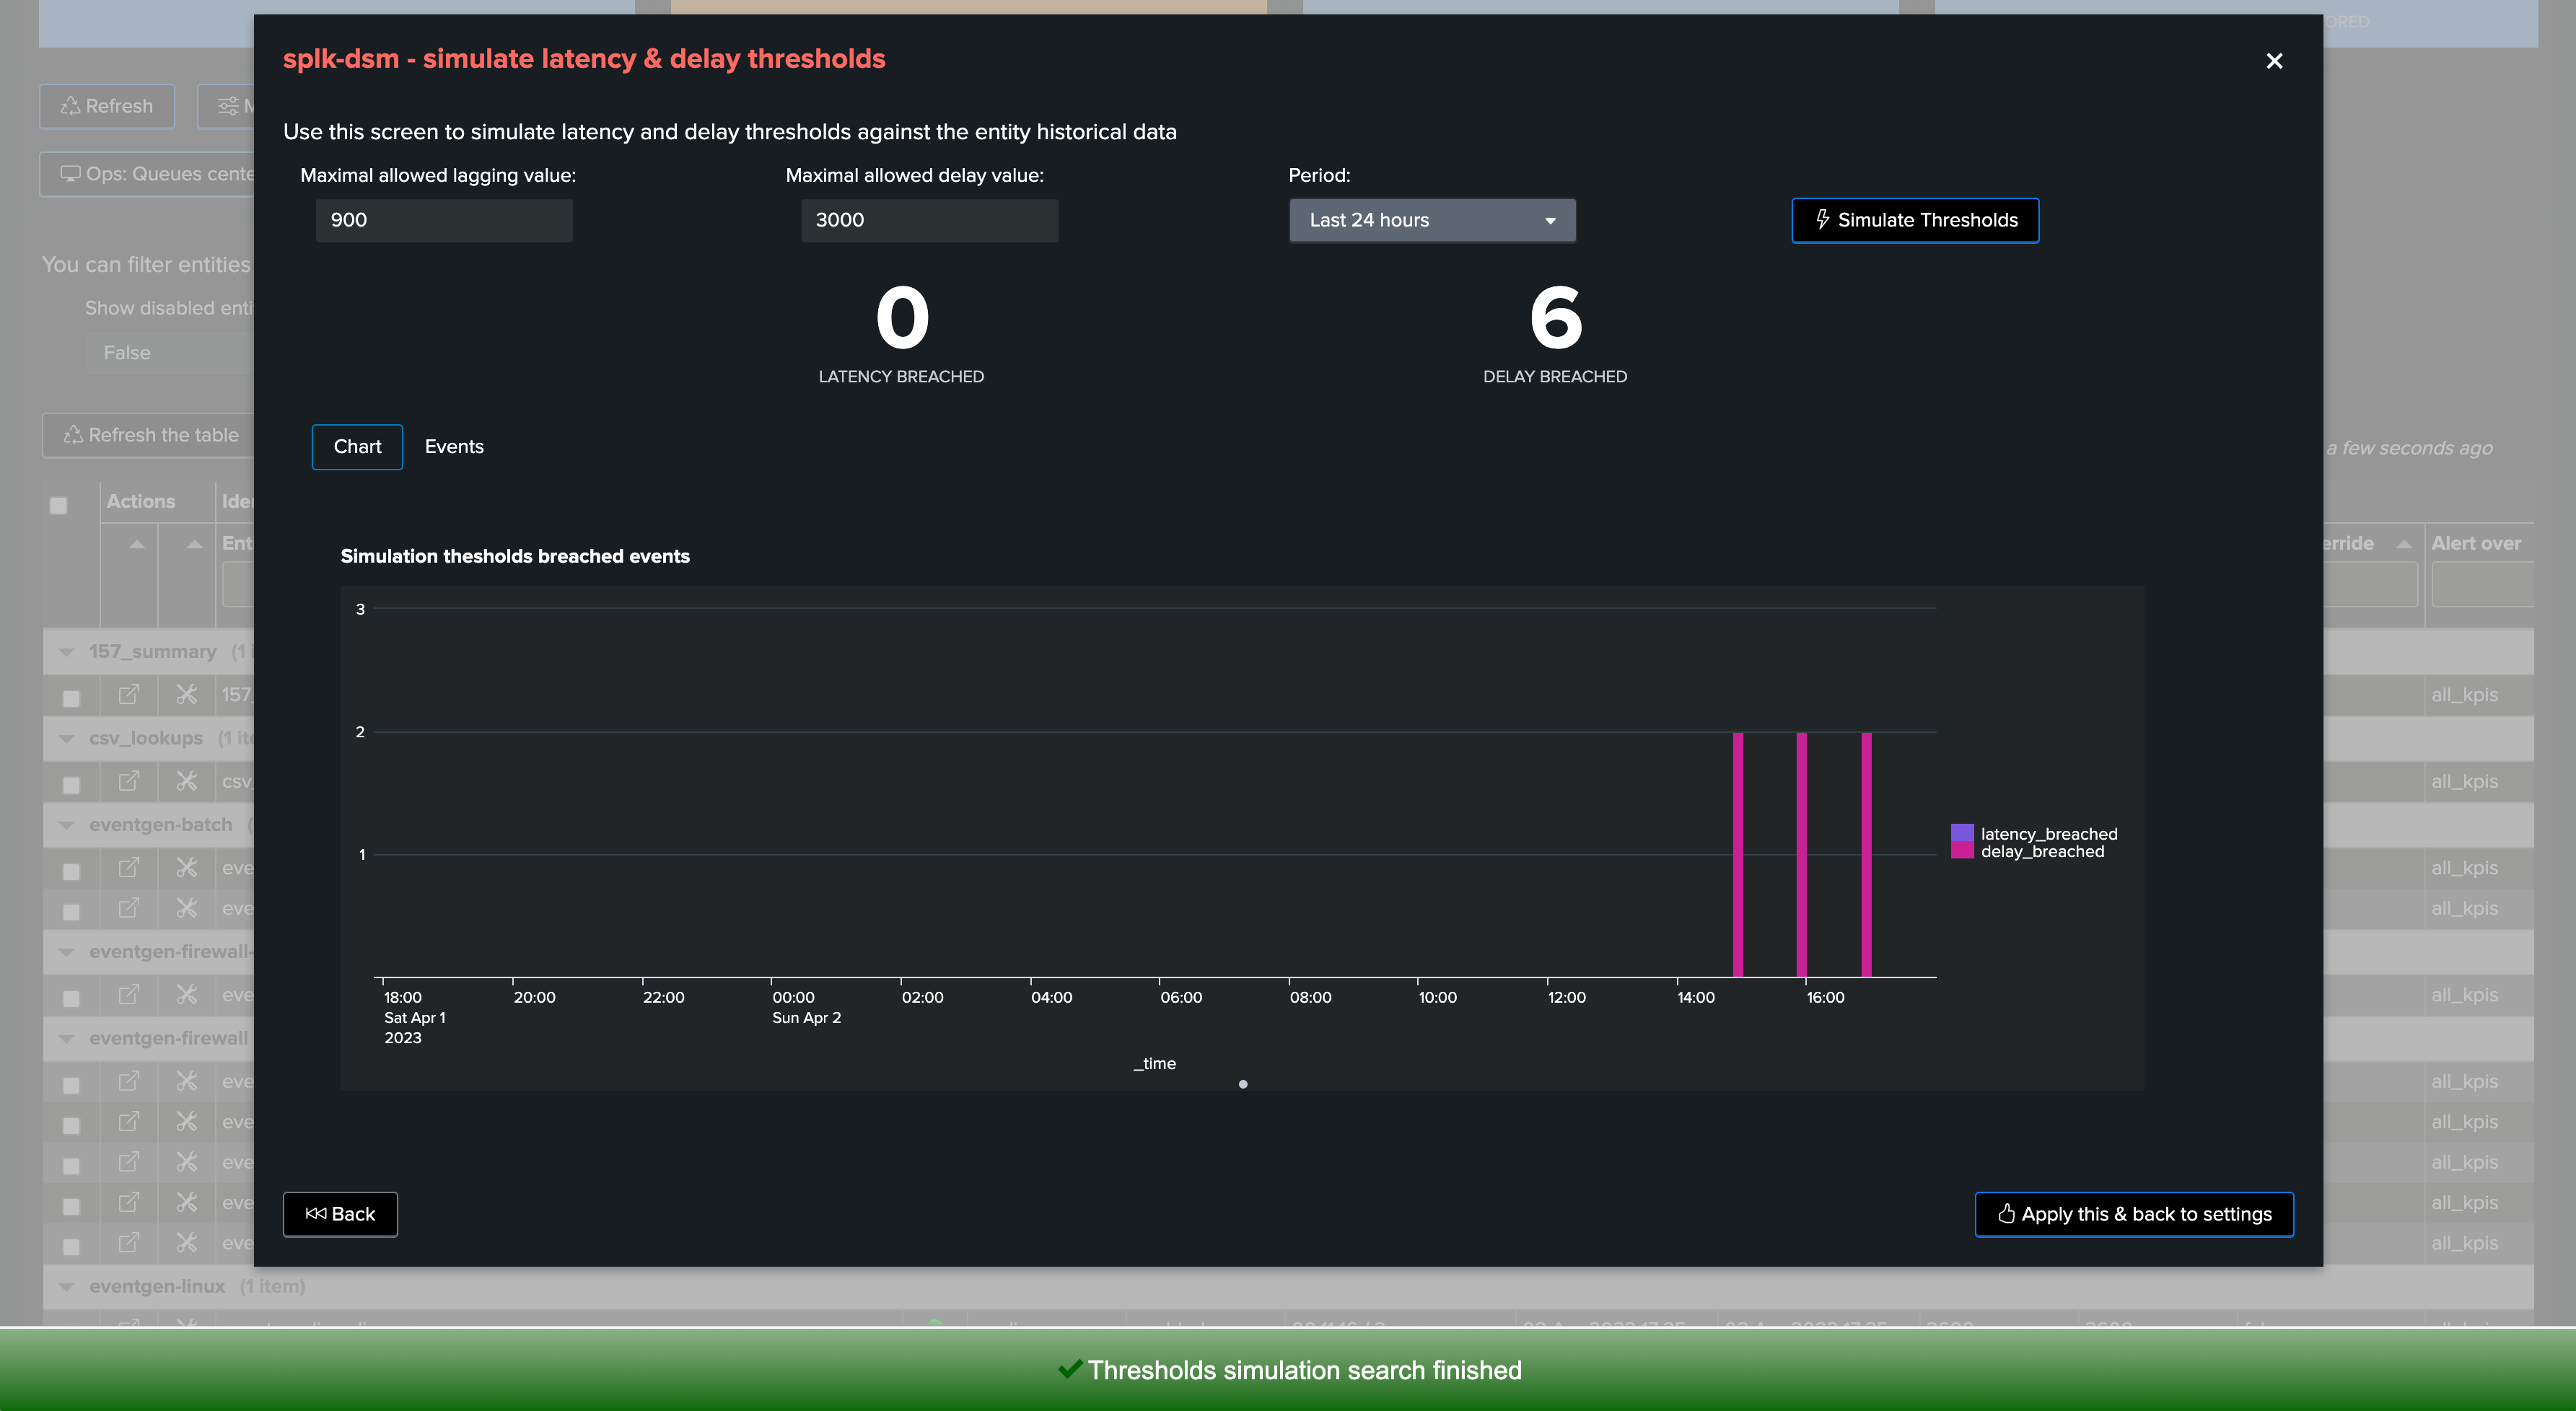
We may or may not have had alerts for this entity yet, depending on the context we may tolerate or not some levels of delay, for instance we could set to 1 hour + 10 minutes if the data is quite critical:
If we go too low (say for 3000 seconds for example), then we can observe that would get alerts for this data source due to delay:
In our example, we will set it to 4200 seconds, 1 hour and 10 minutes:
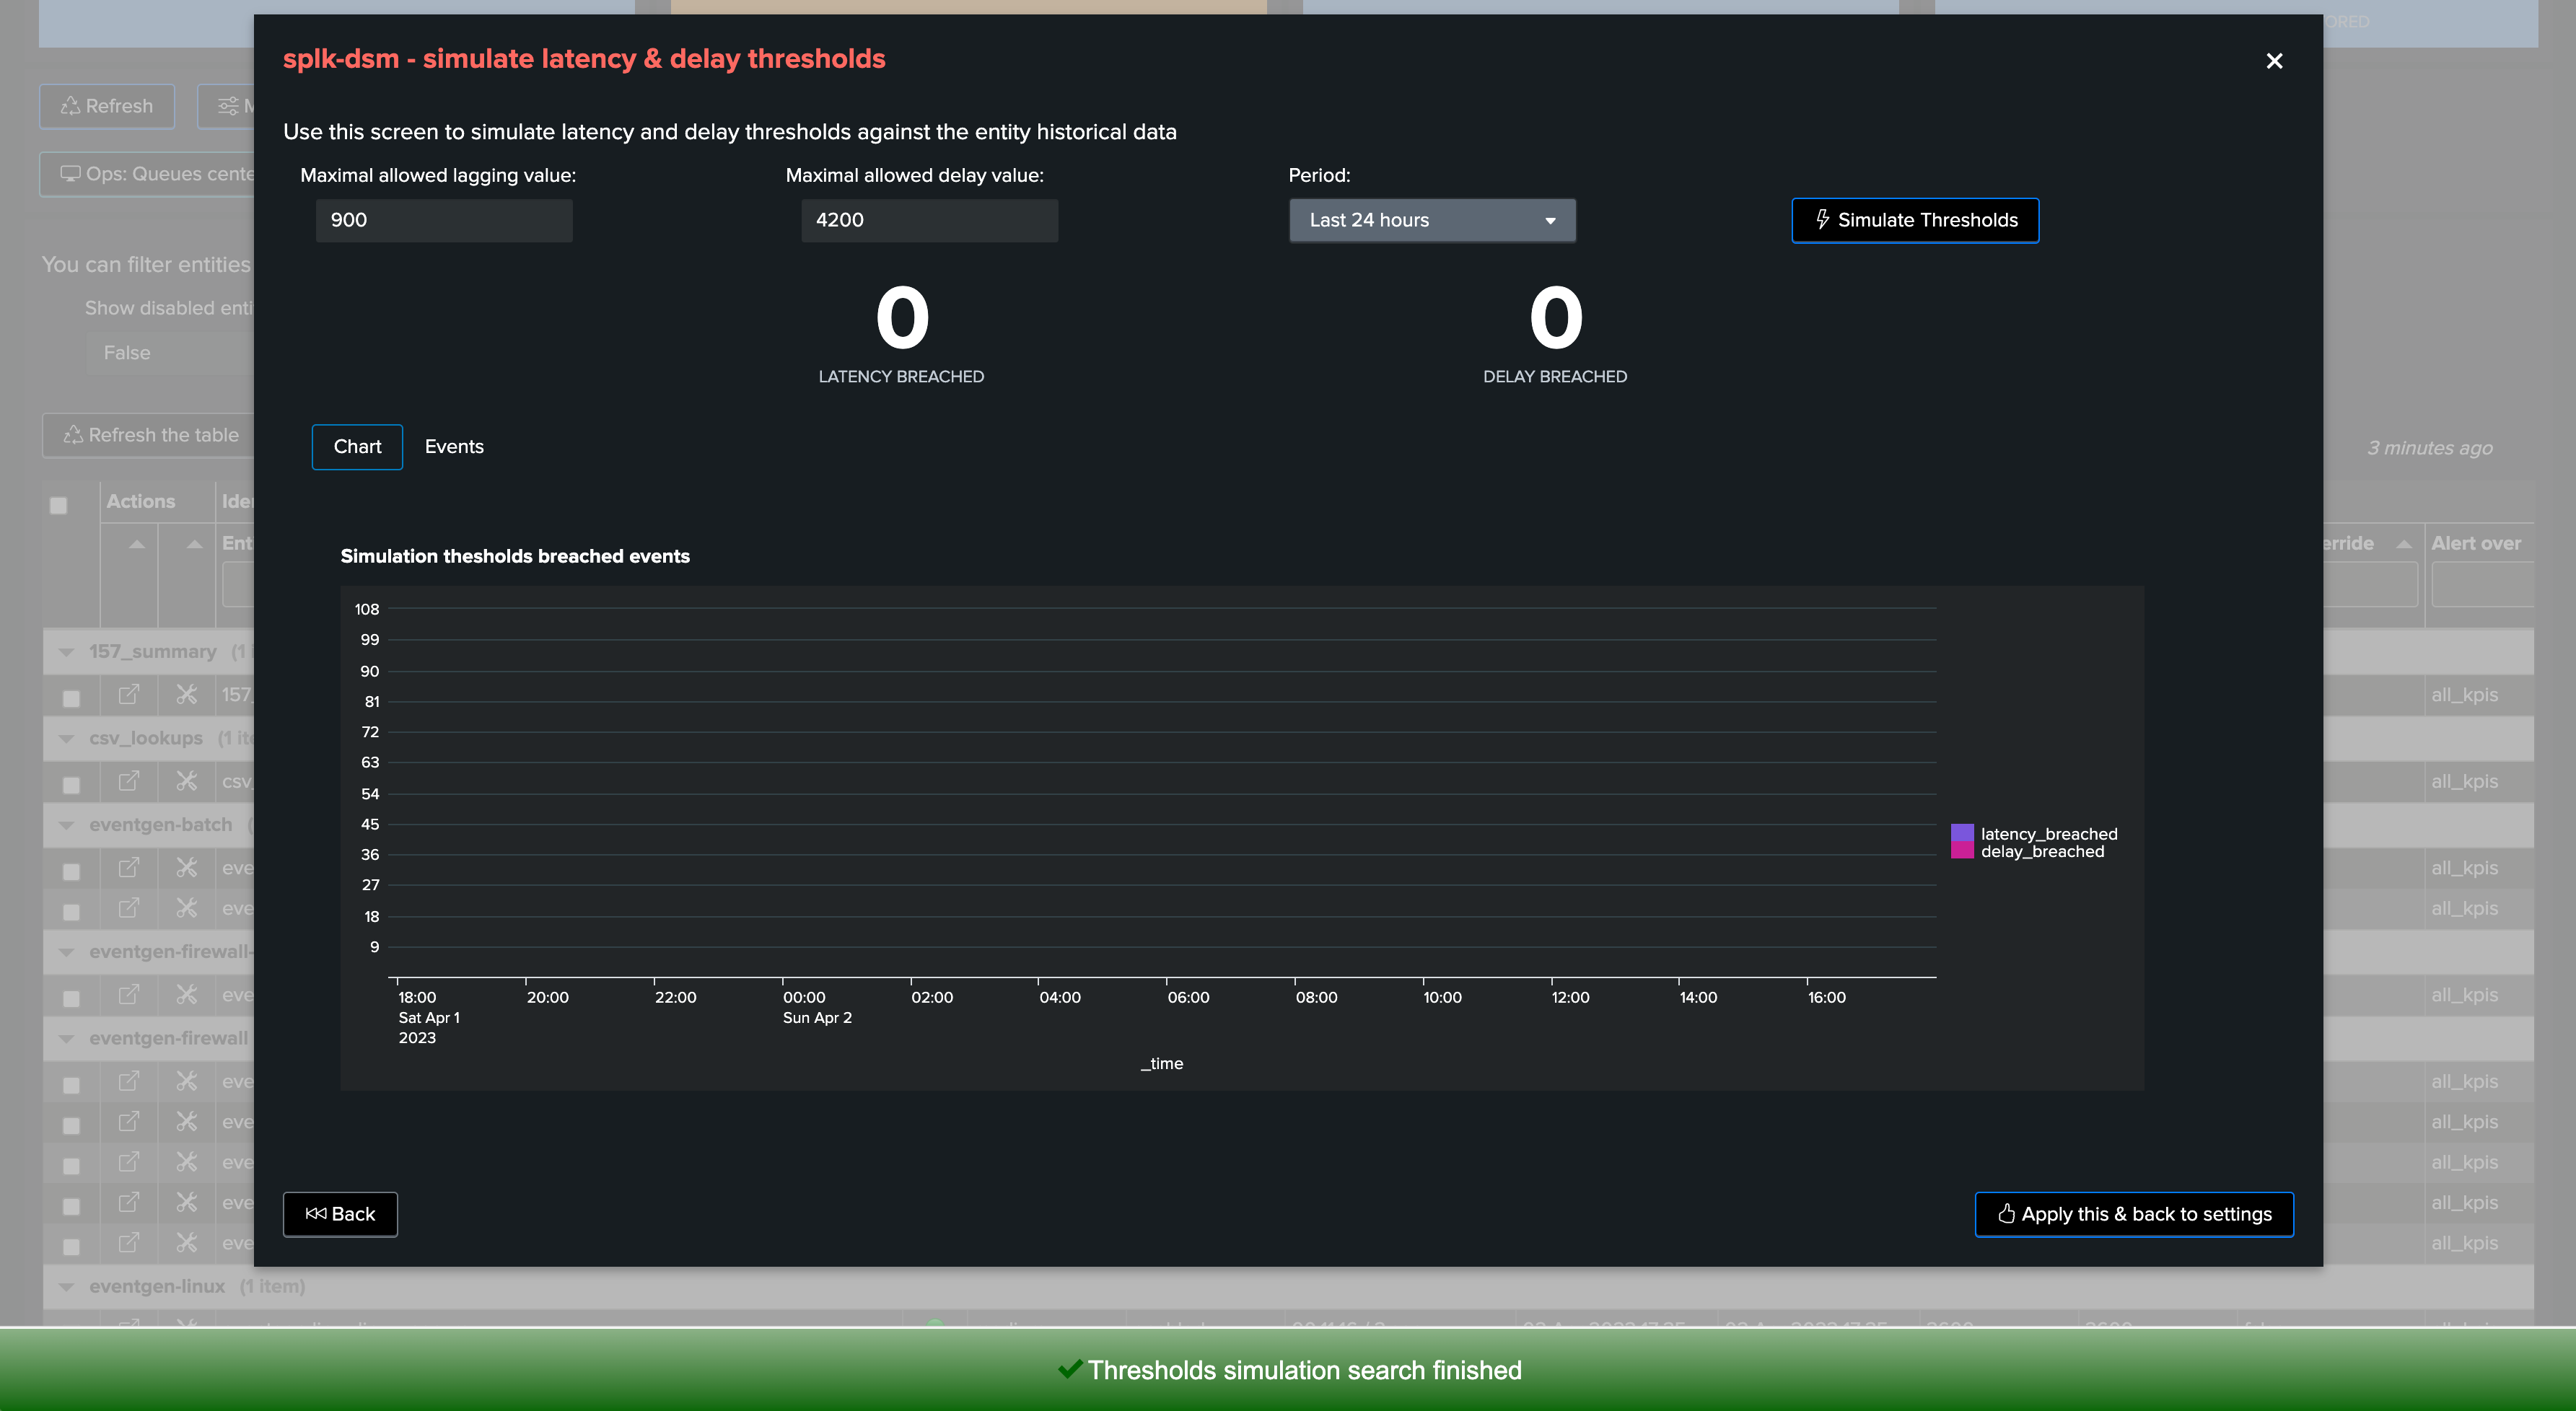
Again, accepting a certain delay in the delivery of events does not mean that these events should be indexed with latency, both KPIs need to be taken into account independently.
Conclusion
Thresholds definition is an important part of TrackMe configuration and entities lifecycle.
TrackMe provides different meaningful features to observe, review, and define threshold values that make sense for your context.
Because every context is different, TrackMe provides flexible features to allow managing latency and delay thresholds as needed.