Splunk Feeds KPIs (splk-feeds)
Introduction to latency and delay
This documentation focuses on the Key Performance Indicators (KPIs) available with the TrackMe component called “splk-feeds”, which stands for Splunk Feeds Tracking.
The category of components includes:
splk-dsm (Data Source Monitoring)
splk-dhm (Data Host Monitoring)
splk-mhm (Metric Host Monitoring)
In the context of these components, we focus on the metrics that can be categorized as part of “lagging metrics”.
In TrackMe, this essentially means:
latency: how fast events are received and indexed, in regards to when these events were produced by the data provider
delay: how late in the past is this data provider, in other terms, when did we receive the latest event for this provider
Latency in the Splunk Context
In the Splunk context, latency is the time taken between when the event was produced and when the event was received and written.
To calculate the latency, we operate a simple formula:
latency = (_indextime - _time)
Understanding Latency’s Importance
Latency is an important concept because it can impact the reliability of Splunk use cases and even imply considerable consequences from an investment, business, and people’s real-life perspective.
TrackMe was originally designed to detect and alert when Splunk is suffering from latency in large environments with a multitude of data sources and typologies of events.
Delay in the Splunk Context
Delay is another KPI related to the quality assessment activity.
It is the interruption of a data flow which can happen for various reasons, such as process issues, configuration issues, or network issues.
TrackMe calculates delay using the formula:
delay = now() - last_time
Difference between Latency and Delay
Latency and delay are two distinct concepts in the context of Splunk and TrackMe.
Here’s a comparison between the two:
Latency
Refers to the time difference between when an event was produced by the data provider and when it was received and indexed by Splunk
Calculated as: latency = (_indextime - _time)
Often caused by network issues, misconfigured timezones, or incorrect timestamp parsing
Affects the reliability of search results, scheduled reports, and alerts due to late indexing of events
Can lead to missed events or incoherent results, especially in time-constrained searches
Delay
Refers to the time difference between the current time (when the Hybrid Tracker runs) and the latest event received for a data provider
Calculated as: delay = now() - last_time
Often caused by data flow interruptions, such as process failures, configuration issues, or network problems
Indicates potential issues with data flow and can impact the quality of service
TrackMe allows setting different thresholds for delay depending on the data source’s expected behavior
While latency and delay are related, they are not the same concept.
TrackMe manages both KPIs individually, allowing users to set different thresholds for latency and delay to adapt to various use cases and data sources.
Significance of Delay
Delay is a major KPI regarding the quality of service.
Detecting interruptions in the data flow is a key to quality.
TrackMe allows managing both thresholds efficiently in various use cases, regardless of whether data sources continuously generate events or generate events sporadically or in a batch fashion.
How TrackMe Handles Latency and Delay
TrackMe is designed to manage latency and delay efficiently, providing a consistent and powerful workflow and framework for monitoring data sources in large environments.
Here’s how TrackMe handles latency and delay:
TrackMe runs scheduled Hybrid Trackers to calculate latency and delay values for each entity.
The Hybrid Trackers are executed based on a cron schedule, which means the accuracy of delay values will vary accordingly. For example, if the tracker is executed every 5 minutes, there can be up to a 5-minute delay before new events are considered.
TrackMe stores the latest latency and delay values for each entity and provides a user interface to view and manage these values.
TrackMe allows users to set different threshold values for latency and delay. When these thresholds are exceeded, alerts can be generated to notify users of potential issues.
TrackMe supports a variety of use cases, including continuous event generation and sporadic or batch event generation. This flexibility allows TrackMe to adapt to the specific needs of different data sources.
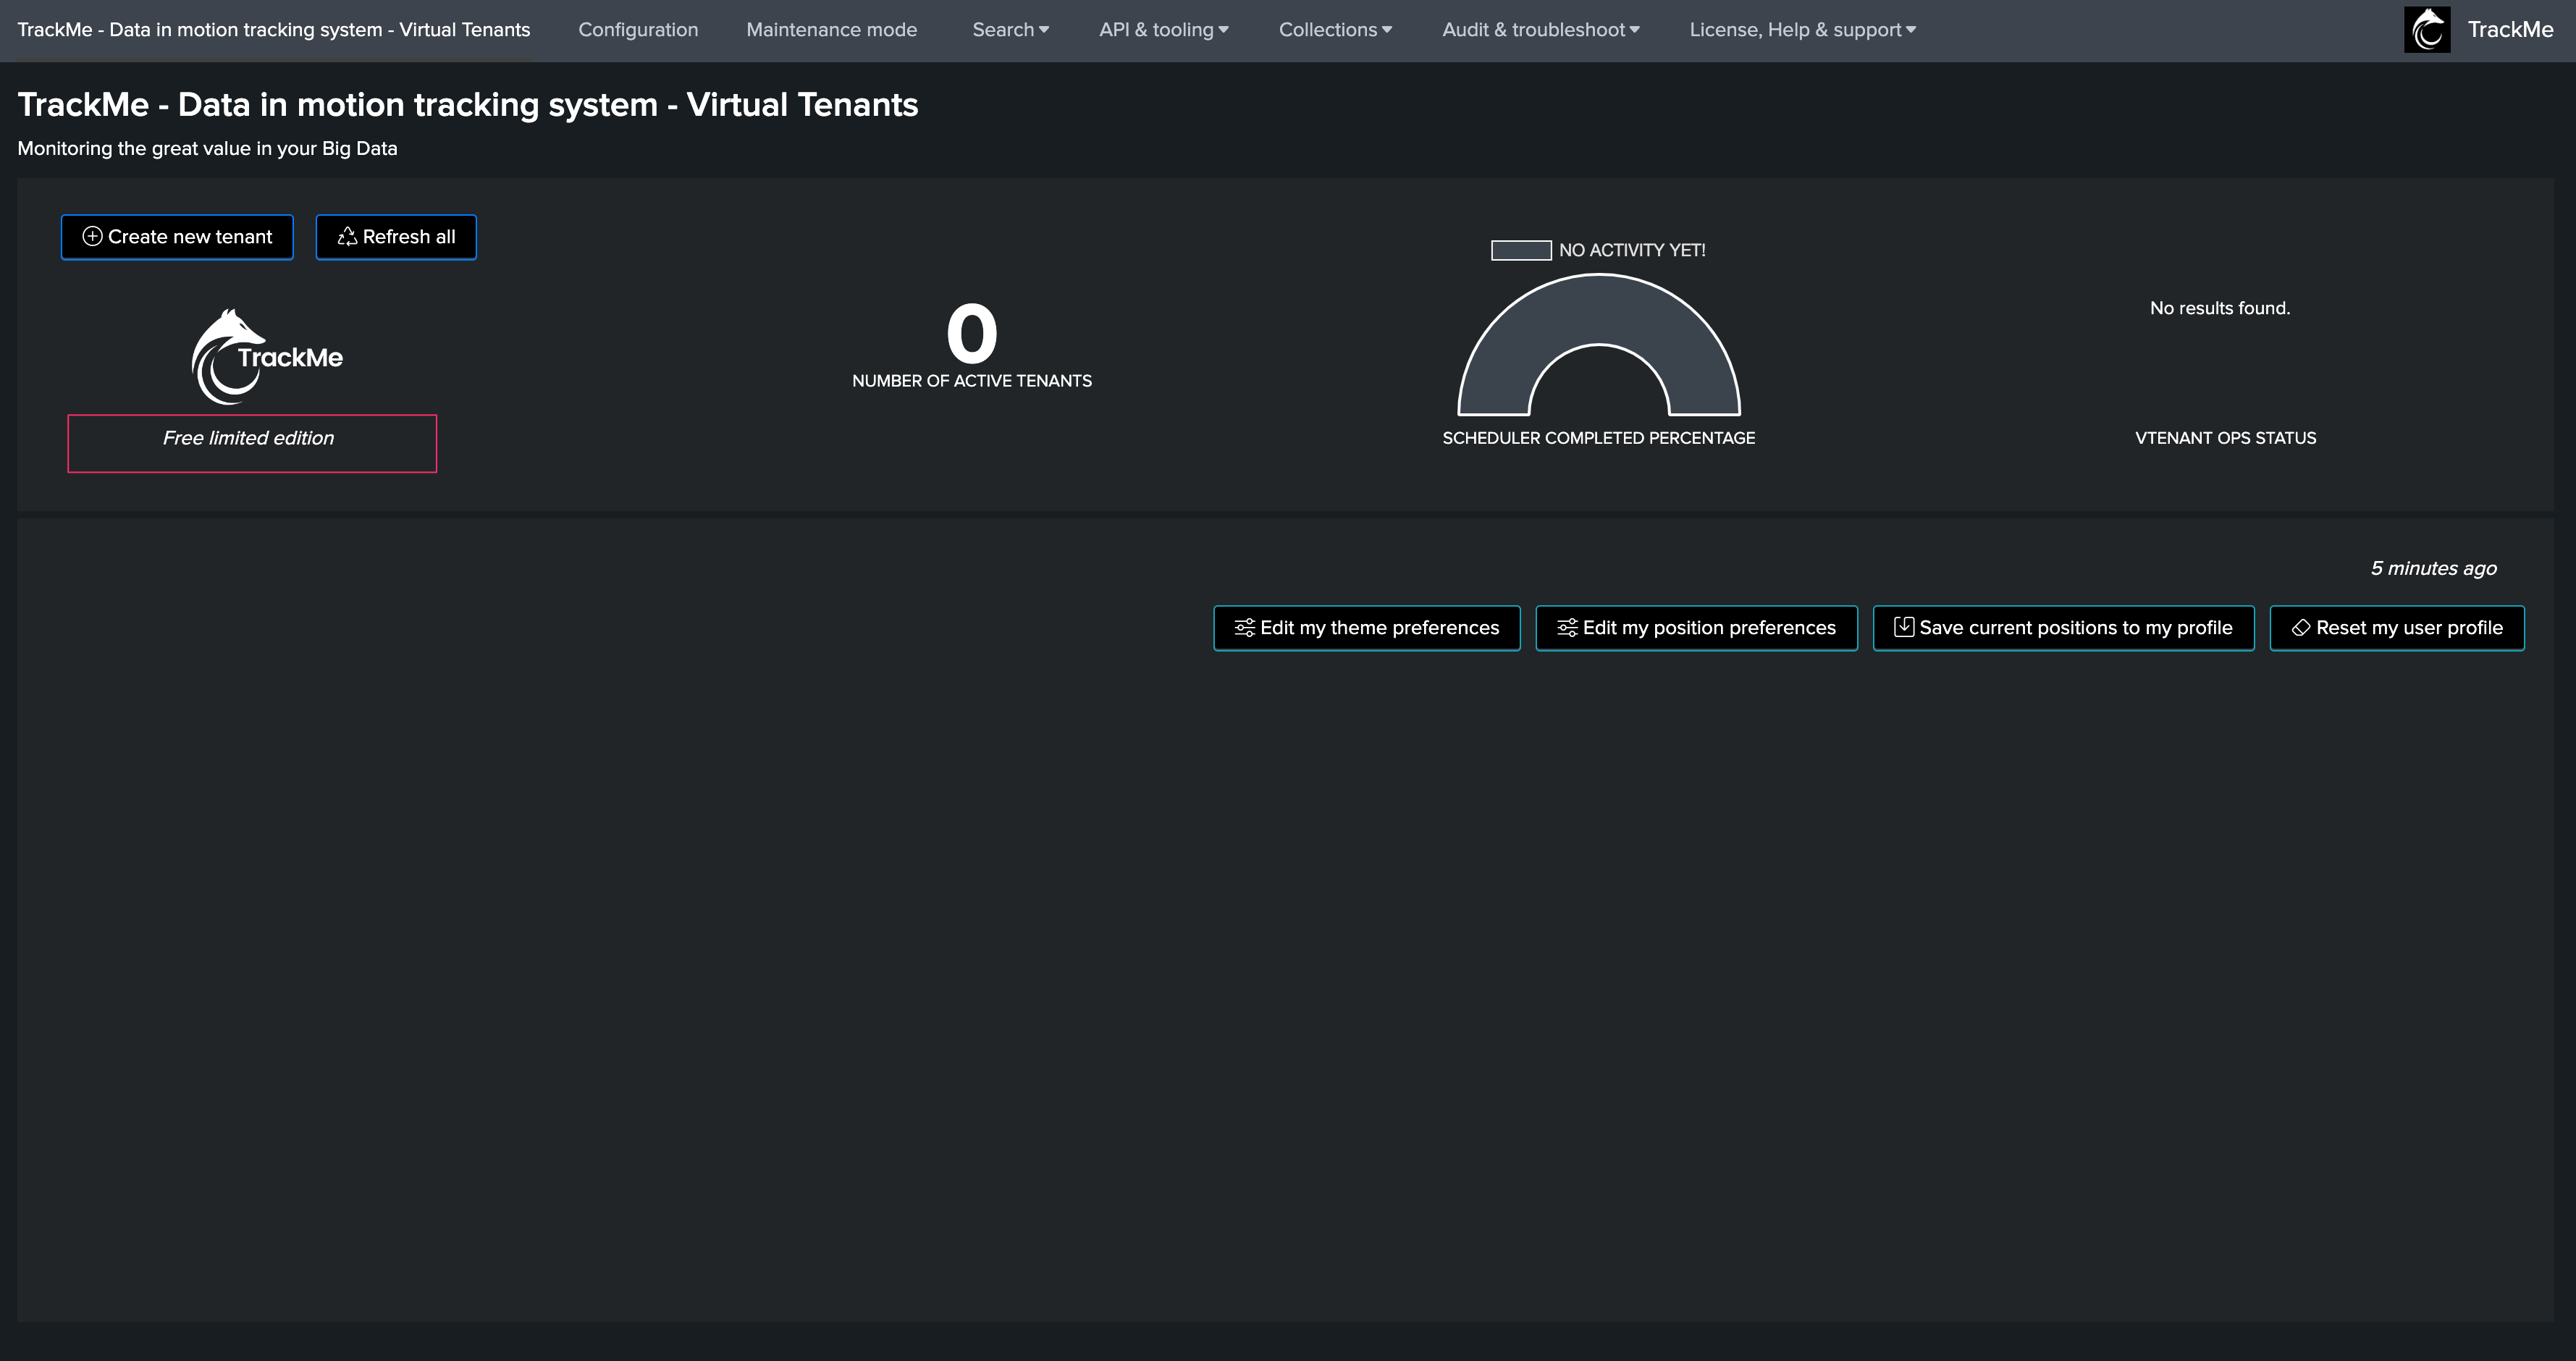
Reviewing latency and delay in TrackMe
TrackMe Tabulator
When accessing TrackMe main user interface, several information related to the latency and delay are displayed in the Tabulator:
For each entity:
The column “lag (event / ingest)” provides a summary of delay and latency (in this order)
The column “Latest event” informs about the latest event that was detected by TrackMe (therefore, the latest event from the _time perspective)
The column “Latest ingest” informs about the latest event that was indexed (therefore, the max value of _indextime)
The column “Delay max” is the current threshold value for the delay
The column “Lag max” is the current threshold value for the latency
TrackMe entity view
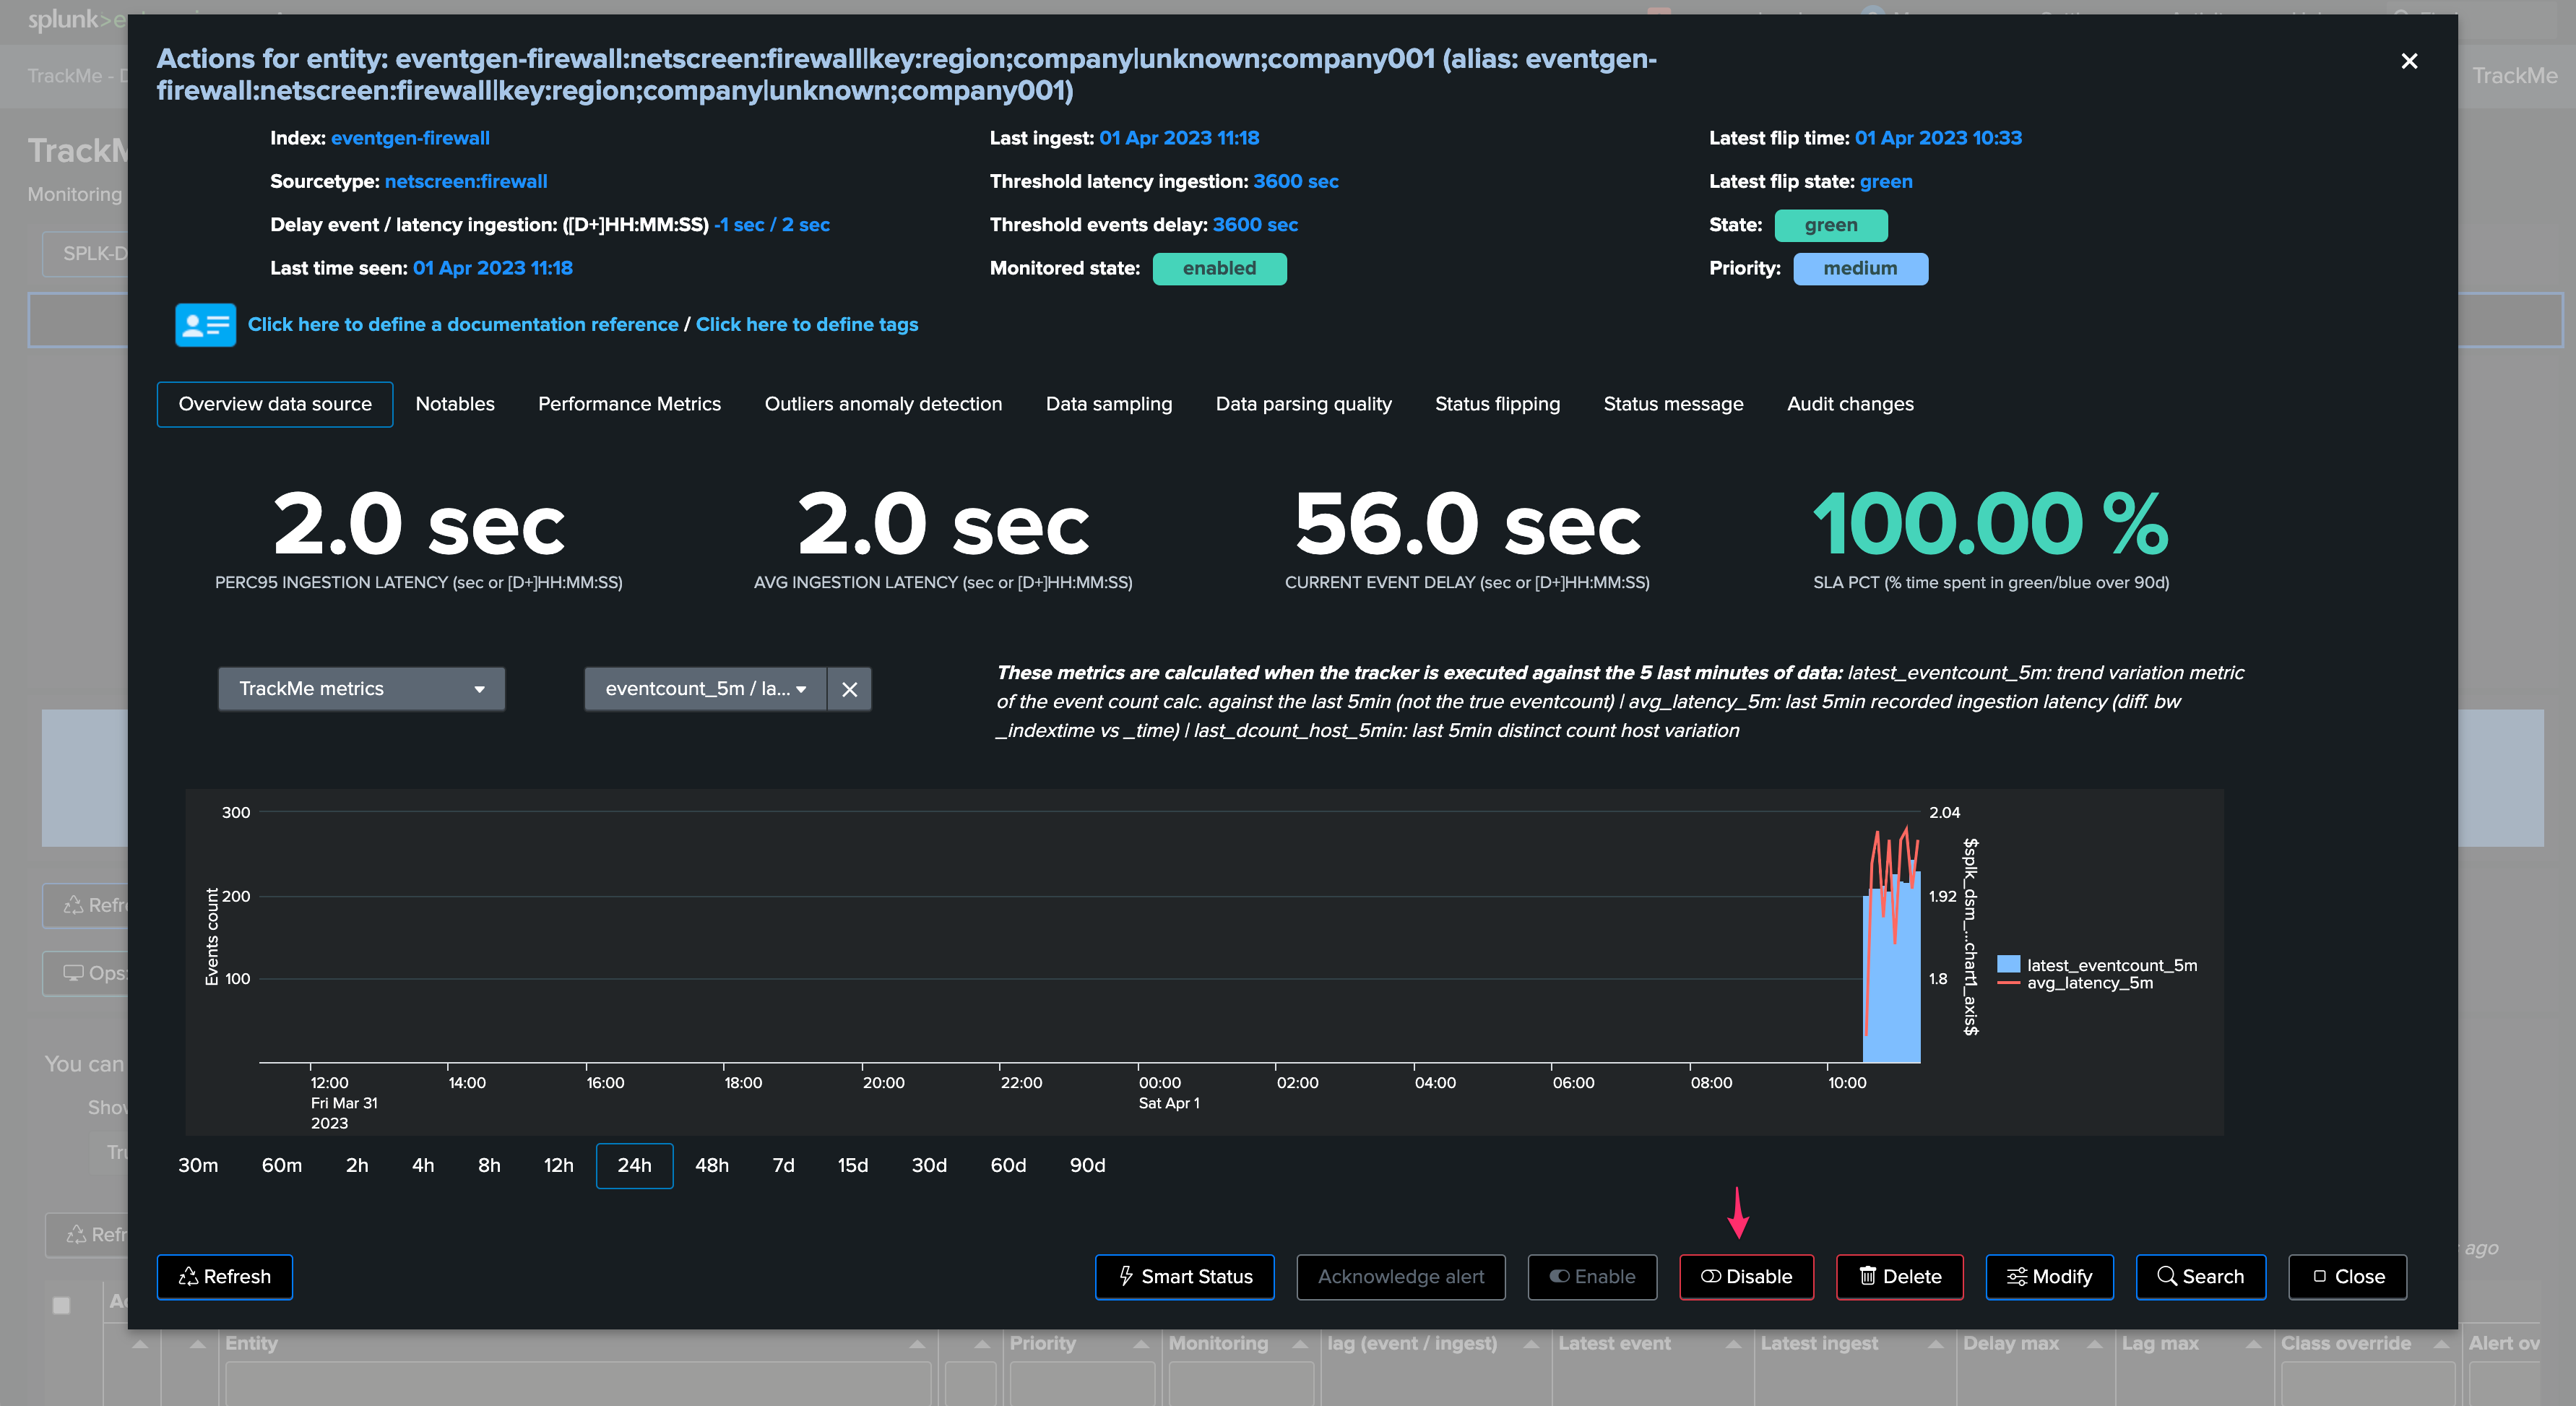
When opening the main screen of an entity, more information is provided for that entity especially:
Let’s describe the top information first:

Delay event / latency ingestion: ([D+]HH:MM:SS): shows the current and latency, these are shown as duration (the Splunk function tostring duration) if the the value exceeds 60 seconds
Last time seen: shows the last event seen, from the _time perspective
Last ingest: shows the last indexed event, from the _indextime perspective
Then we have some high level single view statistics:
These statistics are calculated against either the TrackMe metrics, or direct Splunk queries against the data sources (see the next section):
PERC95 INGESTION LATENCY (sec or [D+]HH:MM:SS) Shows the percentile 95 calculation against the latency
AVG INGESTION LATENCY (sec or [D+]HH:MM:SS) Shows the average calculation against the latency
CURRENT EVENT DELAY (sec or [D+]HH:MM:SS) Shows the current delay for the entity
Finally, we have the over time charts:
Source data for the calculation in TrackMe overview entity screen:
The left dropdown selector allows to operate between two modes:
TrackMe metrics
Splunk queries
TrackMe metrics
When using TrackMe metrics, the overview relies on the metrics that Hybrid Trackers generate and index in the TrackMe metric index defined for this tenant.
You can access the metric index from the Virtual Tenant user interface (indexes shortcuts), otherwise use the following search:
| mpreview `trackme_metrics_idx(mytenant)` filter="tenant_id="mytenant""
where “mytenant” is to be replaced with the name of the Virtual Tenant.
Metrics are prefixed with “trackme_trackme.splk.feeds.”, you can as well use the mcatalog command:
| mcatalog values(metric_name) as metrics where index=trackme_metrics metric_name=trackme.splk.feeds.*
Splunk Queries
When using Splunk Queries, the overview performs direct queries against Splunk data, consider that:
These queries process Splunk data directly (most of the time these will be tstats based queries)
Processing require more time than using TrackMe metrics (which are very performing mstats based searches), the user experience is much slower
Long time range searches on very large environment will likely not be doable in reasonable amount of time, unlike TrackMe metrics
This requires access to the indexes, unlike TrackMe Metrics
For the most optimized experience and fastest results, use TrackMe metrics.
Performance metrics tab
The “Performance metrics” tab provides a deeper access to all TrackMe metrics:
Conclusion on latency and delay
TrackMe stands out for its consistent and scalable approach to addressing a critical challenge faced by Splunk customers.
Monitoring latency and data flow interruptions is crucial for maintaining the quality and reliability of the insights gained from Splunk.
Latency and data flow interruptions can have severe consequences, leading to inconsistent results and jeopardizing the business and security detections that rely on the Splunk platform. Being proactive in detecting and addressing latency and delay issues is essential for successfully managing and operating large-scale Splunk environments.
By utilizing TrackMe, organizations can effectively monitor and manage latency and delay, ensuring that the data driving their decisions and actions remains accurate and up-to-date, ultimately improving their overall Splunk experience.