Use TrackMe to detect abnormal events count drop in Splunk feeds
Detecting abnormal events count drop in Splunk feeds with TrackMe
This TrackMe whitepaper tutorial demonstrates how you can leverage TrackMe to detect abnormal events count drop in Splunk feeds.
It is a frequent use case requested by TrackMe users. The goal is to be able to easily detect when a feed in Splunk is facing a significant drop in the amount of events received.
A massive drop in a given feed, whether you look at this from the index perspective or different factors, can be a sign of a problem in the data ingestion pipeline, or even a sign of a problem in the data source itself.
TrackMe tackles this challenge in different ways, notably by leveraging Machine Learning driven anomaly detection.
In this tutorial, we will cover the different options available to licensed and unlicensed TrackMe users.
This tutorial demonstrates use cases around Machine Learning Outliers detection. For deeper insights, refer to the following documentation: Outliers Anomaly Detection.
In this tutorial, we will review the out-of-the-box features of the splk-dsm component as well as an additional use case for licensed customers leveraging the splk-flx component.
Hint
Before we start, let’s summarize our 3 main options and features in TrackMe:
splk-dsm: Out-of-the-box component for feeds tracking, performs Machine Learning based Anomaly Detection against the events count metrics driven by the ingest.
splk-flx (licensed customers): Flex Object tracker component, allows you to orchestrate any kind of SPL logic, translates results into TrackMe entities, turning these into Key Performance Indicators (KPIs) and applying Machine Learning based Anomaly Detection.
Use case 1 with Flex: We will demonstrate how to use the Flex Object tracker to track the events count of Splunk feeds, and apply Machine Learning based Anomaly Detection against these metrics. (These use cases have been added to the Flex Object library in TrackMe 2.0.89)
Use case 2 with Flex: We will demonstrate how to use the Flex Object tracker to track the license usage volume metrics of Splunk feeds, and apply Machine Learning based Anomaly Detection against these metrics.
Objective: Detecting abnormal events count drop in Splunk feeds
Our objective can be summarised in a few charts, as bellow:
Our feed is still making it to Splunk, we get events but the number of events received has significantly decreased:

Let’s highlight the main challenges:
Feeds behaviors: All feeds can act differently. Some are continuous with very stable volumes, while others are much more volatile and can slightly change depending on the period of the day or time.
Scalability: We need to be able to scale our detection with no restrictions.
Pipeline abstraction: We also possibly need to abstract the pipeline from the feed itself. Depending on your requirements, the main factors could be simply based on indexes, combinations of indexes and sourcetypes, or even more complex factors.
Distinguishing between normal and abnormal behaviors: Feeds suffering from an abnormal drop in events count are still likely sending events to Splunk. This is a different and more complex use case than tracking feeds interruption.
What does TrackMe do out of the box? (feeds tracking with splk-dsm)
TrackMe provides a main component for data sources tracking (splk-dsm) which performs this detection out of the box:
When you configure the splk-dsm component, TrackMe performs an association of factors (by default indexes and sourcetypes), creates and maintains entities for each factor, called TrackMe entities.
Part of the Outliers Anomaly detection framework, TrackMe creates and maintains automatically Machine Learning models based on the events count metrics:
splk.feeds.avg_eventcount_5mDefault system wide settings for the Machine Learning models are applied when TrackMe discovers a new entity.
From this stage, TrackMe will continuously monitor the events count and apply Machine Learning based Anomaly Detection against these entities.
Machine Learning models can fine-tune on a per entity basis, and different concepts such as ML confidence are actionned by TrackMe to limit the risk of false positives.
When a given entity is detected as an anomaly, this defines a flag
isAnomalywhich influences the global entity health status, turning possibly an entity fromgreentored.
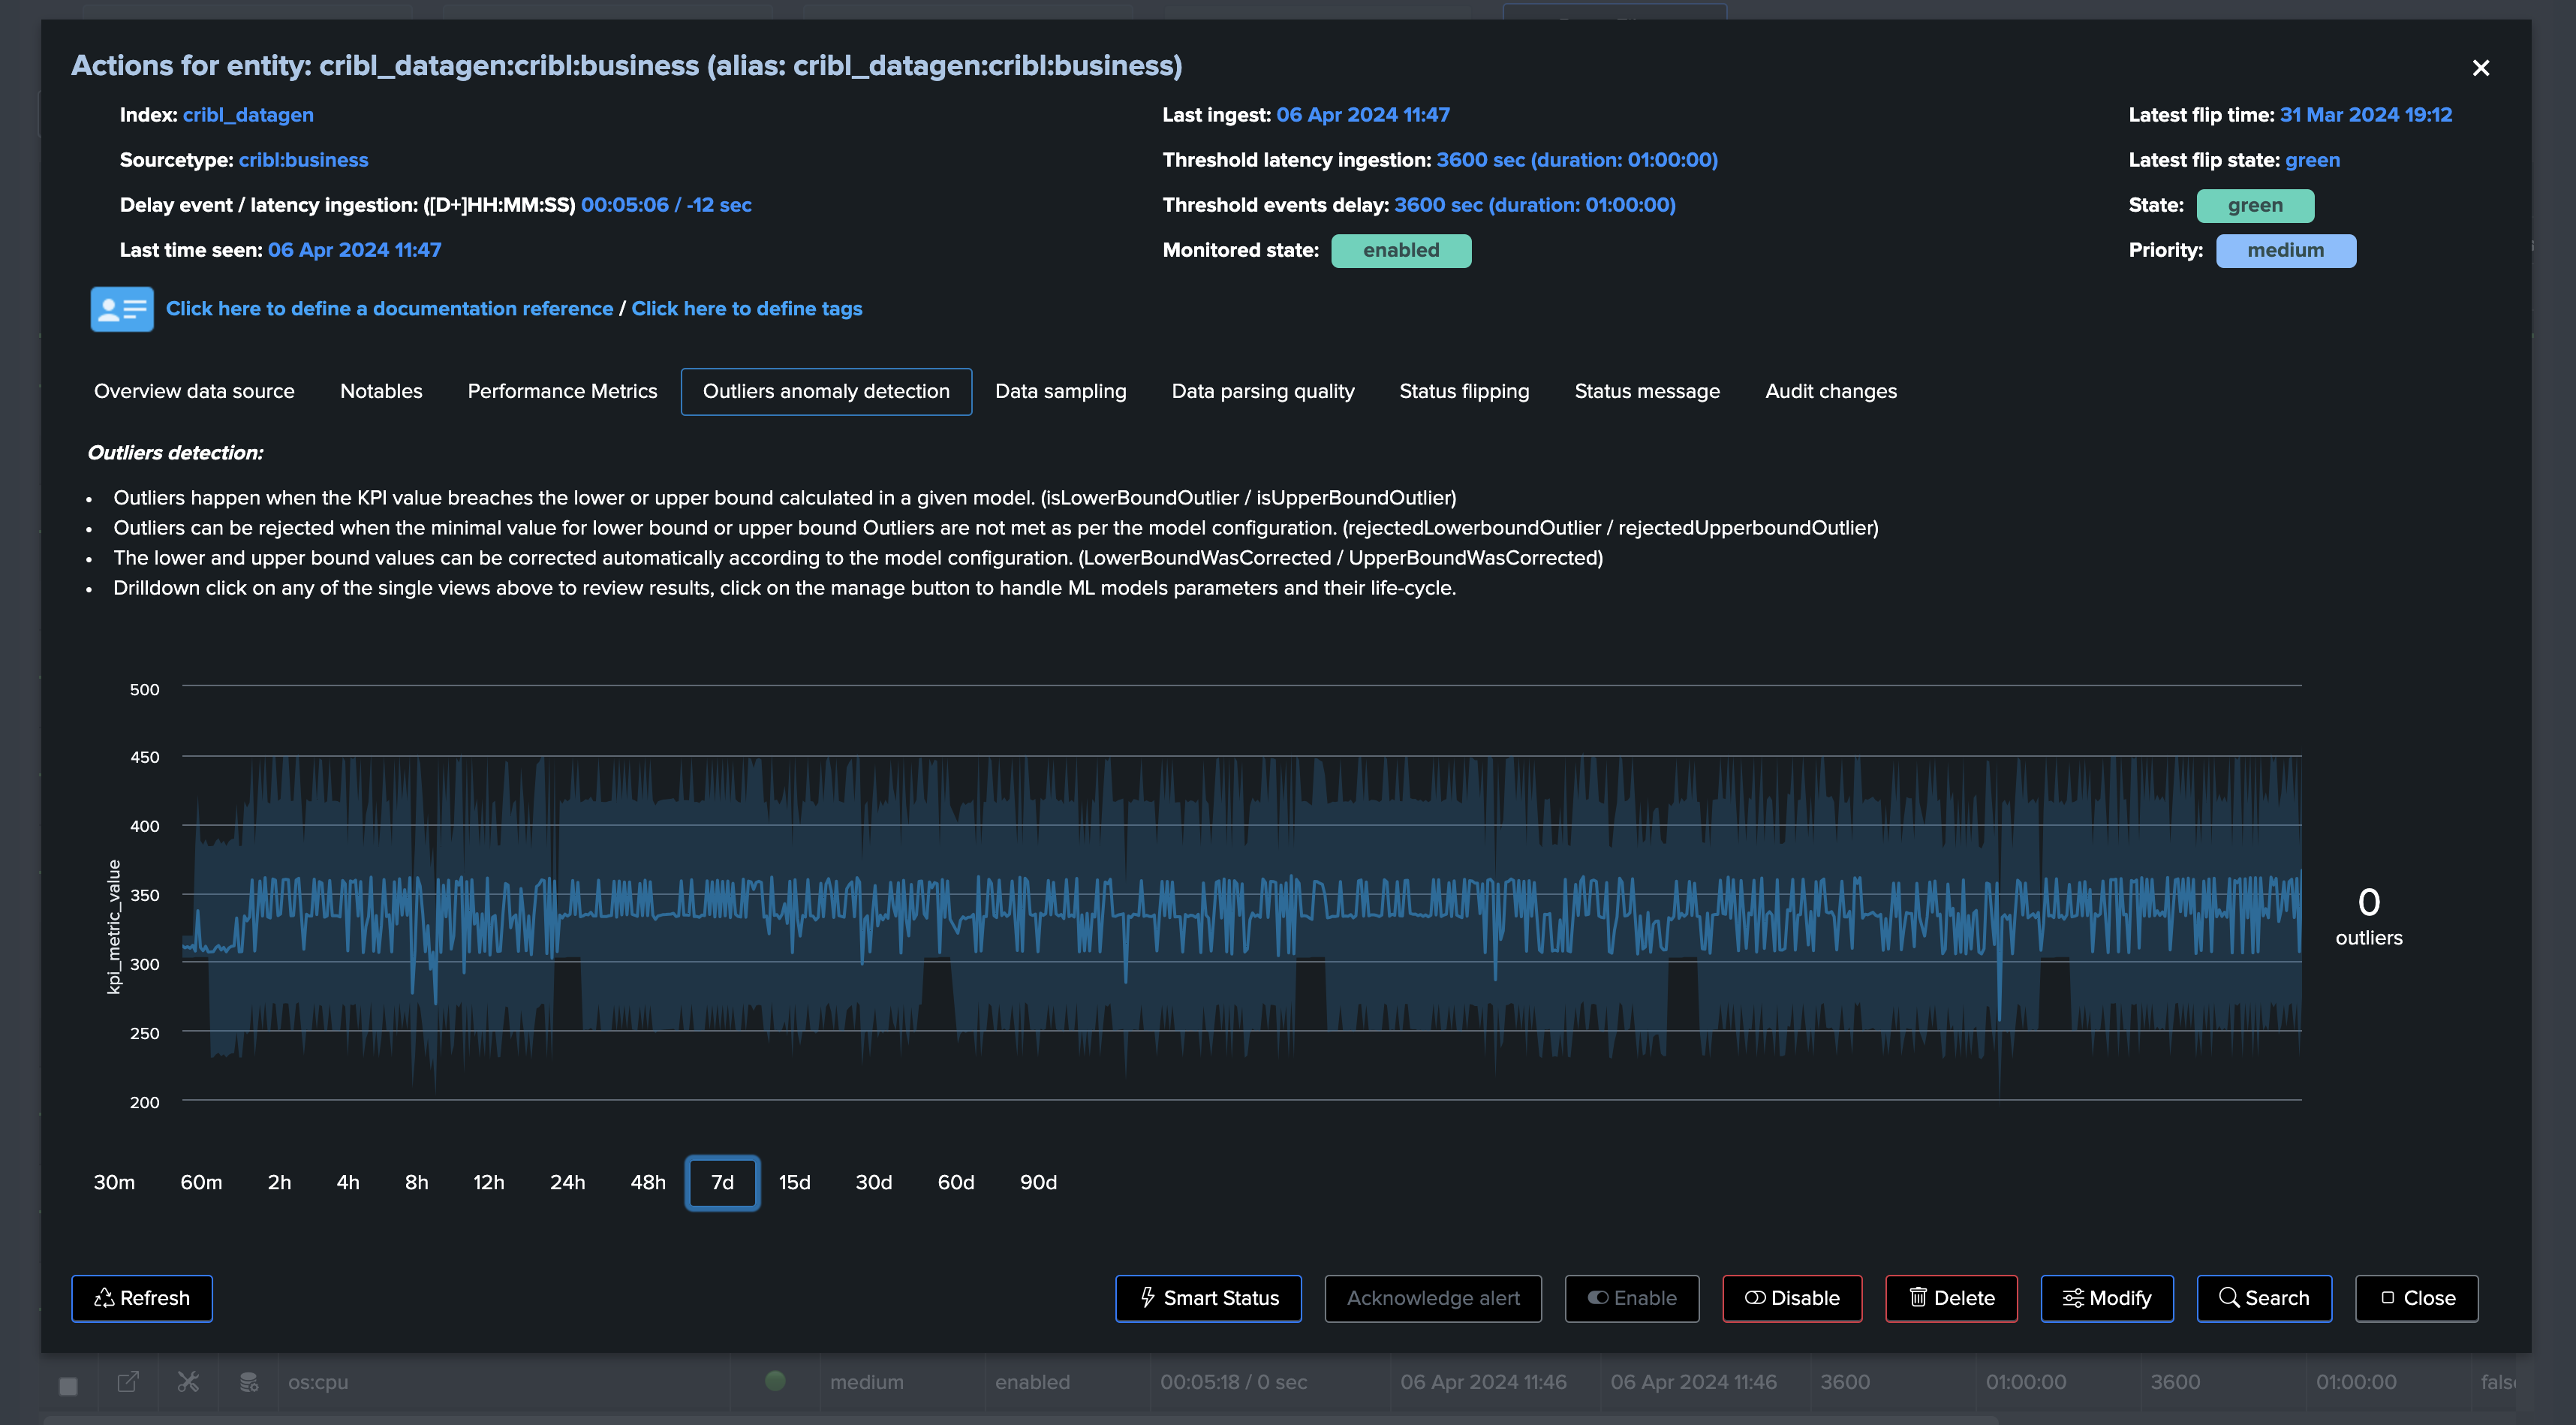
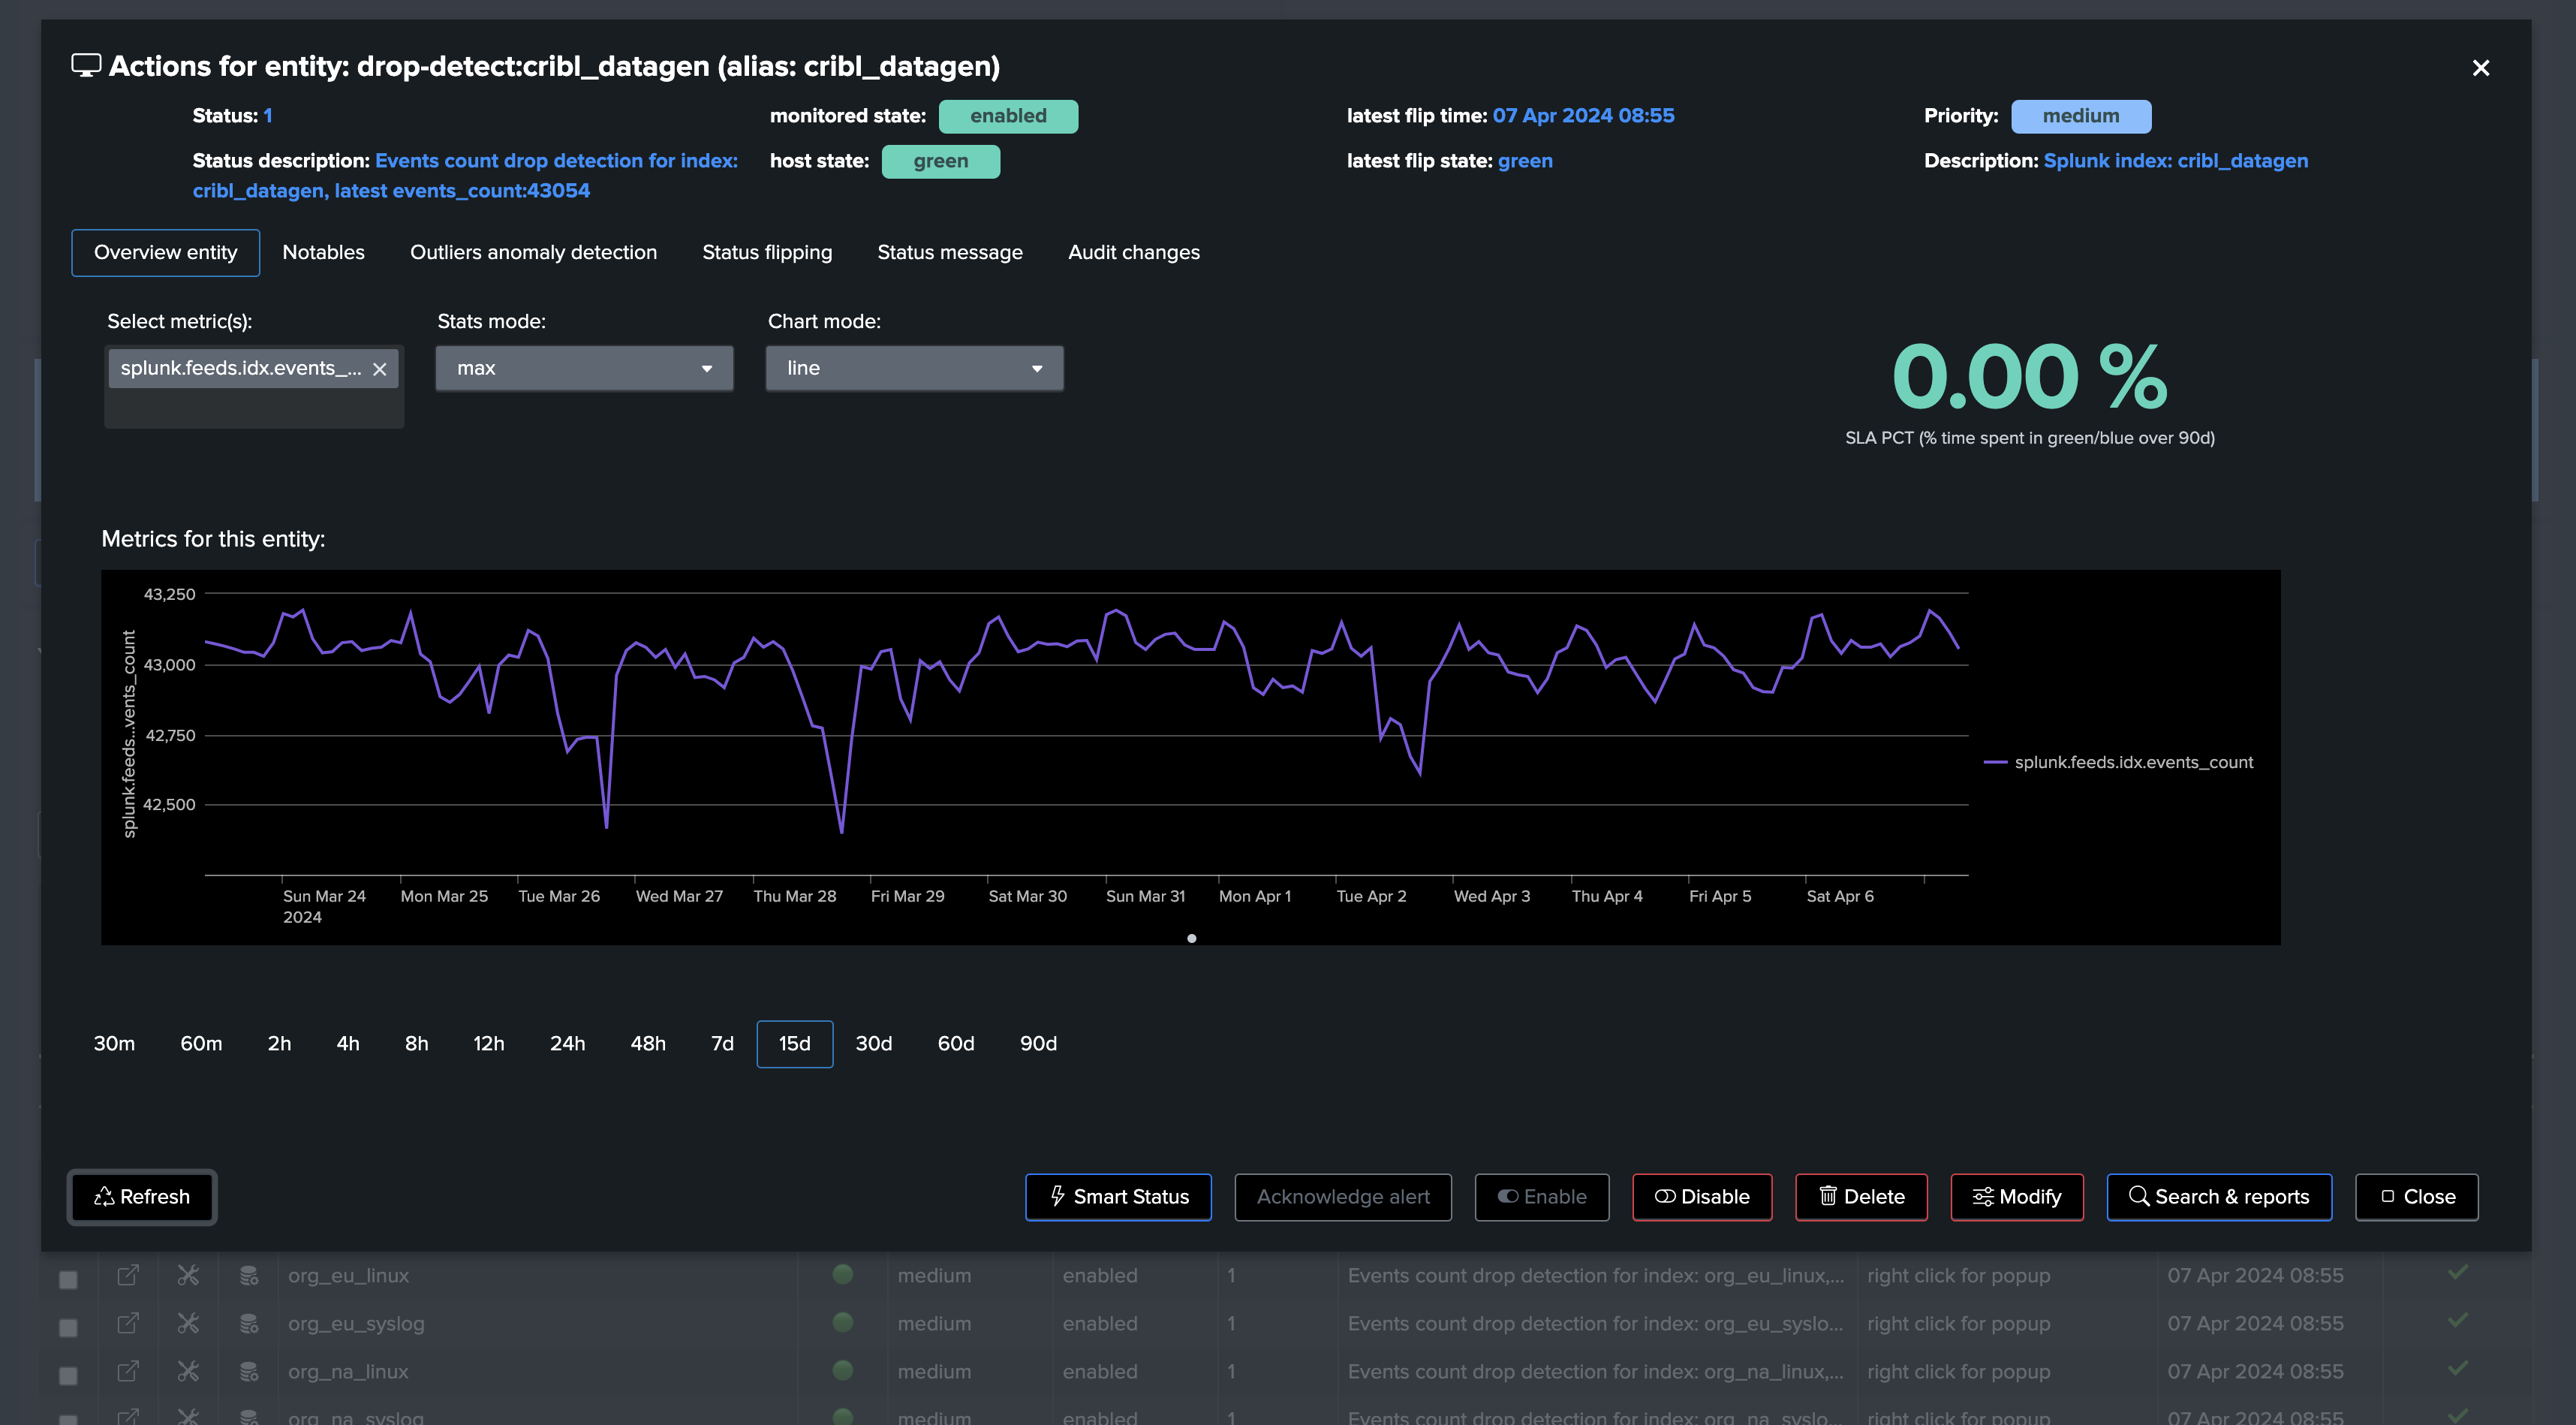
The example below shows a TrackMe data source entity, conditioned by the couple index/sourcetype:
We can observe a slight decrease in the events count. However, this may be normal behavior depending on the period of the week day:

Using merged mode, you can also consider all sourcetypes while using the splk-dsm component to track feeds:
Let’s take an additional use case, and let’s look at a quite continuous and stable feed:
In this example, we have a feed which is characterized by a quite stable and continuous activity in terms of events count.
Therefore, it does not really have a seasonality concept that we should be taking into account.
We can fine-tune the associated Machine Learning model to use time_factor: None which will disable the seasonality concept.
The performance metrics view shows the event count by the ingest over time:
The current Machine Learning model is configured with the default time factor: %H:
By applying time_factor: None, we can disable the seasonality concept, note that TrackMe eventually performs correction if it finds out that the drop is not significant enough to avoid false positives:
More information about this feature in TrackMe
These metrics are driven by the ingestion. (rolling ingest per 5 minutes)
Therefore, this is not a strict event counts for a given time period, but instead these metrics demonstrate the ingest behaviour of the feeds from the event counts perspective.
You can define the default models definition, such as the time_factor which conditions how TrackMe handles the seasonality of the events in a given feed.
You can also define the default time period to be considered when TrackMe trains the models.
Finally, each model can individually be fine-tuned as needed, you can specify many settings on per model basis which will apply against a given entity especially.
In conclusion, detecting abnormal events count drop is an out of the box feature of feeds tracking (splk-dsm), so technically TrackMe performs this activity by default and without the need for any extra configuration!
Flex Object (splk-flx): Detect abnormal events count drop using Flex
Hint
Flex Object tracker use case to monitor and detect abnormal events count drop
The Flex Object tracker component is a very flexible and powerful restricted component of TrackMe. (splk-flx)
These capabilities are available for licensed customers only.
These use cases were added to the Flex Object library in TrackMe 2.0.89.
It allows to orchestrate any kind of SPL logic, translates results into TrackMe entities, turning these into Key Performance Indicators (KPIs) and applying Machine Learning based Anomaly Detection.
Because you have full control and within this use case context, we can use a very efficient and costs optimised
tstatssearch to track the event count of Splunk feeds according to our needs.These metrics will be more “simple” compared to what does the spl-dsm component, these won’t be driven by the ingest but will be strict events counts over a specific time window.
Equally, we will define the default definition for the Machine Learning models, which can then still be fine-tuned on a per entity basis.
Finally, because you have full control, you totally define what an entity should, whenever you want to consider indexes as whole, or more complex scenarios.
One advantage here is that we do not have to break against granular time concepts to calculate complex metrics such as the latency, so we can create very efficient searches with the lowest cost in compute.
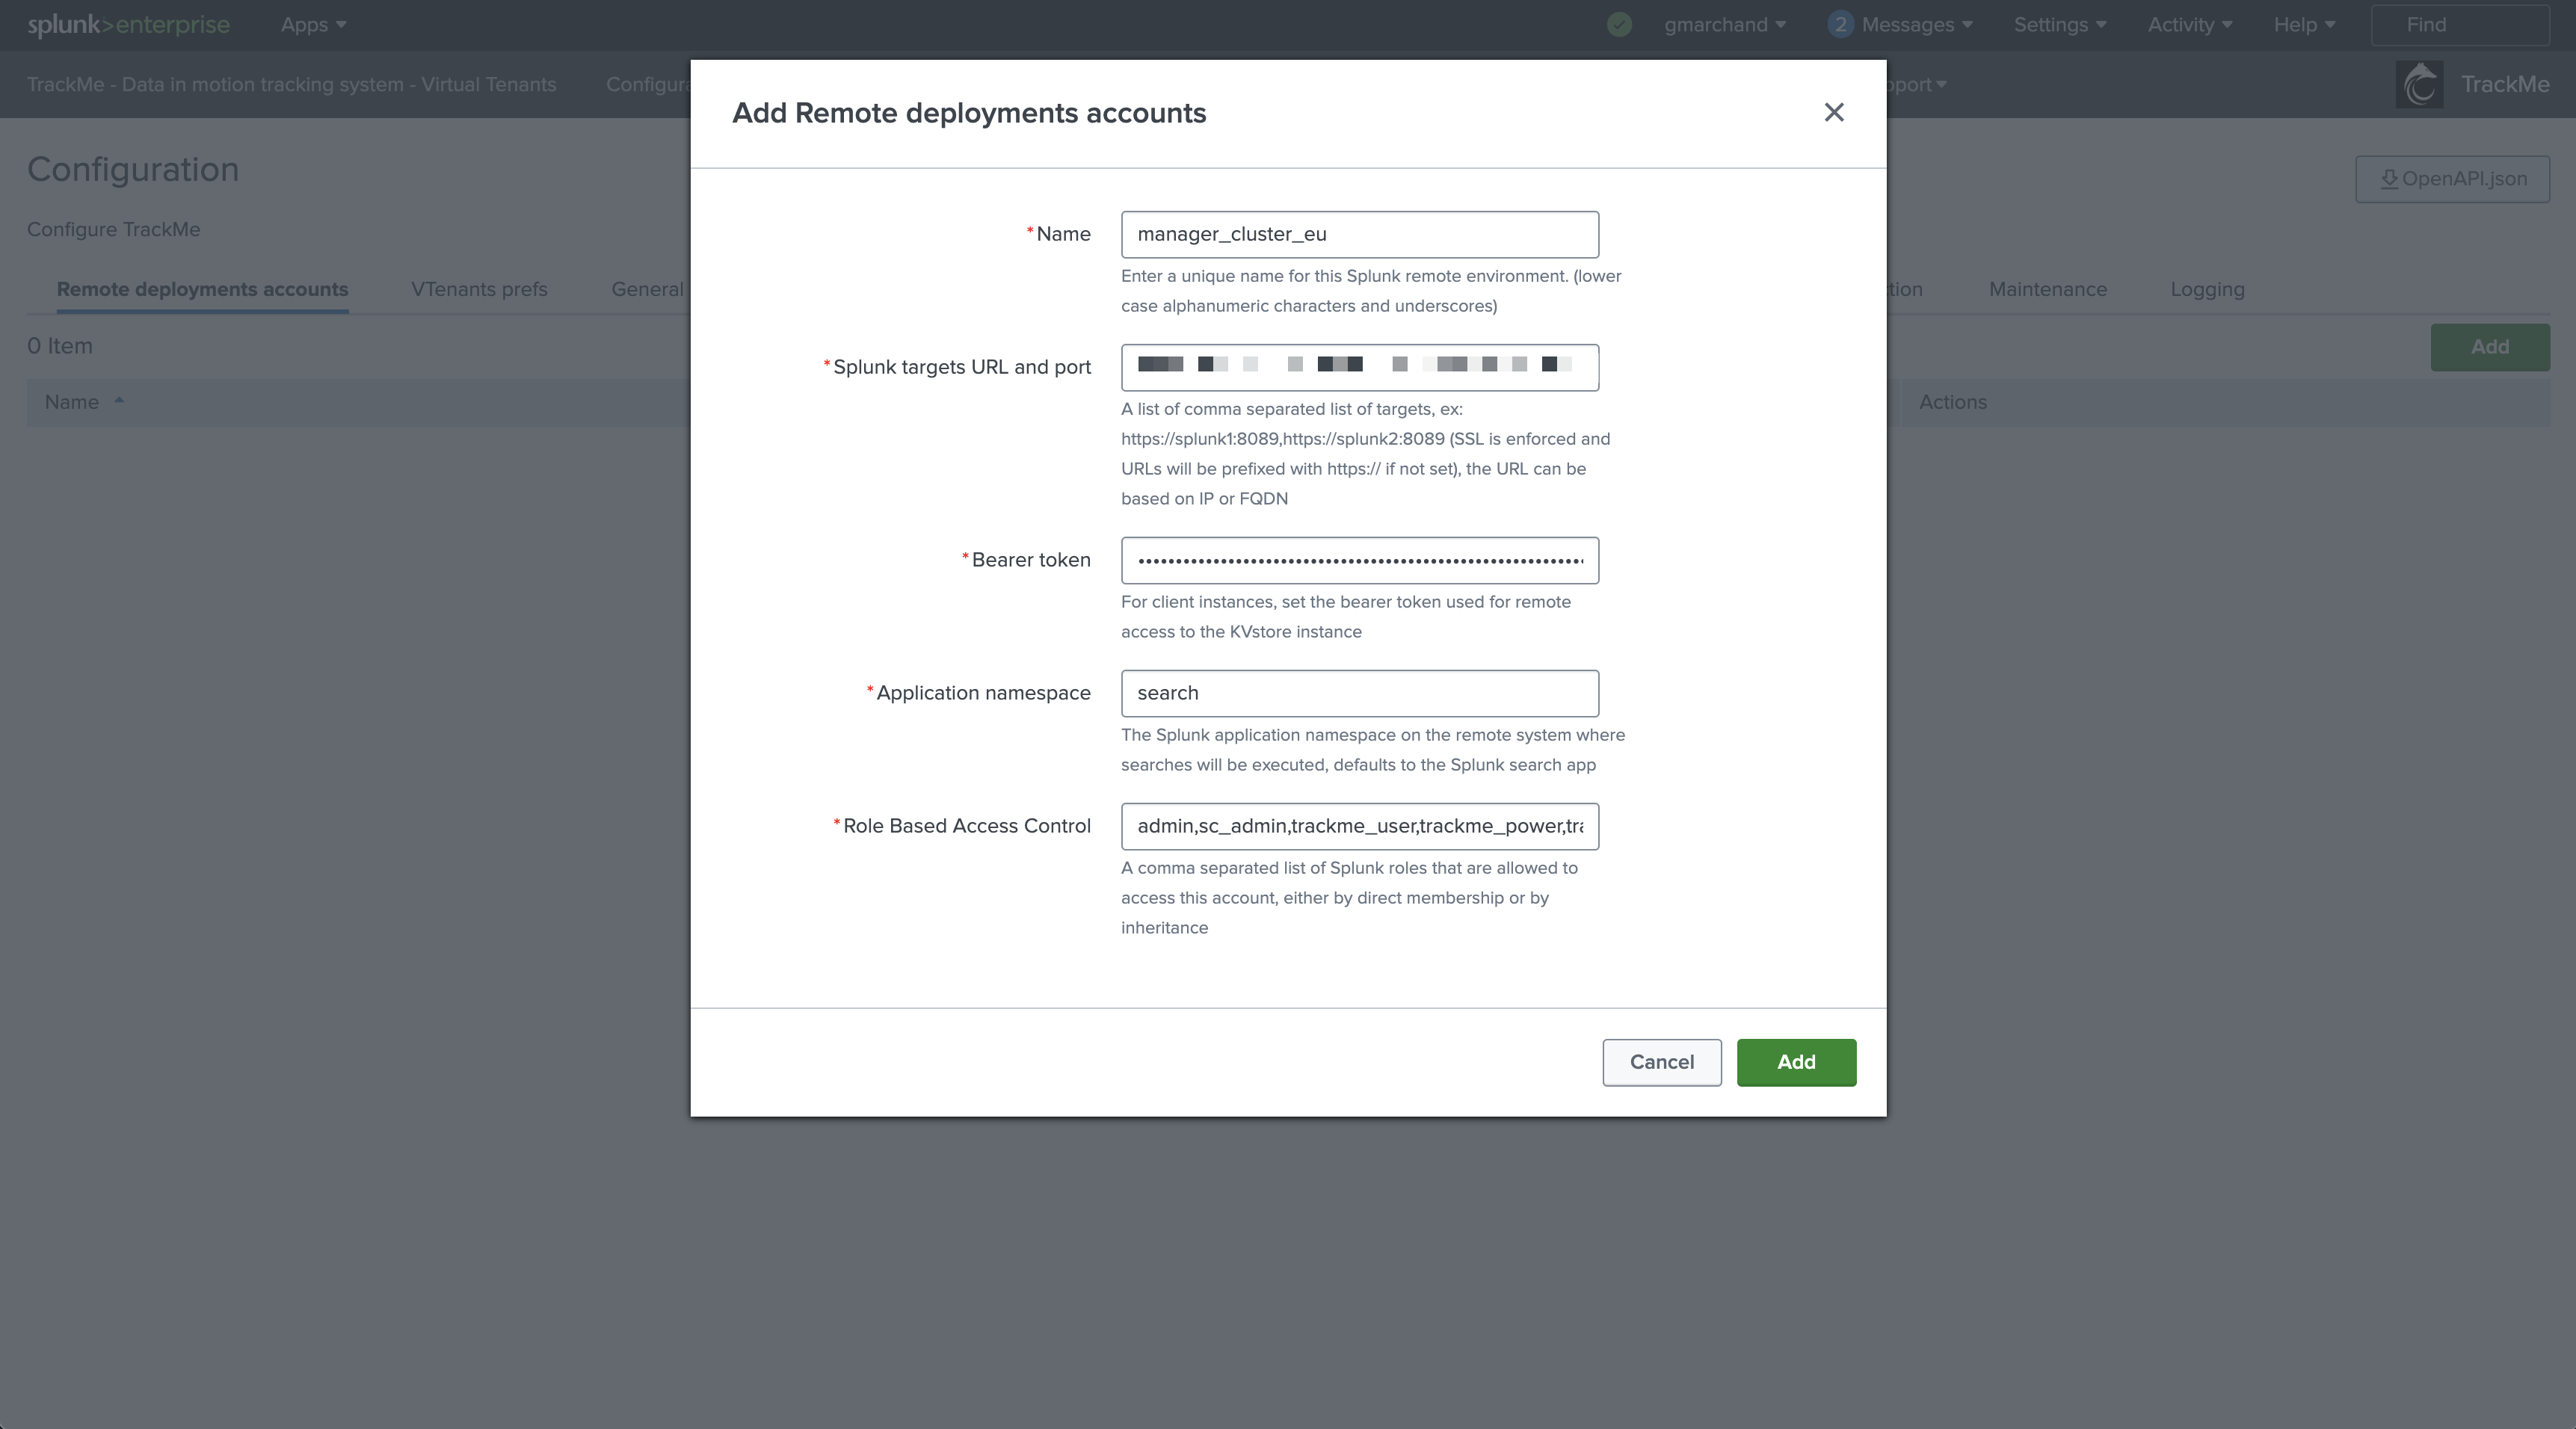
First, let’s create a new Virtual Tenant
Depending on your needs and preferences, you can add the component to any existing Virtual Tenant, or dedicate a new Virtual Tenant for this use case.
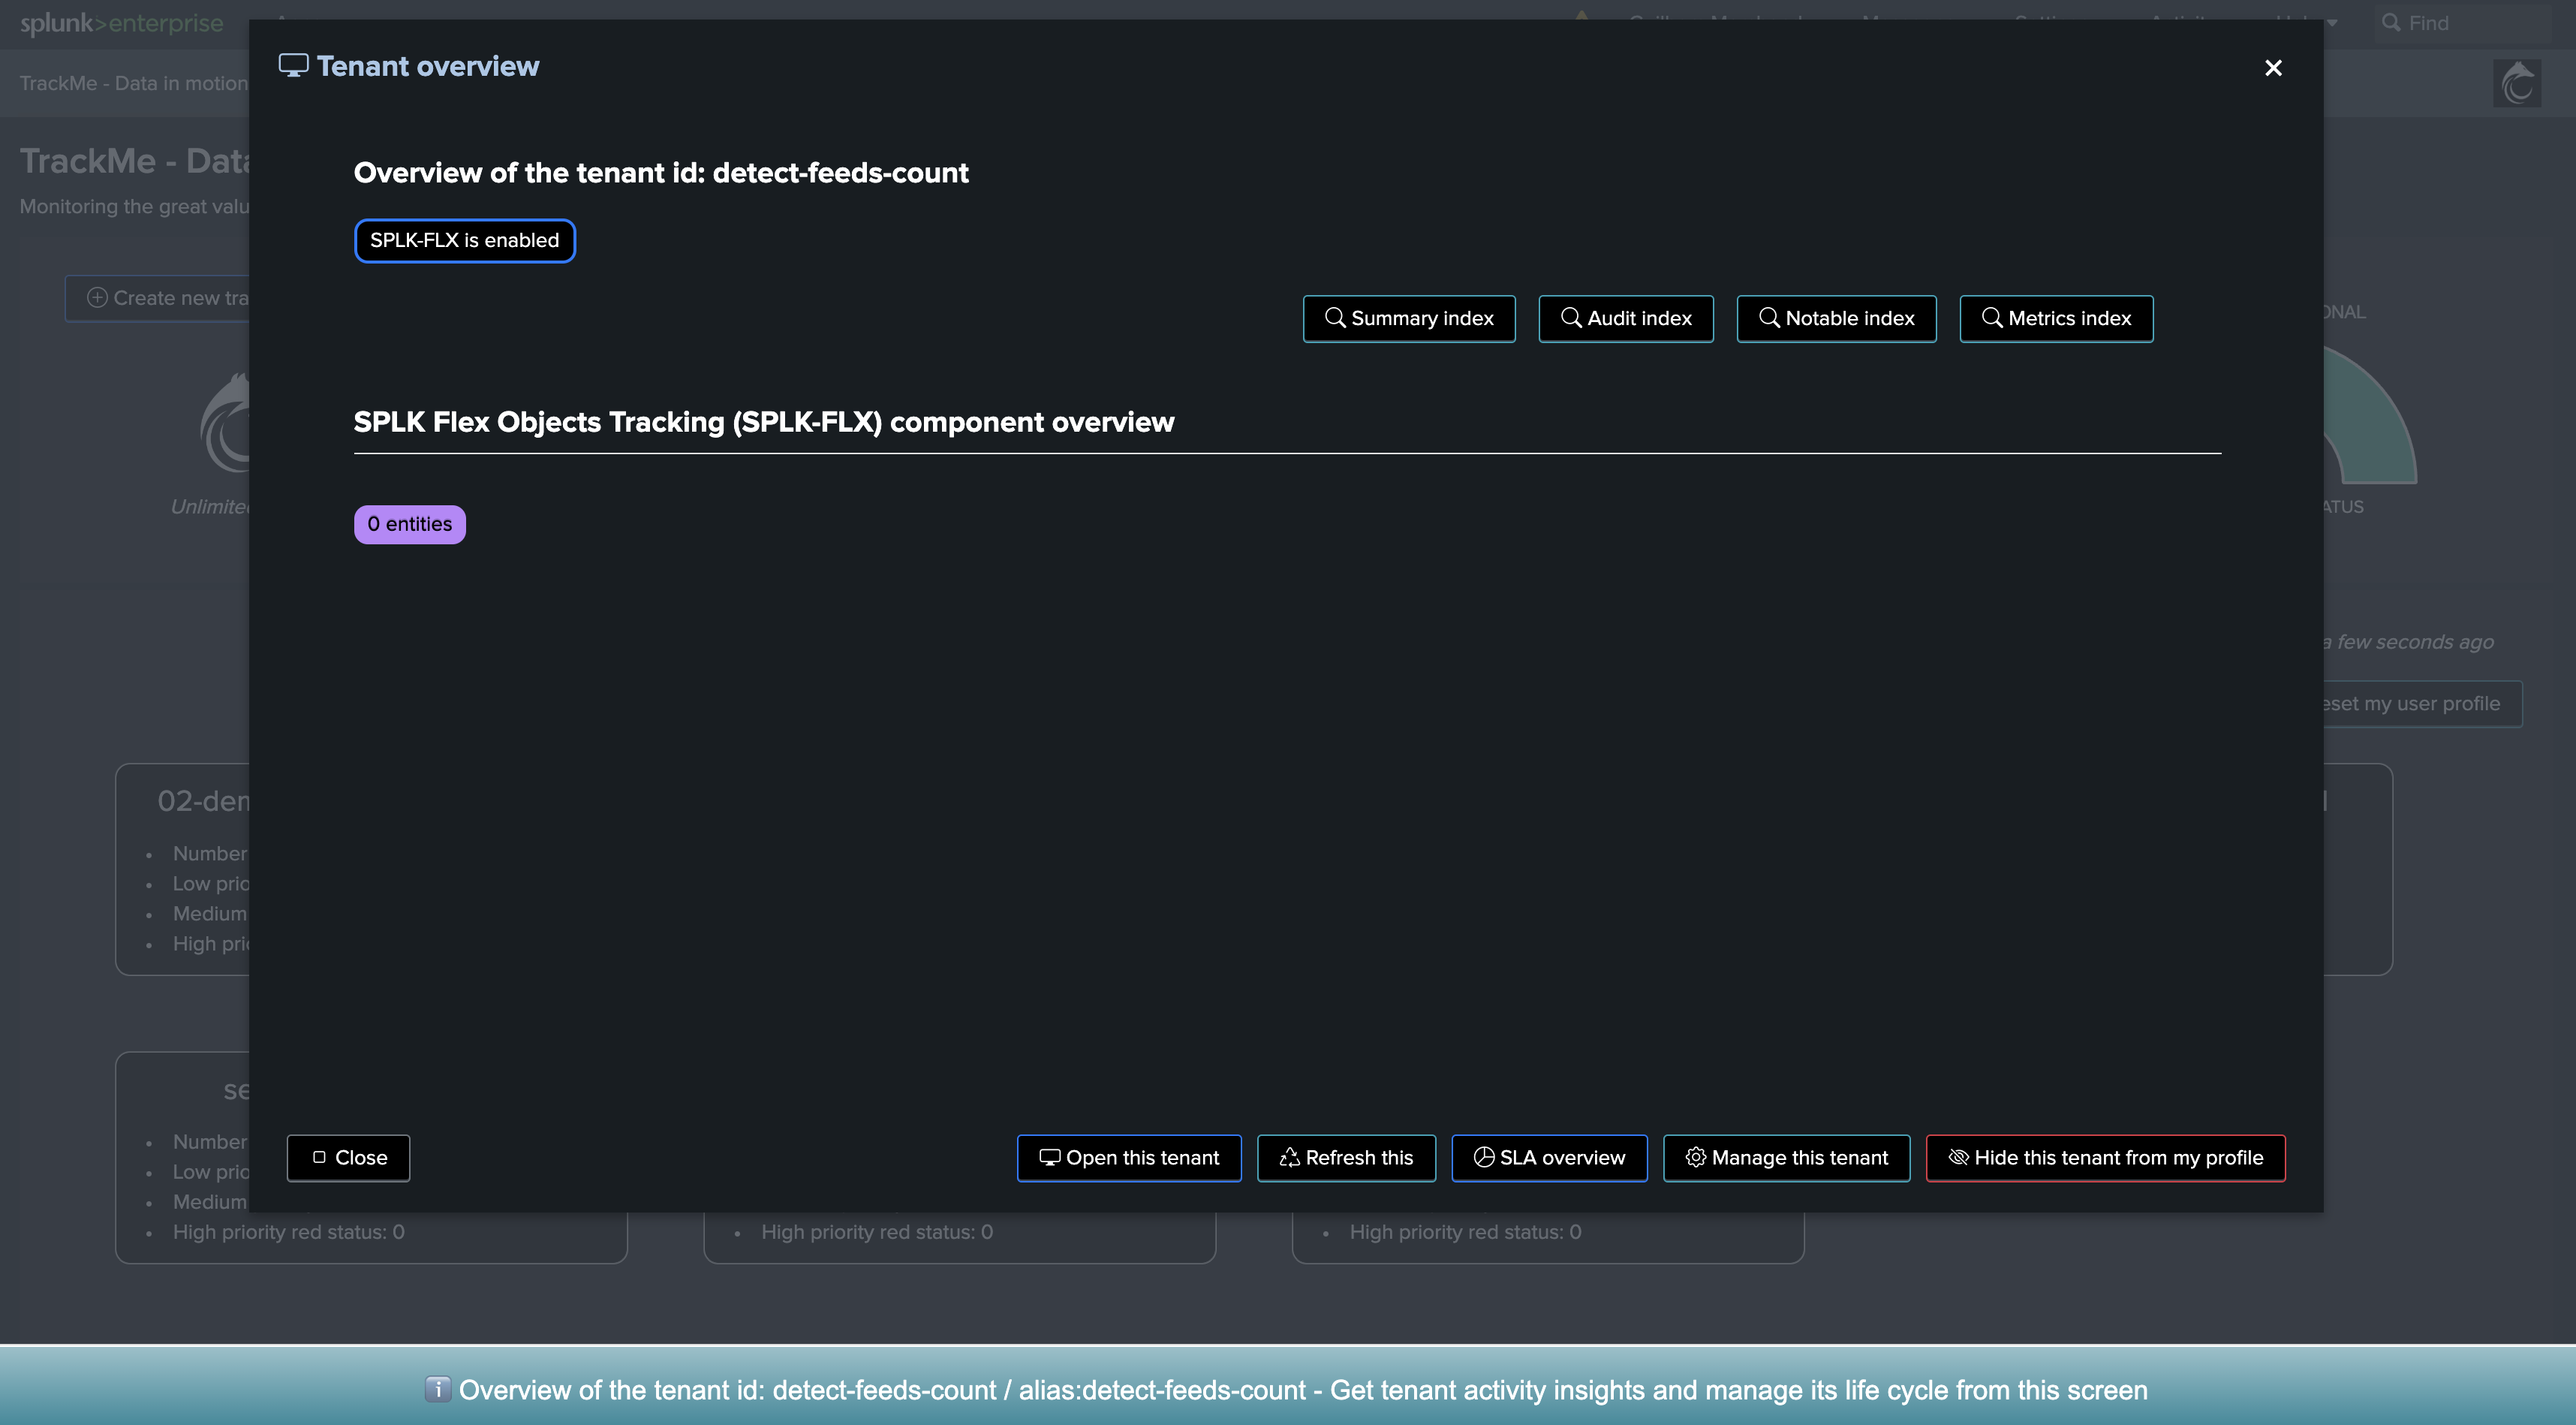
For the purposes of the documentation, we will create a new Virtual Tenant called detect-feeds-count.
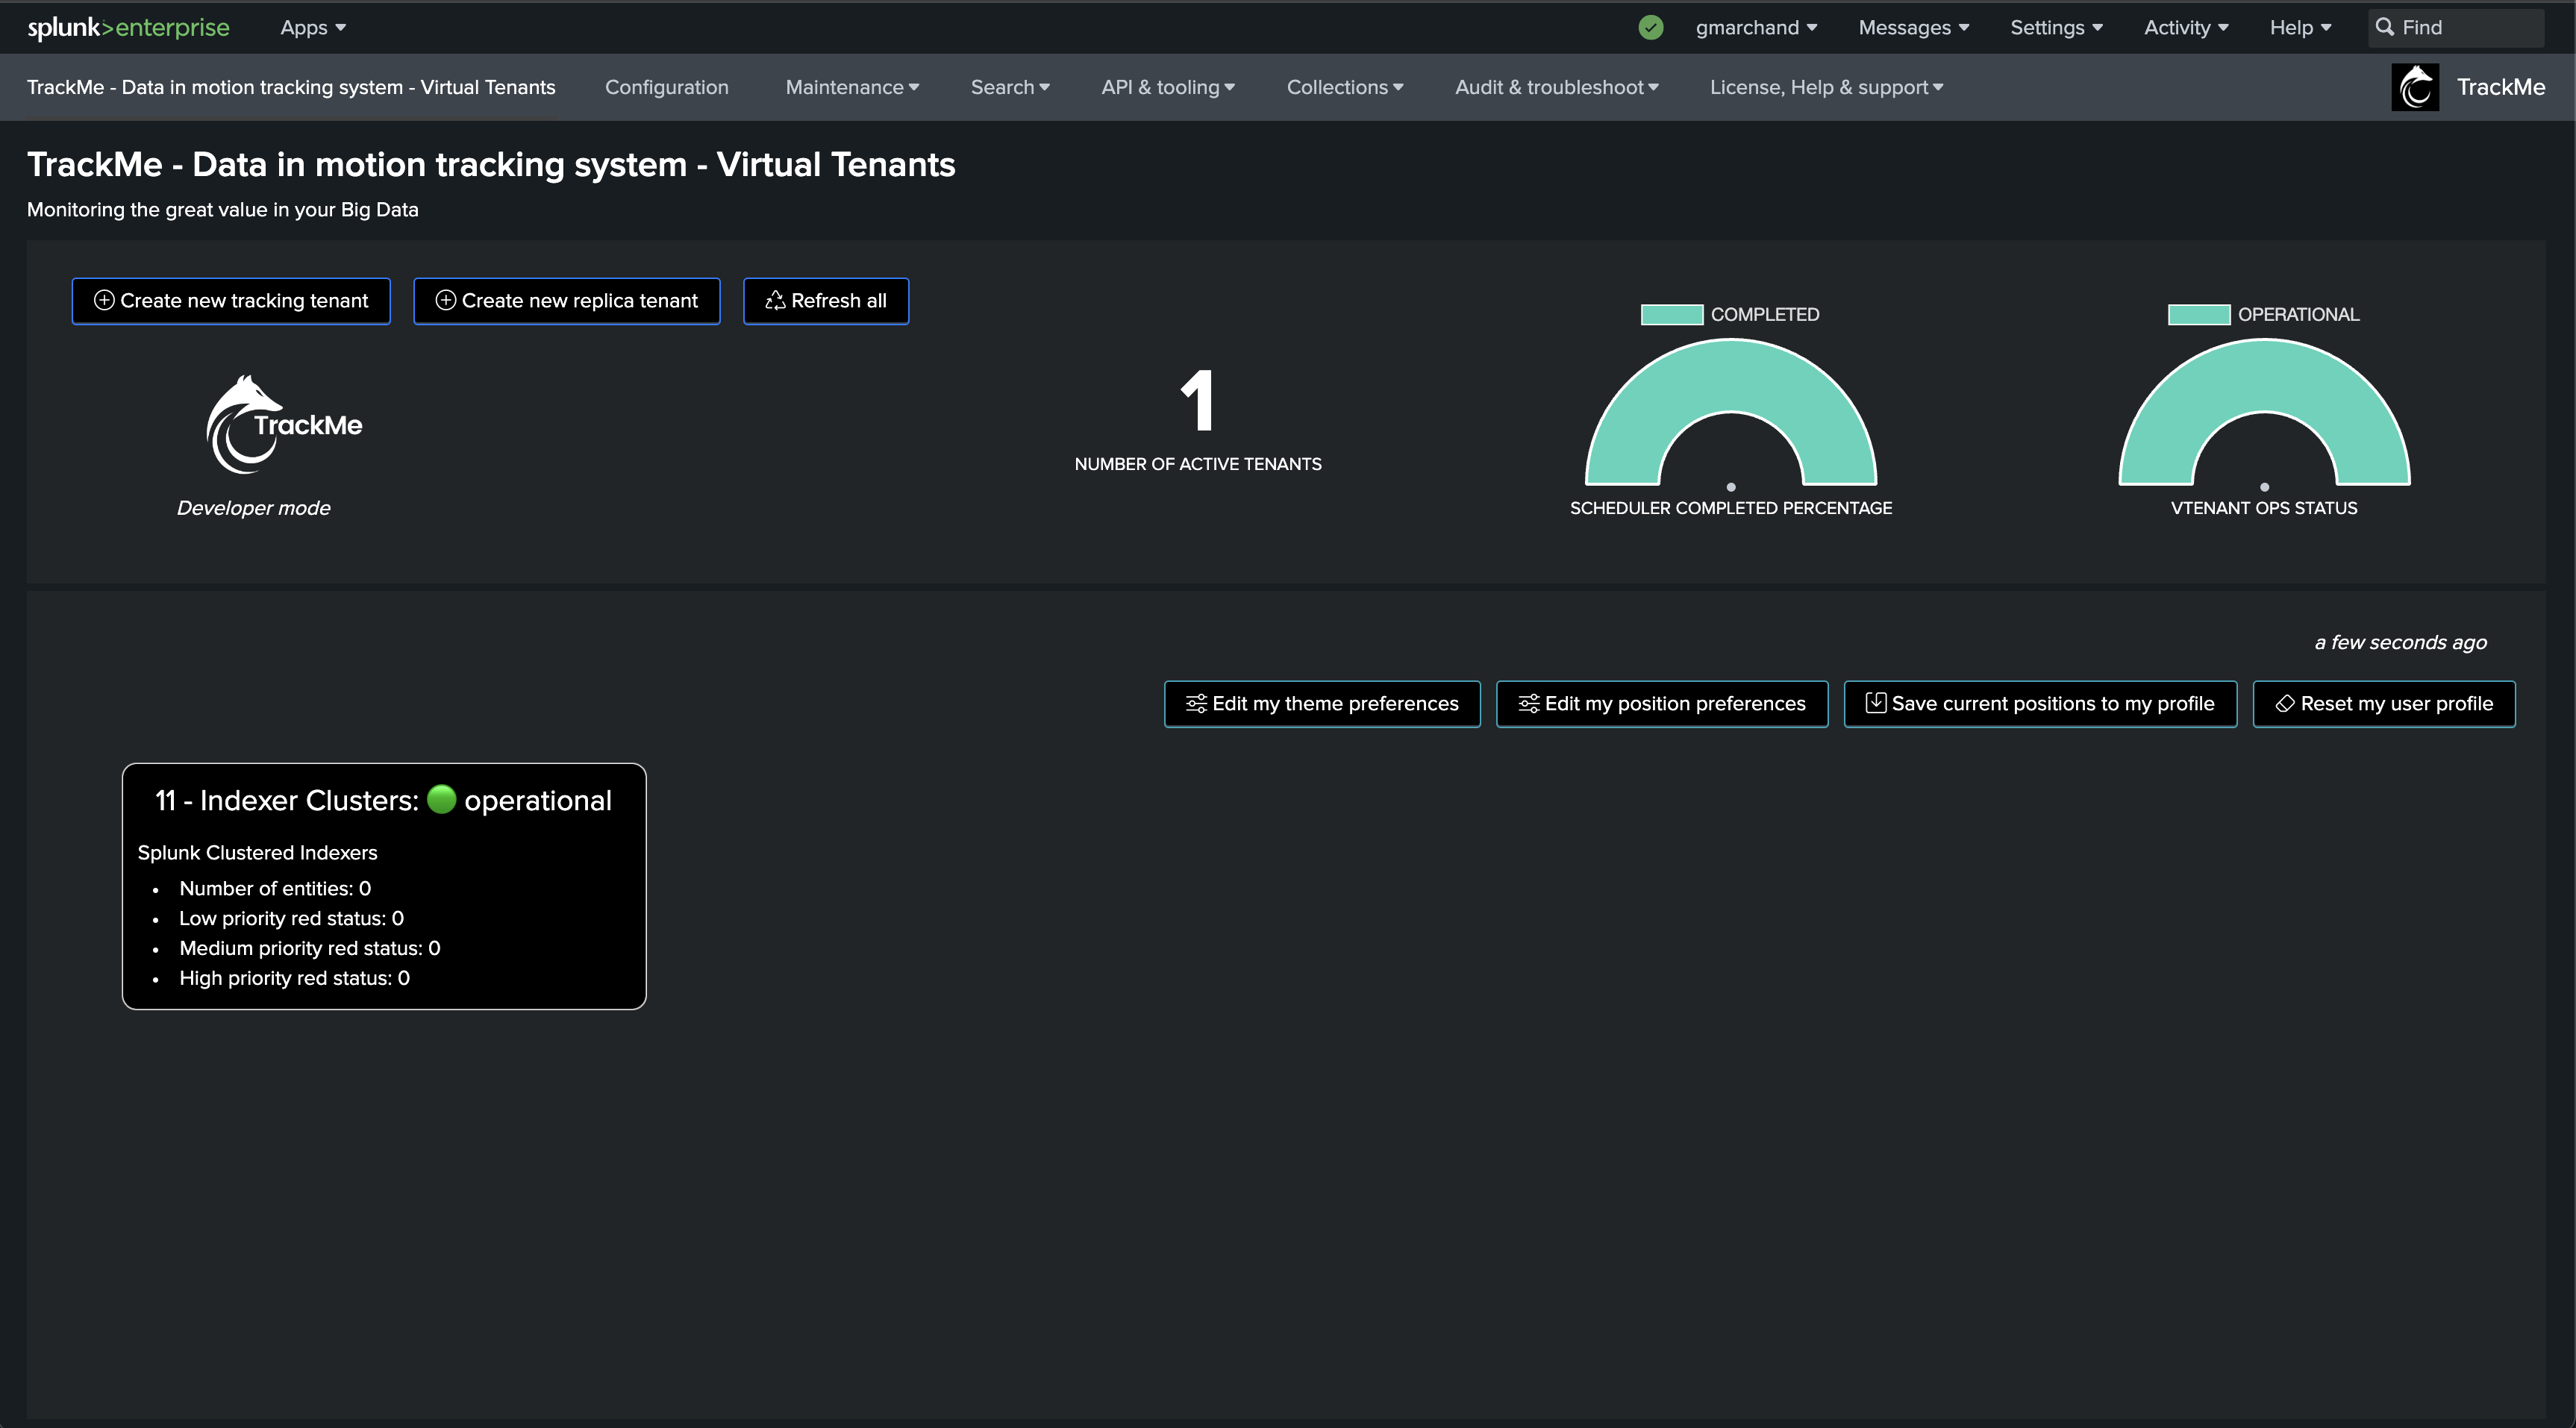
Once proceeded, we have a new Virtual Tenant ready to be used:
Second, create a new Flex Object tracker
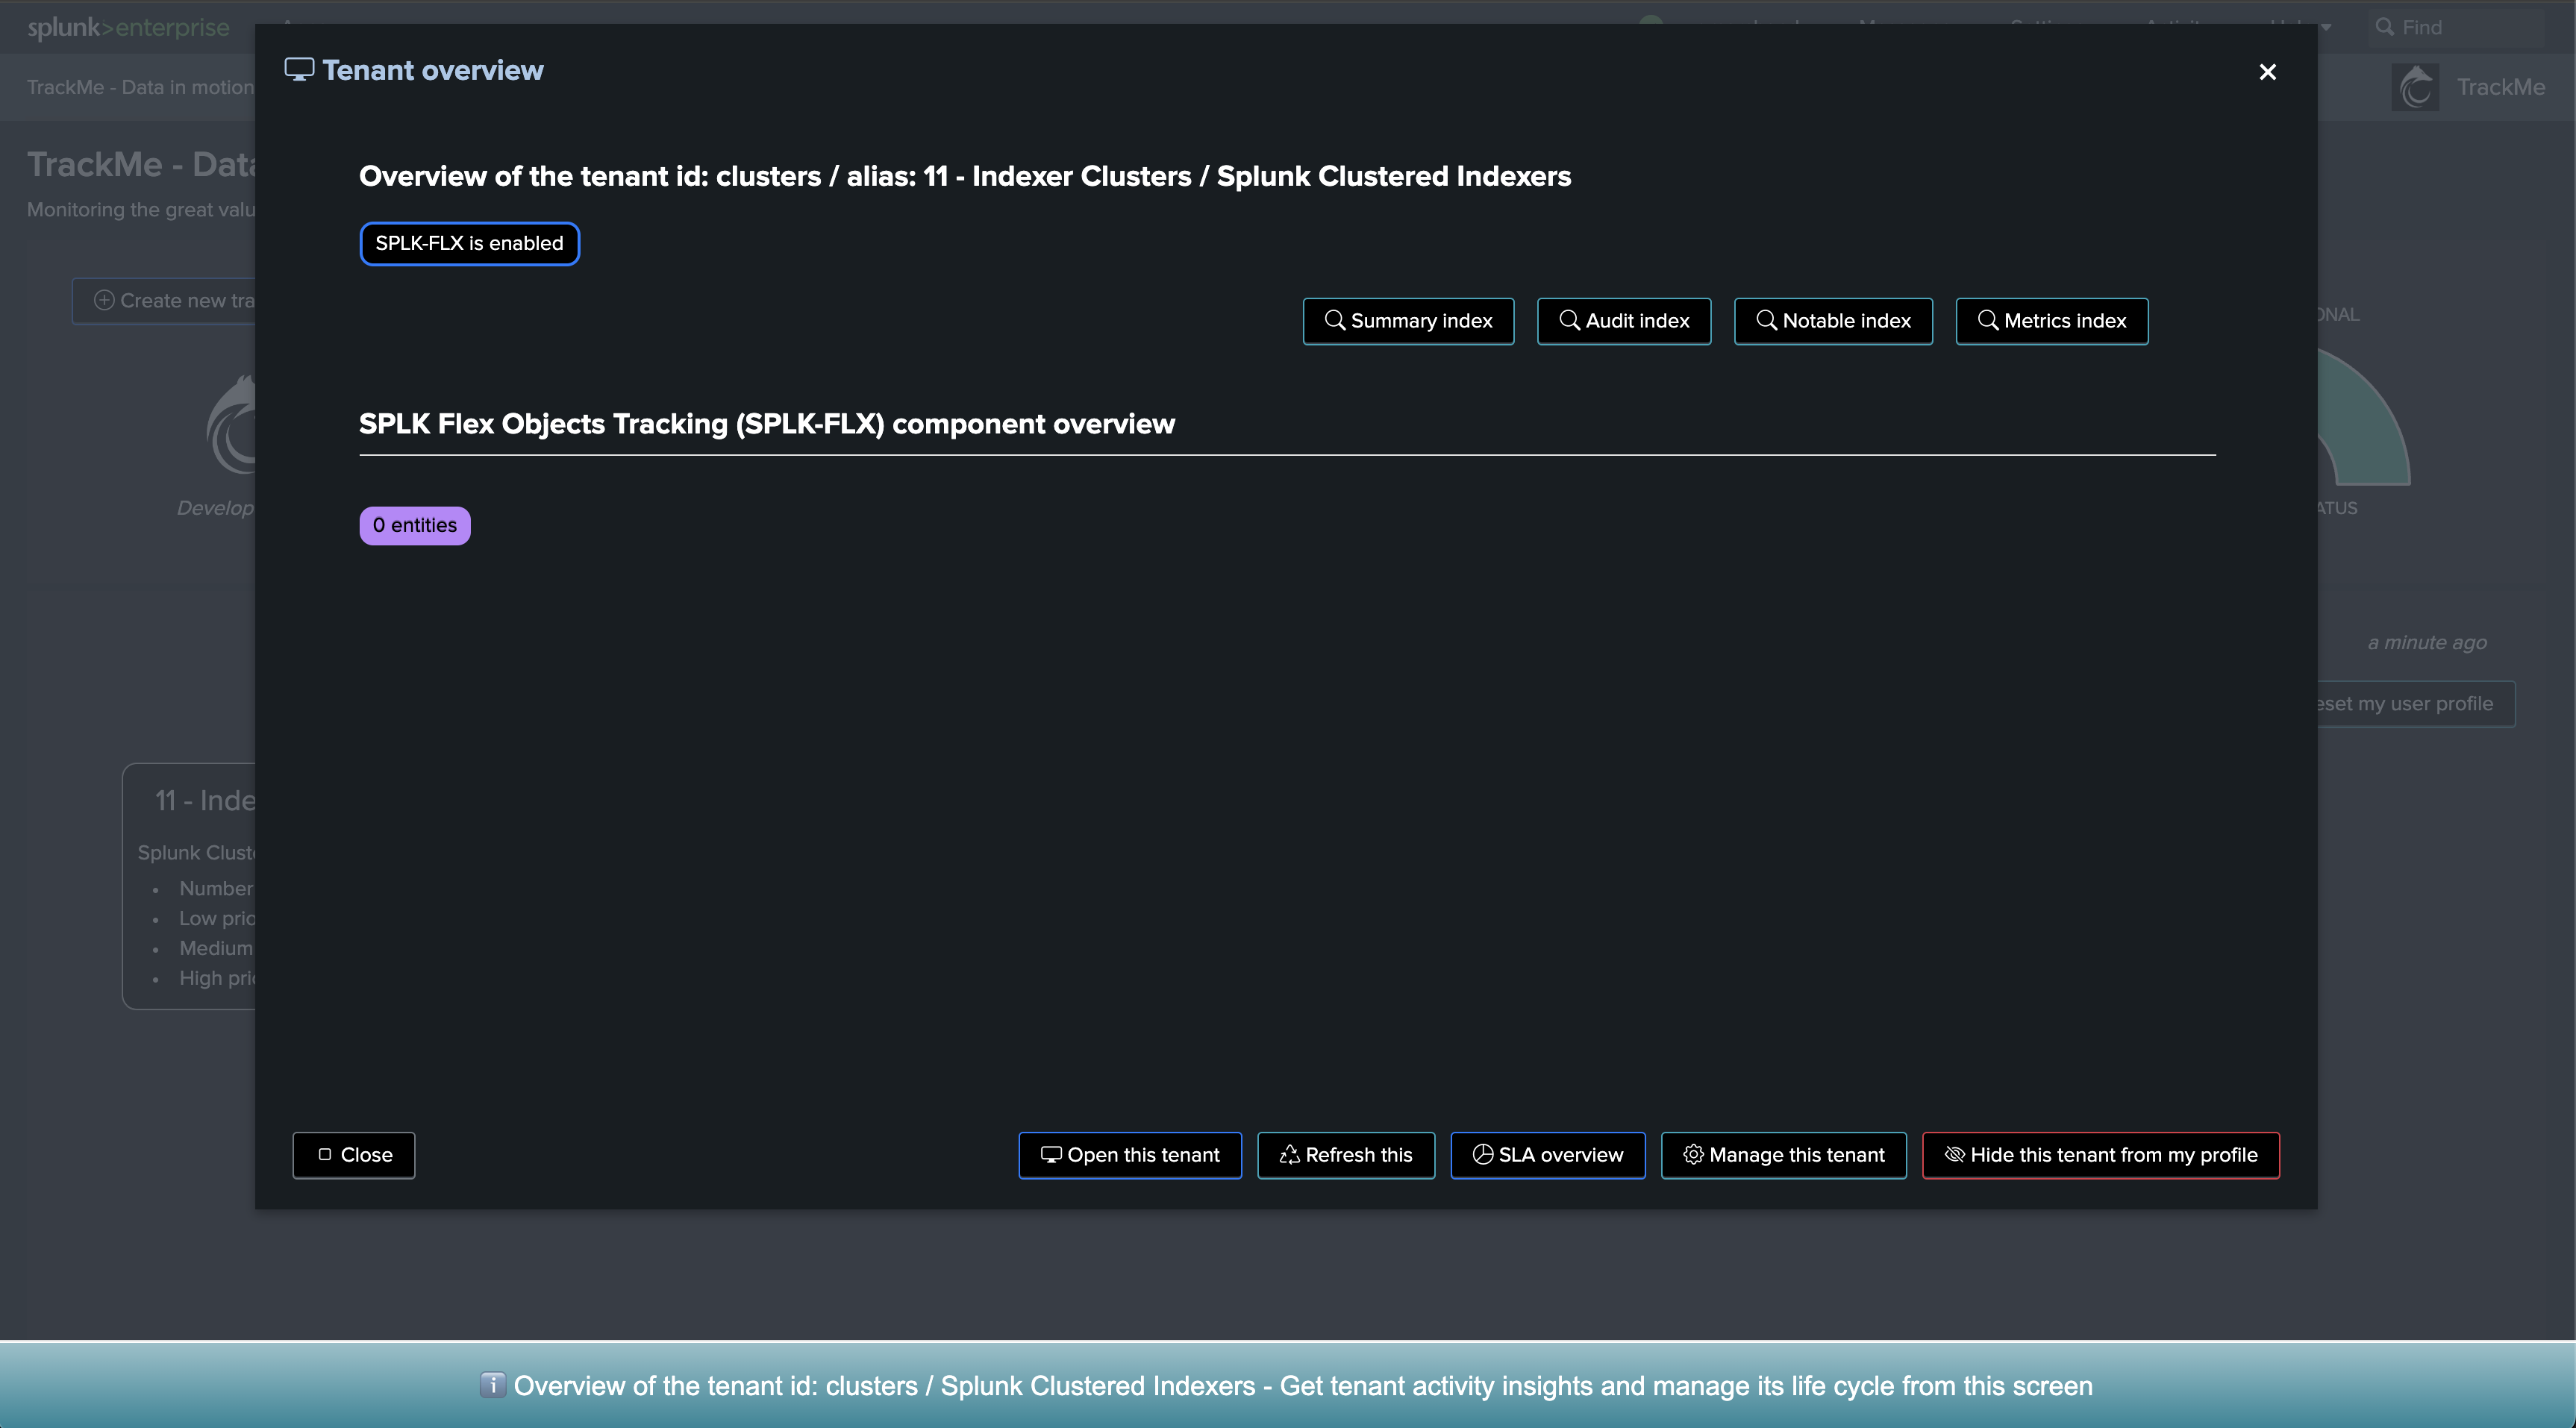
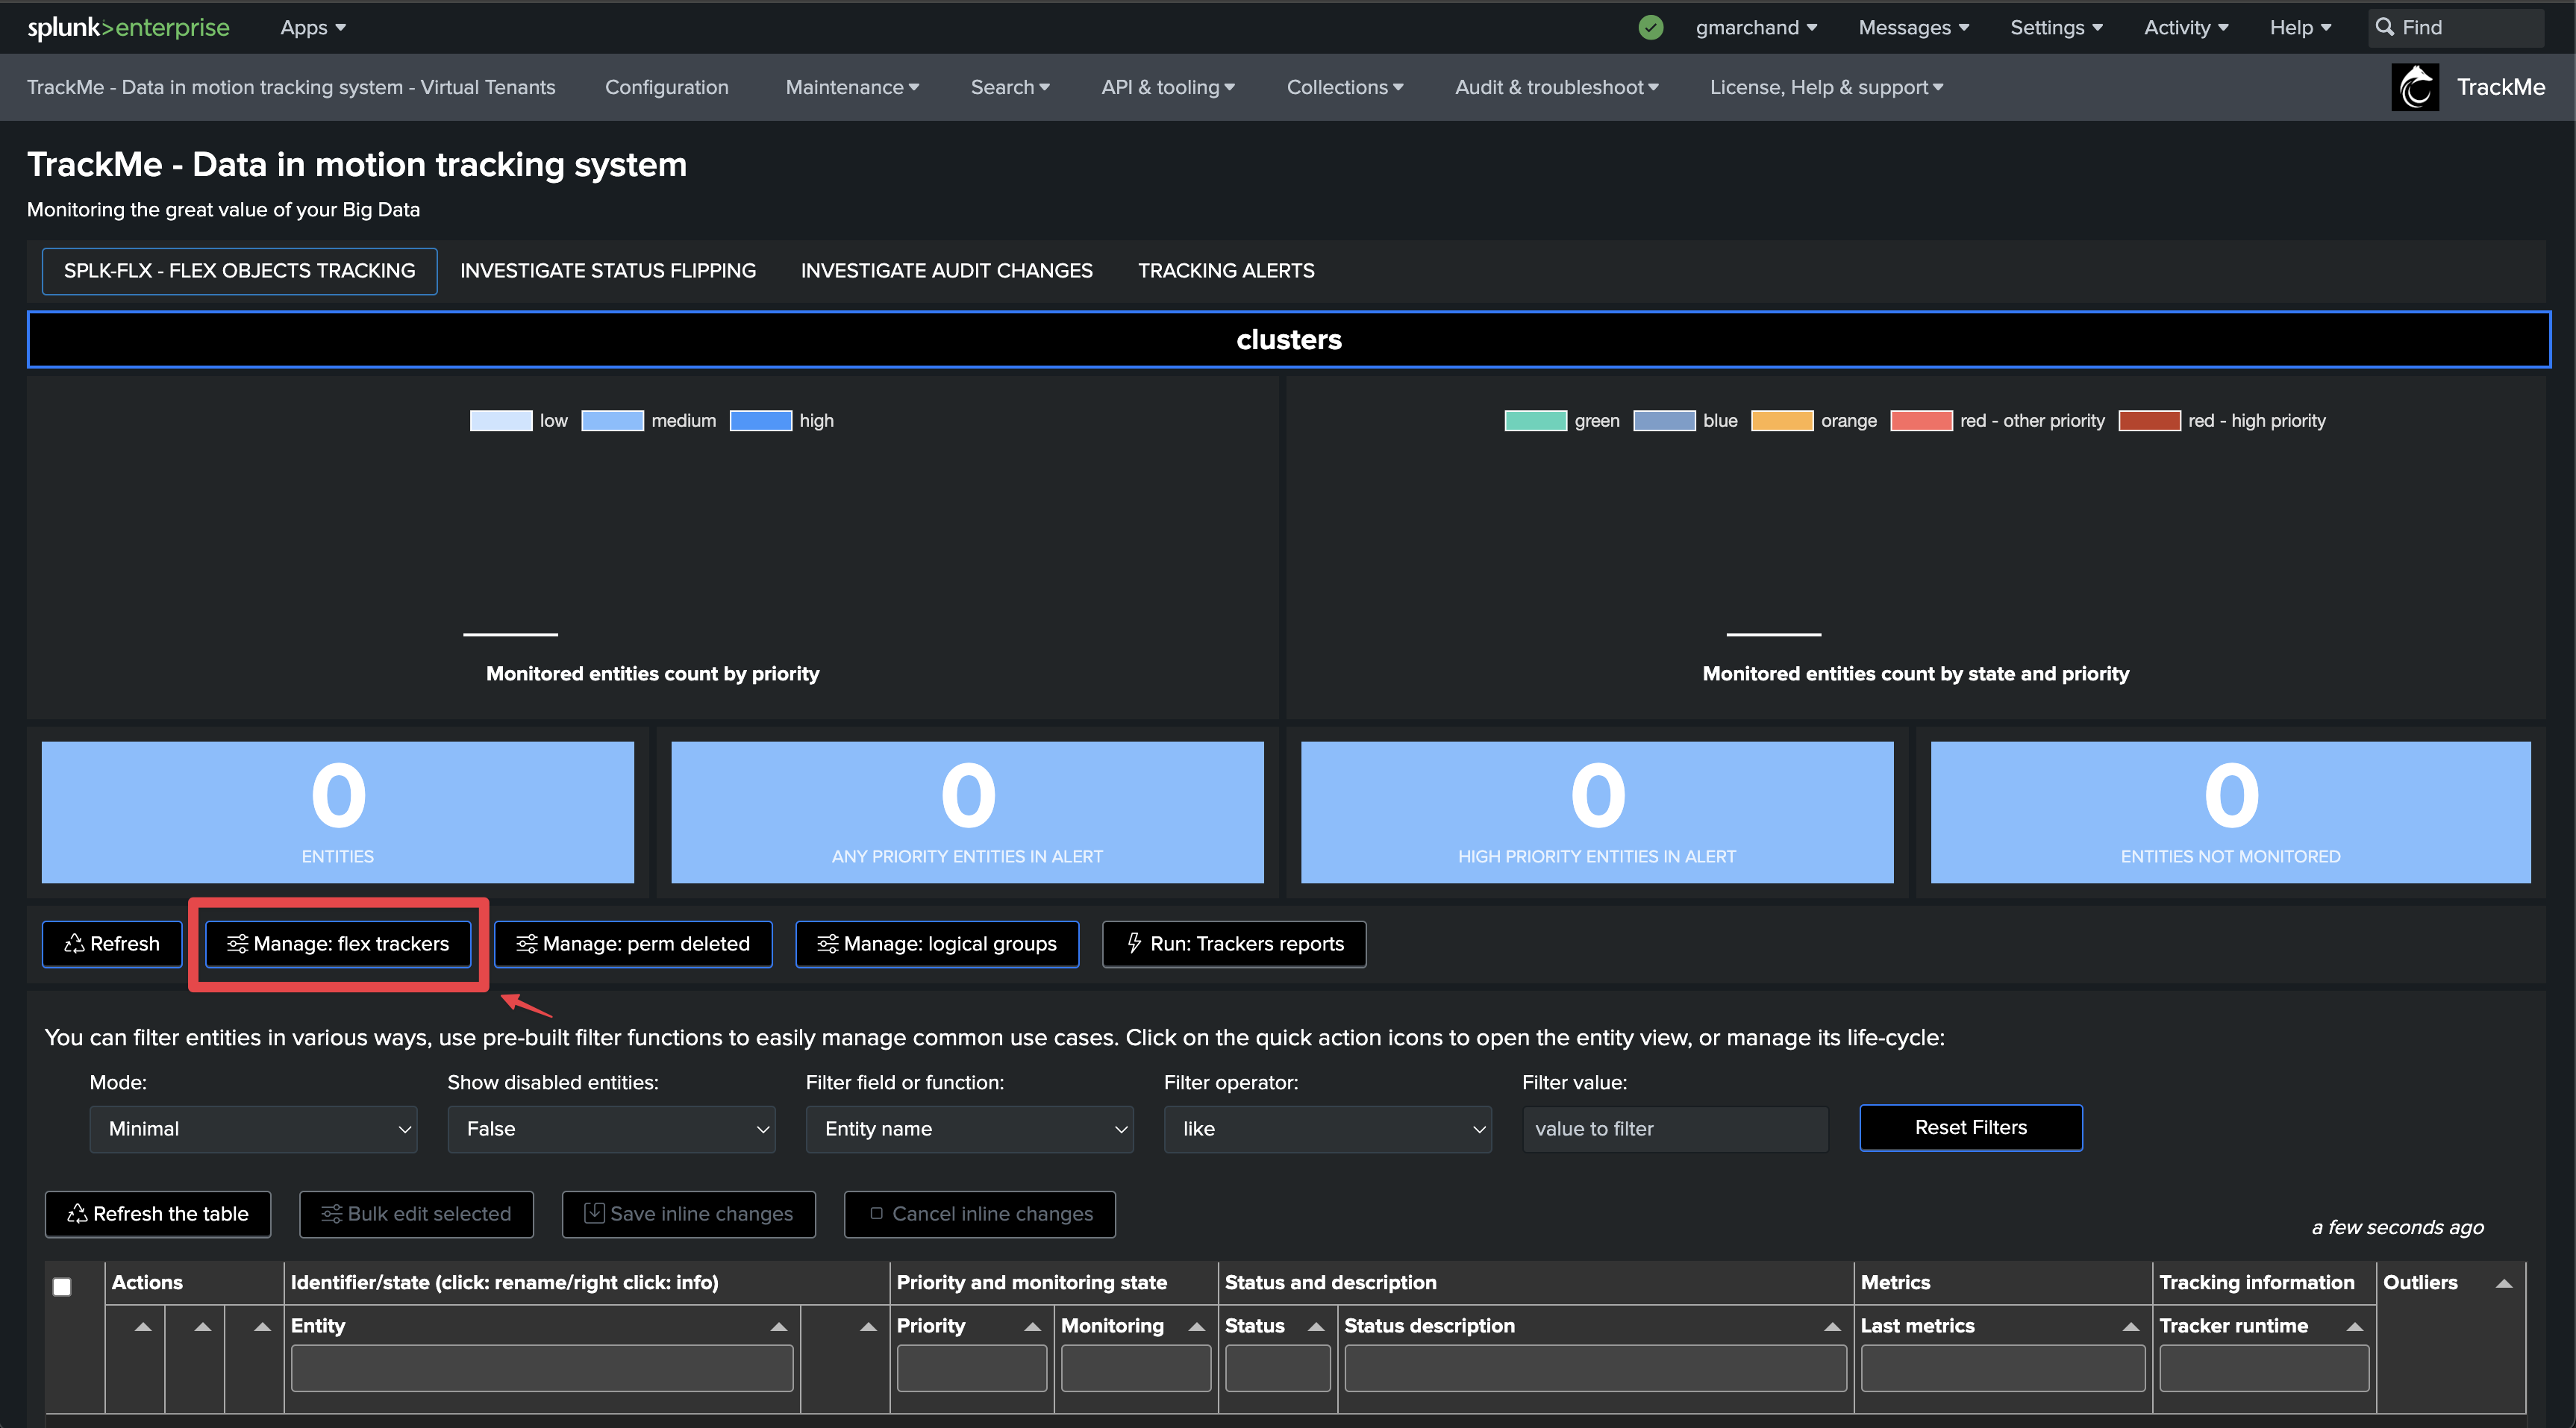
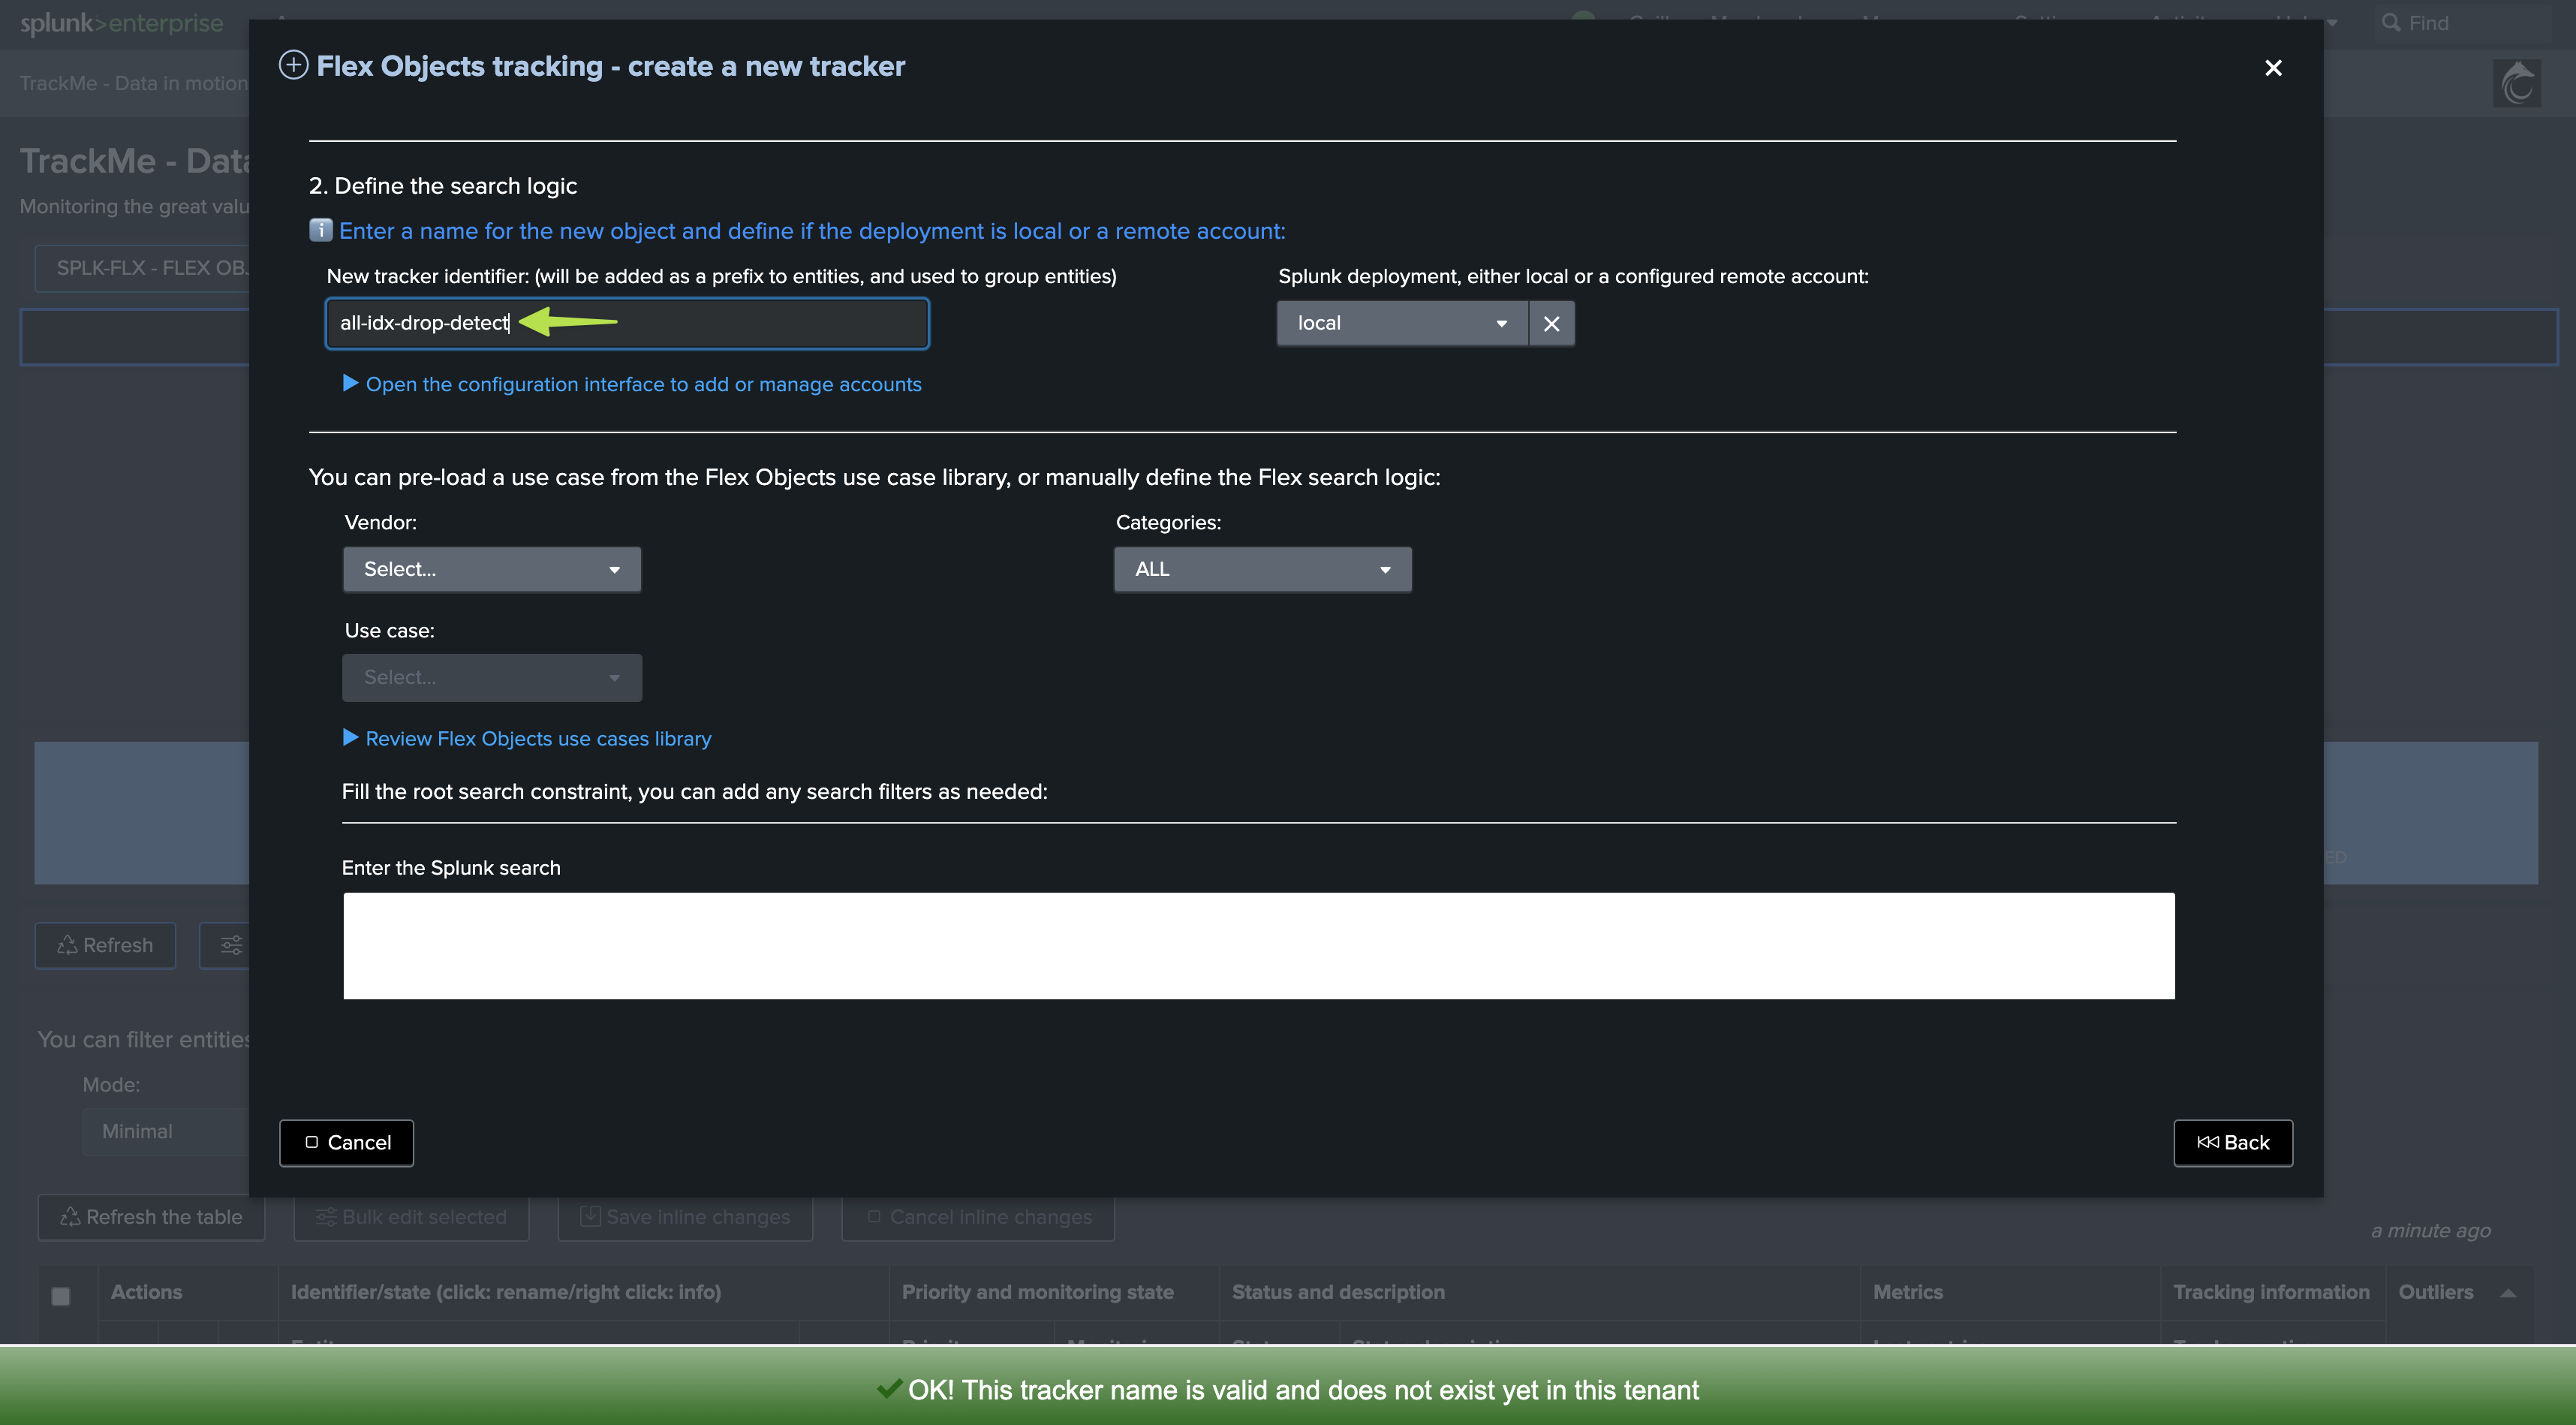
Let’s enter the new tenant, and define our Flex Object tracker:
We will create a new Flex Object tracker, called all-idx-drop-detectt:
Flex Object tracker source code
Hint
These use cases are available out of the box from TrackMe 2.0.89
Since TrackMe 2.0.89, we have added these two use cases to the Flex Object library, so you can simply leverage the library to implement the use cases.
In TrackMe 2.0.98, we added the dictinct count host to the use case, this is also a very valuable KPI to track.
You can still create the use cases manually (therefore with a prior version of TrackMe), this is what we will demonstrate in this tutorial.
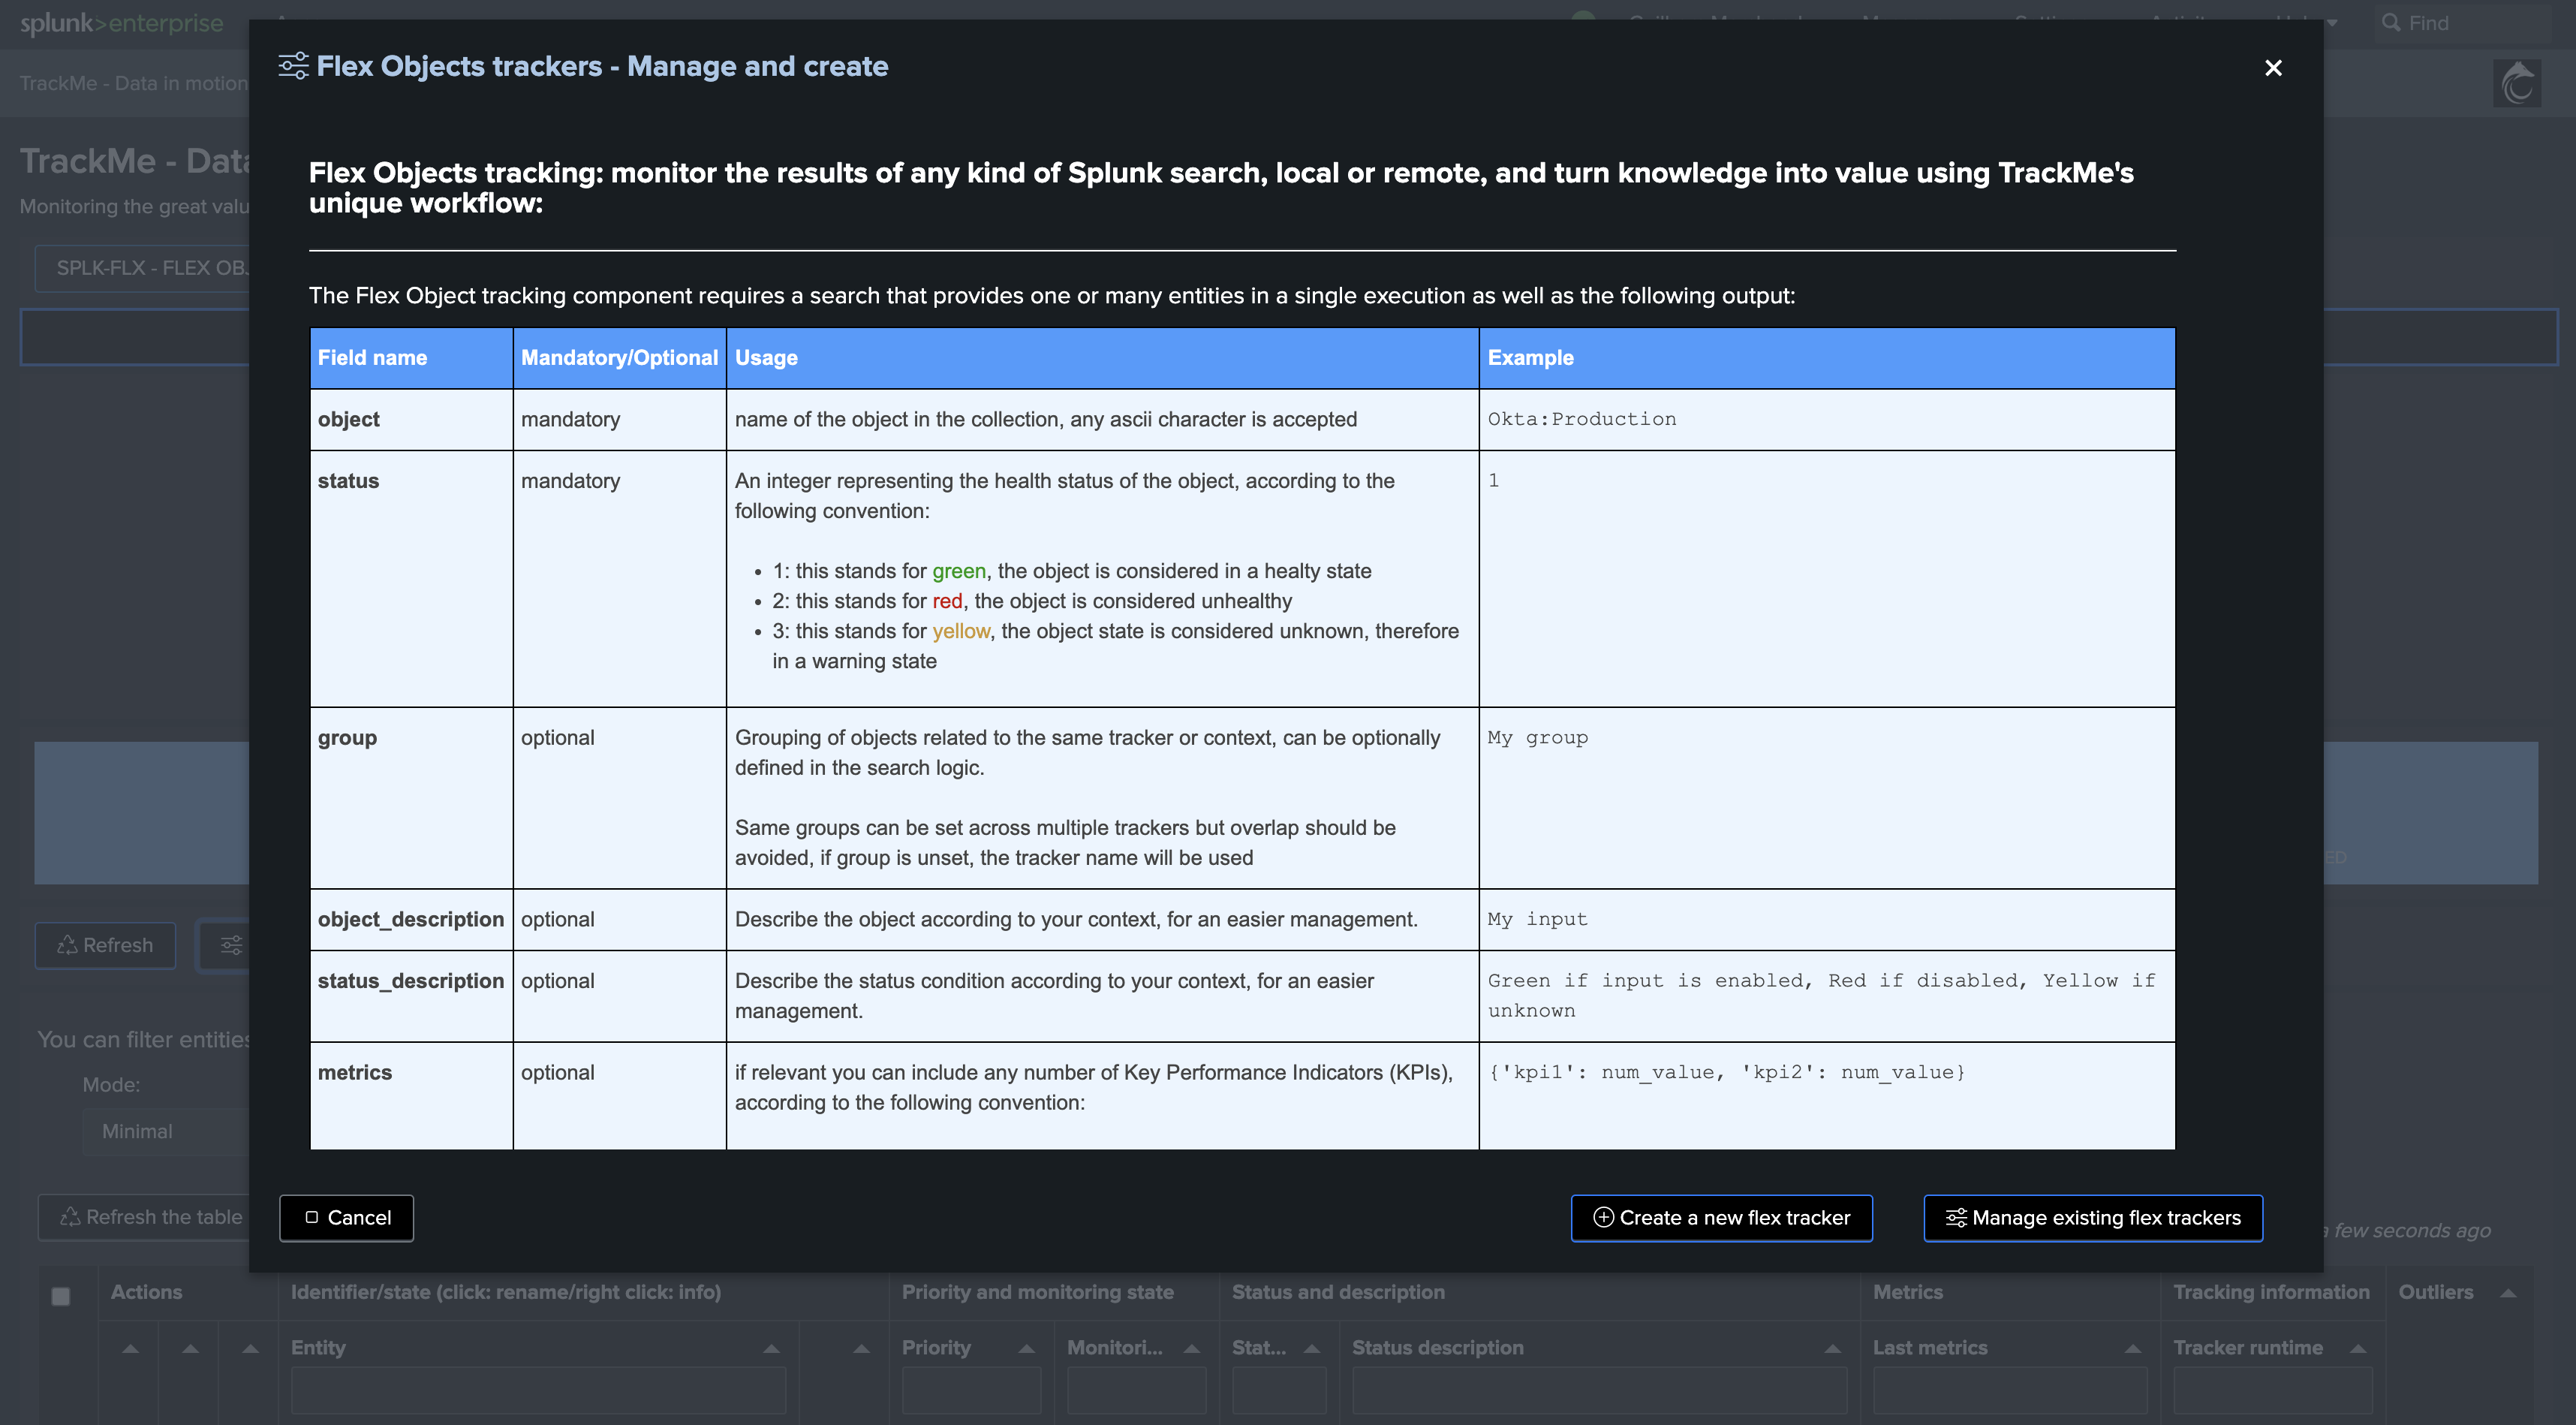
Creating a Flex Object tracker is pretty simple, you can take any of the use cases in the Flex Object library as an example (for instance: splk_license_usage_per_index), we will define our Flex Object tracker as:
Flex object tracker source code:
| tstats count as events_count, dc(host) as dcount_host where (index=*) by index
``` fine tune the query above, you can store eventually the root constraint in a macro, or simply establish the list here ```

``` define the object, group, alias and description ```
| eval object = index
| eval group="drop-detect"
| eval alias = index
| eval object_description = "Splunk index: " . index

``` set status: in this case this is always going to be green, we will rely on outliers detection to detect an abnormal drop in the events count ```
| eval status=1

``` set status_description ```
| eval status_description="Events count drop detection for index: " . index . ", latest events_count:" . events_count

``` Set metrics and outliers ```
| eval metrics = "{'splunk.feeds.idx.events_count': " . if(isnum(events_count), events_count, 0) . ", 'splunk.feeds.idx.dcount_host': " . if(isnum(dcount_host), dcount_host, 0) . "}"

| eval outliers_metrics = "{'splunk.feeds.idx.events_count': {'alert_lower_breached': 1, 'alert_upper_breached': 0, 'time_factor': 'none'}, 'splunk.feeds.idx.dcount_host': {'alert_lower_breached': 1, 'alert_upper_breached': 0, 'time_factor': 'none'}}"

``` do not alert if the index stops receiving events entirely, setting this to 0 means this, otherwise you can define a value in seconds, if the index stops receiving events, it will turn red for inactivity ```
| eval max_sec_inactive=0
We will choose a certain time period, as our search does not have to deal with a time granularity concept (we are not breaking against the time), we have a super efficient and very low cost tracker!
Hint
Fine tuning the Flex Object tracker
You can fine tune the root constraint (the “where”) to match your needs and especially filter on the indexes you want to track.
You can also modify the break by sequence to match your needs, for instance including the sourcetype or including additional factors such as custom indexed fields.
Finally, the group is used to logically group entities together, you can also fine tune the group definition to match your needs. (such as using a specific indexed field providing a company or perimeter concept, etc)
Rolling versus Absolute Key Performance Indicator
In next steps, we will define the time period and the frequency of the tracker, depending on these settings and depending on your preferences, we influence the meaning of the KPIs:
Rolling Key Performance Indicator: This is a metric that is frequently executed by the tracker, and the time period is relative to the current time.
Absolute Key Performance Indicator: The time period length matches the execution frequency (cron), so we produce a strict events count for a definitive period of time.
The meaning of the metrics will be different depending on these settings, although the finality remains the same and both will be equally able to detect abnormal events count dropped.
We will cover both options in the next steps of this tutorial.
Let’s summarize the main ideas:
Rolling metrics pros/cons
Pros:
Easier to understand. The metric is the real strict event count and would match manual comparison searches.
Can be easily backfilled, so you don’t need to wait for TrackMe to build the historical knowledge before the tracking is operational.
Cons:
More sensitive to failures. If the tracker schedule is missed and not executed by Splunk (outage), the metrics will be wrong.
Always looks at 1 hour back compared to the real-time data. We will need at least 1 hour to detect a significant drop in the events count. (However, the use case is about trend analytics, so this last argument is in reality not a real issue)
Absolute metrics pros/cons
Pros:
Less sensitive to failures, if the tracker schedule is missed and not executed by Splunk, there will be no impact on the detection capabilities.
Represents a different and valuable way to look at the trending of the events count rather than a basic strict events count.
Cons:
Cannot be easily backfilled, the trend can only be calculated at point in time and backfilling it is much more challenging.
Does not represent the basic events count, so one cannot compare with simple Splunk searches, in some cases when doing investigations, analysts can struggle to understand the metrics.
Absolute Key Performance Indicator
The time period length must match the frequency of the tracker, so we have a strict events count for a definitive period of time:
earliest: -1h@h
latest: @h
cron_schedule:
0 * * * *
Note: you can optionally be more protected about a single failure of Splunk in executing our Tracker once per hour, you can for instance execute it twice per hour, ML calculations will be affected as we do not use a sum but avg/latest and so others, so a duplicated metrics has no impacts.
Rolling Key Performance Indicator
We would for instance execute on a high frequency the Flex Tracker against a bigger time period length:
earliest: -60m
latest: now
cron_schedule:
*/5 * * * *
Defining the Machine Learning model general rules
In our Flex Object tracker, we have defined the following line:
| eval outliers_metrics = "{'splunk.feeds.idx.events_count': {'alert_lower_breached': 1, 'alert_upper_breached': 0, 'time_factor': 'none'}, 'splunk.feeds.idx.dcount_host': {'alert_lower_breached': 1, 'alert_upper_breached': 0, 'time_factor': 'none'}}"
This does the following:
Automatically define a Machine Learning model definition per entity
The model will by default alert only for Lower Bound breaches, which means in our context an abnormal drop in the events count.
Finally, we decided to define by default a time_factor: none, which means we disable the seasonality concept, so we have single LowerBound and UpperBound ranges per entity.
We could also choose a different pattern between: %H, %H%M, %w%H, %w%H%M
Hint
Machine Learning time_factor
In this example, we have chosen to define a time_factor: none, which means we disable the seasonality concept.
You can also do the opposite and enable by default a time_factor of your choice.
Remember that you can always update the time factor per entity as needed.
This statement in our Flex Object tracker defines the default definition of the models and is only used once at the time of the entity discovery or if you delete the Machine Learning model for a given entity. (so it is re-created automatically at the next execution)
Backfilling the Key Performance Indicator (Absolute KPI)
ONLY AFTER A FIRST EXECUTION OF THE TRACKER: You can optionally choose to backfill the metrics. This is very useful for the Absolute KPIs:
make sure to replace the tenant_id, the root constraints and the period as per your needs. Here we will be backfilling for the past 30 days which would remain efficient even at large scale
| tstats count as trackme.splk.flx.splunk.feeds.idx.events_count, dc(host) as trackme.splk.flx.splunk.feeds.idx.dcount_host where (index=*) earliest=-30d latest=@h by _time, index span=1h

| lookup trackme_flx_tenant_detect-feeds-count alias as index OUTPUT _key as object_id, object
| eval tenant_id = "detect-feeds-count", object_category="splk-flx"
| where isnotnull(object_id)

| mcollect index=trackme_metrics split=t object, object_category, object_id, tenant_id
Final, execute and review entities
Finally, once we have first executed the tracker, we will be able to see one TrackMe entity per (active) index:
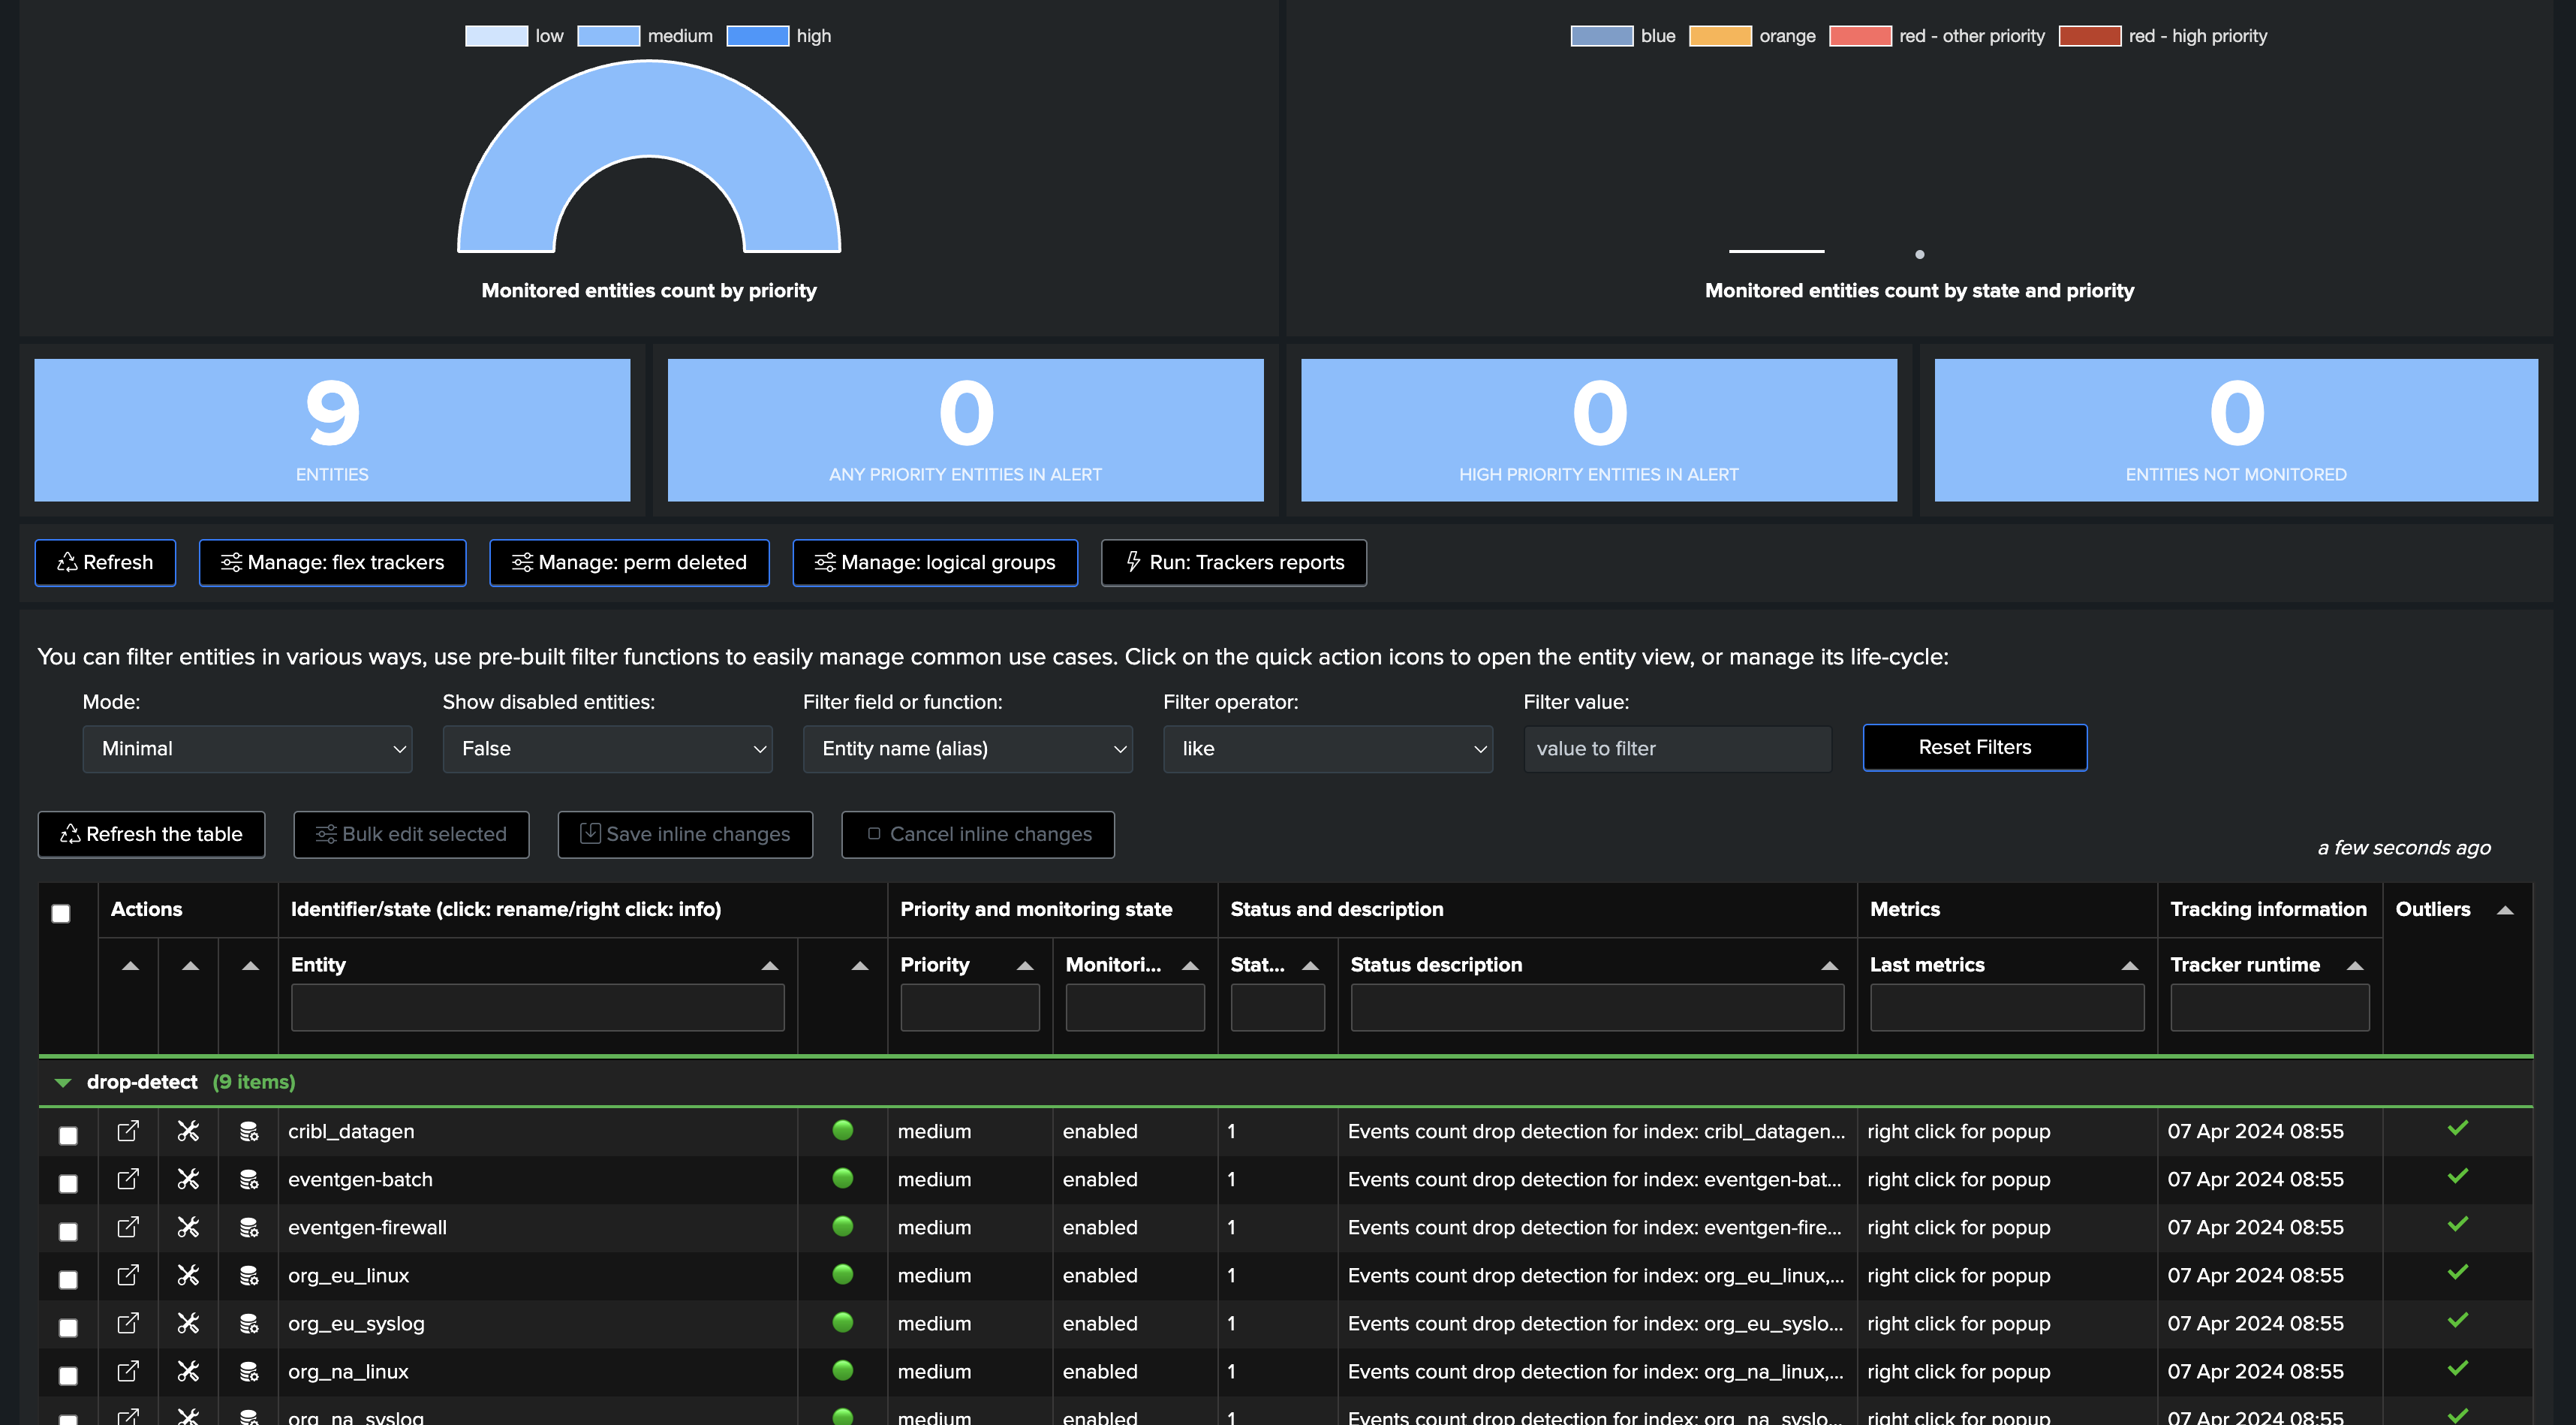
Depending if we wanted to use Rolling or Absolute KPIs, and backfill, we either see the first point of metric or a full backfilled metrics:
Not backefilled:
Backfilled:
Third, let’s have a look at the Machine Learning models
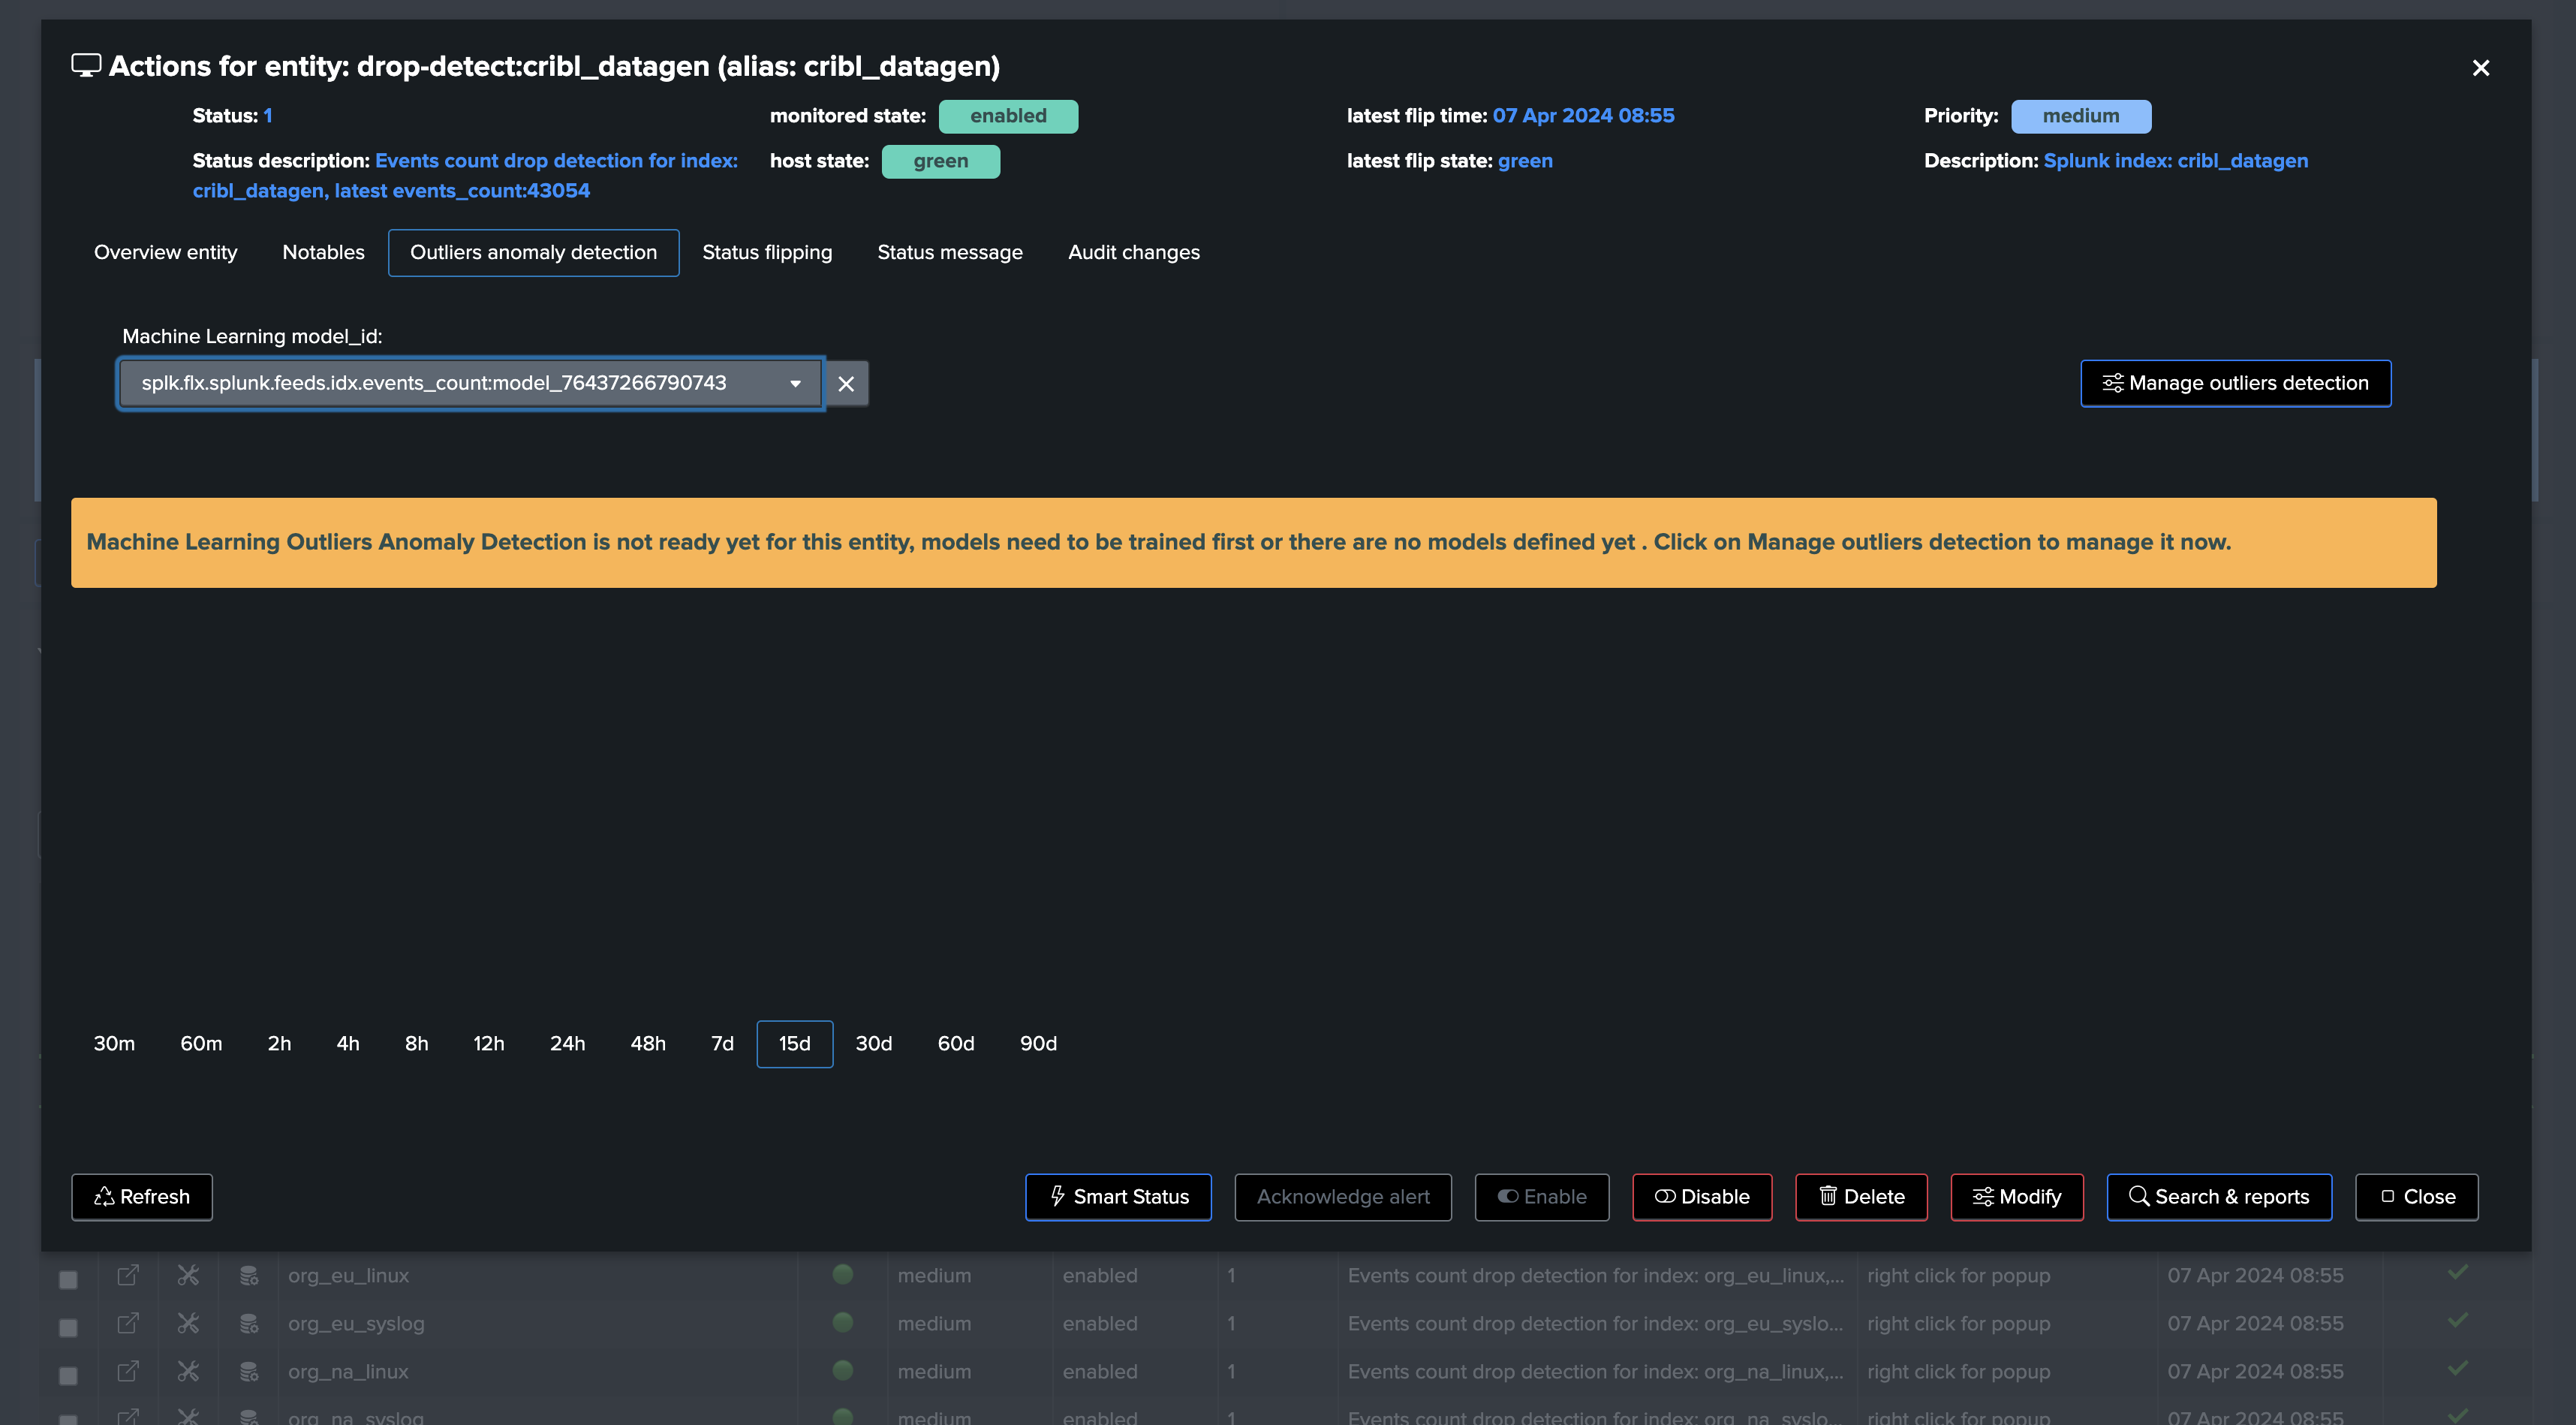
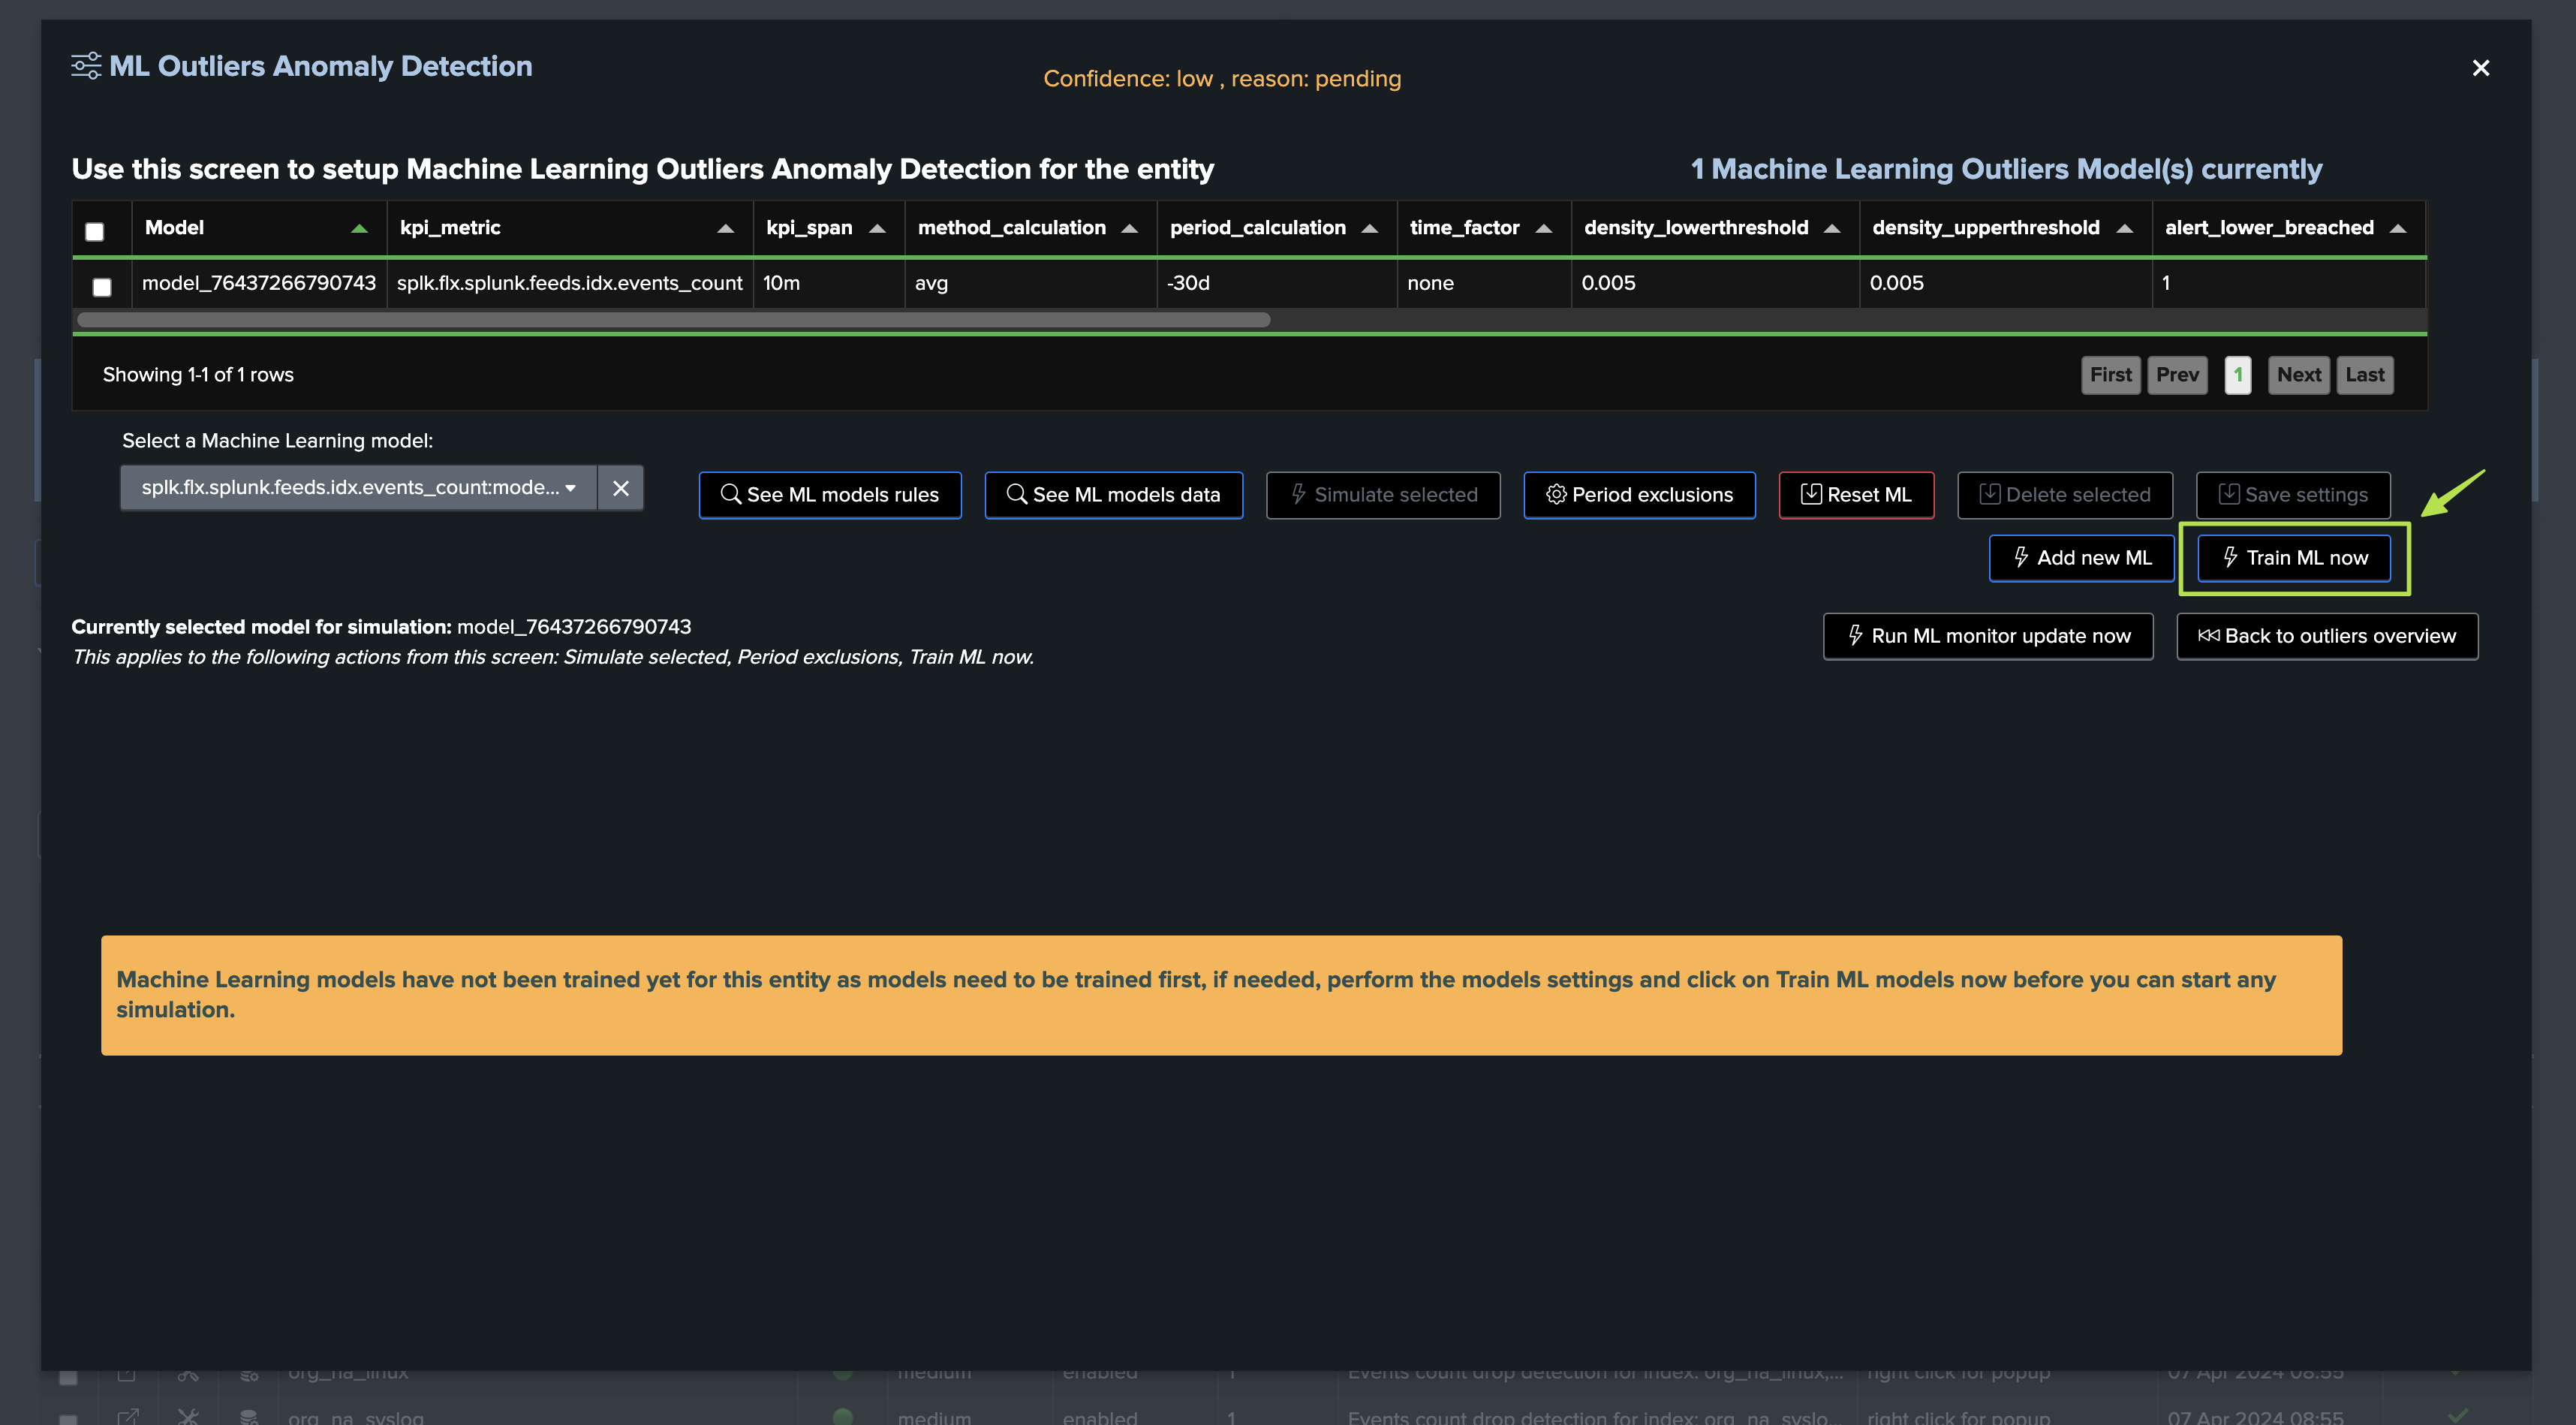
Since we’ve just created our tenant and entities, the Machine Learning models are not yet trained, we will have to wait for the next execution of the tracker to see the models being trained, or manually trigger it:
For the purposes of the tutorial, let’s run the training now:
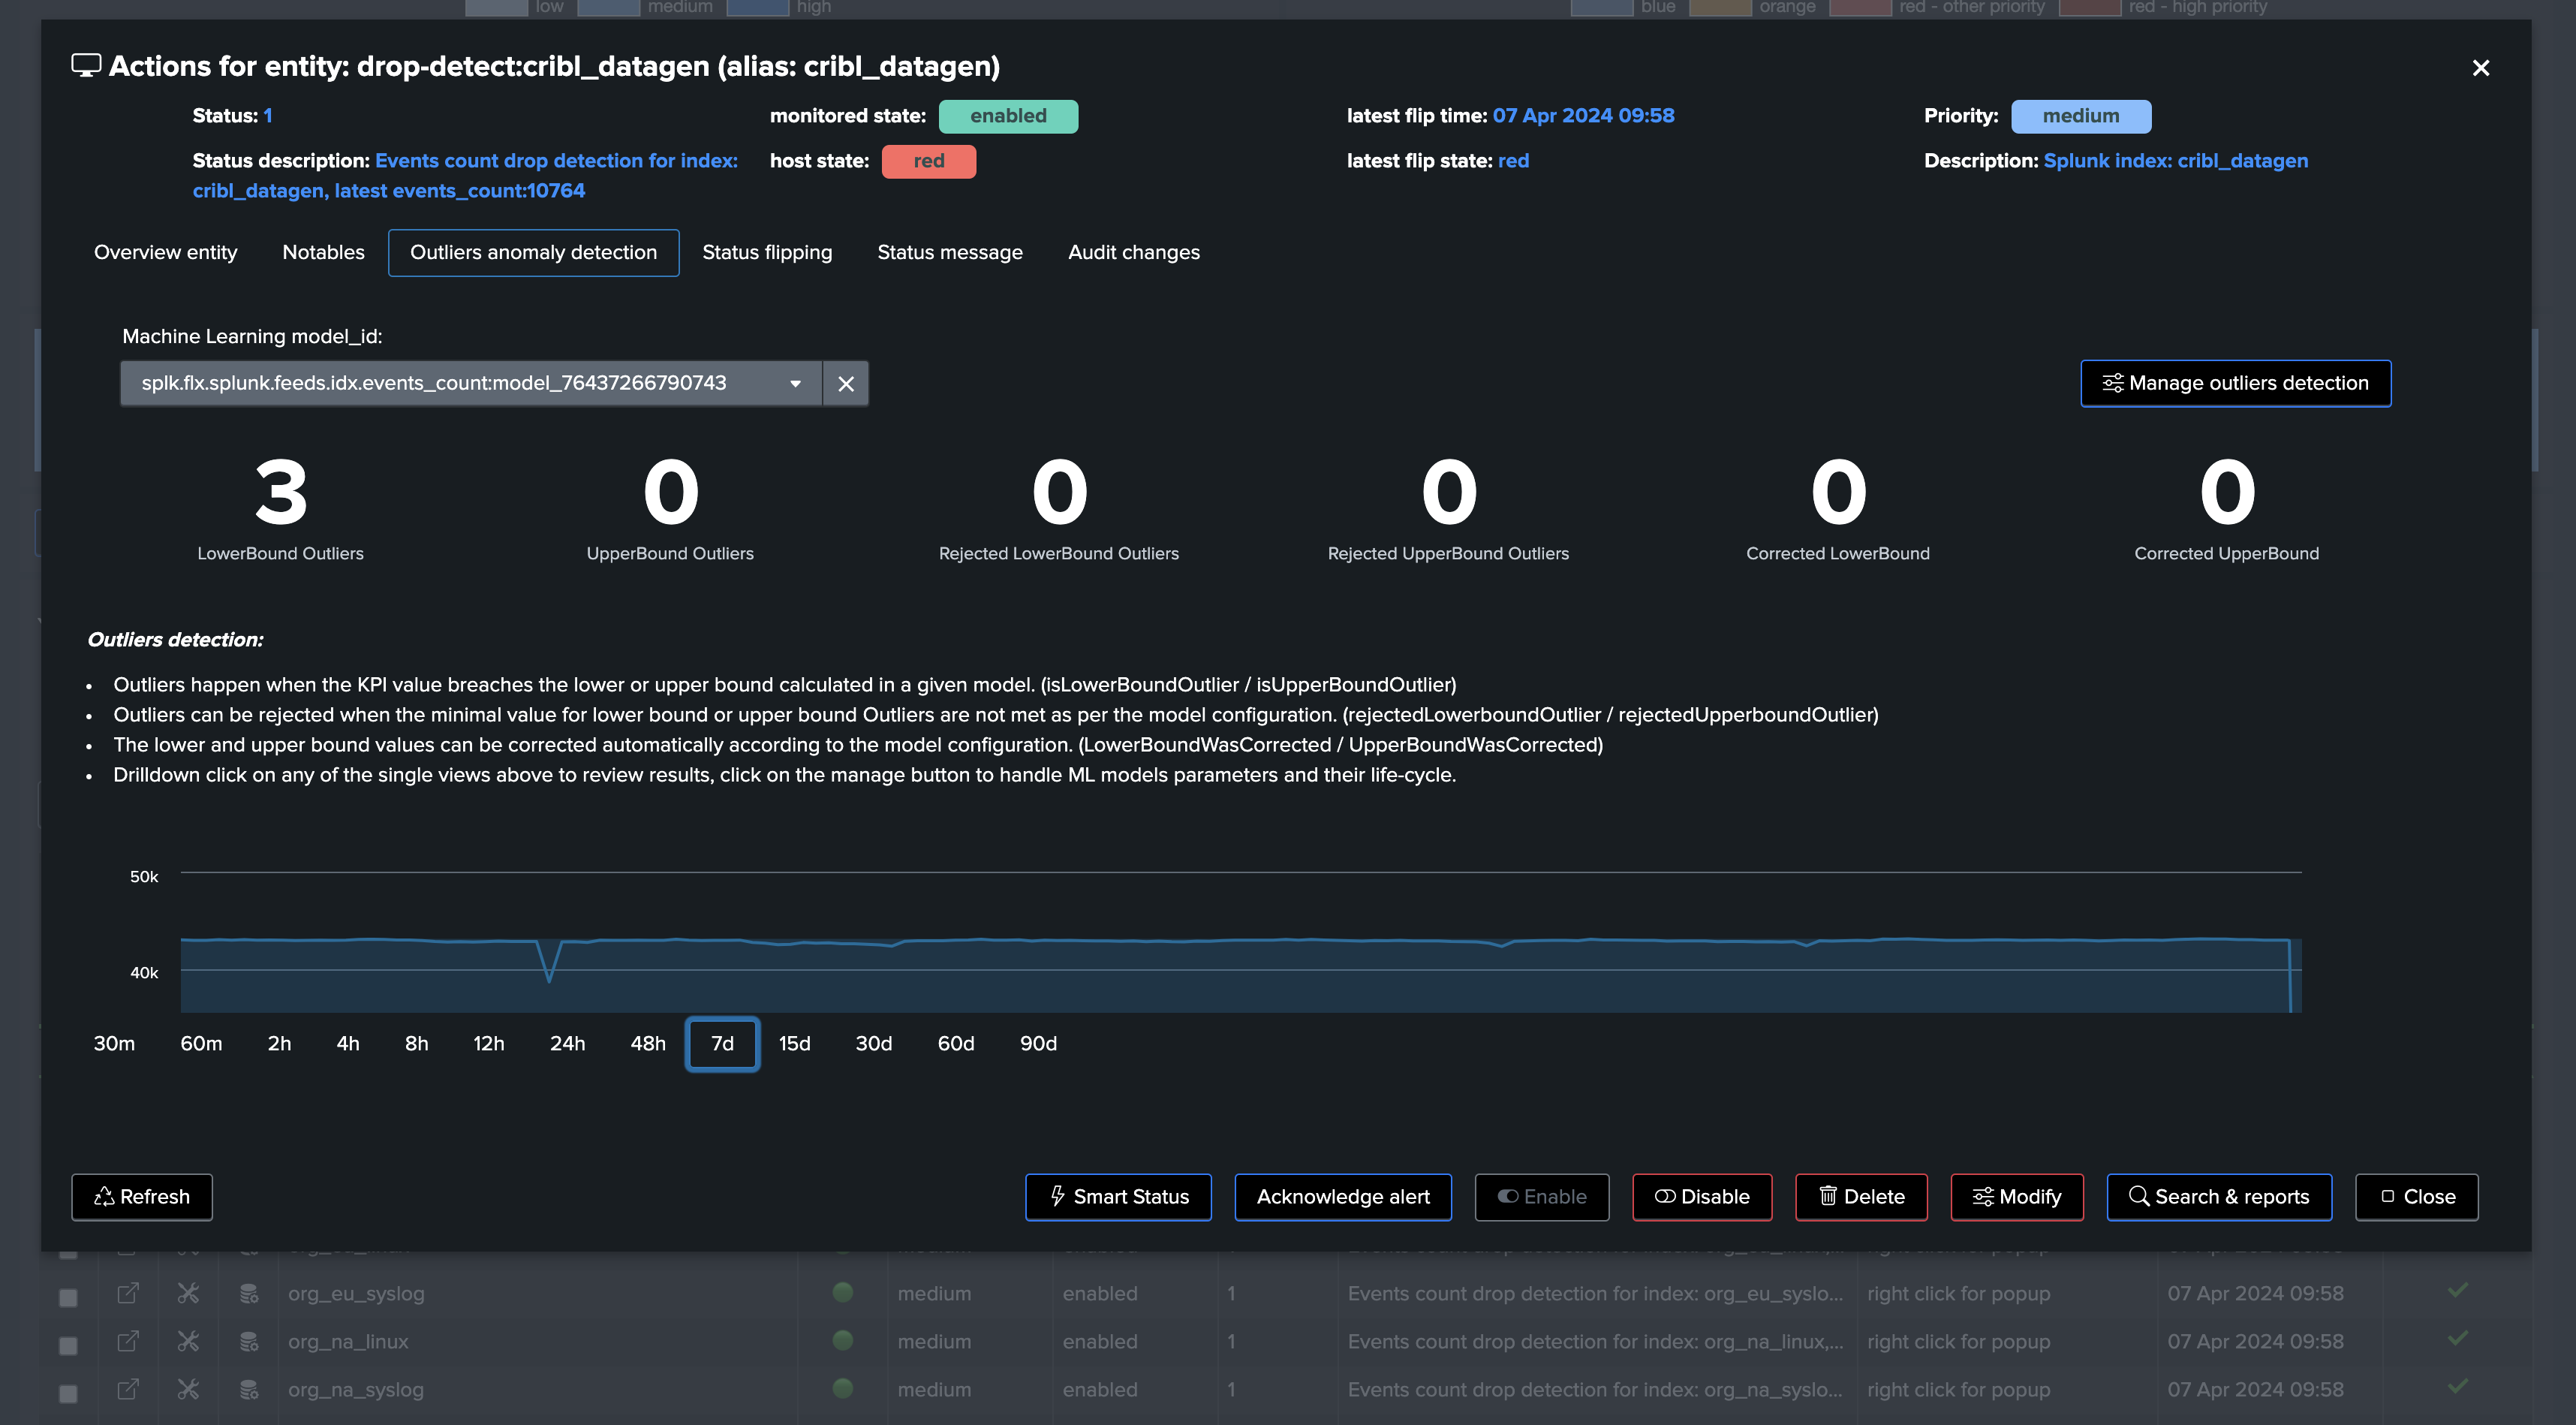
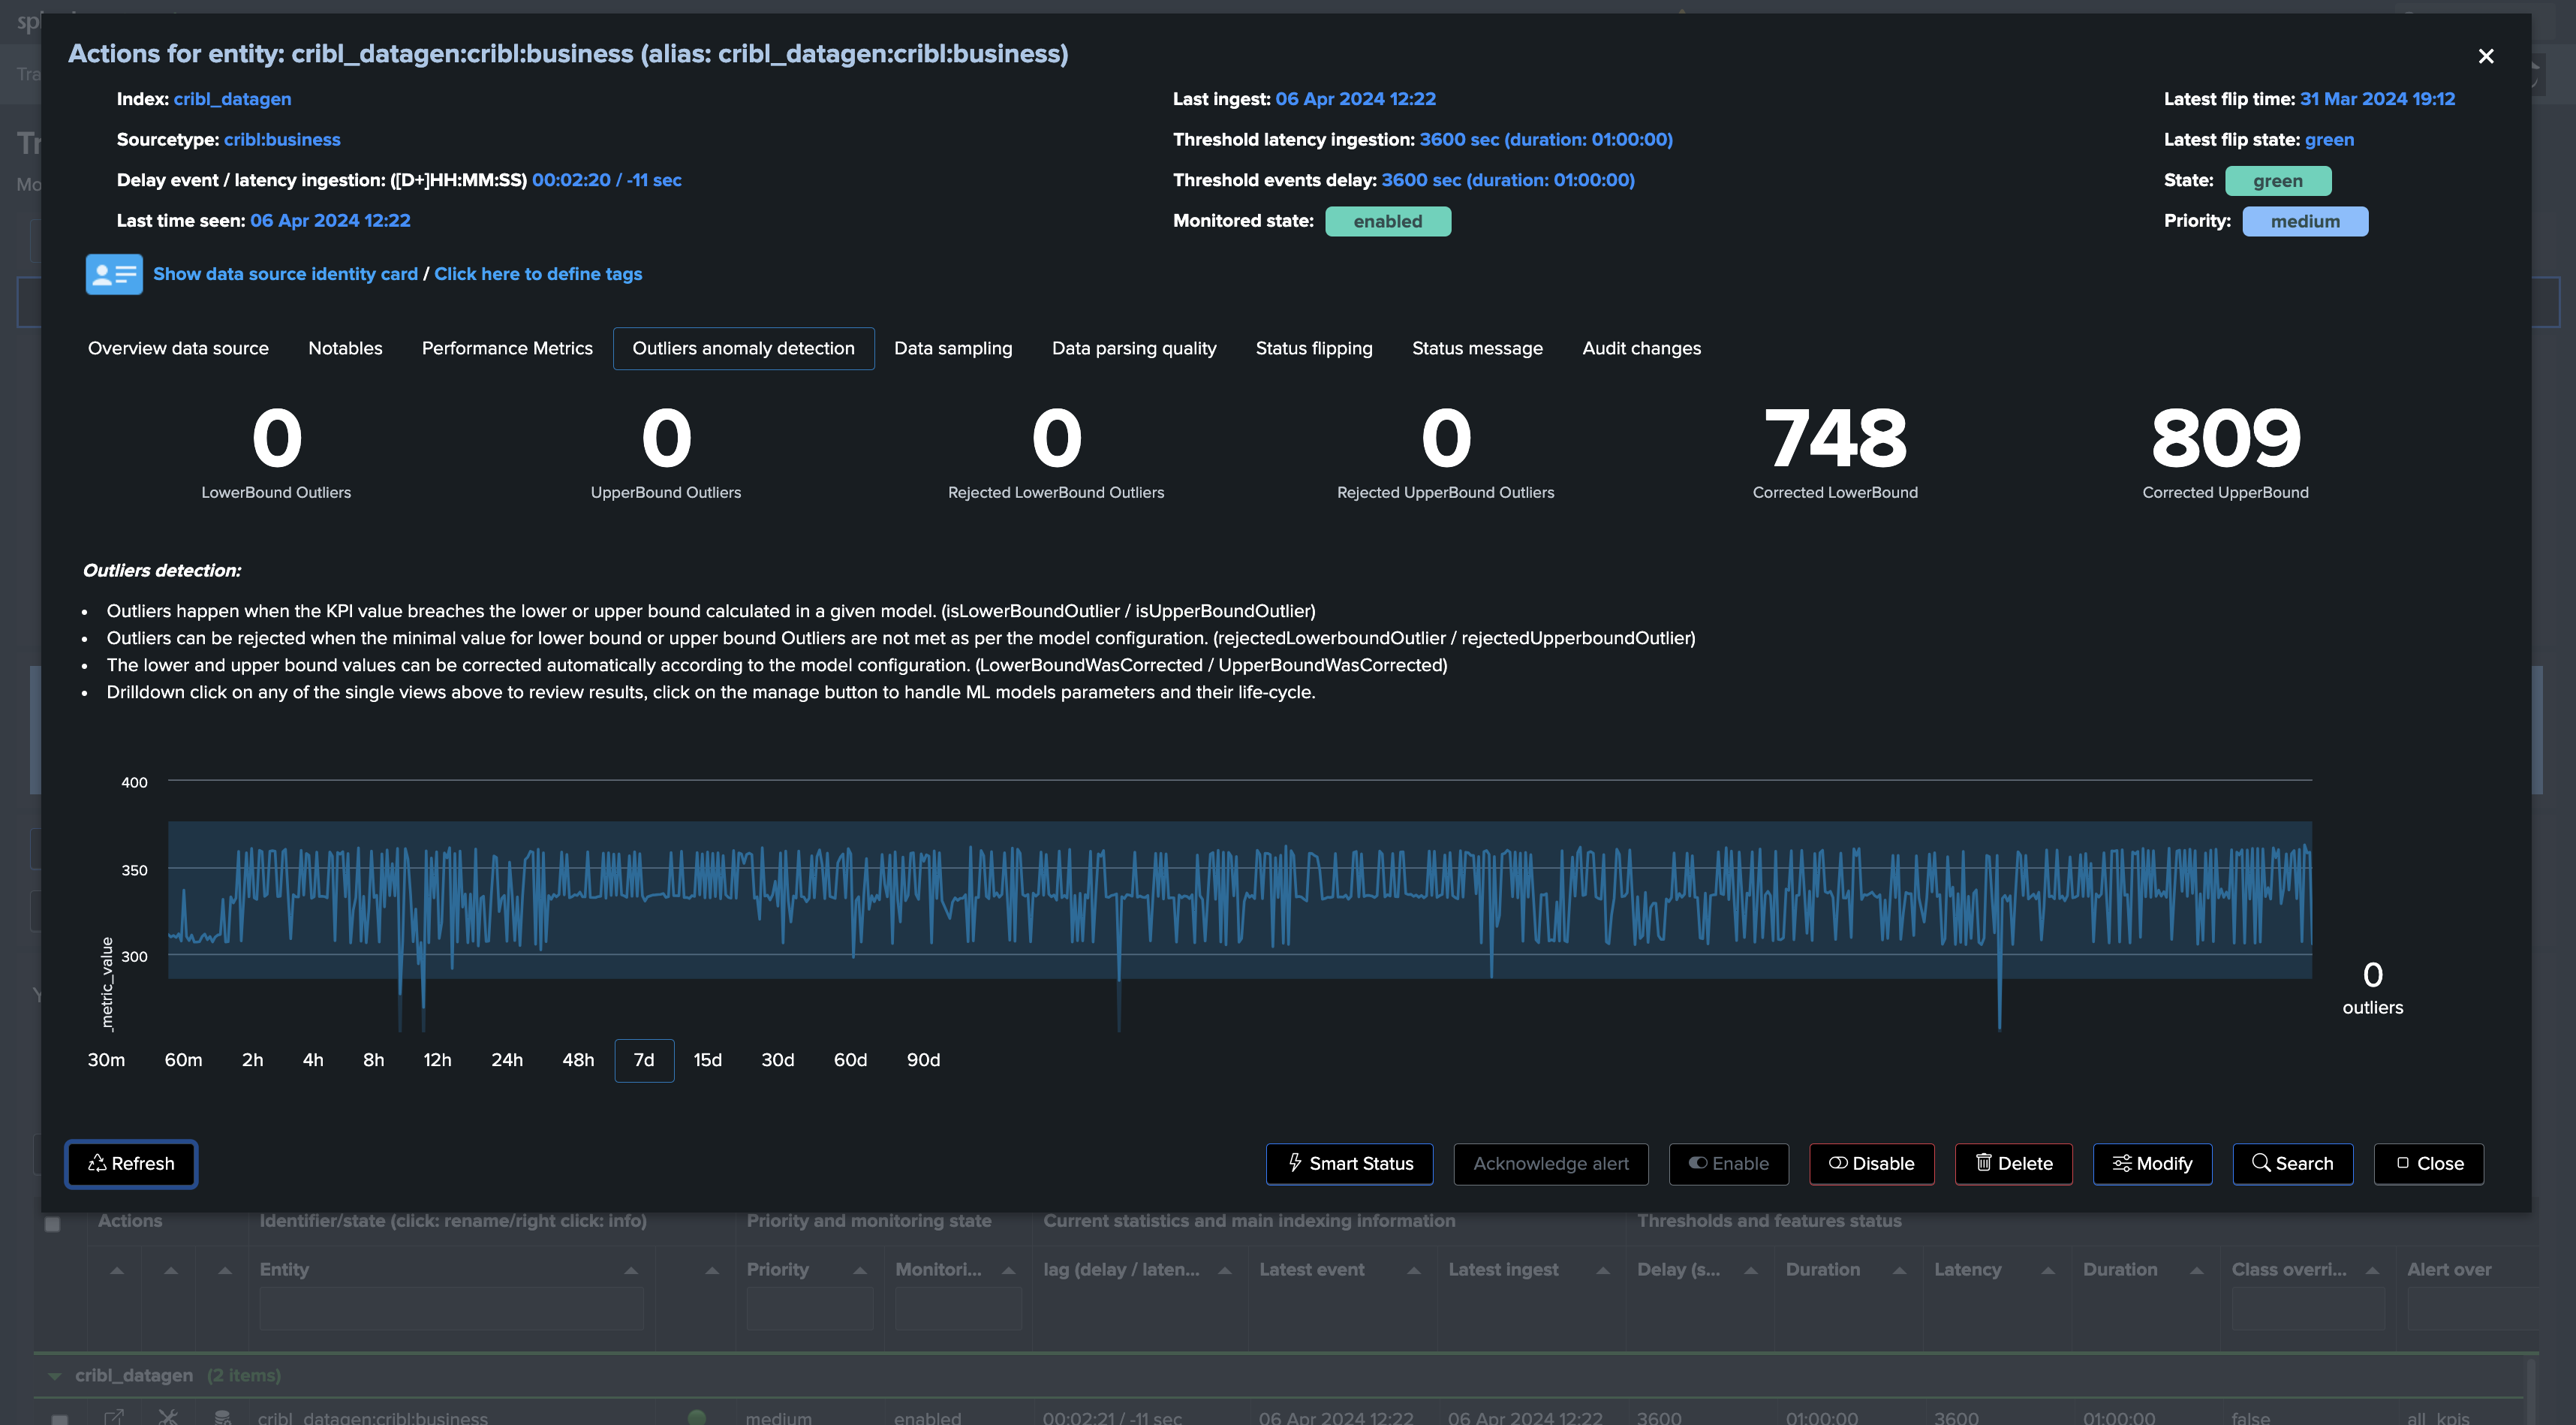
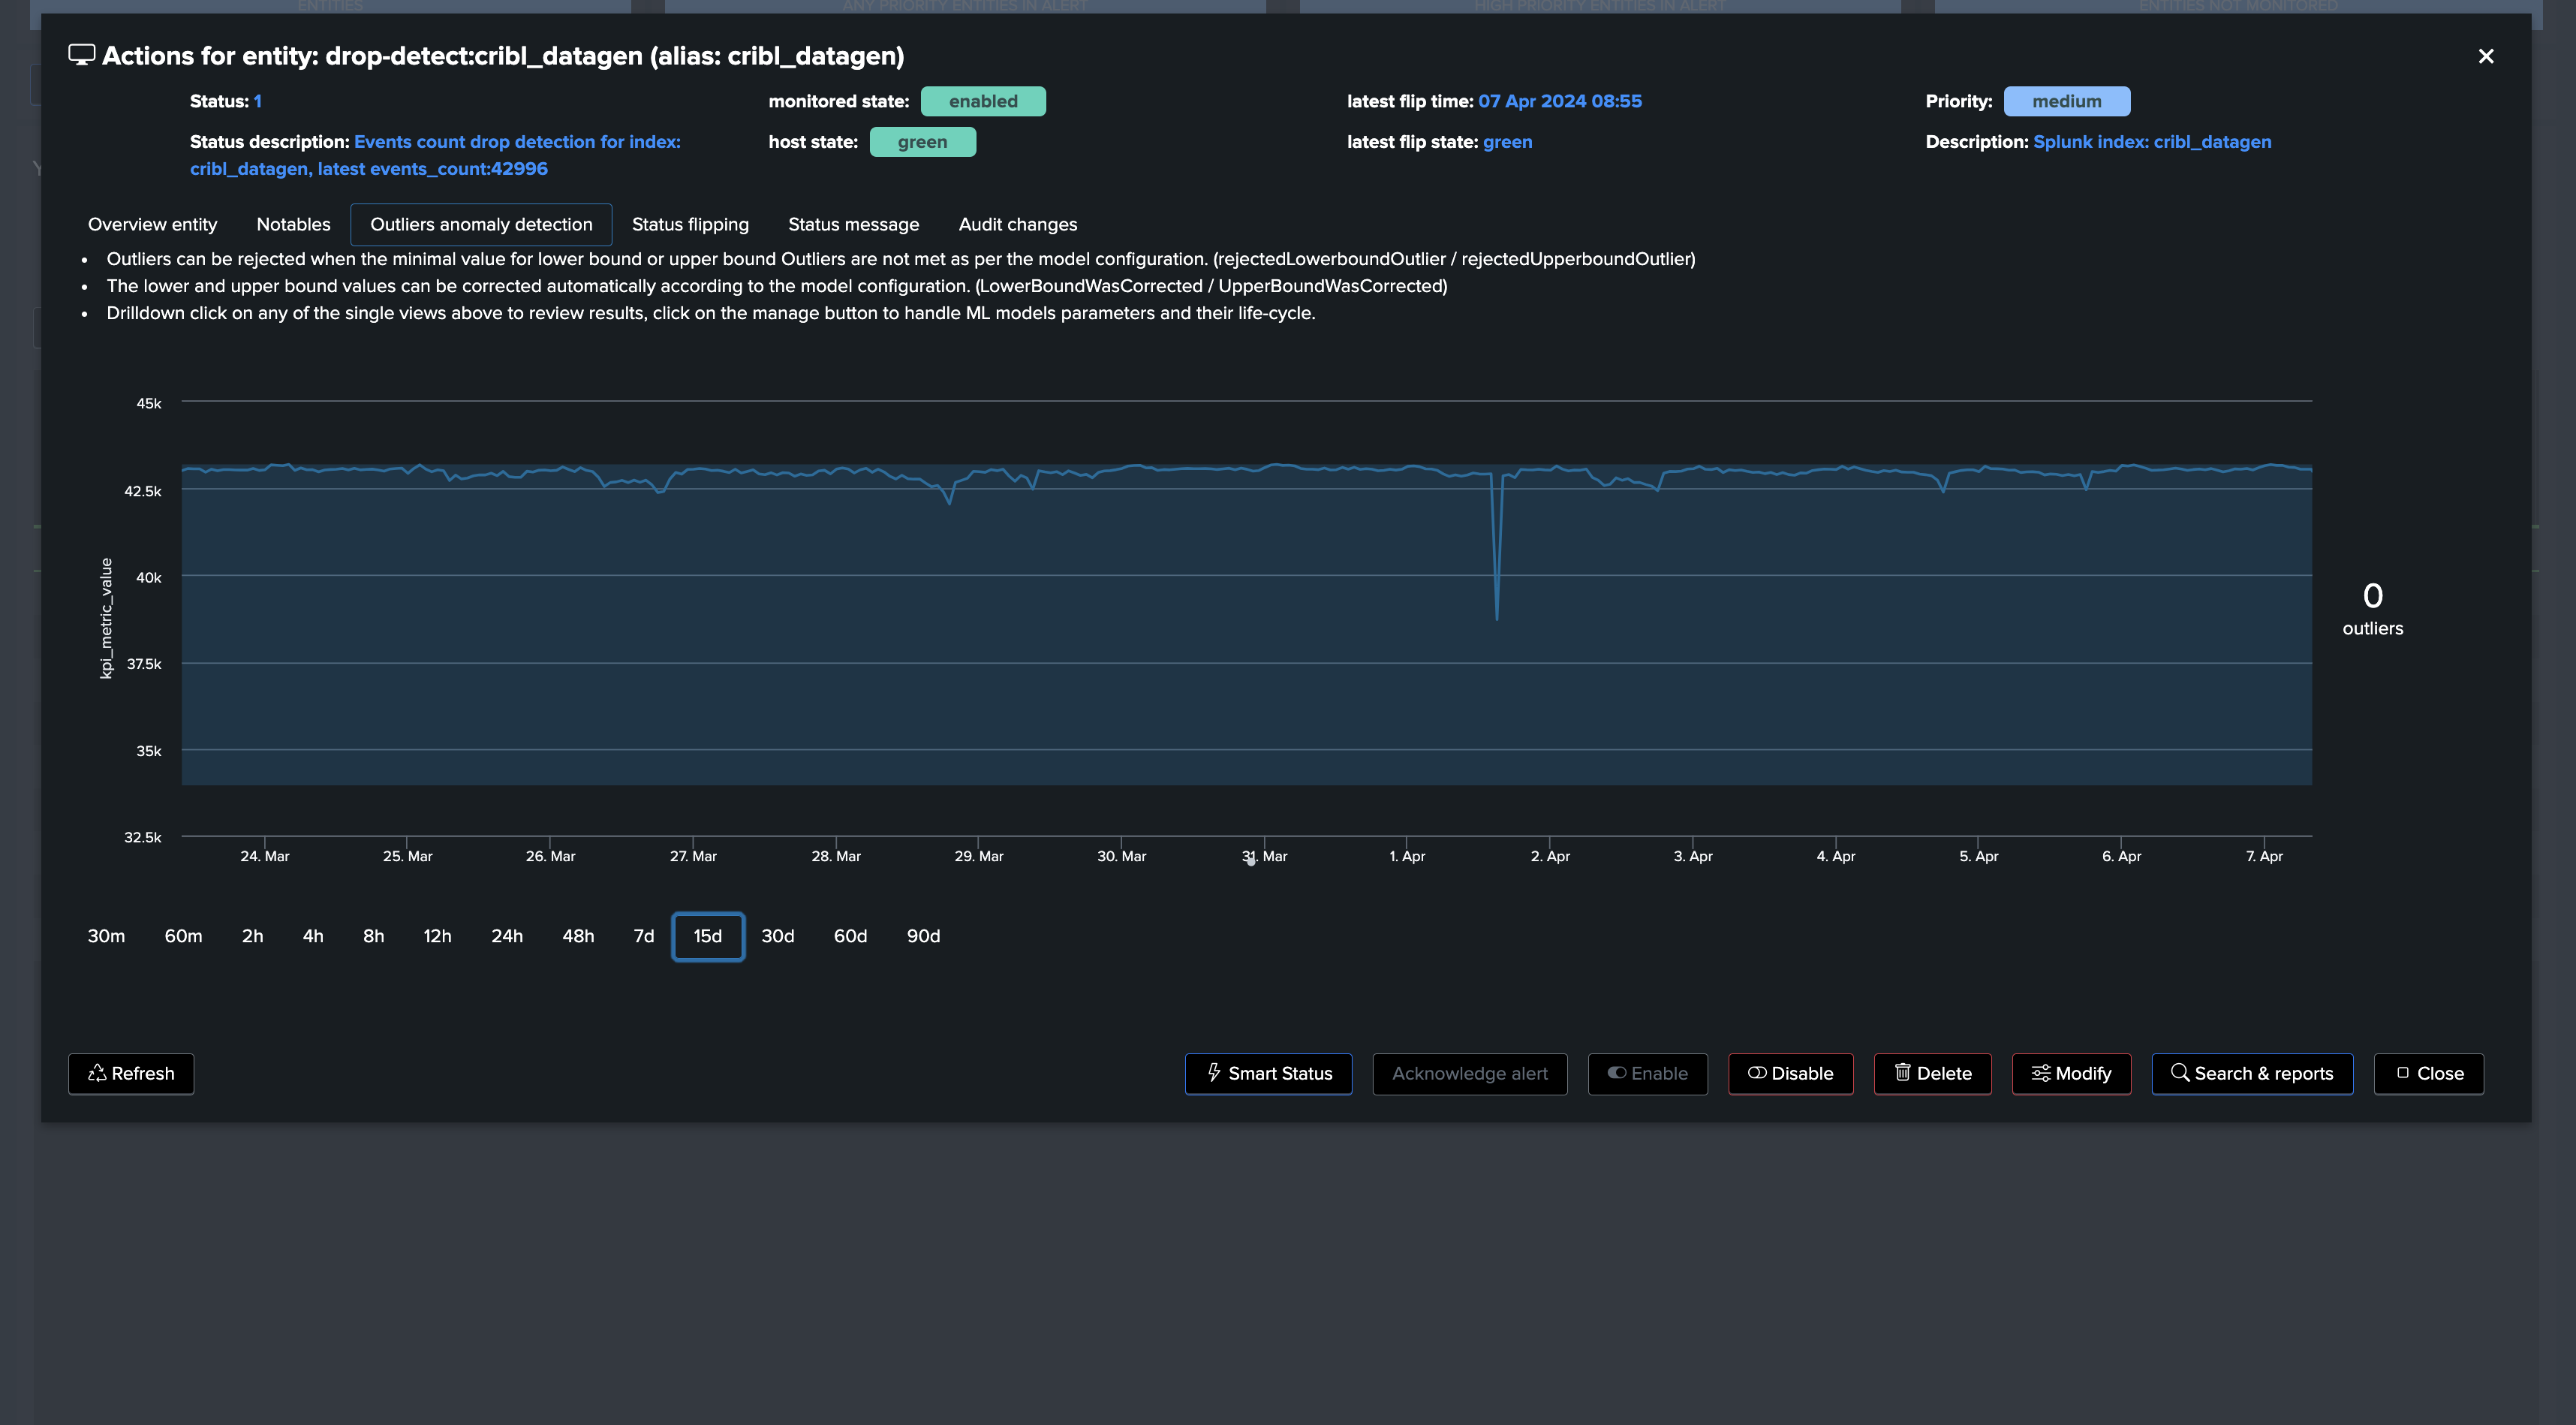
Once trained and simulated, we can see the Machine Learning models being applied:
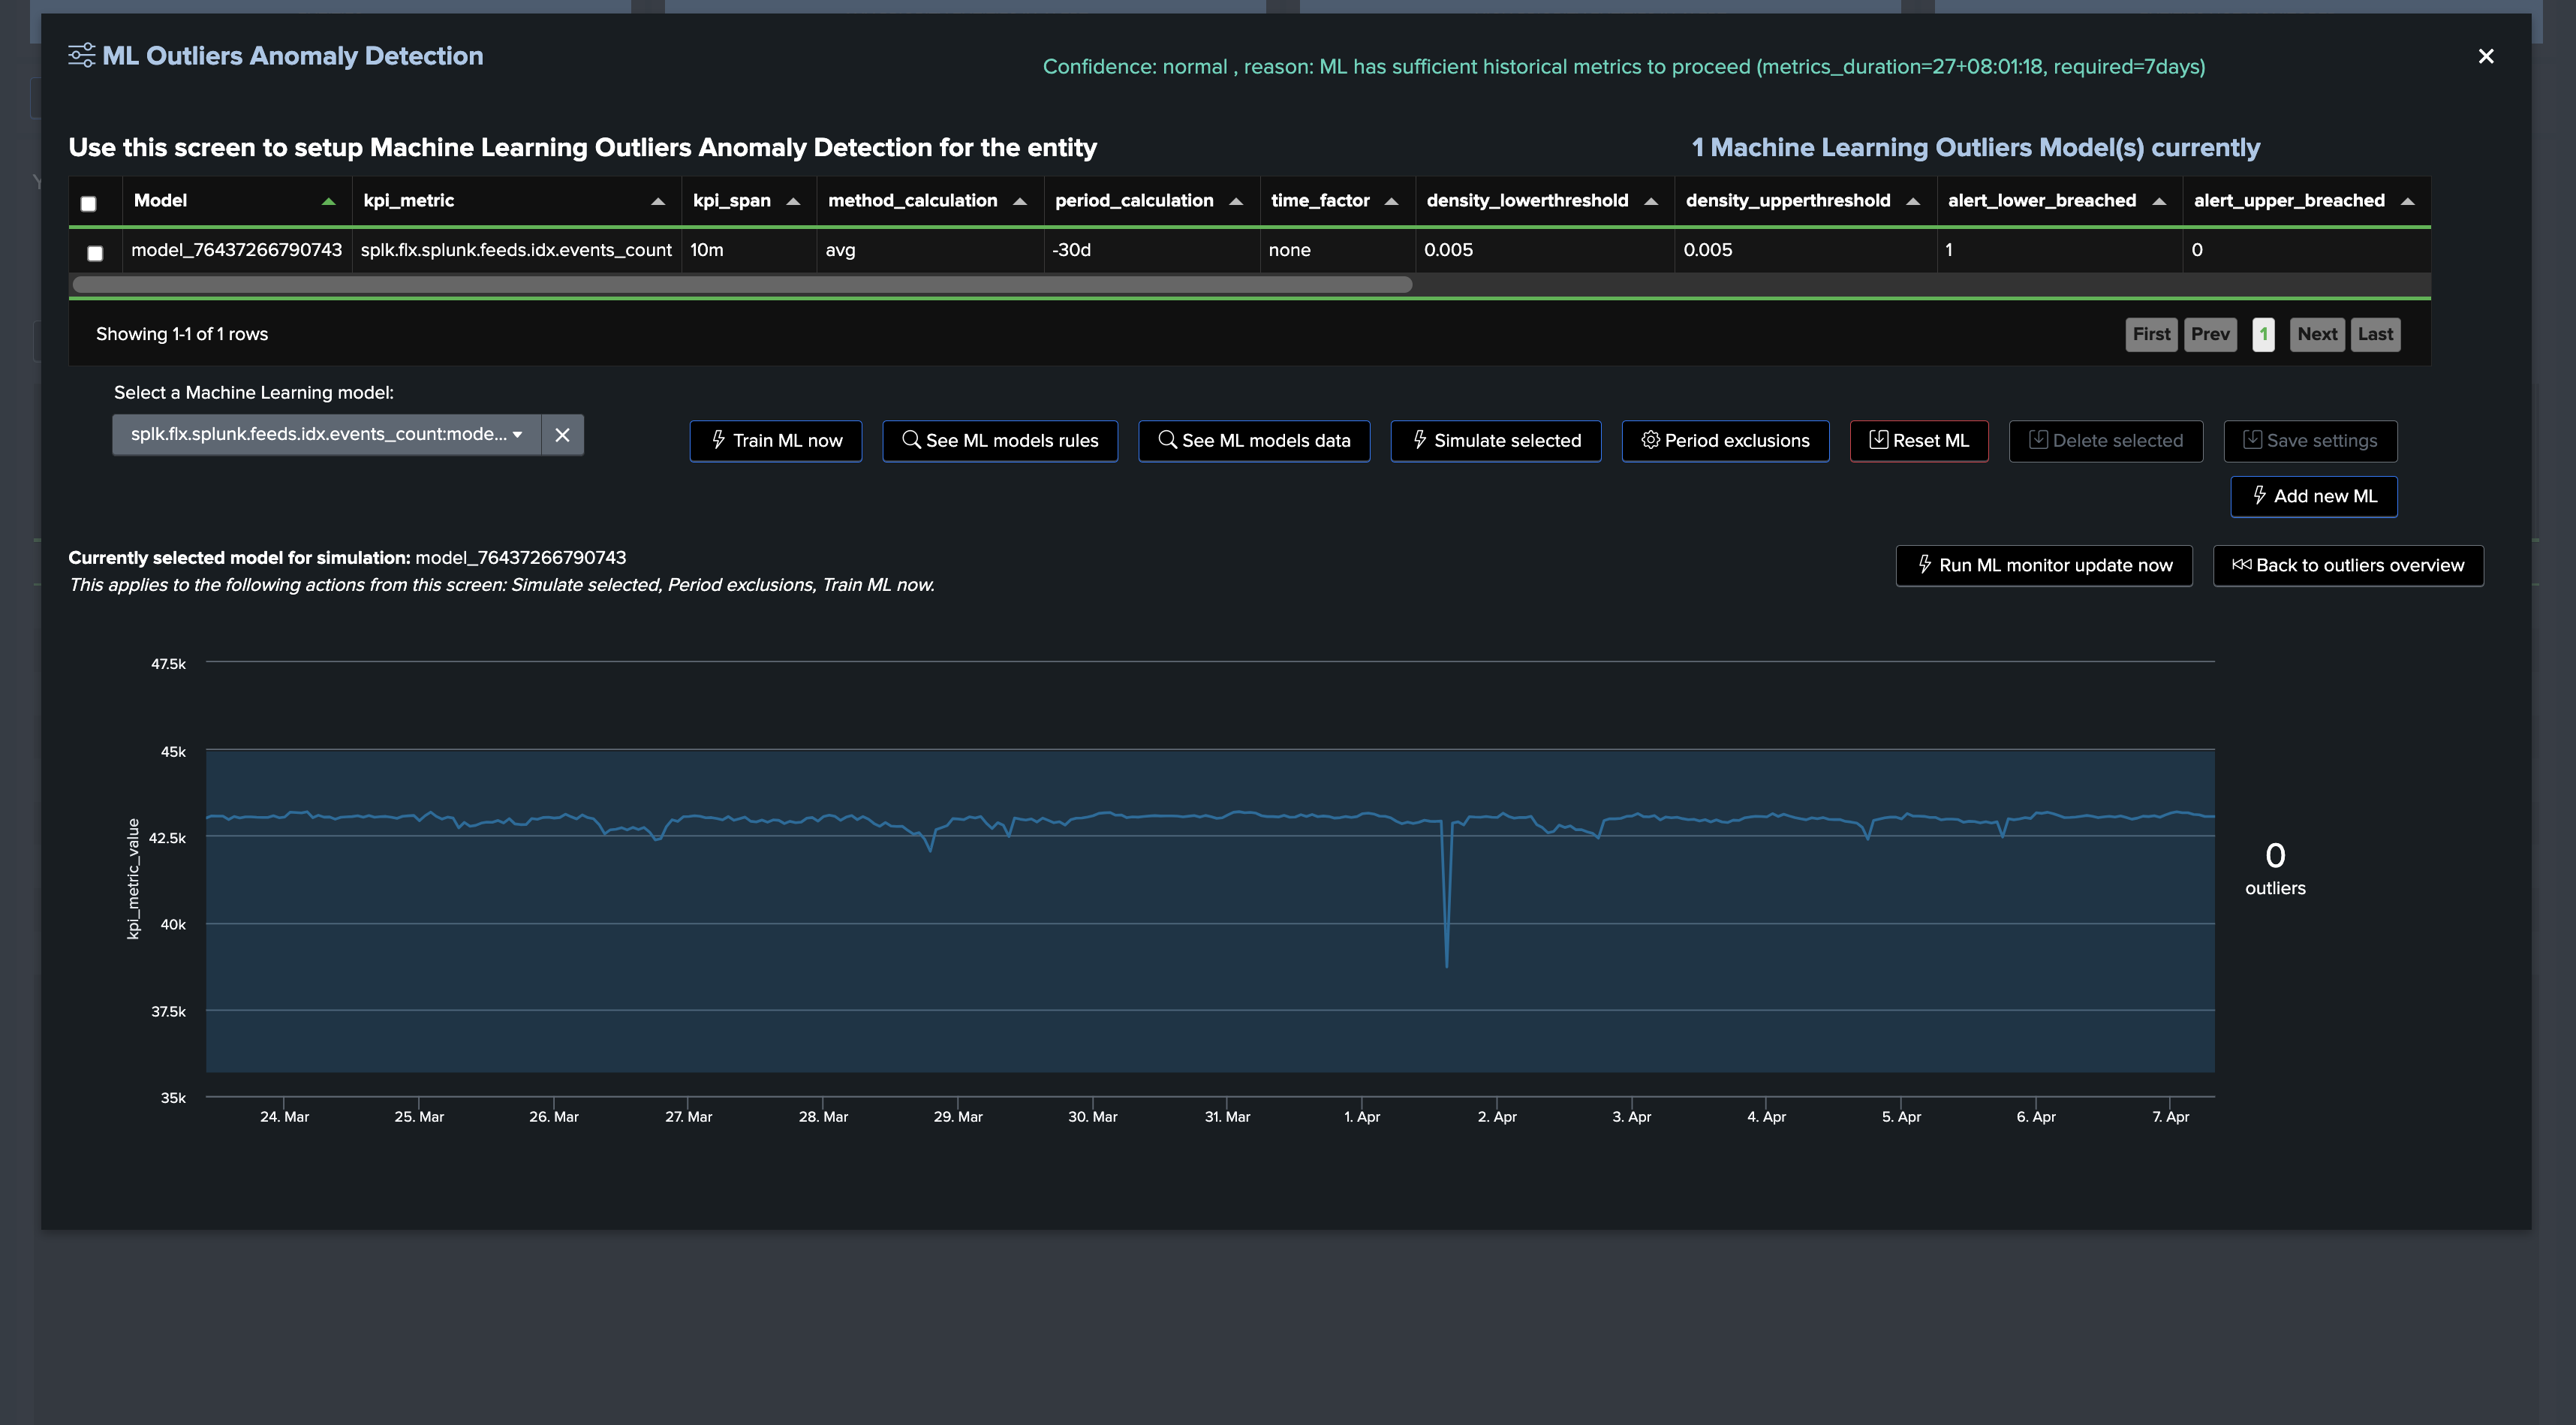
Going back on the live Machine Learning Outliers detection screen (if the chart does not appear, refresh the page!):
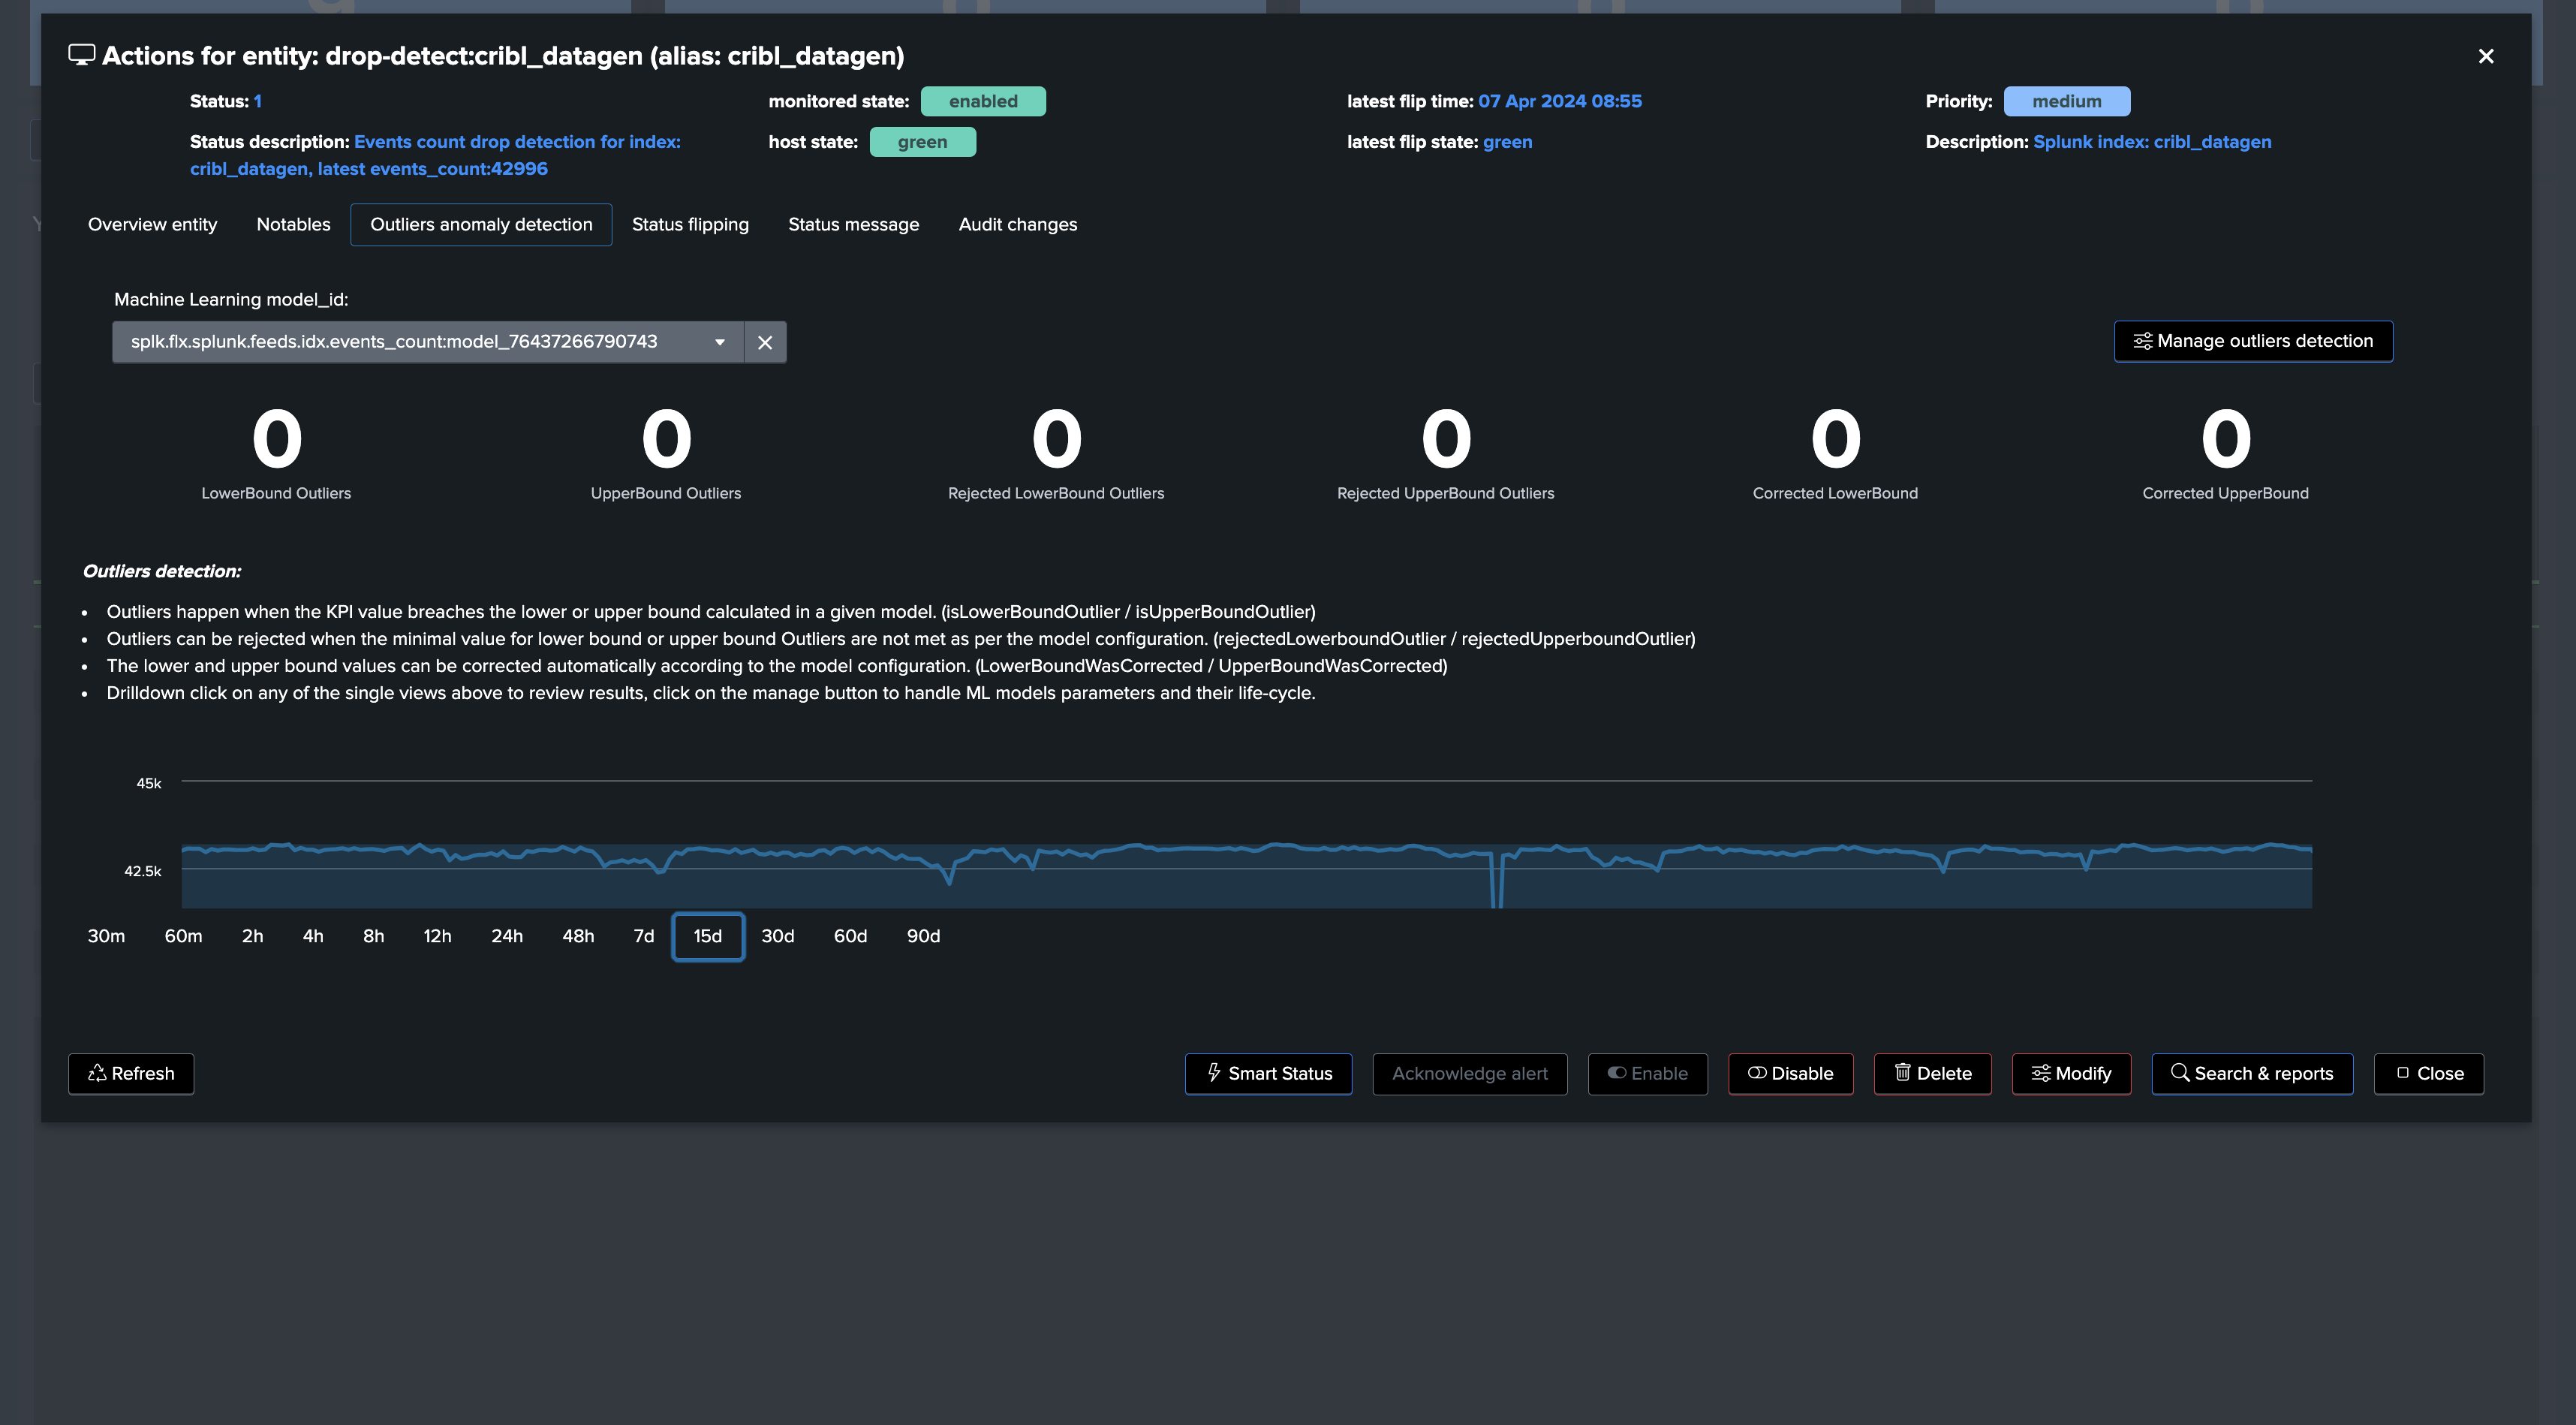
note: Additional options can be set to fine tune Models, notably you can specify minimal values for the LowerBound breaches. (Anything below this value will be rejected as LowerBound Outliers)
Conclusion on drop detection
At this stage, we have:
A ready and operational framework to continuously track and detect abnormal events count drop in Splunk feeds.
TrackMe will automatically train and maintain Machine Learning models for each entity, and apply Anomaly Detection against these models.
Very little fine-tuning is really required, so you can focus on the core of the use case.
You can also fine tune the most important and critical feeds of your environments easily in TrackMe.
Flex Object use case 2 (splk-flx): Detect abnormal events count drop using Flex and Splunk licence usage
Hint
Flex Object tracker use case to monitor and detect abnormal events count drop using Splunk licence statistics
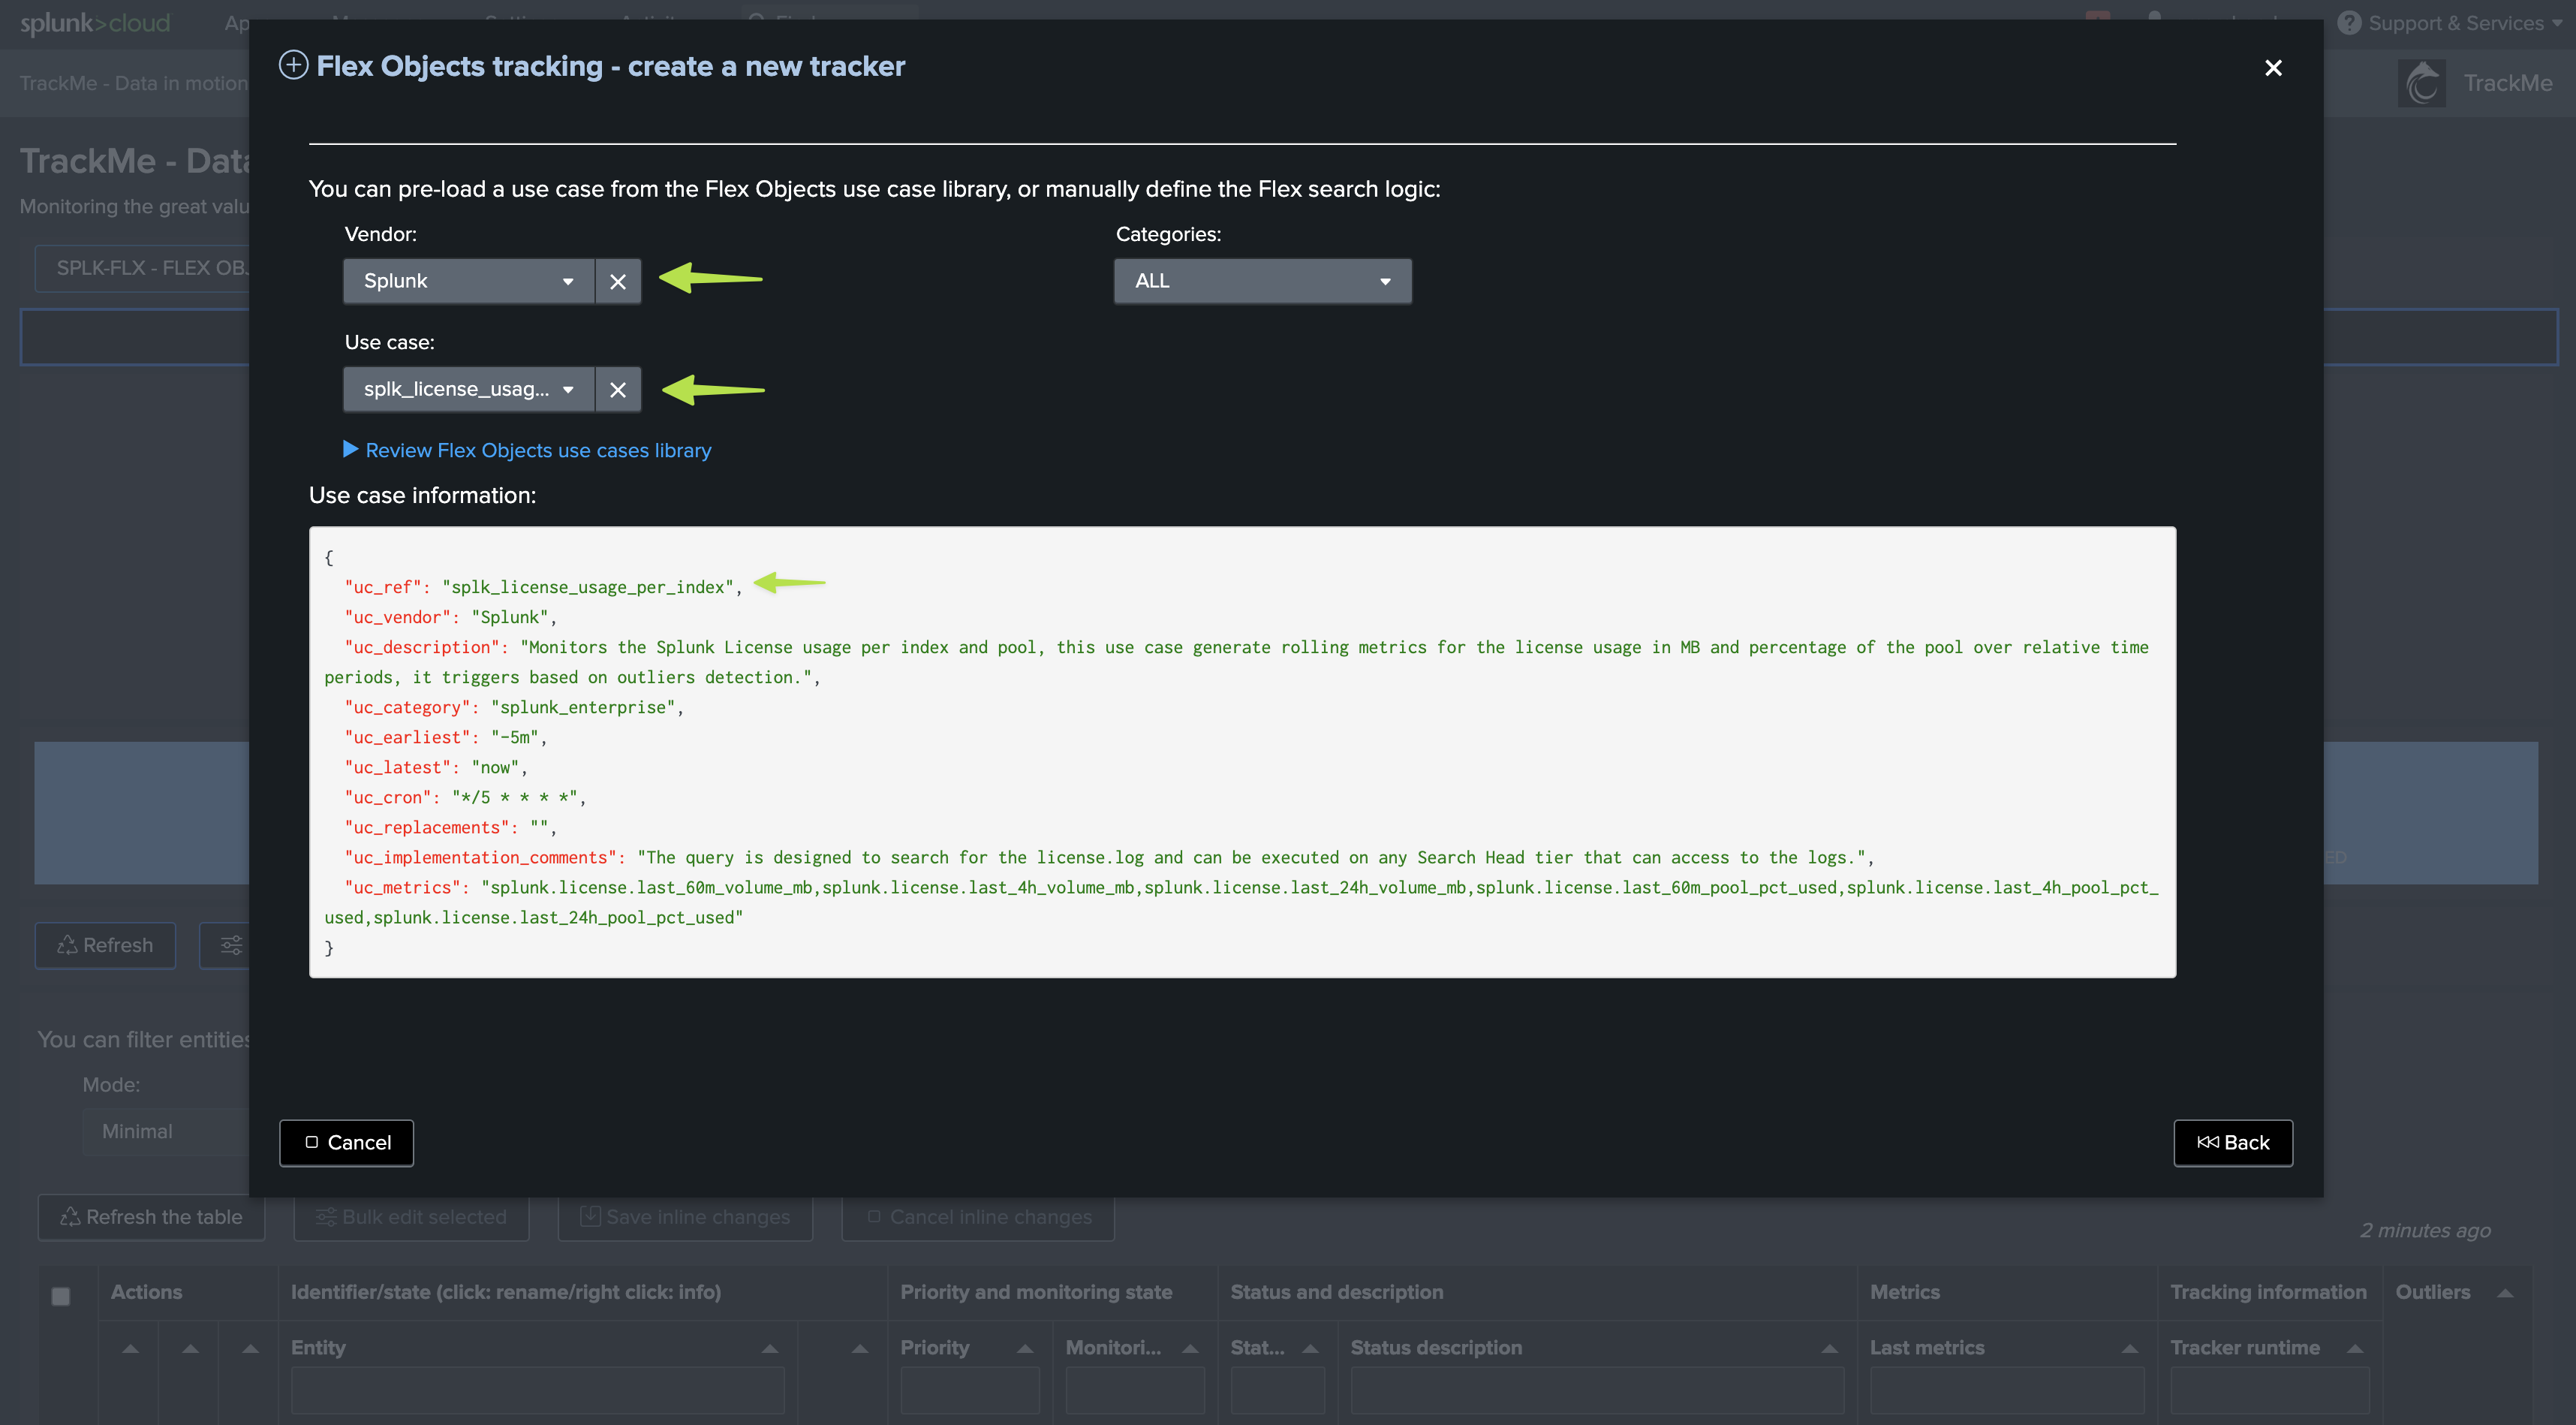
We also have a third option with TrackMe FLex Object tracker and using the Splunk licence usage statistics.
In fact, TrackMe provides an out of the box Flex Object use case called
splk_license_usage_per_indexwhich does exactly this!This use case leverages the Splunk licence usage statistics which accounts against Splunk indexes, this is available and valid for both Splunk Enterprise customers and Splunk Cloud customers.
Unlike the previous use cases, the calculations are based against Megabytes volume metrics of incoming data, rather than events count.
This is also a very efficient use case, the out of the box use case is based on a rolling metric approach, but you could also modify the scheduling plan as we did in the previous example if you wished to turn it into an absolute metric instead.
This use case calculates 3 ranges of rolling metrics: -24h, -4 hours and -60 minutes, and applies Machine Learning based Anomaly Detection against the past 24 hours metrics by default.
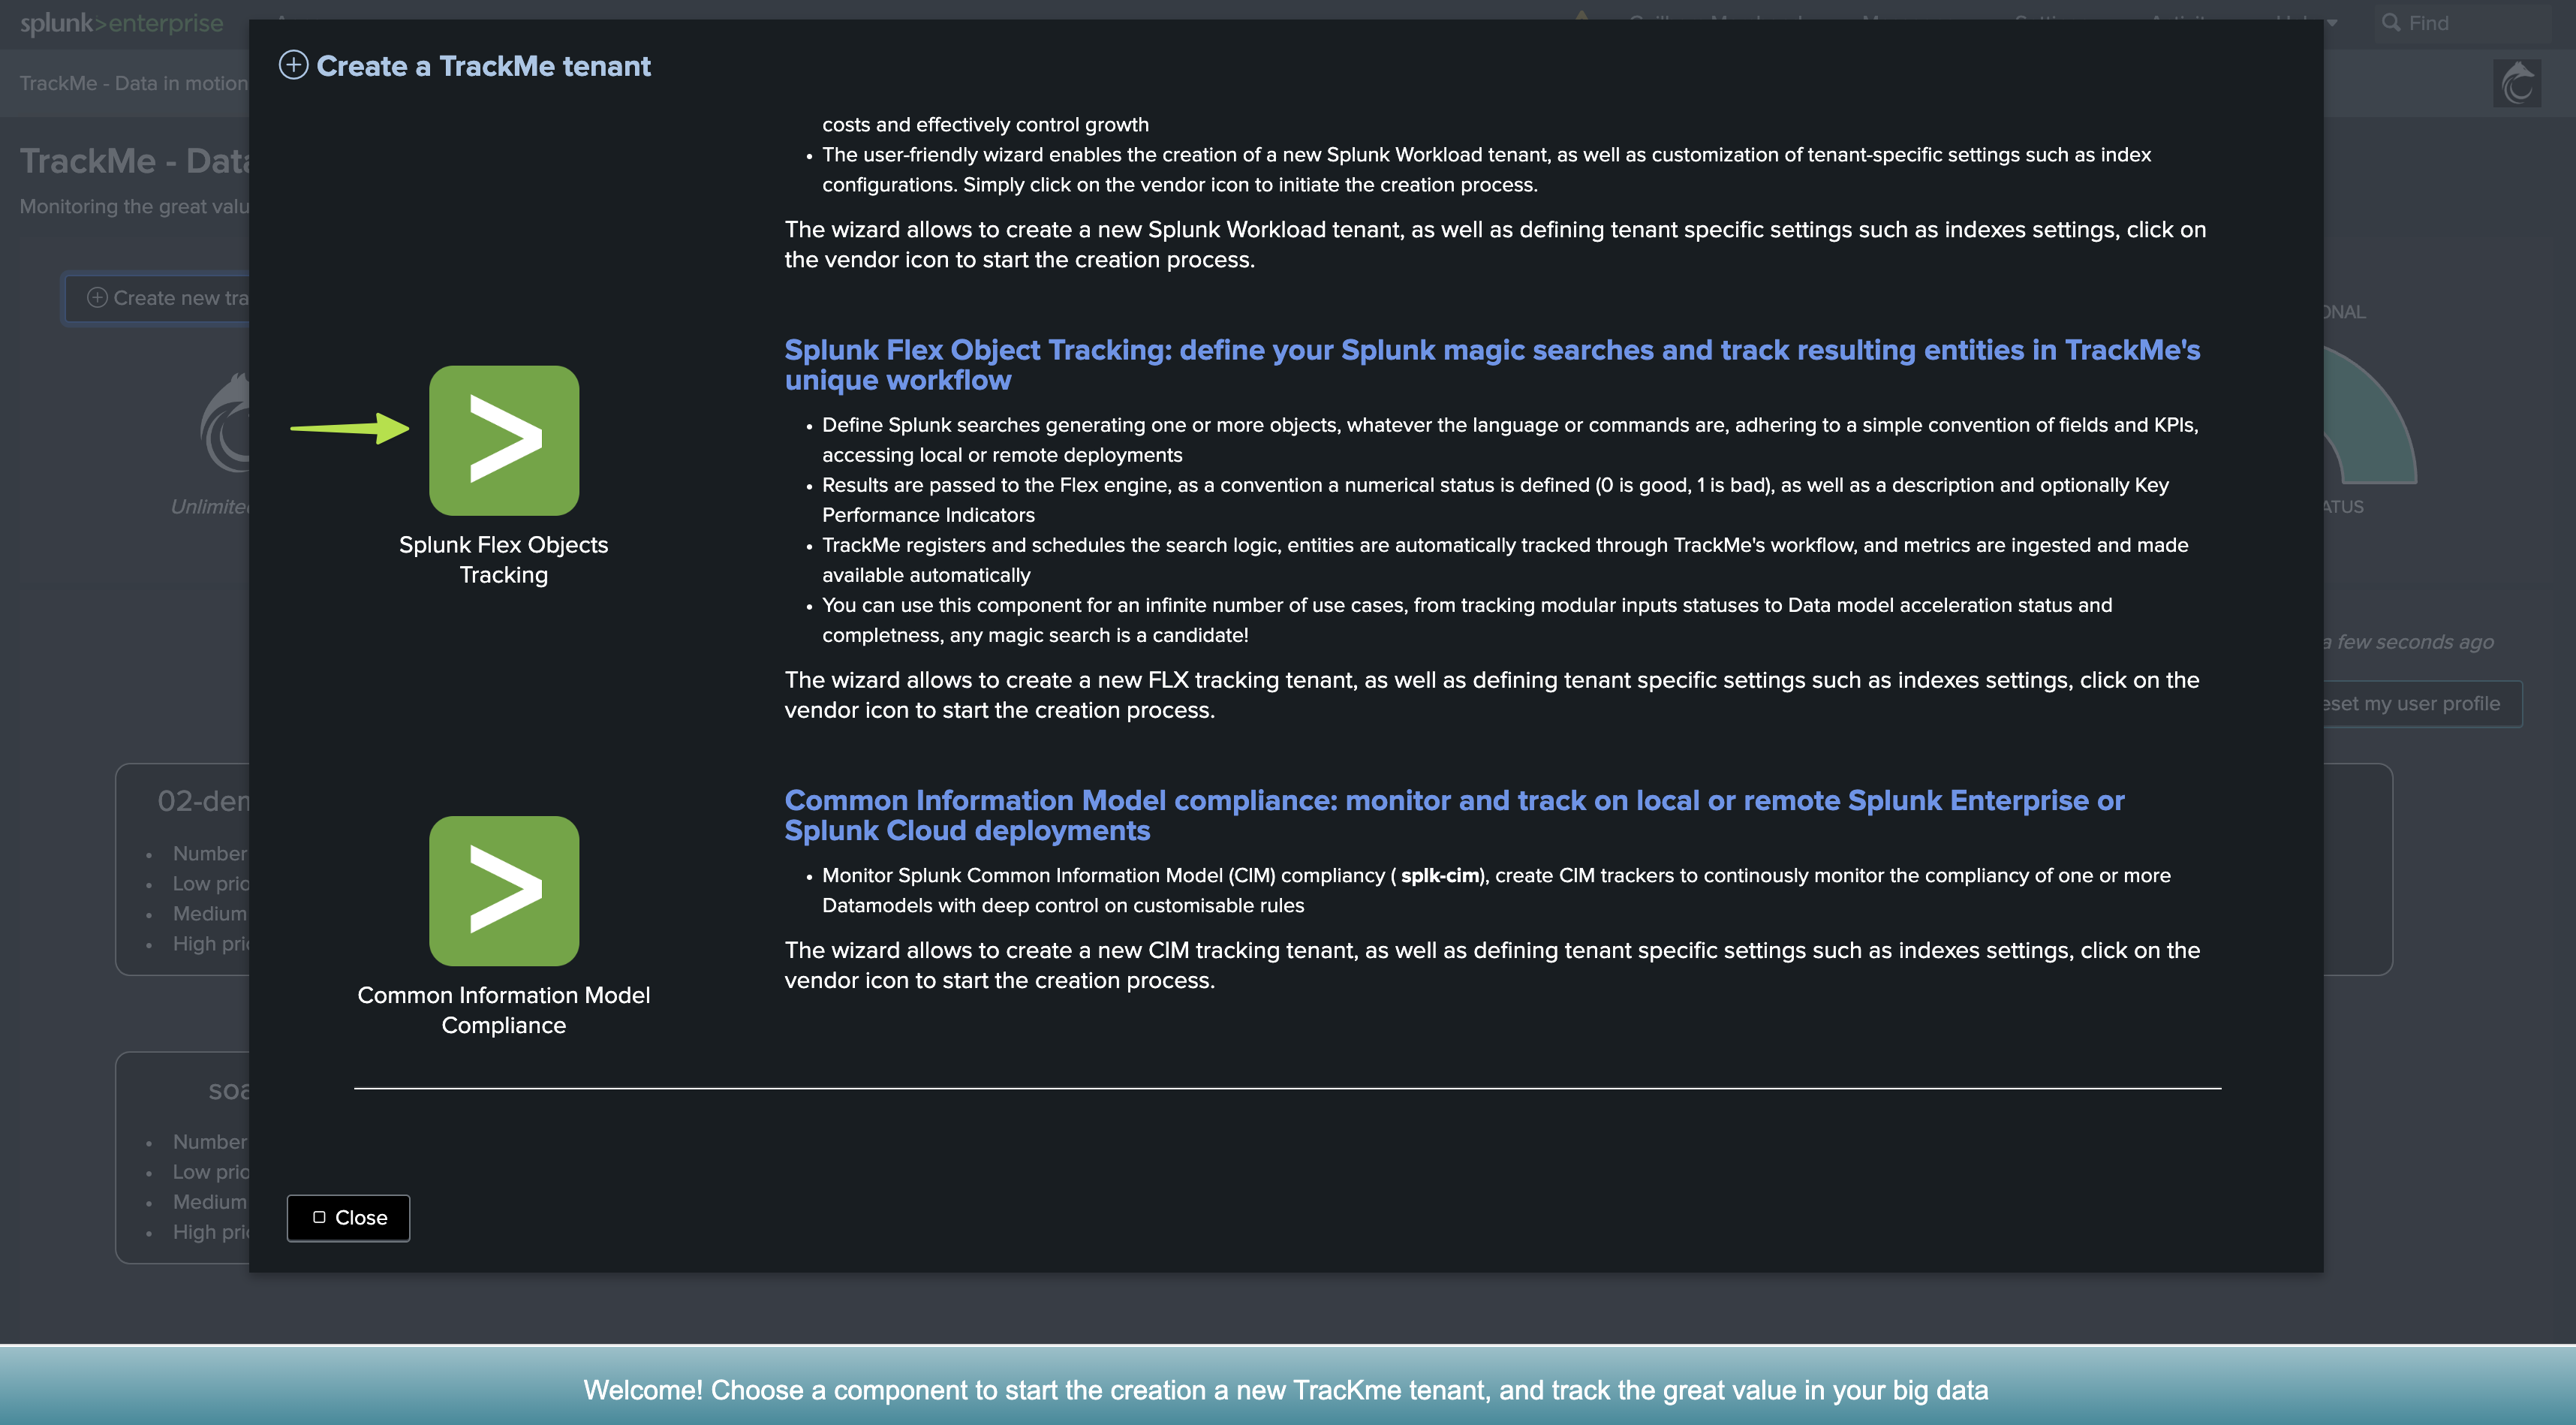
We will assume our Flex Object Virtual Tenant is ready to be used, let’s call the Out of the Box use case
Go with the creation of a Flex Object tracker and select the out of the box use case:
See after this screenshot for an alternative version of the tracker focusing only on the volume based metrics:
Alternative version of the tracker focusing only on the volume based metrics:
index=_internal sourcetype=splunkd source="*/license_usage.log" earliest="-24h" latest="now"
| stats sum(b) as b, latest(poolsz) as poolsz by idx, pool
| eval last_24h_volume_mb = round(b/1024/1024, 2), last_24h_pool_pct_used=round(b/poolsz*100, 2)
| fields idx, pool, last_24h_volume_mb, last_24h_pool_pct_used
| eval object = "idx:" . idx

``` get last 4 hours ```
| append [ search index=_internal sourcetype=splunkd source="*/license_usage.log" earliest="-4h" latest="now"
| stats sum(b) as b, latest(poolsz) as poolsz by idx, pool
| eval last_4h_volume_mb = round(b/1024/1024, 2), last_4h_pool_pct_used=round(b/poolsz*100, 2)
| fields idx, pool, last_4h_volume_mb, last_4h_pool_pct_used
| eval object = "idx:" . idx
]

``` get last 60 minutes ```
| append [ search index=_internal sourcetype=splunkd source="*/license_usage.log" earliest="-60m" latest="now"
| stats sum(b) as b, latest(poolsz) as poolsz by idx, pool
| eval last_60m_volume_mb = round(b/1024/1024, 2), last_60m_pool_pct_used=round(b/poolsz*100, 2)
| fields idx, pool, last_60m_volume_mb, last_60m_pool_pct_used
| eval object = "idx:" . idx
]

| stats first(*) as "*" by object
| foreach last_* [ eval <<FIELD>> = if(isnum('<<FIELD>>'), '<<FIELD>>', 0) ]

| eval group="license|pool:" . pool
| eval alias = idx
| eval object_description = "Splunk license usage for index: " . idx . " / pool: " . pool

``` set status: in this case this is always going to be green, we will rely on outliers detection to detect an upperBound outlier against the rolling 24 hours metrics ```
| eval status=1

``` set status_description ```
| eval status_description=case(
status=1, "last_24h_volume_mb: " . last_24h_volume_mb . ", last_24h_pool_pct_used: " . last_24h_pool_pct_used,
status=2, "last_24h_volume_mb: " . last_24h_volume_mb . ", last_24h_pool_pct_used: " . last_24h_pool_pct_used,
status=3, "last_24h_volume_mb: " . last_24h_volume_mb . ", last_24h_pool_pct_used: " . last_24h_pool_pct_used
)

``` Set metrics and outliers ```
| eval metrics = "{\"splunk.license.last_60m_volume_mb\": " . if(isnum(last_60m_volume_mb), last_60m_volume_mb, 0) . ", \"splunk.license.last_4h_volume_mb\": " . if(isnum(last_4h_volume_mb), last_4h_volume_mb, 0) . ", \"splunk.license.last_24h_volume_mb\": " . if(isnum(last_24h_volume_mb), last_24h_volume_mb, 0) ."}"

| eval outliers_metrics = "{\"splunk.license.last_24h_volume_mb\": {\"alert_lower_breached\": 0, \"alert_upper_breached\": 1}}"

``` alert if inactive for more than 30 days```
| eval max_sec_inactive=30*24*60*60
Once first executed, we have one entity per index, with 3 levels of volume metrics
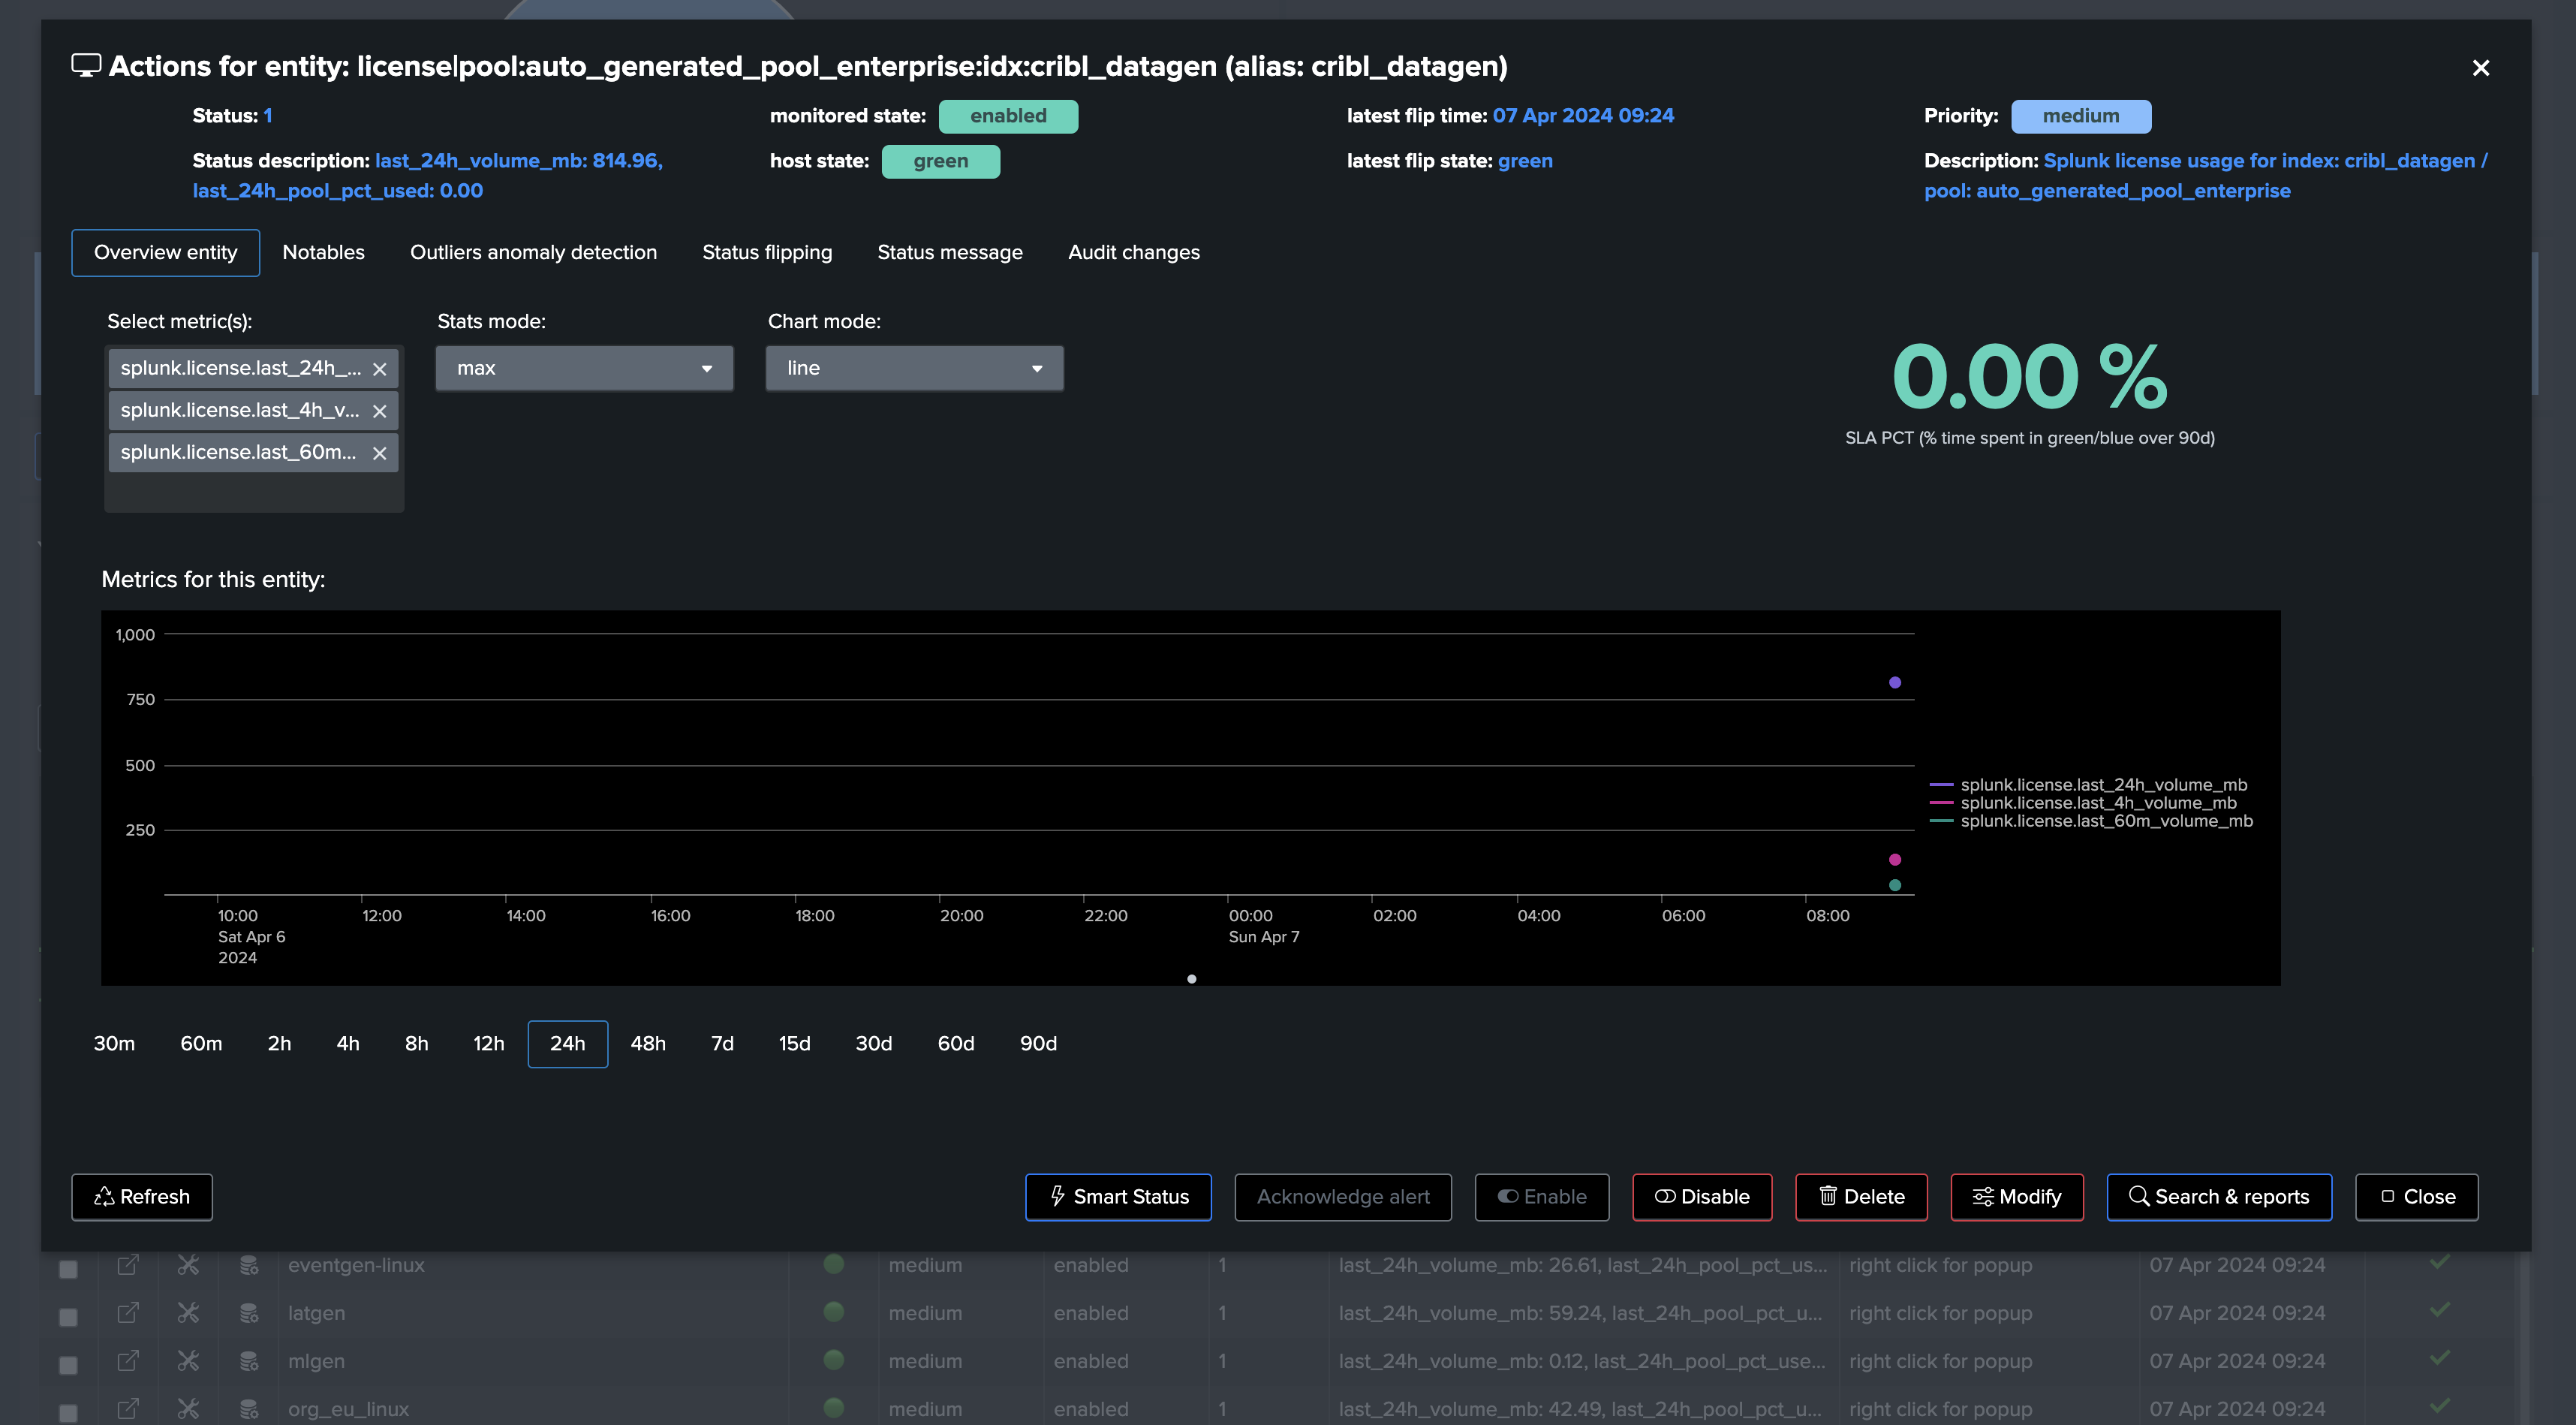
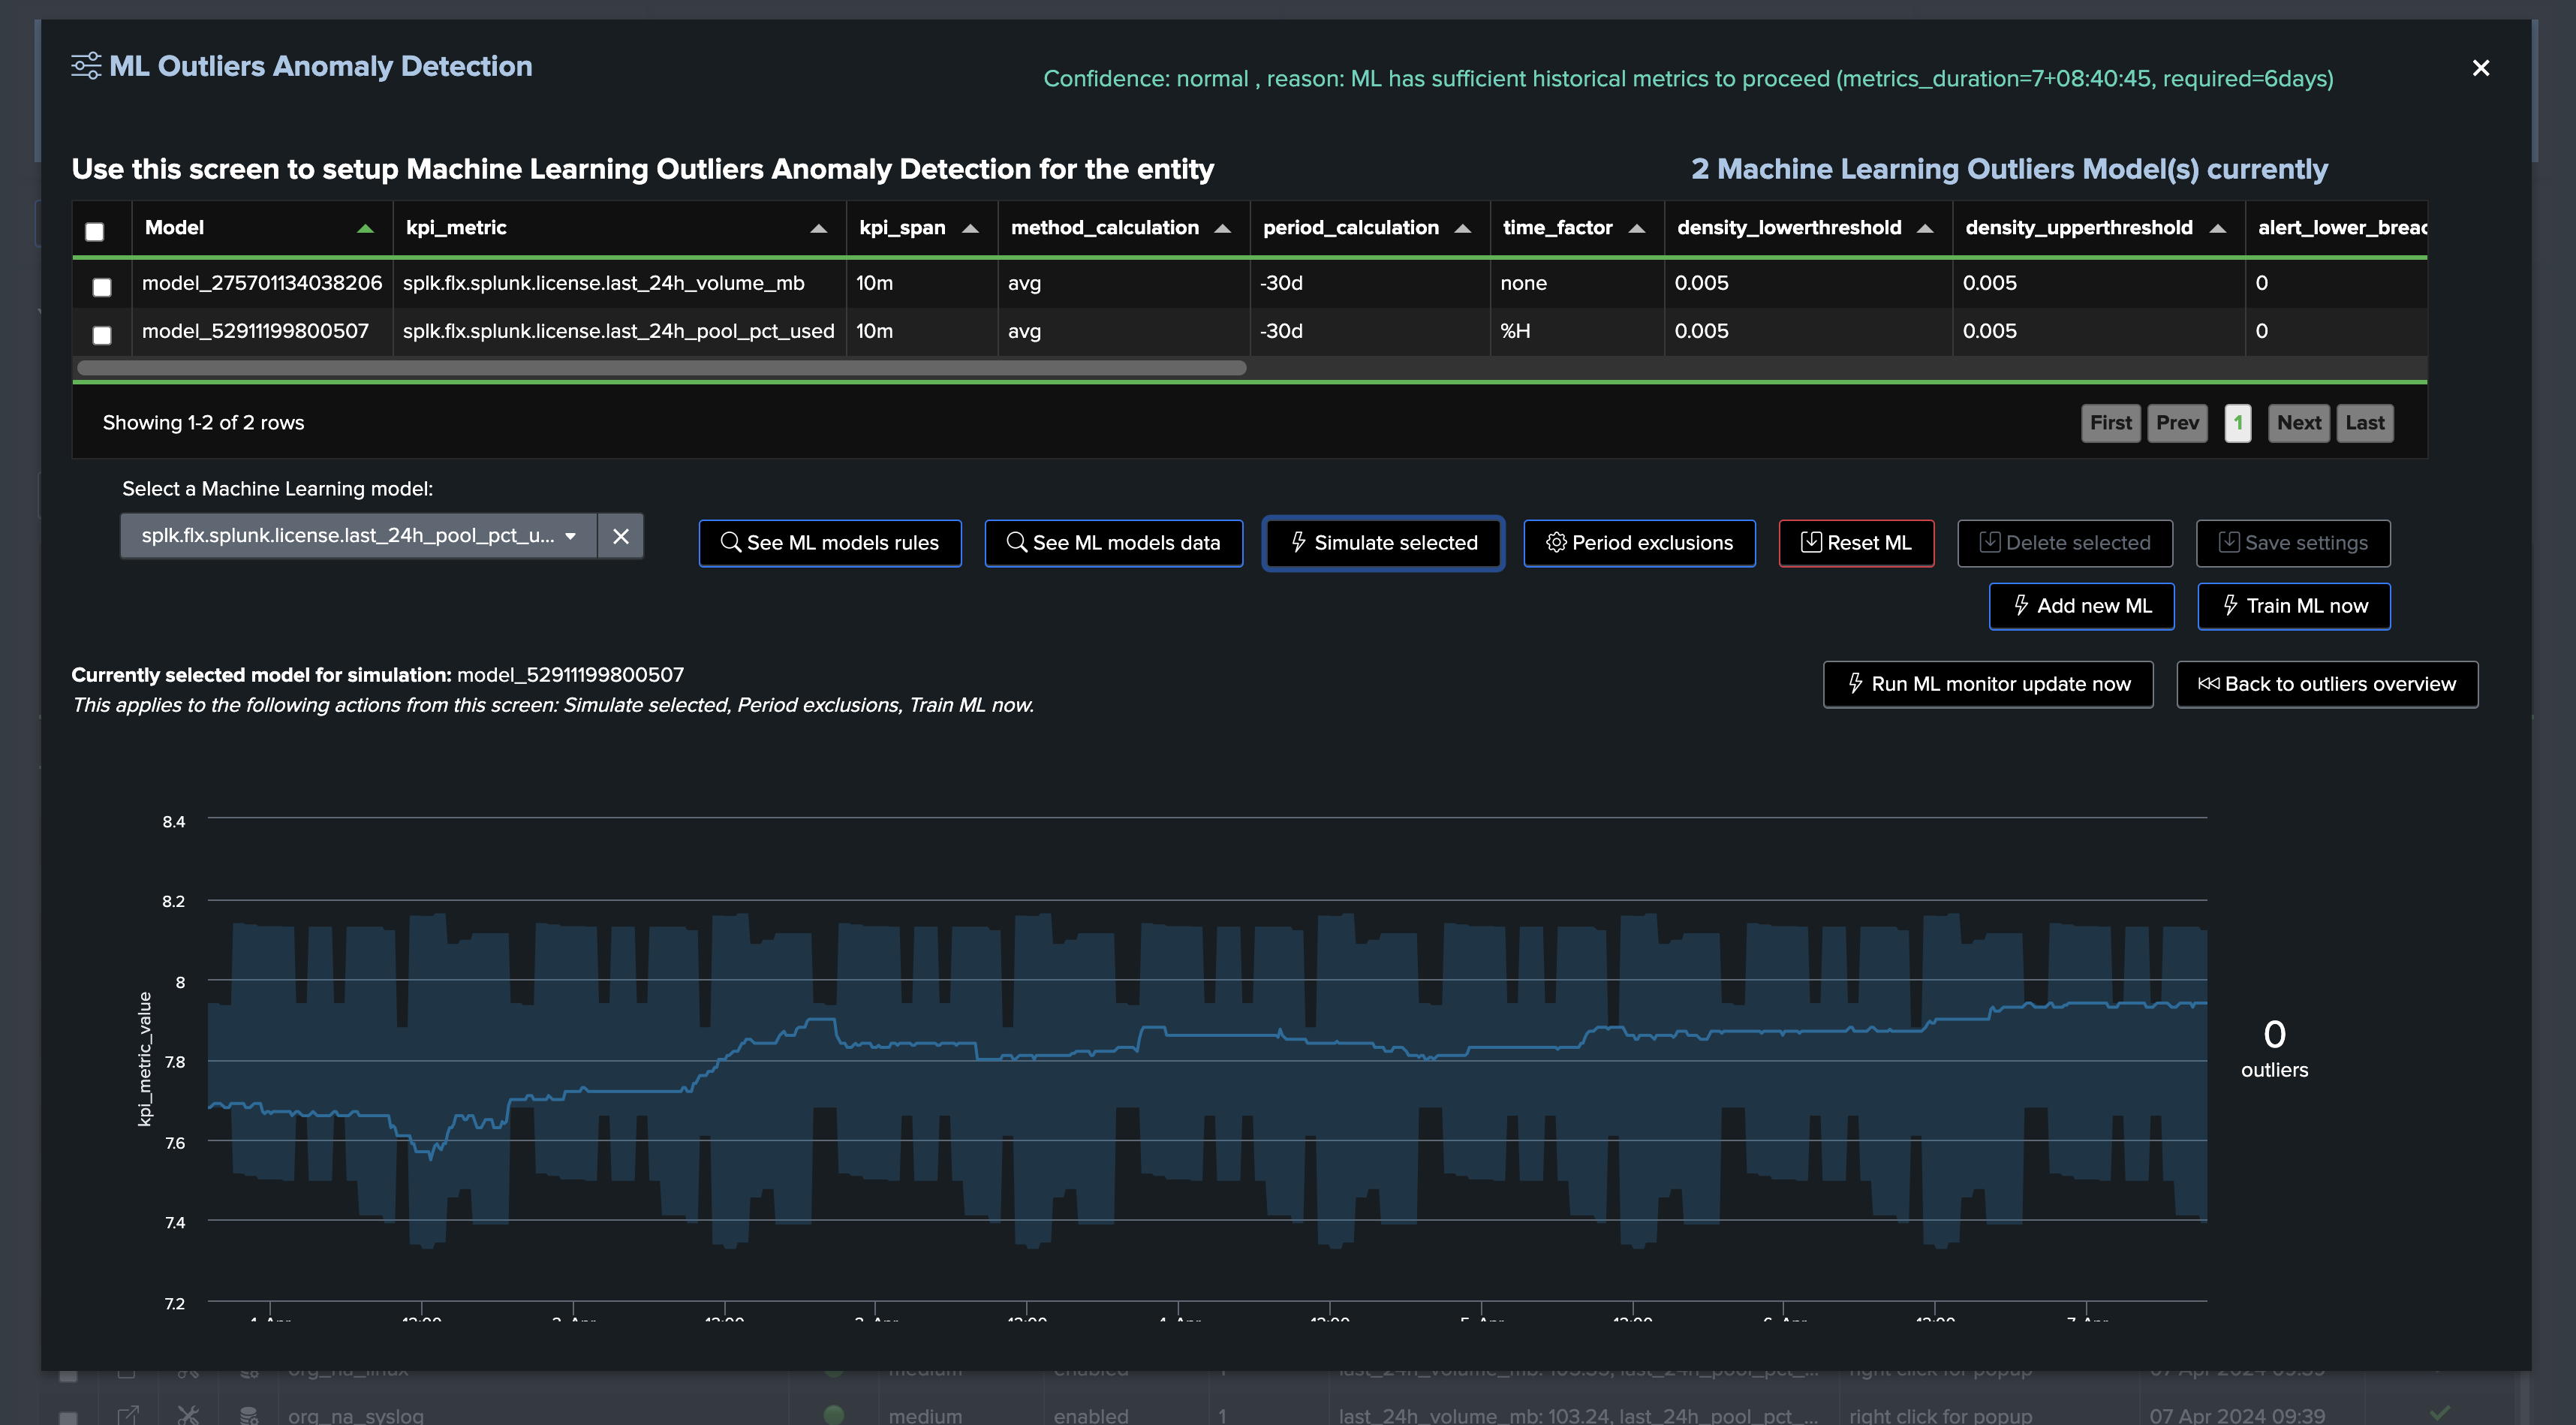
This example shows Machine Learning applied against the licence pool percentage usage with seasonality concept enabled: (for Enterprise customers only)
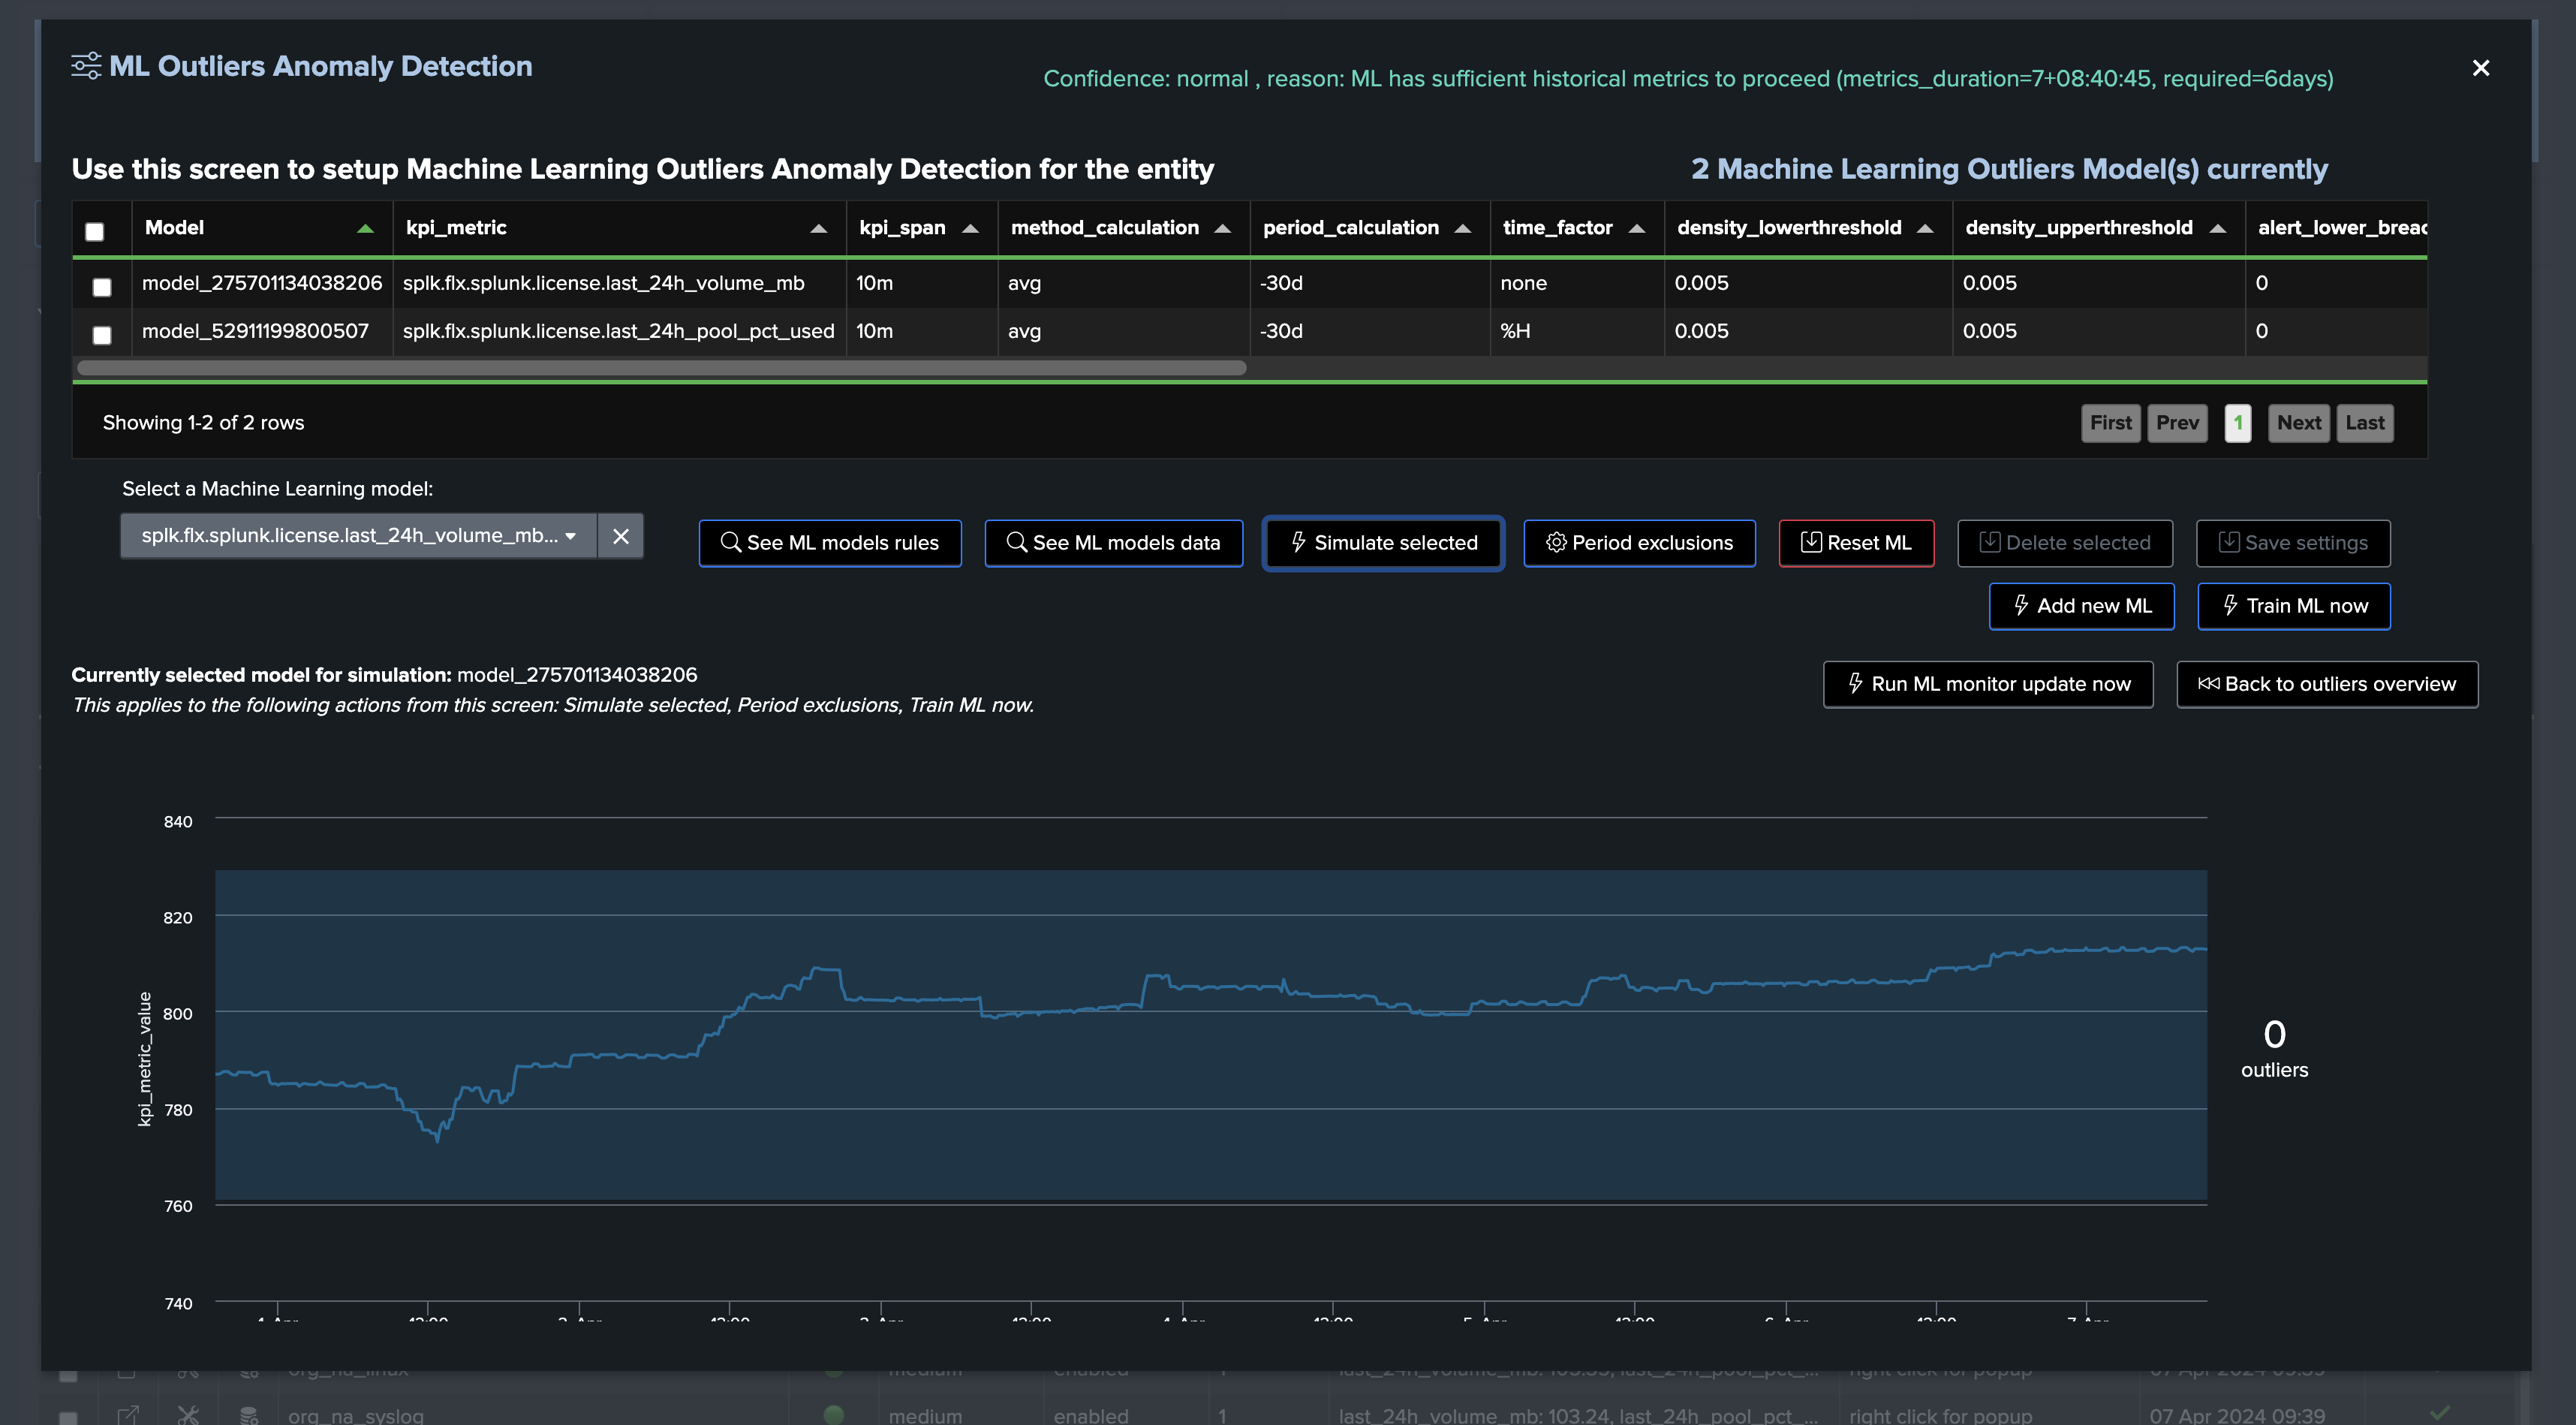
This example shows Machine Learning applied against the volume metrics with seasonality concept disabled:
Conclusion: volume based metrics
At this stage:
We have a ready and operational automated powerful framework to continuously track and detect abnormal volume drop in Splunk feeds per index.
TrackMe will automatically train and maintain Machine Learning models for each entity, and apply Anomaly Detection against these models.
Very little fine-tuning is really required, so you can focus on the core of the use case.
You can also fine tune the most important and critical feeds of your environments easily in TrackMe.
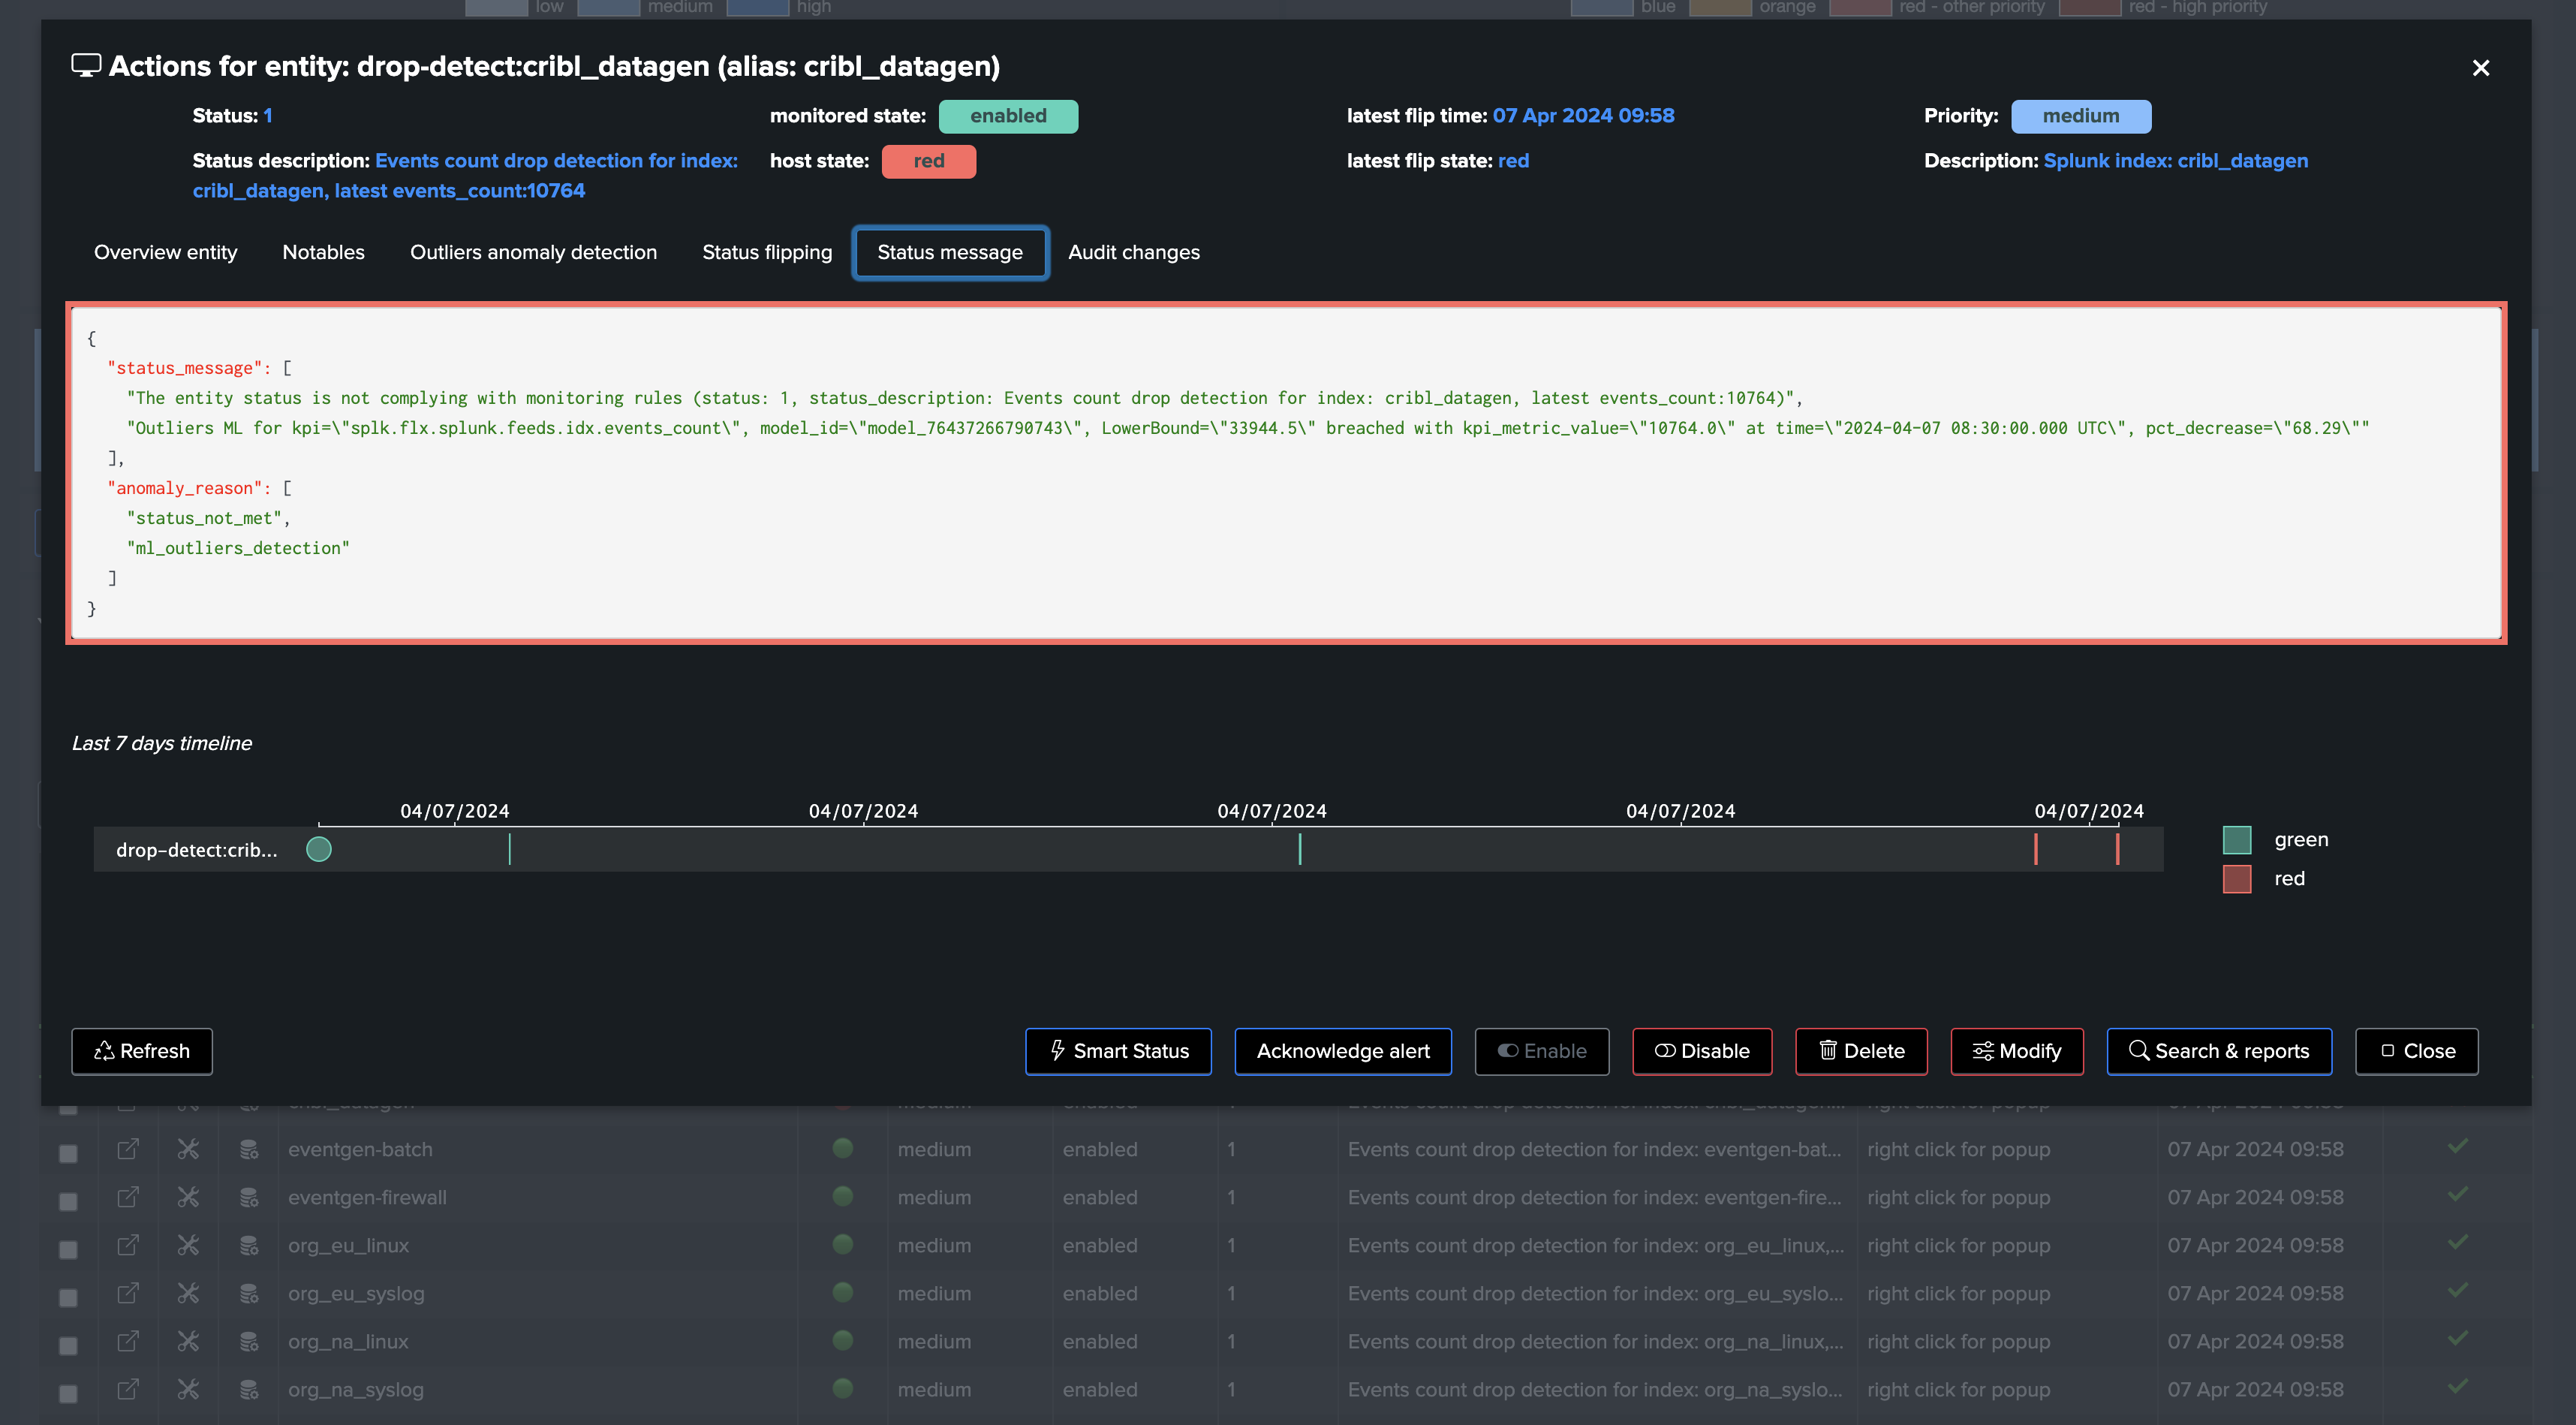
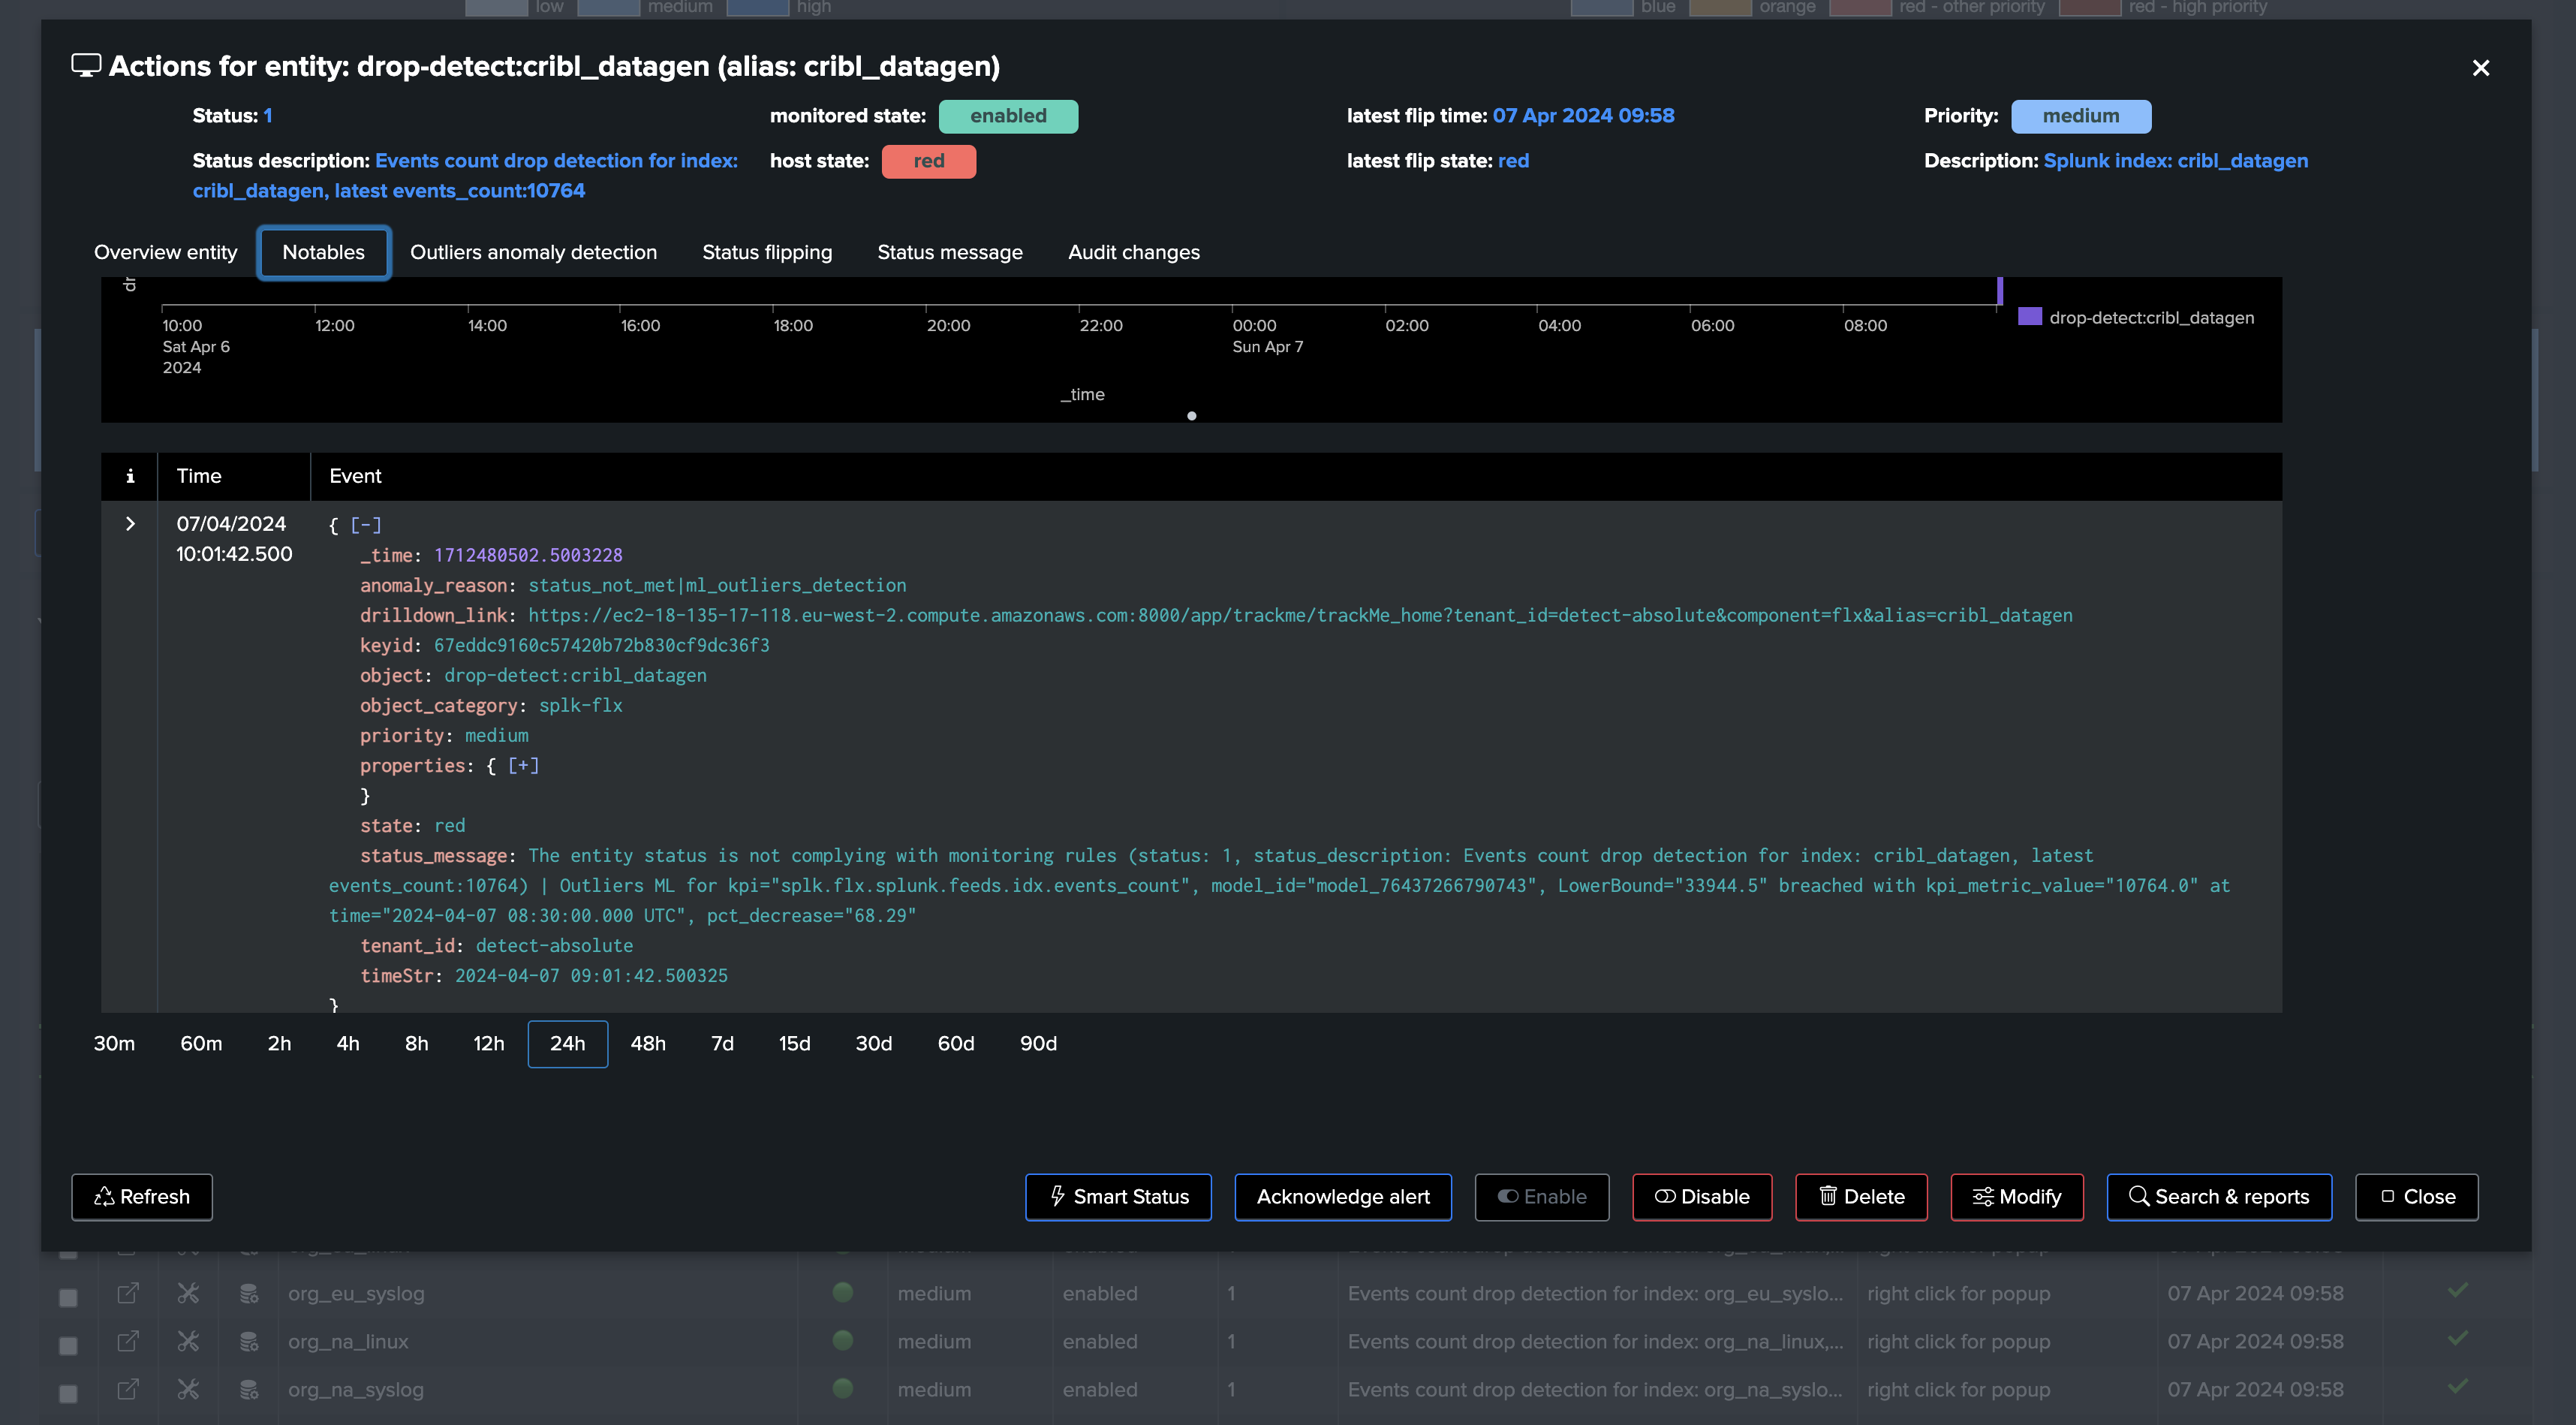
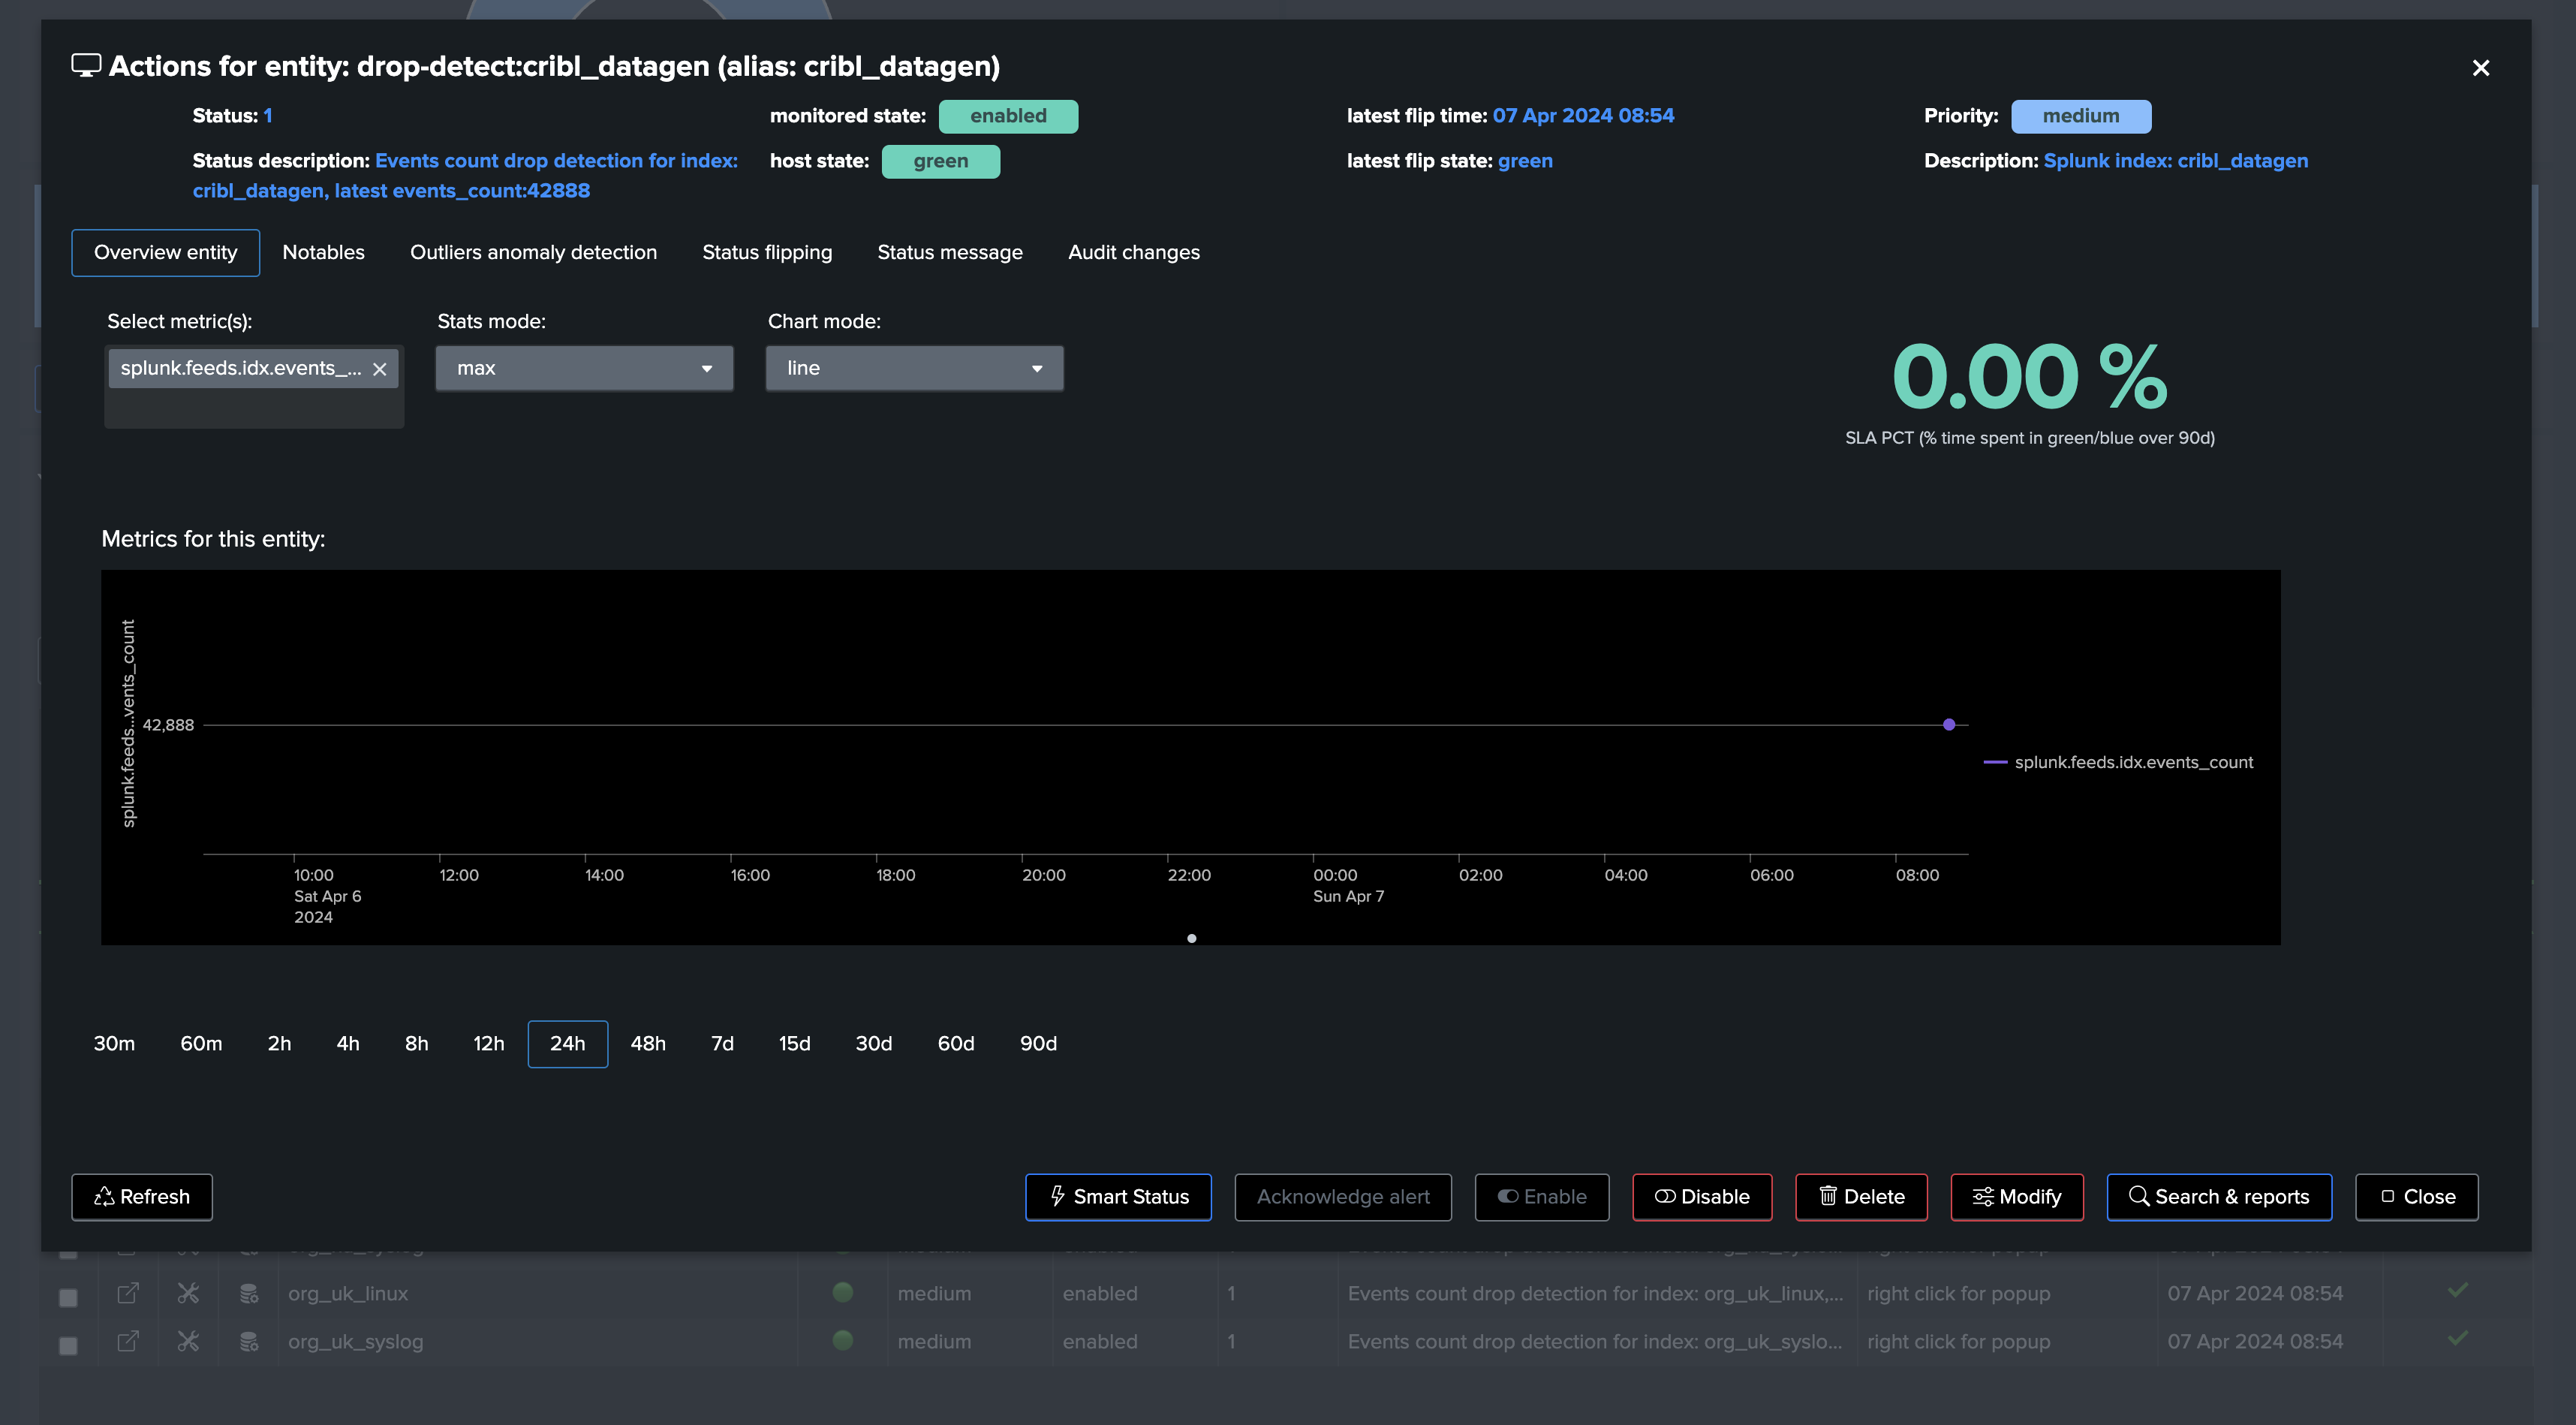
Screenshots of an entity triggering on Machine Learning detection due to abnormal events count drop: