Status Flipping Feature
Introduction to flipping events
The Status Flipping feature is a powerful and informative part of the TrackMe application for Splunk, designed to monitor data availability and quality for Splunk Enterprise and Splunk Cloud. This feature is available for all TrackMe components, including:
splk-dsm (Data Source Monitoring)
splk-dhm (Data Host Monitoring)
splk-mhm (Metric Host Monitoring)
splk-cim (Common Information Model compliance tracking)
splk-flx (Flex Object tracking)

This guide will provide an overview of the Status Flipping feature and how it helps to detect and track changes in the state of entities.
Status Flipping: Understanding Entity States
In TrackMe, entities have a state that represents their current health status. These states include:
Green: The entity is considered to be in a healthy state.
Red: The entity is considered to be in a non-healthy state.
Orange: This is an intermediate status, indicating a condition such as the detection of data in the future.
Blue: The entity is a member of a logical group that fulfills the monitoring conditions but is in a non-healthy state.
How Status Flipping Works
The Status Flipping feature’s purpose is to track changes in the state of entities. Here’s how it works:
Discovery: When an entity is discovered by TrackMe trackers, a flipping event is generated in the trackme_summary index. The entity switches from the “discovered” status to its state (green, red, or orange) based on the detection.
Status Change: When an entity’s status changes because TrackMe has detected an issue, a new event is created in the trackme_summary index. This event shows the previous status, the new status, the reason for the change (captured in a field called “anomaly_reason”), and time-related information.
Entity View: TrackMe provides a tab in the entity view that displays the flipping status events over time in a chart, as well as a table with the flipping events ordered by the most recent events.
Flipping Event Examples
Here are some examples of what flipping events might look like:
Example: Entity being discovered:
31/03/2023 14:52:16, object=osnixsec:linux_secure has flipped from previous_state=discovered to state=green with anomaly_reason=none
Example: Entity switching from green to red:
31/03/2023 15:02:16, object=eventgen-linux:linux_secure has flipped from previous_state=green to state=red with anomaly_reason=delay_threshold_breached
Example: Entity switching from red to green:
31/03/2023 15:59:15, object=eventgen-linux:linux_secure has flipped from previous_state=red to state=green with anomaly_reason=none
Reviewing TrackMe Flipping Events
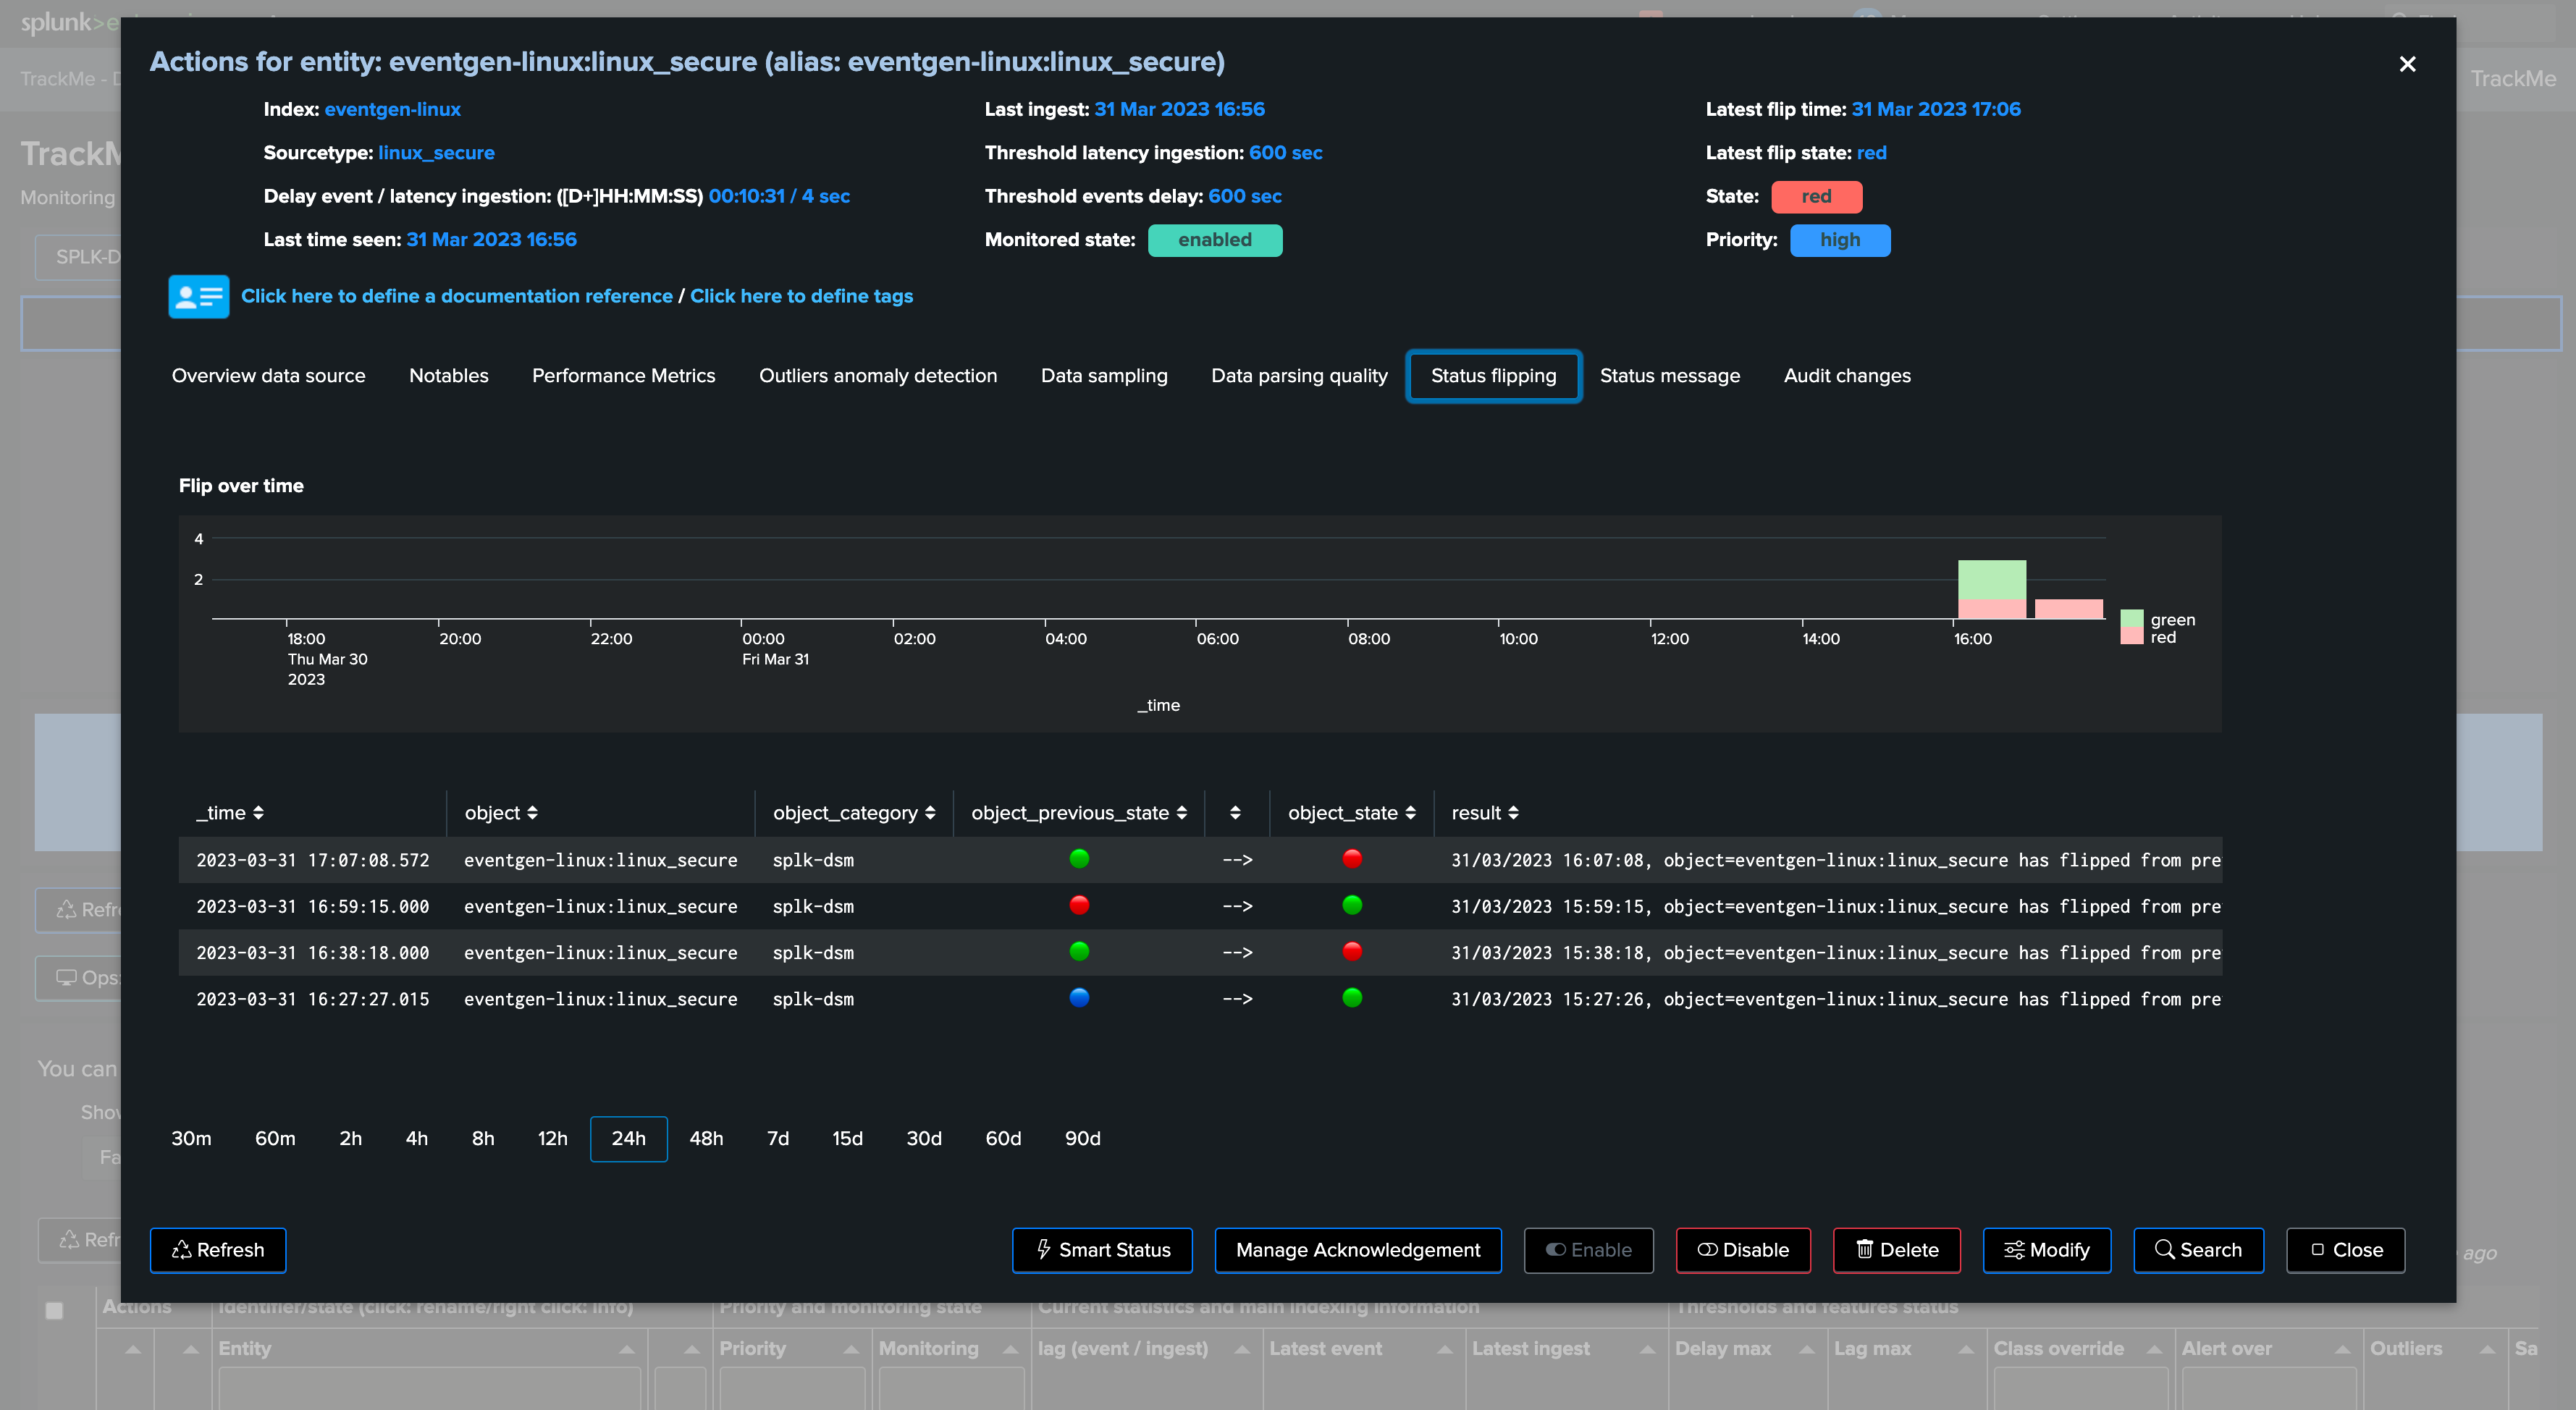
You can access flipping events that fired for a given entity in the “Status Flipping” tab of the main entity screen. This view provides the following information:
Overtime Chart: An overtime chart of the flipping events, which helps to visualize the frequency and distribution of these events over time.
Table View: A table that displays the entity-related notable flipping events ordered by the latest flipping events.
This view provides quick access to the details of each event, making it easier to investigate and understand the frequency of the flipping events for this entity and the reasons behind these changes.
Searching Flipping Events in Splunk
You can search for flipping events in Splunk using the following search:
`trackme_idx(mytenant)` sourcetype=trackme:state tenant_id="mytenant" object="myobject"
Replace “mytenant” with the name of your TrackMe Virtual Tenant and “myobject” with the name (identifier) of the TrackMe entity you want to search for.
Using Flipping Status Events as Key Performance Indicators
TrackMe leverages the flipping status events as a form of Key Performance Indicator (KPI) to measure the entity’s behavior concerning how often it changes from one state to another. Frequent status changes can indicate potential issues, such as bad behavior or the need for fine-tuning the entity’s configuration.
By keeping an eye on the flipping status events, users can gain valuable insights into the performance and stability of their entities, allowing for proactive measures to ensure optimal performance and data quality.
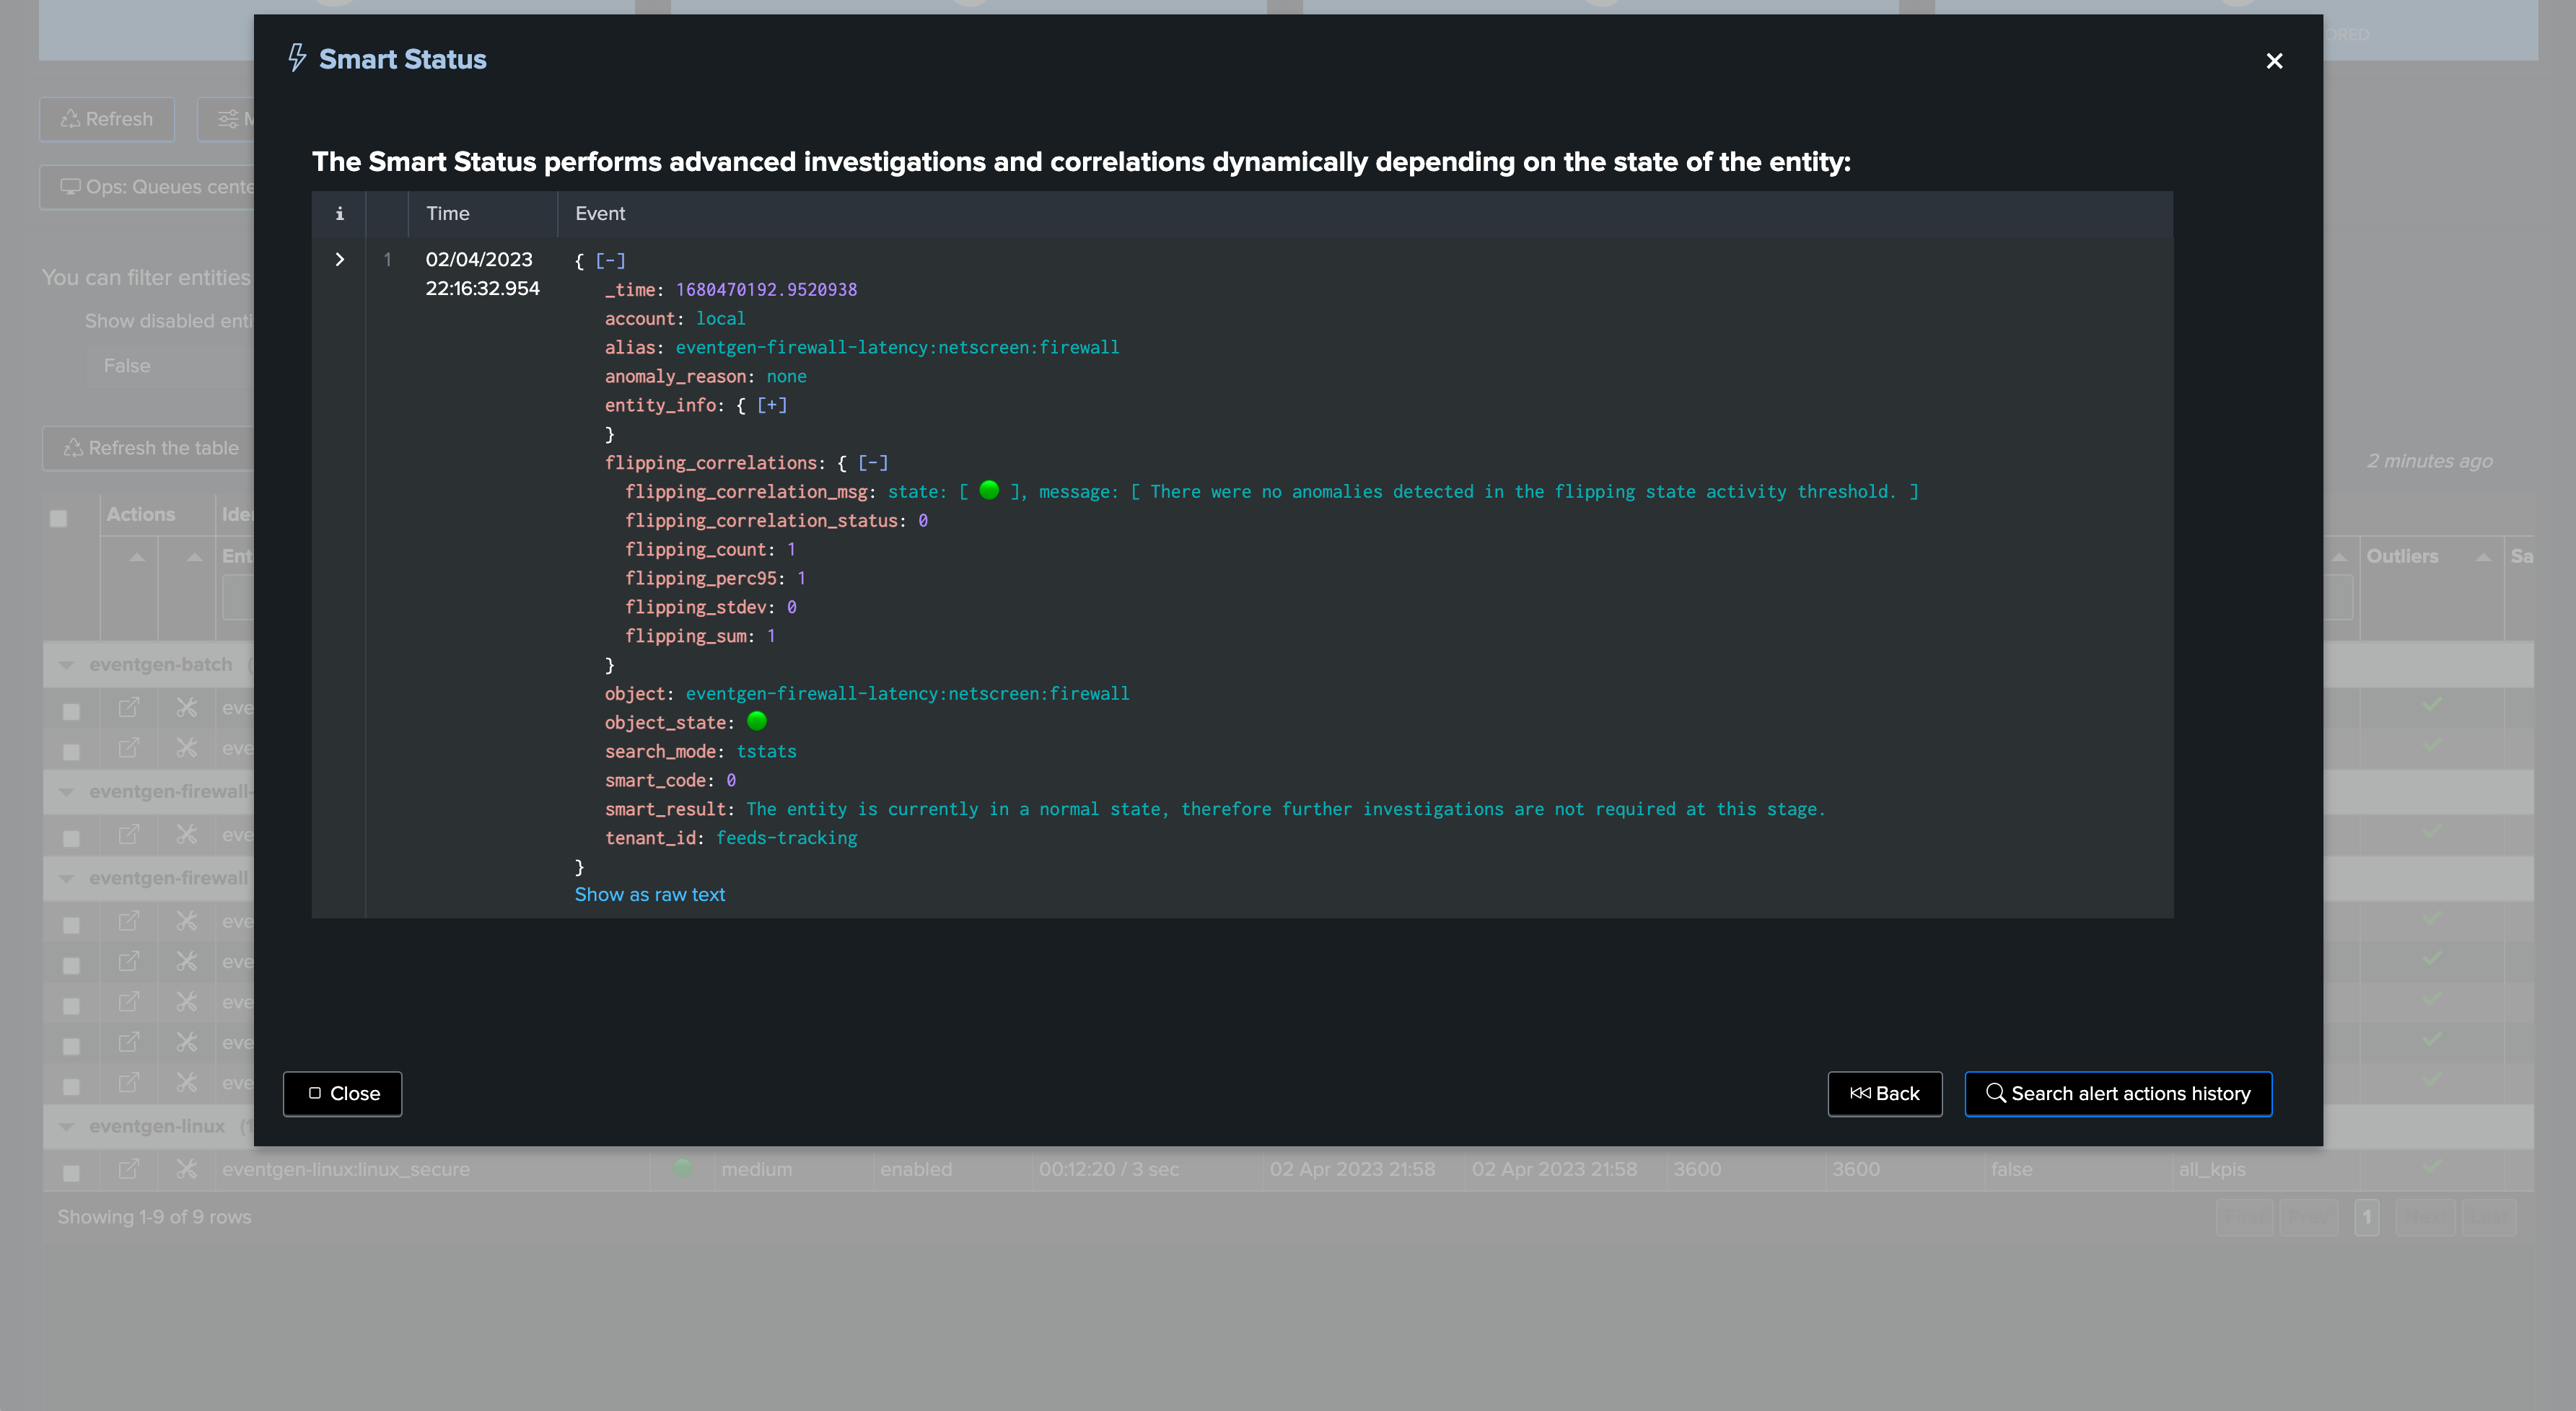
The SmartStatus feature for instance performs a correlation regarding flipping events: