Monitor Splunk Indexer Clusters
Monitoring Splunk Indexer Clusters with TrackMe Flex Objects
This tutorial demonstrates the monitoring of Splunk Indexer Clusters with TrackMe Flex Objects.
TrackMe Flex Objects is a component restricted to licensed customers. Please contact Splunk Sales for more information.
Using these steps will enable TrackMe to continuously monitor the health of your Splunk Indexer Clusters and alert you when issues are detected.
With TrackMe’s remote search capabilities, you can monitor as many Indexer Clusters as you need from a single pane of glass.
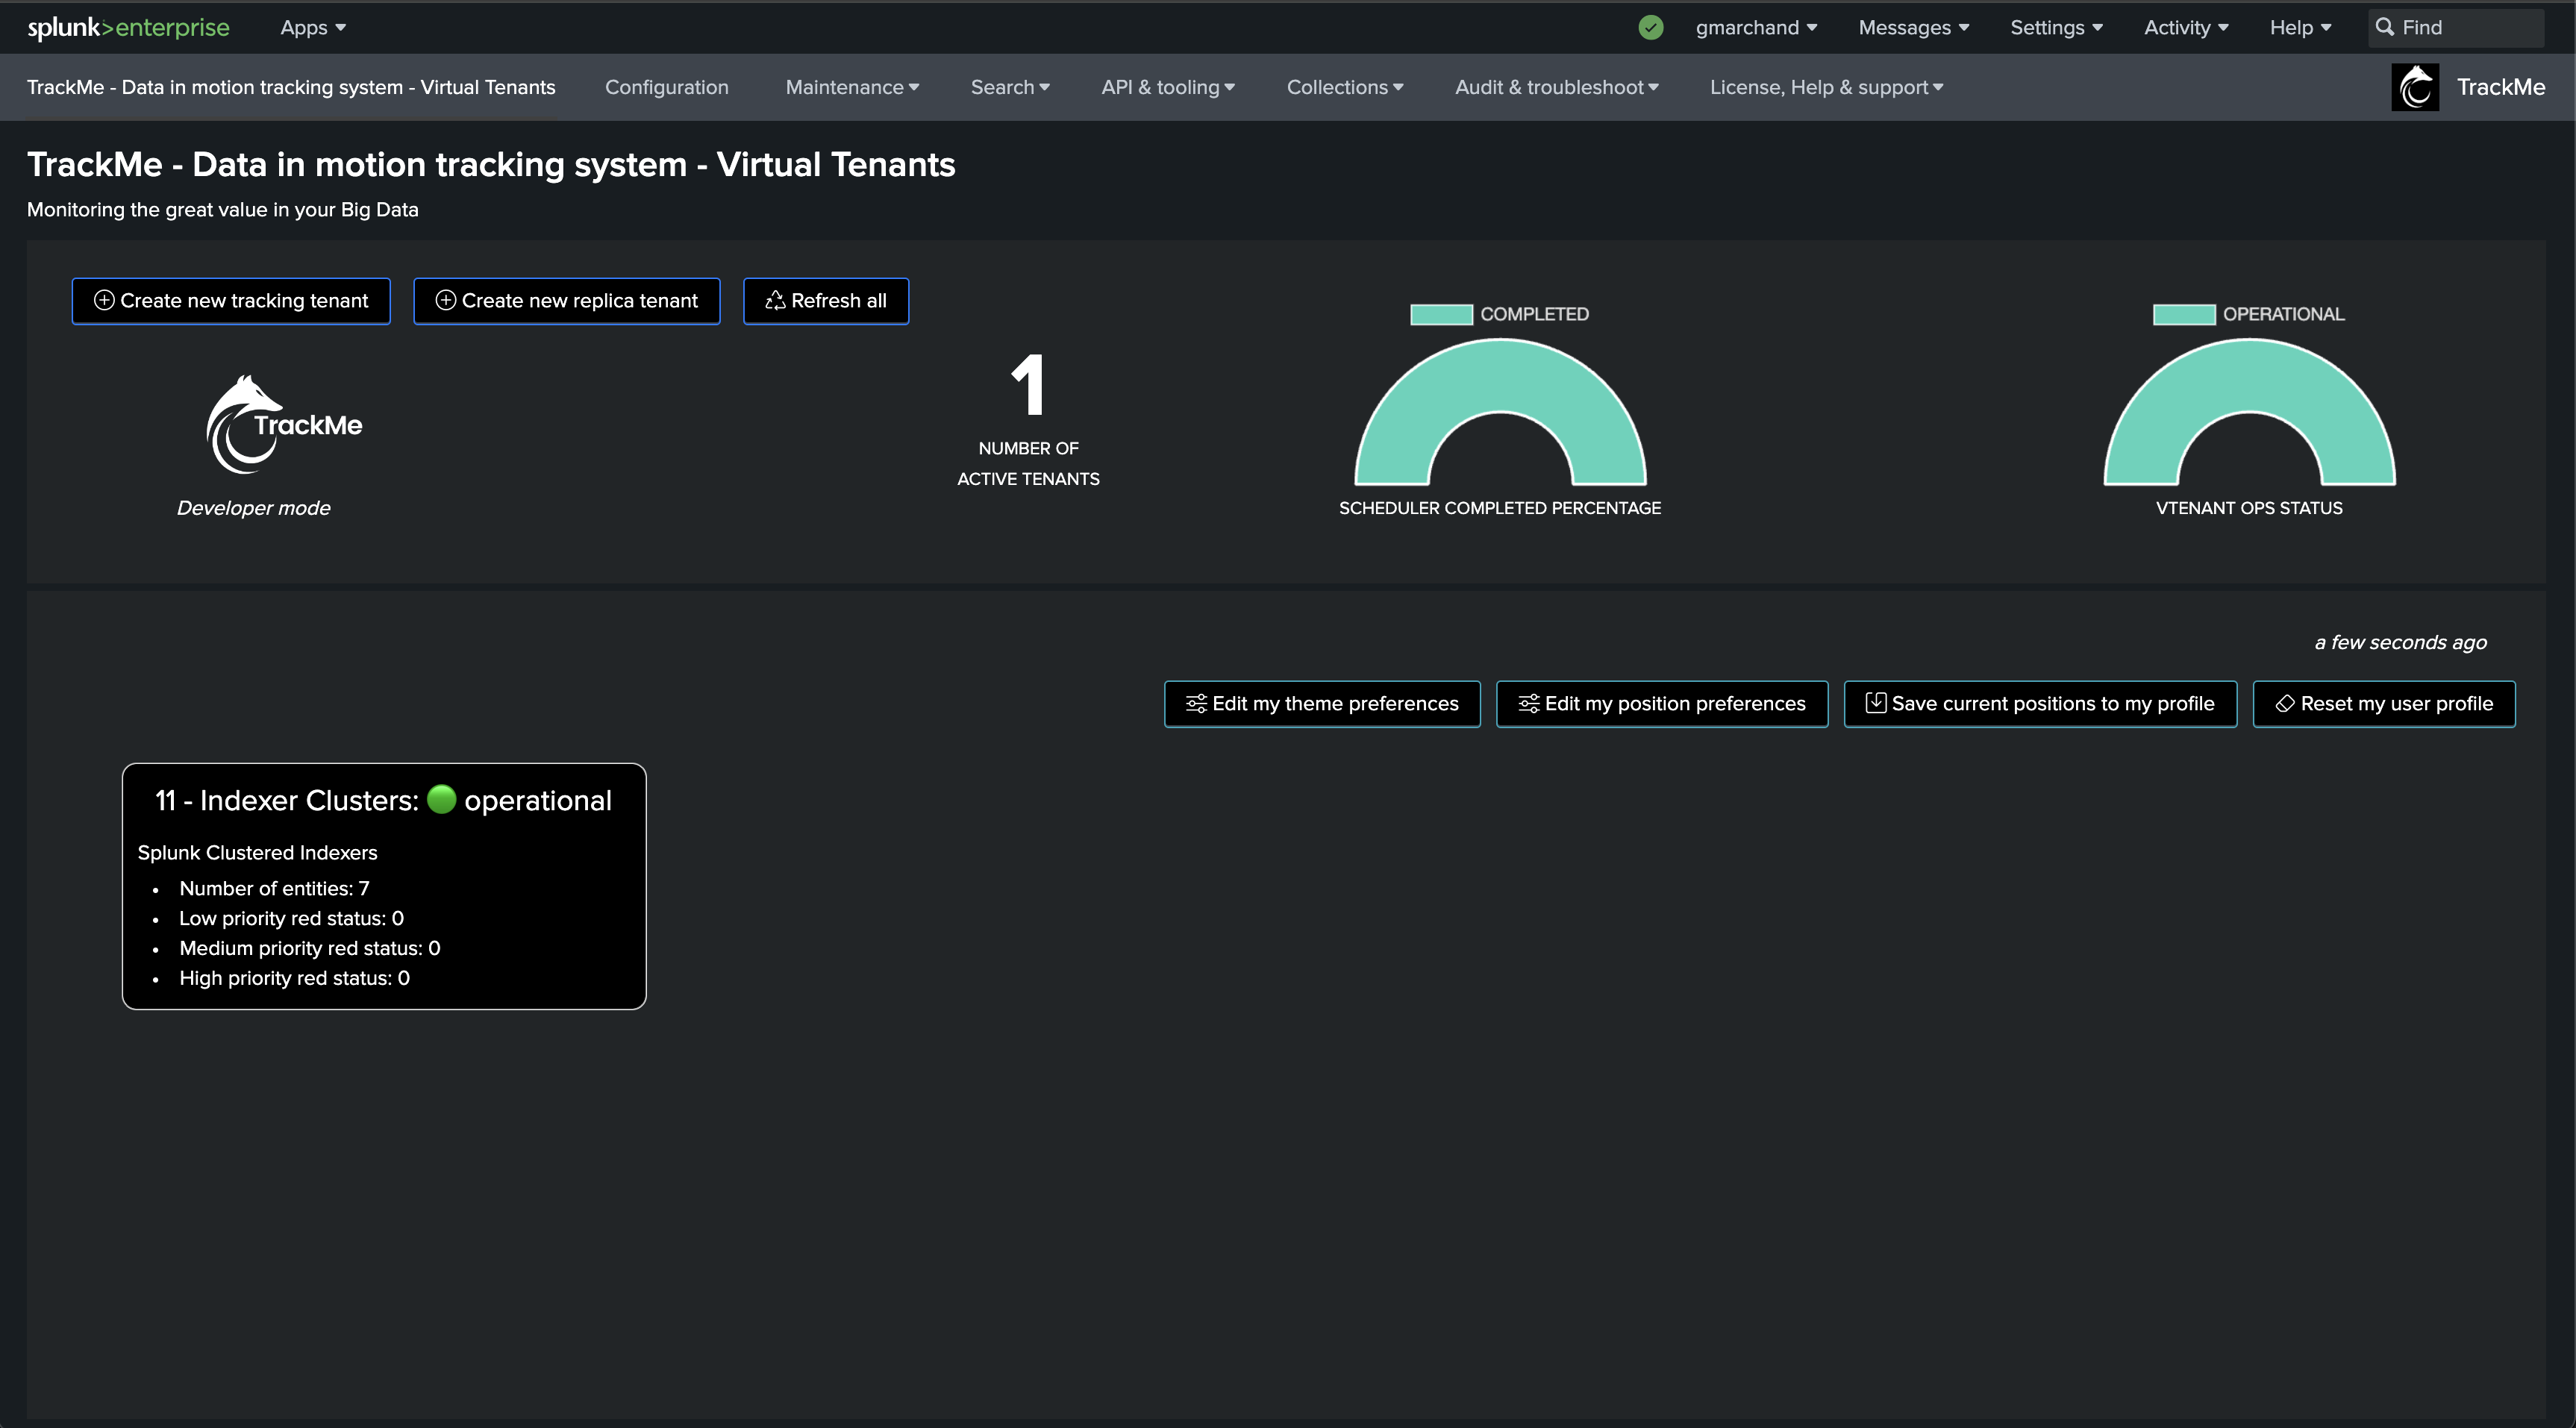
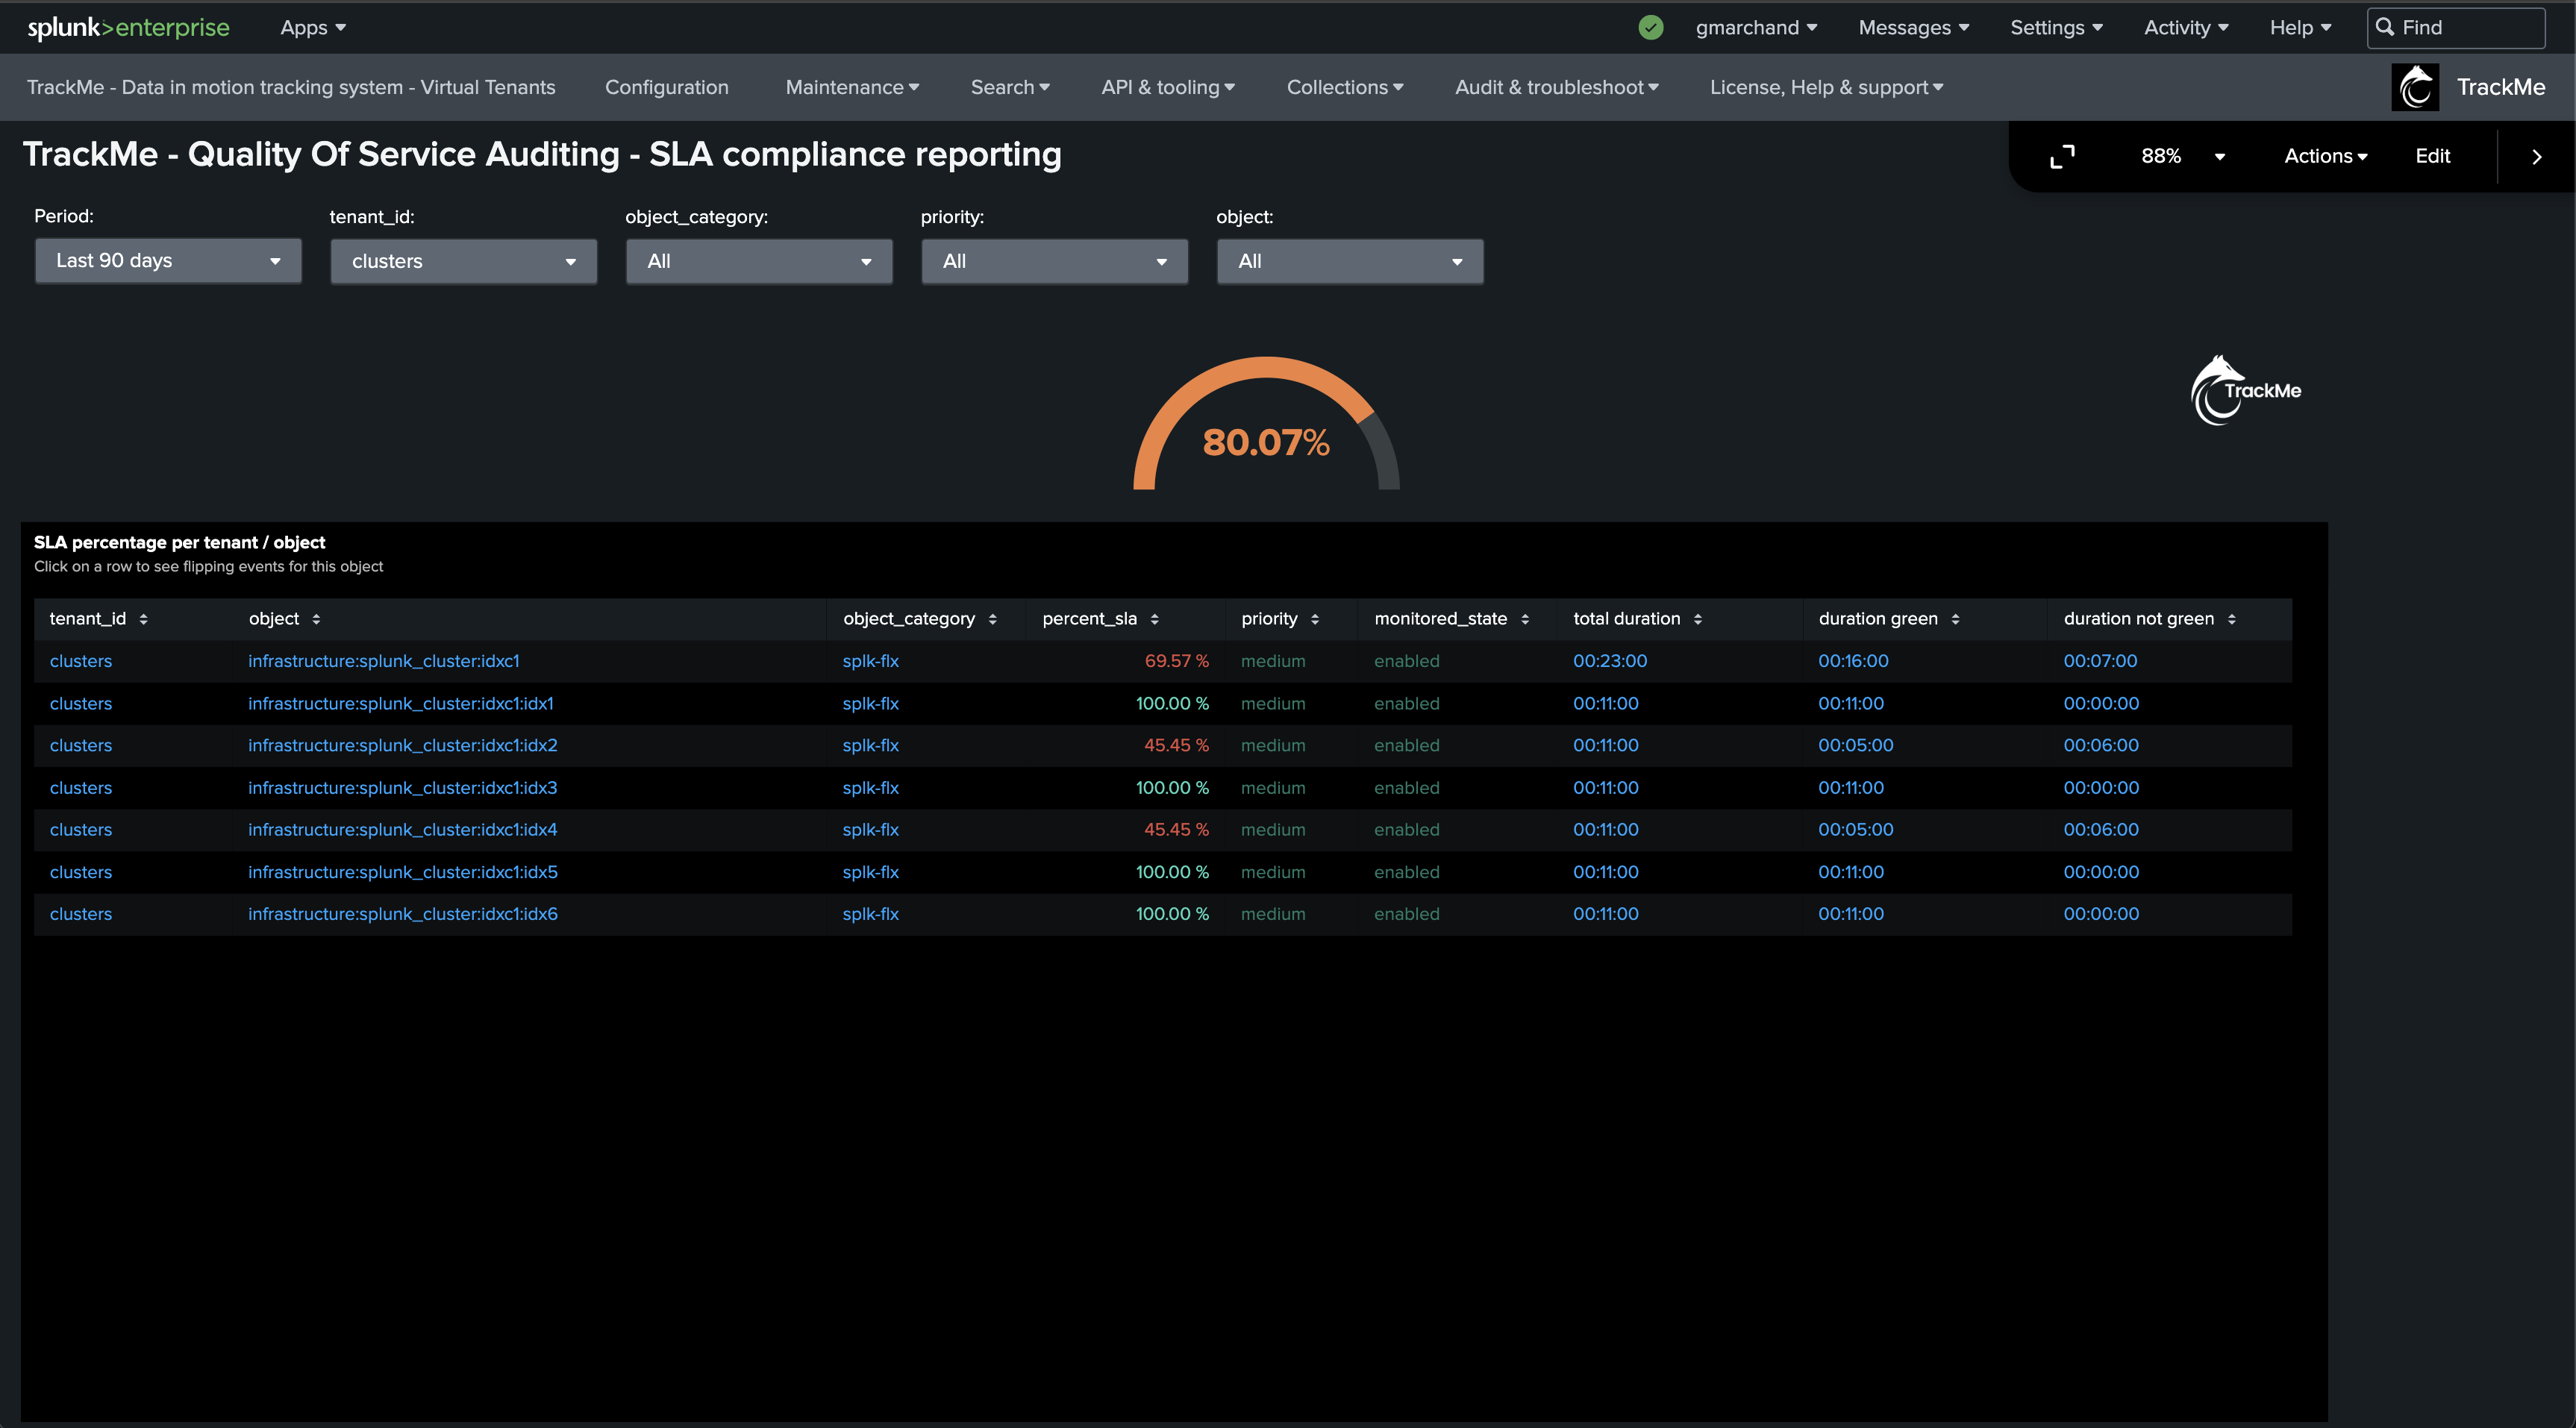
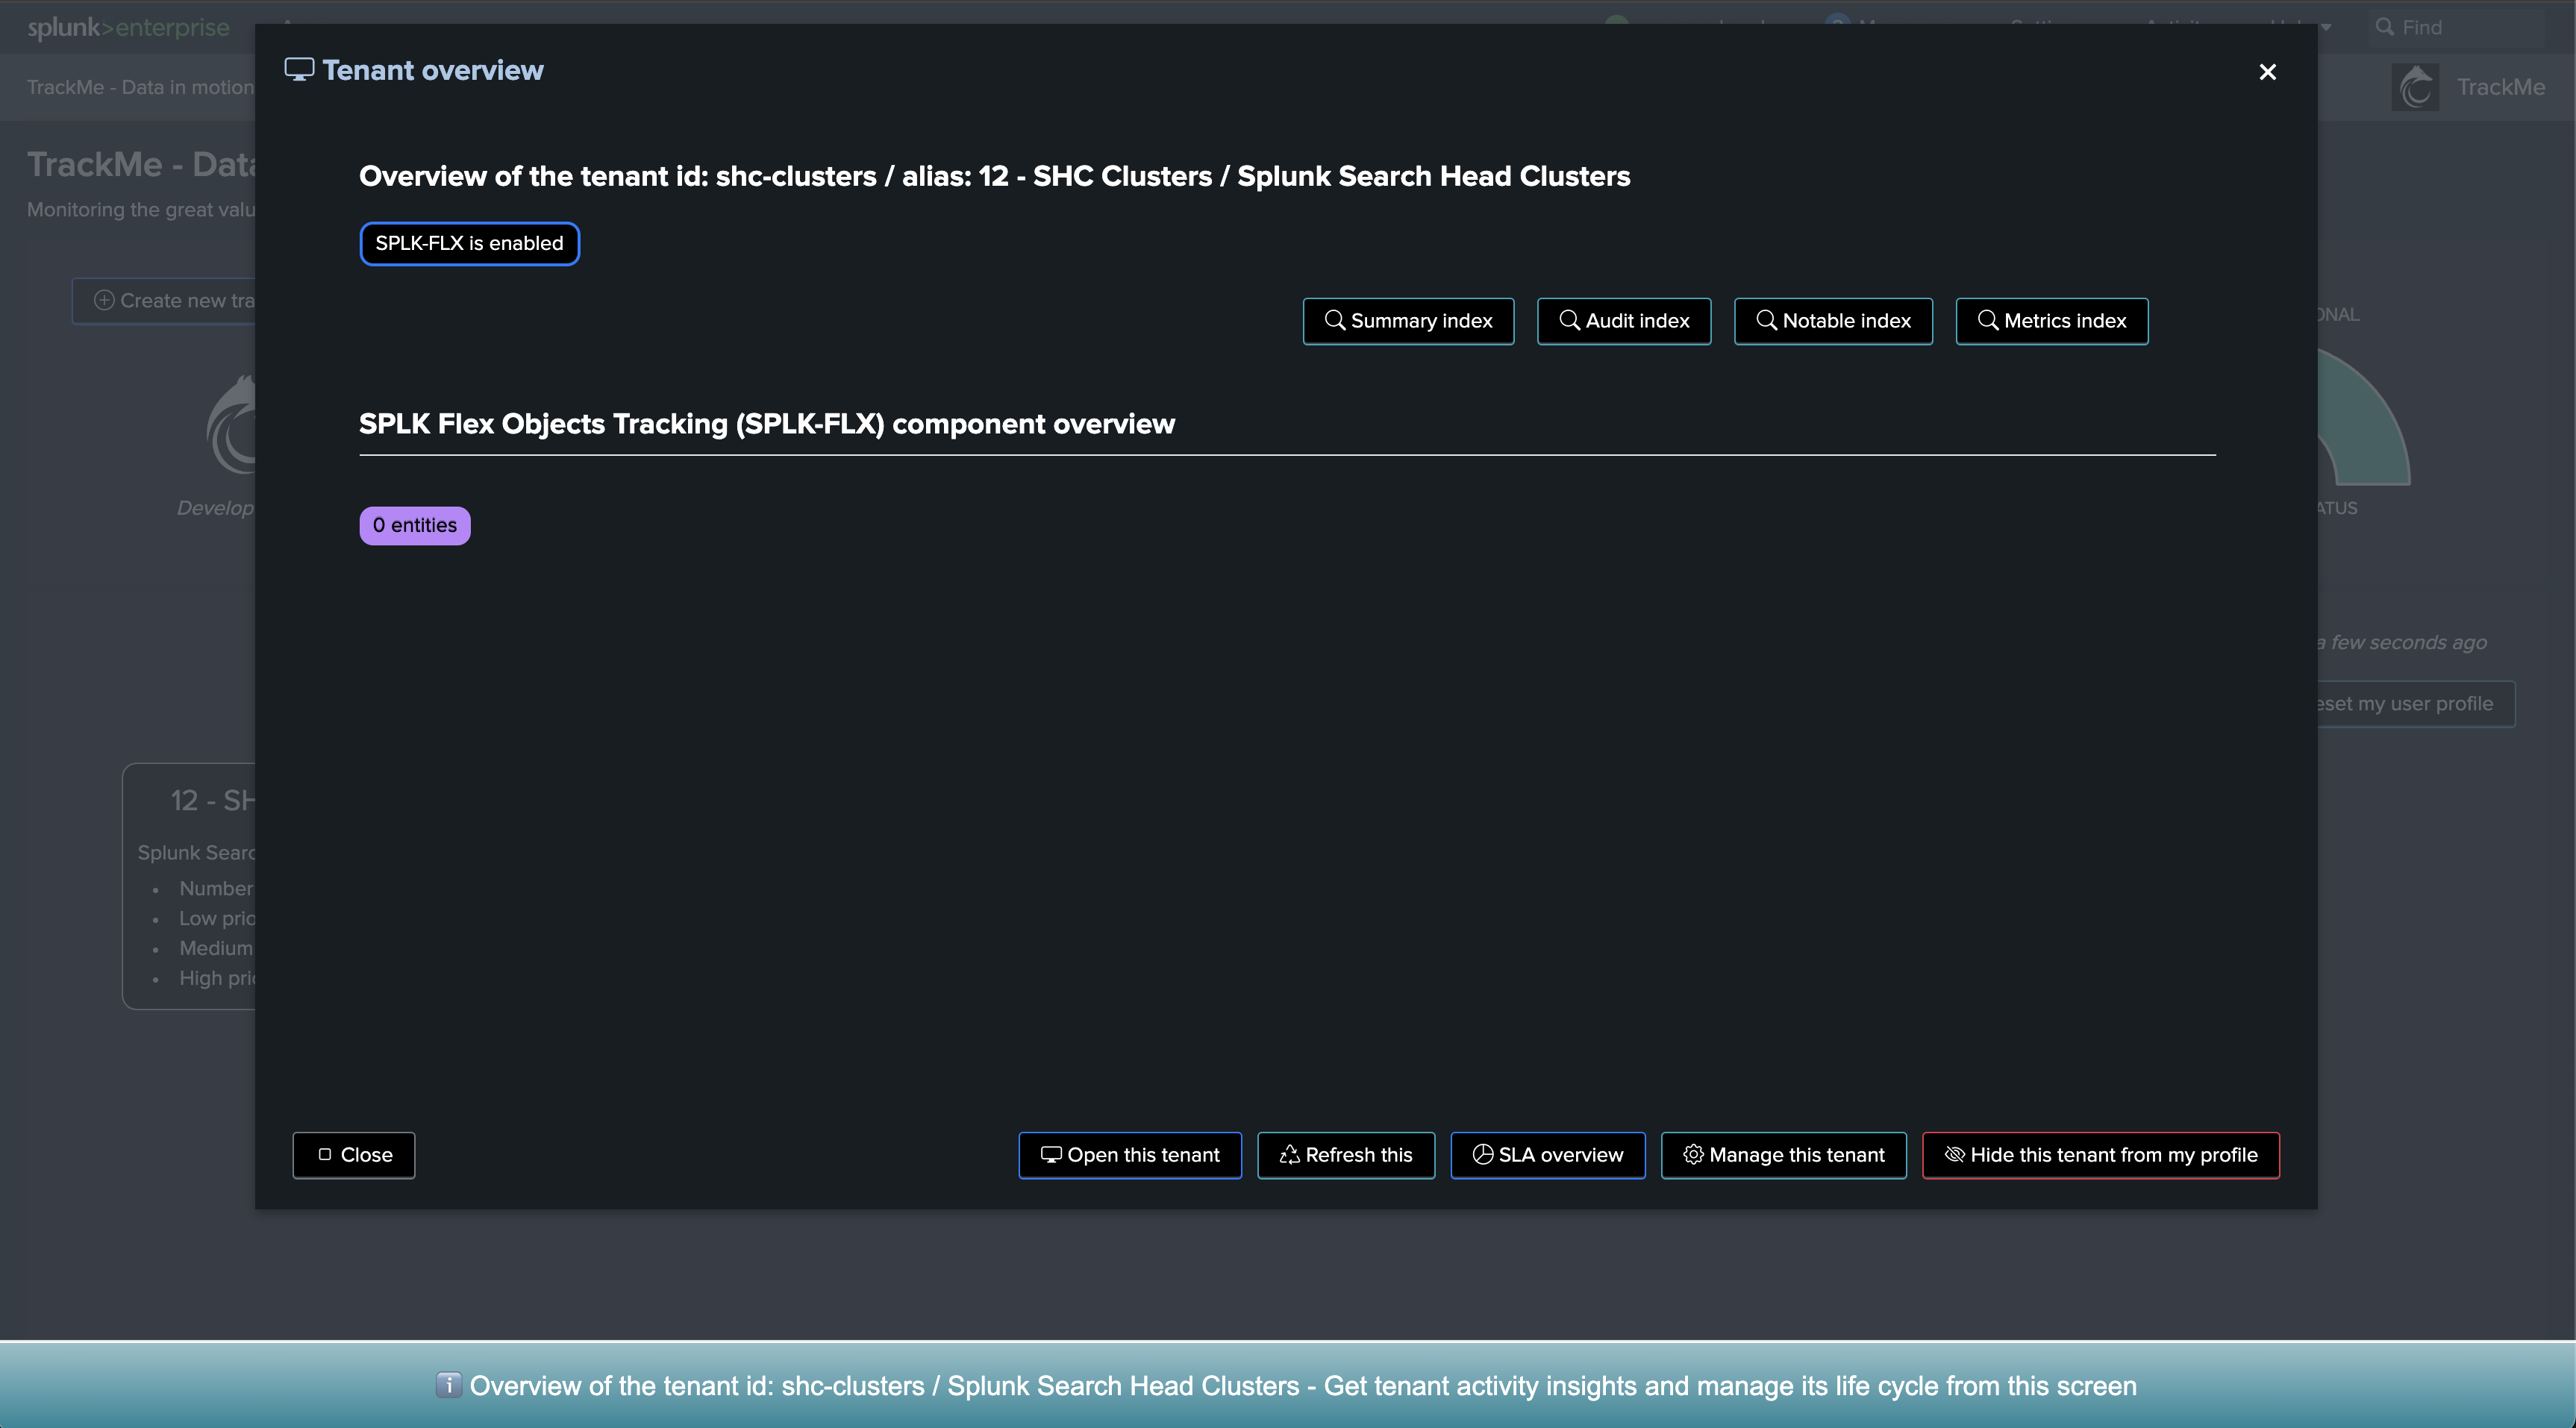
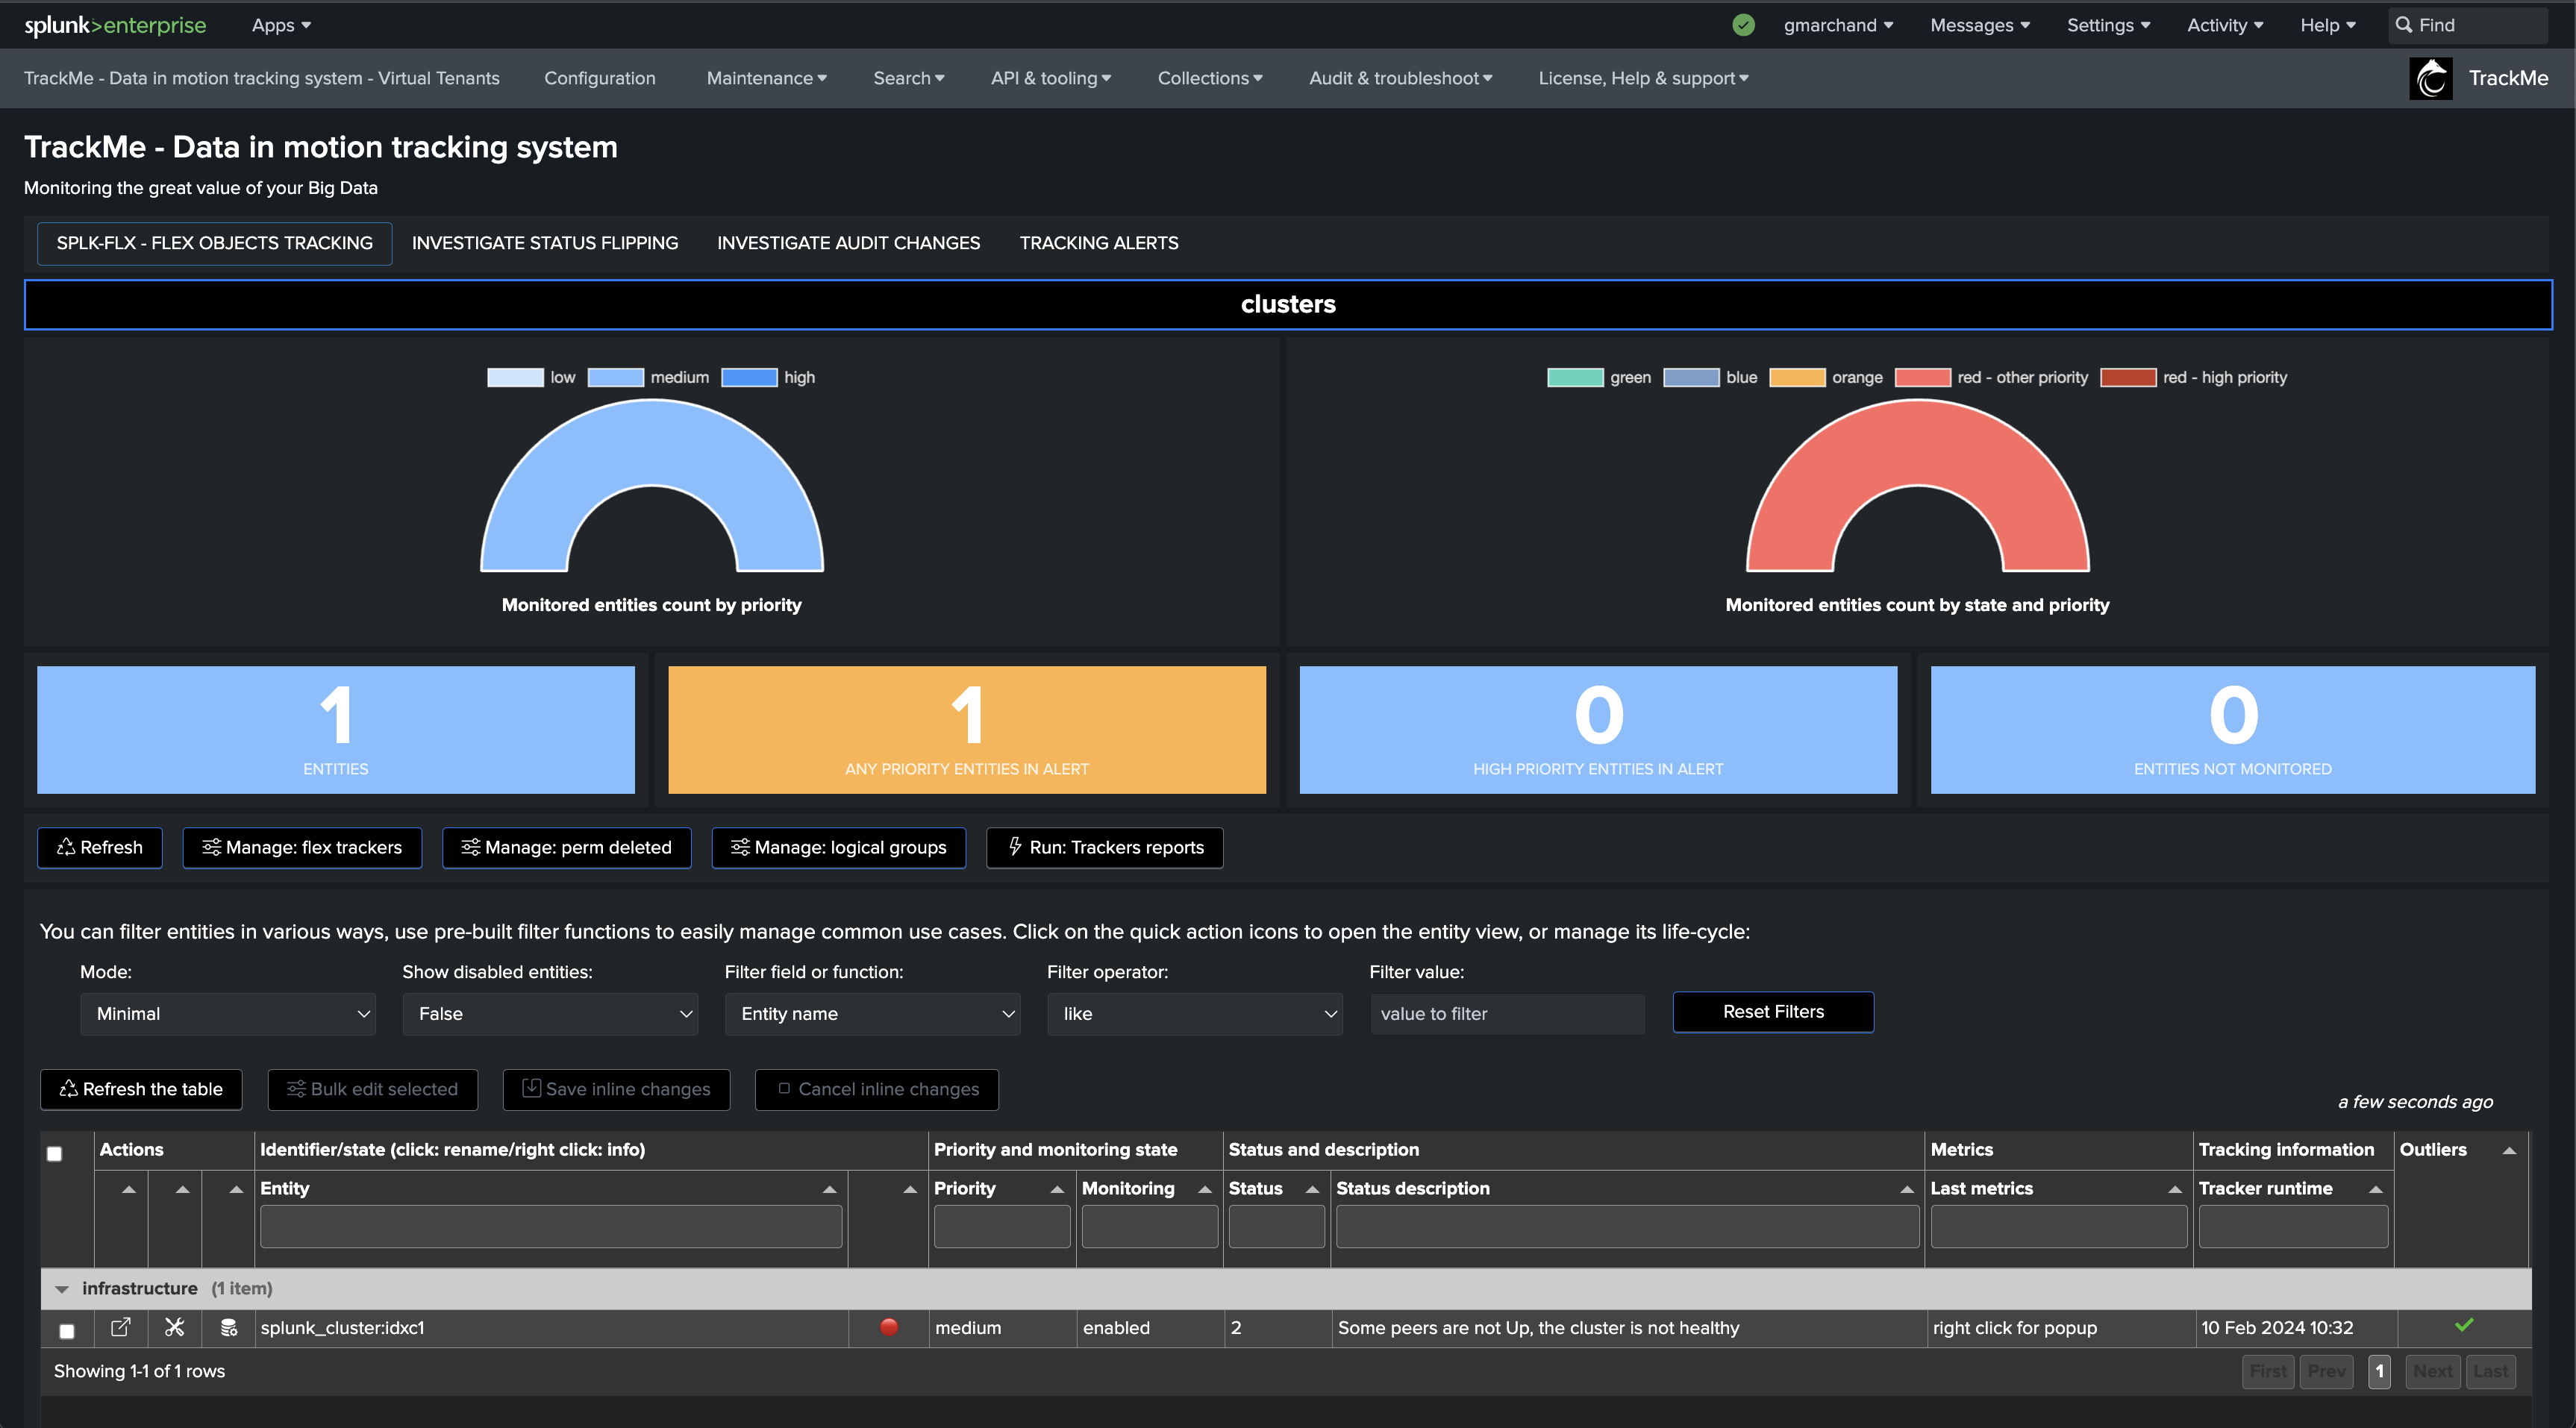
The following screen shows the final results in TrackMe, starting from Step 1 to easily implement the monitoring of your Splunk Indexers Clusters.

Step 1: Create a Splunk Remote Deployment Account for the Cluster Manager
The first step is to create a Splunk Remote Deployment Account for the Cluster Manager. For more information about TrackMe Remote Search capabilities and configuration:
Splunk Remote Deployments (splunkremotesearch)
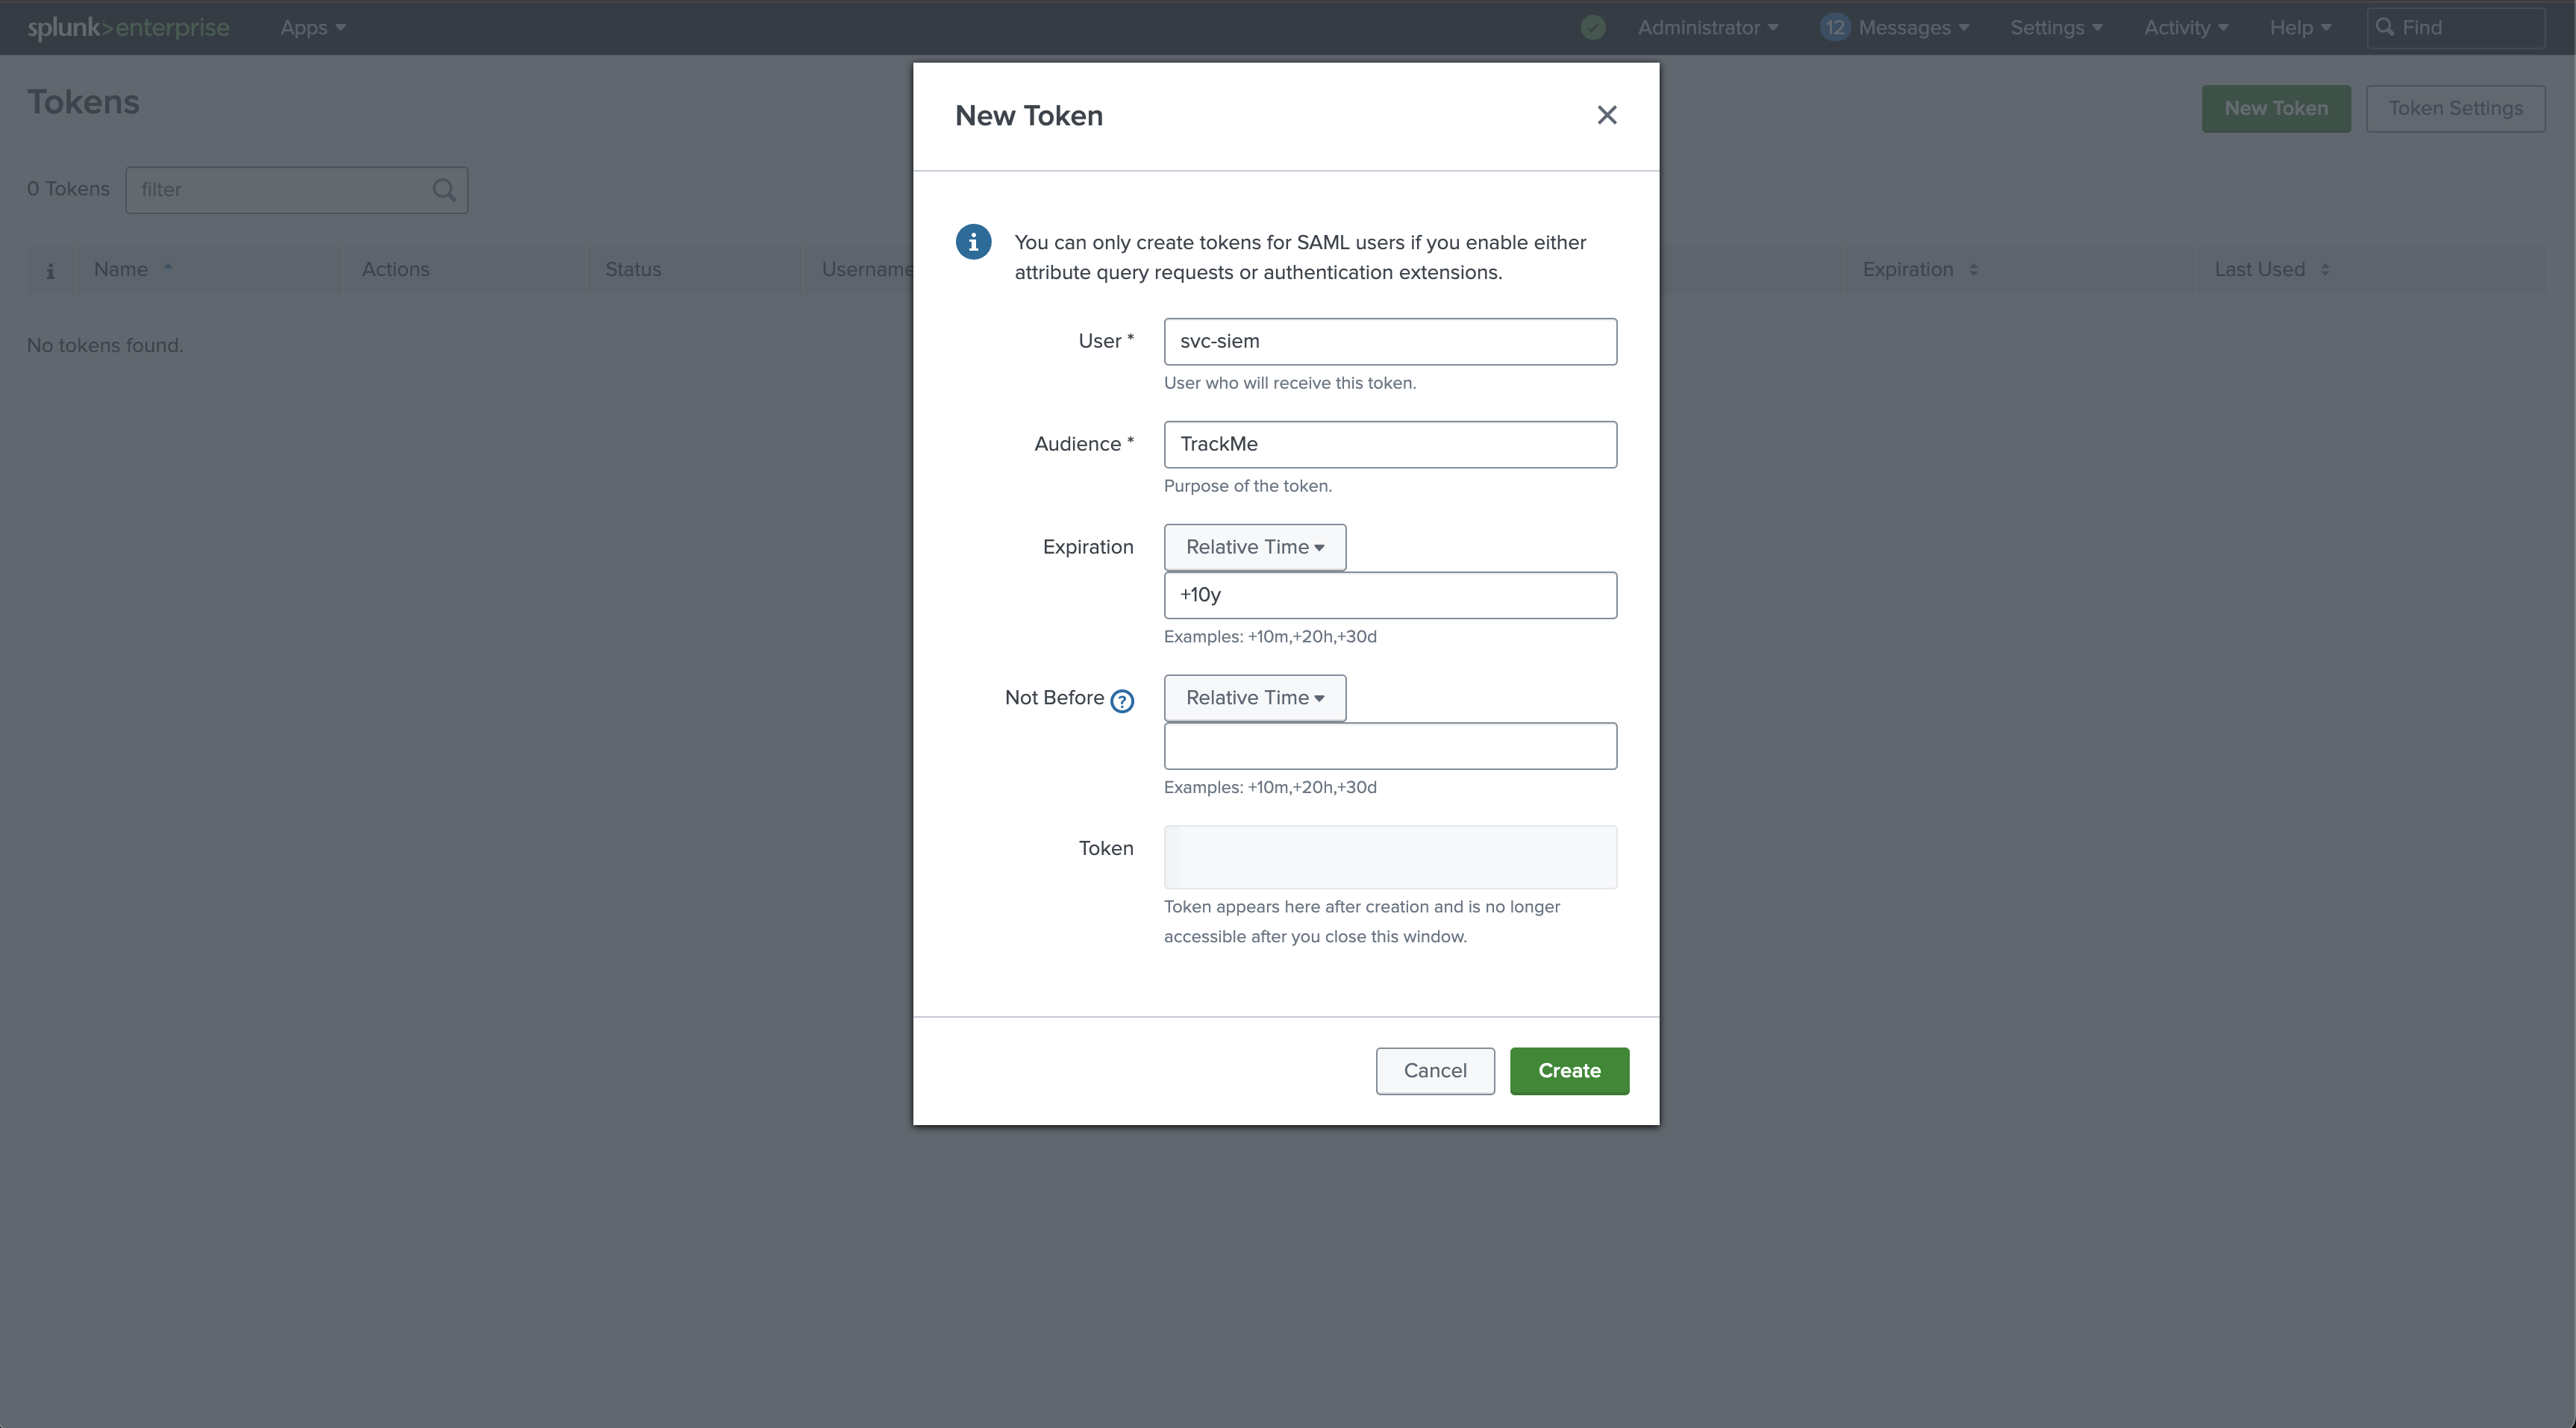
On the Cluster Manager, create a new Splunk bearer token for the TrackMe Remote Deployment Account:
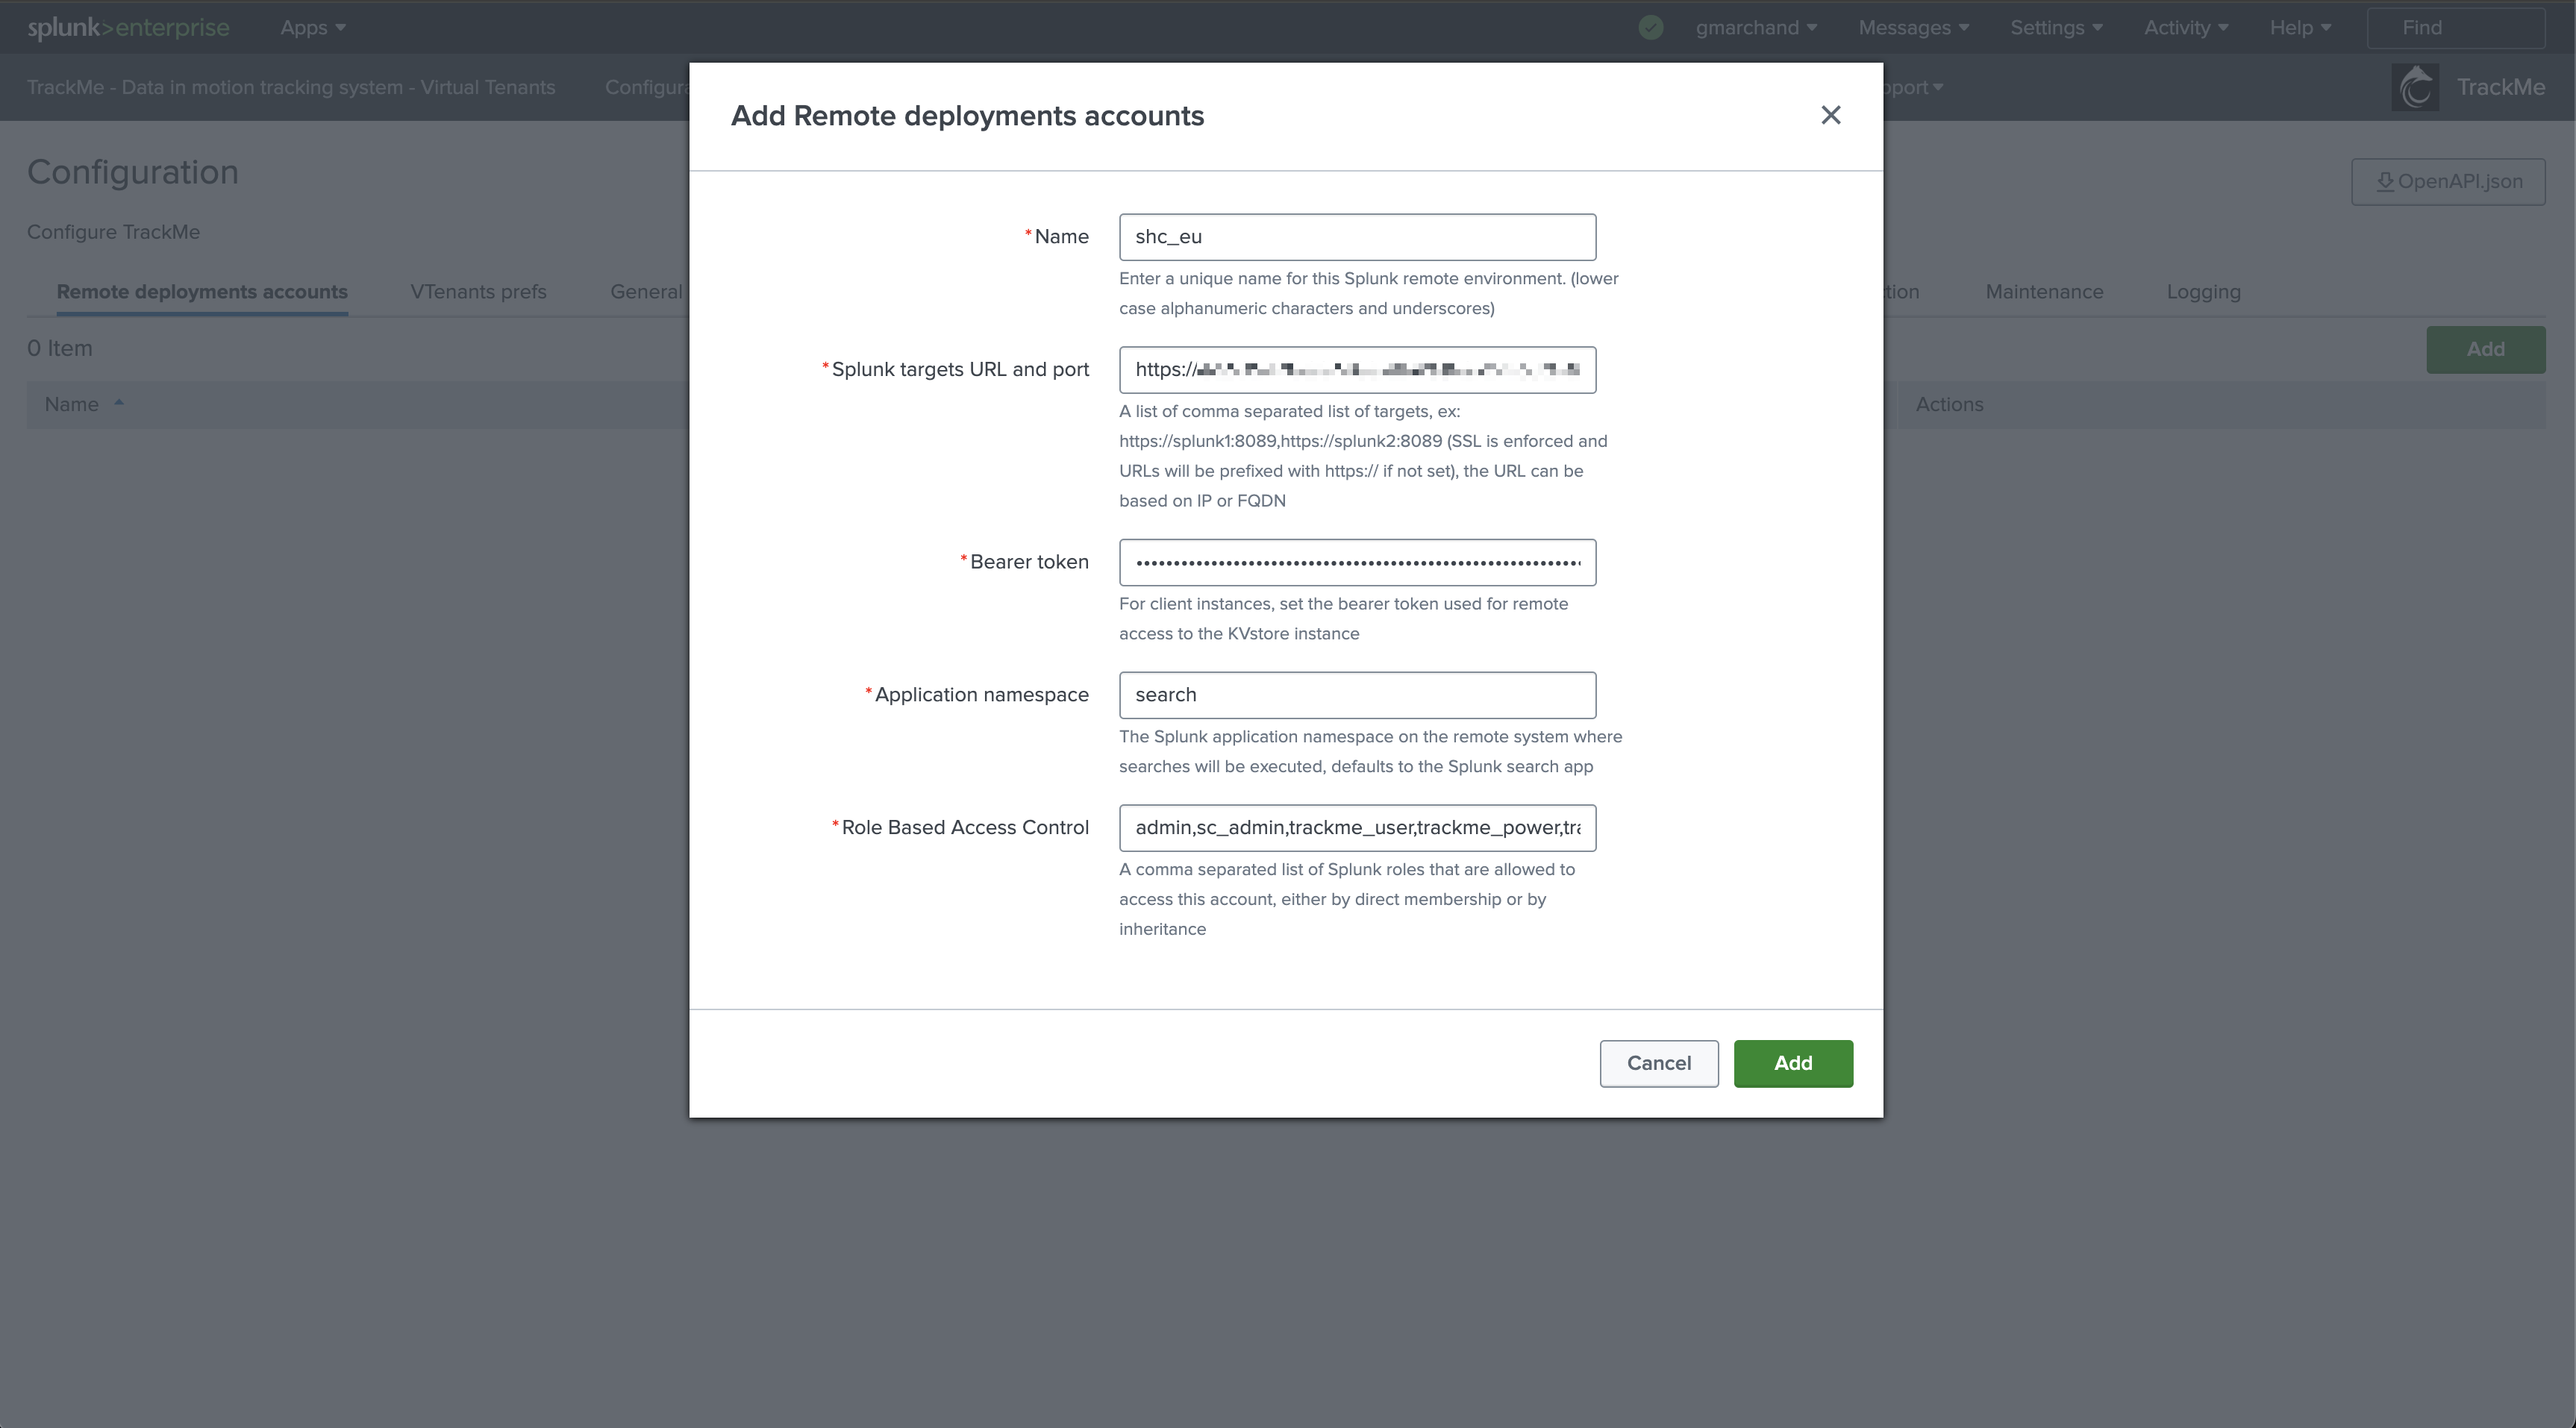
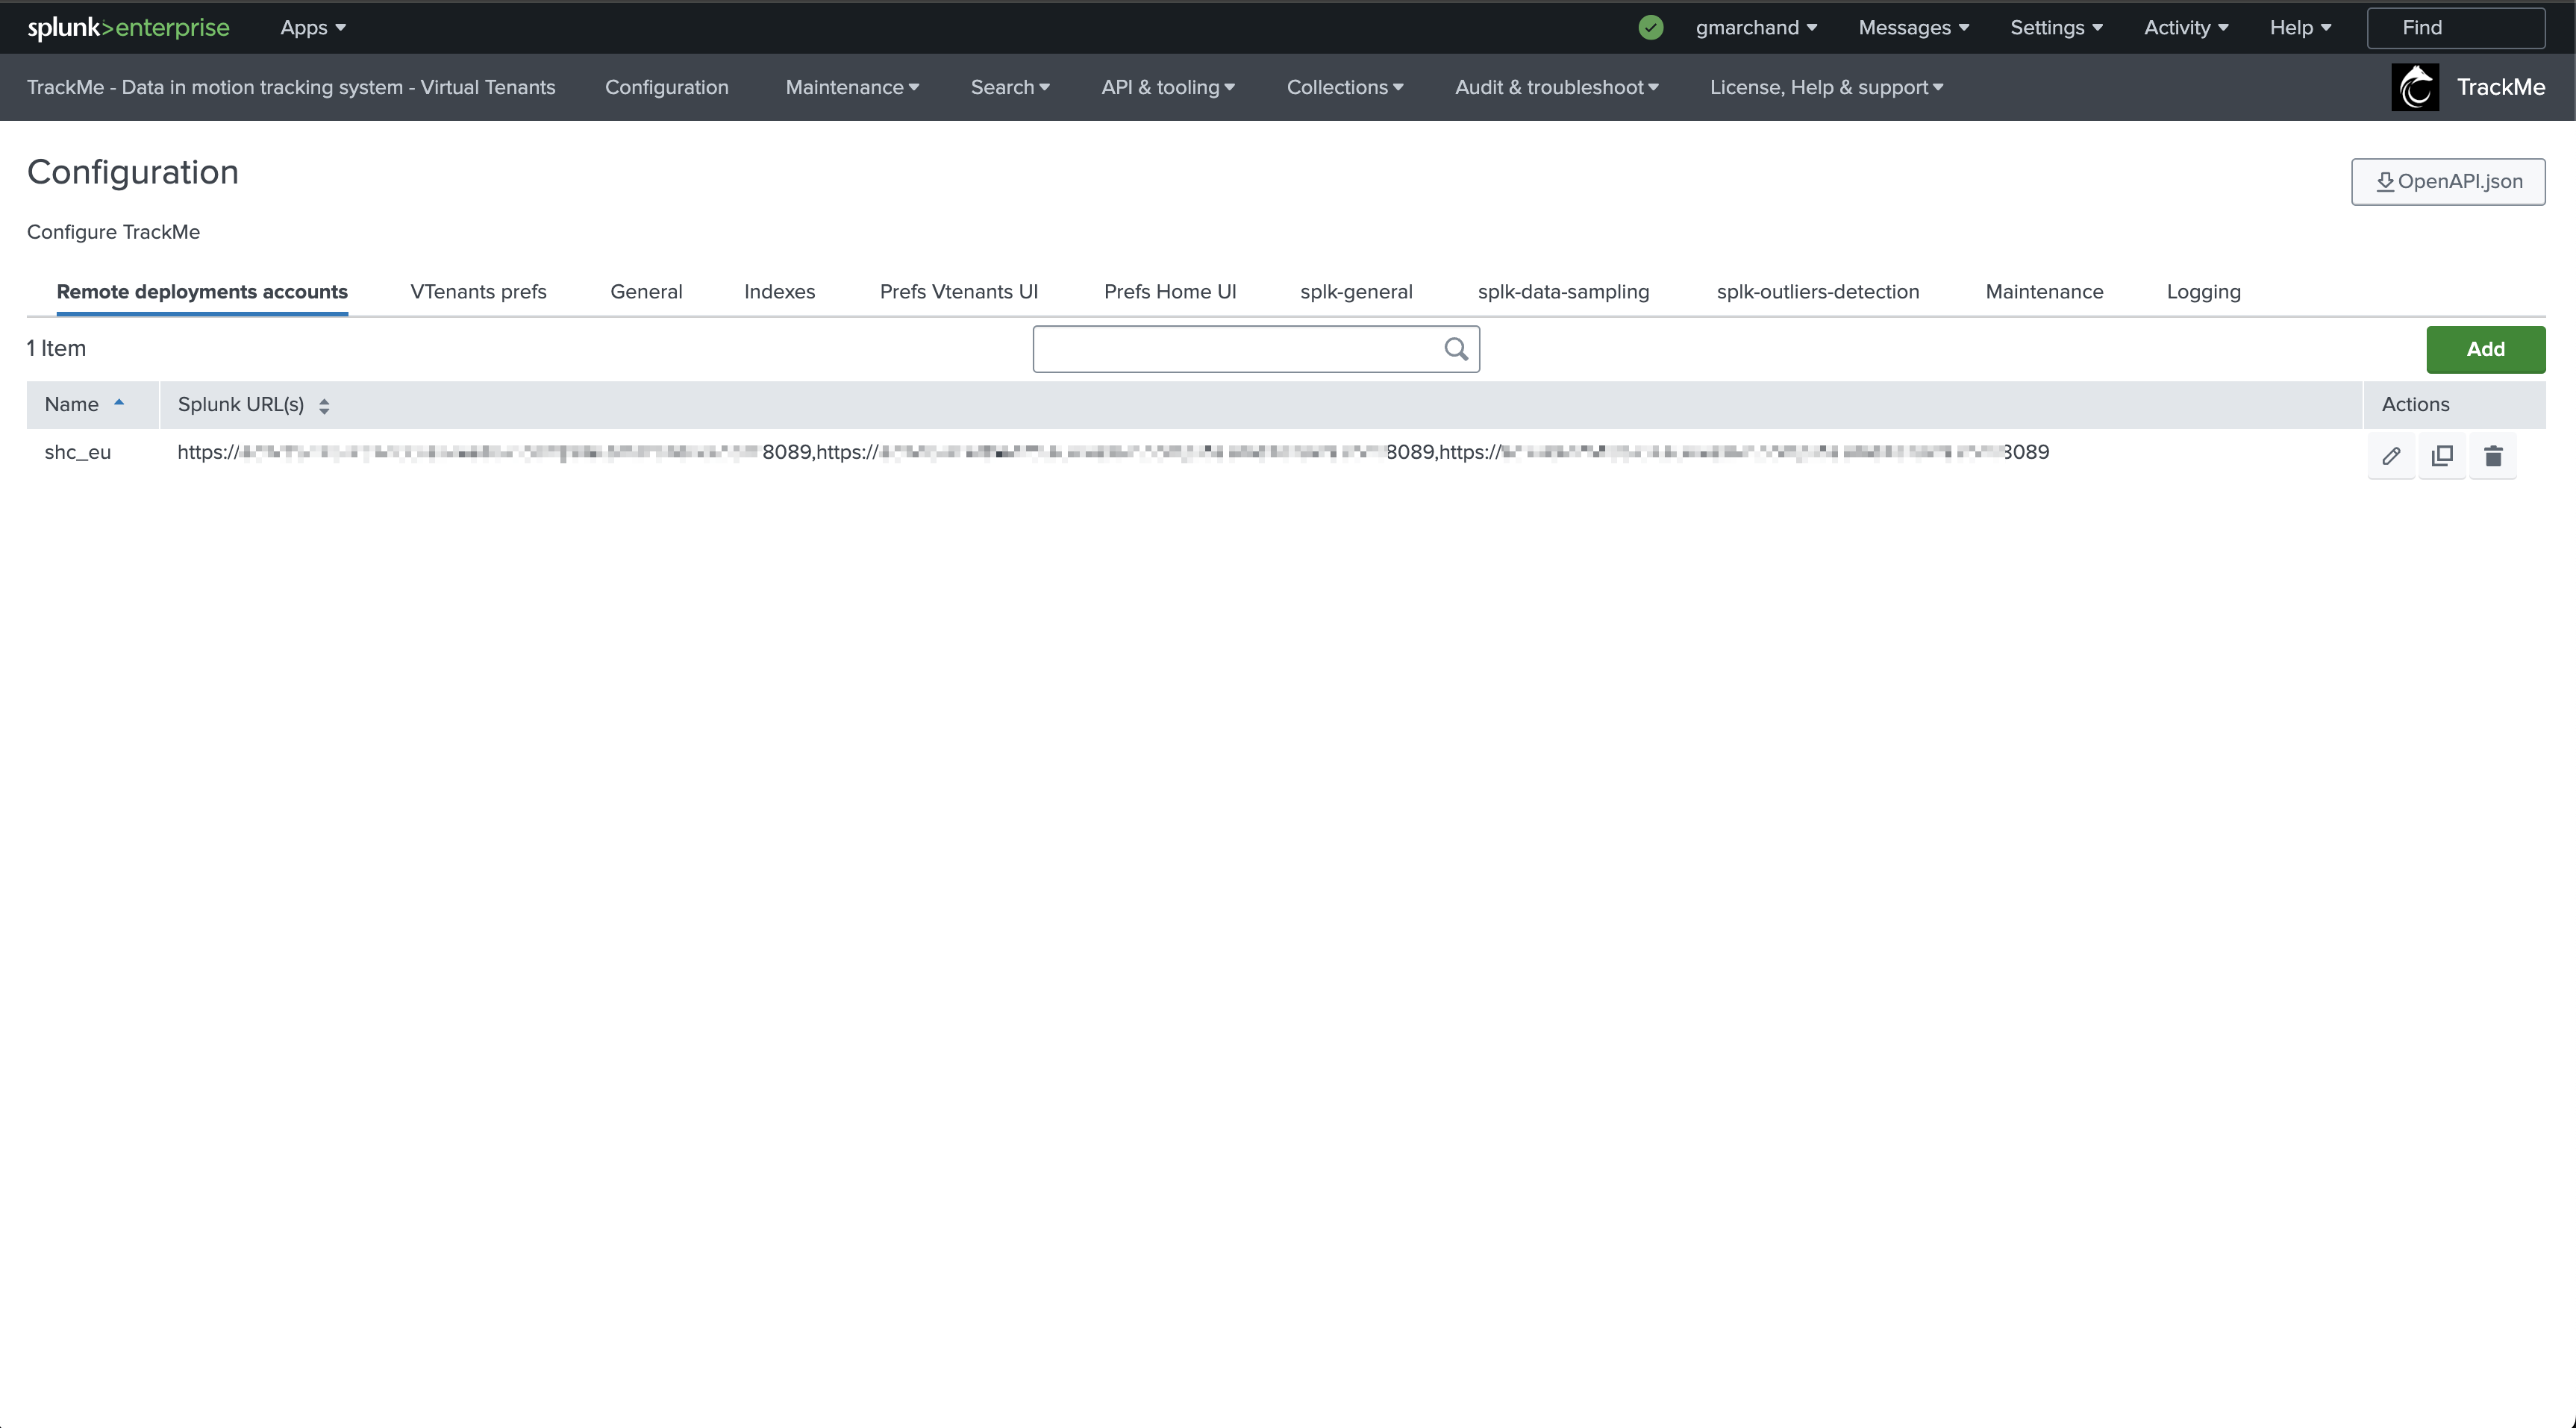
In TrackMe, click on Configure / Remote Deployment Accounts and add a new account:
Hint
Managing multiple Indexer Clusters
If you have multiple Indexer Clusters, you can create a Remote Deployment Account for each Cluster Manager.
You will then be able to manage and monitor as many Indexer Clusters as you need from a single pane of glass in TrackMe.
Step 2: Create a Flex Object tenant for monitoring Indexer Clusters
Now, let’s create a new tenant for the purposes of monitoring our Indexer Clusters. We can achieve this via the UI wizard or with a simple command line:
| trackme url=/services/trackme/v2/vtenants/admin/add_tenant mode=post body="{'tenant_name': 'clusters', 'tenant_alias': '11 - Indexer Clusters', 'tenant_desc': 'Splunk Clustered Indexers', 'tenant_roles_admin': 'trackme_admin', 'tenant_roles_power': 'trackme_power', 'tenant_roles_user': 'trackme_user', 'tenant_owner': 'admin', 'tenant_idx_settings': 'global', 'tenant_flx_enabled': 'true'}"
Step 3: Create Flex Object trackers using the Flex Objects library
Hint
Find the use cases definition (SPL) in annex of this documentation
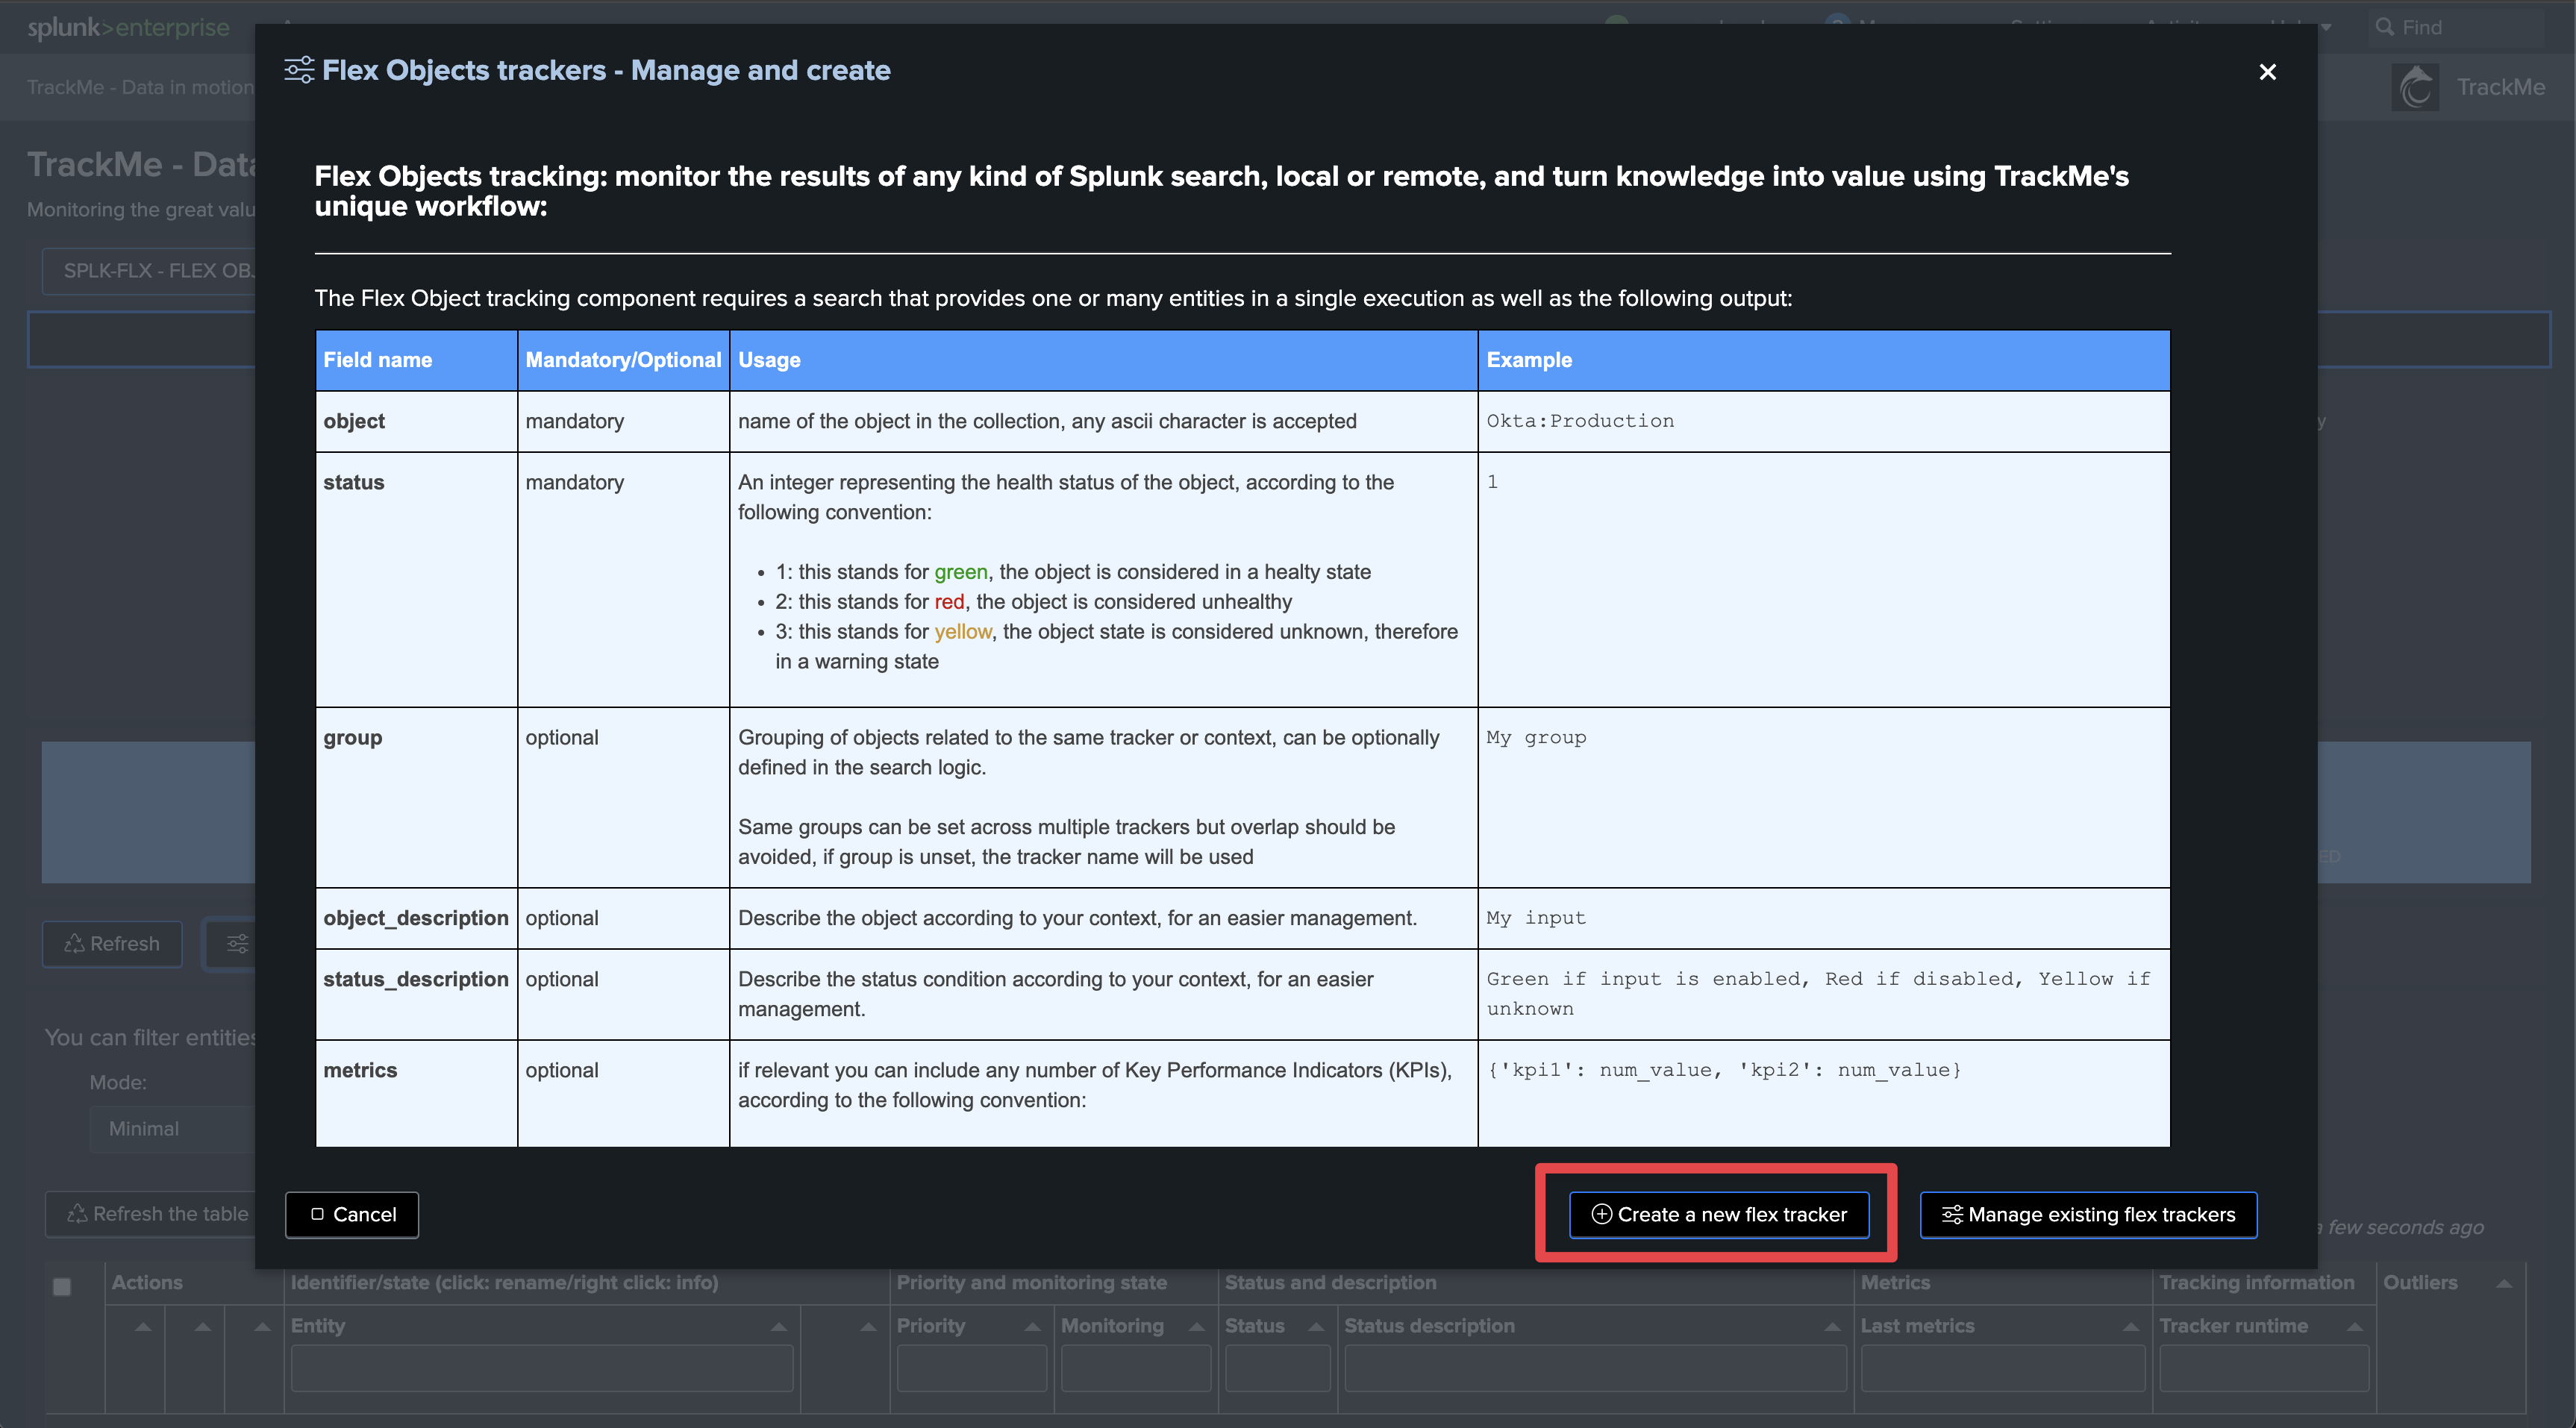
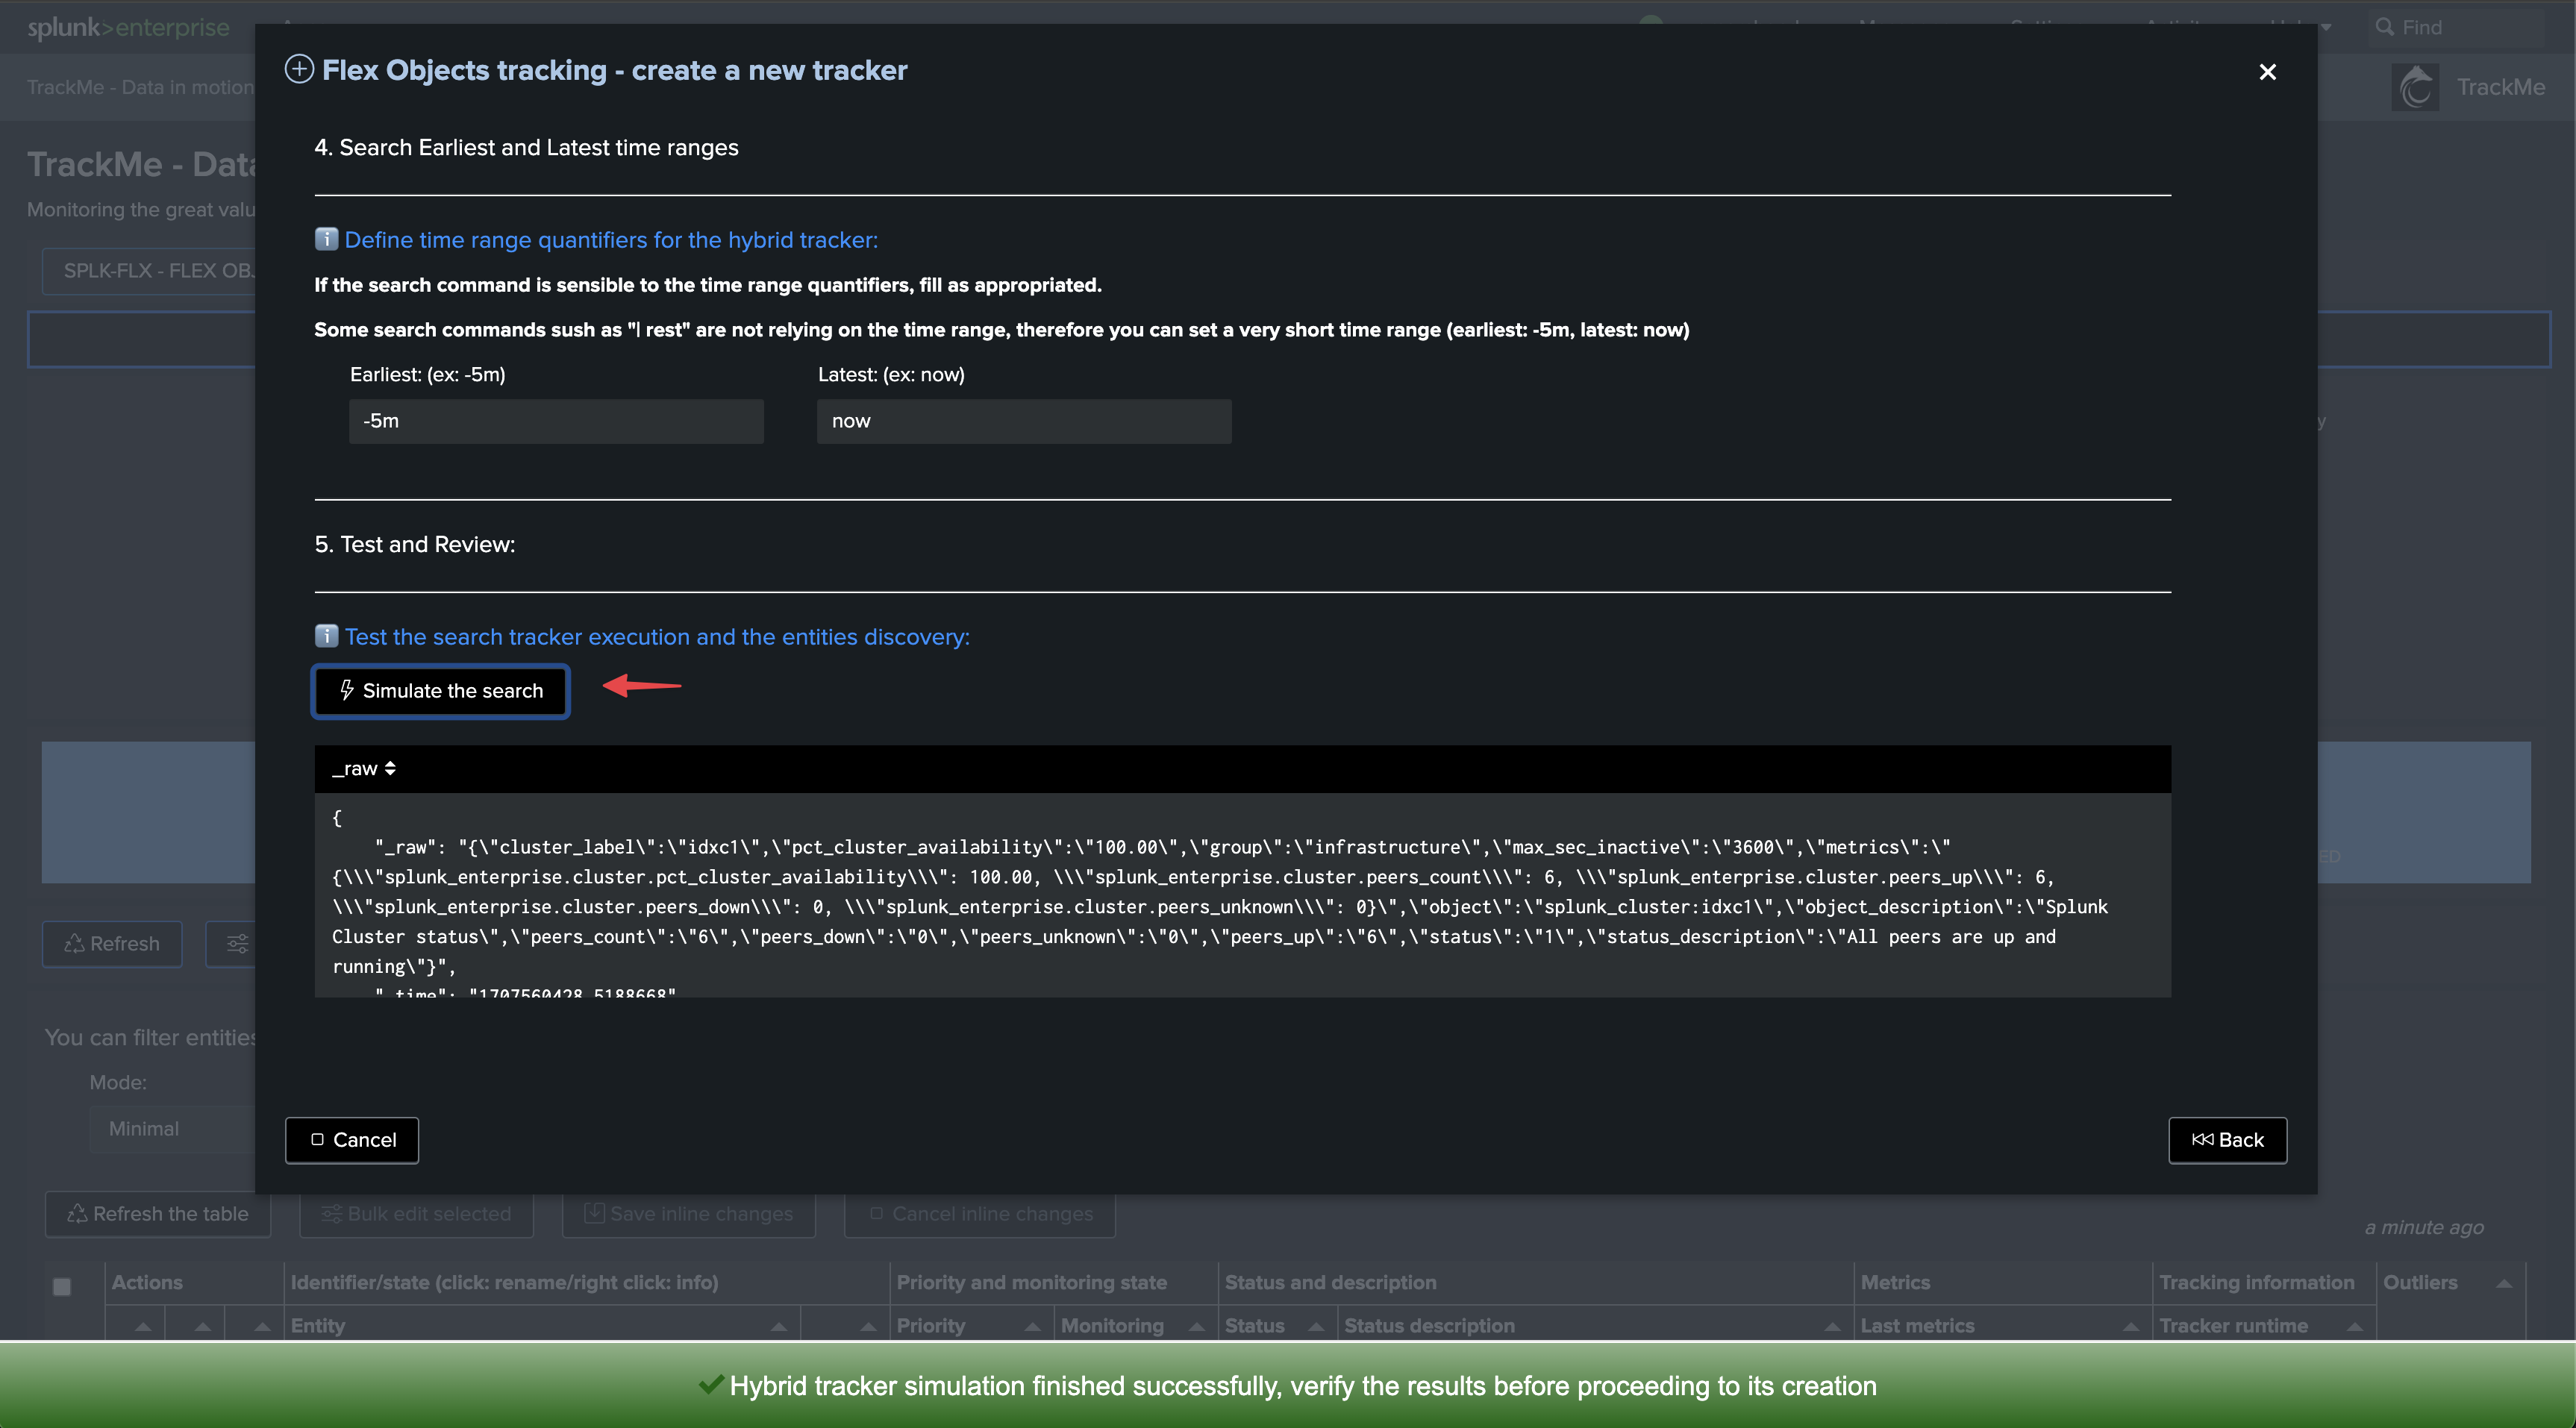
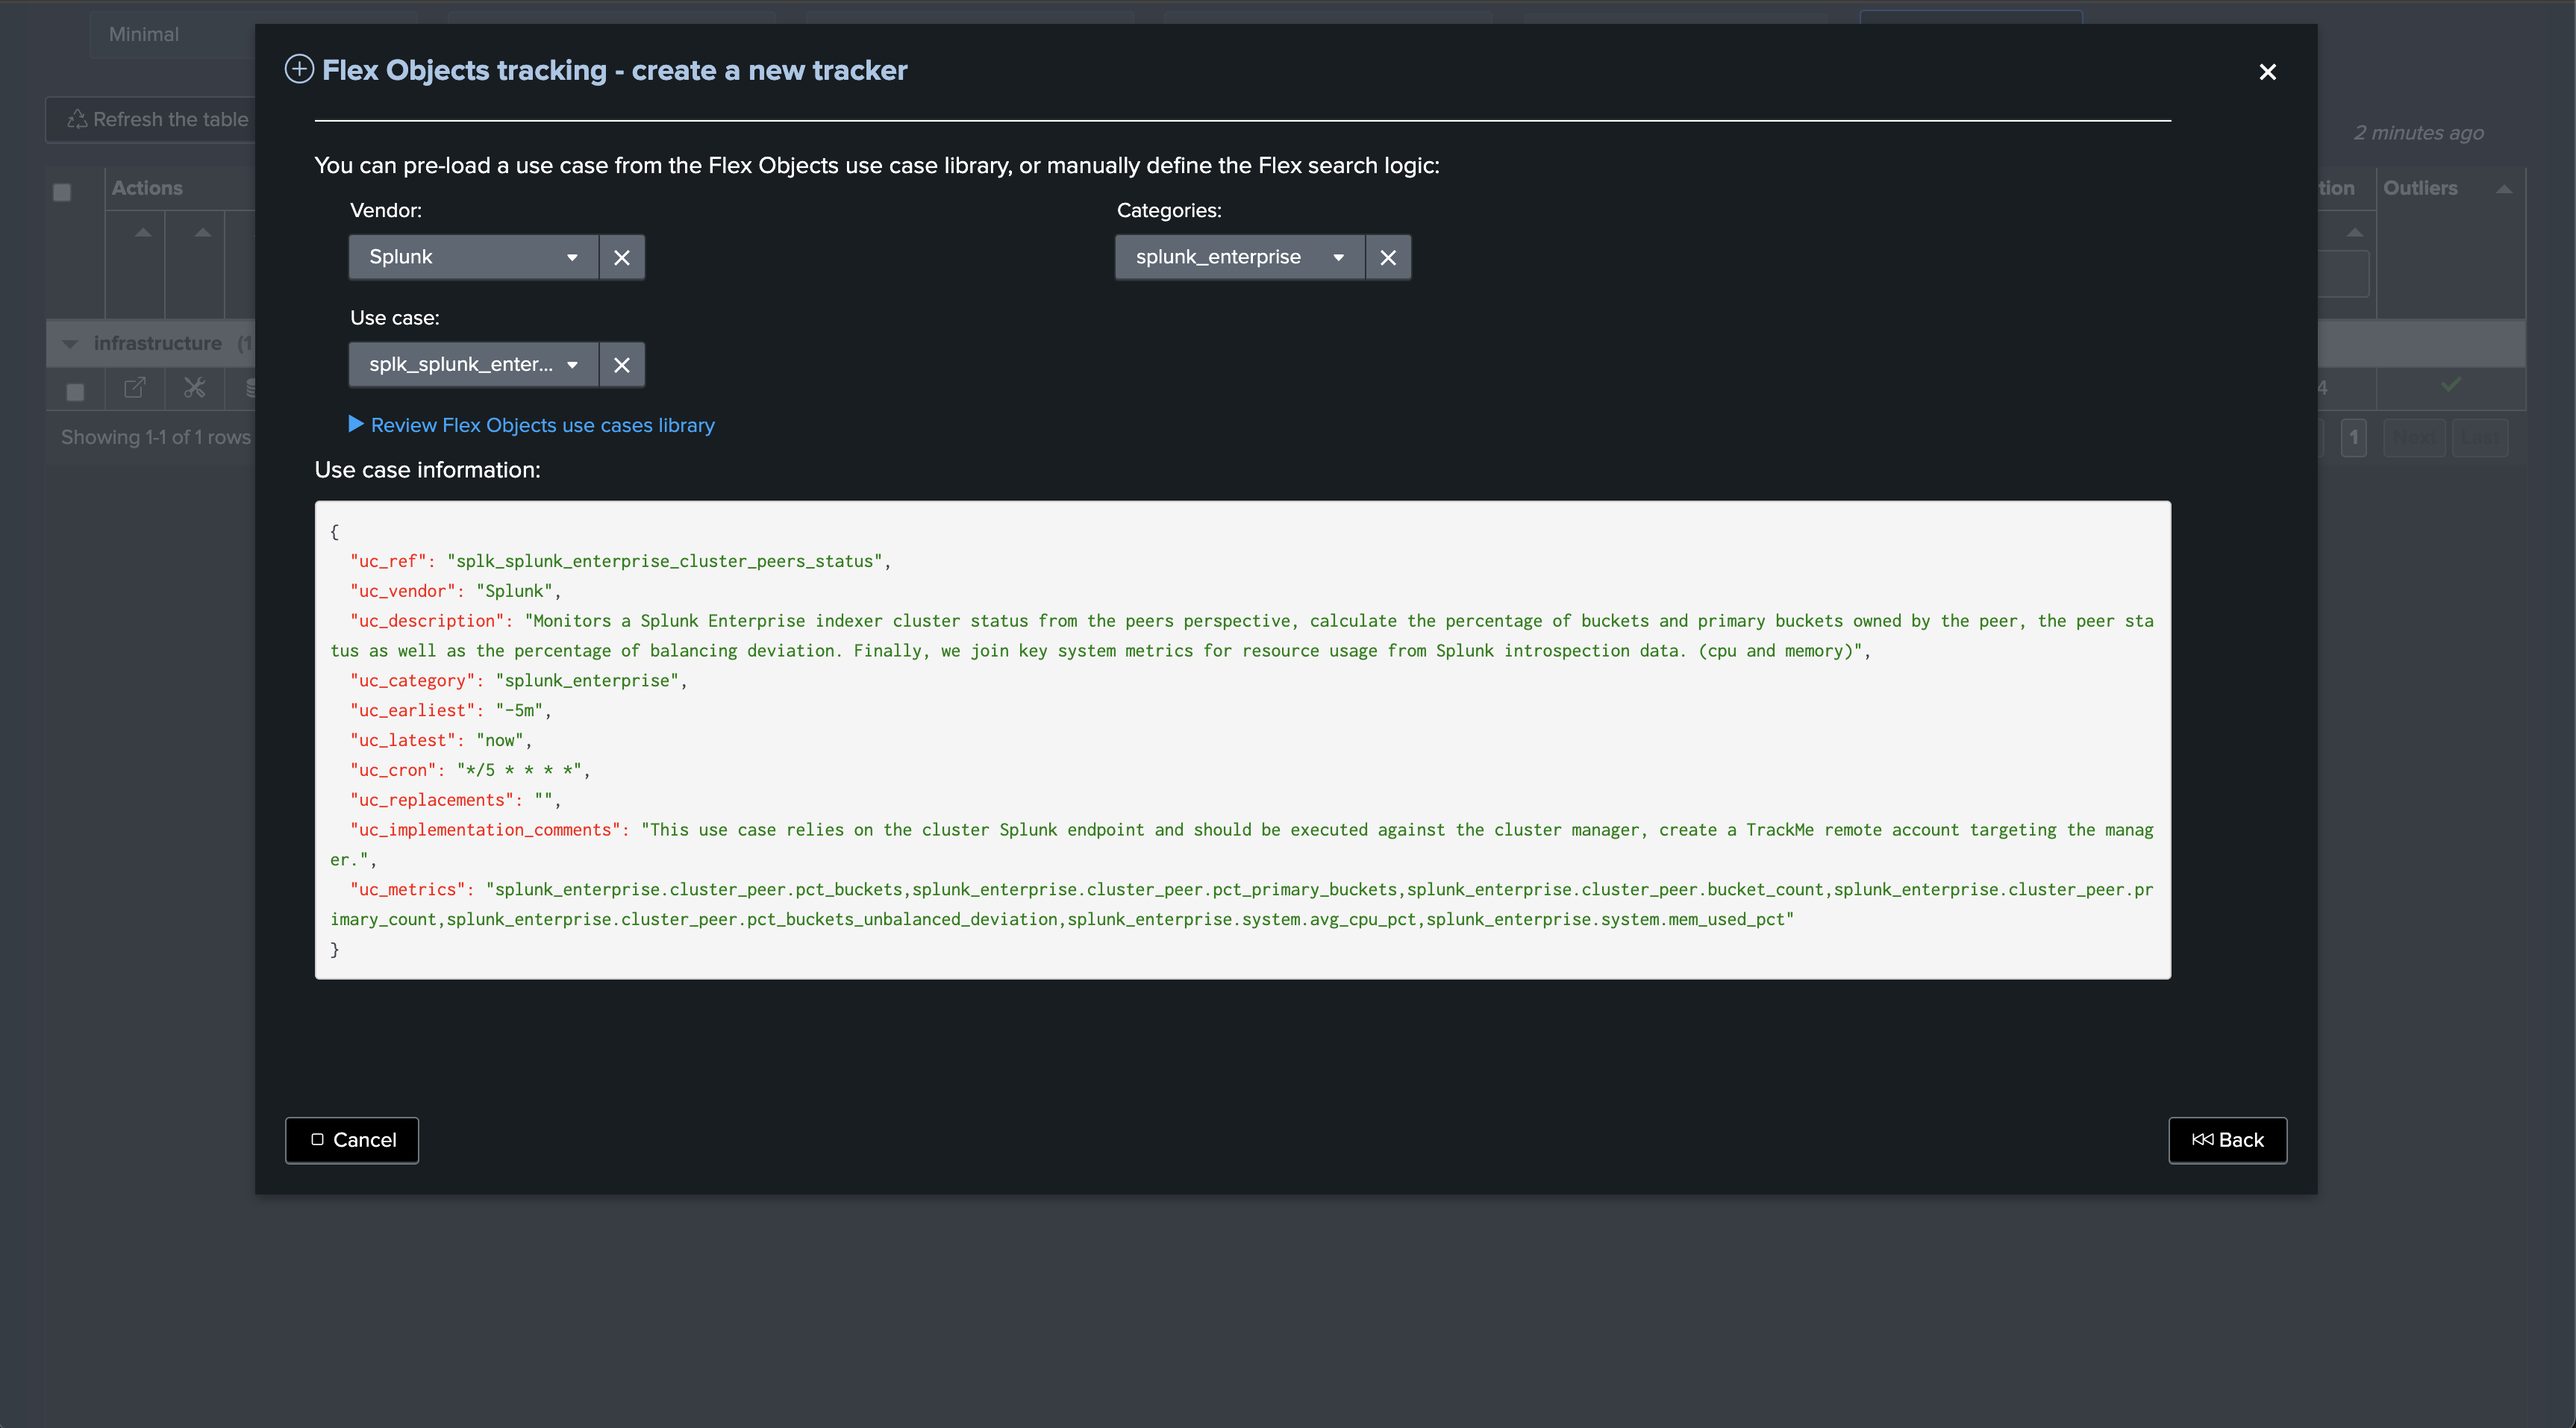
Enter the newly created tenant and start the Flex Object wizard using the built-in Flex Object library:

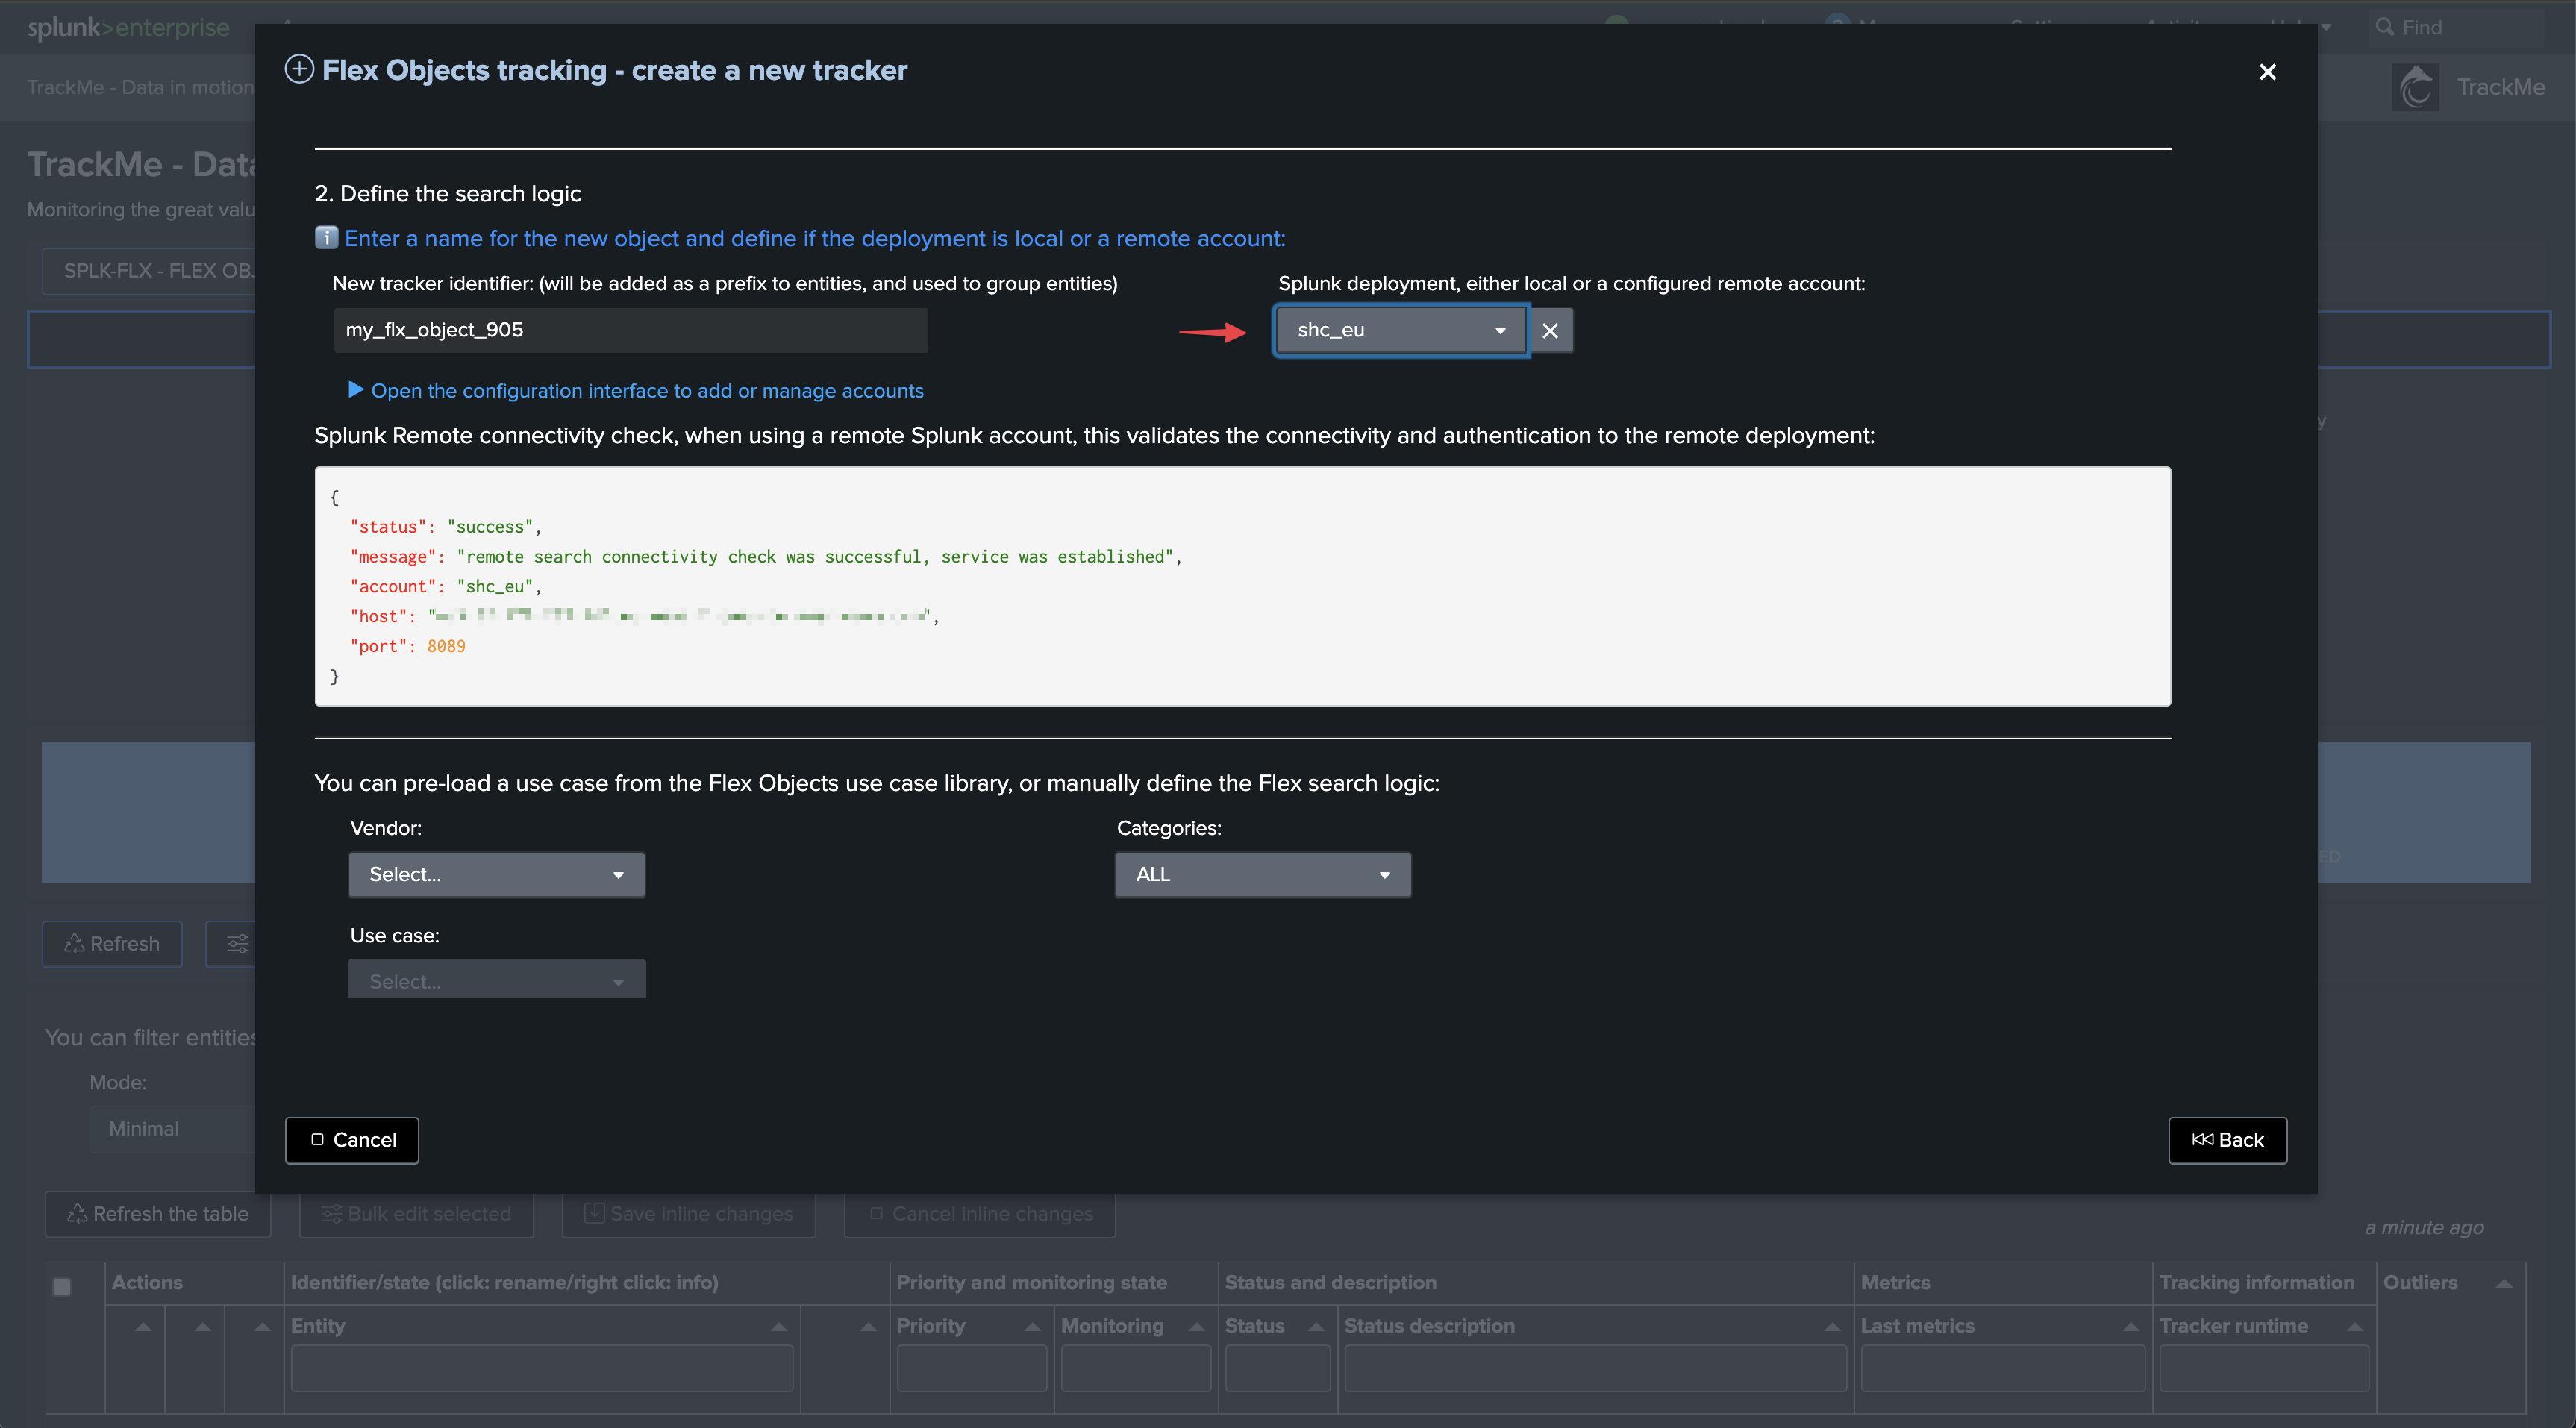

Select the use cases and remote accounts:
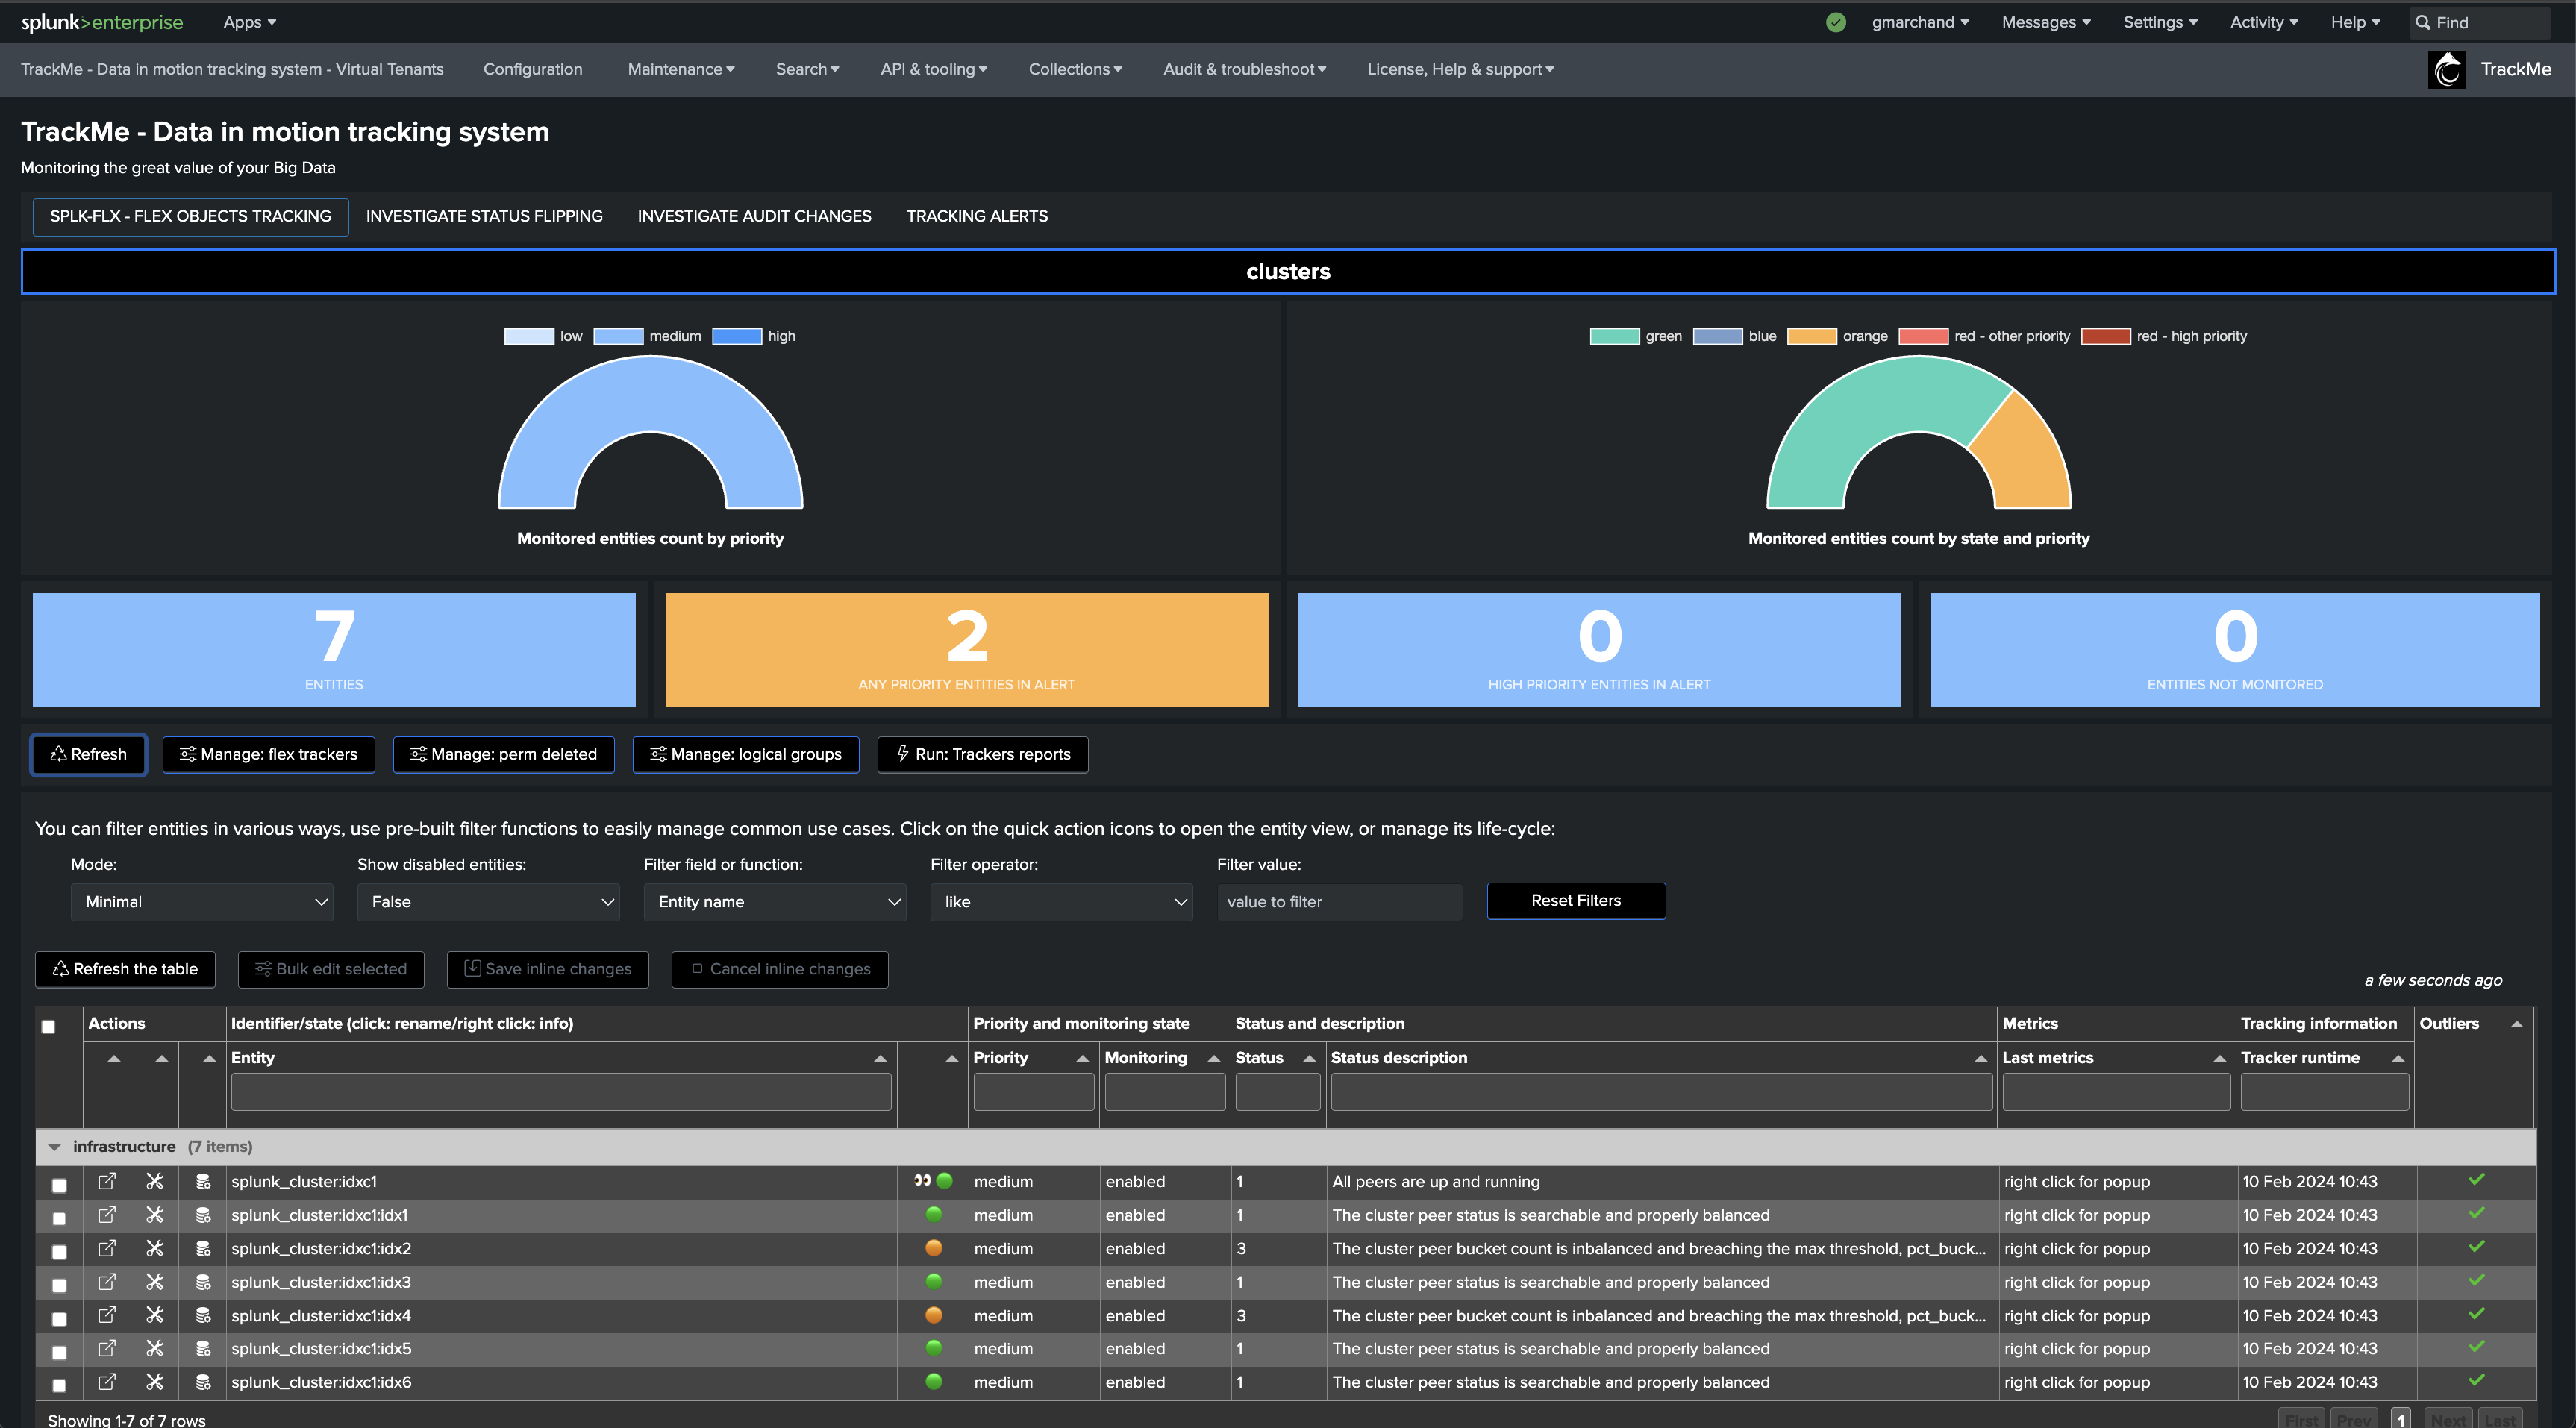
We will start with the use case “splk_splunk_enterprise_cluster_status” which tracks the global indexer cluster status using the manager API endpoints.

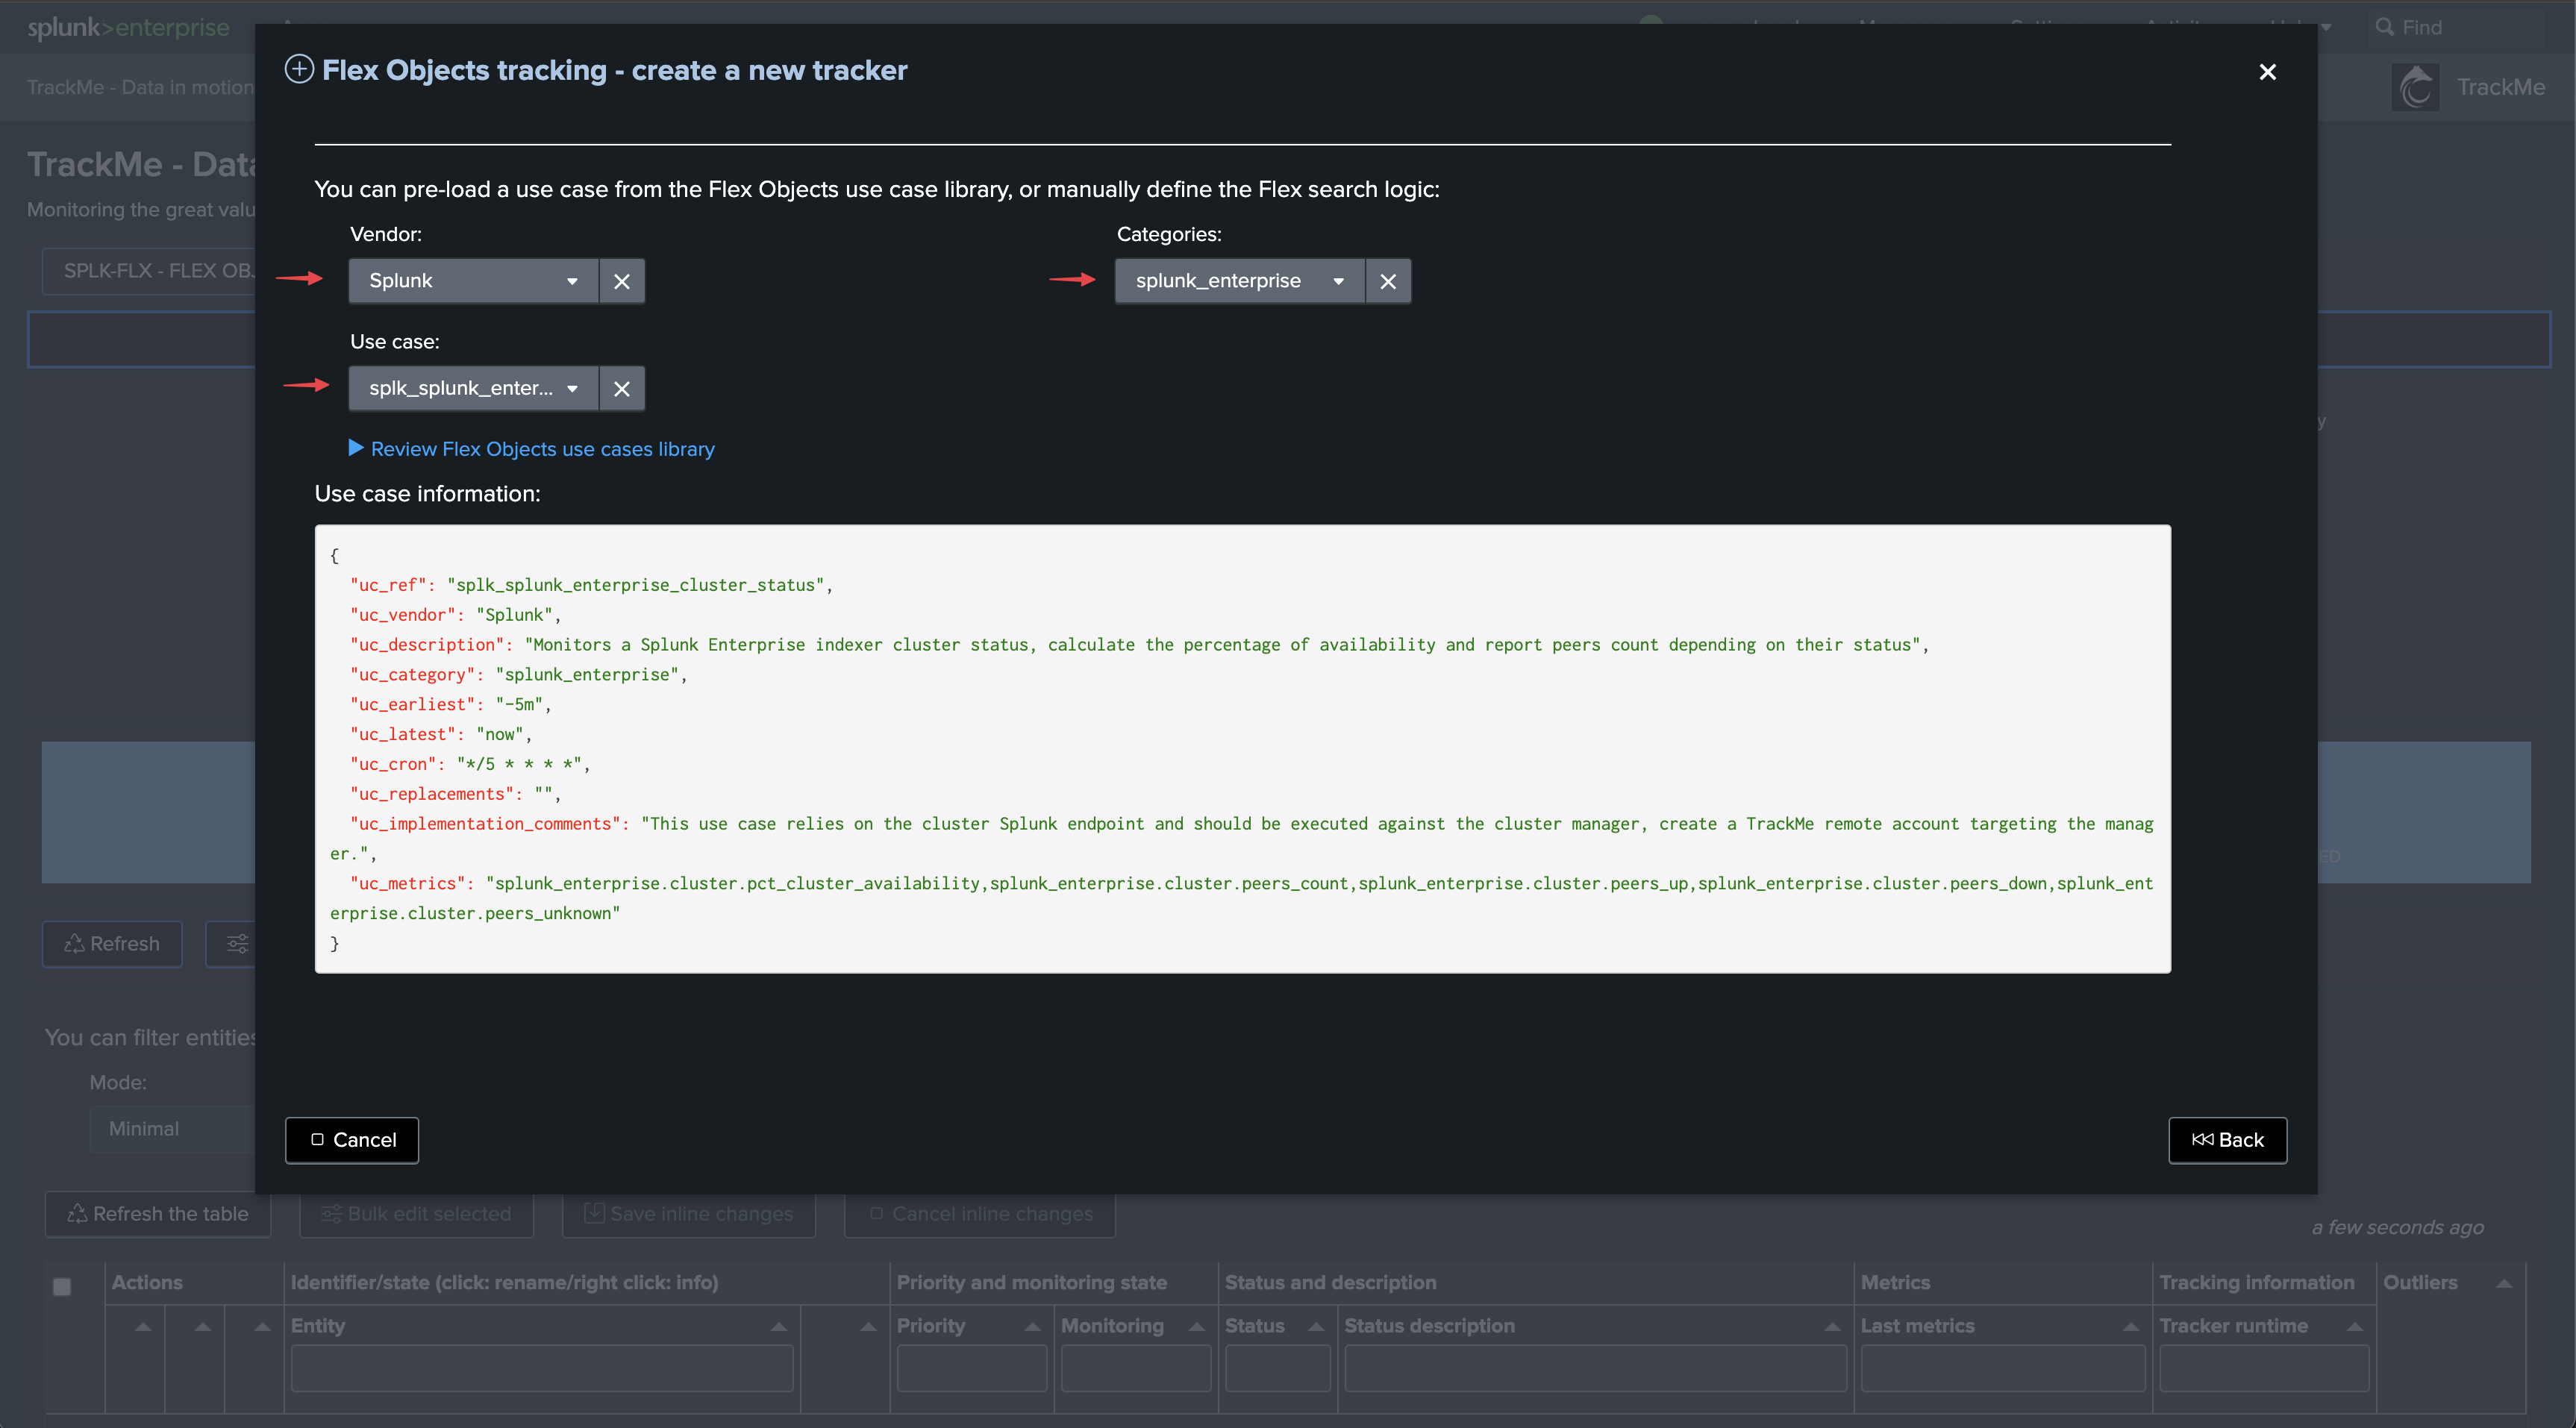

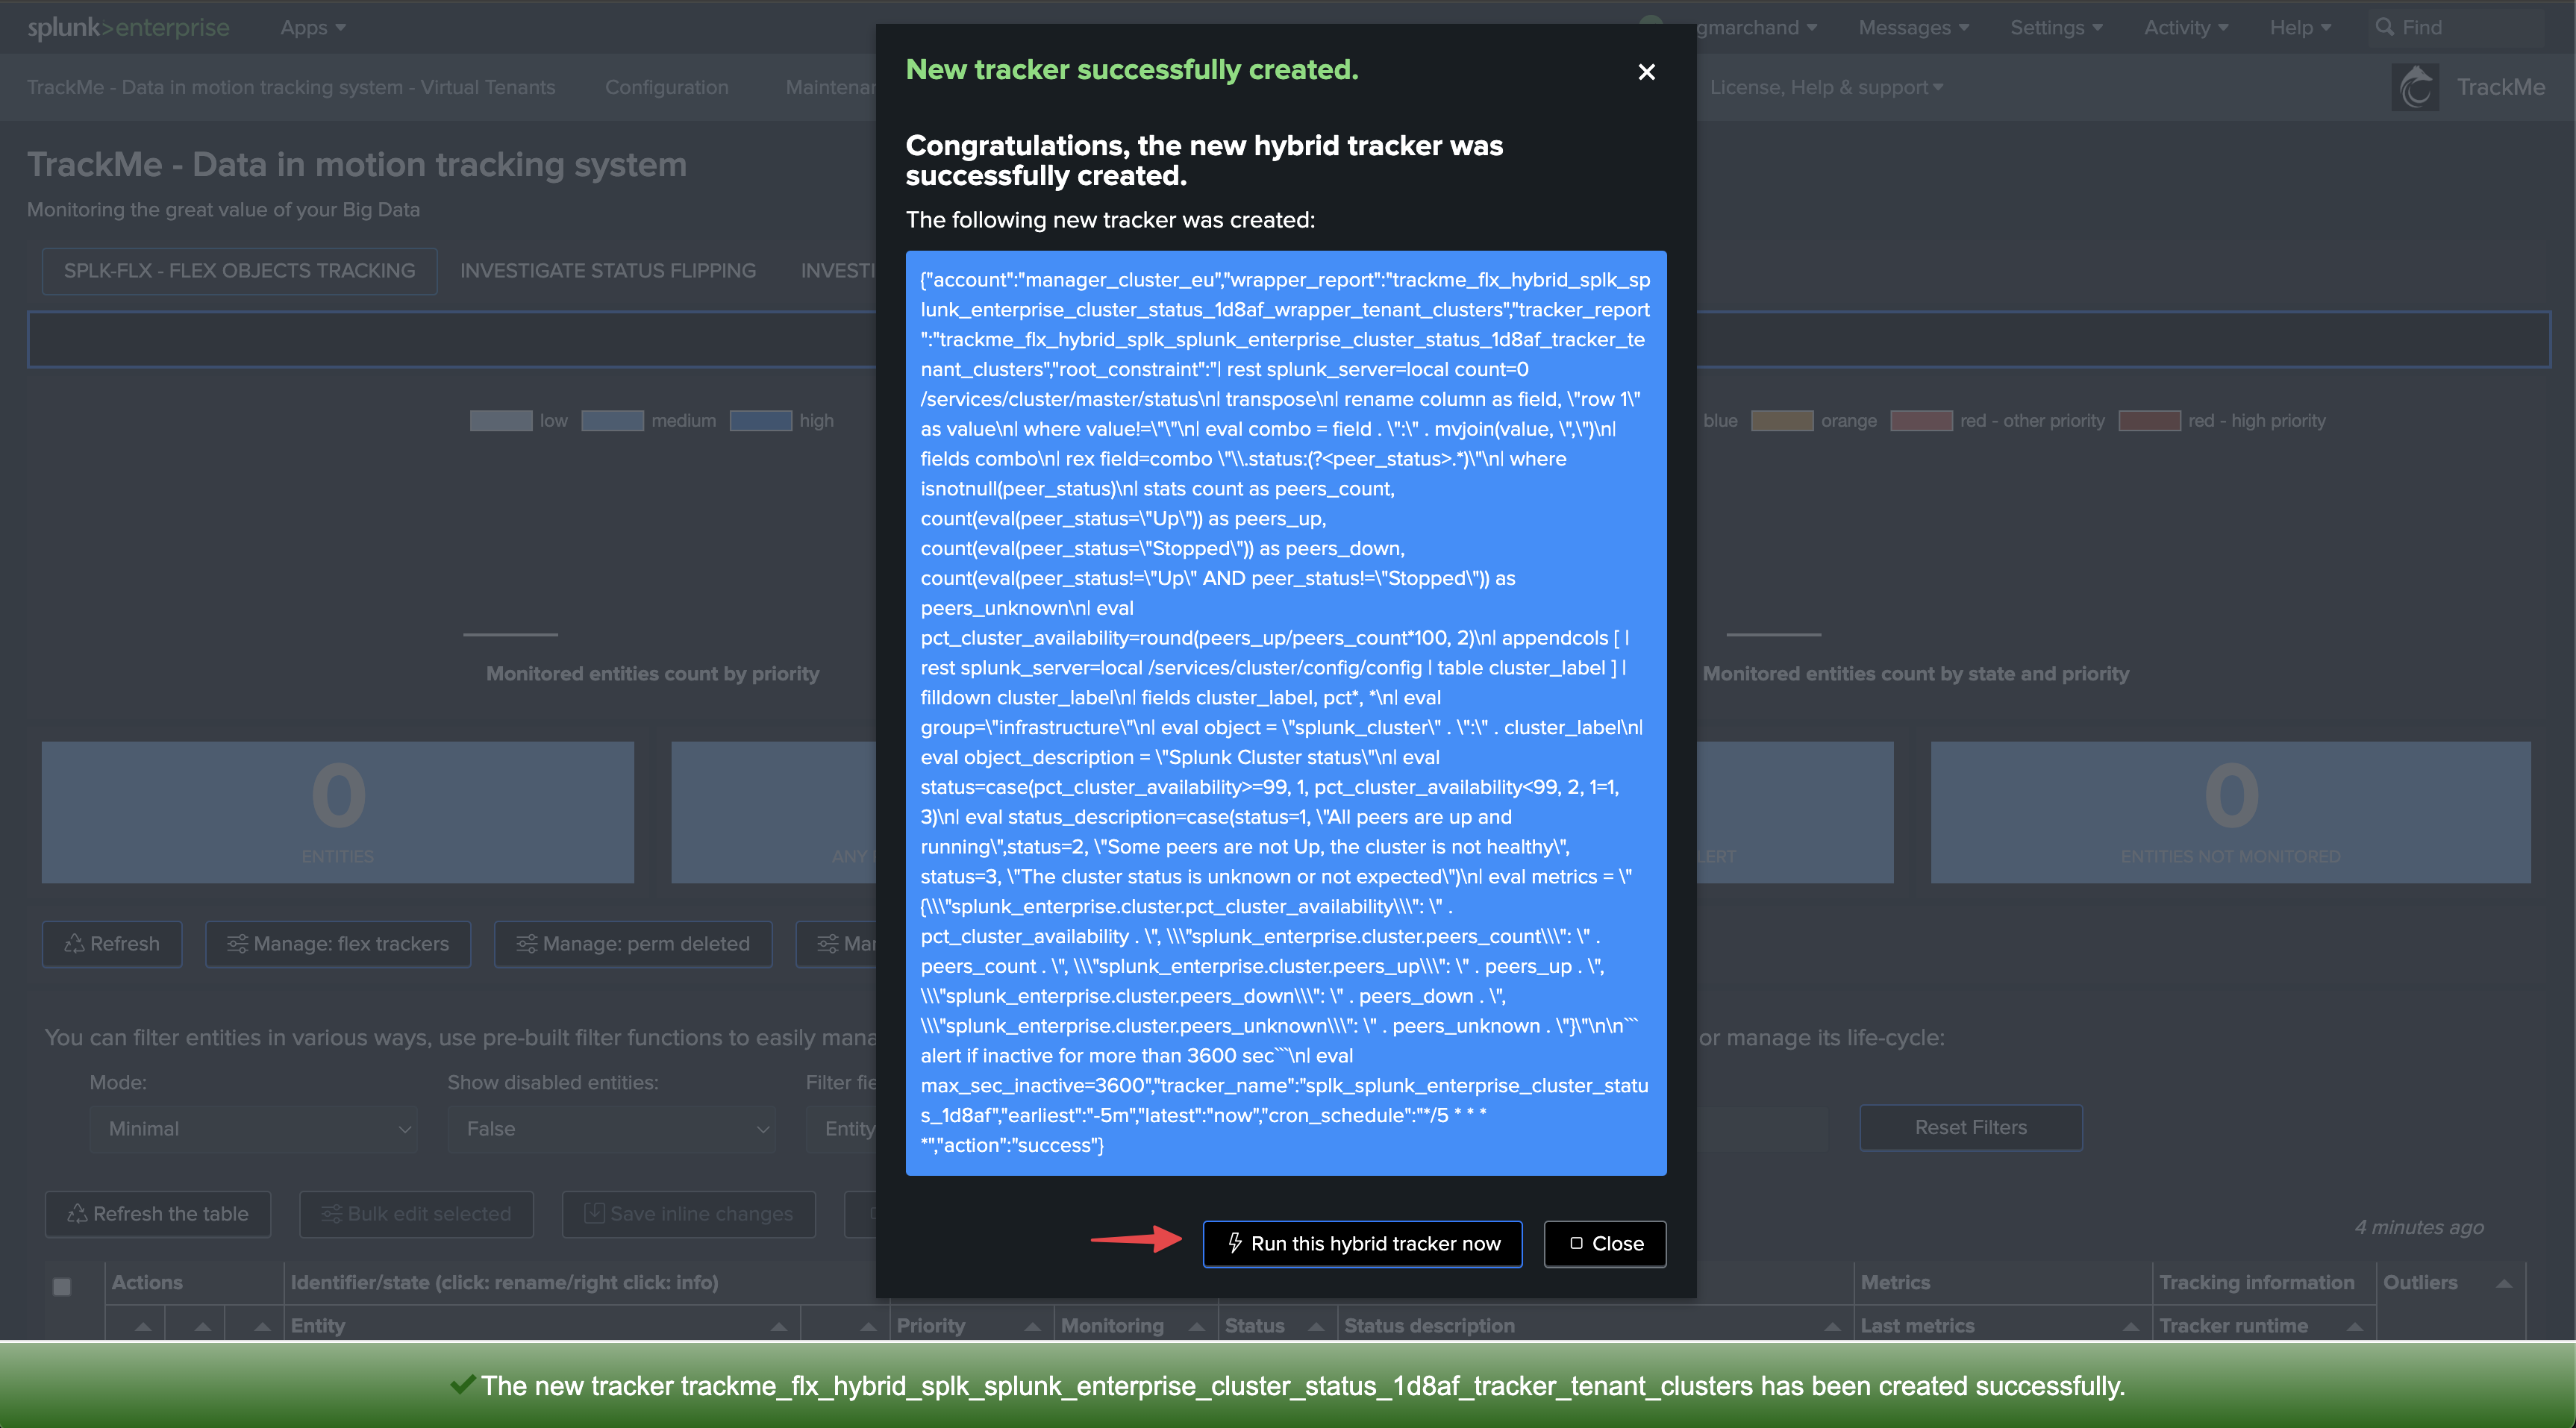
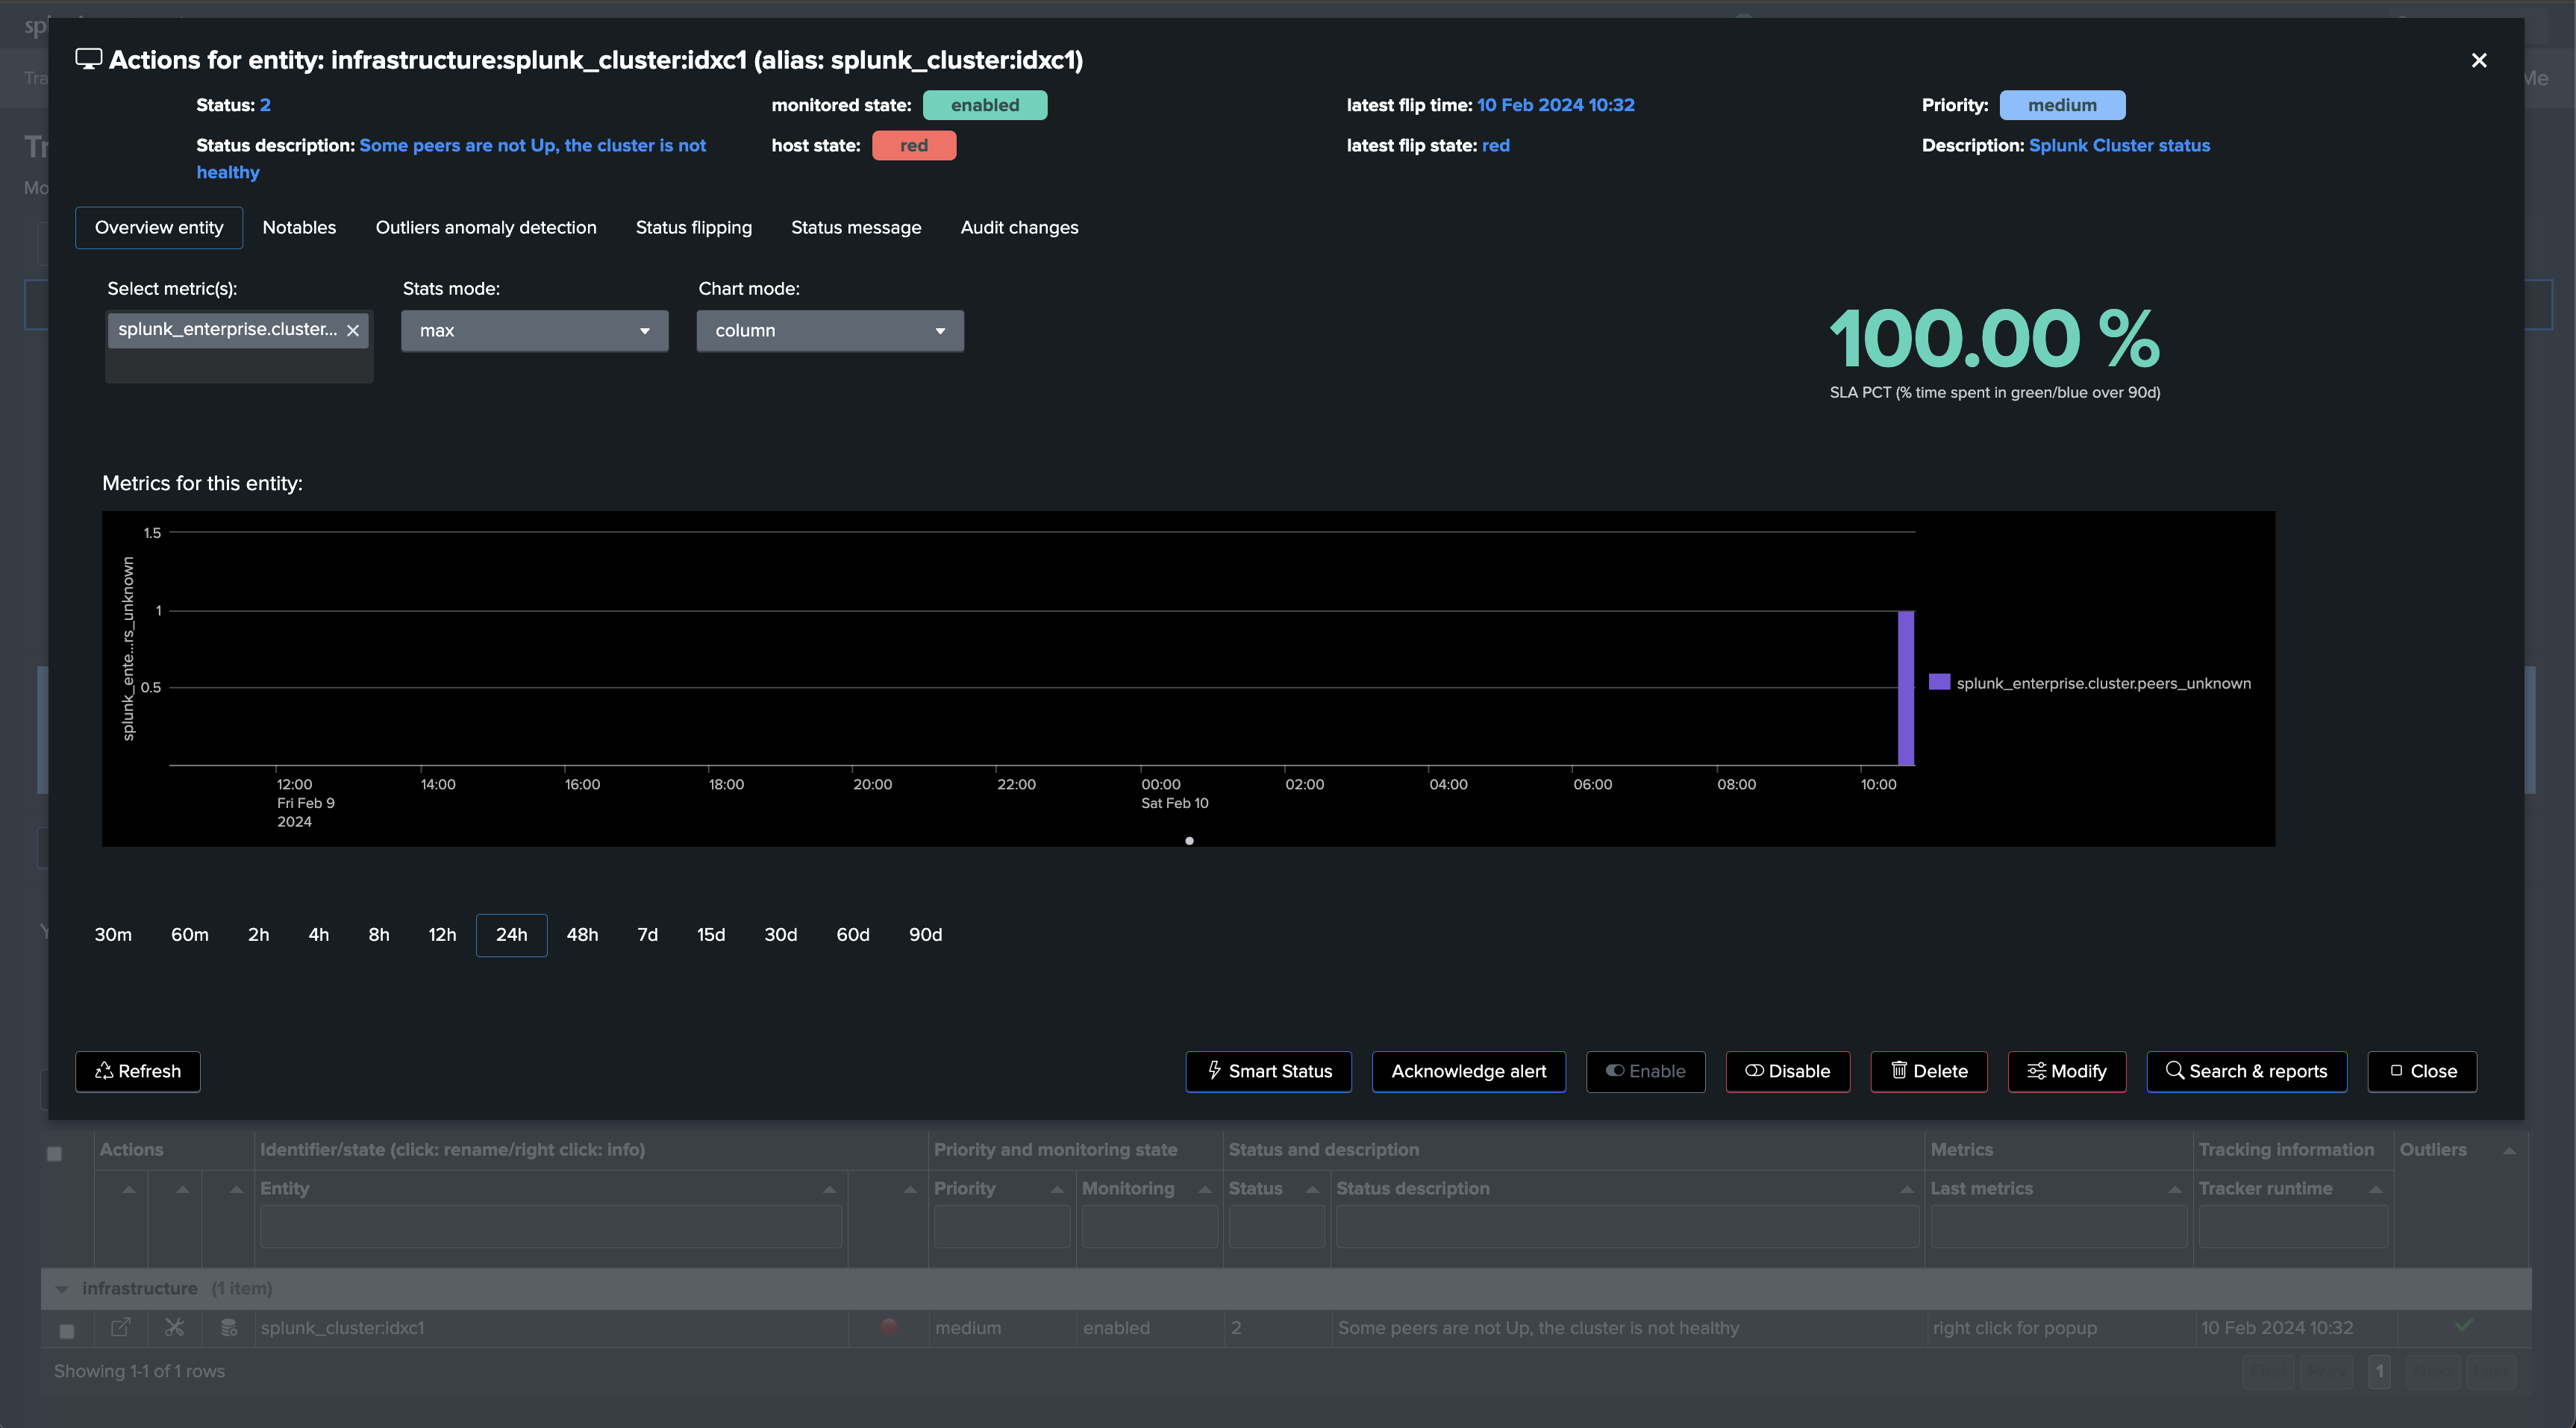
Once executed, TrackMe immediately starts monitoring the global indexer cluster status, generates KPIs for the cluster, and alerts you when issues are detected.
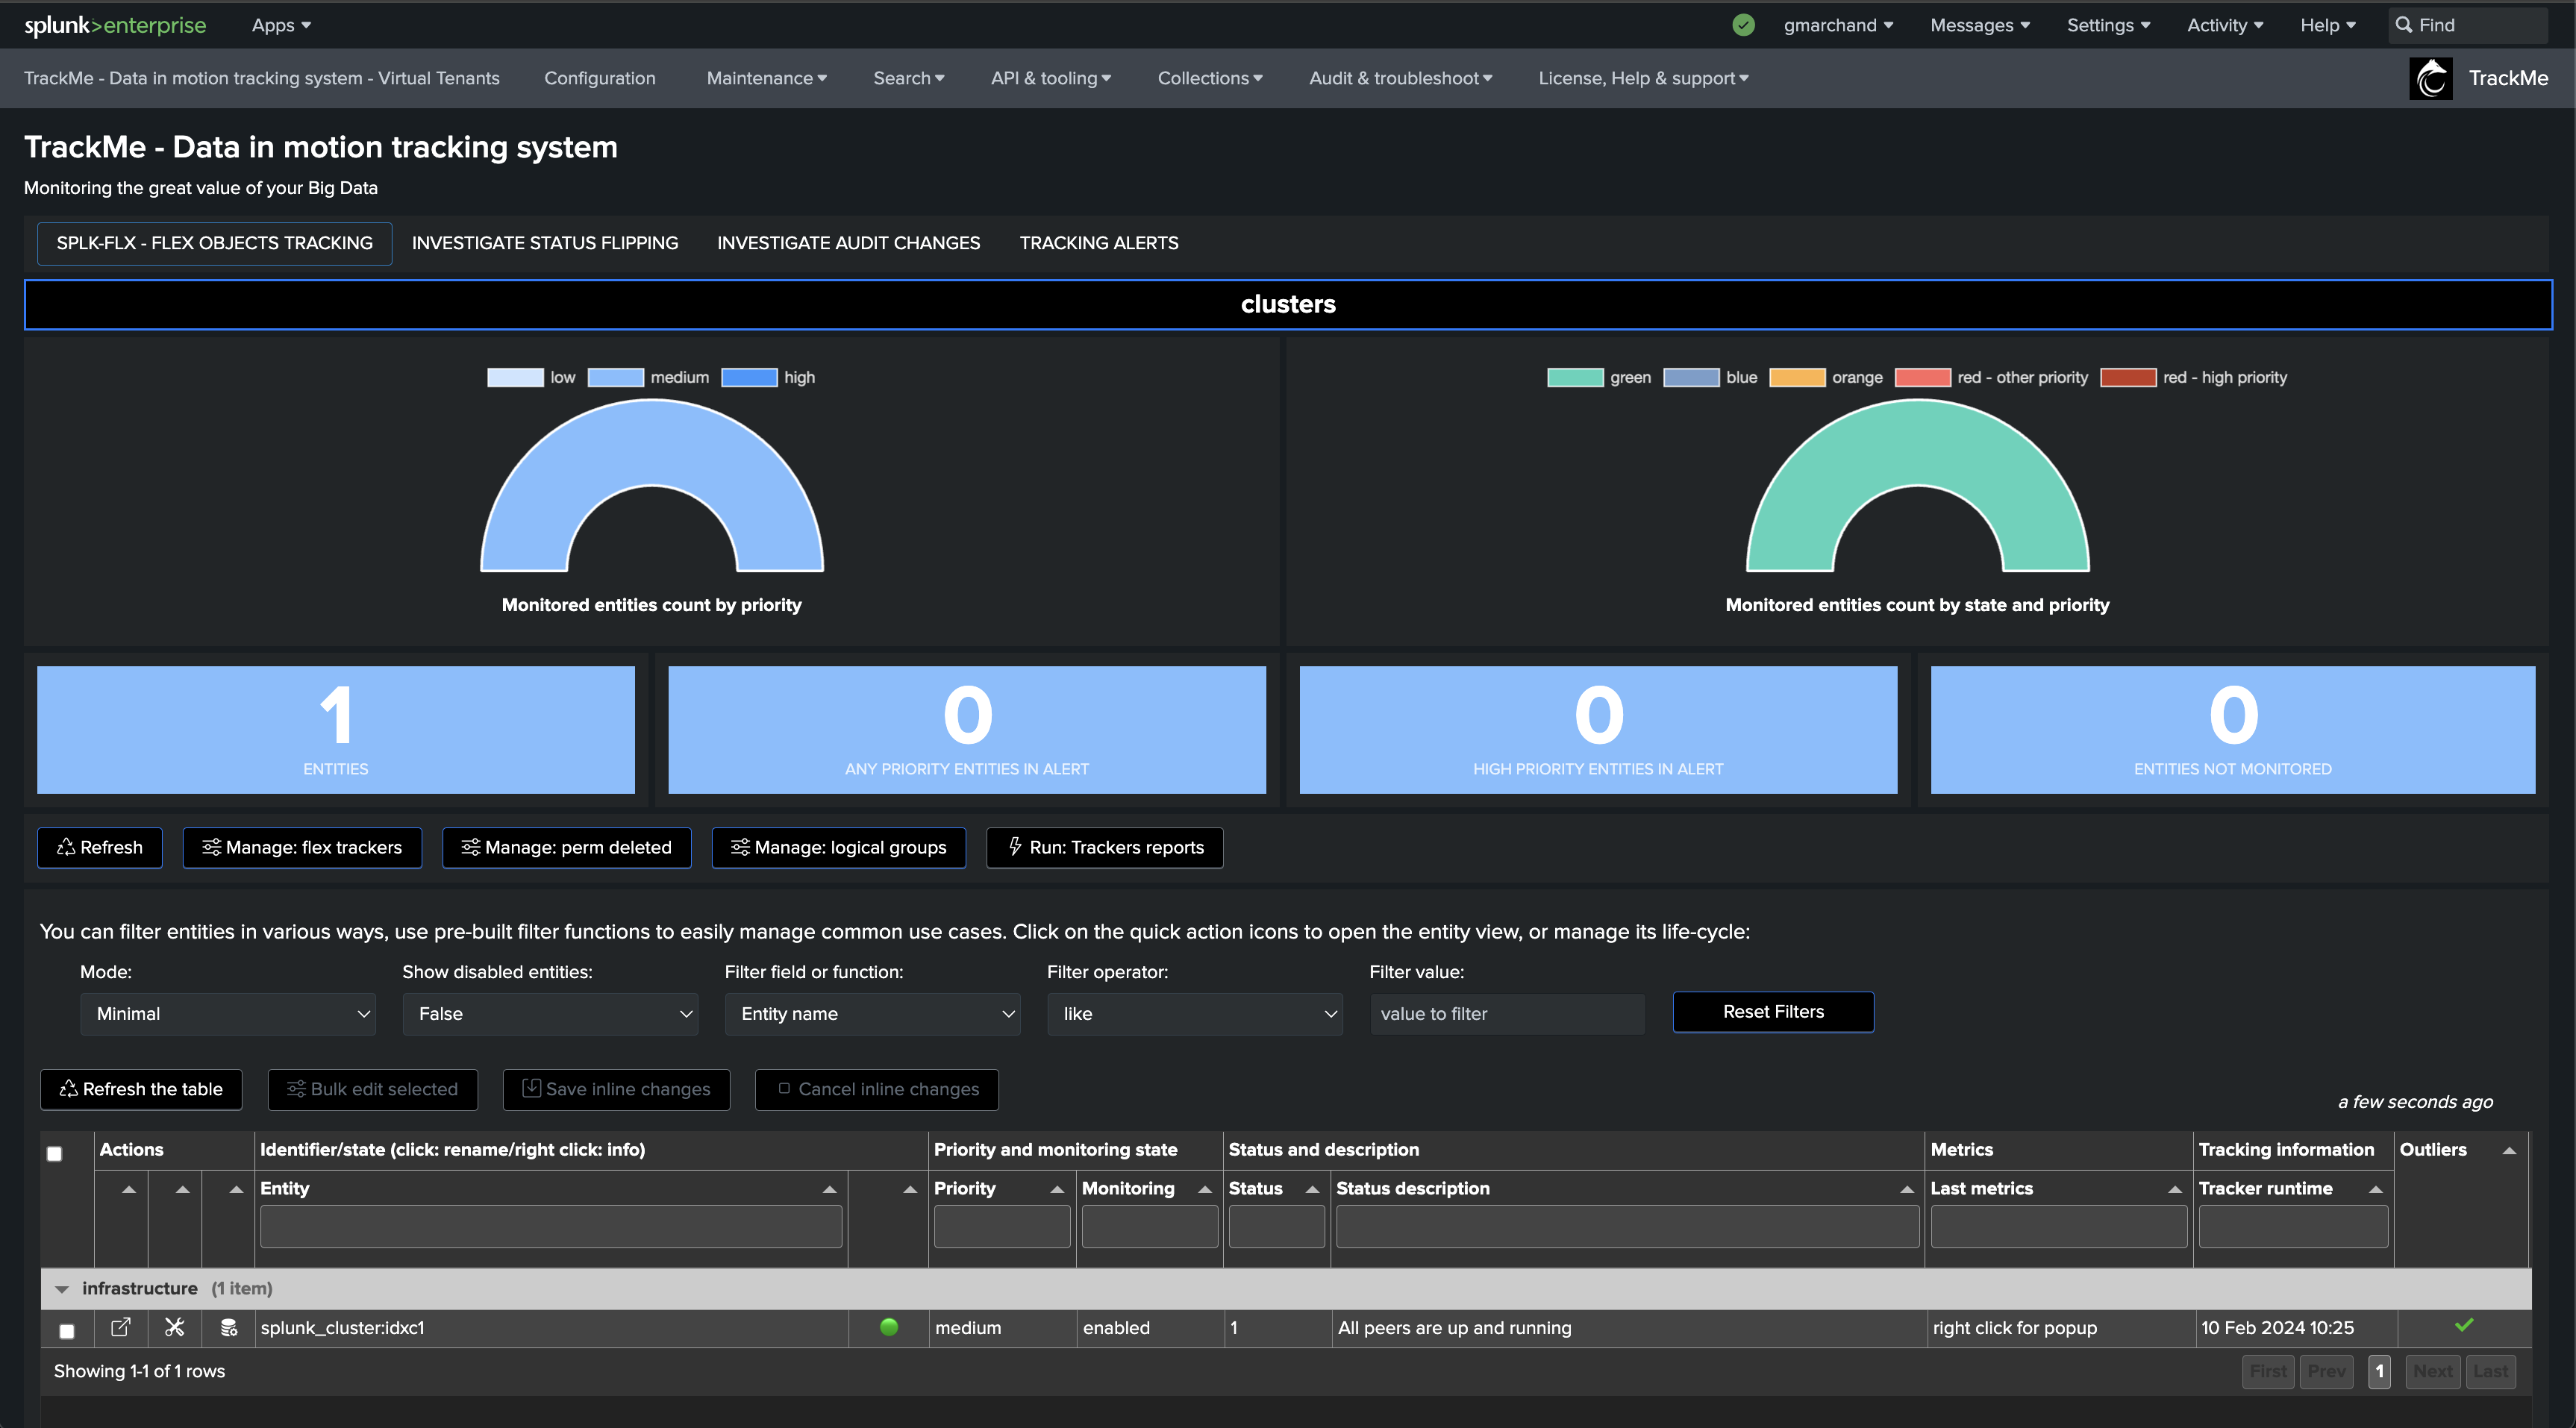


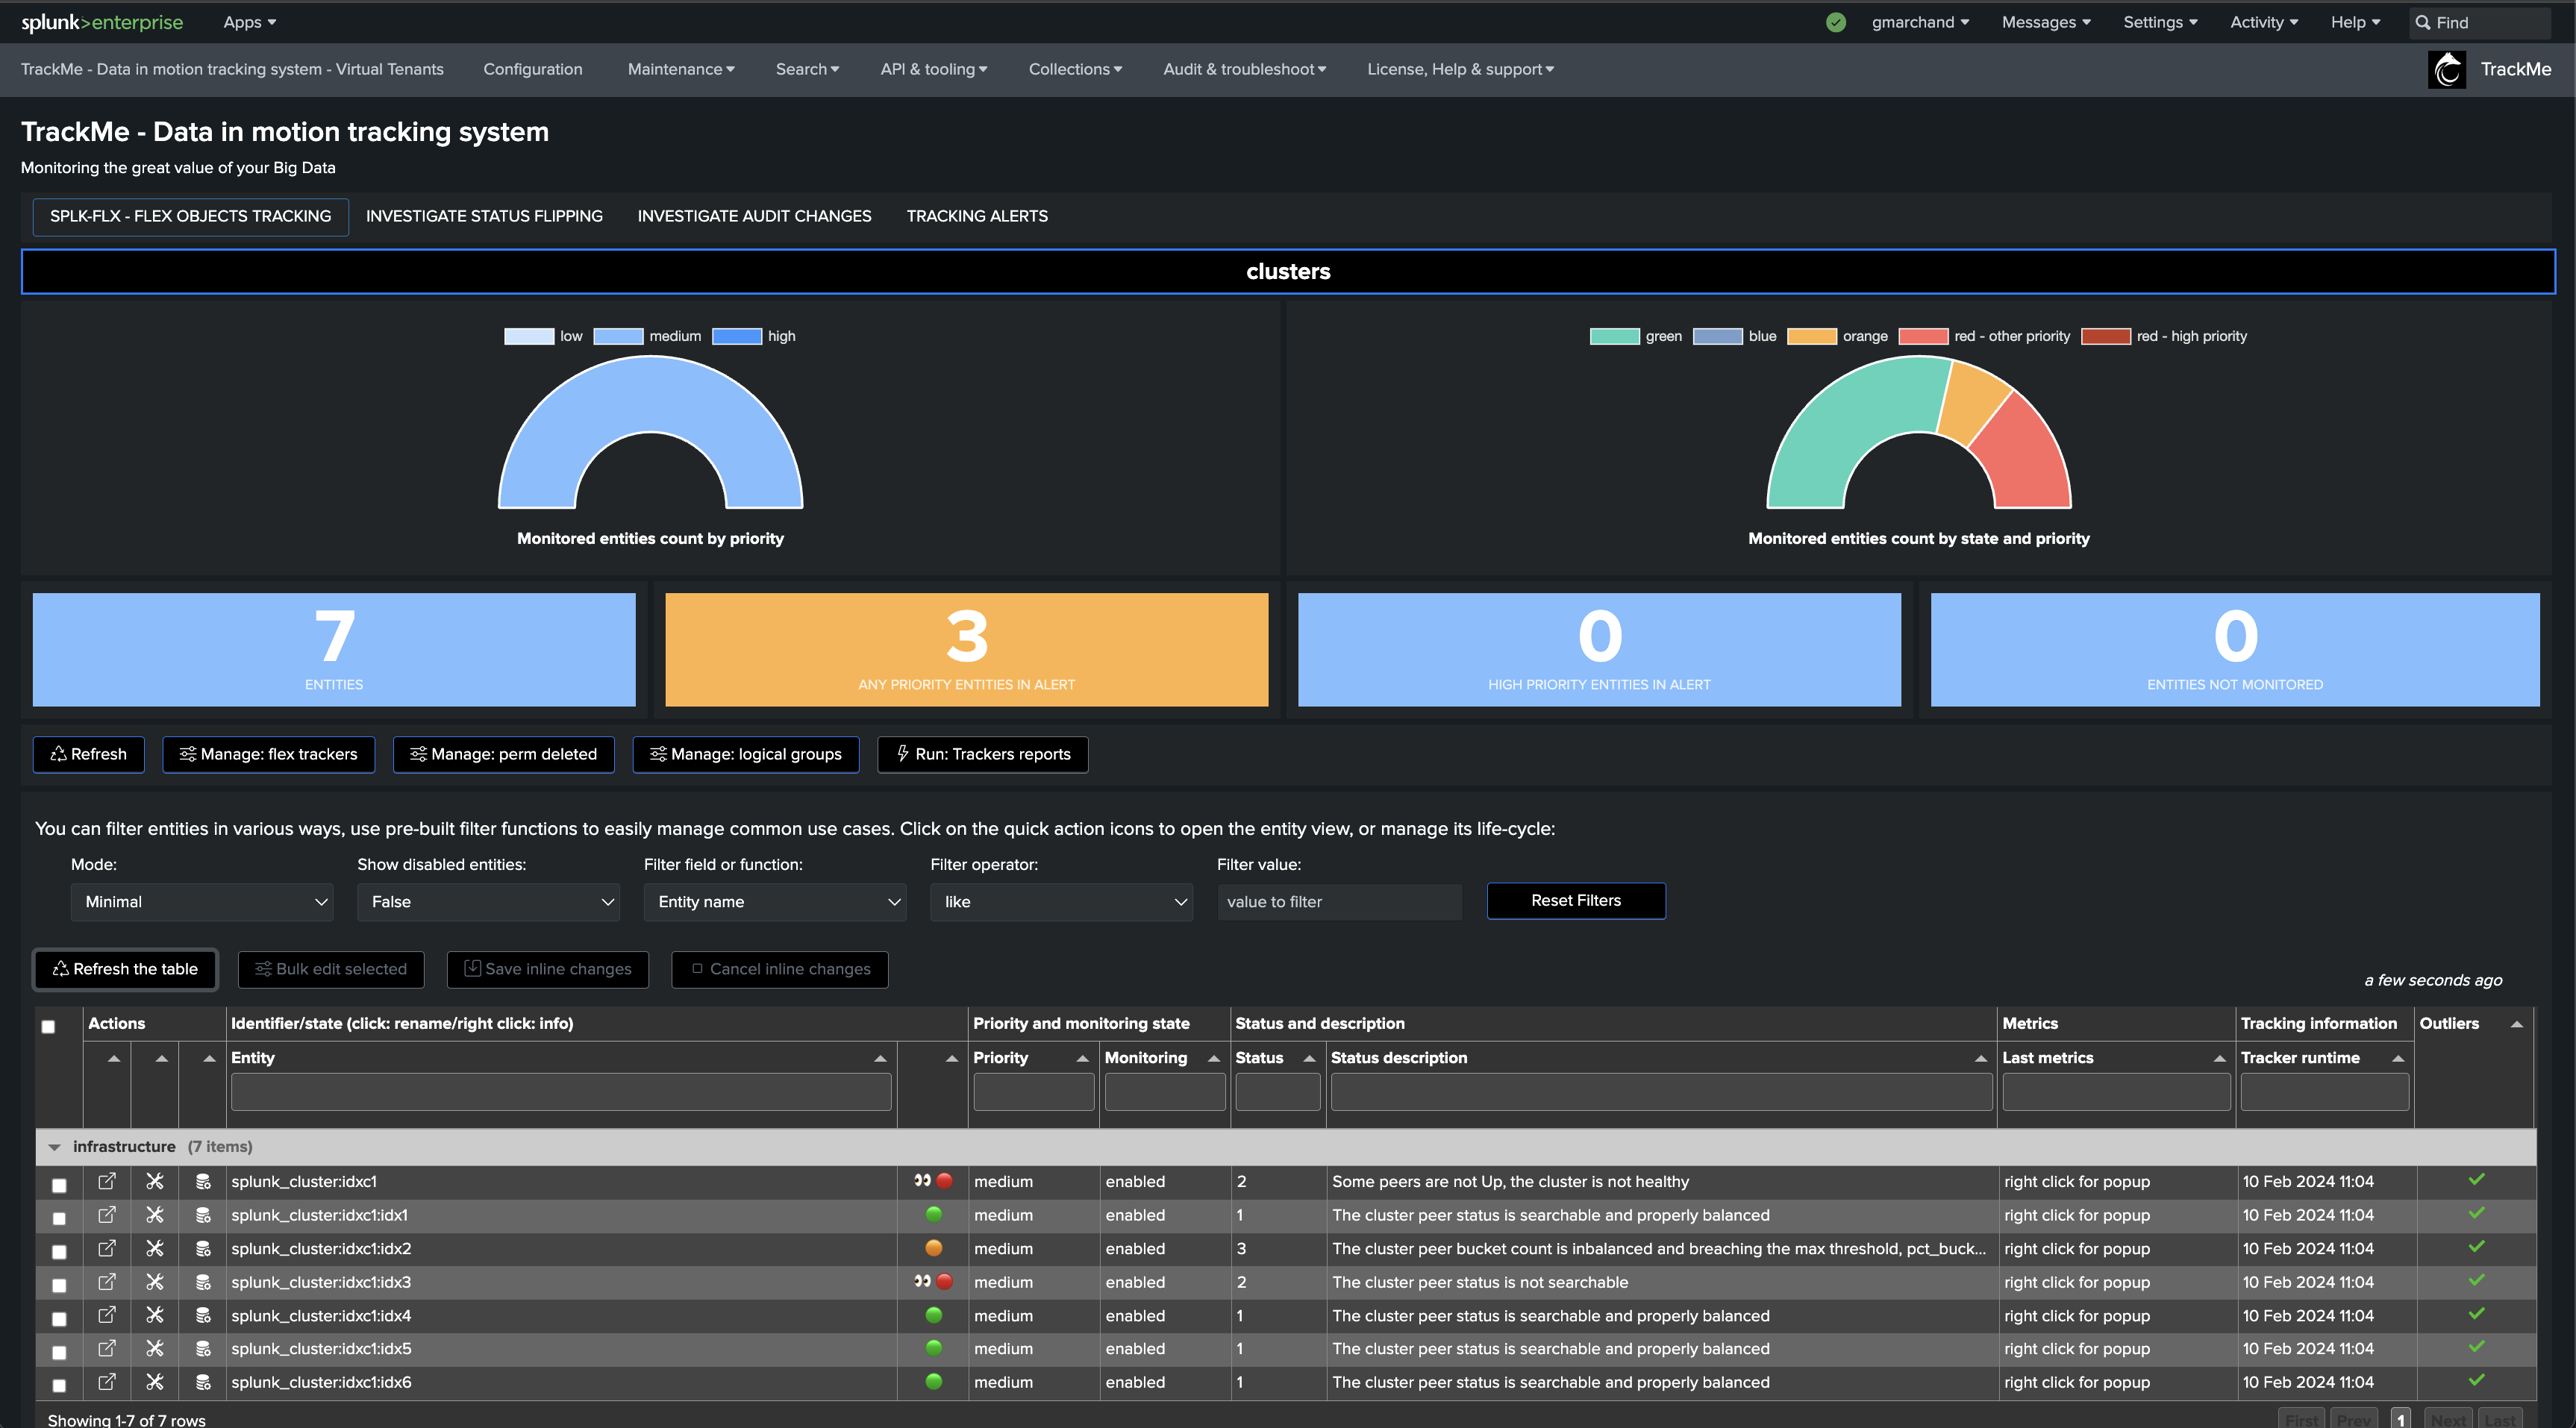
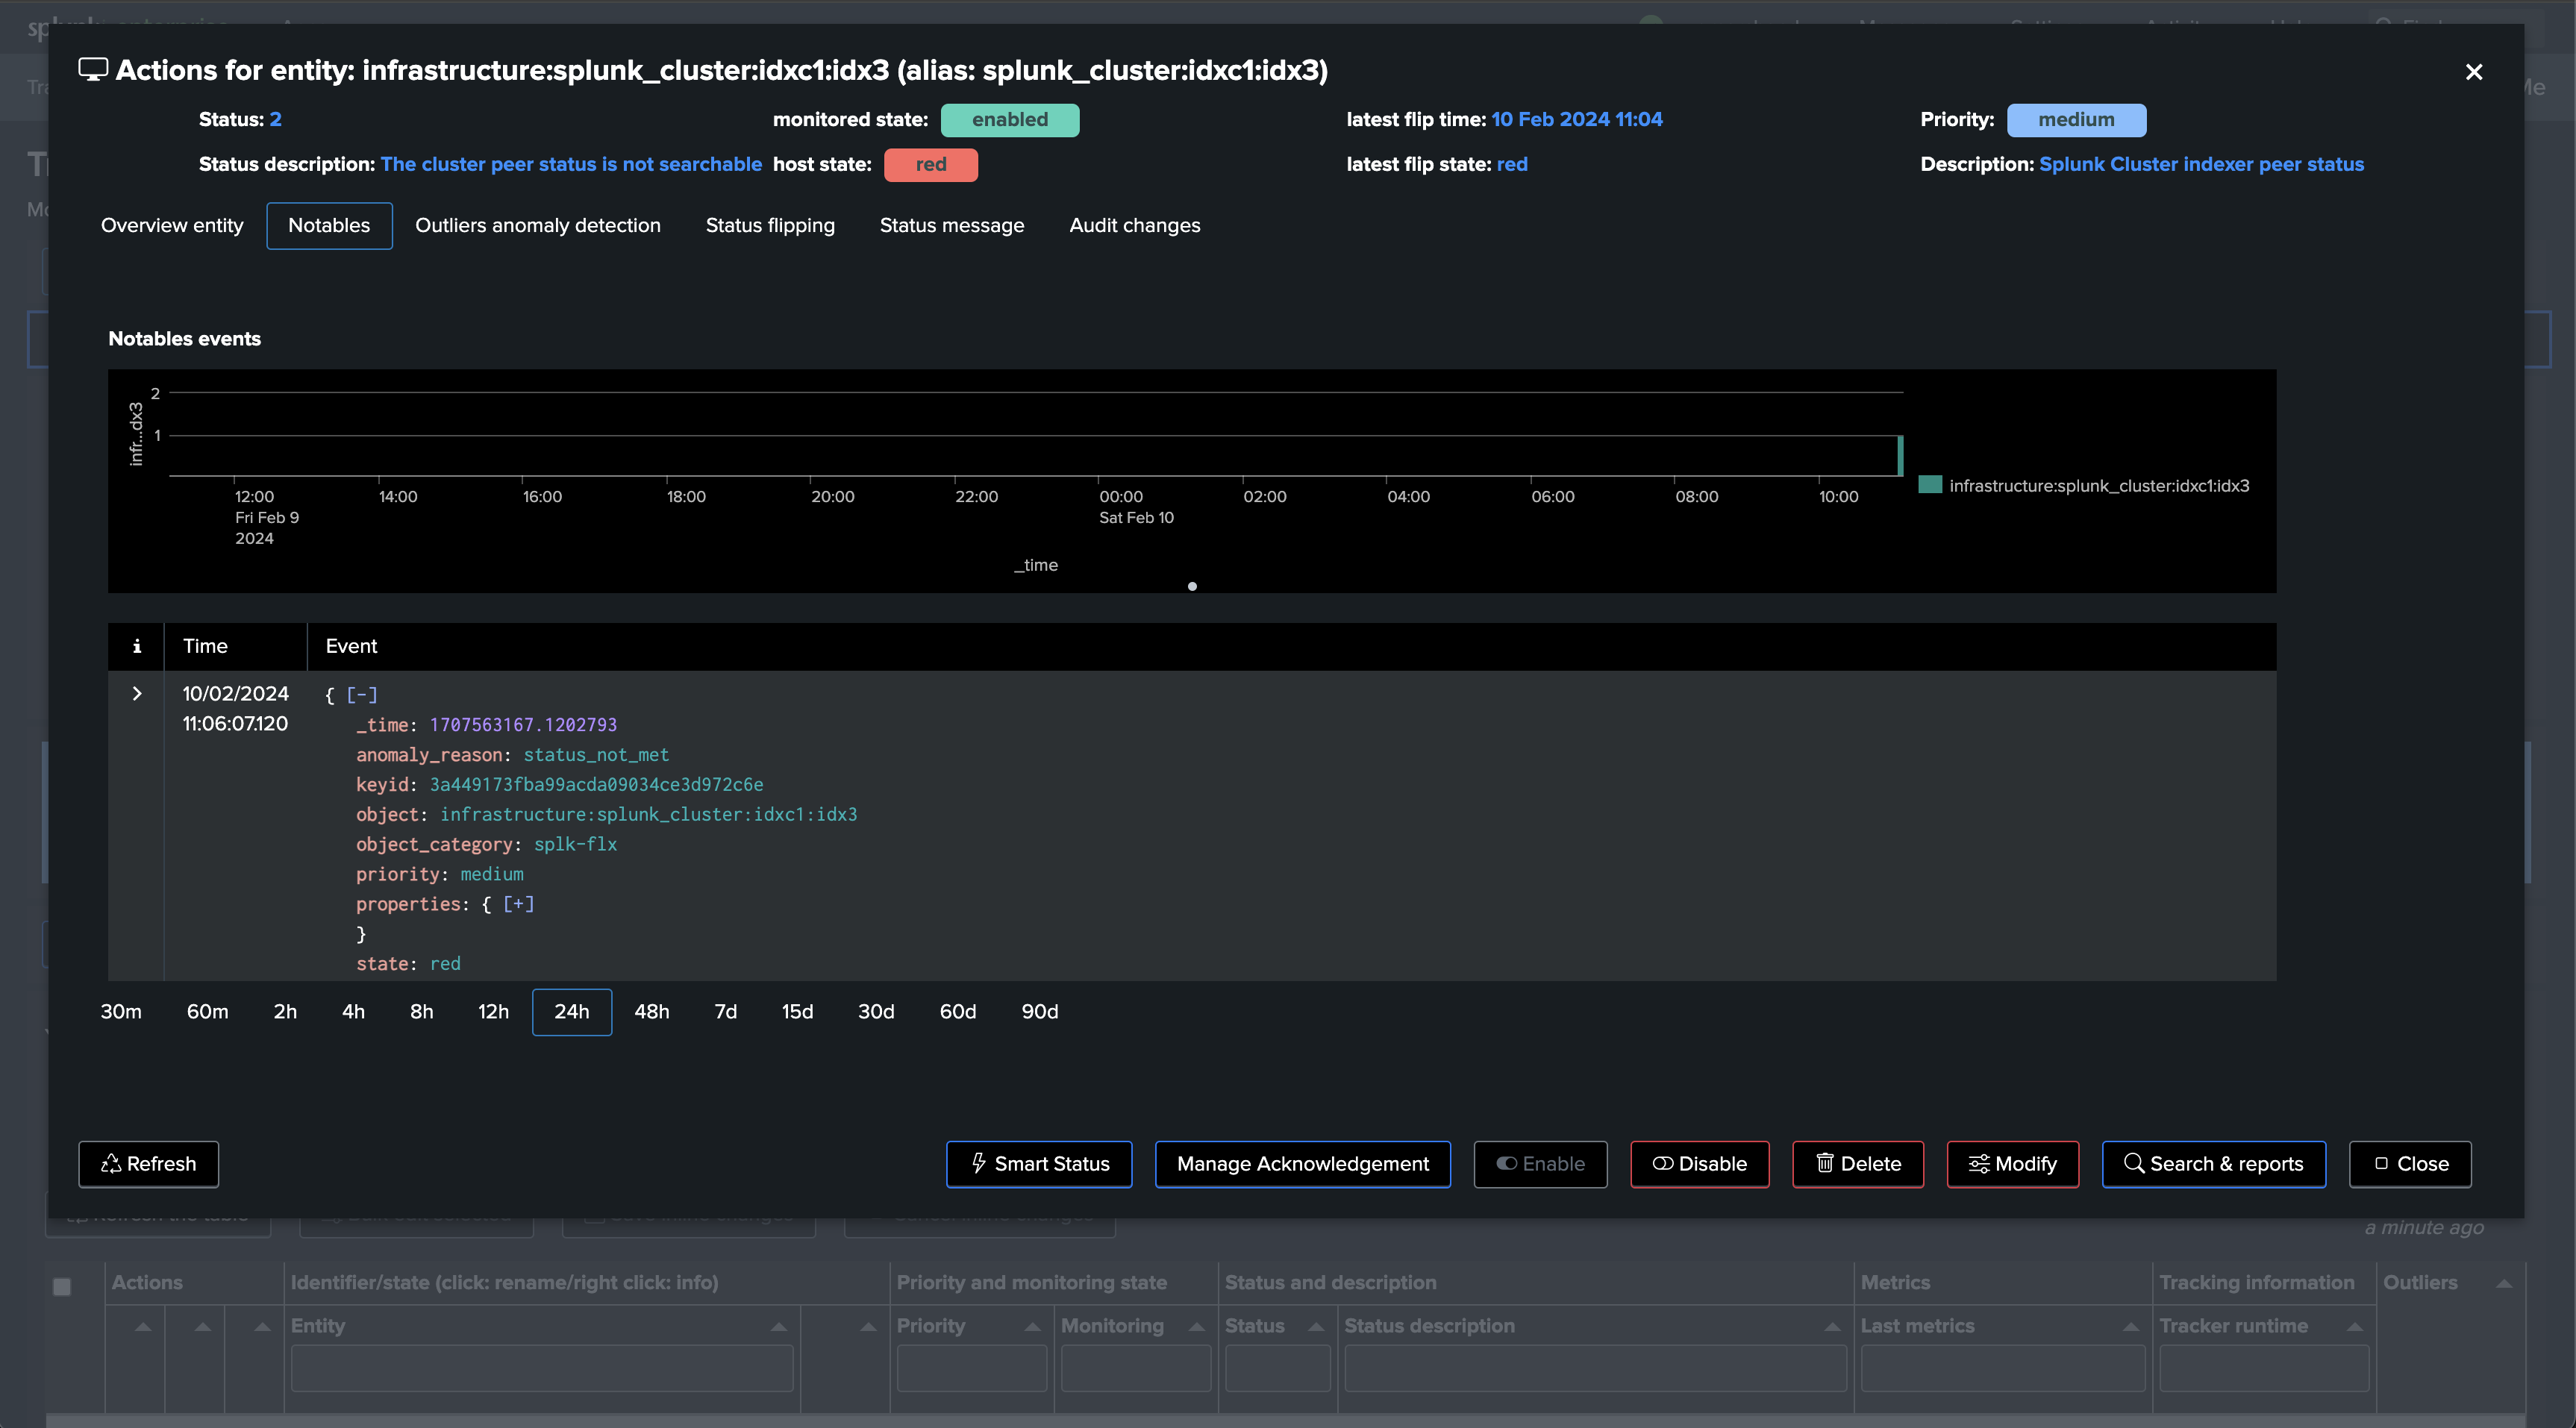
If a cluster peer goes down for any reason, the status of the TrackMe entity turns red and an alert is generated.
Let’s now create a second Flex Object tracker using the library with the use case “splk_splunk_enterprise_cluster_peers” which tracks the peers’ statuses individually.

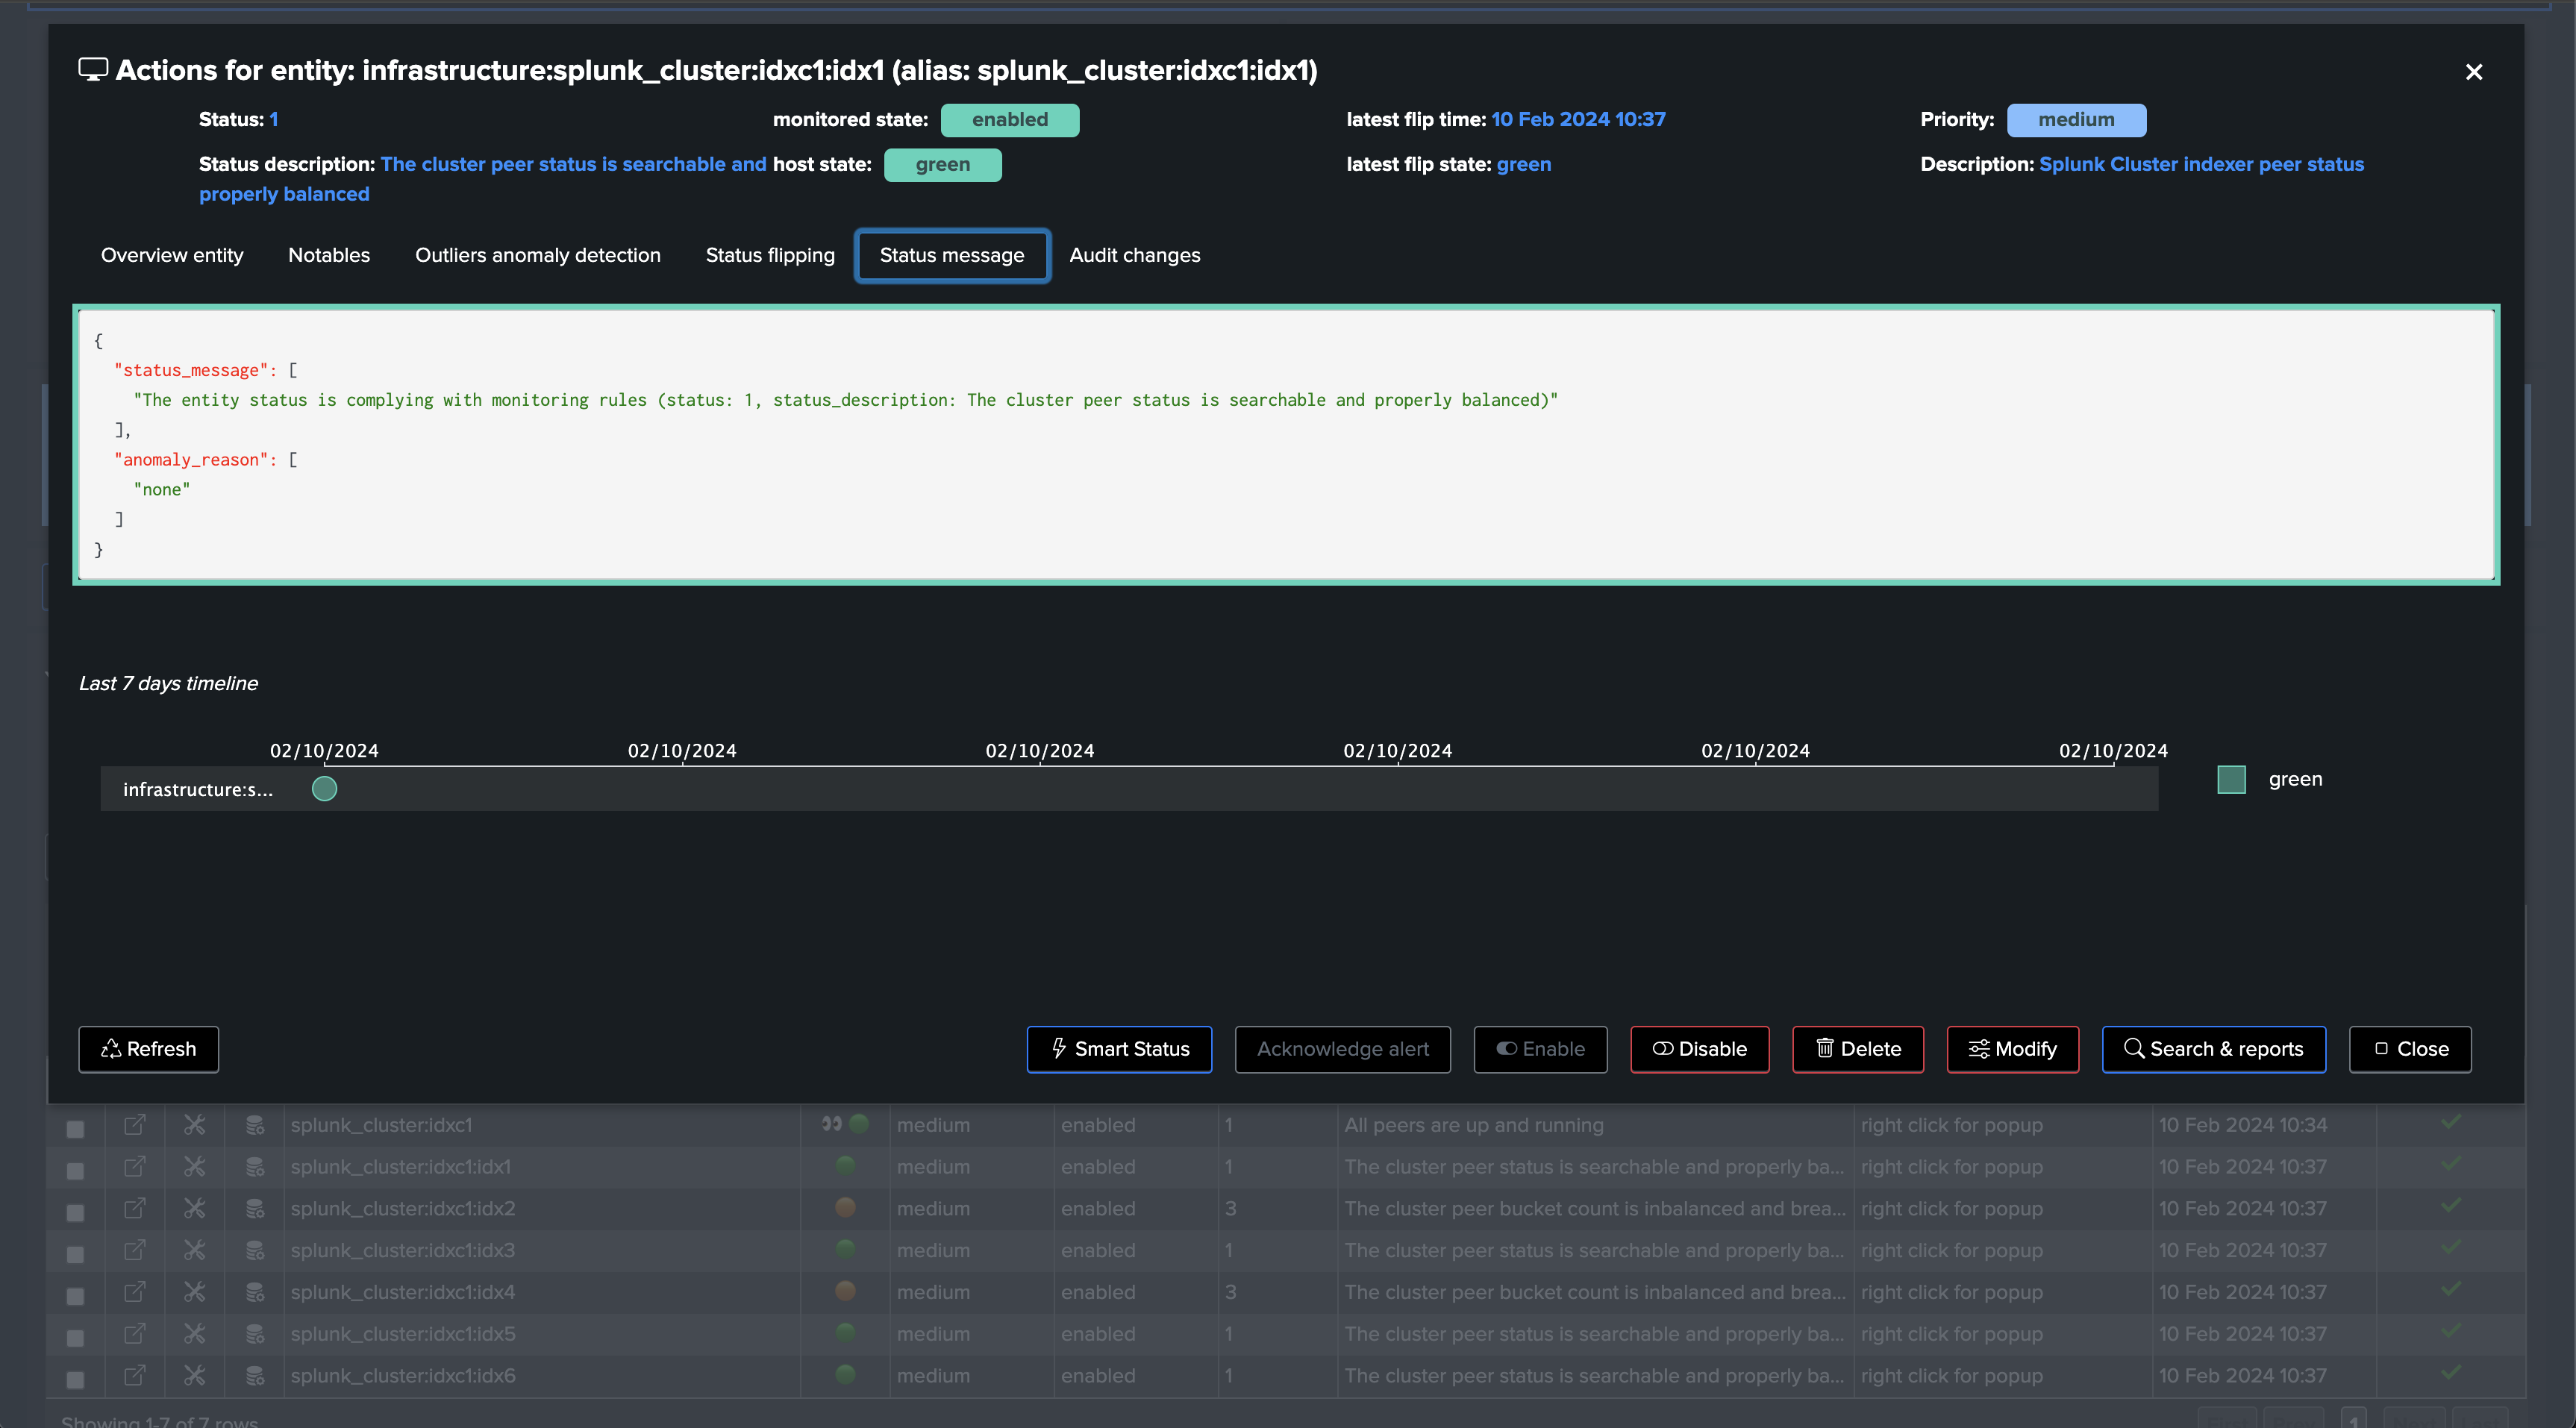
Once executed, one TrackMe entity is created per cluster peer, TrackMe starts monitoring the peer status and begins collecting main KPIs of interest for the peers.
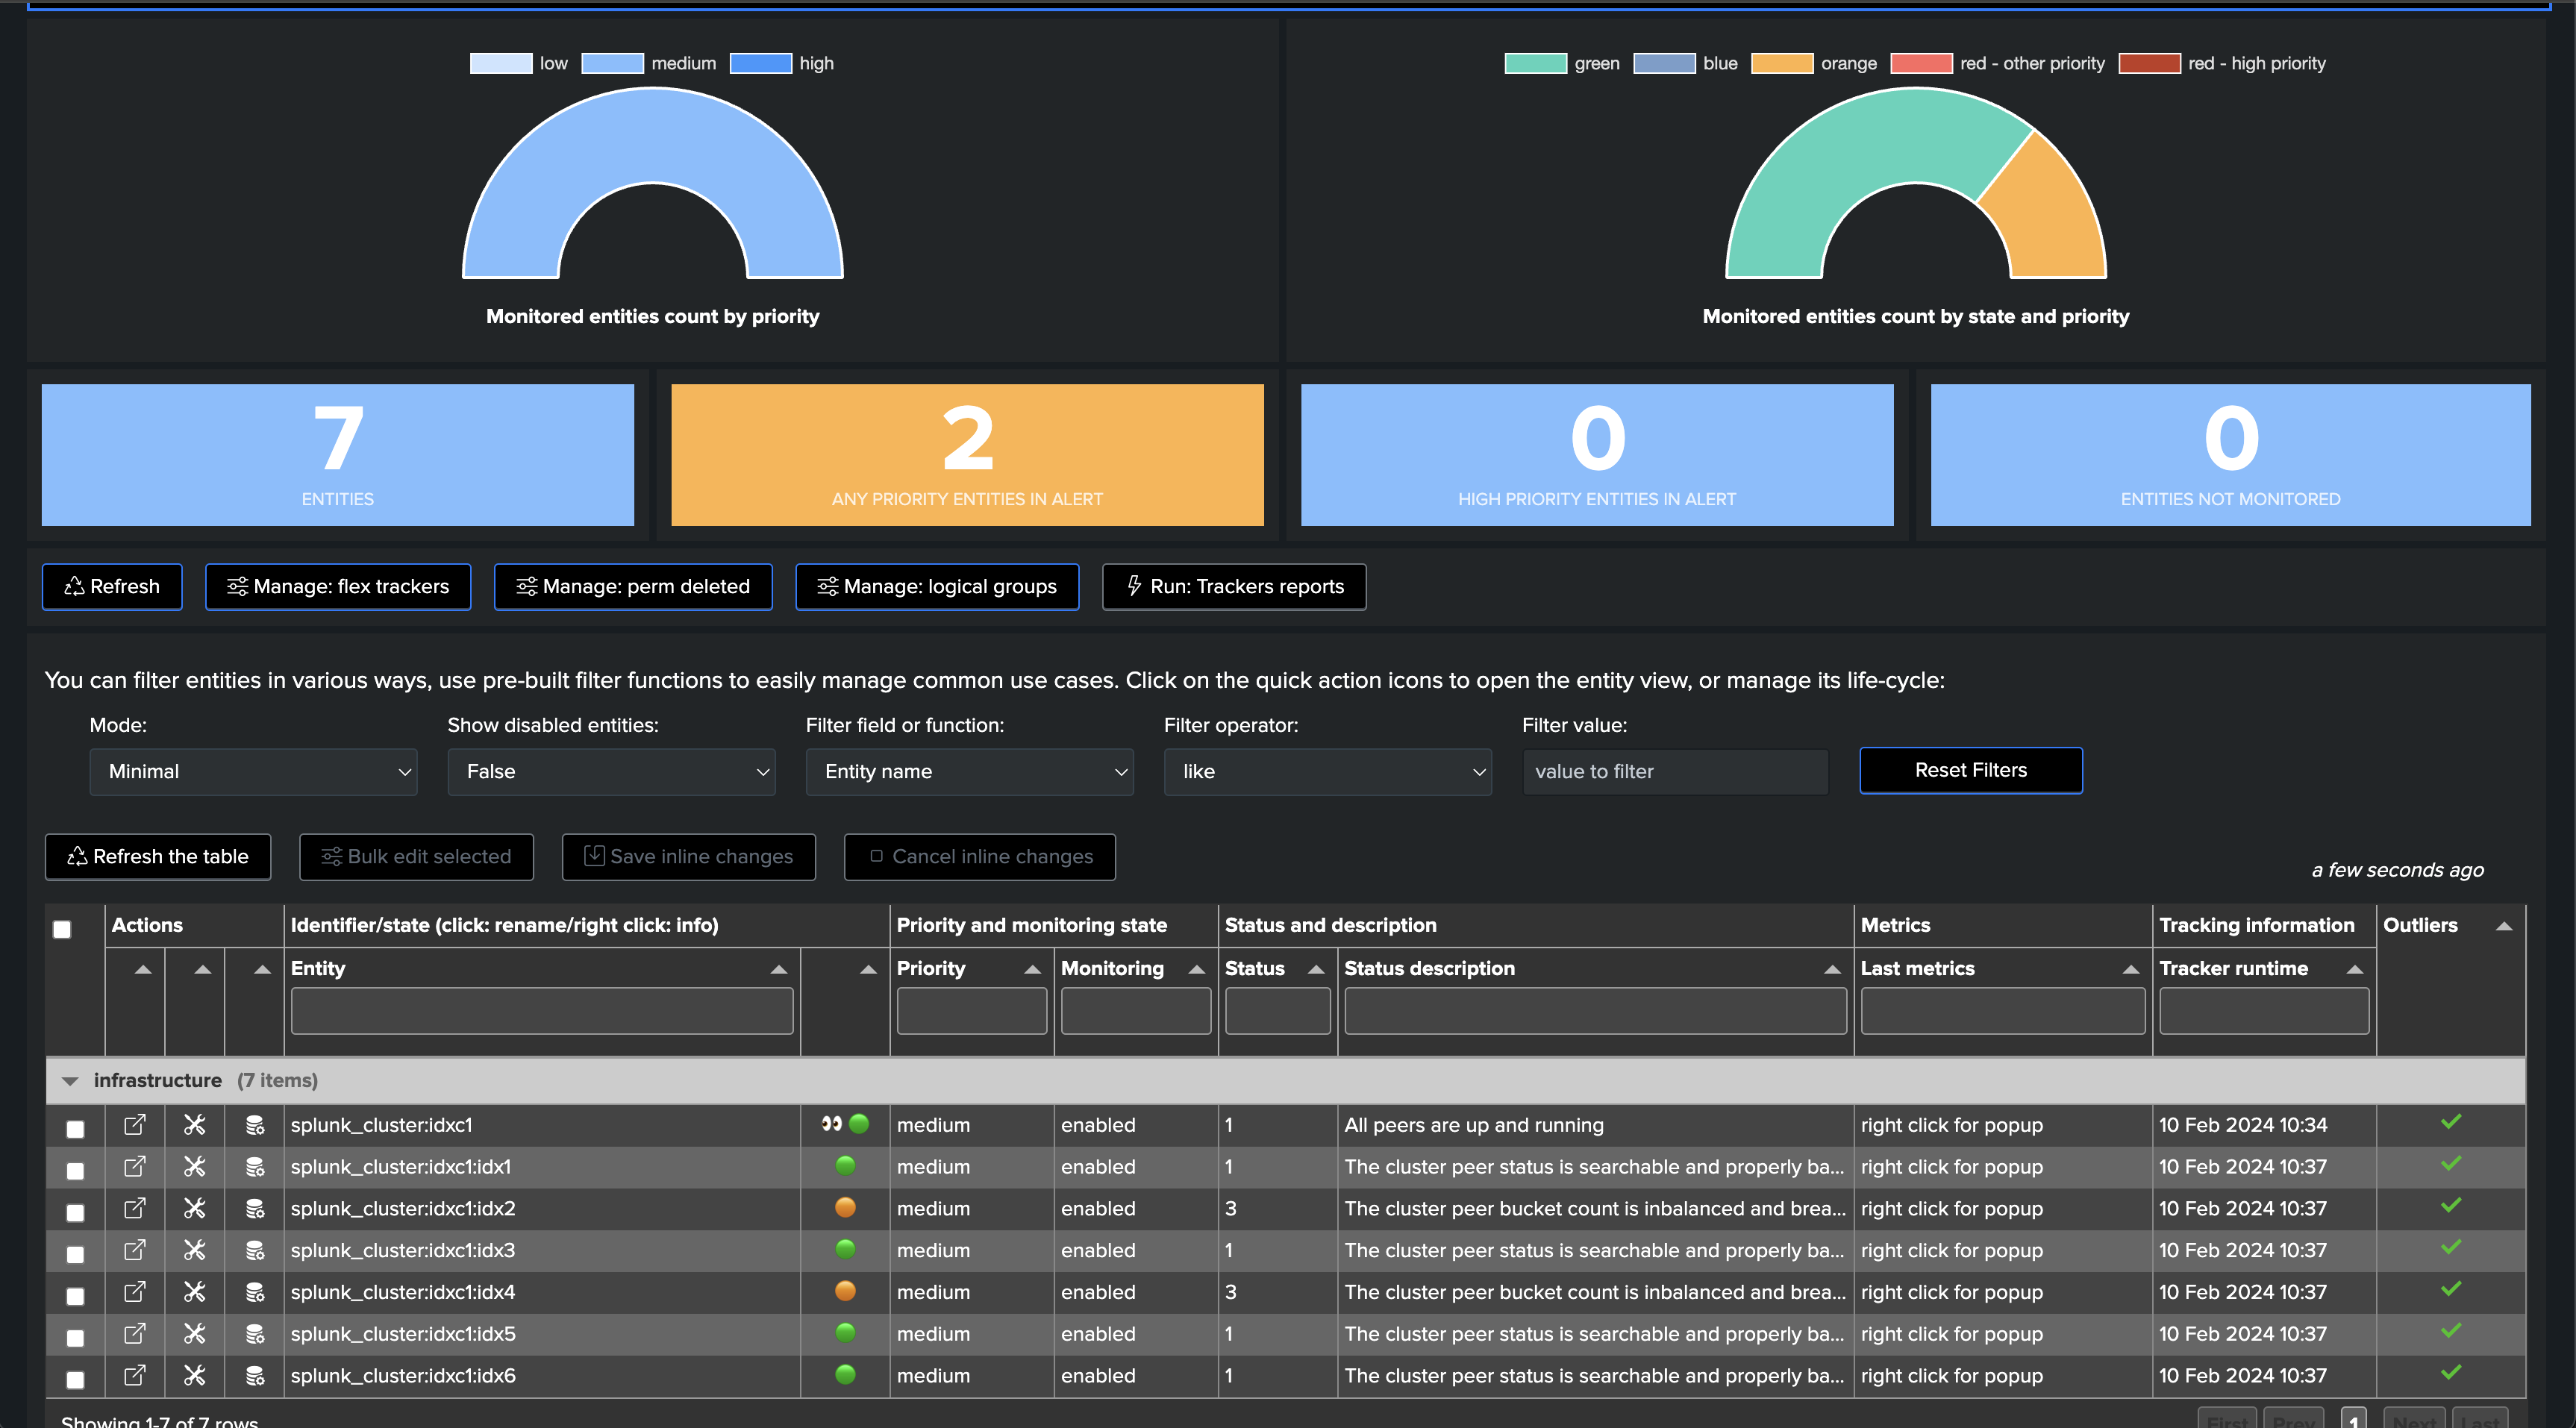
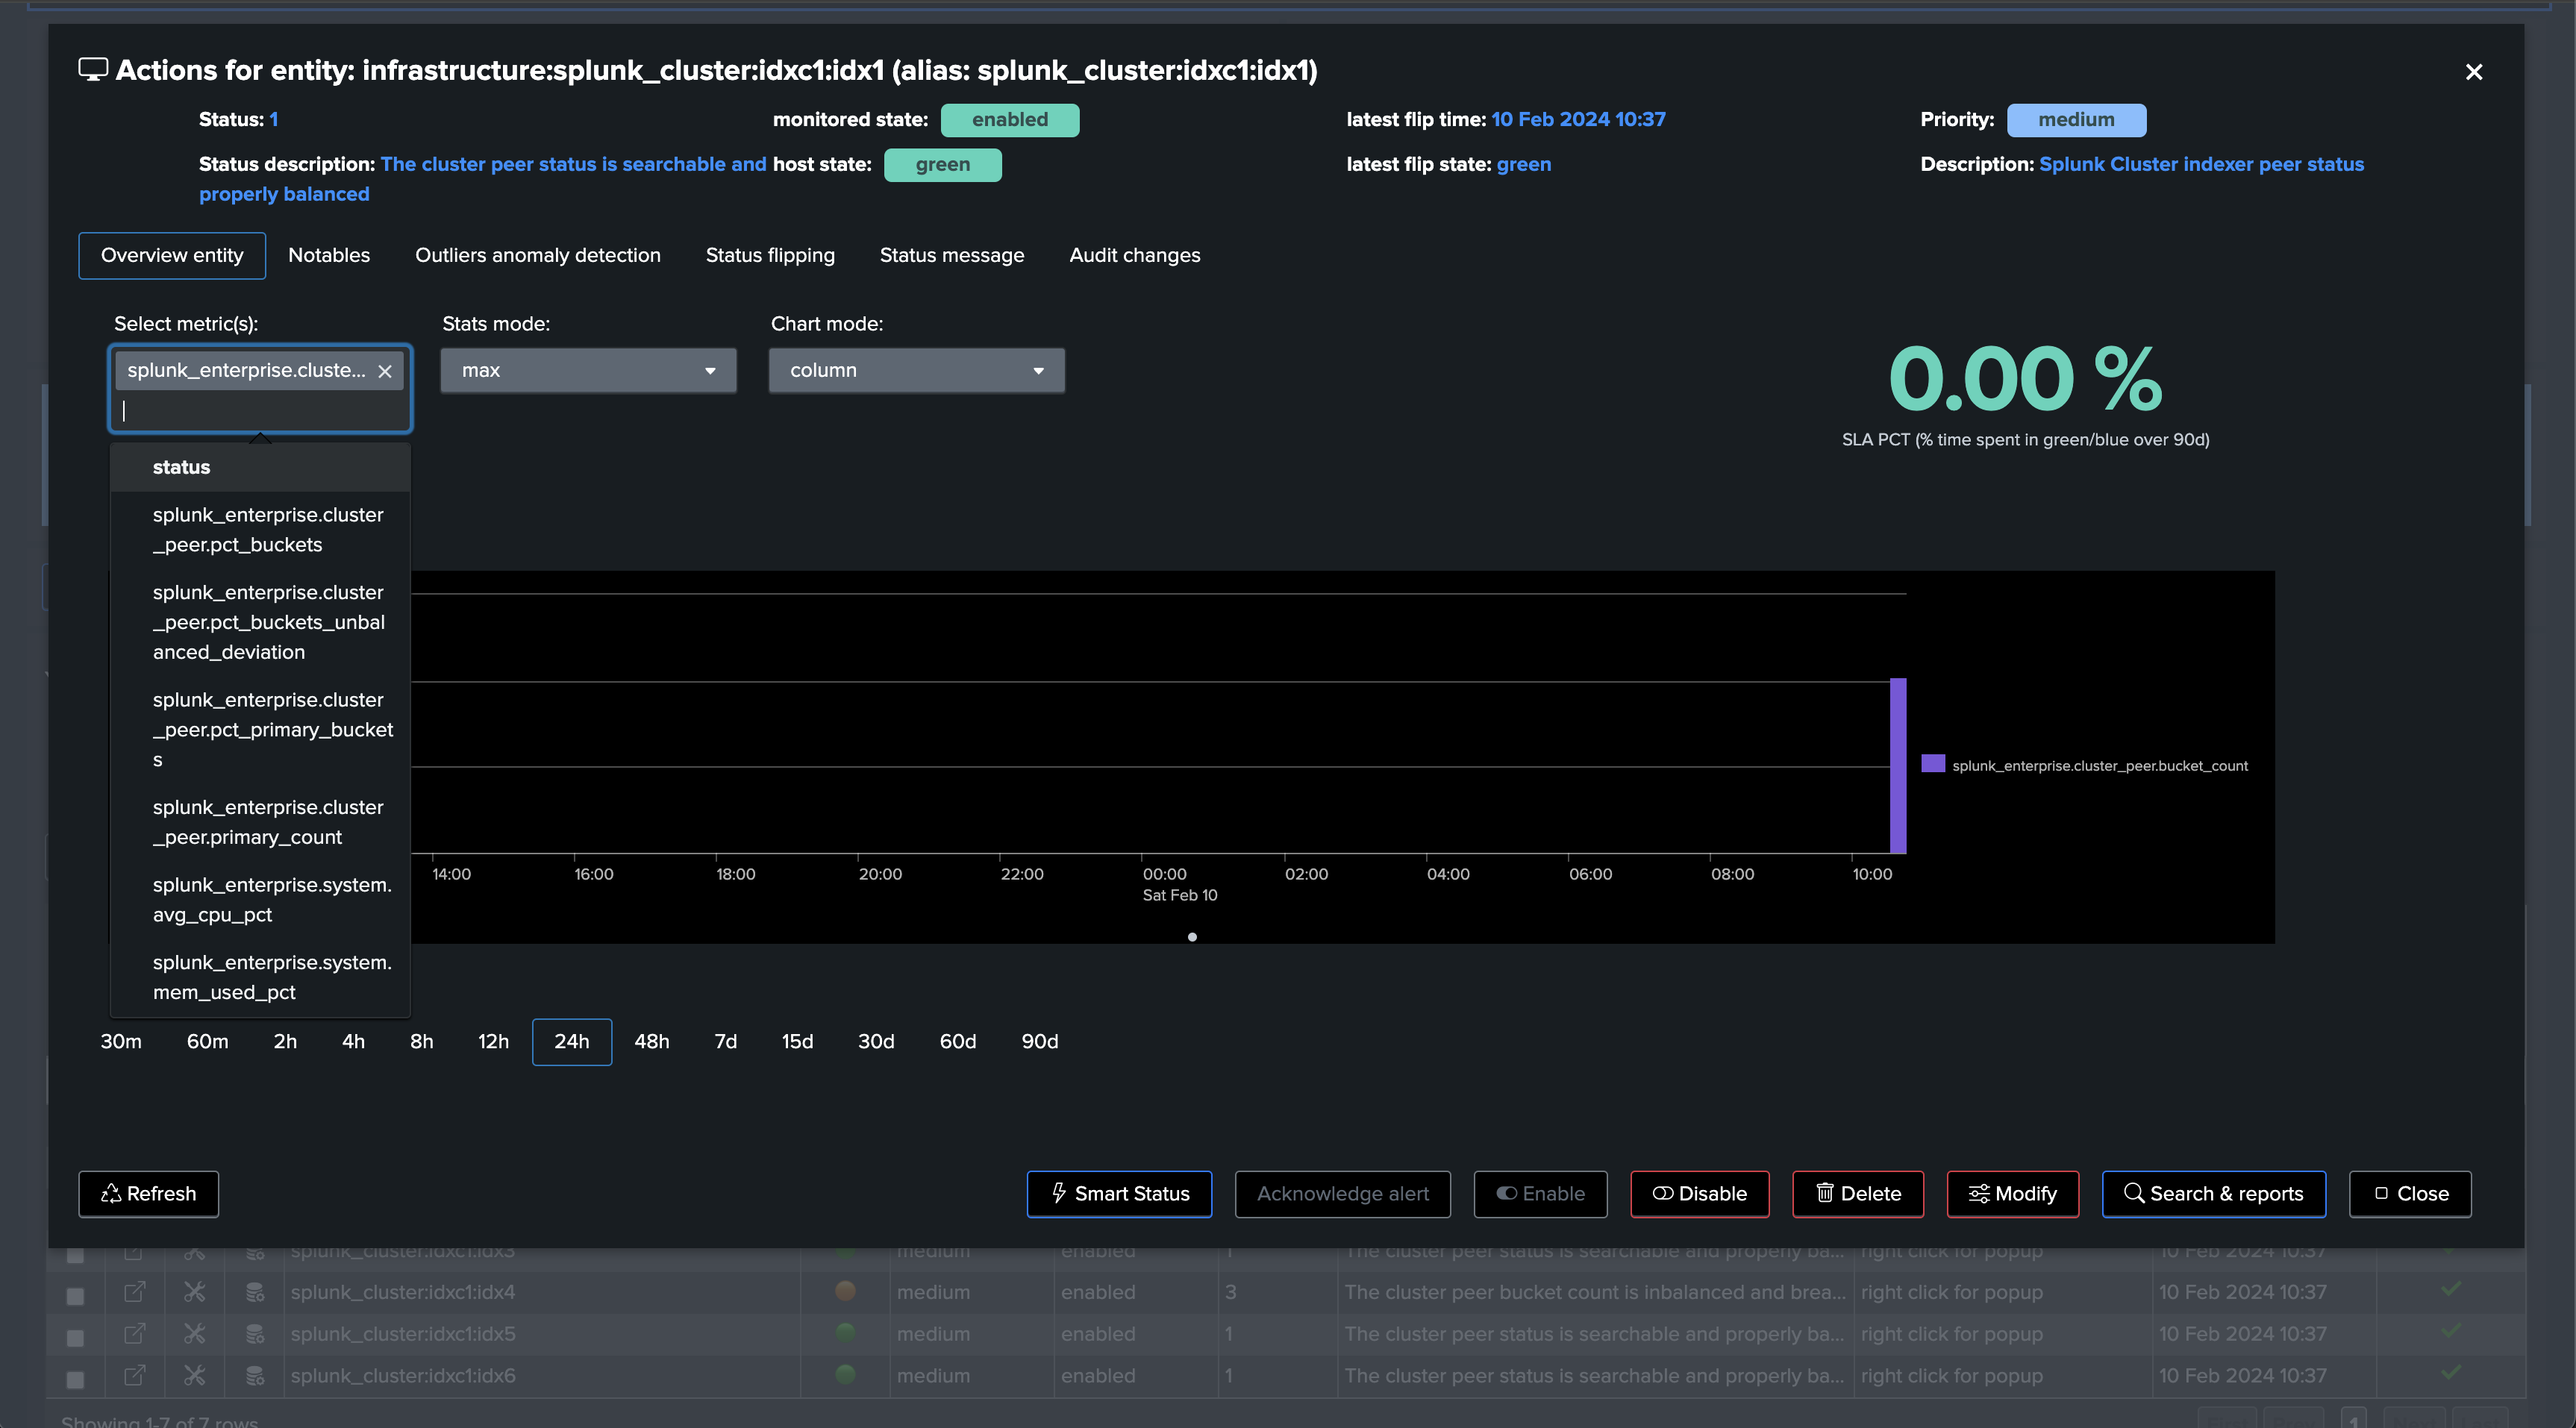
Notably, TrackMe monitors the distribution of the buckets within the members and alerts you when the distribution is not properly balanced between the members.

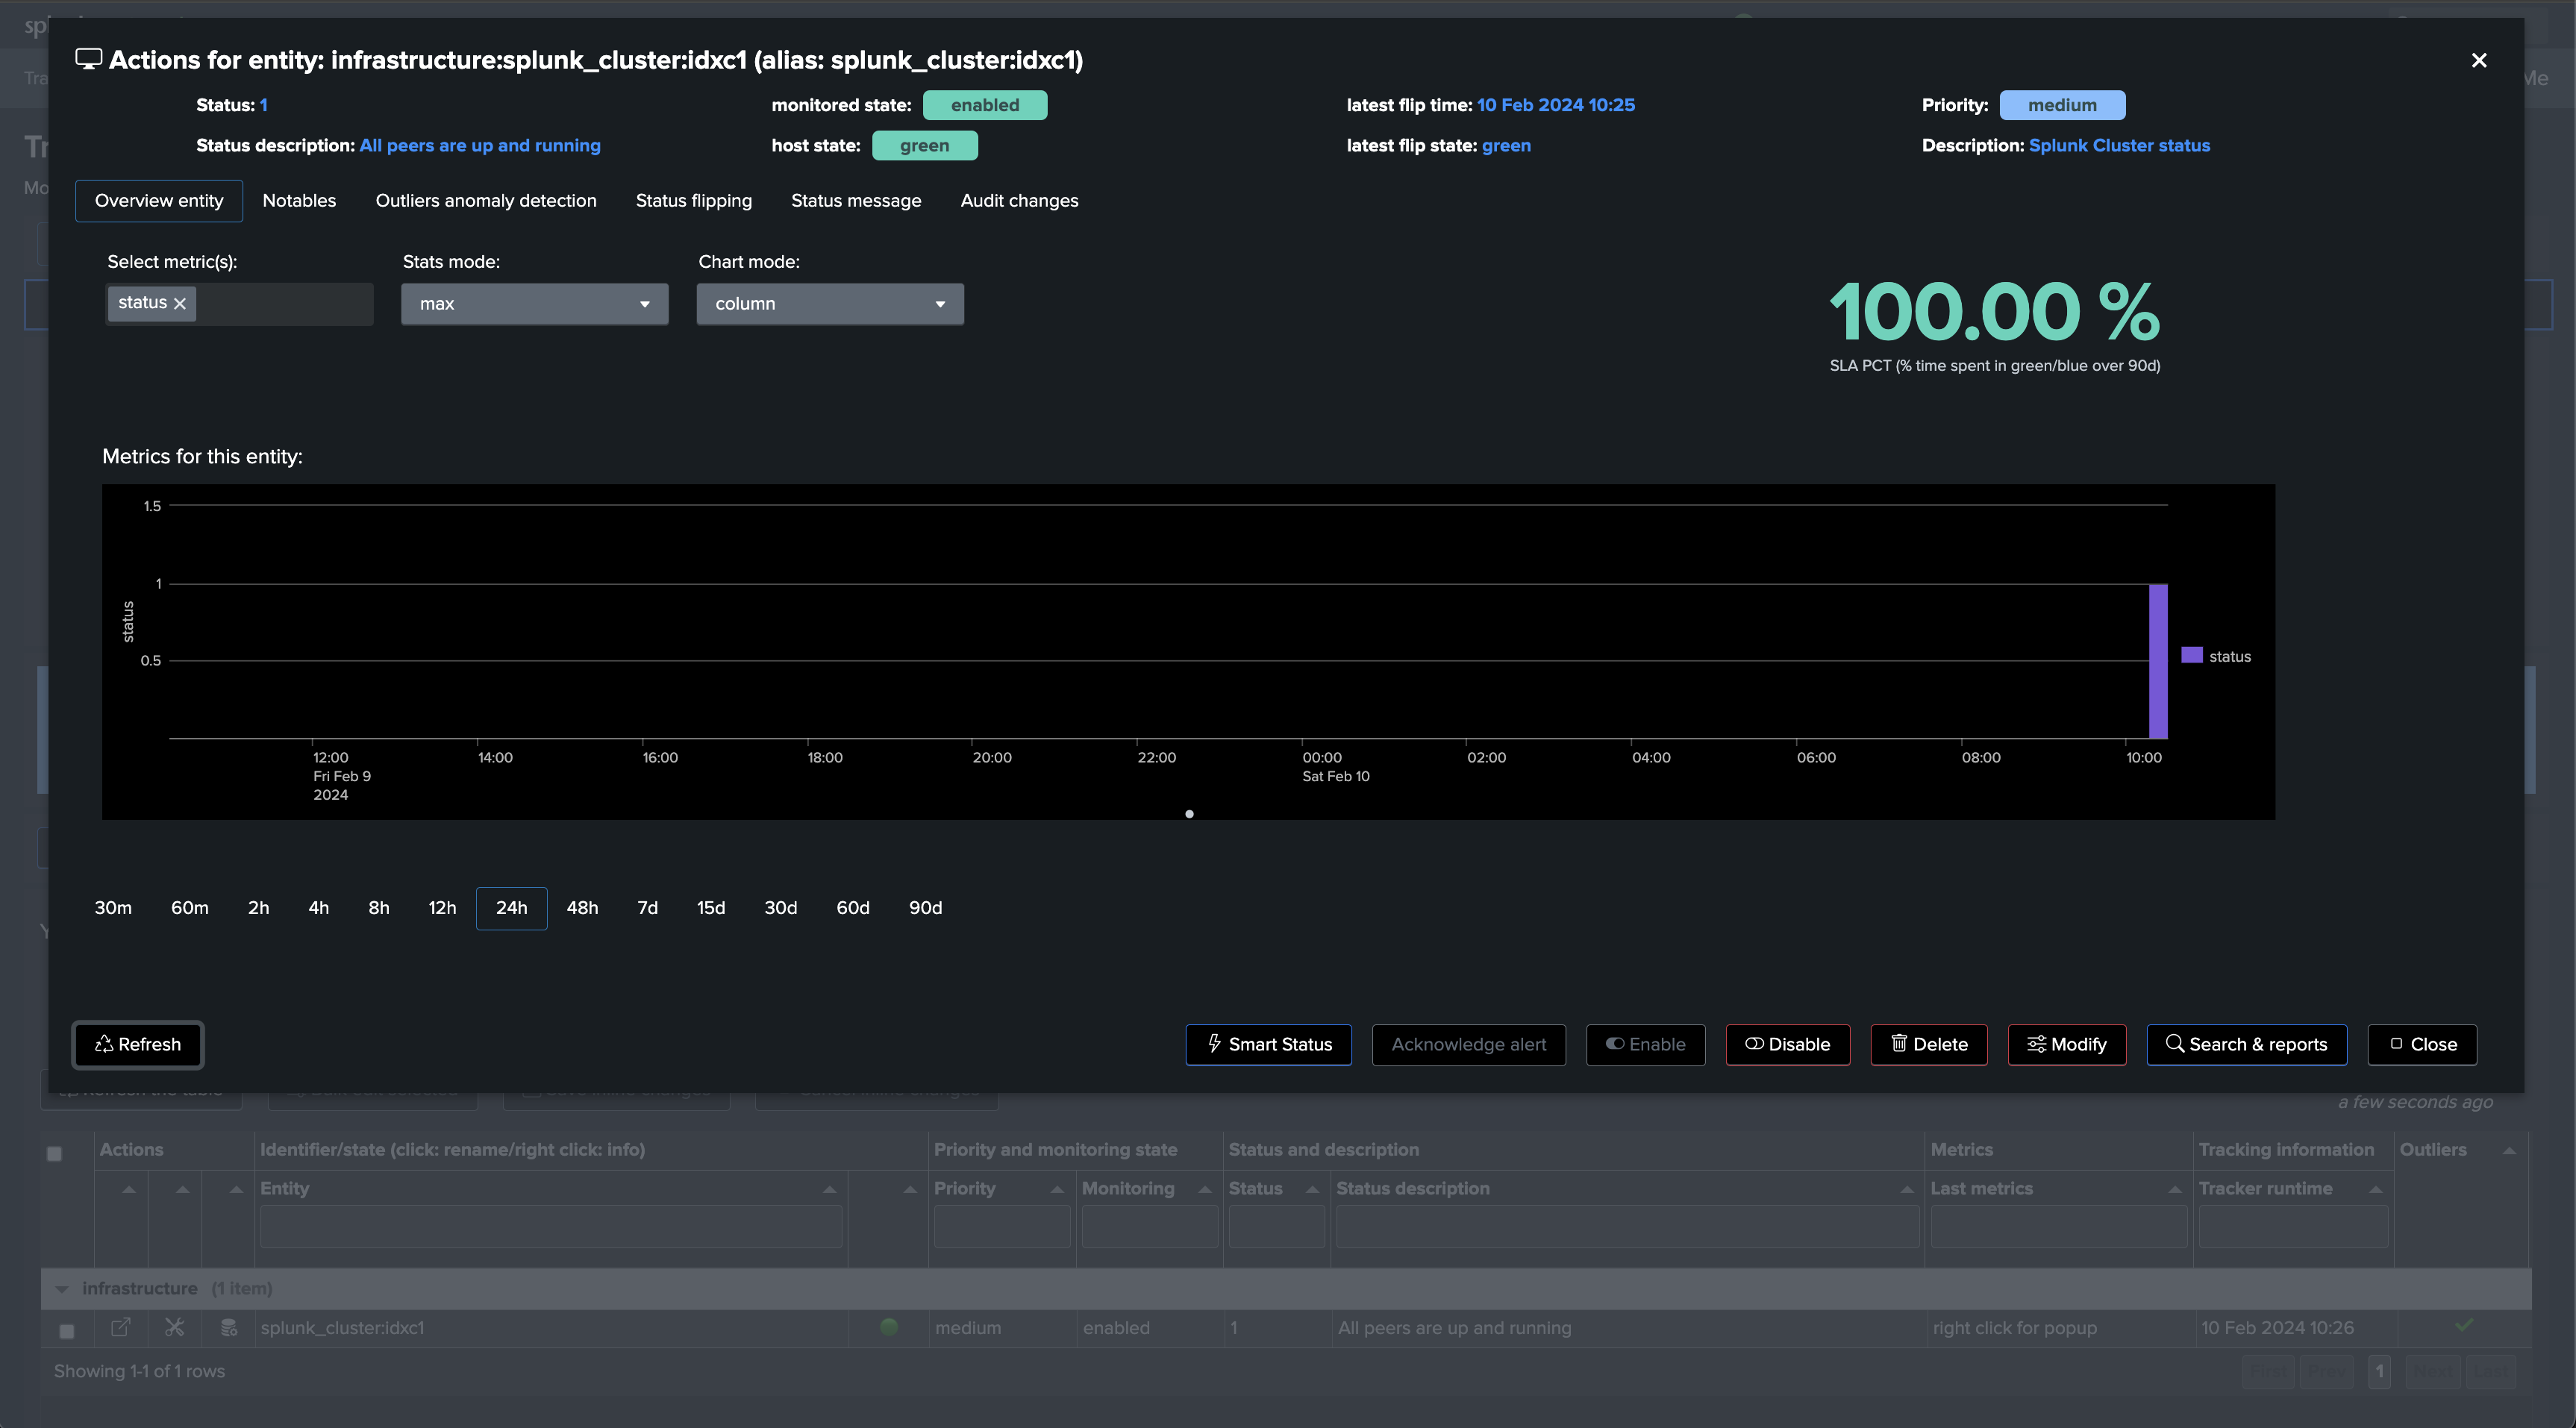
You now have a fully monitored Indexer Cluster, enabling TrackMe to continuously monitor the health of your Splunk Indexer Clusters, track SLA availability, and easily alert you when issues are detected on your Splunk indexers cluster(s) infrastructure.
Annex: Use cases definition (SPL)
Use case splk_splunk_enterprise_cluster_status
| rest splunk_server=local count=0 /services/cluster/master/status
| transpose
| rename column as field, "row 1" as value
| where value!=""
| eval combo = field . ":" . mvjoin(value, ",")
| fields combo
| rex field=combo "\.status:(?<peer_status>.*)"
| where isnotnull(peer_status)
| stats count as peers_count, count(eval(peer_status="Up")) as peers_up, count(eval(peer_status="Stopped")) as peers_down, count(eval(peer_status!="Up" AND peer_status!="Stopped")) as peers_unknown
| eval pct_cluster_availability=round(peers_up/peers_count*100, 2)
| appendcols [ | rest splunk_server=local /services/cluster/config/config | table cluster_label ] | filldown cluster_label
| fields cluster_label, pct*, *
| eval group="infrastructure"
| eval object = "splunk_cluster" . ":" . cluster_label
| eval object_description = "Splunk Cluster status"
| eval status=case(pct_cluster_availability>=99, 1, pct_cluster_availability<99, 2, 1=1, 3)
| eval status_description=case(status=1, "All peers are up and running",status=2, "Some peers are not Up, the cluster is not healthy", status=3, "The cluster status is unknown or not expected")
| eval metrics = "{\"splunk_enterprise.cluster.pct_cluster_availability\": " . pct_cluster_availability . ", \"splunk_enterprise.cluster.peers_count\": " . peers_count . ", \"splunk_enterprise.cluster.peers_up\": " . peers_up . ", \"splunk_enterprise.cluster.peers_down\": " . peers_down . ", \"splunk_enterprise.cluster.peers_unknown\": " . peers_unknown . "}"

``` alert if inactive for more than 3600 sec```
| eval max_sec_inactive=3600
Use case ‘splk_splunk_enterprise_cluster_peers’
| rest splunk_server=local count=0 /services/cluster/master/peers
| fields label site bucket_count is_searchable primary_count

``` aggreg ```
| eventstats sum(bucket_count) as total_bucket_count, dc(label) as dcount_peers

``` calculate percentage of buckets ```
| eval pct_buckets = round(bucket_count/total_bucket_count*100, 2), pct_primary_buckets = round(primary_count/total_bucket_count*100, 2), pct_ideal_buckets=round(100/dcount_peers, 2)
| eval pct_buckets_unbalanced_deviation = round(abs(pct_buckets - pct_ideal_buckets)/pct_ideal_buckets*100, 2)

``` set the cluster_label automatically ```
| appendcols [ | rest splunk_server=local /services/cluster/config/config | table cluster_label ] | filldown cluster_label

``` set group ```
| eval group="infrastructure"

``` set object, alias and object_description ```
| eval object = "splunk_cluster" . ":" . cluster_label . ":" . label, alias=object
| eval object_description = "Splunk Cluster indexer peer status"

``` set status, if the peer is not searchable, then it is red ```
| eval status=case(is_searchable=1, 1, is_searchable!=1, 2, 1=1, 3)

``` if the peer buckets deviation percentage is higher than 25%, then the peer is highly inbalanced, we set the status to yellow, but you can also set this to red if you prefer ```
| eval peer_is_balanced=if(pct_buckets_unbalanced_deviation>25, 0, 1)
``` yellow if breached, set to red if preferred ```
| eval status=if(peer_is_balanced!=1, 3, status)

``` join external CPU metrics ```
| join type=outer label [ search index=_introspection sourcetype=splunk_resource_usage component=Hostwide
| eval cpu_total_pct=('data.cpu_system_pct'+'data.cpu_user_pct'), mem_used_pct=('data.mem_used'/'data.mem'*100)
| stats avg(cpu_total_pct) as avg_cpu_pct, avg(mem_used_pct) as mem_used_pct by host
| eval avg_cpu_pct=round(avg_cpu_pct, 2), mem_used_pct=round(mem_used_pct, 2) | rename host as label ]
| eval avg_cpu_pct=if(isnum(avg_cpu_pct), avg_cpu_pct, 0), mem_used_pct=if(isnum(mem_used_pct), mem_used_pct, 0)

``` set status_description ```
| eval status_description=case(
status=1 AND is_searchable=1 AND pct_buckets_unbalanced_deviation<=25, "The cluster peer status is searchable and properly balanced",
status=2 AND is_searchable!=1, "The cluster peer status is not searchable",
(status=2 OR status=3) AND peer_is_balanced!=1, "The cluster peer bucket count is inbalanced and breaching the max threshold, pct_buckets_unbalanced_deviation: " . pct_buckets_unbalanced_deviation . " %, pct_buckets: " . pct_buckets . " %",
status=3, "The cluster peer status is unknown or not expected"
)

``` set metrics ```
| eval metrics = "{\"splunk_enterprise.cluster_peer.pct_buckets\": " . pct_buckets . ", \"splunk_enterprise.cluster_peer.pct_primary_buckets\": " . pct_primary_buckets . ", \"splunk_enterprise.cluster_peer.bucket_count\": " . bucket_count . ", \"splunk_enterprise.cluster_peer.primary_count\": " . primary_count . ", \"splunk_enterprise.cluster_peer.pct_buckets_unbalanced_deviation\":" . pct_buckets_unbalanced_deviation . ", \"splunk_enterprise.system.avg_cpu_pct\": " . avg_cpu_pct  . ", \"splunk_enterprise.system.mem_used_pct\": " . mem_used_pct . "}"

``` alert if inactive for more than 3600 sec```
| eval max_sec_inactive=3600