Splunk Feeds Thresholds (splk-feeds)
1. Introduction
In TrackMe, Splunk feeds latency and delay Key Performance Indicators (KPI) are continuously monitored.
When a given entity breaches the predefined threshold values, this impacts the state of the entity, and depending on the configuration, the entity status will turn red, potentially leading to an alert being emitted by TrackMe.
By default, TrackMe applies a 1-hour maximal threshold (3600 seconds) in both cases.
The purpose of this documentation is to describe the options that TrackMe provides to configure the threshold values accordingly.
2. Reviewing Current Thresholds
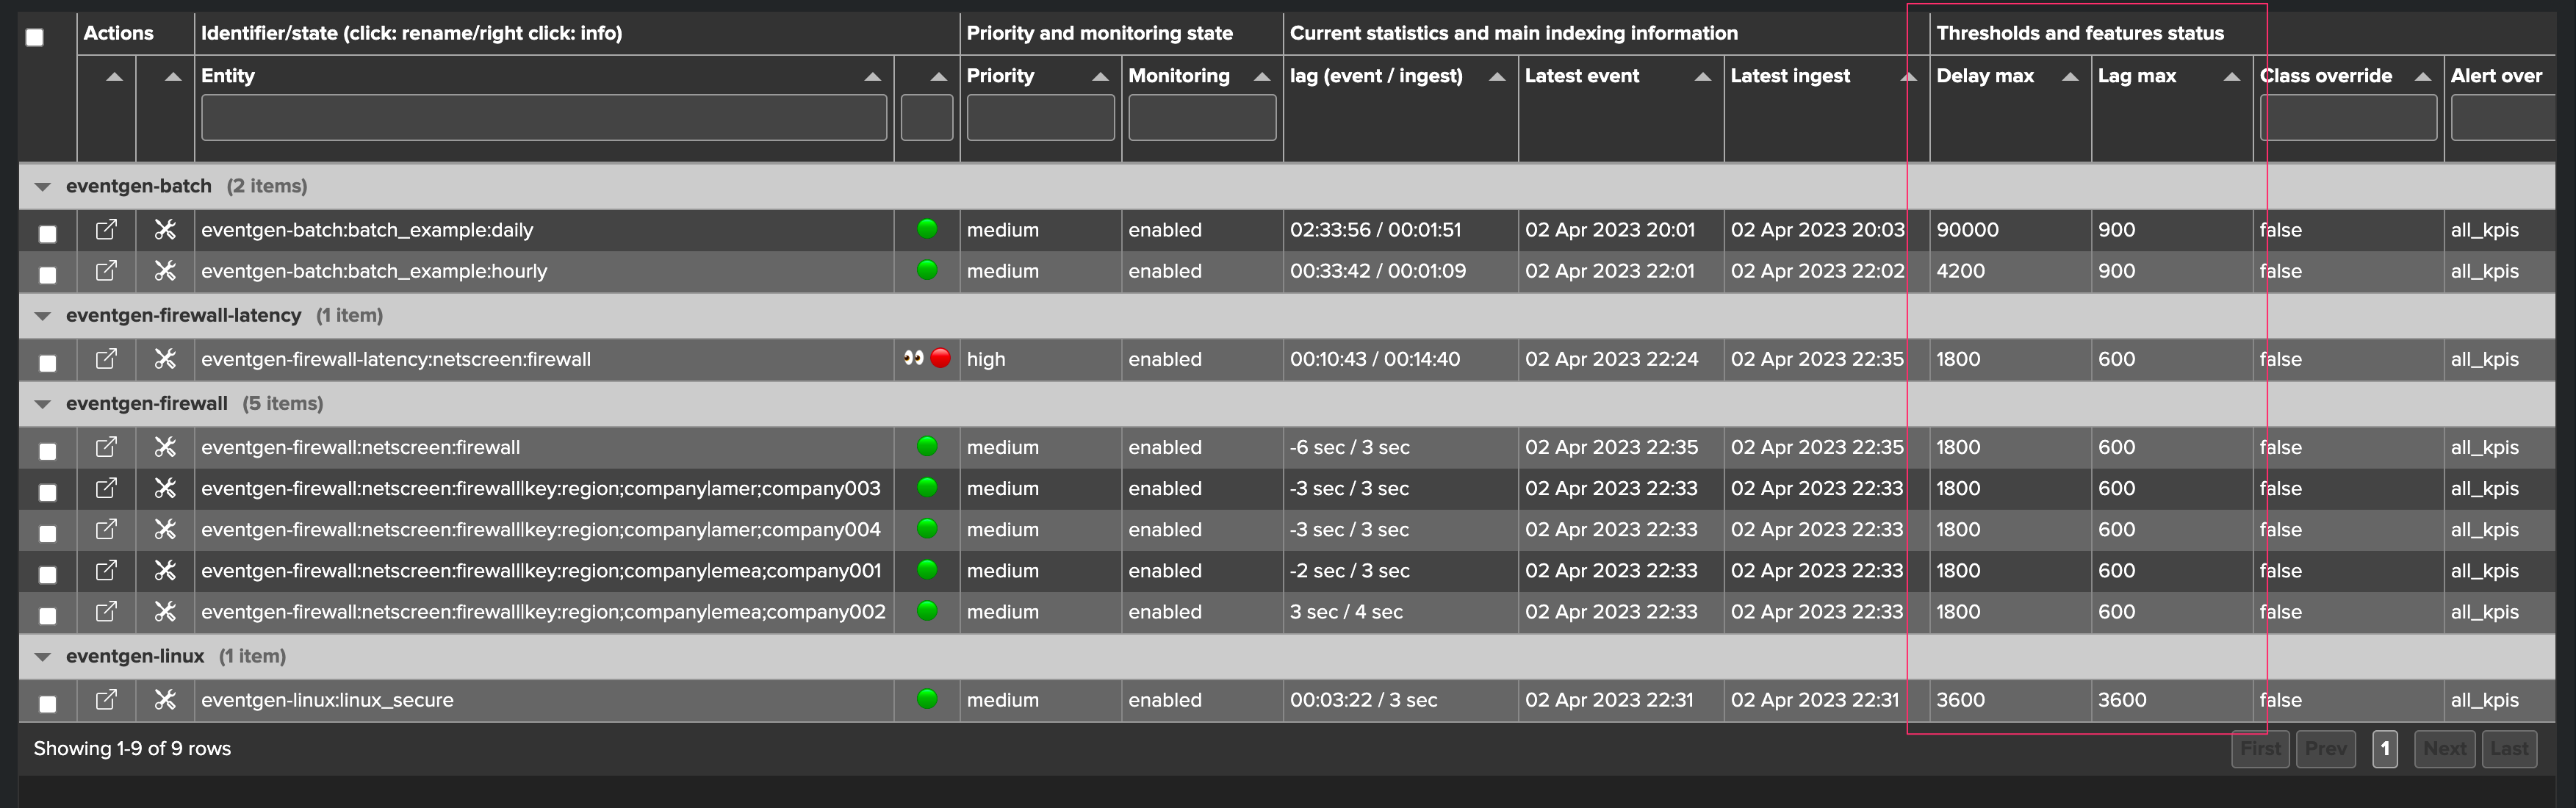
Currently set thresholds are shown in different parts of the TrackMe main user interface:
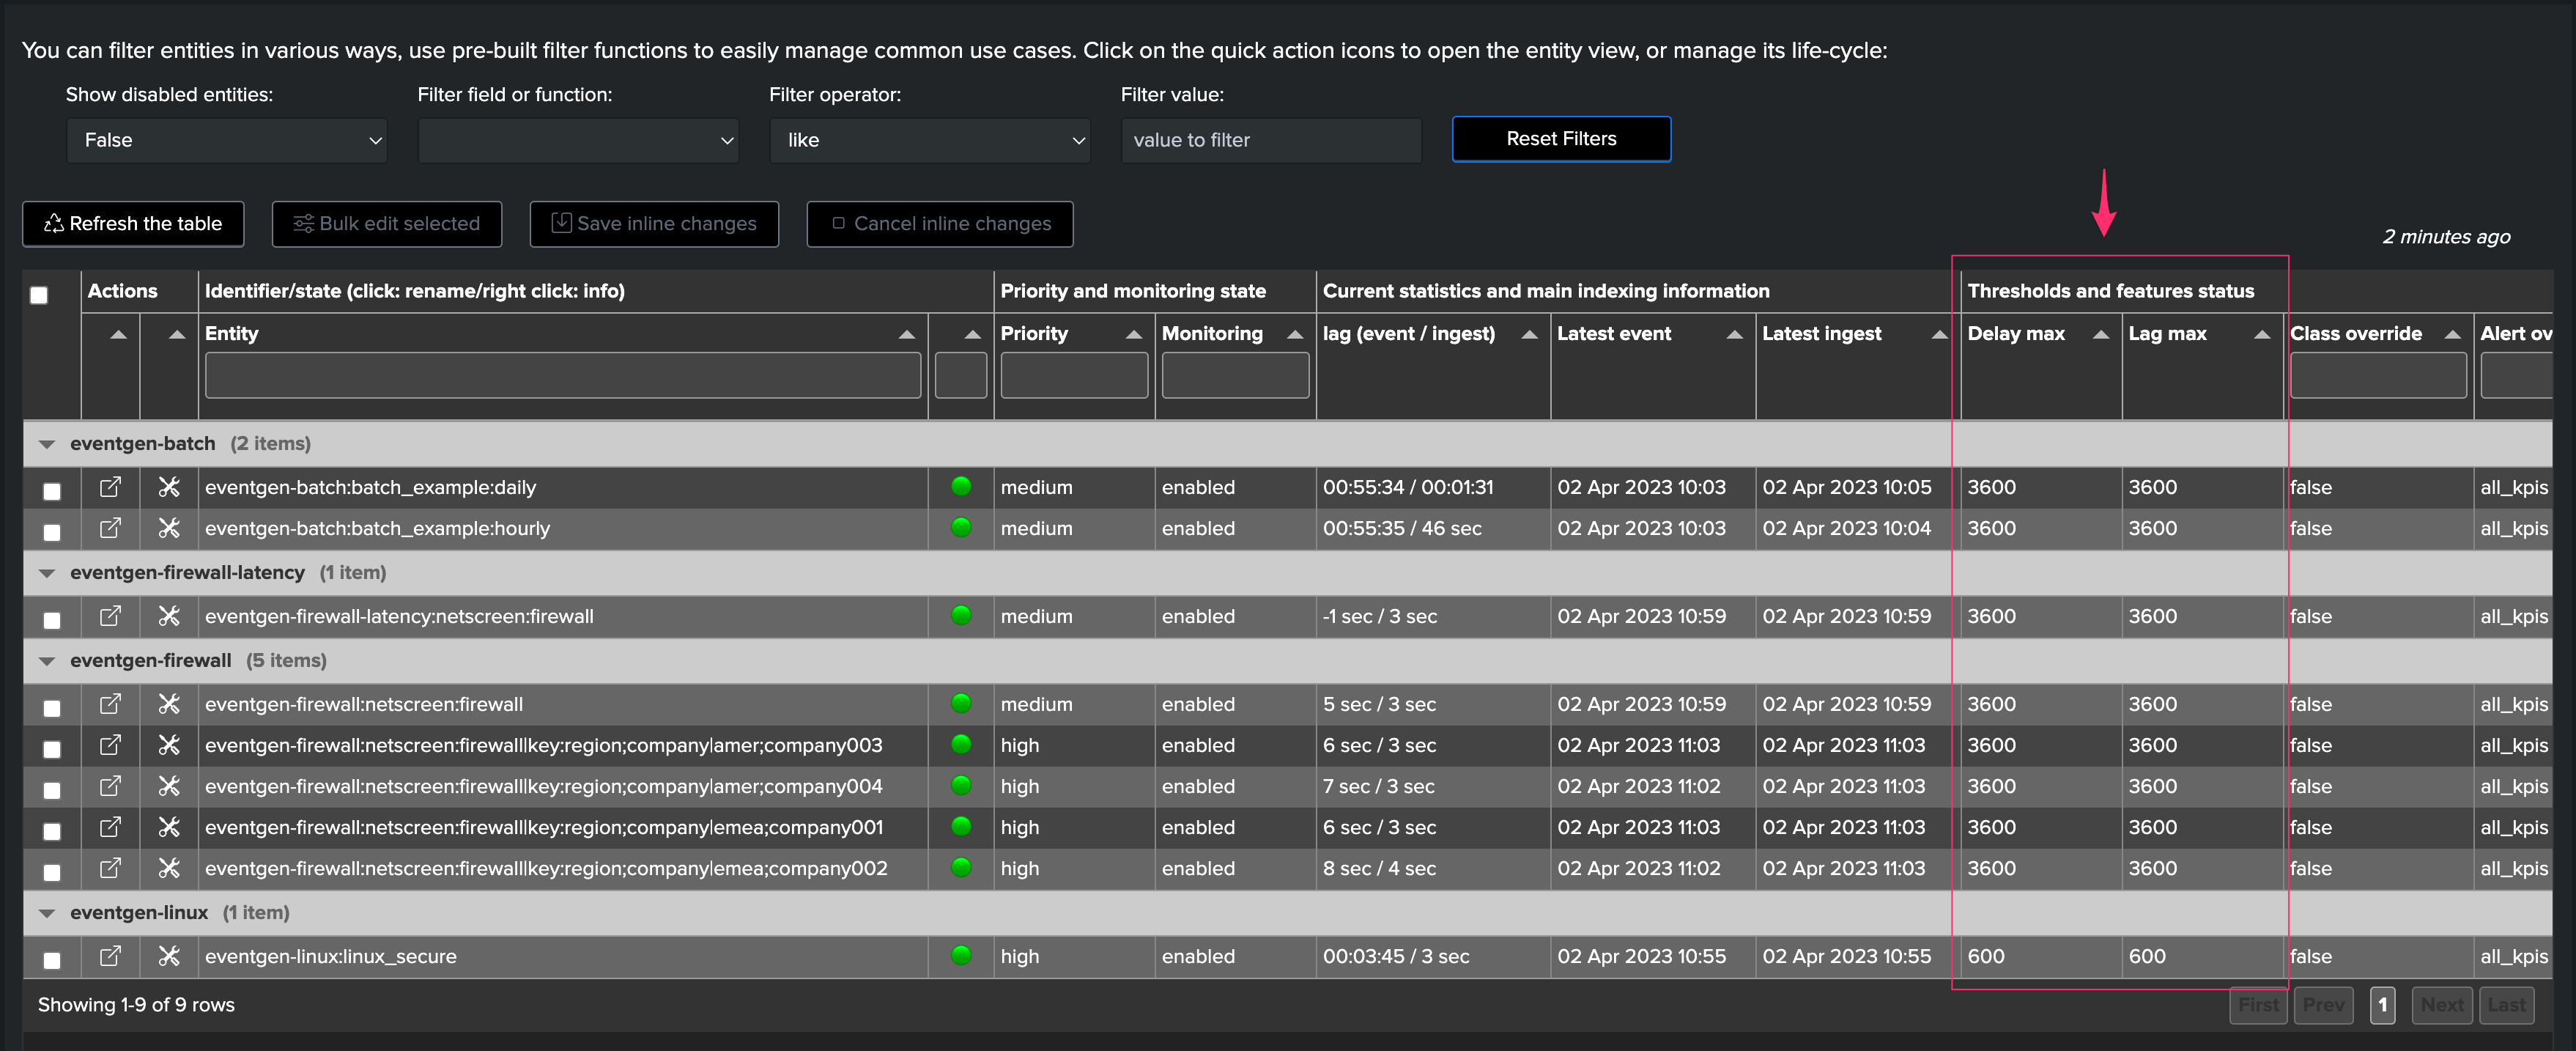
In the main user interface of the Virtual Tenant, the Tabulator shows a two-column element showing both threshold values
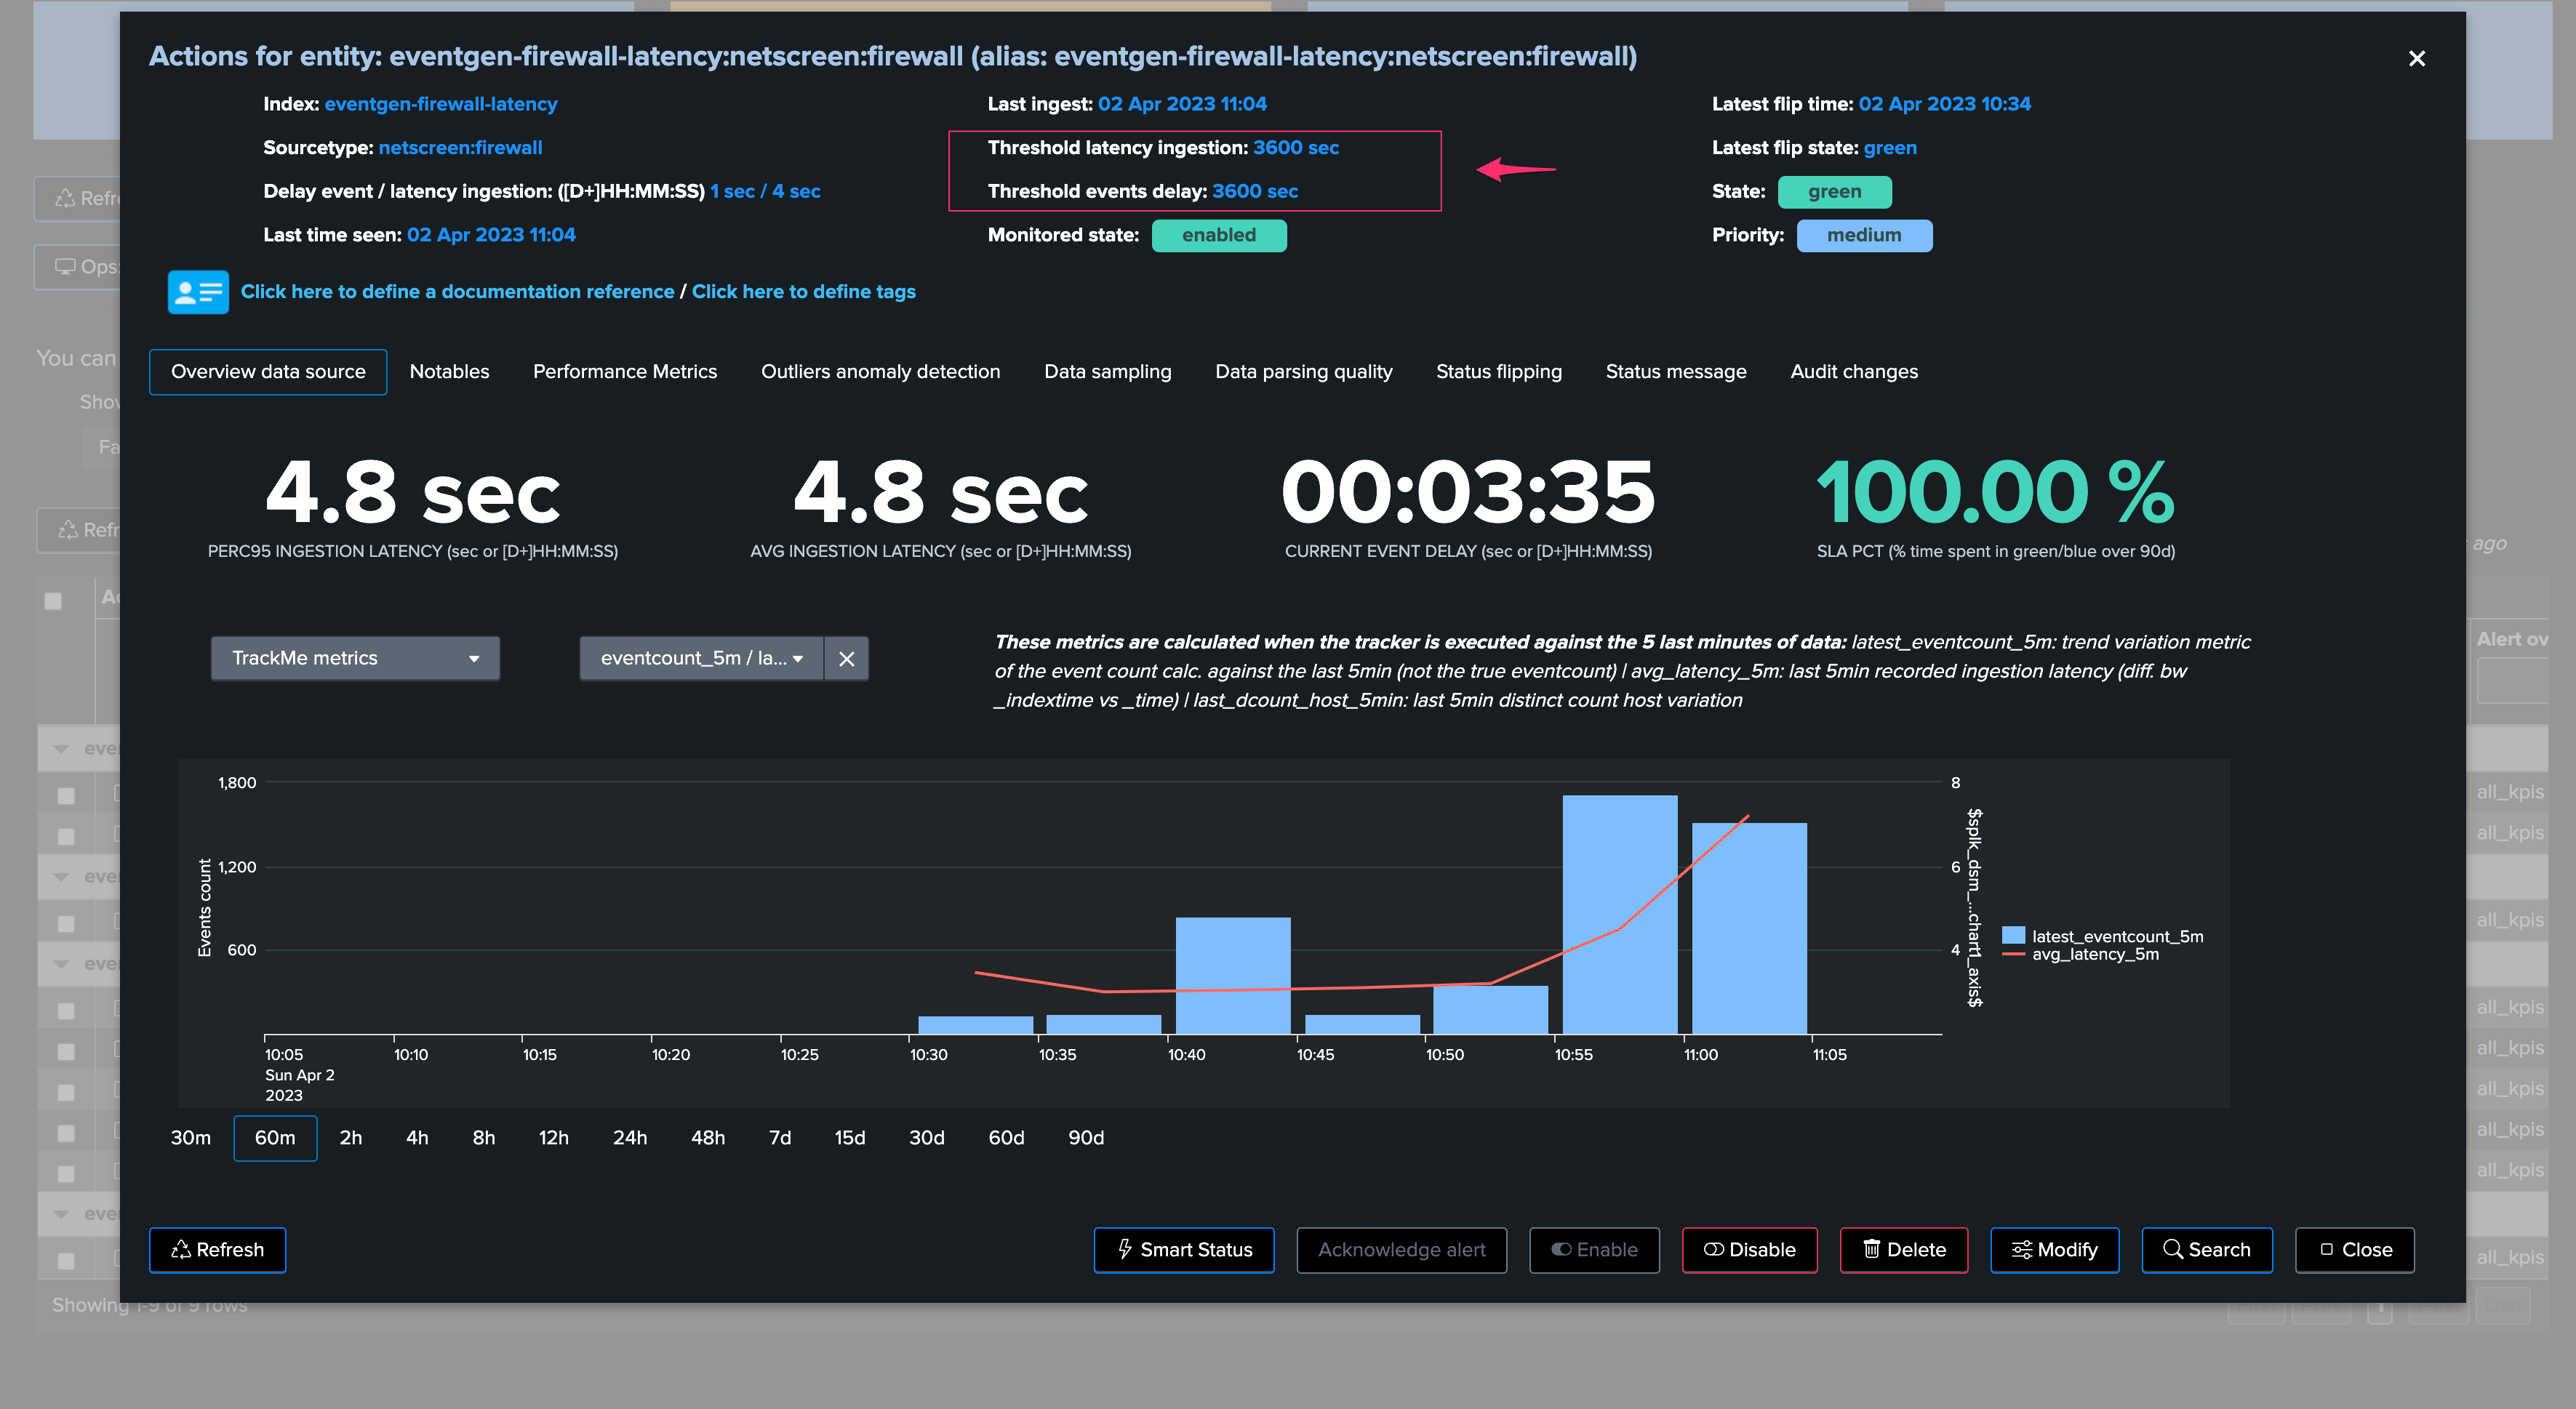
When opening the entity main screen
Viewing thresholds from the Tabulator:
Viewing thesholds from the entity view:
3. Defining Custom Threshold Values
There are mainly two approaches, which can be combined:
Defining global rules that define the threshold values based on custom criteria, these are called “Lagging classes” in TrackMe
Defining custom threshold values for a given entity, optionally overriding Lagging classes, if any
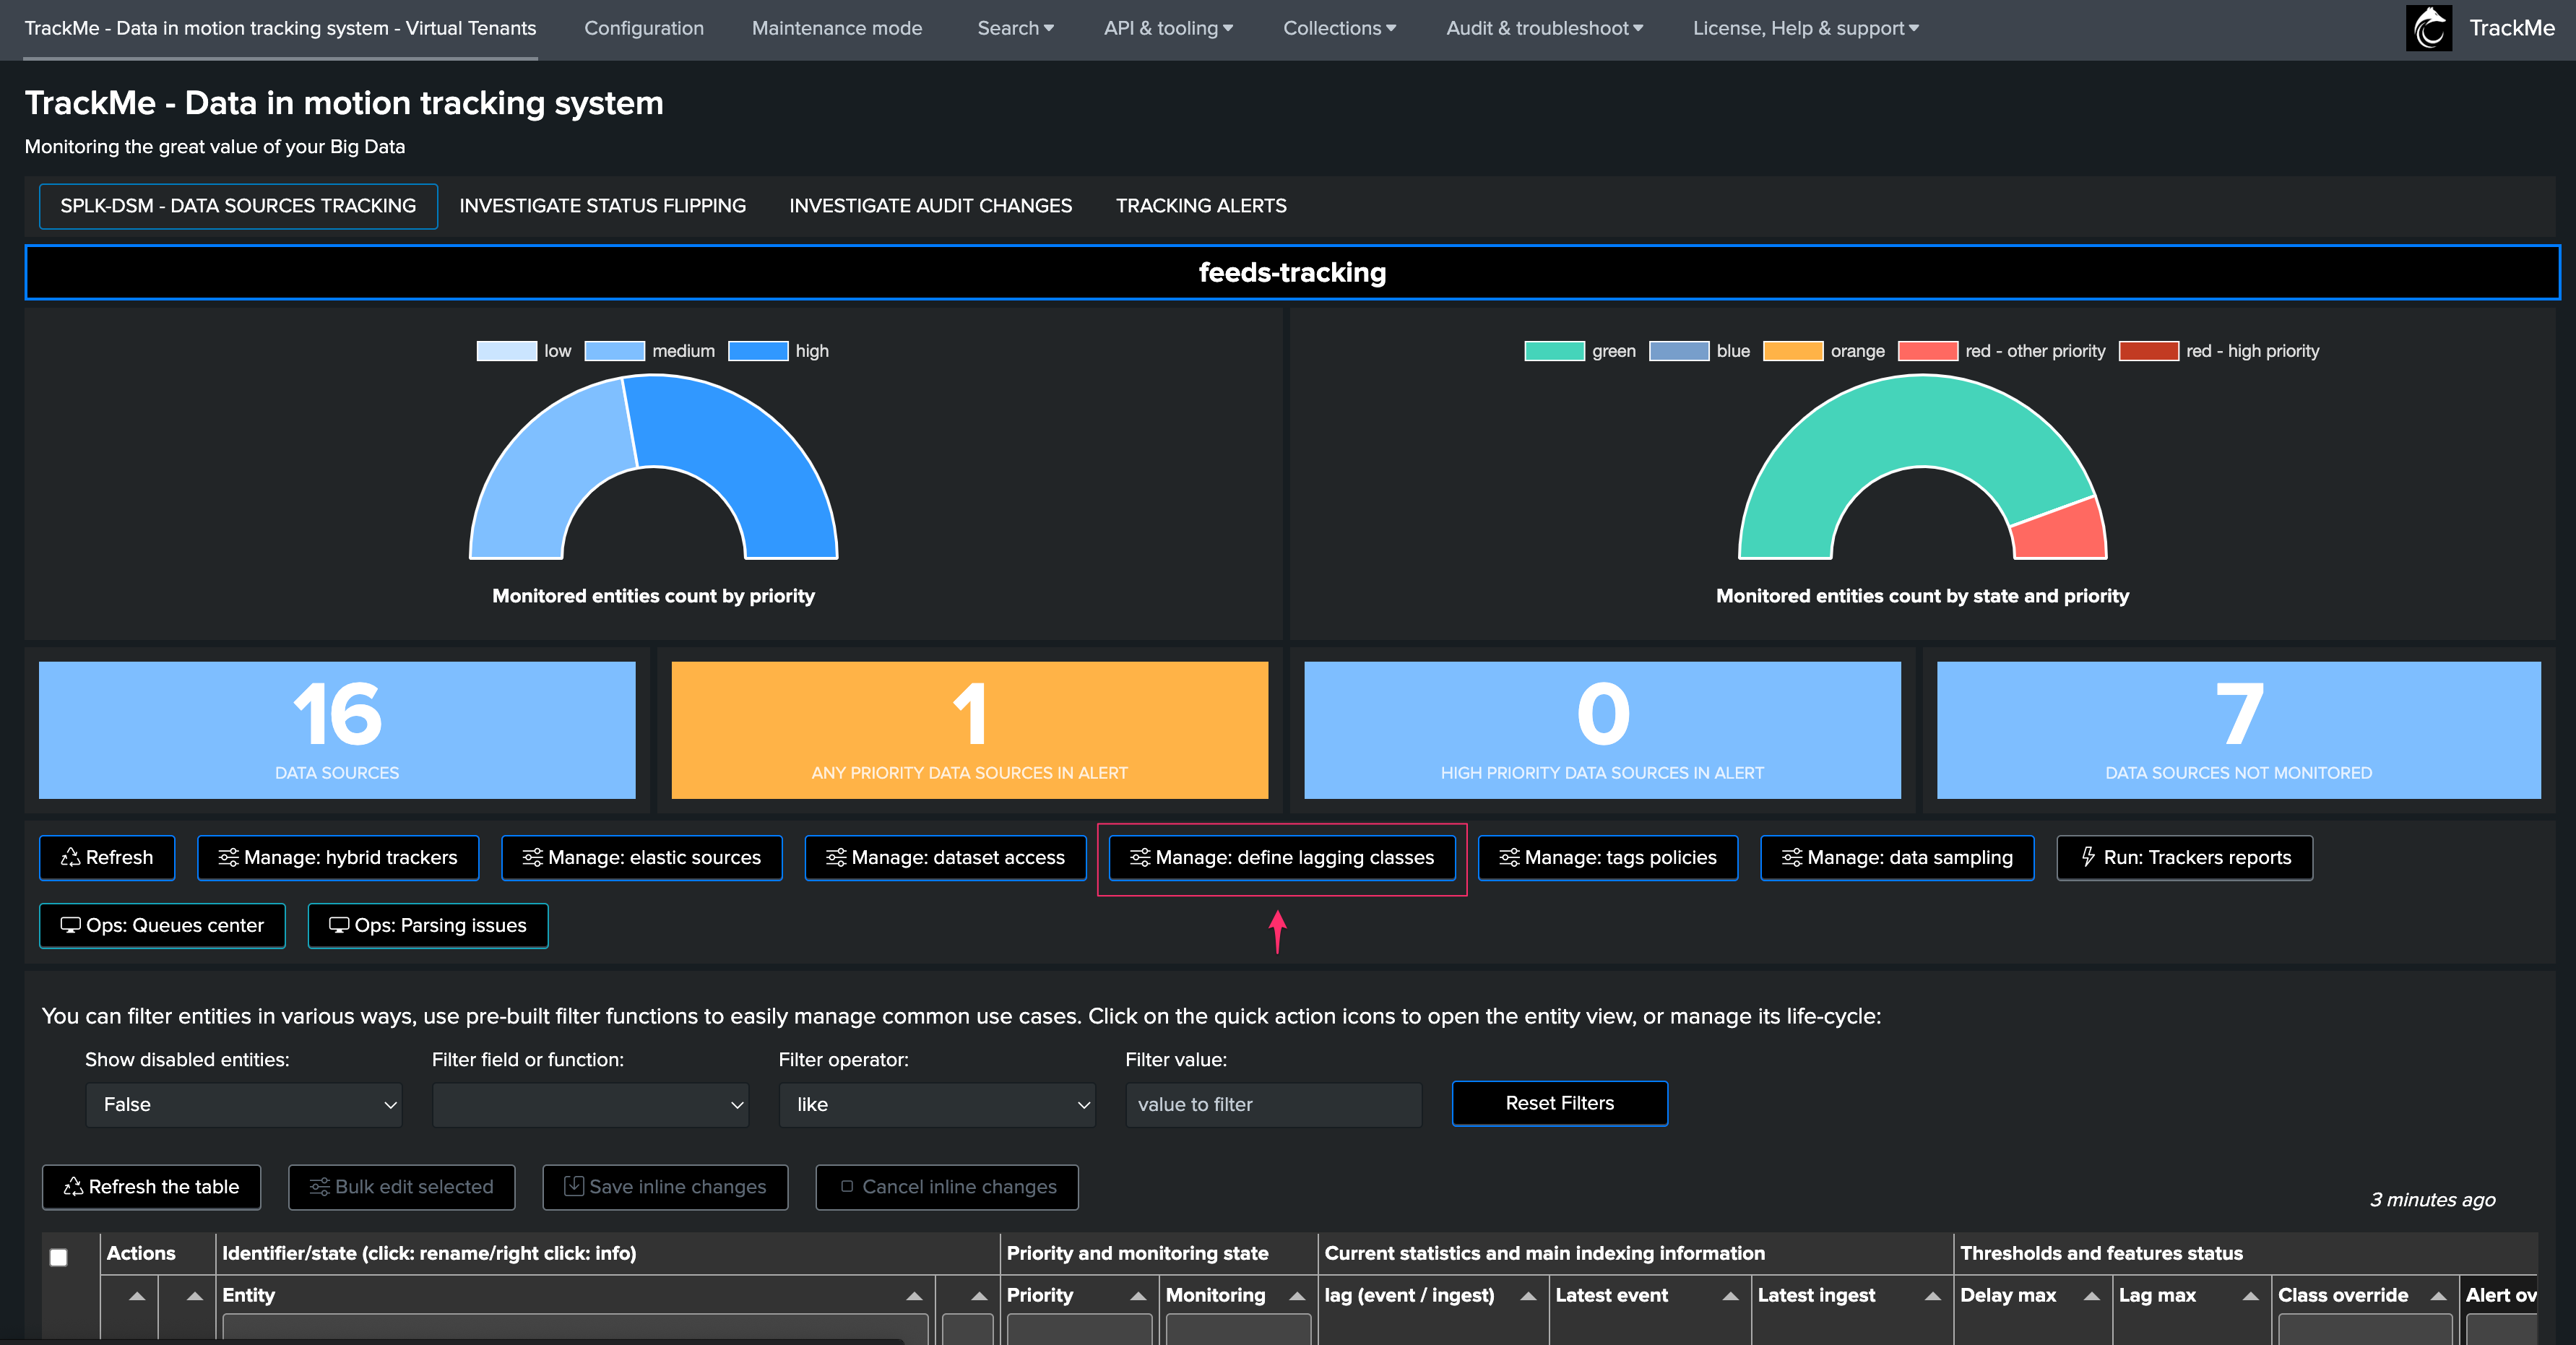
4. Lagging Classes for Thresholds Management
A best practice approach is to configure lagging classes.
Lagging classes can be defined using the following criteria: - Based on the index - Based on the sourcetype - Based on the priority level defined for the entity
When a lagging class is defined and matches an entity, TrackMe defines the values of the thresholds accordingly.
These values can be overridden on a per-entity basis, allowing managing generic use cases for a data provider while still being able to manage specific use cases per entity.
Example: defining a custom lagging class for a sourcetype:
In this example, we define a custom lagging class for the sourcetype “netscreen-firewall”, with the following values:
latency: 10 minutes (600 seconds)
delay: 2 hours (7200 seconds)
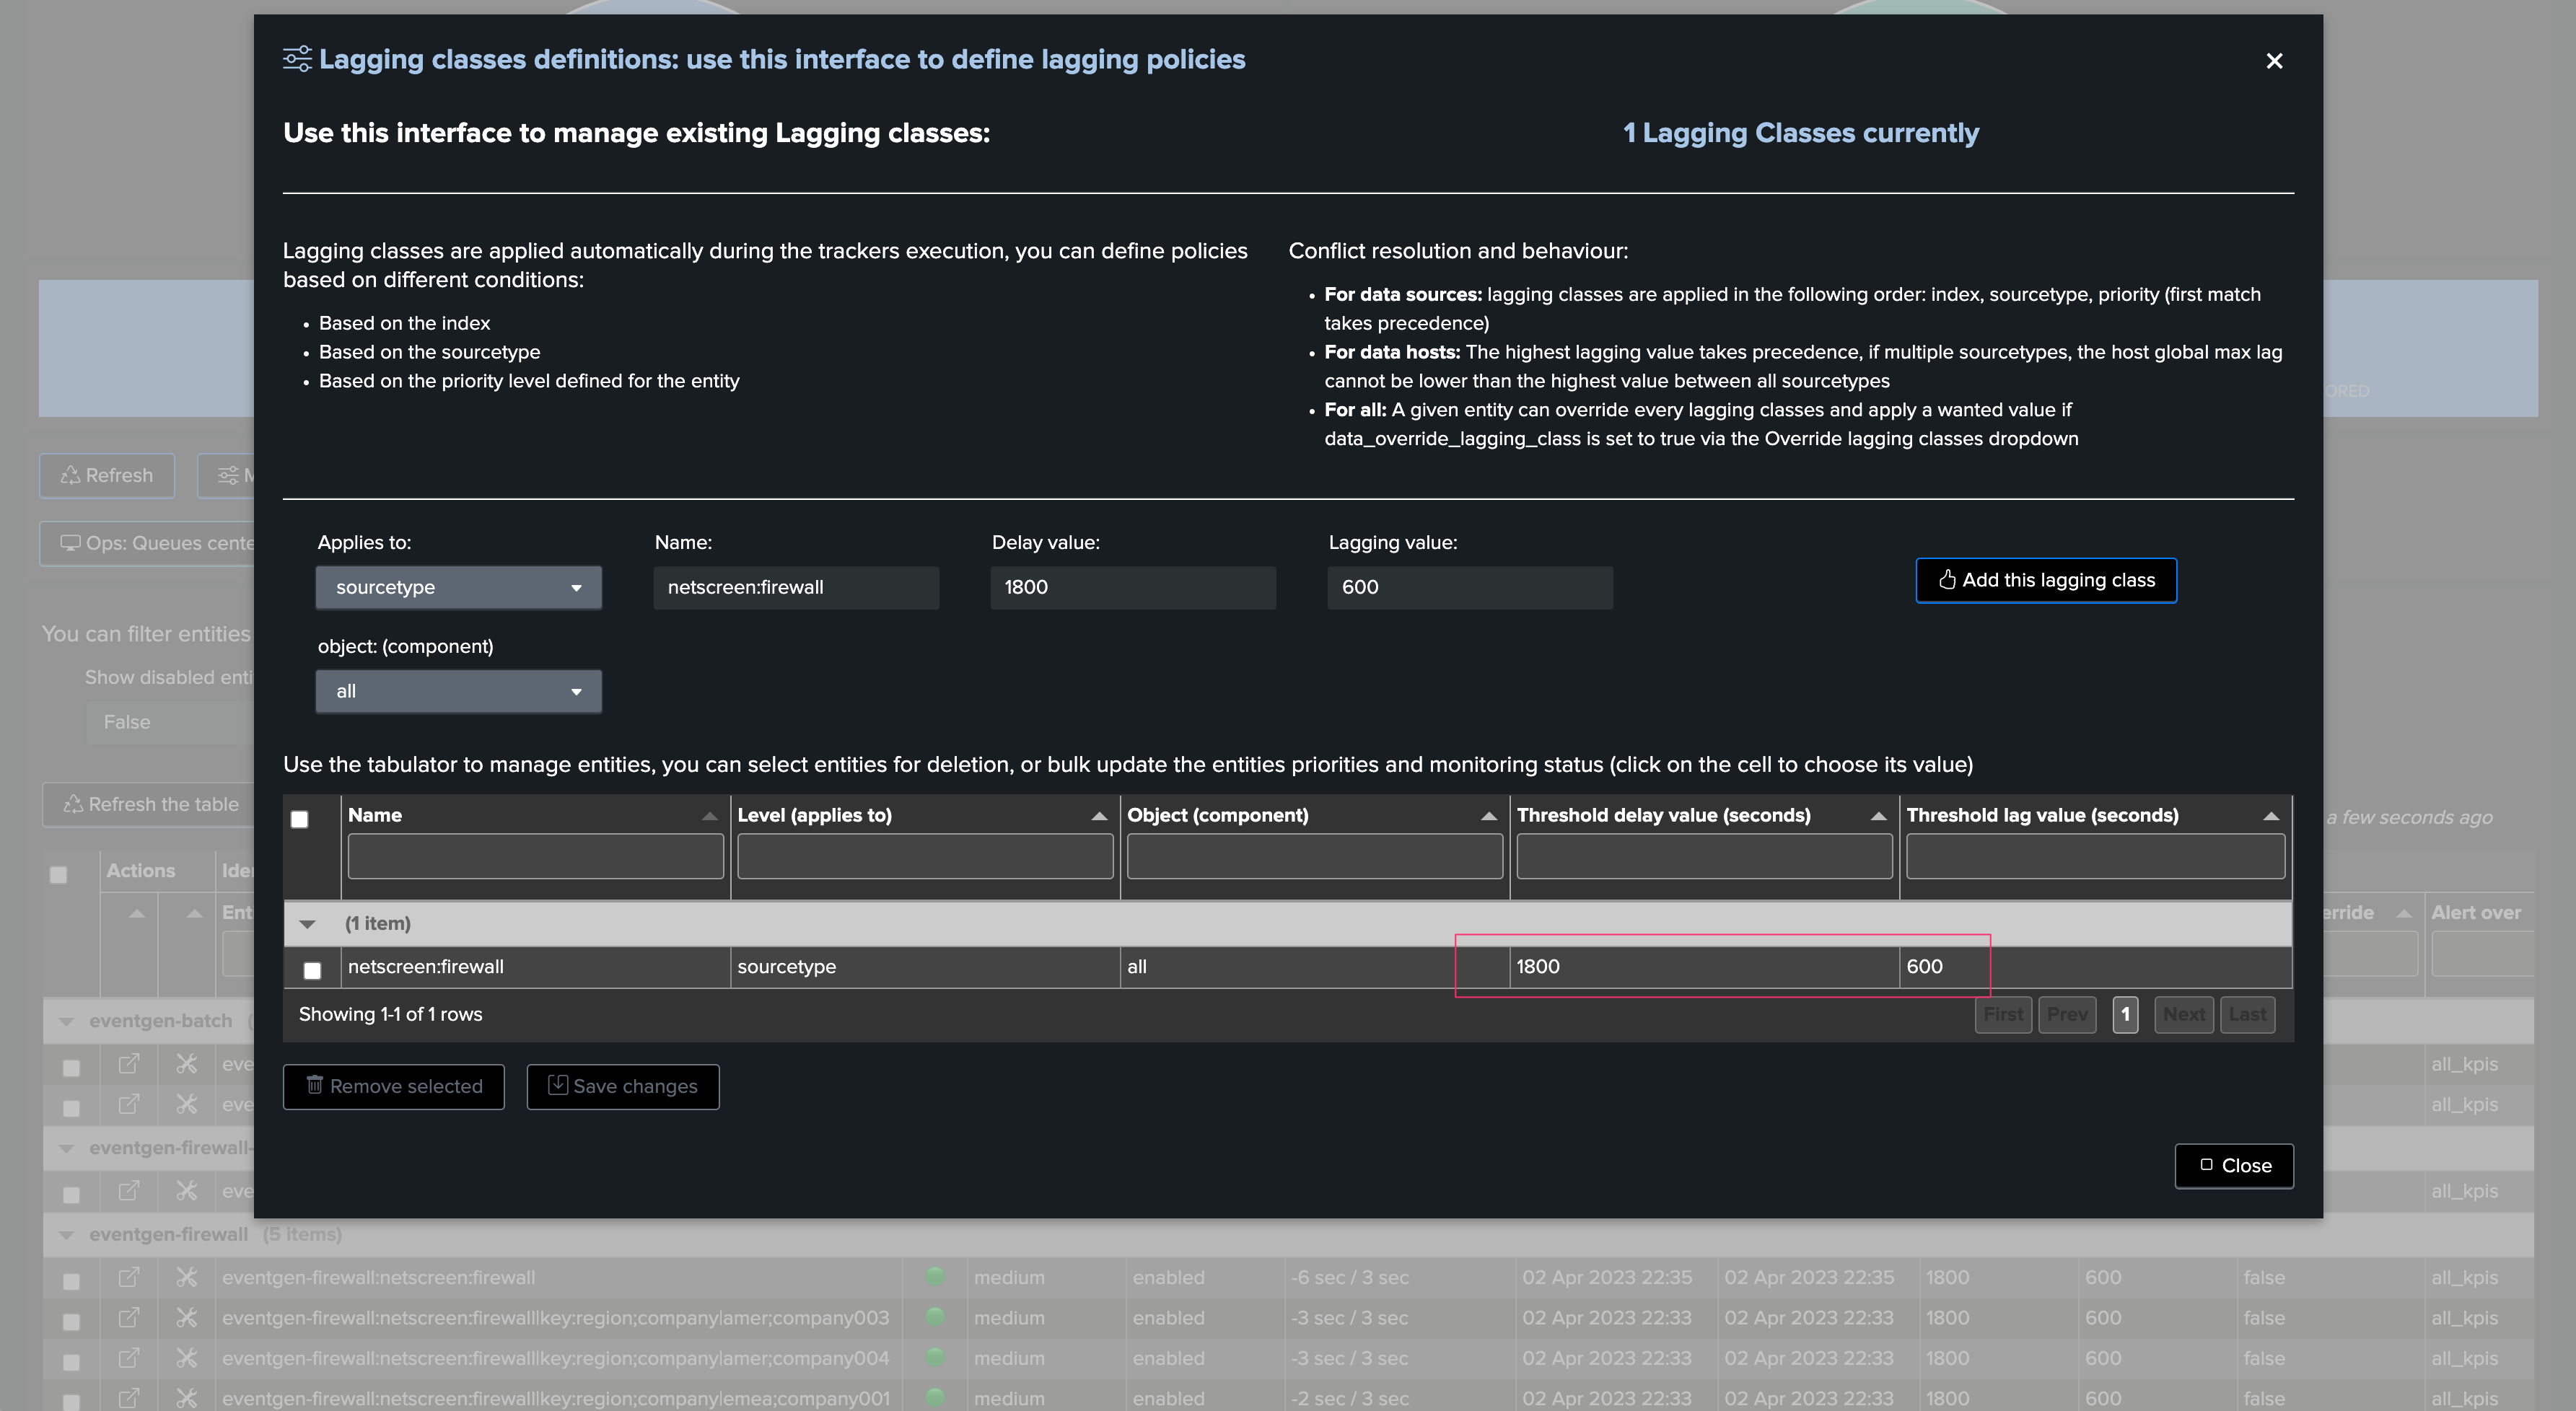
Once Hybrid Trackers have been executed at least once, and the entities are active, thresholds have been updated automatically:
5. Per Entity Thresholds
To manually define thresholds for a given entity, proceed as follows:
Open the entity main screen, and access the modification screen
On top of this screen, define the thresholds as needed
Set the override value to True if you are using lagging classes, to avoid these values from being overridden by a system-wide rule
Click on apply
Example: defining custom thresholds
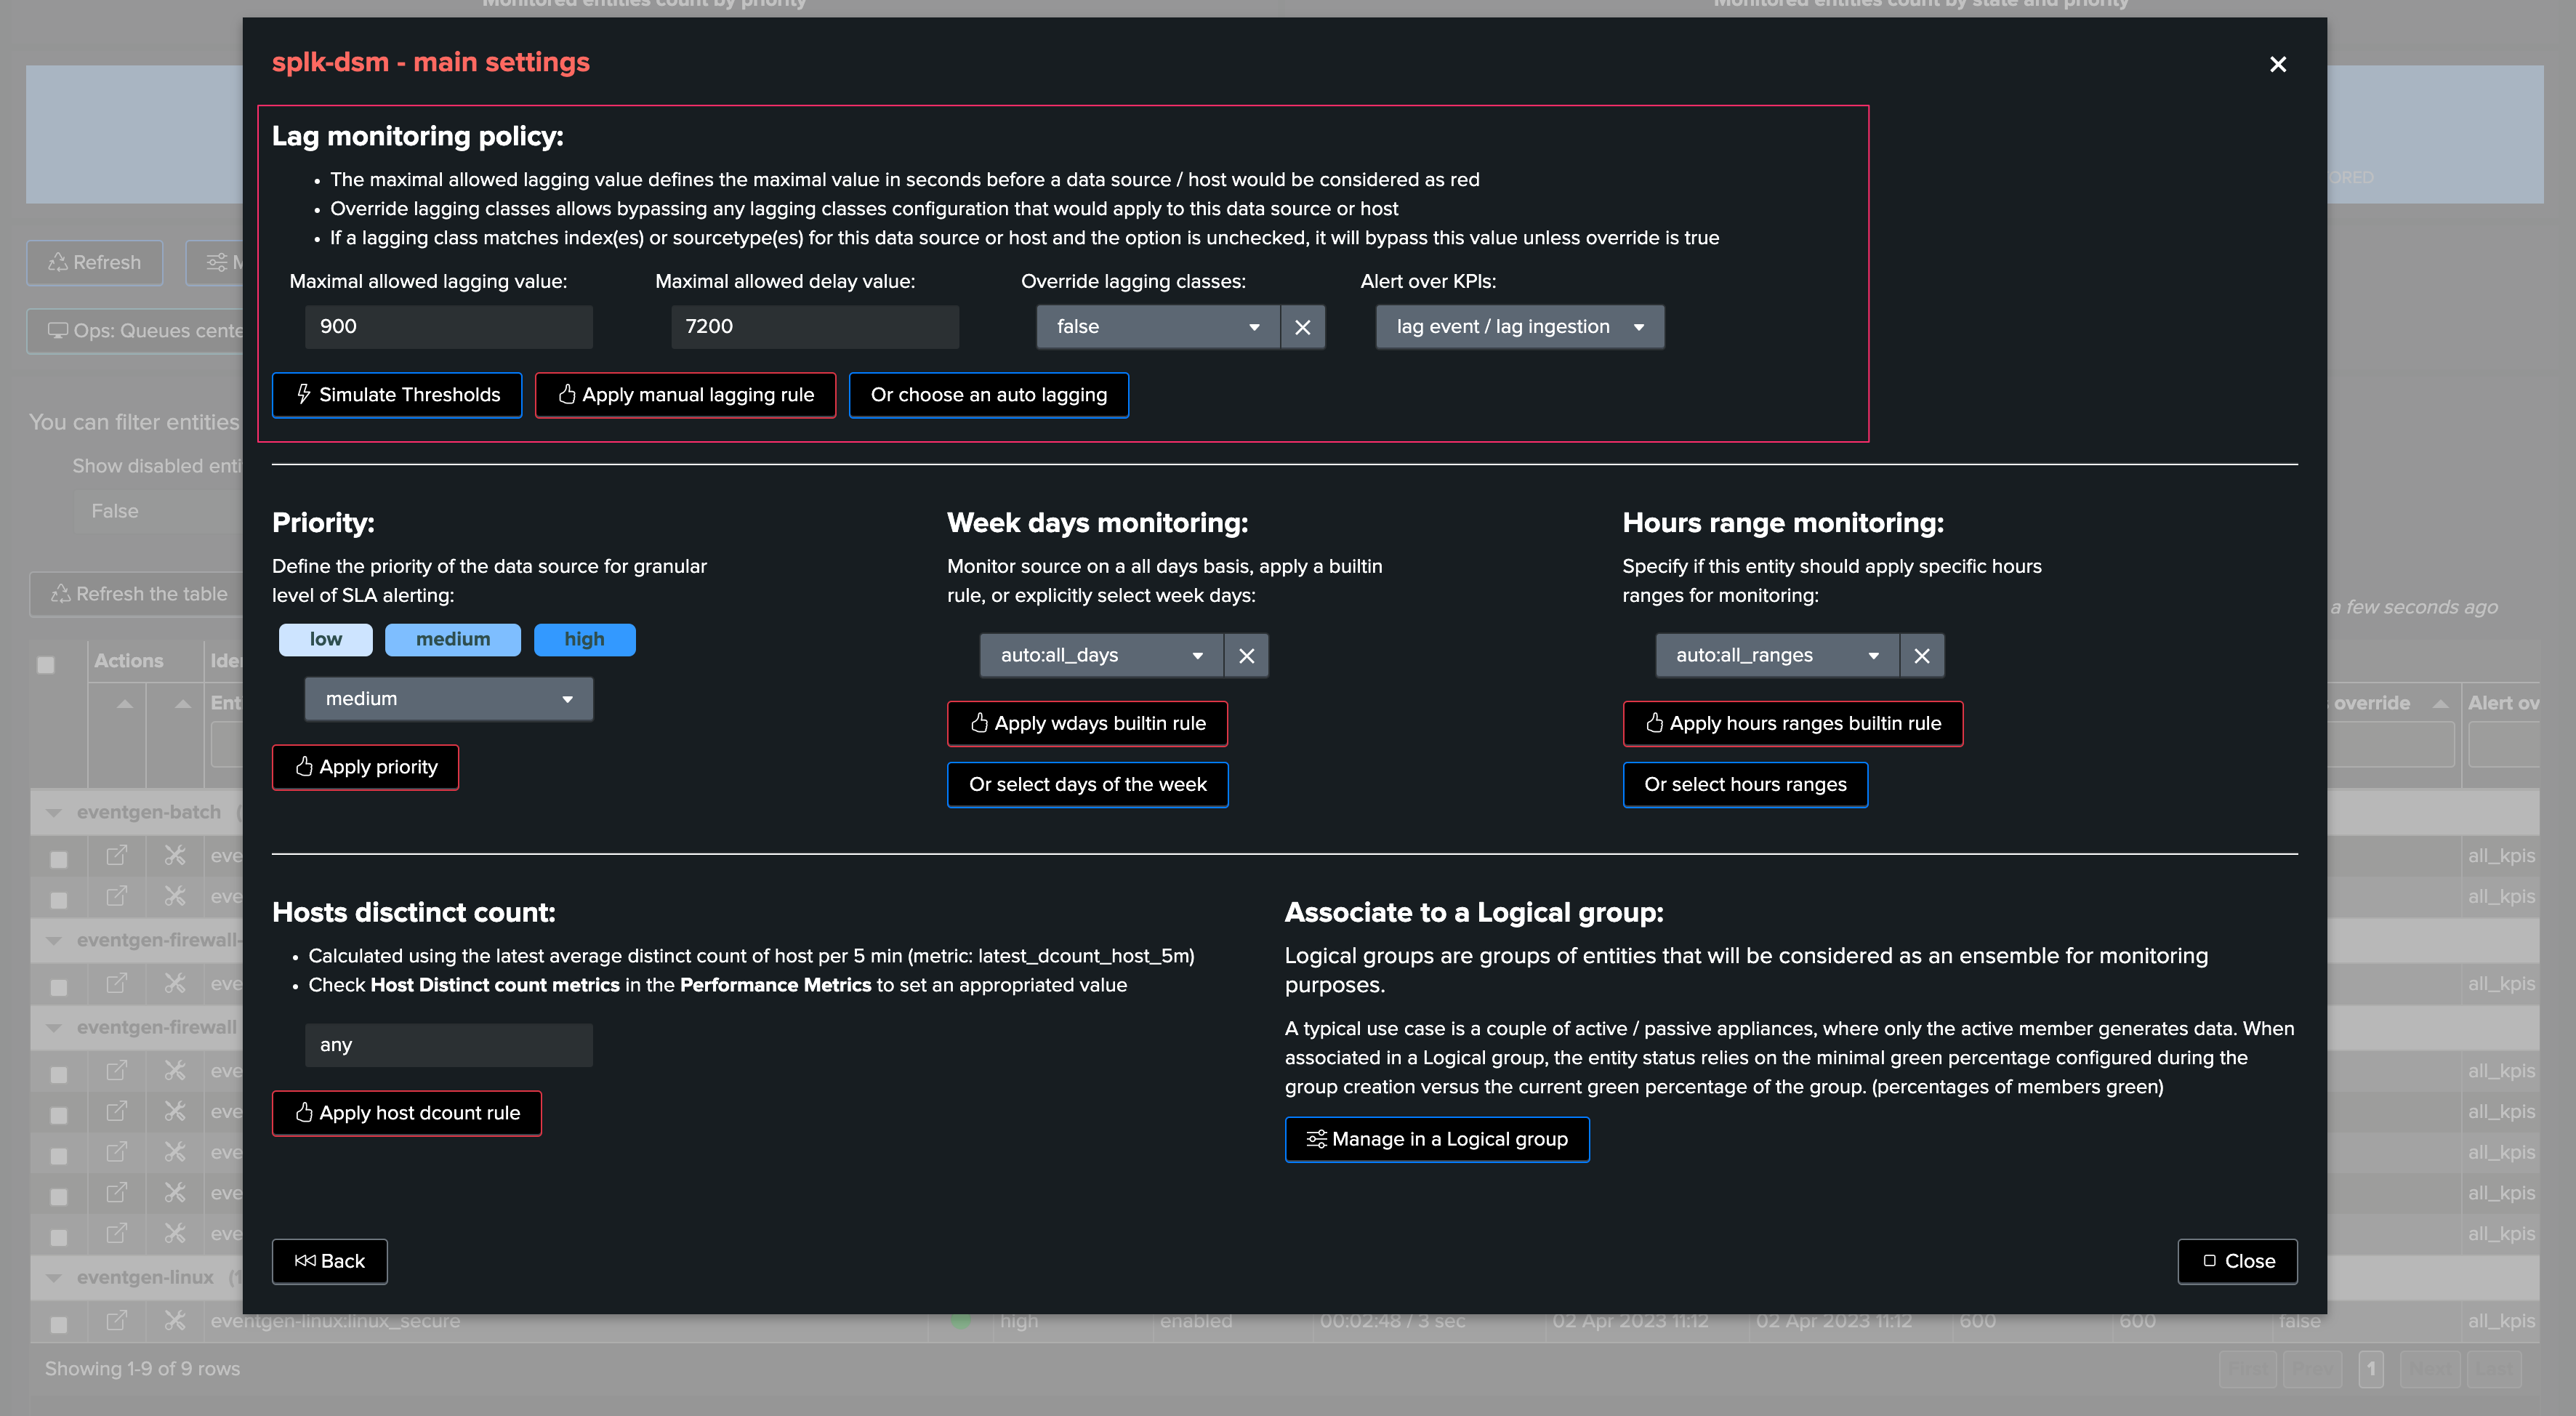
In this screen, you can:
set the maximal acceptable value for latency
set the maximal acceptable value for delay
define if we should override lagging classes, if any matching (default to false, set true if needed)
define if we should alert on both KPIs (default is both), or only one of the two
6. Simulating Threshold Values
TrackMe provides a feature that allows simulating how thresholds would be breached based on your inputs.
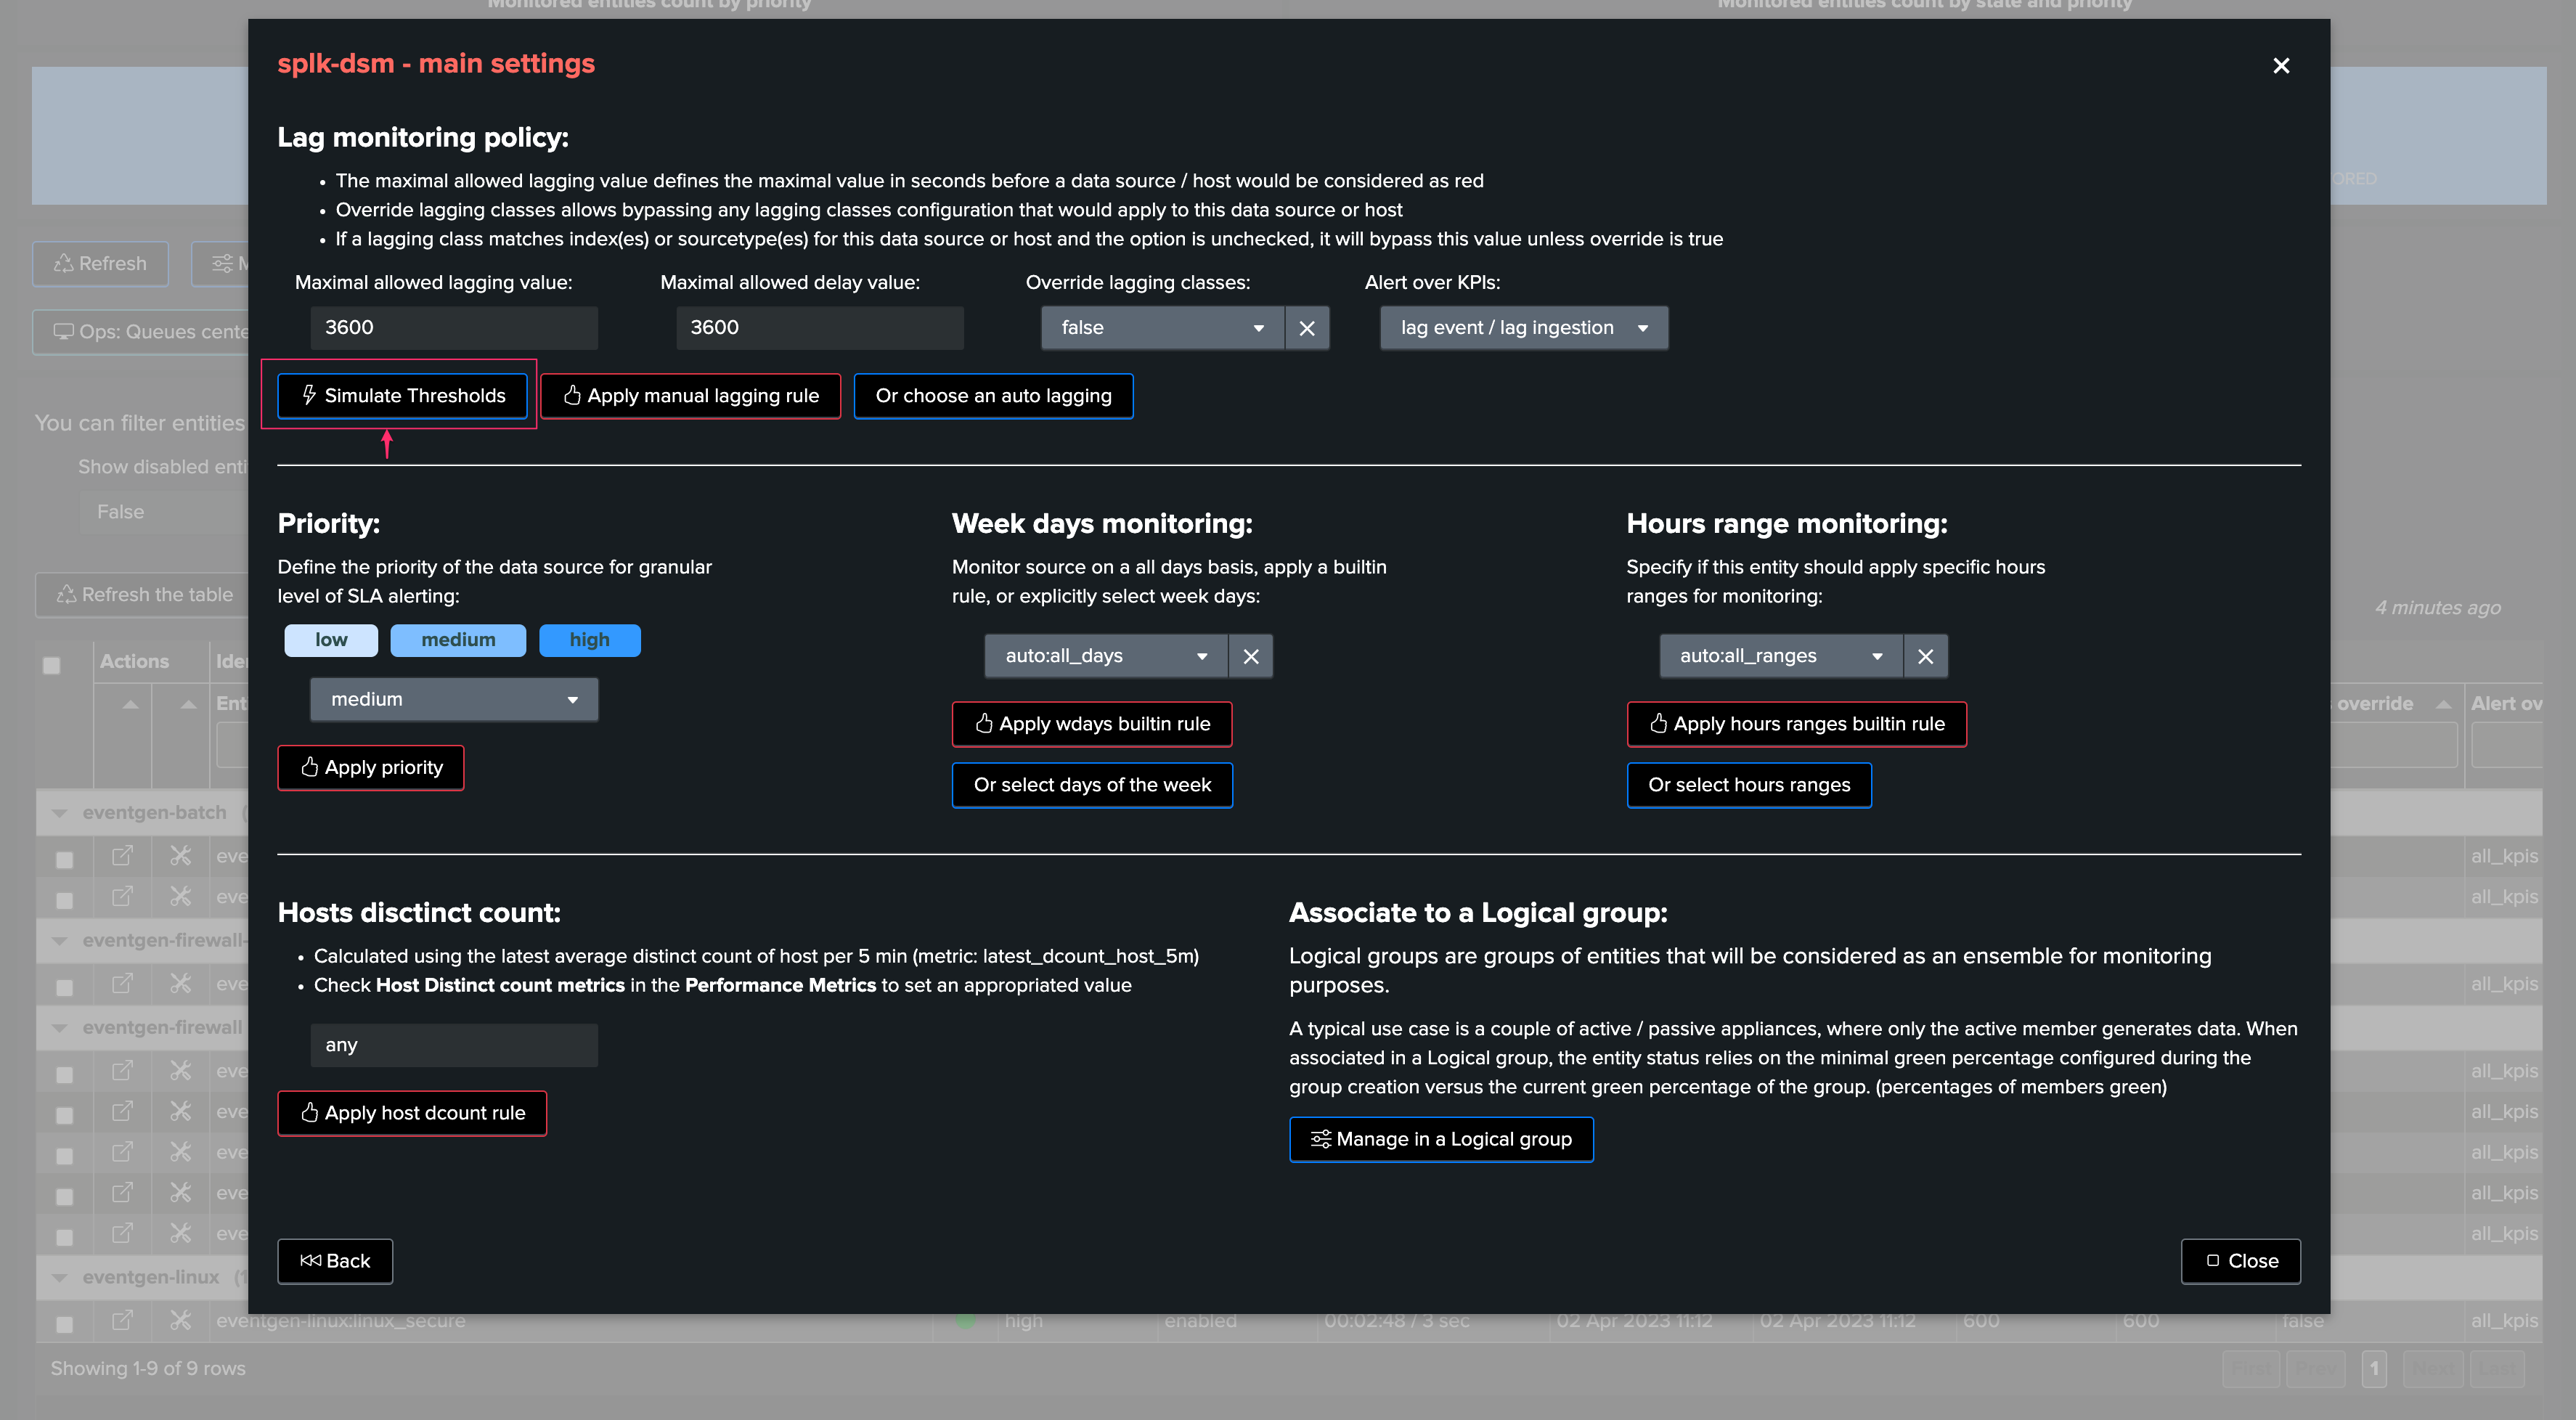
Open the thresholds settings screen, and click on the simulate thresholds button:
Provide input values for both latency and delay thresholds
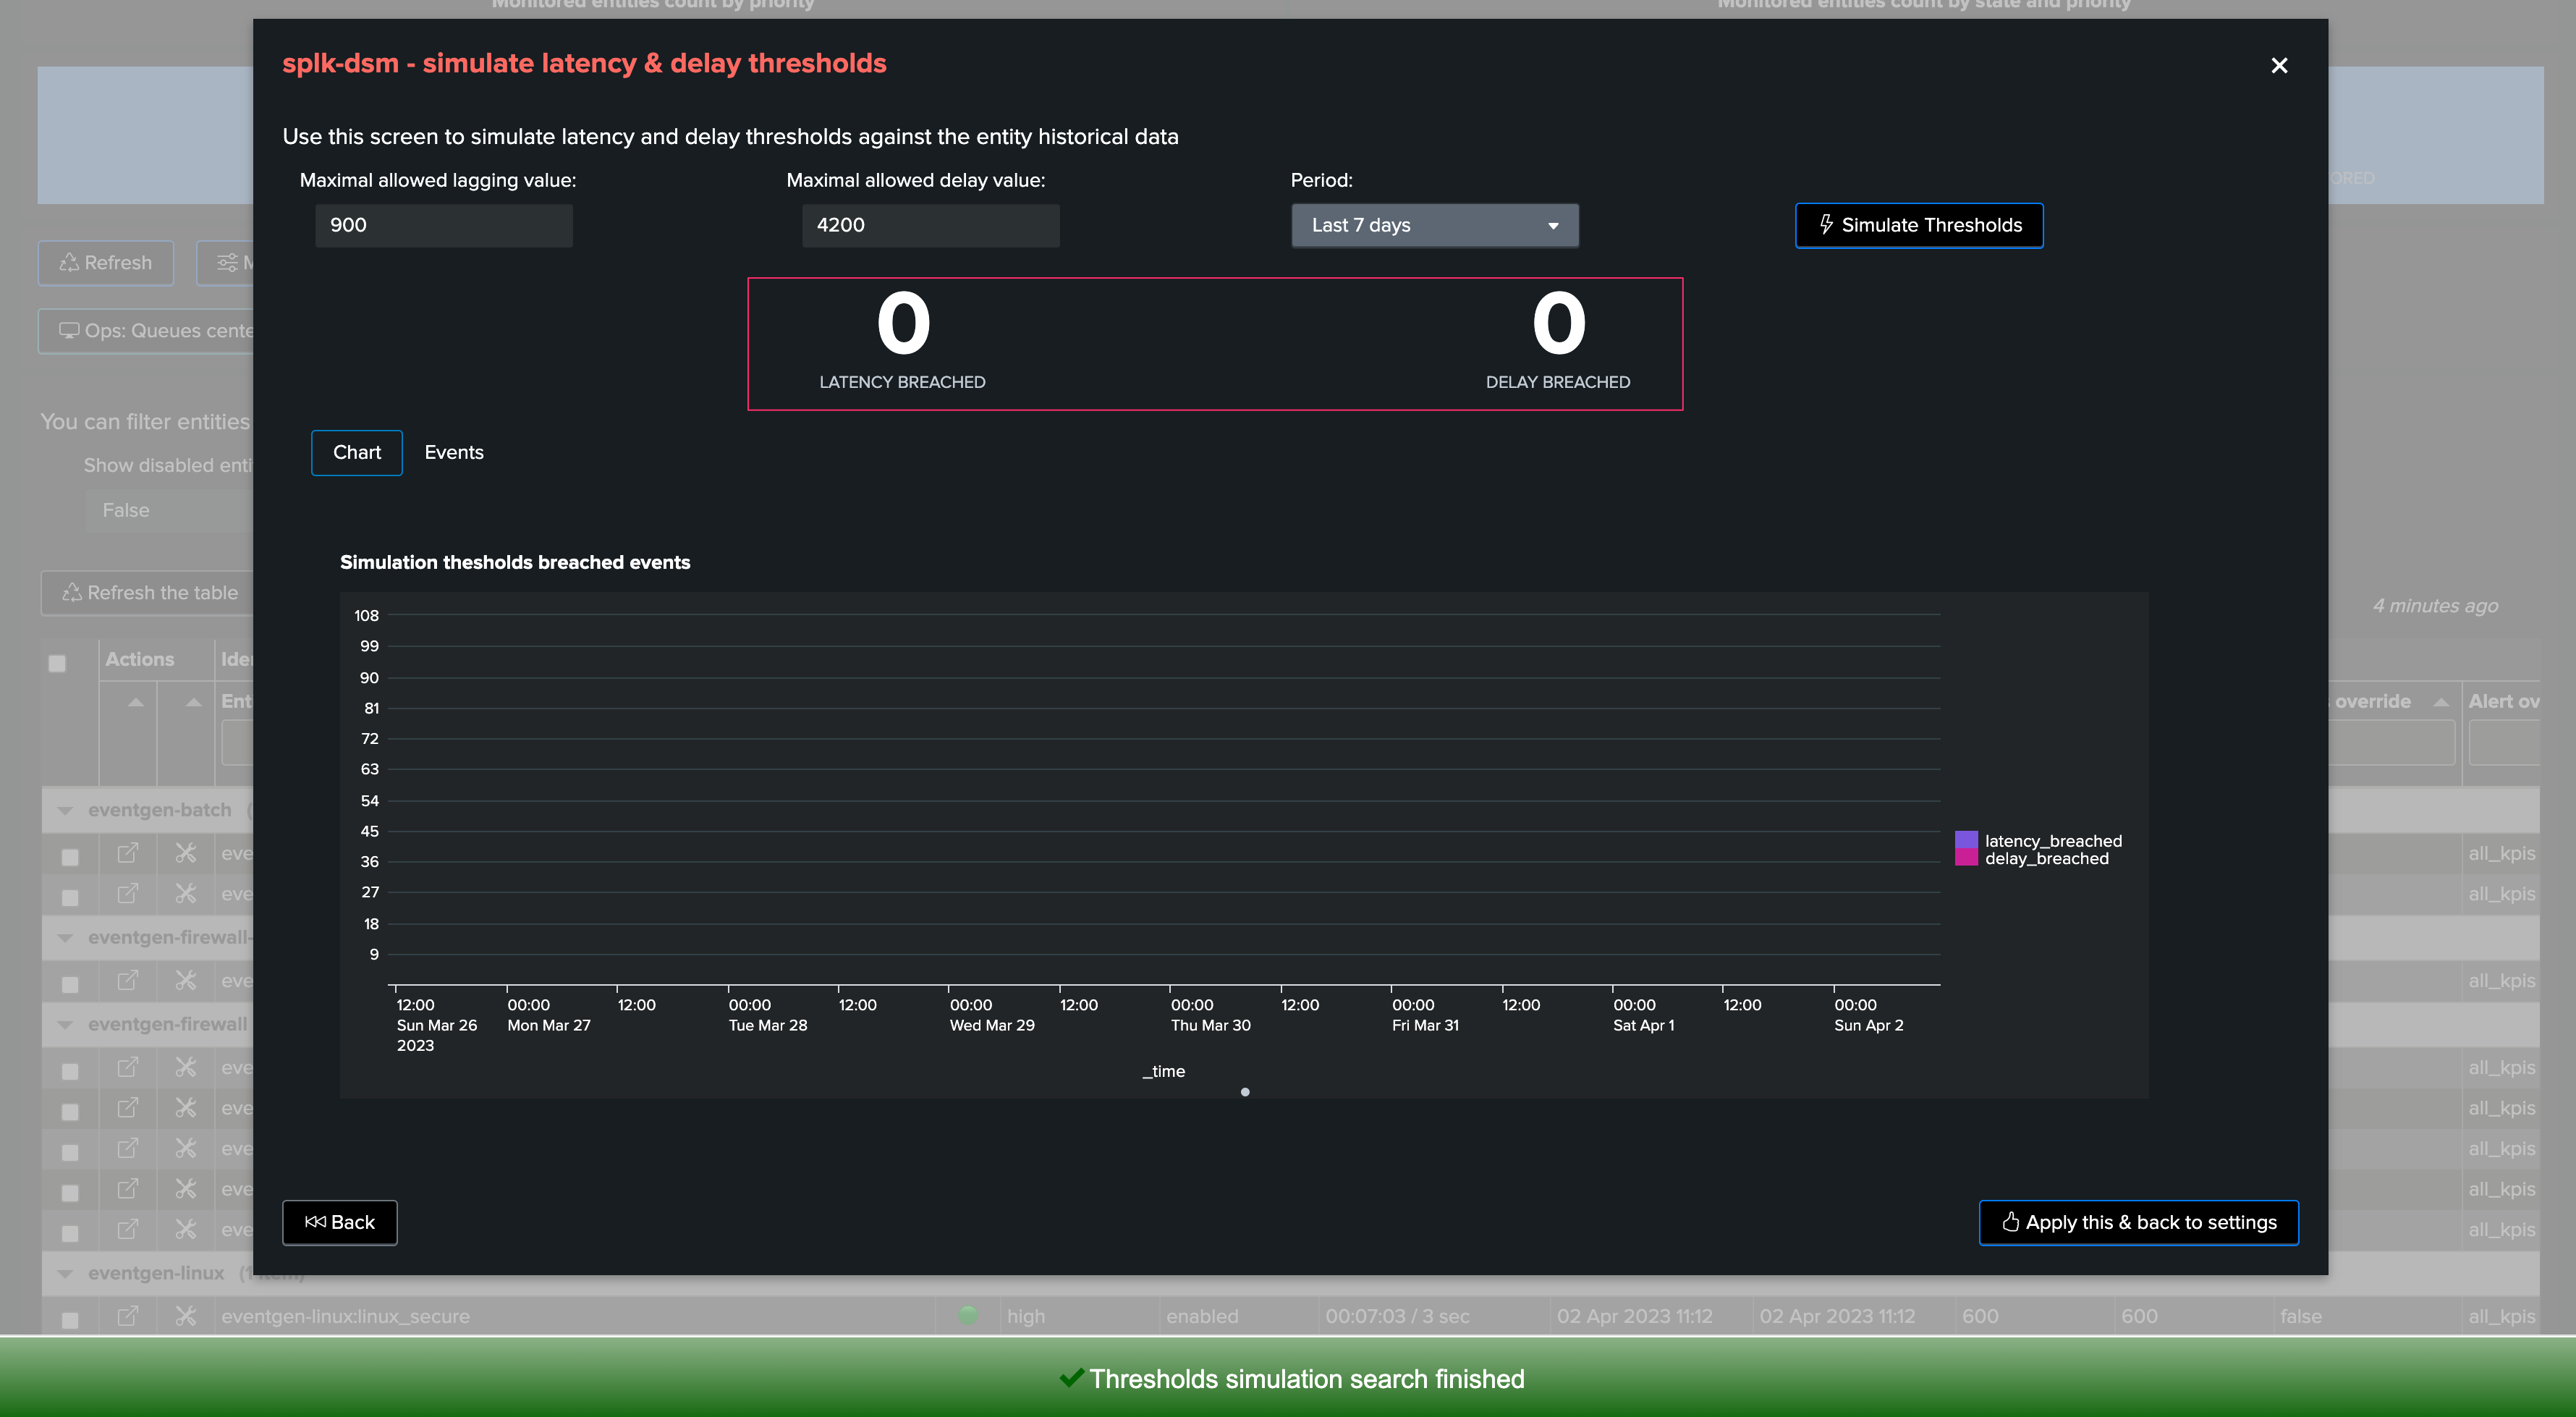
Click on simulate, TrackMe will apply these thresholds against TrackMe summary events and show an event for each breach that would result from your settings
Example:
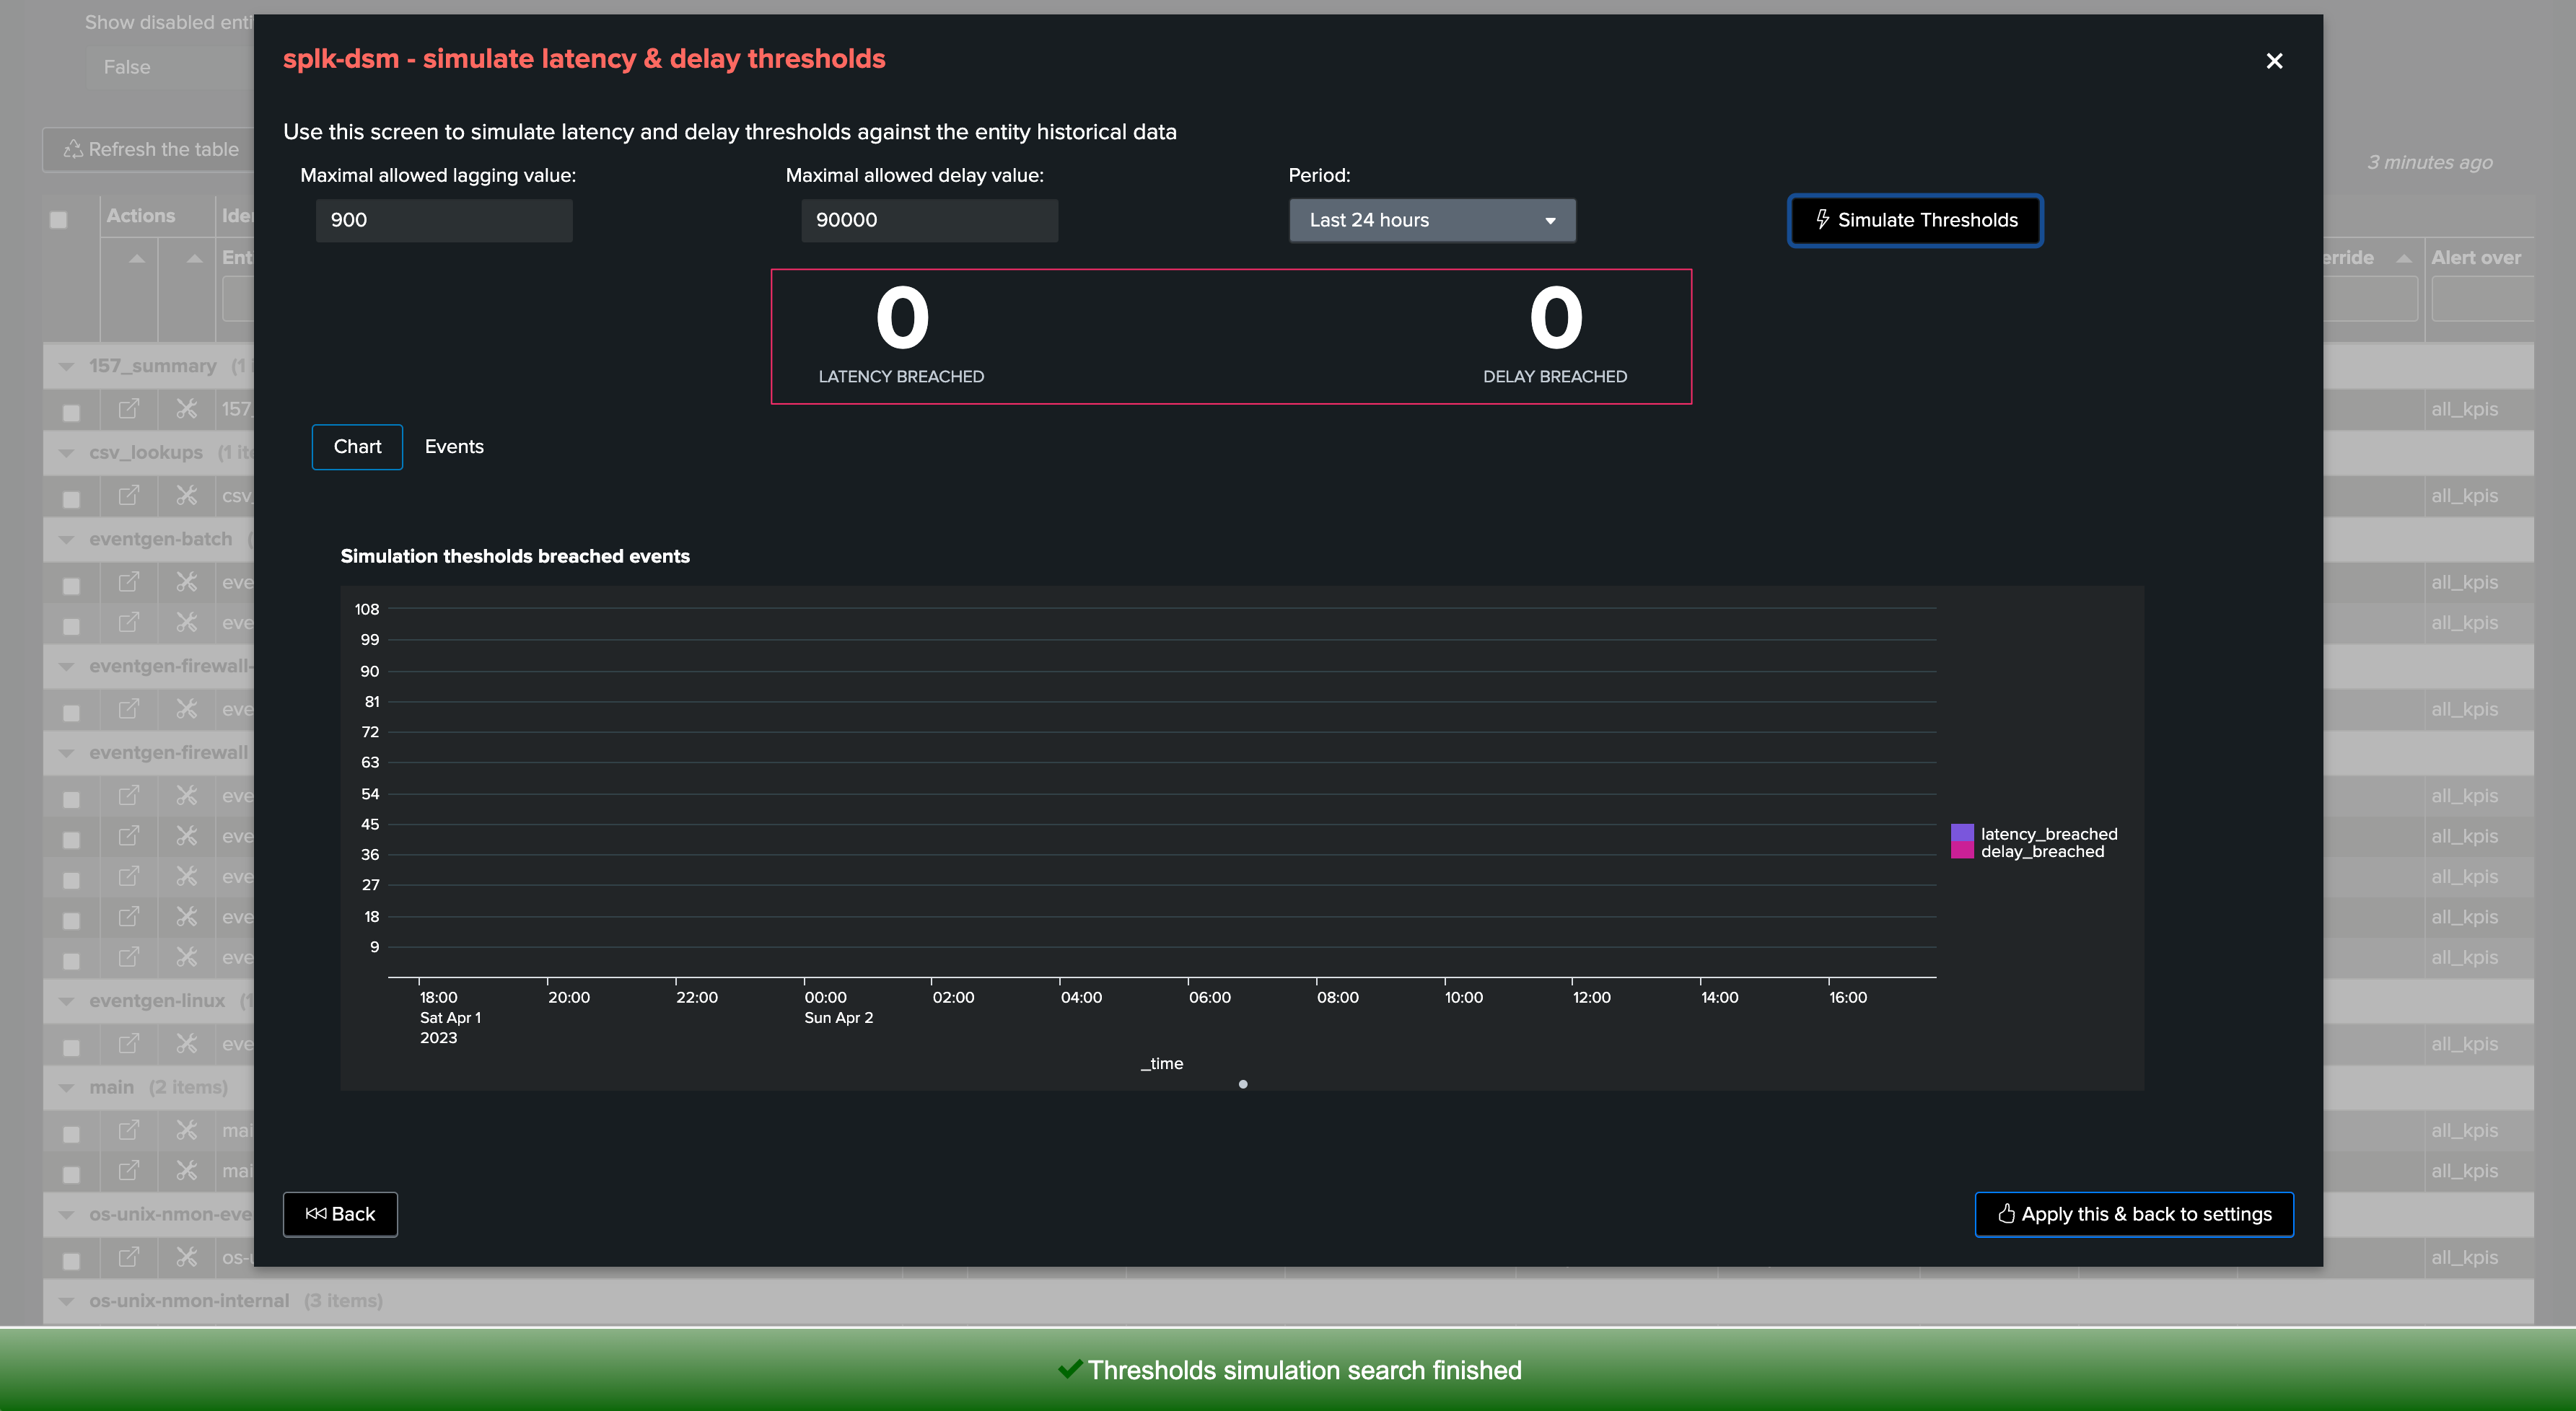
For instance, this provider sends data to Splunk once per hour, however it does not suffer from latency when it does it:
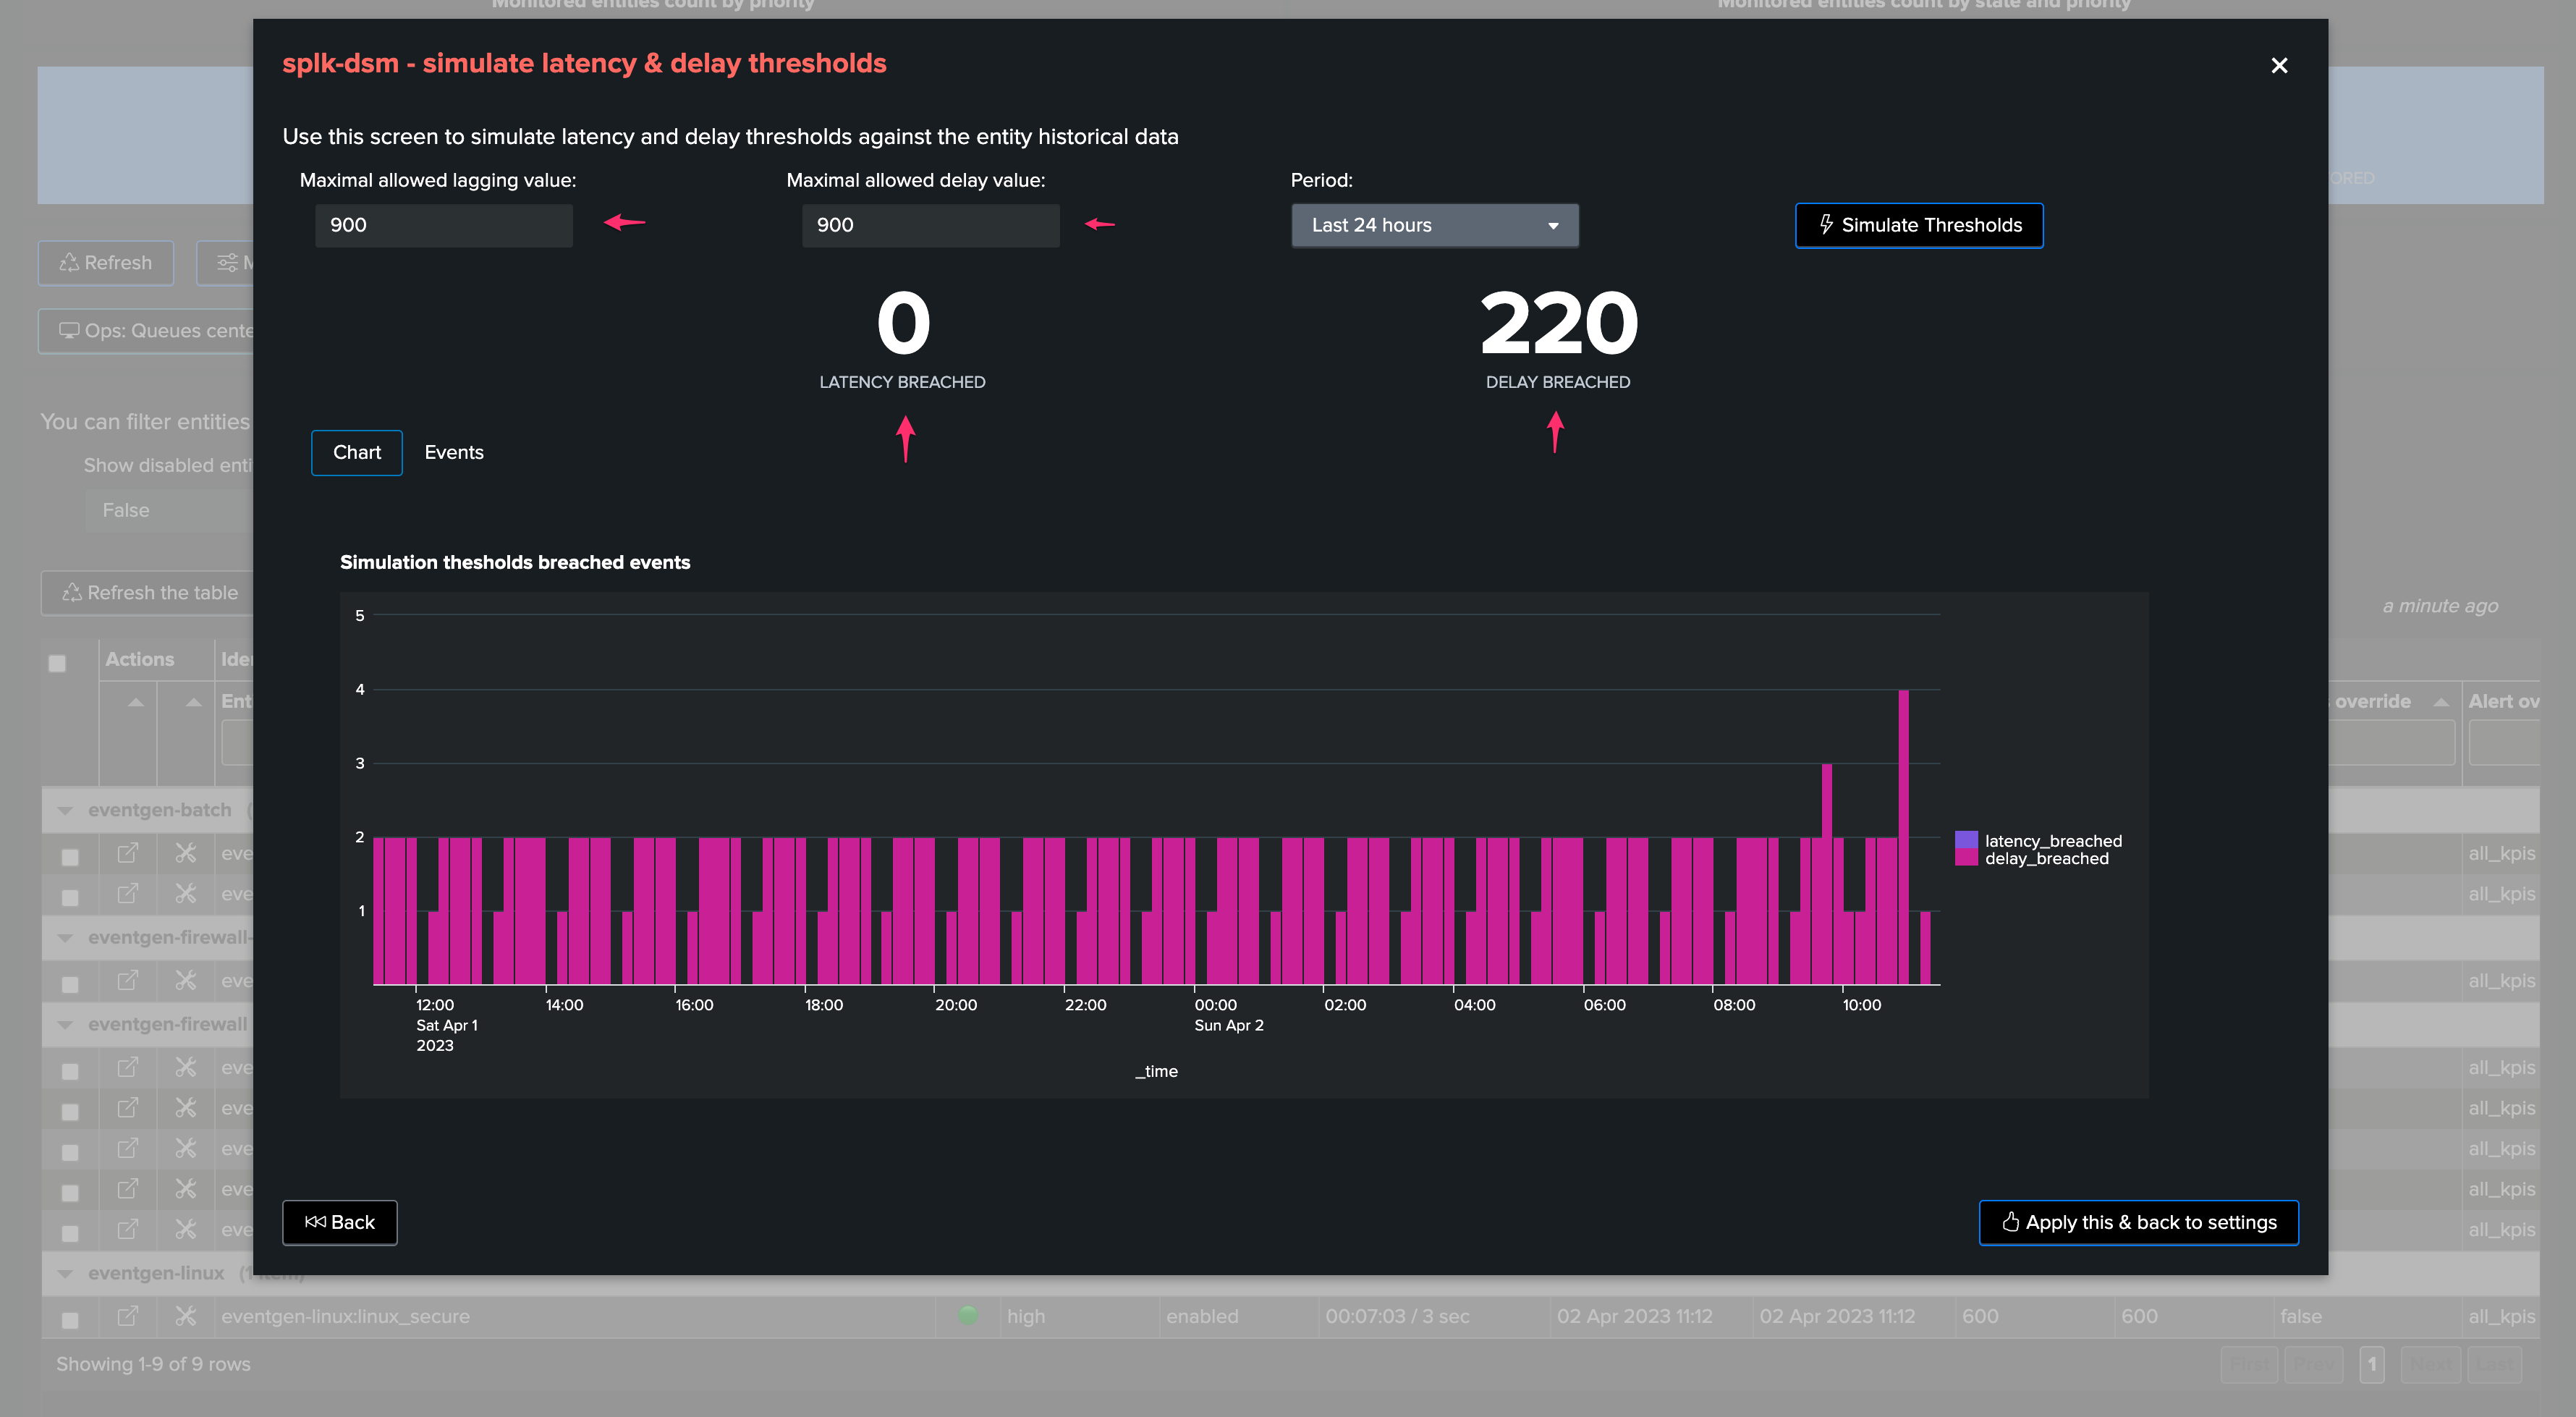
The threshold simulation screen’s purpose is to use TrackMe summary events to simulate your settings against the historical knowledge TrackMe has accumulated, before you set these effectively.
In this example, as the data is generated once per hour, we could setup a small value for latency, and for instance 1 hour + 10 minutes of additional time for the delay:
Finally, we can click on the apply button to prefil our thresholds settings, and apply as needed.
7. Anatomy of an Entity suffering from index time Latency
In the following example, we are reviewing an entity which is suffering from latency at the ingestion time:
Some additional details:
Latency means that we receive and index events with potentially some high amounts of time between when these events were produced (based on the events timestamps) and when these were received
This may imply as well that we have delay, but not necessarly, you can receive for instance a mix of pseudo real time events and events with latency
In addition, the measures between latency and delay will differ, which is in the most of the cases to expected
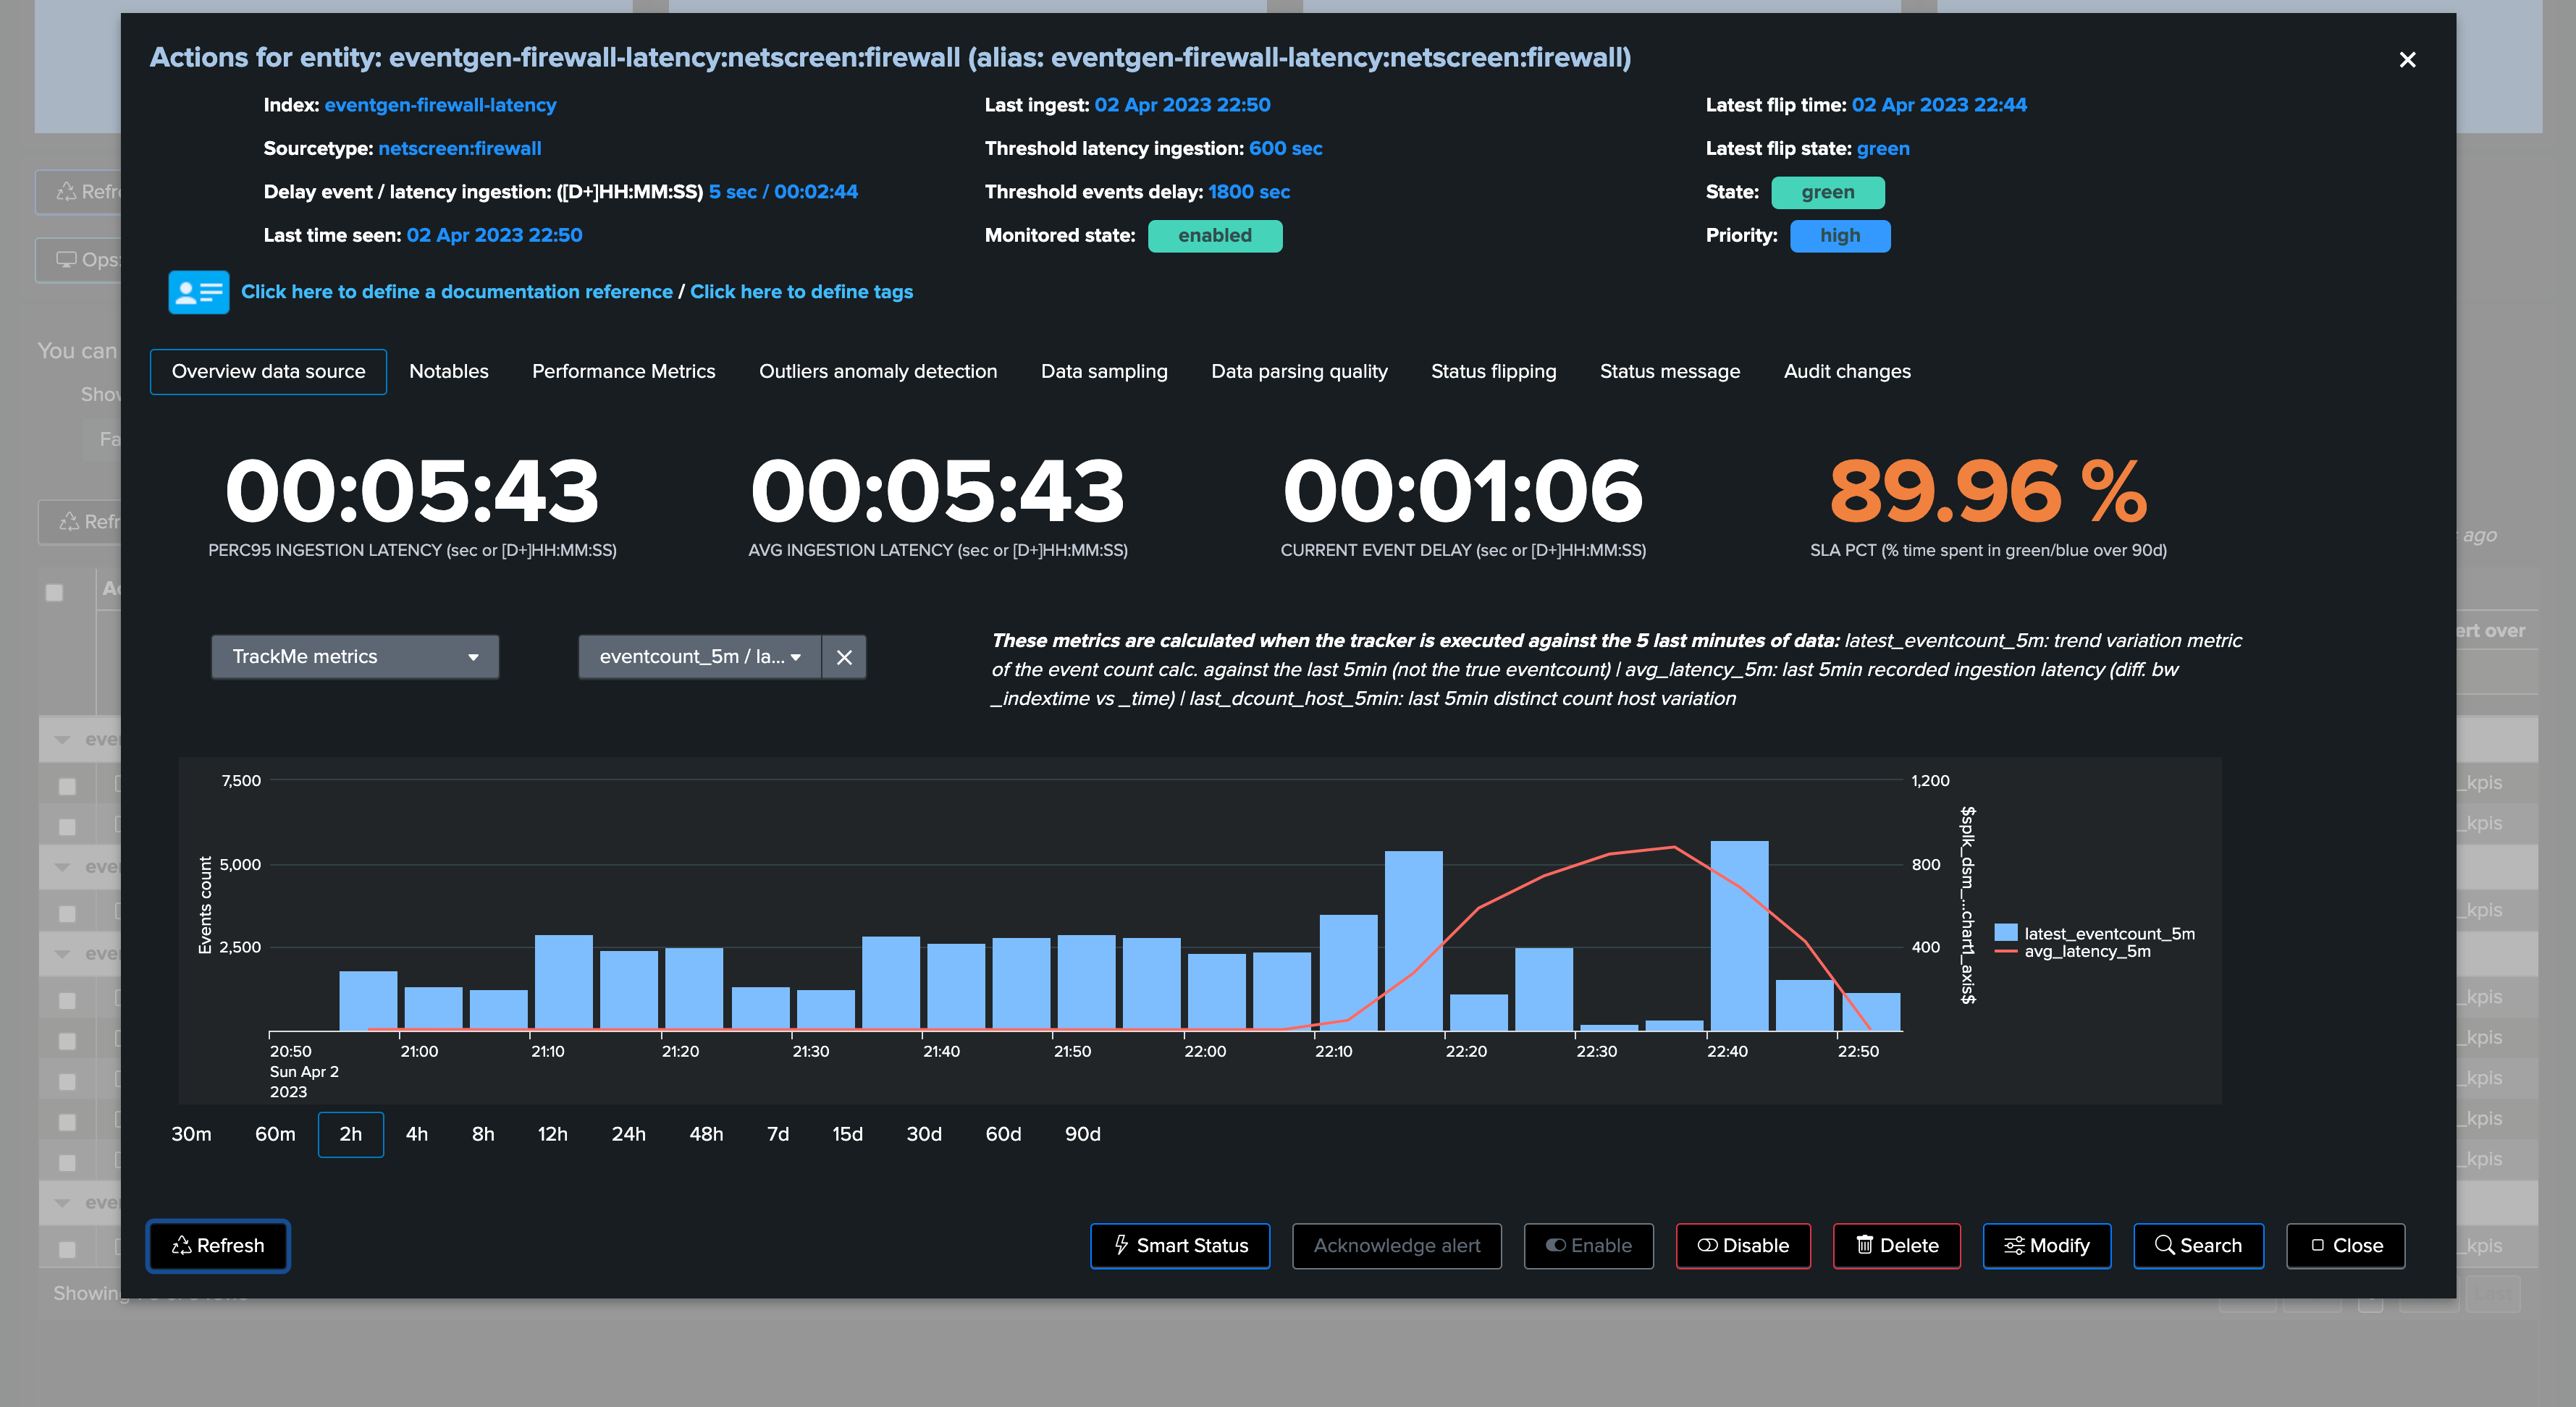
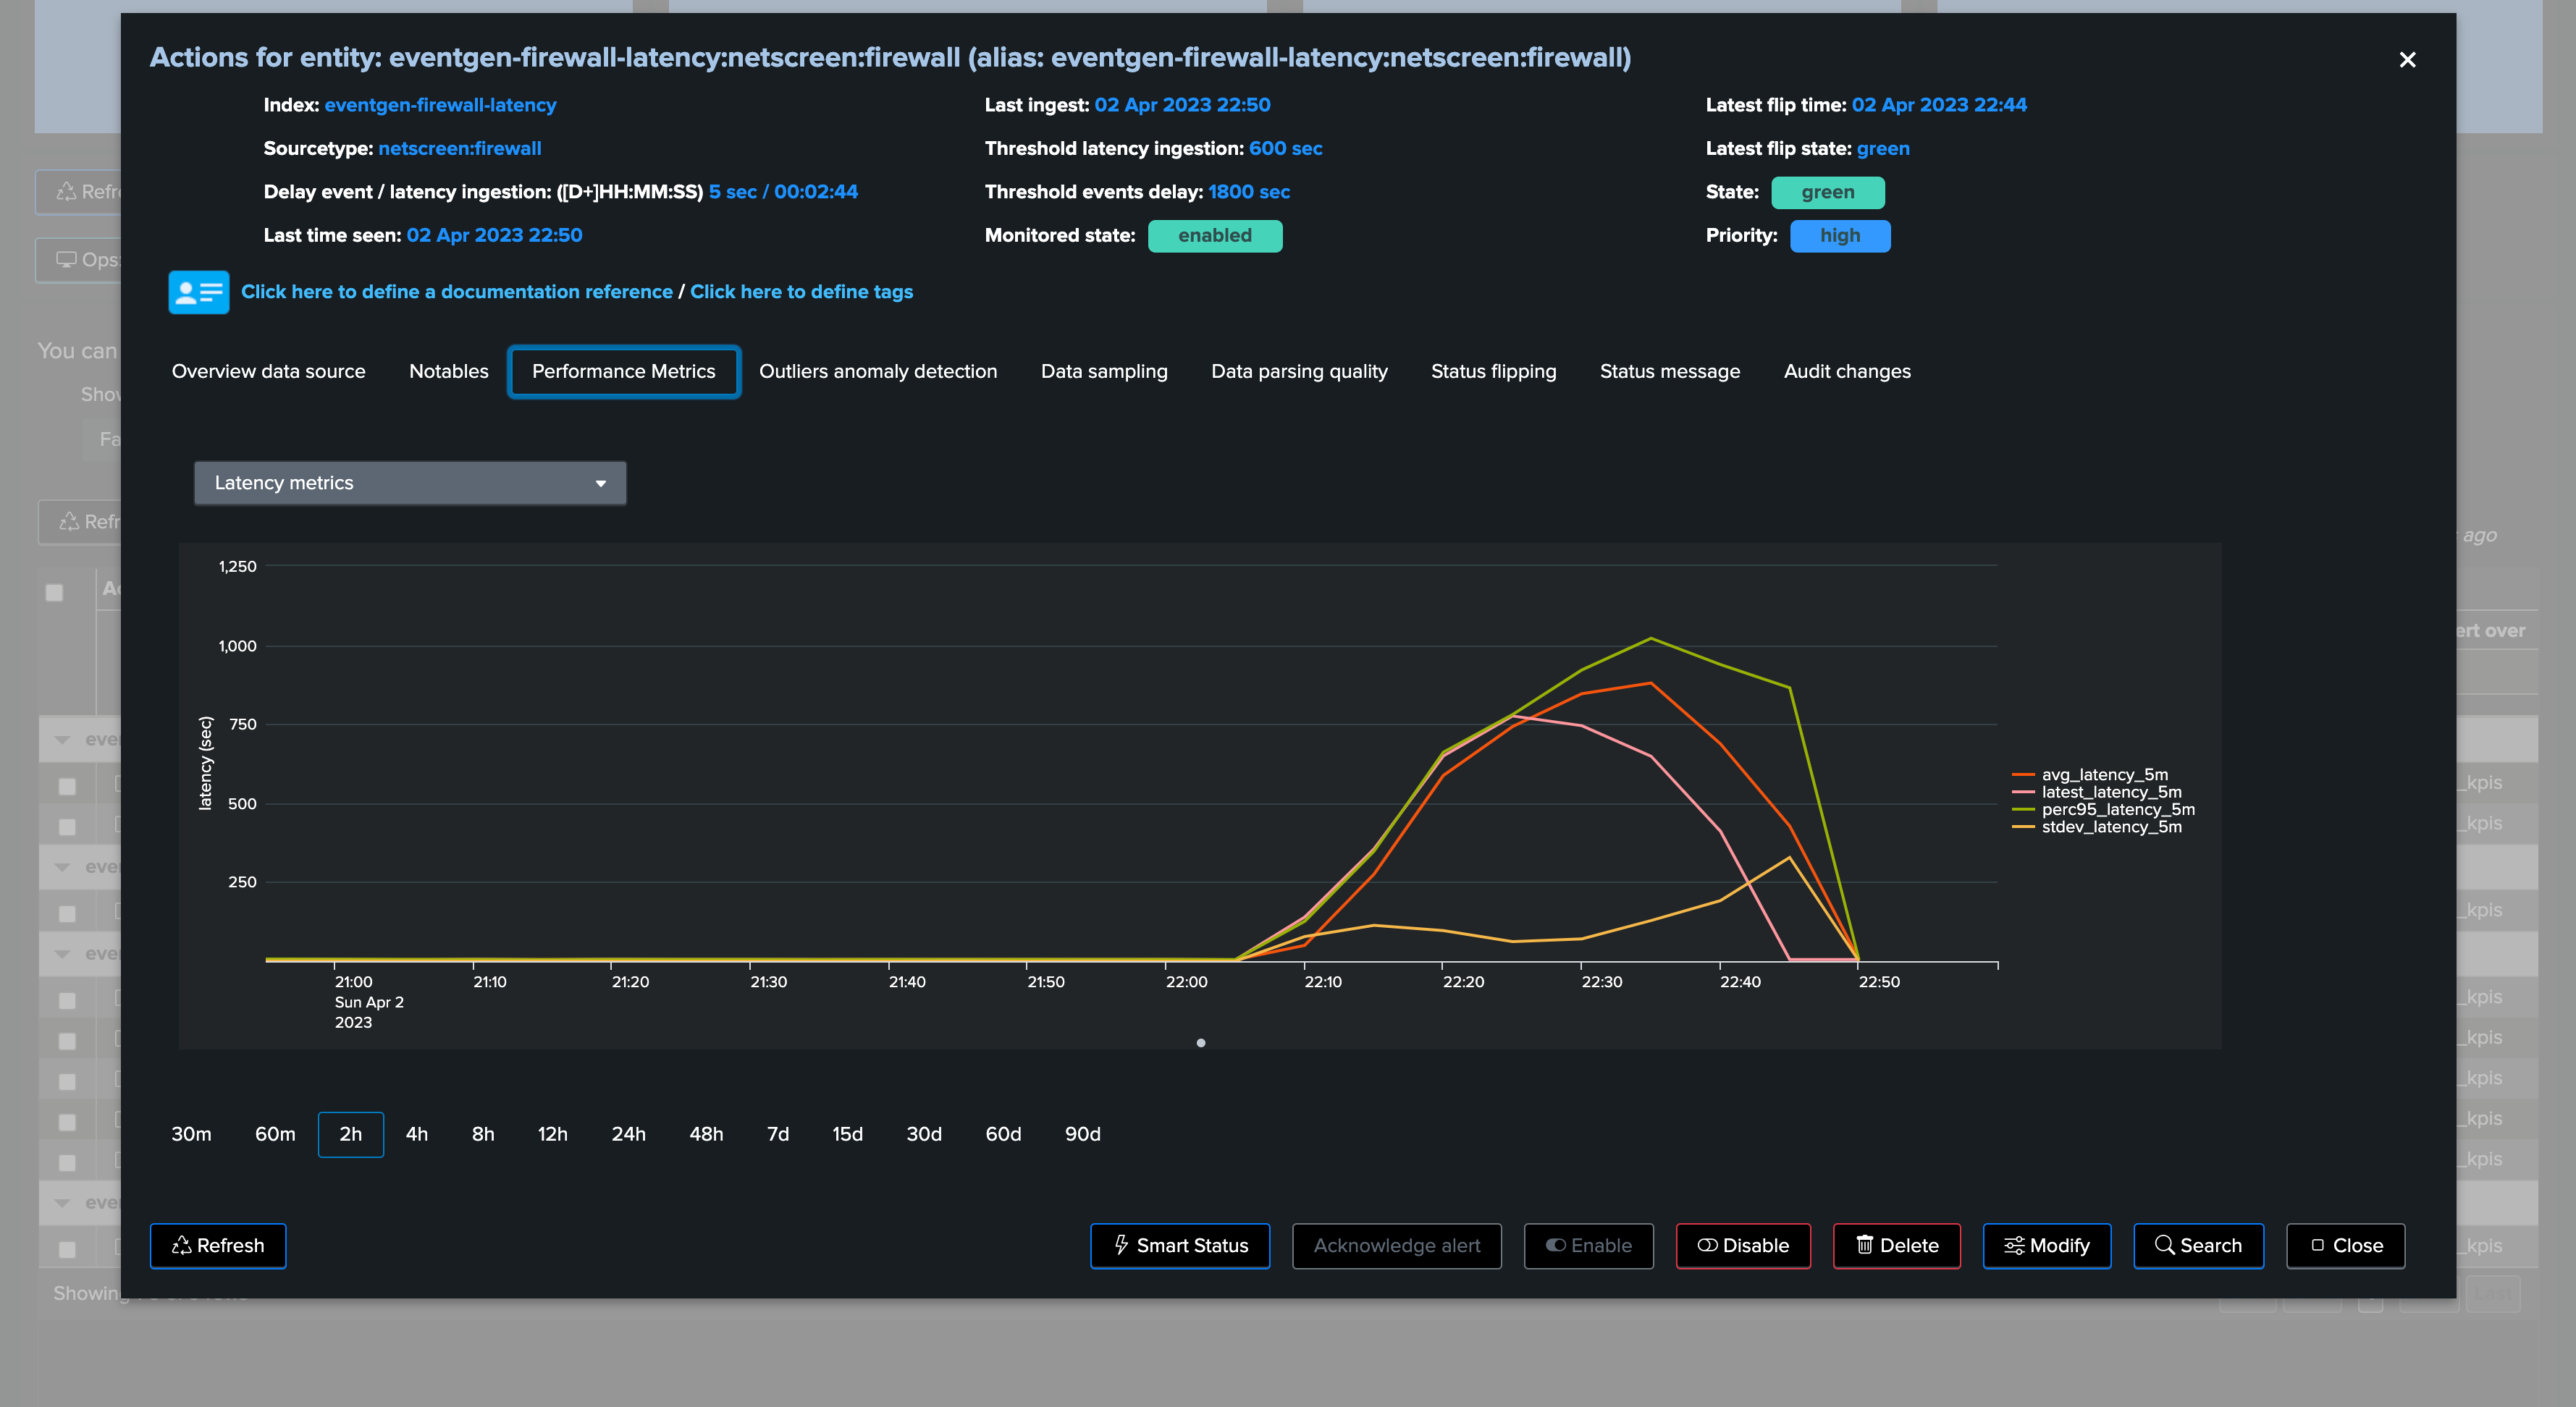
The following entity breached a pre-defined set of thresholds for delay and latency, TrackMe shows:
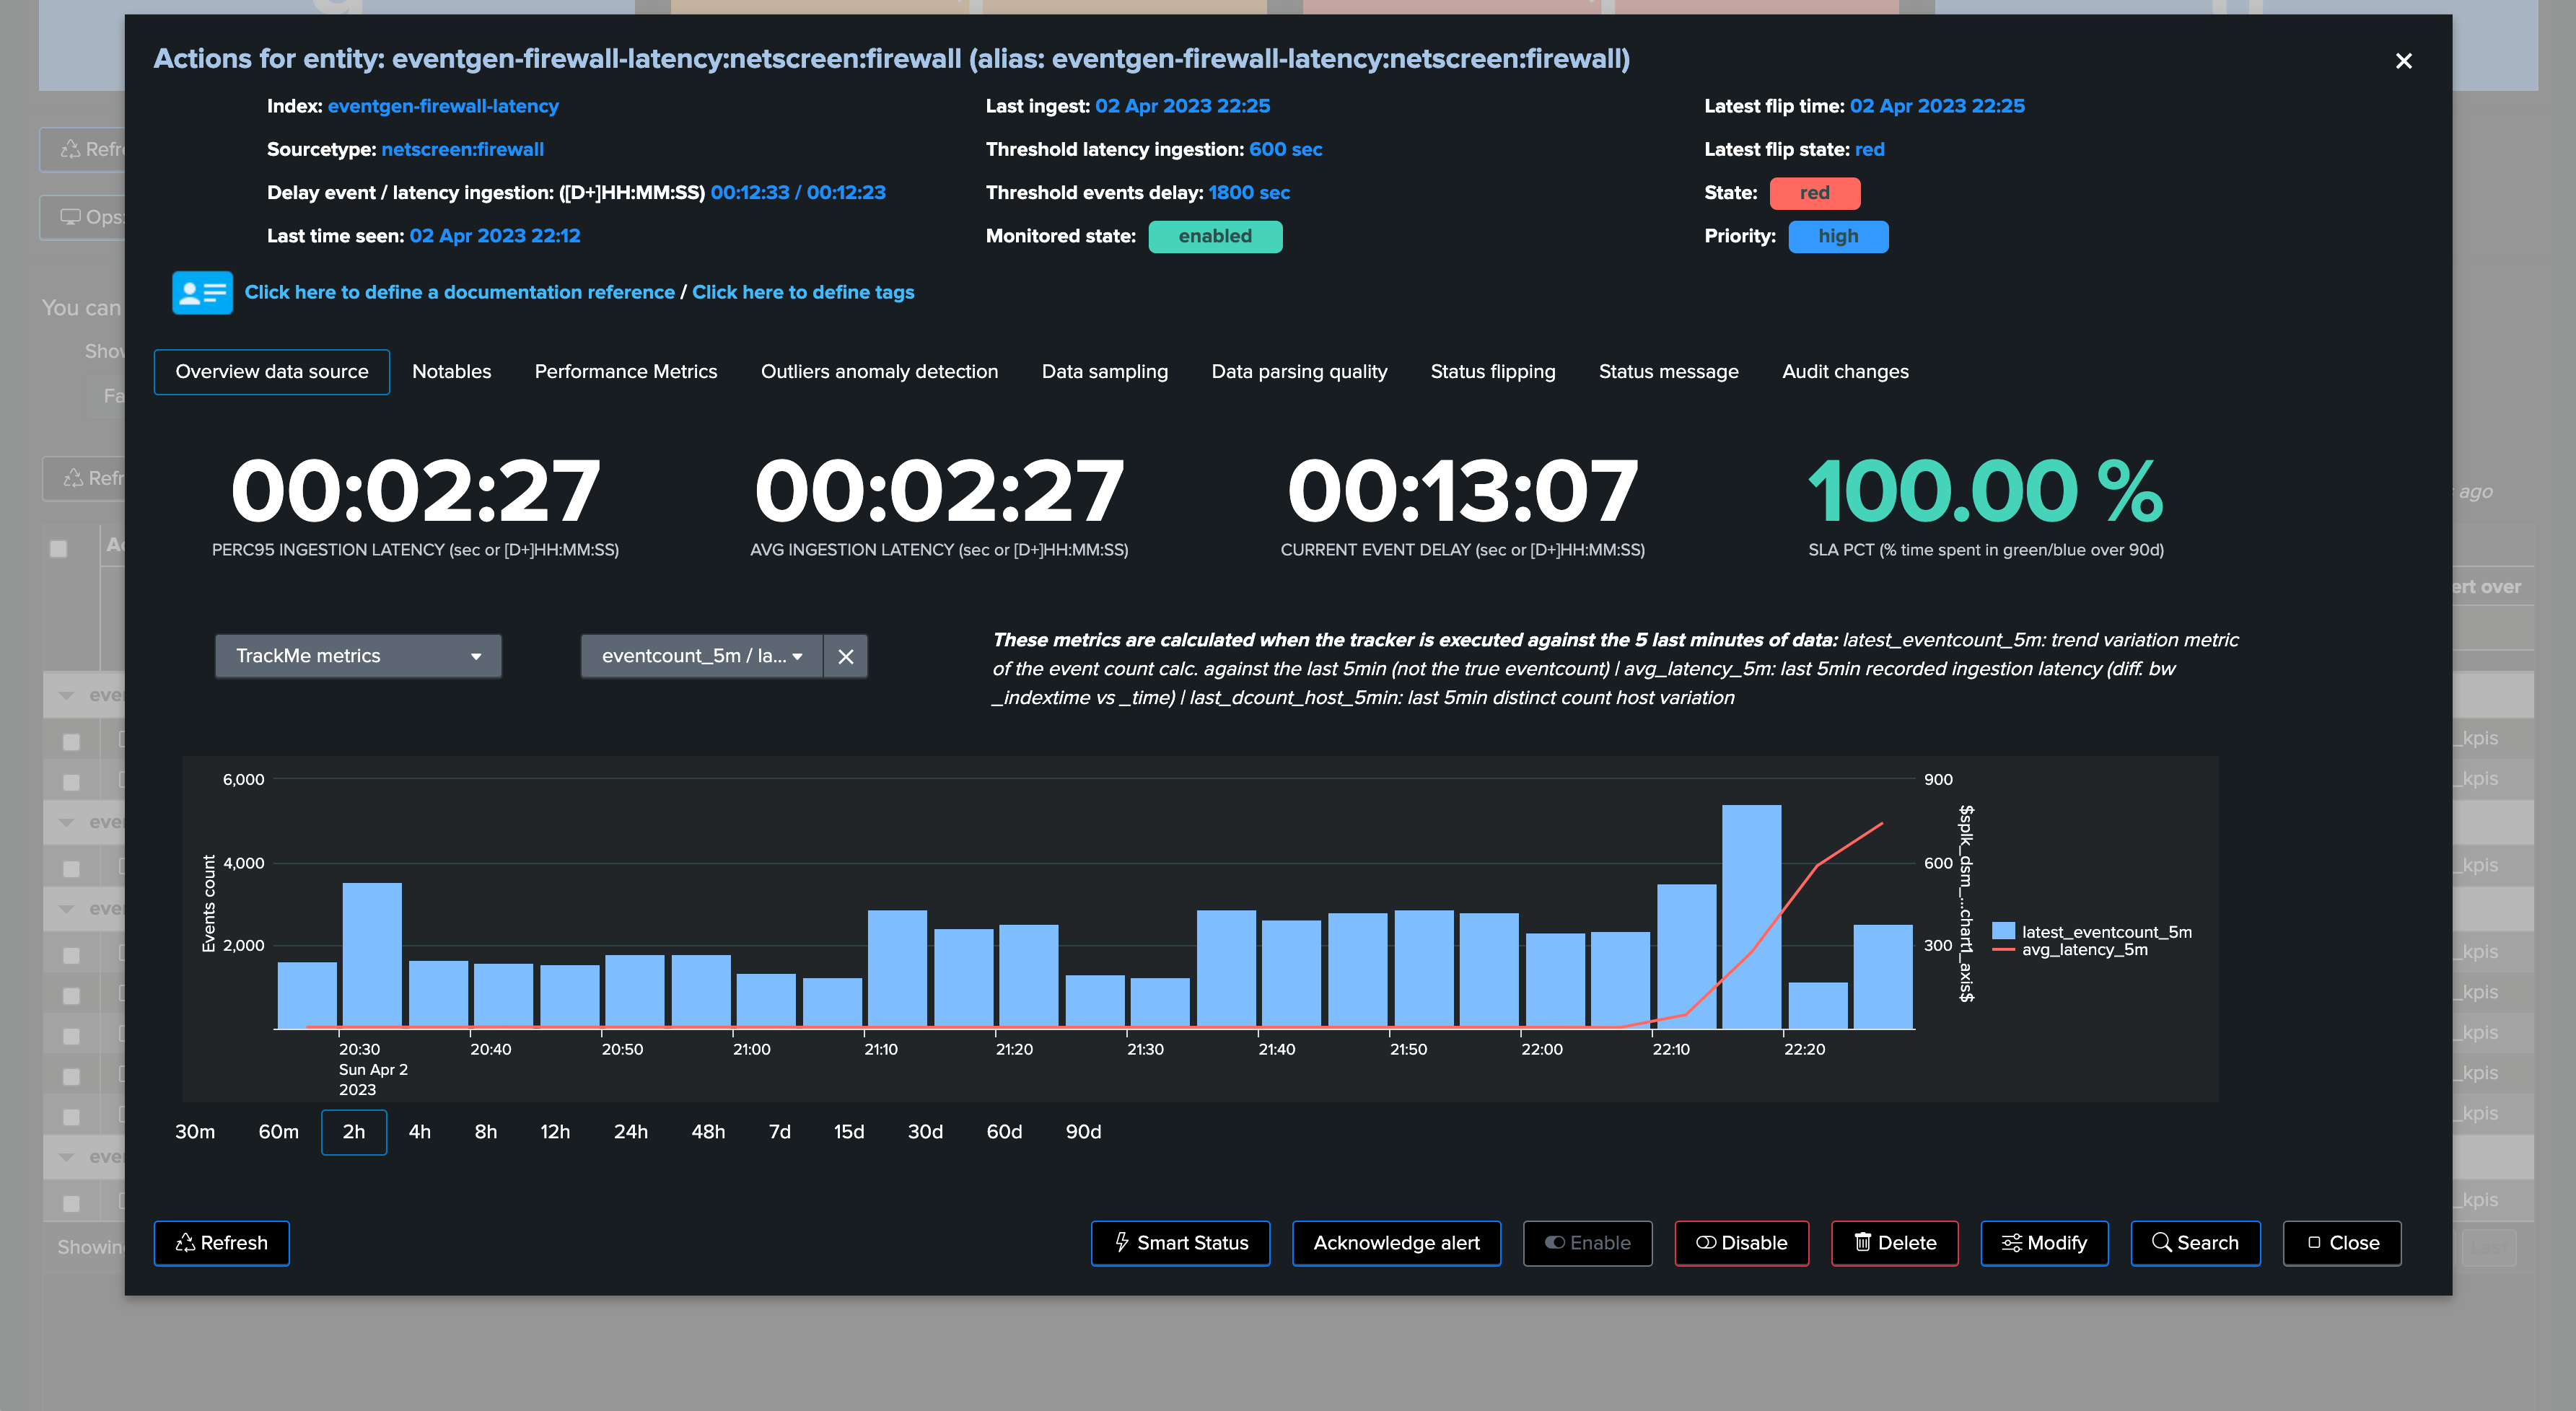
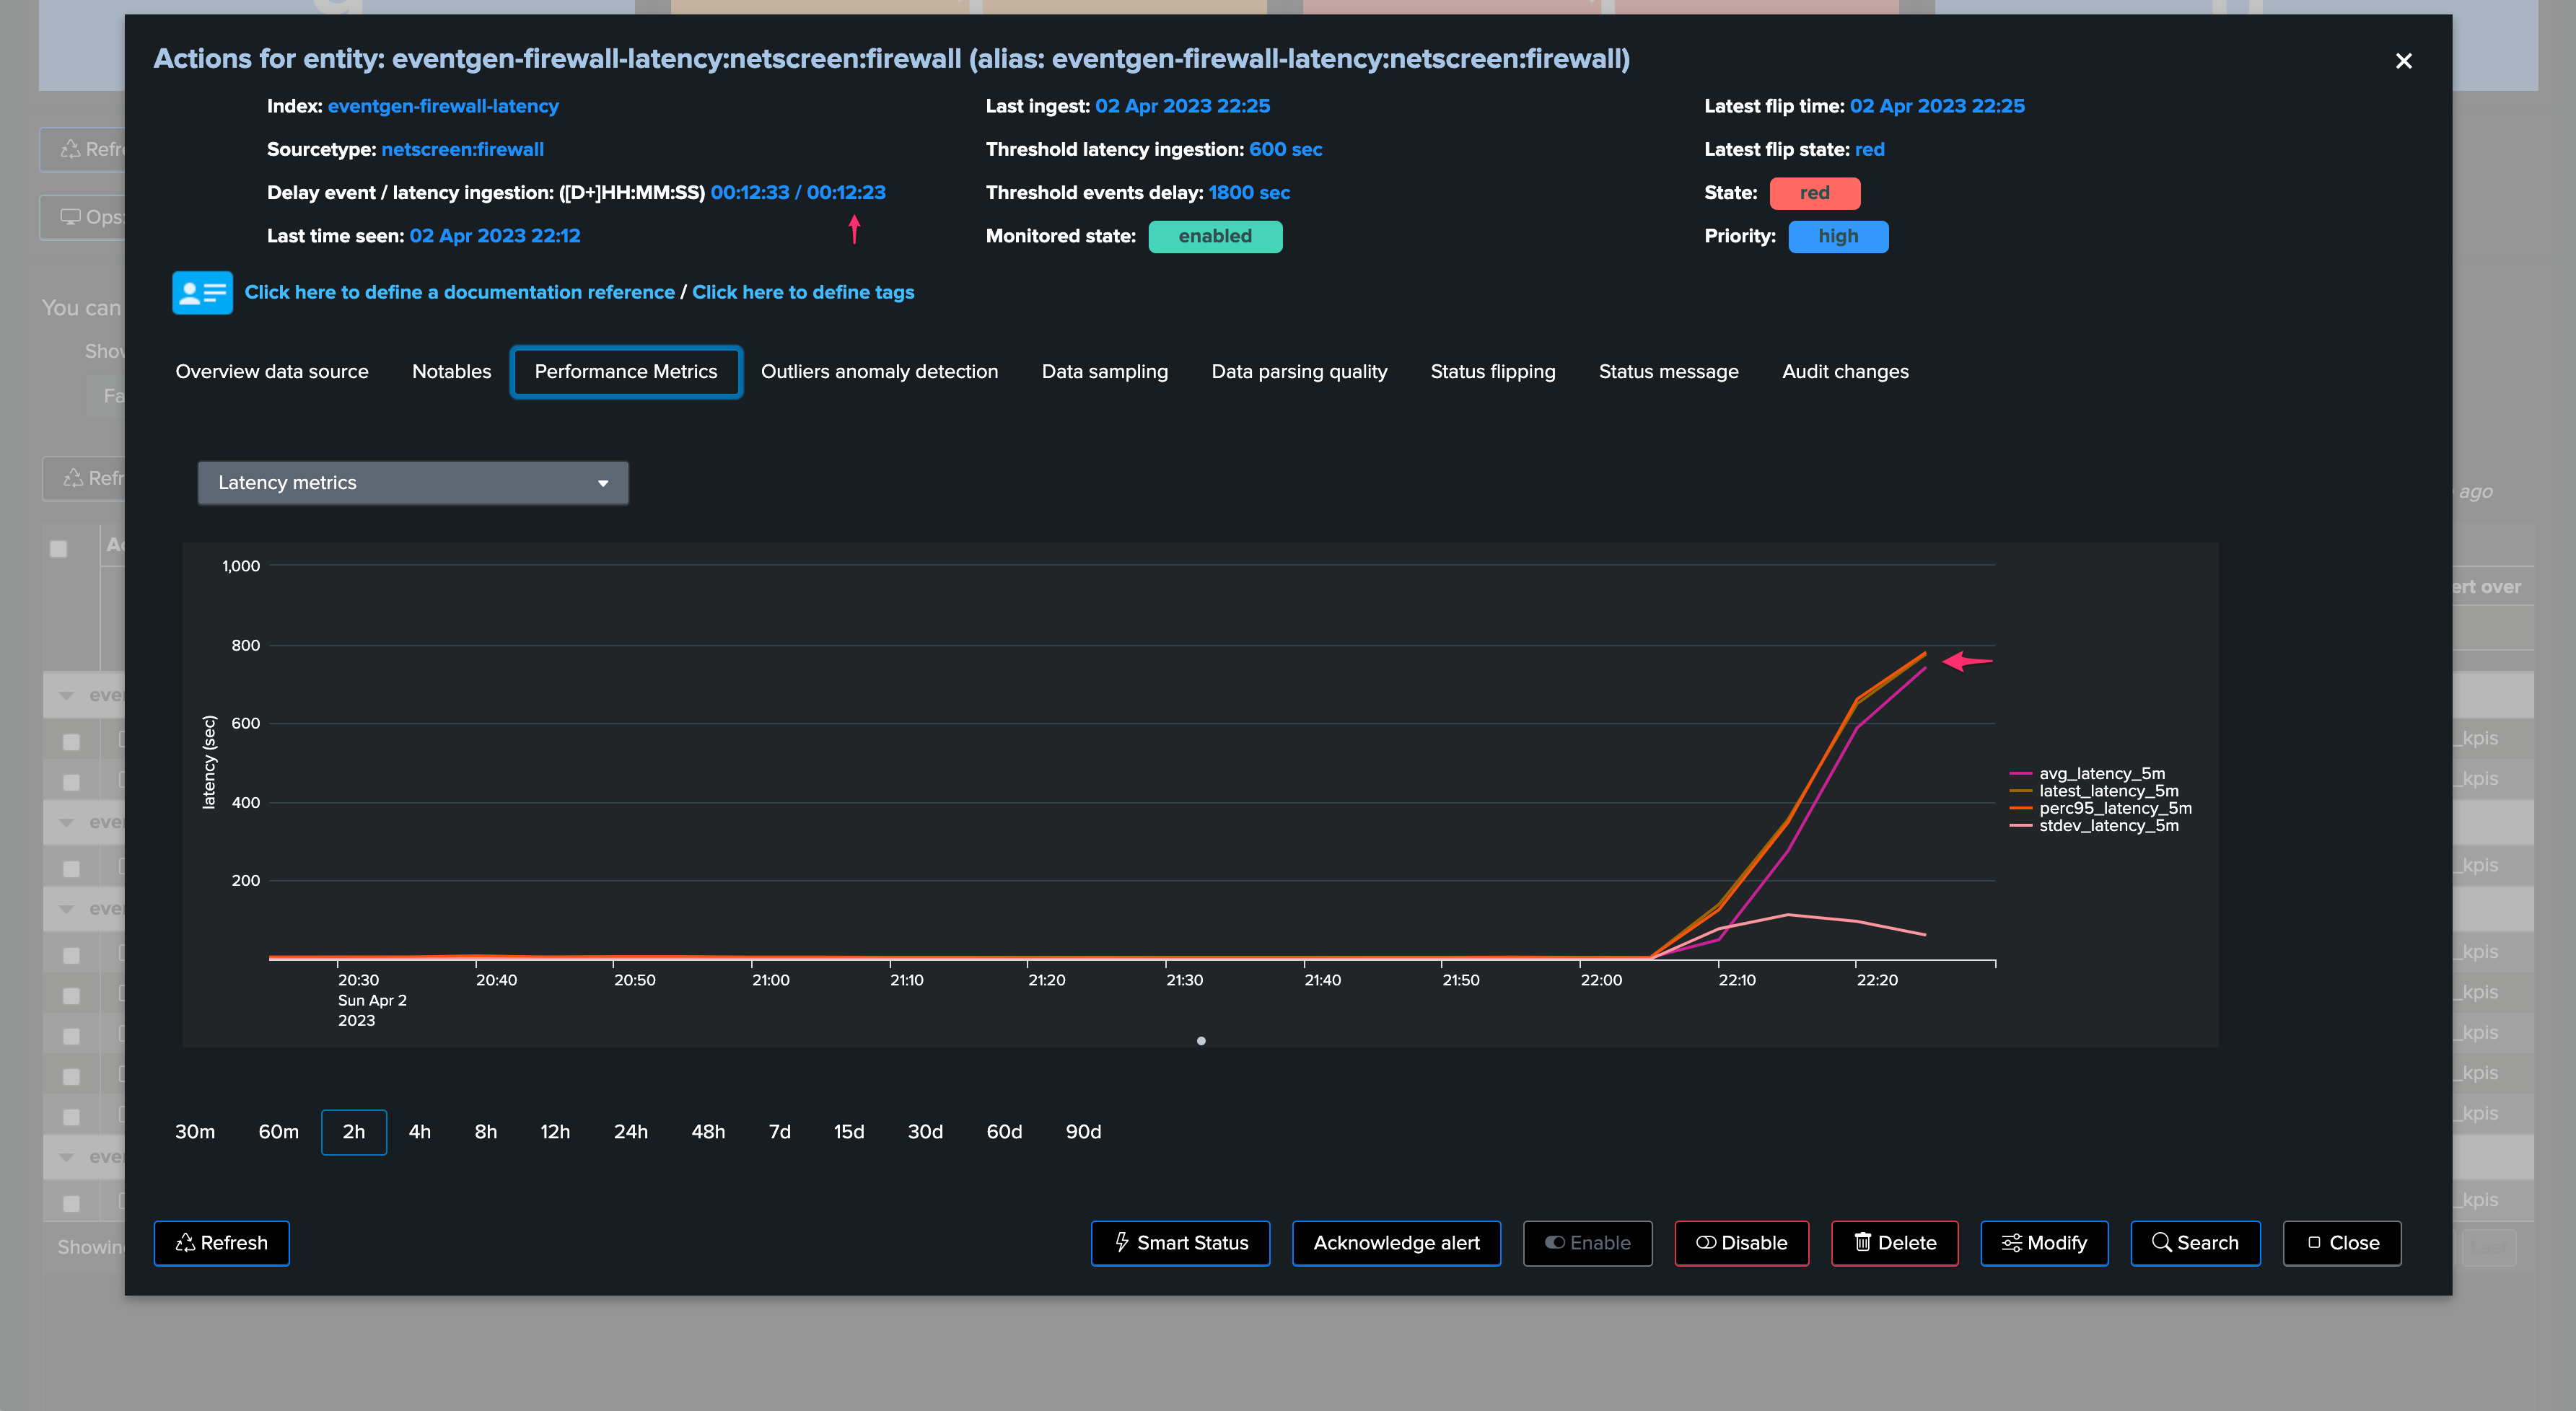
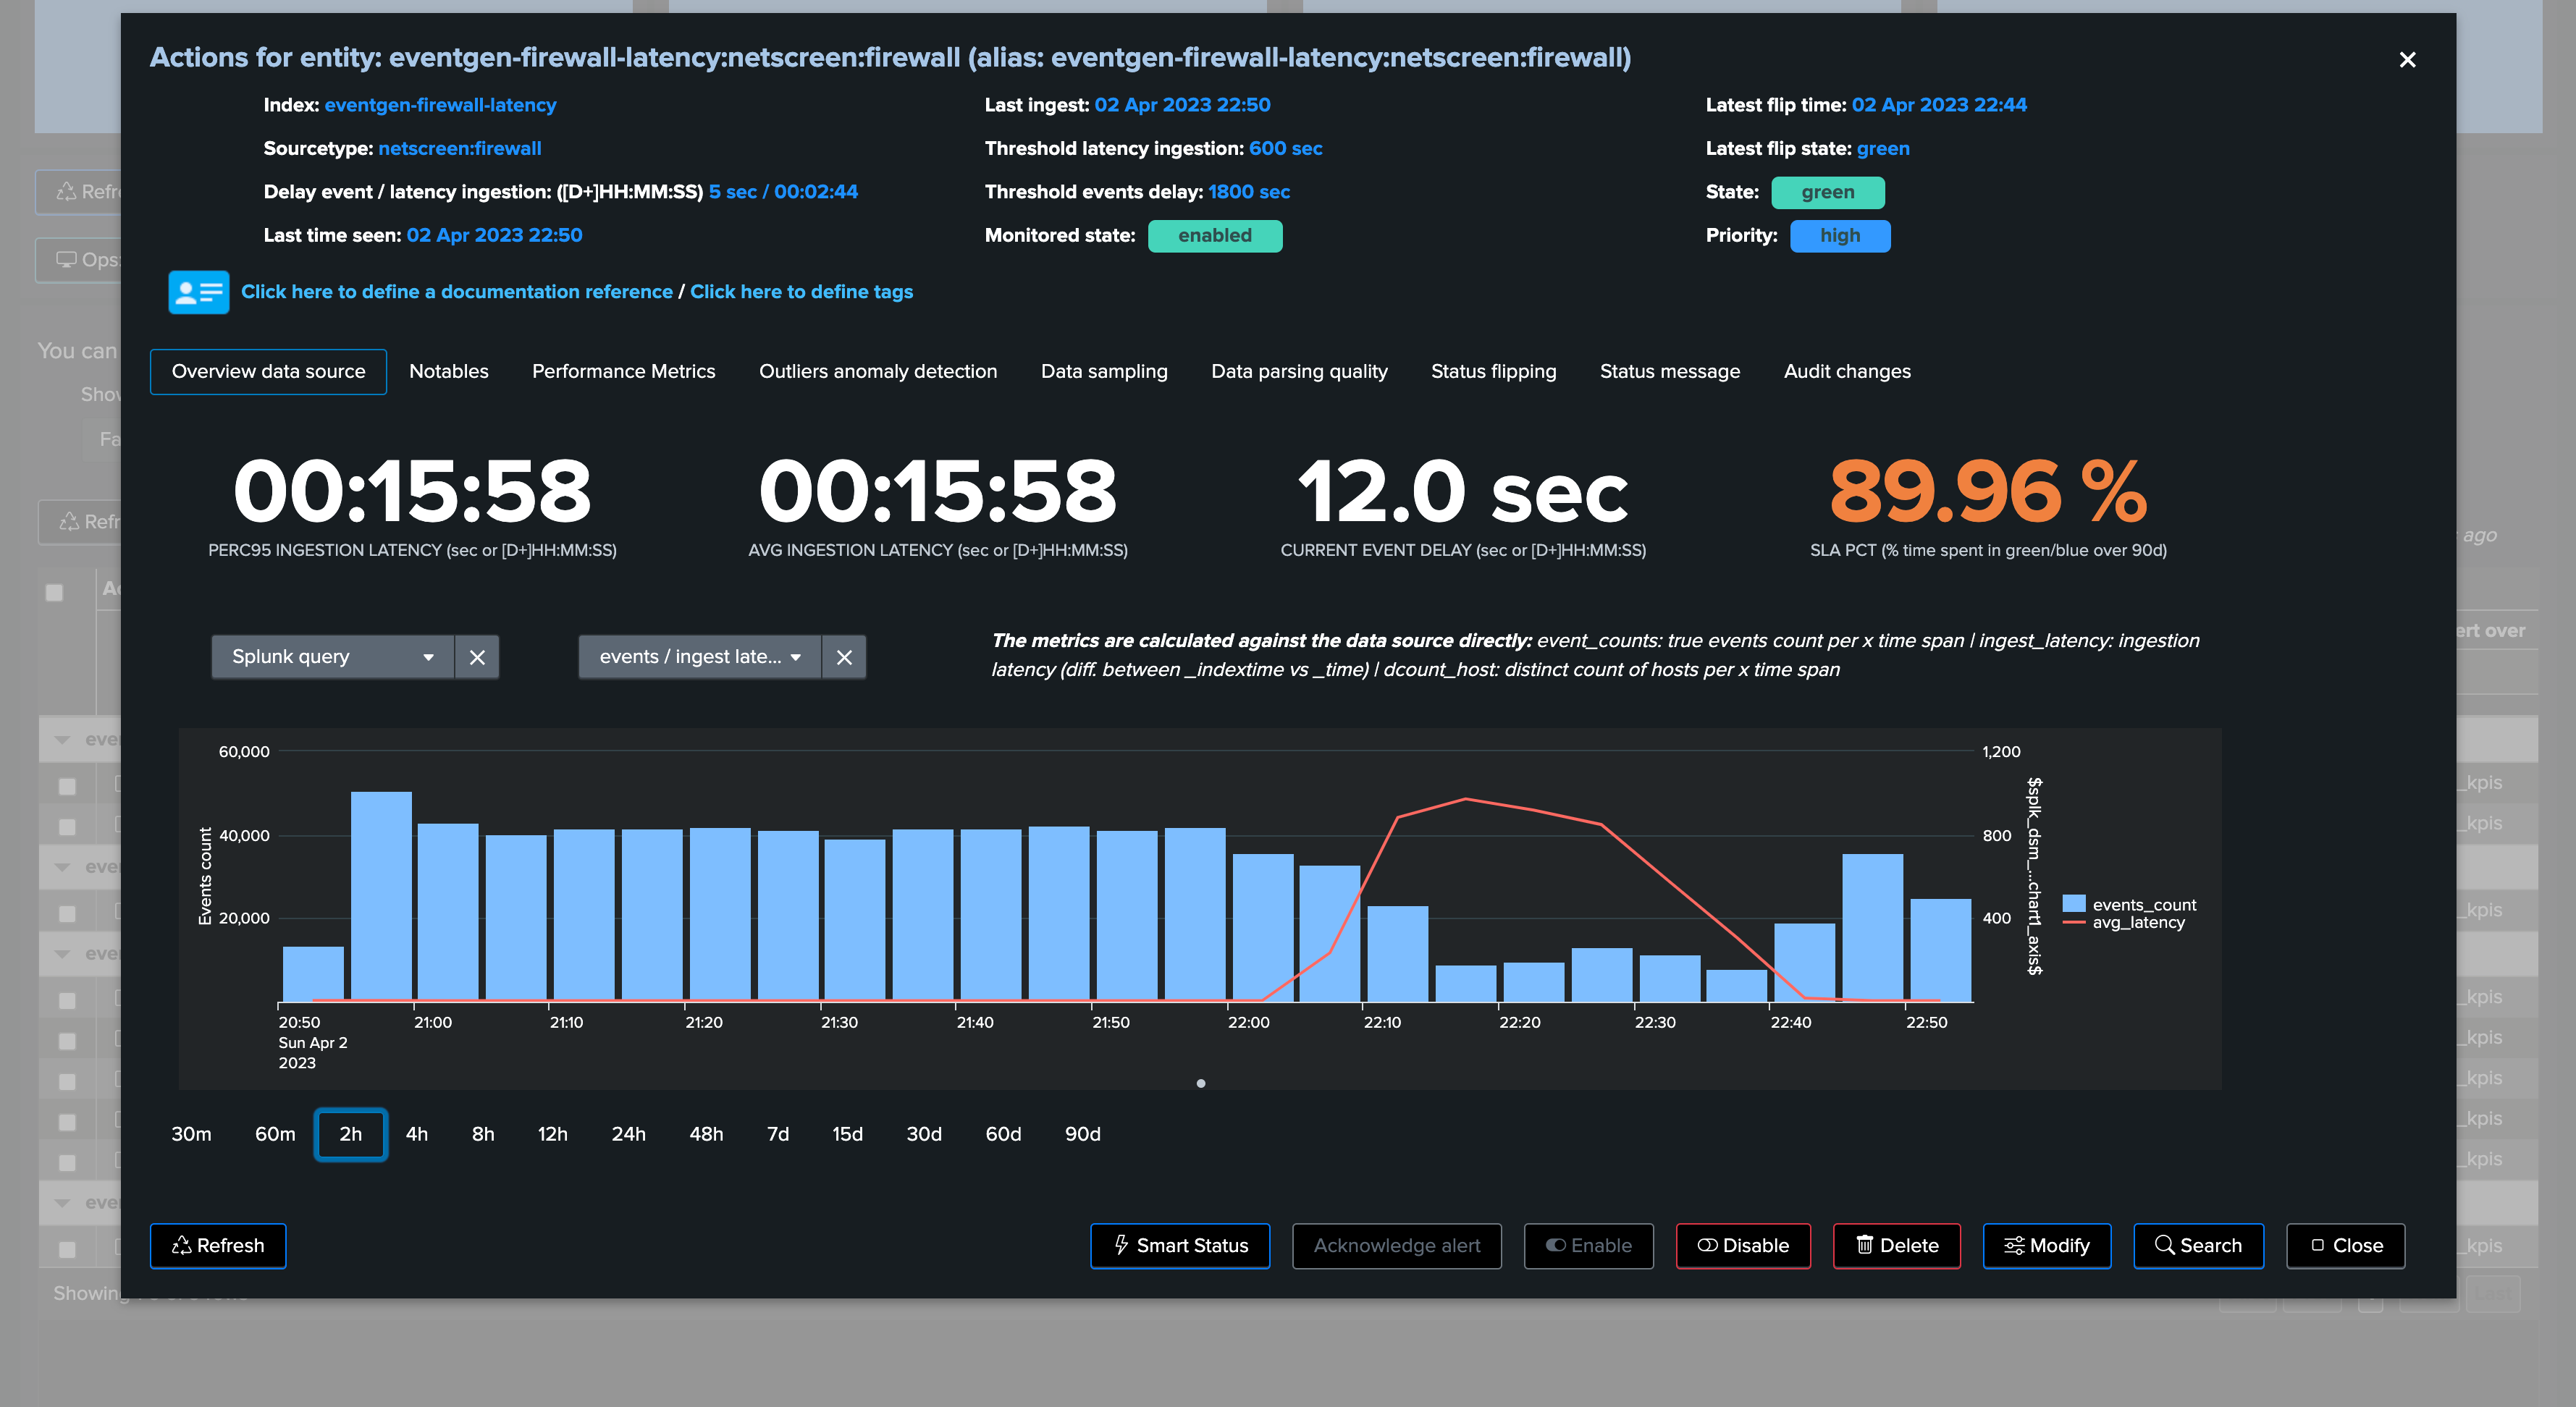
We can observe latency increasing for this entity in both the overview chart (based on TrackMe metrics and Splunk queries), as well as the Performance Metrics chart:
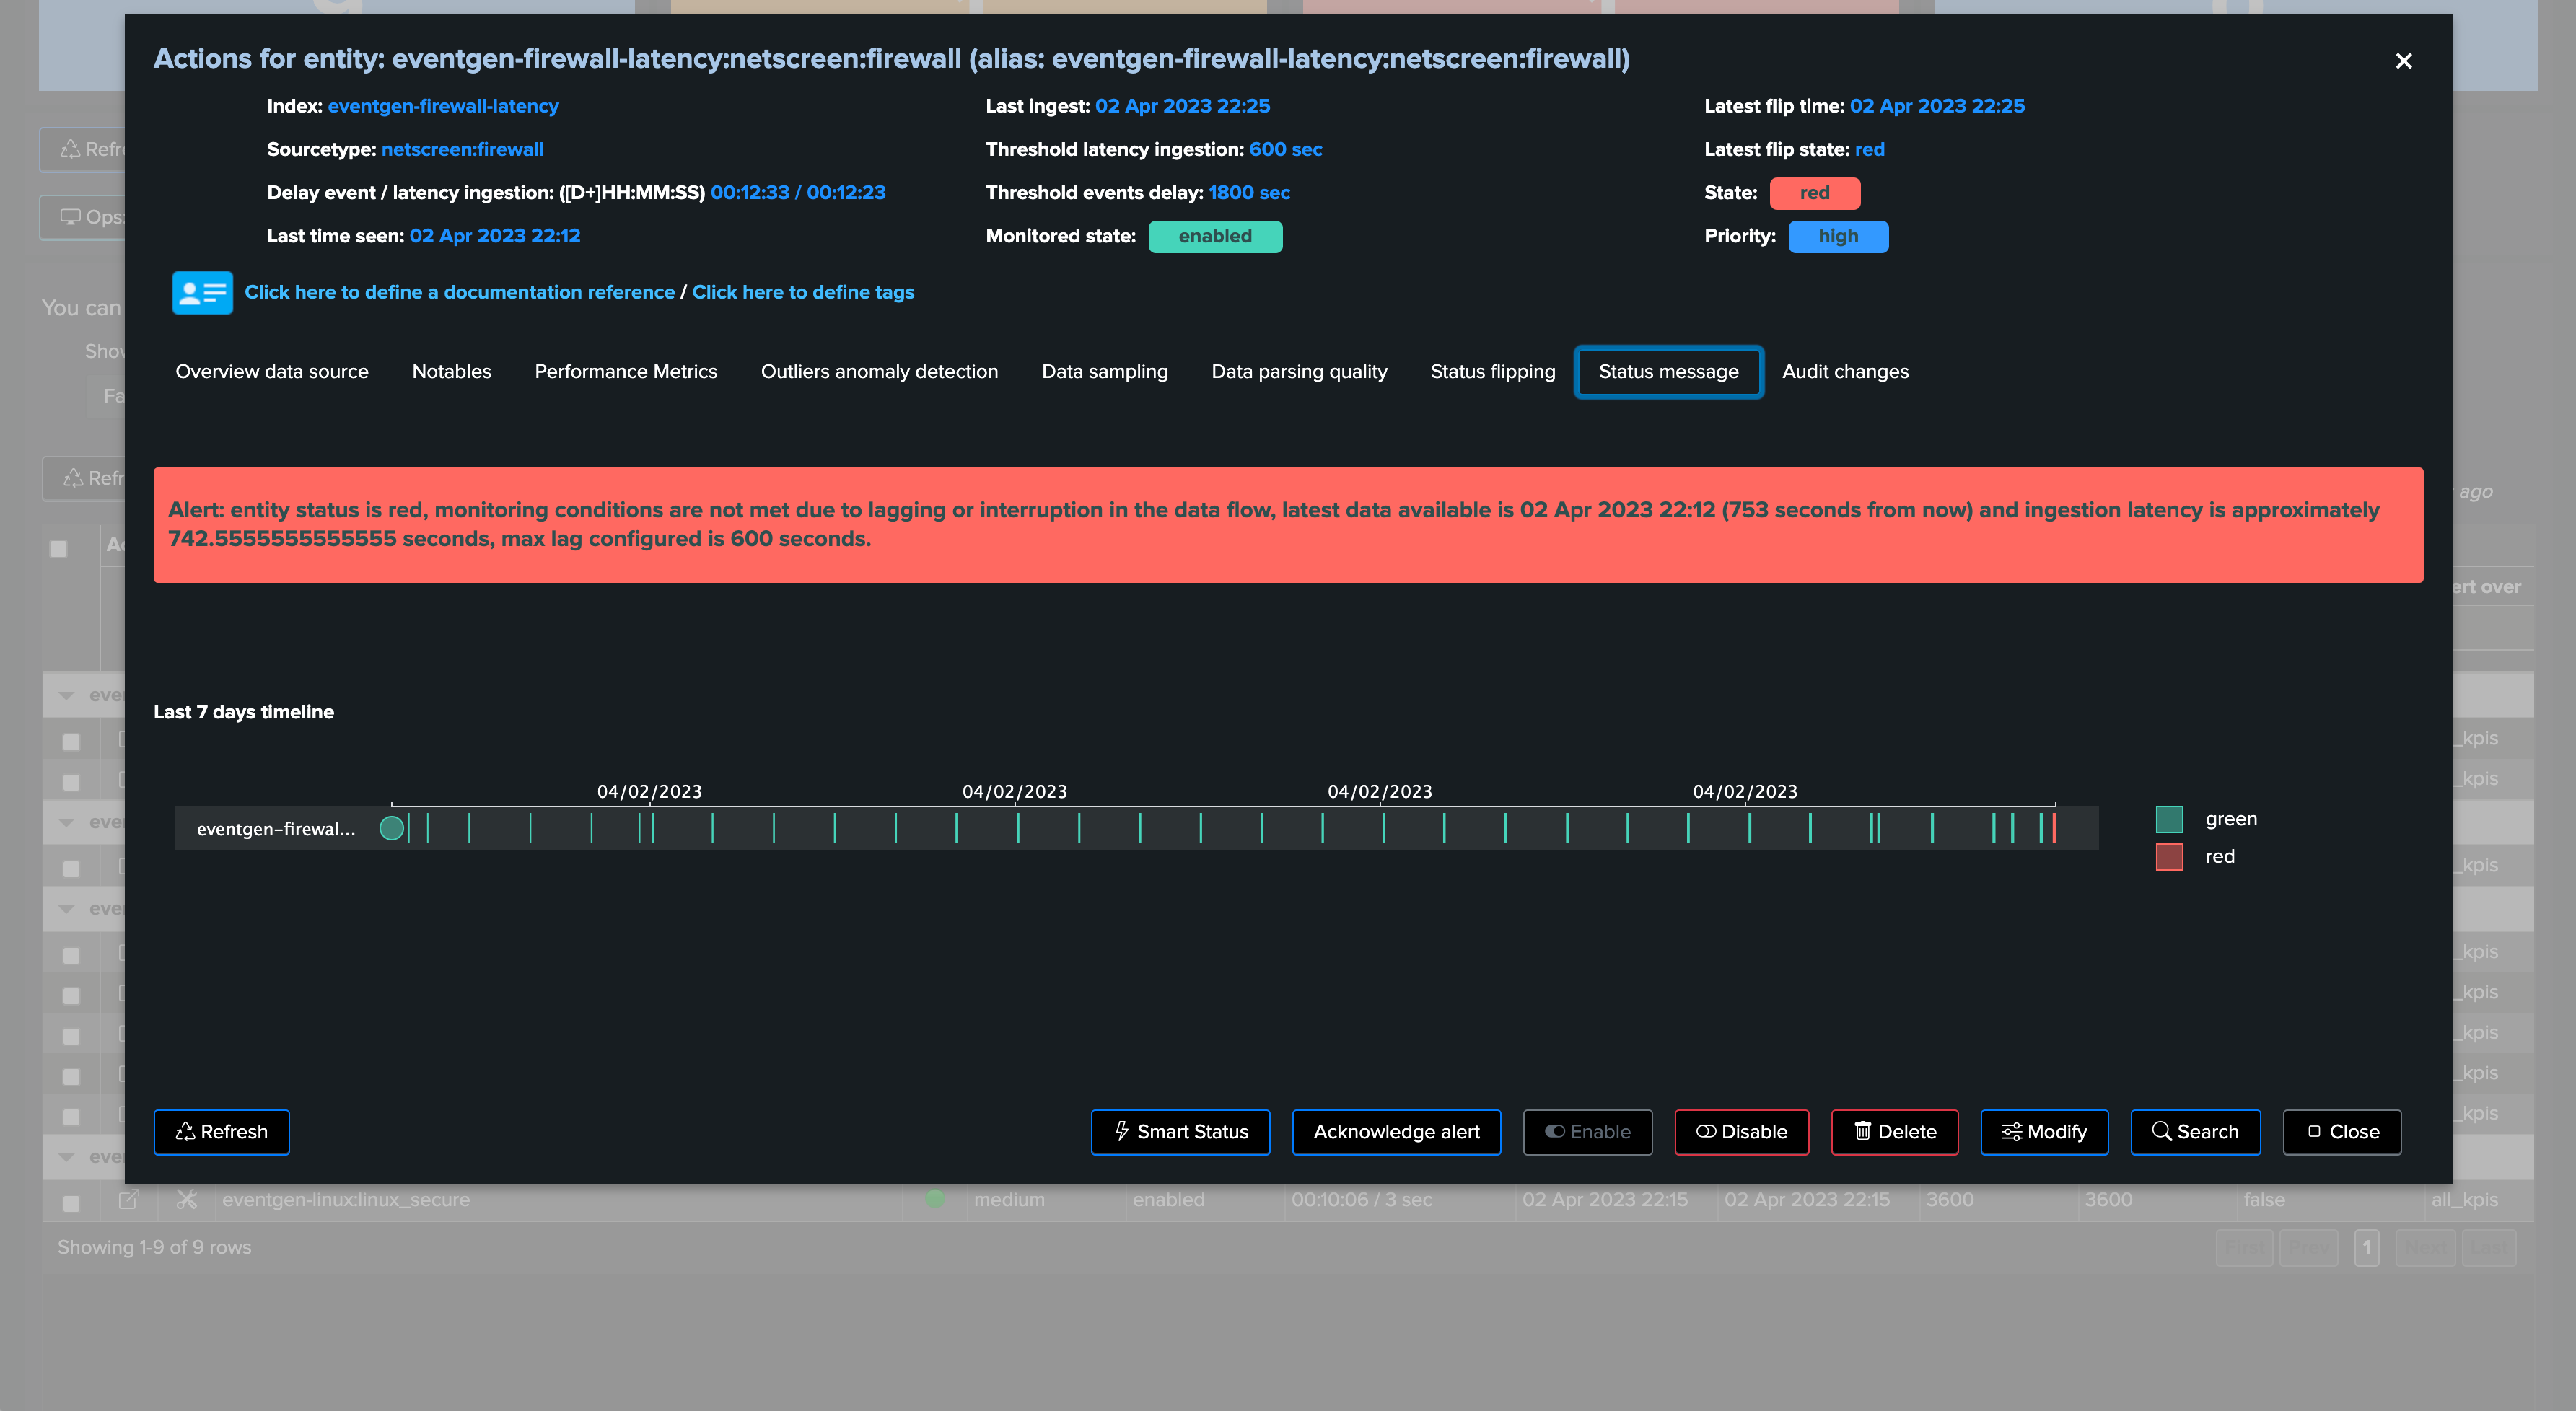
The Status Message shows a clear explanation about the issue that affects the entity:
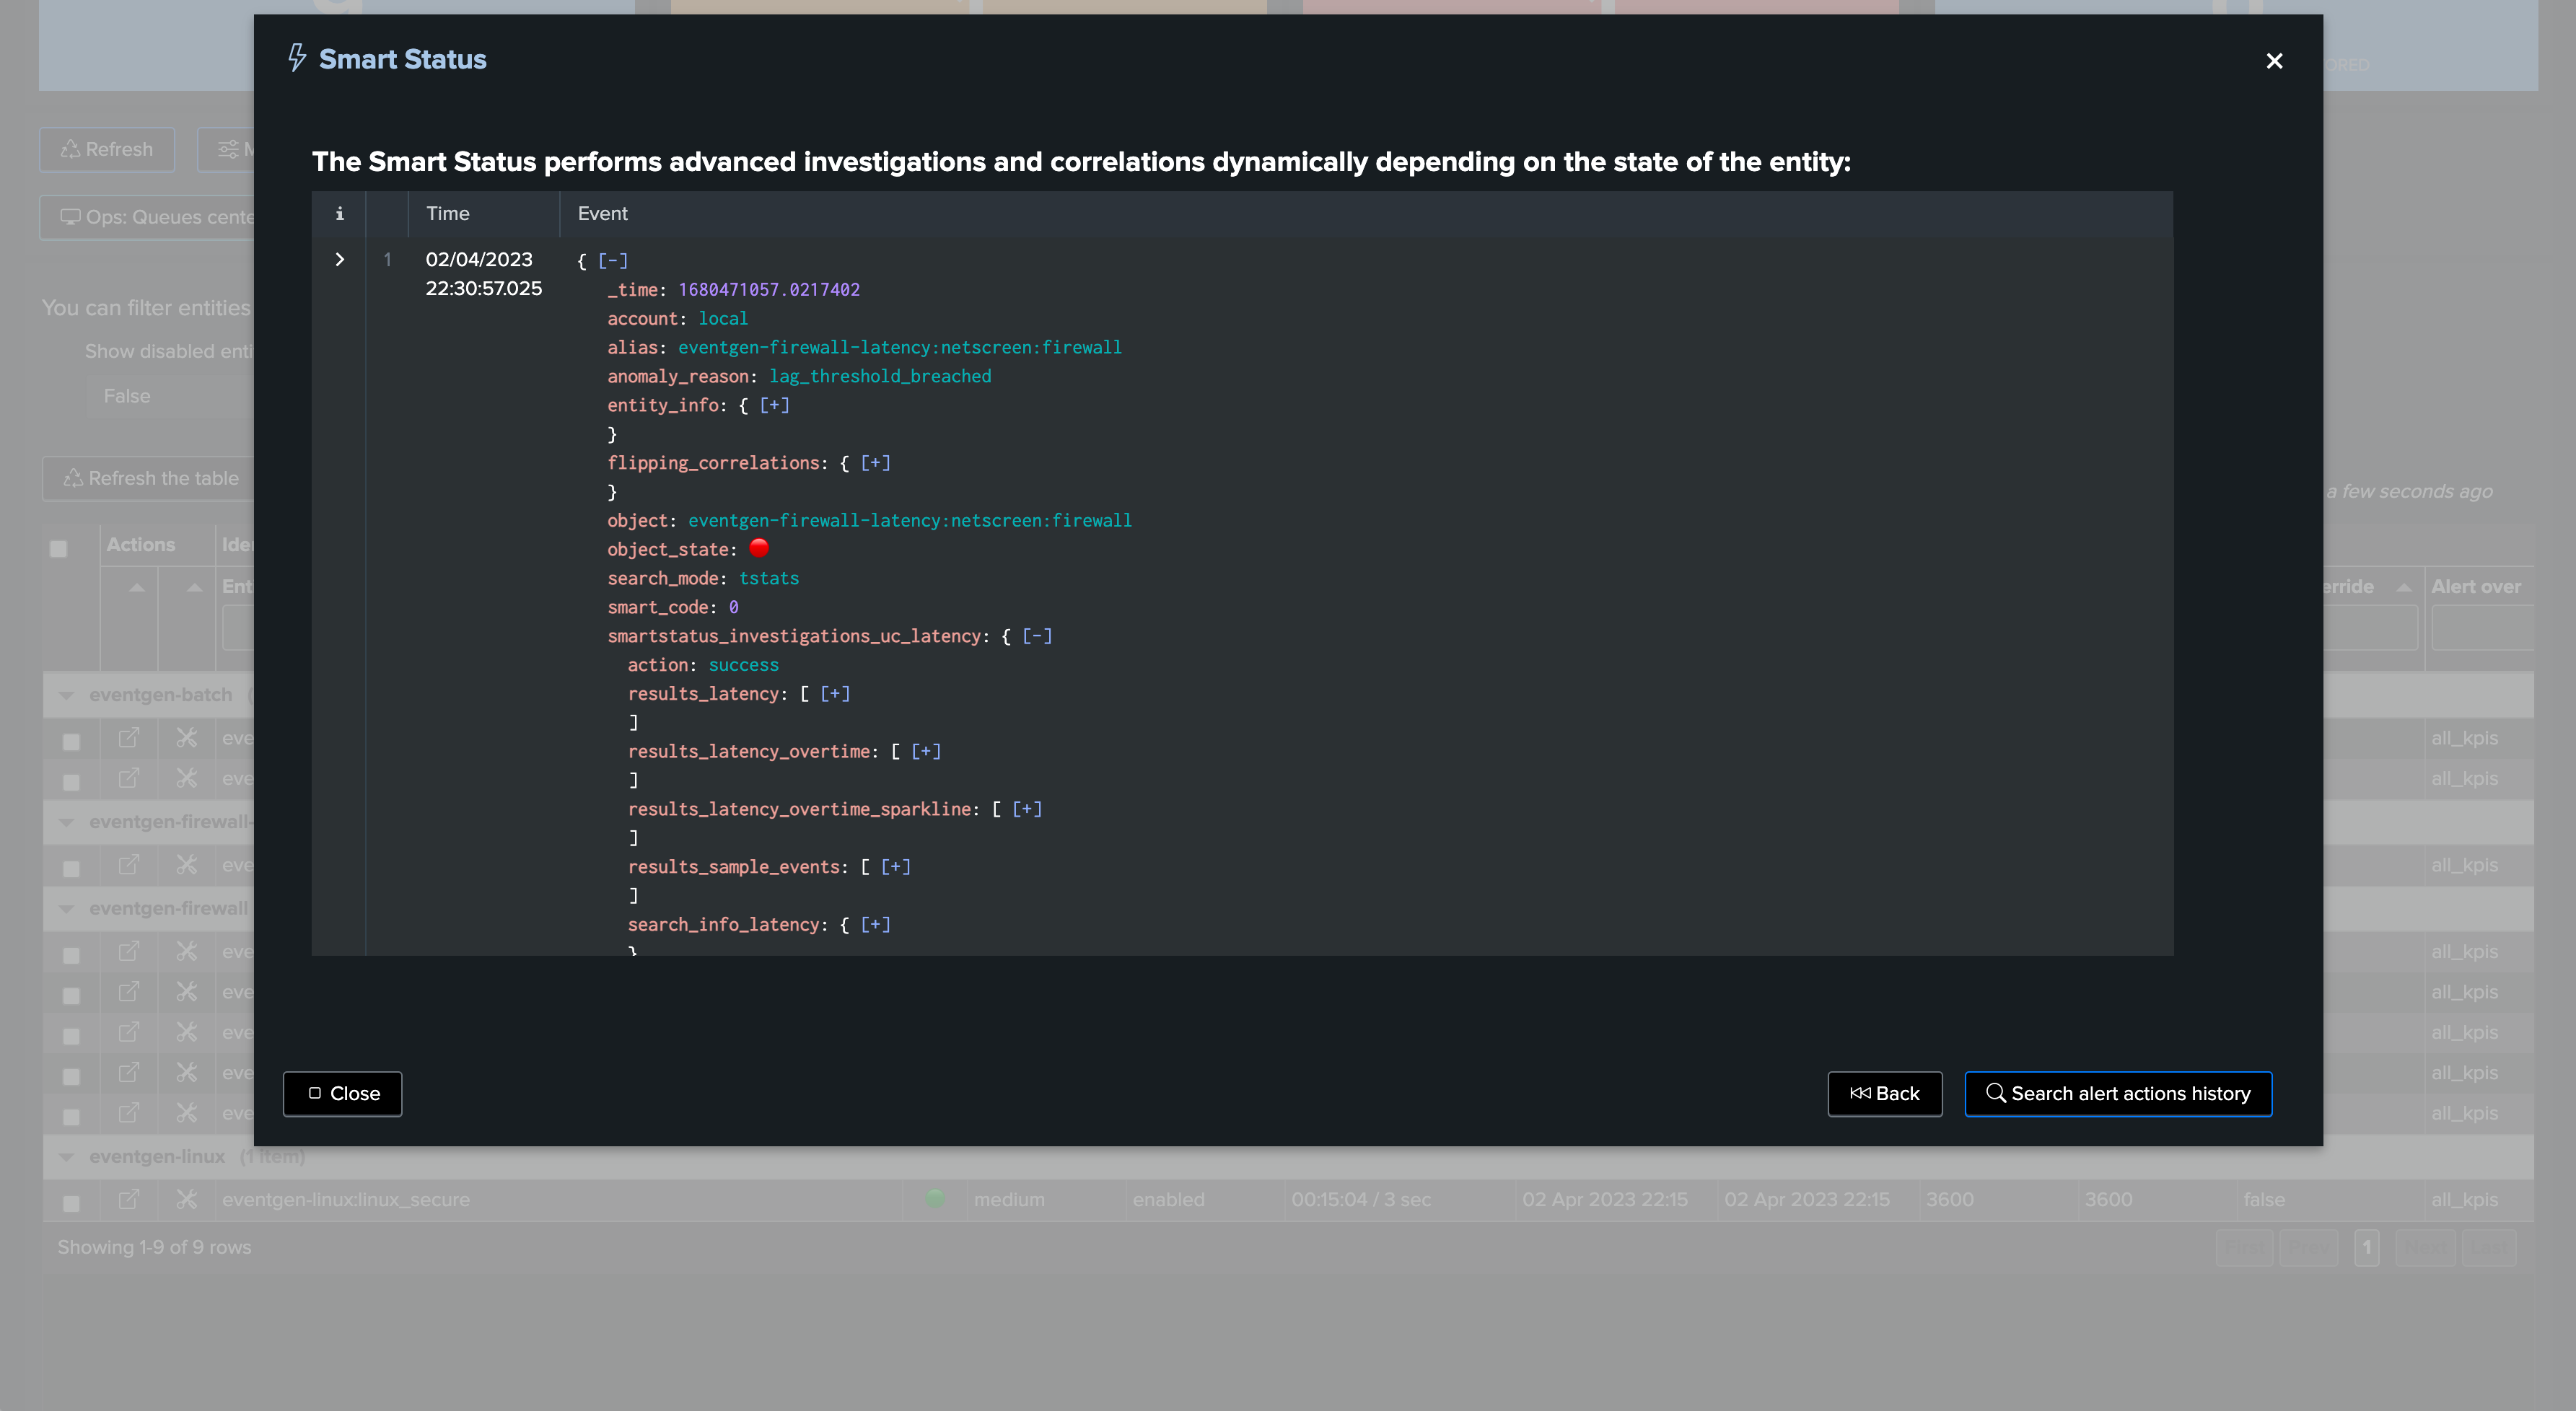
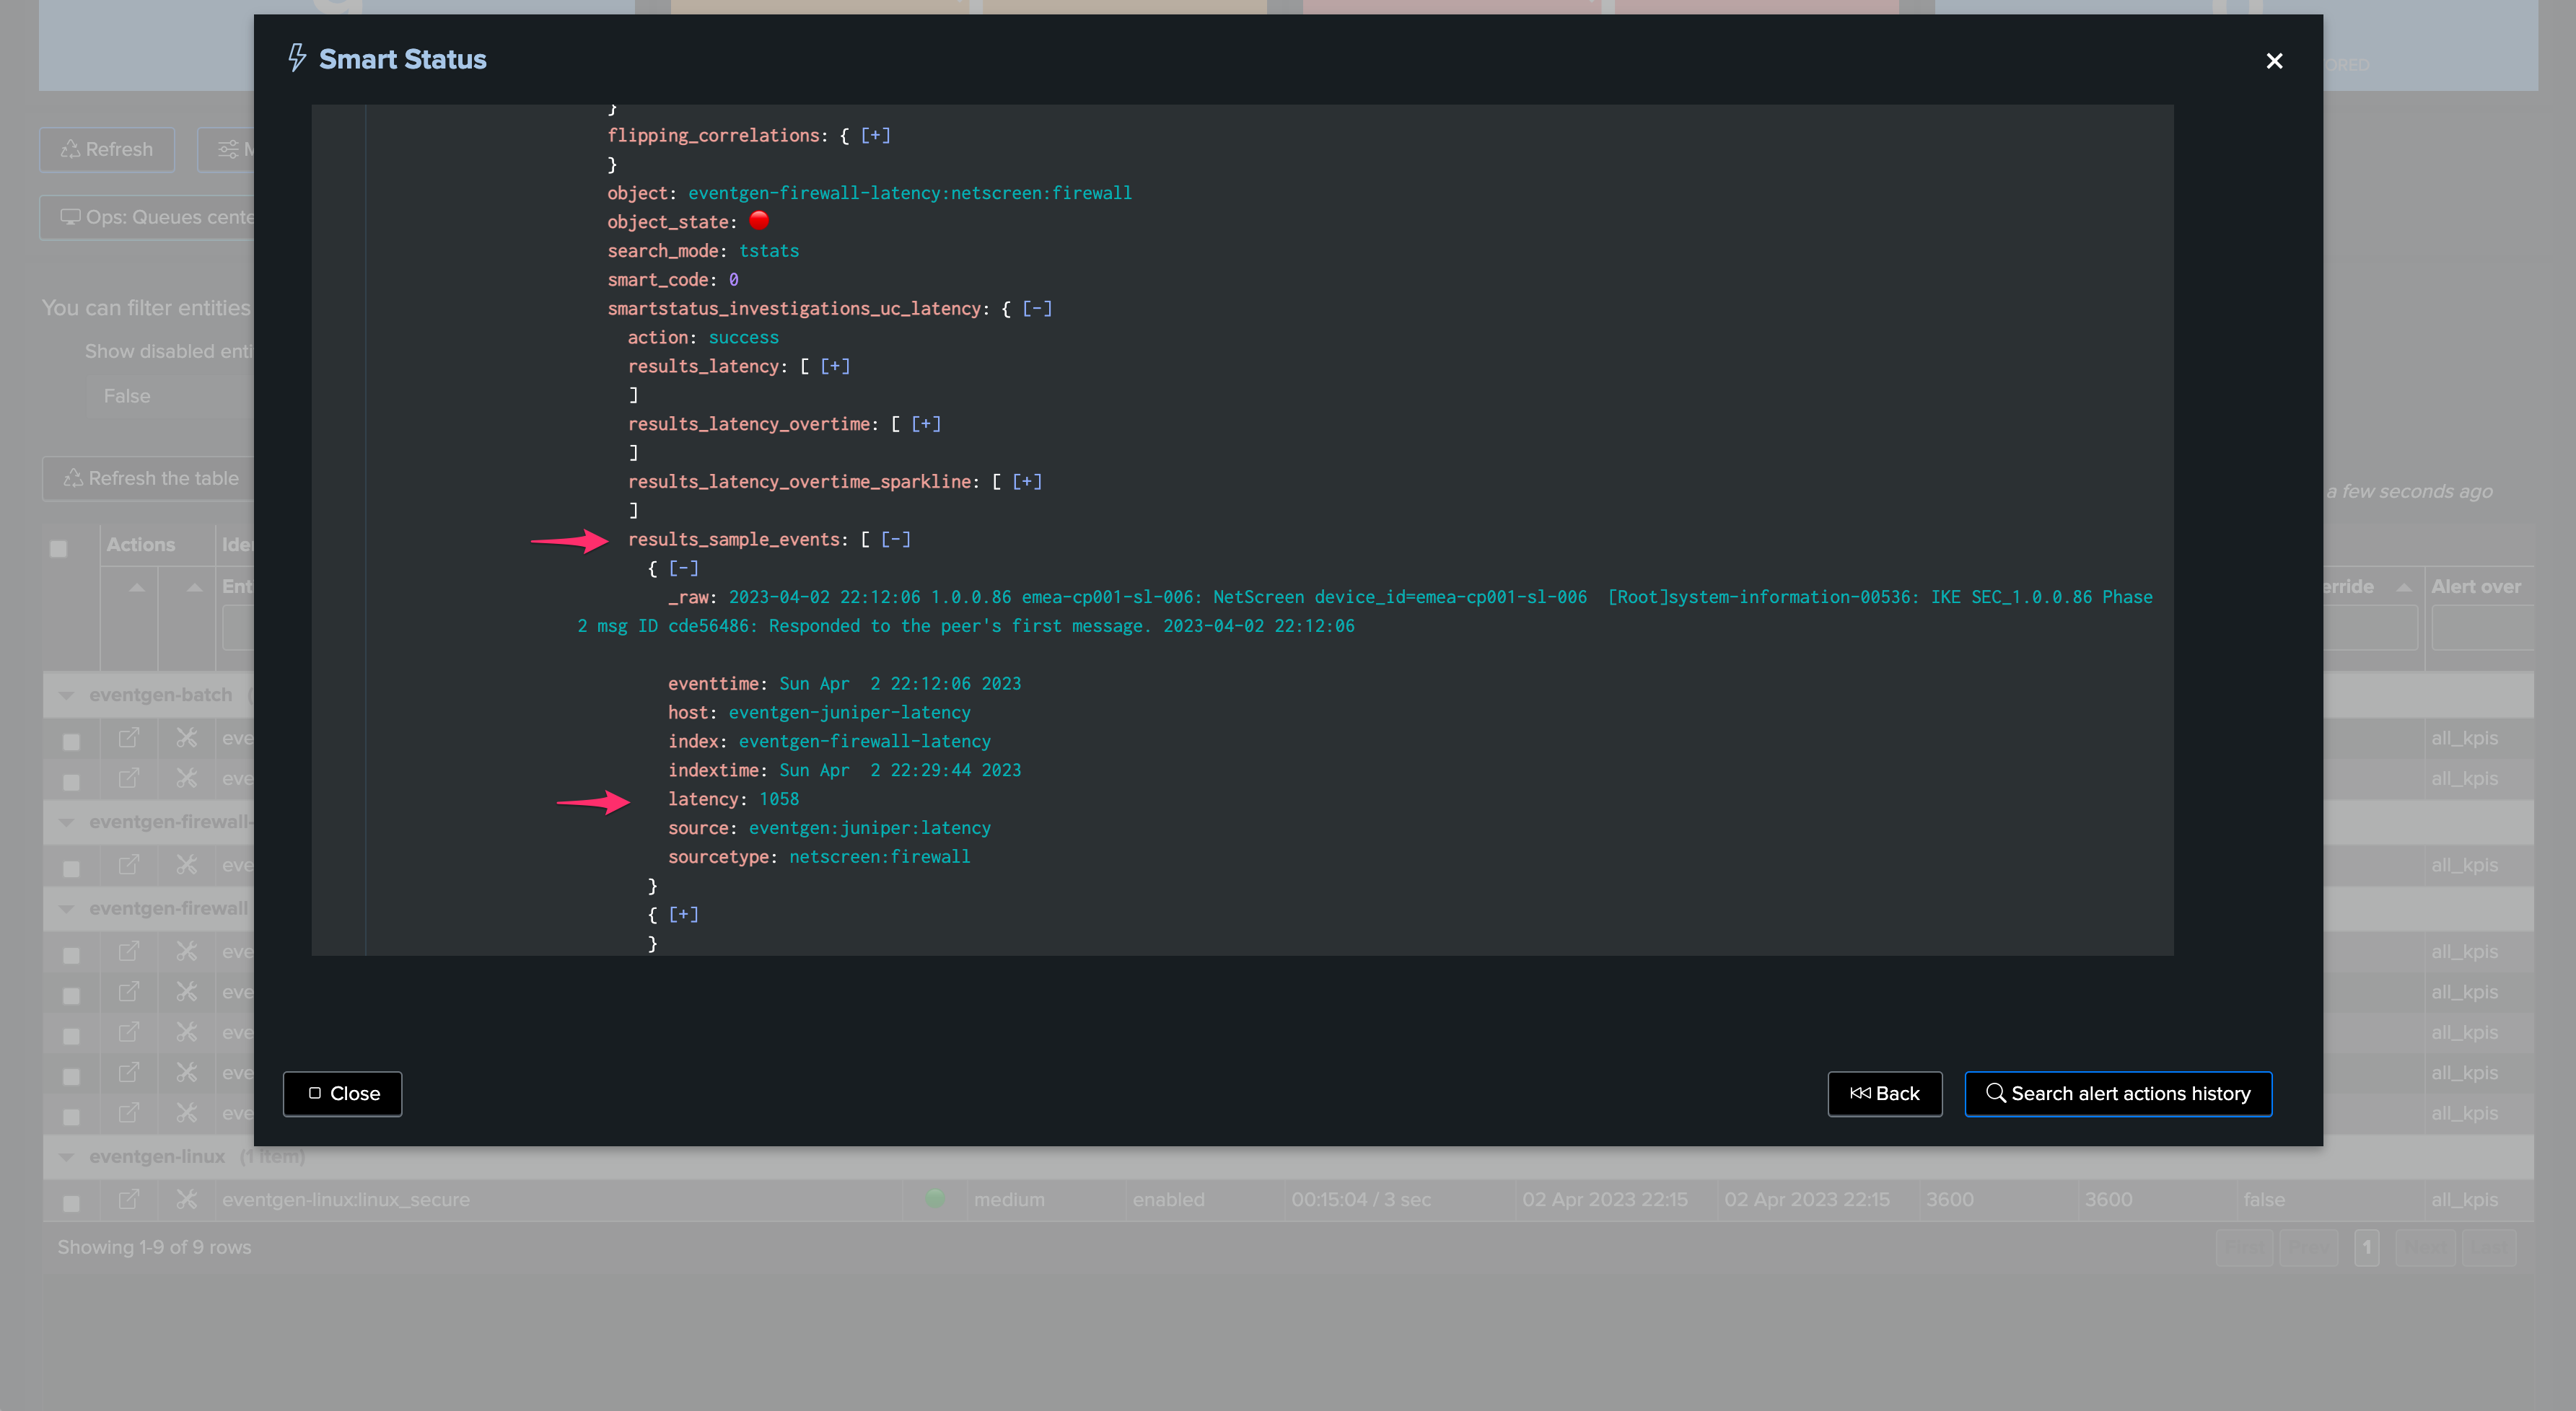
The Smart Status function provides automated investigations too:
Shall we want to manually review events with latency, for instance searching for events indexed with more than 15 minutes of latency during the past 4 hours of indexed data with events within the past 4 hours:
index=myindex sourcetype=mysourcetype _index_earliest="-4h" _index_latest="+4h" earliest="-4h" latest="+4h"
| eval indextime=_indextime, latency=(_indextime-_time)
| where latency>900
| eval indextime=strftime(indextime, "%c")
| table _time indextime latency _raw
Once the issue is addressed and the root cause was fixed, and the latency is back to acceptable thresholds, TrackMe will return the entity status back to green after some time:
TrackMe metrics view:
Splunk query view:
Performance metrics tab:
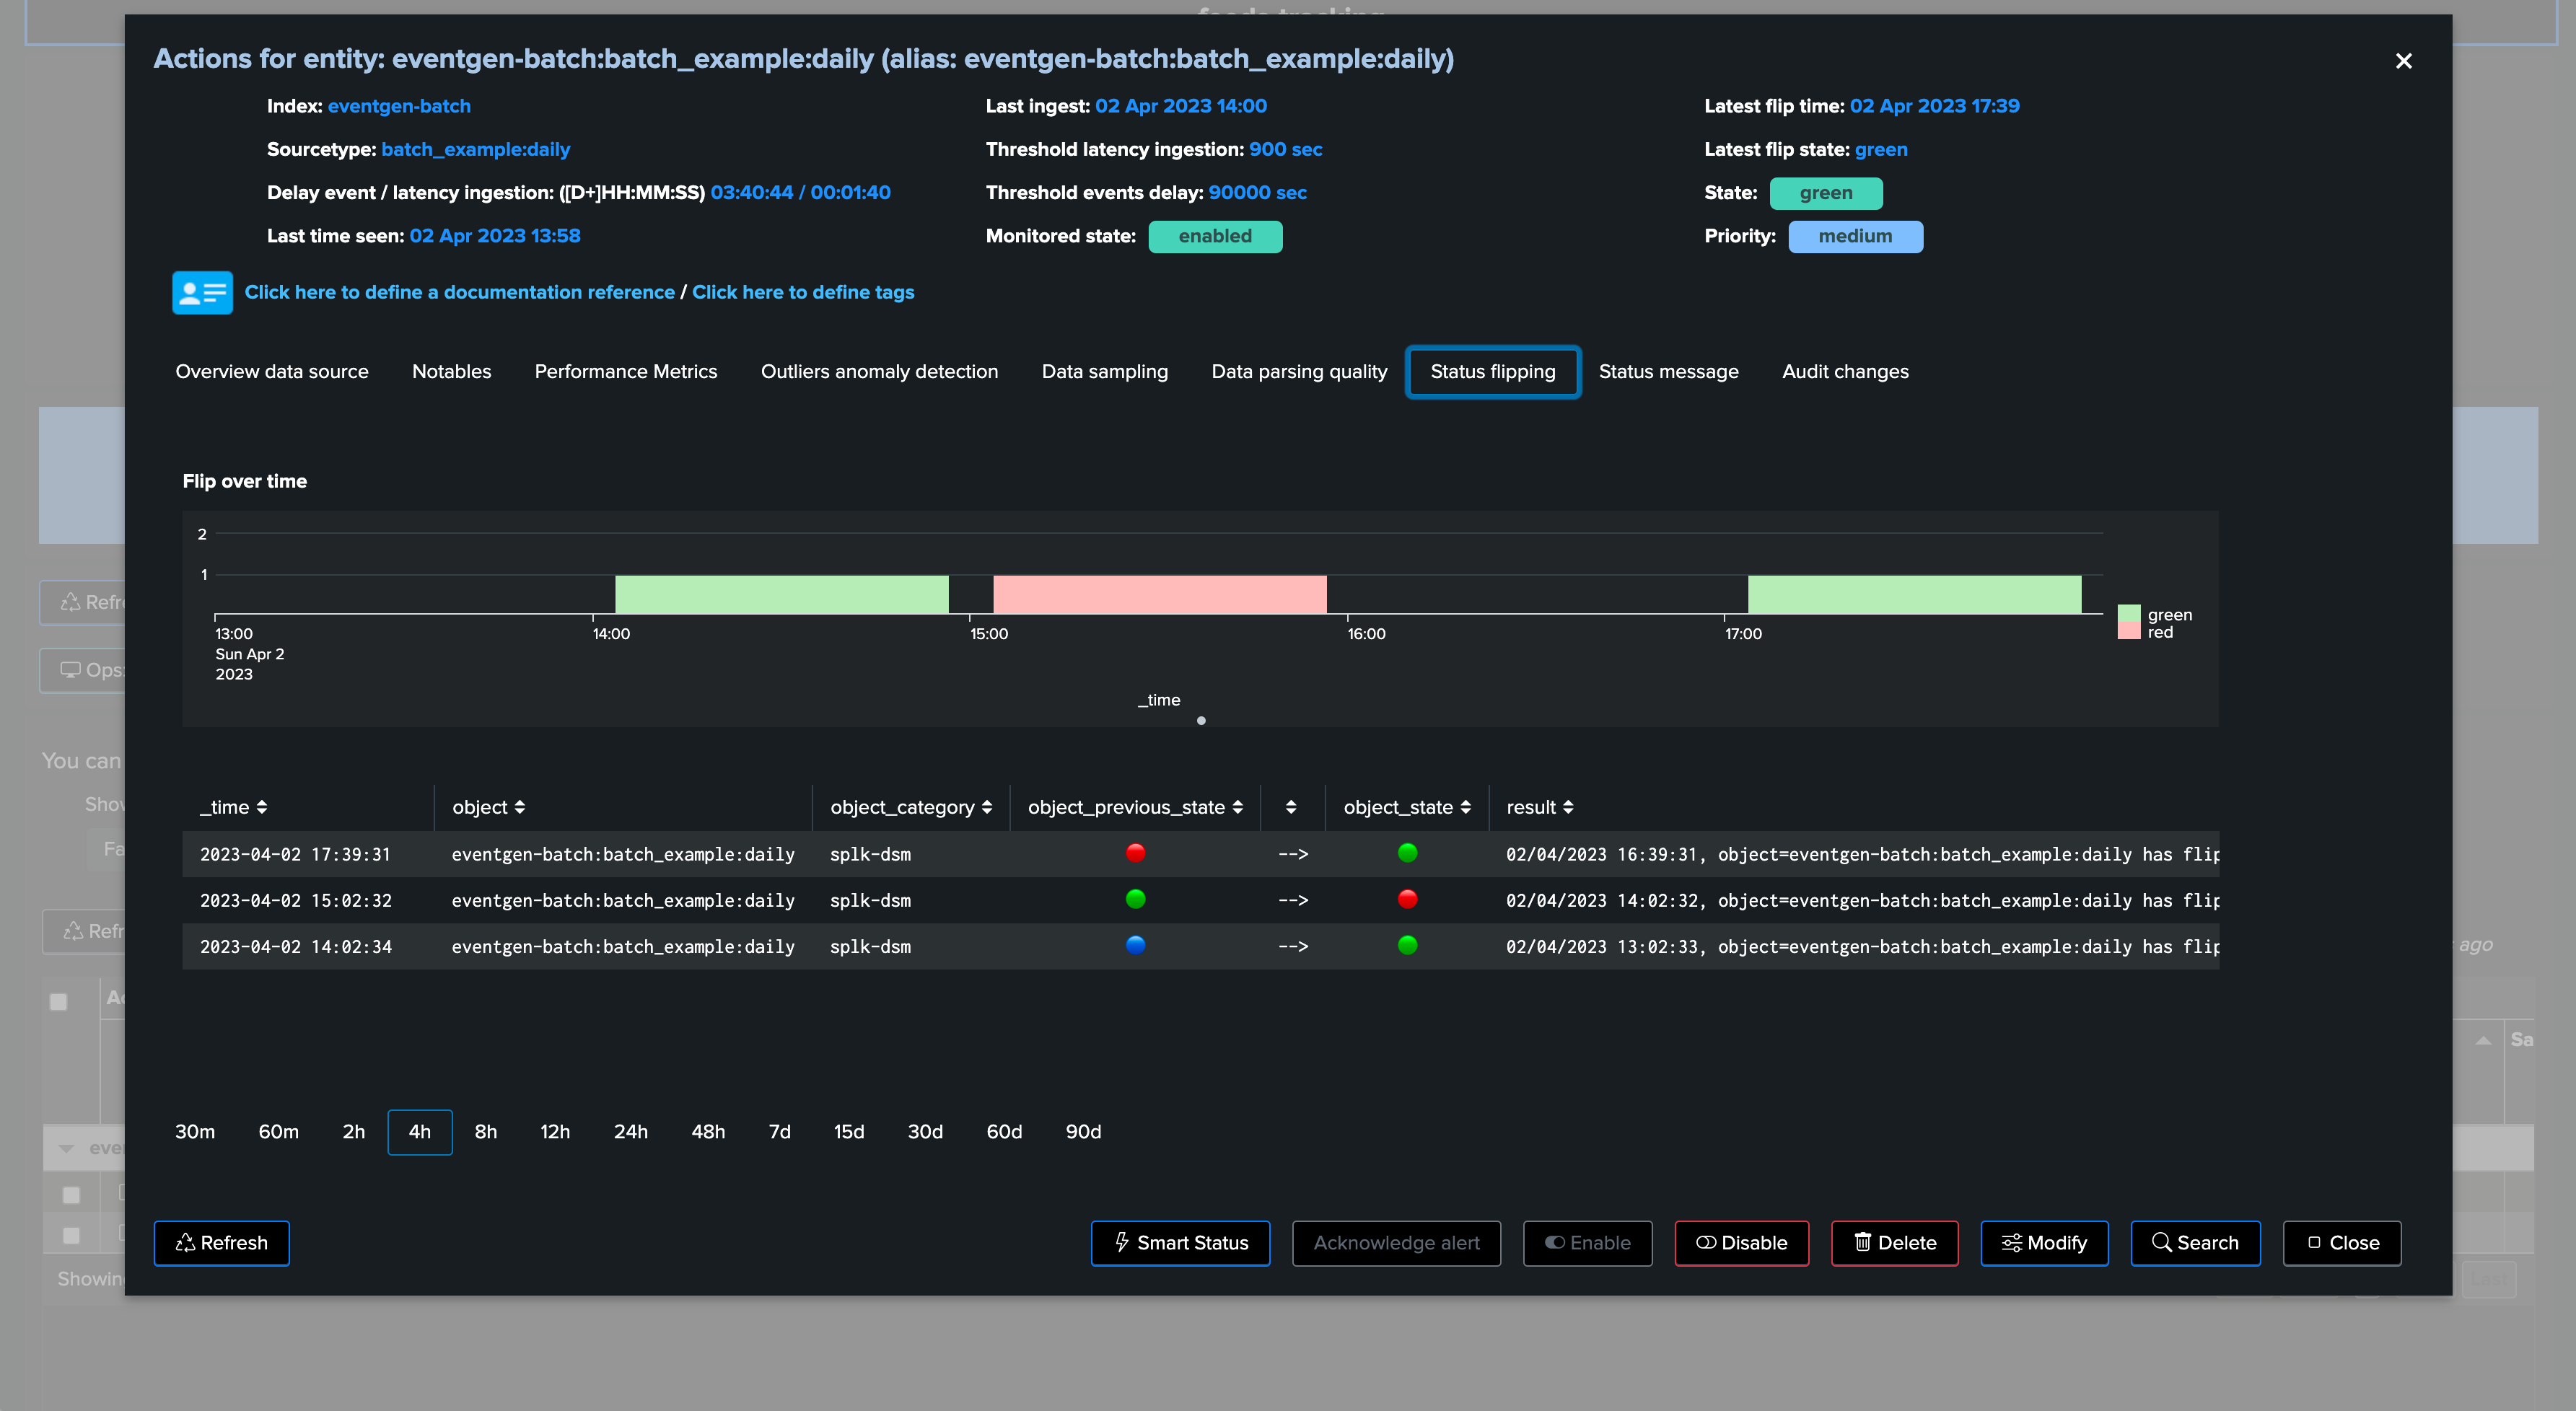
8. Anatomy of an Entity with Delay with no Latency
Batch data once per day example
In the following example, we are reviewing an entity which is suffering from delay:
In this use case, the entity does not have any latency, however, it generates data in a batched manner, for instance this provider generates a bunch of Splunk events once per day:
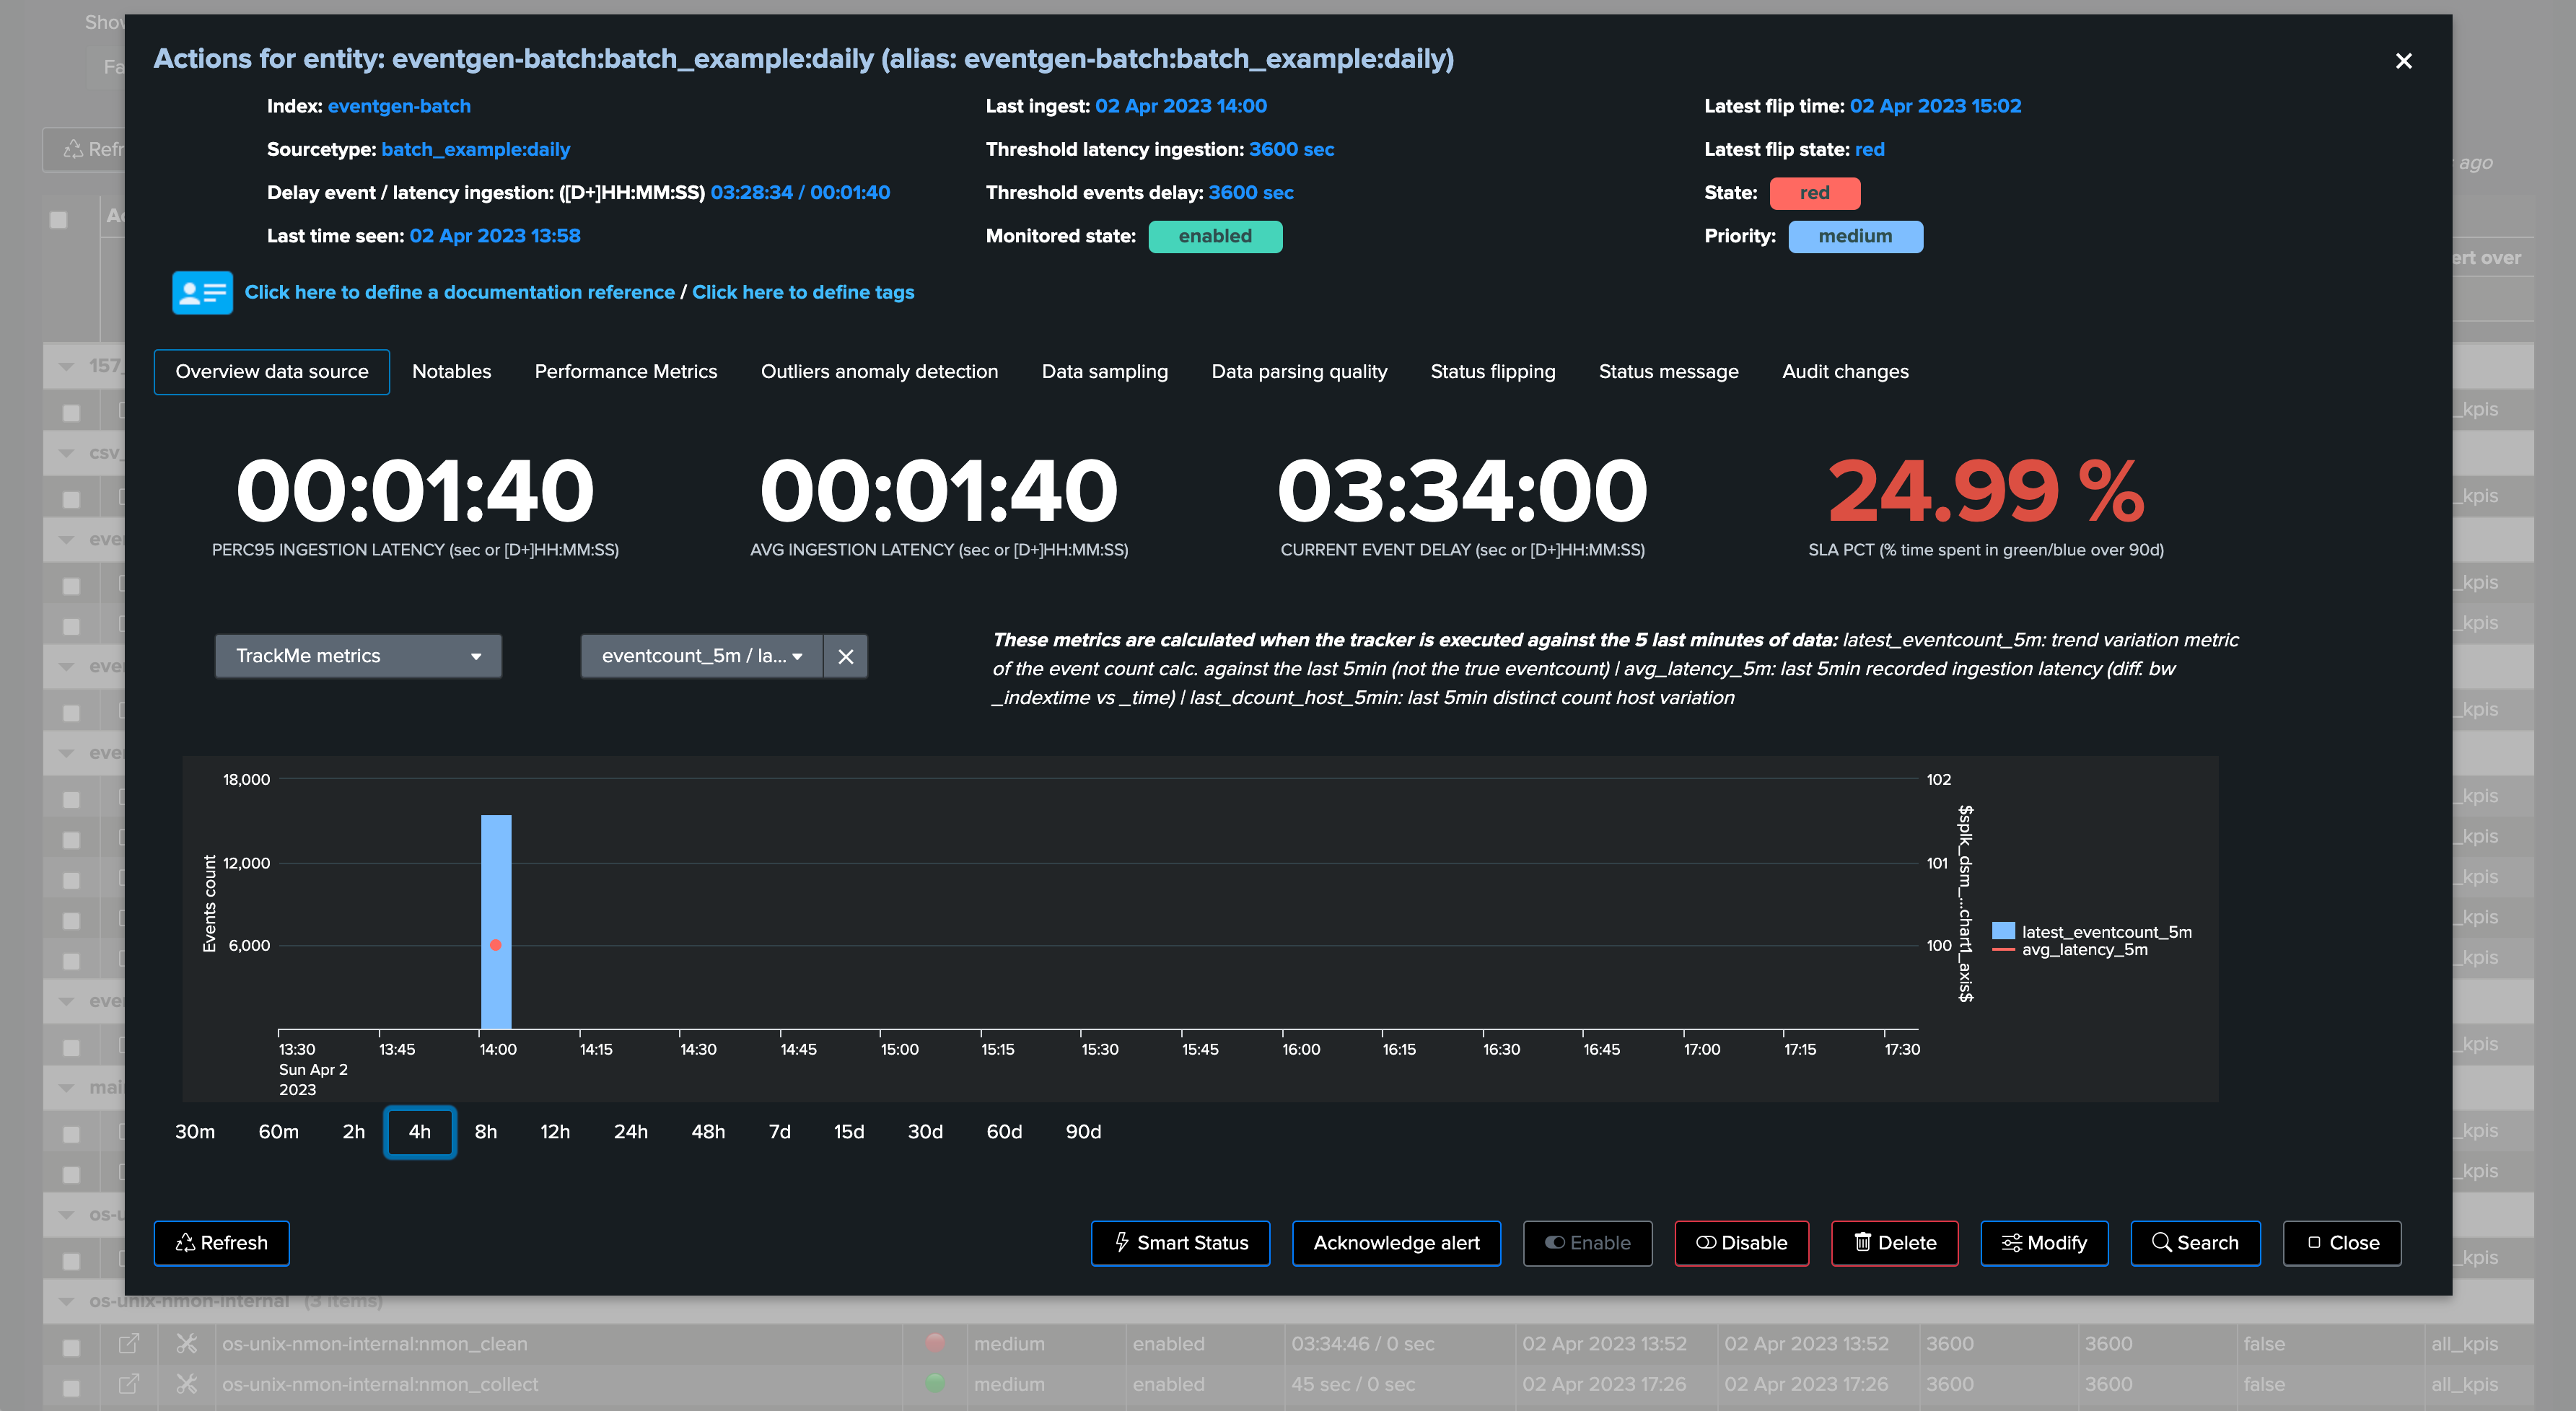
TrackMe shows the current delay, as well as the latest event (from the _time perspective) and the latest ingest event (therefore from the _indextime perspective):
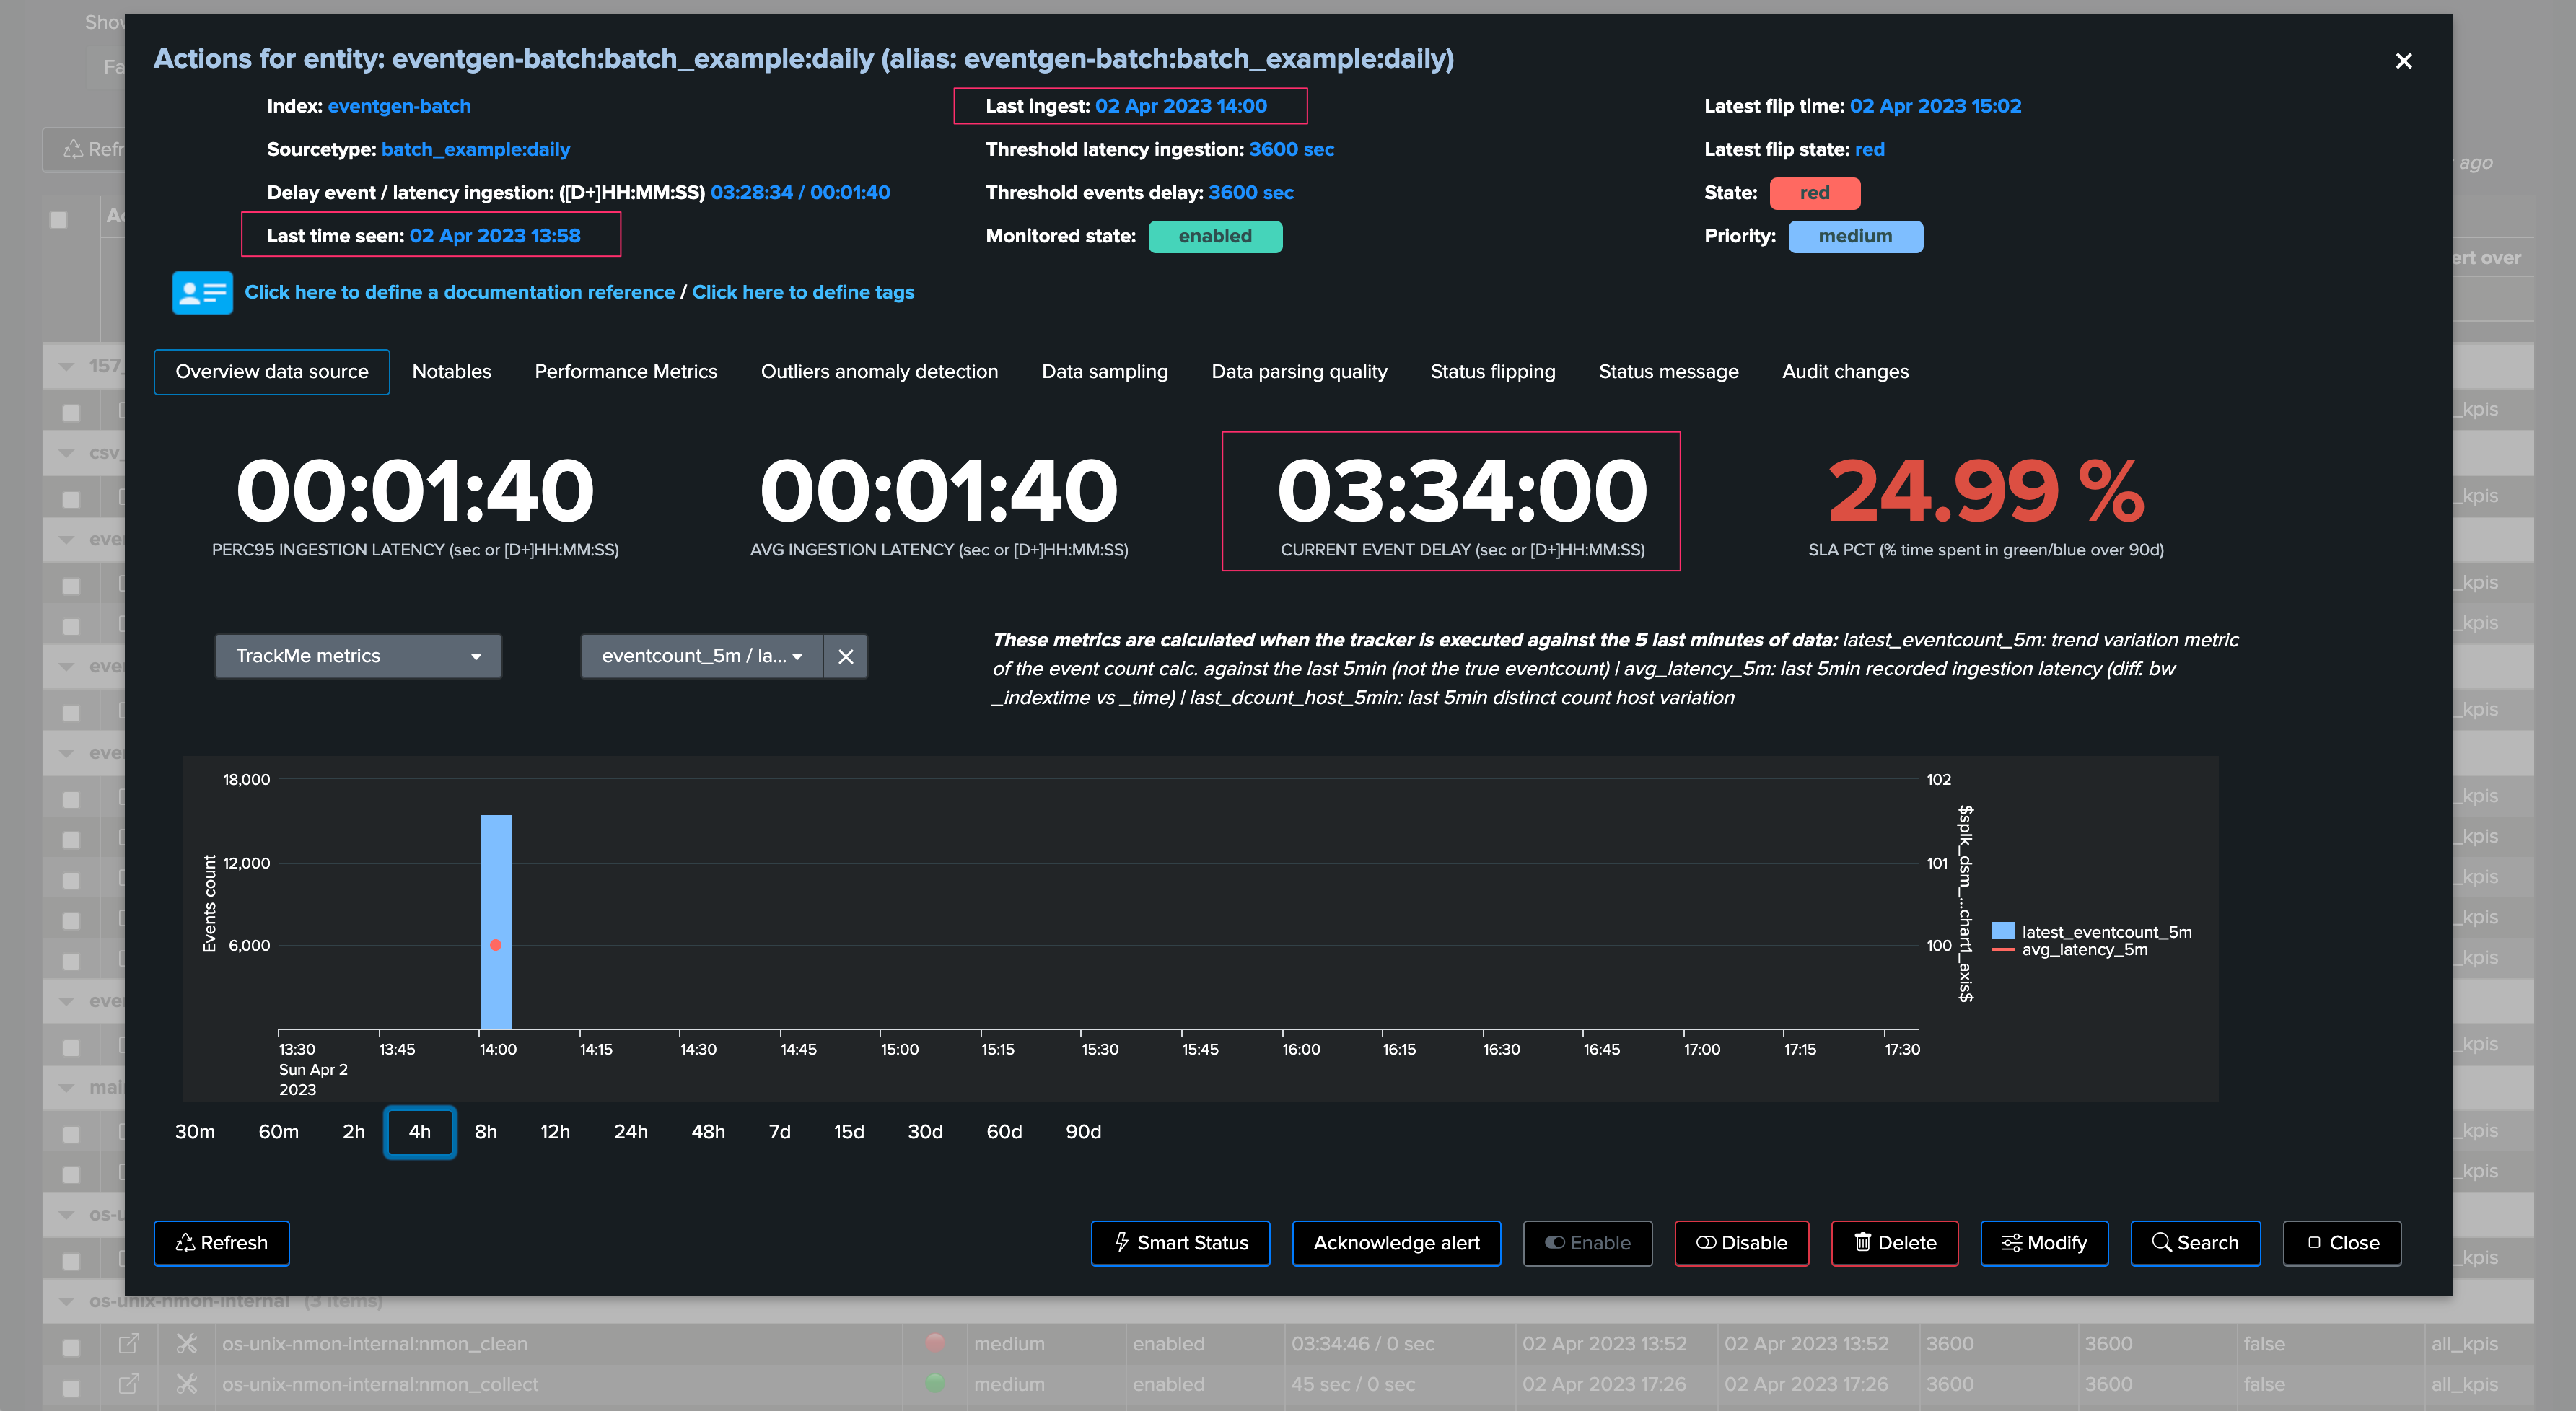
In this context, we could set a max delay of a little bit more than 24 hours (say 24 hours + 10 minutes), the latency may remain low as we do not expect to ingest events with latency when these are produced:
Once we apply our new thresholds, the entity returns to green and will remain healthy unless our monitoring conditions would not be met:
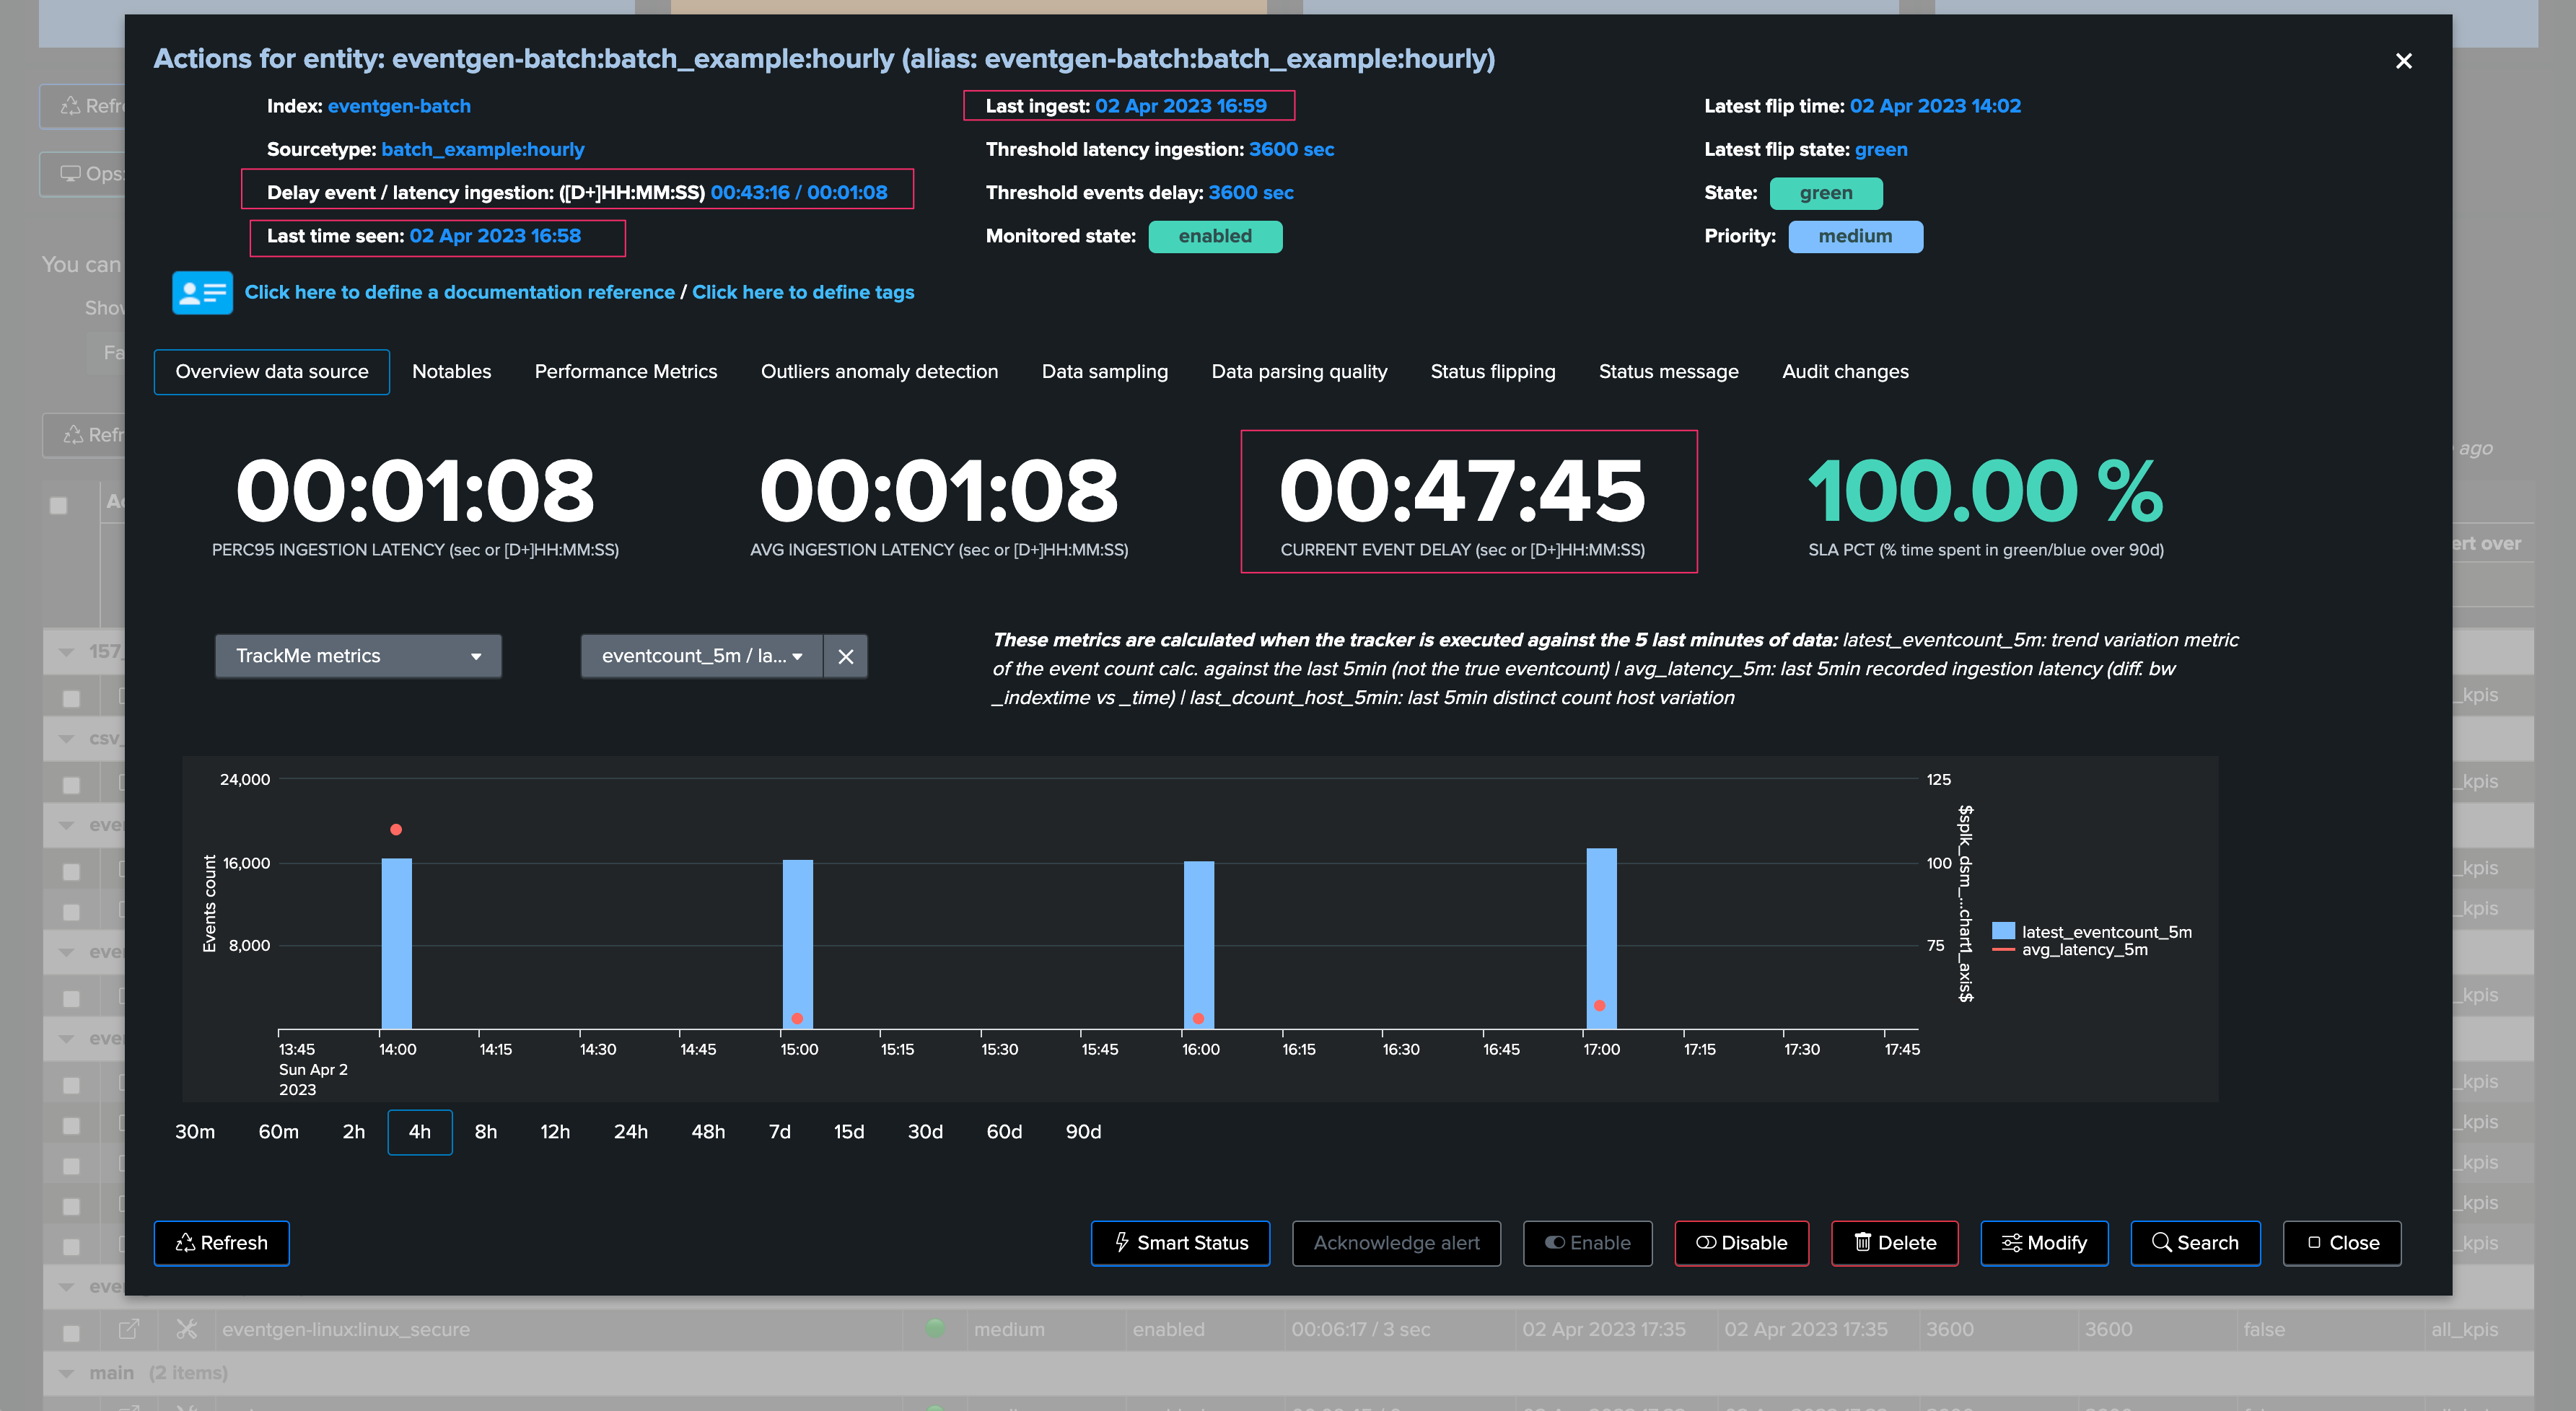
Batch data once per hour example
In this second example, we have another data source which generates data once per hour, similarly we may not expect latency, but it is likely that the data source alert could trigger with a default delay treshold of 3600 seconds if the provider is little bit late:
Note that we clearly observe the delay, when data was generated and indexed, against as fast we received and indexed these events:
We may or may not have had alerts for this entity yet, depending on the context we may tolerate or not some levels of delay, for instance we could set to 1 hour + 10 minutes if the data is quite critical:
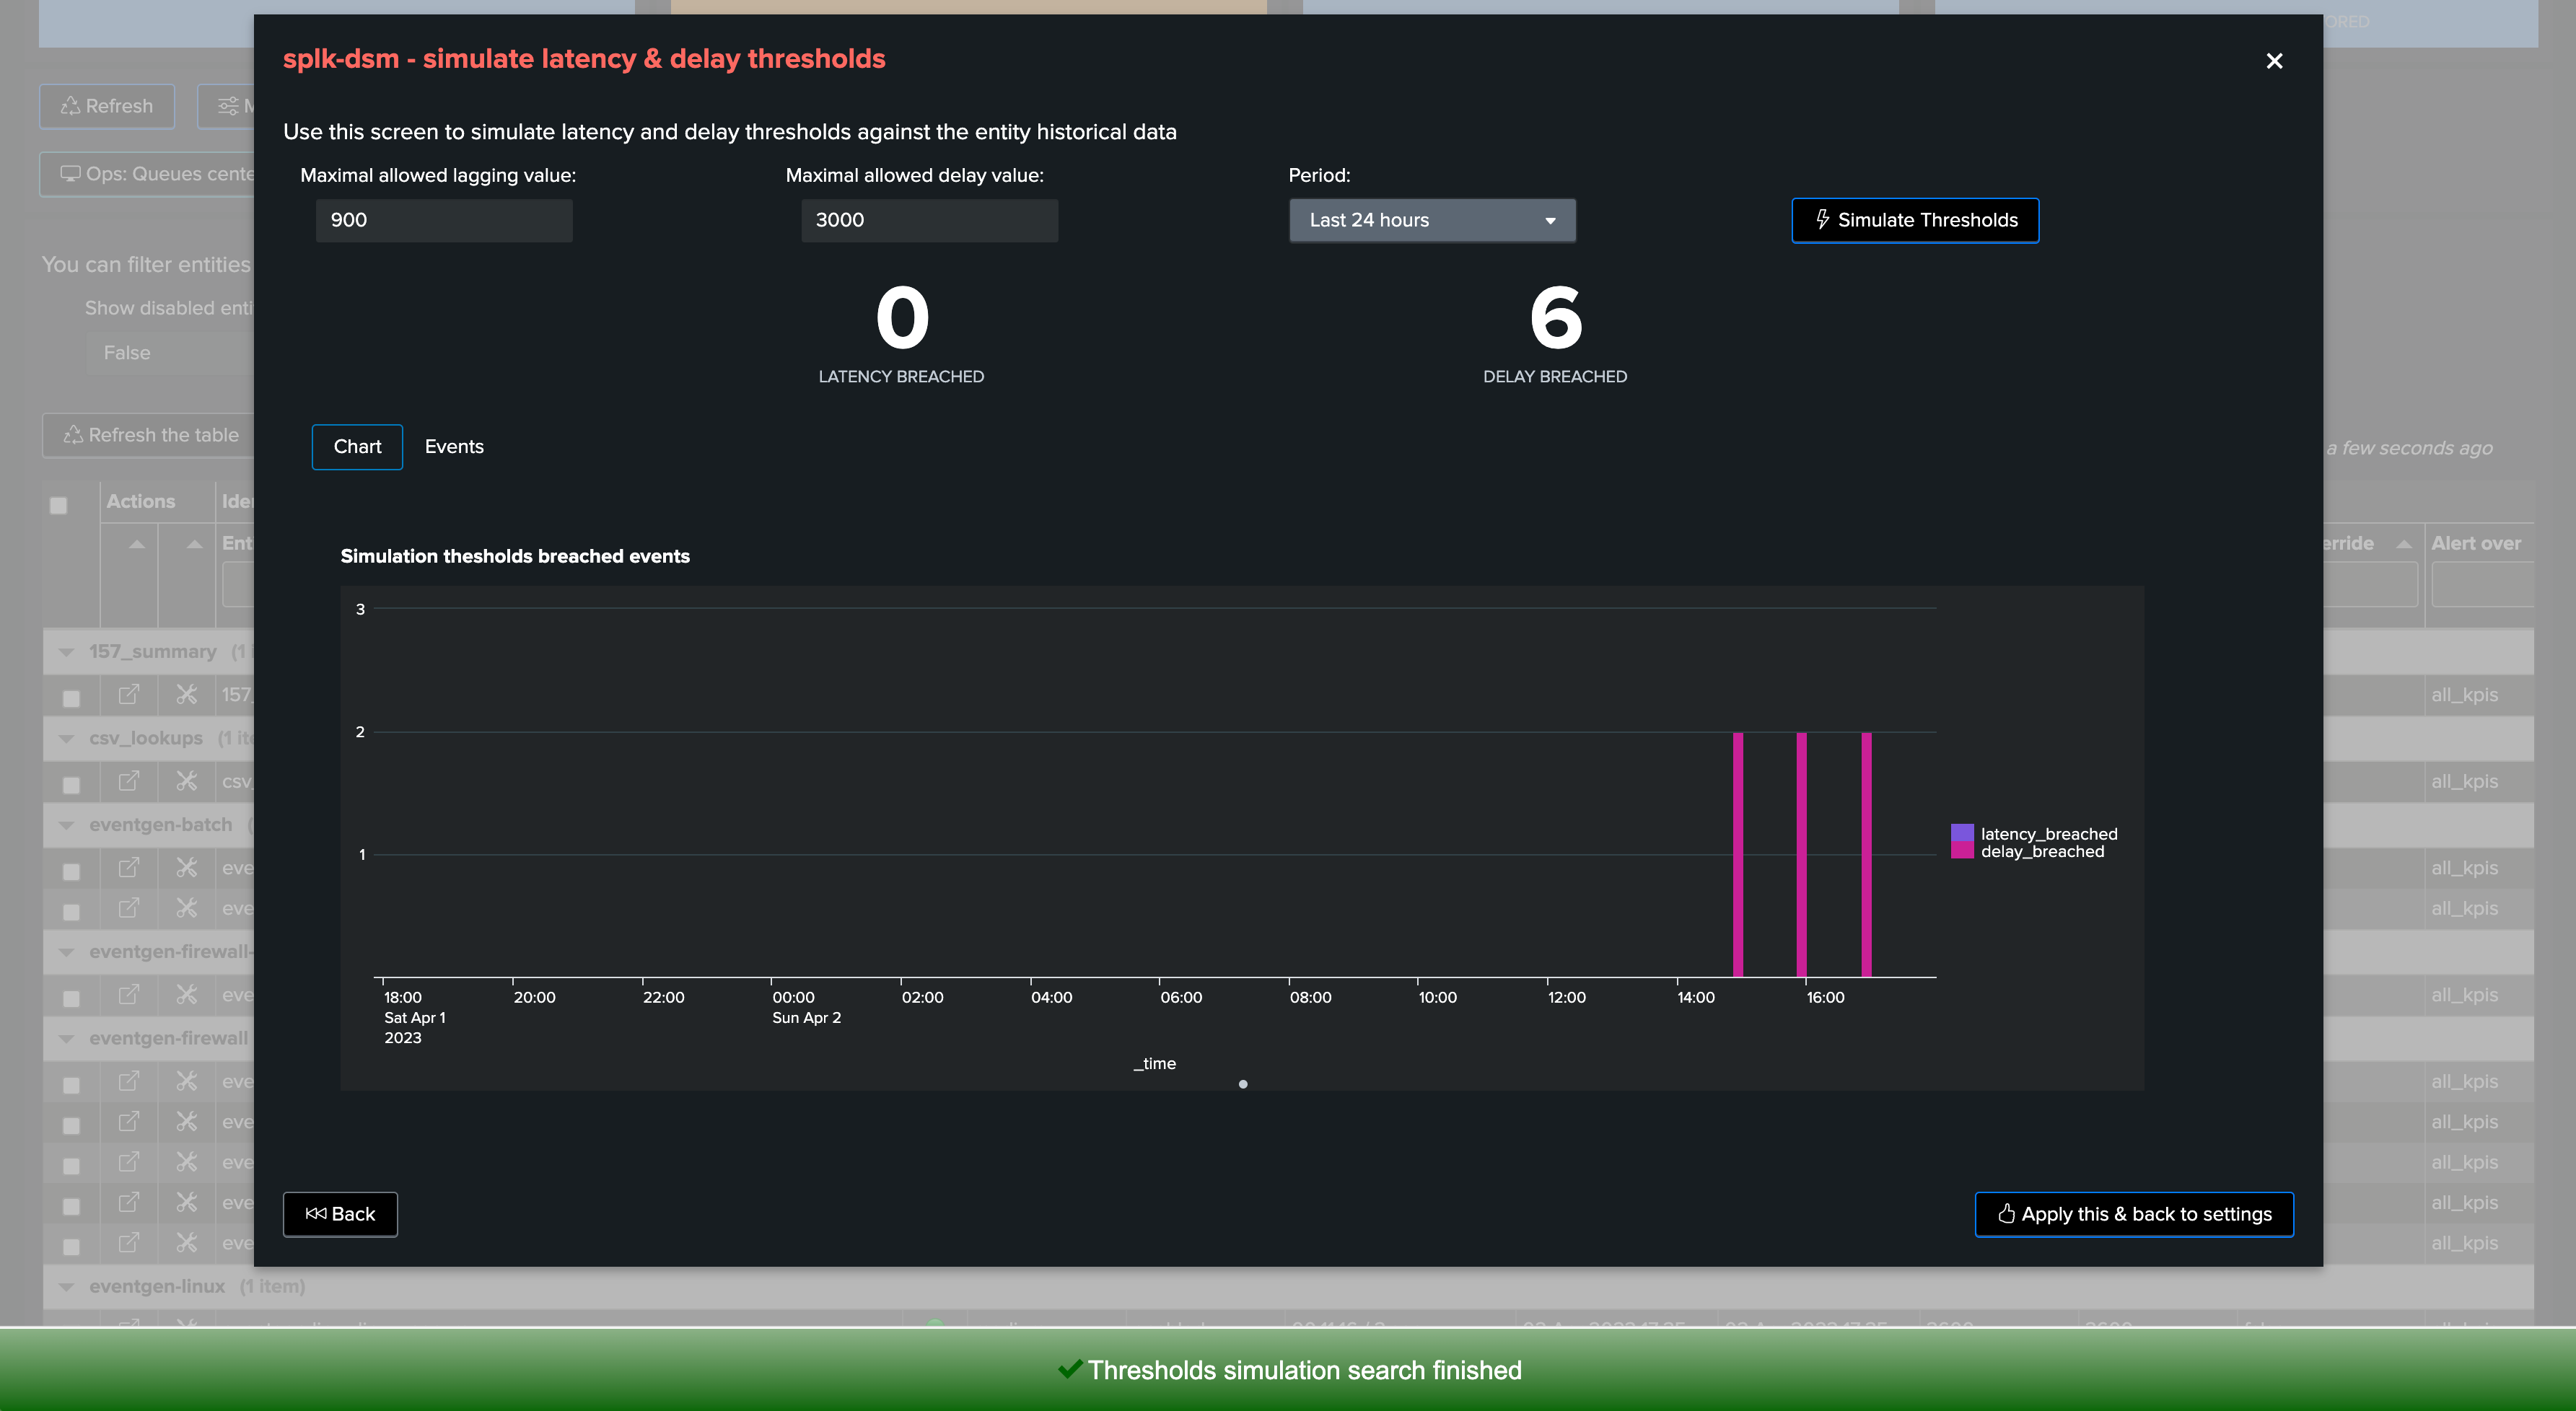
If we go too low (say for 3000 seconds for example), then we can observe that would get alerts for this data source due to delay:
In our example, we will set it to 4200 seconds, 1 hour and 10 minutes:
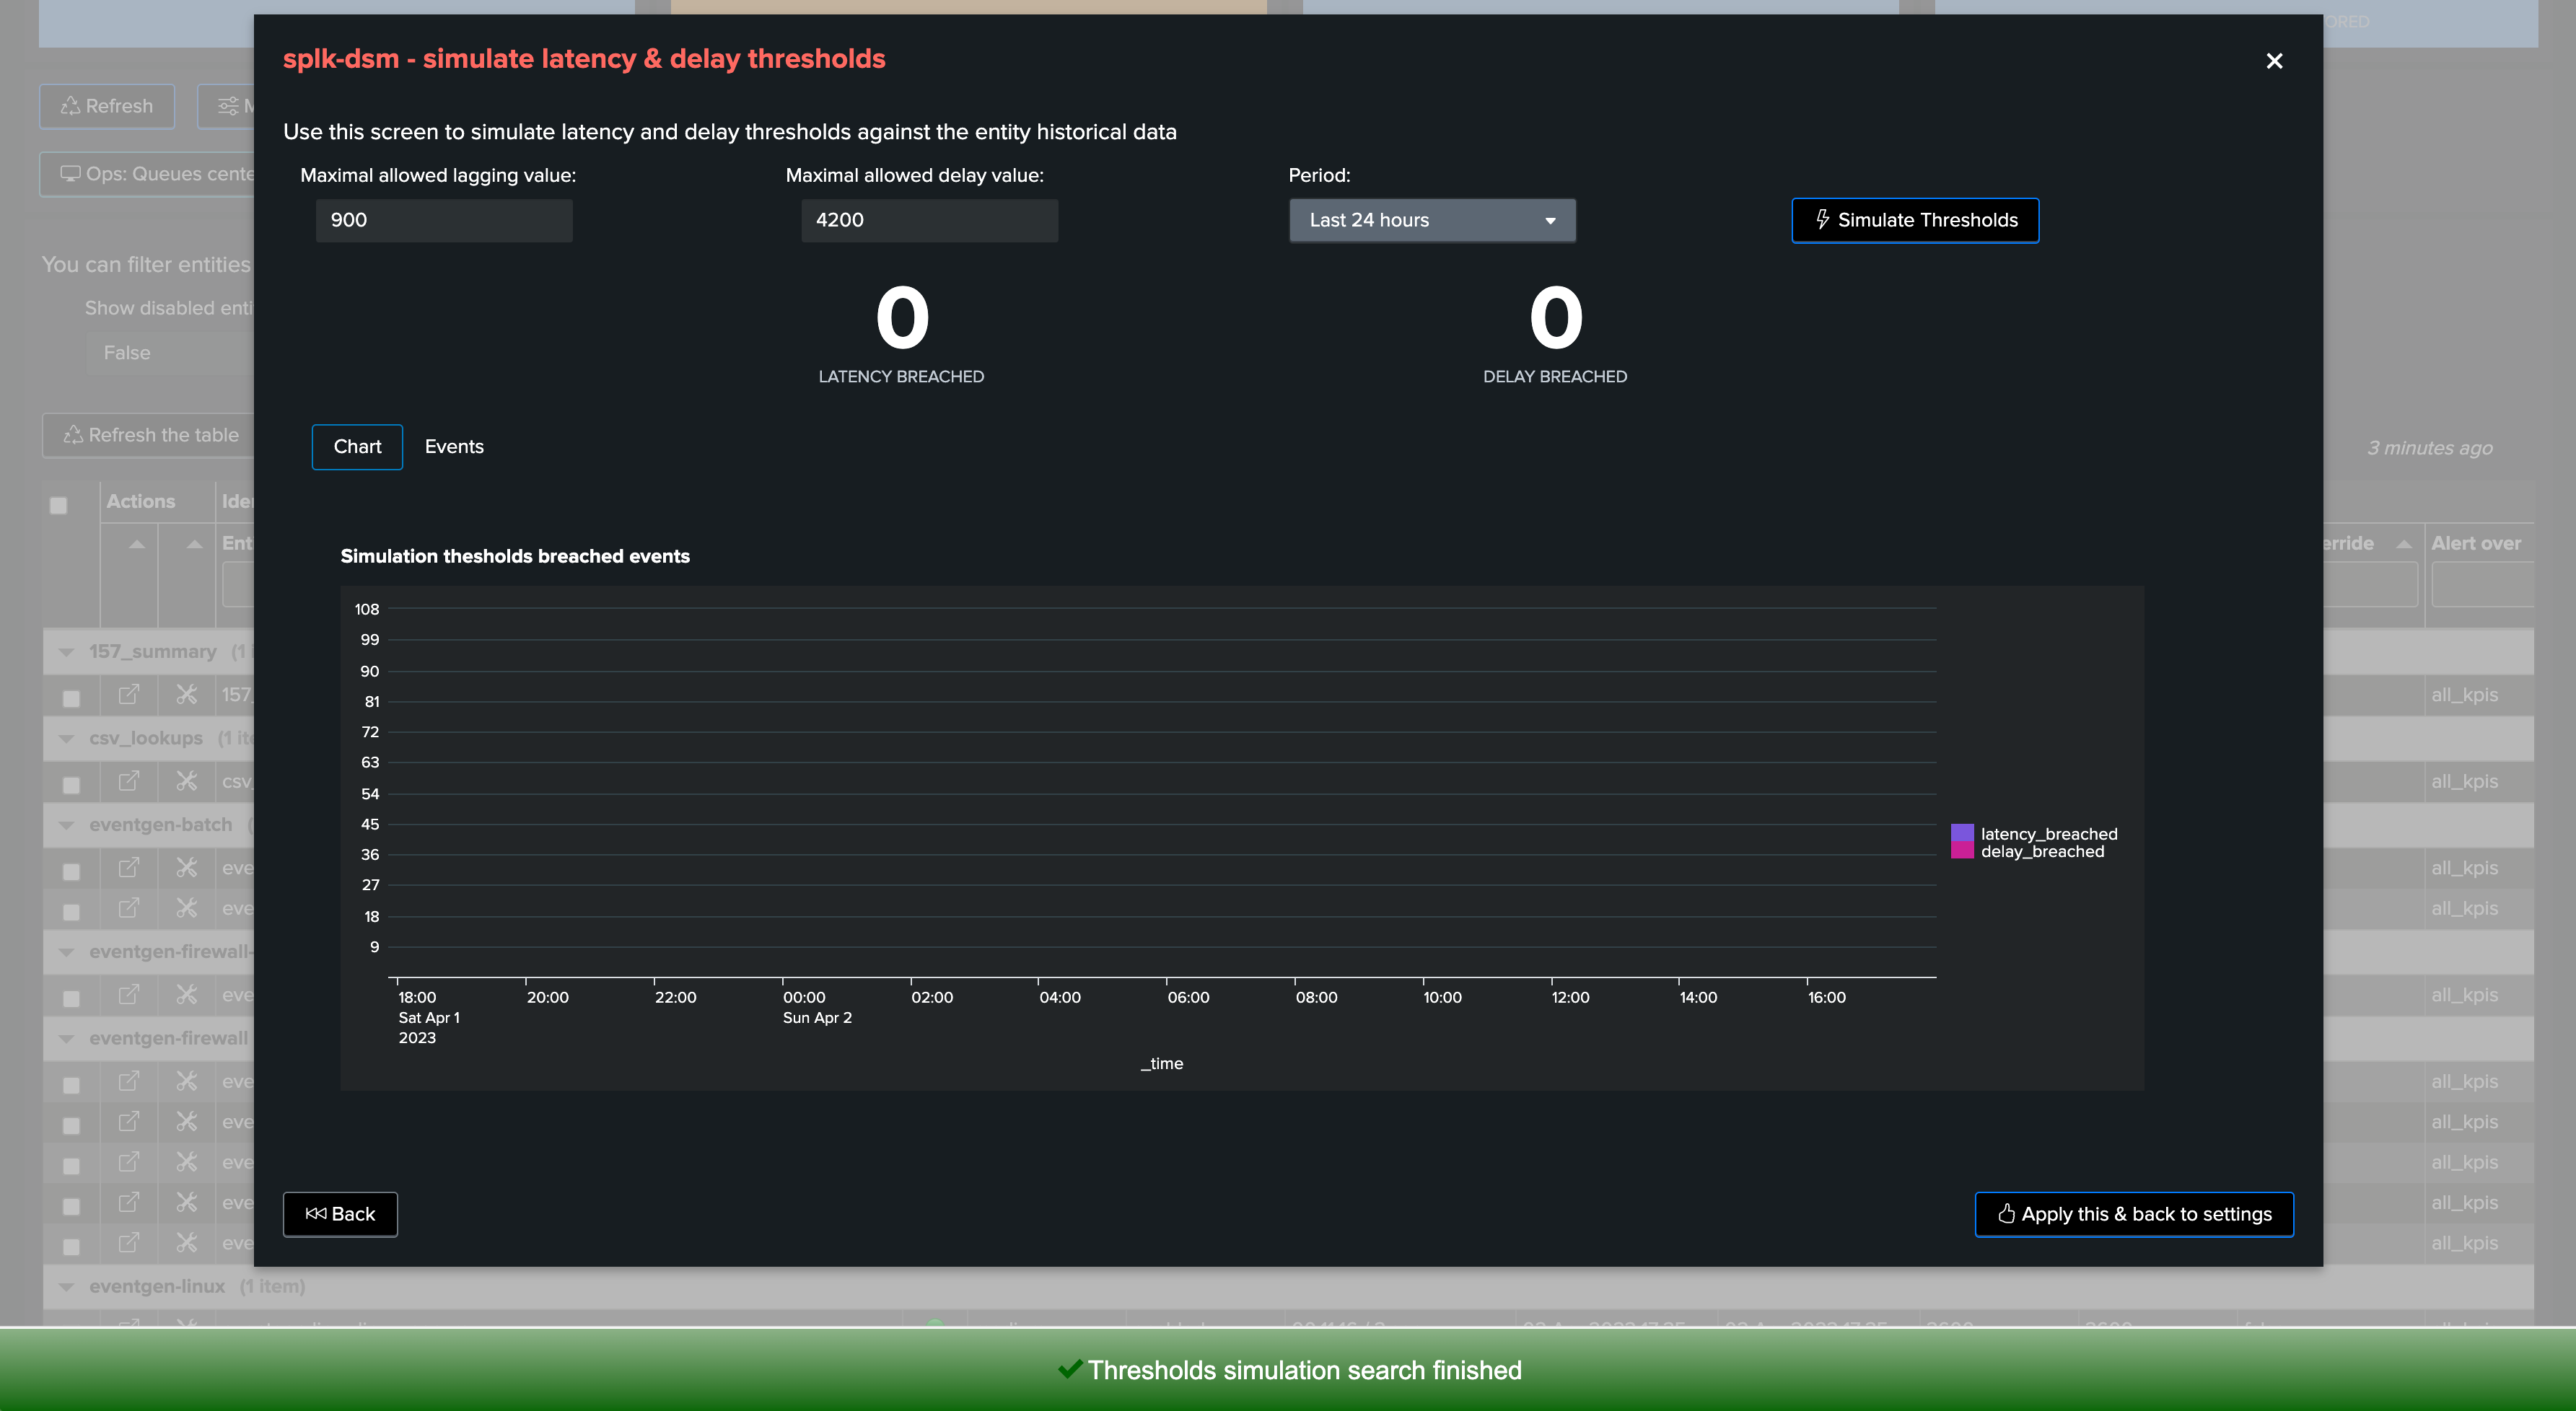
Again, accepting a certain delay in the delivery of events does not mean that these events should be indexed with latency, both KPIs need to be taken into account indepedently.
Conclusion
Thresholds definition is an important part of TrackMe configuration and entities lifecycle.
TrackMe provides different meaningful features to observe, review, and define threshold values that make sense for your context.
Because every context is different, TrackMe provides flexible features to allow managing latency and delay thresholds as needed.